Tissue specific Abundances of This Antigen
ICD Disease Classification 01
Click to Show/Hide the 1 Disease of This Class
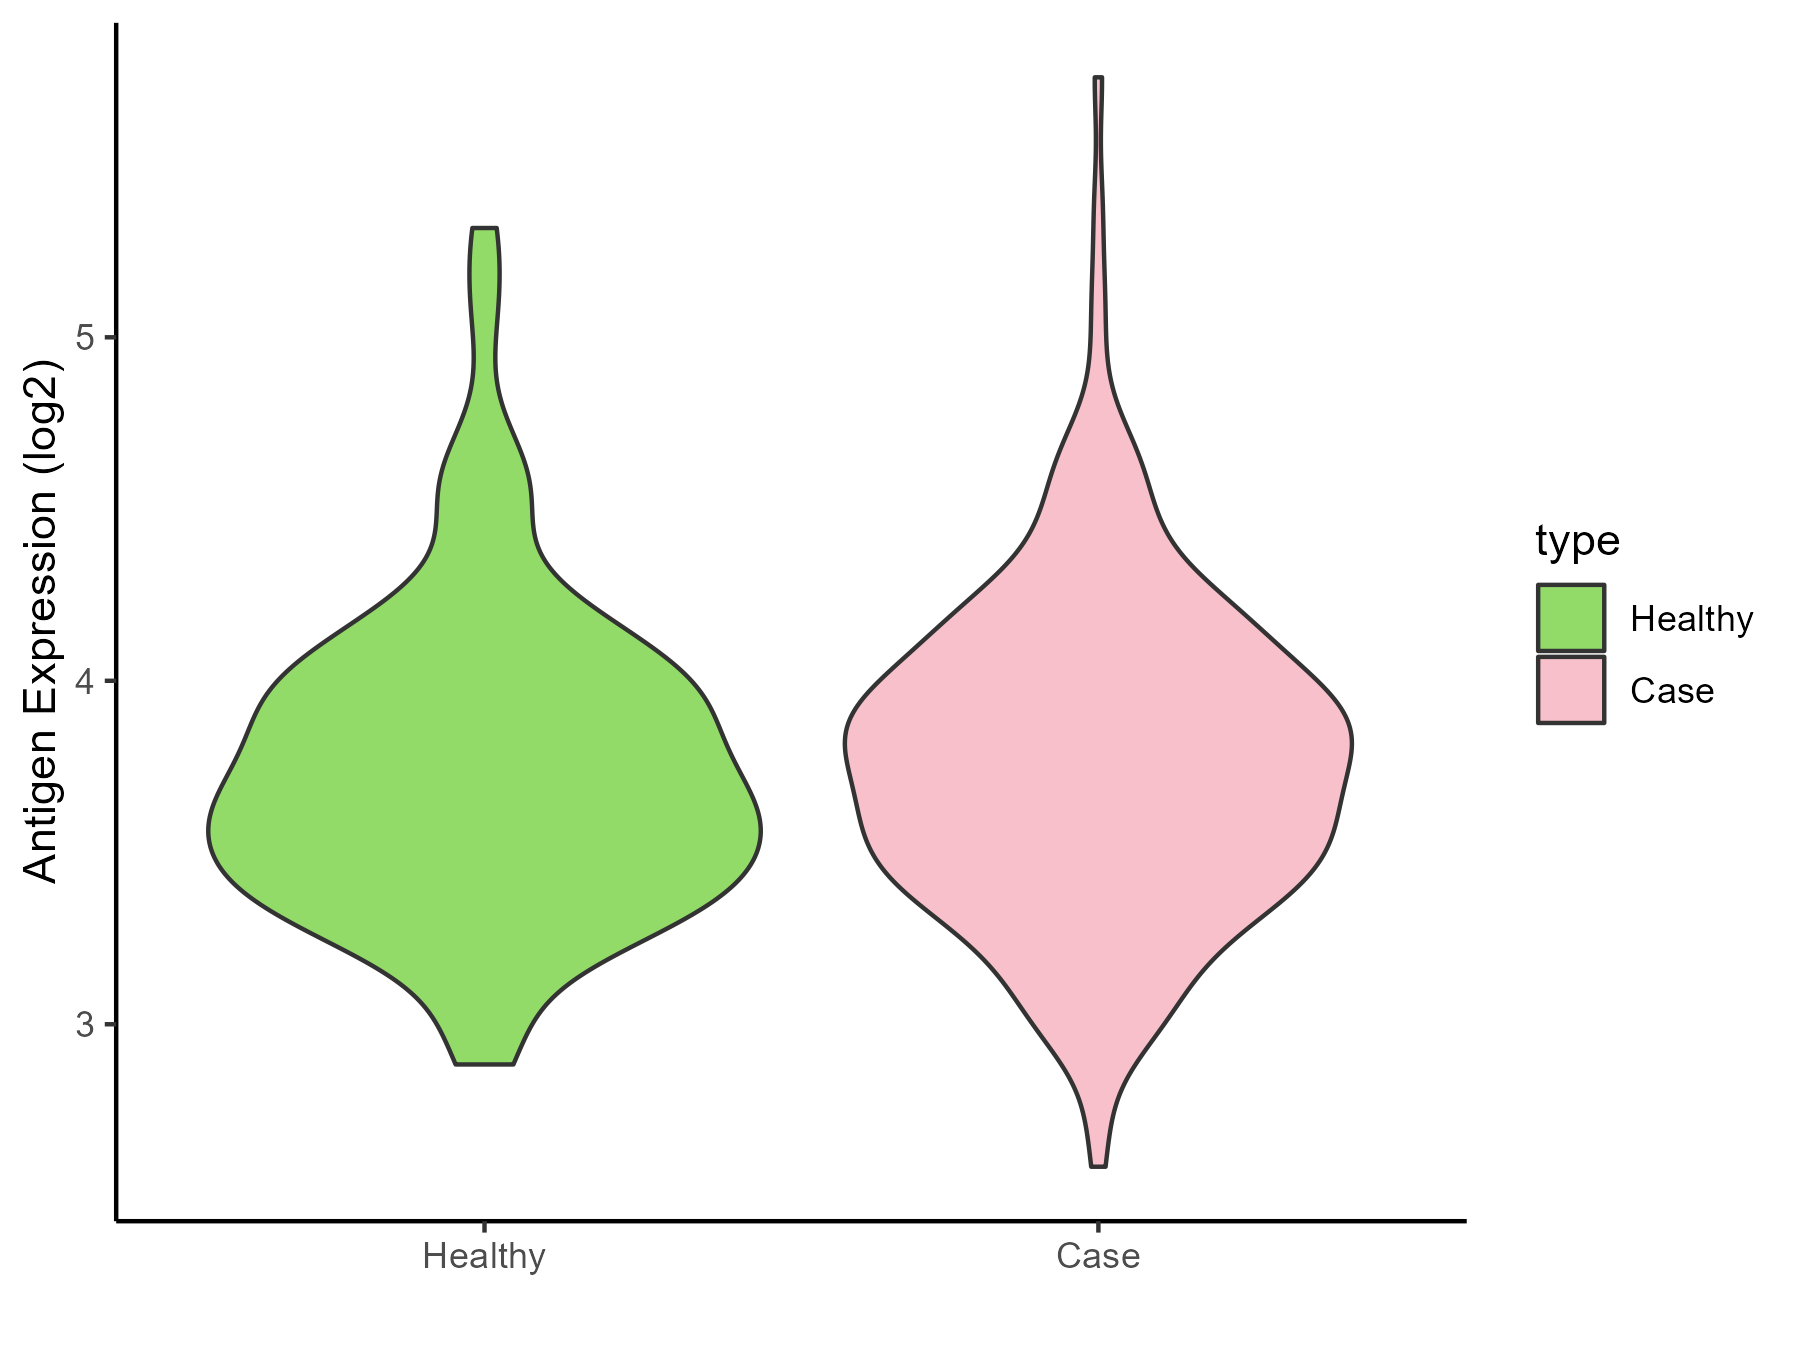
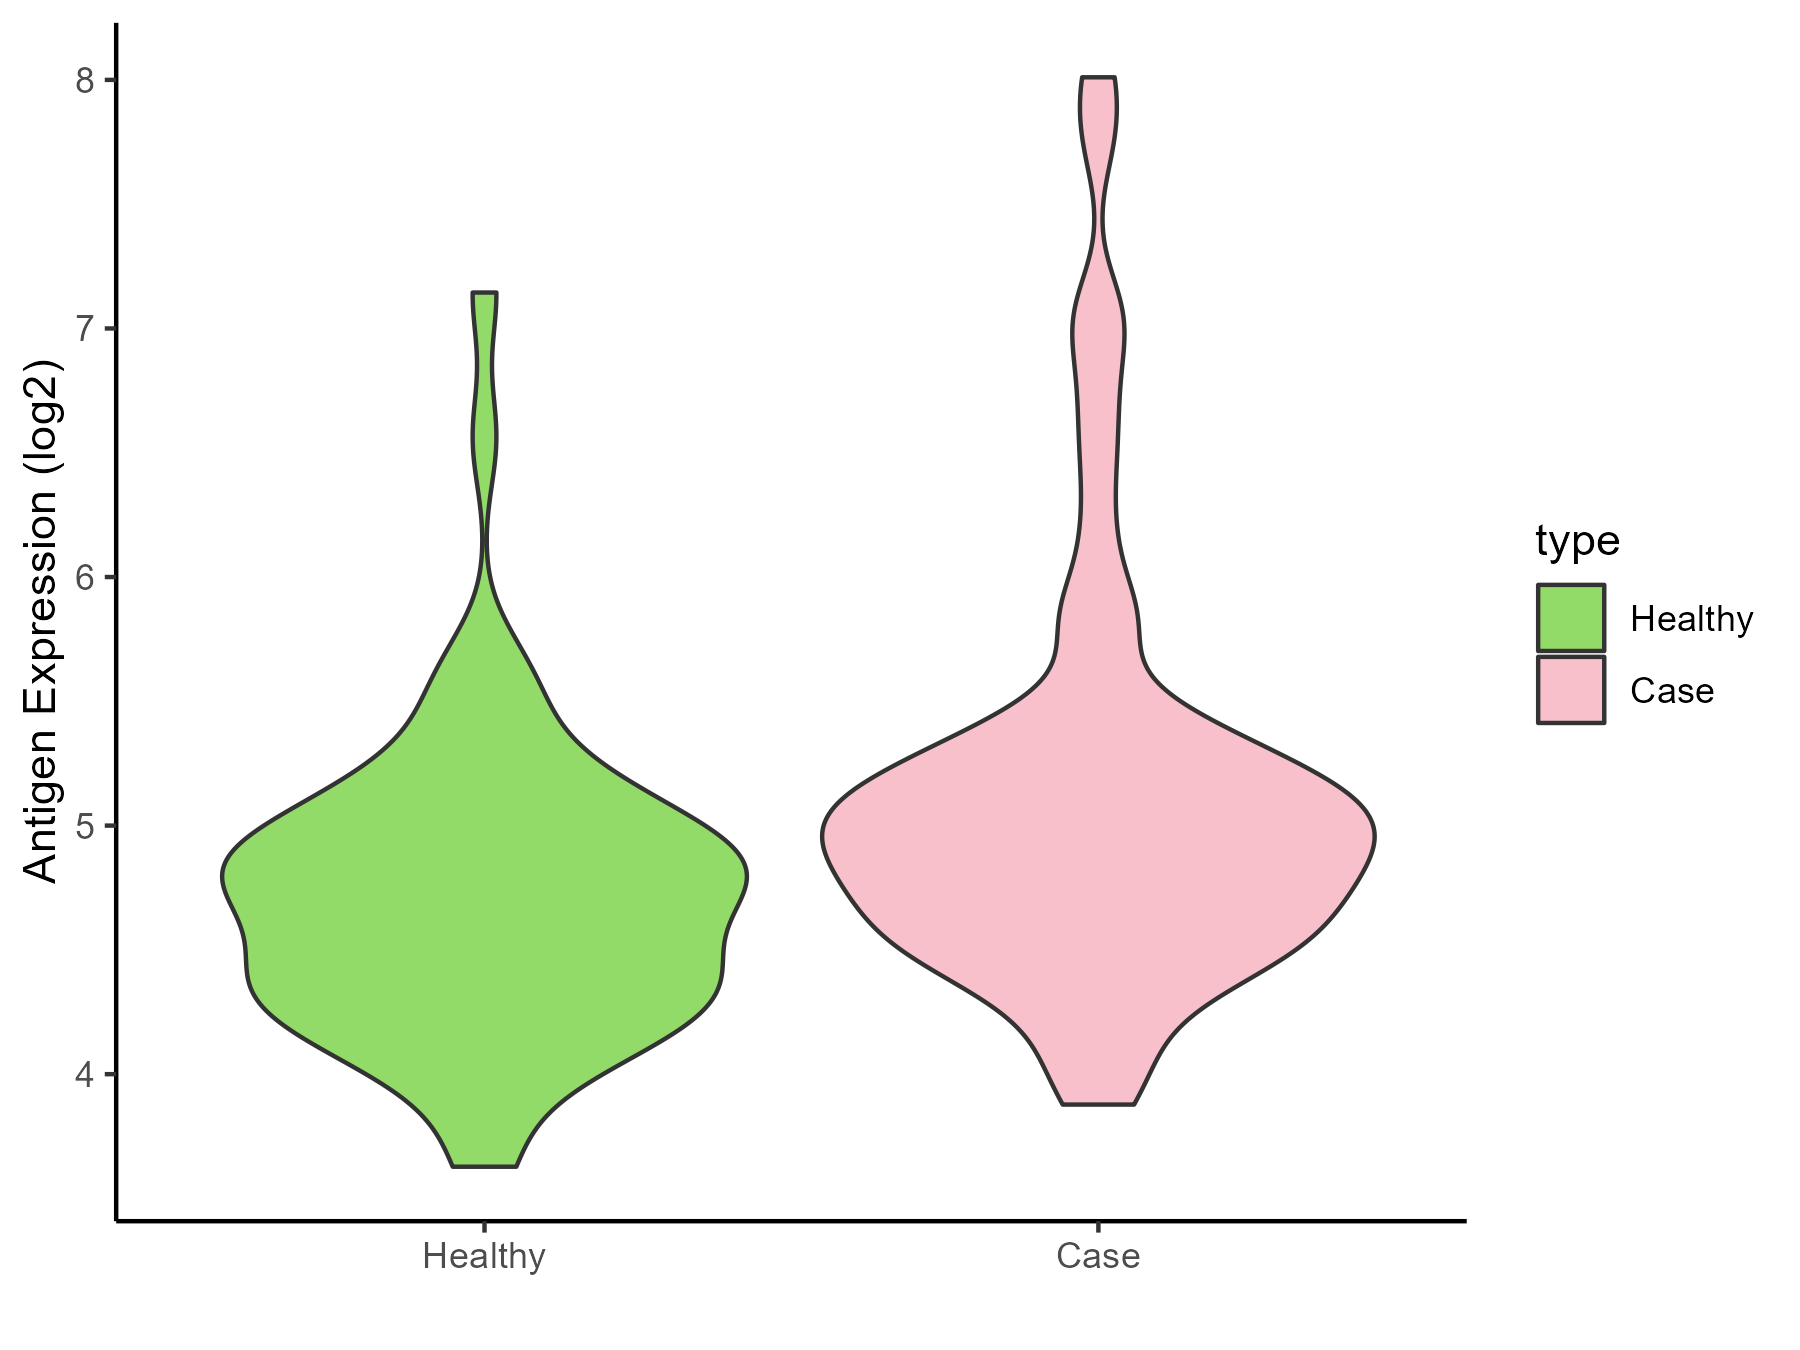
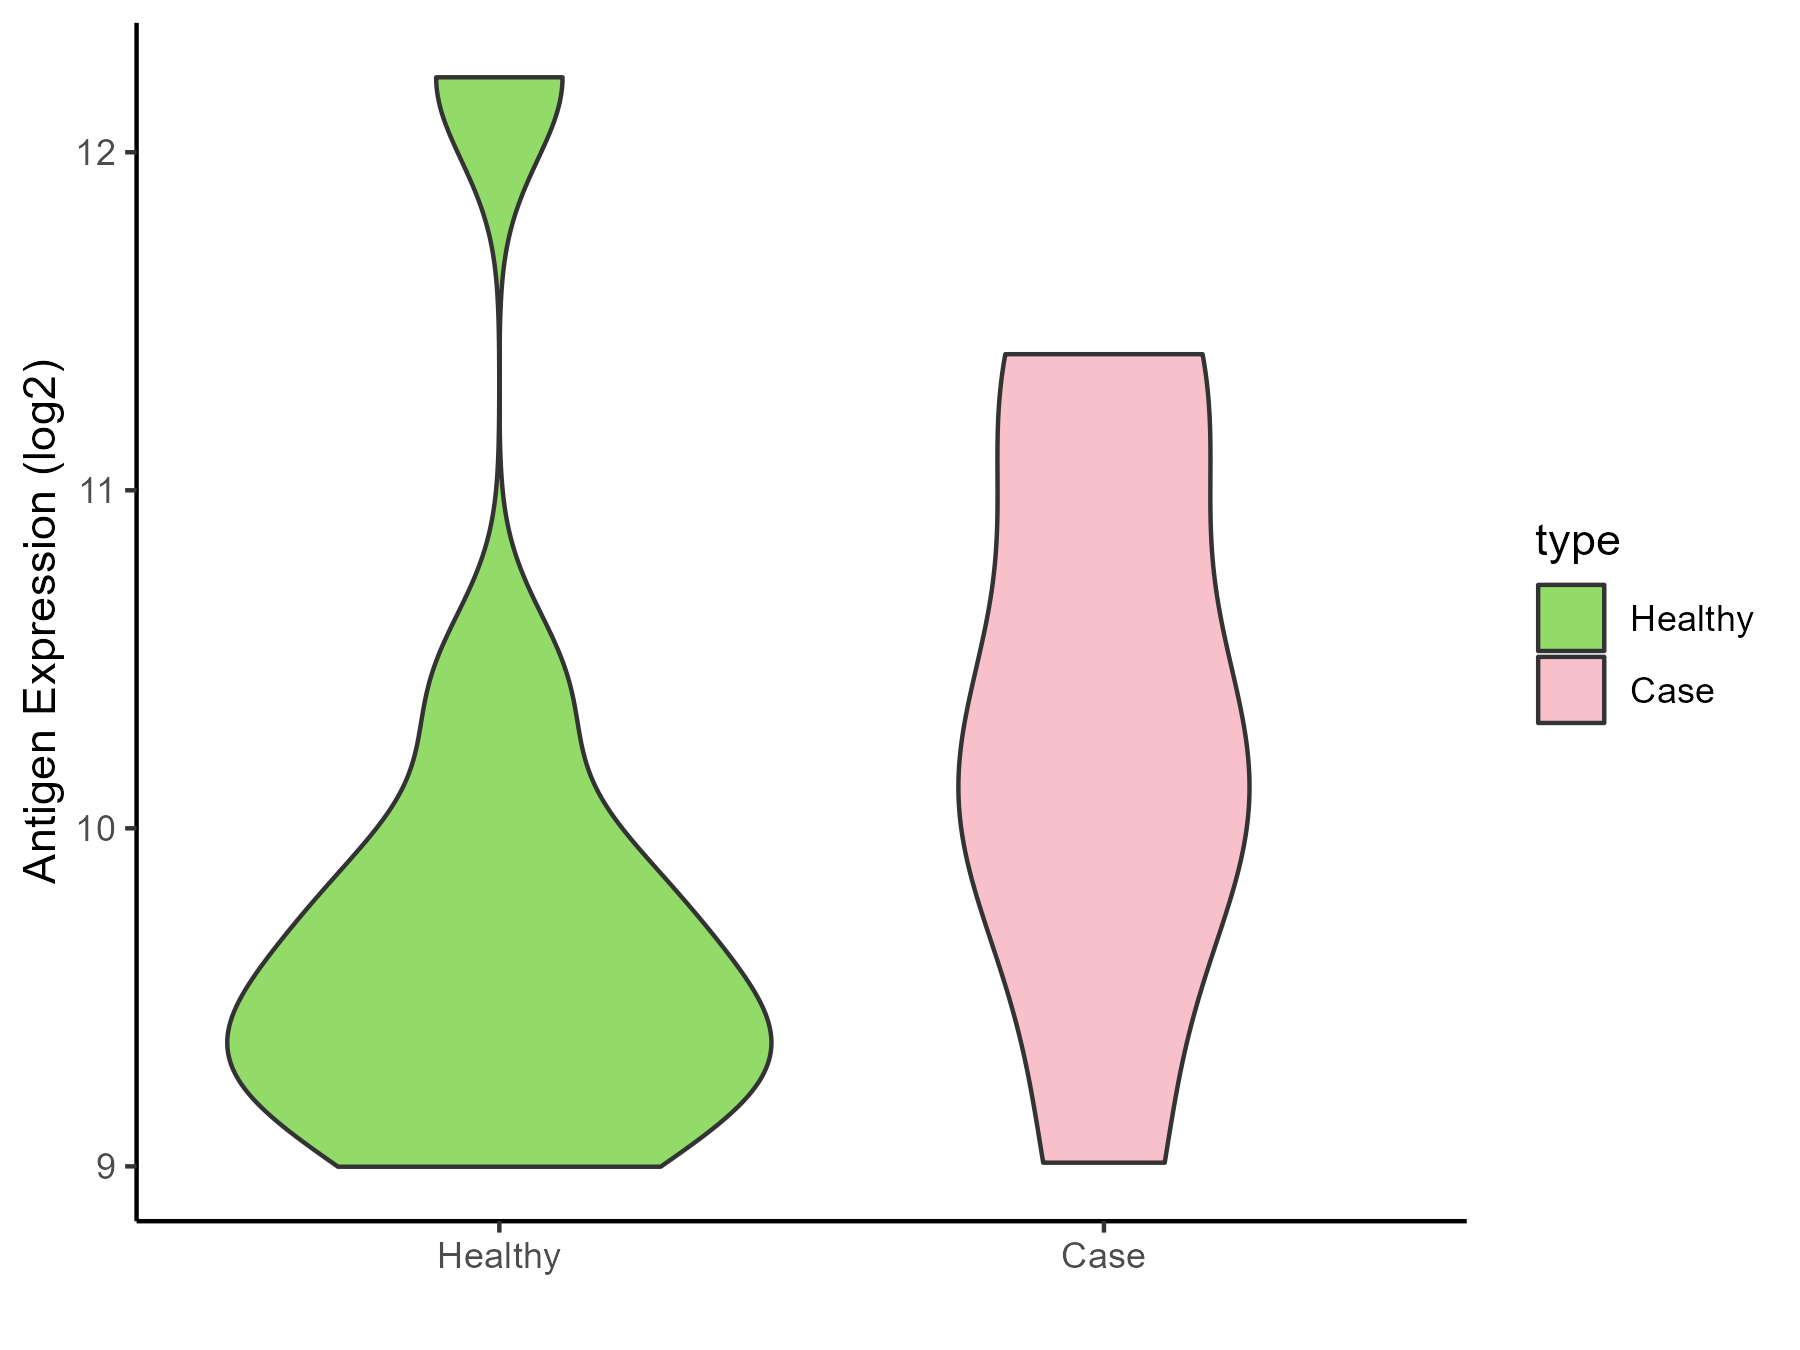
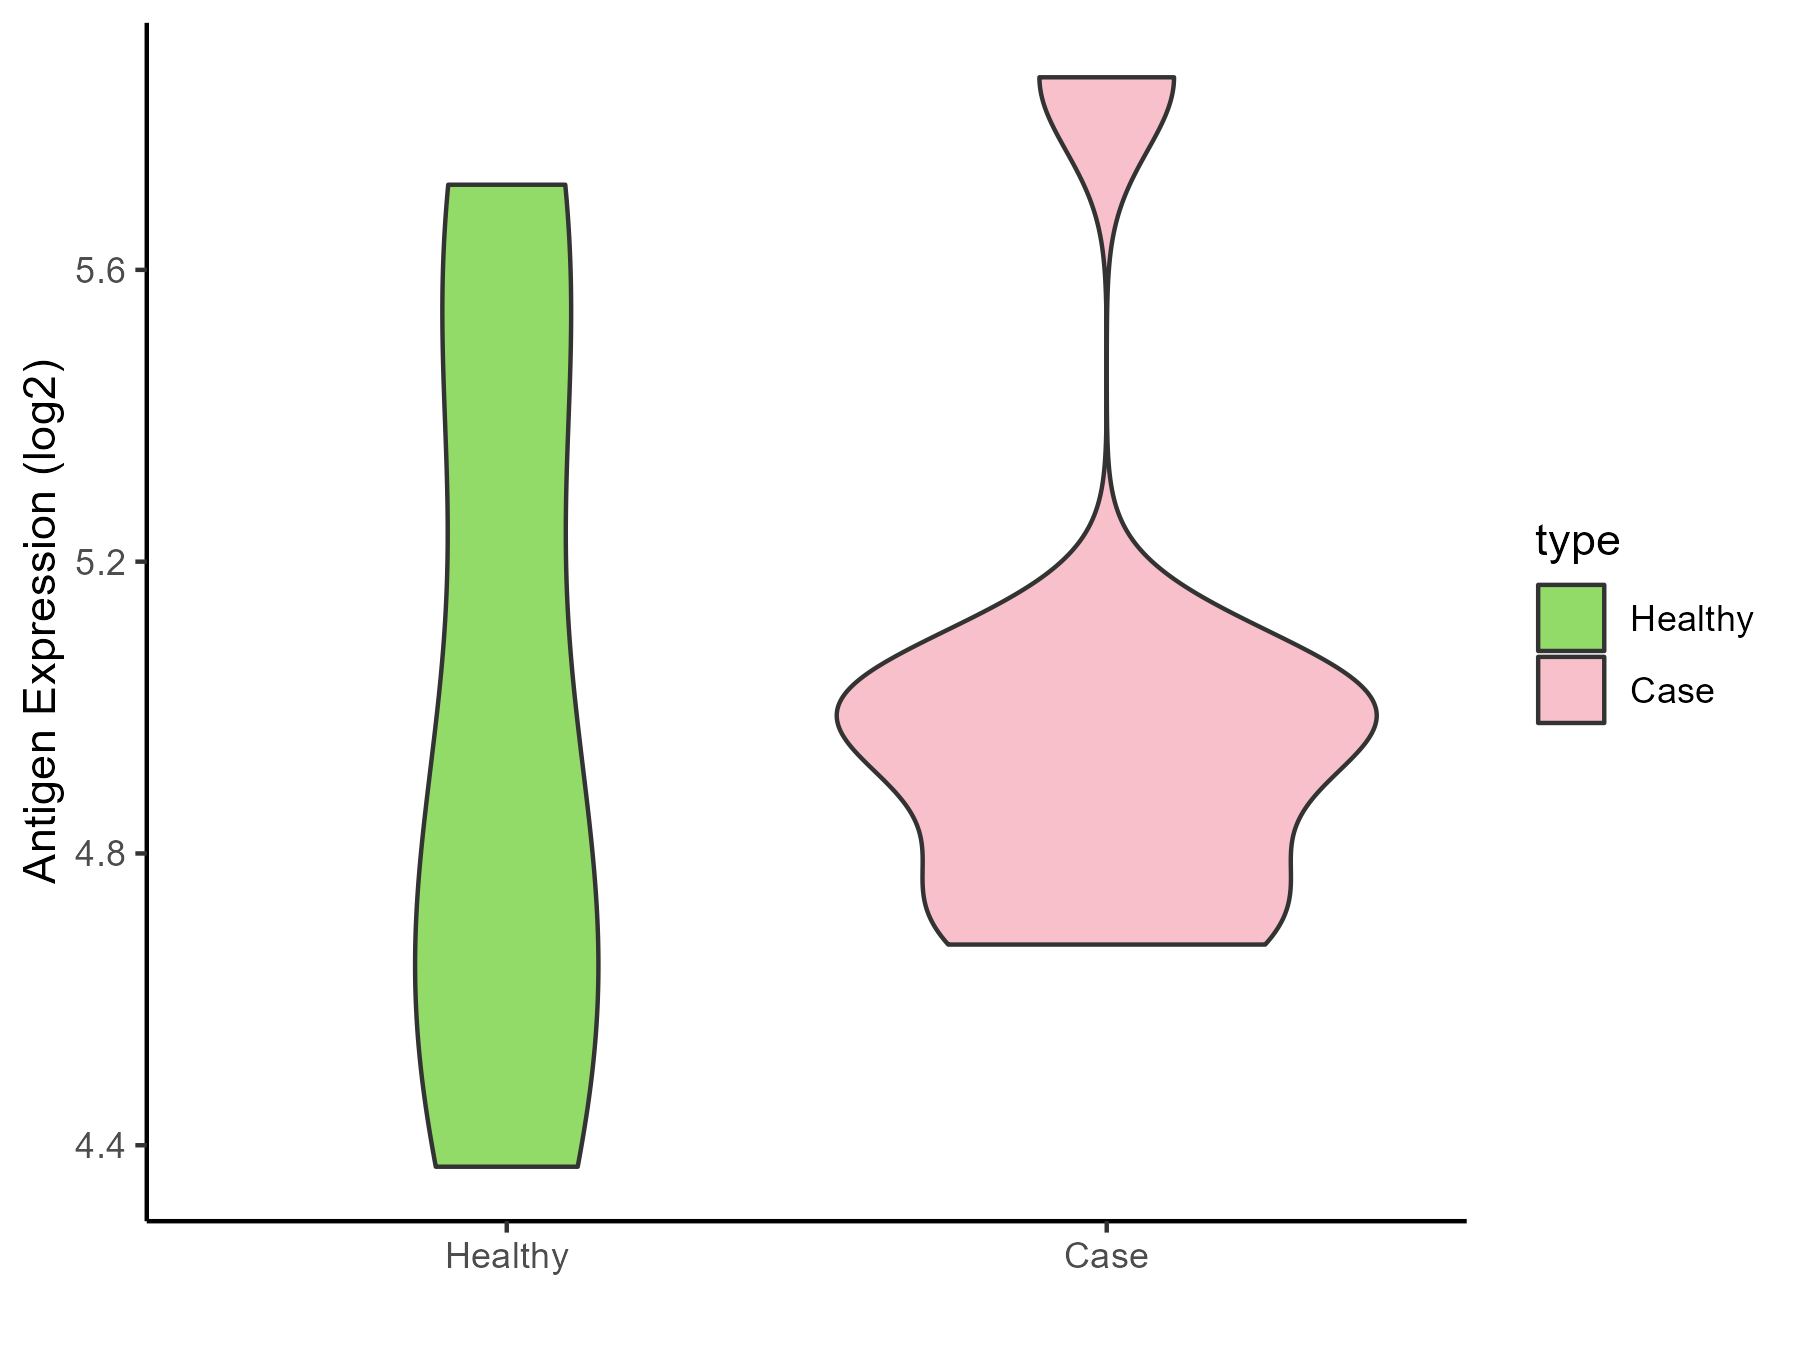
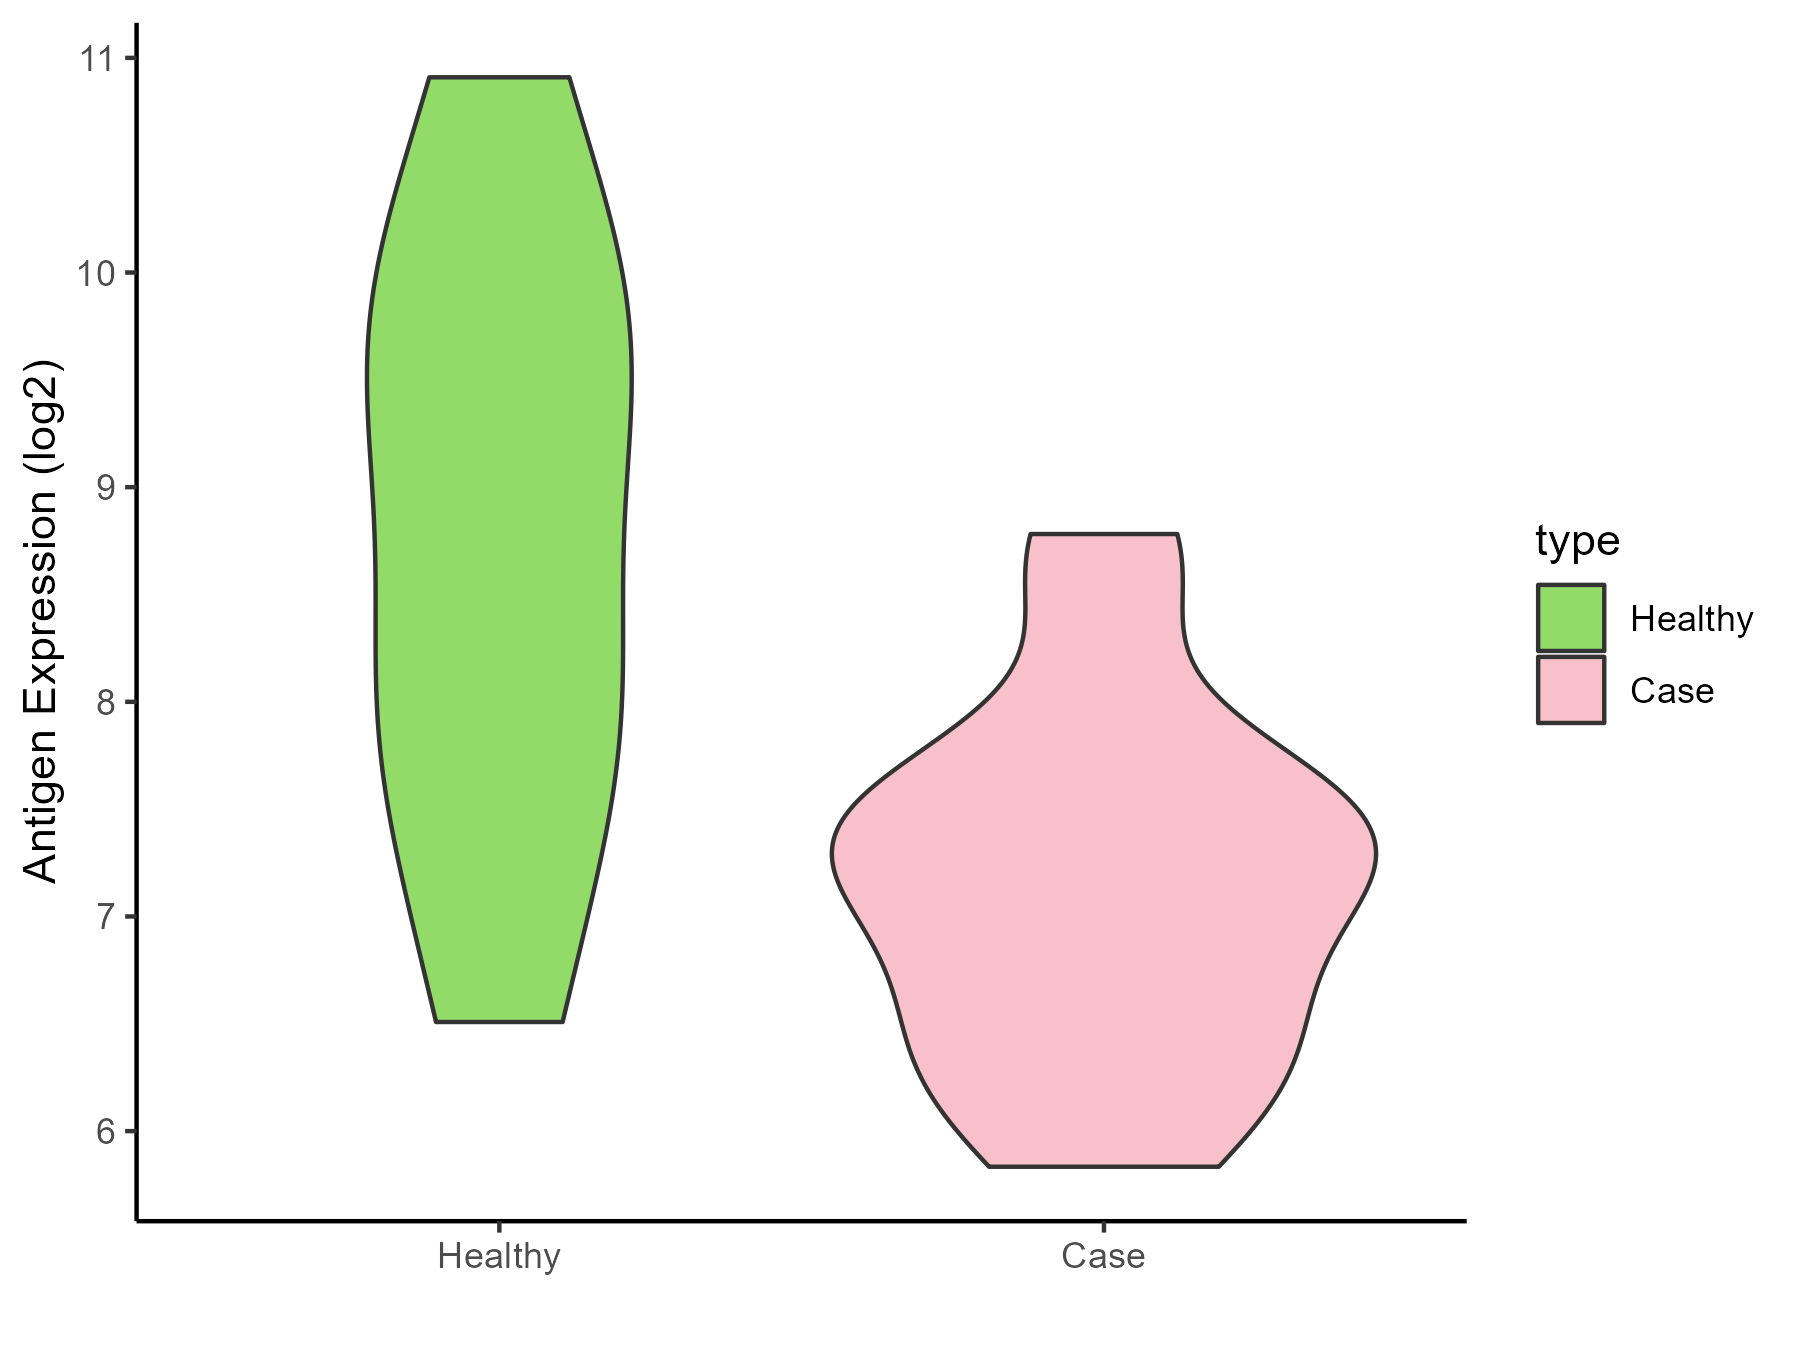
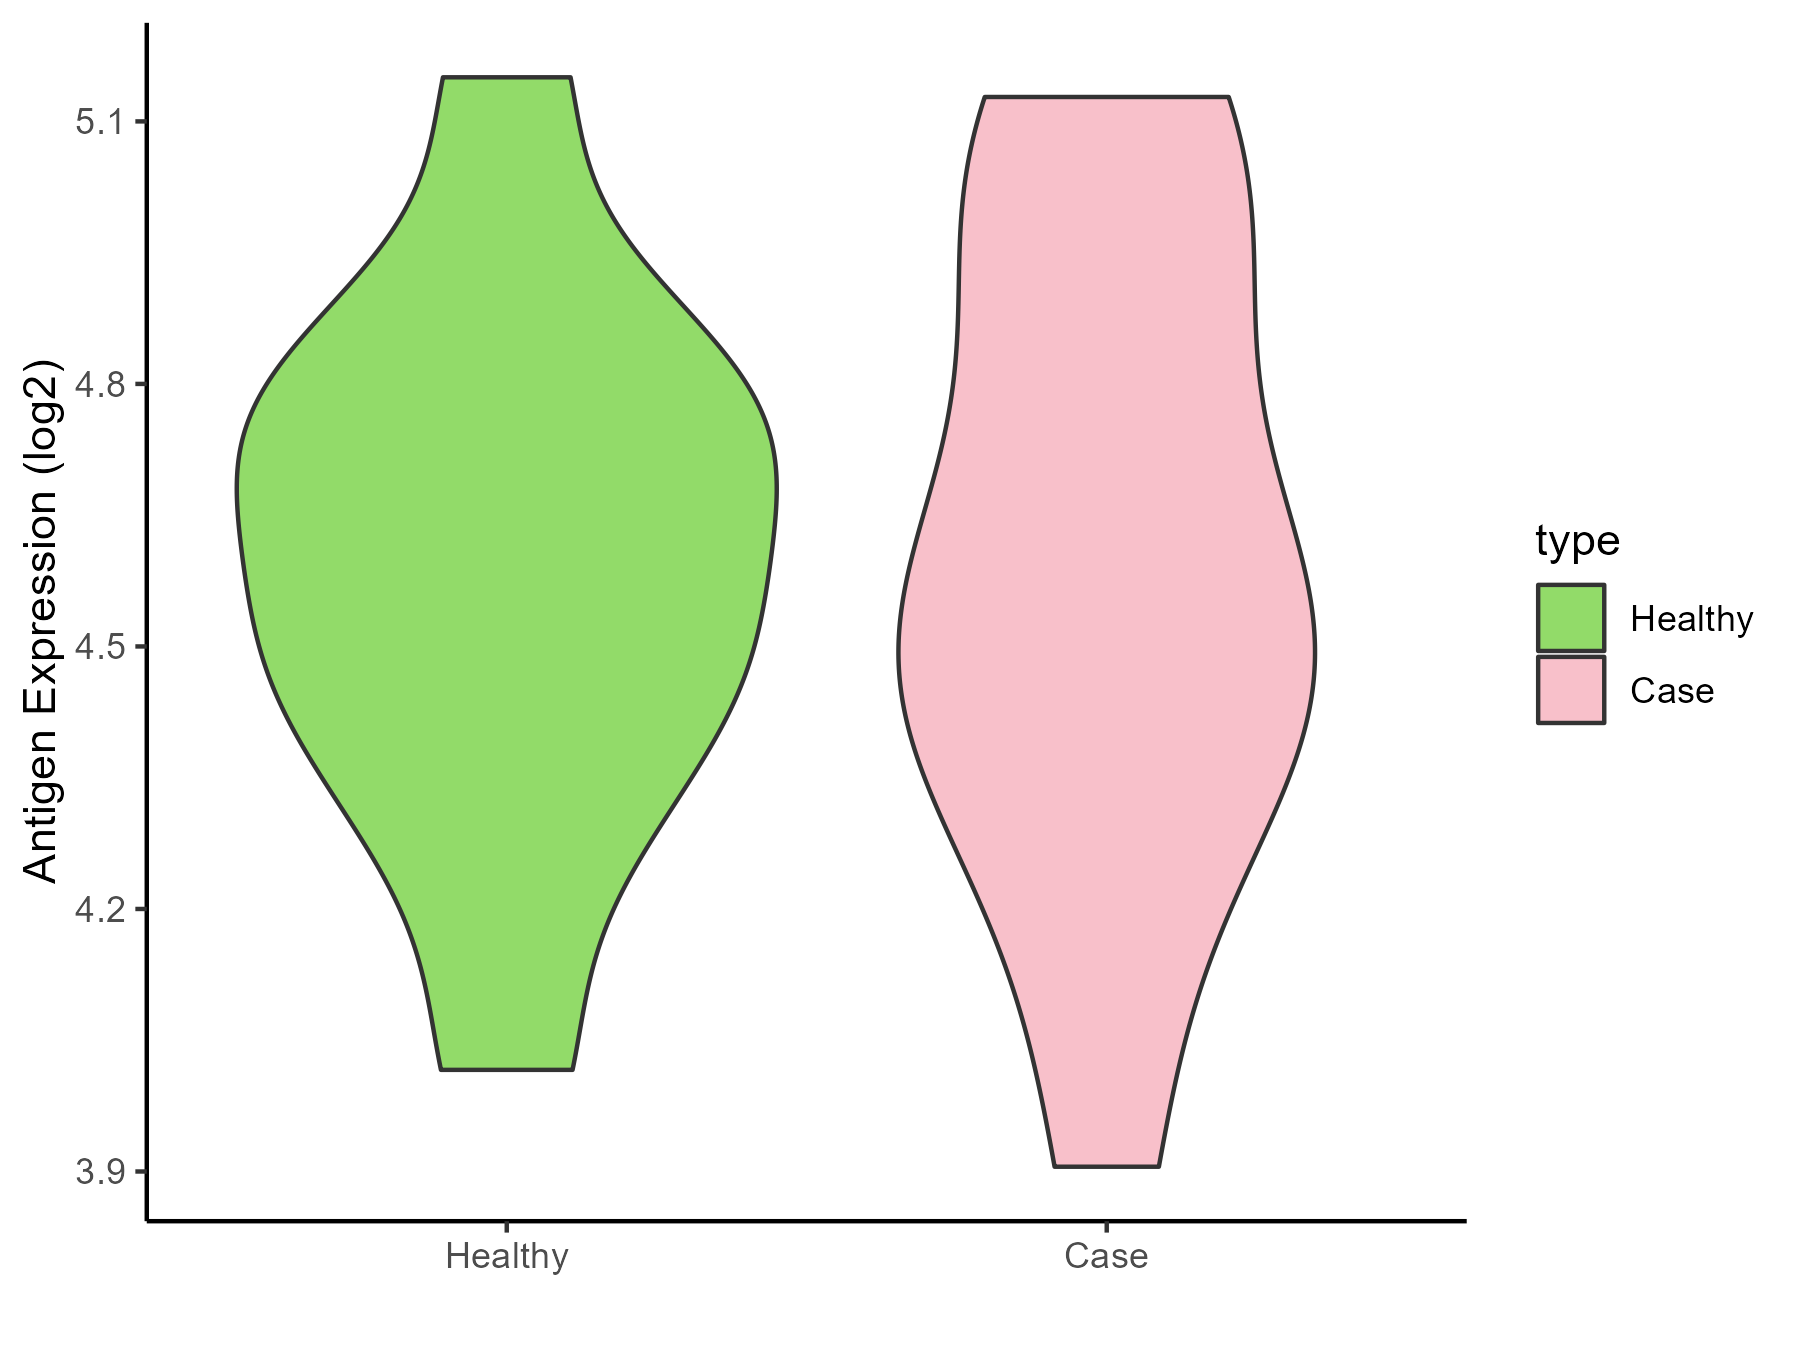
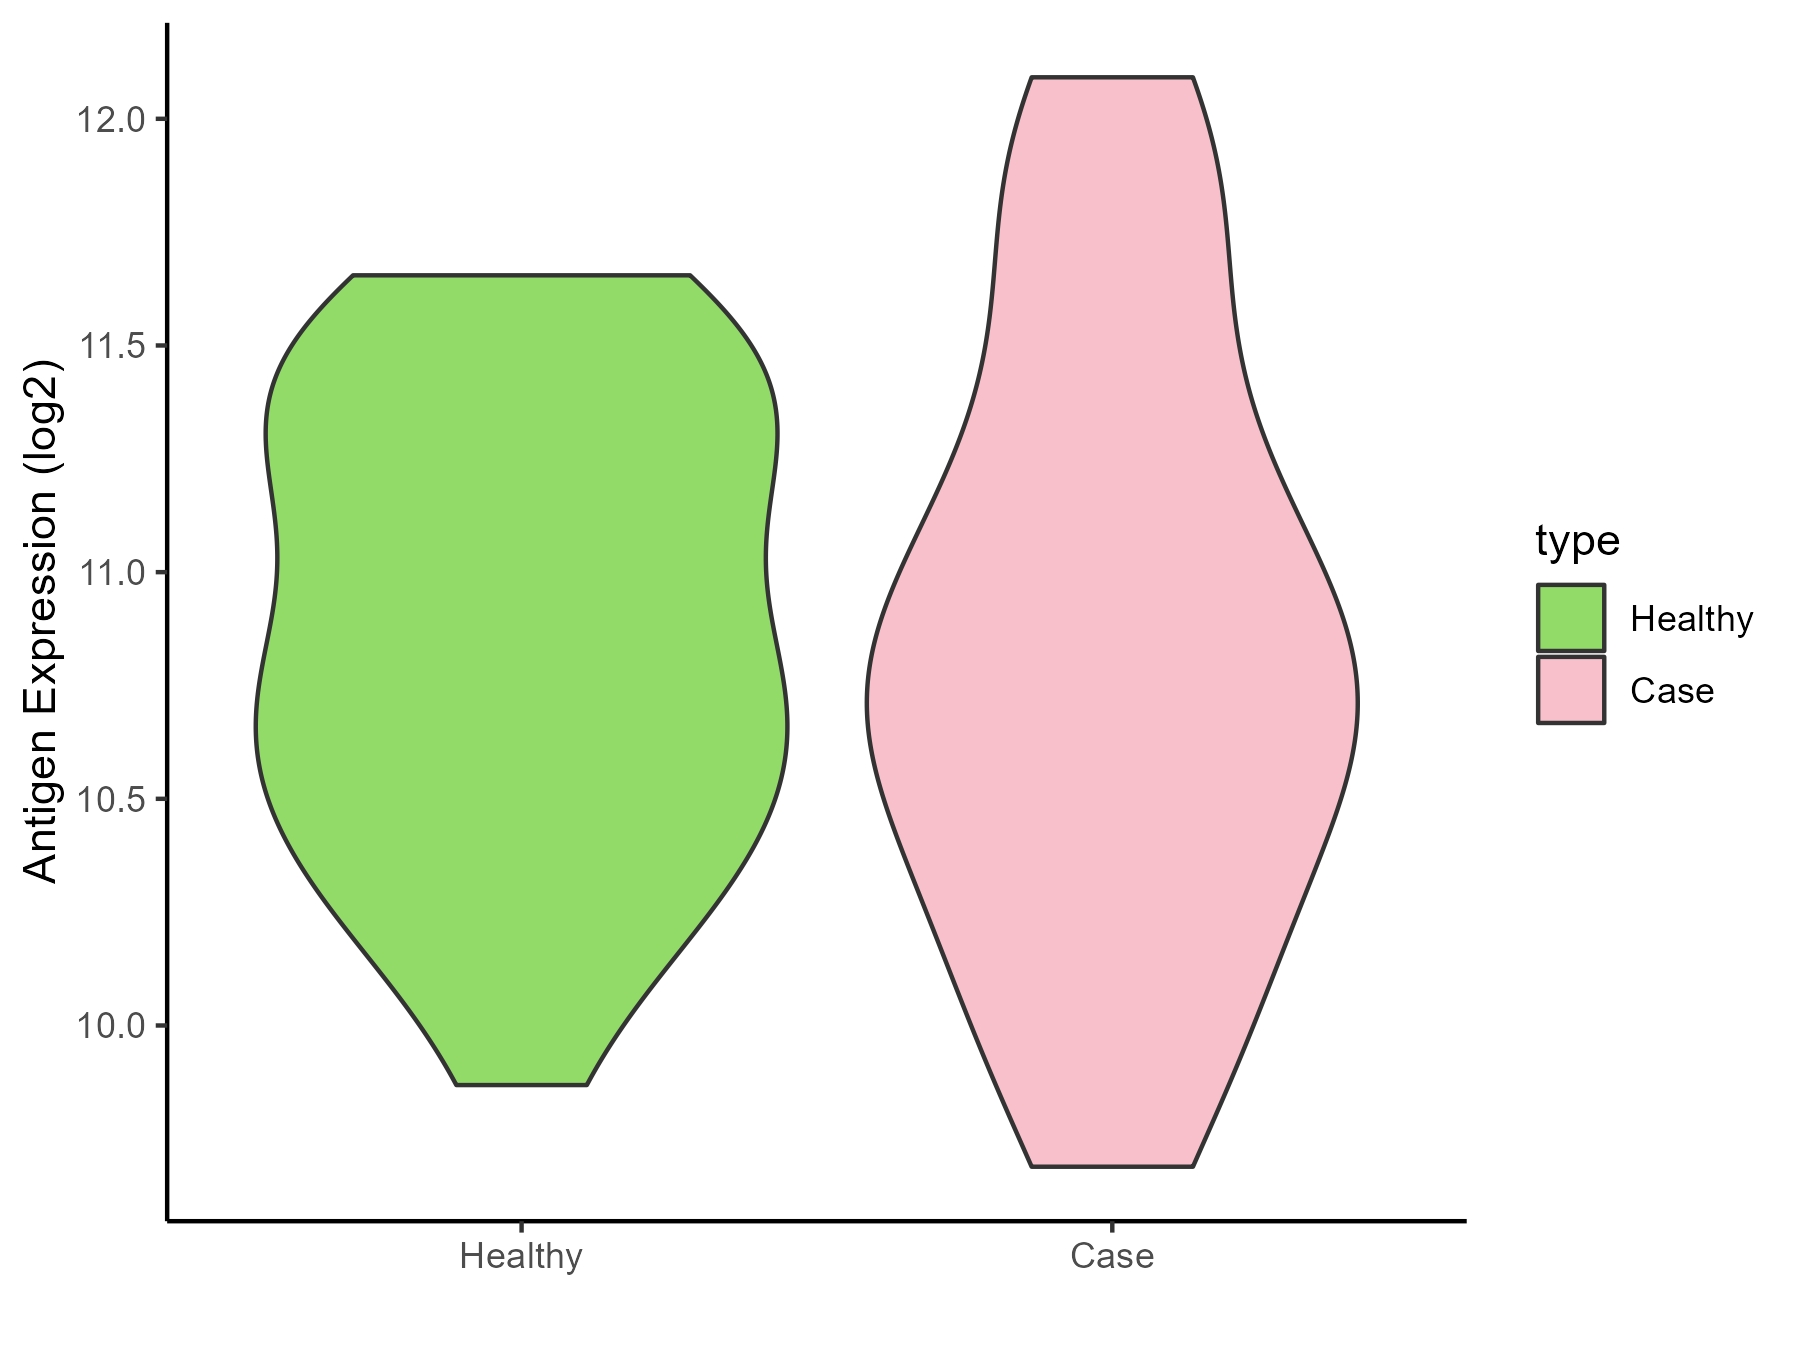
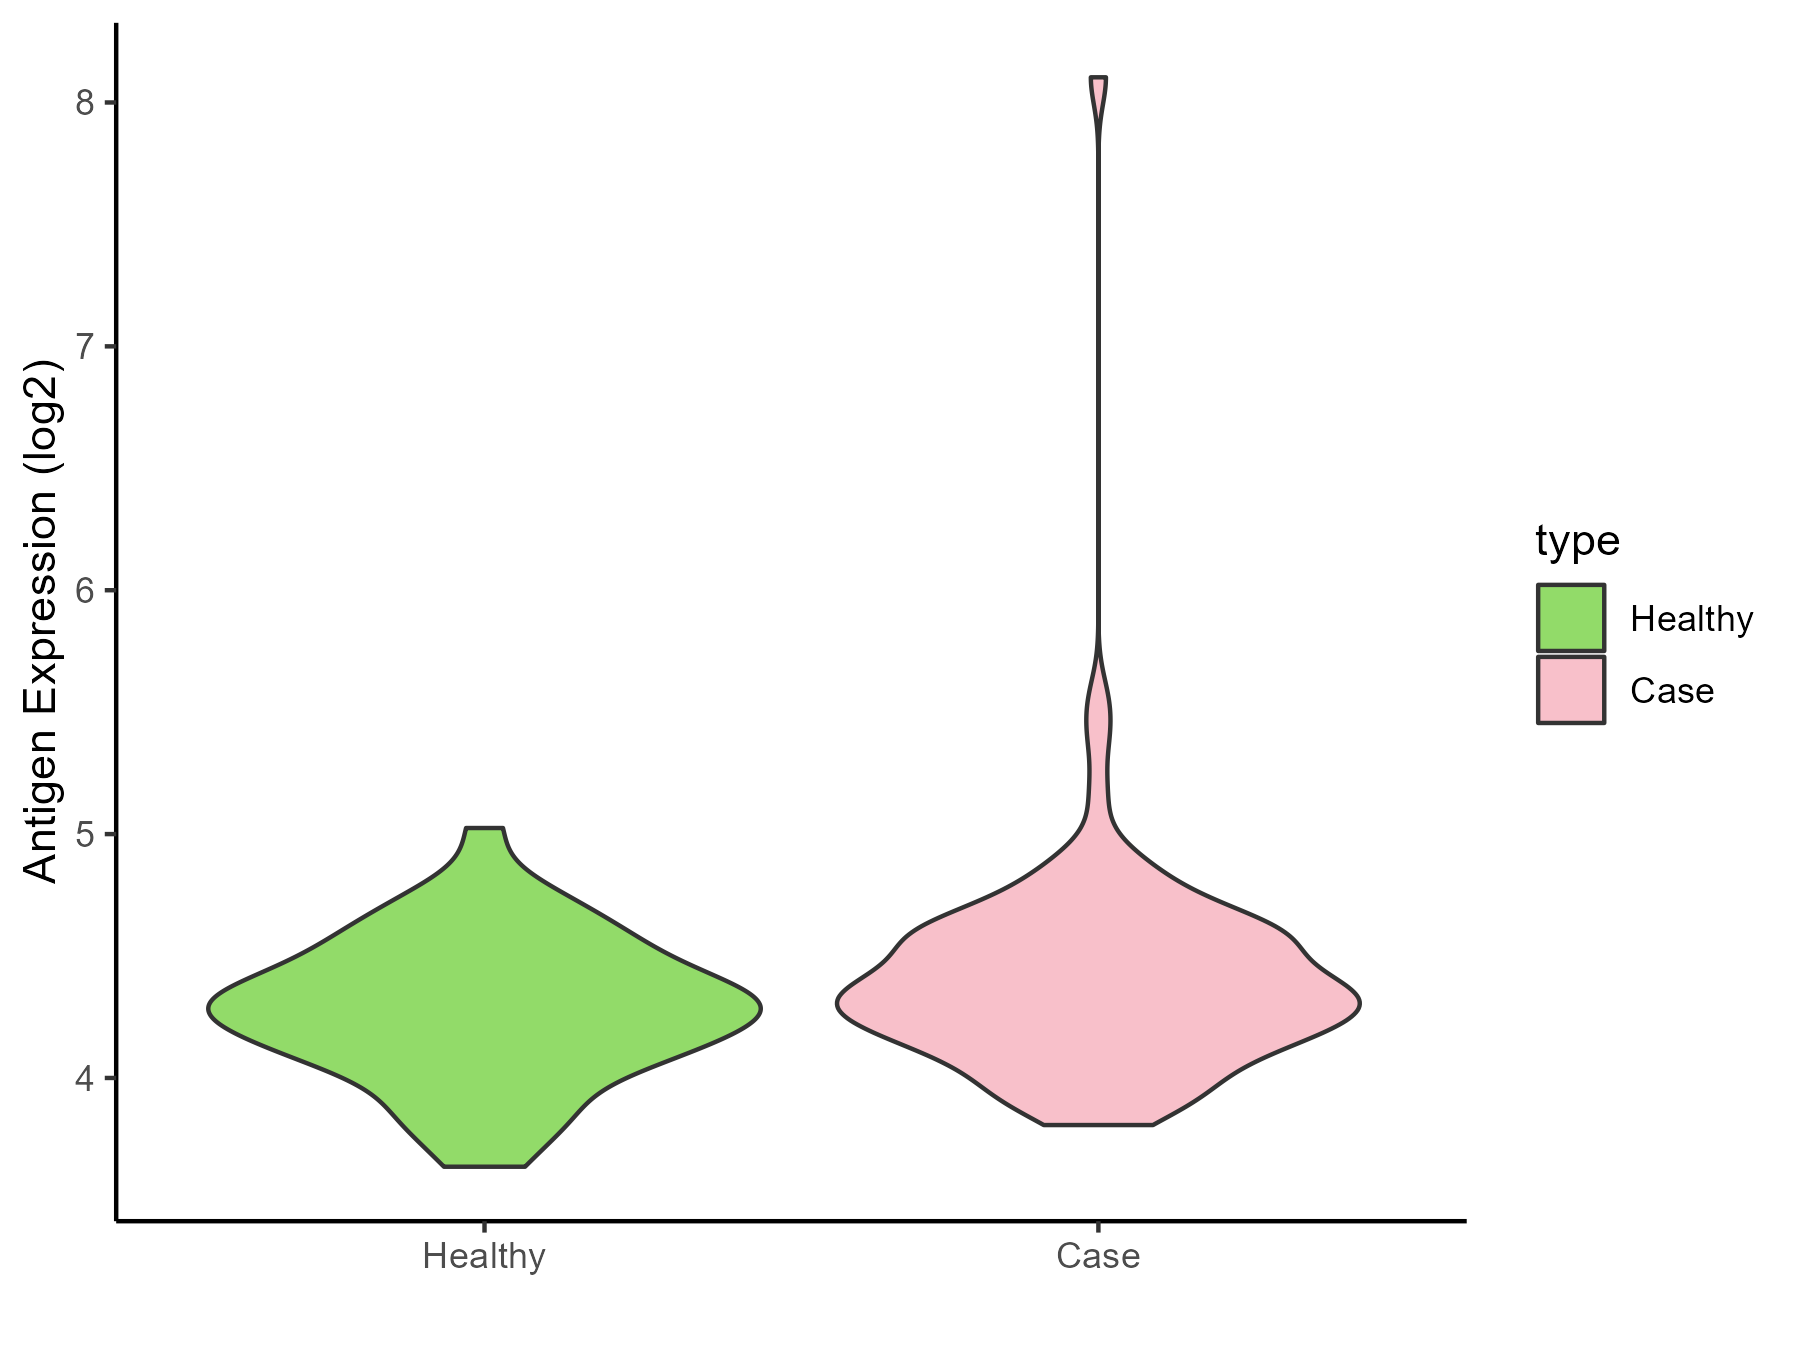
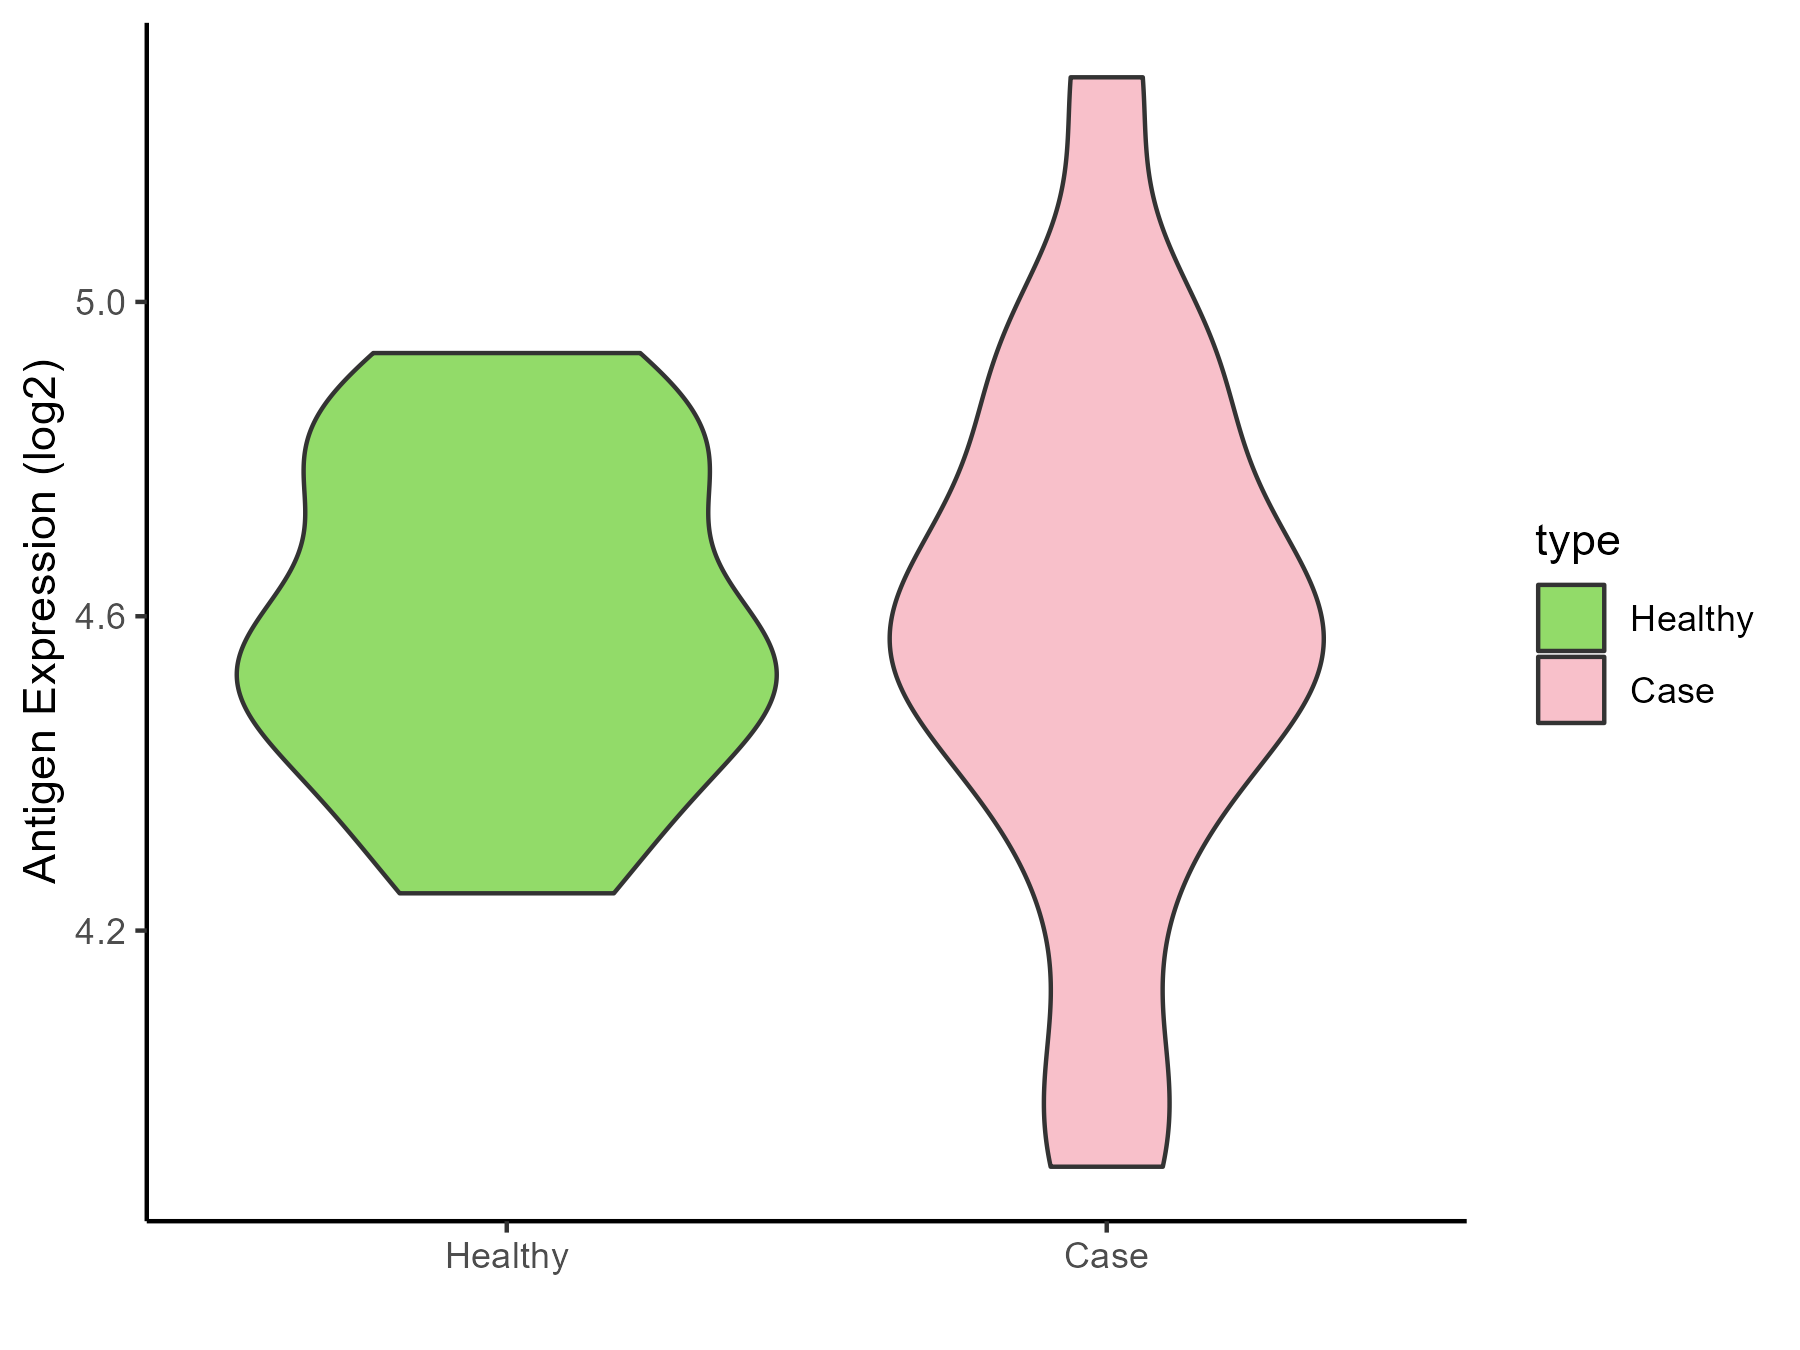
 Bacterial infection [ICD-11: 1A00-1C4Z]
Click to Show/Hide
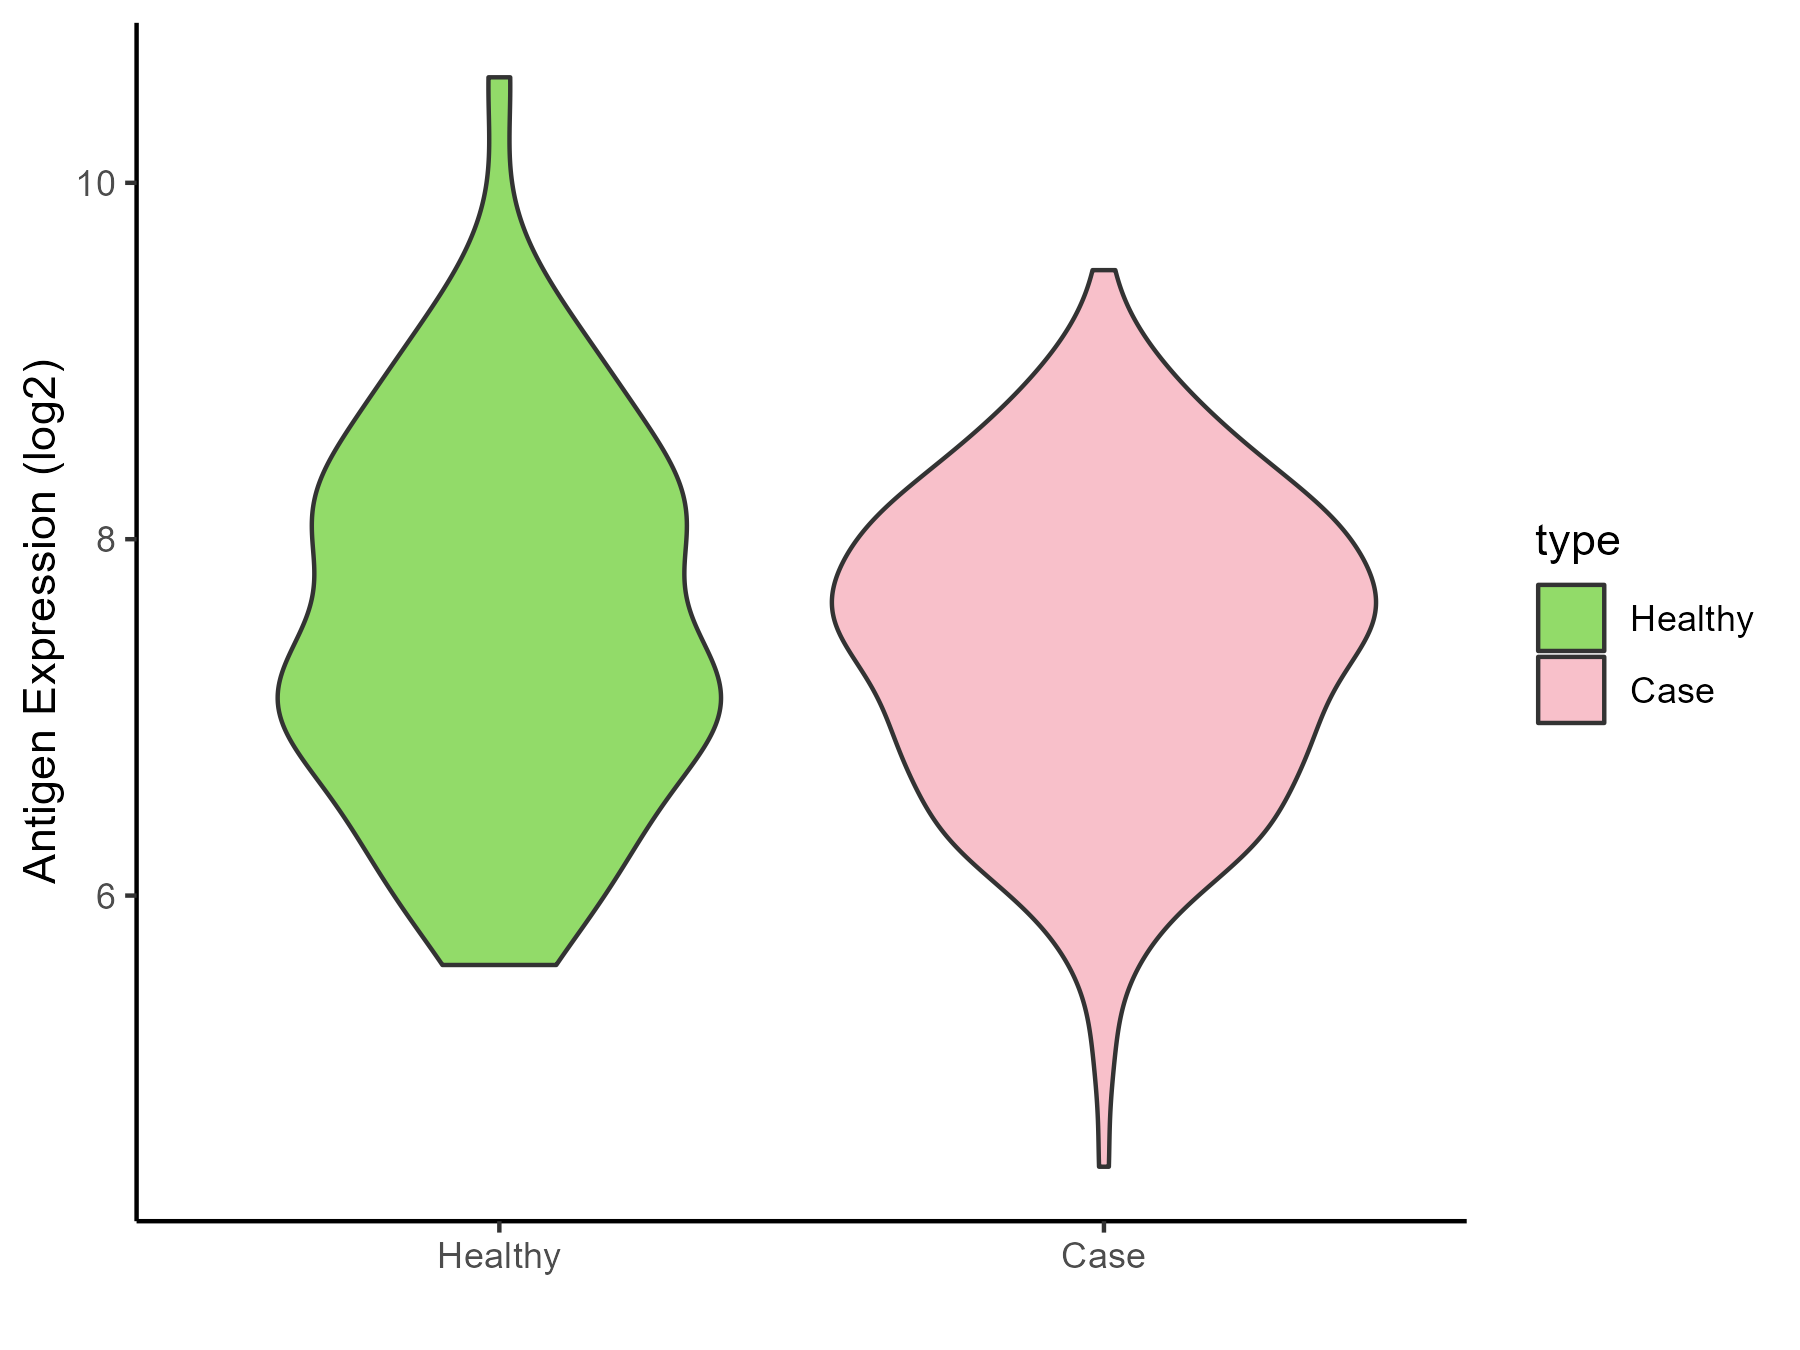
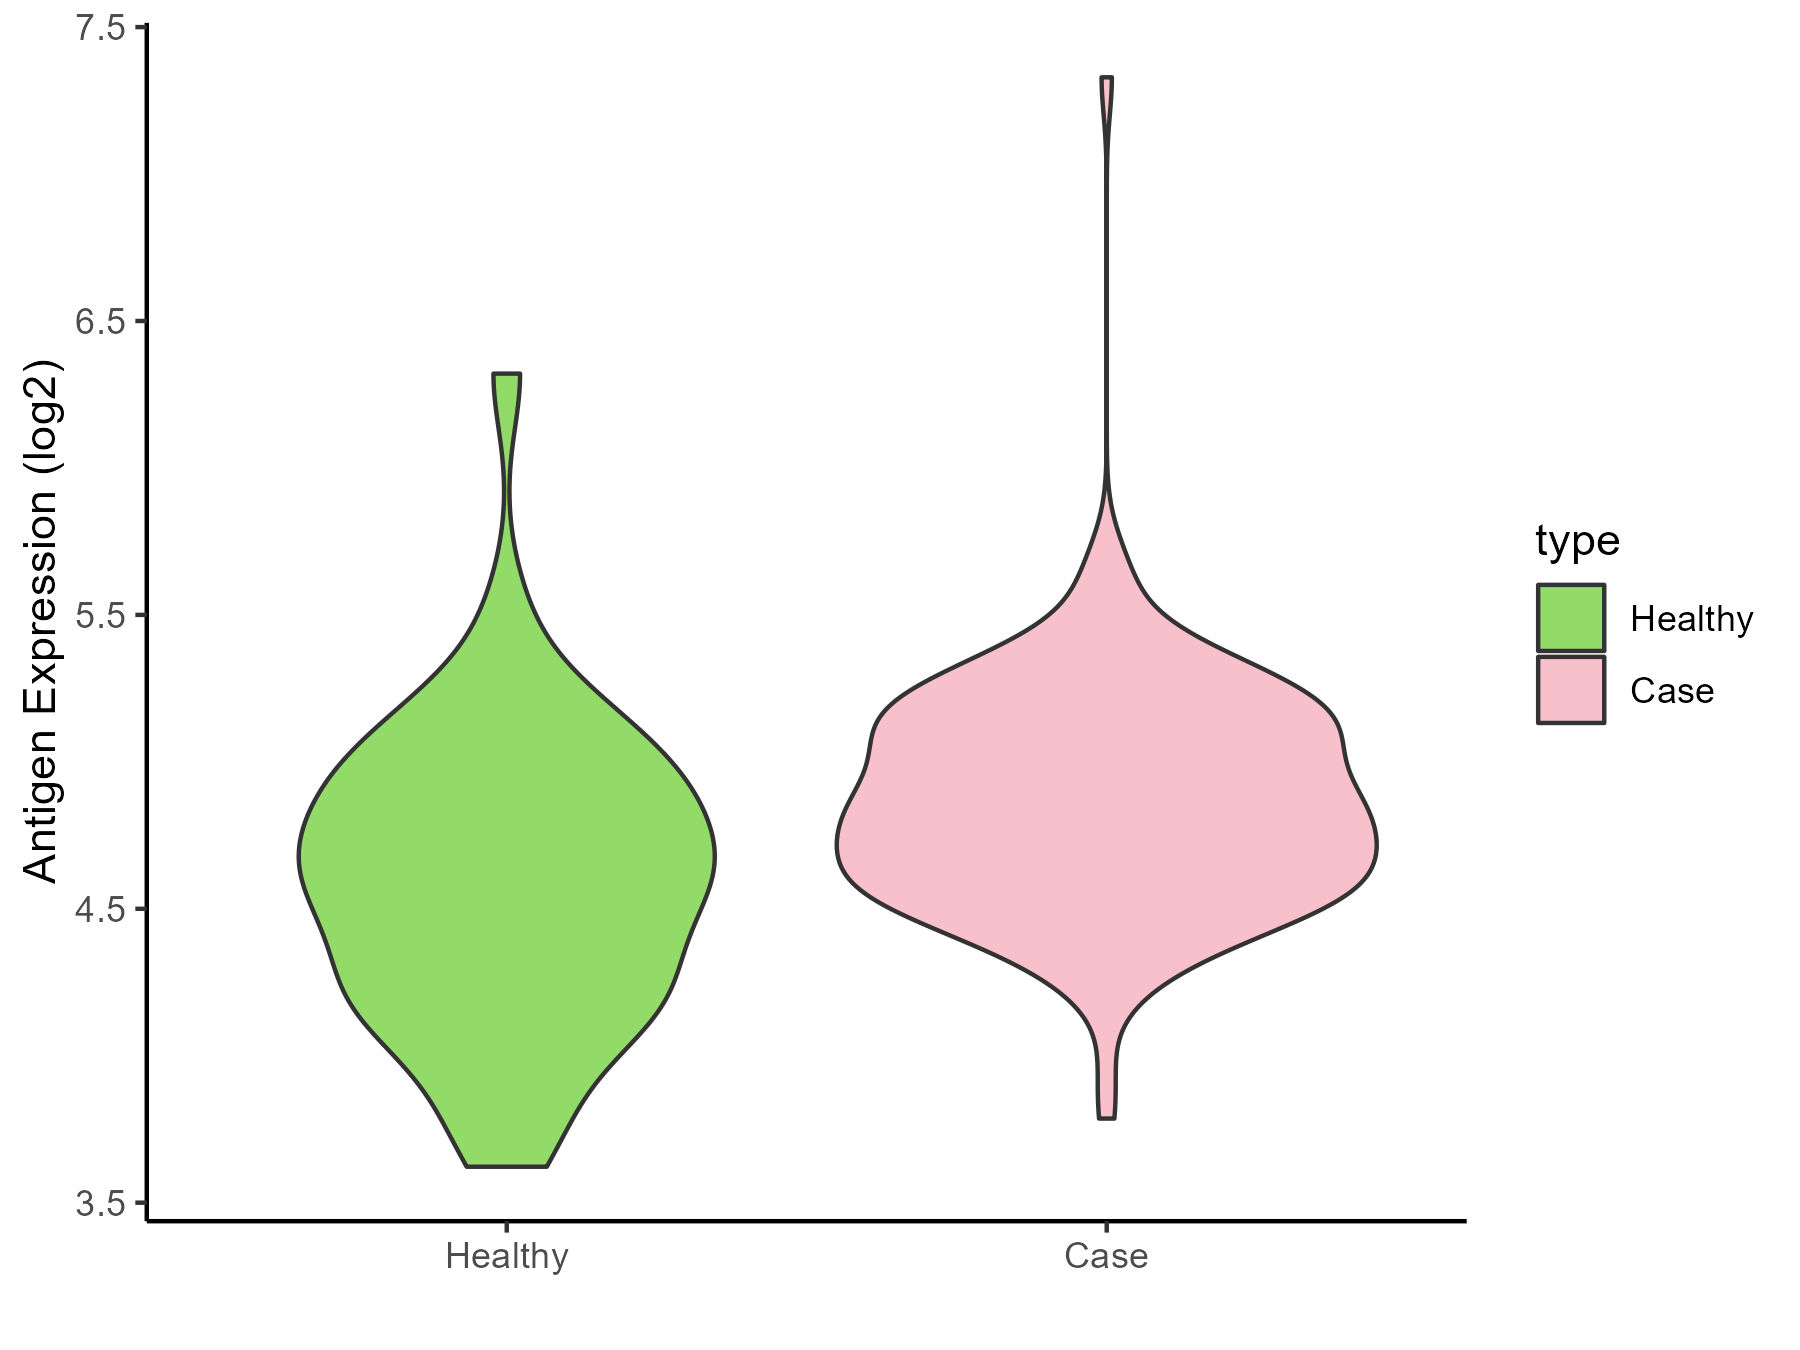
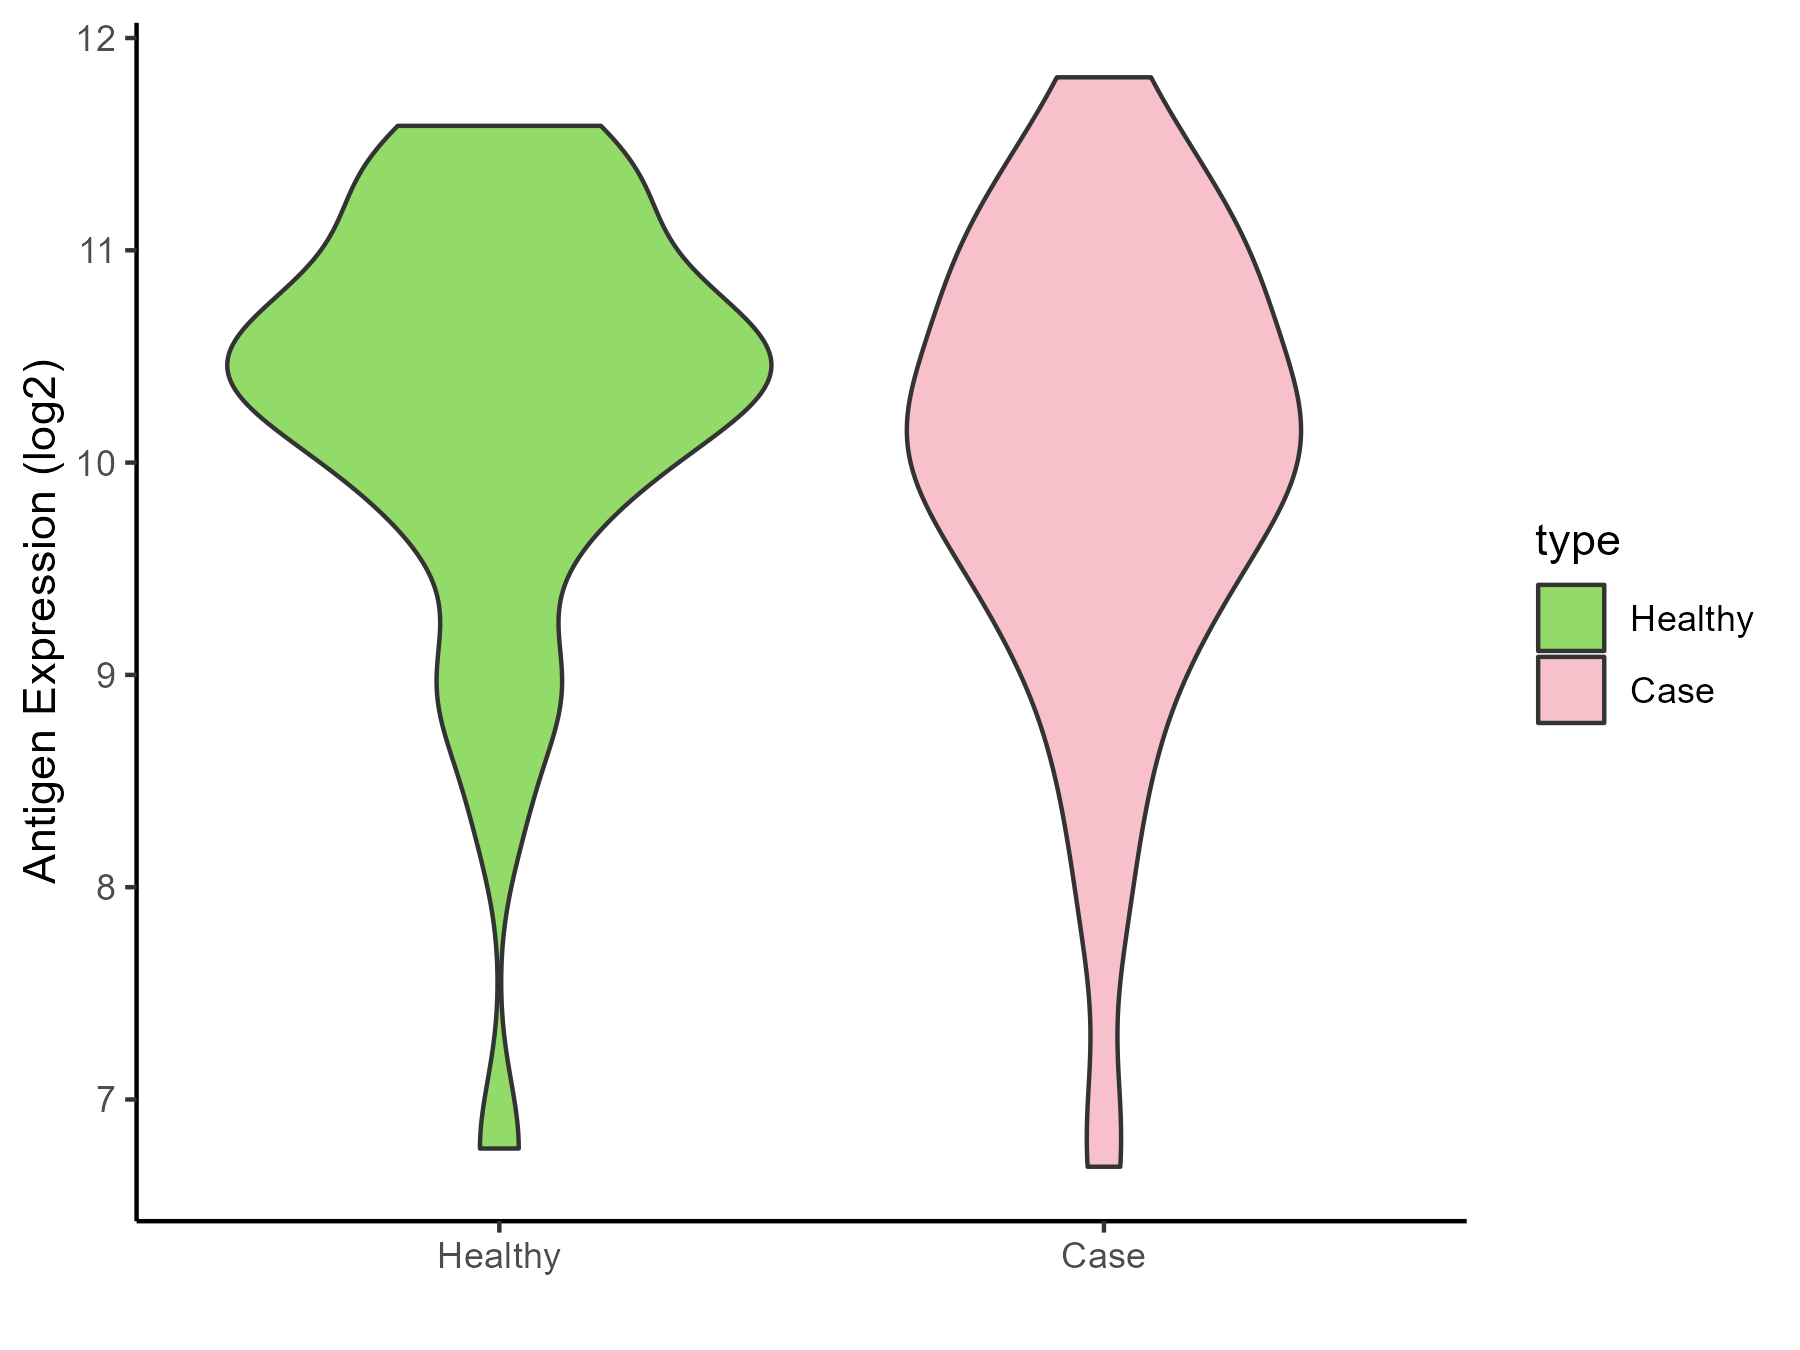
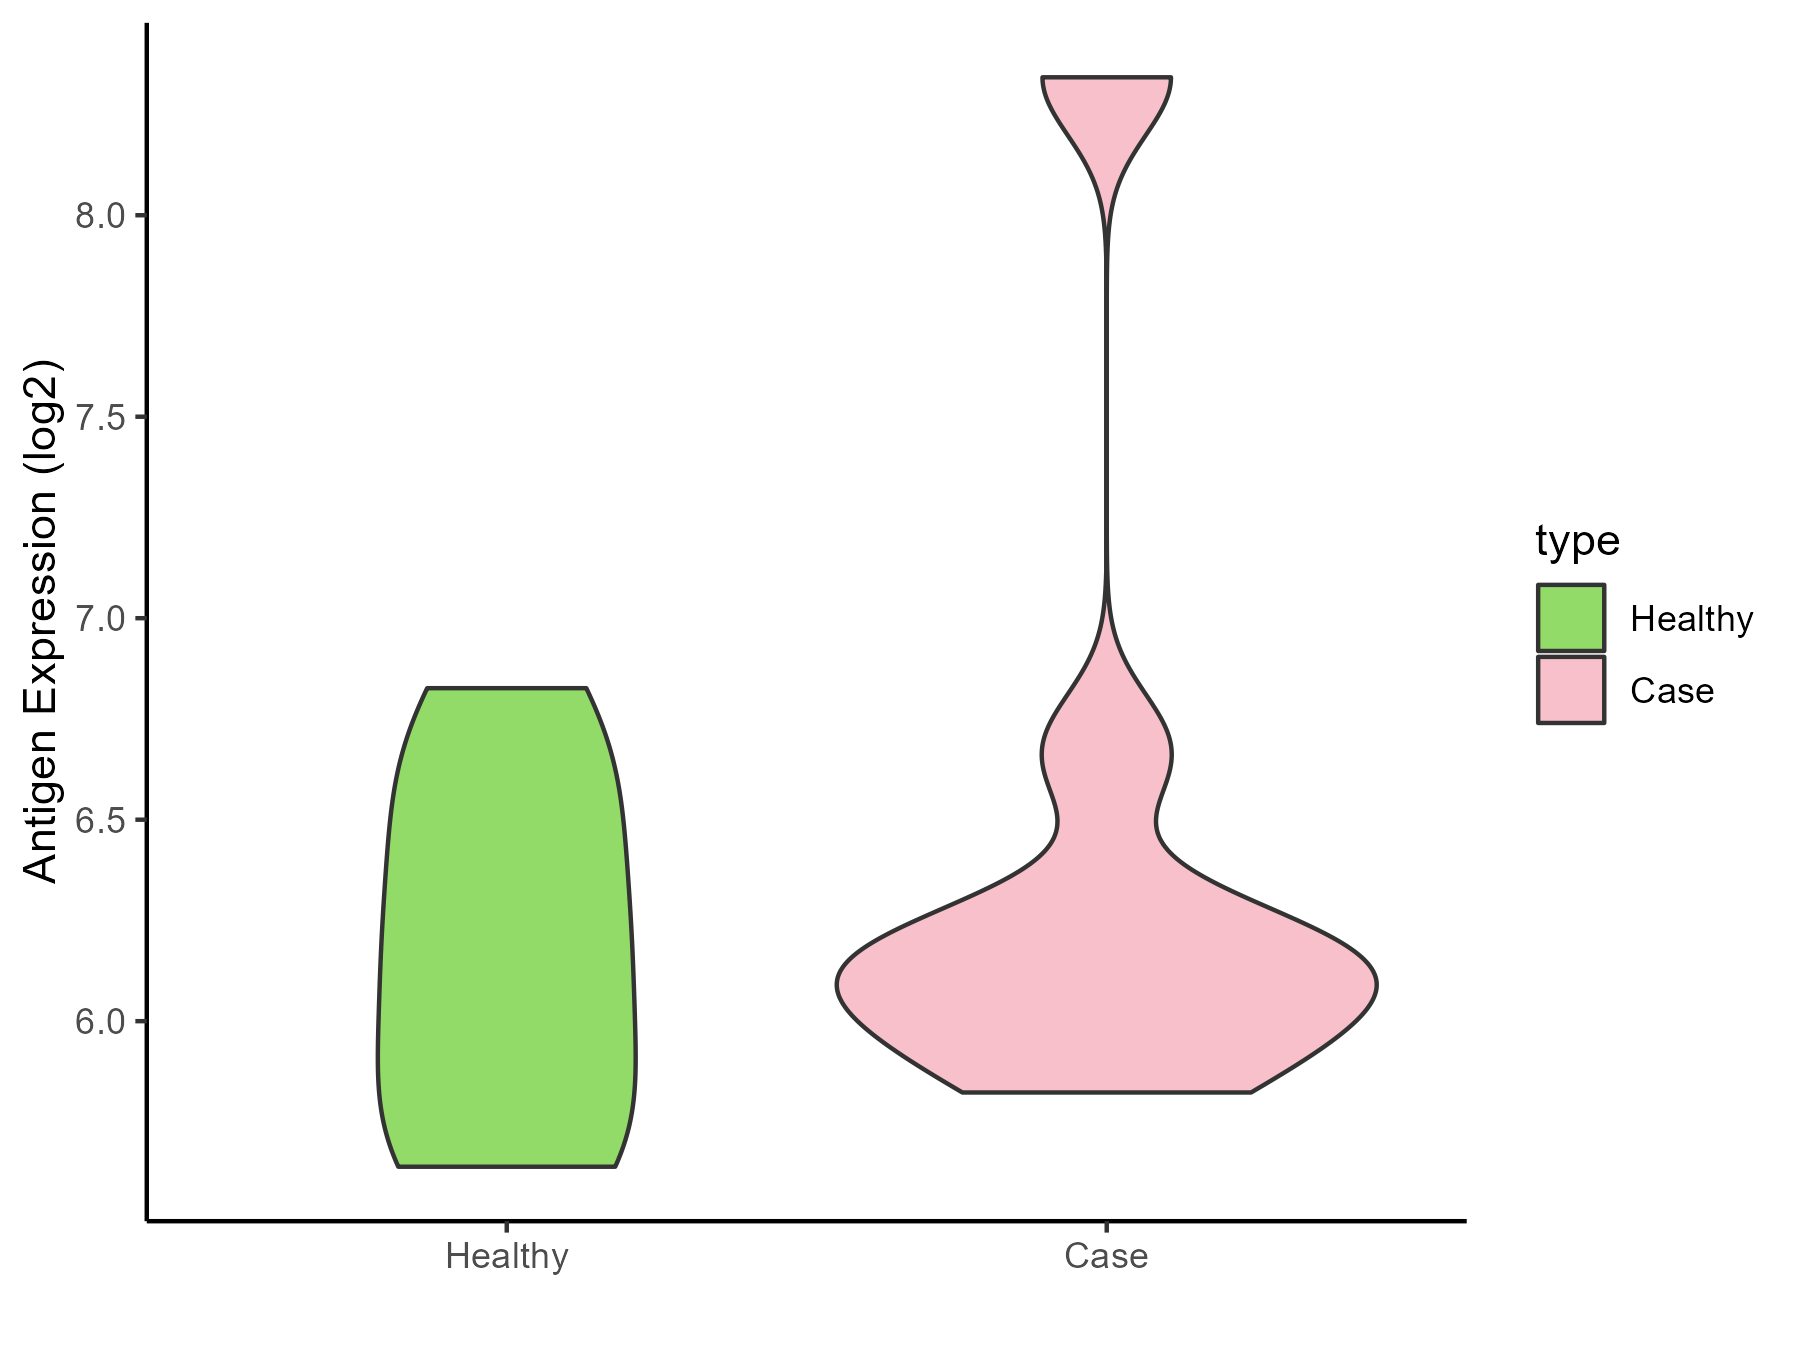
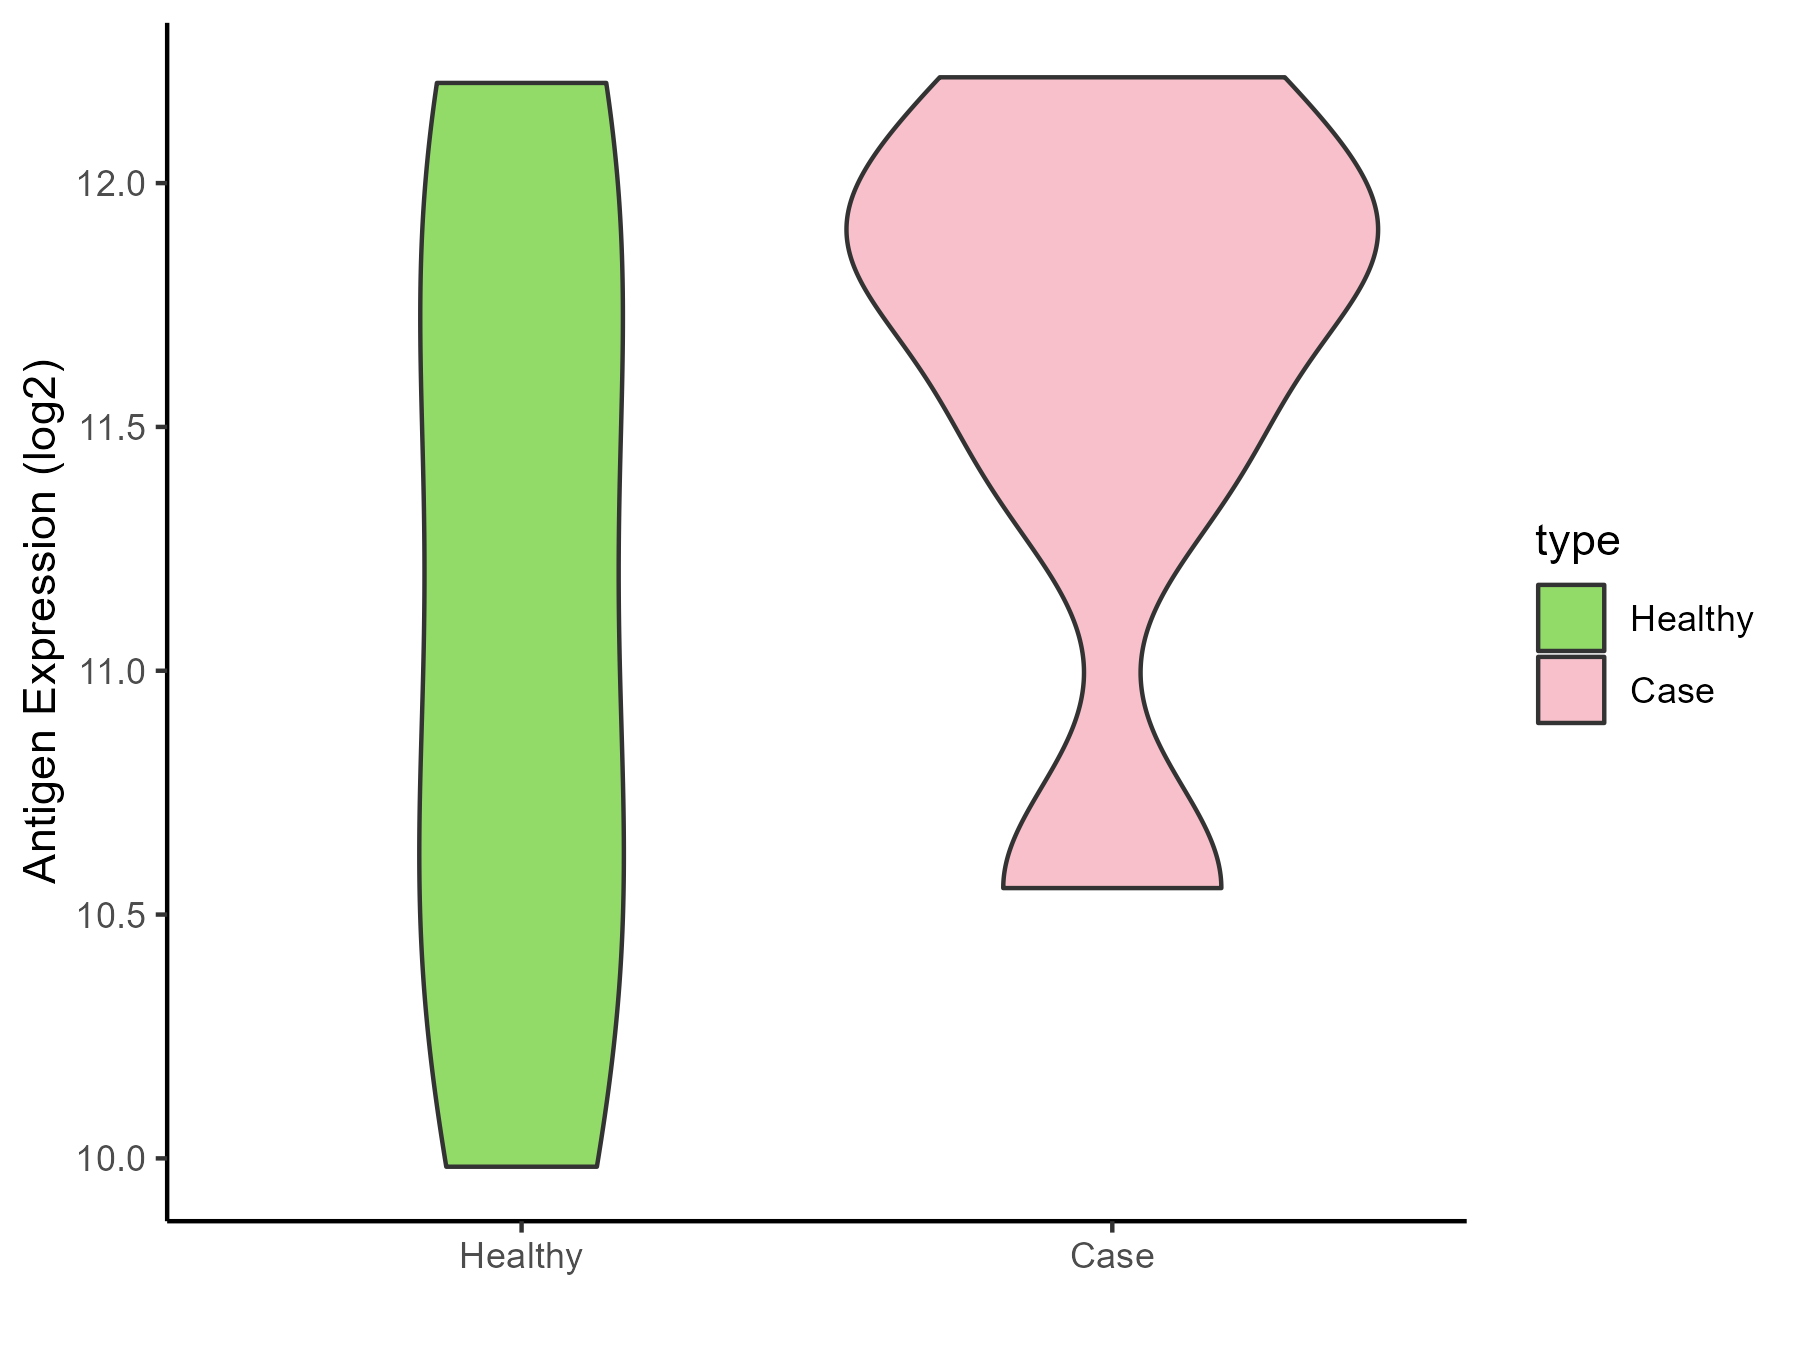
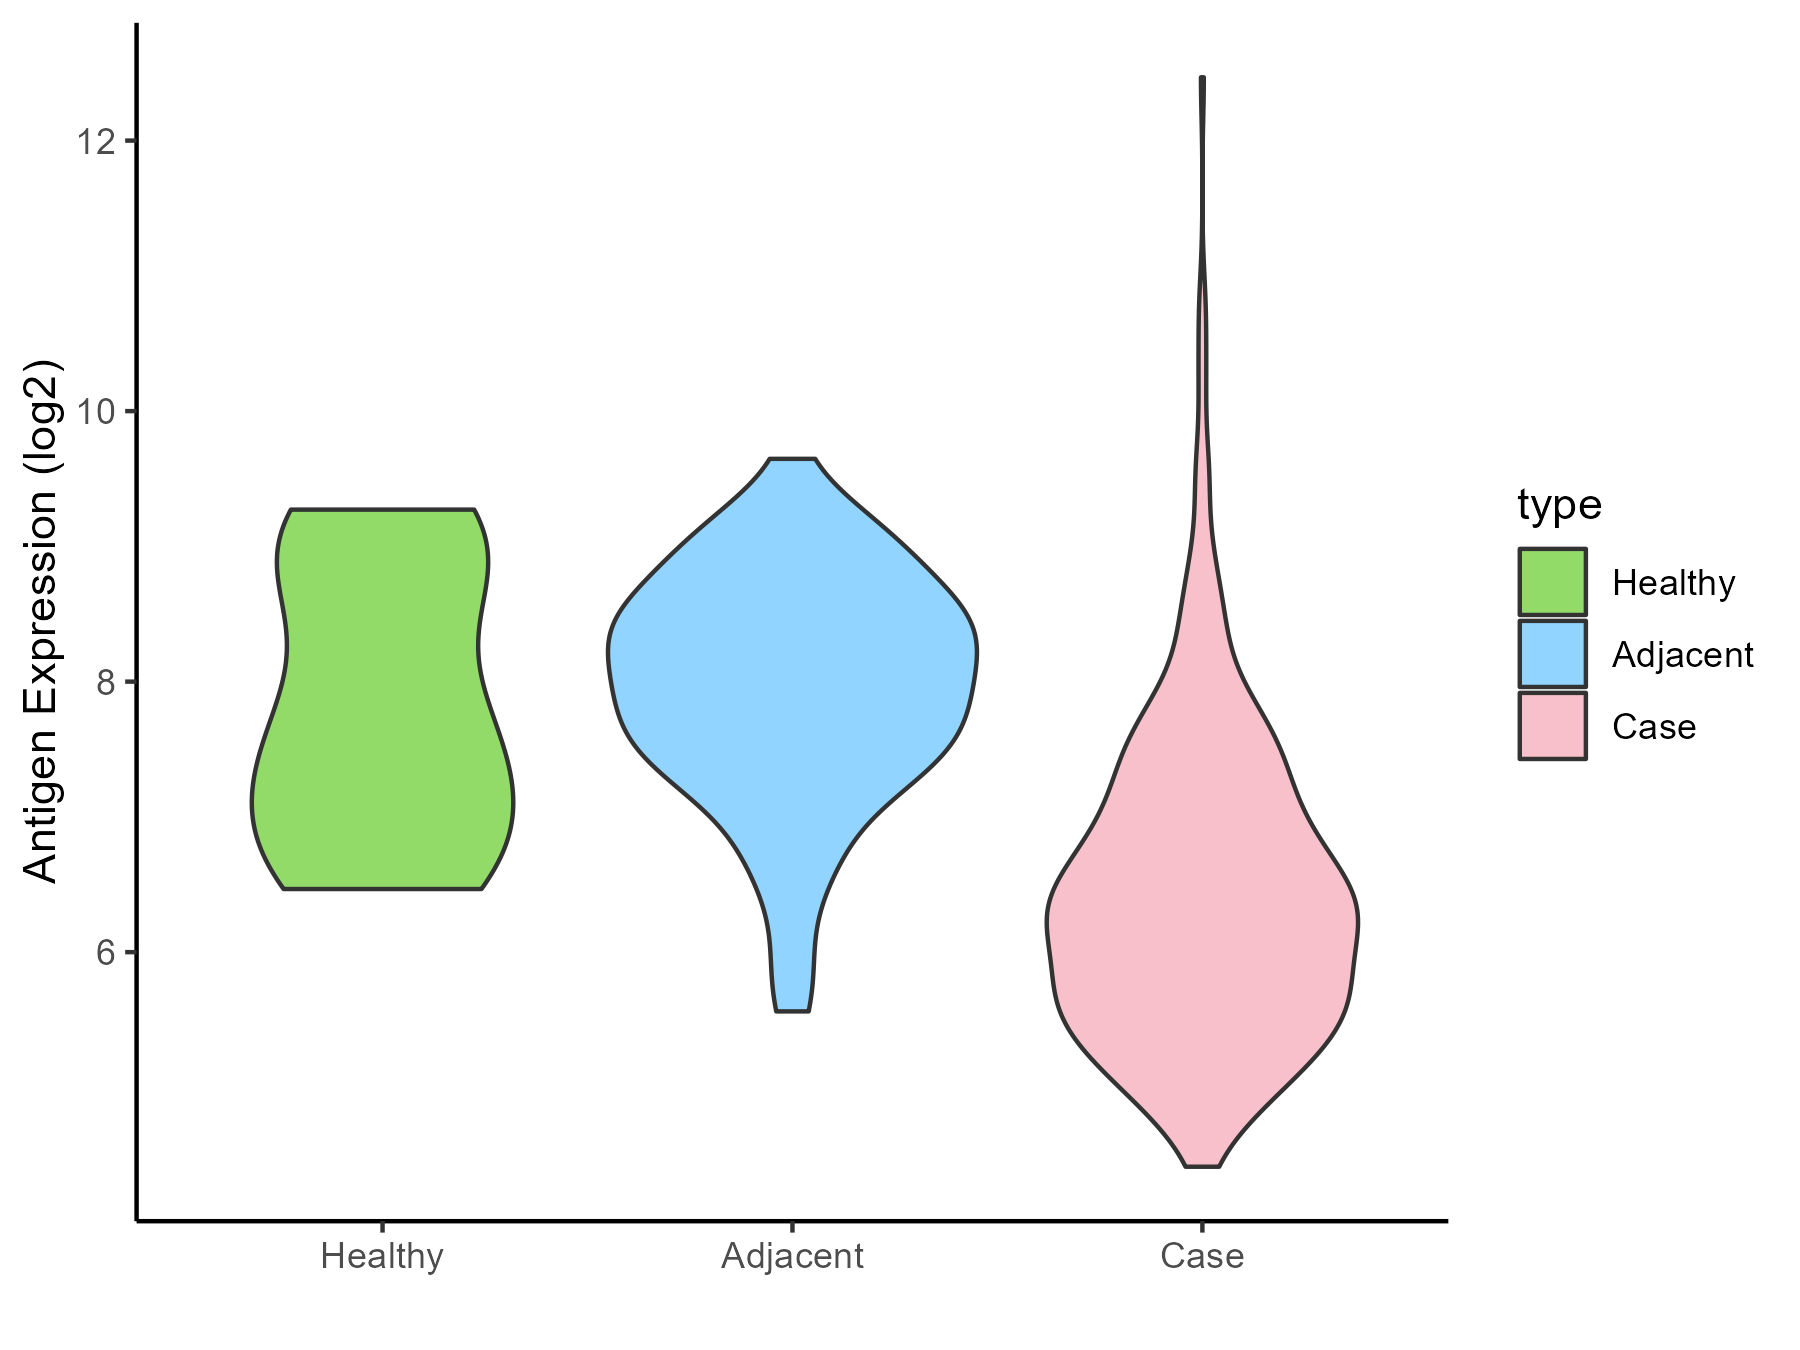
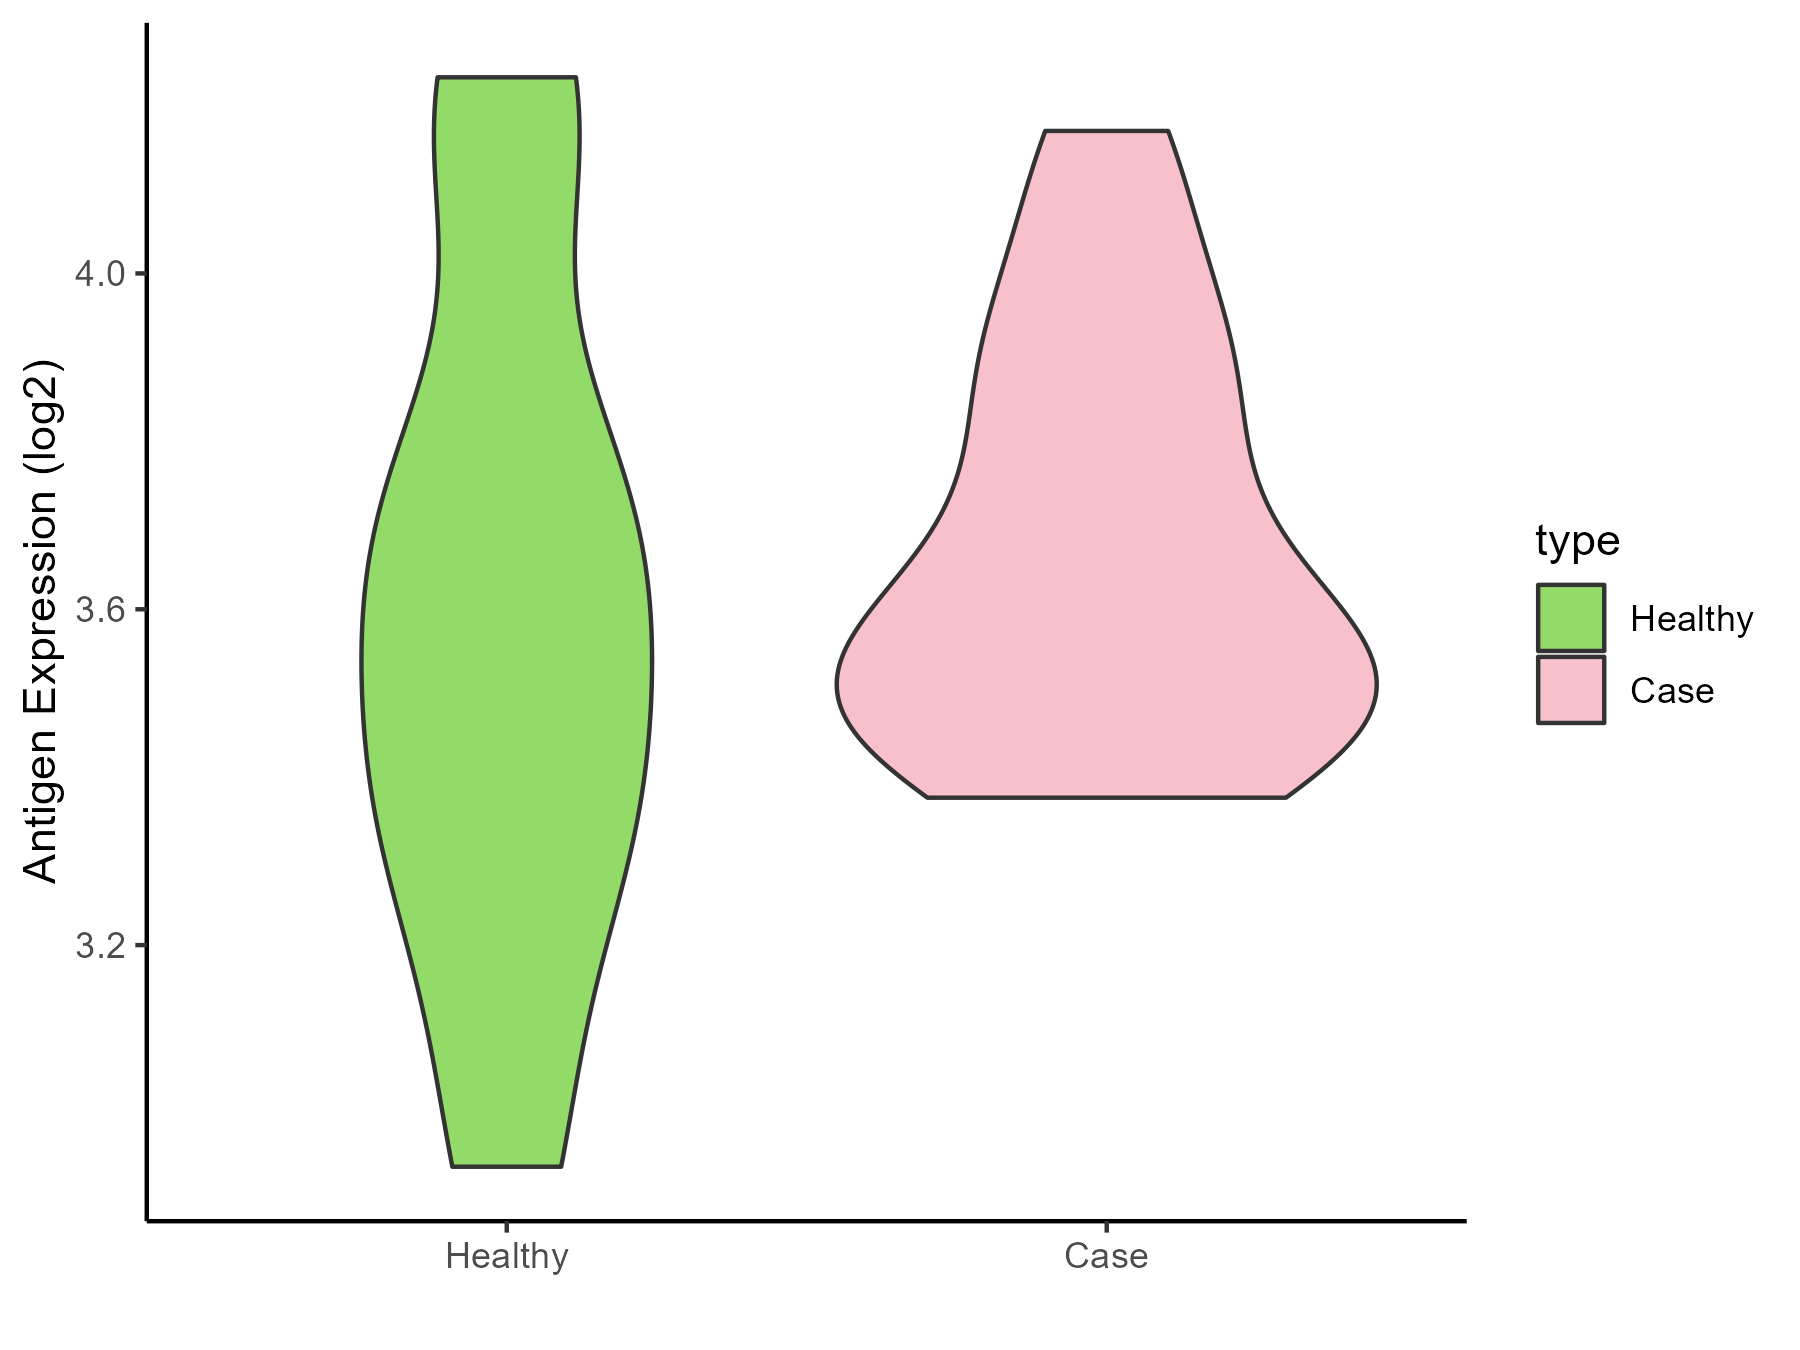
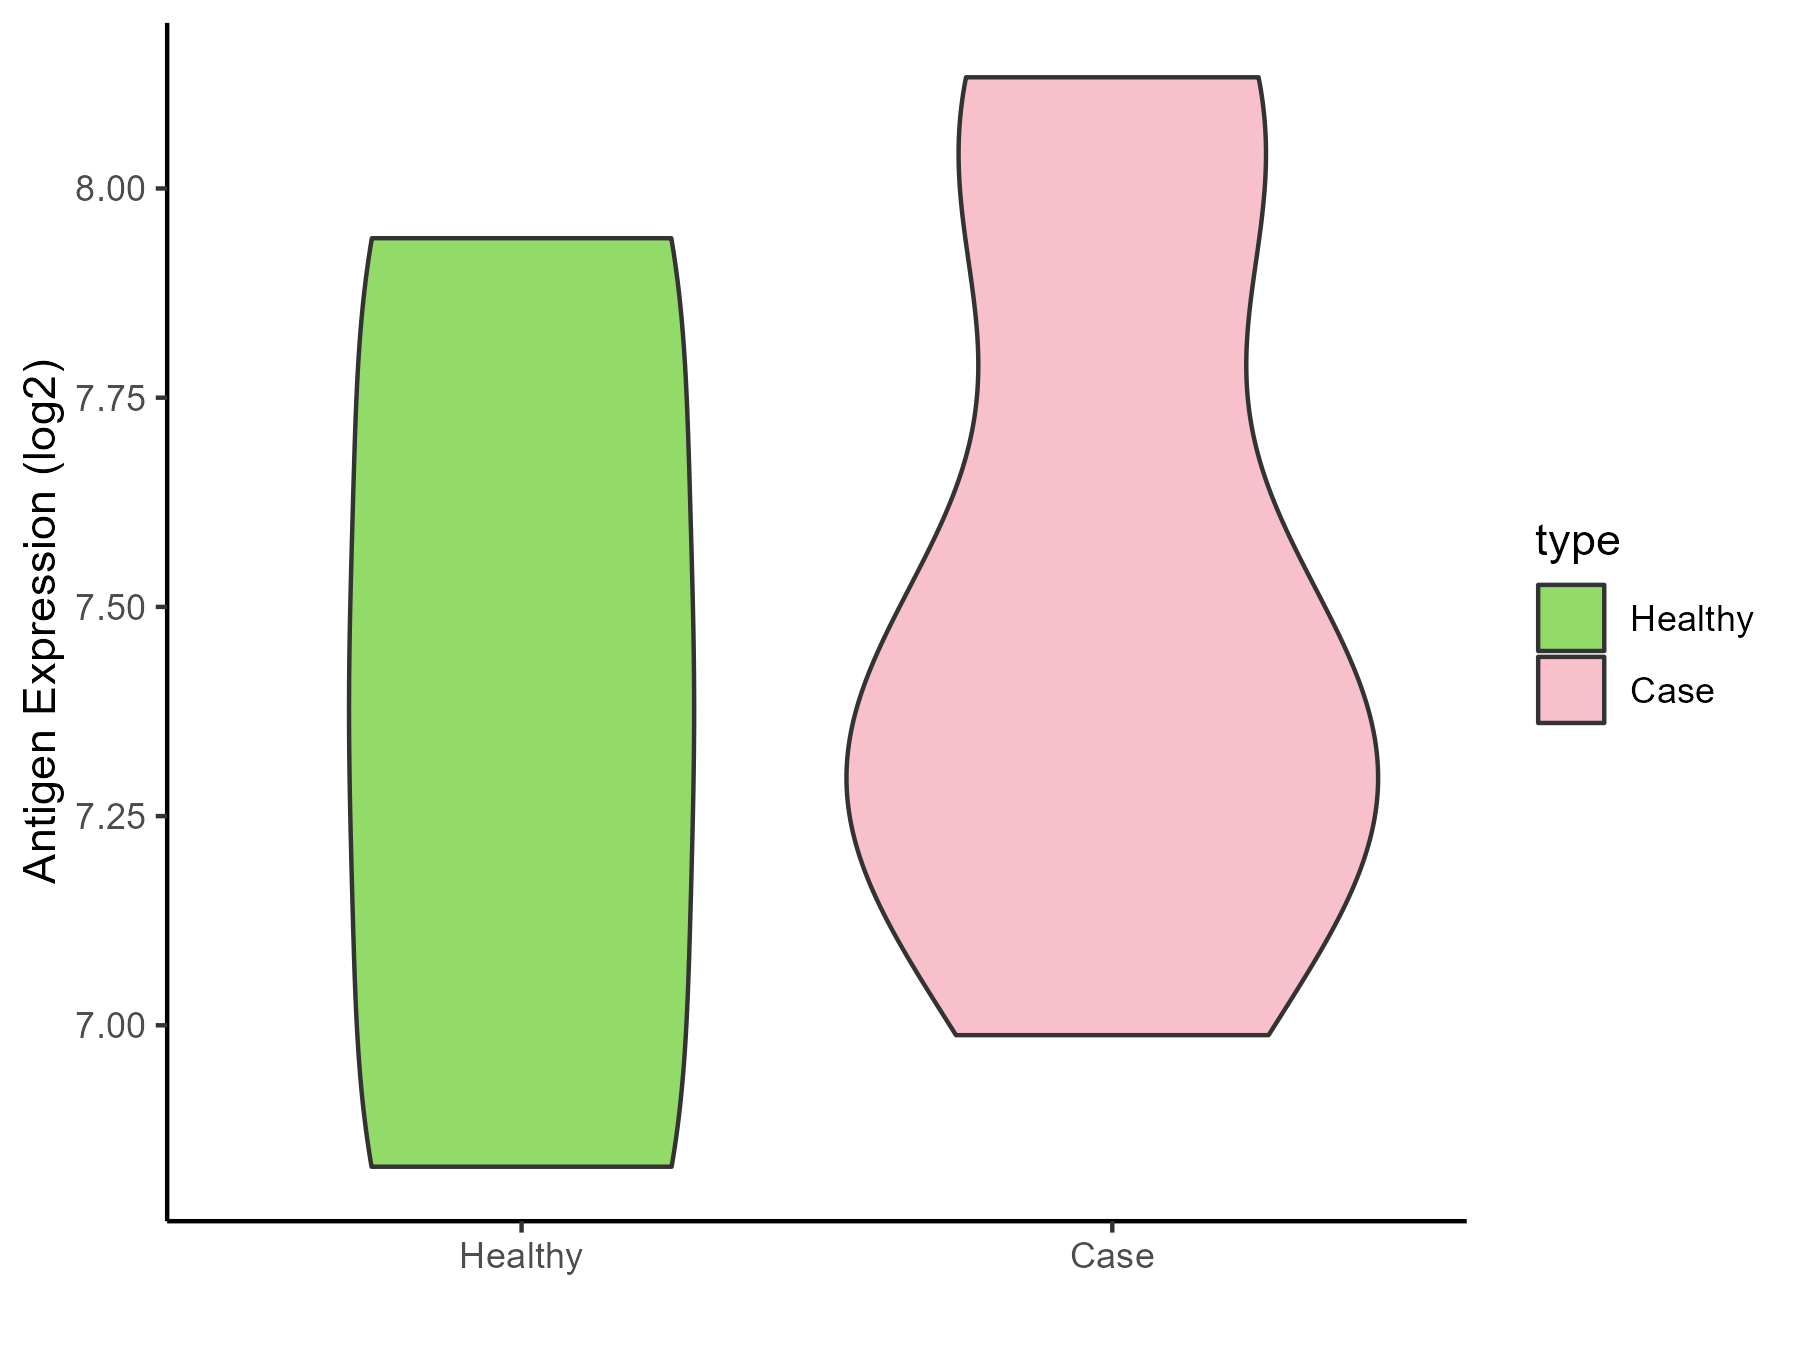
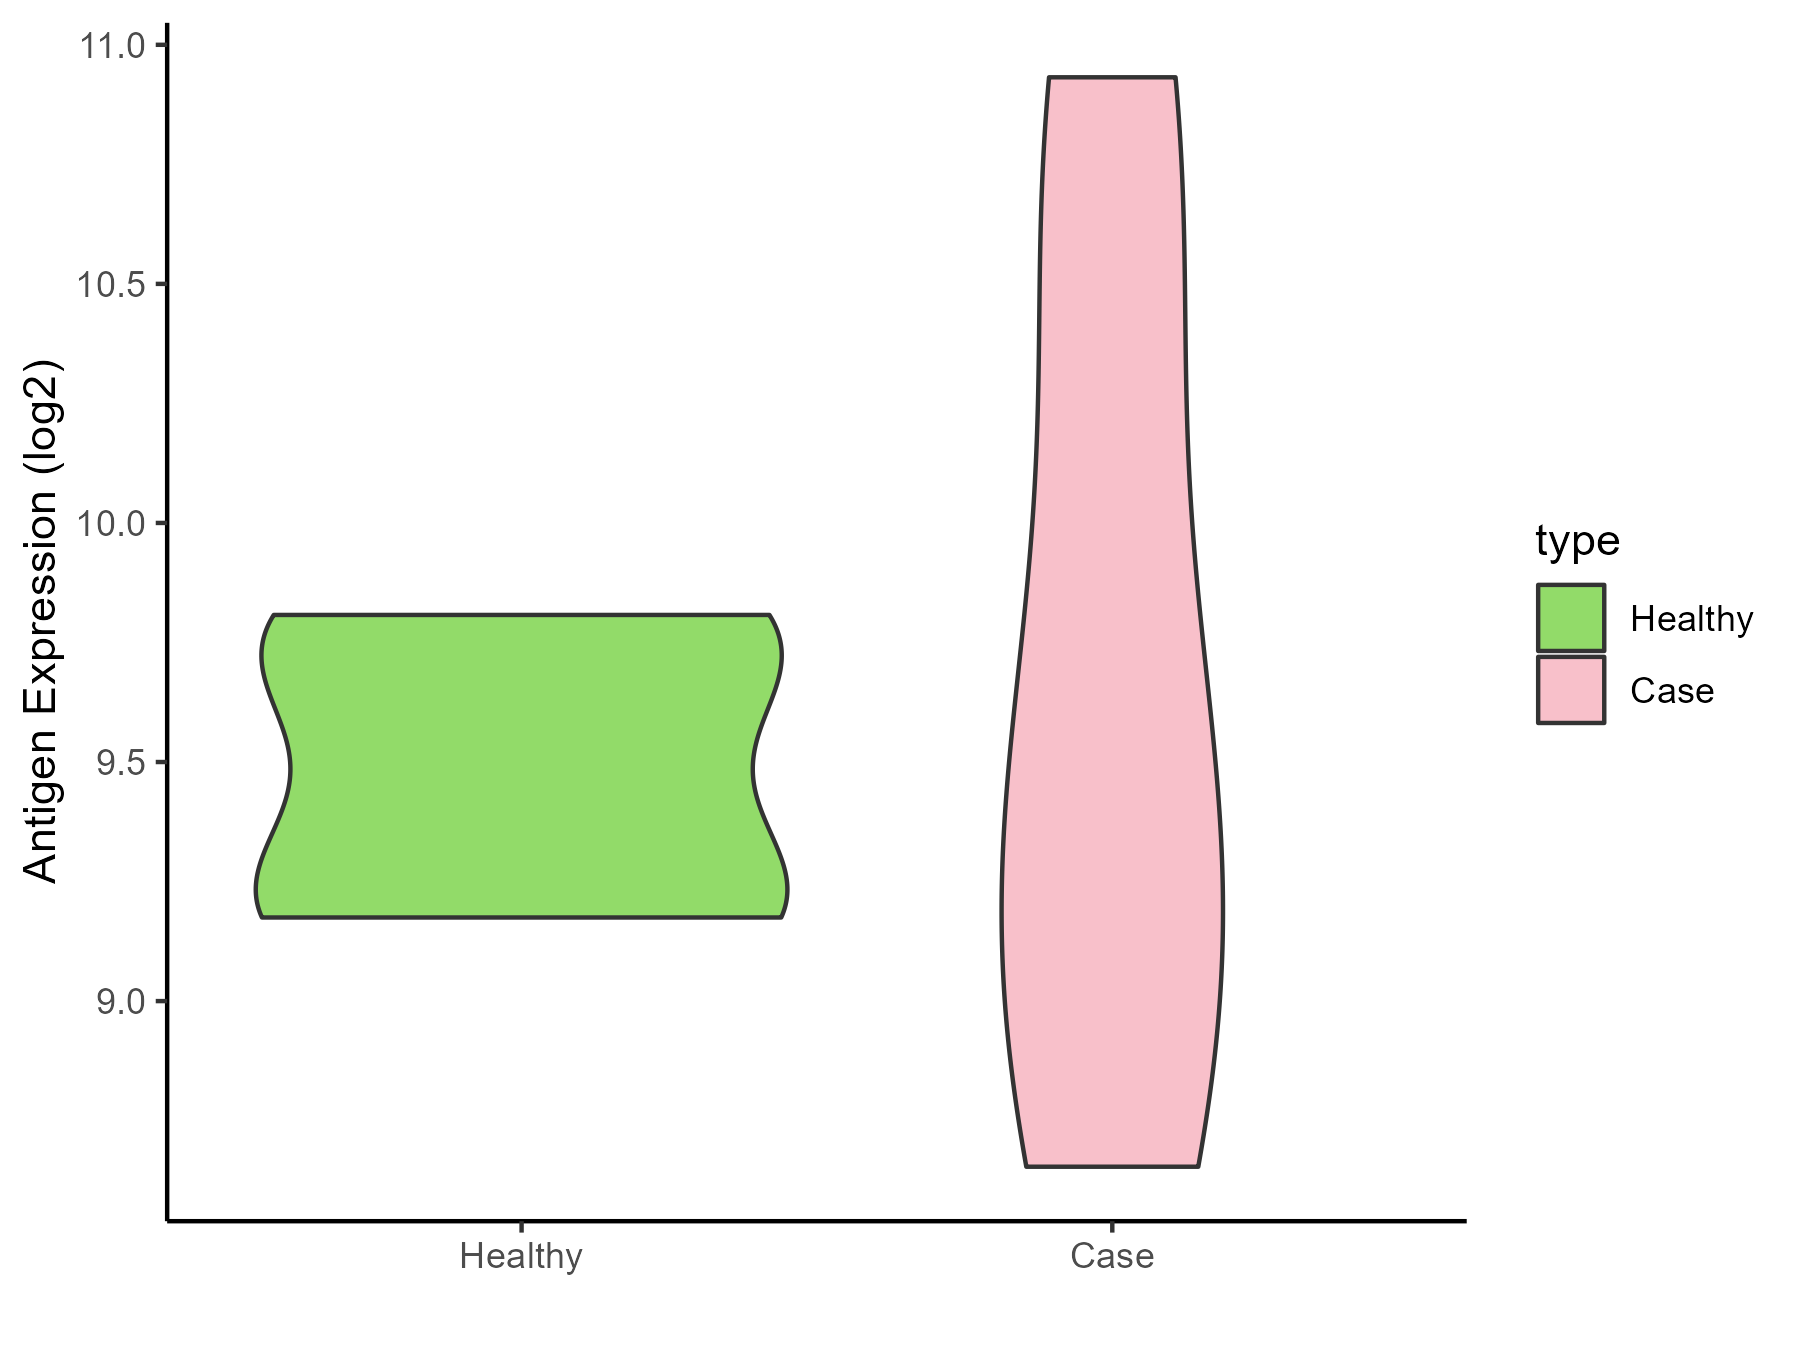
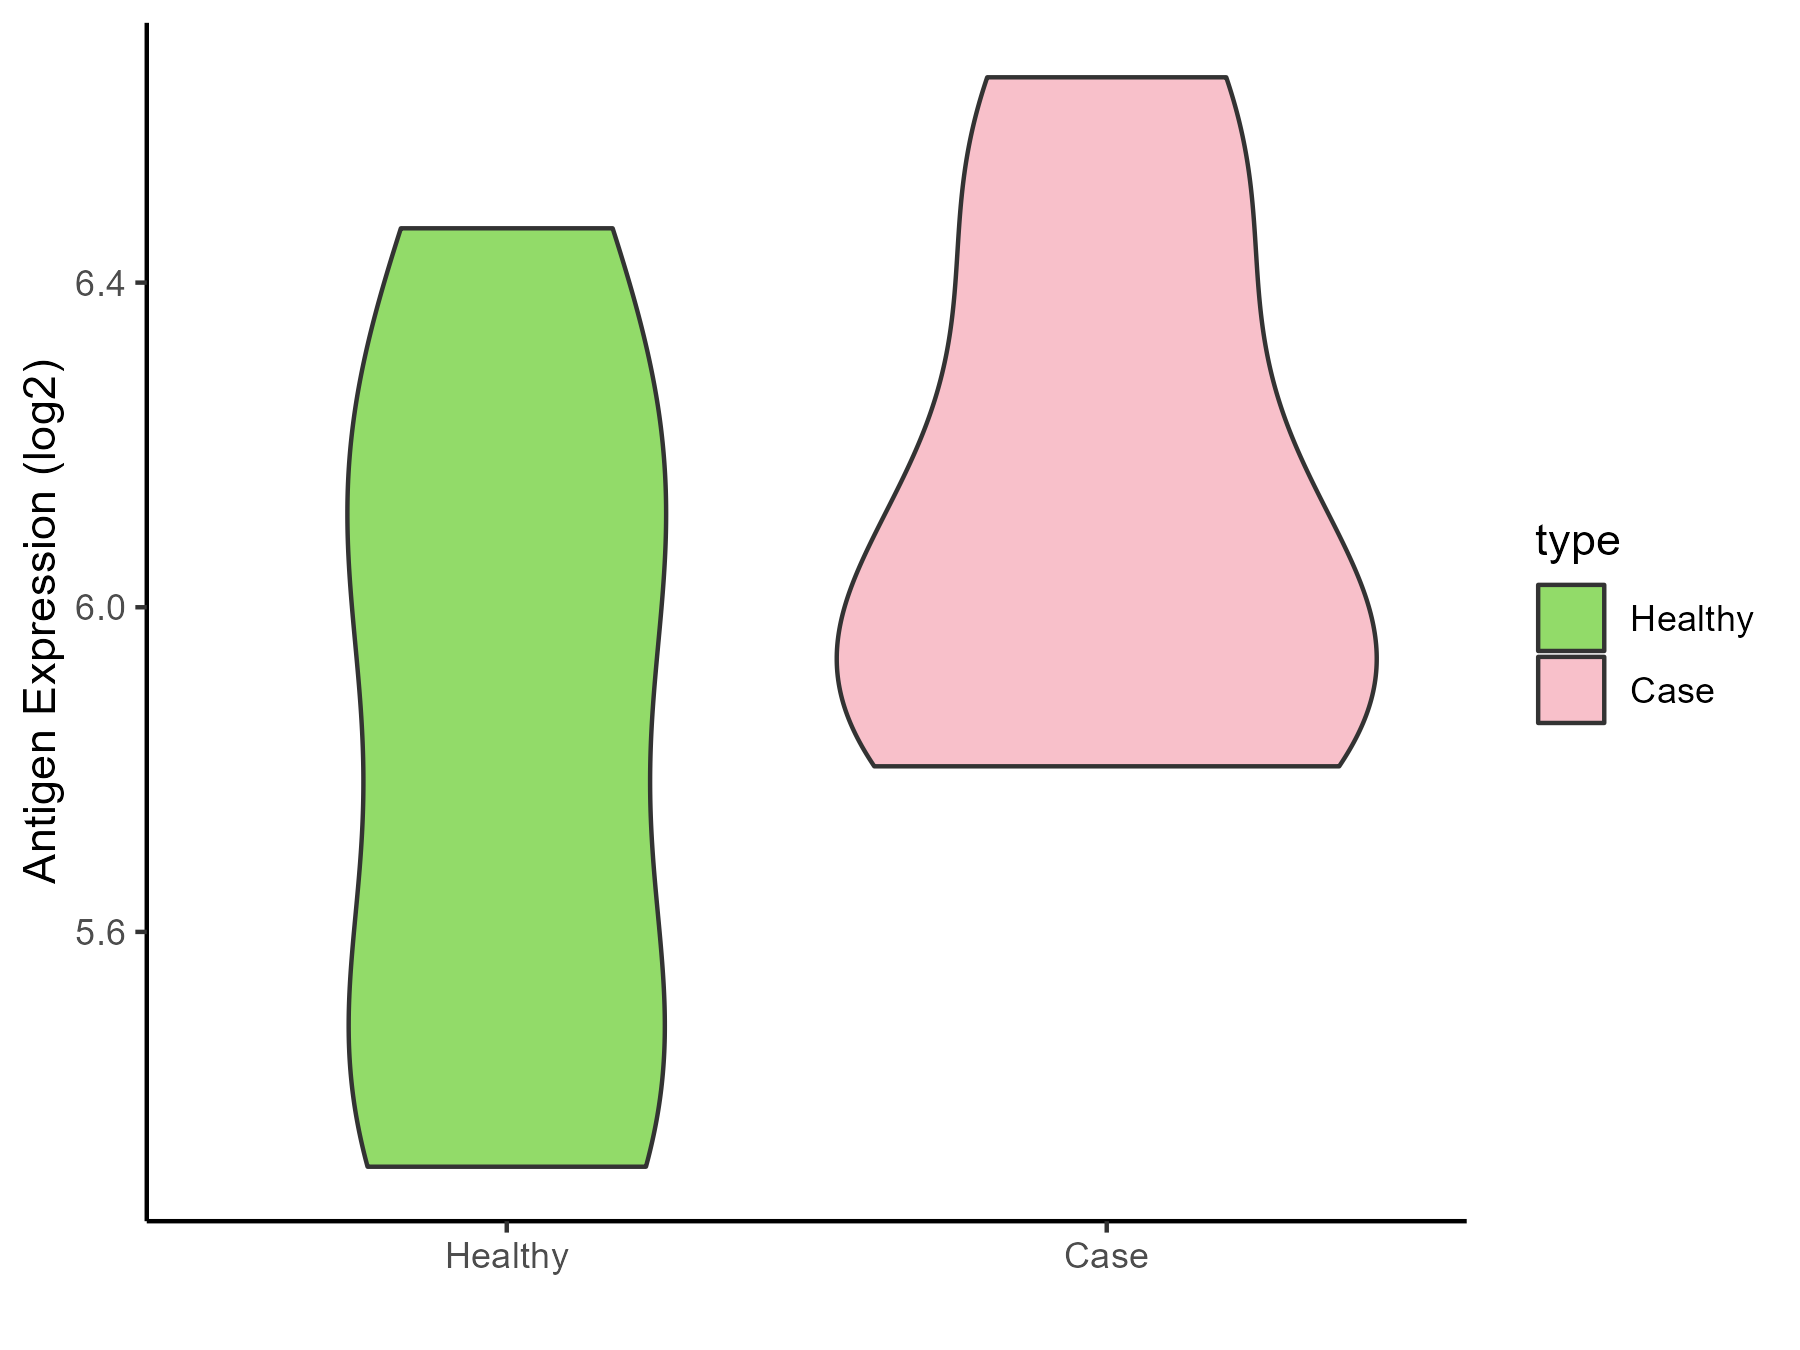
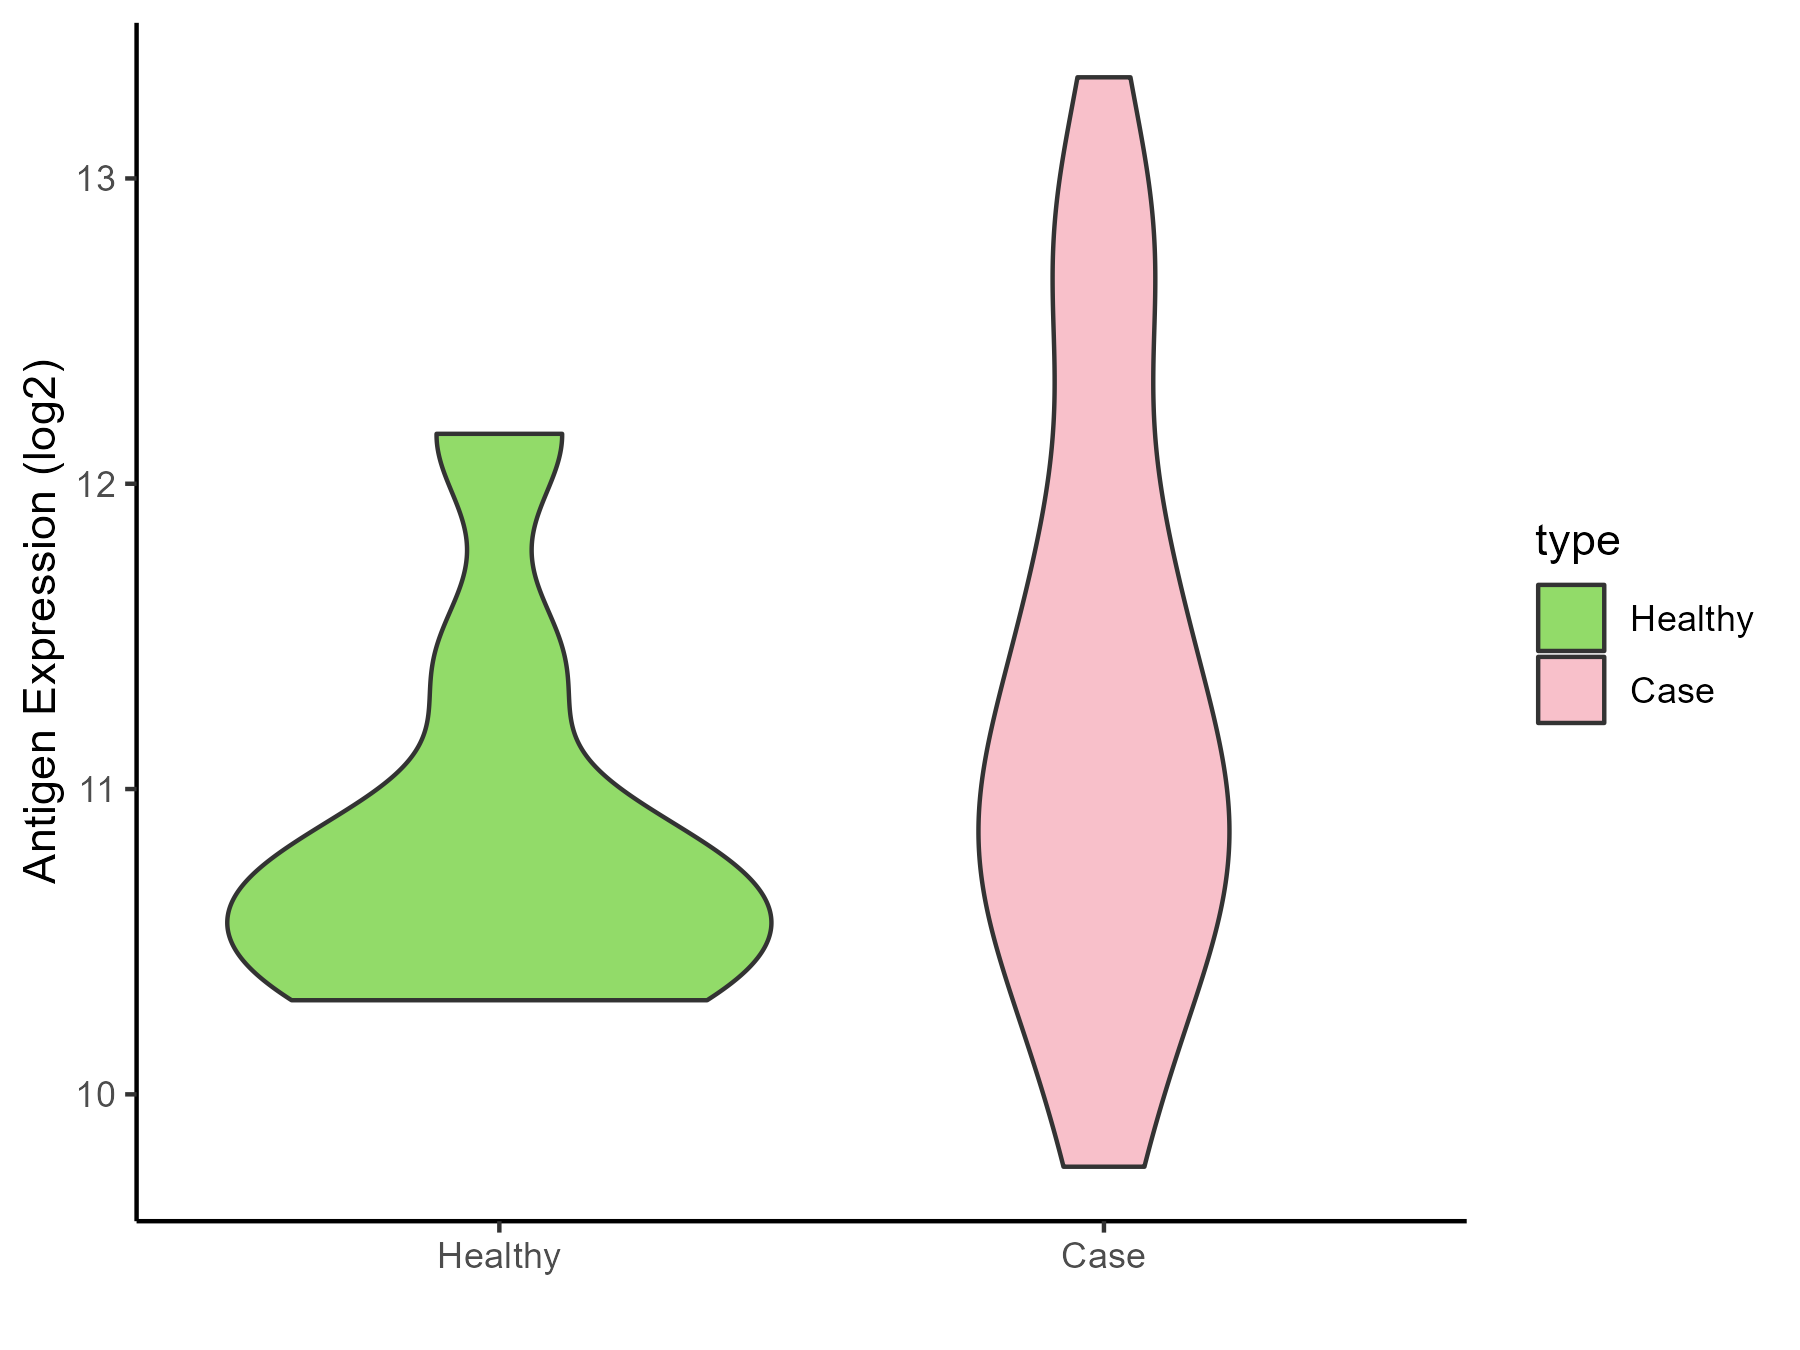
| Differential expression pattern of antigen in diseases |
| The Studied Tissue |
Gingival |
| The Specific Disease |
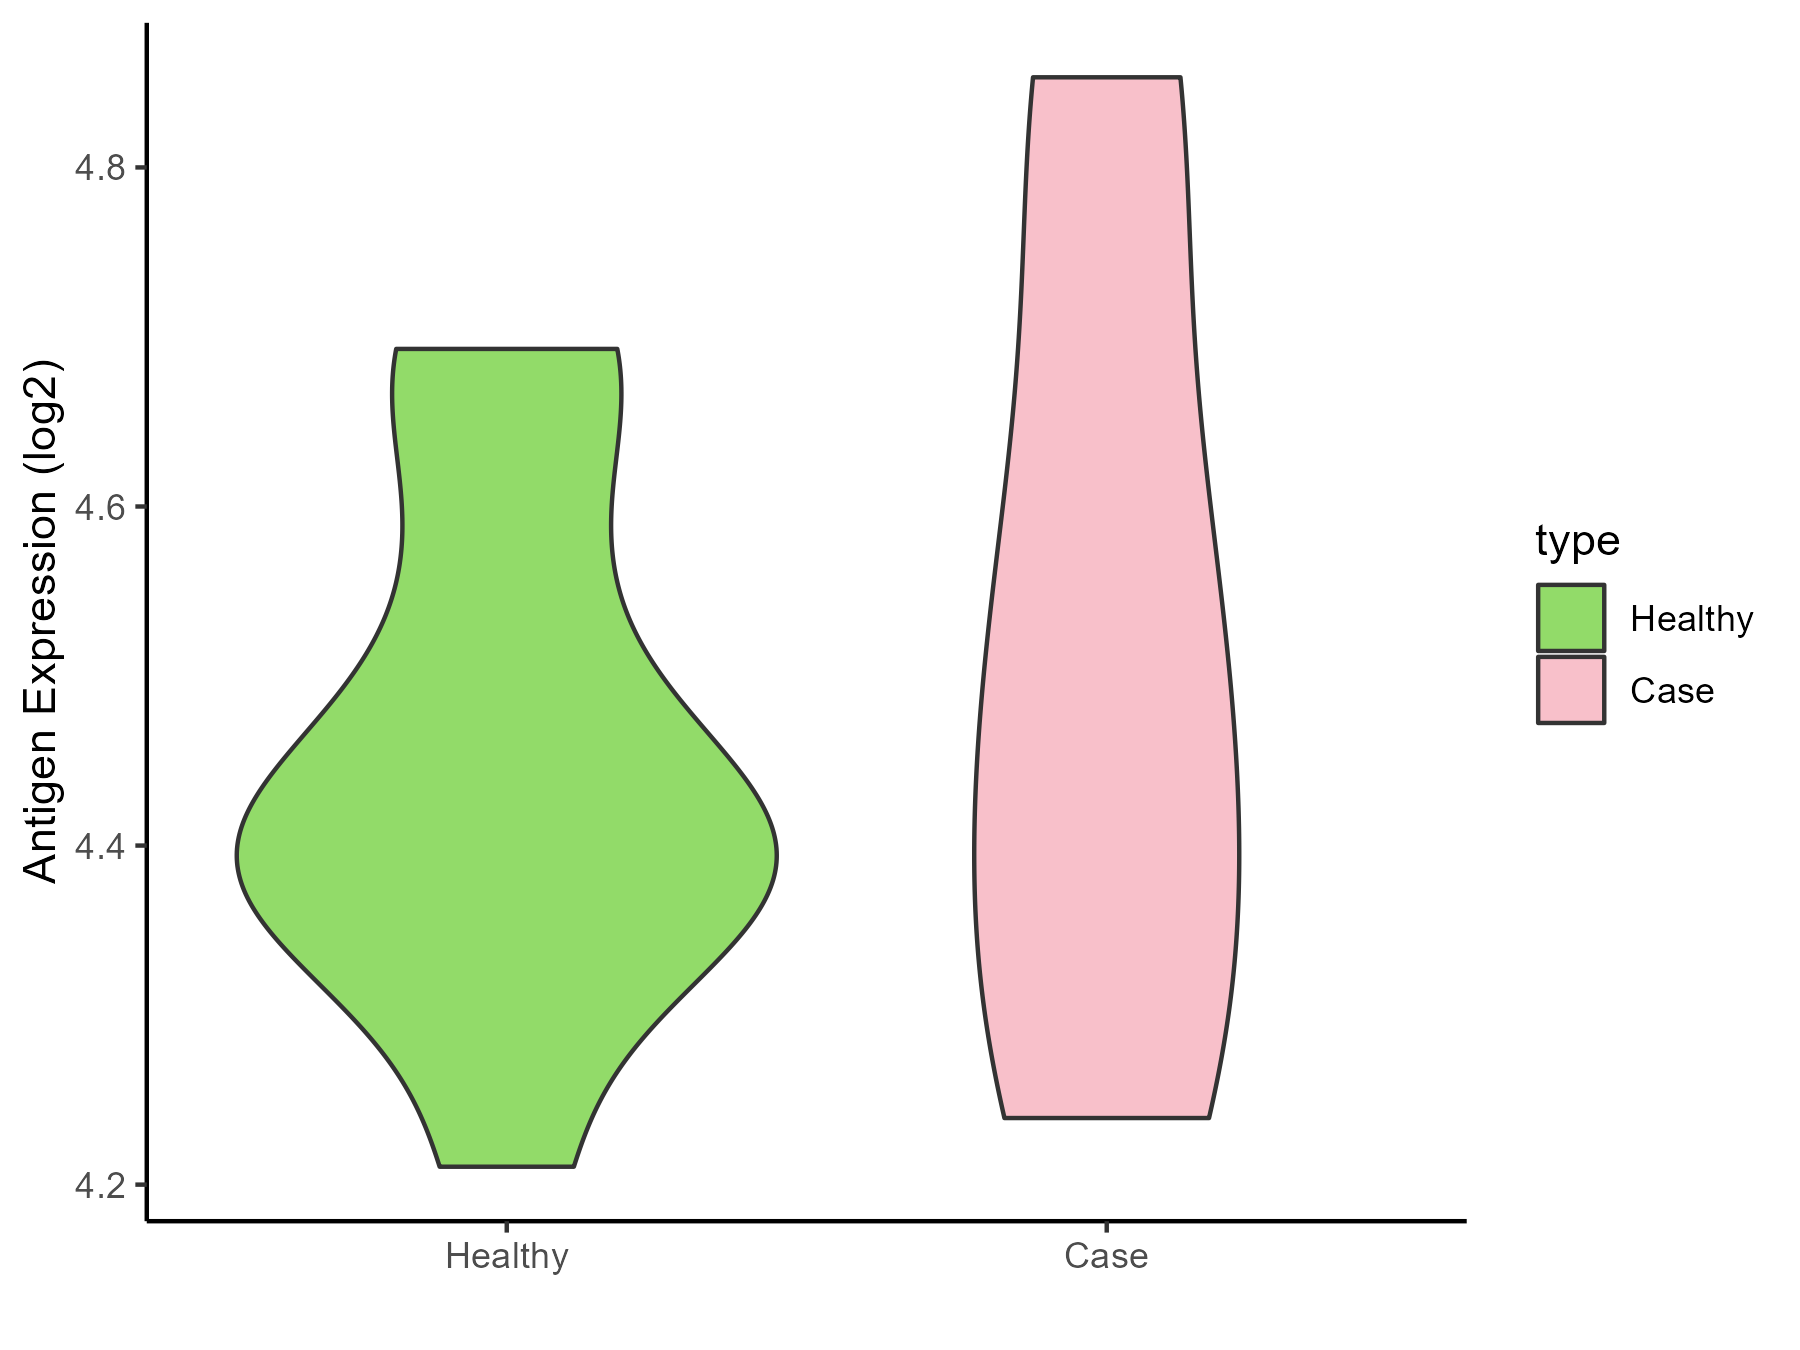
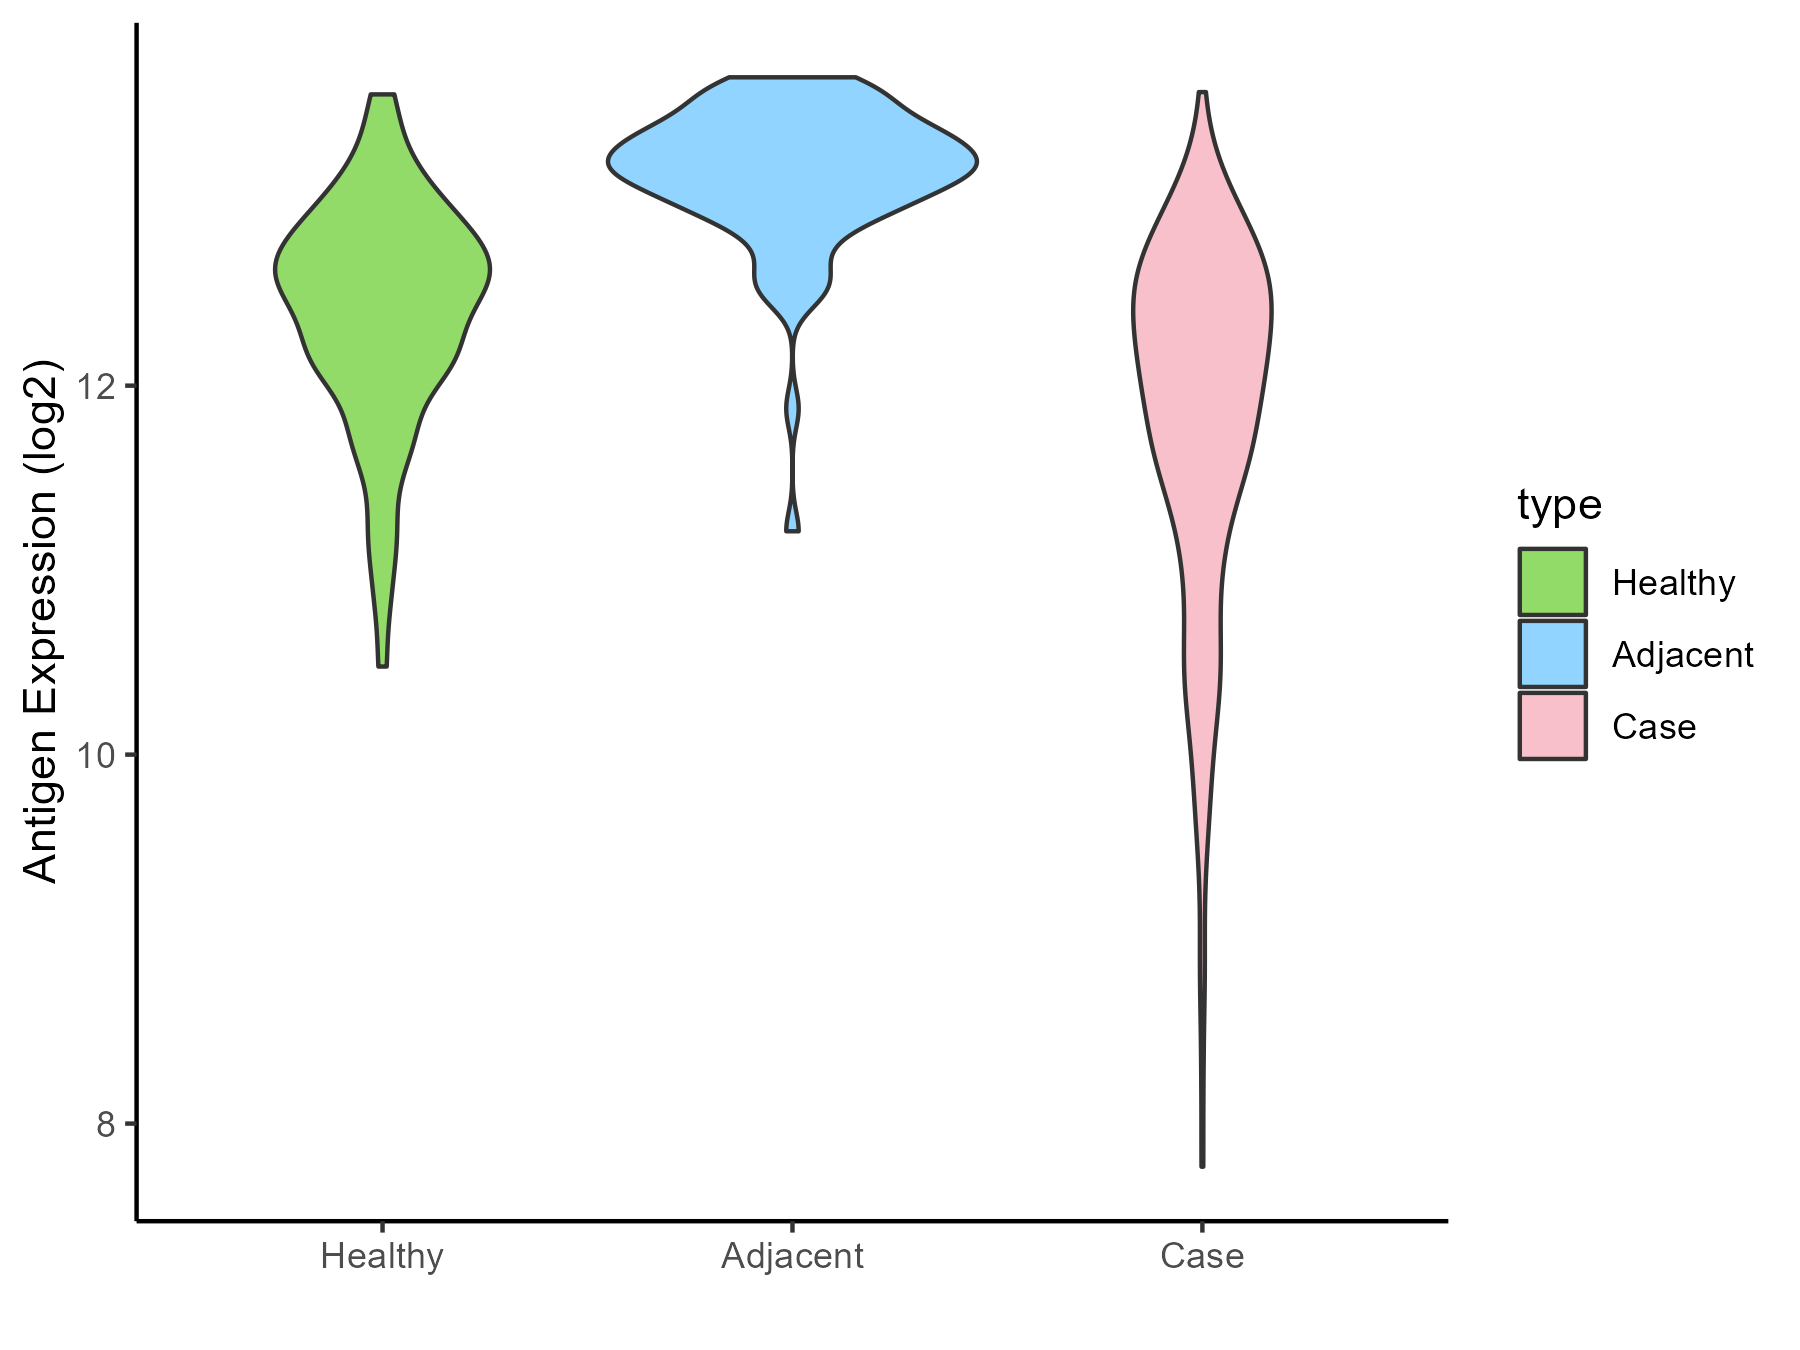
Bacterial infection of gingival |
| The Expression Level of Disease Section Compare with the Healthy Individual Tissue |
p-value: 0.305950482;
Fold-change: 0.109408293;
Z-score: 0.104415013
|
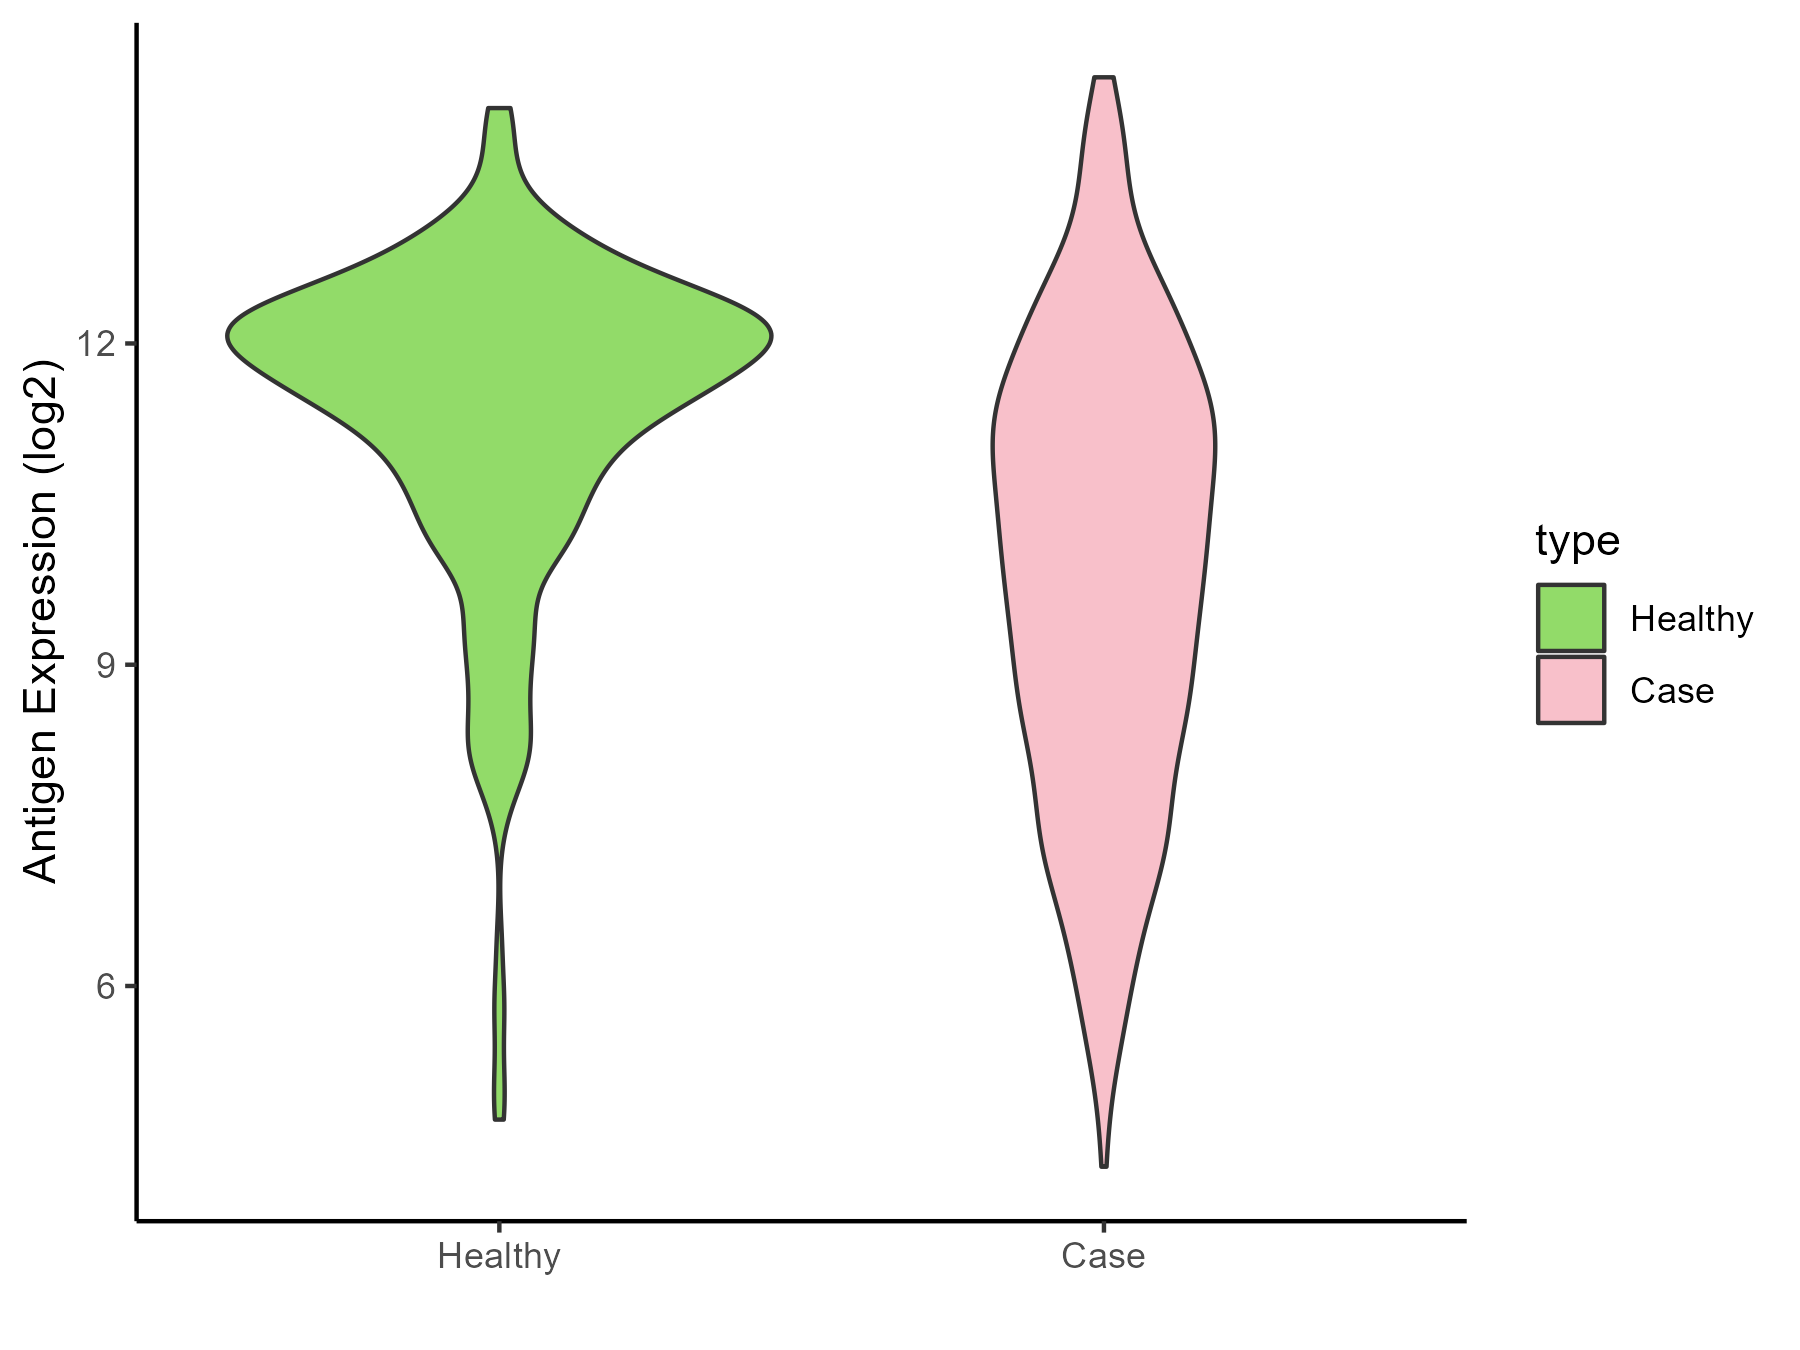
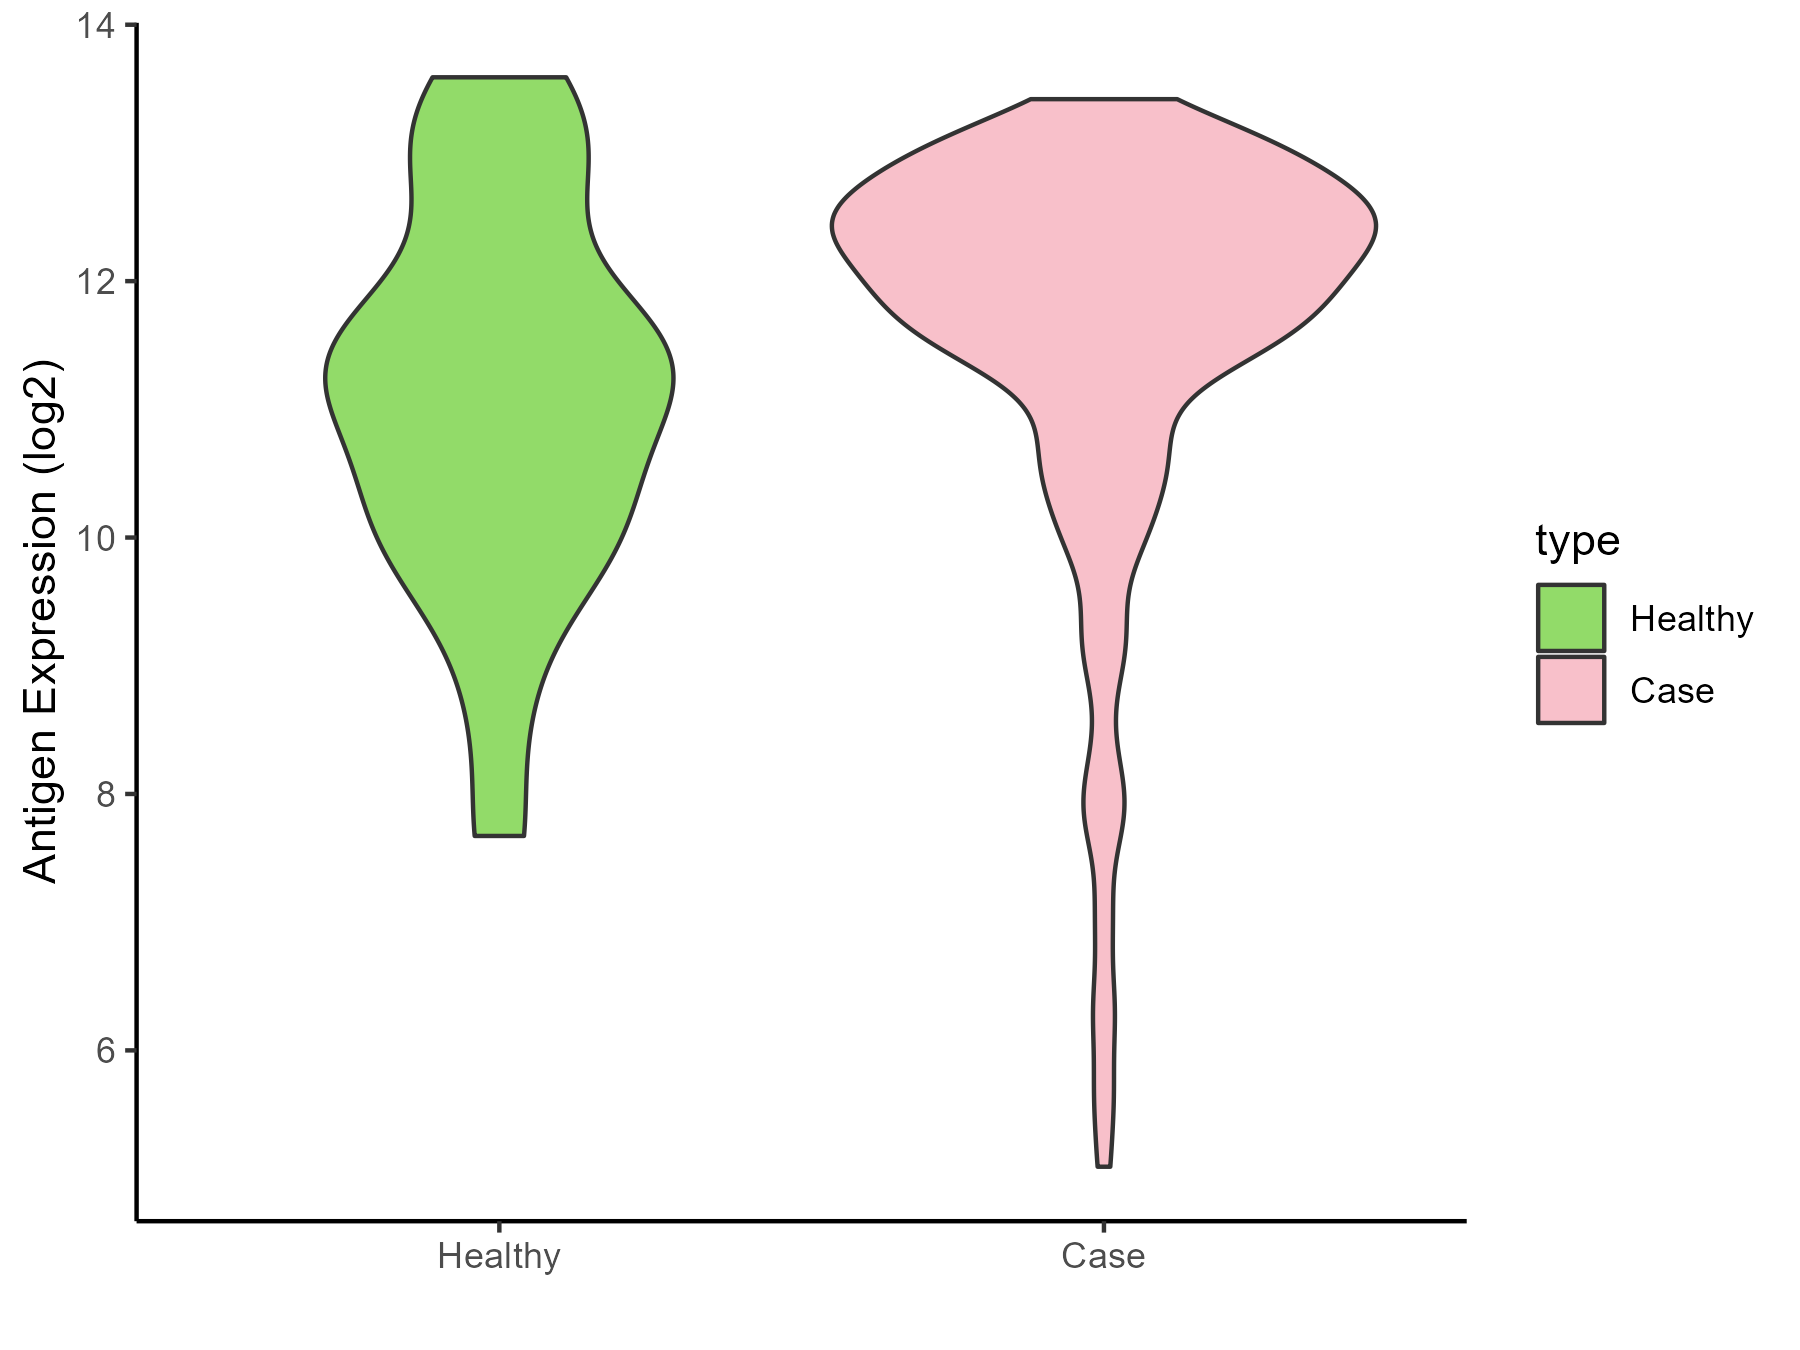
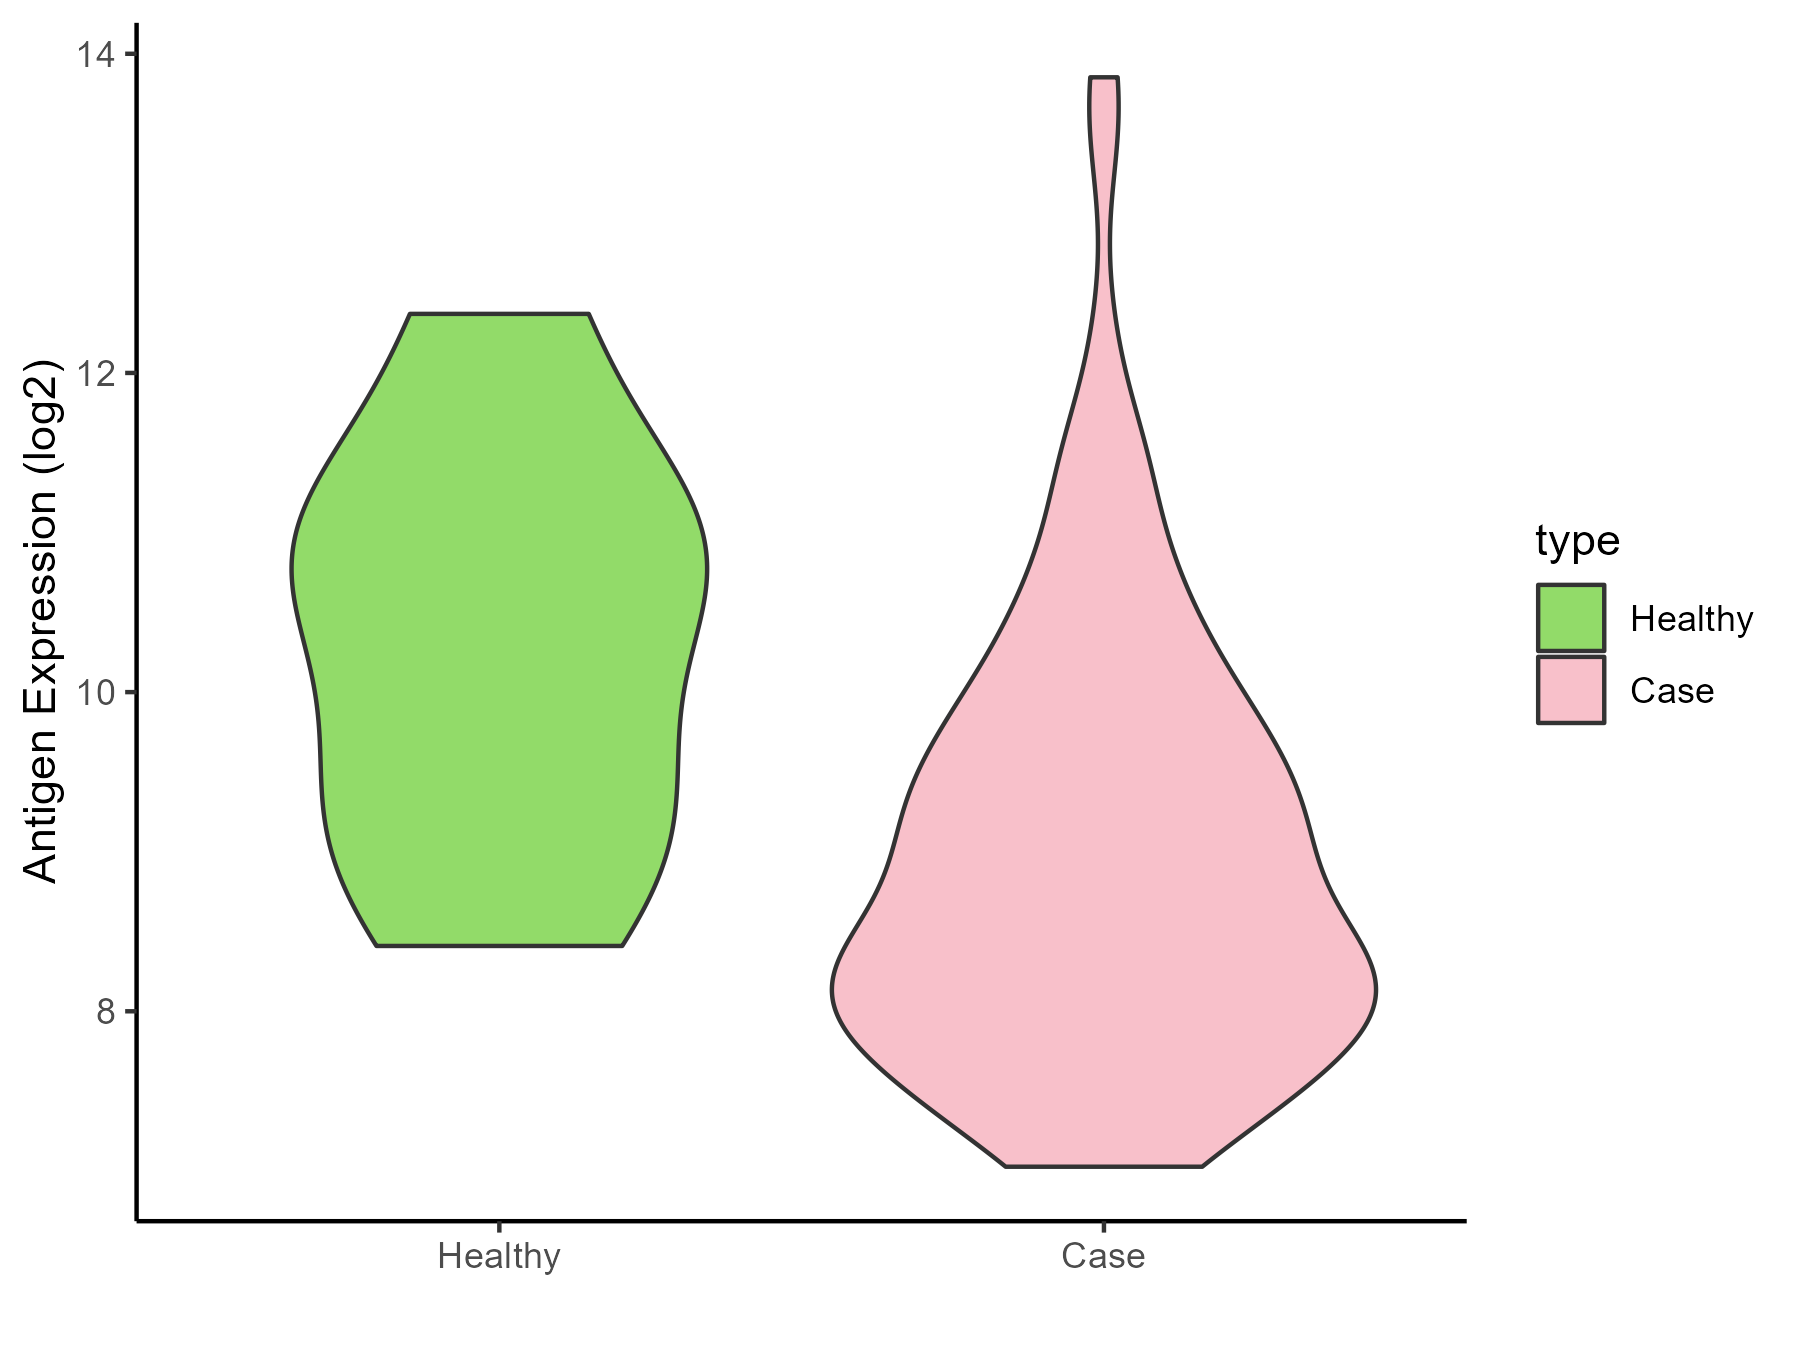
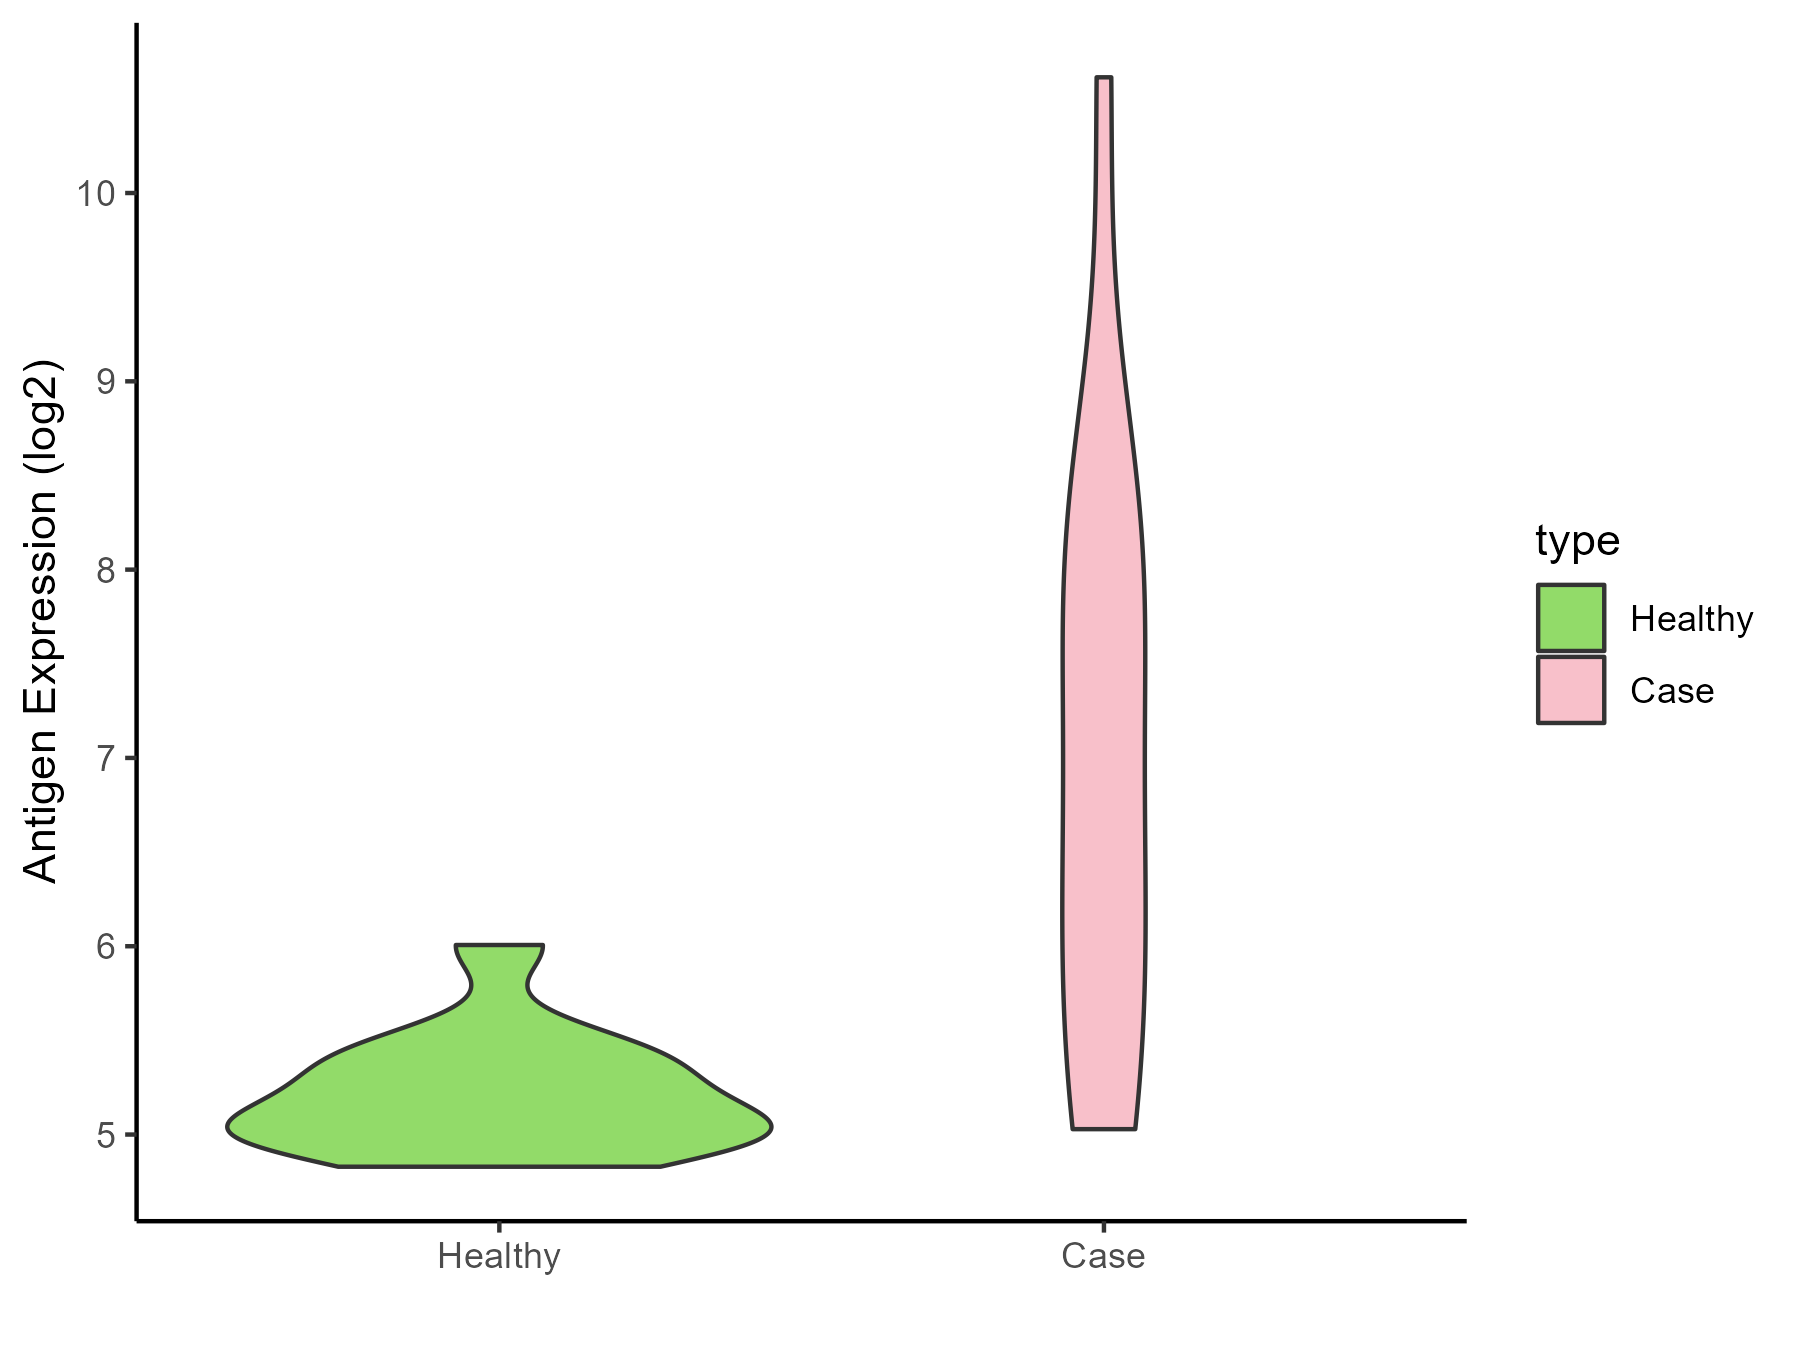
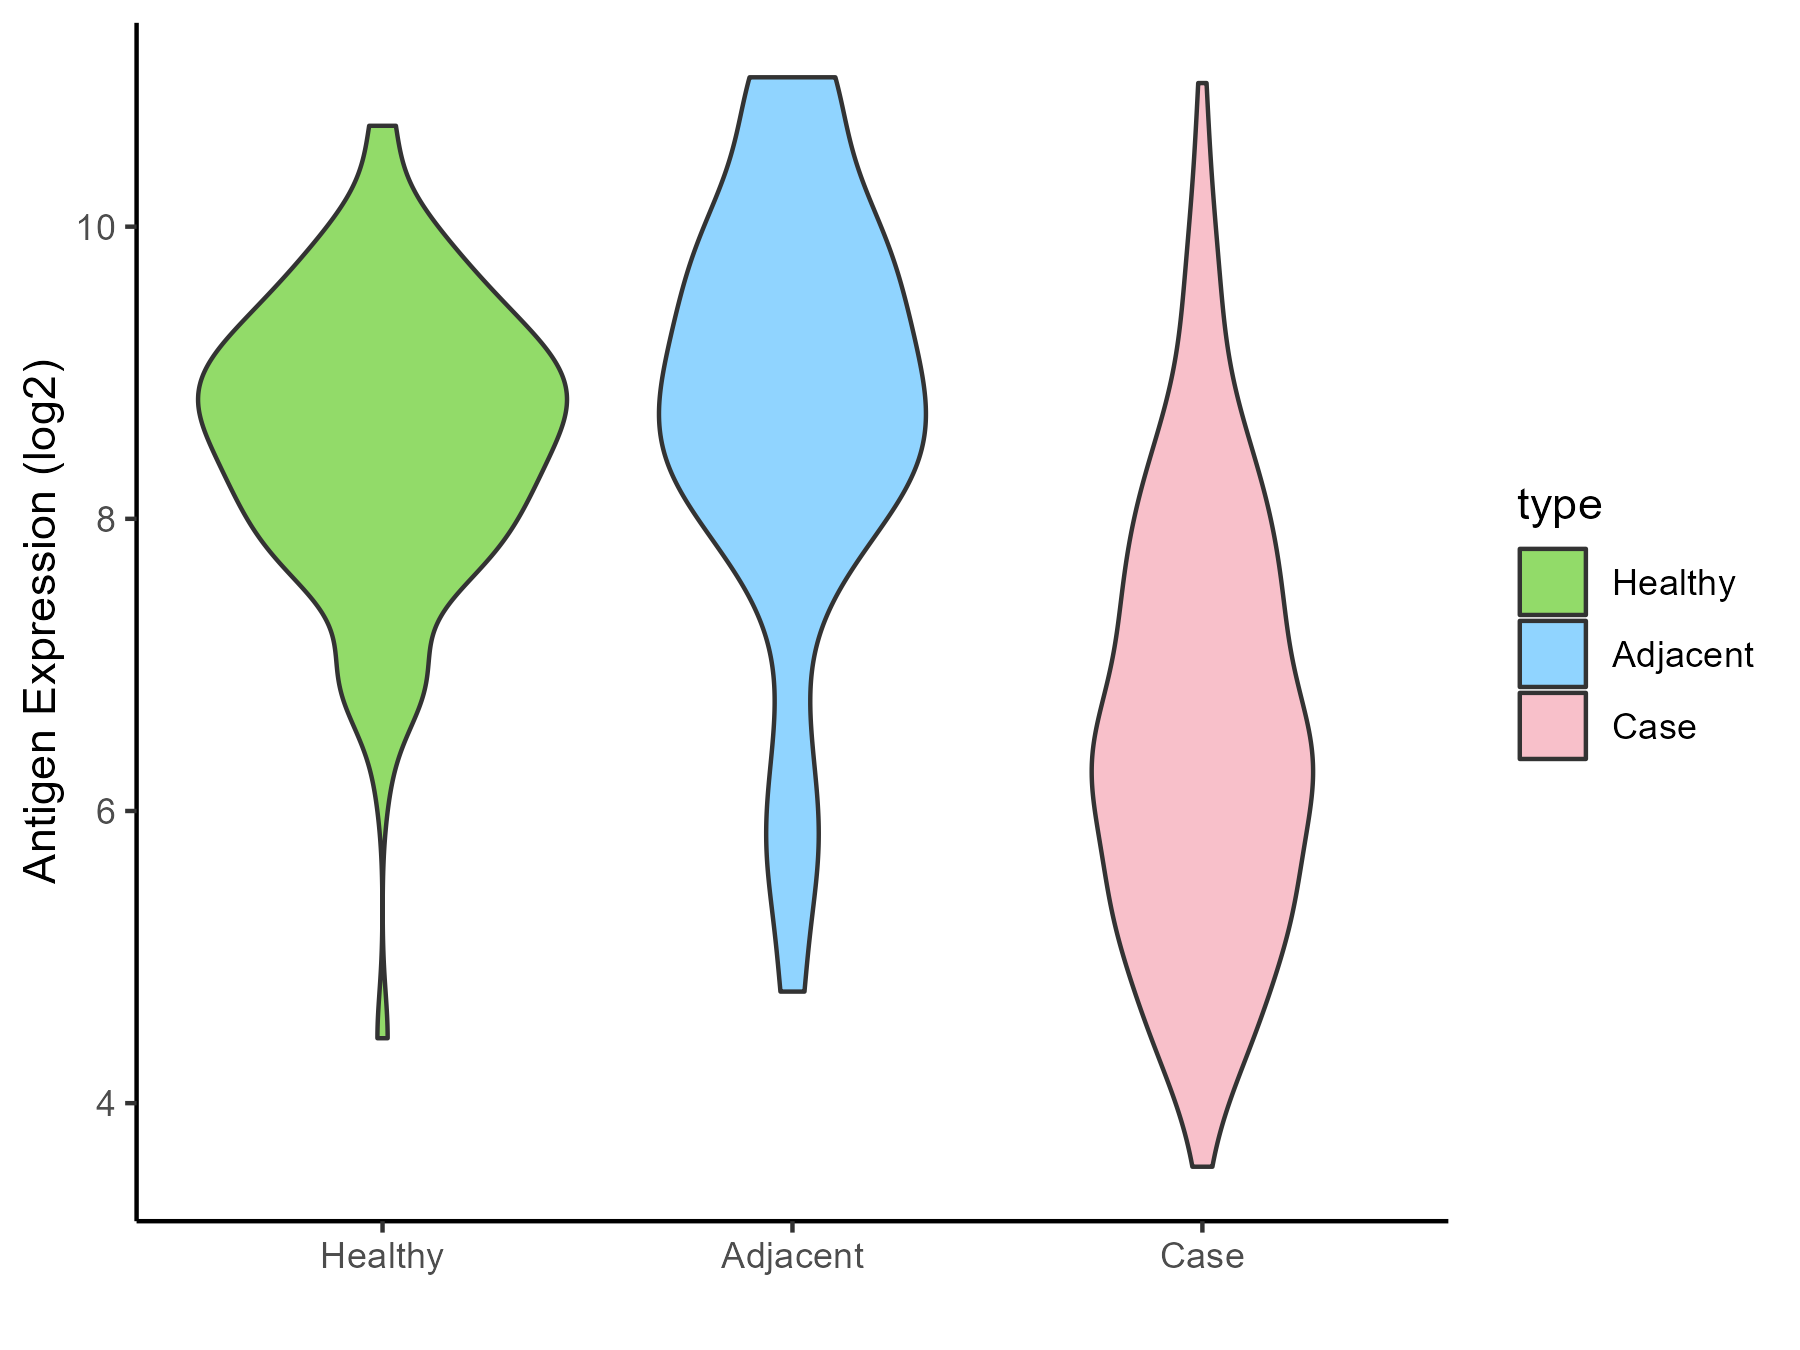
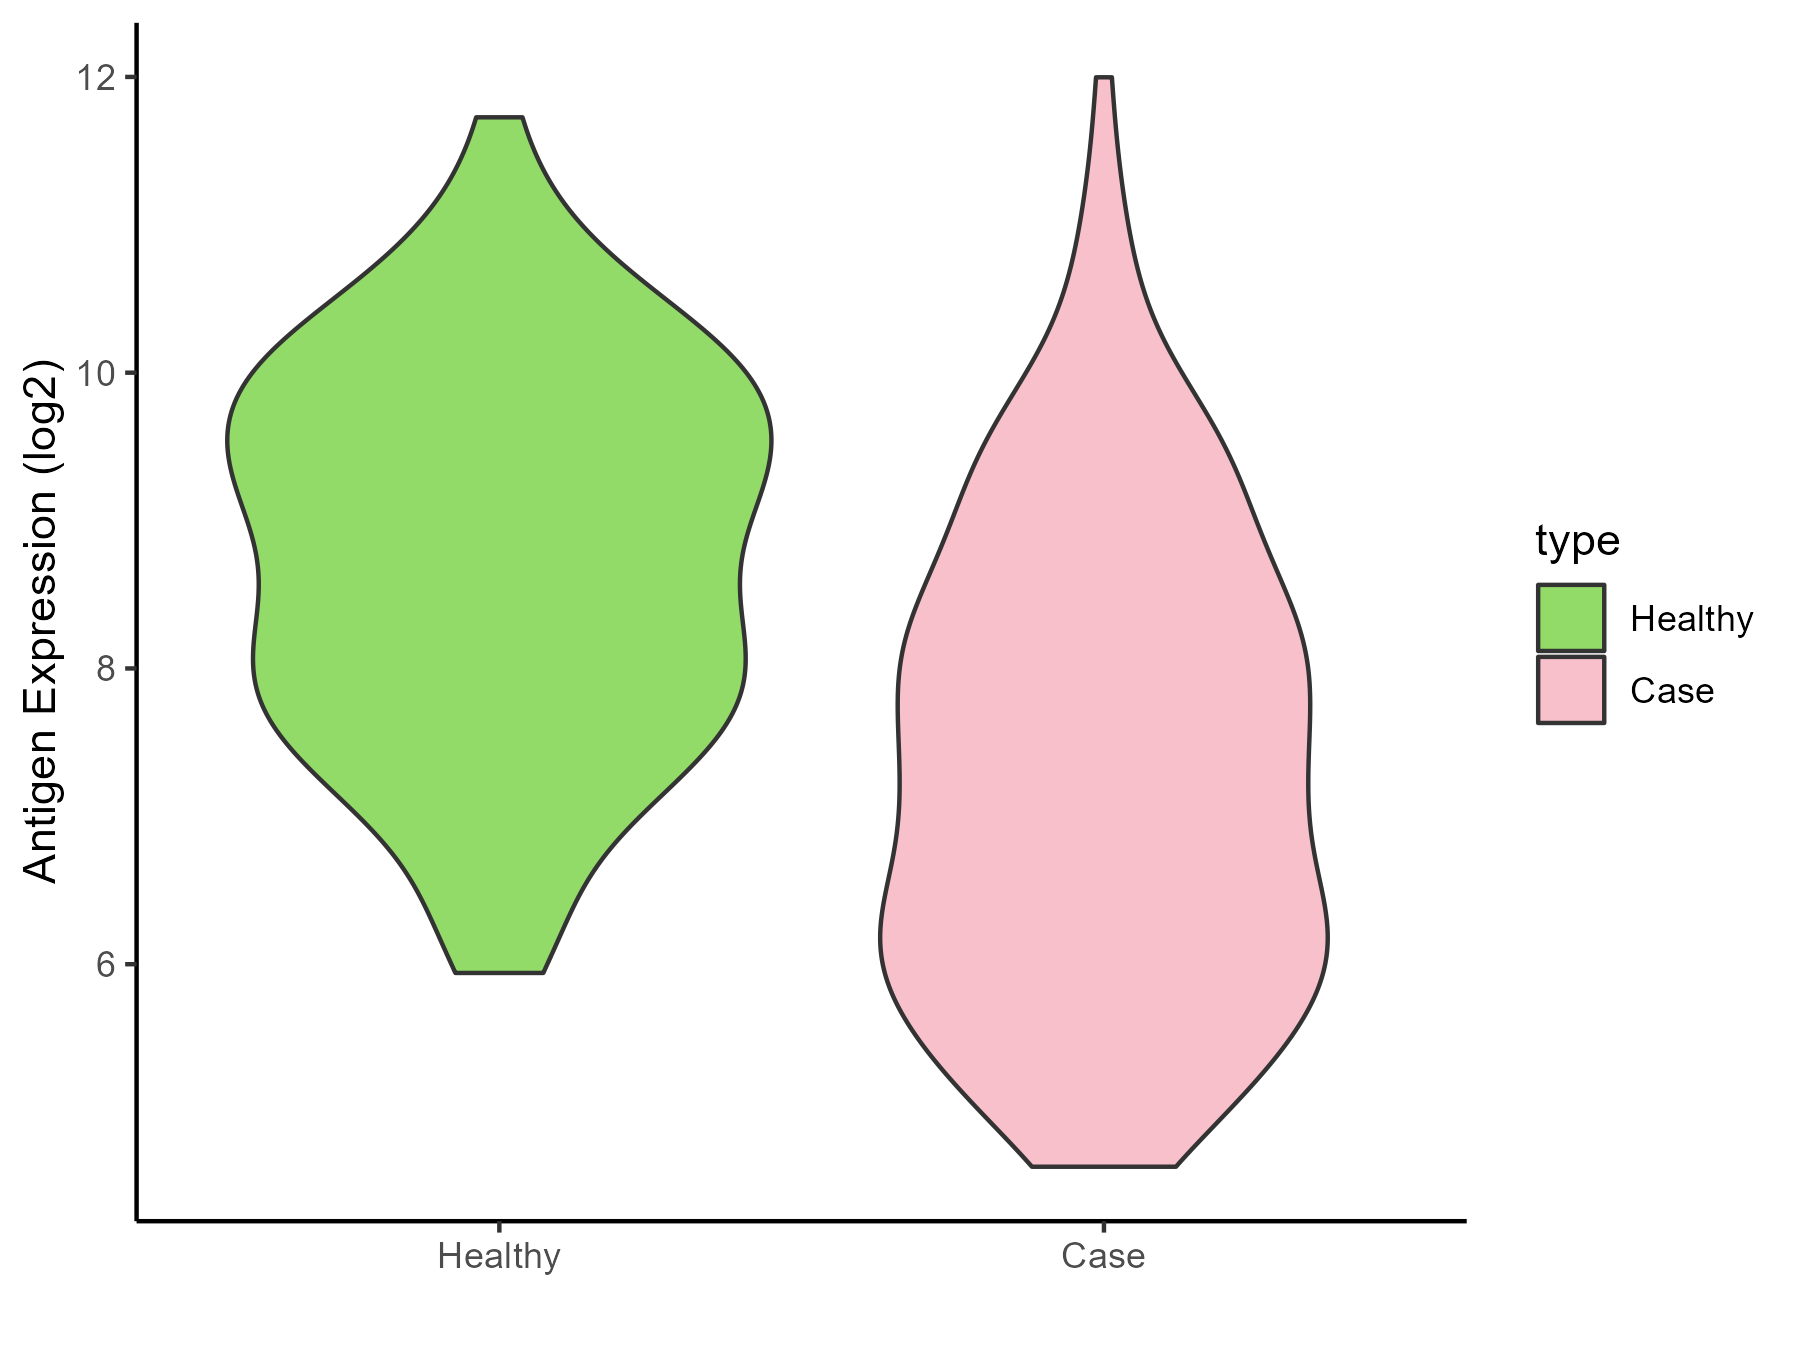
| Disease-specific Antigen Abundances |
|
Click to View the Clearer Original Diagram
|
|
|
ICD Disease Classification 02
Click to Show/Hide the 22 Disease of This Class
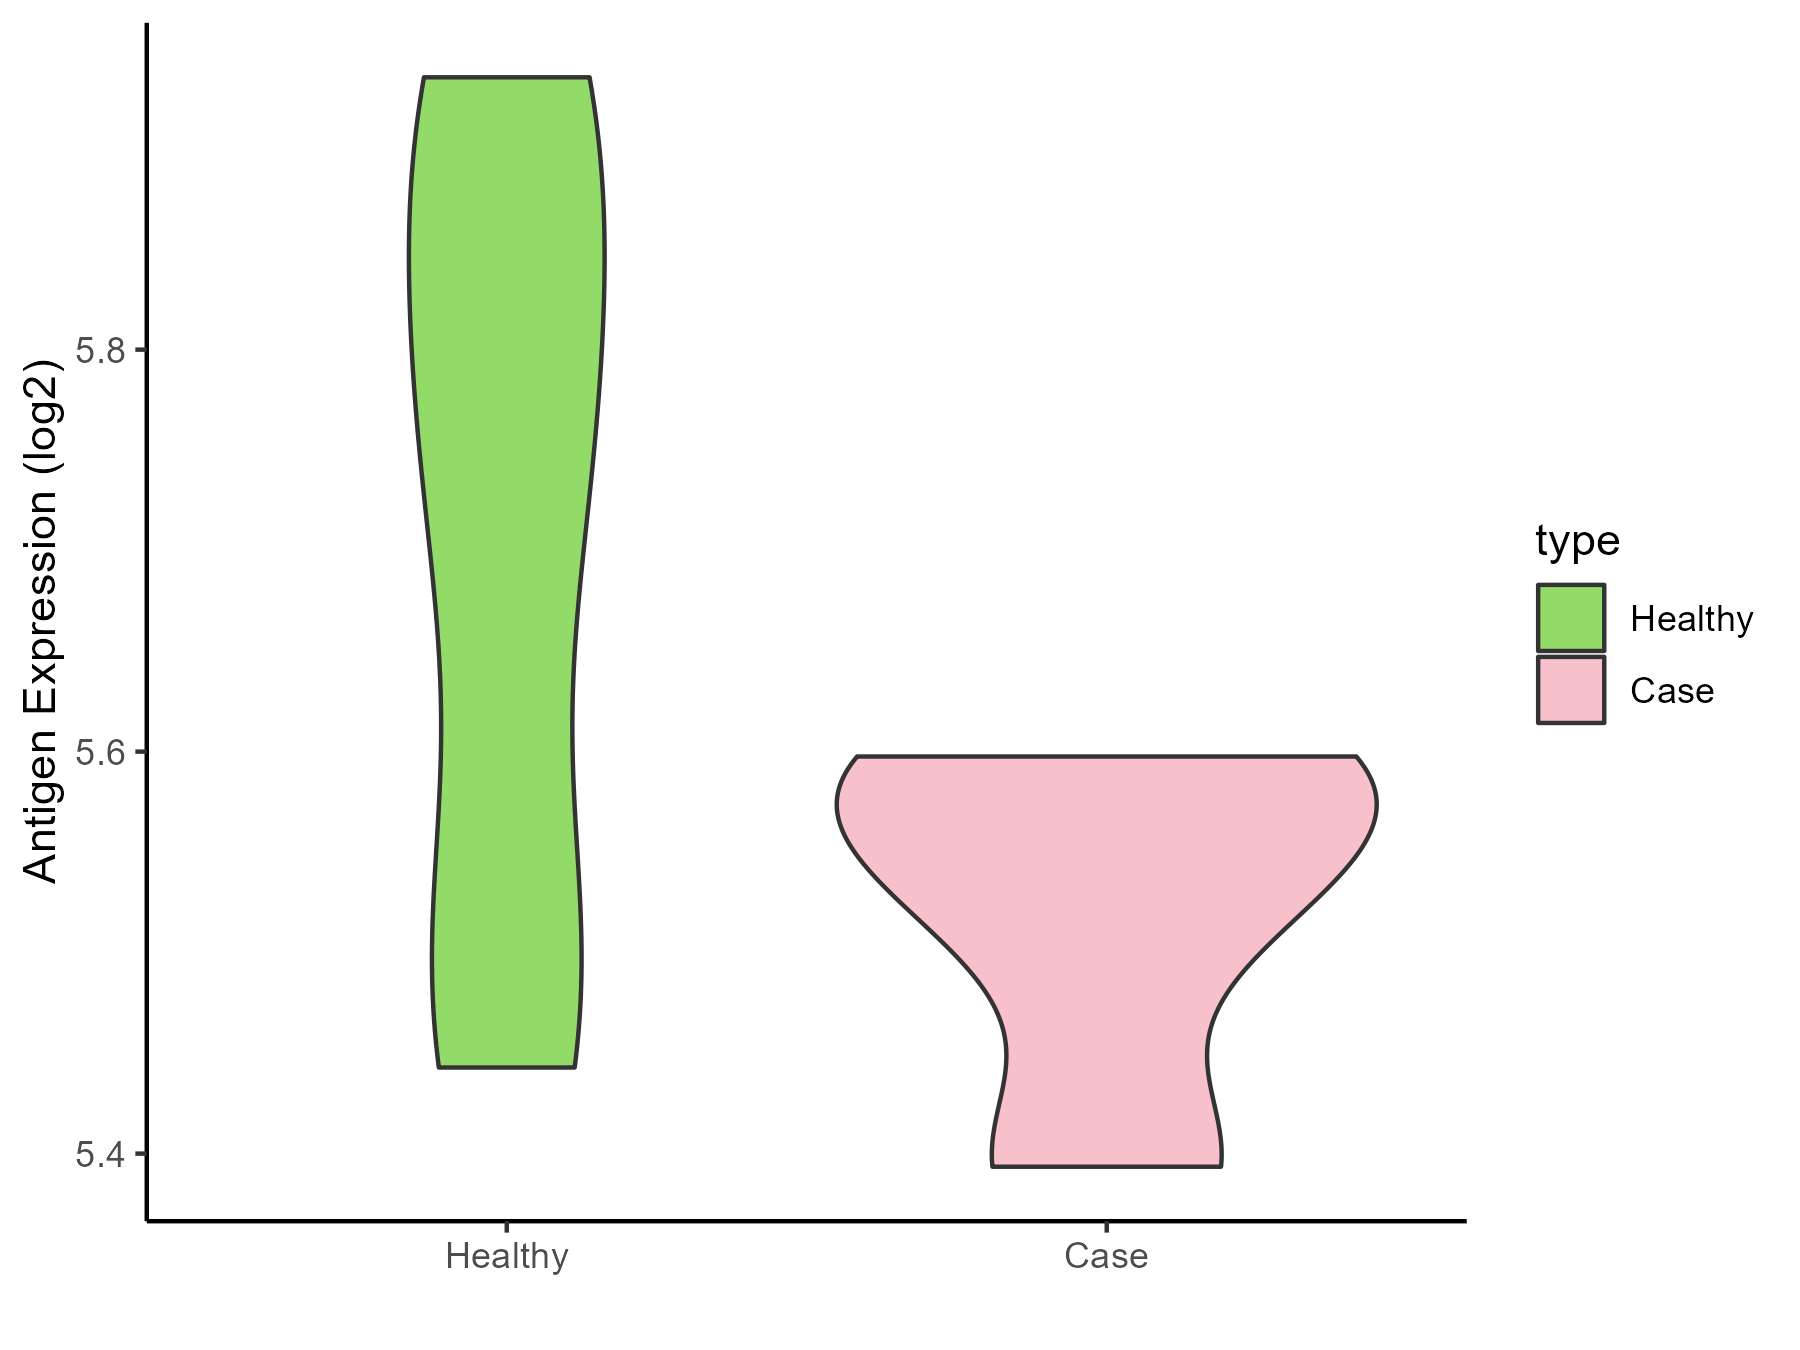
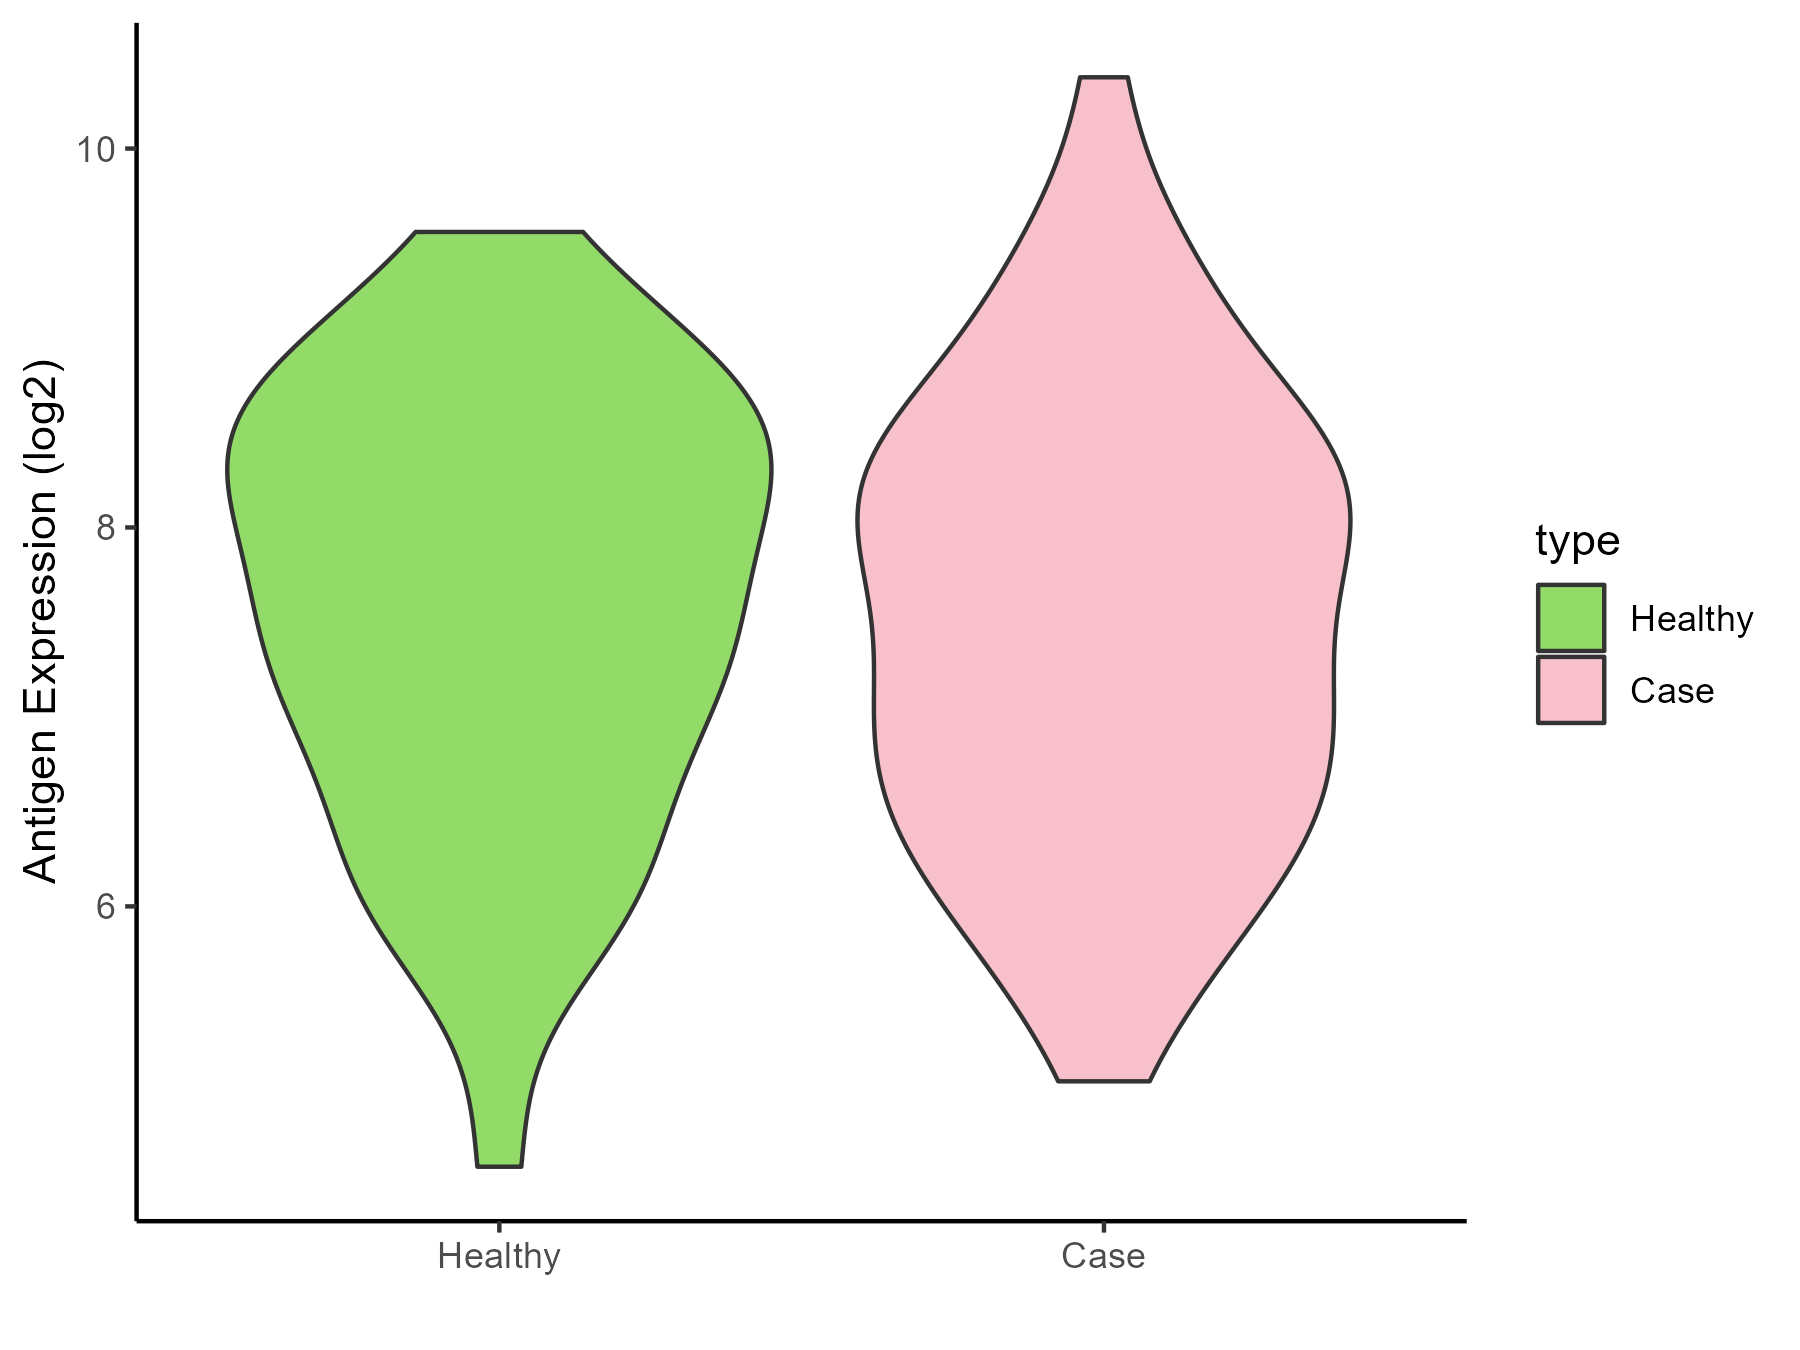
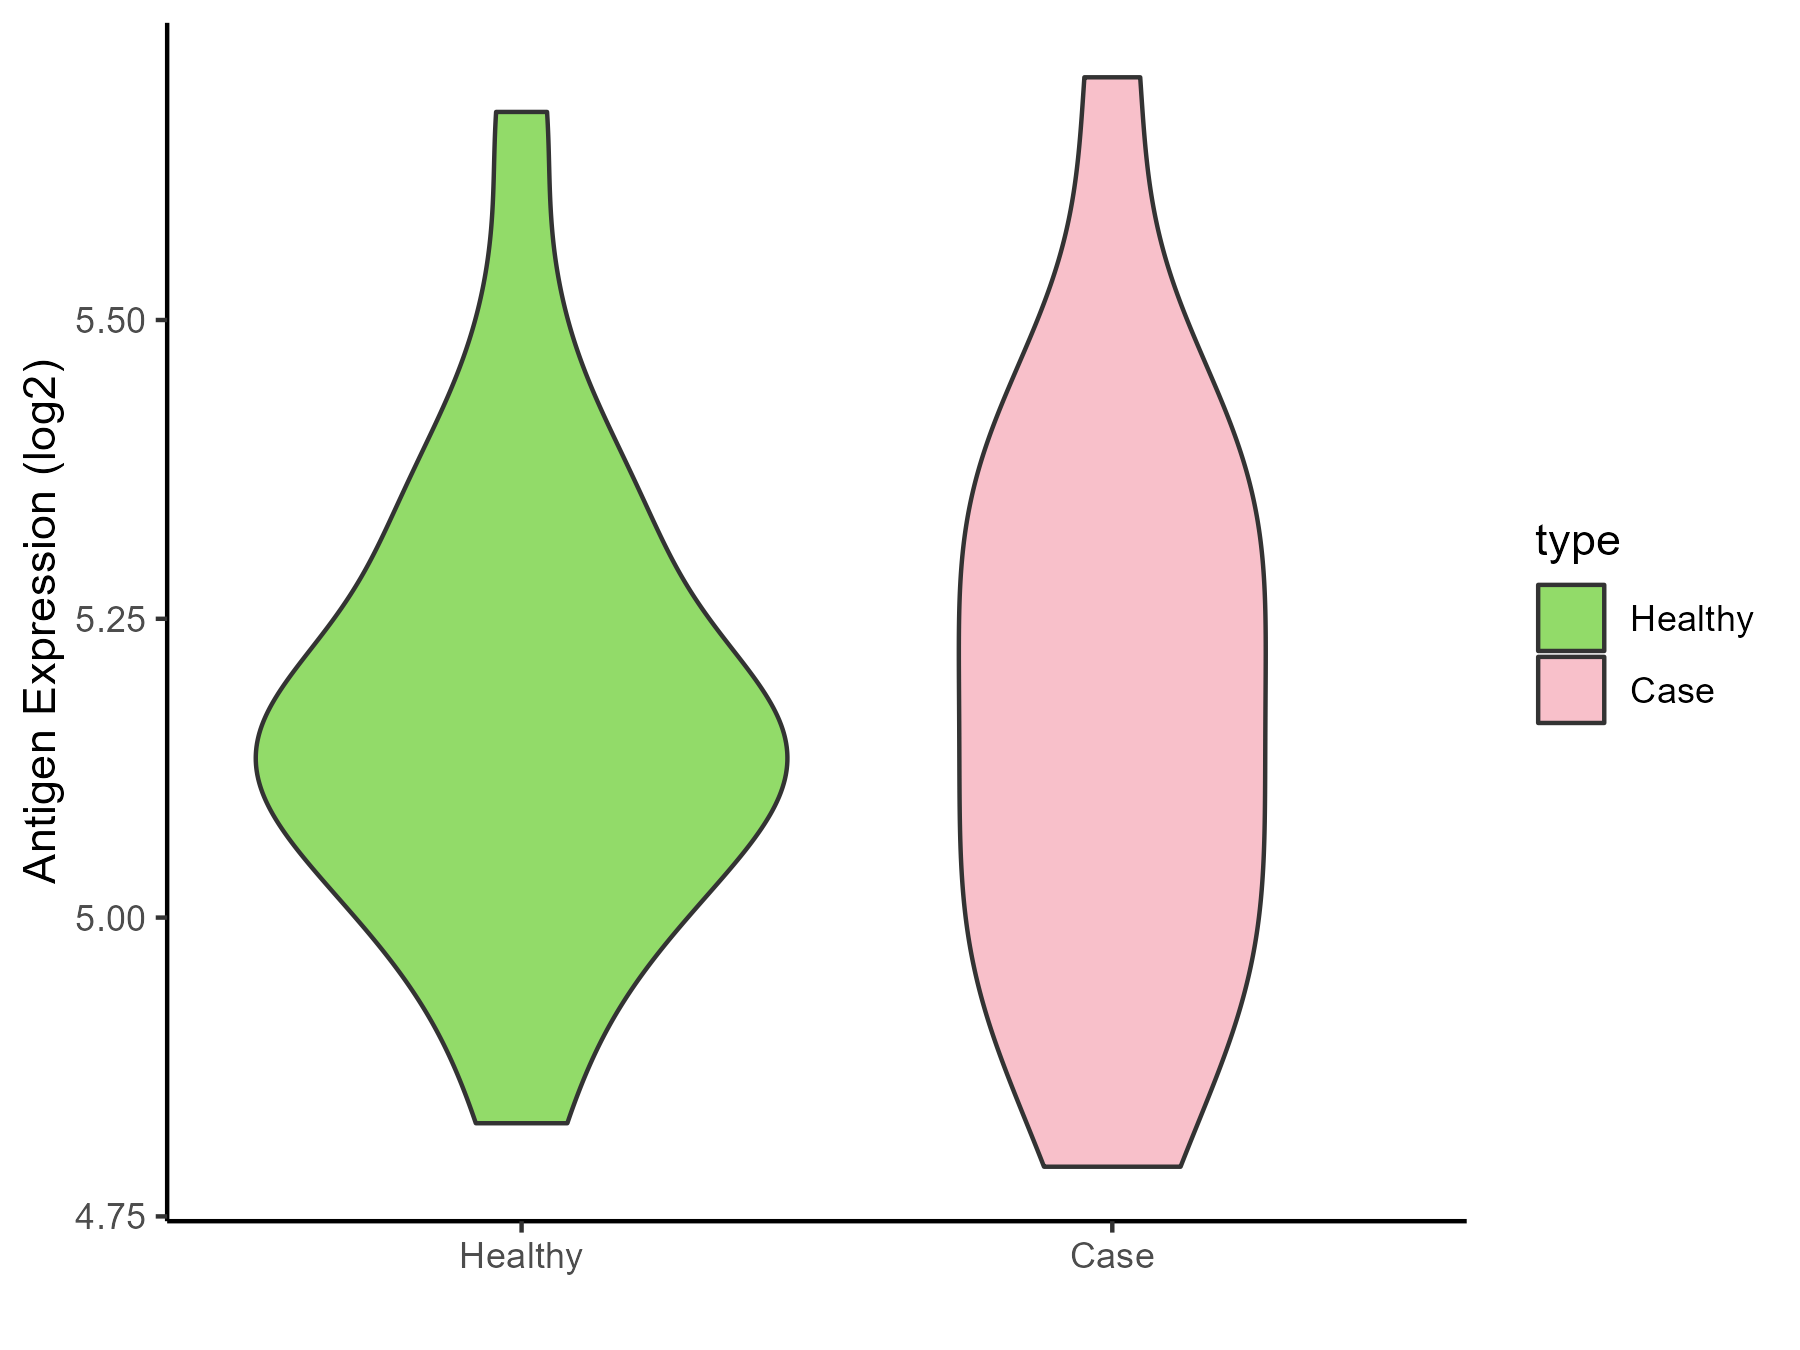
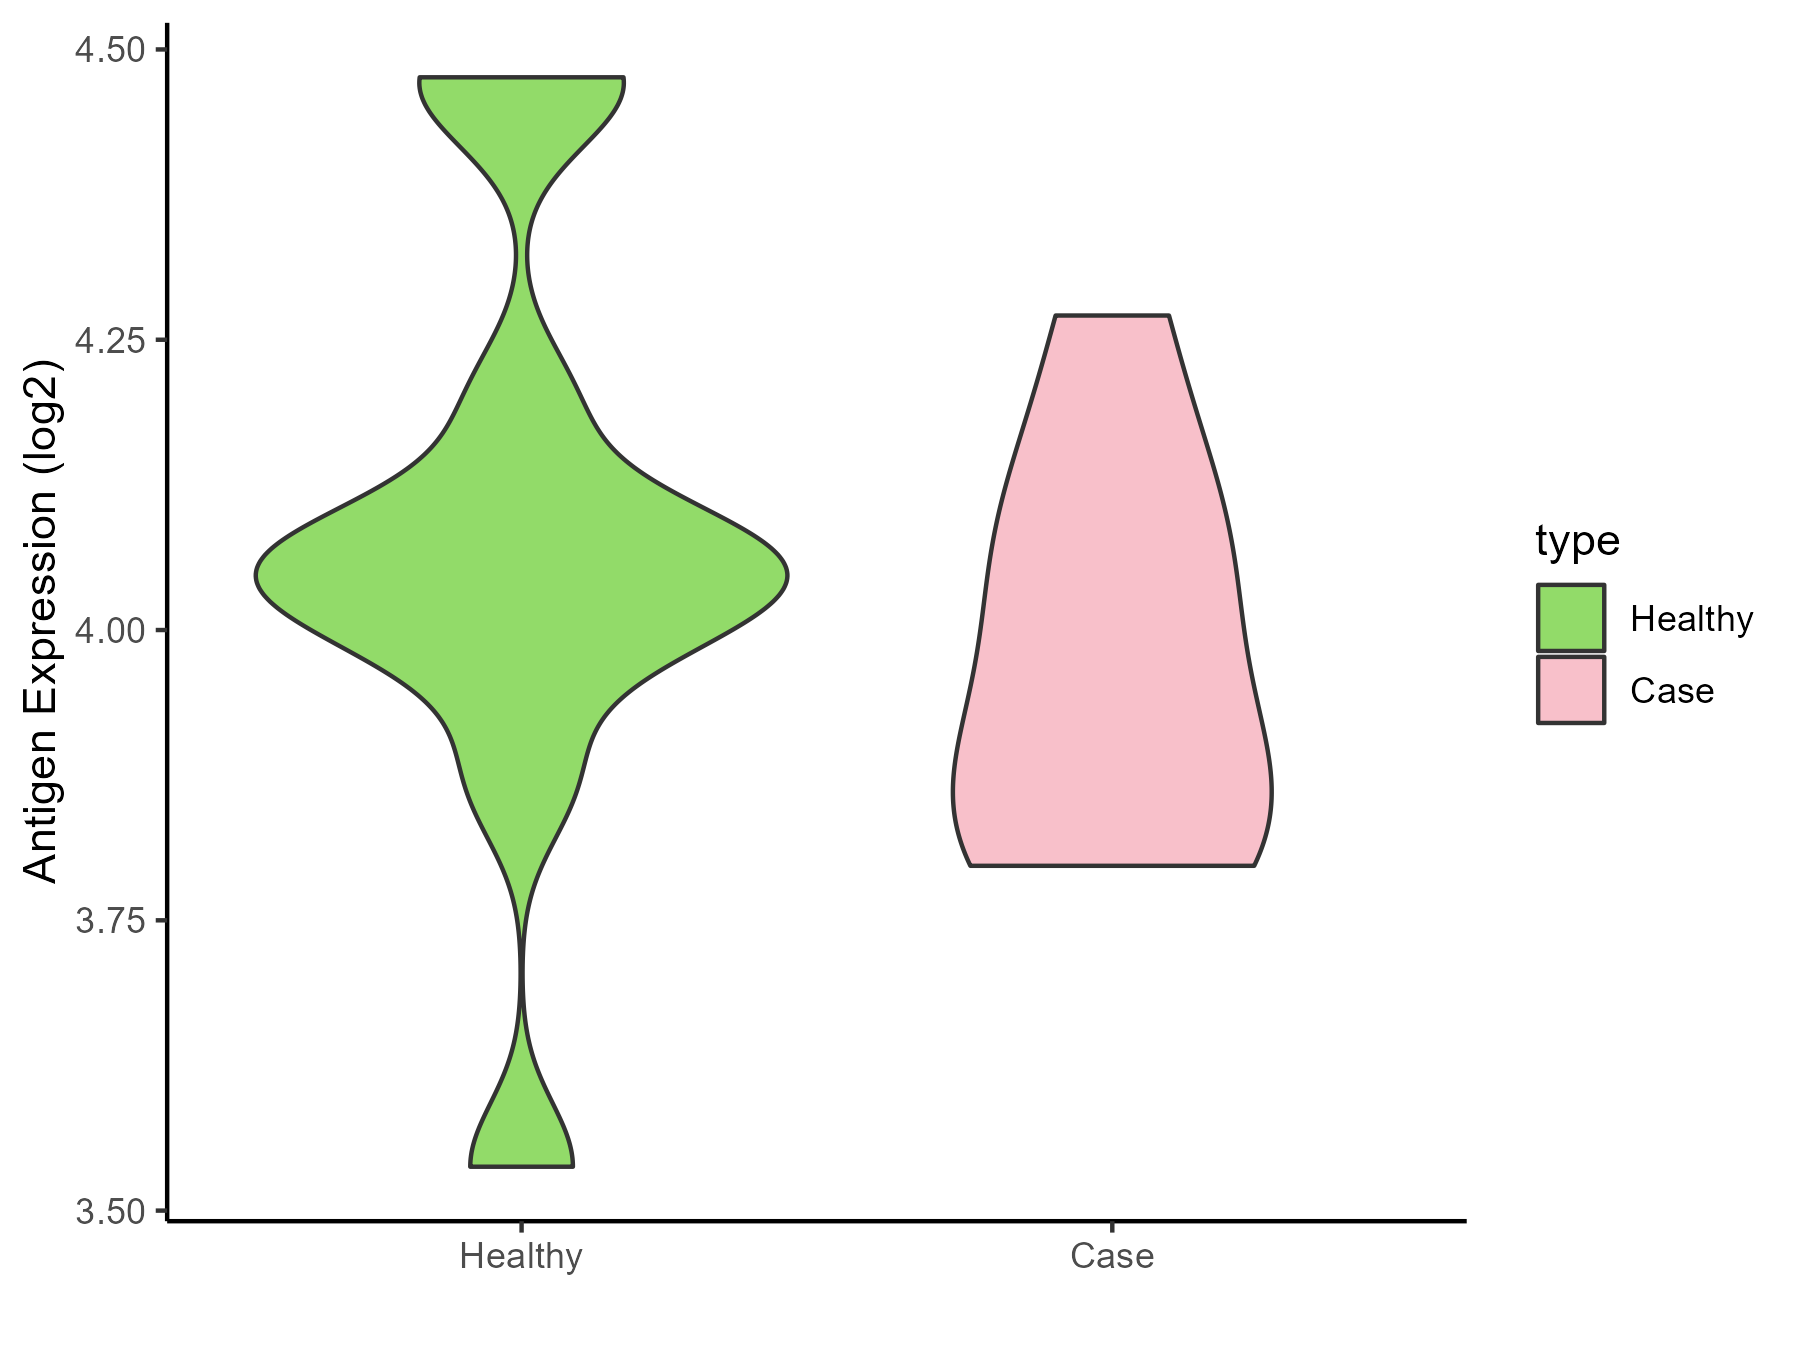
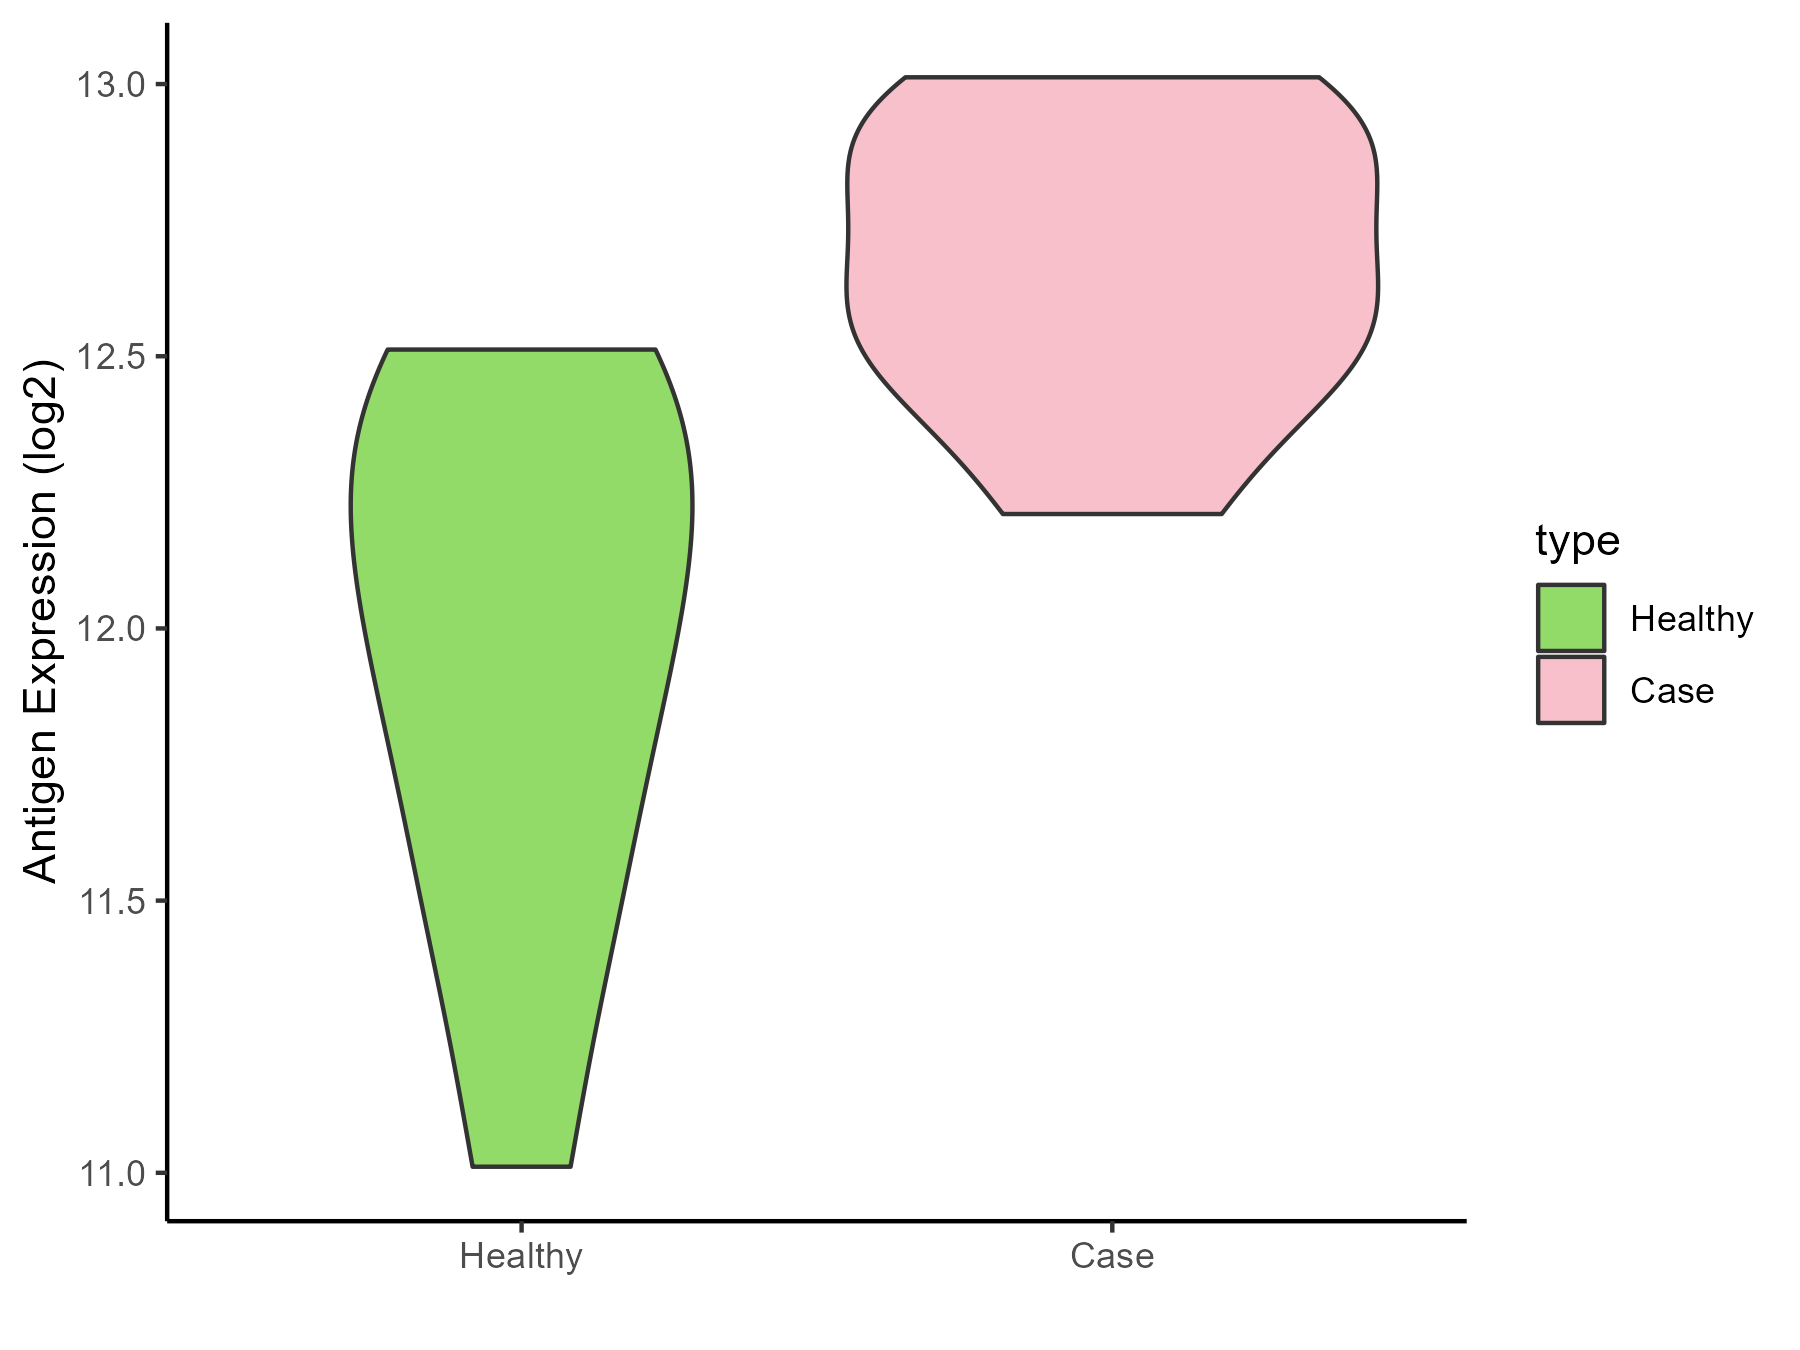
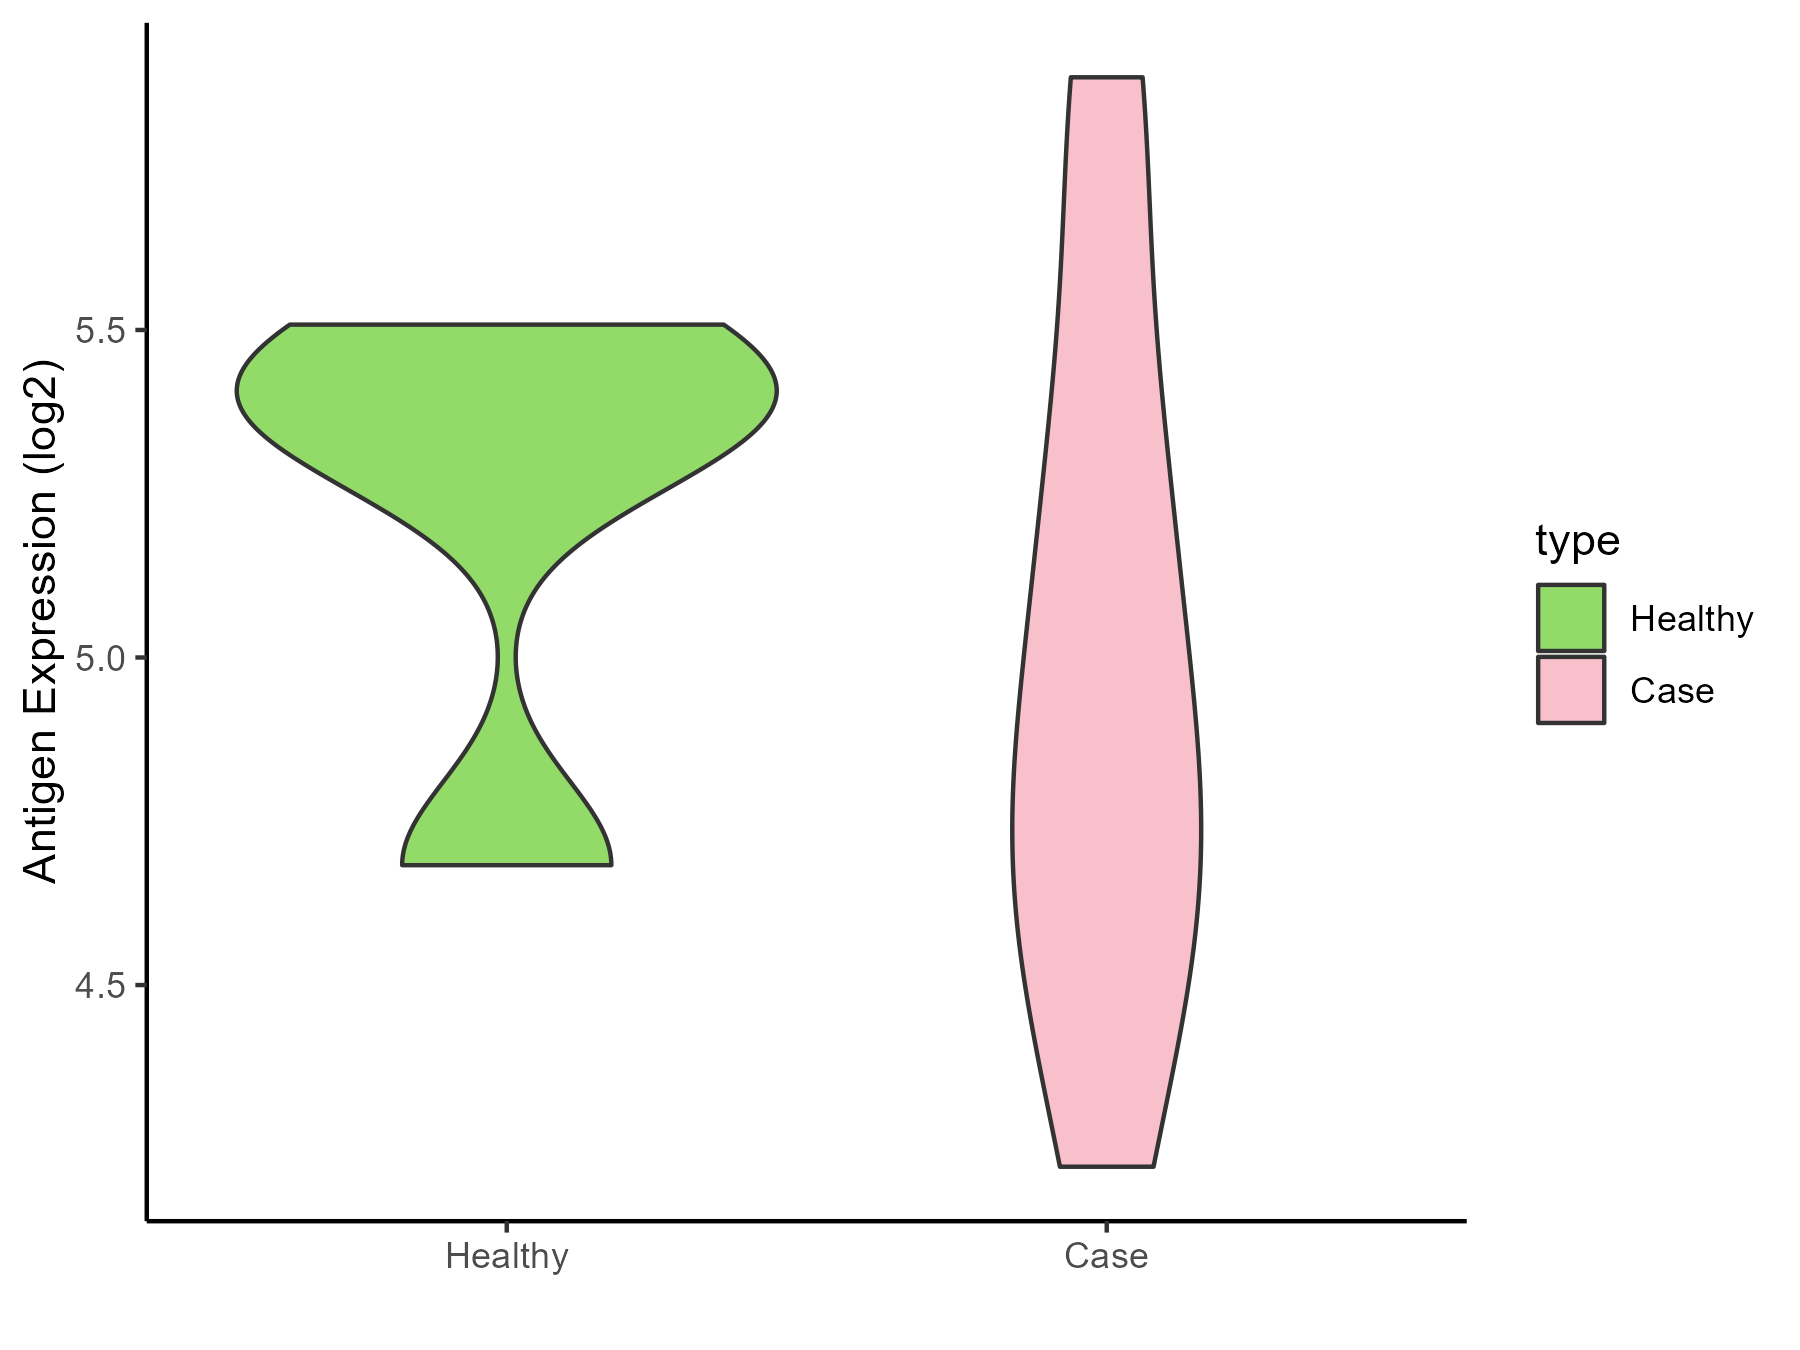
Brain cancer [ICD-11: 2A00]
Click to Show/Hide
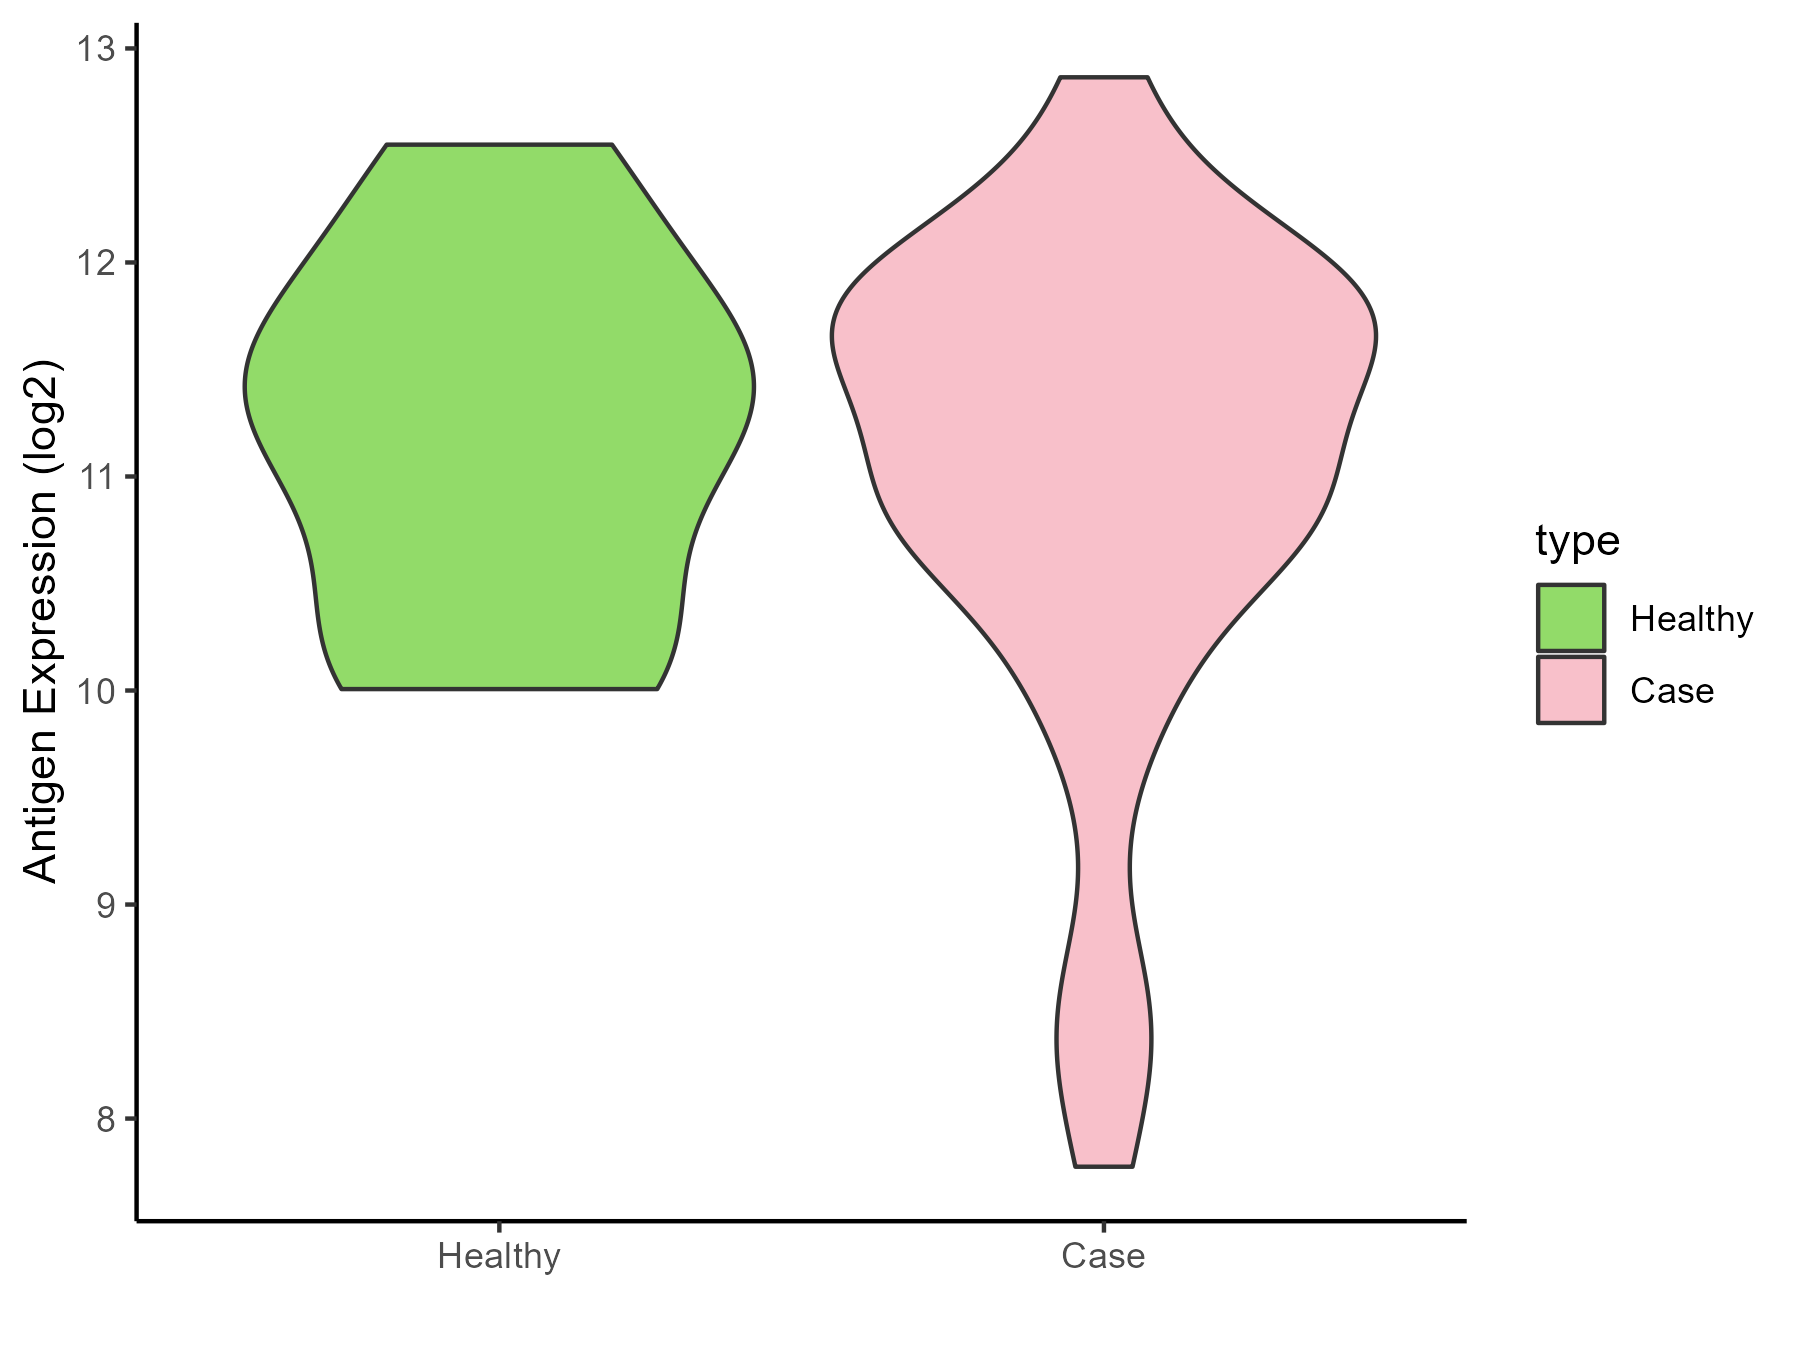
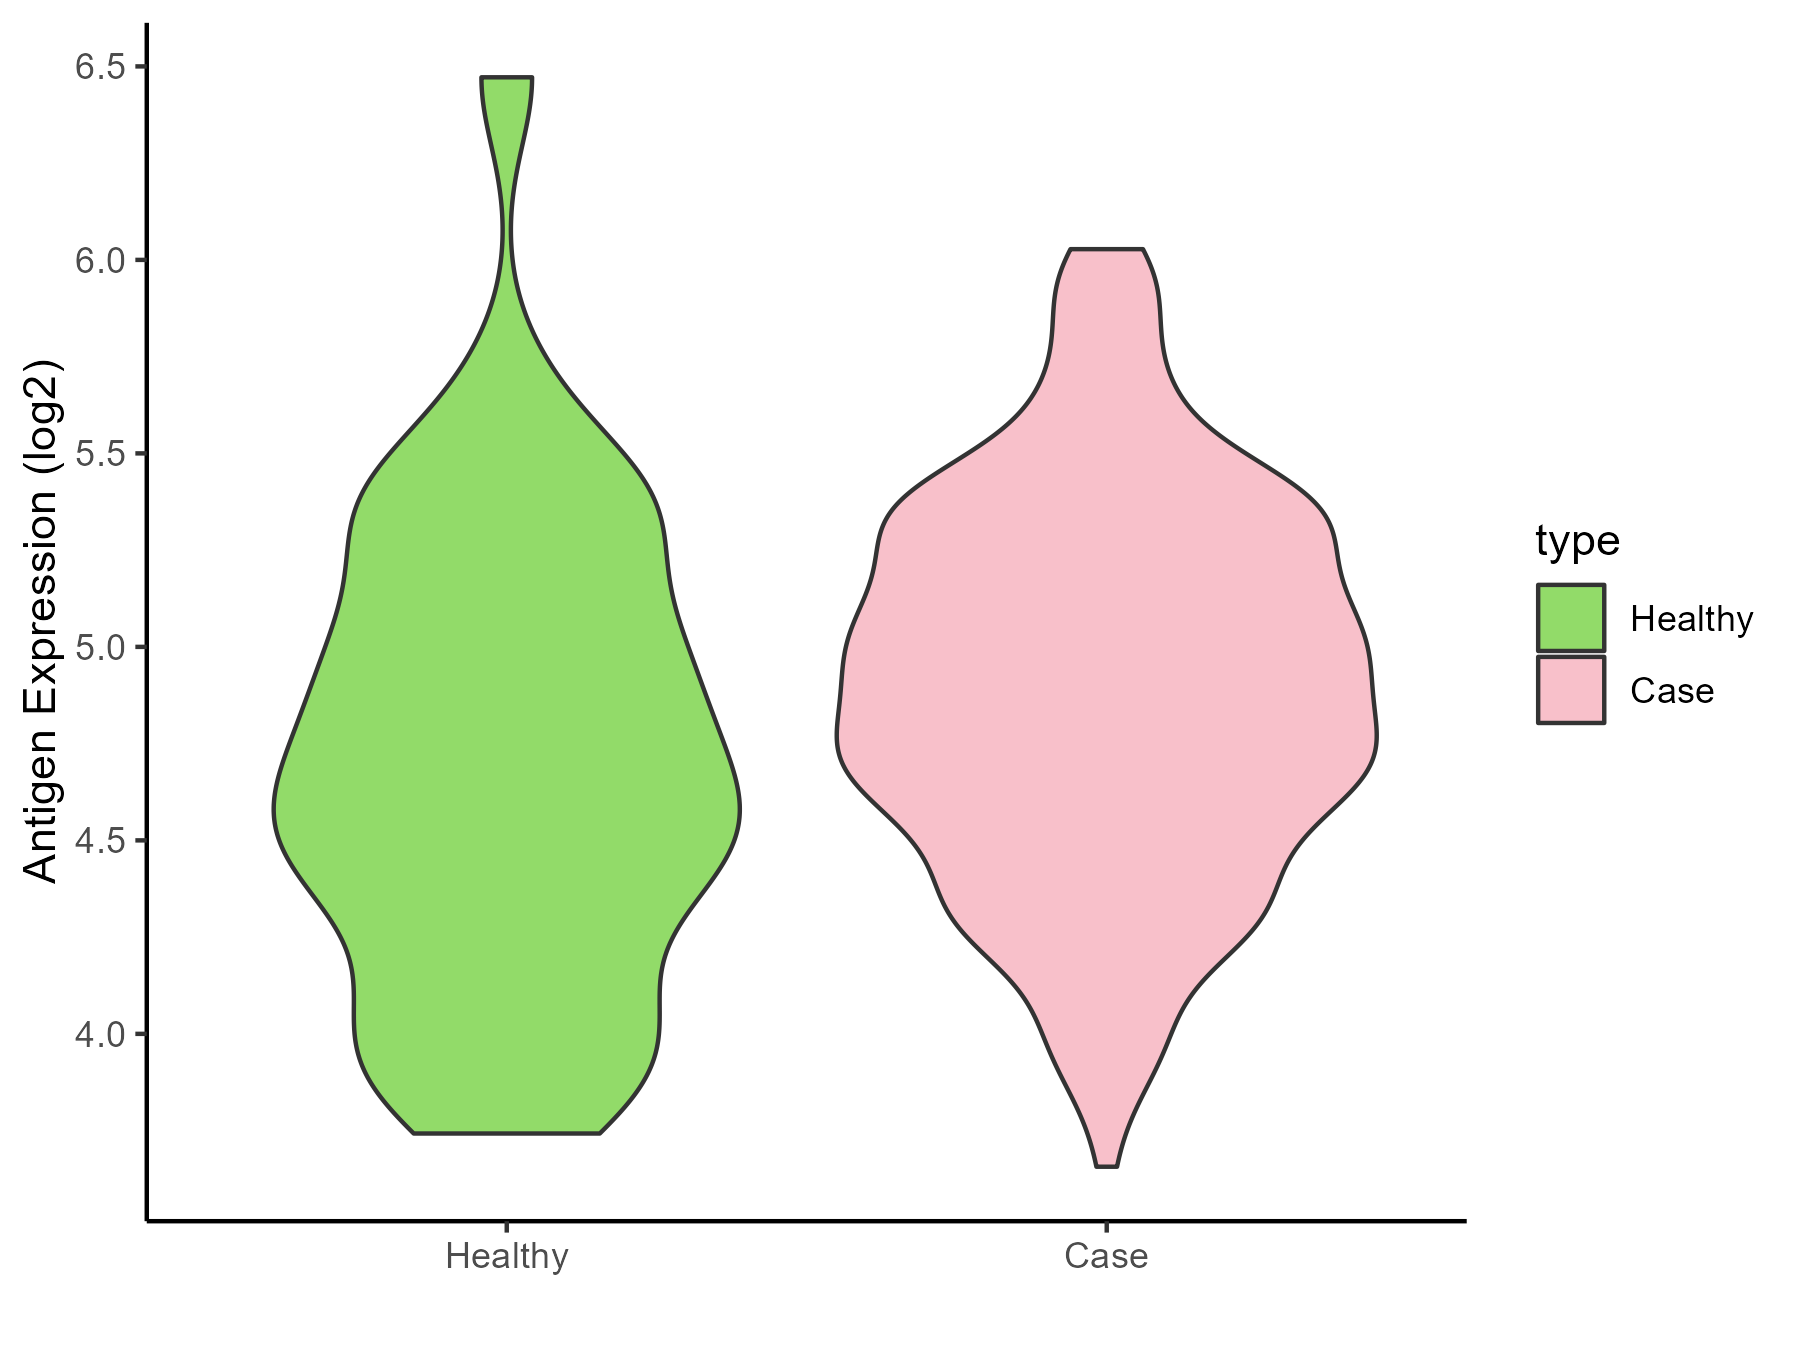
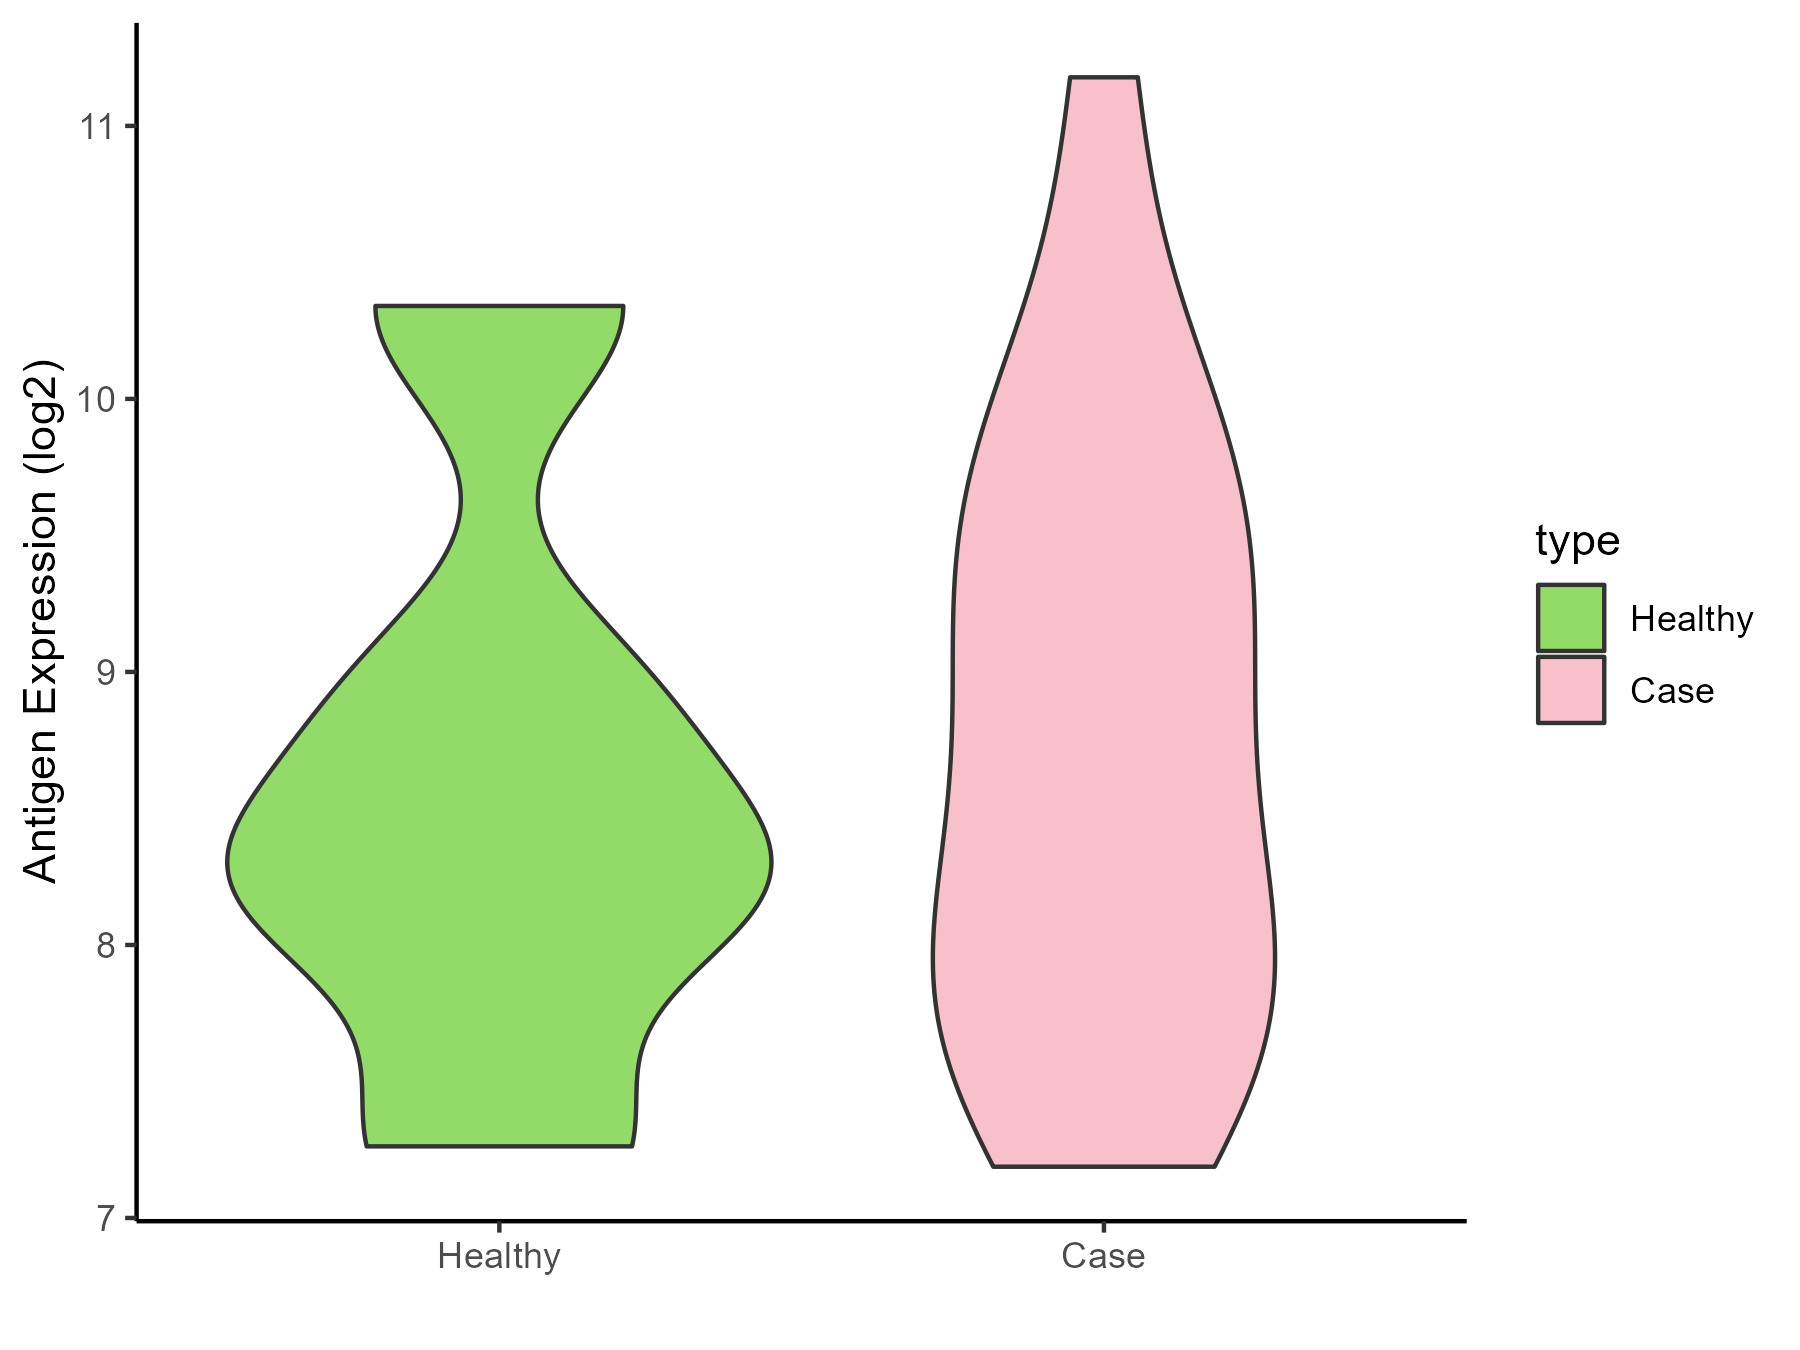
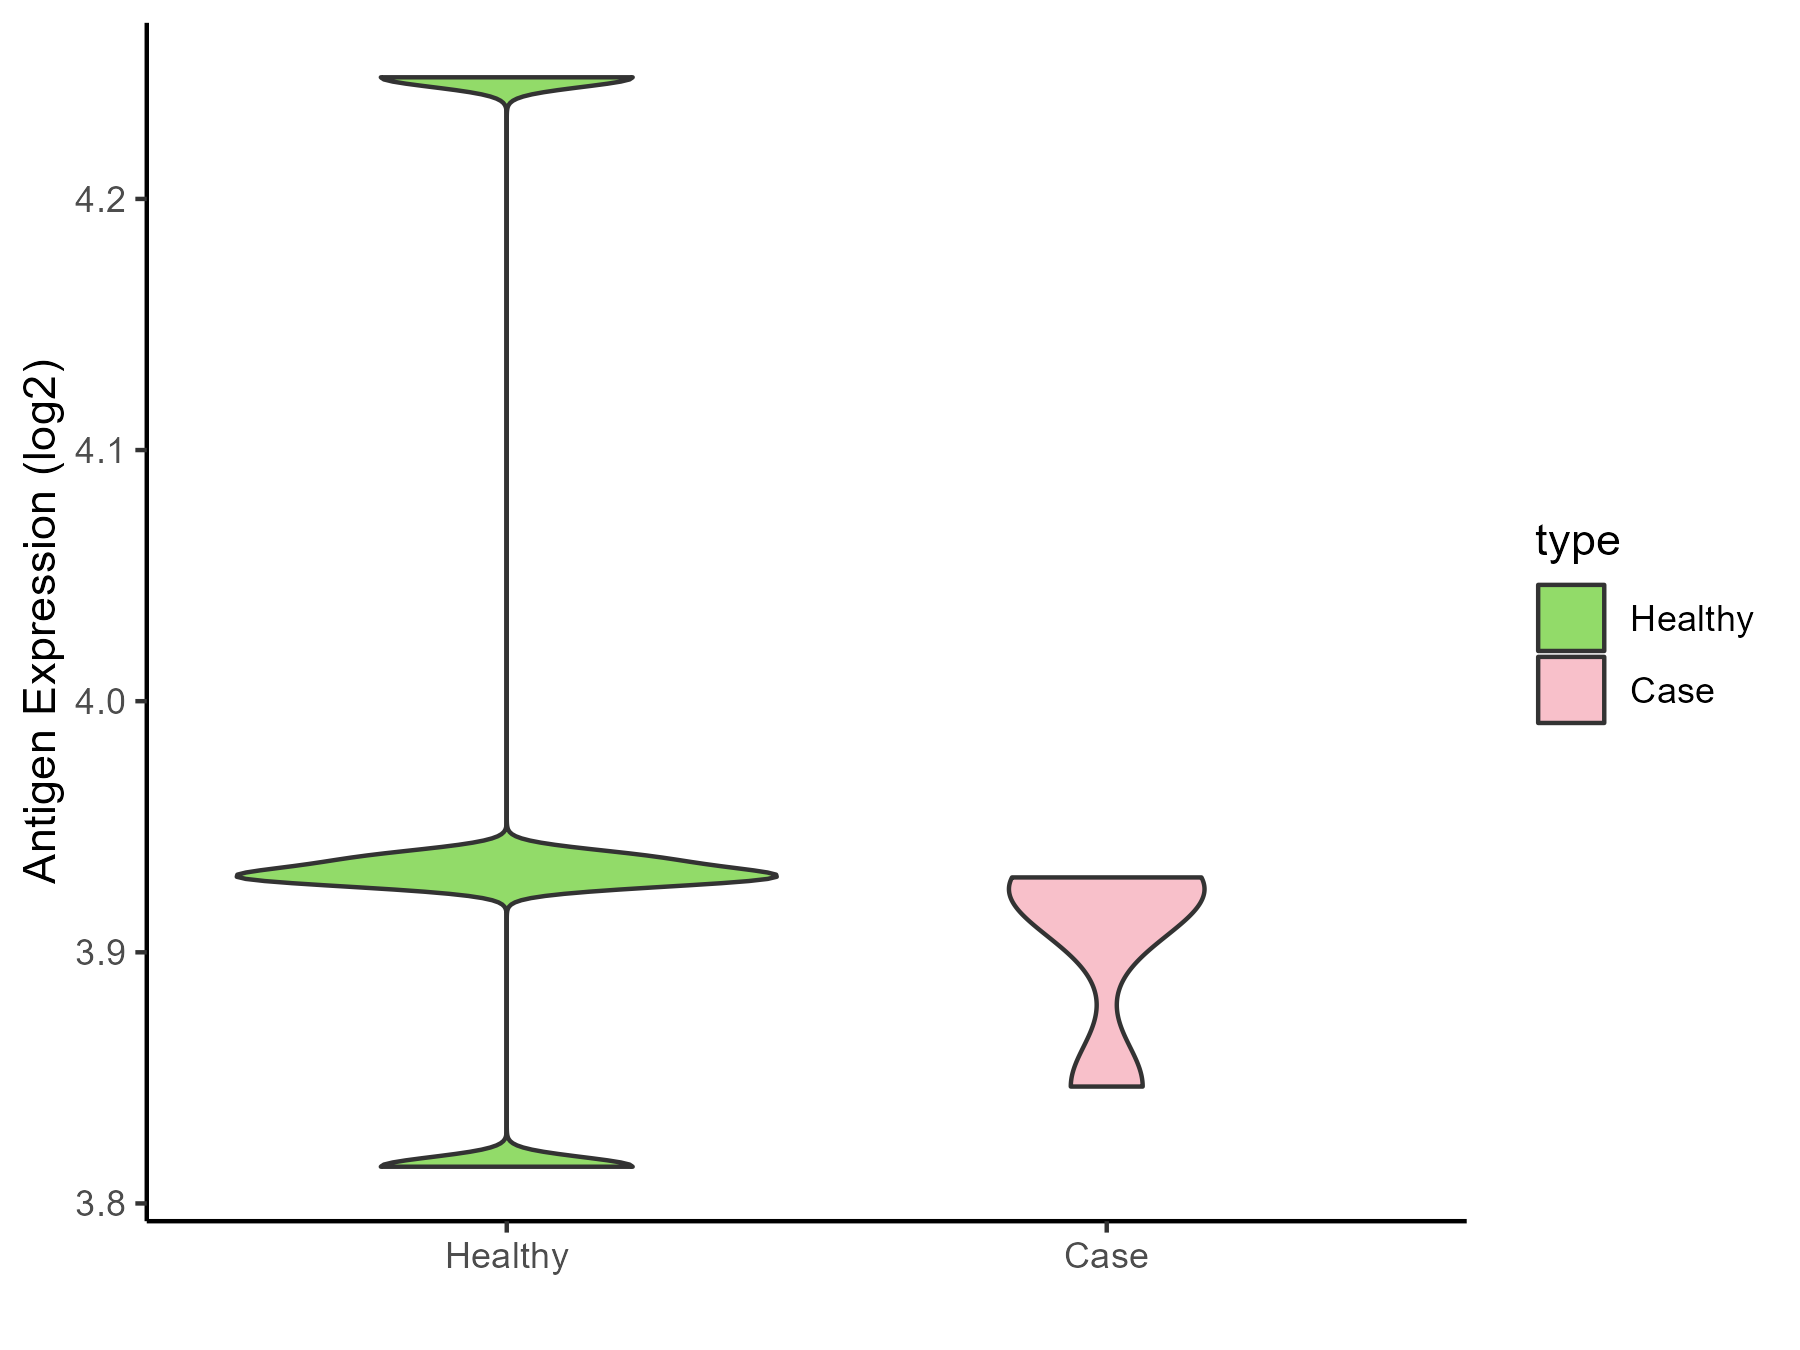
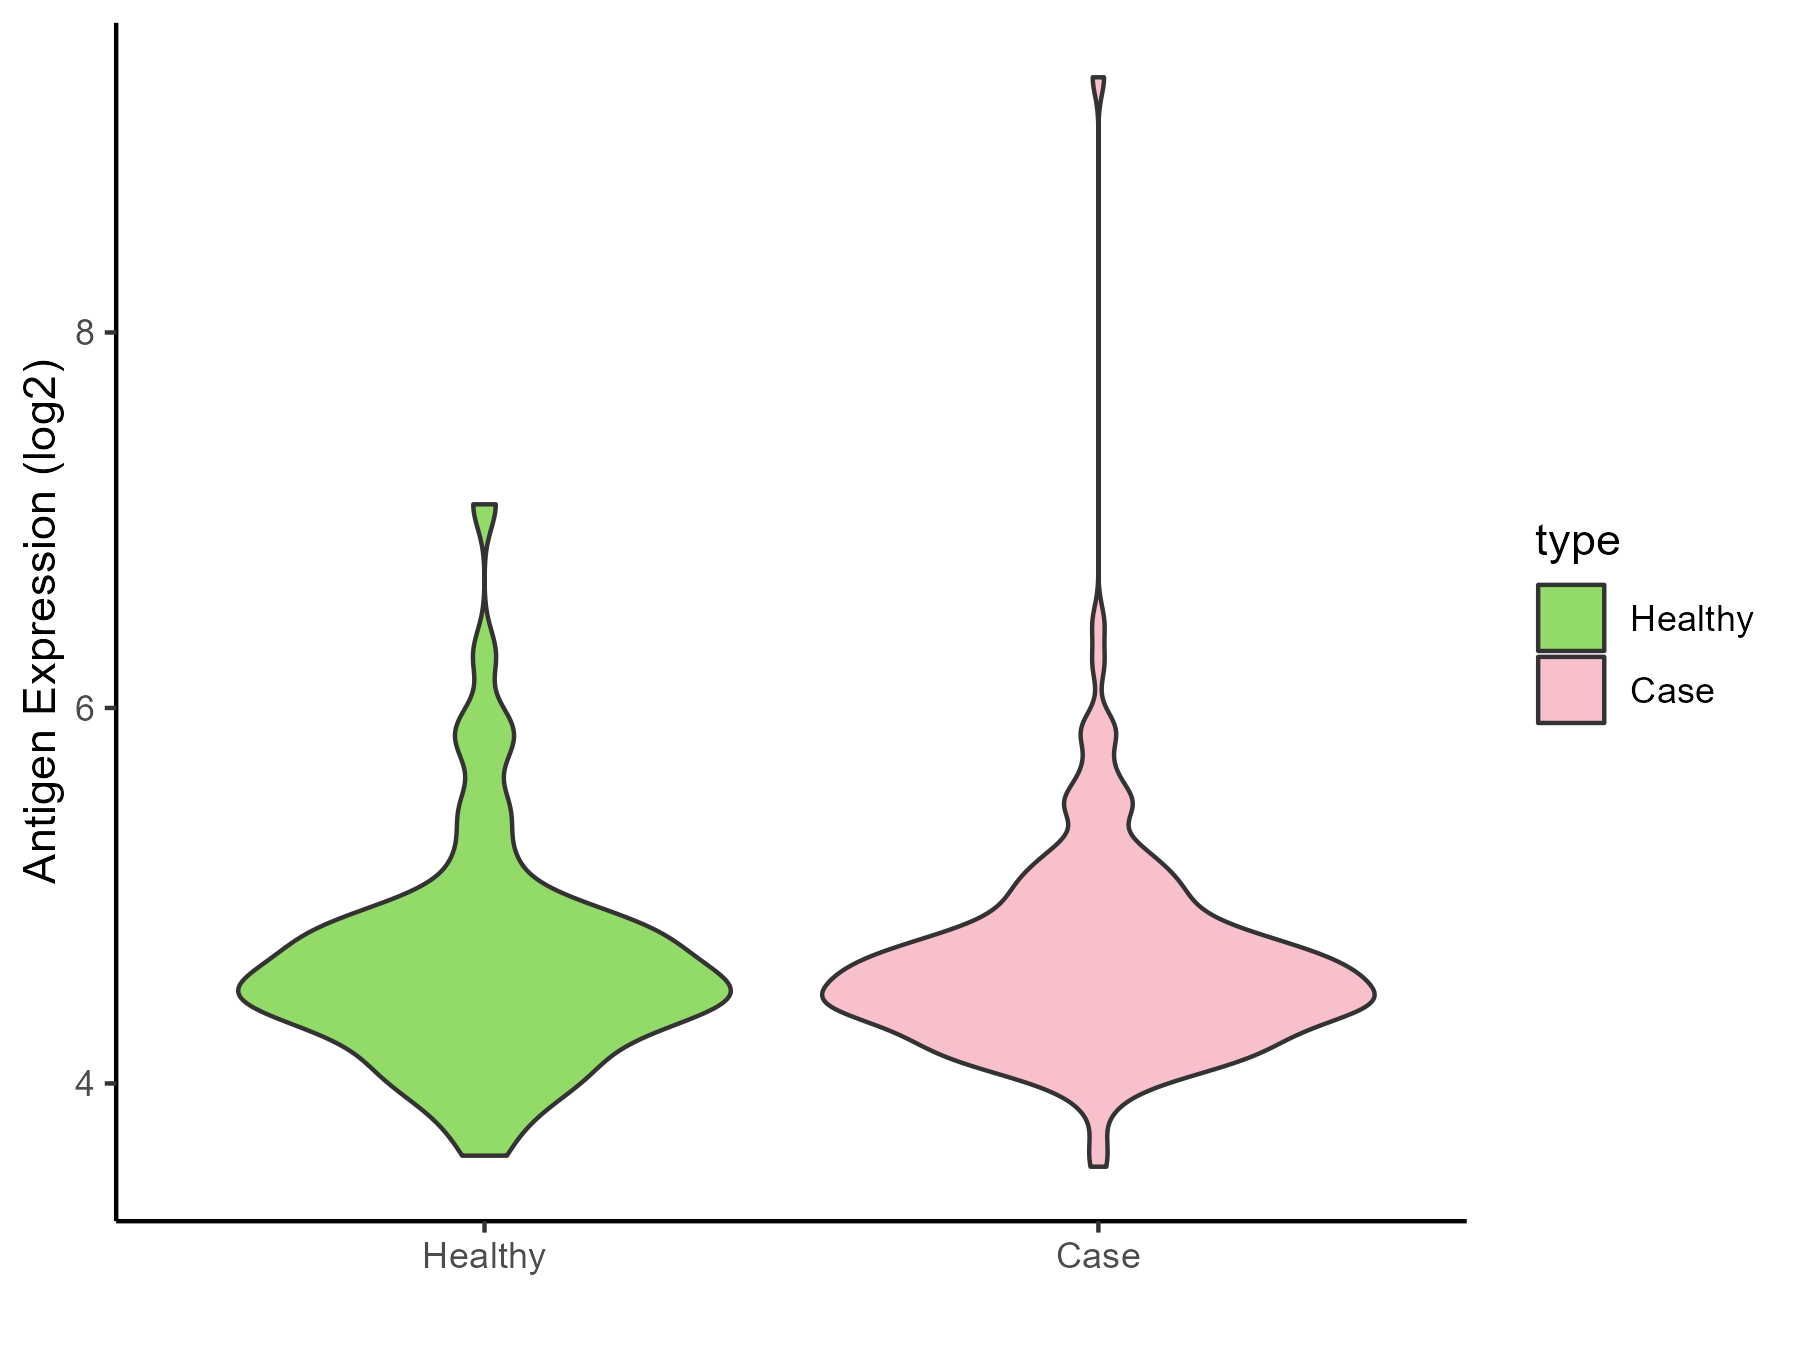
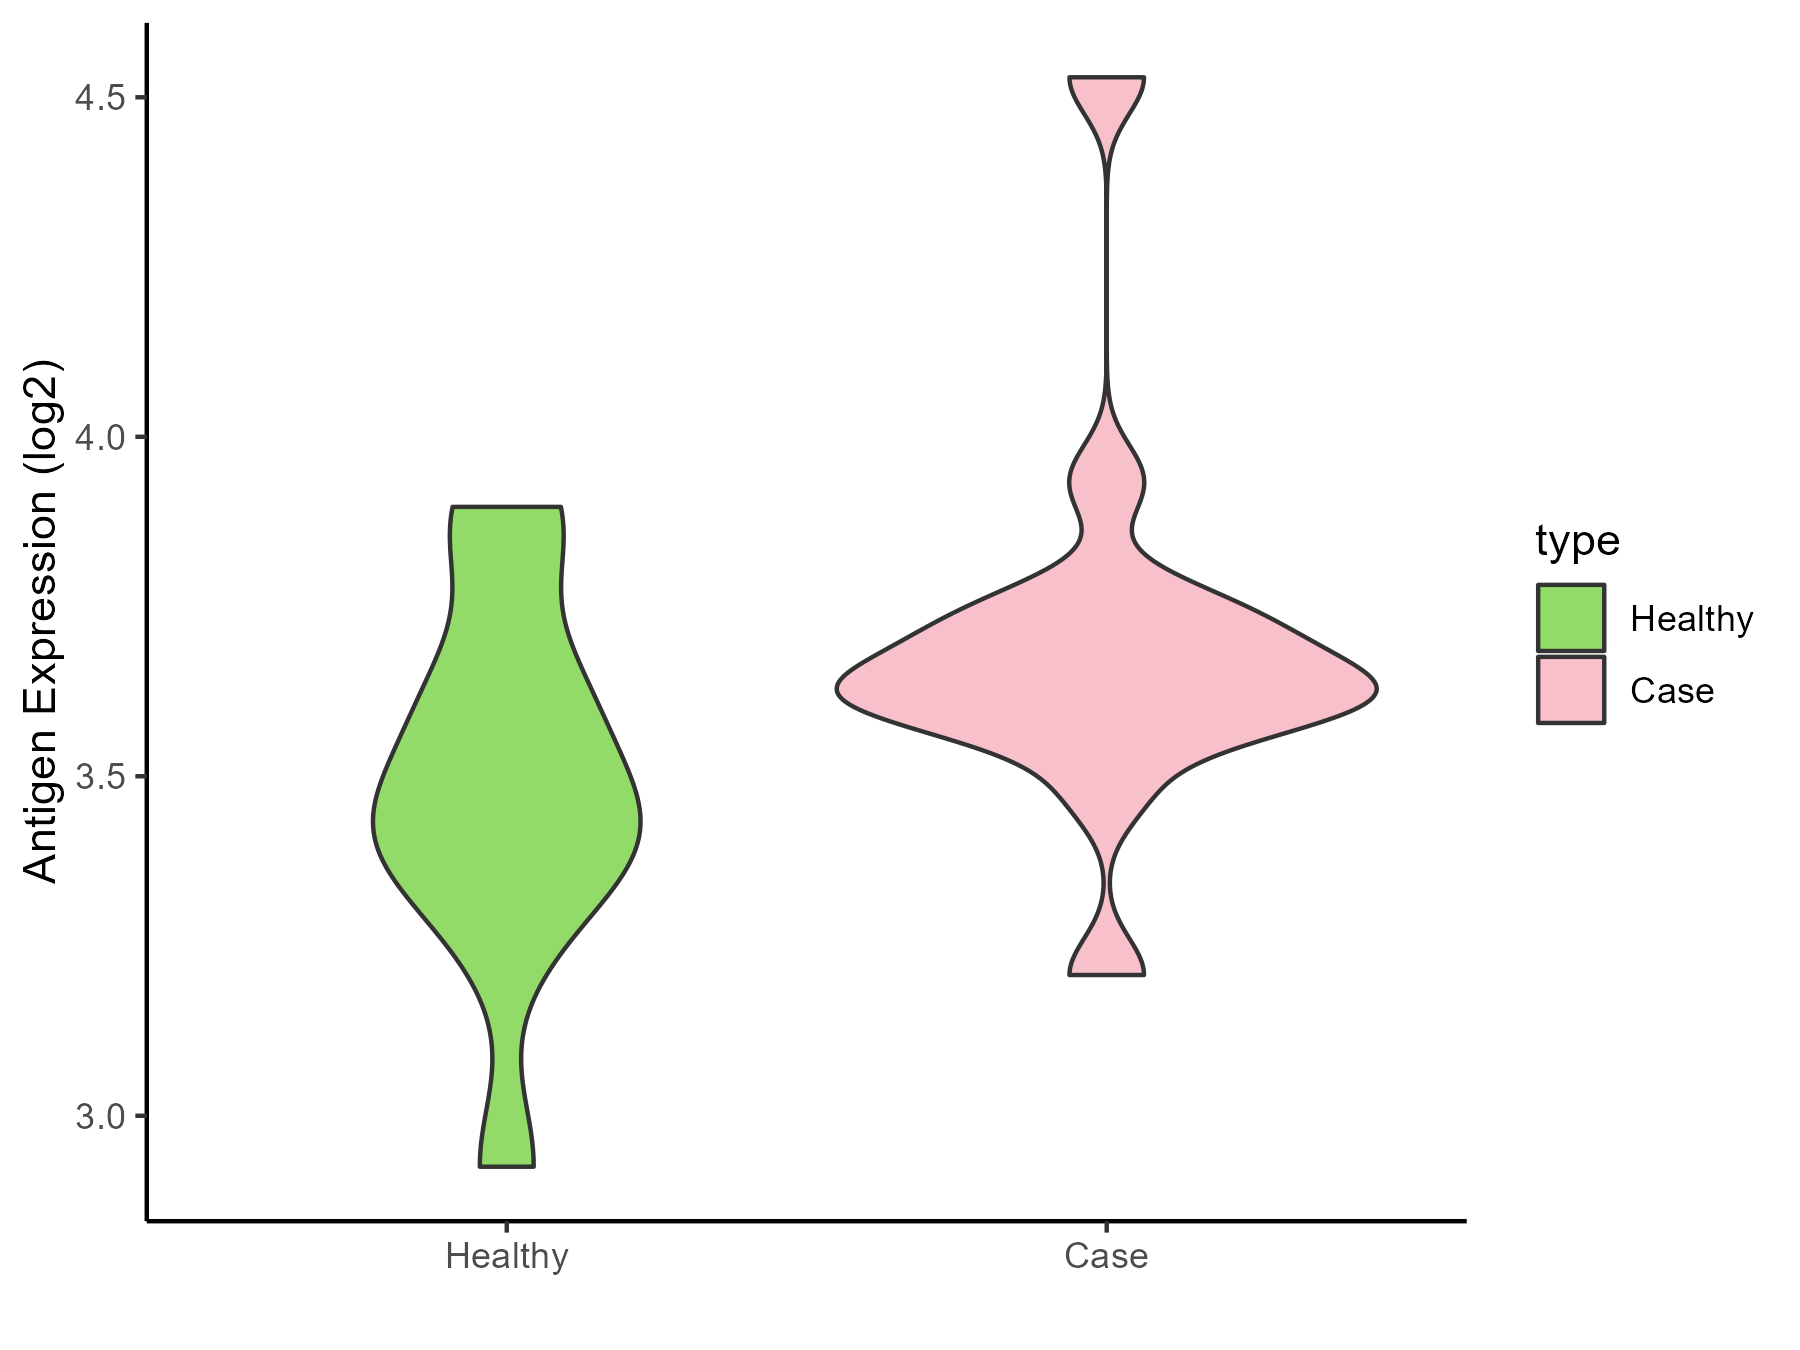
| Differential expression pattern of antigen in diseases |
| The Studied Tissue |
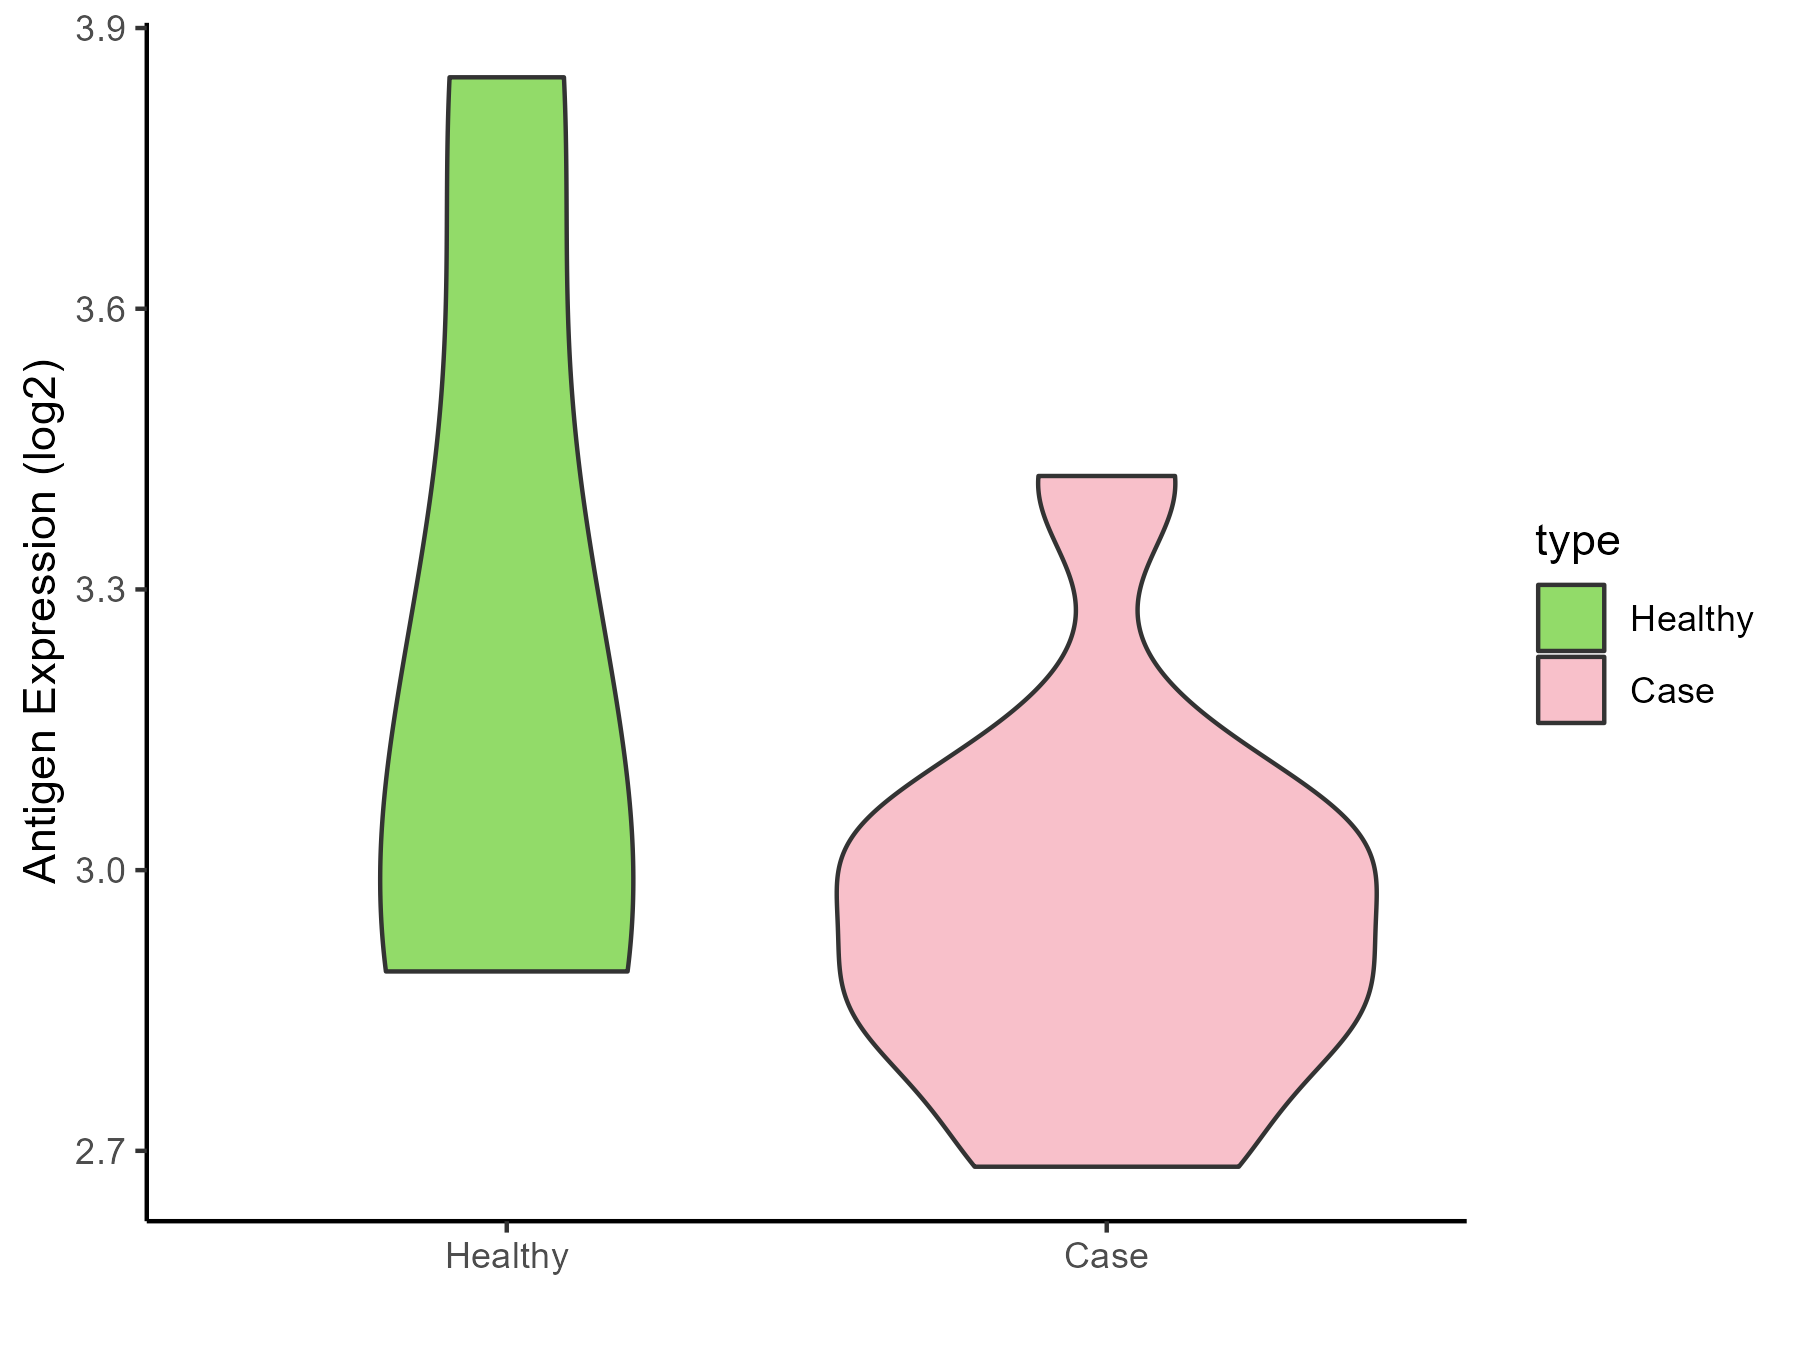
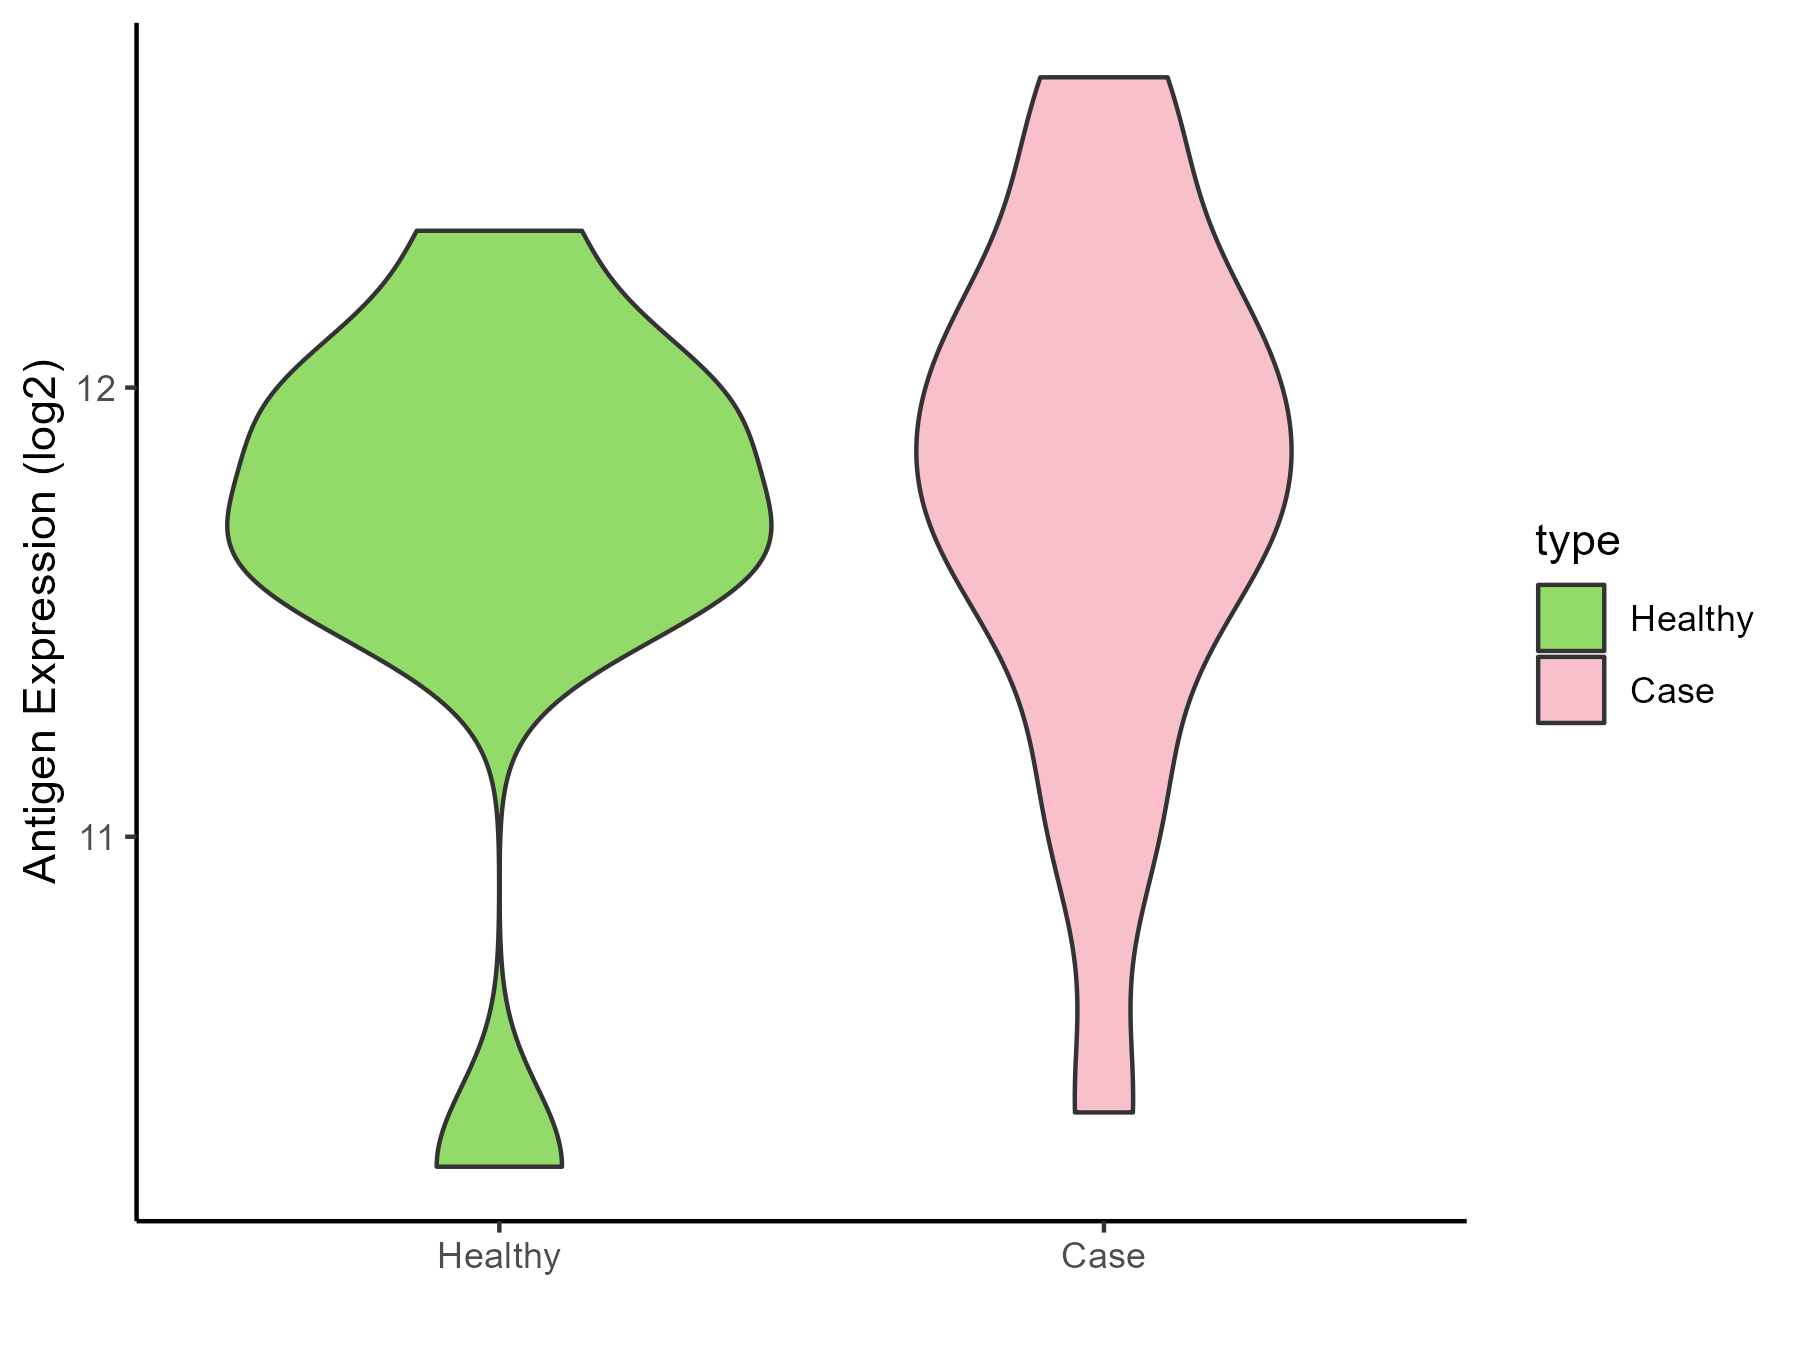
White matter |
| The Specific Disease |
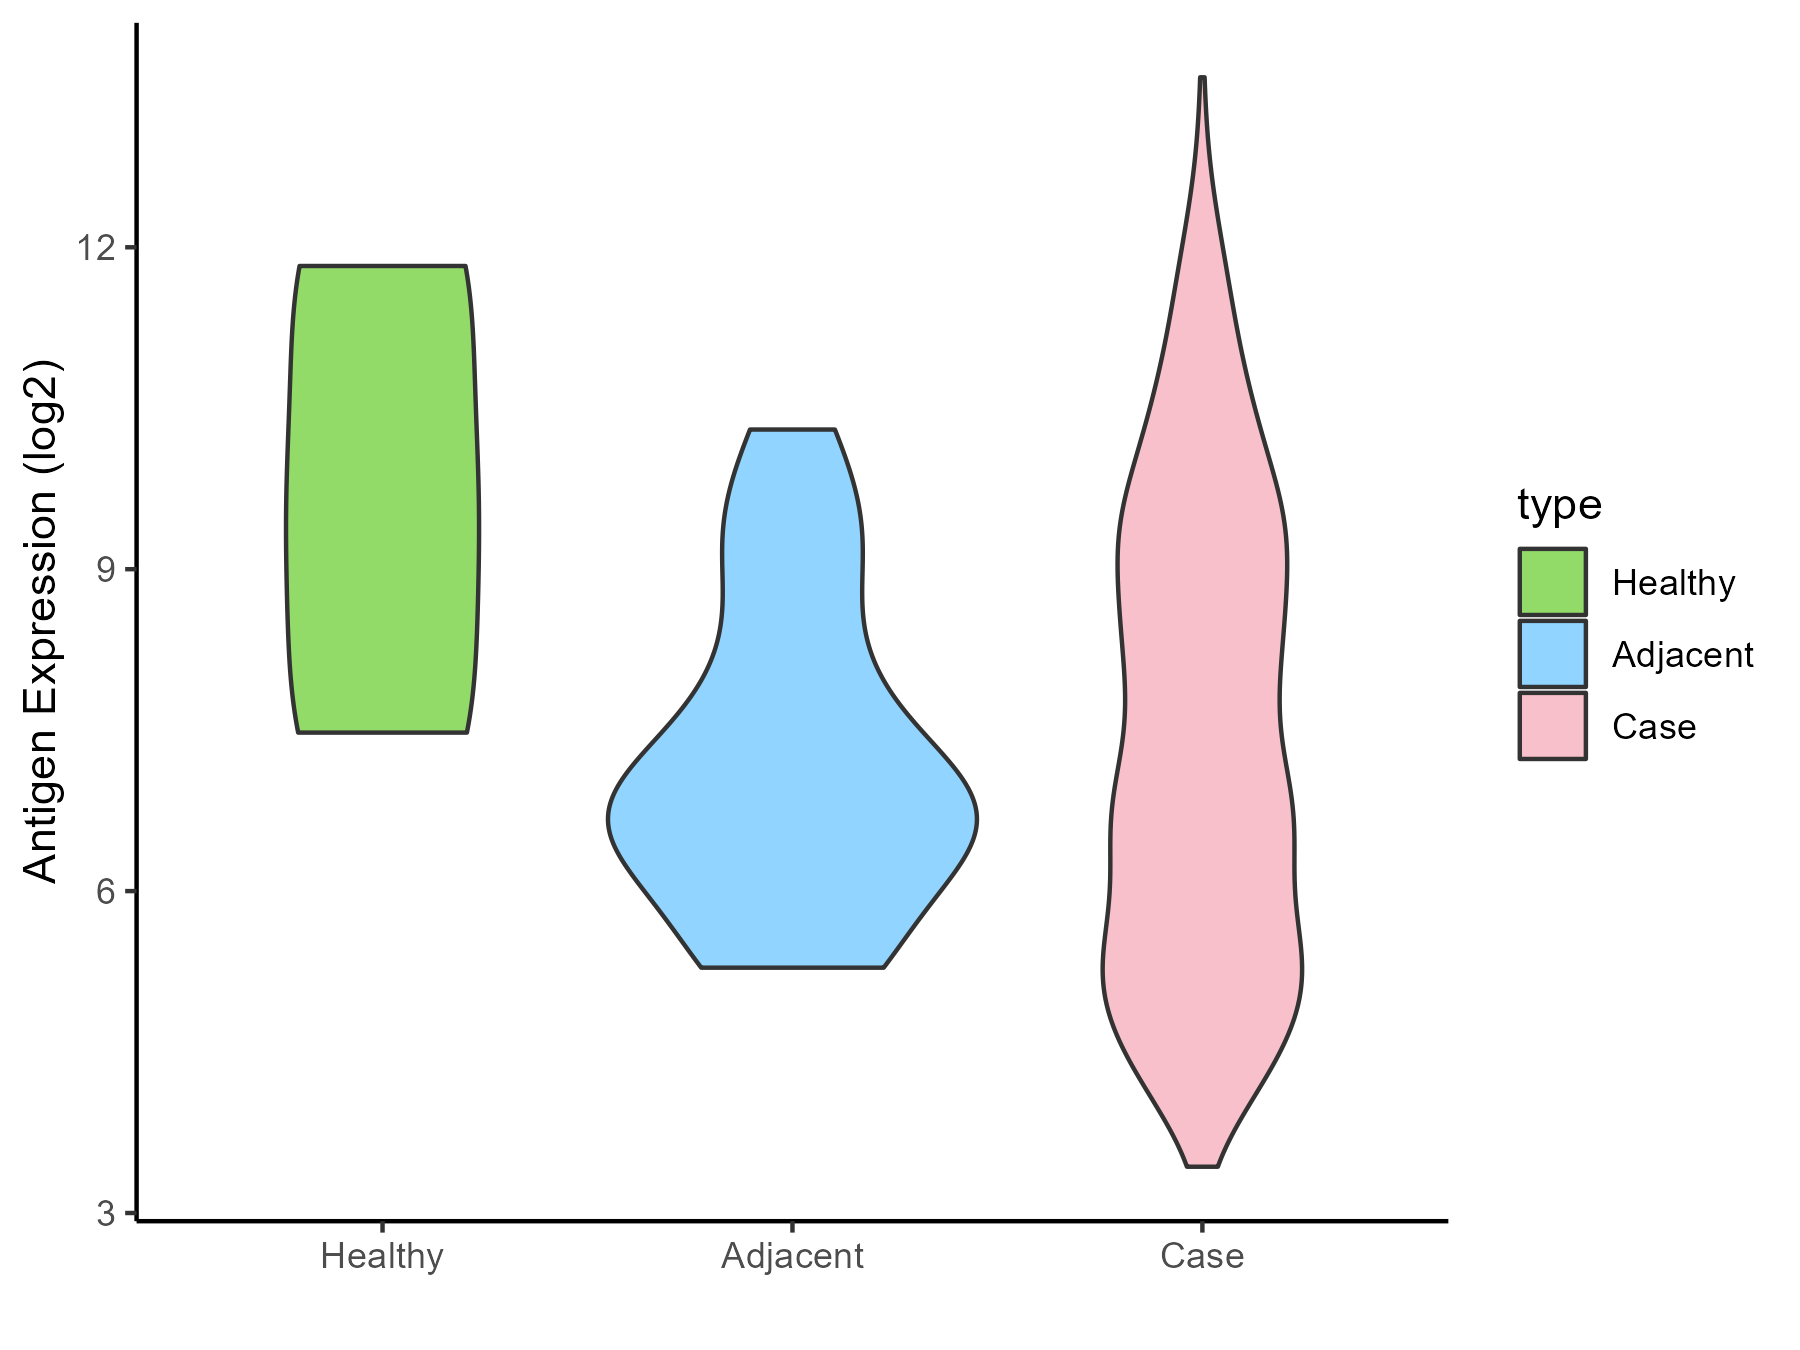
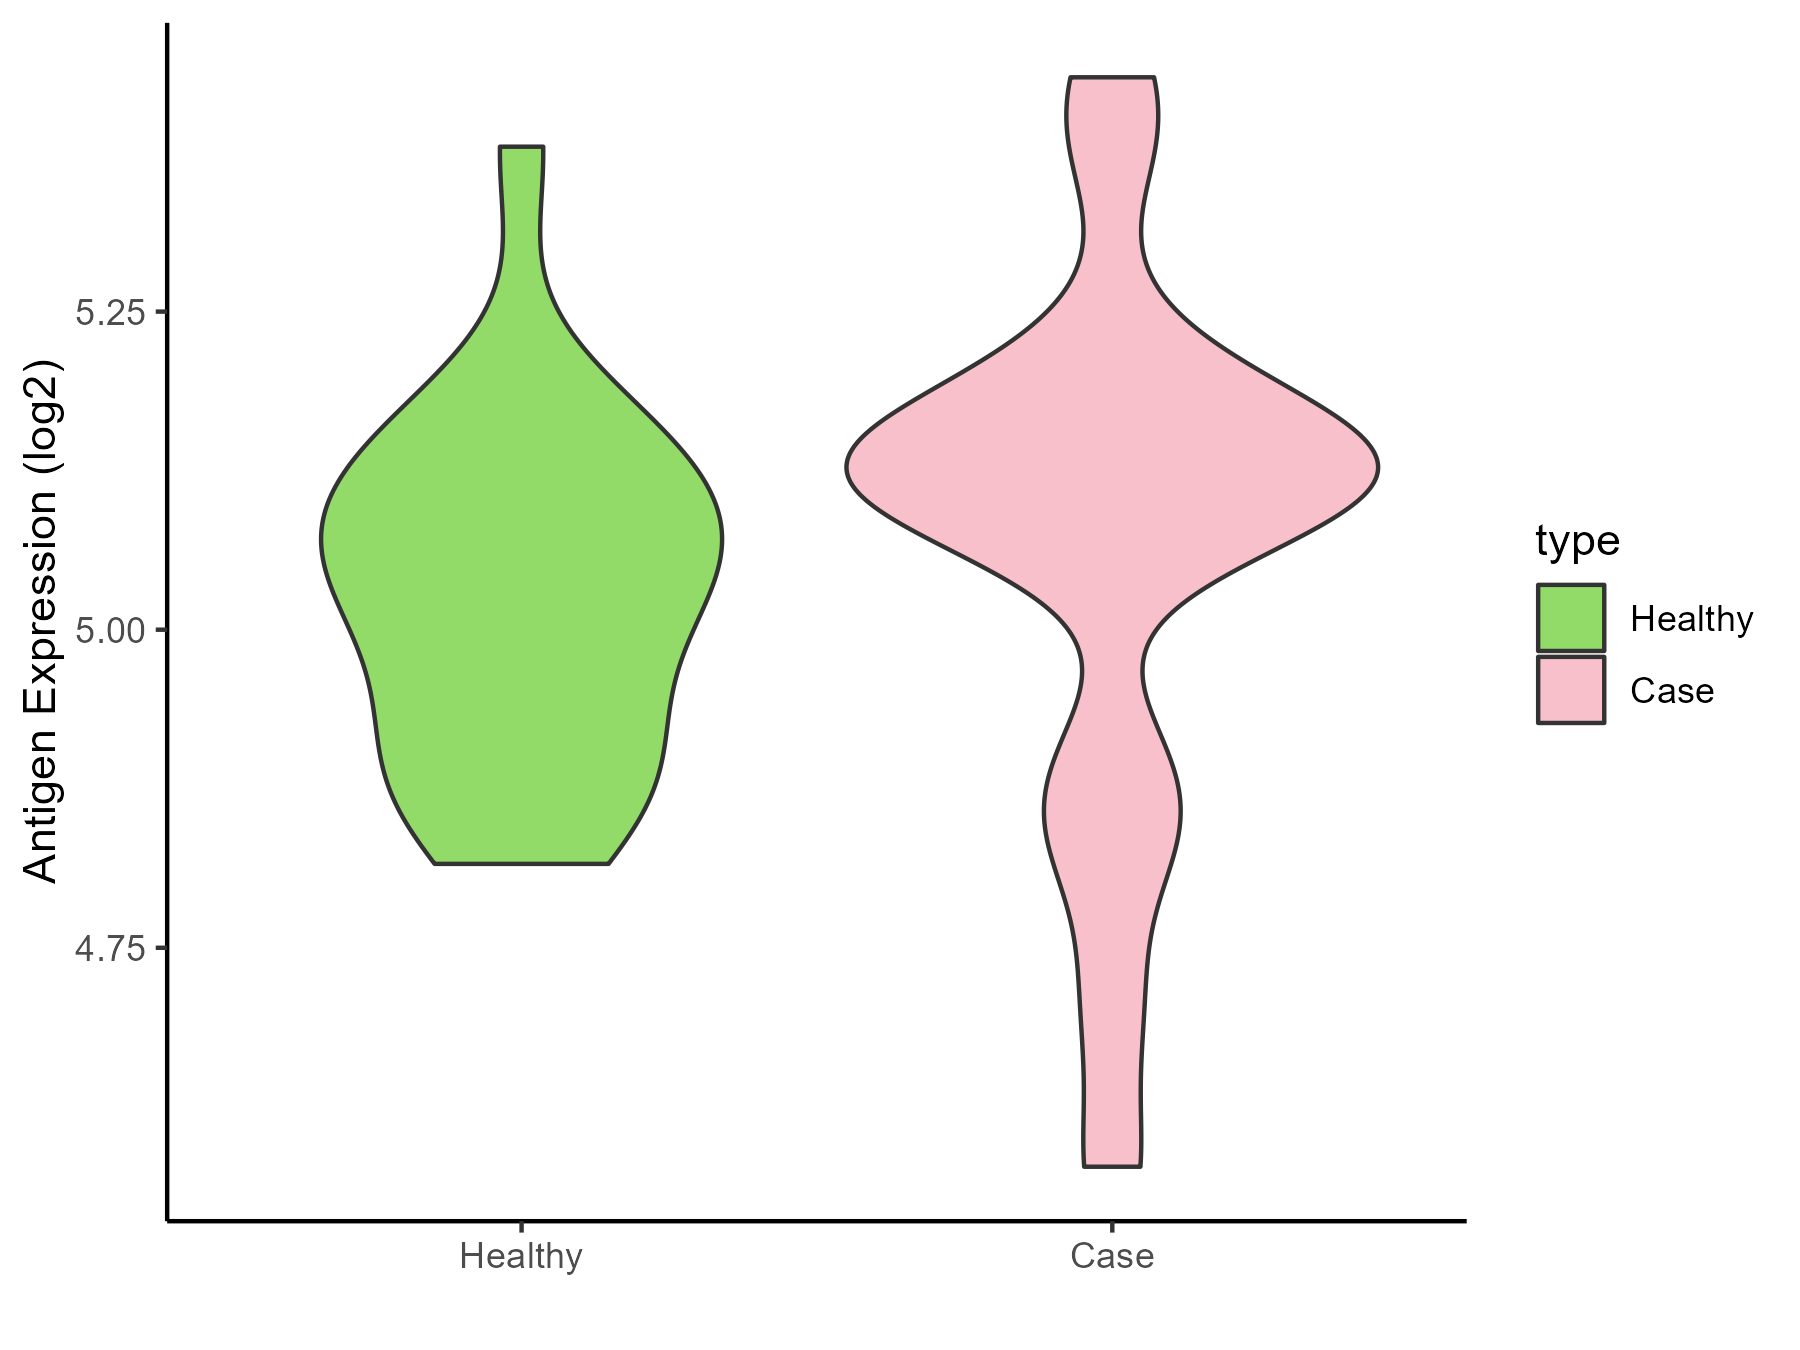
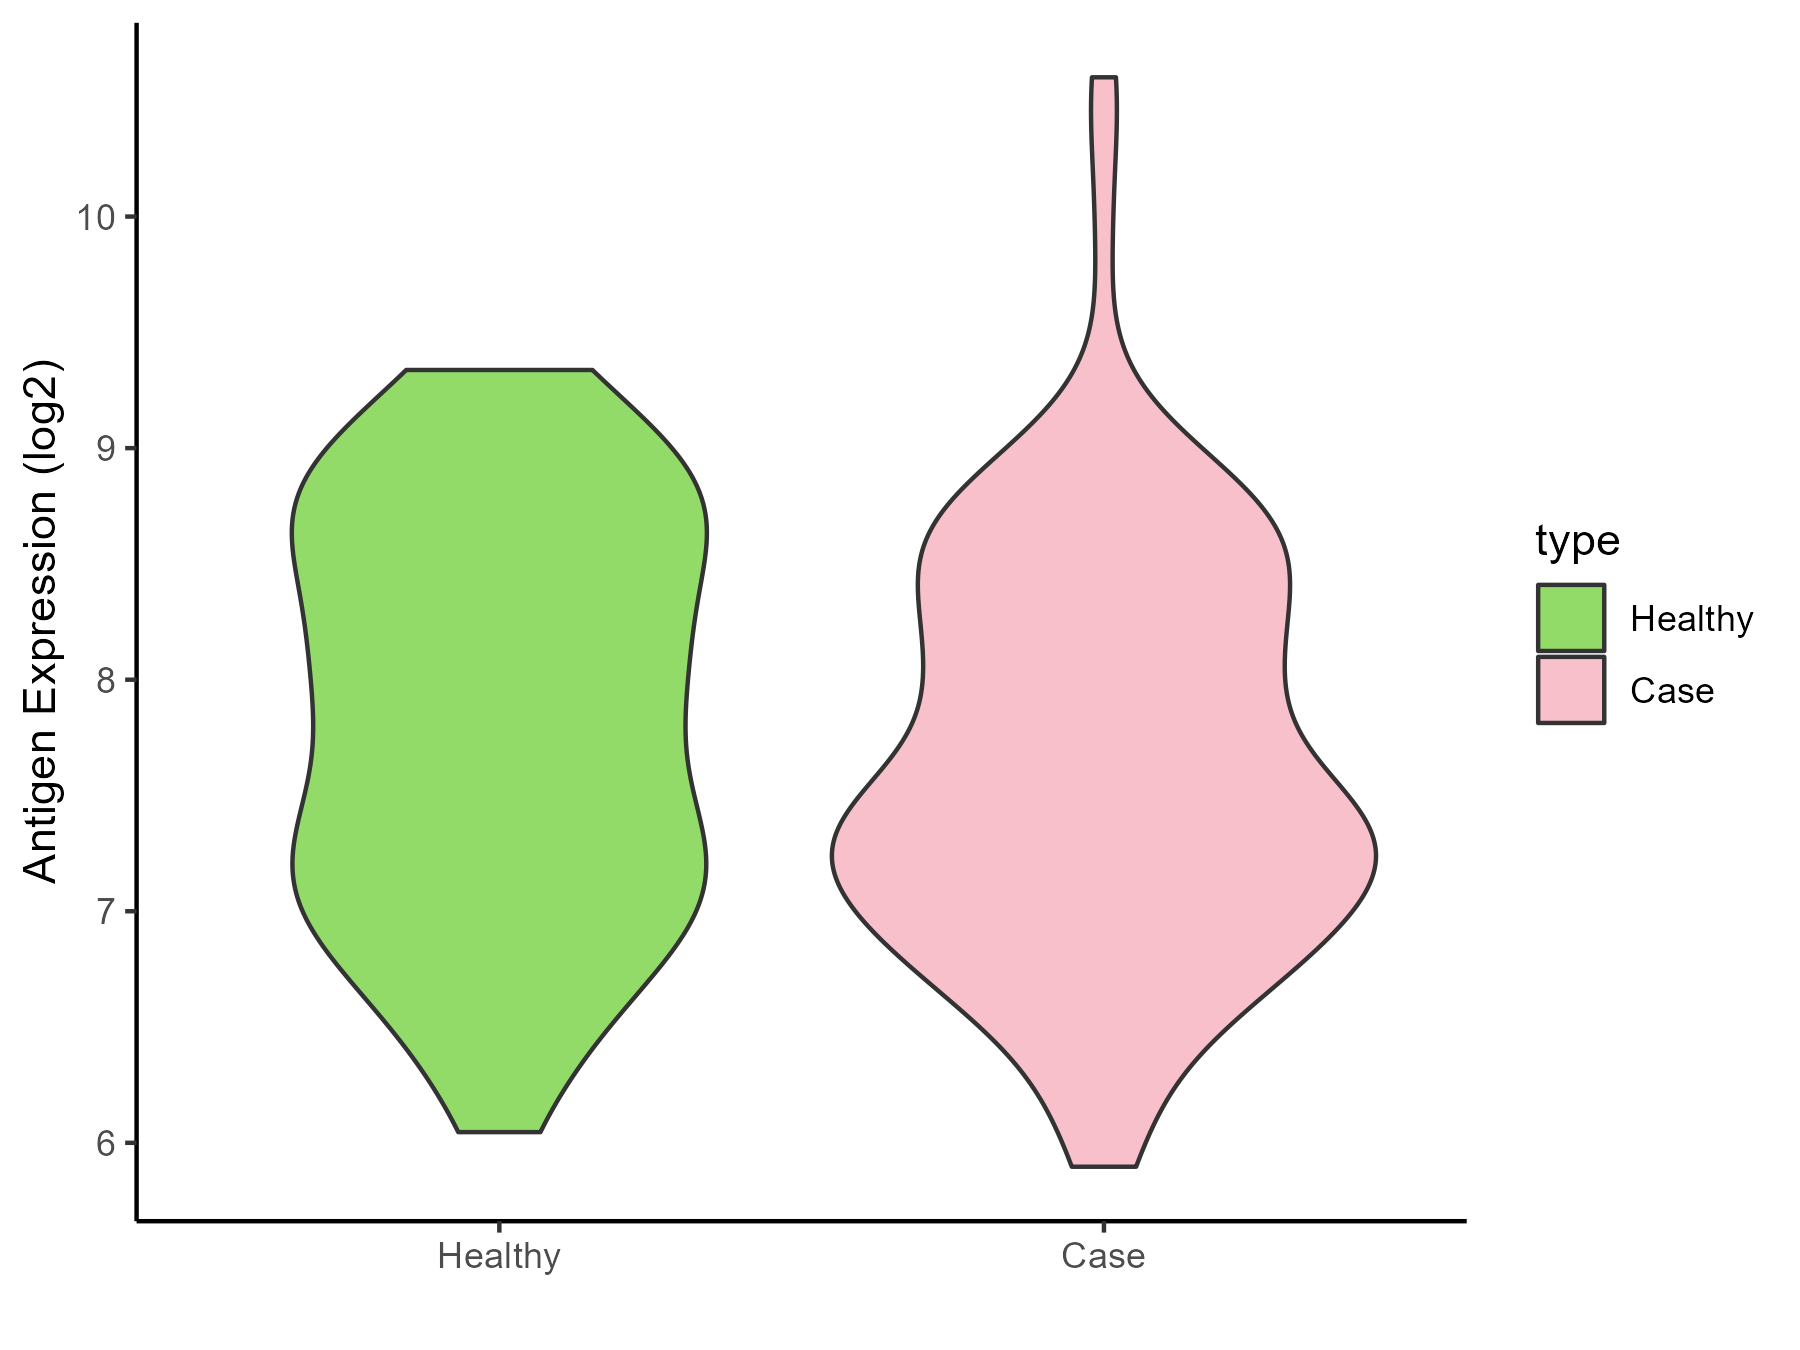
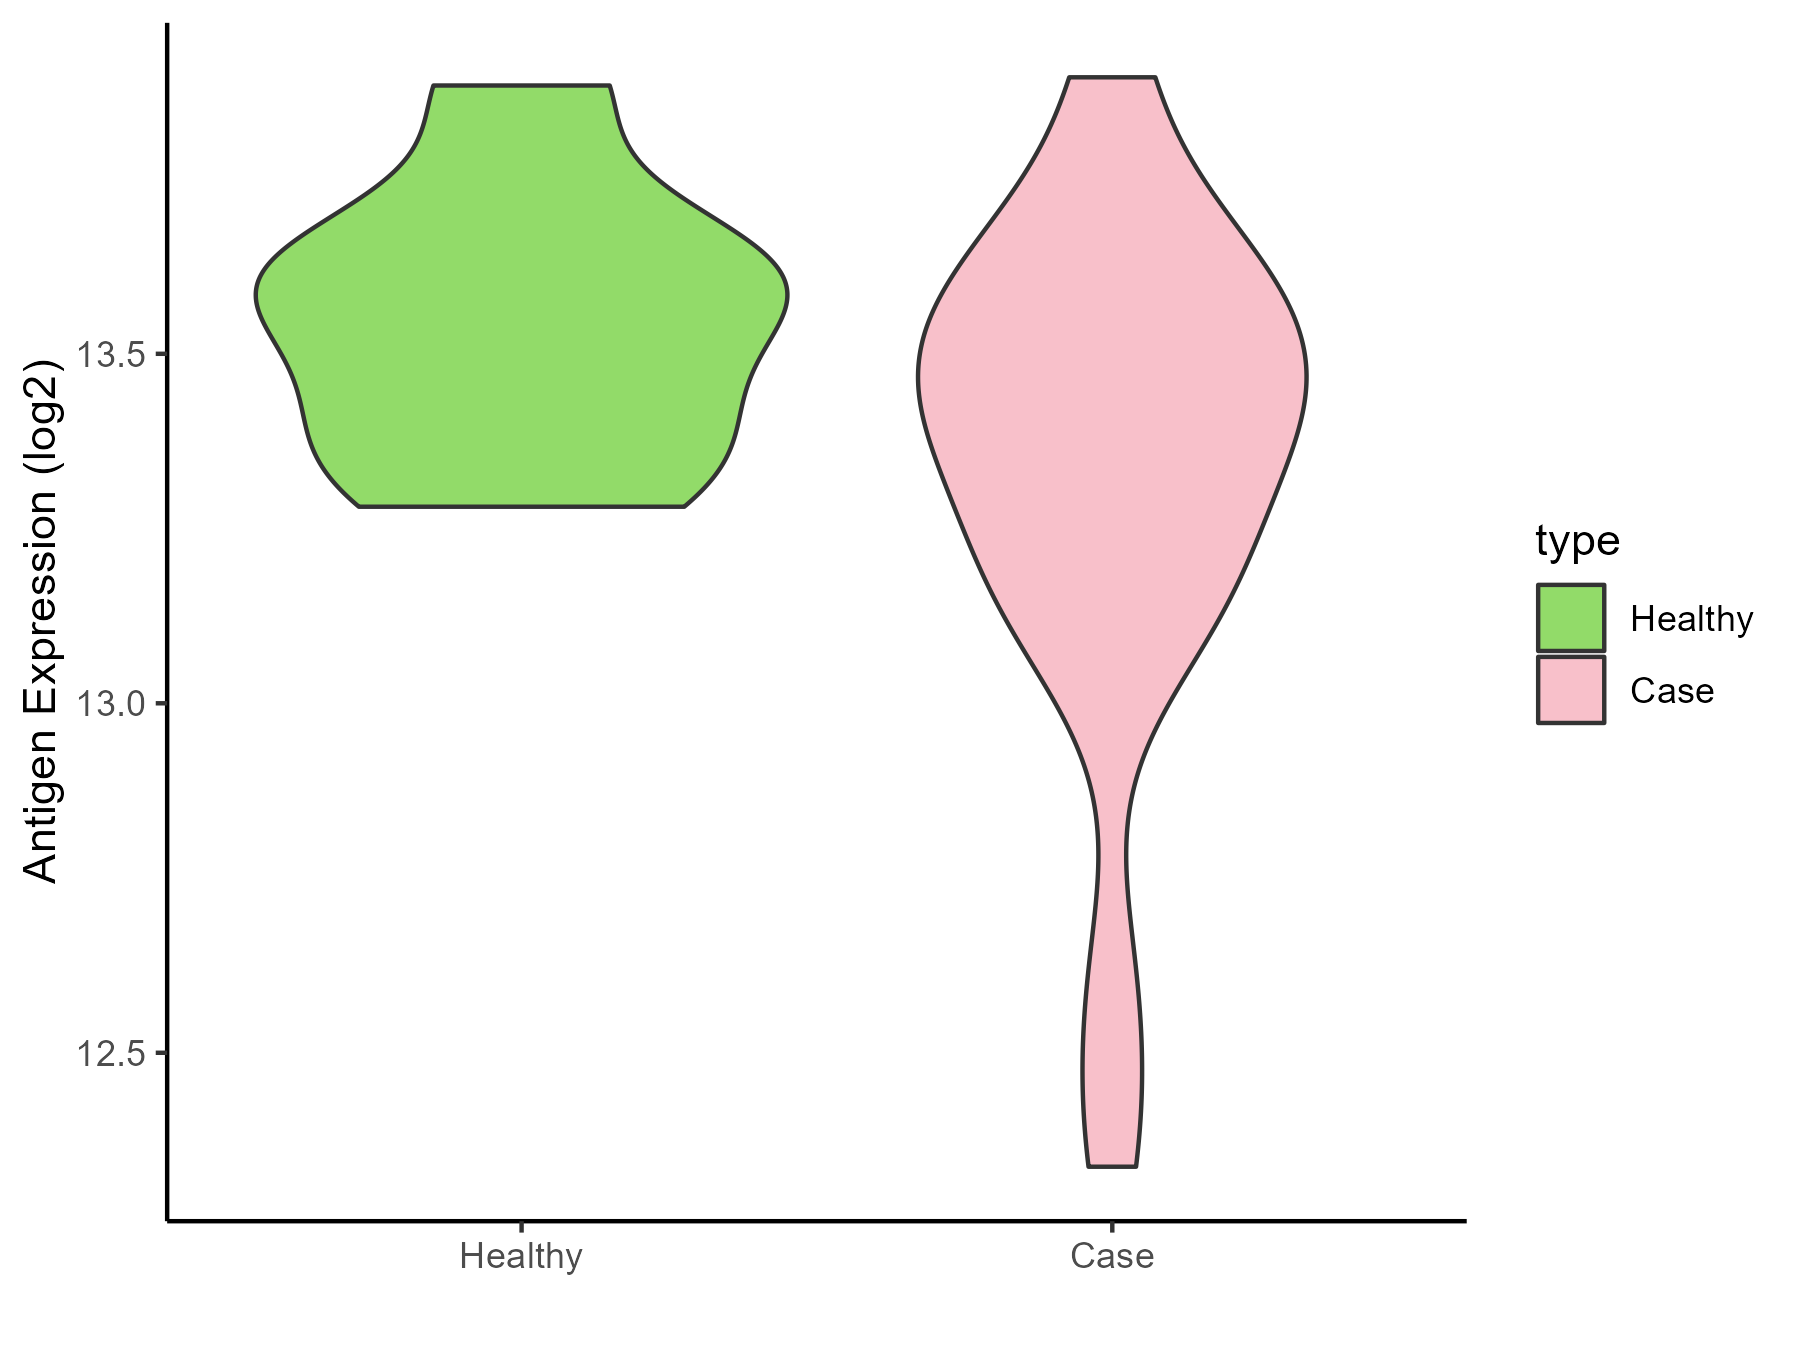
Glioma |
| The Expression Level of Disease Section Compare with the Healthy Individual Tissue |
p-value: 0.57255068;
Fold-change: -0.06792481;
Z-score: -0.079213841
|
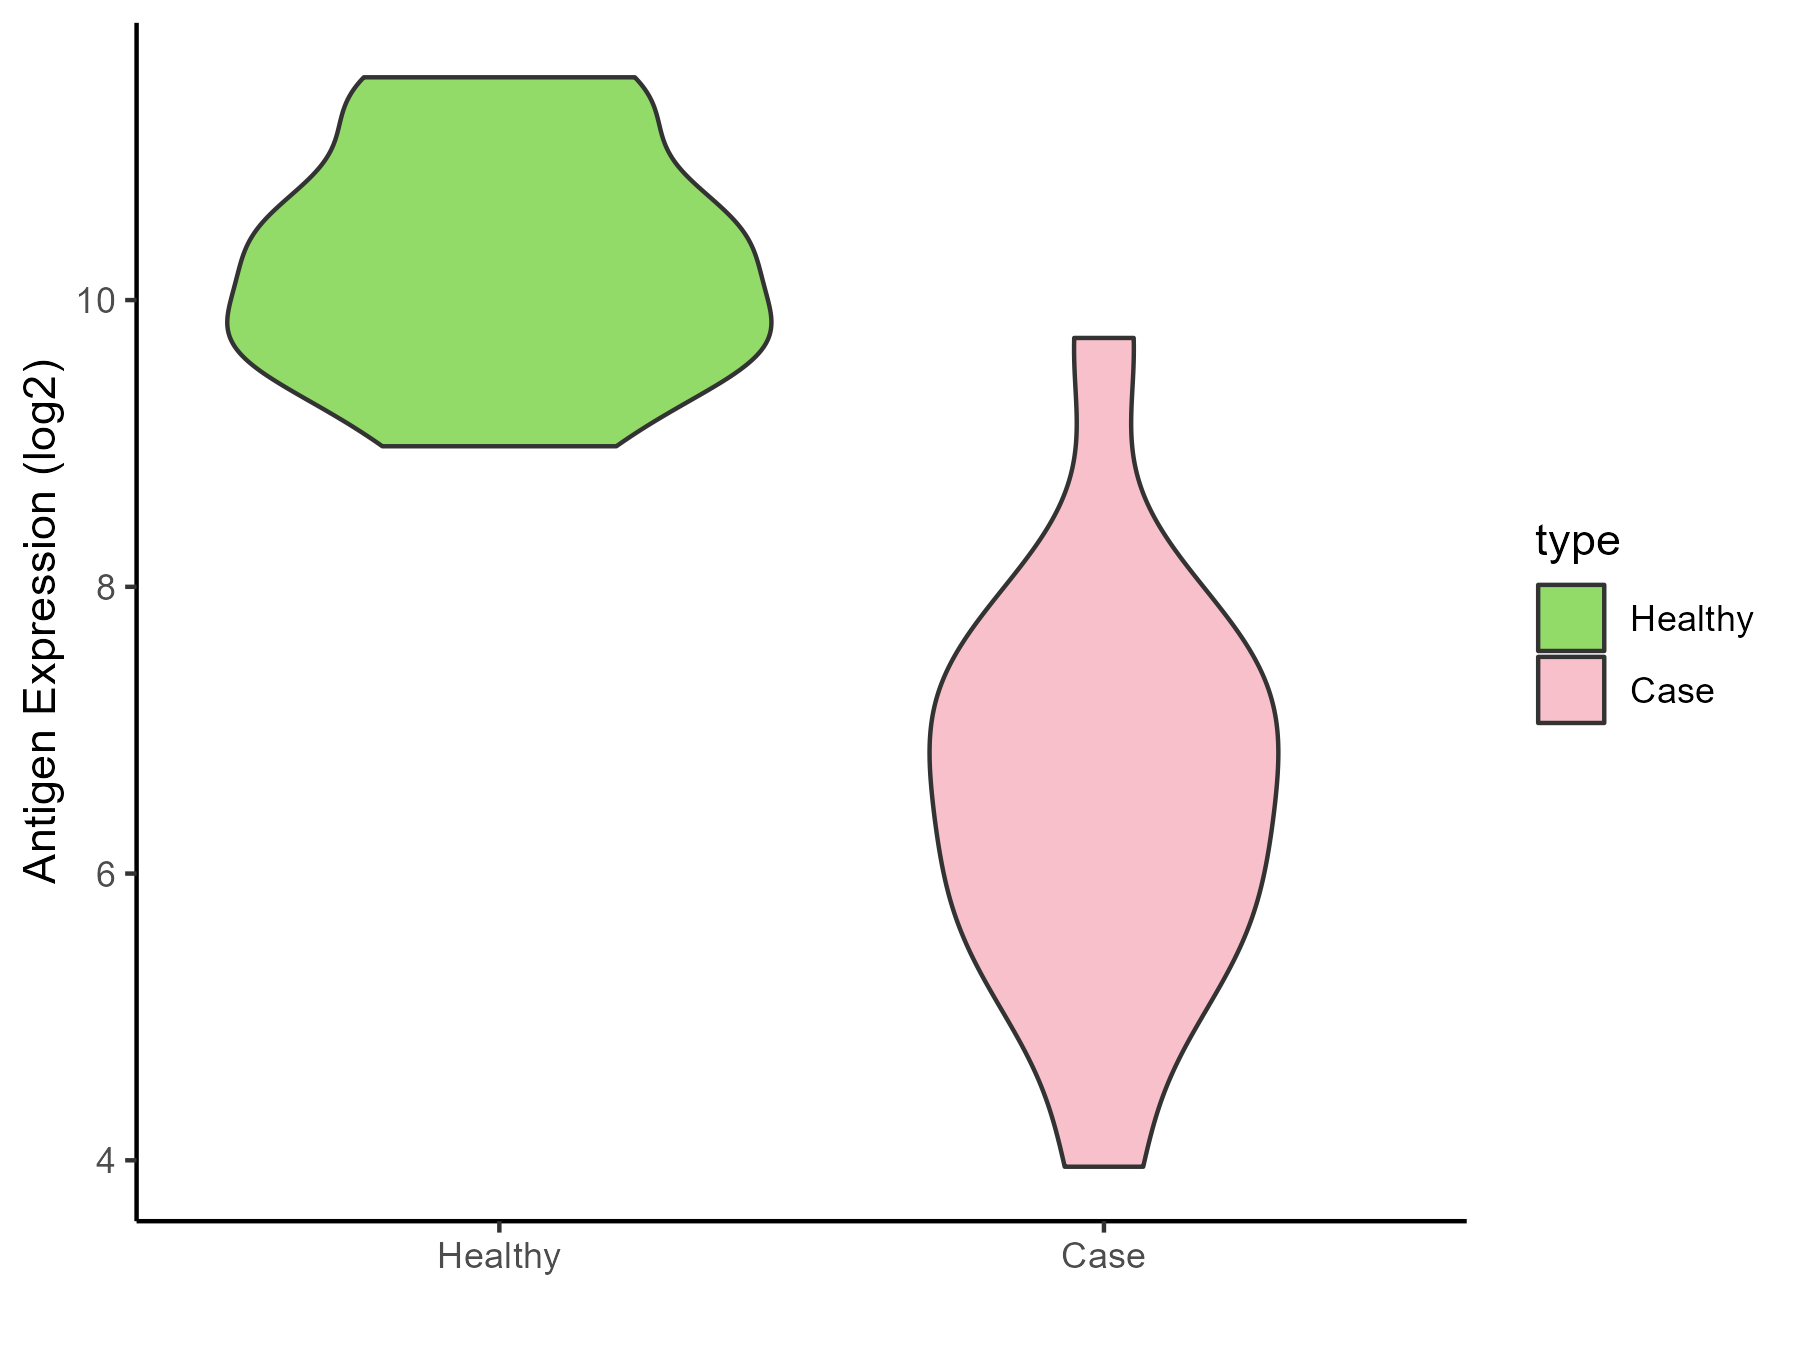
| Disease-specific Antigen Abundances |
|
Click to View the Clearer Original Diagram
|
|
|
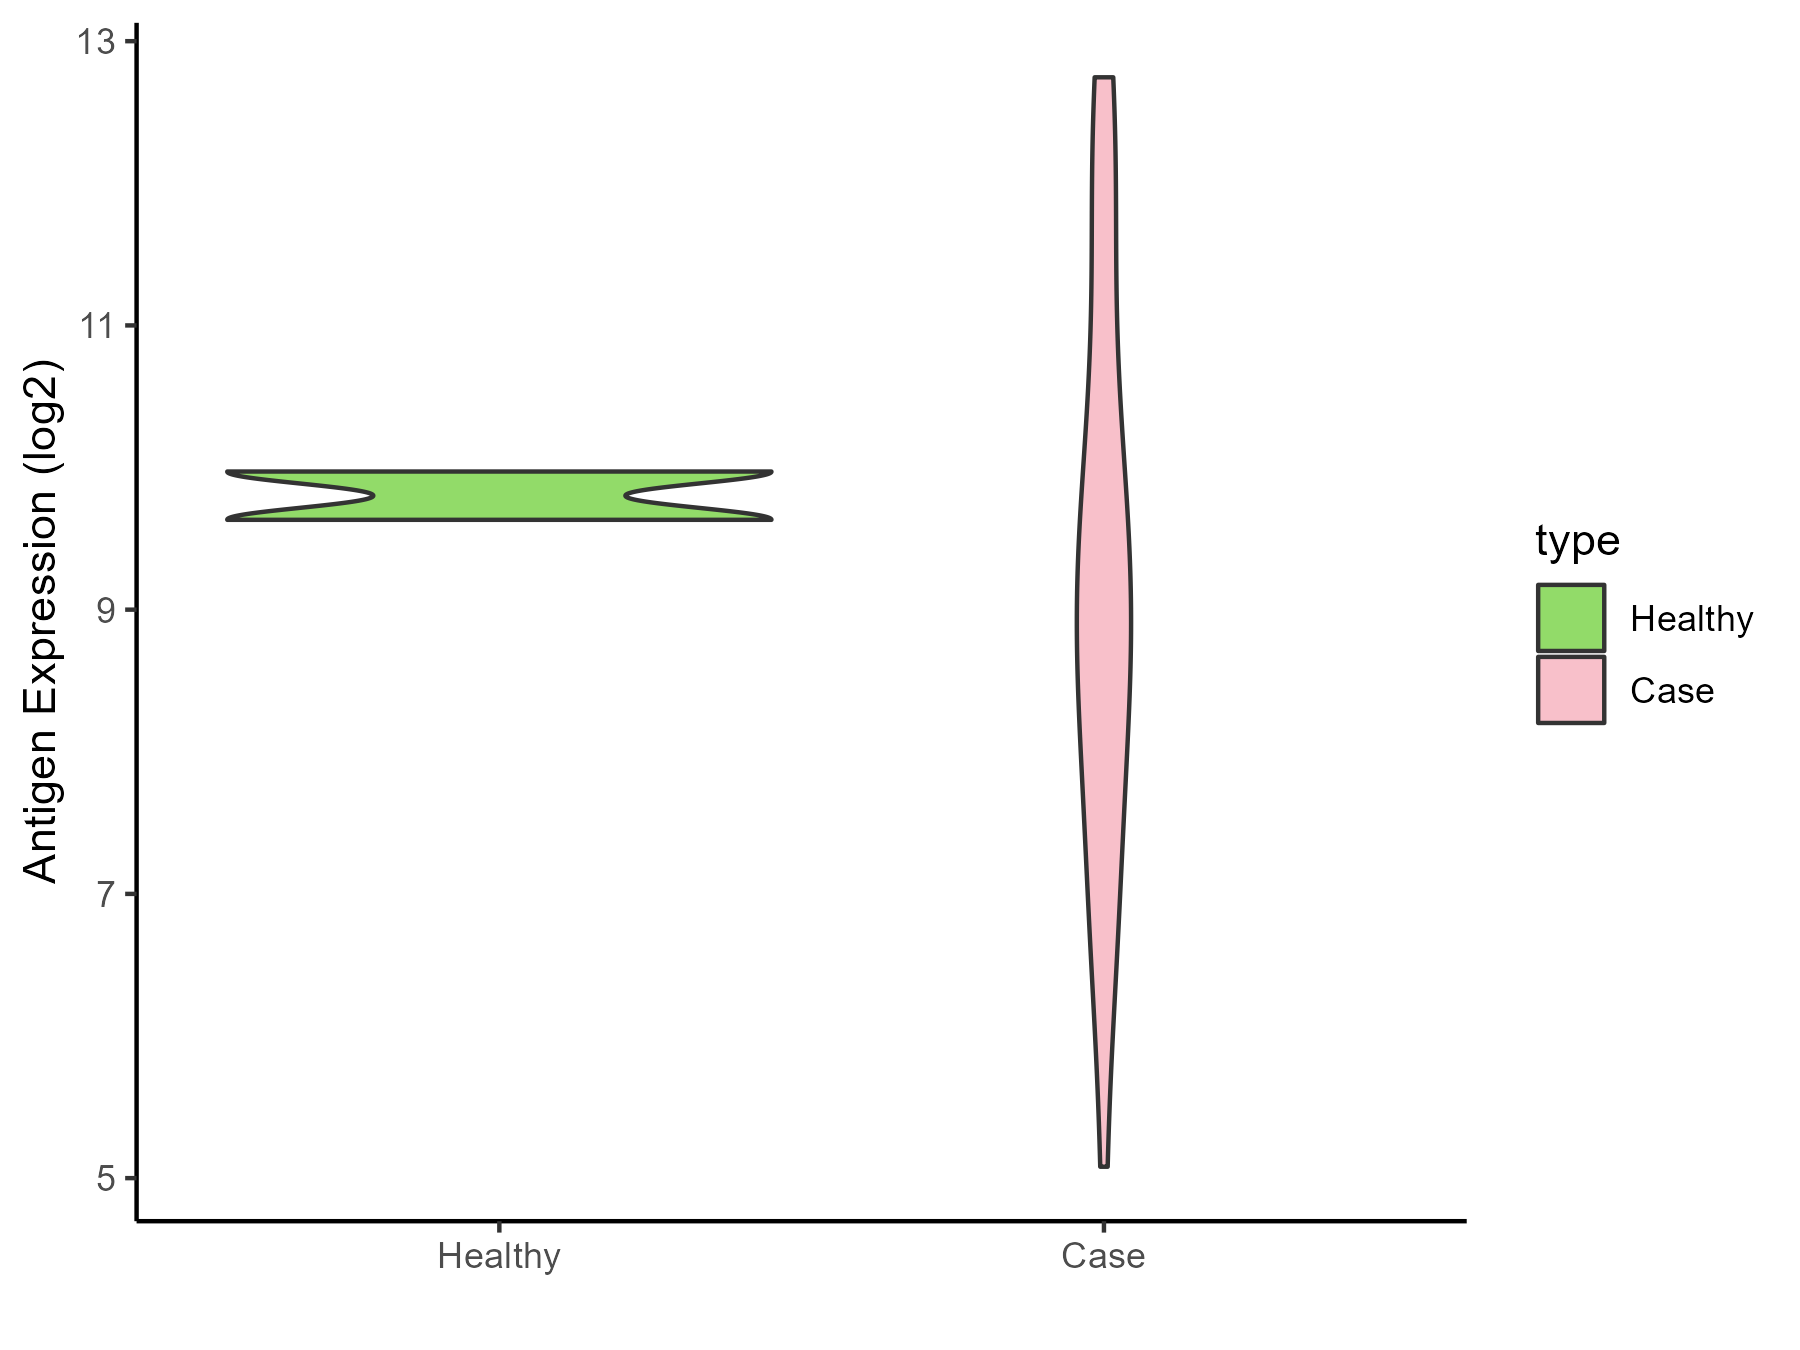
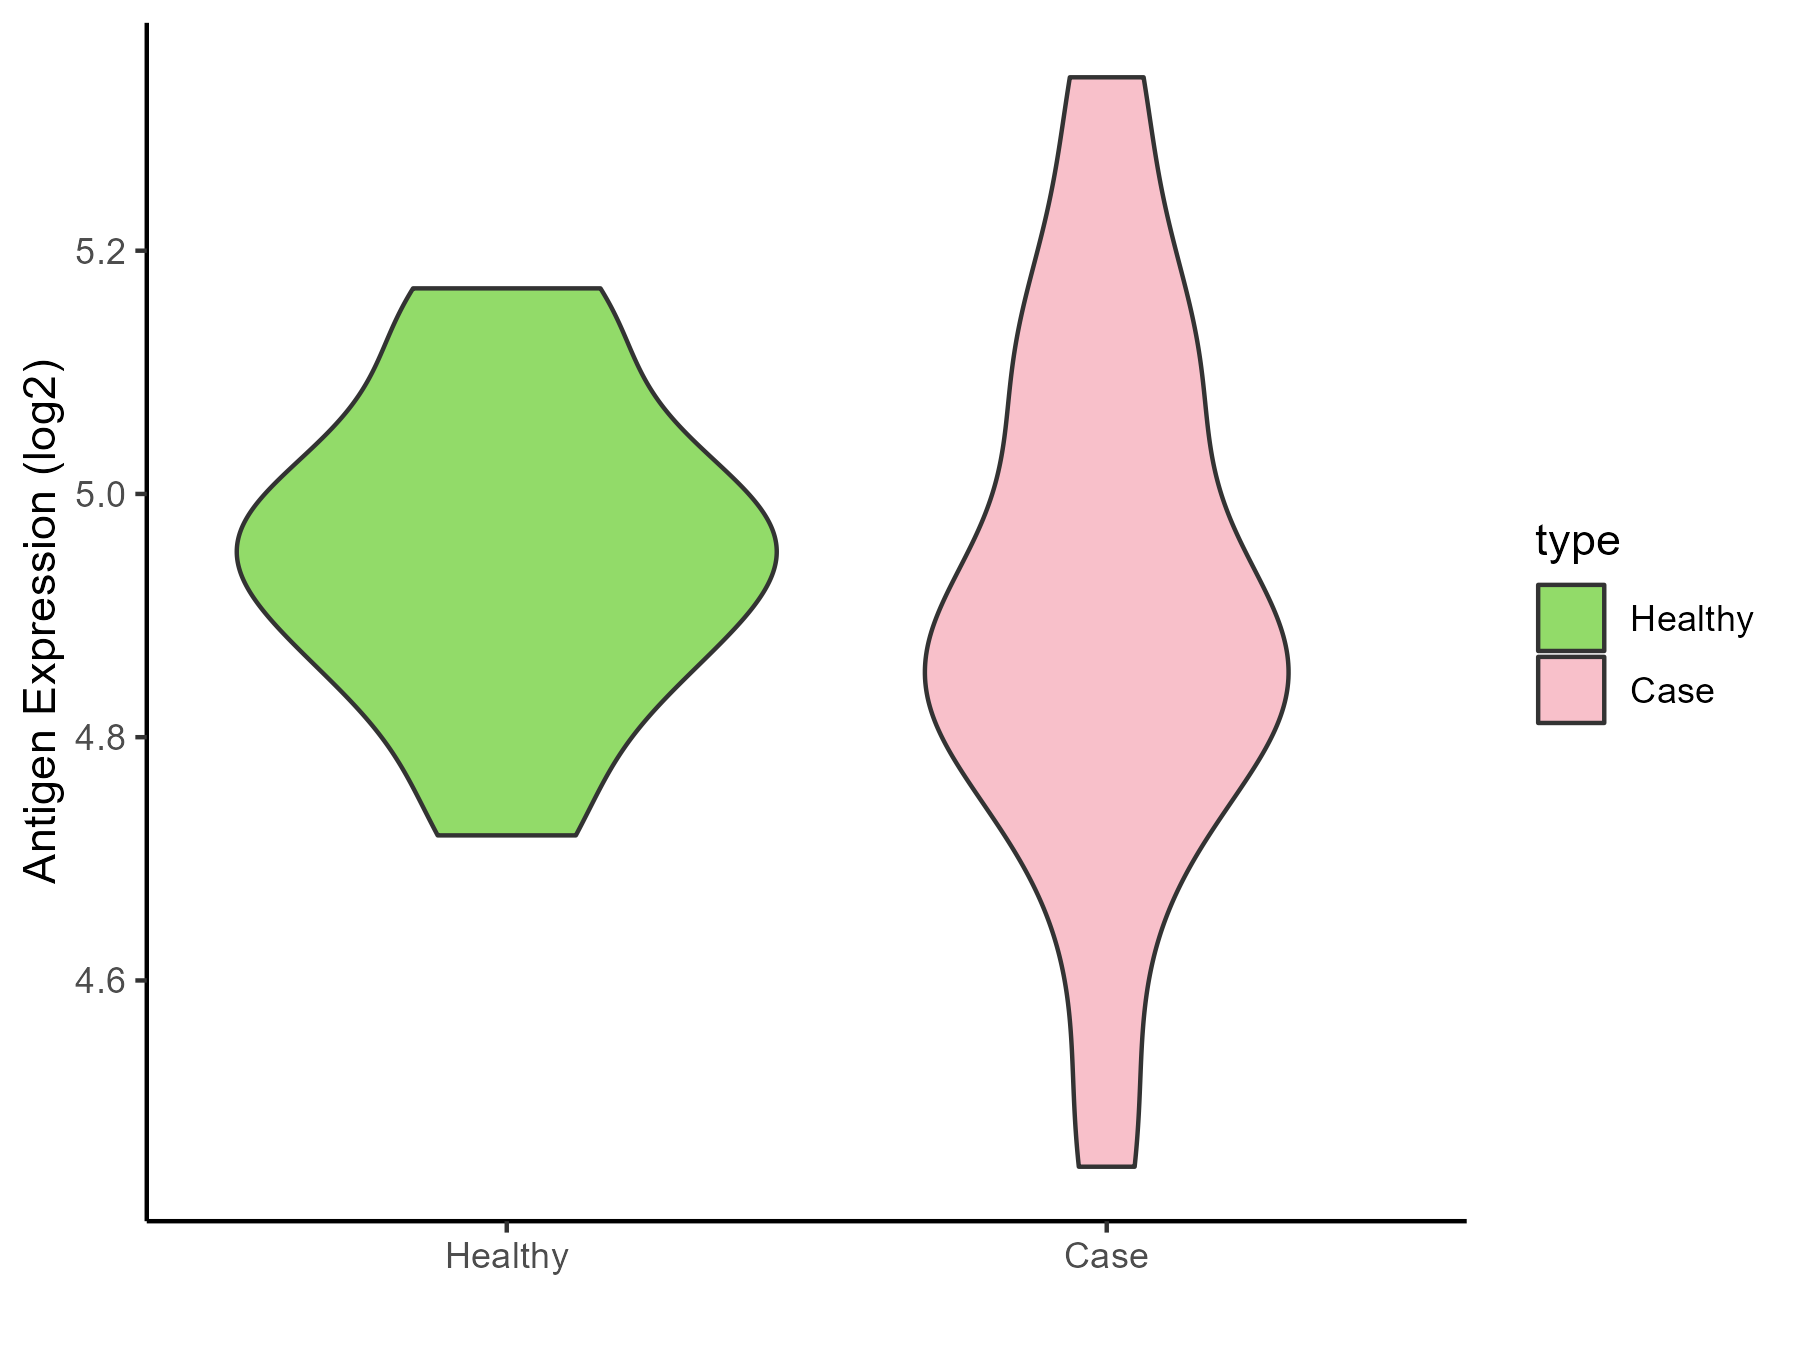
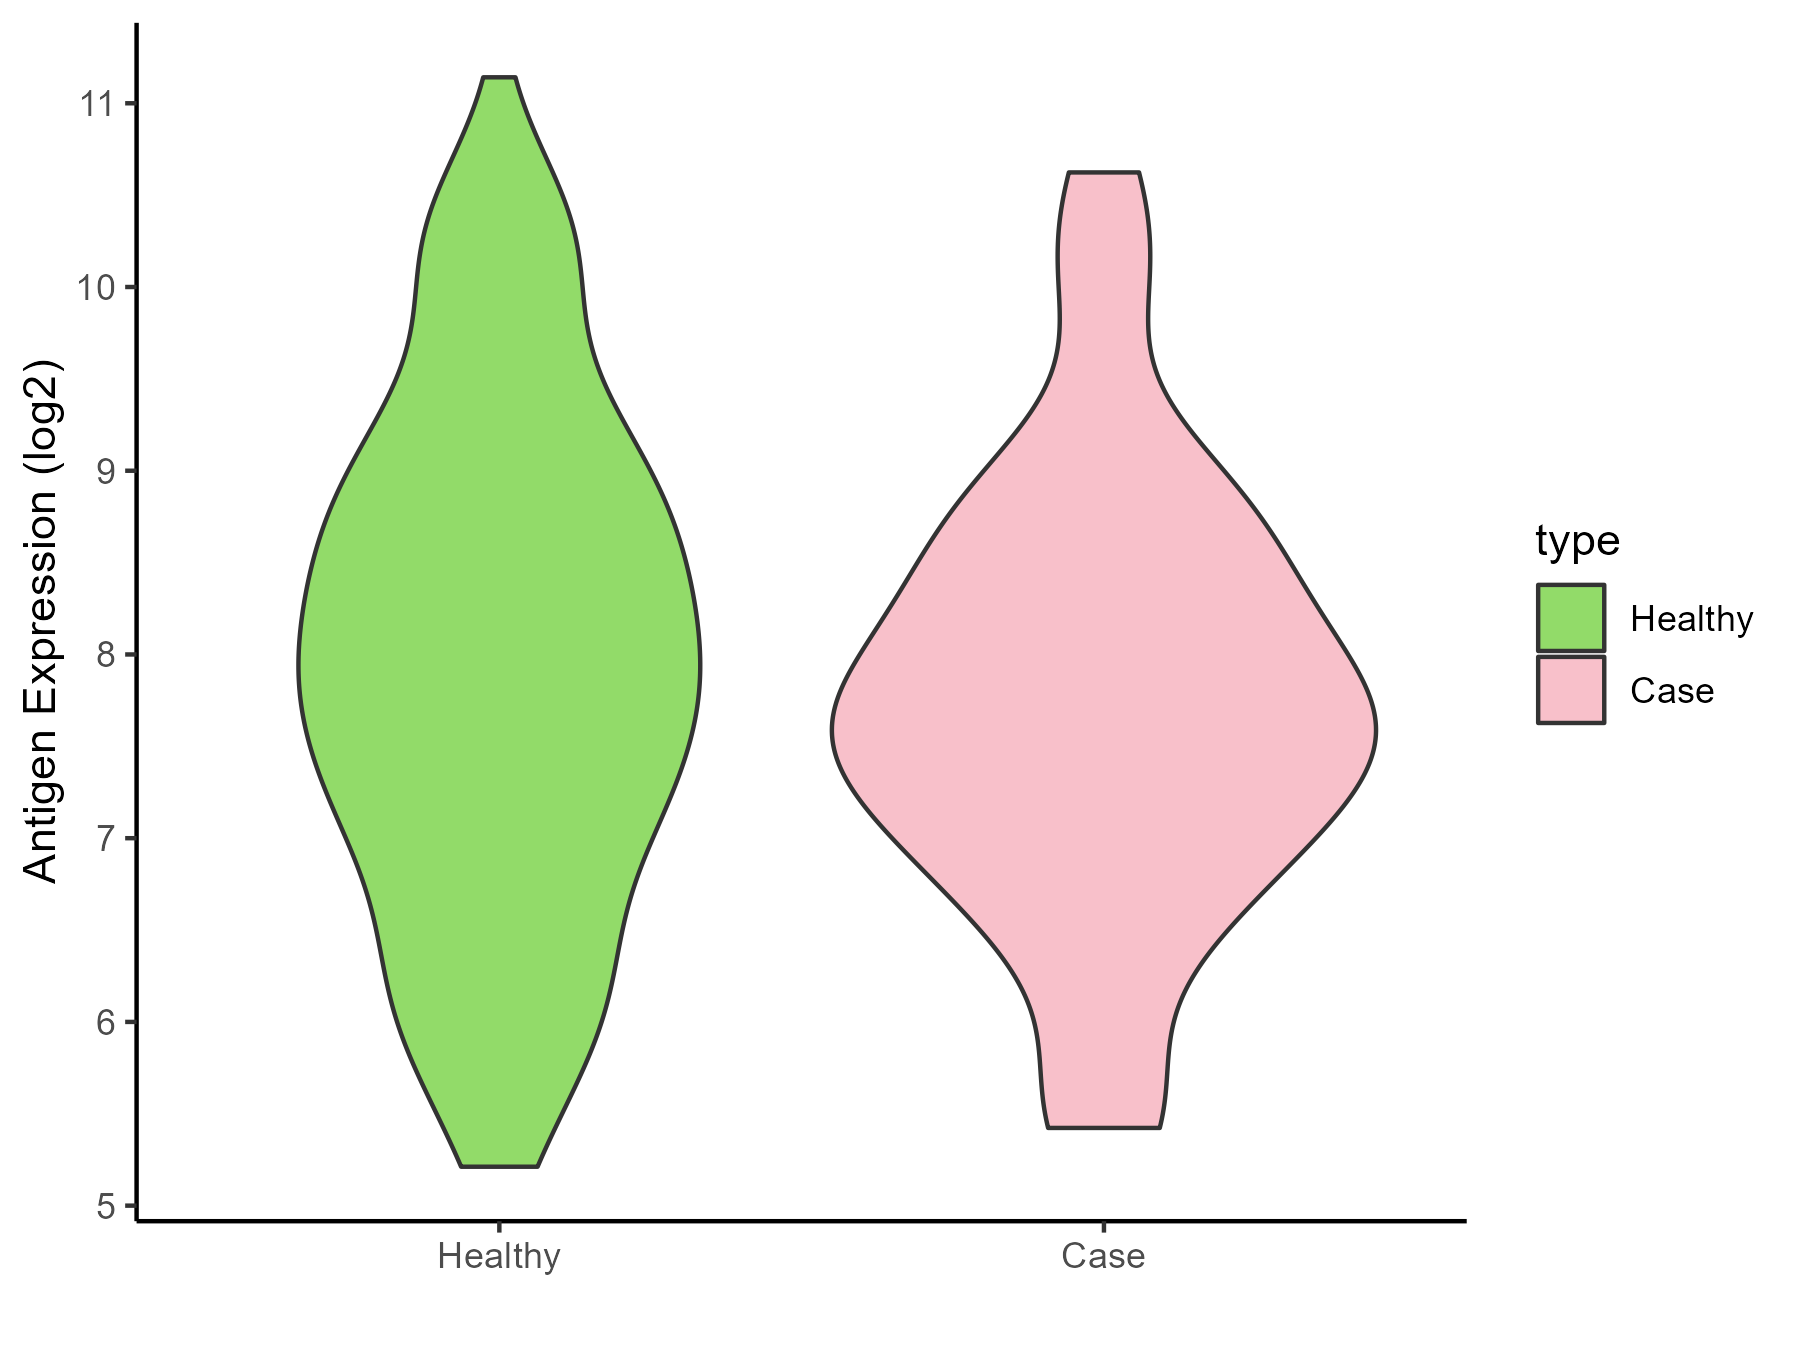
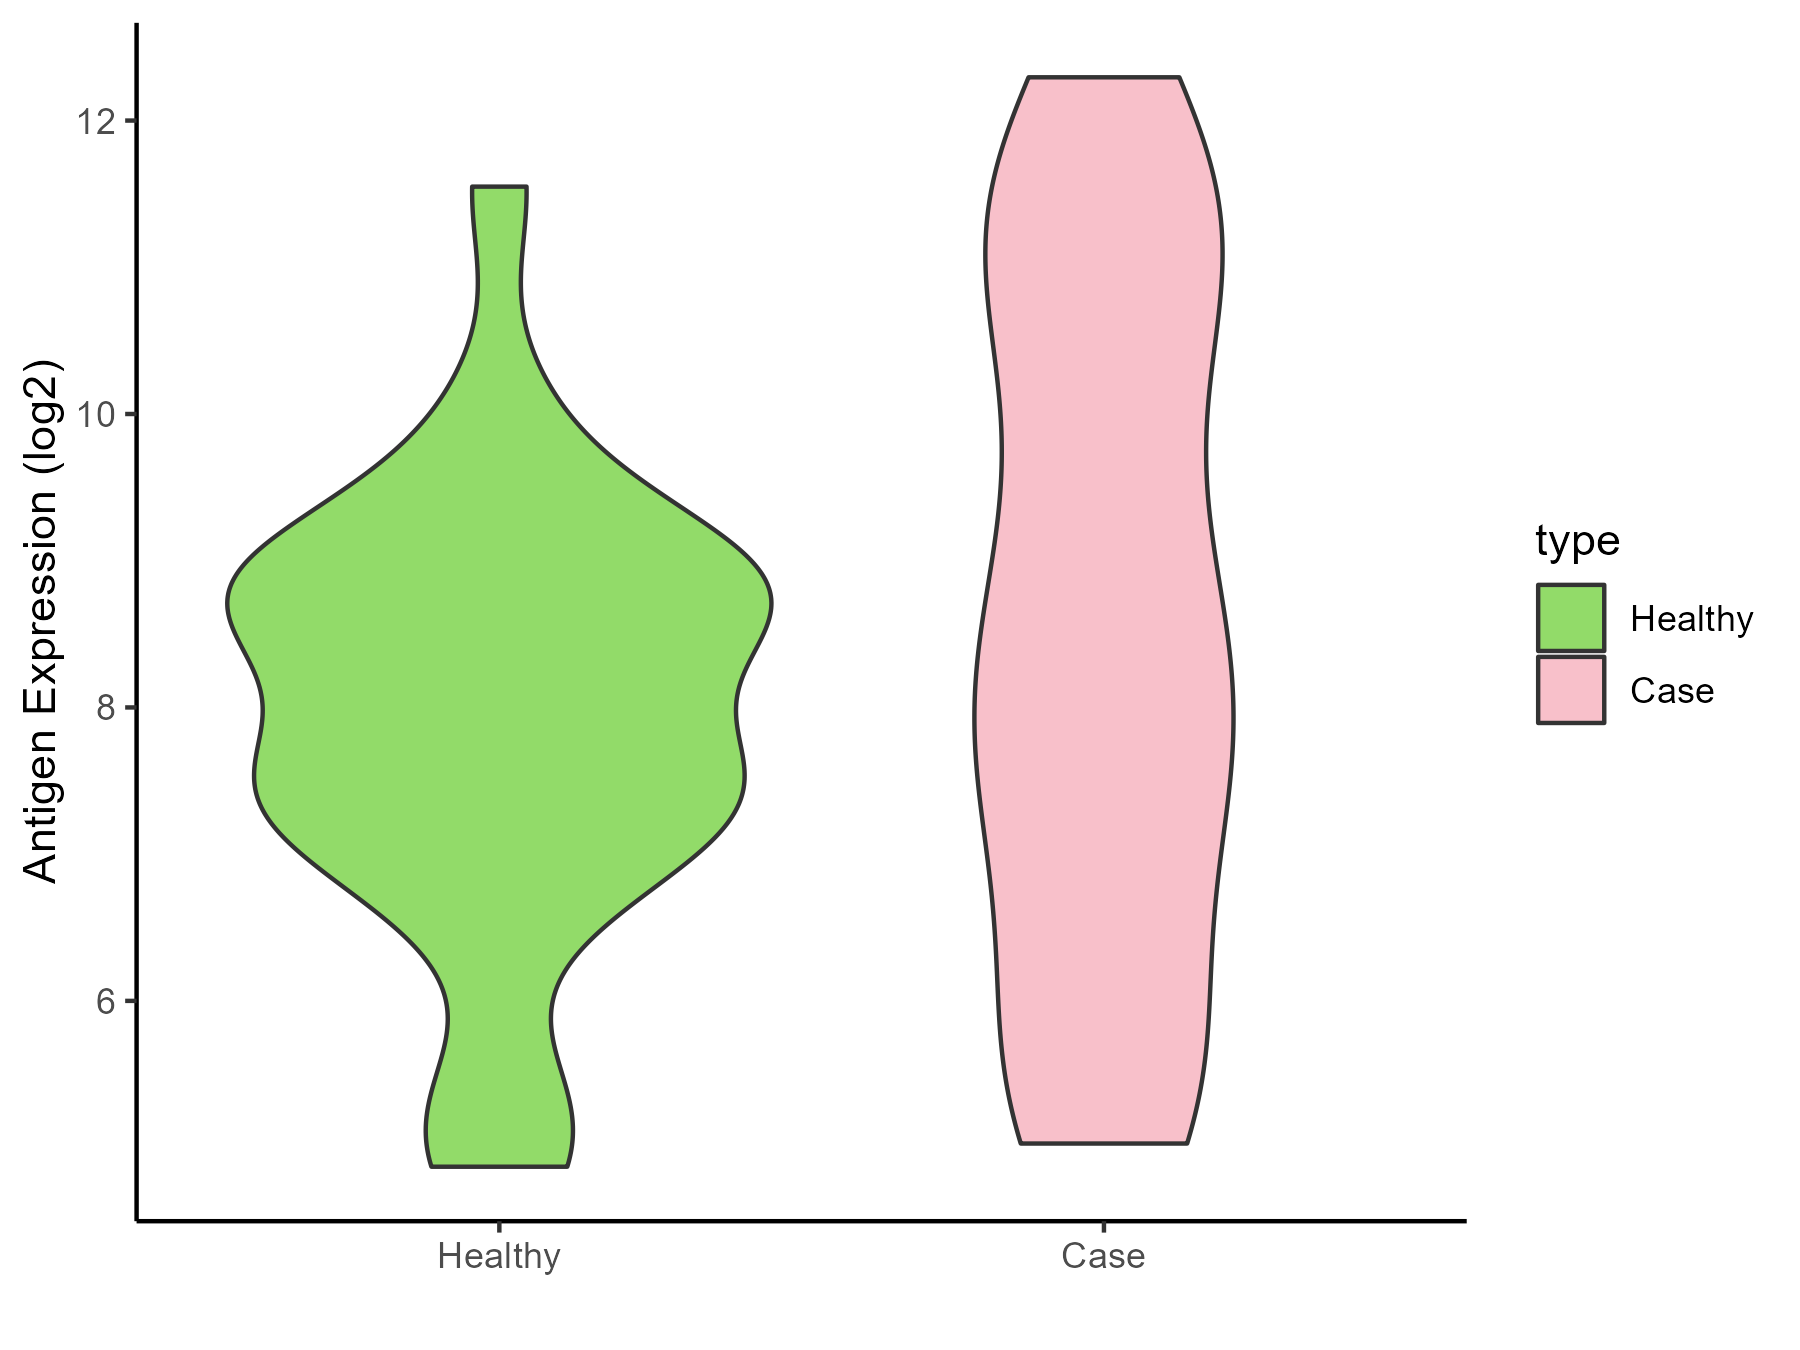
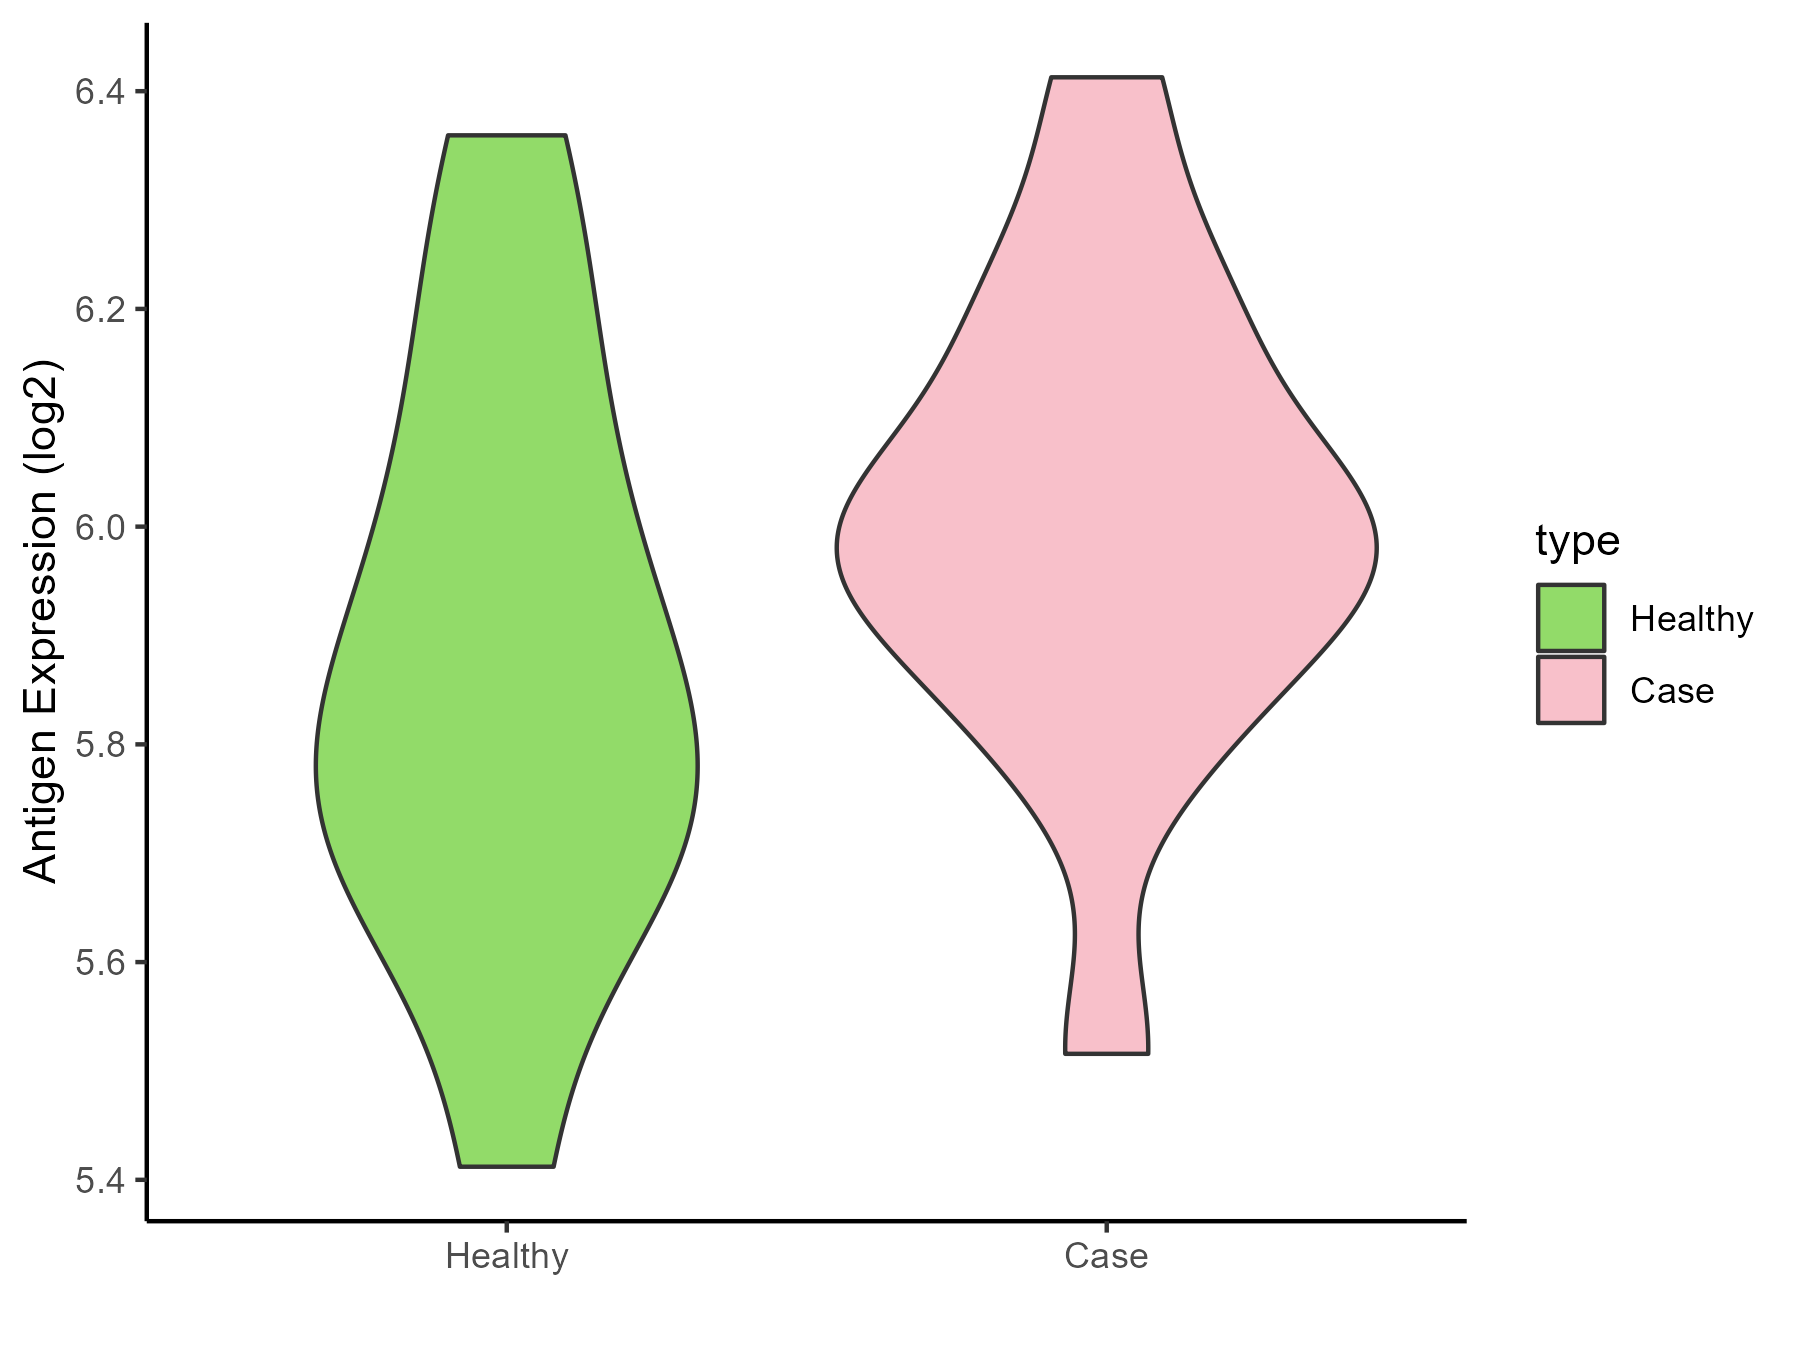
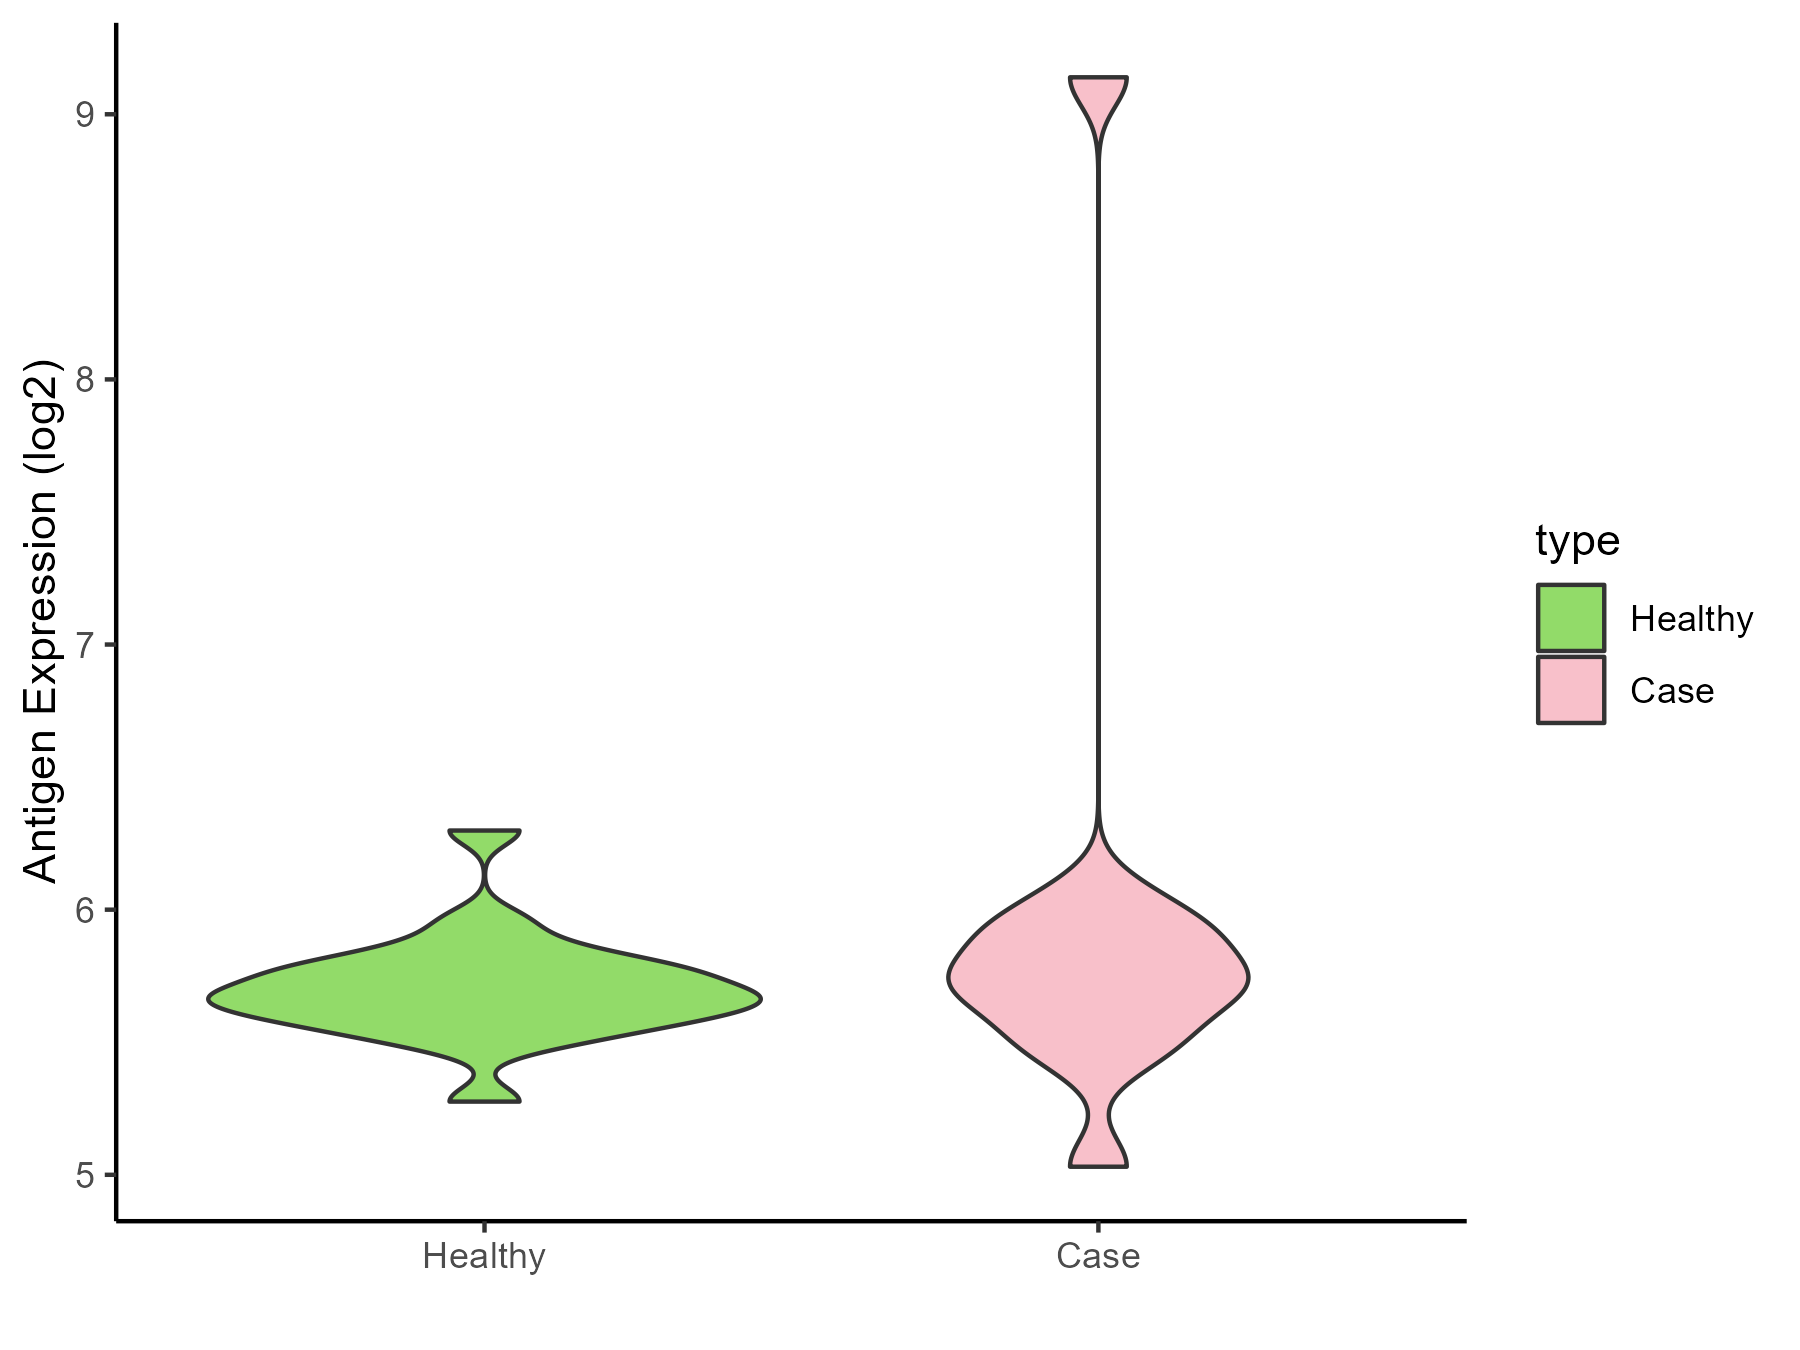
| The Studied Tissue |
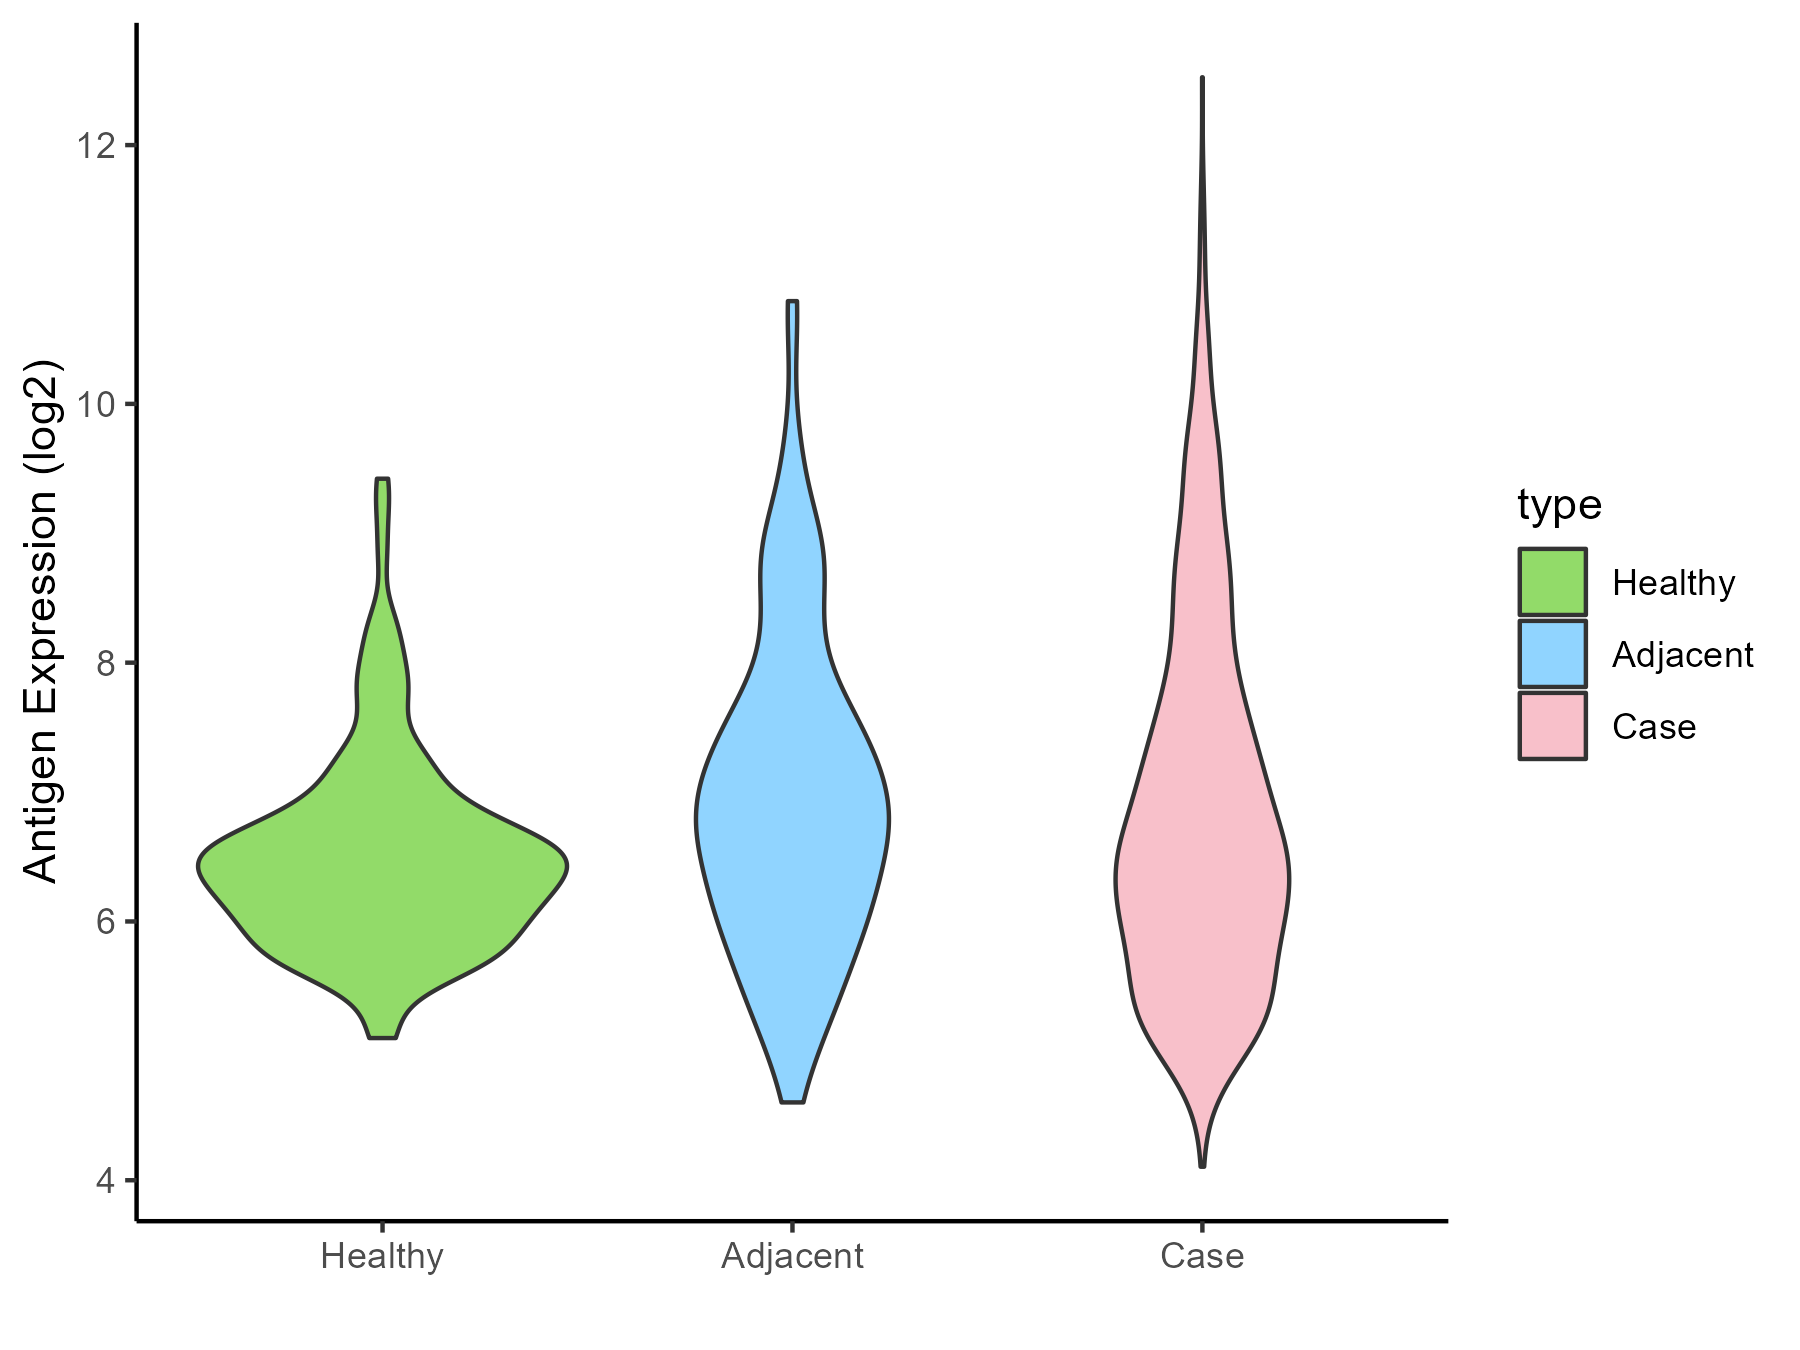
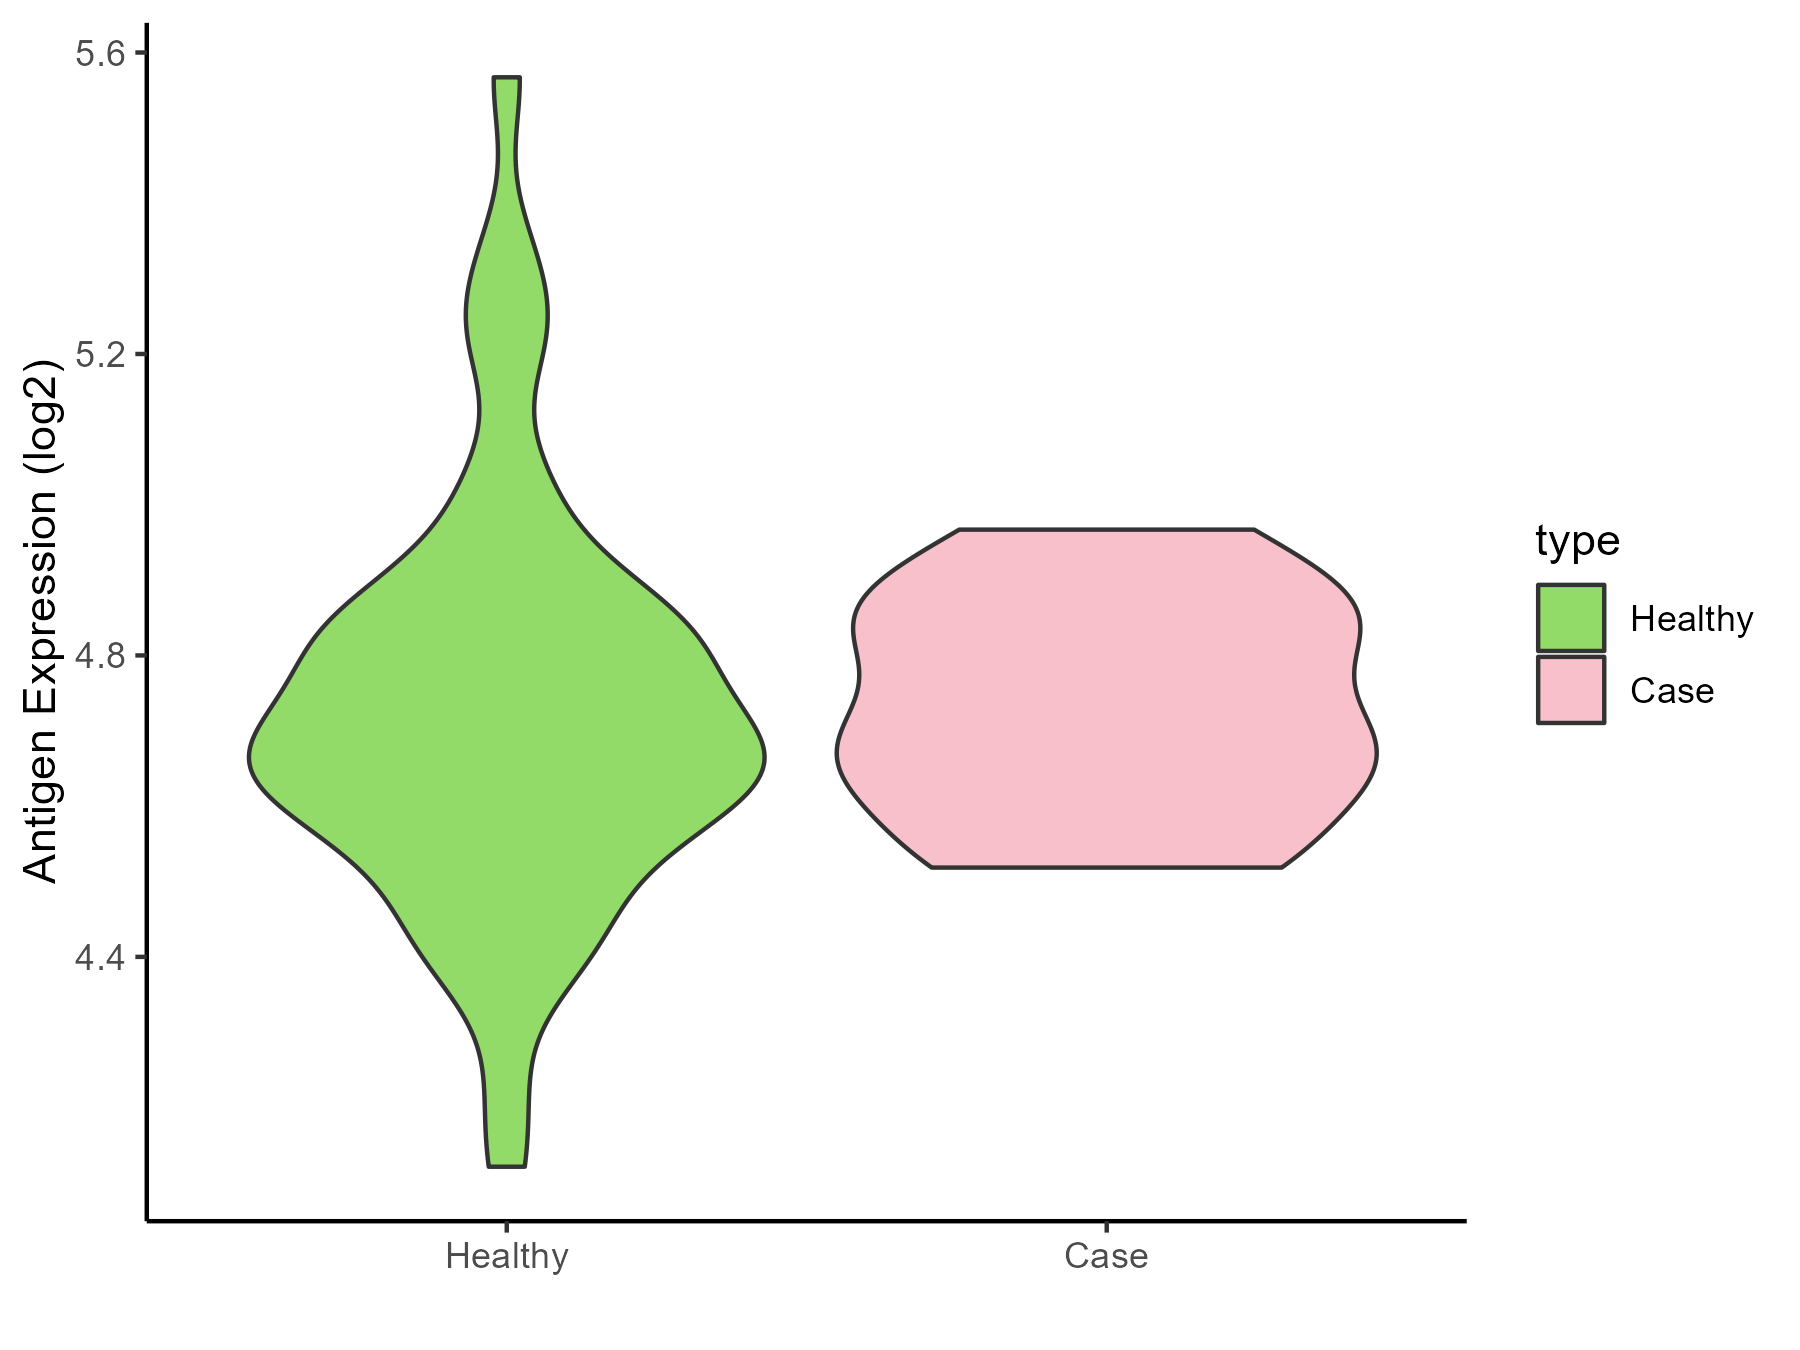
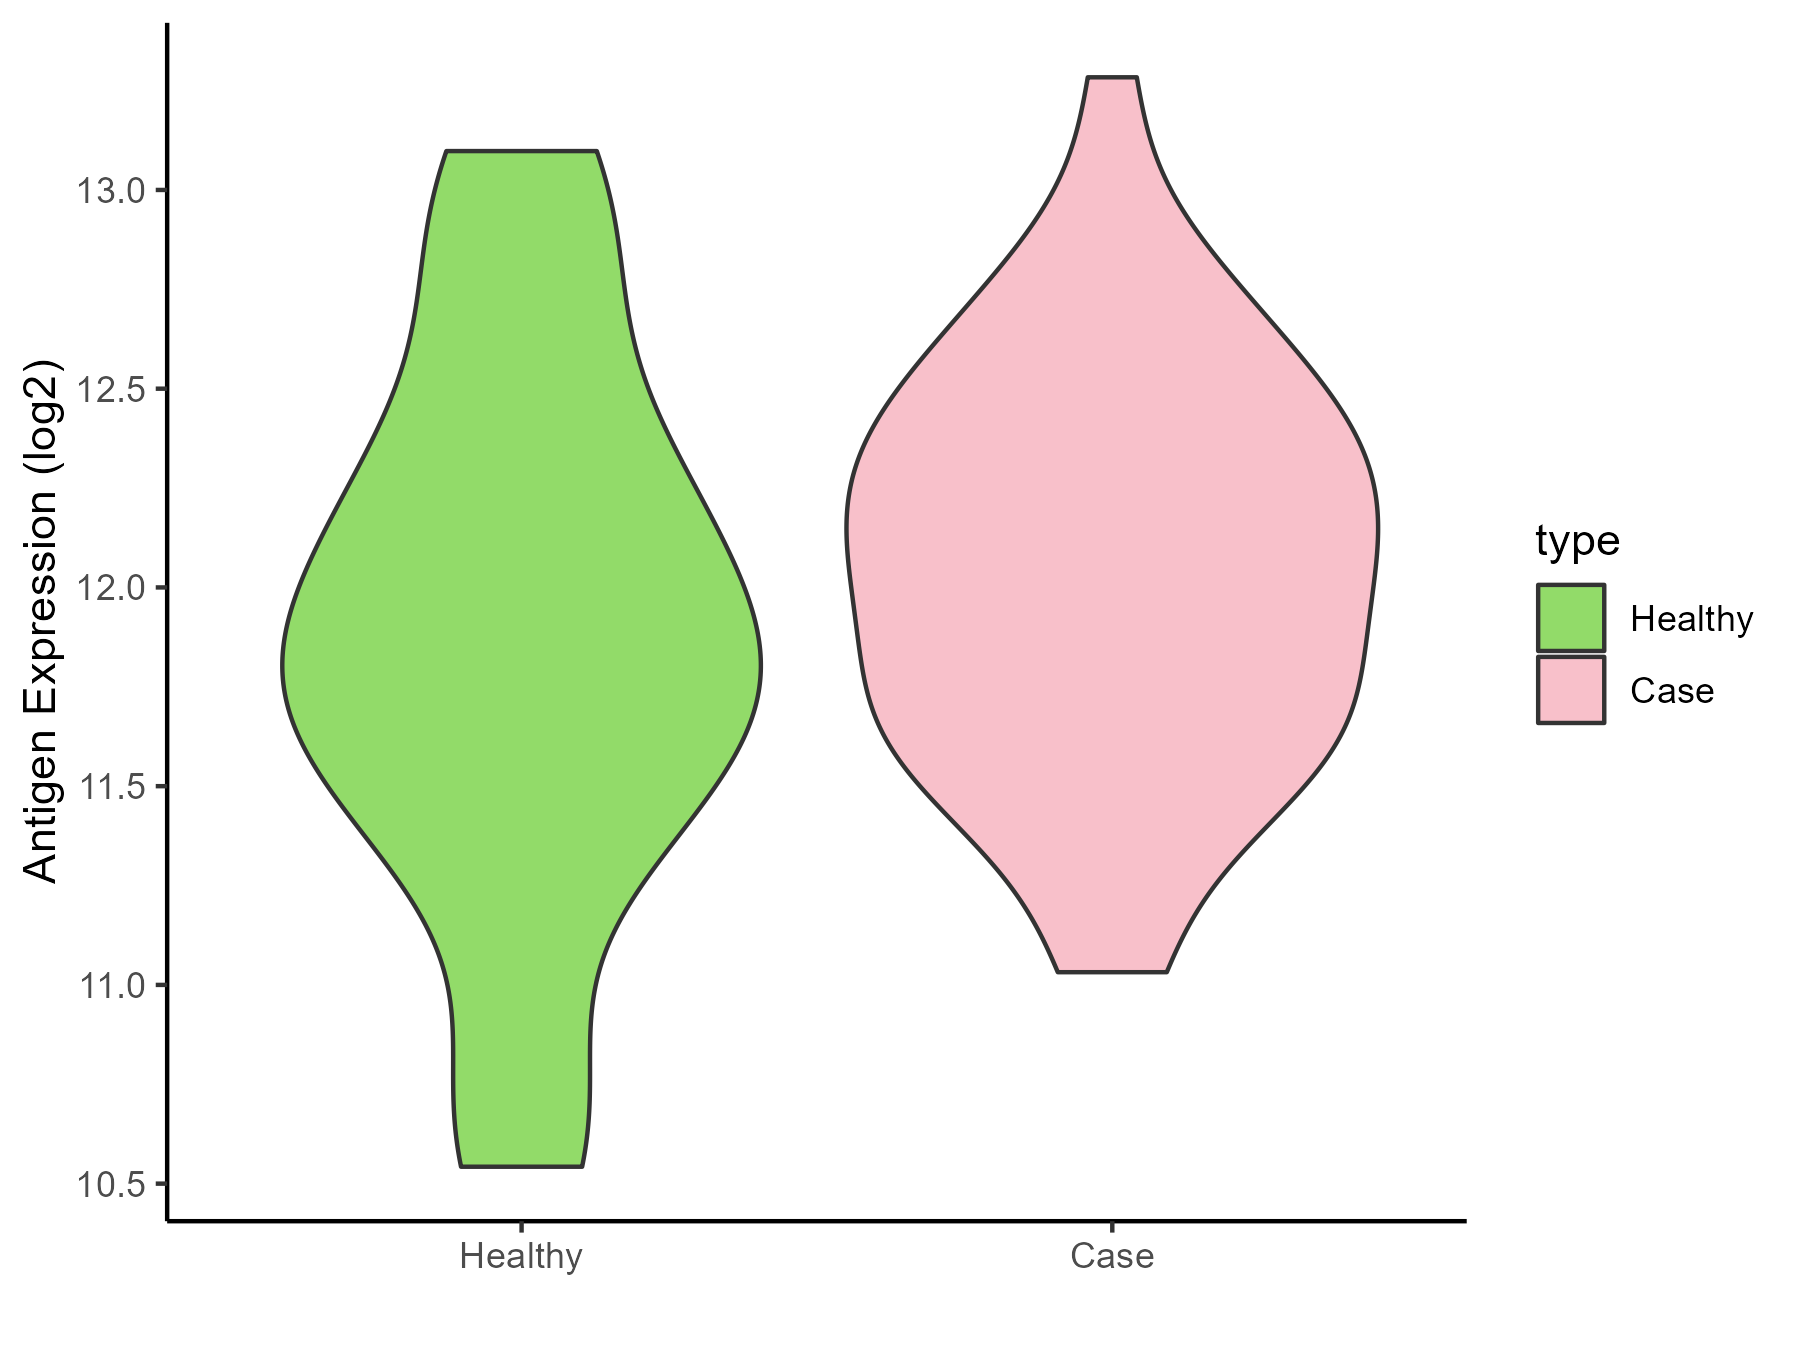
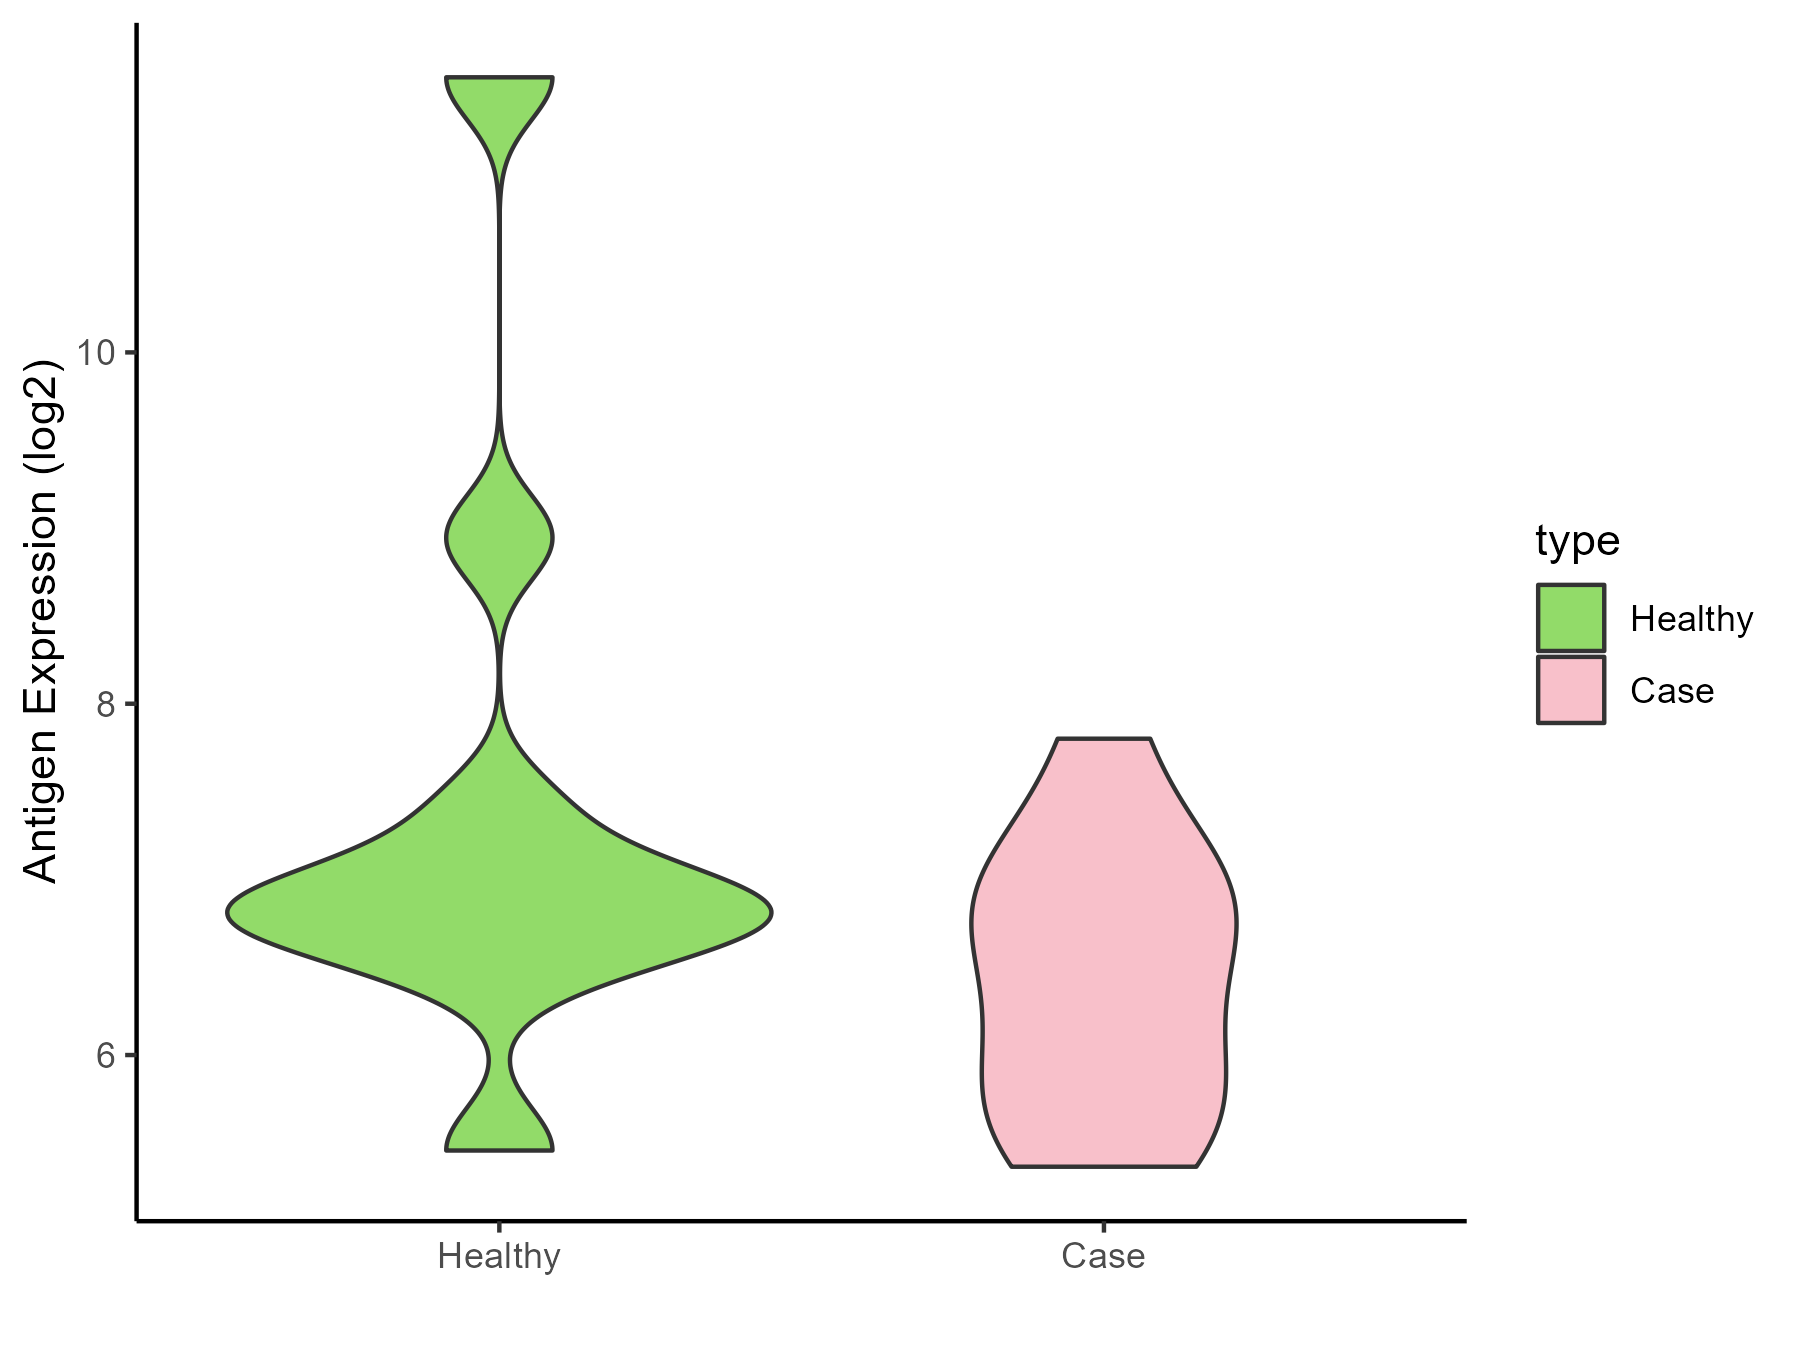
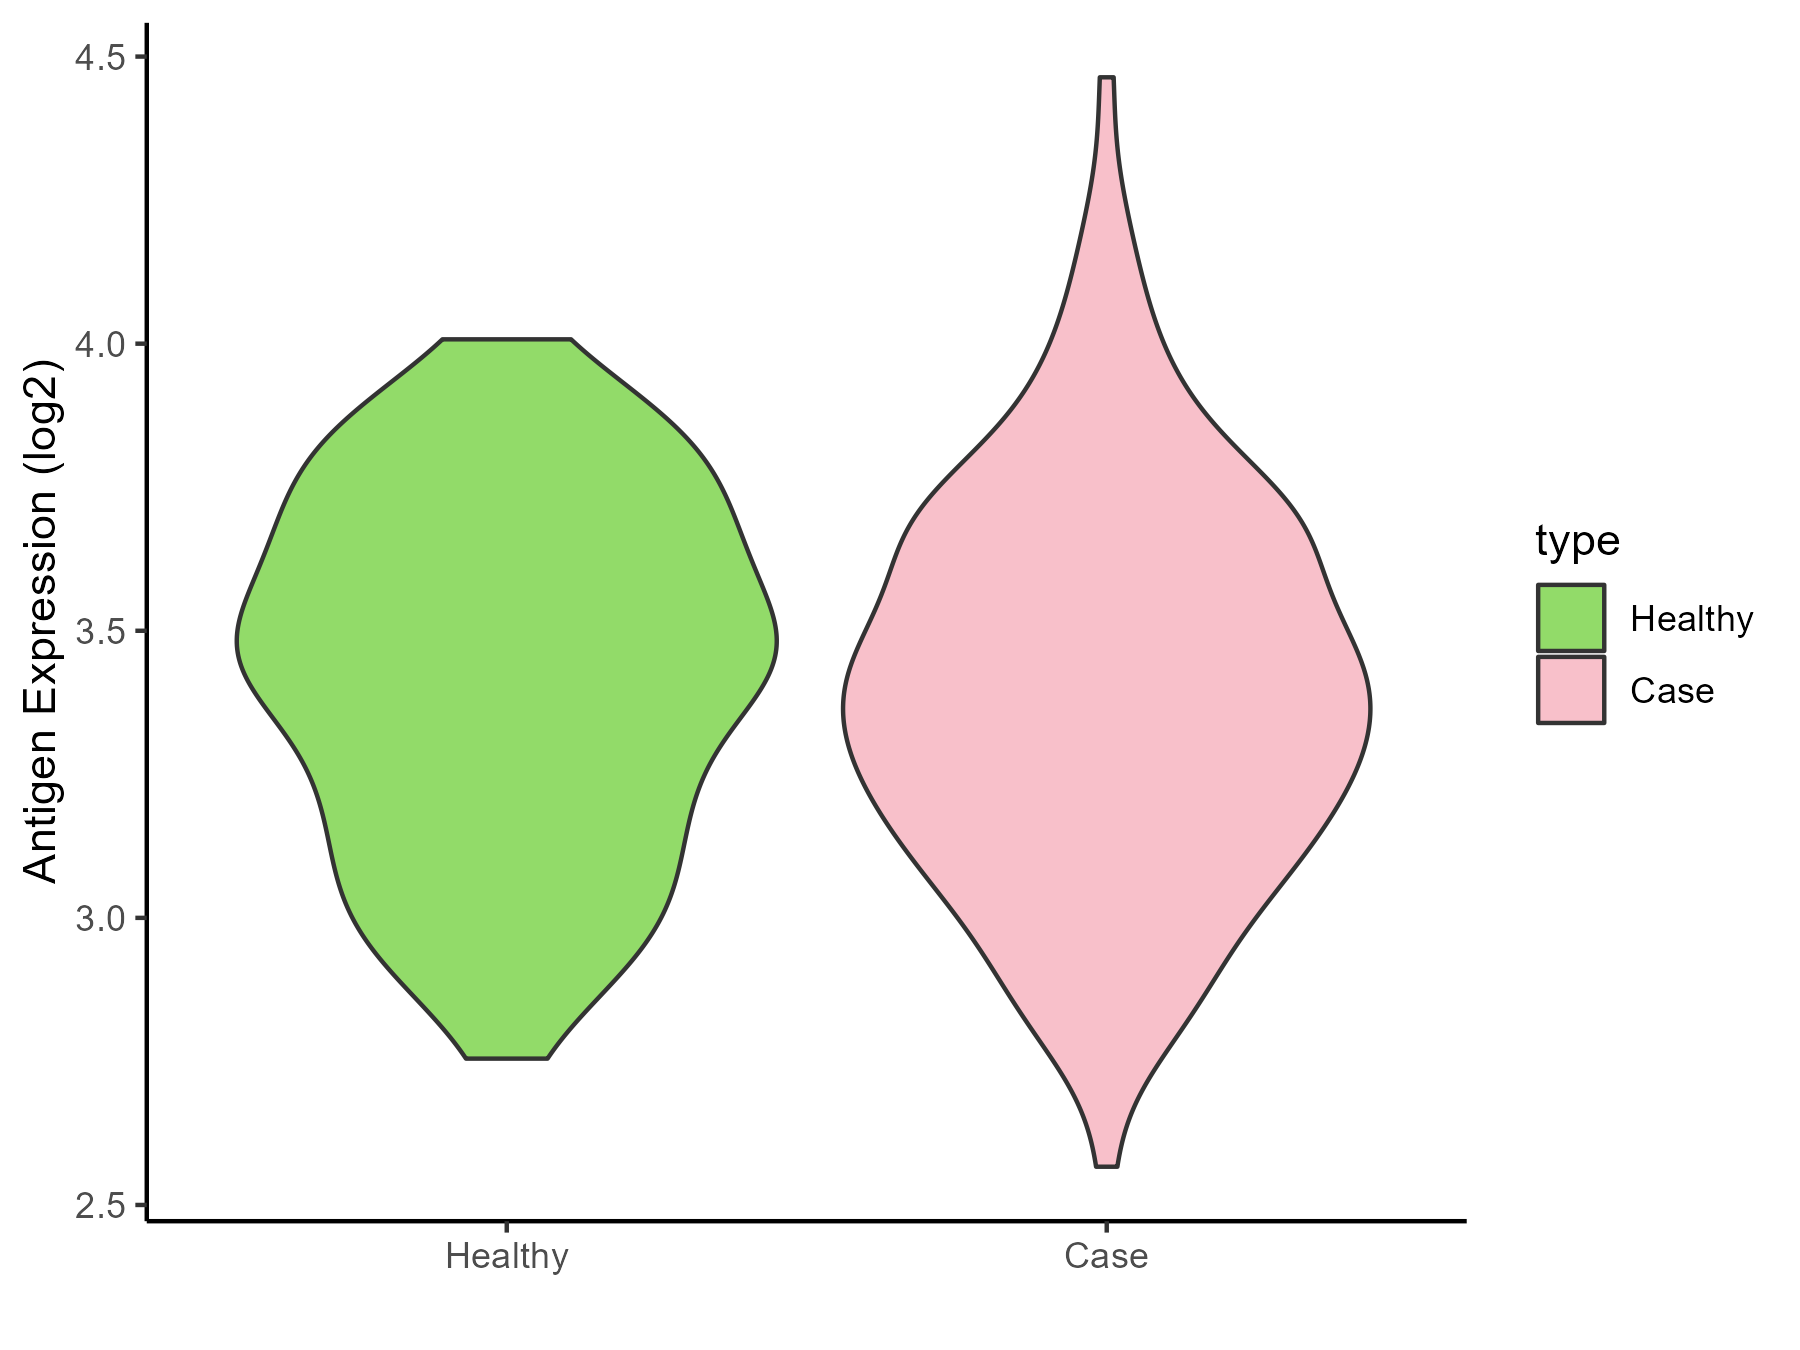
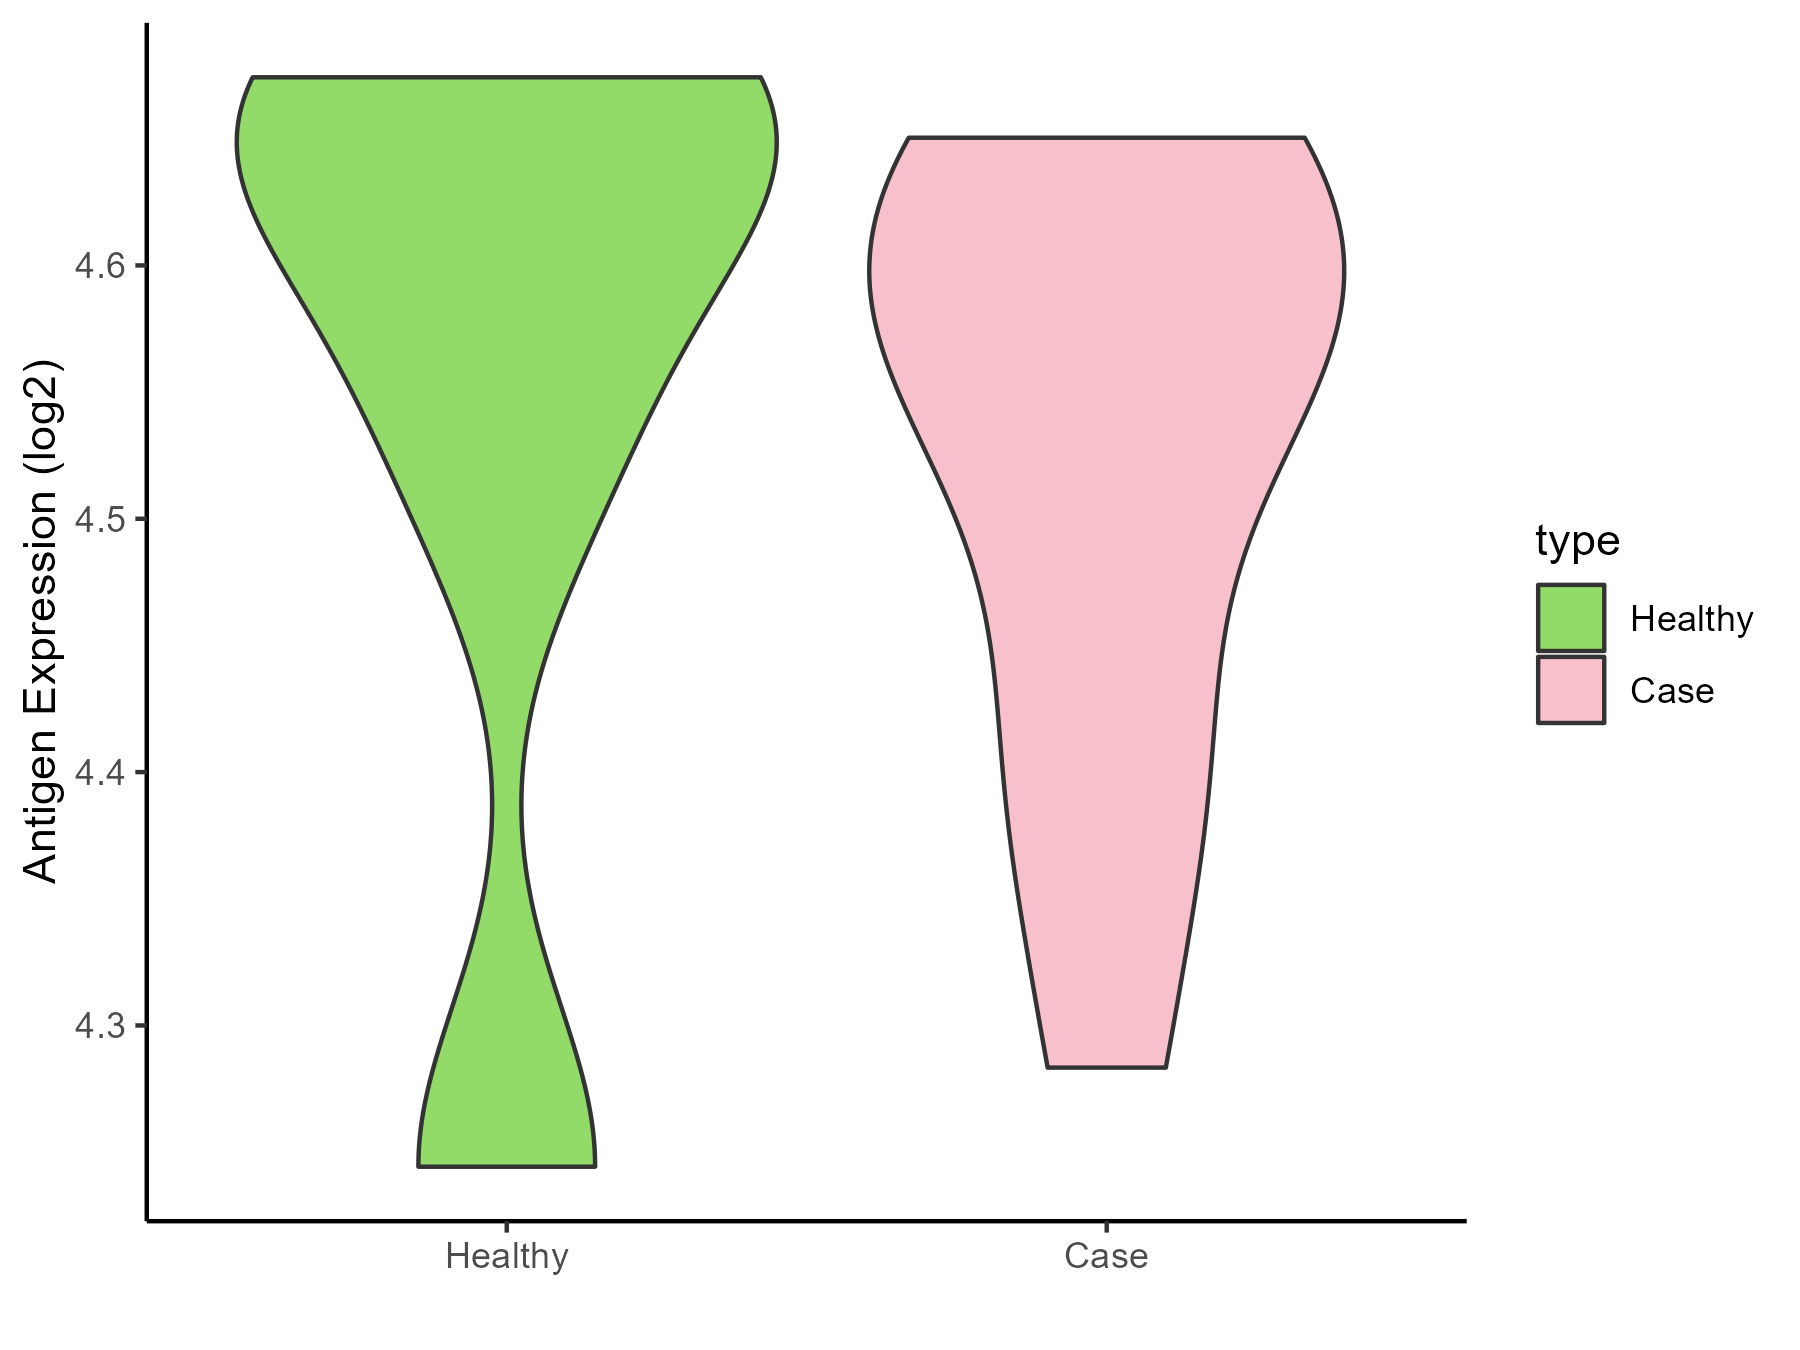
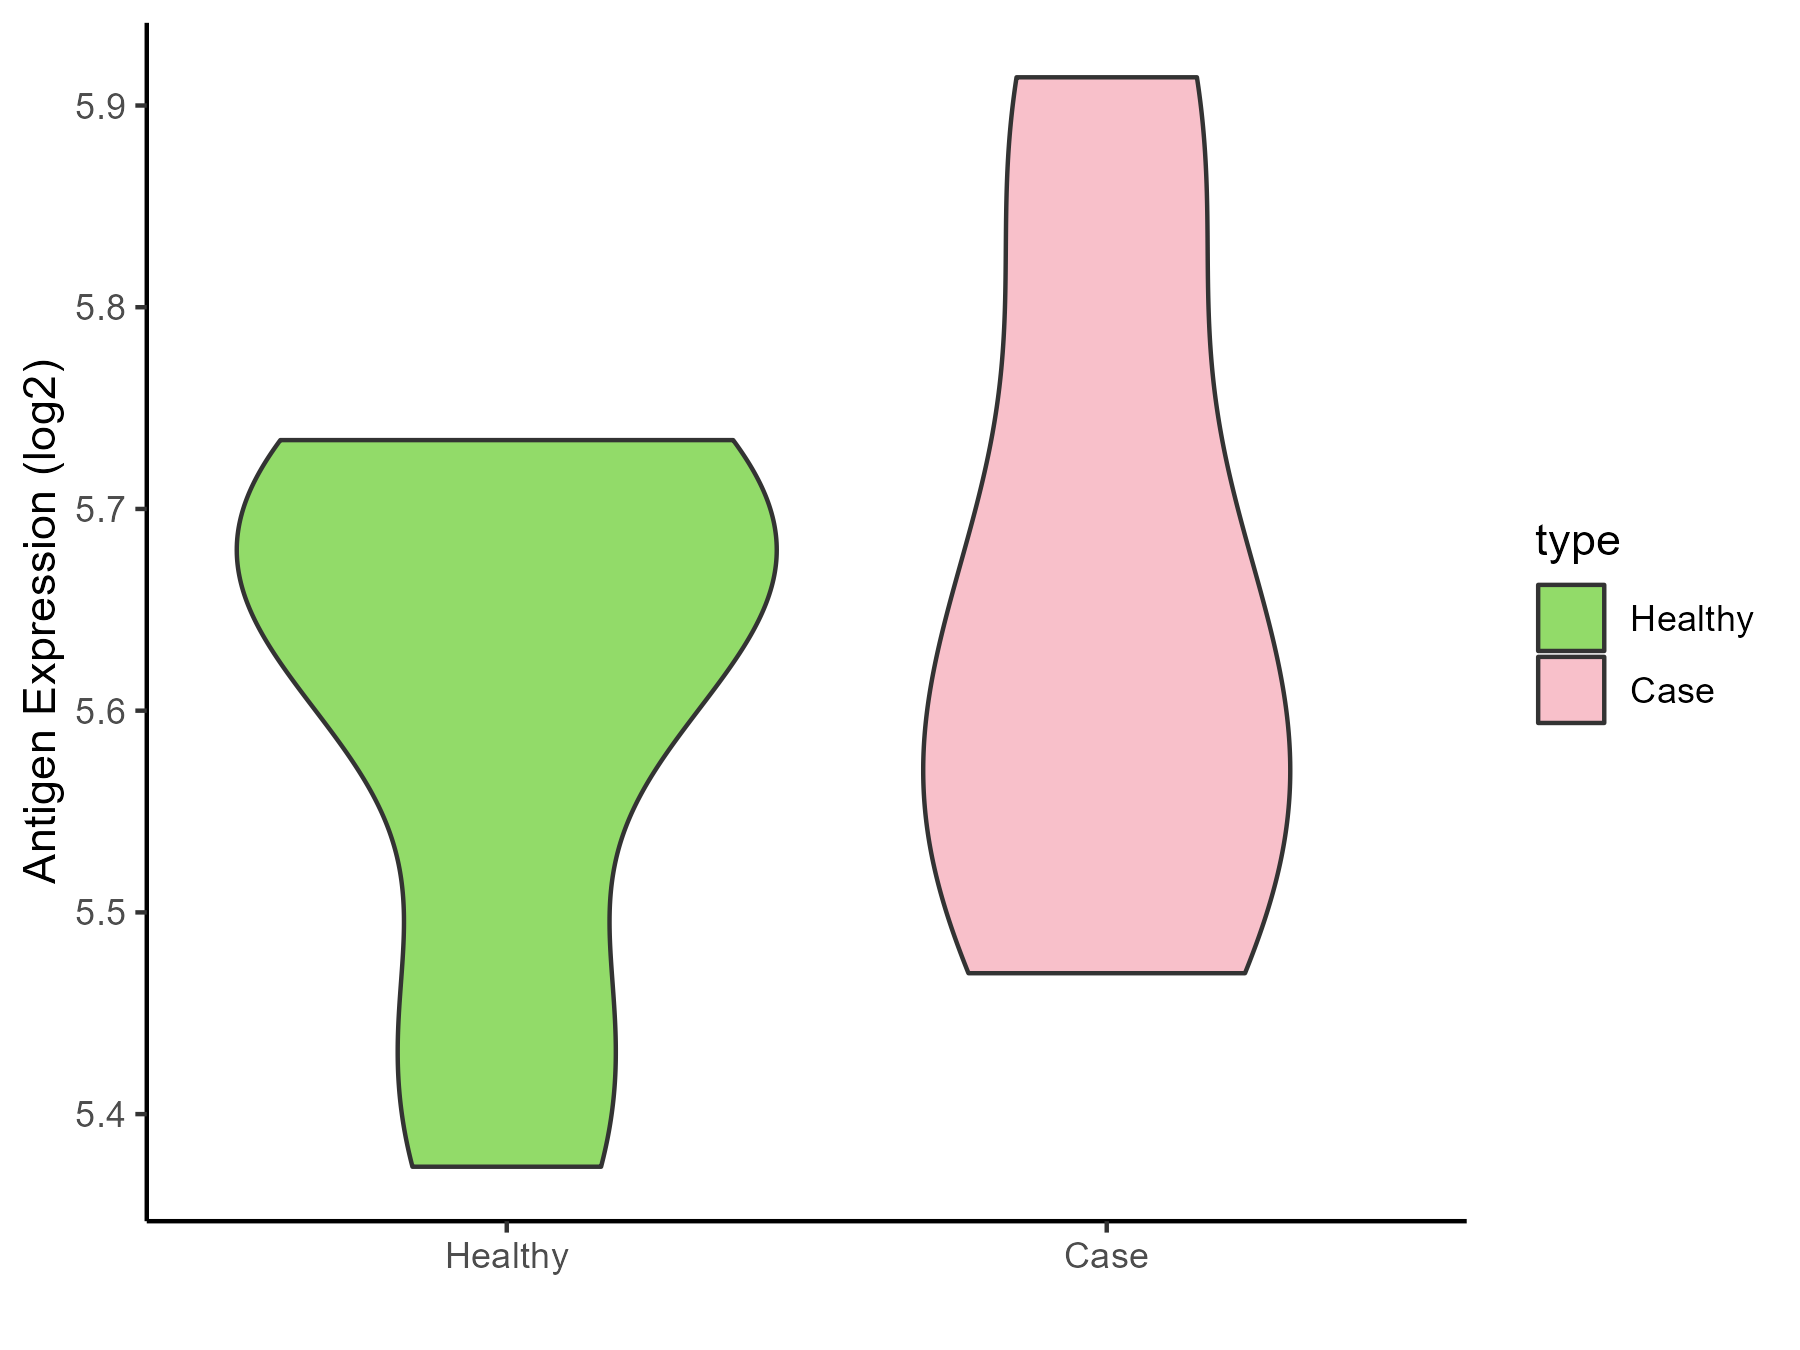
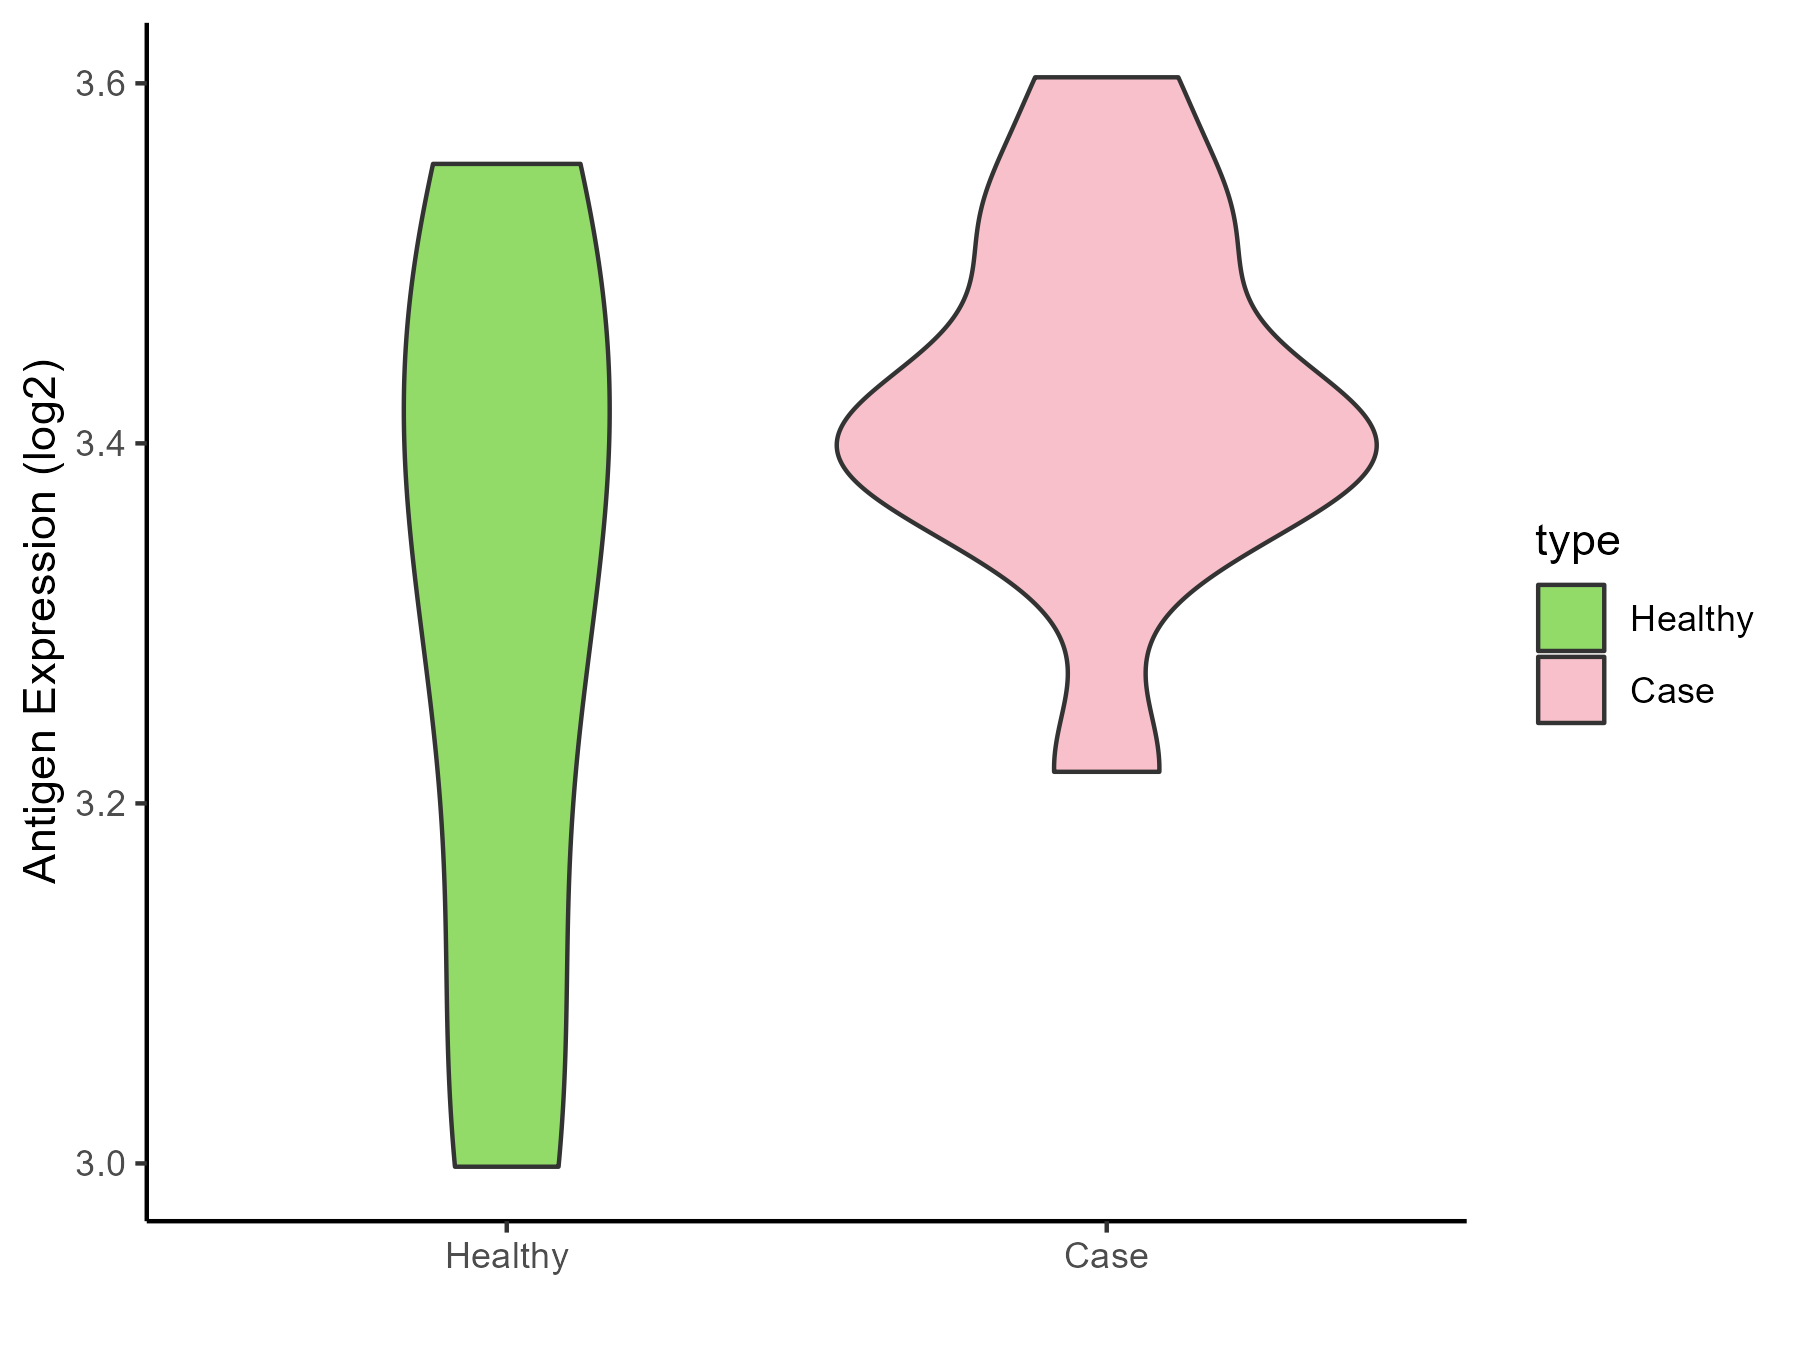
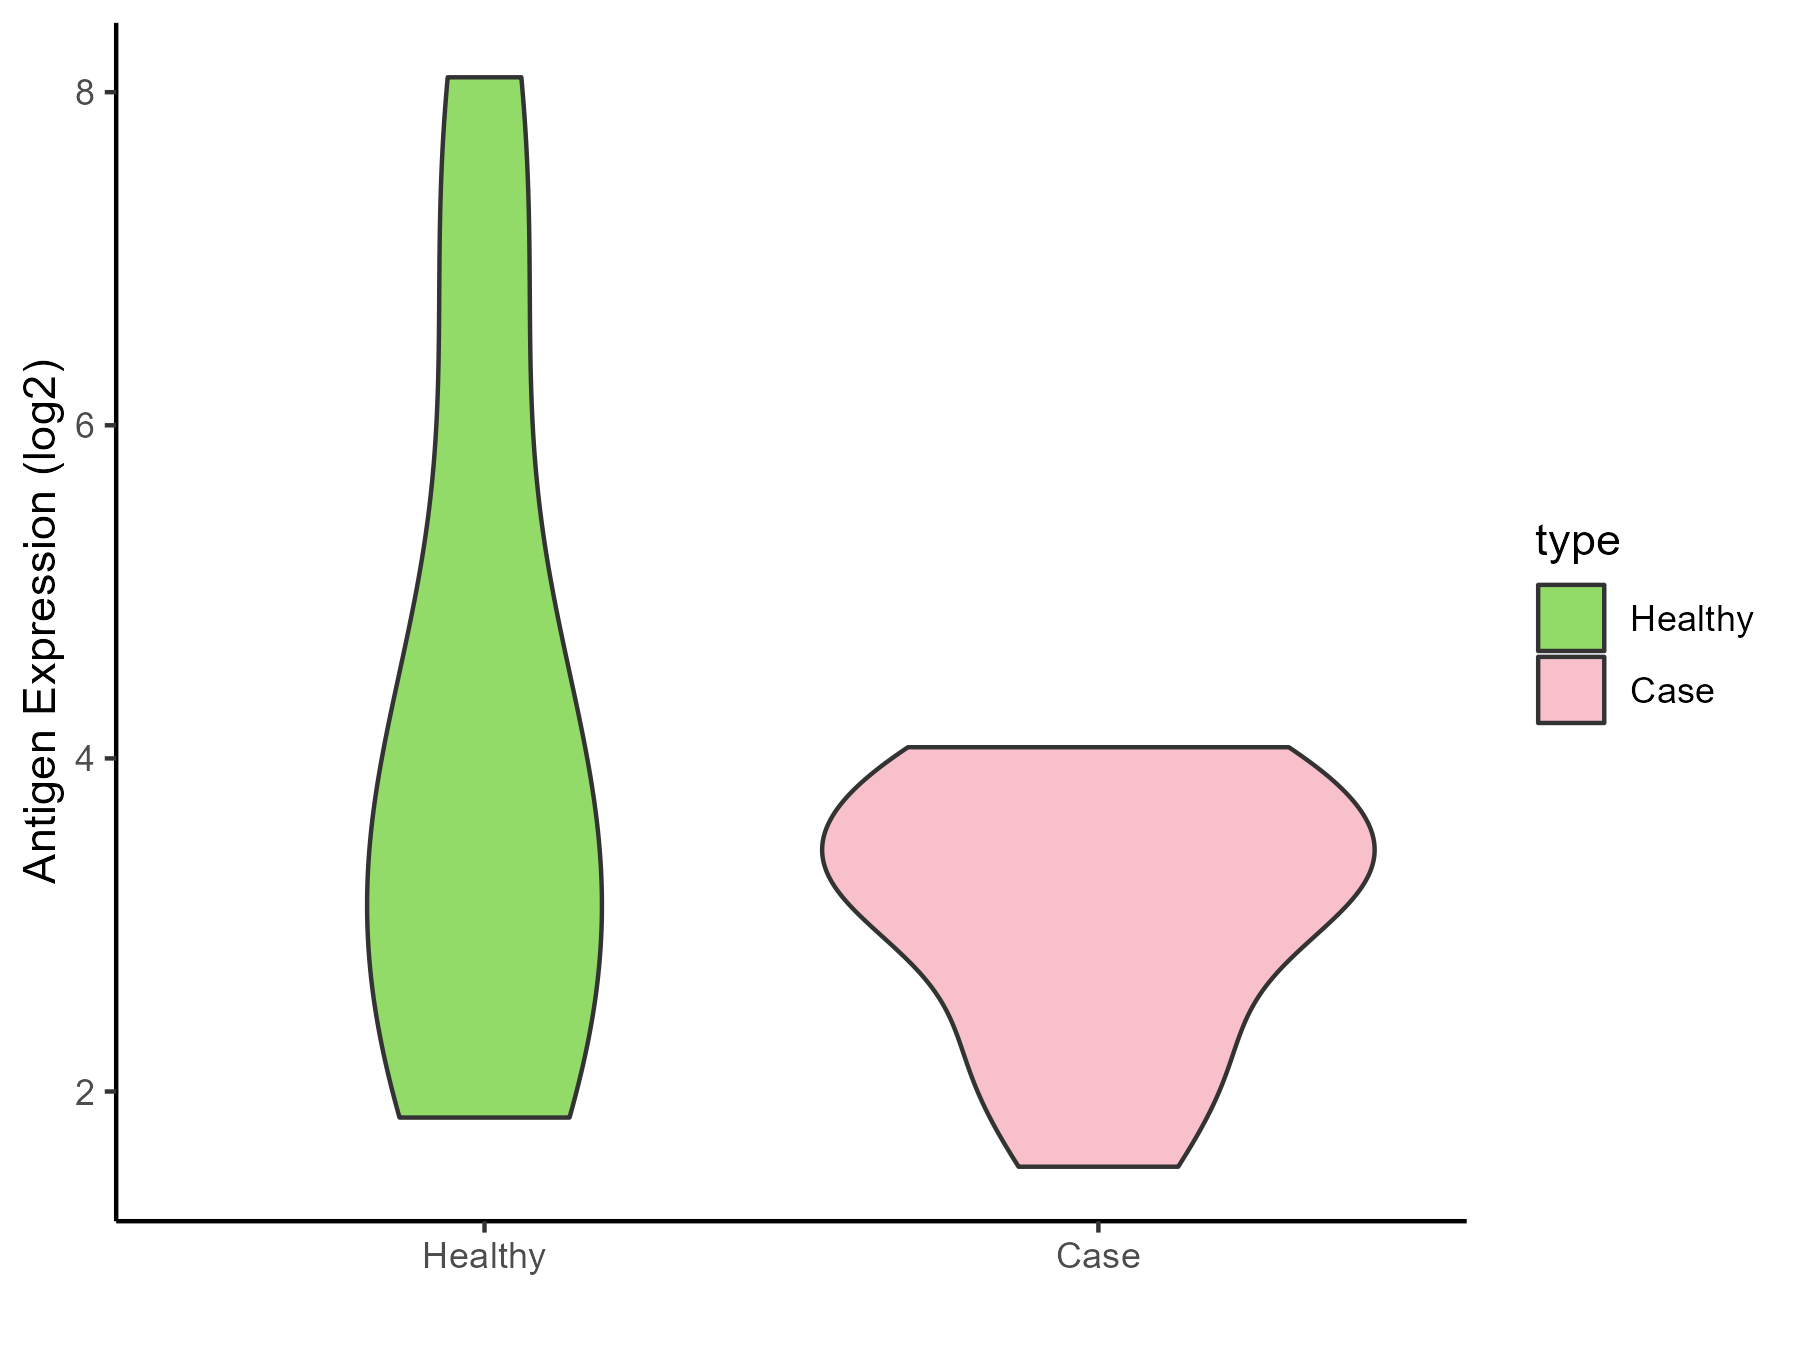
Brainstem |
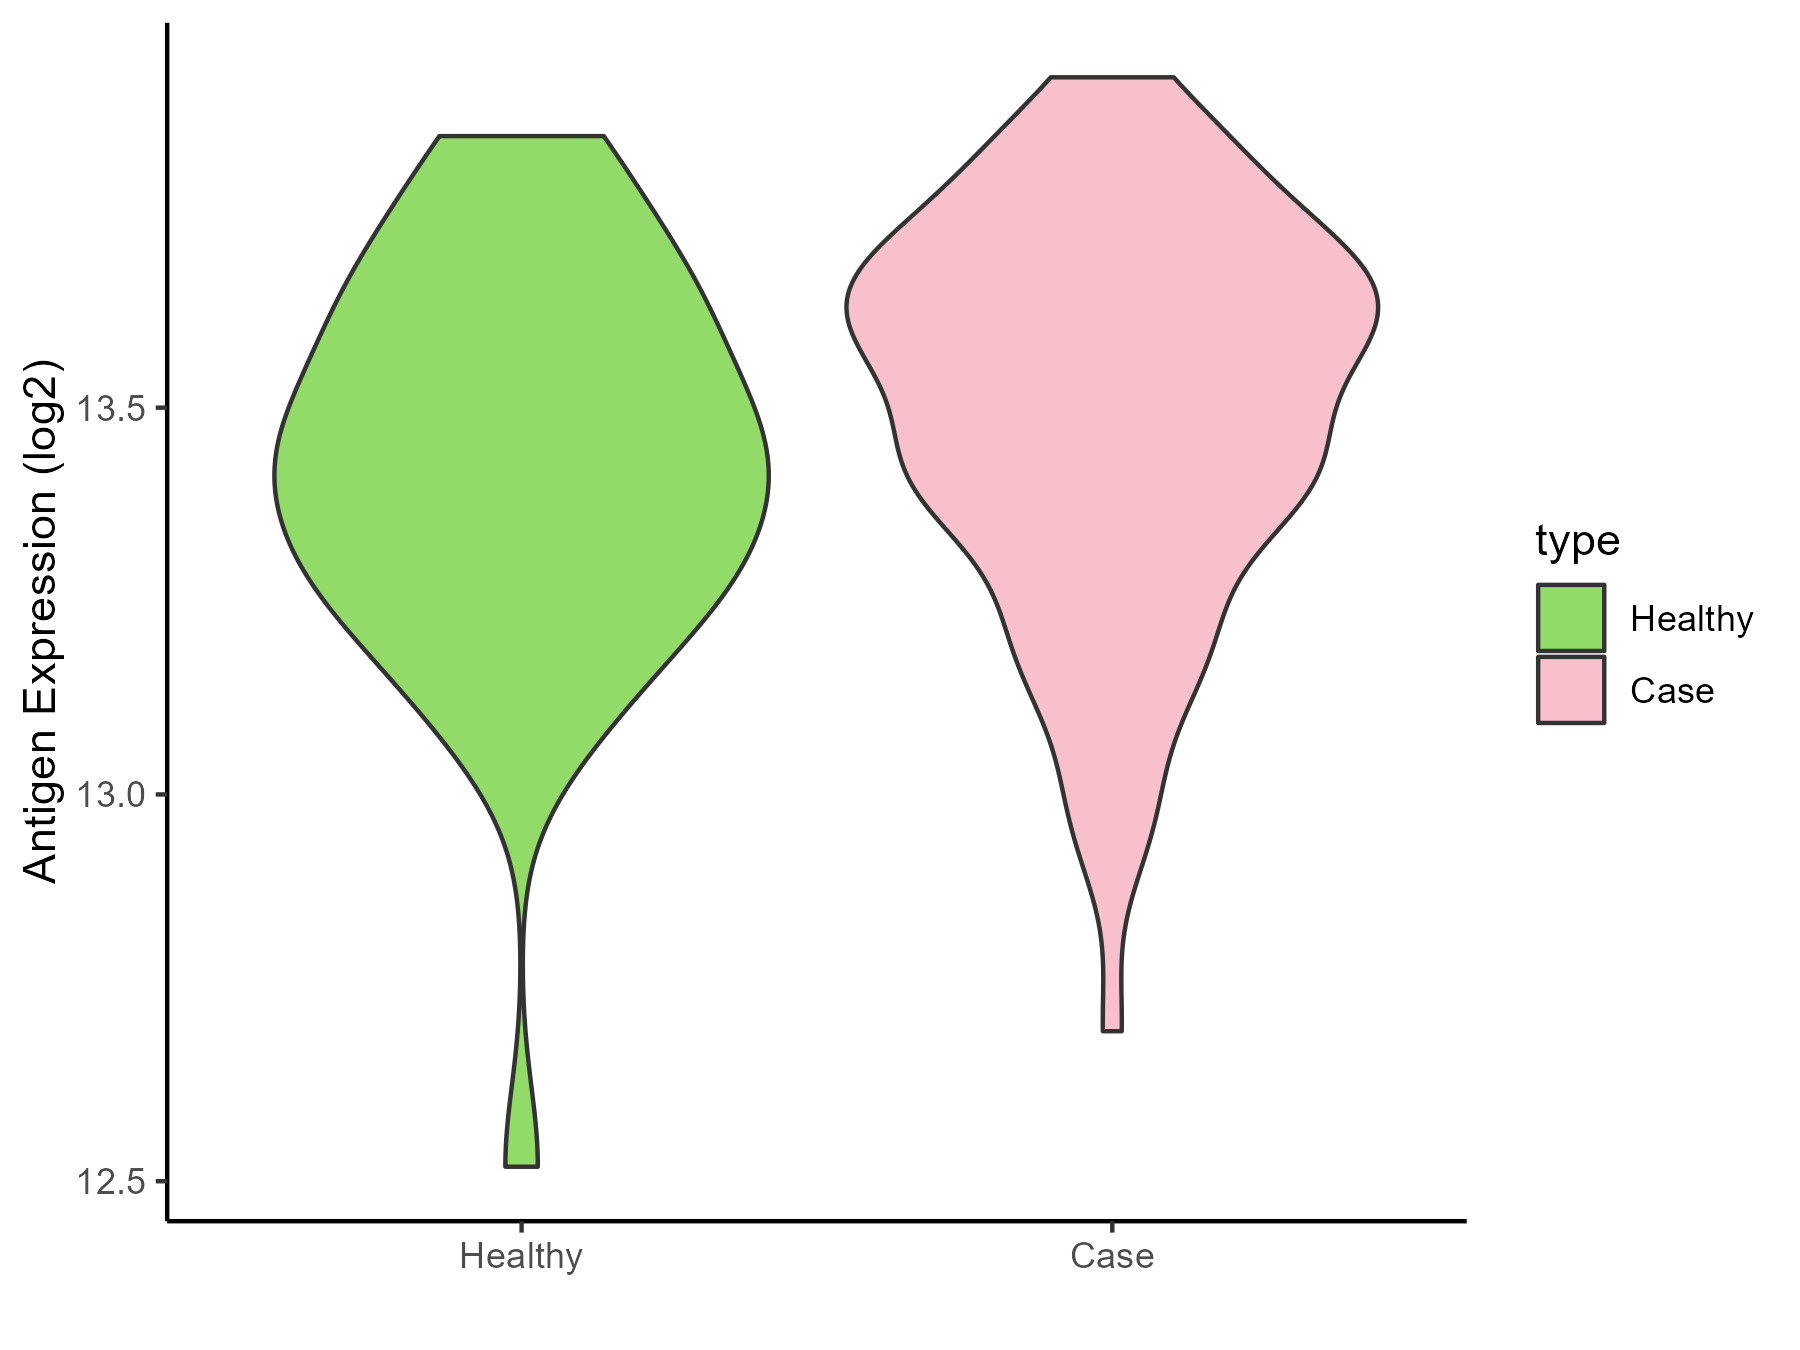
| The Specific Disease |
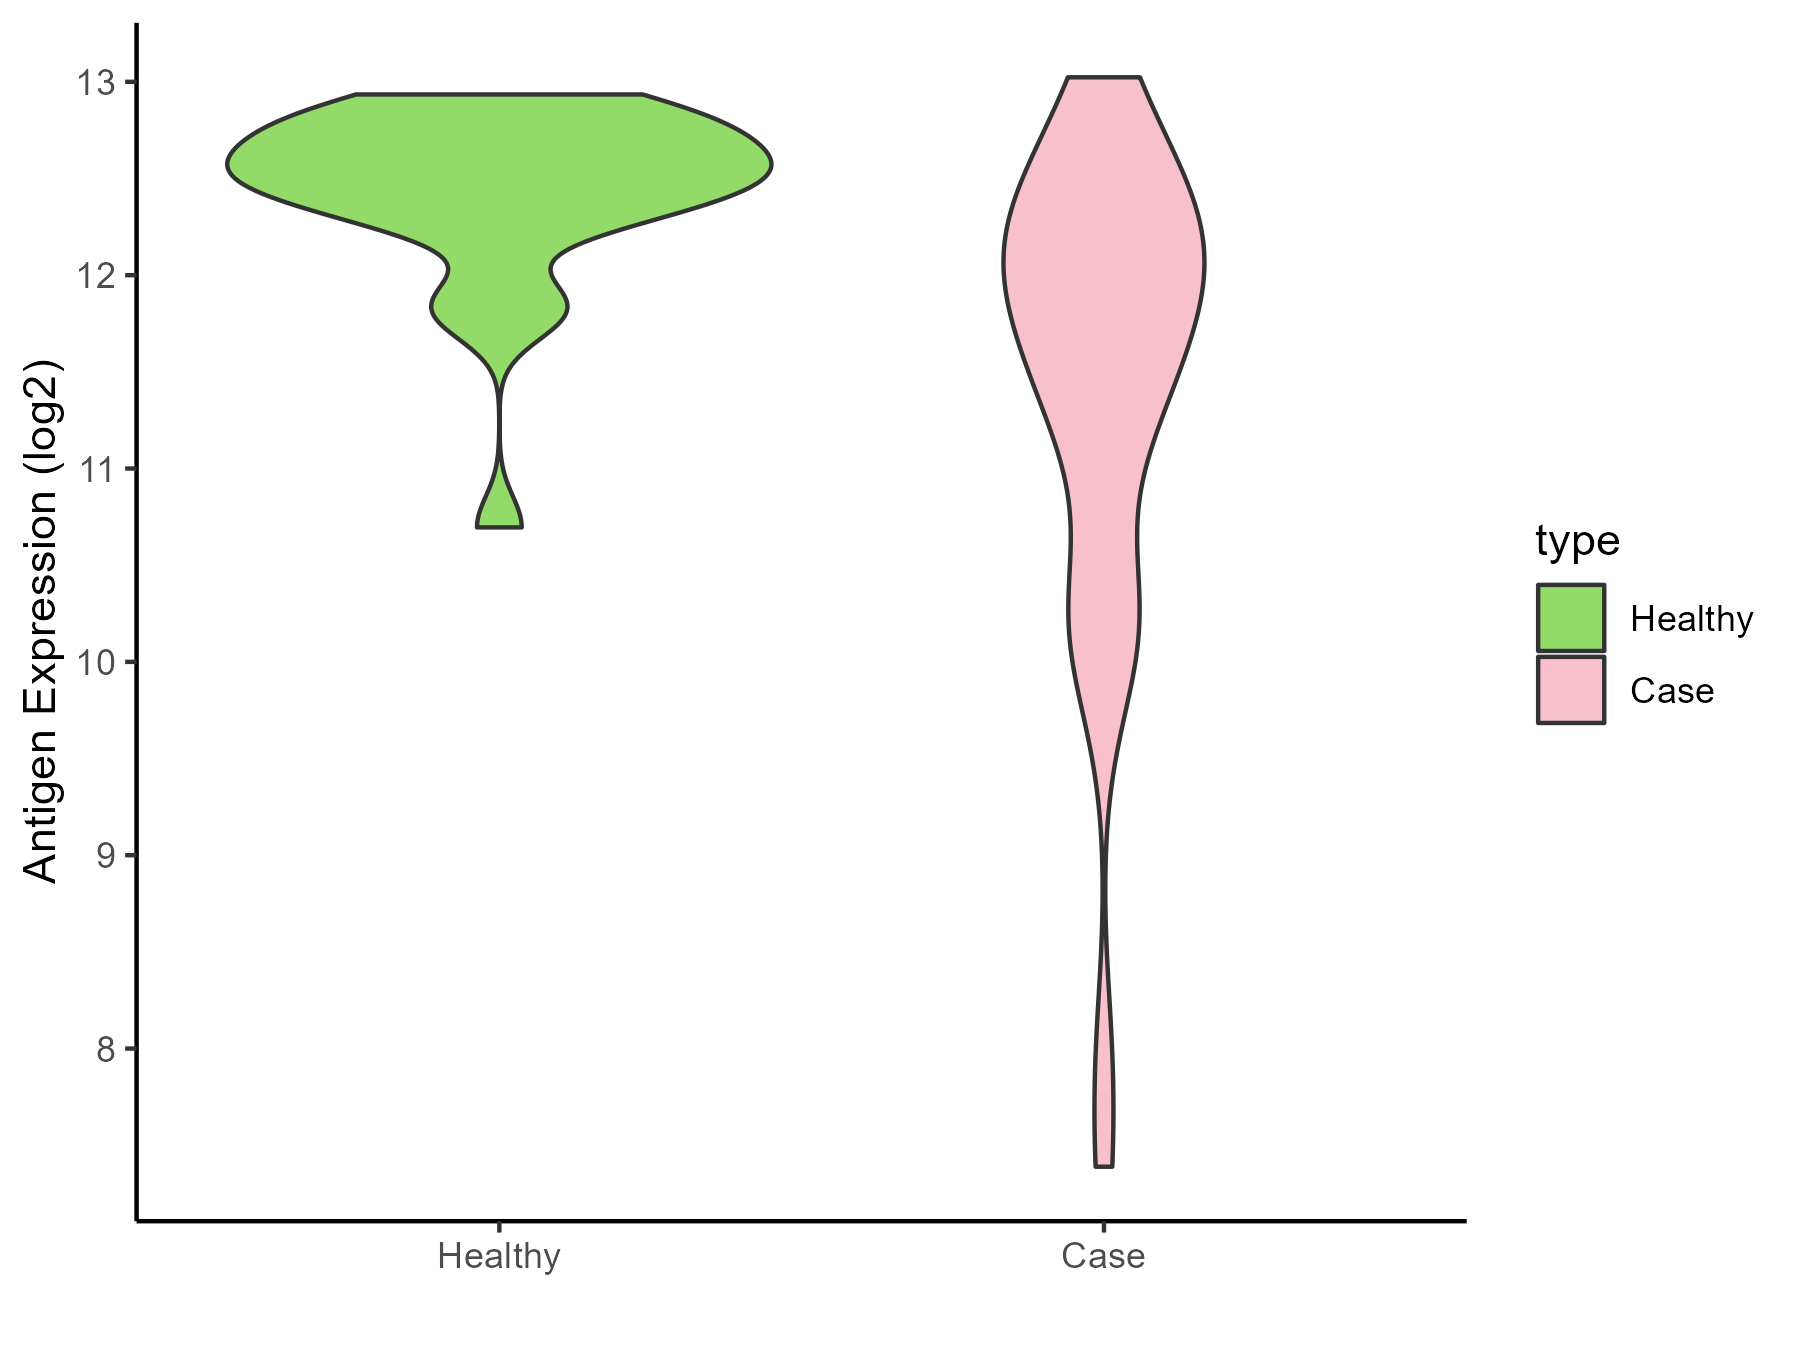
Glioma |
| The Expression Level of Disease Section Compare with the Healthy Individual Tissue |
p-value: 0.107834281;
Fold-change: -0.746483601;
Z-score: -3.1057849
|
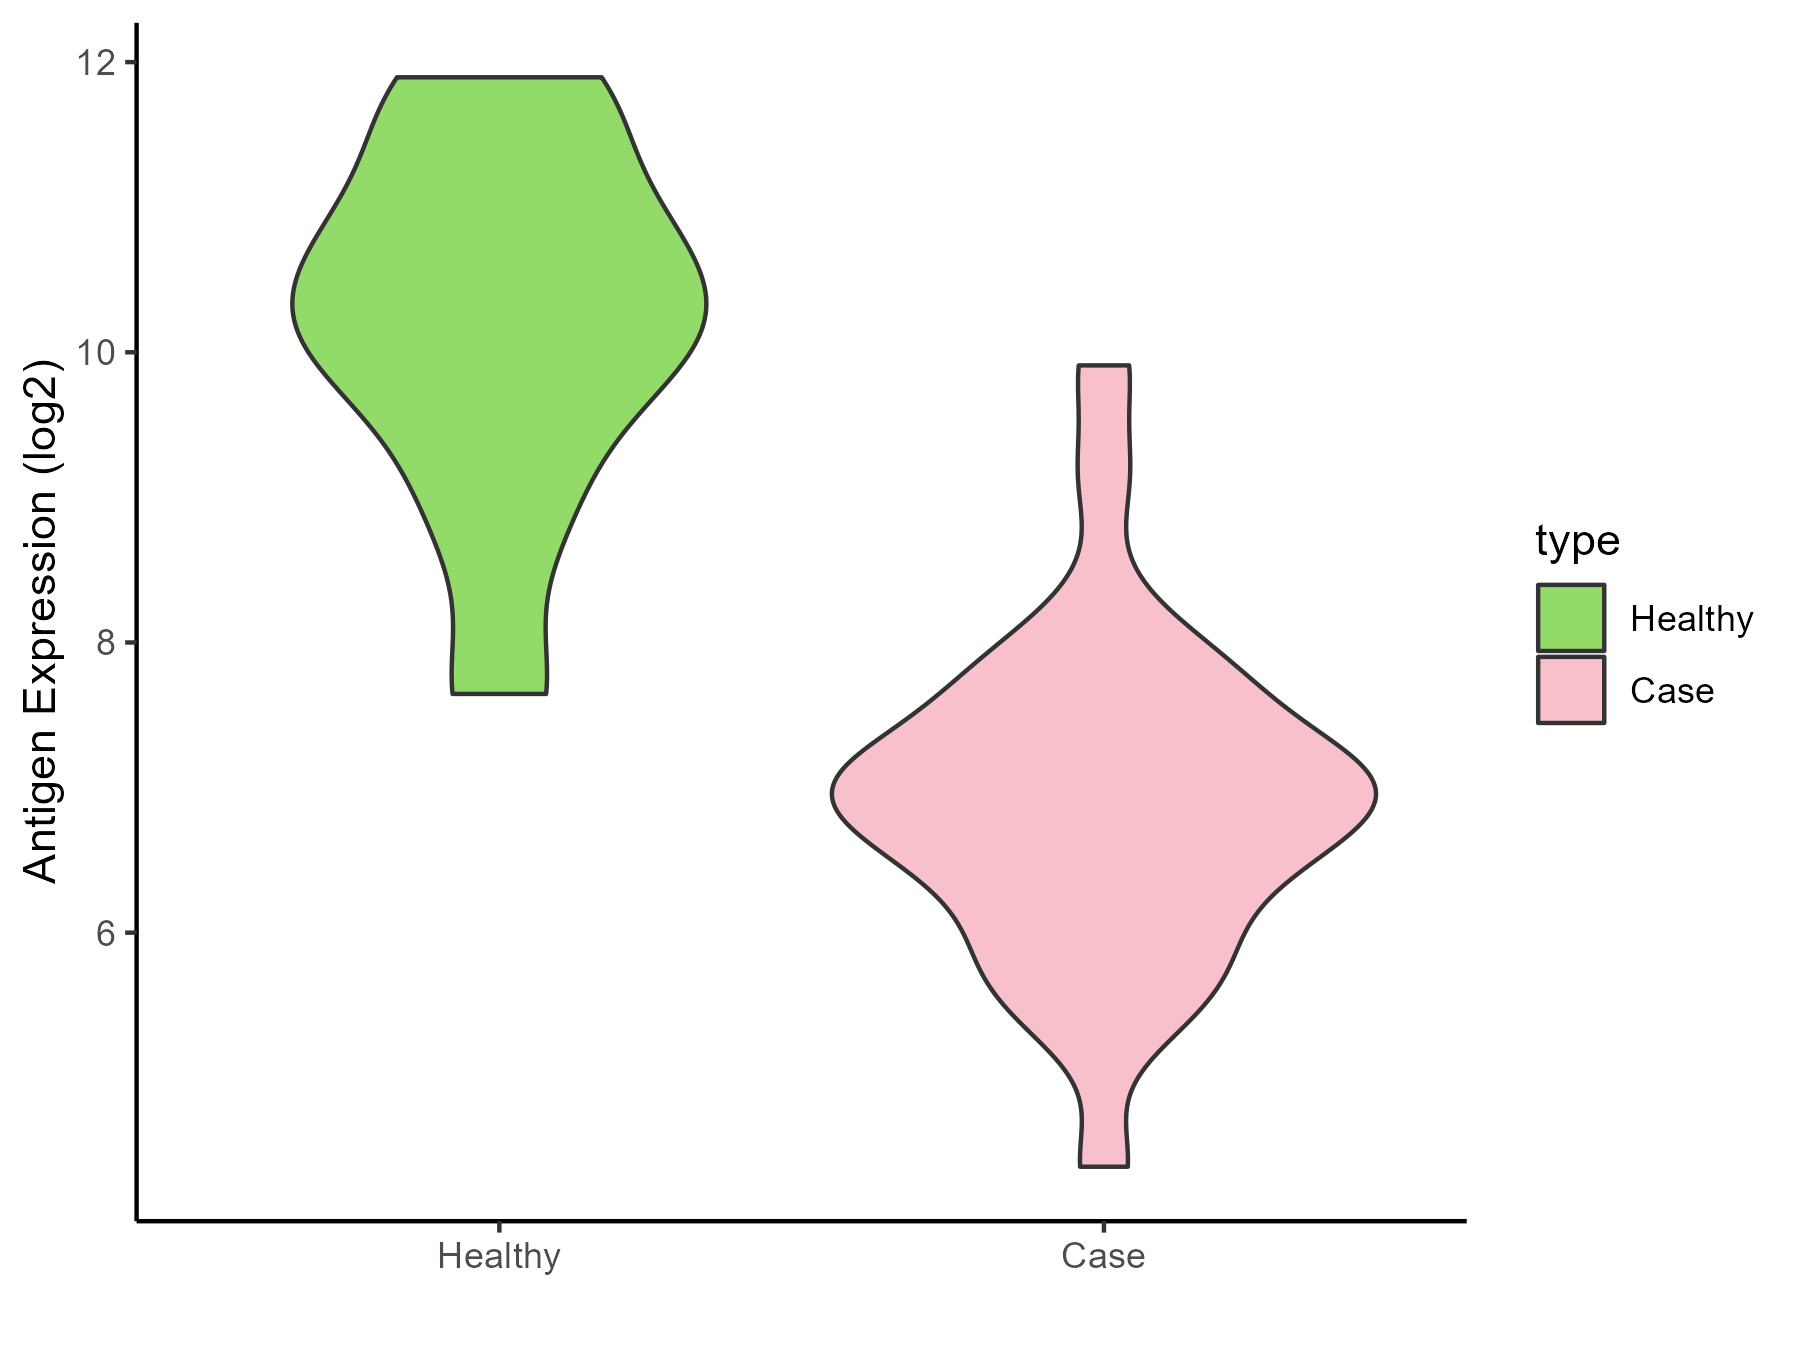
| Disease-specific Antigen Abundances |
|
Click to View the Clearer Original Diagram
|
|
|
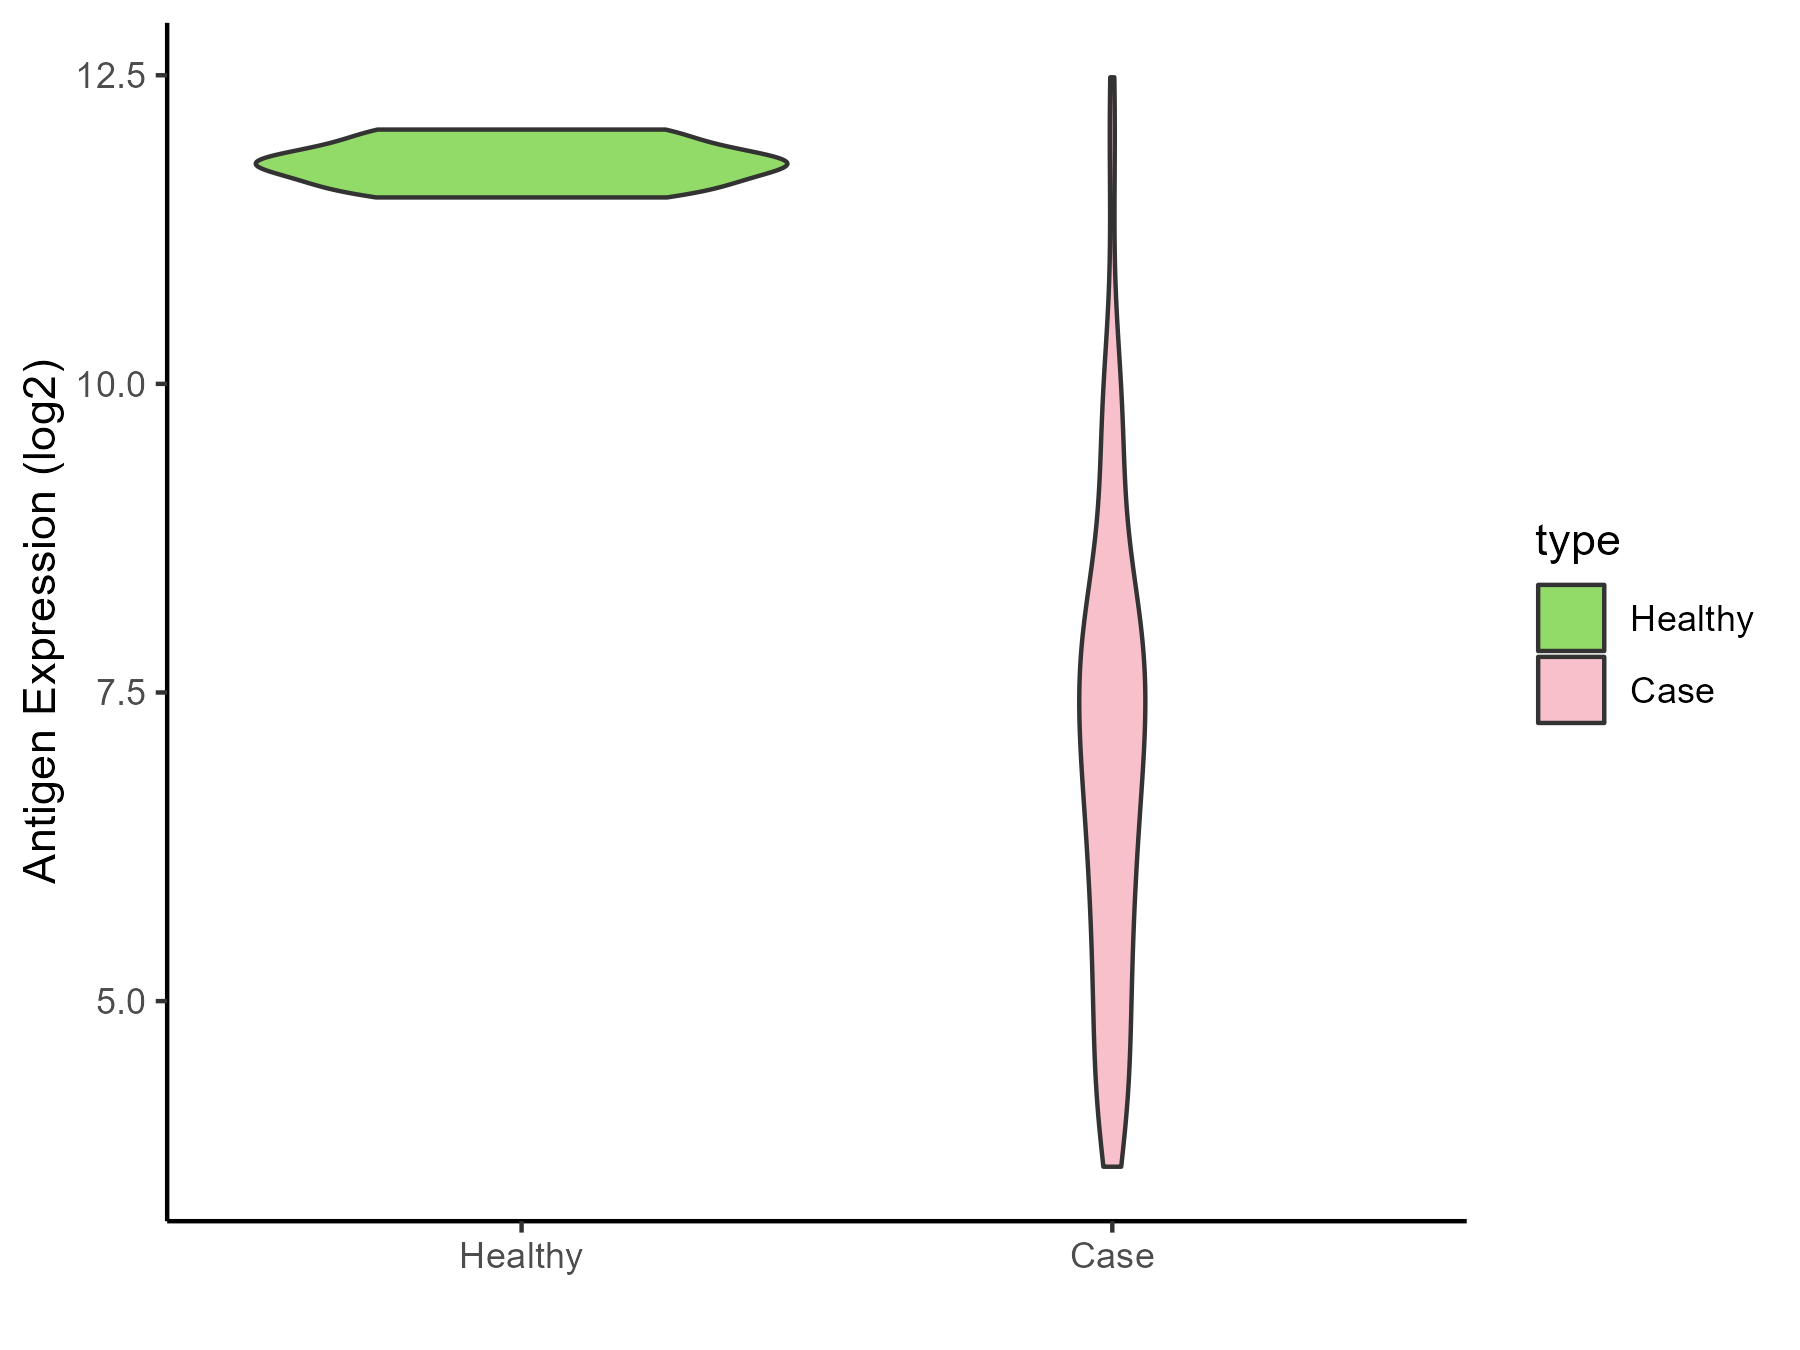
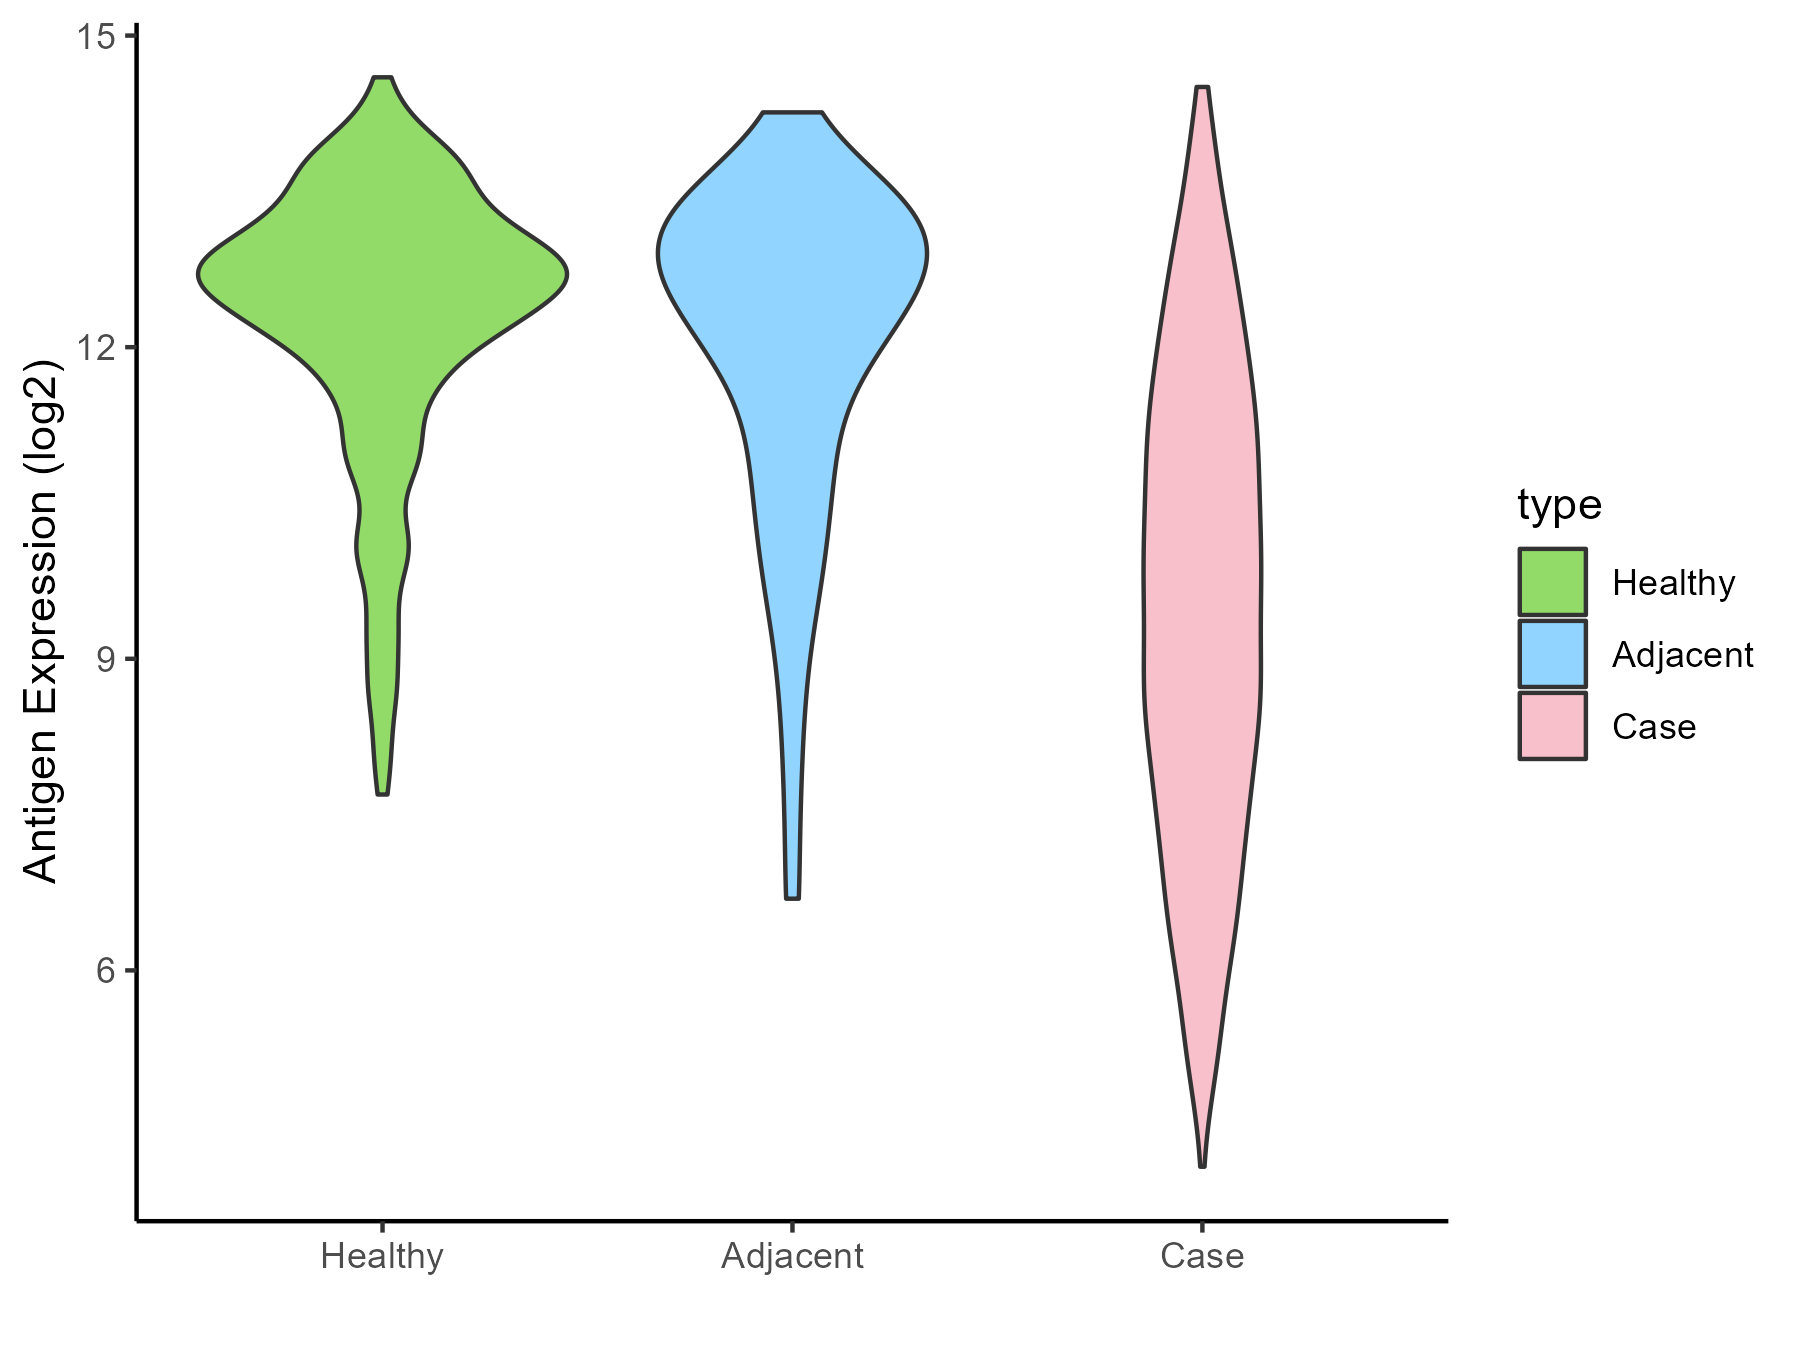
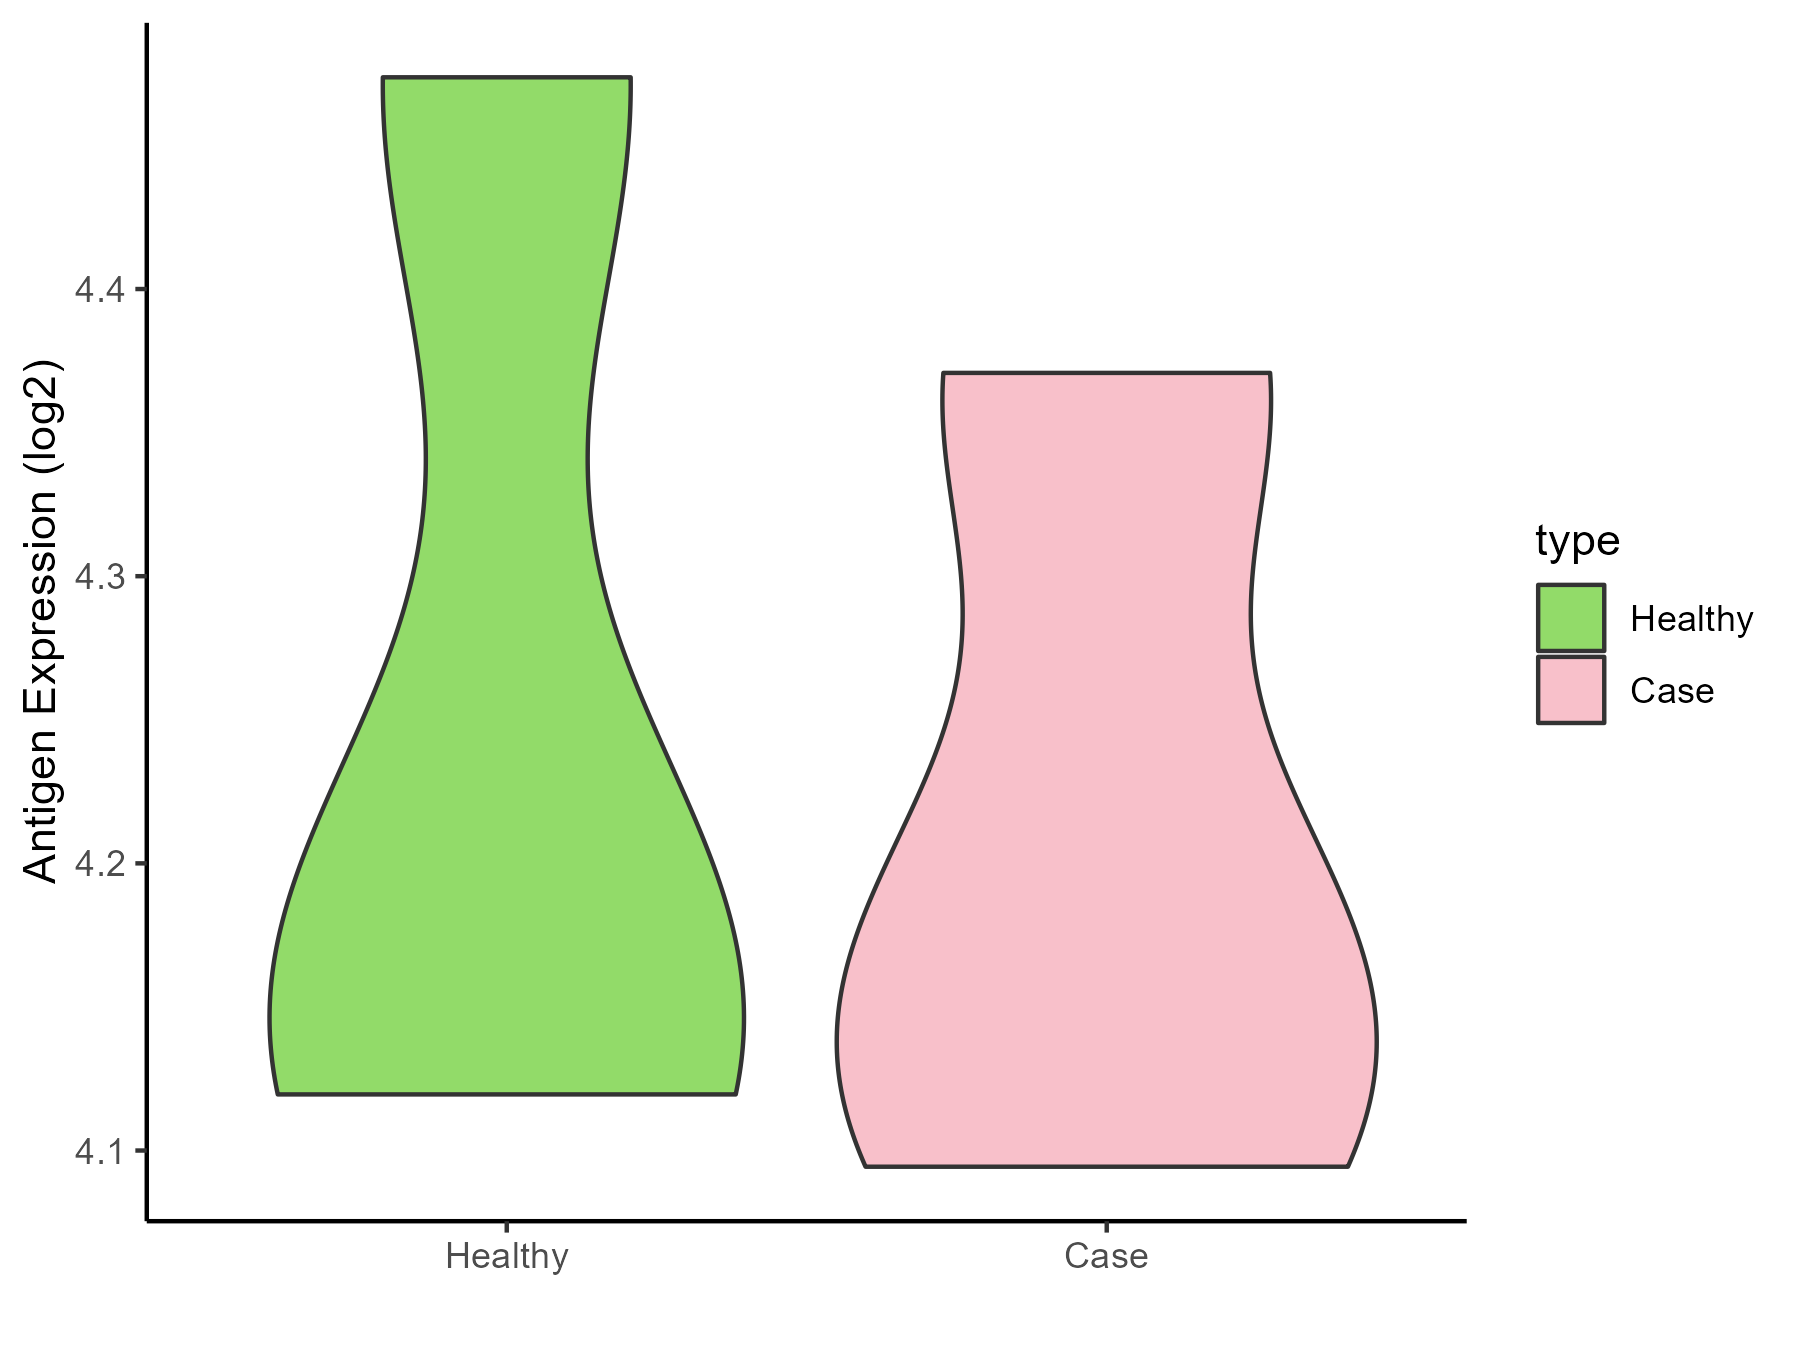
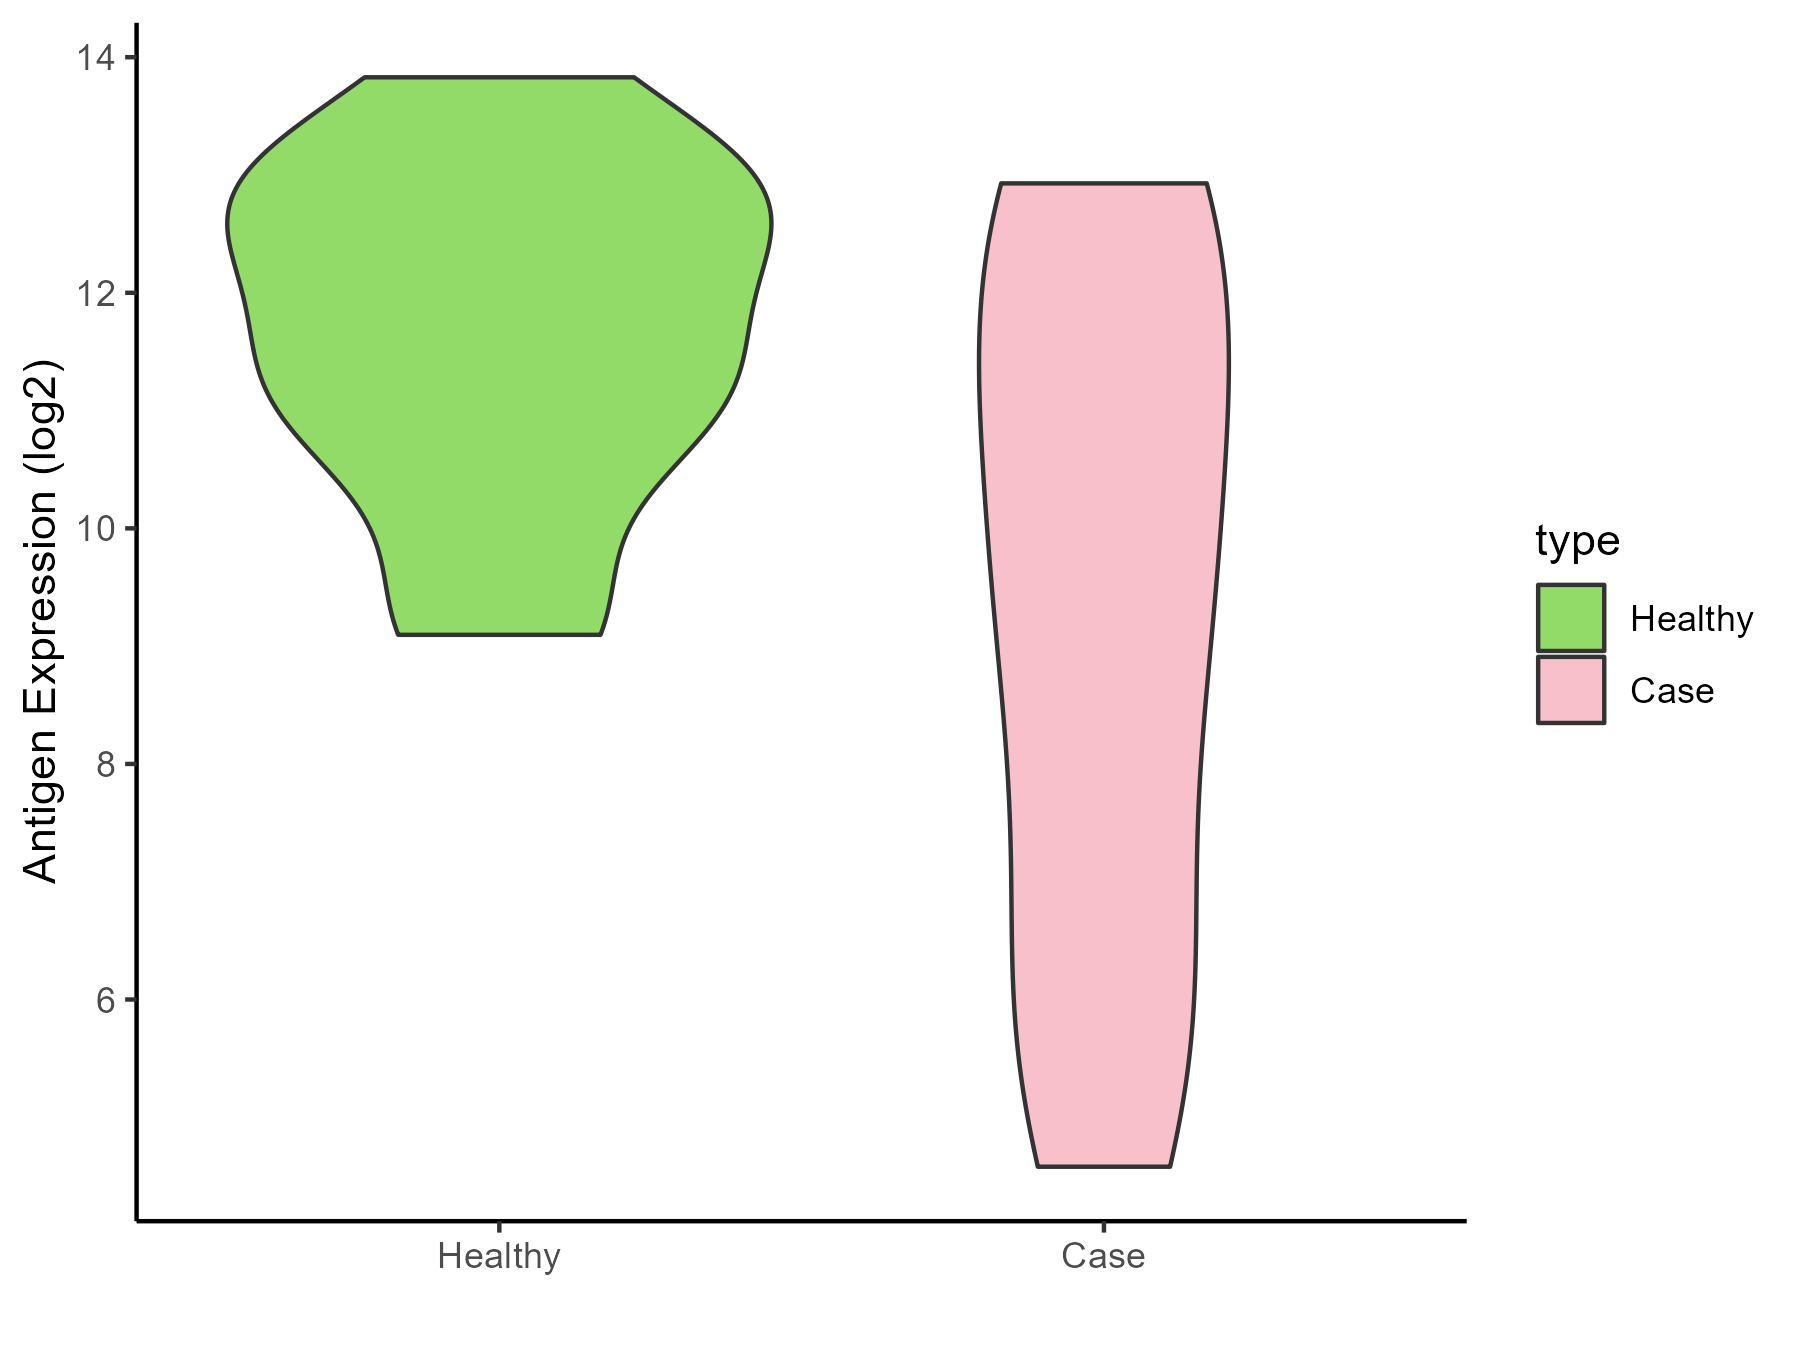
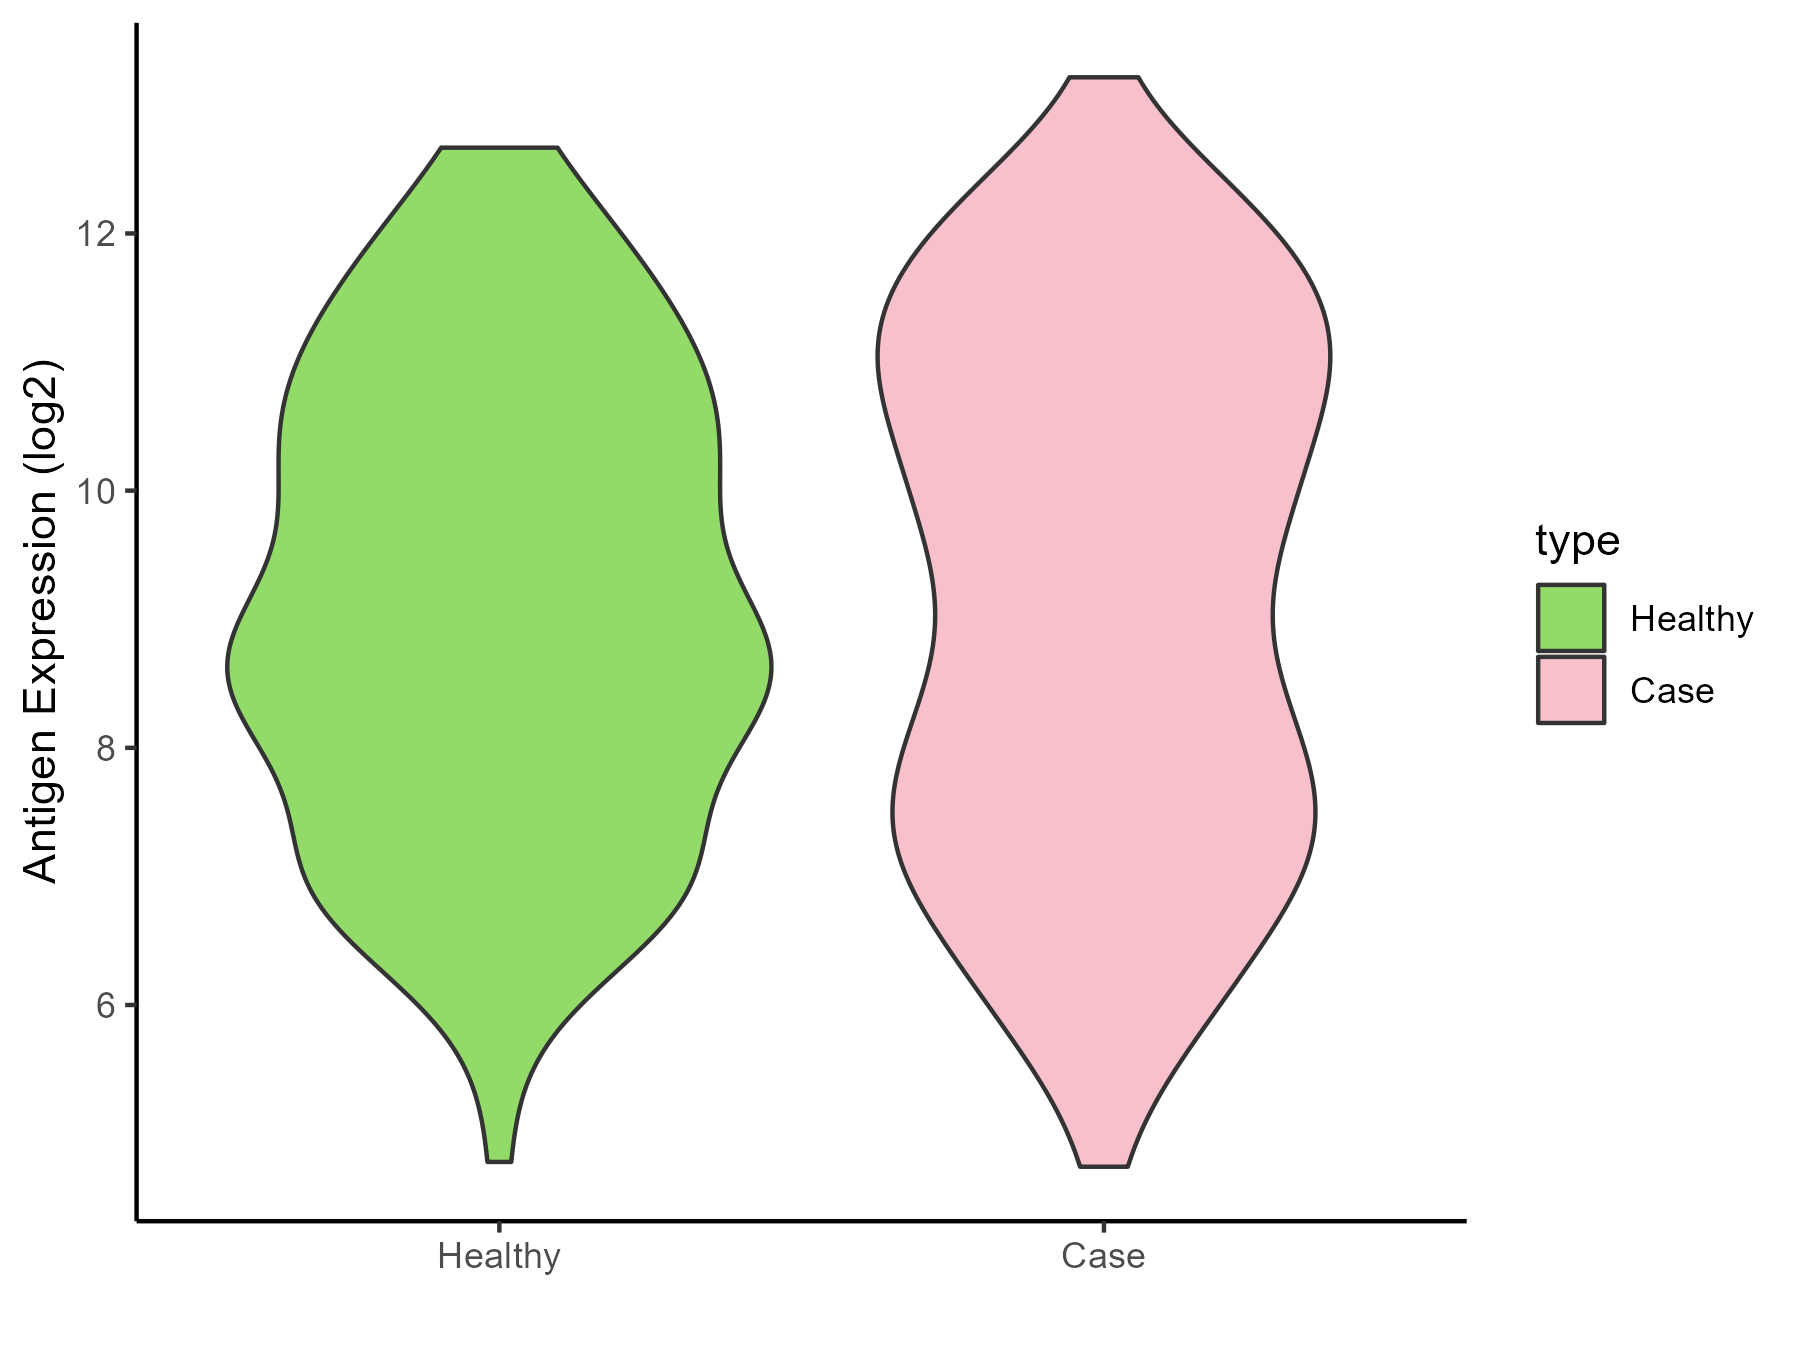
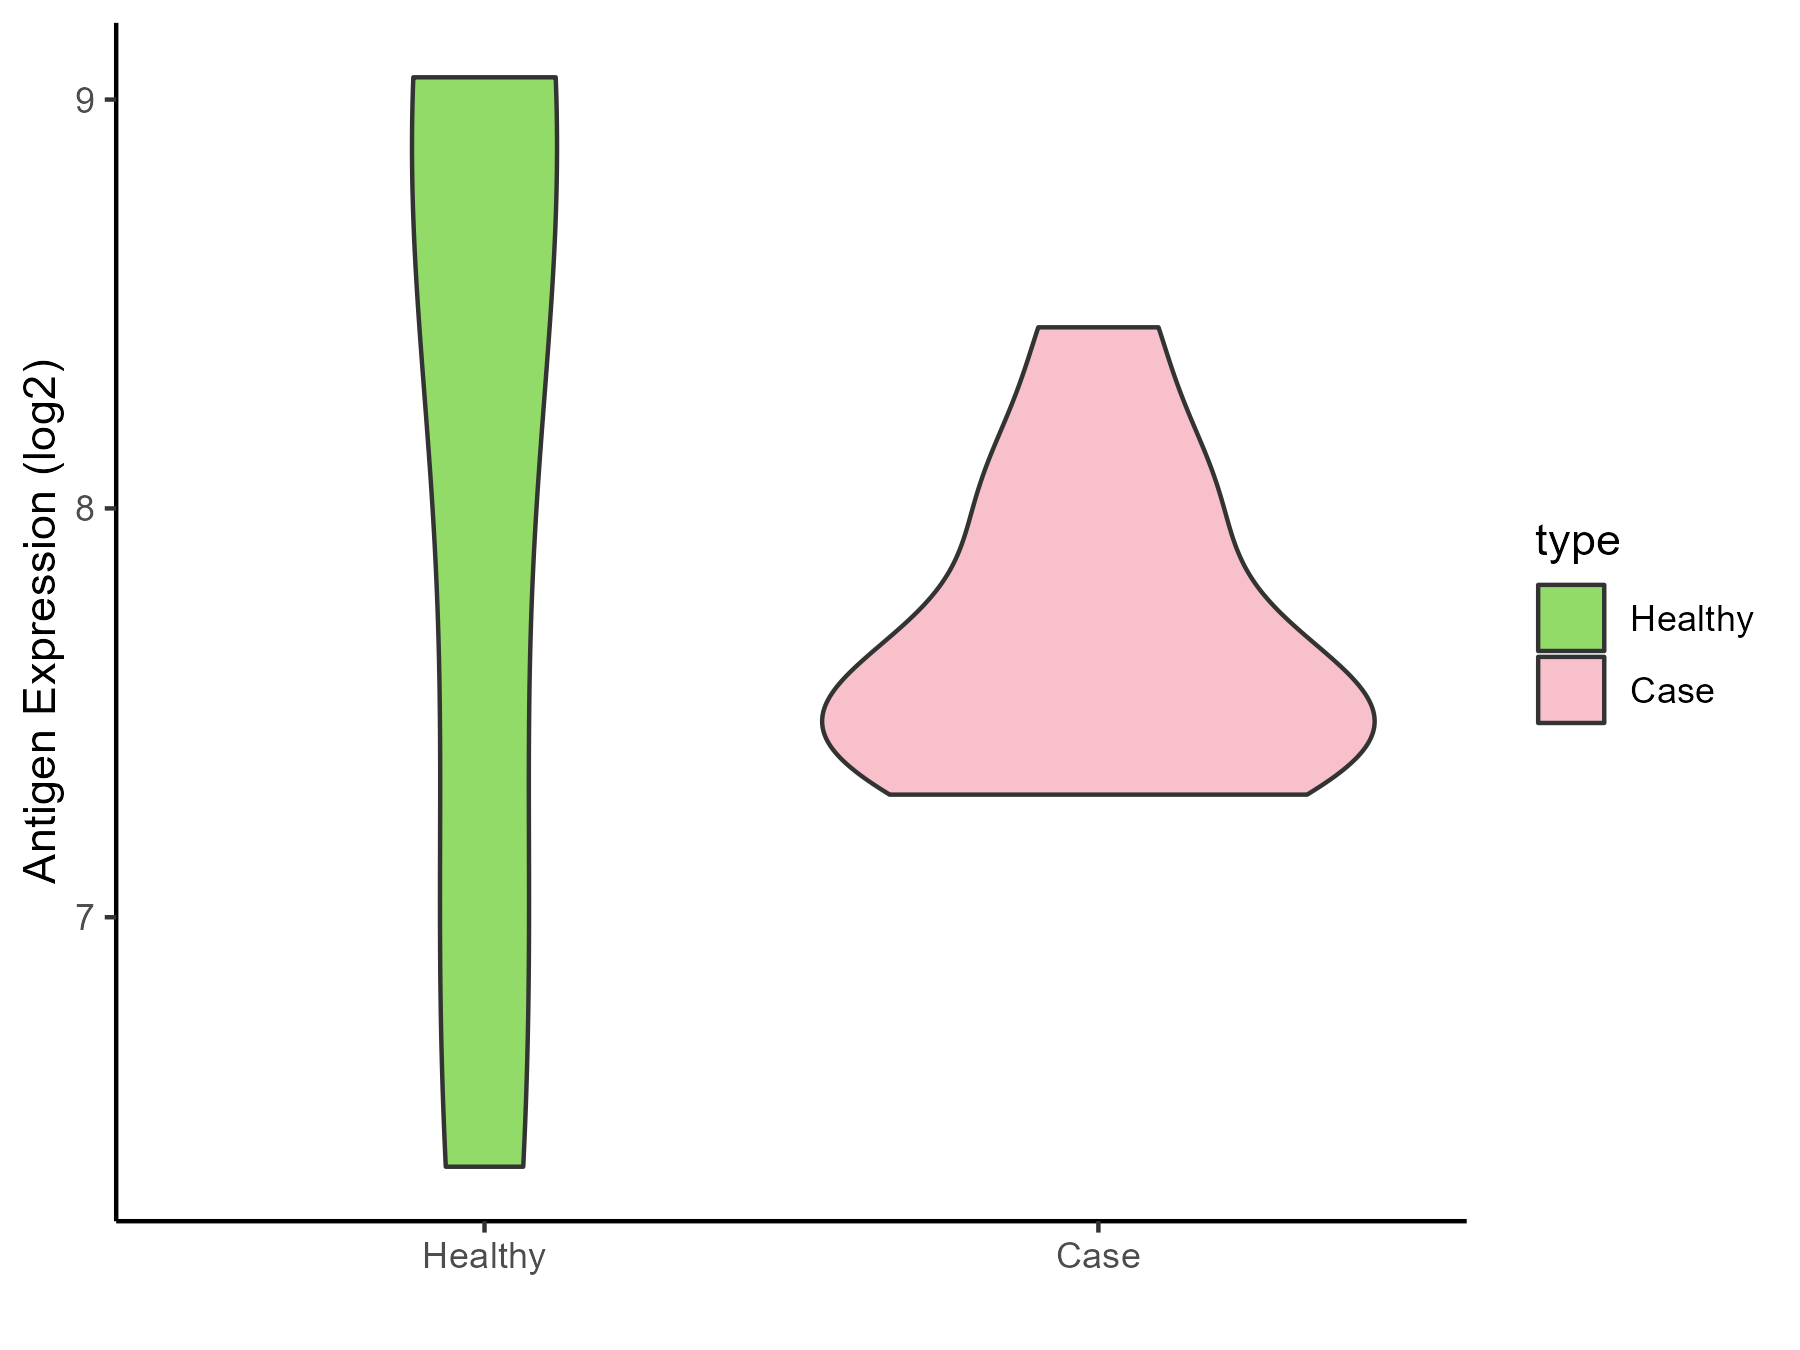
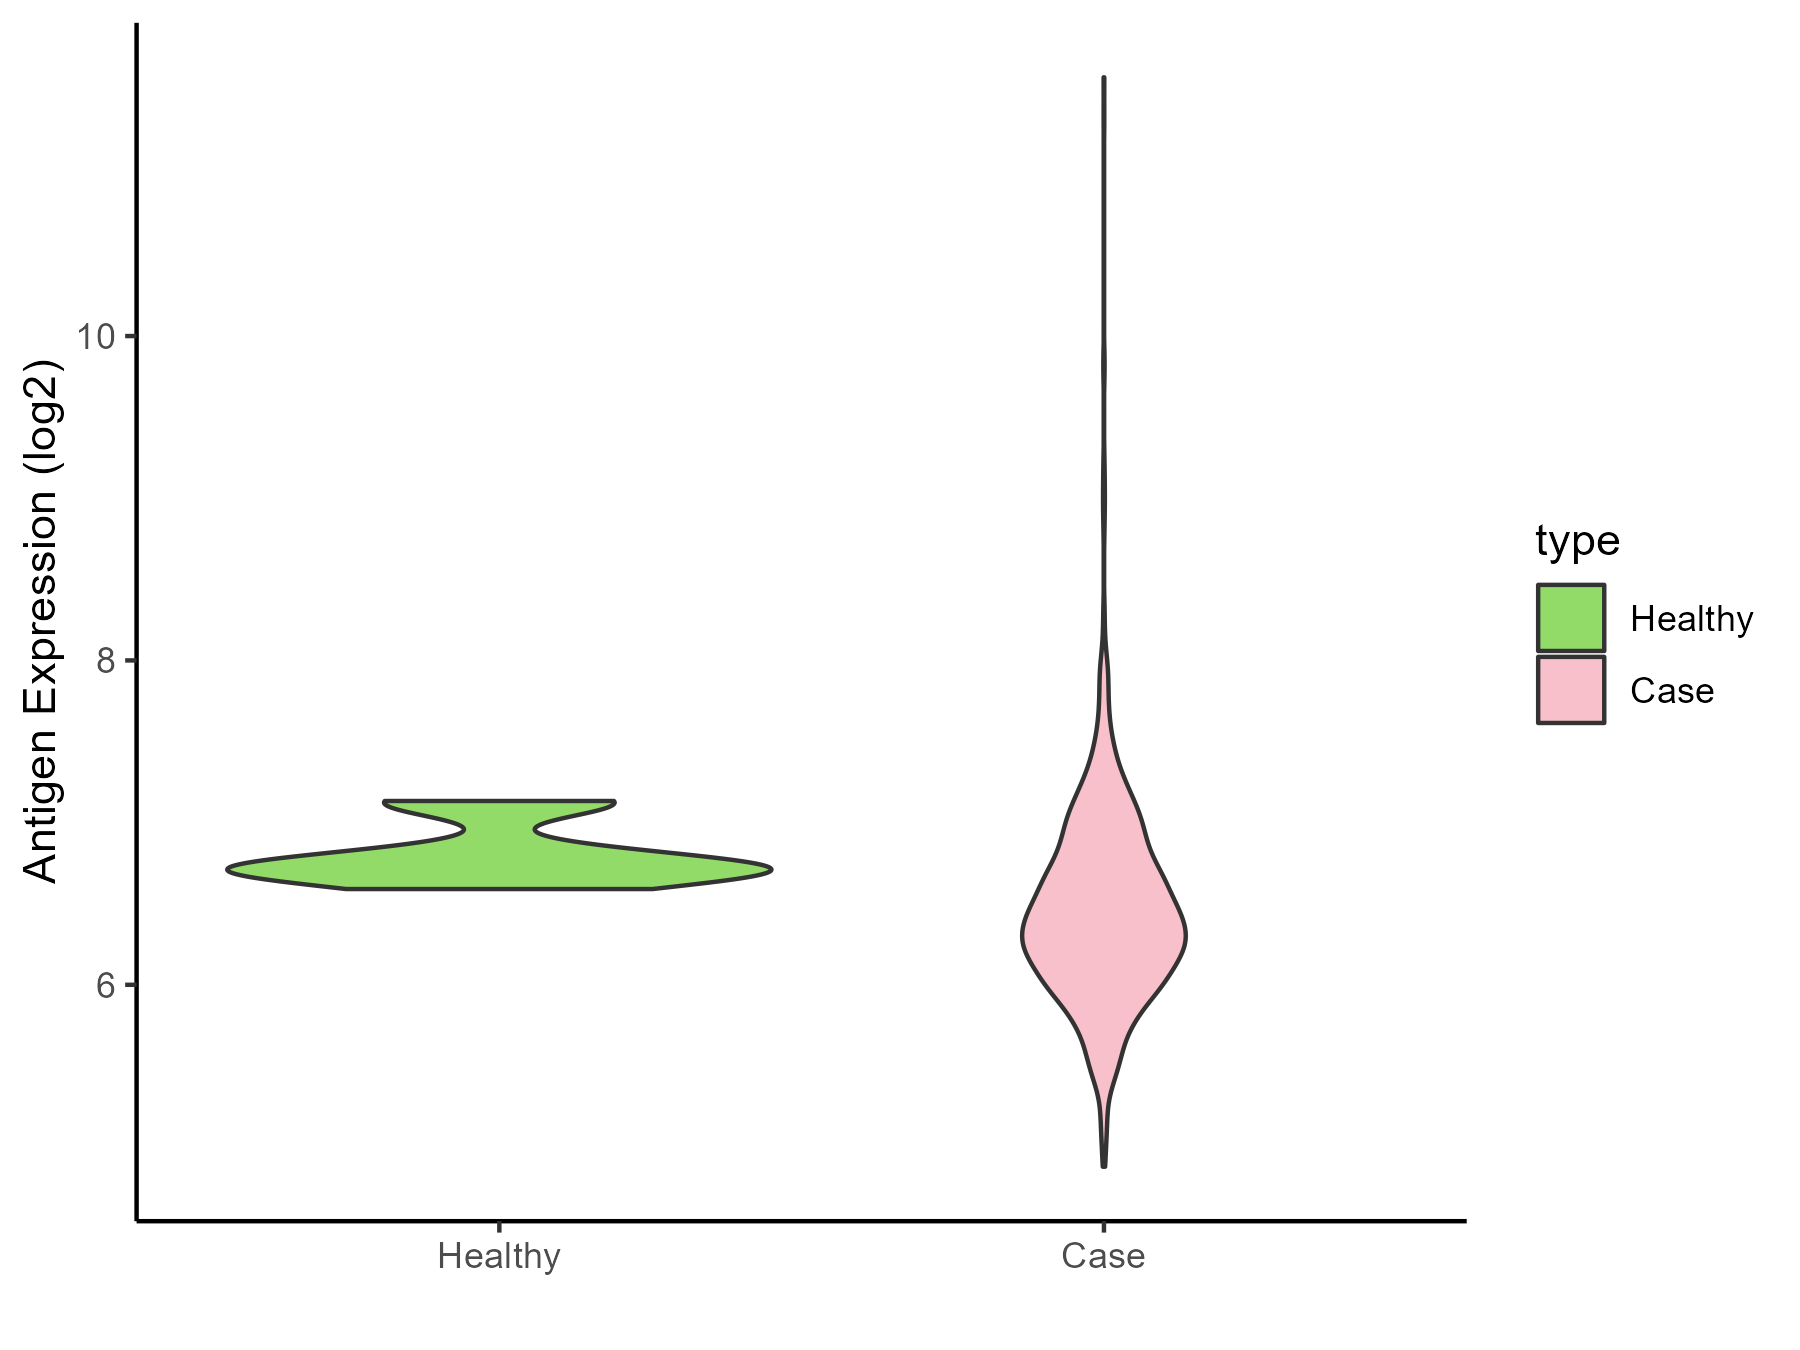
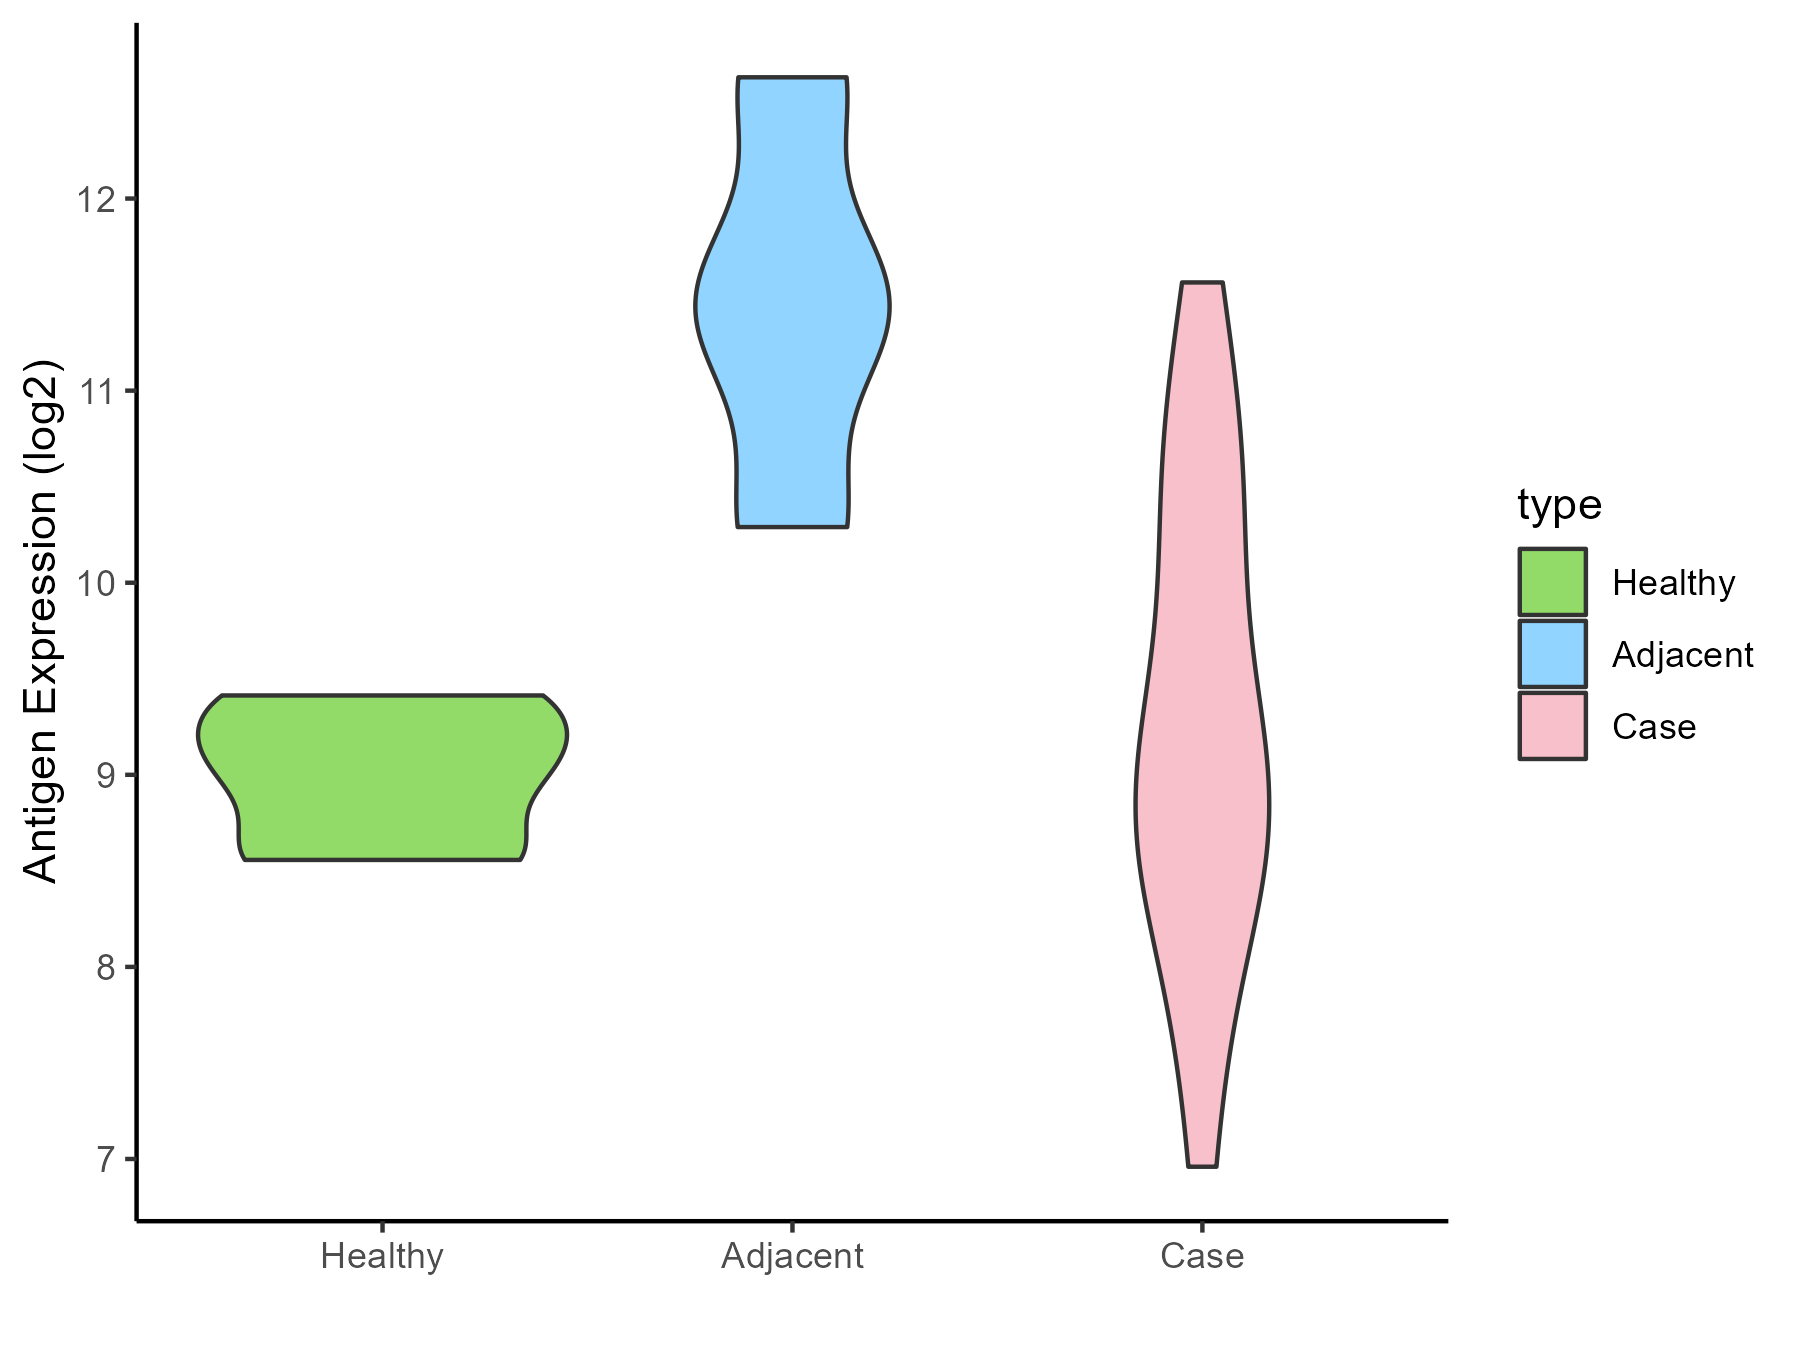
| The Studied Tissue |
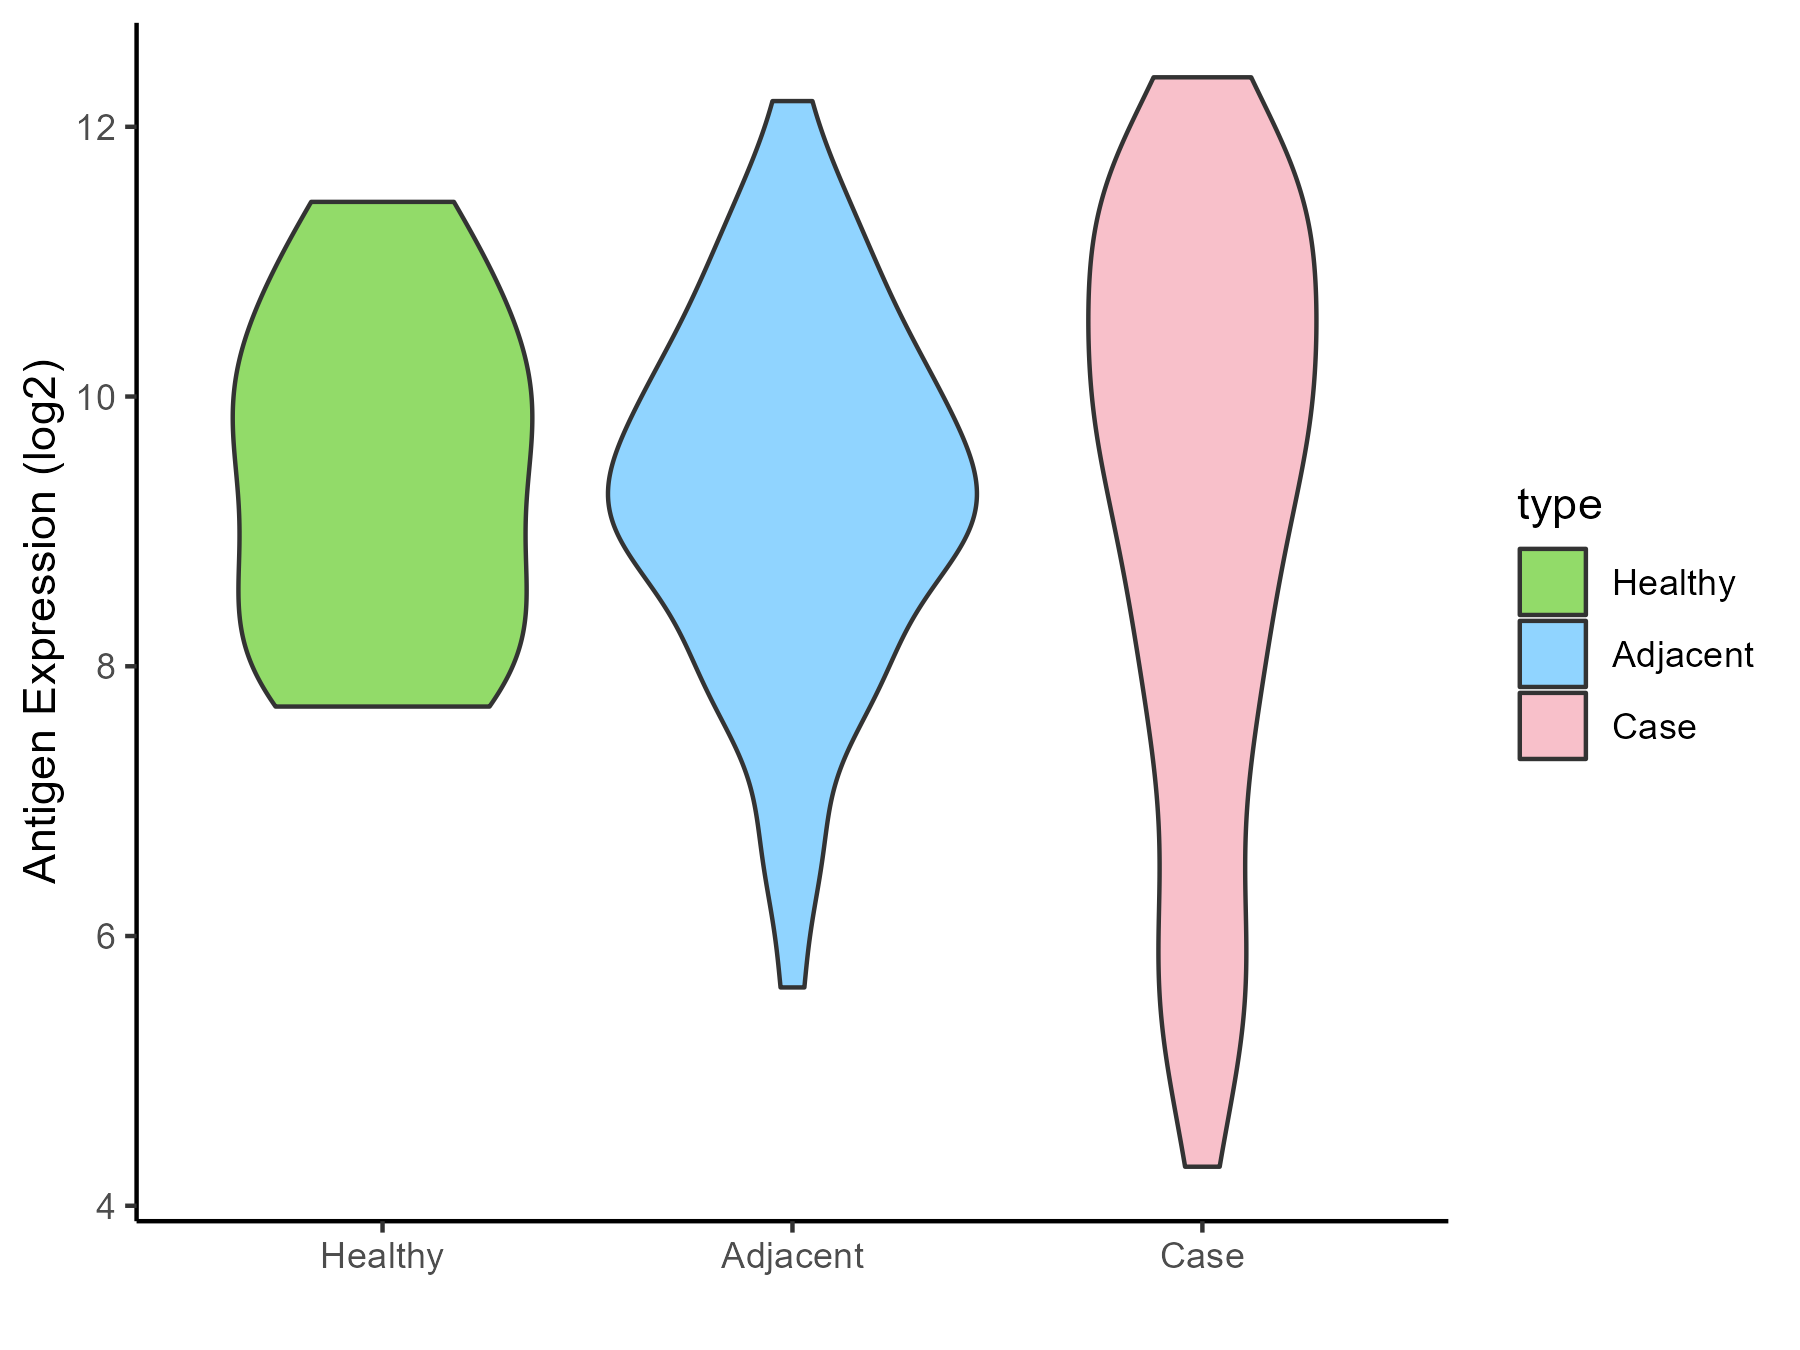
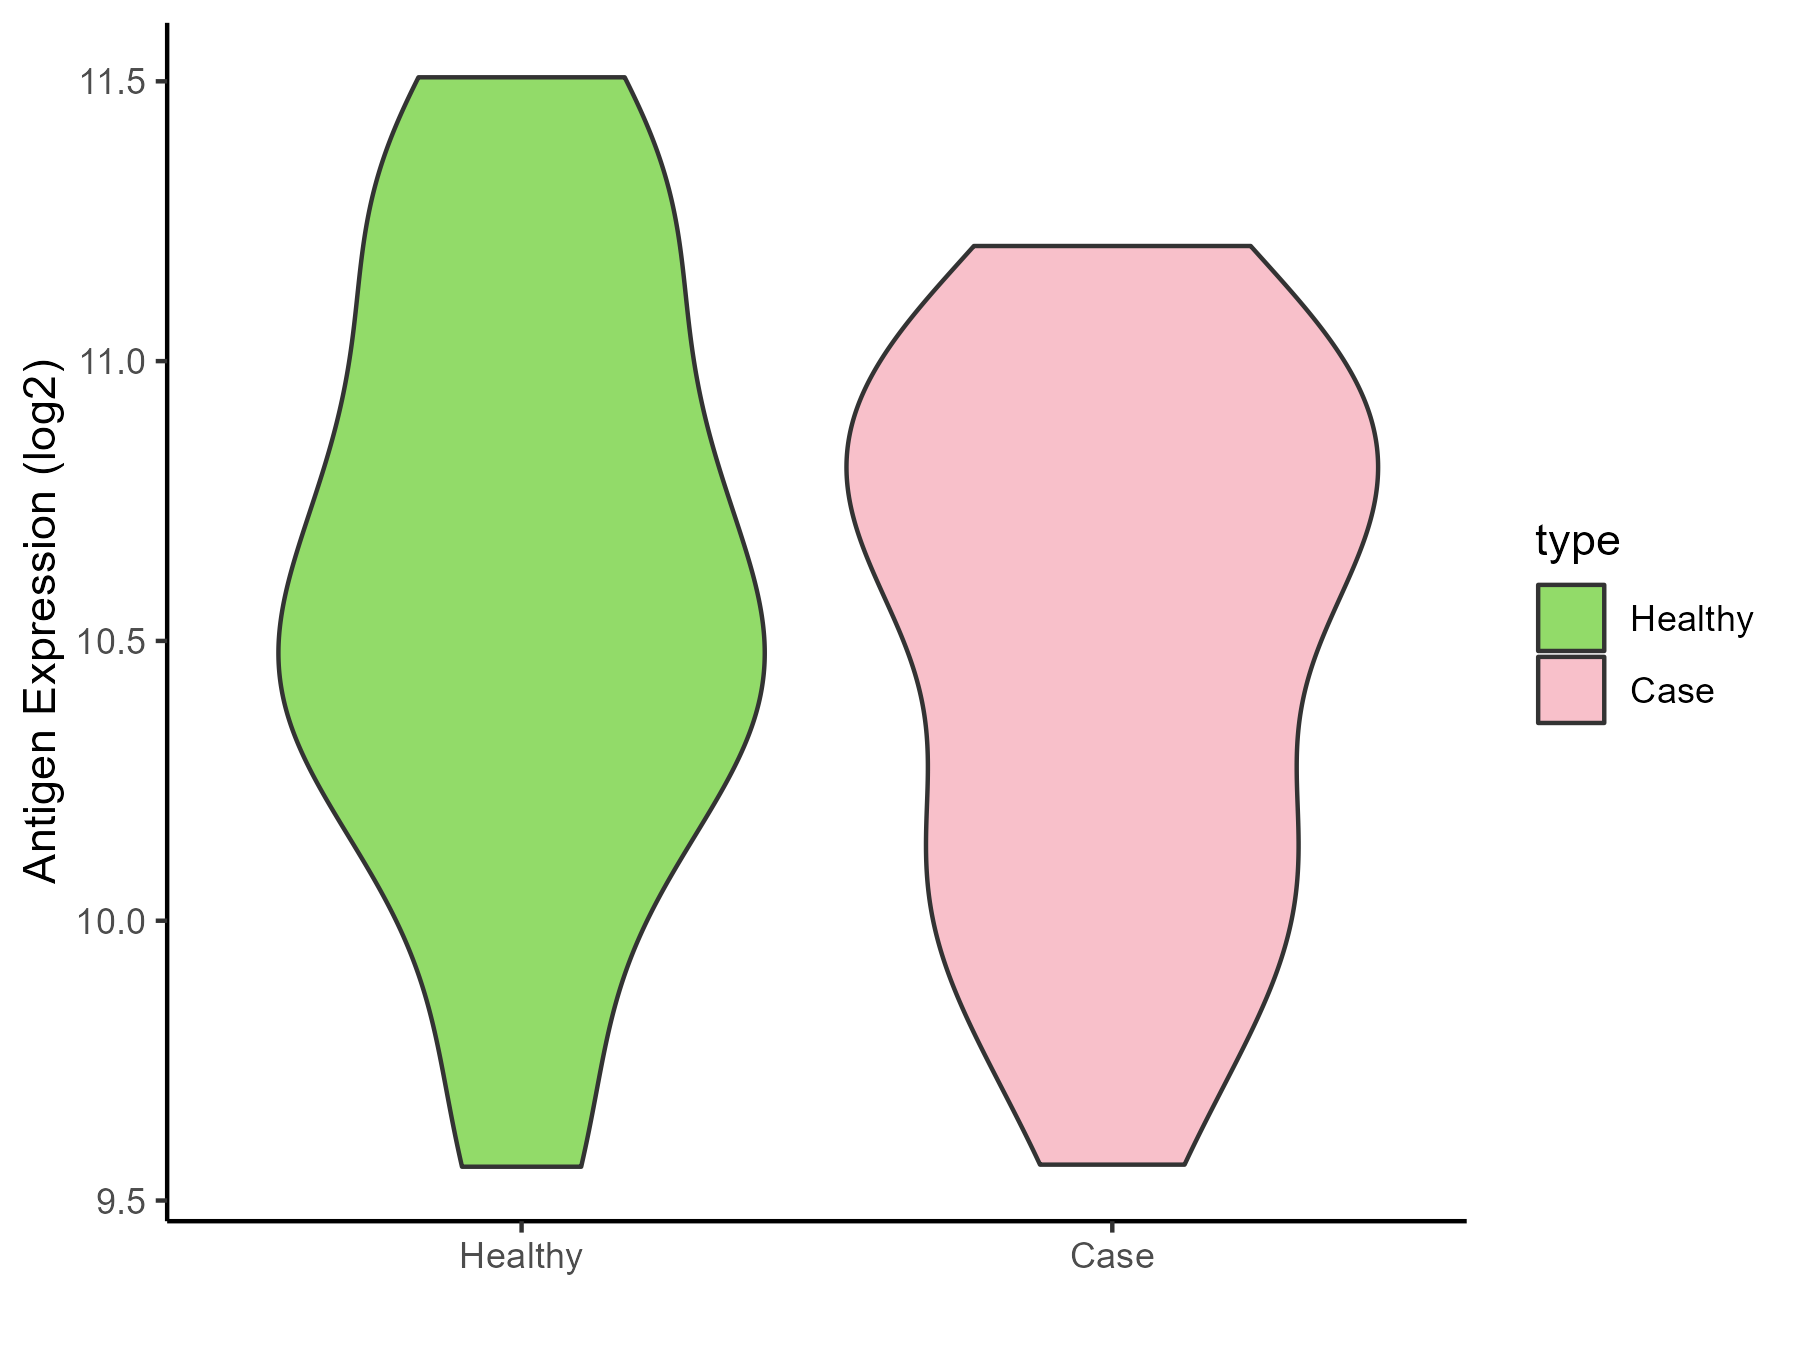
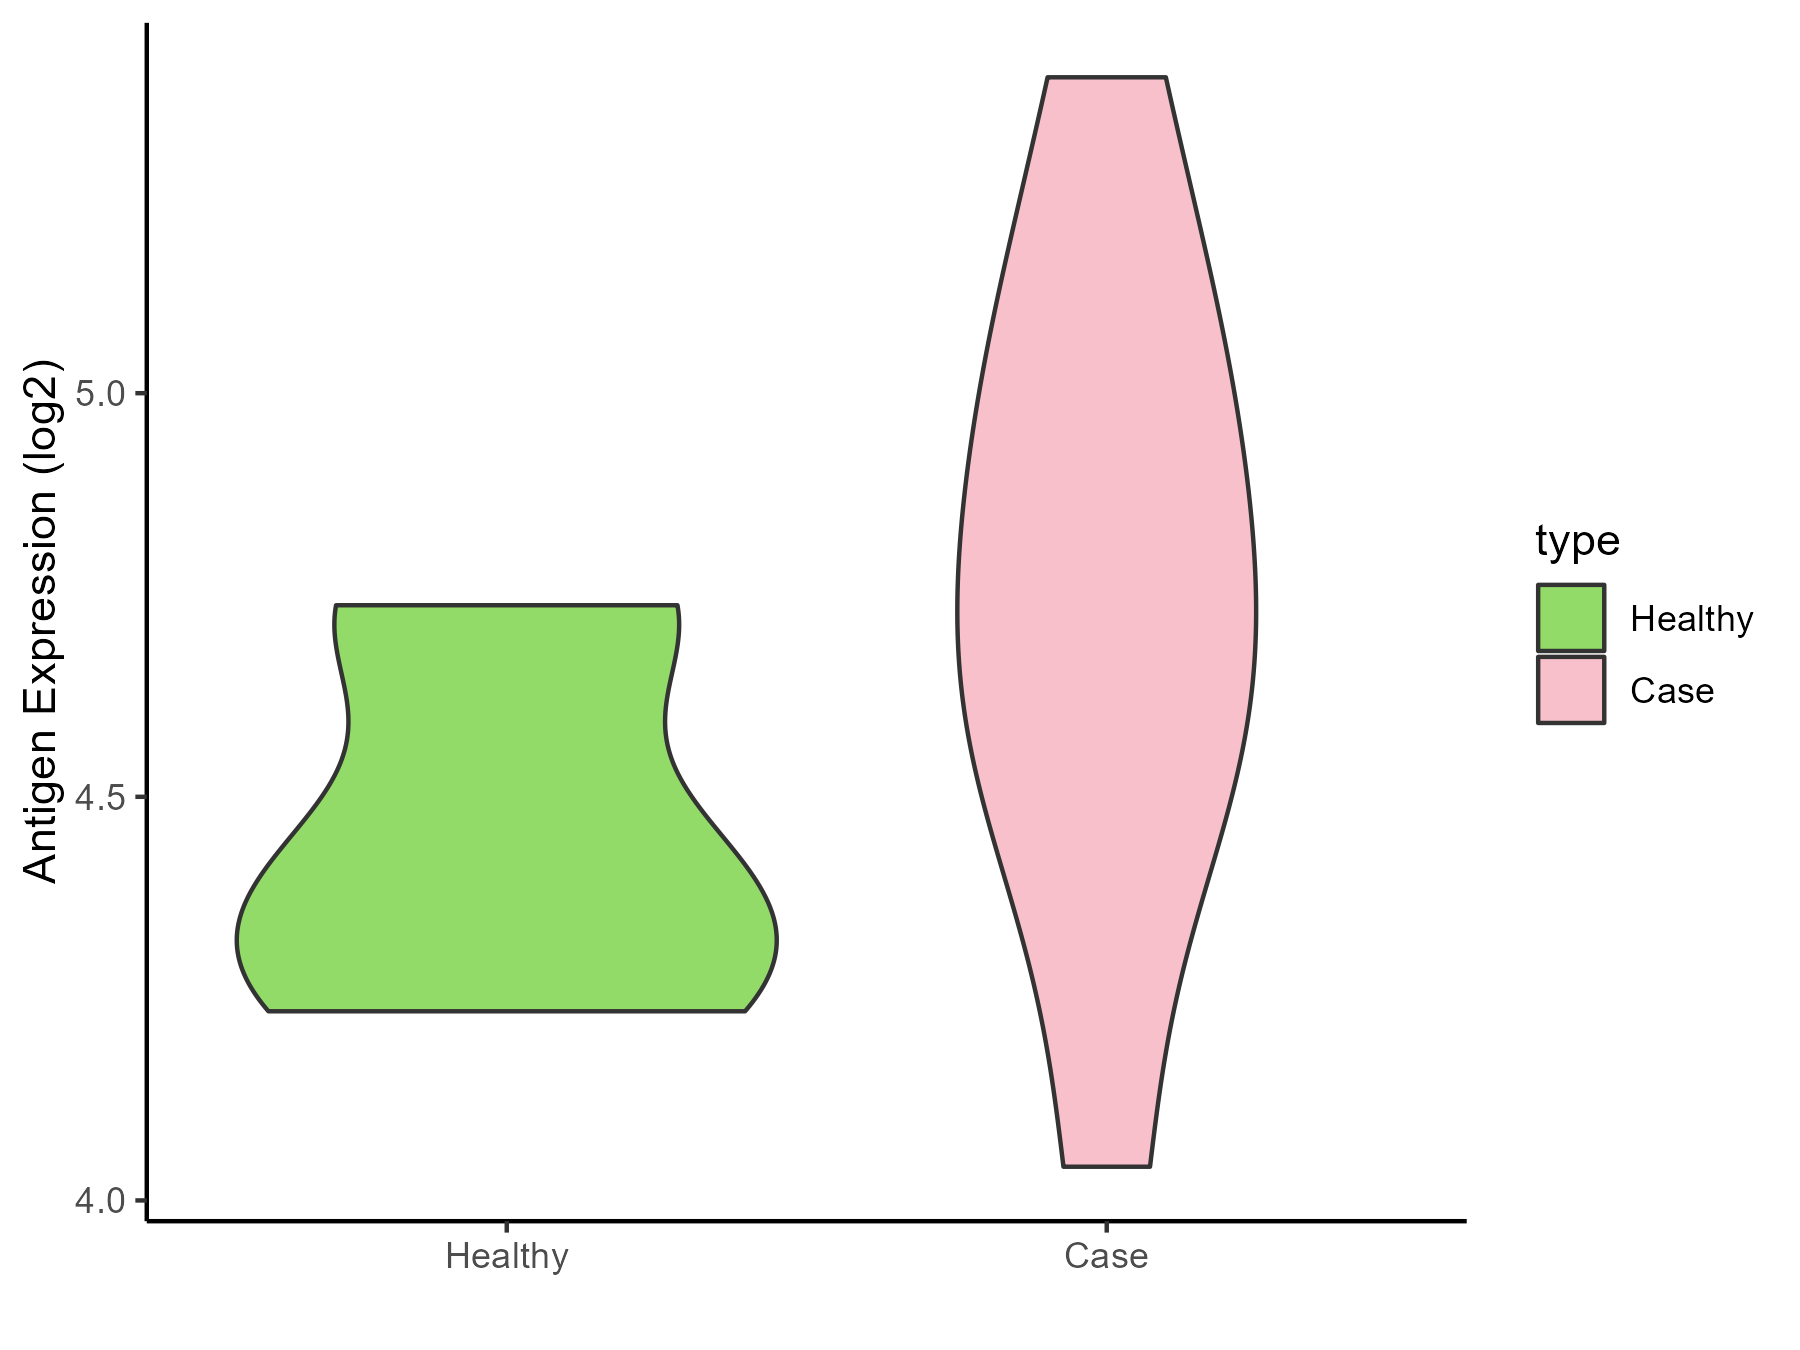
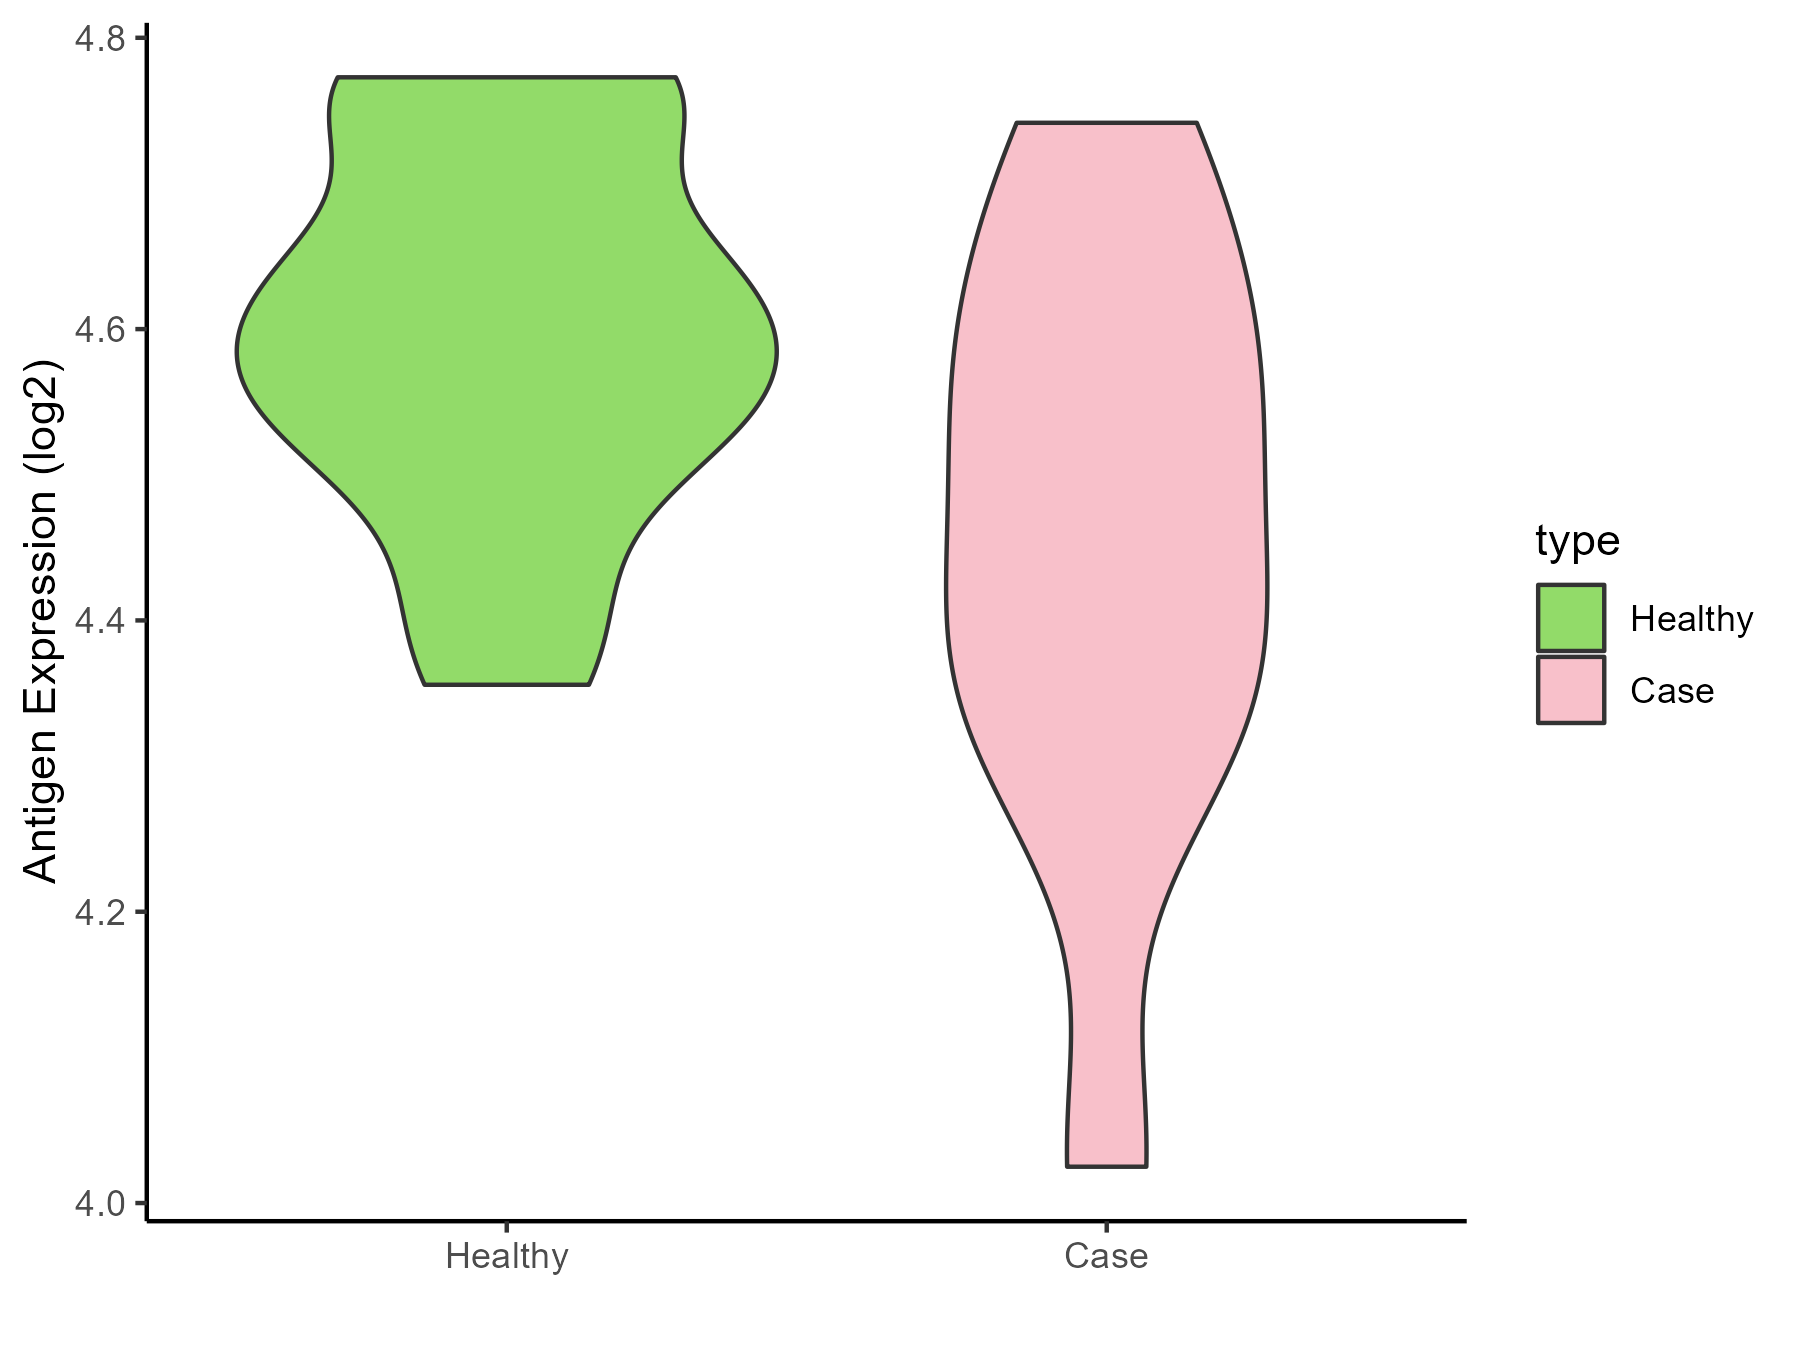
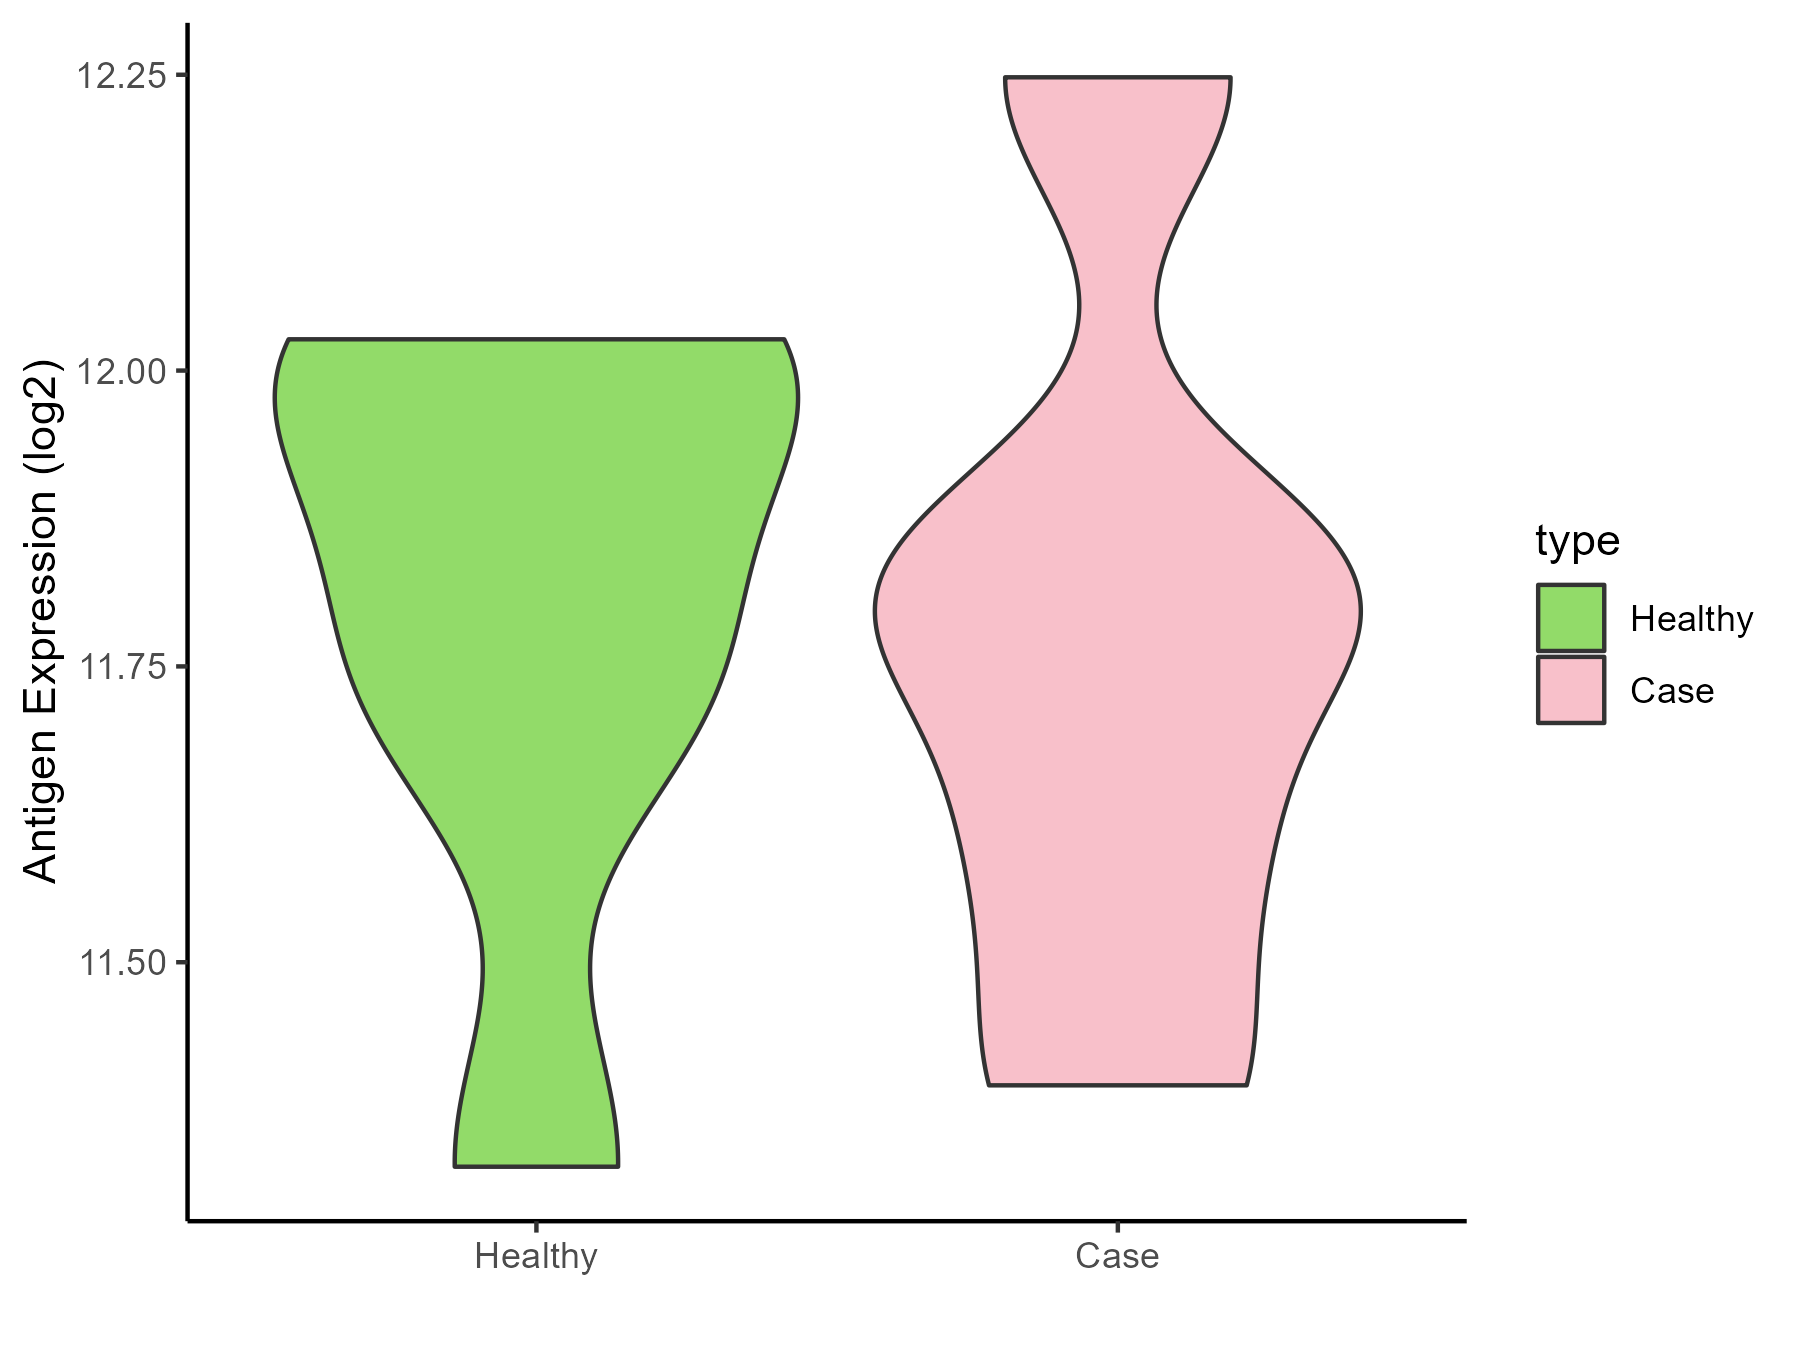
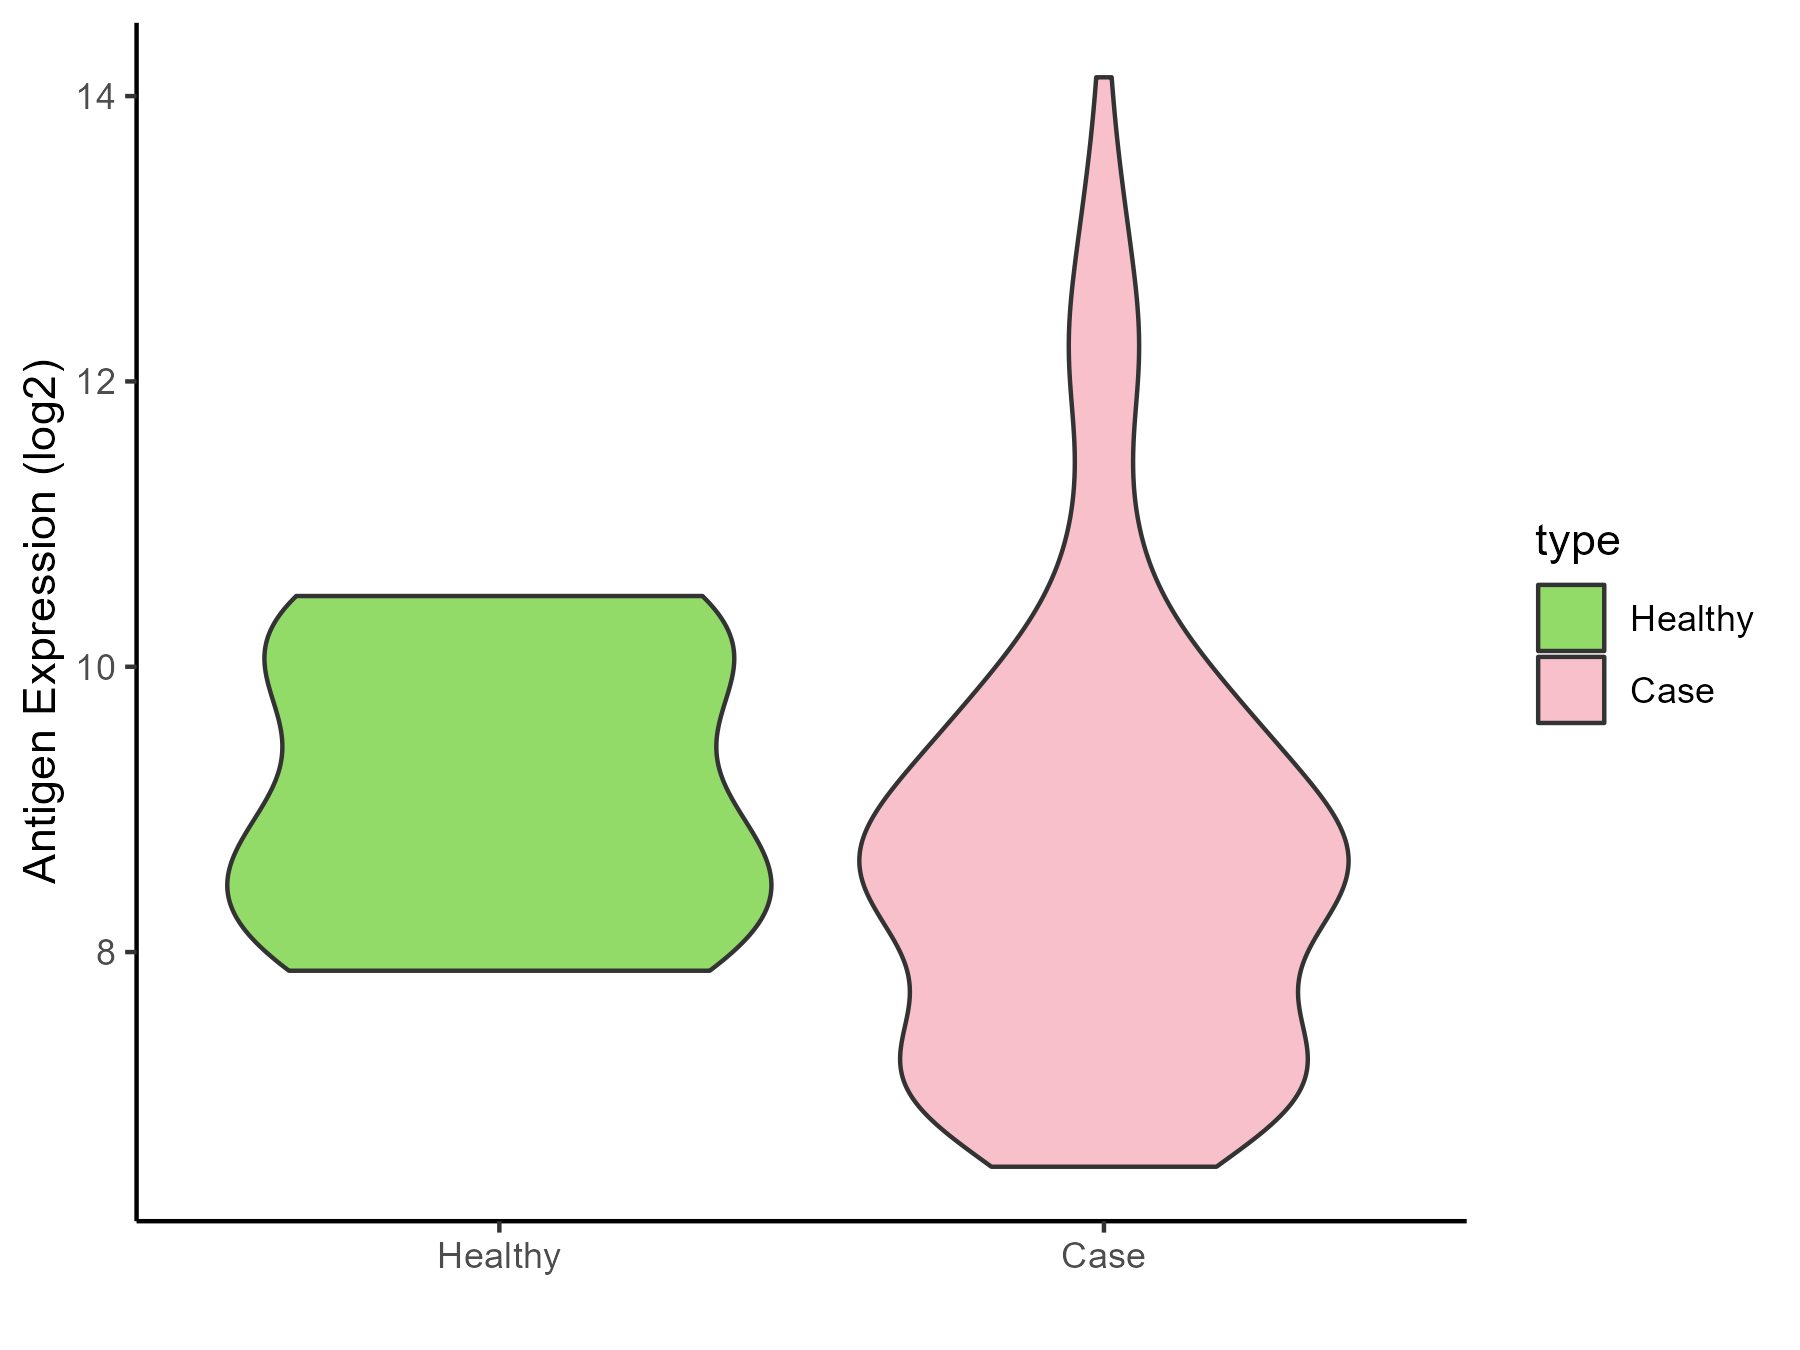
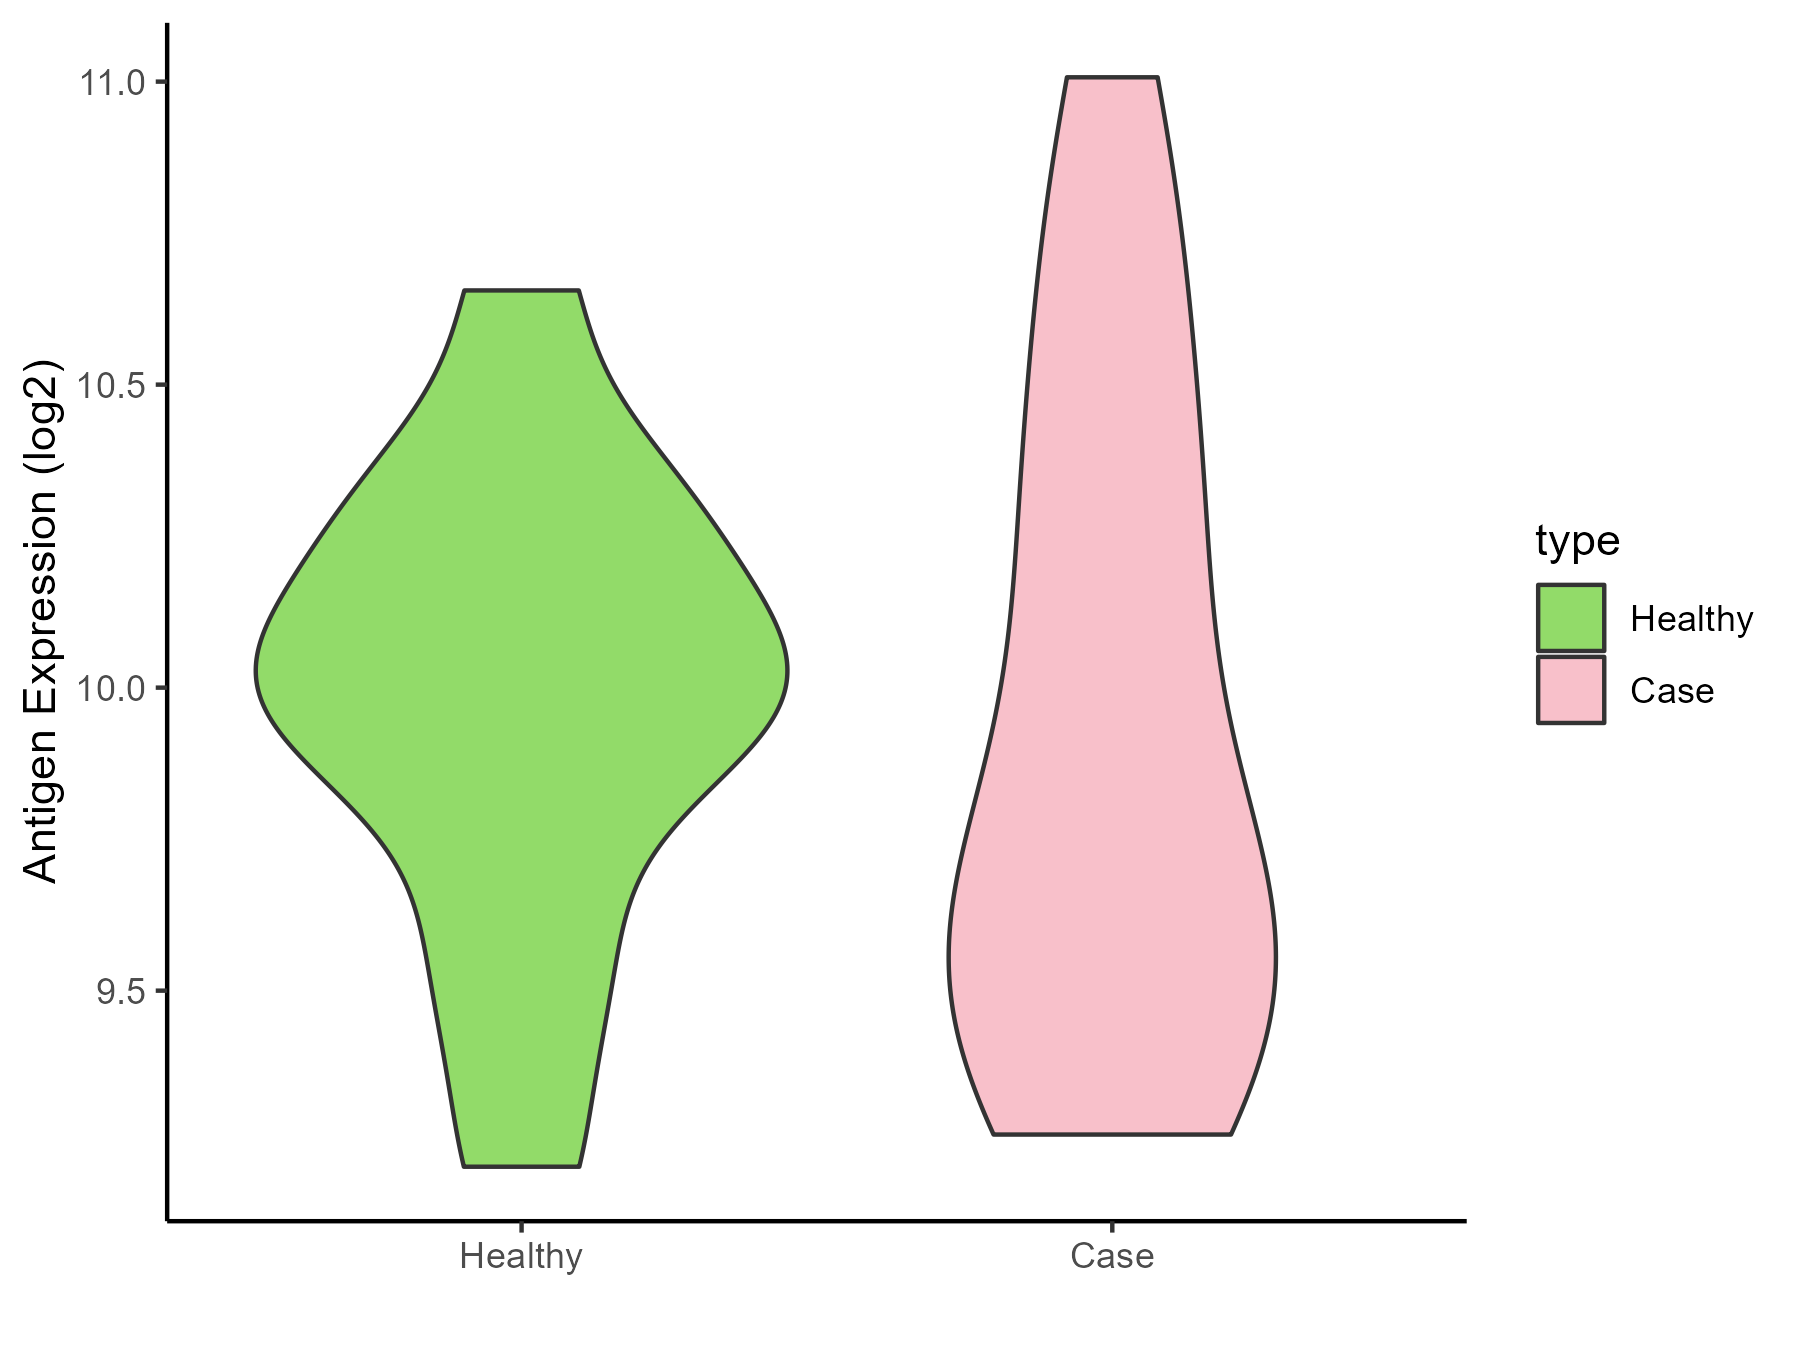
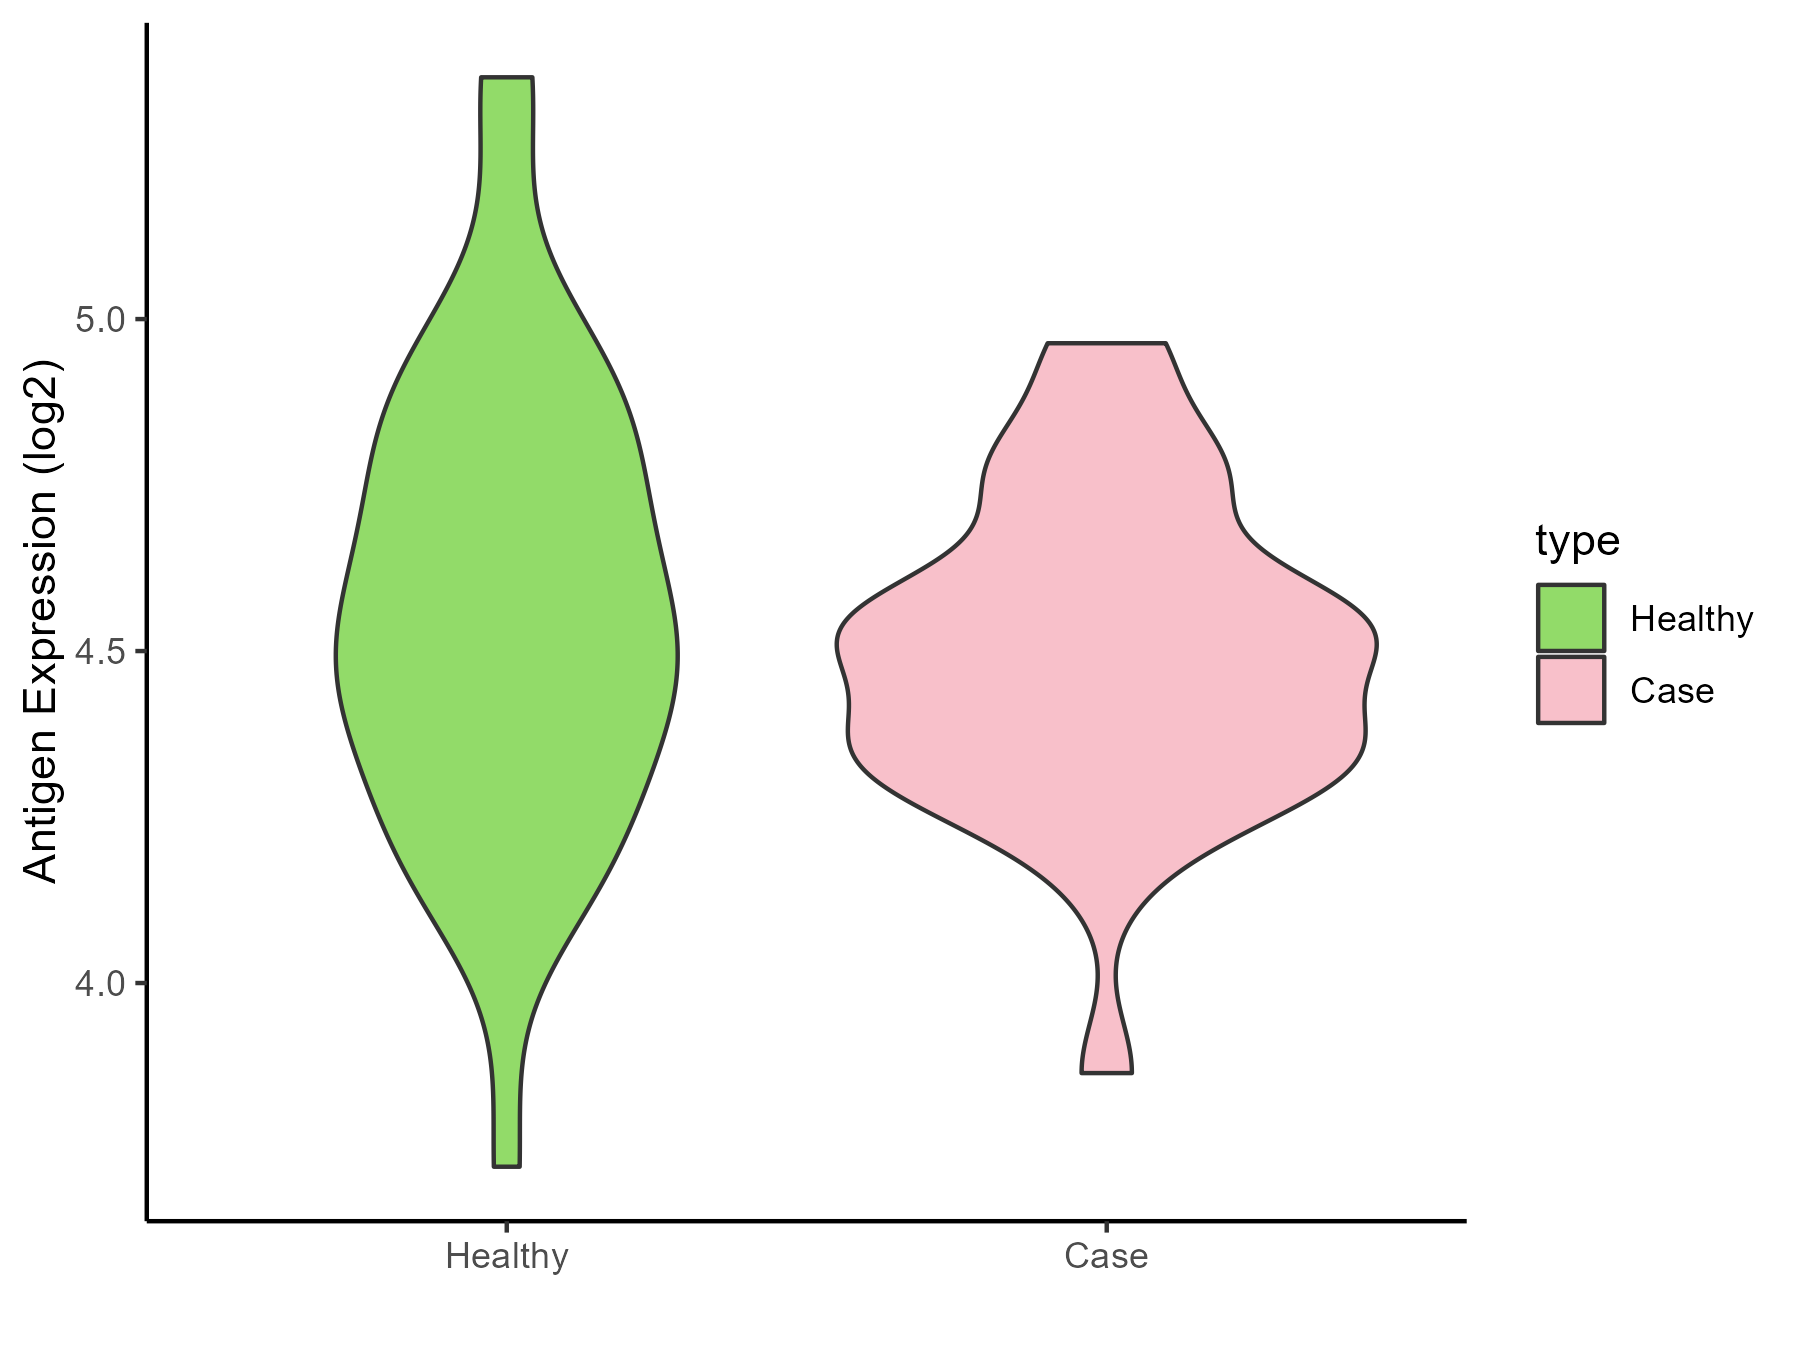
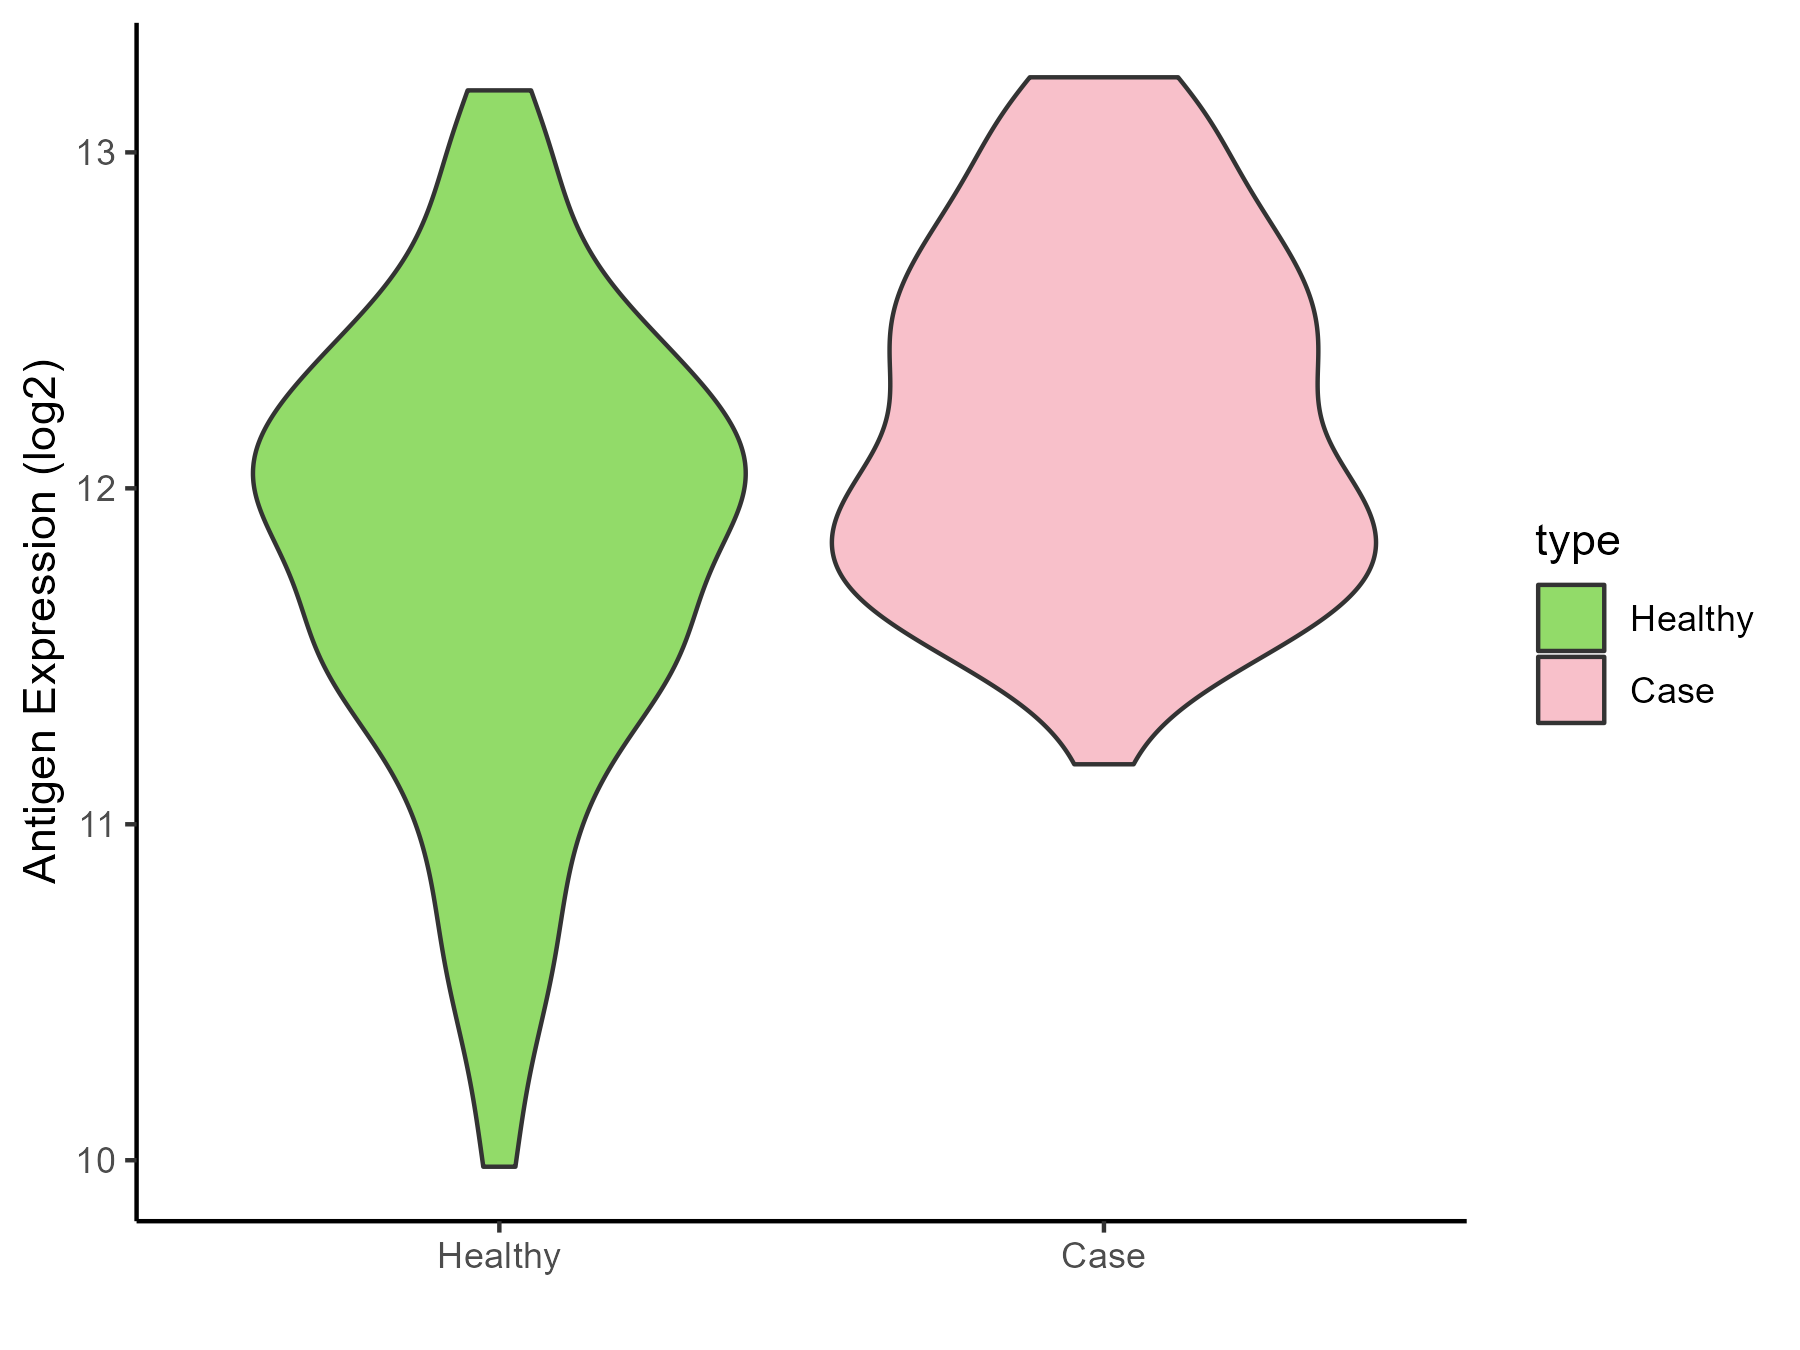
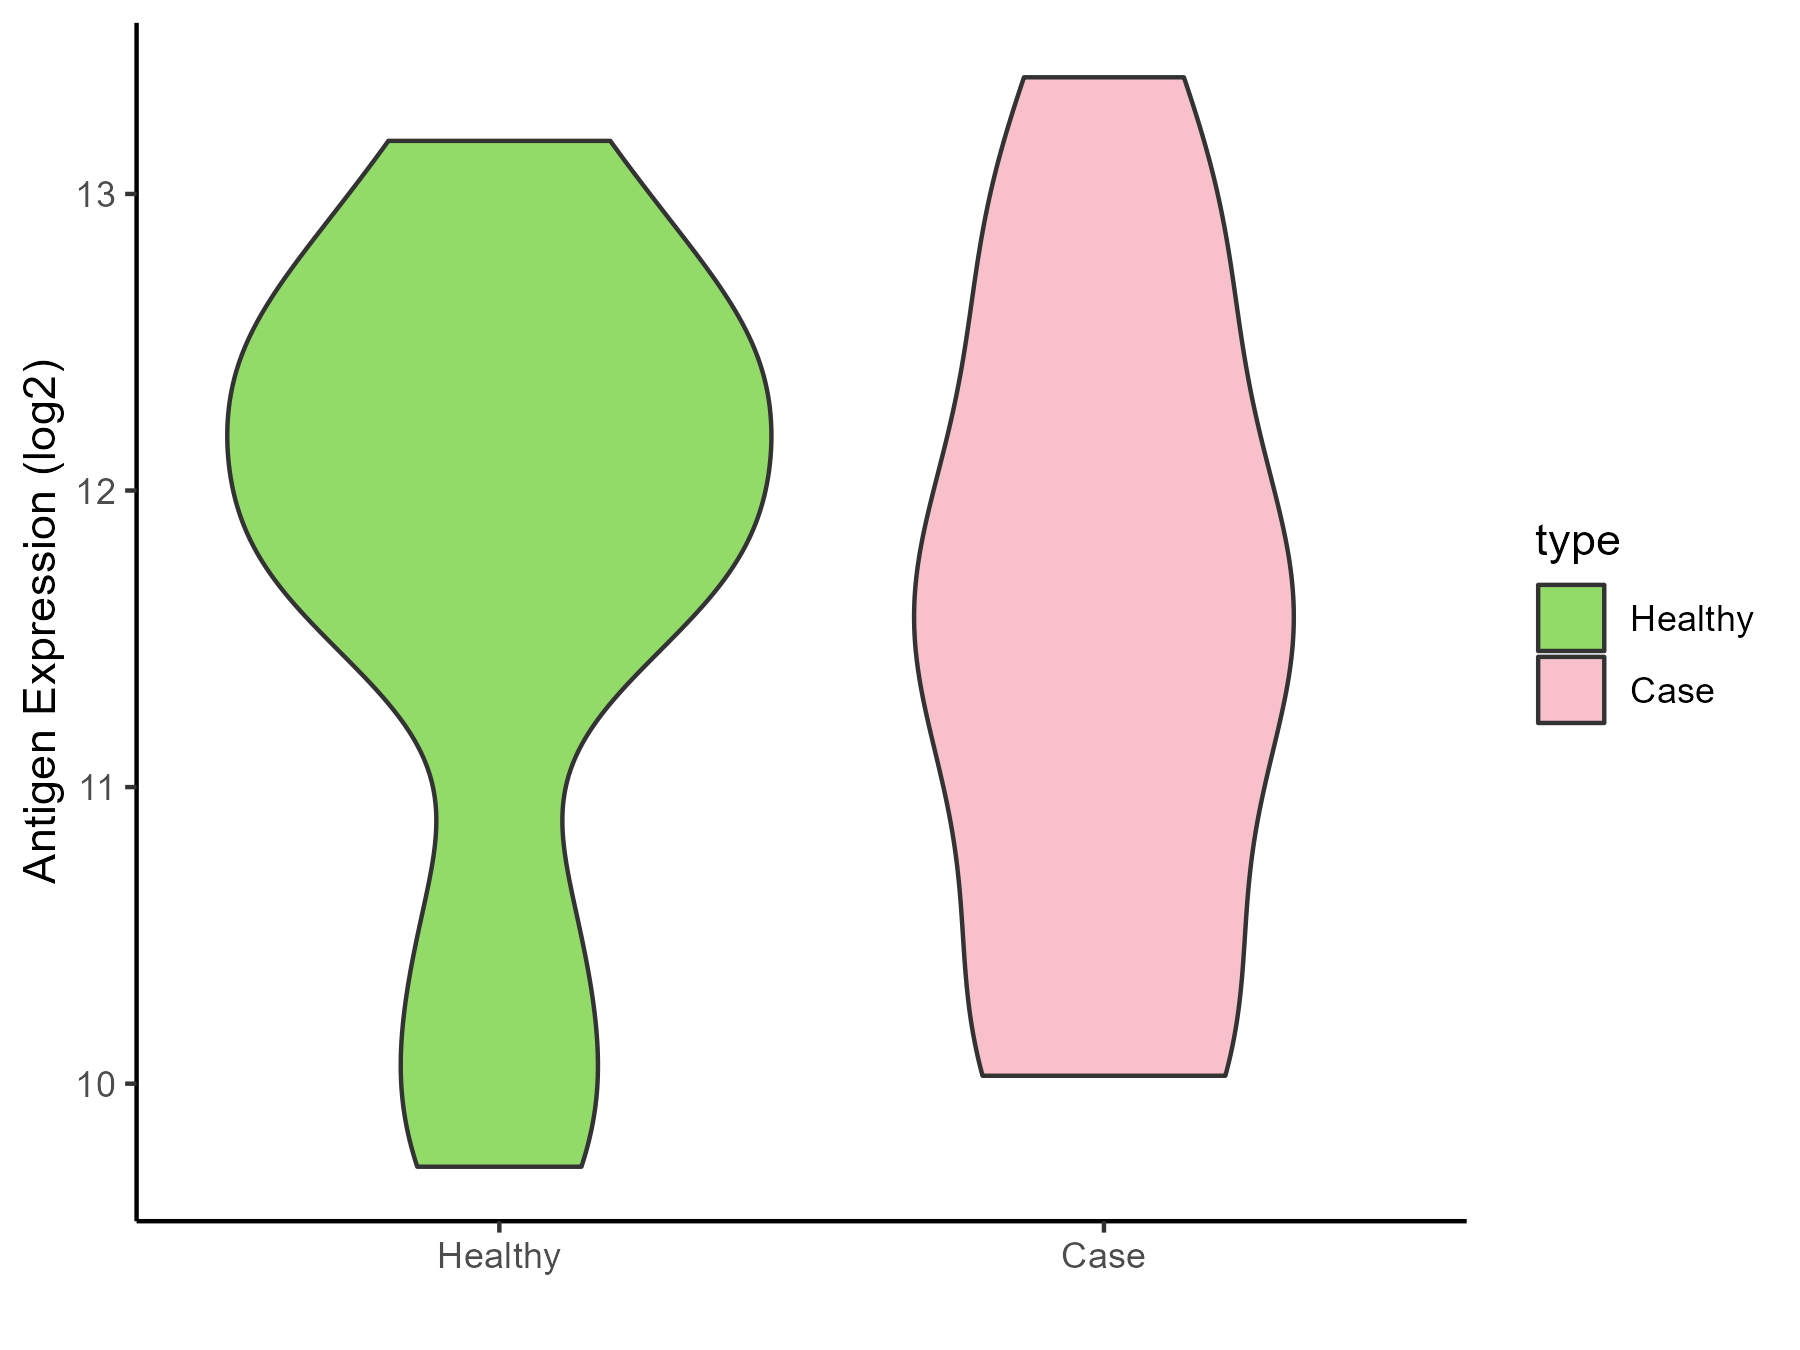
Brainstem |
| The Specific Disease |
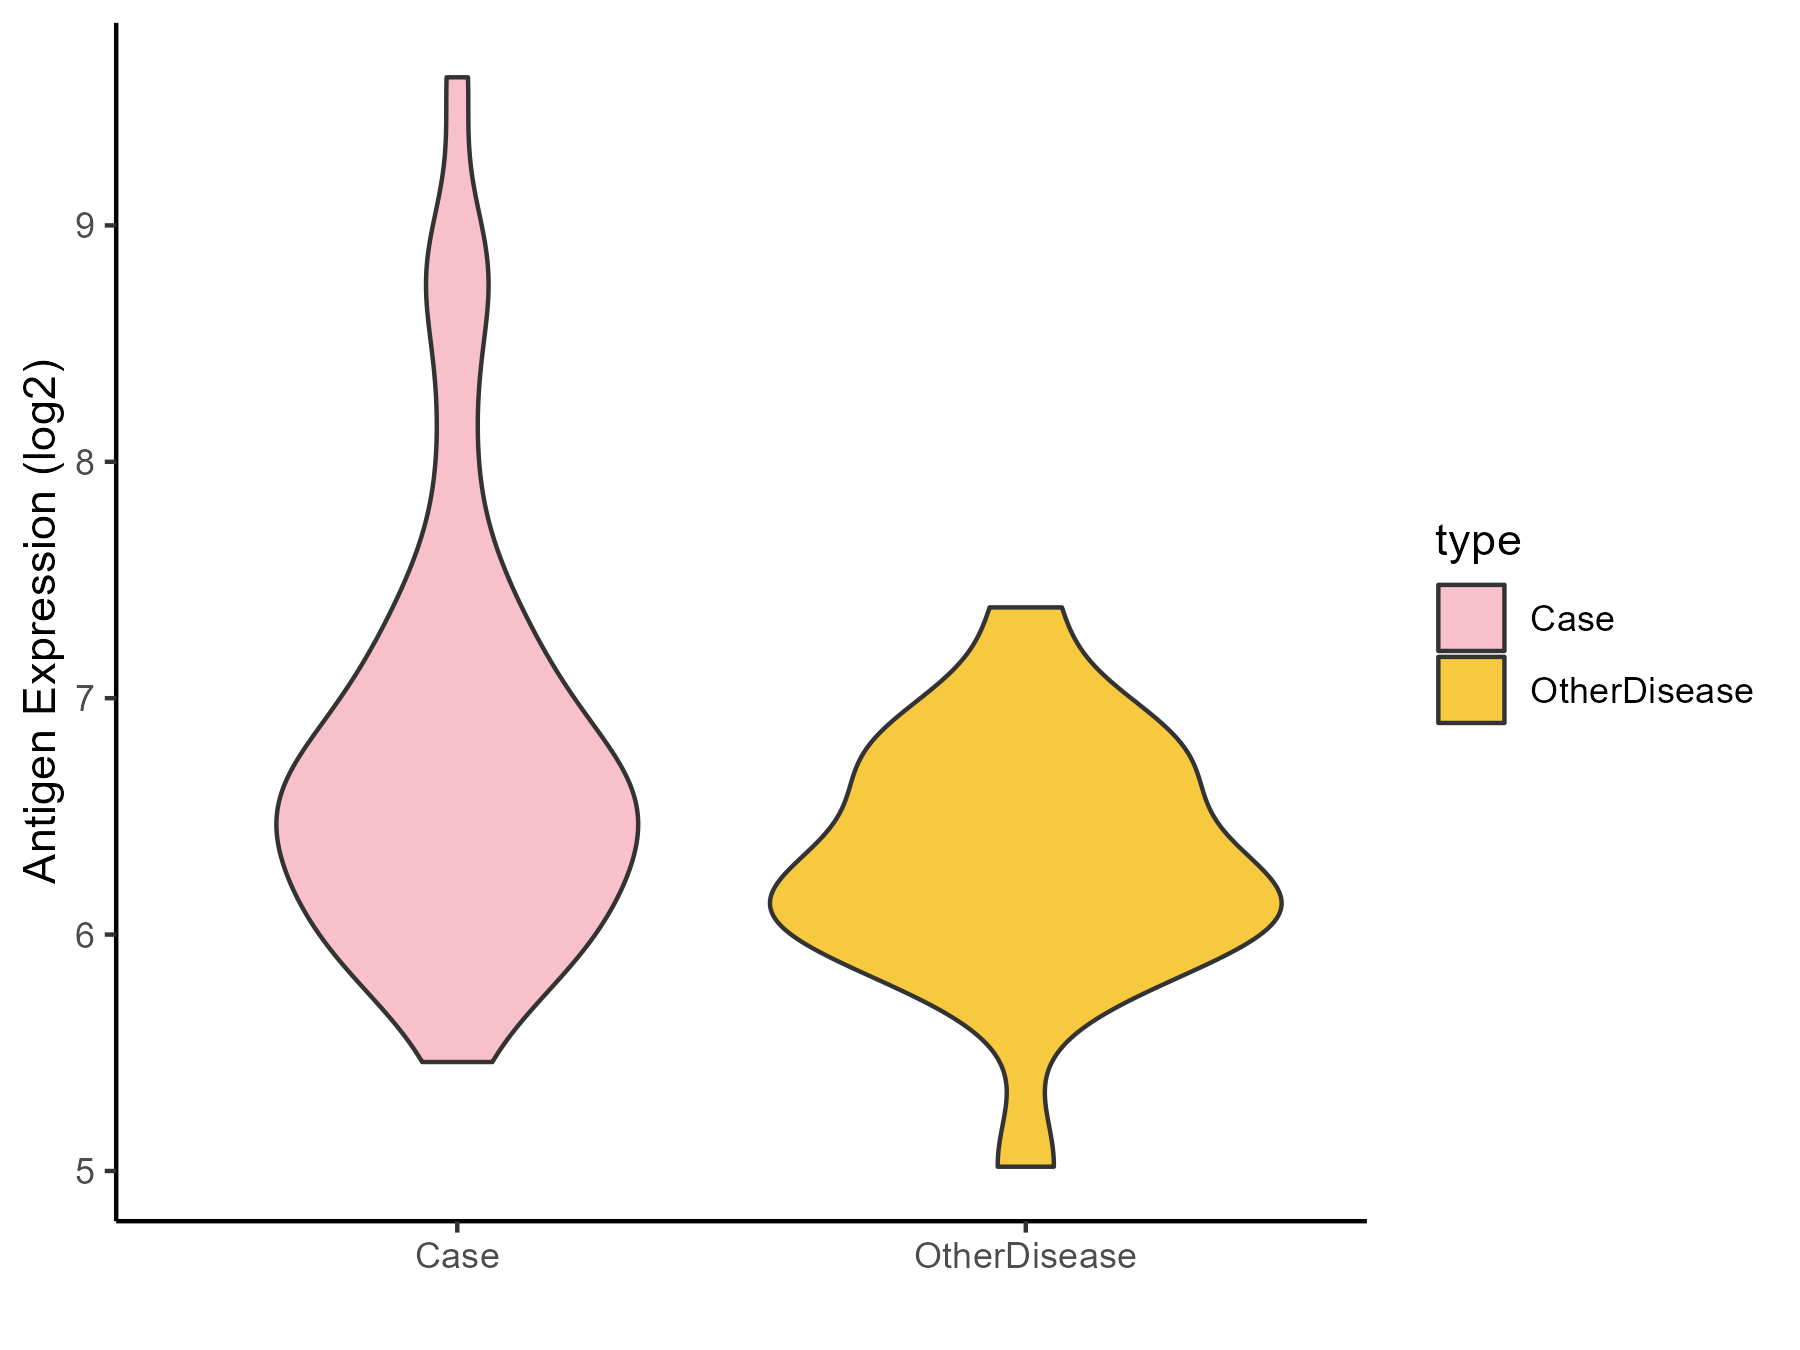
Neuroectodermal tumor |
| The Expression Level of Disease Section Compare with the Healthy Individual Tissue |
p-value: 3.87E-66;
Fold-change: -4.712255795;
Z-score: -25.02721981
|
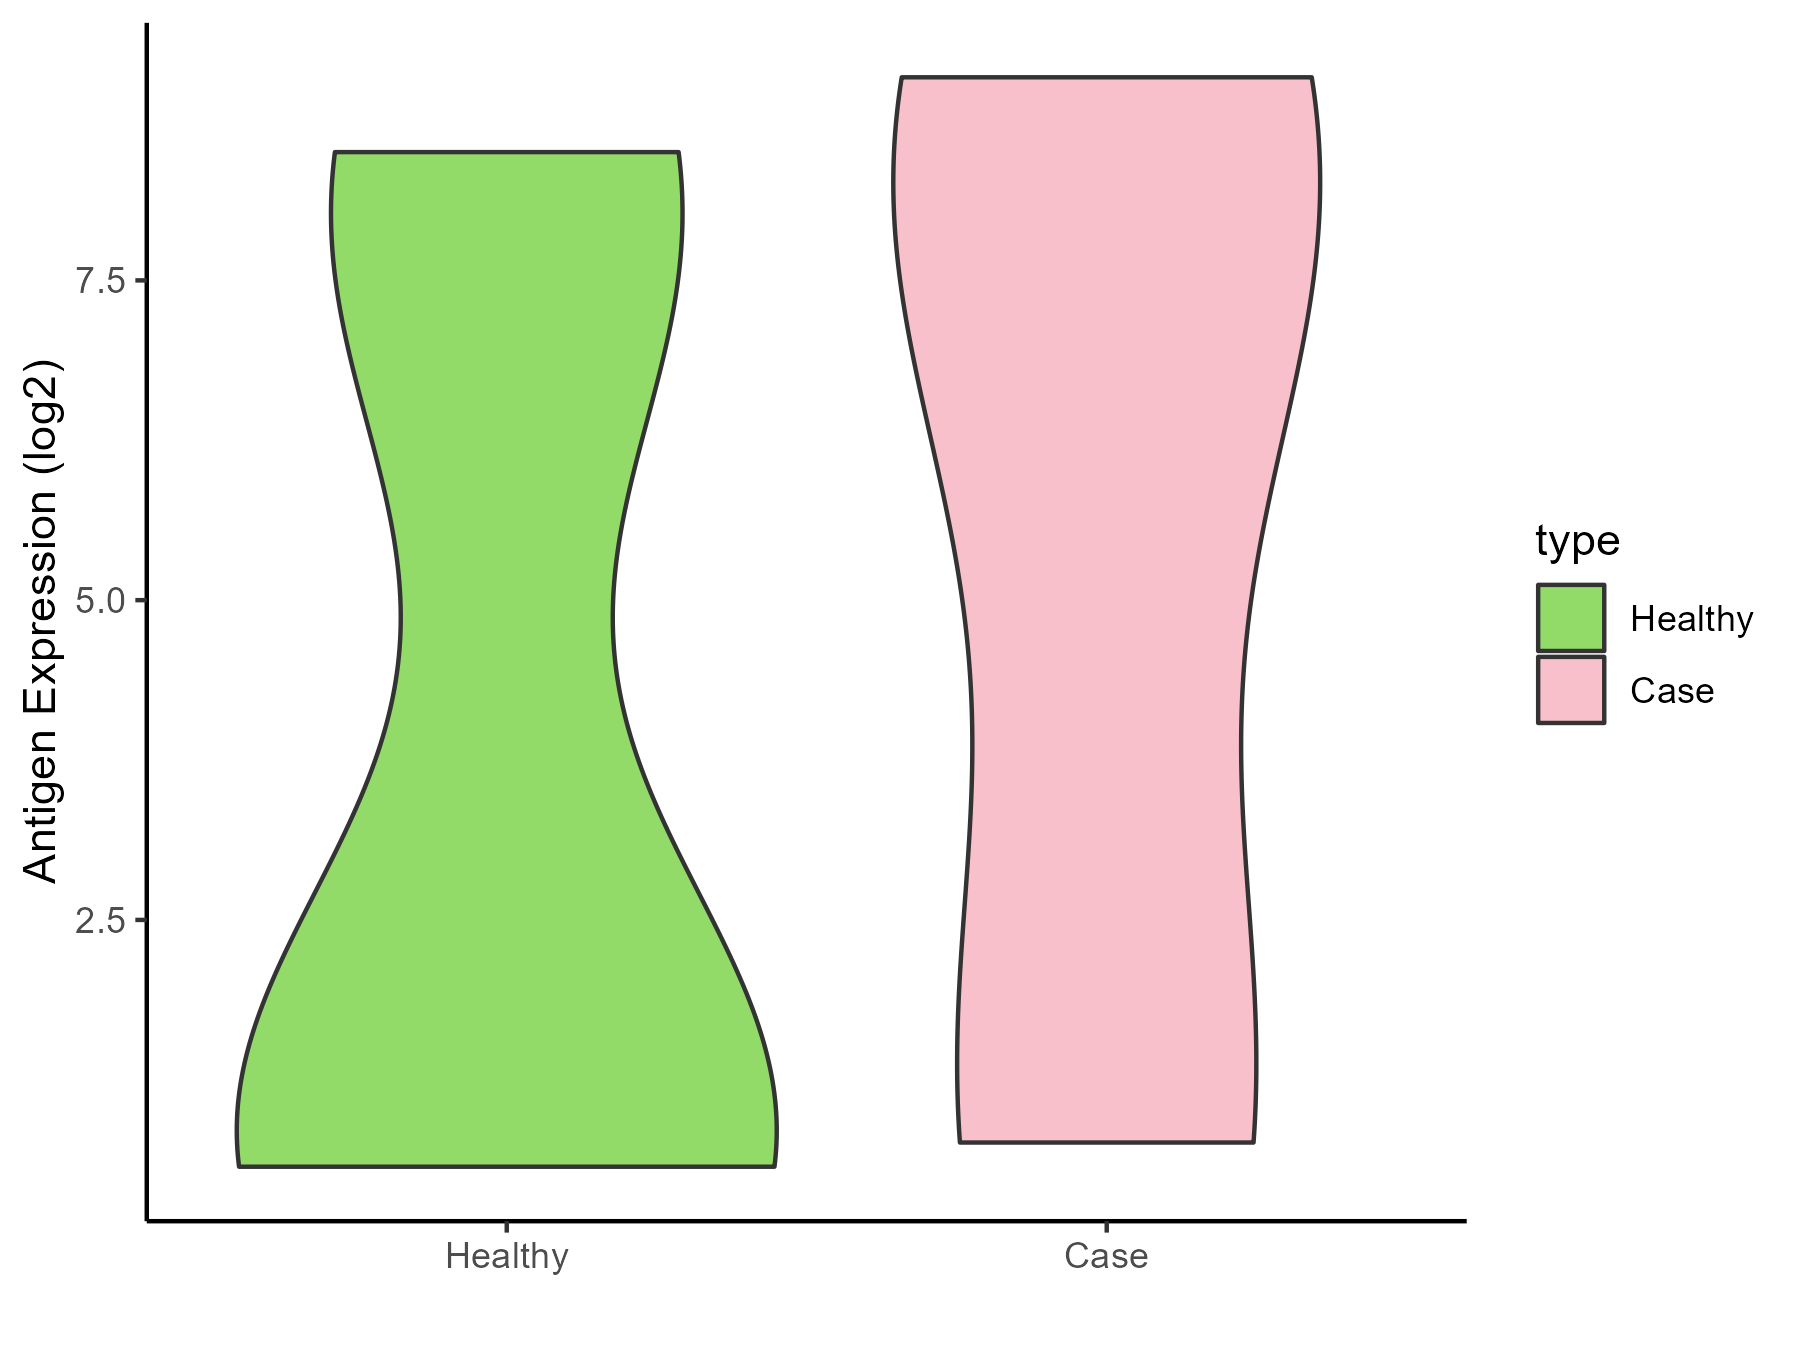
| Disease-specific Antigen Abundances |
|
Click to View the Clearer Original Diagram
|
|
|
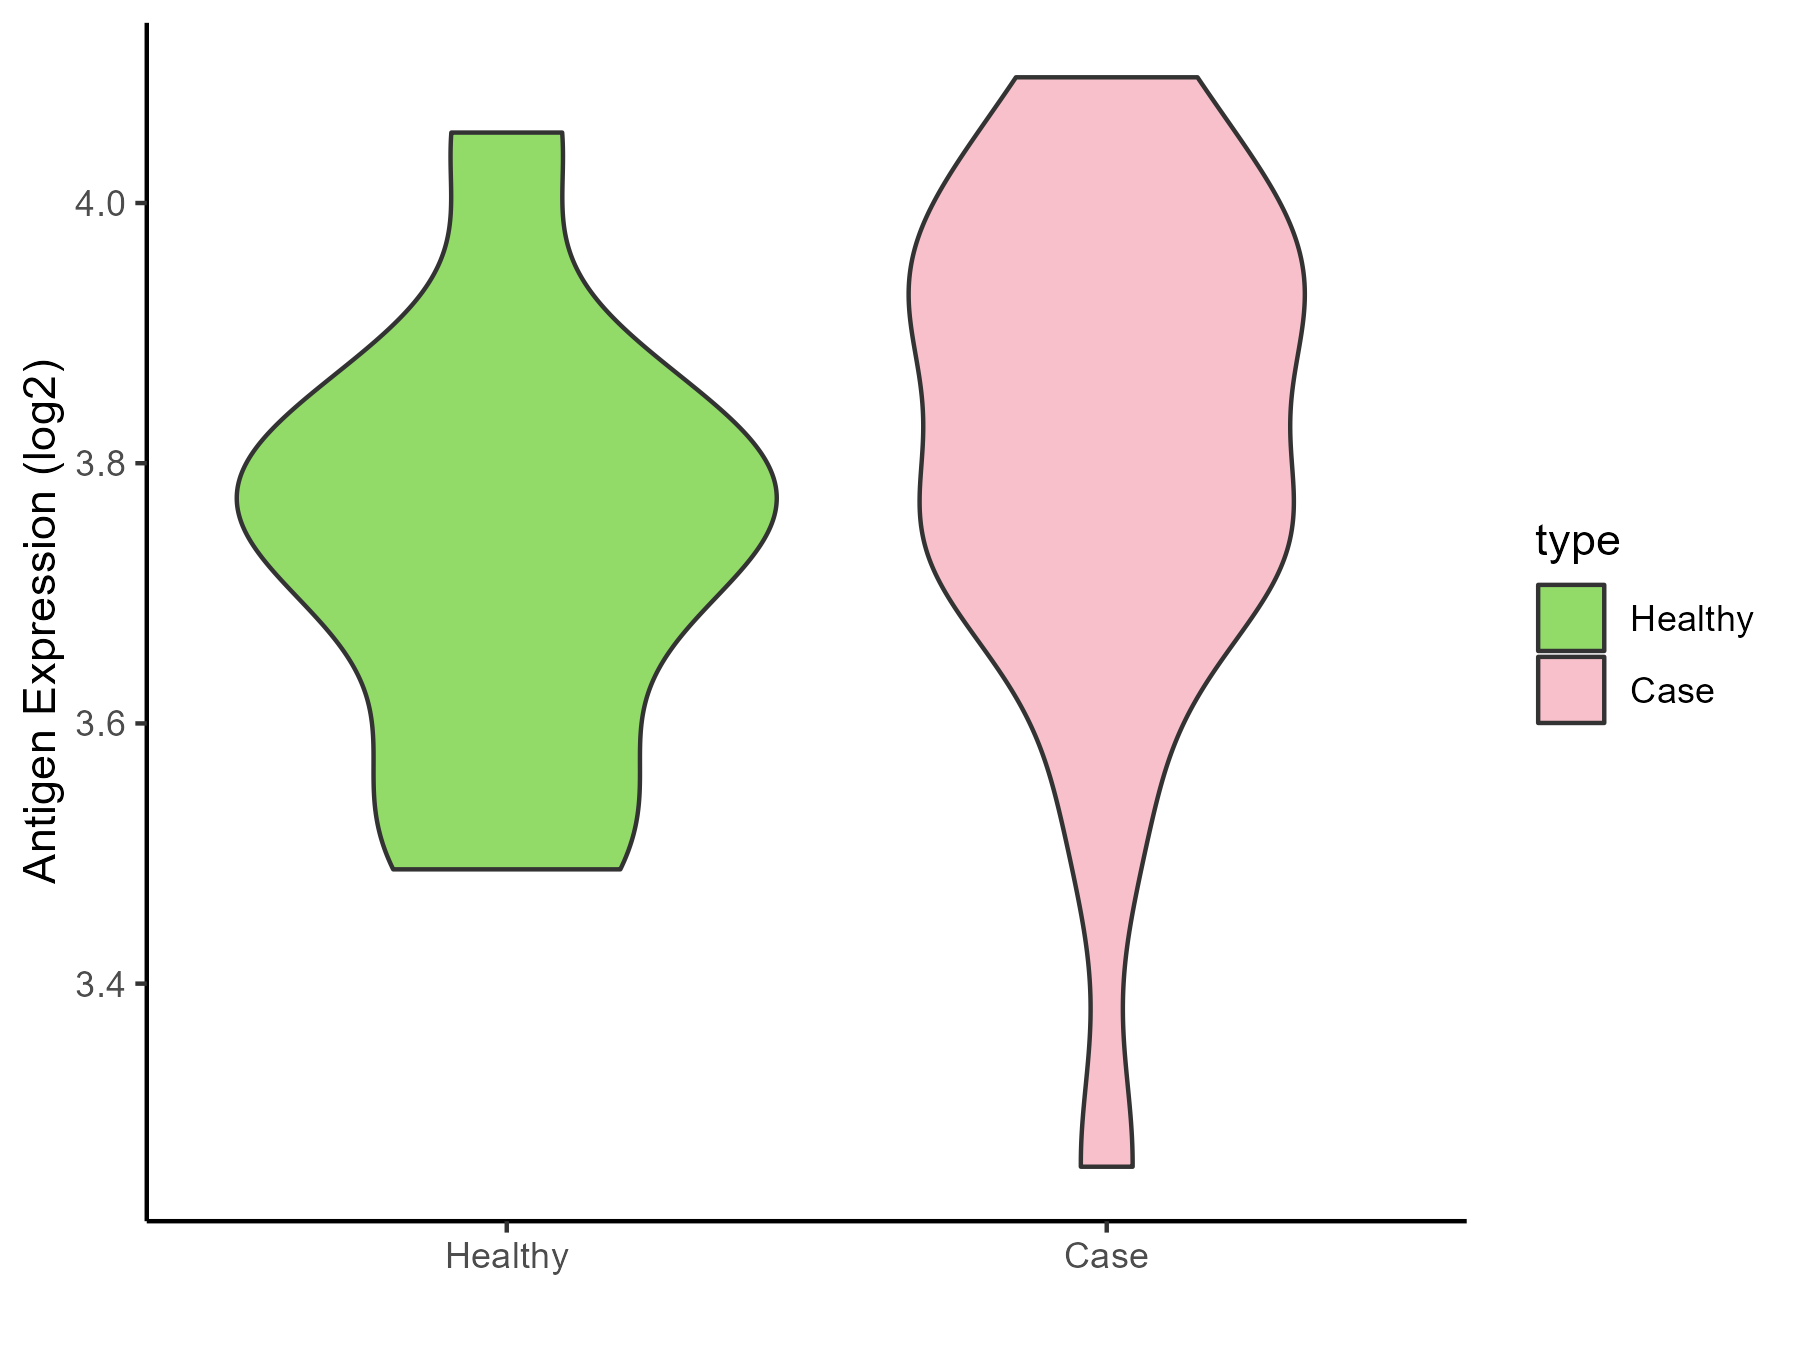
| The Studied Tissue |
Nervous |
| The Specific Disease |
Brain cancer |
| The Expression Level of Disease Section Compare with the Healthy Individual Tissue |
p-value: 8.91E-48;
Fold-change: -1.730326485;
Z-score: -1.183772897
|
| Disease-specific Antigen Abundances |
|
Click to View the Clearer Original Diagram
|
|
|
Chronic myeloid leukemia [ICD-11: 2A20]
Click to Show/Hide
| Differential expression pattern of antigen in diseases |
| The Studied Tissue |
Whole blood |
| The Specific Disease |
Myelofibrosis |
| The Expression Level of Disease Section Compare with the Healthy Individual Tissue |
p-value: 0.284837425;
Fold-change: 0.084548692;
Z-score: 0.429591857
|
| Disease-specific Antigen Abundances |
|
Click to View the Clearer Original Diagram
|
|
|
| The Studied Tissue |
Whole blood |
| The Specific Disease |
Polycythemia vera |
| The Expression Level of Disease Section Compare with the Healthy Individual Tissue |
p-value: 0.766564911;
Fold-change: 0.0035627;
Z-score: 0.0194001
|
| Disease-specific Antigen Abundances |
|
Click to View the Clearer Original Diagram
|
|
|
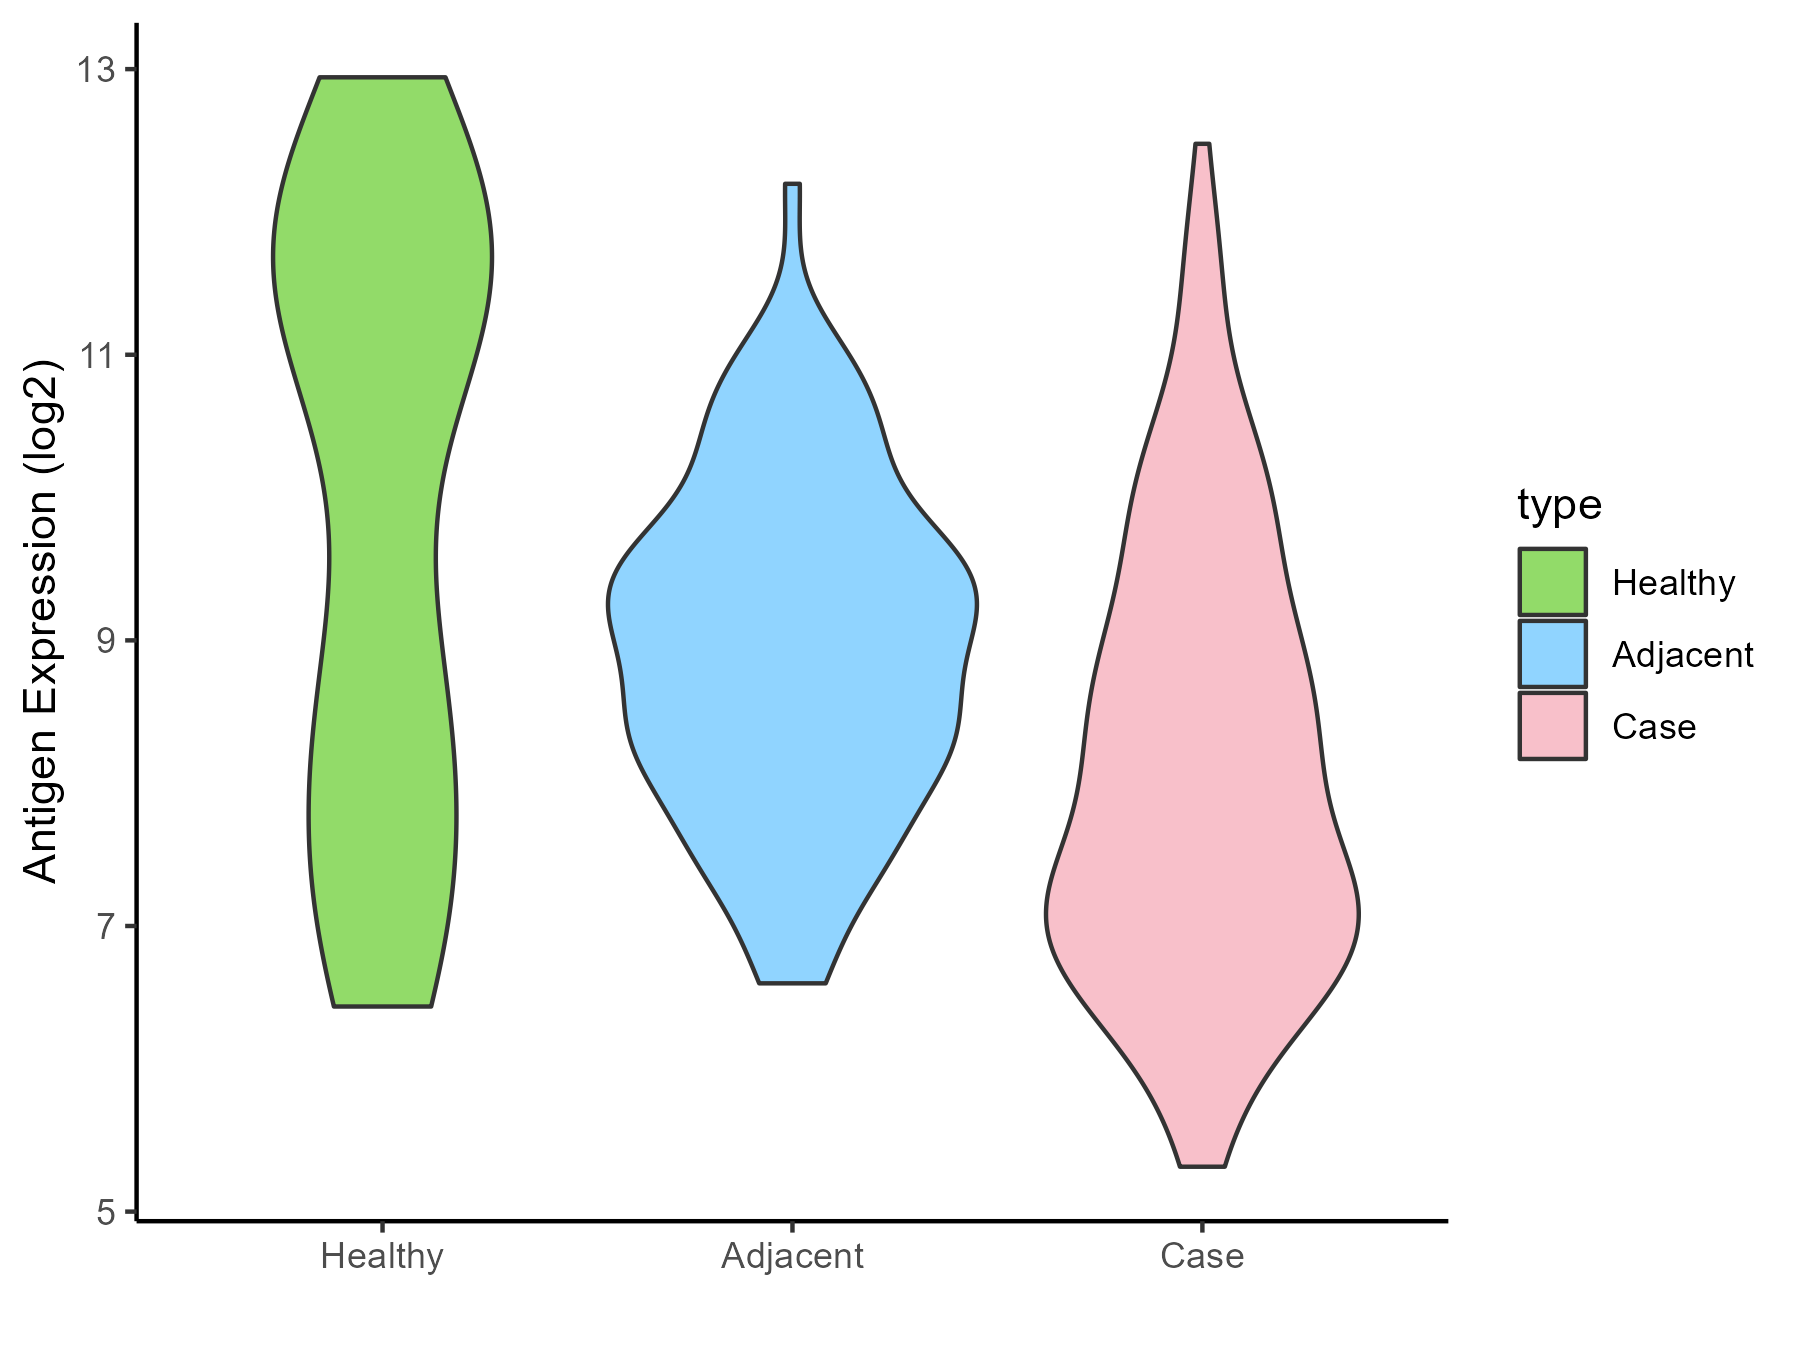
MyeloDysplastic syndromes [ICD-11: 2A37]
Click to Show/Hide
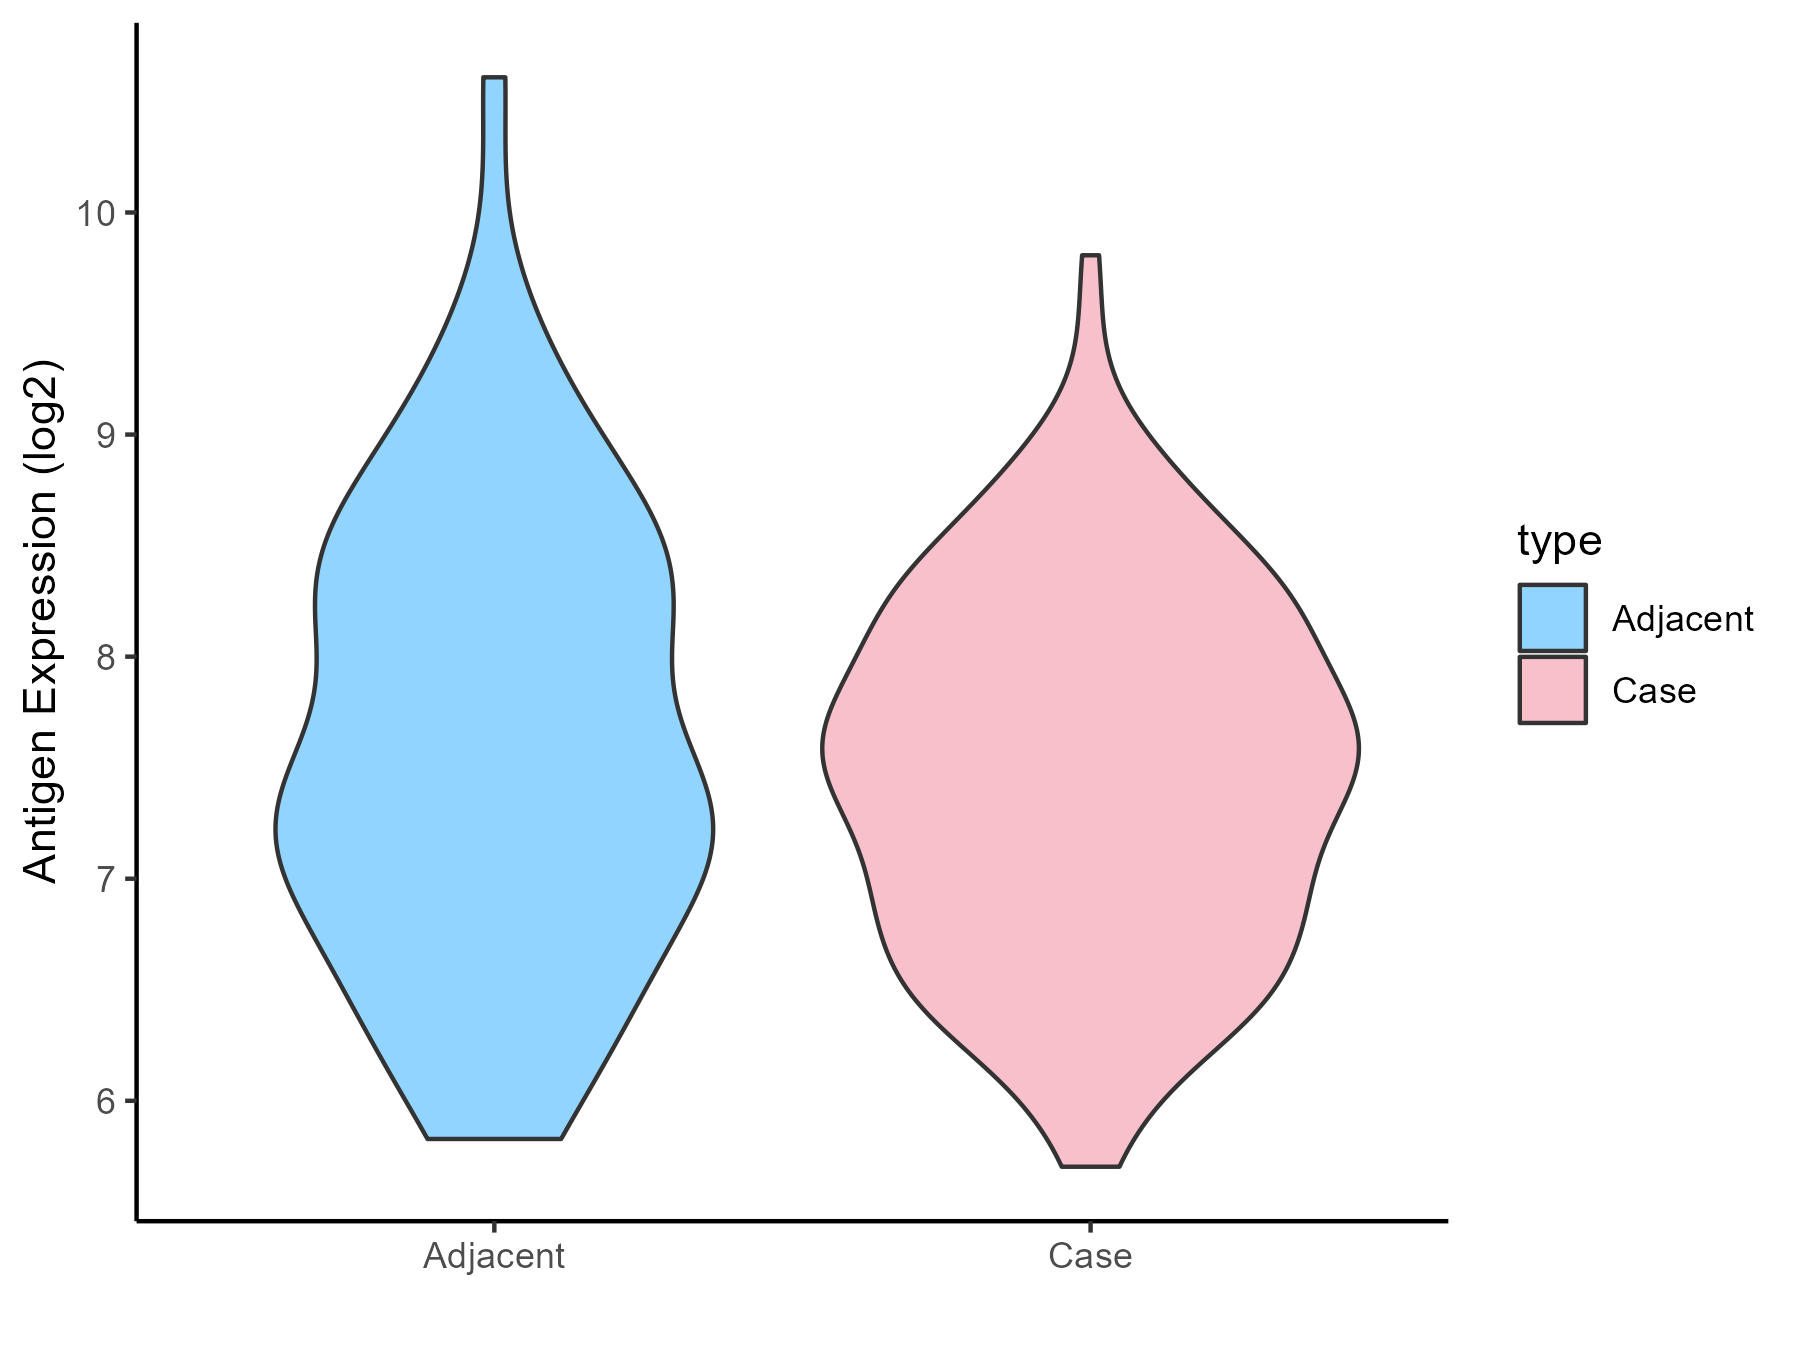
| Differential expression pattern of antigen in diseases |
| The Studied Tissue |
Bone marrow |
| The Specific Disease |
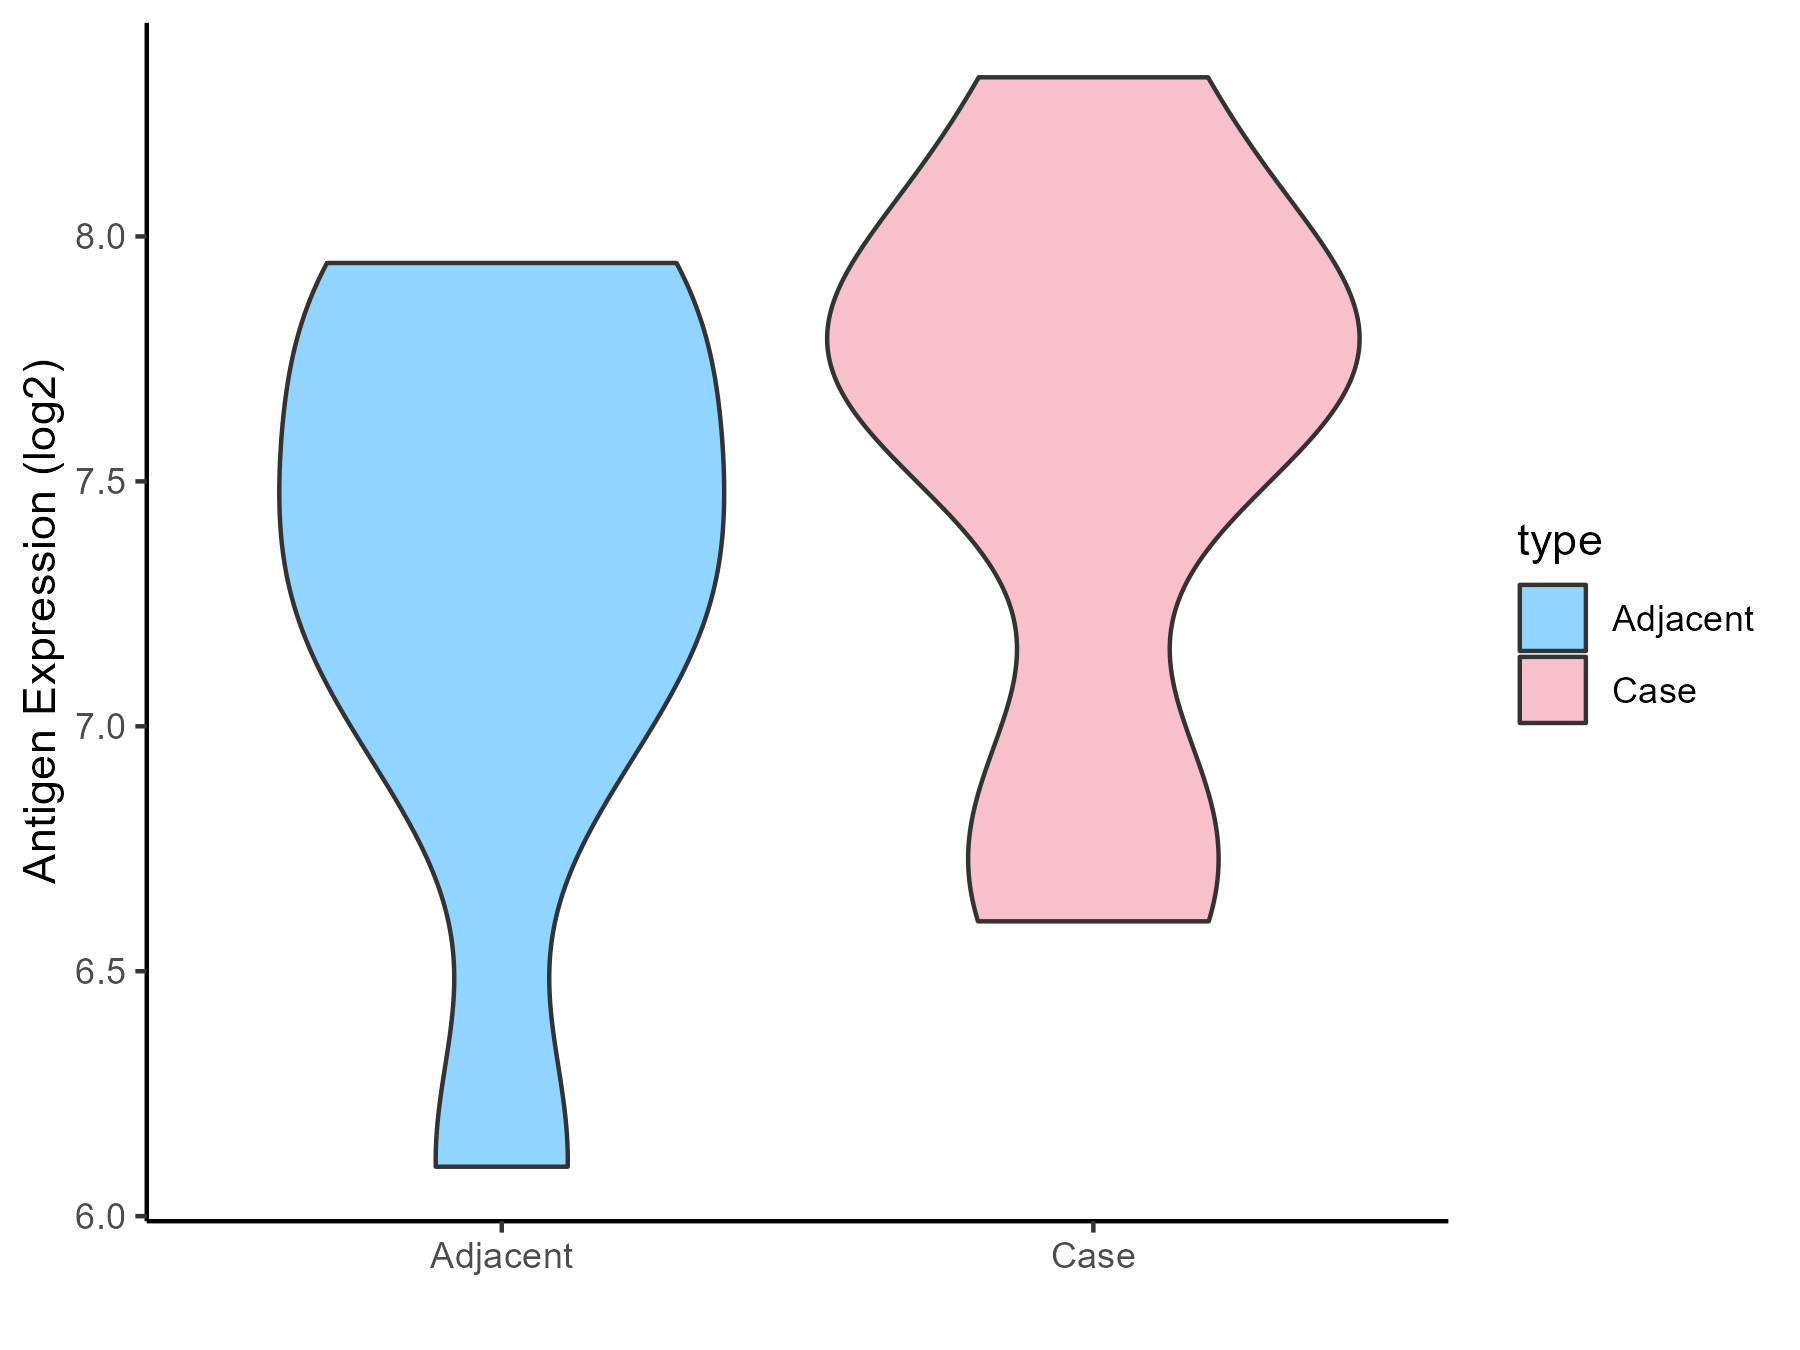
Myelodysplastic syndromes |
| The Expression Level of Disease Section Compare with the Healthy Individual Tissue |
p-value: 0.229726537;
Fold-change: 0.050069657;
Z-score: 0.234886714
|
| The Expression Level of Disease Section Compare with the Adjacent Tissue |
p-value: 0.586149929;
Fold-change: 0.067641624;
Z-score: 0.288001167
|
| Disease-specific Antigen Abundances |
|
Click to View the Clearer Original Diagram
|
|
|
Lymphoma [ICD-11: 2A90- 2A85]
Click to Show/Hide
| Differential expression pattern of antigen in diseases |
| The Studied Tissue |
Tonsil |
| The Specific Disease |
Lymphoma |
| The Expression Level of Disease Section Compare with the Healthy Individual Tissue |
p-value: 0.525712063;
Fold-change: 0.089436538;
Z-score: 0.583799193
|
| Disease-specific Antigen Abundances |
|
Click to View the Clearer Original Diagram
|
|
|
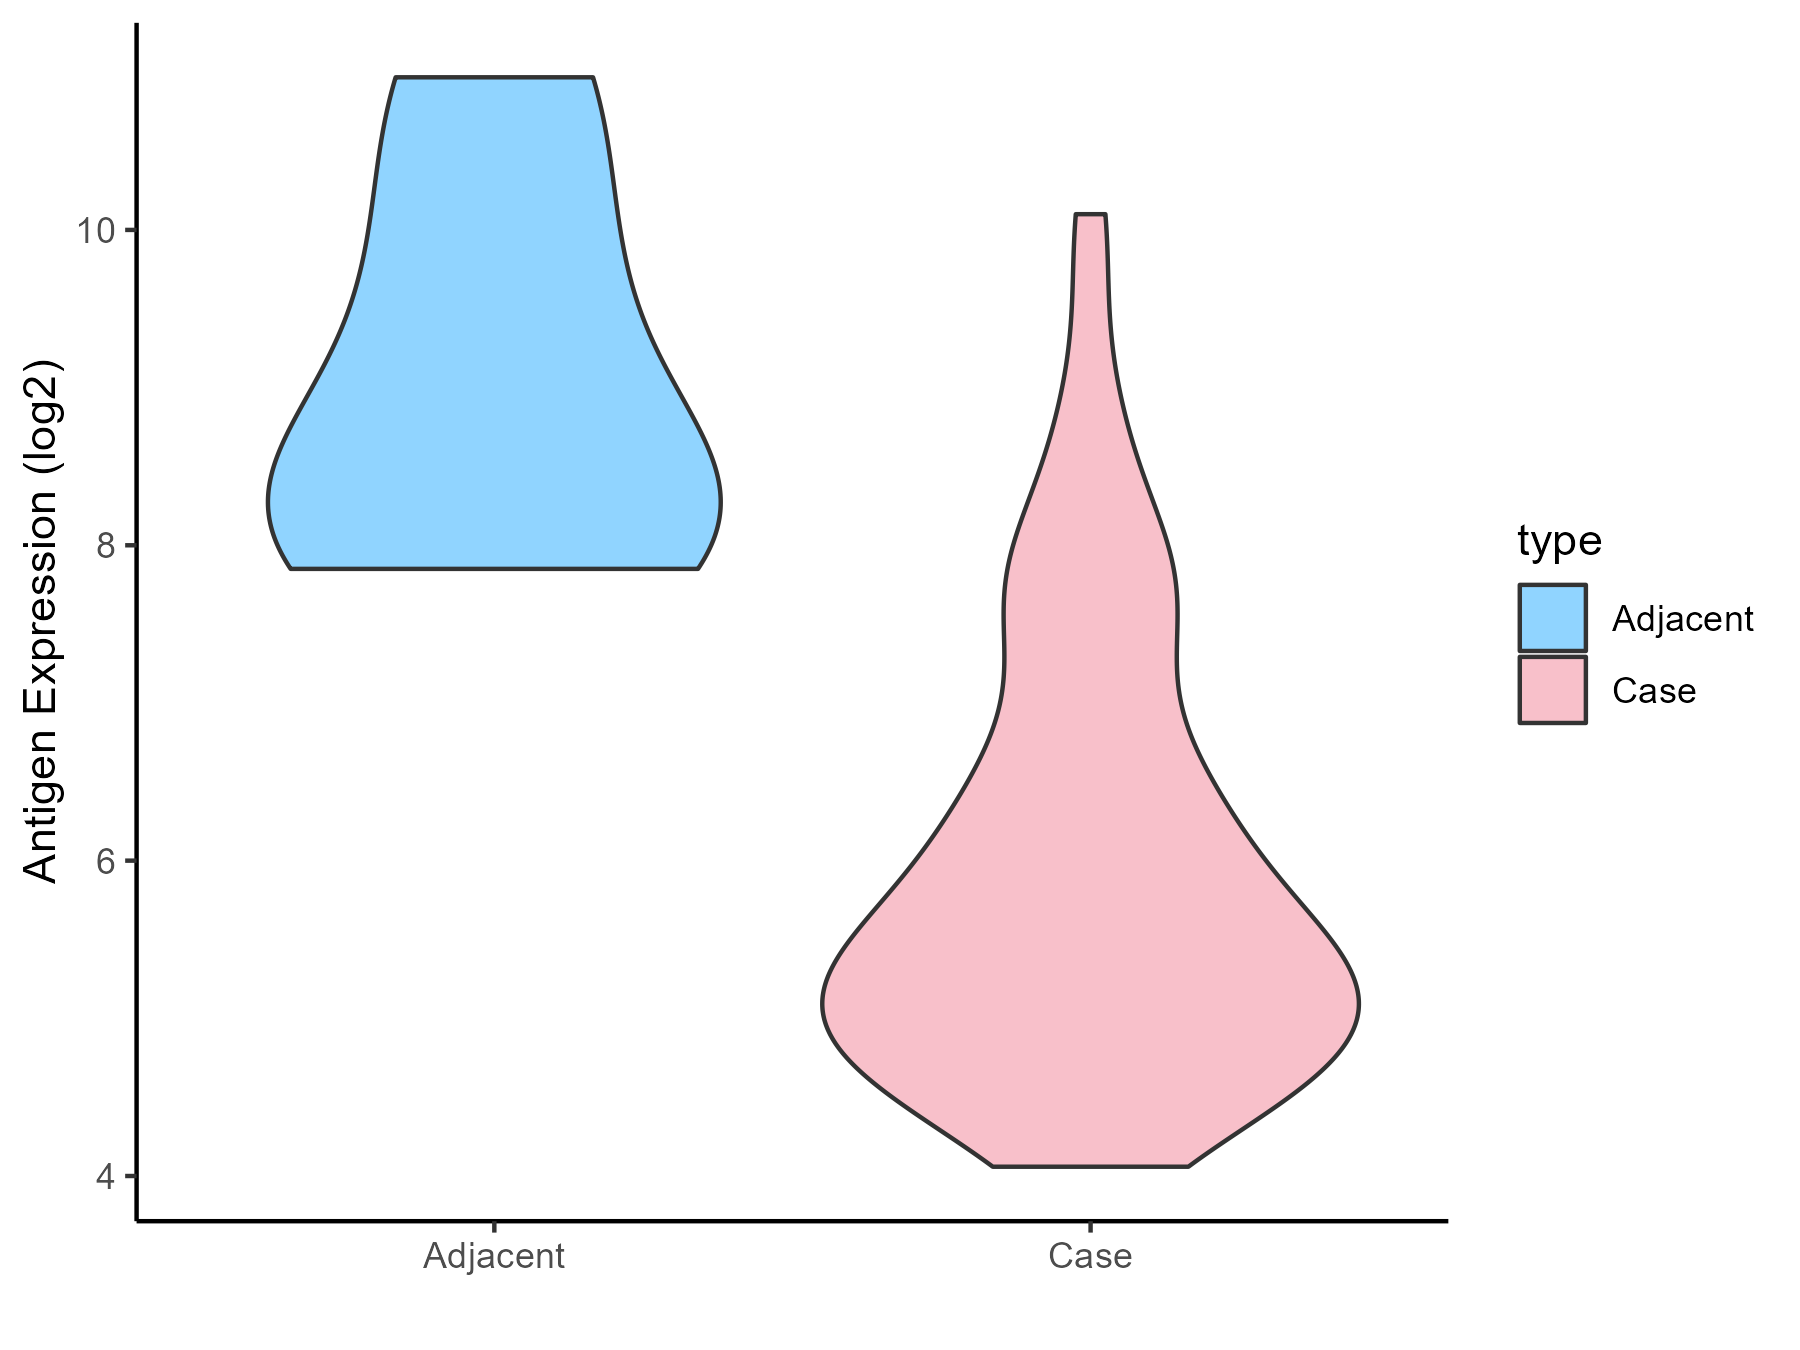
Gastric cancer [ICD-11: 2B72]
Click to Show/Hide
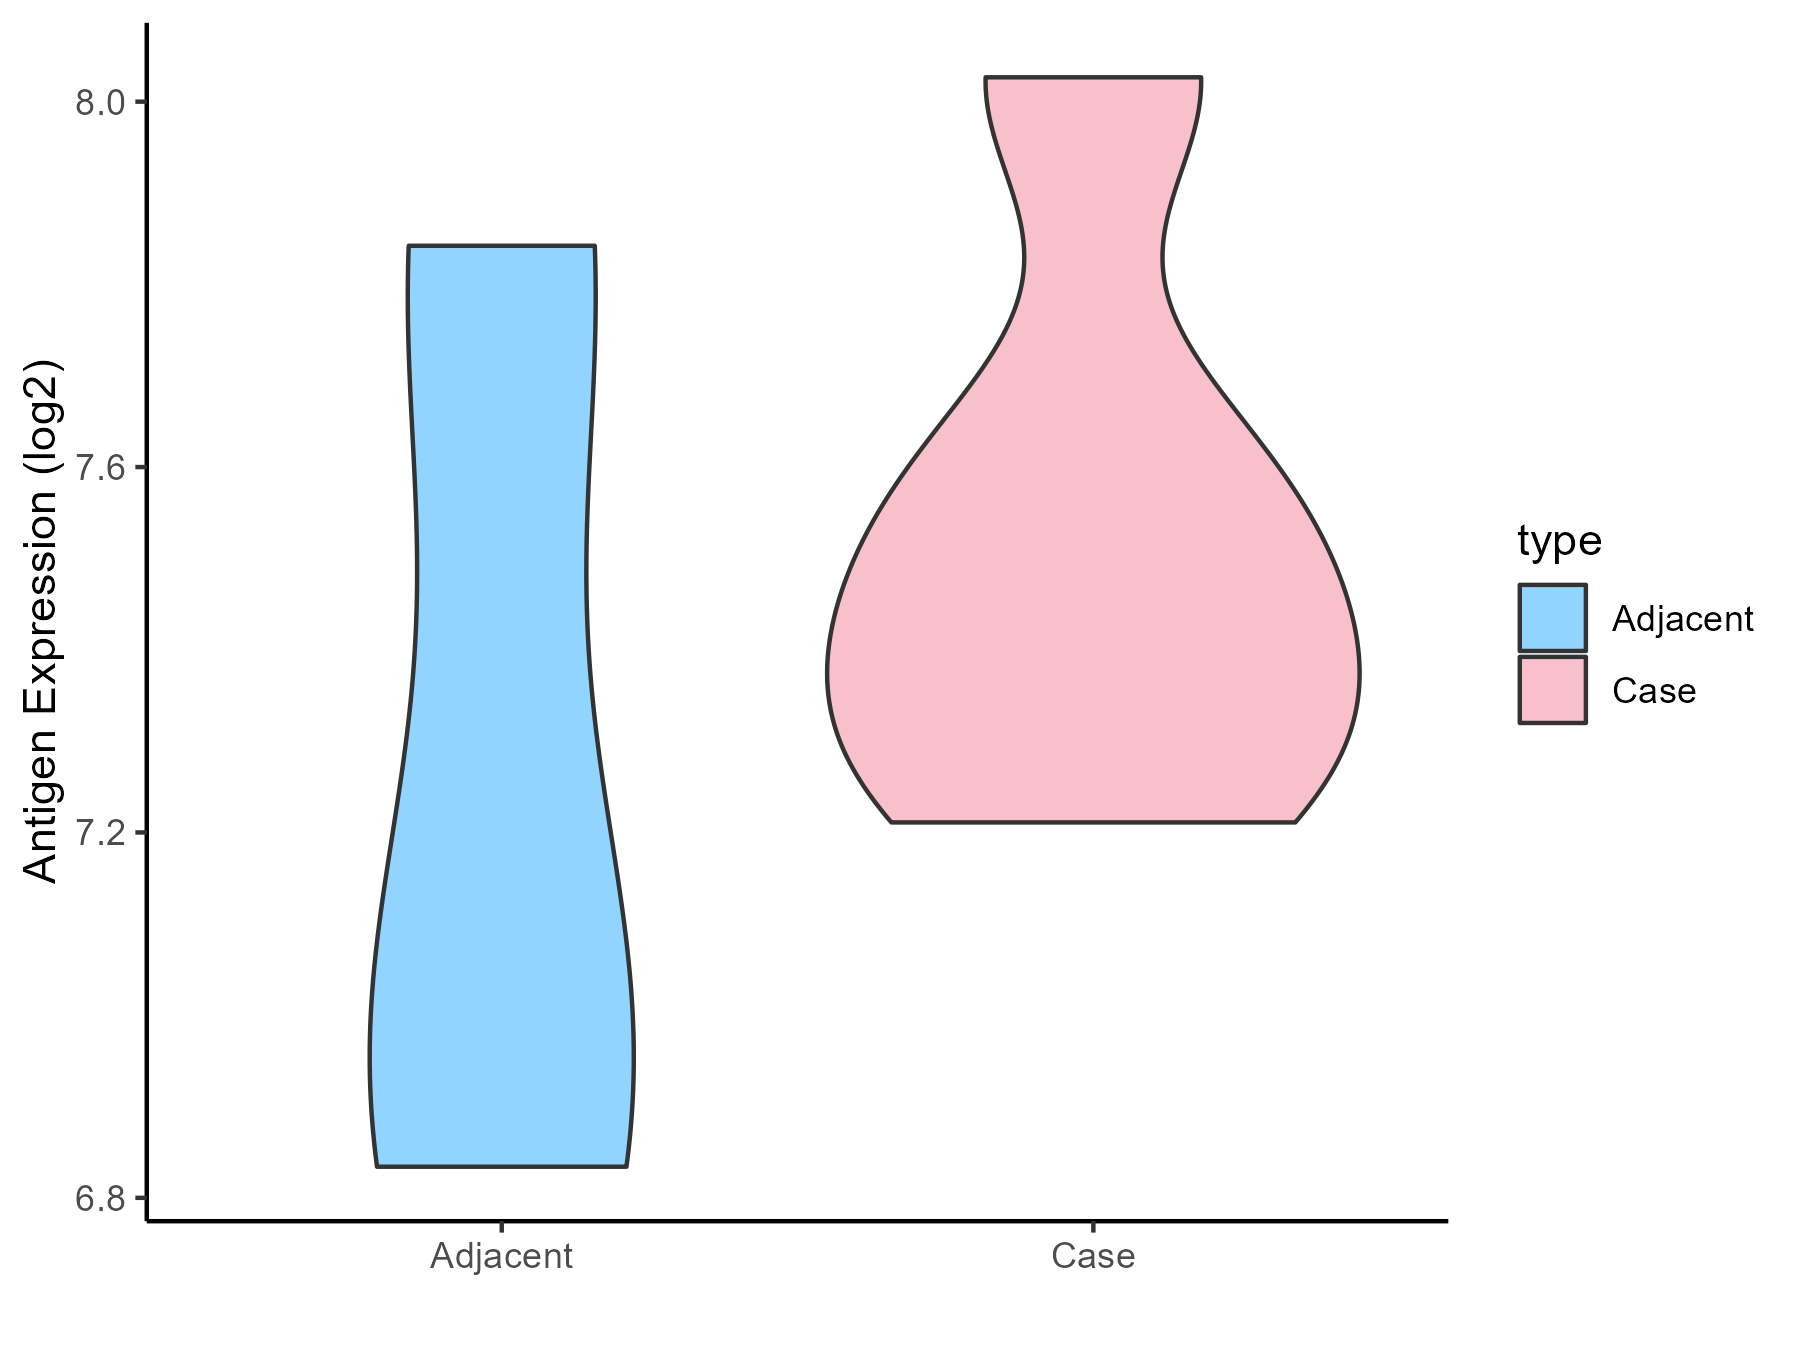
| Differential expression pattern of antigen in diseases |
| The Studied Tissue |
Gastric |
| The Specific Disease |
Gastric cancer |
| The Expression Level of Disease Section Compare with the Healthy Individual Tissue |
p-value: 0.229776789;
Fold-change: -2.345082085;
Z-score: -1.078516291
|
| The Expression Level of Disease Section Compare with the Adjacent Tissue |
p-value: 0.500705052;
Fold-change: 0.507333189;
Z-score: 0.340145571
|
| Disease-specific Antigen Abundances |
|
Click to View the Clearer Original Diagram
|
|
|
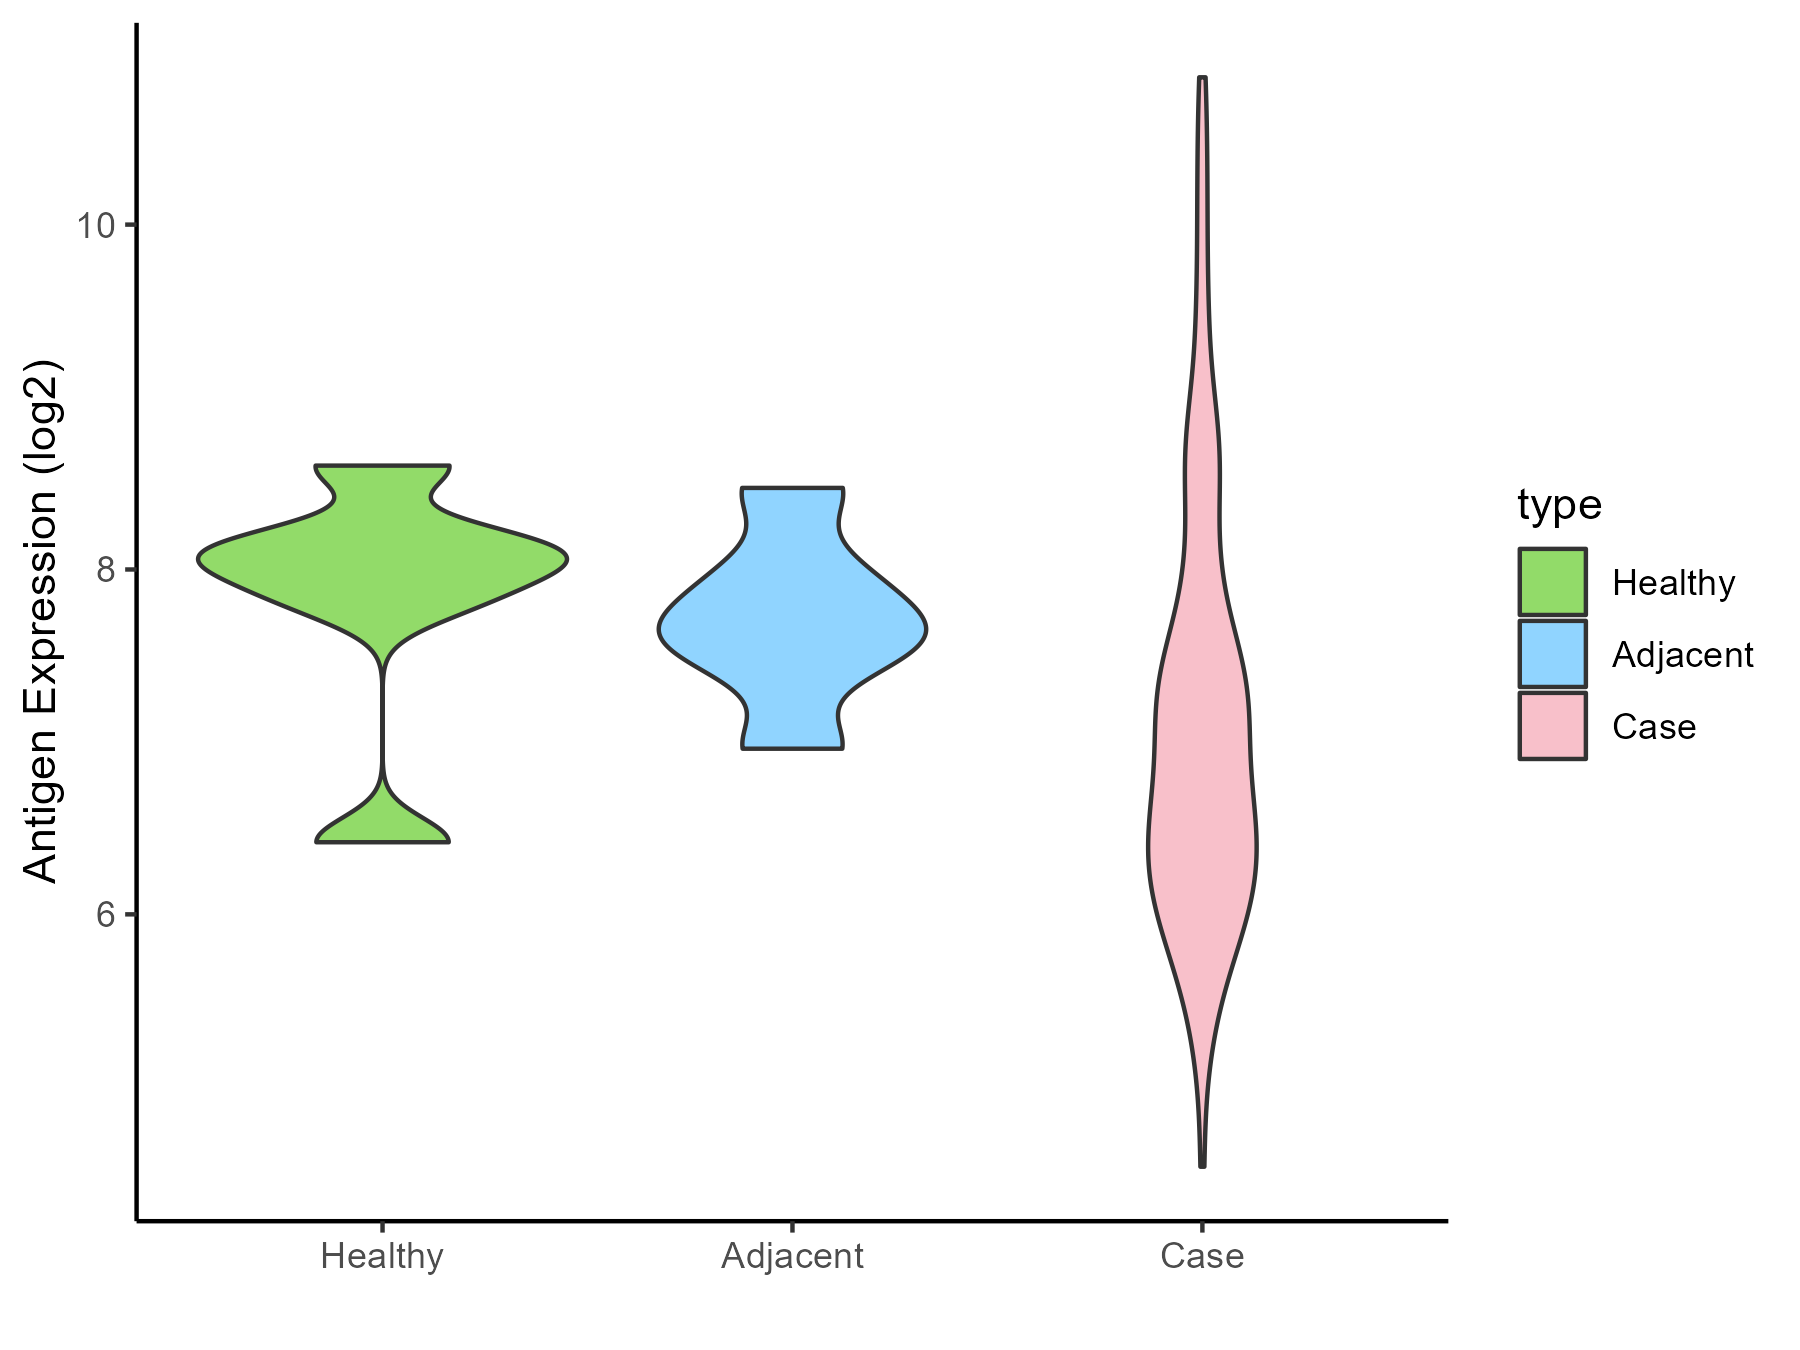
Colon cancer [ICD-11: 2B90]
Click to Show/Hide
| Differential expression pattern of antigen in diseases |
| The Studied Tissue |
Colon |
| The Specific Disease |
Colon cancer |
| The Expression Level of Disease Section Compare with the Healthy Individual Tissue |
p-value: 8.55E-07;
Fold-change: 0.195529043;
Z-score: 0.262376203
|
| The Expression Level of Disease Section Compare with the Adjacent Tissue |
p-value: 0.374767224;
Fold-change: -0.271289081;
Z-score: -0.224025991
|
| Disease-specific Antigen Abundances |
|
Click to View the Clearer Original Diagram
|
|
|
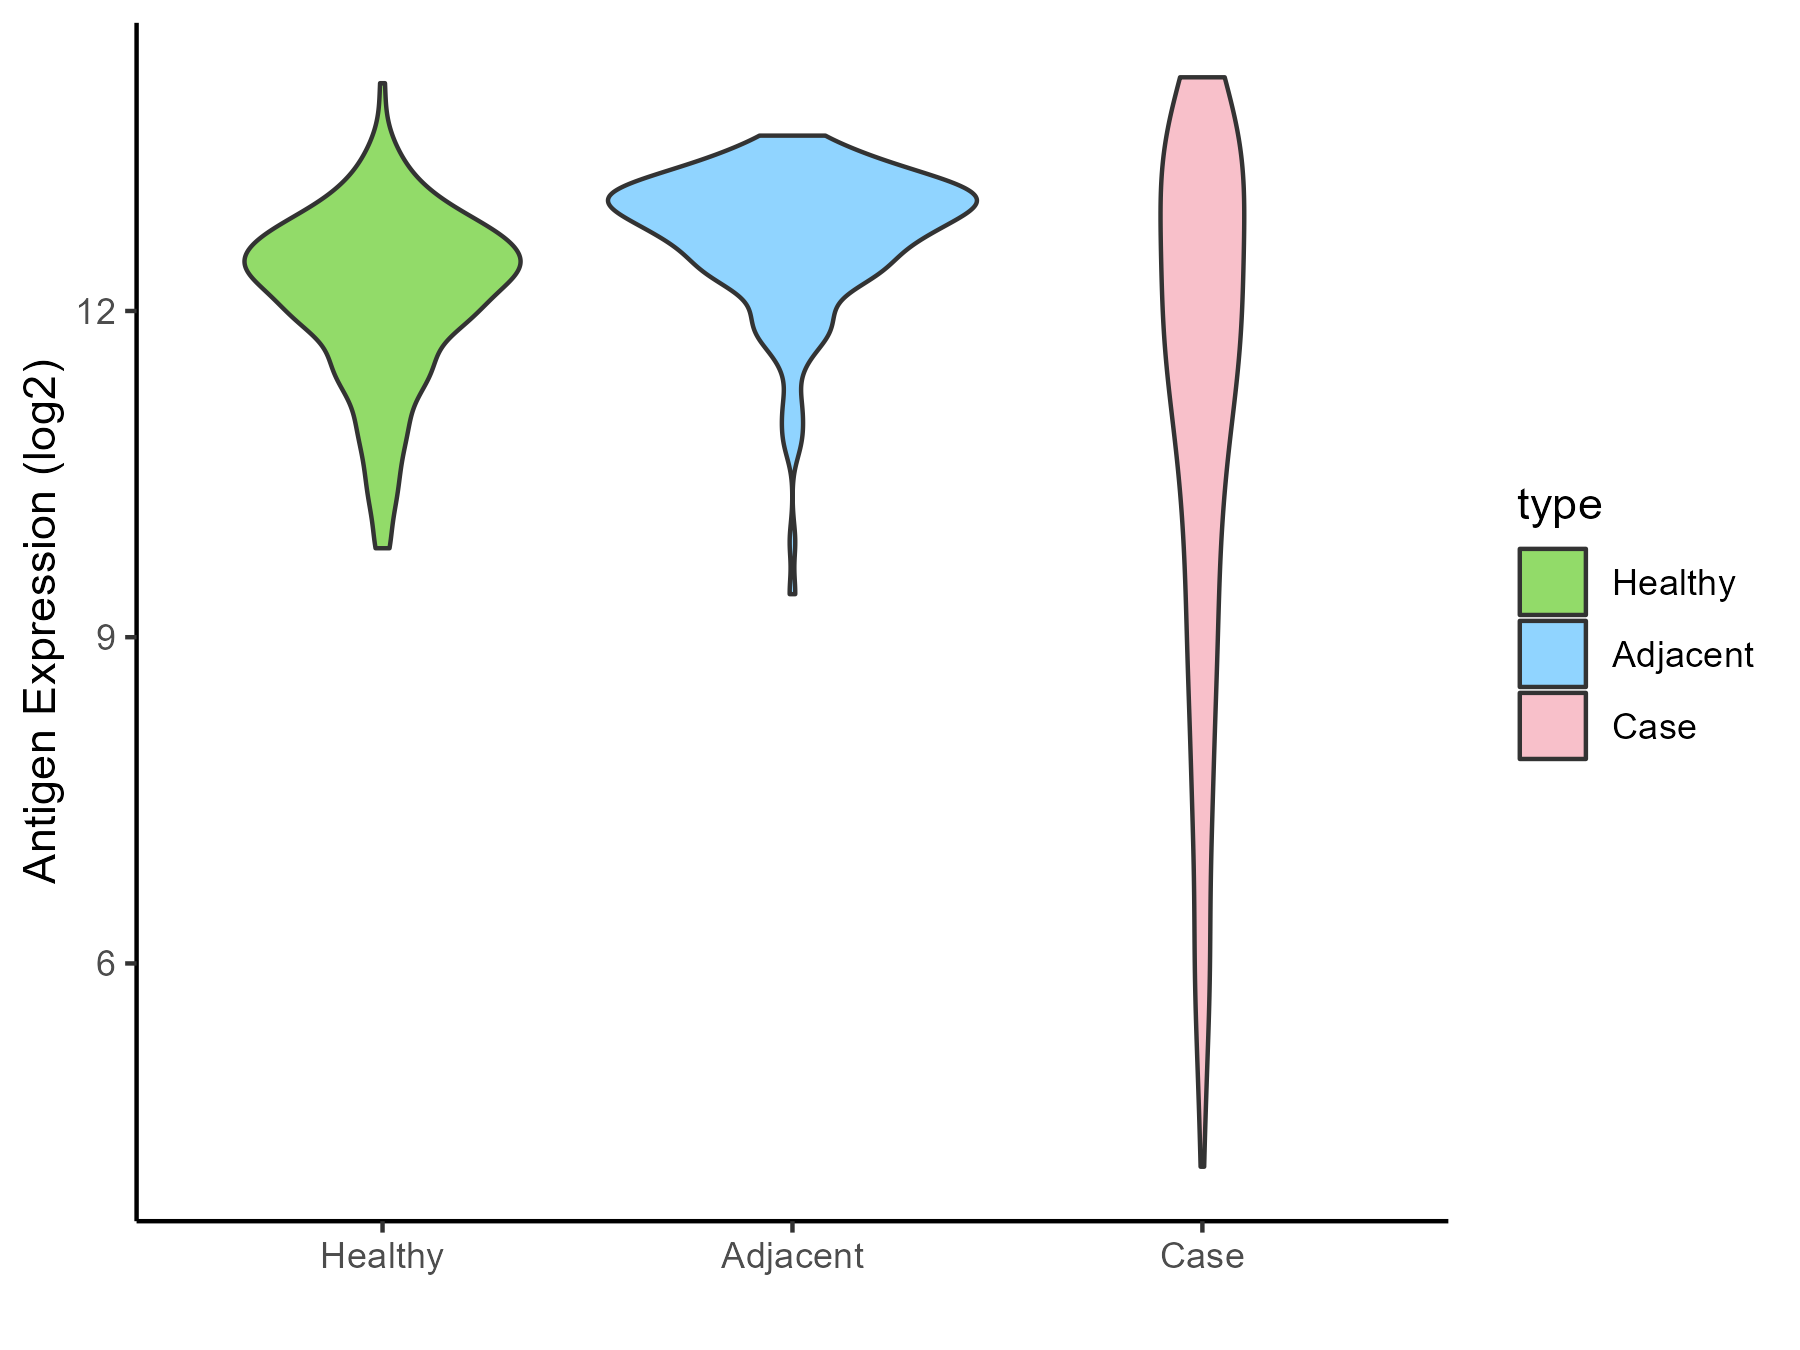
Pancreatic cancer [ICD-11: 2C10]
Click to Show/Hide
| Differential expression pattern of antigen in diseases |
| The Studied Tissue |
Pancreas |
| The Specific Disease |
Pancreatic cancer |
| The Expression Level of Disease Section Compare with the Healthy Individual Tissue |
p-value: 0.585326107;
Fold-change: 0.268396846;
Z-score: 0.22176512
|
| The Expression Level of Disease Section Compare with the Adjacent Tissue |
p-value: 0.832045978;
Fold-change: 0.443095263;
Z-score: 0.326798367
|
| Disease-specific Antigen Abundances |
|
Click to View the Clearer Original Diagram
|
|
|
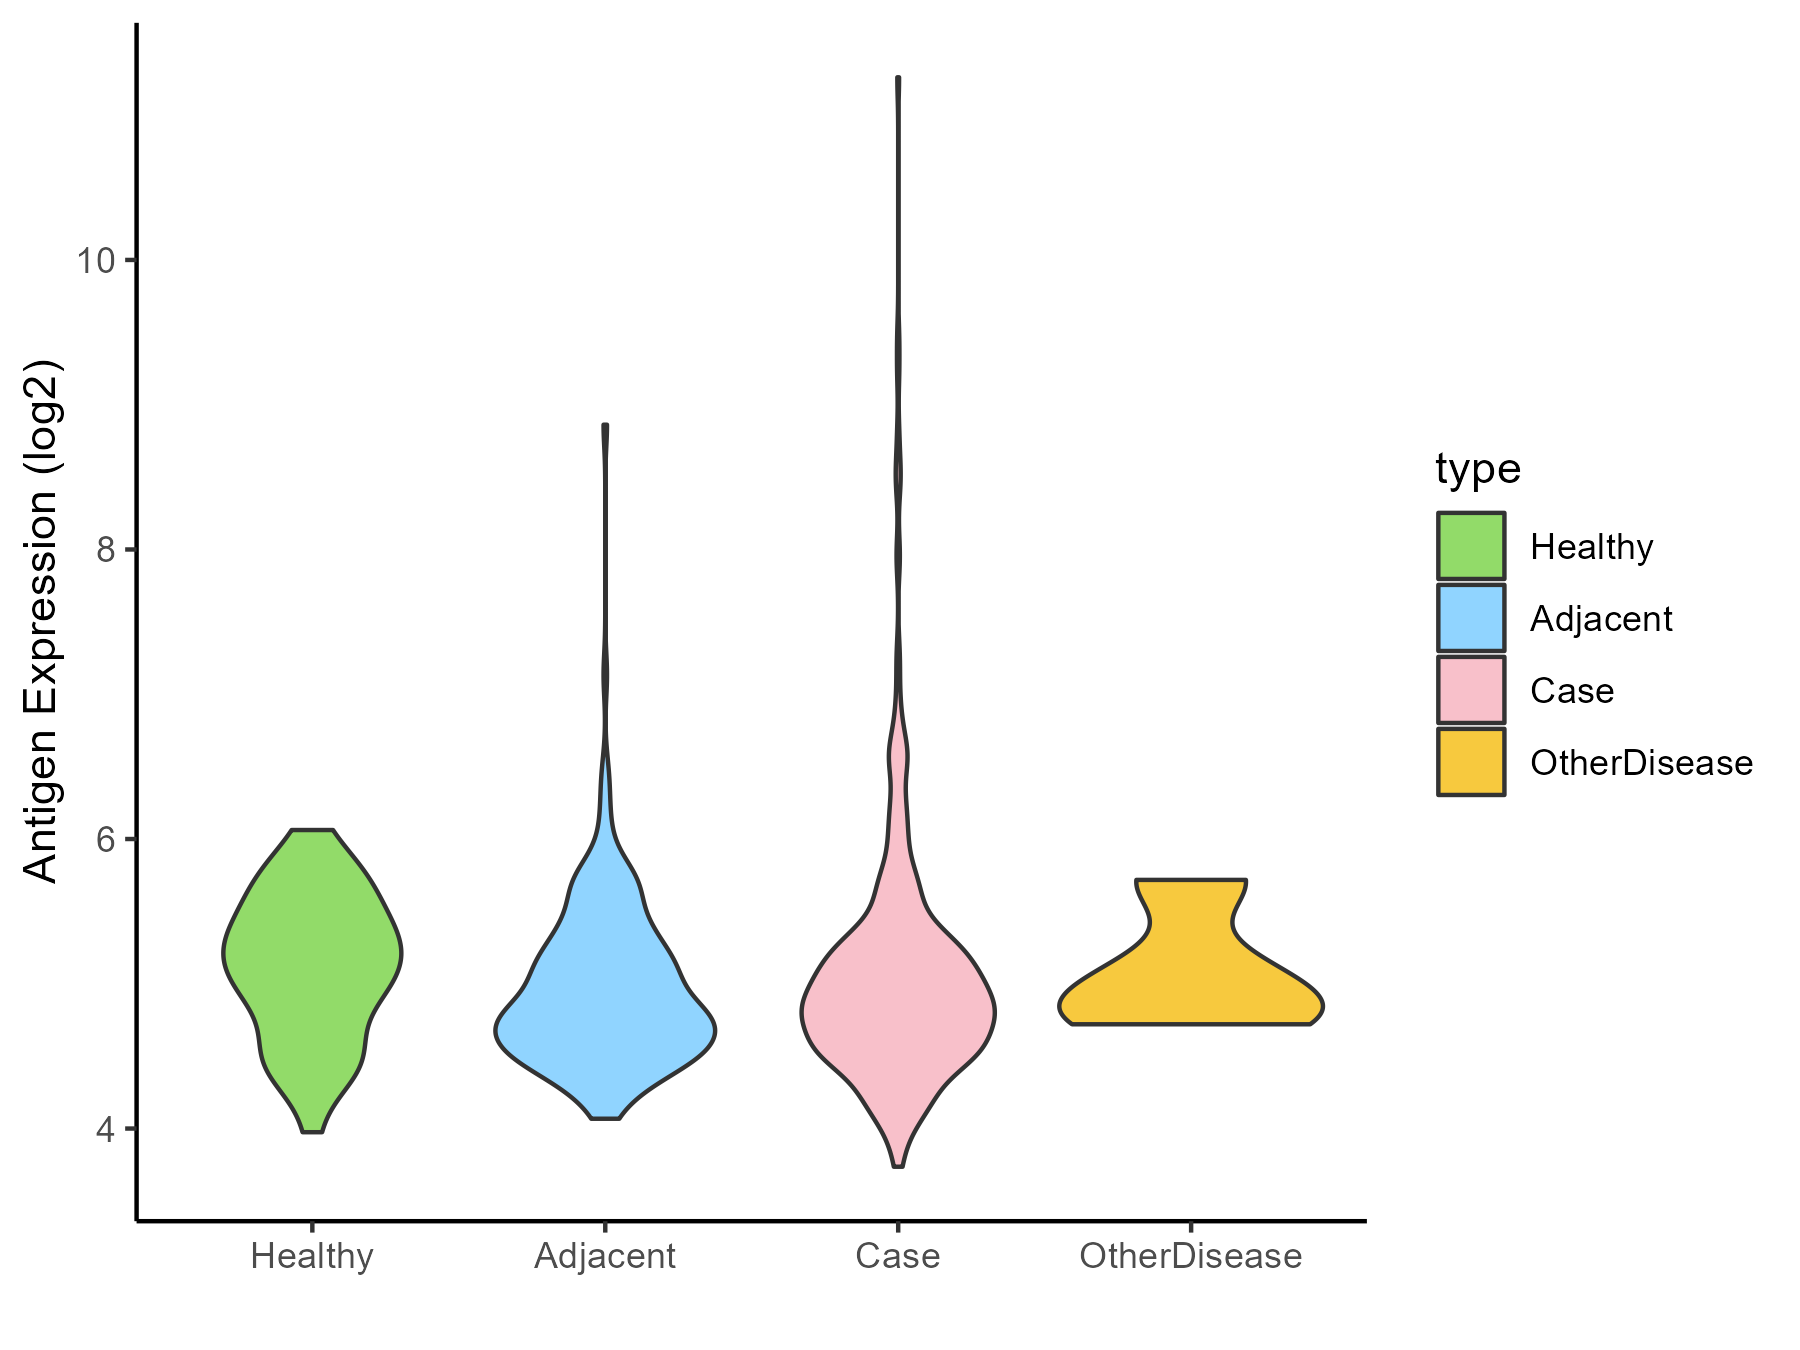
Liver cancer [ICD-11: 2C12]
Click to Show/Hide
| Differential expression pattern of antigen in diseases |
| The Studied Tissue |
Liver |
| The Specific Disease |
Liver cancer |
| The Expression Level of Disease Section Compare with the Healthy Individual Tissue |
p-value: 0.40967654;
Fold-change: -0.26377613;
Z-score: -0.531438481
|
| The Expression Level of Disease Section Compare with the Adjacent Tissue |
p-value: 0.169949112;
Fold-change: 0.071408703;
Z-score: 0.124568447
|
| The Expression Level of Disease Section Compare with the Other Disease Section |
p-value: 0.894758549;
Fold-change: -0.051353324;
Z-score: -0.114208171
|
| Disease-specific Antigen Abundances |
|
Click to View the Clearer Original Diagram
|
|
|
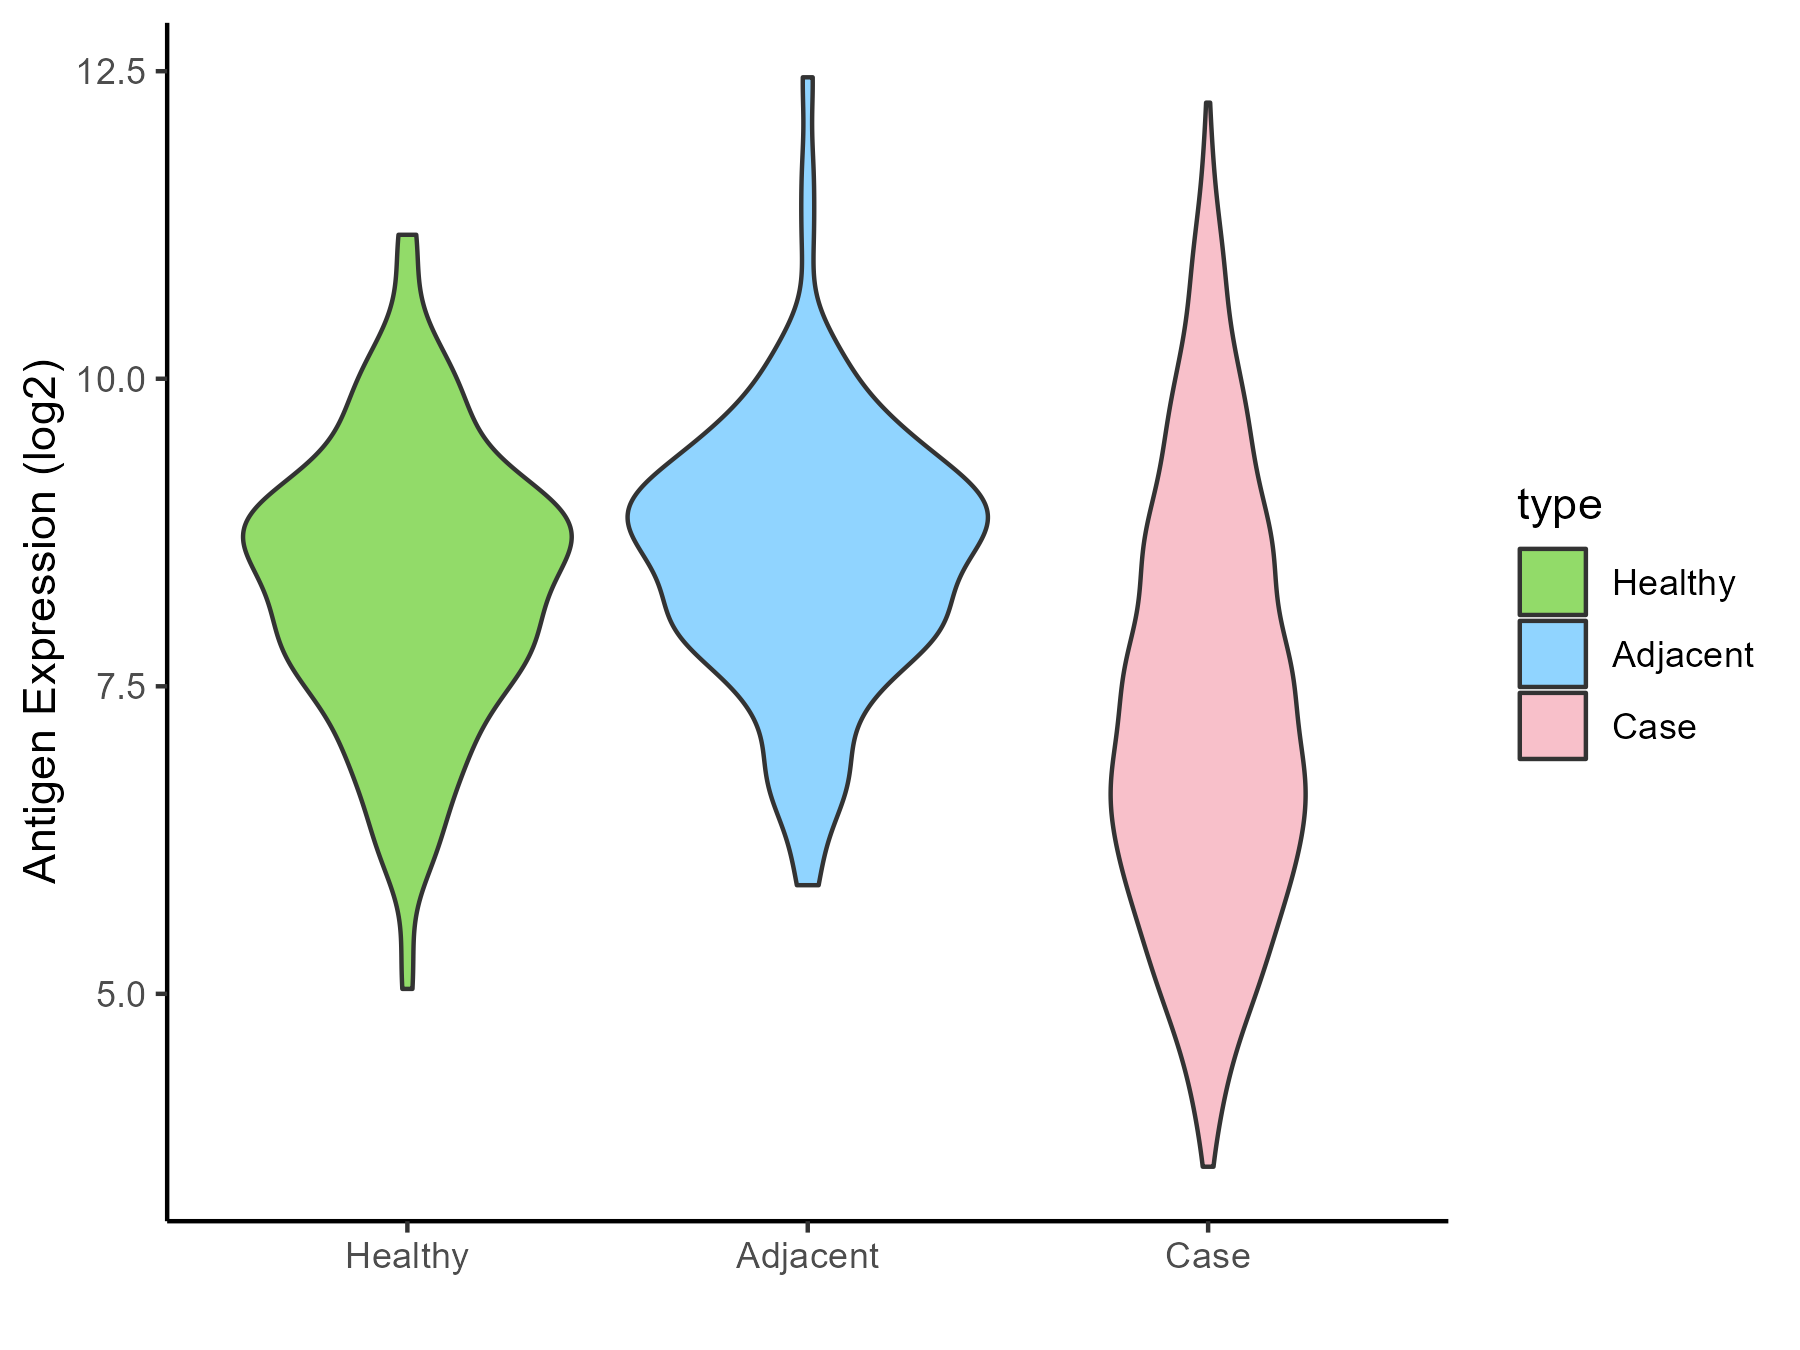
Lung cancer [ICD-11: 2C25]
Click to Show/Hide
| Differential expression pattern of antigen in diseases |
| The Studied Tissue |
Lung |
| The Specific Disease |
Lung cancer |
| The Expression Level of Disease Section Compare with the Healthy Individual Tissue |
p-value: 1.85E-21;
Fold-change: -1.236721811;
Z-score: -1.1185338
|
| The Expression Level of Disease Section Compare with the Adjacent Tissue |
p-value: 4.24E-22;
Fold-change: -1.482314437;
Z-score: -1.389192261
|
| Disease-specific Antigen Abundances |
|
Click to View the Clearer Original Diagram
|
|
|
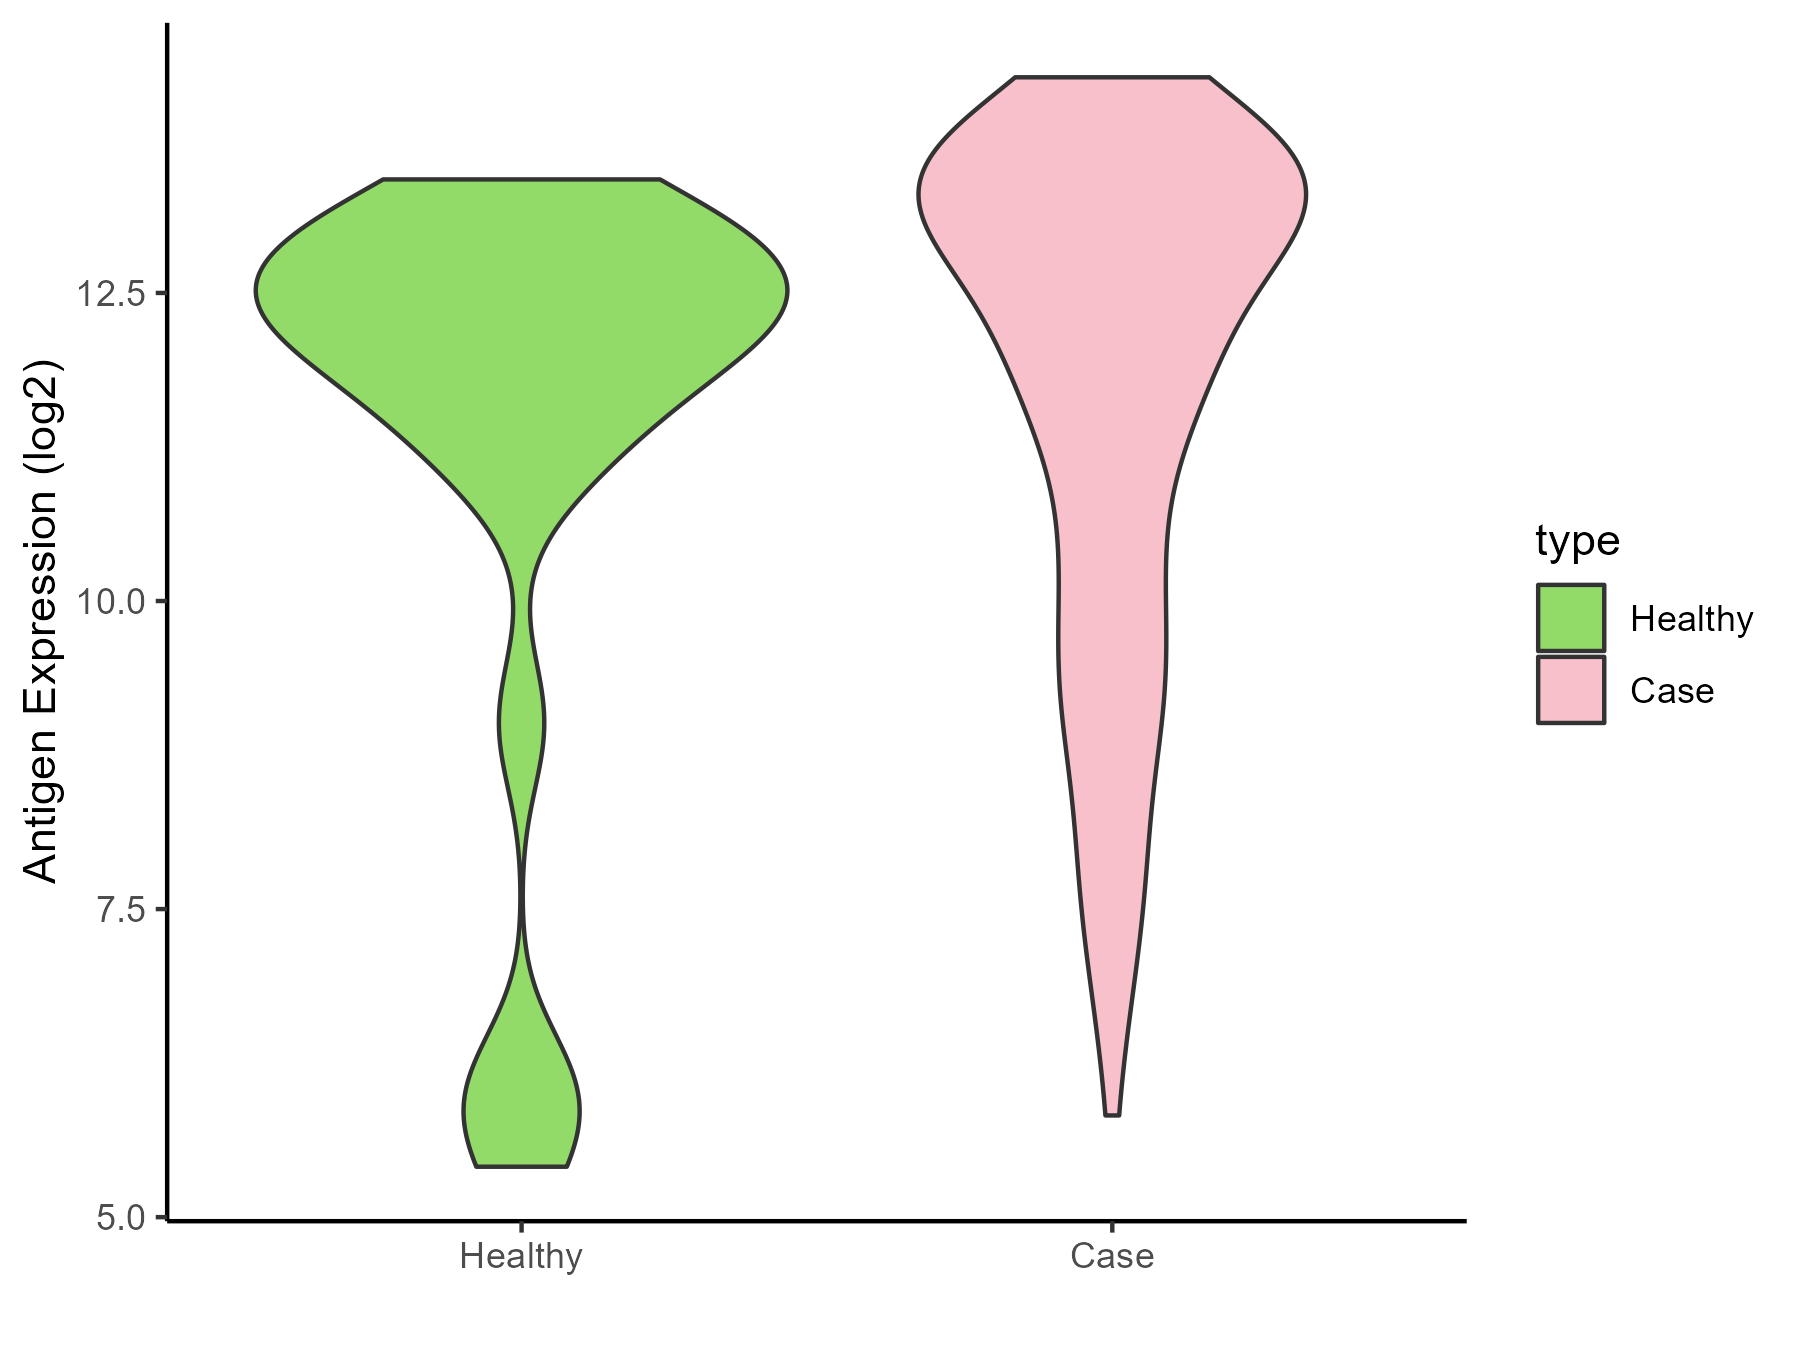
Melanoma [ICD-11: 2C30]
Click to Show/Hide
| Differential expression pattern of antigen in diseases |
| The Studied Tissue |
Skin |
| The Specific Disease |
Melanoma |
| The Expression Level of Disease Section Compare with the Healthy Individual Tissue |
p-value: 0.422587263;
Fold-change: 0.253660552;
Z-score: 0.106235895
|
| Disease-specific Antigen Abundances |
|
Click to View the Clearer Original Diagram
|
|
|
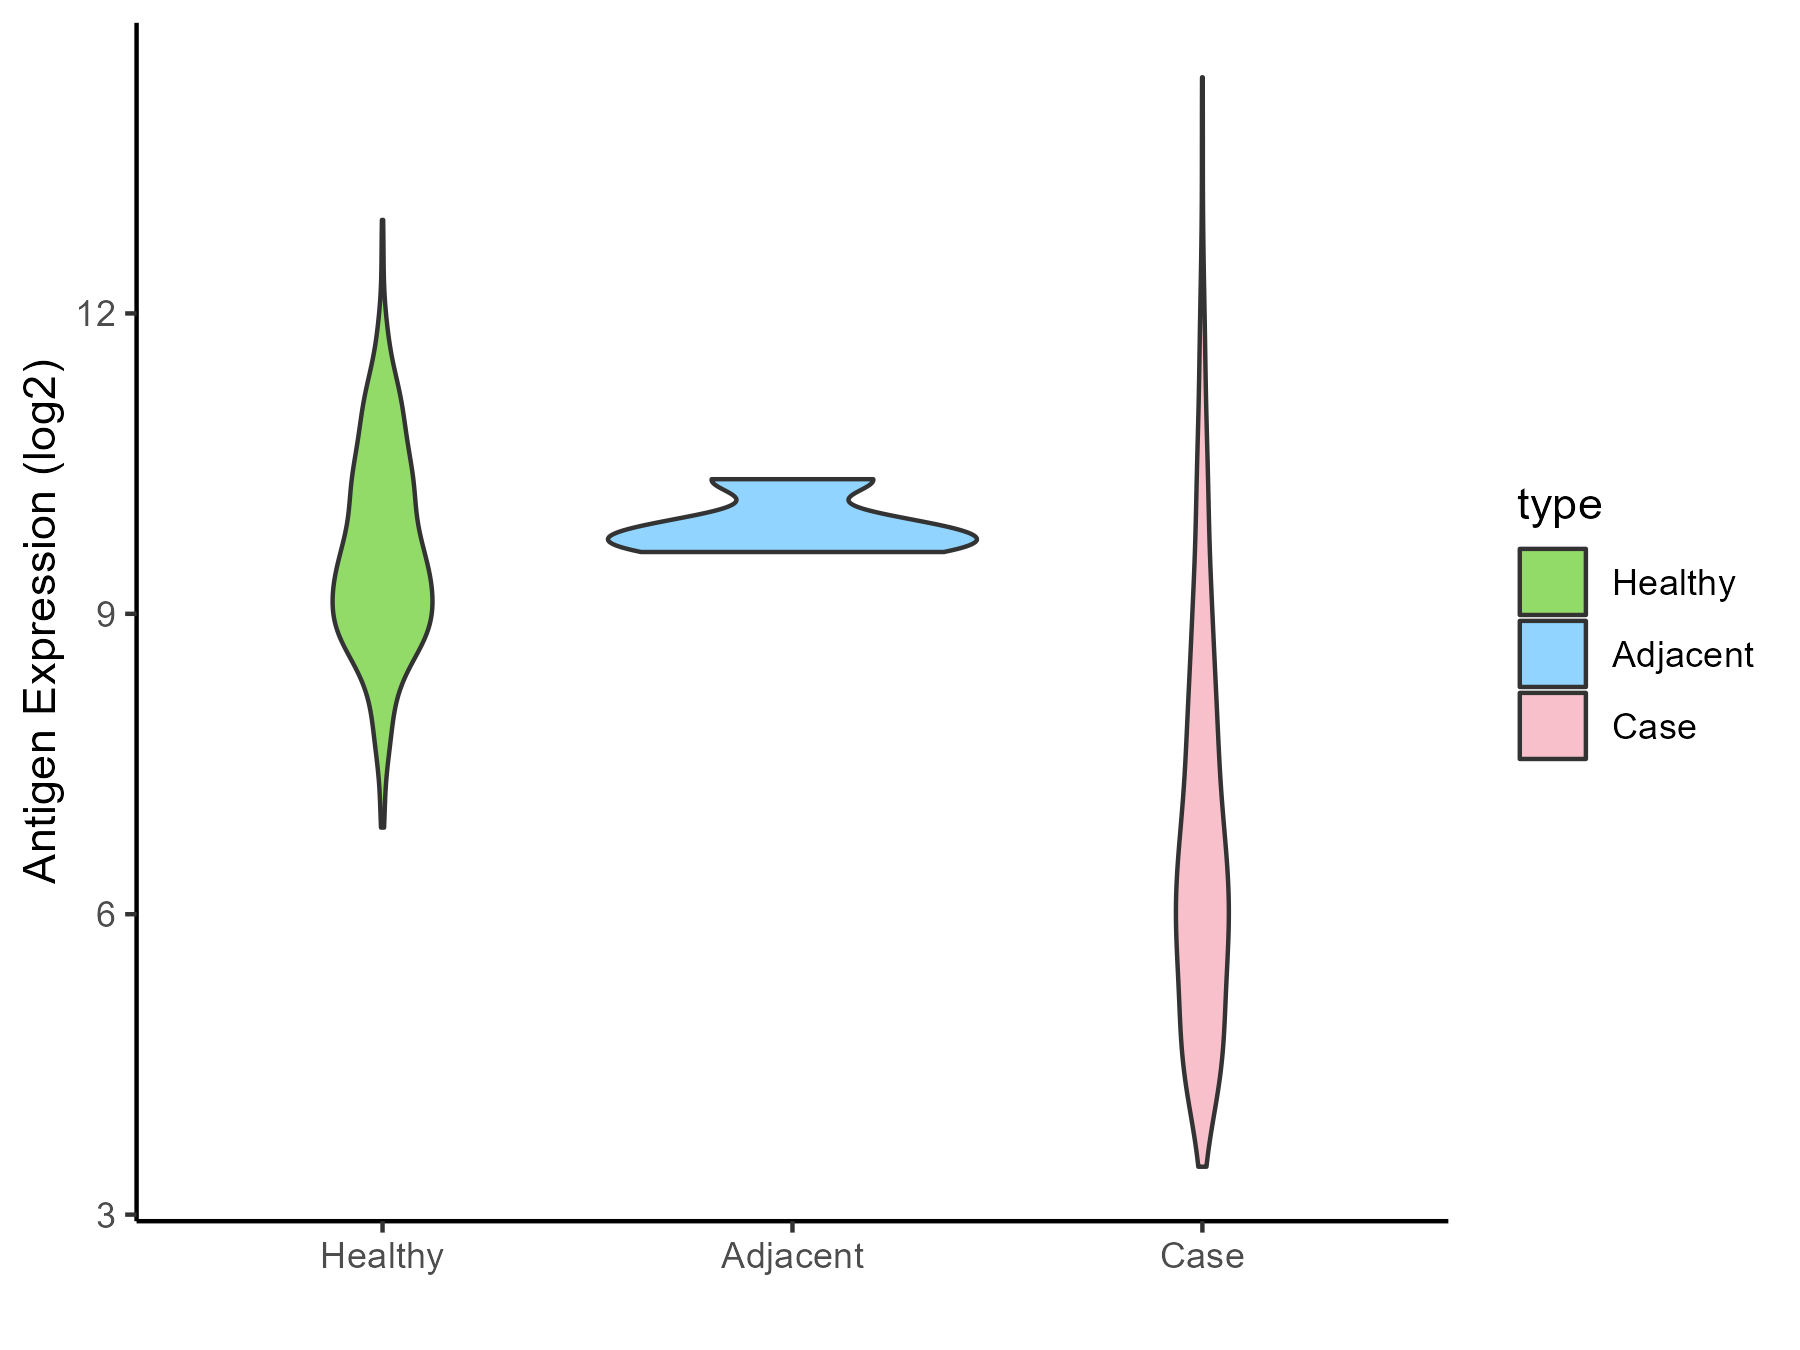
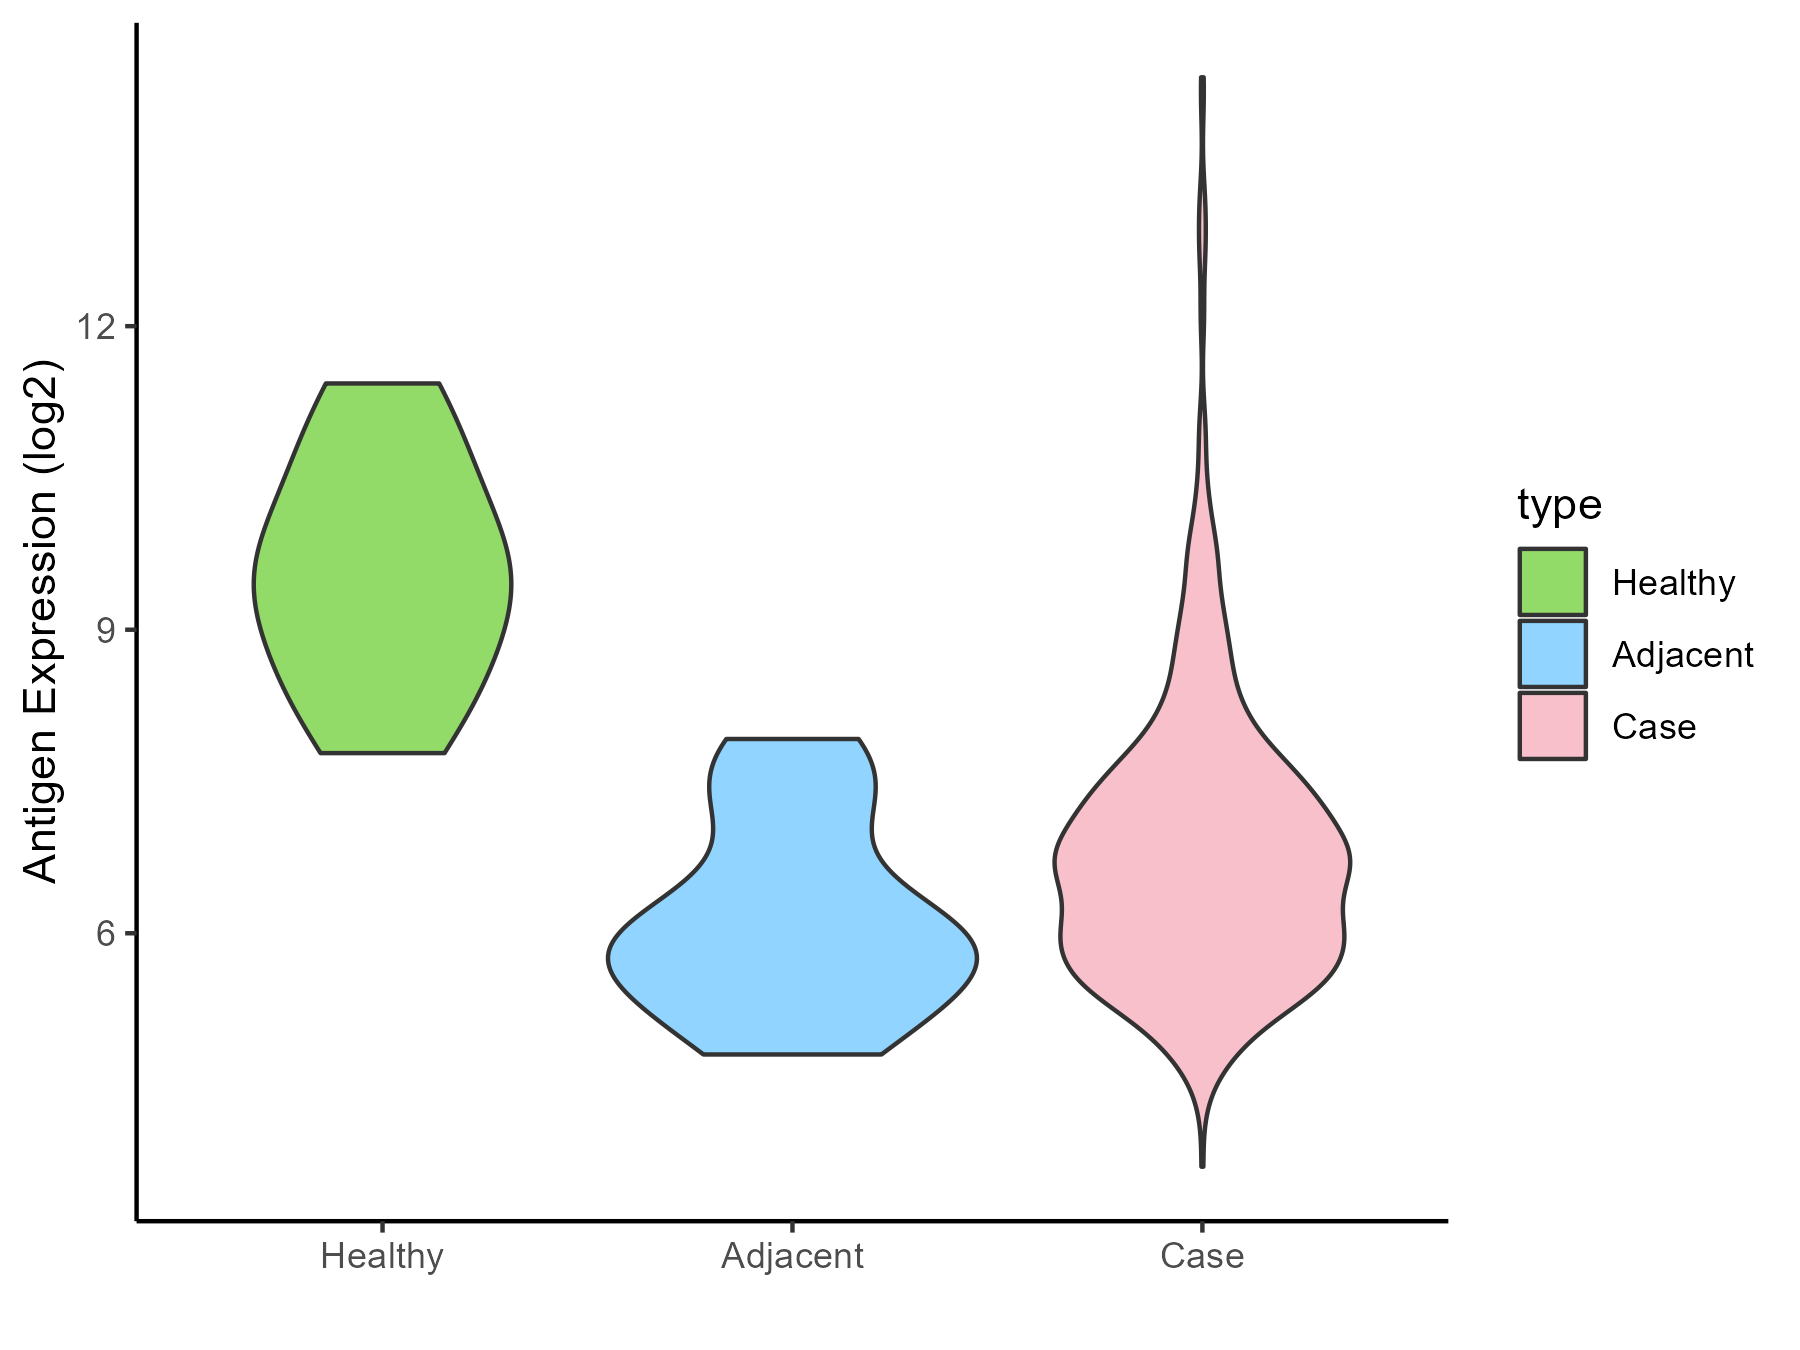
Sarcoma [ICD-11: 2C35]
Click to Show/Hide
| Differential expression pattern of antigen in diseases |
| The Studied Tissue |
Muscle |
| The Specific Disease |
Sarcoma |
| The Expression Level of Disease Section Compare with the Healthy Individual Tissue |
p-value: 5.43E-129;
Fold-change: -3.048324981;
Z-score: -2.993644004
|
| The Expression Level of Disease Section Compare with the Adjacent Tissue |
p-value: 1.40E-05;
Fold-change: -3.387616495;
Z-score: -10.66675724
|
| Disease-specific Antigen Abundances |
|
Click to View the Clearer Original Diagram
|
|
|
Breast cancer [ICD-11: 2C60]
Click to Show/Hide
| Differential expression pattern of antigen in diseases |
| The Studied Tissue |
Breast |
| The Specific Disease |
Breast cancer |
| The Expression Level of Disease Section Compare with the Healthy Individual Tissue |
p-value: 1.02E-103;
Fold-change: -3.002257931;
Z-score: -2.247446753
|
| The Expression Level of Disease Section Compare with the Adjacent Tissue |
p-value: 8.34E-15;
Fold-change: -2.875943167;
Z-score: -1.780204576
|
| Disease-specific Antigen Abundances |
|
Click to View the Clearer Original Diagram
|
|
|
Ovarian cancer [ICD-11: 2C73]
Click to Show/Hide
| Differential expression pattern of antigen in diseases |
| The Studied Tissue |
Ovarian |
| The Specific Disease |
Ovarian cancer |
| The Expression Level of Disease Section Compare with the Healthy Individual Tissue |
p-value: 9.25E-05;
Fold-change: -2.936611101;
Z-score: -2.52975548
|
| The Expression Level of Disease Section Compare with the Adjacent Tissue |
p-value: 0.026808061;
Fold-change: 0.749306452;
Z-score: 0.766024356
|
| Disease-specific Antigen Abundances |
|
Click to View the Clearer Original Diagram
|
|
|
Cervical cancer [ICD-11: 2C77]
Click to Show/Hide
| Differential expression pattern of antigen in diseases |
| The Studied Tissue |
Cervical |
| The Specific Disease |
Cervical cancer |
| The Expression Level of Disease Section Compare with the Healthy Individual Tissue |
p-value: 0.063621799;
Fold-change: -0.693874788;
Z-score: -0.73664293
|
| Disease-specific Antigen Abundances |
|
Click to View the Clearer Original Diagram
|
|
|
Uterine cancer [ICD-11: 2C78]
Click to Show/Hide
| Differential expression pattern of antigen in diseases |
| The Studied Tissue |
Endometrium |
| The Specific Disease |
Uterine cancer |
| The Expression Level of Disease Section Compare with the Healthy Individual Tissue |
p-value: 1.19E-30;
Fold-change: -2.381648568;
Z-score: -1.260492052
|
| The Expression Level of Disease Section Compare with the Adjacent Tissue |
p-value: 0.385046531;
Fold-change: -1.538553181;
Z-score: -1.062107304
|
| Disease-specific Antigen Abundances |
|
Click to View the Clearer Original Diagram
|
|
|
Prostate cancer [ICD-11: 2C82]
Click to Show/Hide
| Differential expression pattern of antigen in diseases |
| The Studied Tissue |
Prostate |
| The Specific Disease |
Prostate cancer |
| The Expression Level of Disease Section Compare with the Healthy Individual Tissue |
p-value: 0.165838065;
Fold-change: 0.843103662;
Z-score: 0.558353153
|
| Disease-specific Antigen Abundances |
|
Click to View the Clearer Original Diagram
|
|
|
Bladder cancer [ICD-11: 2C94]
Click to Show/Hide
| Differential expression pattern of antigen in diseases |
| The Studied Tissue |
Bladder |
| The Specific Disease |
Bladder cancer |
| The Expression Level of Disease Section Compare with the Healthy Individual Tissue |
p-value: 0.039832897;
Fold-change: -2.027456072;
Z-score: -1.508333937
|
| Disease-specific Antigen Abundances |
|
Click to View the Clearer Original Diagram
|
|
|
Retina cancer [ICD-11: 2D02]
Click to Show/Hide
| Differential expression pattern of antigen in diseases |
| The Studied Tissue |
Uvea |
| The Specific Disease |
Retinoblastoma tumor |
| The Expression Level of Disease Section Compare with the Healthy Individual Tissue |
p-value: 0.000941773;
Fold-change: 1.701449031;
Z-score: 5.245317237
|
| Disease-specific Antigen Abundances |
|
Click to View the Clearer Original Diagram
|
|
|
Thyroid cancer [ICD-11: 2D10]
Click to Show/Hide
| Differential expression pattern of antigen in diseases |
| The Studied Tissue |
Thyroid |
| The Specific Disease |
Thyroid cancer |
| The Expression Level of Disease Section Compare with the Healthy Individual Tissue |
p-value: 8.14E-37;
Fold-change: -2.183923374;
Z-score: -2.237916628
|
| The Expression Level of Disease Section Compare with the Adjacent Tissue |
p-value: 7.71E-12;
Fold-change: -2.418084925;
Z-score: -1.644726969
|
| Disease-specific Antigen Abundances |
|
Click to View the Clearer Original Diagram
|
|
|
Adrenal cancer [ICD-11: 2D11]
Click to Show/Hide
| Differential expression pattern of antigen in diseases |
| The Studied Tissue |
Adrenal cortex |
| The Specific Disease |
Adrenocortical carcinoma |
| The Expression Level of Disease Section Compare with the Other Disease Section |
p-value: 9.40E-13;
Fold-change: -2.158510098;
Z-score: -3.764282064
|
| Disease-specific Antigen Abundances |

|
Click to View the Clearer Original Diagram
|
|
|
Head and neck cancer [ICD-11: 2D42]
Click to Show/Hide
| Differential expression pattern of antigen in diseases |
| The Studied Tissue |
Head and neck |
| The Specific Disease |
Head and neck cancer |
| The Expression Level of Disease Section Compare with the Healthy Individual Tissue |
p-value: 5.06E-13;
Fold-change: -1.566468918;
Z-score: -1.216516314
|
| Disease-specific Antigen Abundances |
|
Click to View the Clearer Original Diagram
|
|
|
Pituitary cancer [ICD-11: 2F37]
Click to Show/Hide
| Differential expression pattern of antigen in diseases |
| The Studied Tissue |
Pituitary |
| The Specific Disease |
Pituitary gonadotrope tumor |
| The Expression Level of Disease Section Compare with the Healthy Individual Tissue |
p-value: 1.44E-07;
Fold-change: -3.649539664;
Z-score: -4.384316702
|
| Disease-specific Antigen Abundances |
|
Click to View the Clearer Original Diagram
|
|
|
| The Studied Tissue |
Pituitary |
| The Specific Disease |
Pituitary cancer |
| The Expression Level of Disease Section Compare with the Healthy Individual Tissue |
p-value: 8.16E-07;
Fold-change: -3.23856529;
Z-score: -2.595864819
|
| Disease-specific Antigen Abundances |
|
Click to View the Clearer Original Diagram
|
|
|
ICD Disease Classification 03
Click to Show/Hide the 1 Disease of This Class
Thrombocytopenia [ICD-11: 3B64]
Click to Show/Hide
| Differential expression pattern of antigen in diseases |
| The Studied Tissue |
Whole blood |
| The Specific Disease |
Thrombocytopenia |
| The Expression Level of Disease Section Compare with the Healthy Individual Tissue |
p-value: 0.454262246;
Fold-change: 6.56728847;
Z-score: 1.752880482
|
| Disease-specific Antigen Abundances |
|
Click to View the Clearer Original Diagram
|
|
|
ICD Disease Classification 04
Click to Show/Hide the 2 Disease of This Class
Lupus erythematosus [ICD-11: 4A40]
Click to Show/Hide
| Differential expression pattern of antigen in diseases |
| The Studied Tissue |
Whole blood |
| The Specific Disease |
Lupus erythematosus |
| The Expression Level of Disease Section Compare with the Healthy Individual Tissue |
p-value: 0.731891559;
Fold-change: 0.081255382;
Z-score: 0.183787551
|
| Disease-specific Antigen Abundances |
|
Click to View the Clearer Original Diagram
|
|
|
Autoimmune disease [ICD-11: 4A4Z]
Click to Show/Hide
| Differential expression pattern of antigen in diseases |
| The Studied Tissue |
Peripheral monocyte |
| The Specific Disease |
Autoimmune uveitis |
| The Expression Level of Disease Section Compare with the Healthy Individual Tissue |
p-value: 0.019236797;
Fold-change: -0.204912354;
Z-score: -1.082319466
|
| Disease-specific Antigen Abundances |
|
Click to View the Clearer Original Diagram
|
|
|
ICD Disease Classification 05
Click to Show/Hide the 1 Disease of This Class
Hyperlipoproteinaemia [ICD-11: 5C80]
Click to Show/Hide
| Differential expression pattern of antigen in diseases |
| The Studied Tissue |
Whole blood |
| The Specific Disease |
Familial hypercholesterolemia |
| The Expression Level of Disease Section Compare with the Healthy Individual Tissue |
p-value: 0.940662635;
Fold-change: -0.009949247;
Z-score: -0.037382073
|
| Disease-specific Antigen Abundances |
|
Click to View the Clearer Original Diagram
|
|
|
ICD Disease Classification 06
Click to Show/Hide the 1 Disease of This Class
Schizophrenia [ICD-11: 6A20]
Click to Show/Hide
| Differential expression pattern of antigen in diseases |
| The Studied Tissue |
Superior temporal cortex |
| The Specific Disease |
Schizophrenia |
| The Expression Level of Disease Section Compare with the Healthy Individual Tissue |
p-value: 0.458353861;
Fold-change: 0.027799114;
Z-score: 0.051217284
|
| Disease-specific Antigen Abundances |
|
Click to View the Clearer Original Diagram
|
|
|
ICD Disease Classification 08
Click to Show/Hide the 3 Disease of This Class
Multiple sclerosis [ICD-11: 8A40]
Click to Show/Hide
| Differential expression pattern of antigen in diseases |
| The Studied Tissue |
Spinal cord |
| The Specific Disease |
Multiple sclerosis |
| The Expression Level of Disease Section Compare with the Adjacent Tissue |
p-value: 0.469737675;
Fold-change: 0.381939801;
Z-score: 0.601020445
|
| Disease-specific Antigen Abundances |
|
Click to View the Clearer Original Diagram
|
|
|
| The Studied Tissue |
Plasmacytoid dendritic cells |
| The Specific Disease |
Multiple sclerosis |
| The Expression Level of Disease Section Compare with the Healthy Individual Tissue |
p-value: 0.767537234;
Fold-change: 0.105400385;
Z-score: 0.279370079
|
| Disease-specific Antigen Abundances |
|
Click to View the Clearer Original Diagram
|
|
|
Epilepsy [ICD-11: 8A60]
Click to Show/Hide
| Differential expression pattern of antigen in diseases |
| The Studied Tissue |
Peritumoral cortex |
| The Specific Disease |
Epilepsy |
| The Expression Level of Disease Section Compare with the Other Disease Section |
p-value: 0.503345638;
Fold-change: -2.38643245;
Z-score: -1.091424657
|
| Disease-specific Antigen Abundances |
|
Click to View the Clearer Original Diagram
|
|
|
Cerebral ischaemic stroke [ICD-11: 8B11]
Click to Show/Hide
| Differential expression pattern of antigen in diseases |
| The Studied Tissue |
Whole blood |
| The Specific Disease |
Cardioembolic Stroke |
| The Expression Level of Disease Section Compare with the Healthy Individual Tissue |
p-value: 0.434242408;
Fold-change: 0.042944022;
Z-score: 0.04457145
|
| Disease-specific Antigen Abundances |
|
Click to View the Clearer Original Diagram
|
|
|
| The Studied Tissue |
Peripheral blood |
| The Specific Disease |
Ischemic stroke |
| The Expression Level of Disease Section Compare with the Healthy Individual Tissue |
p-value: 0.521653992;
Fold-change: 0.058570139;
Z-score: 0.430532497
|
| Disease-specific Antigen Abundances |
|
Click to View the Clearer Original Diagram
|
|
|
ICD Disease Classification 1
Click to Show/Hide the 6 Disease of This Class
HIV [ICD-11: 1C60-1C62]
Click to Show/Hide
| Differential expression pattern of antigen in diseases |
| The Studied Tissue |
White matter |
| The Specific Disease |
HIV |
| The Expression Level of Disease Section Compare with the Healthy Individual Tissue |
p-value: 0.392201351;
Fold-change: 0.253365285;
Z-score: 0.362143177
|
| Disease-specific Antigen Abundances |
|
Click to View the Clearer Original Diagram
|
|
|
Influenza [ICD-11: 1E30]
Click to Show/Hide
| Differential expression pattern of antigen in diseases |
| The Studied Tissue |
Whole blood |
| The Specific Disease |
Influenza |
| The Expression Level of Disease Section Compare with the Healthy Individual Tissue |
p-value: 0.18877215;
Fold-change: 0.358654235;
Z-score: 1.400783249
|
| Disease-specific Antigen Abundances |
|
Click to View the Clearer Original Diagram
|
|
|
Chronic hepatitis C [ICD-11: 1E51.1]
Click to Show/Hide
| Differential expression pattern of antigen in diseases |
| The Studied Tissue |
Whole blood |
| The Specific Disease |
Chronic hepatitis C |
| The Expression Level of Disease Section Compare with the Healthy Individual Tissue |
p-value: 0.292987449;
Fold-change: 0.109974104;
Z-score: 0.661821937
|
| Disease-specific Antigen Abundances |
|
Click to View the Clearer Original Diagram
|
|
|
Sepsis [ICD-11: 1G40-1G41]
Click to Show/Hide
| Differential expression pattern of antigen in diseases |
| The Studied Tissue |
Whole blood |
| The Specific Disease |
Sepsis |
| The Expression Level of Disease Section Compare with the Healthy Individual Tissue |
p-value: 3.67E-05;
Fold-change: 0.255460776;
Z-score: 0.502706425
|
| Disease-specific Antigen Abundances |
|
Click to View the Clearer Original Diagram
|
|
|
Septic shock [ICD-11: 1G41]
Click to Show/Hide
| Differential expression pattern of antigen in diseases |
| The Studied Tissue |
Whole blood |
| The Specific Disease |
Septic shock |
| The Expression Level of Disease Section Compare with the Healthy Individual Tissue |
p-value: 0.001104611;
Fold-change: 0.240074346;
Z-score: 0.396519476
|
| Disease-specific Antigen Abundances |
|
Click to View the Clearer Original Diagram
|
|
|
Pediatric respiratory syncytial virus infection [ICD-11: CA40.11]
Click to Show/Hide
| Differential expression pattern of antigen in diseases |
| The Studied Tissue |
Peripheral blood |
| The Specific Disease |
Pediatric respiratory syncytial virus infection |
| The Expression Level of Disease Section Compare with the Healthy Individual Tissue |
p-value: 0.441271982;
Fold-change: -0.082983799;
Z-score: -0.66397365
|
| Disease-specific Antigen Abundances |
|
Click to View the Clearer Original Diagram
|
|
|
ICD Disease Classification 11
Click to Show/Hide the 6 Disease of This Class
Essential hypertension [ICD-11: BA00]
Click to Show/Hide
| Differential expression pattern of antigen in diseases |
| The Studied Tissue |
Peripheral blood |
| The Specific Disease |
Essential hypertension |
| The Expression Level of Disease Section Compare with the Healthy Individual Tissue |
p-value: 0.784075317;
Fold-change: 0.006646393;
Z-score: 0.034760982
|
| Disease-specific Antigen Abundances |
|
Click to View the Clearer Original Diagram
|
|
|
Myocardial infarction [ICD-11: BA41]
Click to Show/Hide
| Differential expression pattern of antigen in diseases |
| The Studied Tissue |
Peripheral blood |
| The Specific Disease |
Myocardial infarction |
| The Expression Level of Disease Section Compare with the Healthy Individual Tissue |
p-value: 0.004023233;
Fold-change: 0.226780038;
Z-score: 0.37780078
|
| Disease-specific Antigen Abundances |
|
Click to View the Clearer Original Diagram
|
|
|
Coronary artery disease [ICD-11: BA8Z]
Click to Show/Hide
| Differential expression pattern of antigen in diseases |
| The Studied Tissue |
Peripheral blood |
| The Specific Disease |
Coronary artery disease |
| The Expression Level of Disease Section Compare with the Healthy Individual Tissue |
p-value: 0.311121194;
Fold-change: -0.156076352;
Z-score: -0.350321802
|
| Disease-specific Antigen Abundances |
|
Click to View the Clearer Original Diagram
|
|
|
Aortic stenosis [ICD-11: BB70]
Click to Show/Hide
| Differential expression pattern of antigen in diseases |
| The Studied Tissue |
Calcified aortic valve |
| The Specific Disease |
Aortic stenosis |
| The Expression Level of Disease Section Compare with the Healthy Individual Tissue |
p-value: 0.120612371;
Fold-change: -0.376604788;
Z-score: -0.22206428
|
| Disease-specific Antigen Abundances |
|
Click to View the Clearer Original Diagram
|
|
|
Arteriosclerosis [ICD-11: BD40]
Click to Show/Hide
| Differential expression pattern of antigen in diseases |
| The Studied Tissue |
Peripheral blood |
| The Specific Disease |
Arteriosclerosis |
| The Expression Level of Disease Section Compare with the Healthy Individual Tissue |
p-value: 0.082725344;
Fold-change: -0.131492574;
Z-score: -0.992687448
|
| Disease-specific Antigen Abundances |
|
Click to View the Clearer Original Diagram
|
|
|
Aneurysm [ICD-11: BD50]
Click to Show/Hide
| Differential expression pattern of antigen in diseases |
| The Studied Tissue |
Intracranial artery |
| The Specific Disease |
Aneurysm |
| The Expression Level of Disease Section Compare with the Healthy Individual Tissue |
p-value: 0.014587056;
Fold-change: -2.137384517;
Z-score: -1.467723161
|
| Disease-specific Antigen Abundances |
|
Click to View the Clearer Original Diagram
|
|
|
ICD Disease Classification 12
Click to Show/Hide the 8 Disease of This Class
Immunodeficiency [ICD-11: 4A00-4A20]
Click to Show/Hide
| Differential expression pattern of antigen in diseases |
| The Studied Tissue |
Peripheral blood |
| The Specific Disease |
Immunodeficiency |
| The Expression Level of Disease Section Compare with the Healthy Individual Tissue |
p-value: 0.448443033;
Fold-change: -0.068013078;
Z-score: -0.649308879
|
| Disease-specific Antigen Abundances |
|
Click to View the Clearer Original Diagram
|
|
|
Apnea [ICD-11: 7A40]
Click to Show/Hide
| Differential expression pattern of antigen in diseases |
| The Studied Tissue |
Hyperplastic tonsil |
| The Specific Disease |
Apnea |
| The Expression Level of Disease Section Compare with the Healthy Individual Tissue |
p-value: 0.044202777;
Fold-change: -0.458922184;
Z-score: -0.810931833
|
| Disease-specific Antigen Abundances |
|
Click to View the Clearer Original Diagram
|
|
|
Olive pollen allergy [ICD-11: CA08.00]
Click to Show/Hide
| Differential expression pattern of antigen in diseases |
| The Studied Tissue |
Peripheral blood |
| The Specific Disease |
Olive pollen allergy |
| The Expression Level of Disease Section Compare with the Healthy Individual Tissue |
p-value: 0.462441068;
Fold-change: 0.188087288;
Z-score: 0.643209597
|
| Disease-specific Antigen Abundances |
|
Click to View the Clearer Original Diagram
|
|
|
Chronic rhinosinusitis [ICD-11: CA0A]
Click to Show/Hide
| Differential expression pattern of antigen in diseases |
| The Studied Tissue |
Sinus mucosa |
| The Specific Disease |
Chronic rhinosinusitis |
| The Expression Level of Disease Section Compare with the Healthy Individual Tissue |
p-value: 0.349517299;
Fold-change: 0.658498062;
Z-score: 0.67062575
|
| Disease-specific Antigen Abundances |
|
Click to View the Clearer Original Diagram
|
|
|
Chronic obstructive pulmonary disease [ICD-11: CA22]
Click to Show/Hide
| Differential expression pattern of antigen in diseases |
| The Studied Tissue |
Lung |
| The Specific Disease |
Chronic obstructive pulmonary disease |
| The Expression Level of Disease Section Compare with the Healthy Individual Tissue |
p-value: 0.758698043;
Fold-change: -0.218034167;
Z-score: -0.189970178
|
| Disease-specific Antigen Abundances |
|
Click to View the Clearer Original Diagram
|
|
|
| The Studied Tissue |
Small airway epithelium |
| The Specific Disease |
Chronic obstructive pulmonary disease |
| The Expression Level of Disease Section Compare with the Healthy Individual Tissue |
p-value: 0.341525531;
Fold-change: -0.254671762;
Z-score: -0.187335707
|
| Disease-specific Antigen Abundances |
|
Click to View the Clearer Original Diagram
|
|
|
Asthma [ICD-11: CA23]
Click to Show/Hide
| Differential expression pattern of antigen in diseases |
| The Studied Tissue |
Nasal and bronchial airway |
| The Specific Disease |
Asthma |
| The Expression Level of Disease Section Compare with the Healthy Individual Tissue |
p-value: 0.724911074;
Fold-change: 0.384903135;
Z-score: 0.217843056
|
| Disease-specific Antigen Abundances |
|
Click to View the Clearer Original Diagram
|
|
|
Human rhinovirus infection [ICD-11: CA42]
Click to Show/Hide
| Differential expression pattern of antigen in diseases |
| The Studied Tissue |
Nasal Epithelium |
| The Specific Disease |
Human rhinovirus infection |
| The Expression Level of Disease Section Compare with the Healthy Individual Tissue |
p-value: 0.276000076;
Fold-change: -0.312522339;
Z-score: -0.307385073
|
| Disease-specific Antigen Abundances |
|
Click to View the Clearer Original Diagram
|
|
|
Idiopathic pulmonary fibrosis [ICD-11: CB03.4]
Click to Show/Hide
| Differential expression pattern of antigen in diseases |
| The Studied Tissue |
Lung |
| The Specific Disease |
Idiopathic pulmonary fibrosis |
| The Expression Level of Disease Section Compare with the Healthy Individual Tissue |
p-value: 0.782548026;
Fold-change: 0.513323292;
Z-score: 0.450140634
|
| Disease-specific Antigen Abundances |
|
Click to View the Clearer Original Diagram
|
|
|
ICD Disease Classification 13
Click to Show/Hide the 5 Disease of This Class
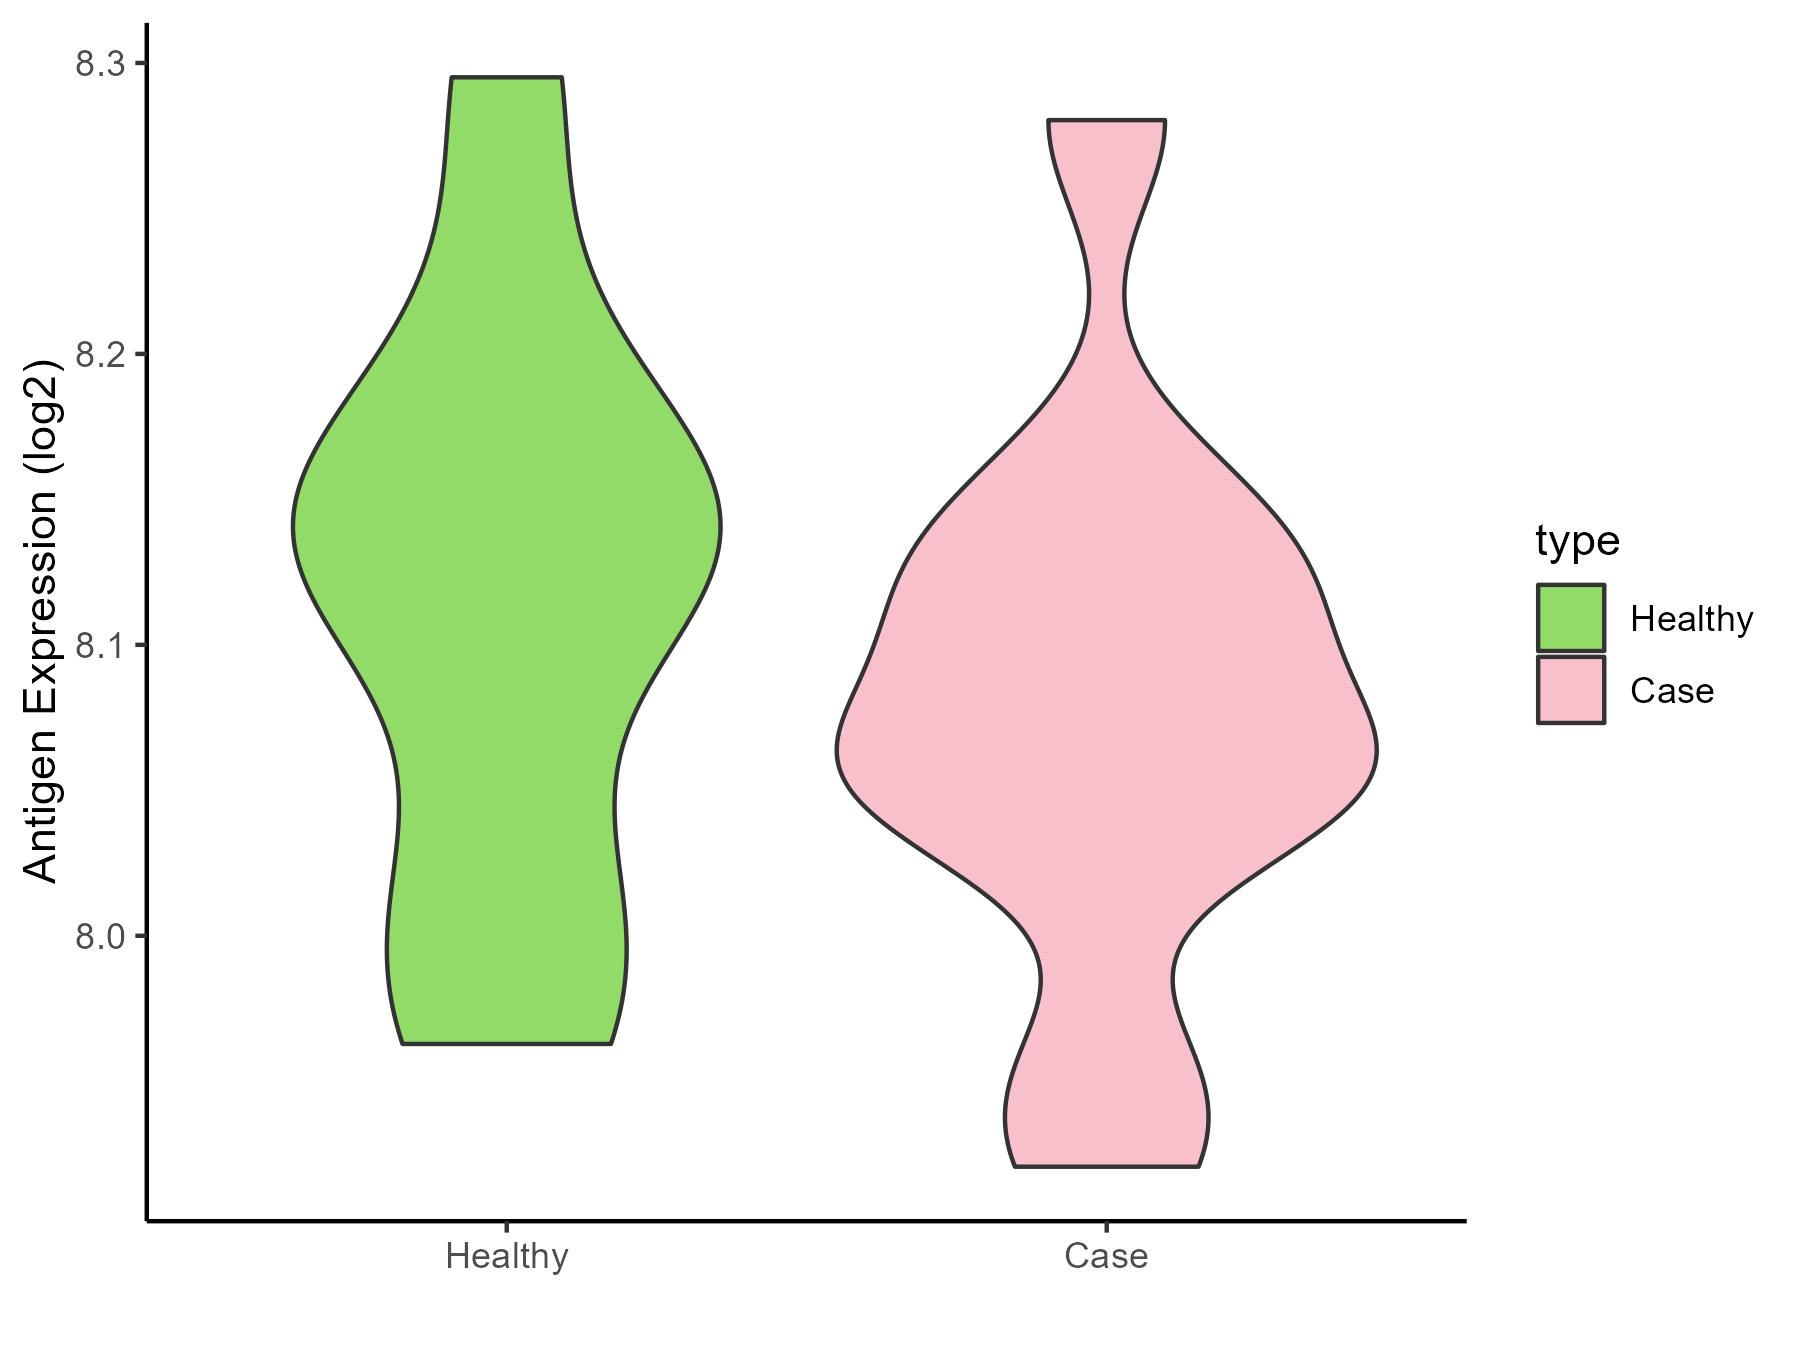
Periodontal disease [ICD-11: DA0C]
Click to Show/Hide
| Differential expression pattern of antigen in diseases |
| The Studied Tissue |
Gingival |
| The Specific Disease |
Periodontal disease |
| The Expression Level of Disease Section Compare with the Adjacent Tissue |
p-value: 0.316241951;
Fold-change: 0.082251893;
Z-score: 0.080177197
|
| Disease-specific Antigen Abundances |
|
Click to View the Clearer Original Diagram
|
|
|
Eosinophilic gastritis [ICD-11: DA42.2]
Click to Show/Hide
| Differential expression pattern of antigen in diseases |
| The Studied Tissue |
Gastric antrum |
| The Specific Disease |
Eosinophilic gastritis |
| The Expression Level of Disease Section Compare with the Adjacent Tissue |
p-value: 0.410824331;
Fold-change: 0.412980389;
Z-score: 0.831578597
|
| Disease-specific Antigen Abundances |
|
Click to View the Clearer Original Diagram
|
|
|
Liver failure [ICD-11: DB99.7-DB99.8]
Click to Show/Hide
| Differential expression pattern of antigen in diseases |
| The Studied Tissue |
Liver |
| The Specific Disease |
Liver failure |
| The Expression Level of Disease Section Compare with the Healthy Individual Tissue |
p-value: 0.969720835;
Fold-change: 0.129506684;
Z-score: 0.245798978
|
| Disease-specific Antigen Abundances |
|
Click to View the Clearer Original Diagram
|
|
|
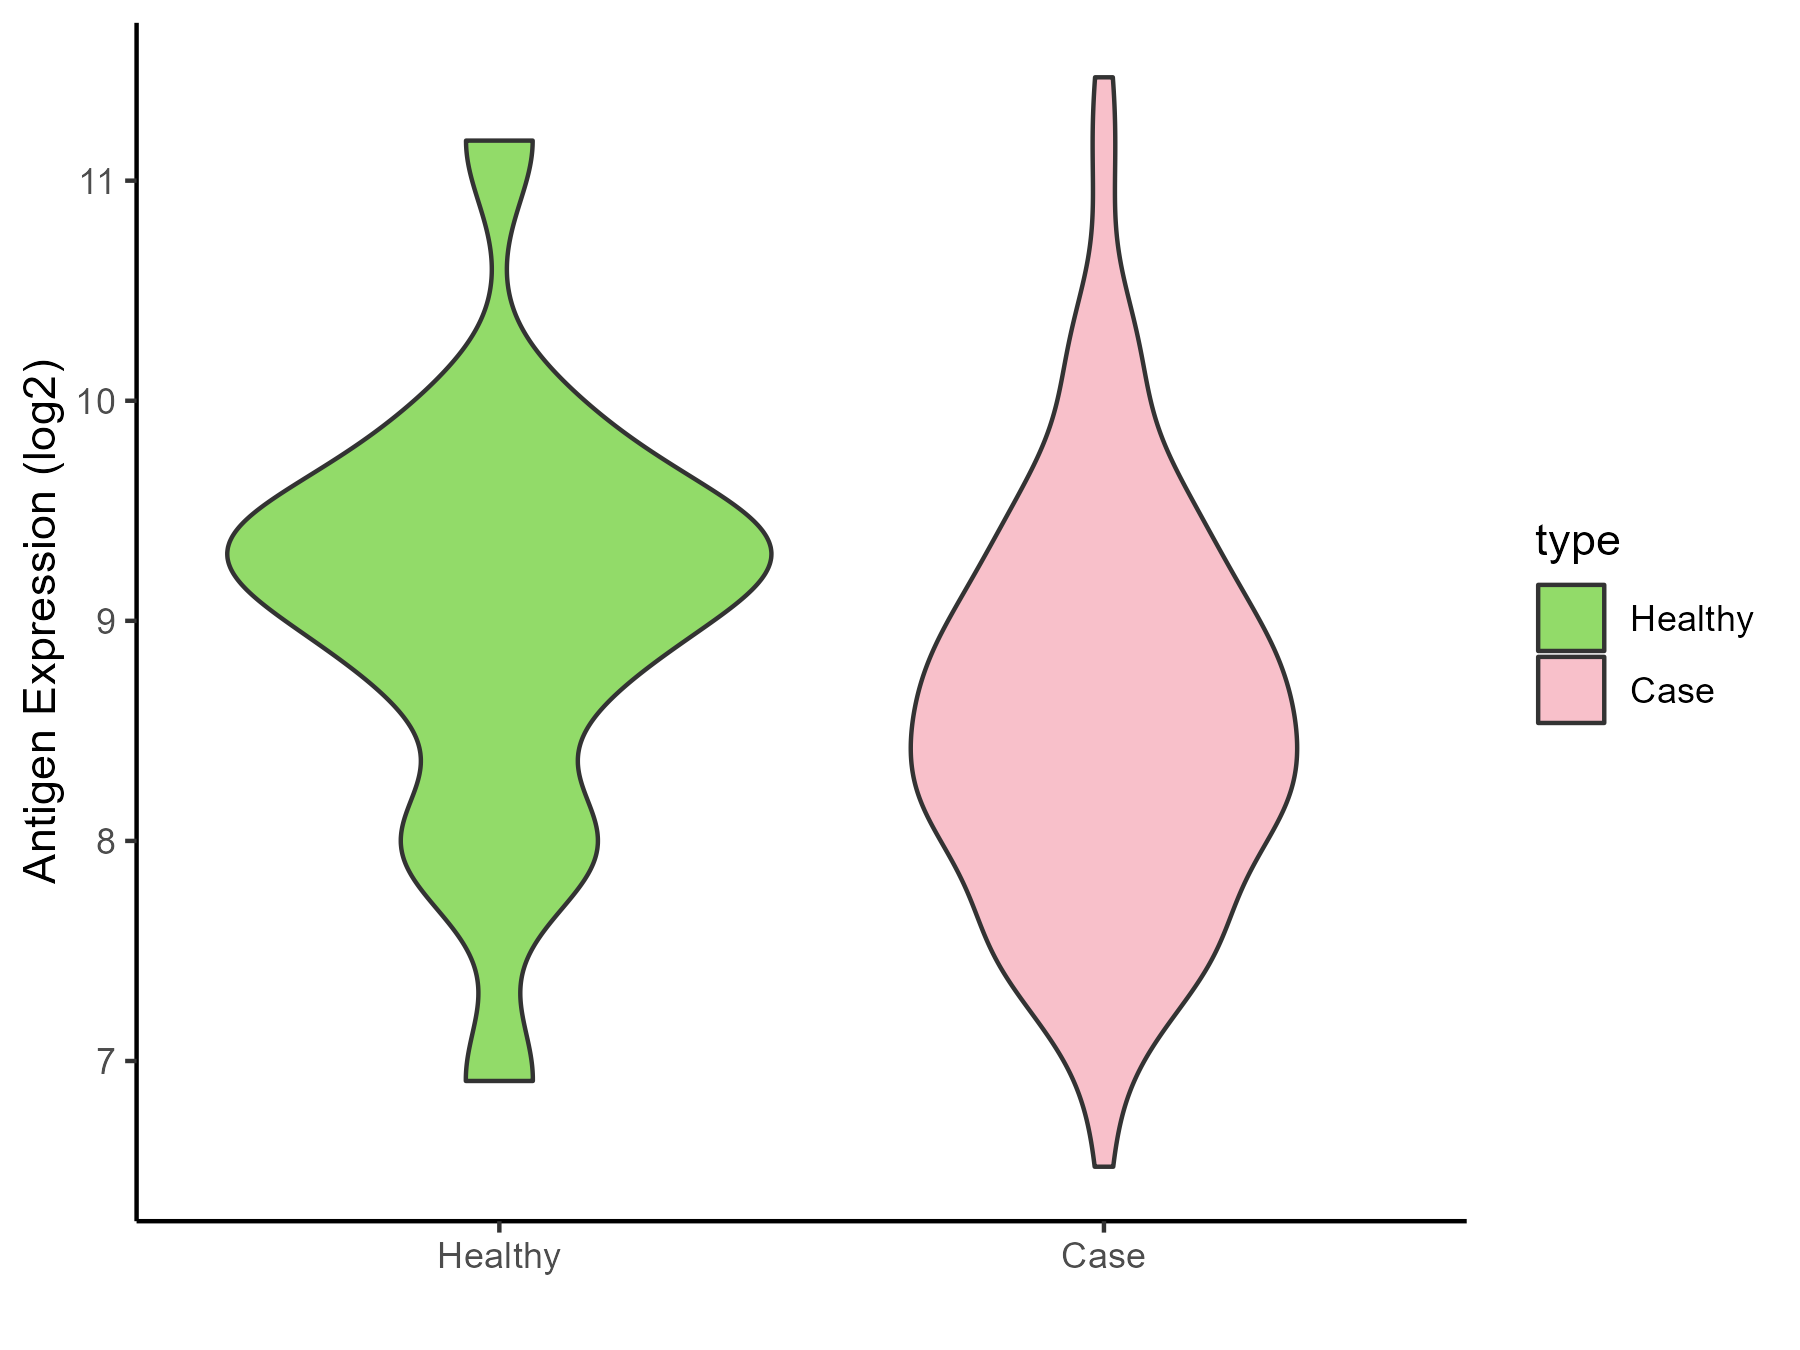
Ulcerative colitis [ICD-11: DD71]
Click to Show/Hide
| Differential expression pattern of antigen in diseases |
| The Studied Tissue |
Colon mucosal |
| The Specific Disease |
Ulcerative colitis |
| The Expression Level of Disease Section Compare with the Adjacent Tissue |
p-value: 0.010784779;
Fold-change: 0.467626587;
Z-score: 0.893918905
|
| Disease-specific Antigen Abundances |
|
Click to View the Clearer Original Diagram
|
|
|
Irritable bowel syndrome [ICD-11: DD91.0]
Click to Show/Hide
| Differential expression pattern of antigen in diseases |
| The Studied Tissue |
Rectal colon |
| The Specific Disease |
Irritable bowel syndrome |
| The Expression Level of Disease Section Compare with the Healthy Individual Tissue |
p-value: 0.183602037;
Fold-change: -0.474698512;
Z-score: -0.543922019
|
| Disease-specific Antigen Abundances |
|
Click to View the Clearer Original Diagram
|
|
|
ICD Disease Classification 14
Click to Show/Hide the 5 Disease of This Class
Atopic dermatitis [ICD-11: EA80]
Click to Show/Hide
| Differential expression pattern of antigen in diseases |
| The Studied Tissue |
Skin |
| The Specific Disease |
Atopic dermatitis |
| The Expression Level of Disease Section Compare with the Healthy Individual Tissue |
p-value: 0.000116642;
Fold-change: -0.666667142;
Z-score: -1.388226635
|
| Disease-specific Antigen Abundances |
|
Click to View the Clearer Original Diagram
|
|
|
Psoriasis [ICD-11: EA90]
Click to Show/Hide
| Differential expression pattern of antigen in diseases |
| The Studied Tissue |
Skin |
| The Specific Disease |
Psoriasis |
| The Expression Level of Disease Section Compare with the Healthy Individual Tissue |
p-value: 2.54E-10;
Fold-change: -0.457799311;
Z-score: -0.760151803
|
| The Expression Level of Disease Section Compare with the Adjacent Tissue |
p-value: 5.60E-52;
Fold-change: -1.135053664;
Z-score: -2.91794542
|
| Disease-specific Antigen Abundances |
|
Click to View the Clearer Original Diagram
|
|
|
Vitiligo [ICD-11: ED63.0]
Click to Show/Hide
| Differential expression pattern of antigen in diseases |
| The Studied Tissue |
Skin |
| The Specific Disease |
Vitiligo |
| The Expression Level of Disease Section Compare with the Healthy Individual Tissue |
p-value: 0.059248006;
Fold-change: -0.152004201;
Z-score: -0.753479014
|
| Disease-specific Antigen Abundances |
|
Click to View the Clearer Original Diagram
|
|
|
Alopecia [ICD-11: ED70]
Click to Show/Hide
| Differential expression pattern of antigen in diseases |
| The Studied Tissue |
Skin from scalp |
| The Specific Disease |
Alopecia |
| The Expression Level of Disease Section Compare with the Healthy Individual Tissue |
p-value: 0.18468289;
Fold-change: 0.110228432;
Z-score: 0.425862521
|
| Disease-specific Antigen Abundances |
|
Click to View the Clearer Original Diagram
|
|
|
Sensitive skin [ICD-11: EK0Z]
Click to Show/Hide
| Differential expression pattern of antigen in diseases |
| The Studied Tissue |
Skin |
| The Specific Disease |
Sensitive skin |
| The Expression Level of Disease Section Compare with the Healthy Individual Tissue |
p-value: 0.882374204;
Fold-change: -0.063381694;
Z-score: -0.237690362
|
| Disease-specific Antigen Abundances |
|
Click to View the Clearer Original Diagram
|
|
|
ICD Disease Classification 15
Click to Show/Hide the 6 Disease of This Class
Osteoarthritis [ICD-11: FA00-FA0Z]
Click to Show/Hide
| Differential expression pattern of antigen in diseases |
| The Studied Tissue |
Synovial |
| The Specific Disease |
Osteoarthritis |
| The Expression Level of Disease Section Compare with the Healthy Individual Tissue |
p-value: 0.015610121;
Fold-change: -1.691909888;
Z-score: -1.171434392
|
| Disease-specific Antigen Abundances |
|
Click to View the Clearer Original Diagram
|
|
|
Arthropathy [ICD-11: FA00-FA5Z]
Click to Show/Hide
| Differential expression pattern of antigen in diseases |
| The Studied Tissue |
Peripheral blood |
| The Specific Disease |
Arthropathy |
| The Expression Level of Disease Section Compare with the Healthy Individual Tissue |
p-value: 0.964172746;
Fold-change: 0.015871504;
Z-score: 0.08422479
|
| Disease-specific Antigen Abundances |
|
Click to View the Clearer Original Diagram
|
|
|
Arthritis [ICD-11: FA20]
Click to Show/Hide
| Differential expression pattern of antigen in diseases |
| The Studied Tissue |
Peripheral blood |
| The Specific Disease |
Arthritis |
| The Expression Level of Disease Section Compare with the Healthy Individual Tissue |
p-value: 0.5615674;
Fold-change: -0.059415179;
Z-score: -0.193181452
|
| Disease-specific Antigen Abundances |
|
Click to View the Clearer Original Diagram
|
|
|
Rheumatoid arthritis [ICD-11: FA20]
Click to Show/Hide
| Differential expression pattern of antigen in diseases |
| The Studied Tissue |
Synovial |
| The Specific Disease |
Rheumatoid arthritis |
| The Expression Level of Disease Section Compare with the Healthy Individual Tissue |
p-value: 0.305521838;
Fold-change: -0.221440921;
Z-score: -0.214564689
|
| Disease-specific Antigen Abundances |
|
Click to View the Clearer Original Diagram
|
|
|
Ankylosing spondylitis [ICD-11: FA92.0Z]
Click to Show/Hide
| Differential expression pattern of antigen in diseases |
| The Studied Tissue |
Pheripheral blood |
| The Specific Disease |
Ankylosing spondylitis |
| The Expression Level of Disease Section Compare with the Healthy Individual Tissue |
p-value: 0.474781935;
Fold-change: -0.028350566;
Z-score: -0.065302946
|
| Disease-specific Antigen Abundances |
|
Click to View the Clearer Original Diagram
|
|
|
Osteoporosis [ICD-11: FB83]
Click to Show/Hide
| Differential expression pattern of antigen in diseases |
| The Studied Tissue |
Bone marrow |
| The Specific Disease |
Osteoporosis |
| The Expression Level of Disease Section Compare with the Healthy Individual Tissue |
p-value: 0.418582081;
Fold-change: -0.007927657;
Z-score: -0.048715155
|
| Disease-specific Antigen Abundances |
|
Click to View the Clearer Original Diagram
|
|
|
ICD Disease Classification 16
Click to Show/Hide the 2 Disease of This Class
Endometriosis [ICD-11: GA10]
Click to Show/Hide
| Differential expression pattern of antigen in diseases |
| The Studied Tissue |
Endometrium |
| The Specific Disease |
Endometriosis |
| The Expression Level of Disease Section Compare with the Healthy Individual Tissue |
p-value: 0.174641973;
Fold-change: 0.287289269;
Z-score: 0.191220399
|
| Disease-specific Antigen Abundances |
|
Click to View the Clearer Original Diagram
|
|
|
Interstitial cystitis [ICD-11: GC00.3]
Click to Show/Hide
| Differential expression pattern of antigen in diseases |
| The Studied Tissue |
Bladder |
| The Specific Disease |
Interstitial cystitis |
| The Expression Level of Disease Section Compare with the Healthy Individual Tissue |
p-value: 0.524115535;
Fold-change: -1.279701739;
Z-score: -1.045604482
|
| Disease-specific Antigen Abundances |
|
Click to View the Clearer Original Diagram
|
|
|
ICD Disease Classification 19
Click to Show/Hide the 1 Disease of This Class
Preterm birth [ICD-11: KA21.4Z]
Click to Show/Hide
| Differential expression pattern of antigen in diseases |
| The Studied Tissue |
Myometrium |
| The Specific Disease |
Preterm birth |
| The Expression Level of Disease Section Compare with the Healthy Individual Tissue |
p-value: 0.347036138;
Fold-change: 0.749631894;
Z-score: 0.858160654
|
| Disease-specific Antigen Abundances |
|
Click to View the Clearer Original Diagram
|
|
|
ICD Disease Classification 2
Click to Show/Hide the 8 Disease of This Class
Acute myelocytic leukemia [ICD-11: 2A60]
Click to Show/Hide
| Differential expression pattern of antigen in diseases |
| The Studied Tissue |
Bone marrow |
| The Specific Disease |
Acute myelocytic leukemia |
| The Expression Level of Disease Section Compare with the Healthy Individual Tissue |
p-value: 0.872085345;
Fold-change: -0.017765068;
Z-score: -0.030015786
|
| Disease-specific Antigen Abundances |
|
Click to View the Clearer Original Diagram
|
|
|
Myeloma [ICD-11: 2A83]
Click to Show/Hide
| Differential expression pattern of antigen in diseases |
| The Studied Tissue |
Peripheral blood |
| The Specific Disease |
Myeloma |
| The Expression Level of Disease Section Compare with the Healthy Individual Tissue |
p-value: 0.202111516;
Fold-change: 0.159173437;
Z-score: 0.597573935
|
| Disease-specific Antigen Abundances |
|
Click to View the Clearer Original Diagram
|
|
|
| The Studied Tissue |
Bone marrow |
| The Specific Disease |
Myeloma |
| The Expression Level of Disease Section Compare with the Healthy Individual Tissue |
p-value: 0.001641871;
Fold-change: -0.332418819;
Z-score: -1.633063378
|
| Disease-specific Antigen Abundances |
|
Click to View the Clearer Original Diagram
|
|
|
Oral cancer [ICD-11: 2B6E]
Click to Show/Hide
| Differential expression pattern of antigen in diseases |
| The Studied Tissue |
Oral |
| The Specific Disease |
Oral cancer |
| The Expression Level of Disease Section Compare with the Healthy Individual Tissue |
p-value: 0.000146621;
Fold-change: -2.970011939;
Z-score: -1.390405582
|
| The Expression Level of Disease Section Compare with the Adjacent Tissue |
p-value: 7.45E-07;
Fold-change: -1.036501772;
Z-score: -0.892140733
|
| Disease-specific Antigen Abundances |
|
Click to View the Clearer Original Diagram
|
|
|
Esophagal cancer [ICD-11: 2B70]
Click to Show/Hide
| Differential expression pattern of antigen in diseases |
| The Studied Tissue |
Esophagus |
| The Specific Disease |
Esophagal cancer |
| The Expression Level of Disease Section Compare with the Adjacent Tissue |
p-value: 0.004844632;
Fold-change: -3.015119997;
Z-score: -2.33151128
|
| Disease-specific Antigen Abundances |
|
Click to View the Clearer Original Diagram
|
|
|
Rectal cancer [ICD-11: 2B92]
Click to Show/Hide
| Differential expression pattern of antigen in diseases |
| The Studied Tissue |
Rectal colon |
| The Specific Disease |
Rectal cancer |
| The Expression Level of Disease Section Compare with the Healthy Individual Tissue |
p-value: 0.060474029;
Fold-change: -1.167627874;
Z-score: -1.560716461
|
| The Expression Level of Disease Section Compare with the Adjacent Tissue |
p-value: 0.032670068;
Fold-change: -0.805213414;
Z-score: -1.587732591
|
| Disease-specific Antigen Abundances |
|
Click to View the Clearer Original Diagram
|
|
|
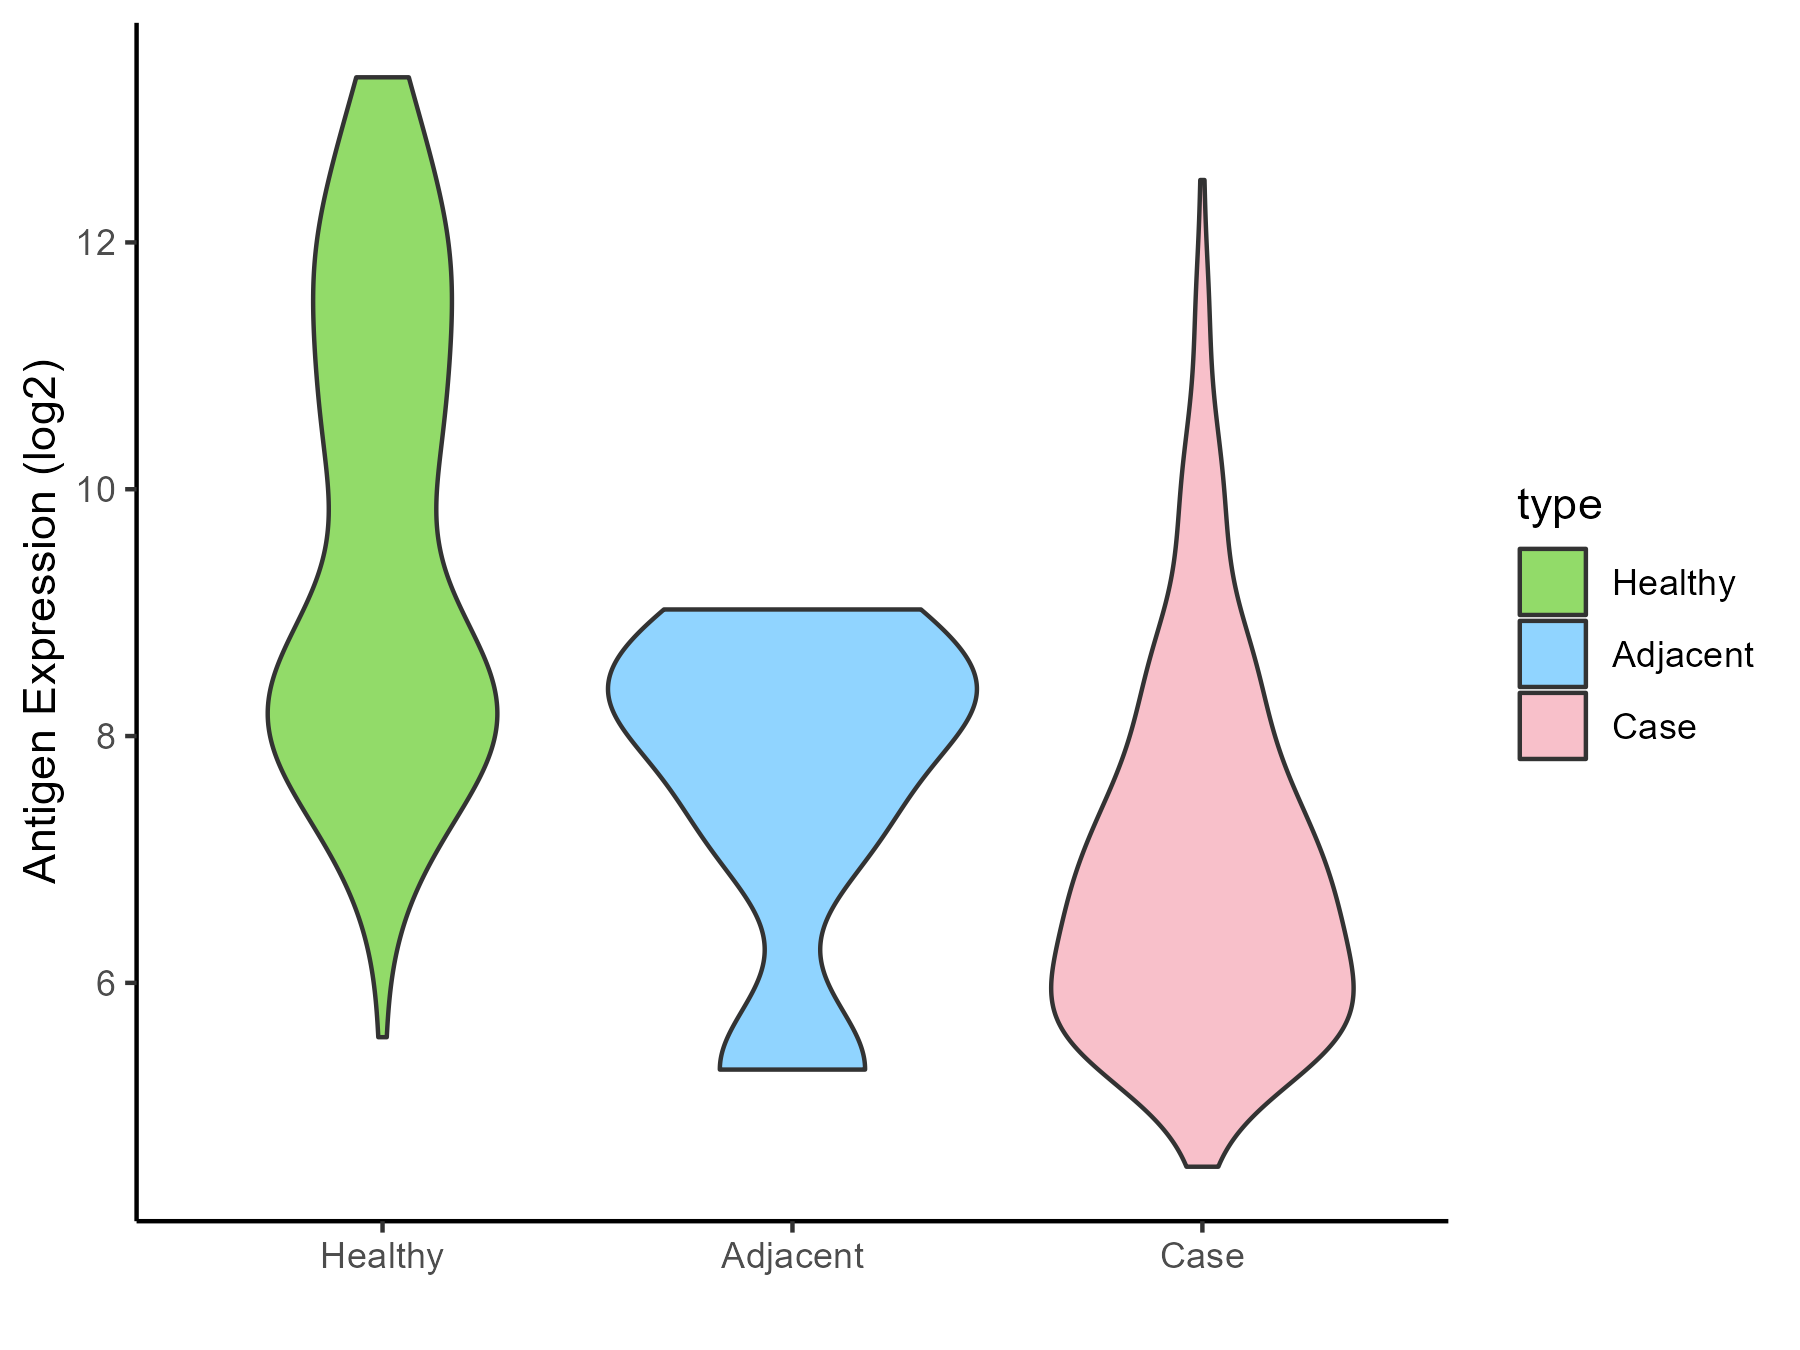
Skin cancer [ICD-11: 2C30-2C3Z]
Click to Show/Hide
| Differential expression pattern of antigen in diseases |
| The Studied Tissue |
Skin |
| The Specific Disease |
Skin cancer |
| The Expression Level of Disease Section Compare with the Healthy Individual Tissue |
p-value: 2.03E-14;
Fold-change: -0.619718367;
Z-score: -0.80304158
|
| The Expression Level of Disease Section Compare with the Adjacent Tissue |
p-value: 1.11E-29;
Fold-change: -1.171305883;
Z-score: -1.810328923
|
| Disease-specific Antigen Abundances |
|
Click to View the Clearer Original Diagram
|
|
|
Renal cancer [ICD-11: 2C90-2C91]
Click to Show/Hide
| Differential expression pattern of antigen in diseases |
| The Studied Tissue |
Kidney |
| The Specific Disease |
Renal cancer |
| The Expression Level of Disease Section Compare with the Healthy Individual Tissue |
p-value: 0.001327717;
Fold-change: -1.387017992;
Z-score: -1.332332935
|
| The Expression Level of Disease Section Compare with the Adjacent Tissue |
p-value: 1.13E-24;
Fold-change: -1.734917178;
Z-score: -2.049420319
|
| Disease-specific Antigen Abundances |
|
Click to View the Clearer Original Diagram
|
|
|
Ureter cancer [ICD-11: 2C92]
Click to Show/Hide
| Differential expression pattern of antigen in diseases |
| The Studied Tissue |
Urothelium |
| The Specific Disease |
Ureter cancer |
| The Expression Level of Disease Section Compare with the Healthy Individual Tissue |
p-value: 0.474389159;
Fold-change: -0.00878568;
Z-score: -0.021891444
|
| Disease-specific Antigen Abundances |
|
Click to View the Clearer Original Diagram
|
|
|
ICD Disease Classification 20
Click to Show/Hide the 2 Disease of This Class
Simpson golabi behmel syndrome [ICD-11: LD2C]
Click to Show/Hide
| Differential expression pattern of antigen in diseases |
| The Studied Tissue |
Adipose |
| The Specific Disease |
Simpson golabi behmel syndrome |
| The Expression Level of Disease Section Compare with the Healthy Individual Tissue |
p-value: 0.694786379;
Fold-change: -0.00349399;
Z-score: -0.006297926
|
| Disease-specific Antigen Abundances |
|
Click to View the Clearer Original Diagram
|
|
|
Tuberous sclerosis complex [ICD-11: LD2D.2]
Click to Show/Hide
| Differential expression pattern of antigen in diseases |
| The Studied Tissue |
Perituberal |
| The Specific Disease |
Tuberous sclerosis complex |
| The Expression Level of Disease Section Compare with the Healthy Individual Tissue |
p-value: 0.637193151;
Fold-change: 0.014019917;
Z-score: 0.042826471
|
| Disease-specific Antigen Abundances |
|
Click to View the Clearer Original Diagram
|
|
|
ICD Disease Classification 3
Click to Show/Hide the 3 Disease of This Class
Anemia [ICD-11: 3A00-3A9Z]
Click to Show/Hide
| Differential expression pattern of antigen in diseases |
| The Studied Tissue |
Bone marrow |
| The Specific Disease |
Anemia |
| The Expression Level of Disease Section Compare with the Healthy Individual Tissue |
p-value: 0.187618964;
Fold-change: 0.09142479;
Z-score: 0.207234976
|
| Disease-specific Antigen Abundances |
|
Click to View the Clearer Original Diagram
|
|
|
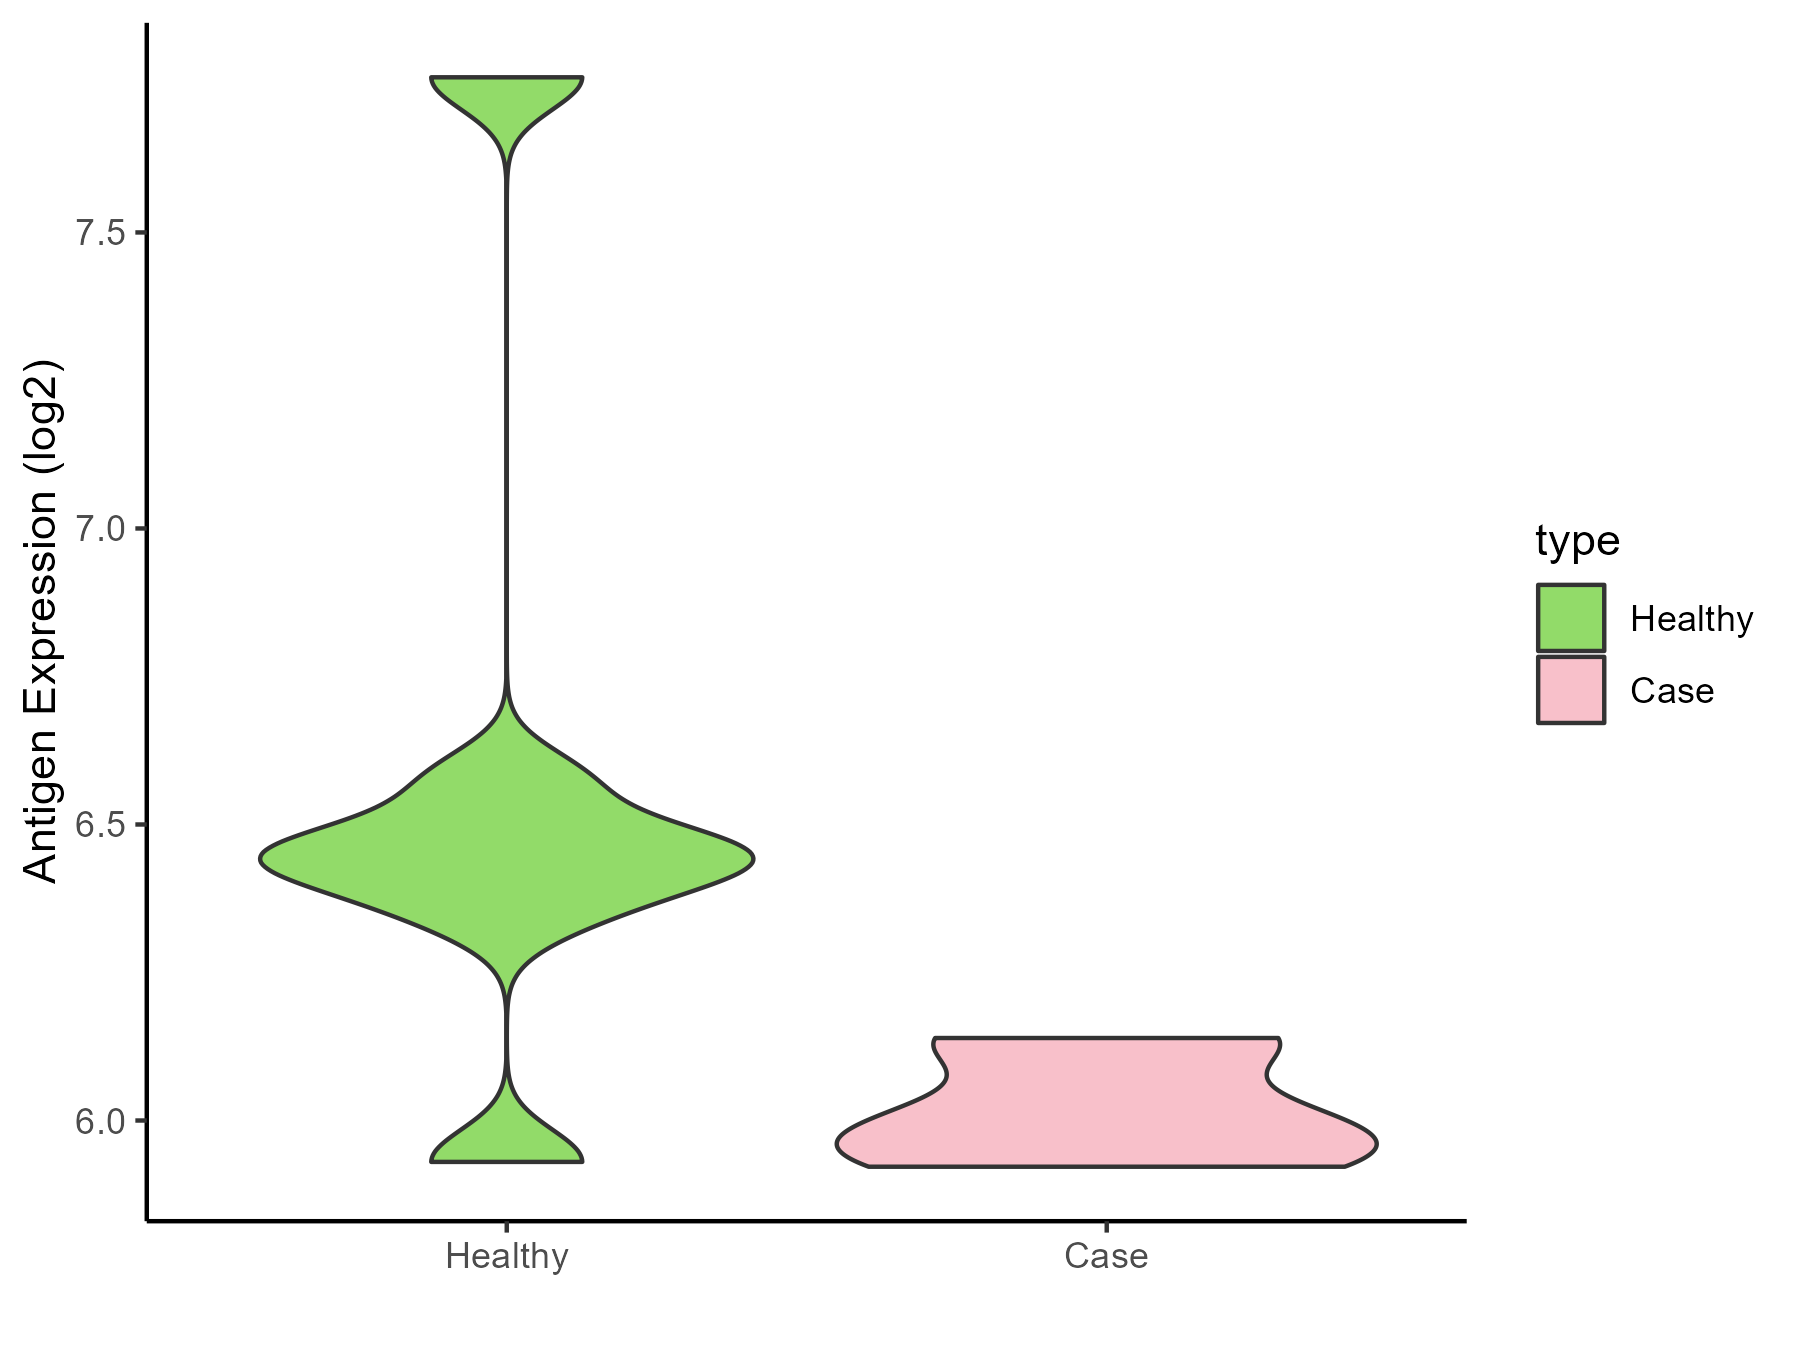
Sickle cell disease [ICD-11: 3A51.0-3A51.3]
Click to Show/Hide
| Differential expression pattern of antigen in diseases |
| The Studied Tissue |
Peripheral blood |
| The Specific Disease |
Sickle cell disease |
| The Expression Level of Disease Section Compare with the Healthy Individual Tissue |
p-value: 0.080038773;
Fold-change: 0.17838253;
Z-score: 0.65397067
|
| Disease-specific Antigen Abundances |
|
Click to View the Clearer Original Diagram
|
|
|
Thrombocythemia [ICD-11: 3B63]
Click to Show/Hide
| Differential expression pattern of antigen in diseases |
| The Studied Tissue |
Whole blood |
| The Specific Disease |
Thrombocythemia |
| The Expression Level of Disease Section Compare with the Healthy Individual Tissue |
p-value: 0.200783532;
Fold-change: 0.039032727;
Z-score: 0.197116861
|
| Disease-specific Antigen Abundances |
|
Click to View the Clearer Original Diagram
|
|
|
ICD Disease Classification 4
Click to Show/Hide the 4 Disease of This Class
Scleroderma [ICD-11: 4A42.Z]
Click to Show/Hide
| Differential expression pattern of antigen in diseases |
| The Studied Tissue |
Whole blood |
| The Specific Disease |
Scleroderma |
| The Expression Level of Disease Section Compare with the Healthy Individual Tissue |
p-value: 0.000106987;
Fold-change: -0.317481437;
Z-score: -2.039737967
|
| Disease-specific Antigen Abundances |

|
Click to View the Clearer Original Diagram
|
|
|
Sjogren syndrome [ICD-11: 4A43]
Click to Show/Hide
| Differential expression pattern of antigen in diseases |
| The Studied Tissue |
Salivary gland |
| The Specific Disease |
Sjogren syndrome |
| The Expression Level of Disease Section Compare with the Healthy Individual Tissue |
p-value: 0.44804031;
Fold-change: 0.049068663;
Z-score: 0.114201453
|
| The Expression Level of Disease Section Compare with the Adjacent Tissue |
p-value: 0.010869002;
Fold-change: -2.345801262;
Z-score: -2.430573722
|
| Disease-specific Antigen Abundances |
|
Click to View the Clearer Original Diagram
|
|
|
Behcet disease [ICD-11: 4A62]
Click to Show/Hide
| Differential expression pattern of antigen in diseases |
| The Studied Tissue |
Peripheral blood |
| The Specific Disease |
Behcet disease |
| The Expression Level of Disease Section Compare with the Healthy Individual Tissue |
p-value: 0.939939215;
Fold-change: -0.061375132;
Z-score: -0.20181987
|
| Disease-specific Antigen Abundances |
|
Click to View the Clearer Original Diagram
|
|
|
Autosomal dominant monocytopenia [ICD-11: 4B04]
Click to Show/Hide
| Differential expression pattern of antigen in diseases |
| The Studied Tissue |
Whole blood |
| The Specific Disease |
Autosomal dominant monocytopenia |
| The Expression Level of Disease Section Compare with the Healthy Individual Tissue |
p-value: 0.336756563;
Fold-change: -0.119817607;
Z-score: -0.462691317
|
| Disease-specific Antigen Abundances |
|
Click to View the Clearer Original Diagram
|
|
|
ICD Disease Classification 5
Click to Show/Hide the 5 Disease of This Class
Type 2 diabetes [ICD-11: 5A11]
Click to Show/Hide
| Differential expression pattern of antigen in diseases |
| The Studied Tissue |
Liver |
| The Specific Disease |
Type 2 diabetes |
| The Expression Level of Disease Section Compare with the Healthy Individual Tissue |
p-value: 0.822171774;
Fold-change: -0.060777903;
Z-score: -0.33883257
|
| Disease-specific Antigen Abundances |
|
Click to View the Clearer Original Diagram
|
|
|
Polycystic ovary syndrome [ICD-11: 5A80.1]
Click to Show/Hide
| Differential expression pattern of antigen in diseases |
| The Studied Tissue |
Vastus lateralis muscle |
| The Specific Disease |
Polycystic ovary syndrome |
| The Expression Level of Disease Section Compare with the Healthy Individual Tissue |
p-value: 0.755921359;
Fold-change: -0.265986105;
Z-score: -0.688781394
|
| Disease-specific Antigen Abundances |
|
Click to View the Clearer Original Diagram
|
|
|
Obesity [ICD-11: 5B81]
Click to Show/Hide
| Differential expression pattern of antigen in diseases |
| The Studied Tissue |
Subcutaneous Adipose |
| The Specific Disease |
Obesity |
| The Expression Level of Disease Section Compare with the Healthy Individual Tissue |
p-value: 0.760828603;
Fold-change: -0.111254828;
Z-score: -0.219429889
|
| Disease-specific Antigen Abundances |
|
Click to View the Clearer Original Diagram
|
|
|
Pompe disease [ICD-11: 5C51.3]
Click to Show/Hide
| Differential expression pattern of antigen in diseases |
| The Studied Tissue |
Biceps muscle |
| The Specific Disease |
Pompe disease |
| The Expression Level of Disease Section Compare with the Healthy Individual Tissue |
p-value: 0.001372642;
Fold-change: 0.672359683;
Z-score: 1.371515535
|
| Disease-specific Antigen Abundances |
|
Click to View the Clearer Original Diagram
|
|
|
Batten disease [ICD-11: 5C56.1]
Click to Show/Hide
| Differential expression pattern of antigen in diseases |
| The Studied Tissue |
Whole blood |
| The Specific Disease |
Batten disease |
| The Expression Level of Disease Section Compare with the Healthy Individual Tissue |
p-value: 0.518445031;
Fold-change: -0.036156897;
Z-score: -0.264414951
|
| Disease-specific Antigen Abundances |
|
Click to View the Clearer Original Diagram
|
|
|
ICD Disease Classification 6
Click to Show/Hide the 2 Disease of This Class
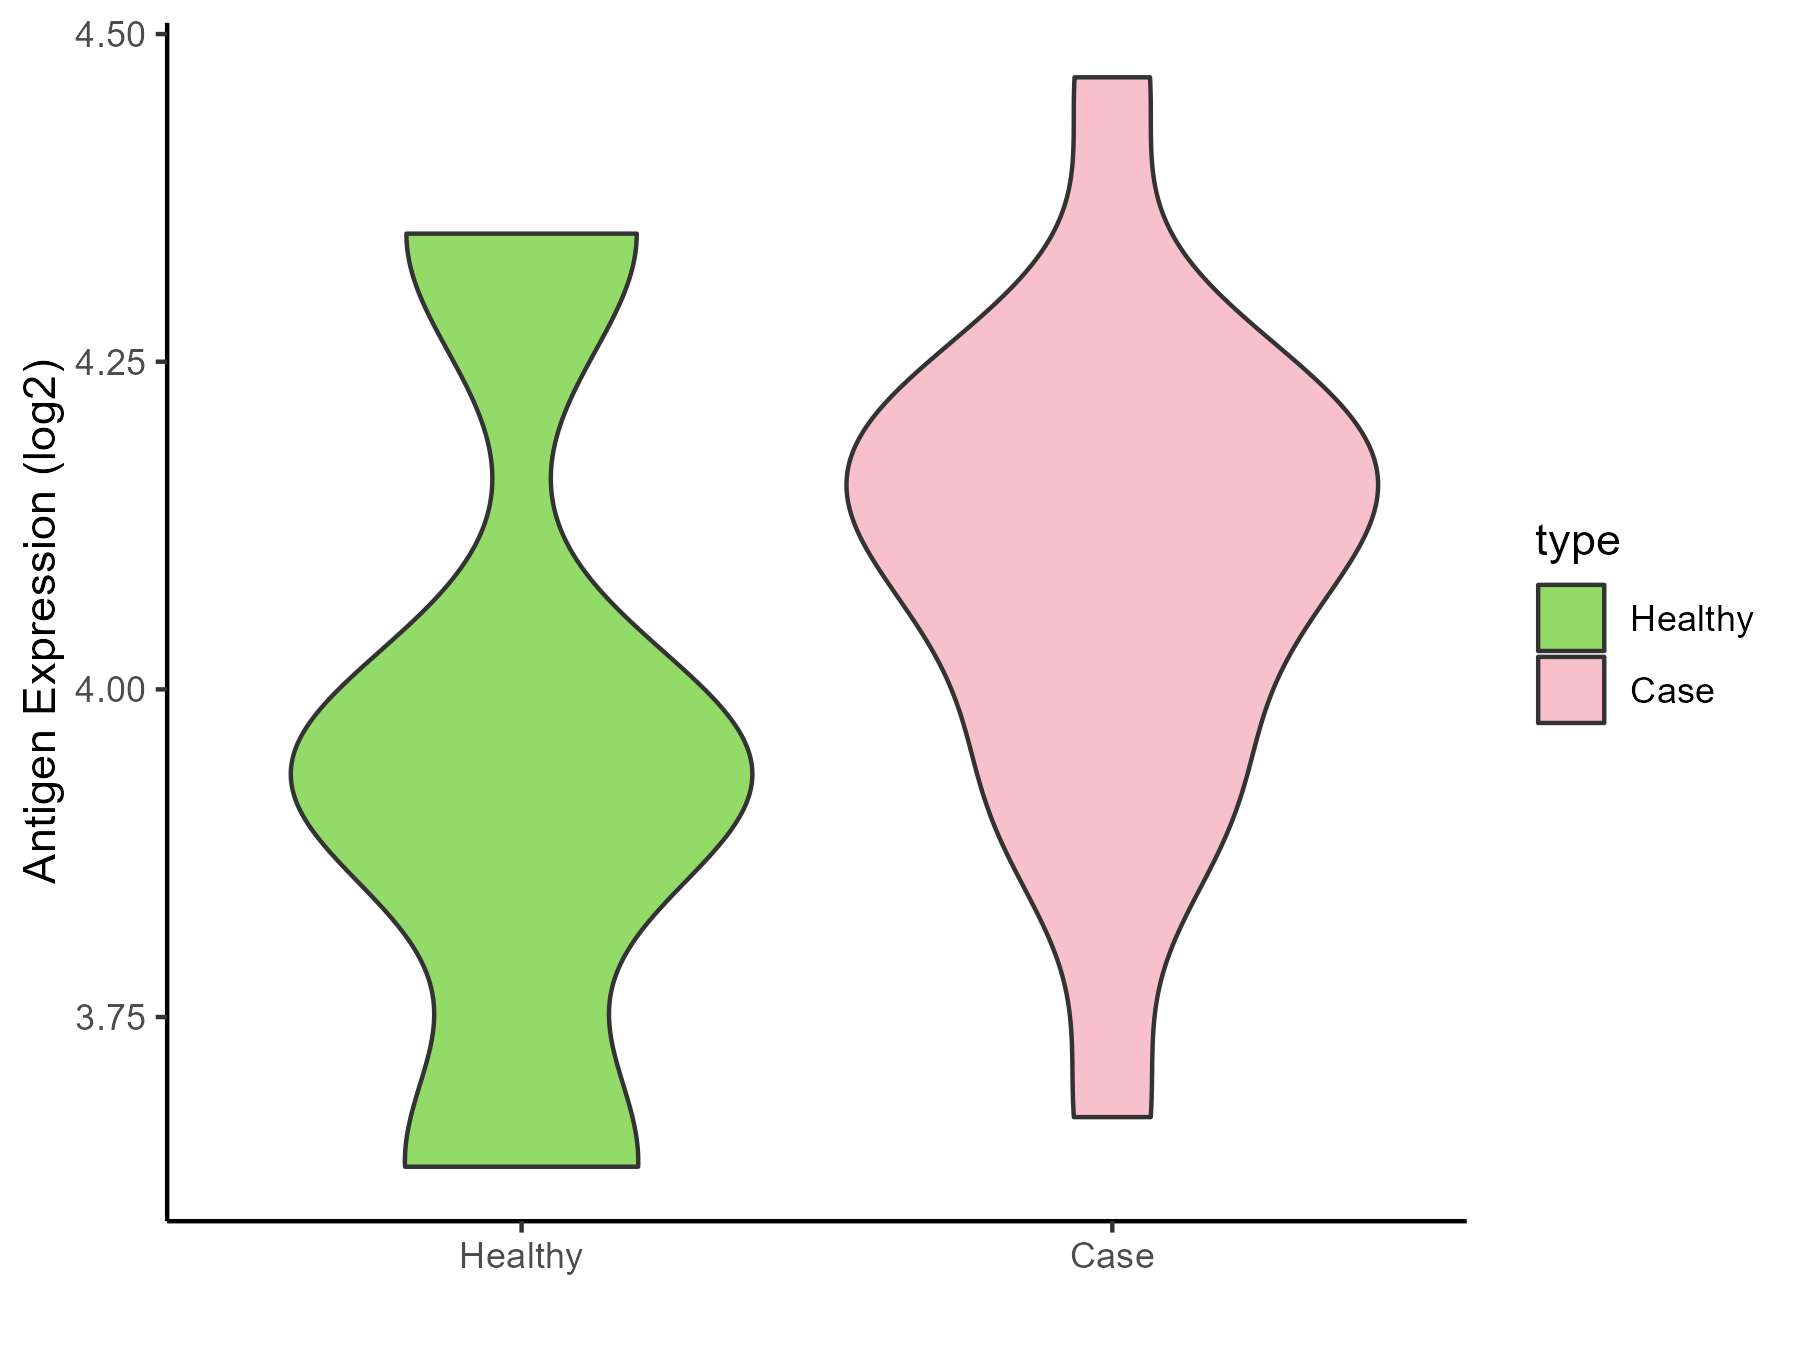
Autism [ICD-11: 6A02]
Click to Show/Hide
| Differential expression pattern of antigen in diseases |
| The Studied Tissue |
Whole blood |
| The Specific Disease |
Autism |
| The Expression Level of Disease Section Compare with the Healthy Individual Tissue |
p-value: 0.309417072;
Fold-change: -0.02876894;
Z-score: -0.083124474
|
| Disease-specific Antigen Abundances |
|
Click to View the Clearer Original Diagram
|
|
|
Anxiety disorder [ICD-11: 6B00-6B0Z]
Click to Show/Hide
| Differential expression pattern of antigen in diseases |
| The Studied Tissue |
Whole blood |
| The Specific Disease |
Anxiety disorder |
| The Expression Level of Disease Section Compare with the Healthy Individual Tissue |
p-value: 0.045839935;
Fold-change: 0.078544356;
Z-score: 0.265499723
|
| Disease-specific Antigen Abundances |
|
Click to View the Clearer Original Diagram
|
|
|
ICD Disease Classification 8
Click to Show/Hide the 7 Disease of This Class
Parkinson disease [ICD-11: 8A00]
Click to Show/Hide
| Differential expression pattern of antigen in diseases |
| The Studied Tissue |
Substantia nigra |
| The Specific Disease |
Parkinson disease |
| The Expression Level of Disease Section Compare with the Healthy Individual Tissue |
p-value: 0.66379838;
Fold-change: 0.127567726;
Z-score: 0.218163213
|
| Disease-specific Antigen Abundances |
|
Click to View the Clearer Original Diagram
|
|
|
Huntington disease [ICD-11: 8A01]
Click to Show/Hide
| Differential expression pattern of antigen in diseases |
| The Studied Tissue |
Whole blood |
| The Specific Disease |
Huntington disease |
| The Expression Level of Disease Section Compare with the Healthy Individual Tissue |
p-value: 0.144954184;
Fold-change: 0.05784905;
Z-score: 0.285662888
|
| Disease-specific Antigen Abundances |
|
Click to View the Clearer Original Diagram
|
|
|
Alzheimer disease [ICD-11: 8A20]
Click to Show/Hide
| Differential expression pattern of antigen in diseases |
| The Studied Tissue |
Entorhinal cortex |
| The Specific Disease |
Alzheimer disease |
| The Expression Level of Disease Section Compare with the Healthy Individual Tissue |
p-value: 7.82E-07;
Fold-change: 0.266224381;
Z-score: 0.396771353
|
| Disease-specific Antigen Abundances |
|
Click to View the Clearer Original Diagram
|
|
|
Seizure [ICD-11: 8A60-8A6Z]
Click to Show/Hide
| Differential expression pattern of antigen in diseases |
| The Studied Tissue |
Whole blood |
| The Specific Disease |
Seizure |
| The Expression Level of Disease Section Compare with the Healthy Individual Tissue |
p-value: 0.89940485;
Fold-change: -0.00856618;
Z-score: -0.040846725
|
| Disease-specific Antigen Abundances |
|
Click to View the Clearer Original Diagram
|
|
|
Lateral sclerosis [ICD-11: 8B60.4]
Click to Show/Hide
| Differential expression pattern of antigen in diseases |
| The Studied Tissue |
Skin |
| The Specific Disease |
Lateral sclerosis |
| The Expression Level of Disease Section Compare with the Healthy Individual Tissue |
p-value: 0.323799067;
Fold-change: -0.514040561;
Z-score: -1.382333158
|
| Disease-specific Antigen Abundances |
|
Click to View the Clearer Original Diagram
|
|
|
| The Studied Tissue |
Cervical spinal cord |
| The Specific Disease |
Lateral sclerosis |
| The Expression Level of Disease Section Compare with the Healthy Individual Tissue |
p-value: 0.179653237;
Fold-change: -0.586558797;
Z-score: -0.276116246
|
| Disease-specific Antigen Abundances |
|
Click to View the Clearer Original Diagram
|
|
|
Muscular atrophy [ICD-11: 8C70]
Click to Show/Hide
| Differential expression pattern of antigen in diseases |
| The Studied Tissue |
Muscle |
| The Specific Disease |
Muscular atrophy |
| The Expression Level of Disease Section Compare with the Healthy Individual Tissue |
p-value: 0.559870642;
Fold-change: -0.246855143;
Z-score: -0.234784644
|
| Disease-specific Antigen Abundances |
|
Click to View the Clearer Original Diagram
|
|
|
Myopathy [ICD-11: 8C70.6]
Click to Show/Hide
| Differential expression pattern of antigen in diseases |
| The Studied Tissue |
Muscle |
| The Specific Disease |
Myopathy |
| The Expression Level of Disease Section Compare with the Healthy Individual Tissue |
p-value: 0.159489427;
Fold-change: 0.303572339;
Z-score: 0.483971533
|
| Disease-specific Antigen Abundances |
|
Click to View the Clearer Original Diagram
|
|
|
