Antigen Information
General Information of This Antigen
| Antigen ID | TAR0VQYAS |
|||||
|---|---|---|---|---|---|---|
| Antigen Name | Interferon-stimulated gene 20 kDa protein (ISG20) |
|||||
| Gene Name | ISG20 |
|||||
| Gene ID | ||||||
| Synonym | HEM45; Estrogen-regulated transcript 45 protein;Promyelocytic leukemia nuclear body-associated protein ISG20 |
|||||
| Sequence |
MAGSREVVAMDCEMVGLGPHRESGLARCSLVNVHGAVLYDKFIRPEGEITDYRTRVSGVT
PQHMVGATPFAVARLEILQLLKGKLVVGHDLKHDFQALKEDMSGYTIYDTSTDRLLWREA KLDHCRRVSLRVLSERLLHKSIQNSLLGHSSVEDARATMELYQISQRIRARRGLPRLAVS D Click to Show/Hide
|
|||||
| Family | EPCAM family |
|||||
| Function |
Interferon-induced antiviral exoribonuclease that acts on single-stranded RNA and also has minor activity towards single-stranded DNA. Exhibits antiviral activity against RNA viruses including hepatitis C virus (HCV), hepatitis A virus (HAV) and yellow fever virus (YFV) in an exonuclease-dependent manner. May also play additional roles in the maturation of snRNAs and rRNAs, and in ribosome biogenesis.
Click to Show/Hide
|
|||||
| Uniprot Entry | ||||||
| HGNC ID | ||||||
| KEGG ID | ||||||
Each Antibody-drug Conjuate AND It's Component Related to This Antigen
Full List of The ADC Related to This Antigen
Anti-CD25 mAb D265A
| ADC Info | ADC Name | Payload | Target | Linker | Ref |
|---|---|---|---|---|---|
Anti-CD25 ADC 10-1 |
Anti-CD25 ADC 10-1 payload |
Undisclosed |
Anti-CD25 ADC 10-1 linker |
[1] | |
Anti-CD25 ADC 11-5 |
Anti-CD25 ADC 11-5 payload |
Undisclosed |
Anti-CD25 ADC 11-5 linker |
[1] | |
Anti-CD25 ADC 12-1 |
Anti-CD25 ADC 12-1 payload |
Undisclosed |
Anti-CD25 ADC 12-1 linker |
[1] | |
Anti-CD25 ADC 12-3 |
Anti-CD25 ADC 12-3 payload |
Undisclosed |
Anti-CD25 ADC 12-3 linker |
[1] | |
Anti-CD25 ADC 13-7 |
Anti-CD25 ADC 13-7 payload |
Undisclosed |
Anti-CD25 ADC 13-7 linker |
[1] | |
Anti-CD25 ADC 14-5 |
Anti-CD25 ADC 14-5 payload |
Undisclosed |
Anti-CD25 ADC 14-5 linker |
[1] | |
Anti-CD25 ADC 15-5 |
Anti-CD25 ADC 15-5 payload |
Undisclosed |
Anti-CD25 ADC 15-5 linker |
[1] | |
Anti-CD25 ADC 16-5 |
Anti-CD25 ADC 16-5 payload |
Undisclosed |
Anti-CD25 ADC 16-5 linker |
[1] | |
Anti-CD25 ADC 17-2 |
Anti-CD25 ADC 17-2 payload |
Undisclosed |
Anti-CD25 ADC 17-2 linker |
[1] | |
Anti-CD25 ADC 18-3 |
Anti-CD25 ADC 18-3 payload |
Undisclosed |
Anti-CD25 ADC 18-3 linker |
[1] | |
Anti-CD25 ADC 19-5 |
Anti-CD25 ADC 19-5 payload |
Undisclosed |
Anti-CD25 ADC 19-5 linker |
[1] | |
Anti-CD25 ADC 20-5 |
Anti-CD25 ADC 20-5 payload |
Undisclosed |
Anti-CD25 ADC 20-5 linker |
[1] | |
Anti-CD25 ADC 21-5 |
Anti-CD25 ADC 21-5 payload |
Undisclosed |
Anti-CD25 ADC 21-5 linker |
[1] | |
Anti-CD25 ADC 2-7 |
Anti-CD25 ADC 2-7 payload |
Undisclosed |
Anti-CD25 ADC 2-7 linker |
[1] | |
Anti-CD25 ADC 3-4 |
Anti-CD25 ADC 3-4 payload |
Undisclosed |
Anti-CD25 ADC 3-4 linker |
[1] | |
Anti-CD25 ADC 4-3 |
Anti-CD25 ADC 4-3 payload |
Undisclosed |
Anti-CD25 ADC 4-3 linker |
[1] | |
Anti-CD25 ADC 5-3 |
Anti-CD25 ADC 5-3 payload |
Undisclosed |
Anti-CD25 ADC 5-3 linker |
[1] | |
Anti-CD25 ADC 6-2 |
Anti-CD25 ADC 6-2 payload |
Undisclosed |
Anti-CD25 ADC 6-2 linker |
[1] | |
Anti-CD25 ADC 7-1 |
Anti-CD25 ADC 7-1 payload |
Undisclosed |
Anti-CD25 ADC 7-1 linker |
[1] | |
Anti-CD25 ADC 8-5 |
Anti-CD25 ADC 8-5 payload |
Undisclosed |
Anti-CD25 ADC 8-5 linker |
[1] | |
Anti-CD25 ADC 9-4 |
Anti-CD25 ADC 9-4 payload |
Undisclosed |
Anti-CD25 ADC 9-4 linker |
[1] |
Anti-CD25 mAb PC61
| ADC Info | ADC Name | Payload | Target | Linker | Ref |
|---|---|---|---|---|---|
CD25-ADC |
SG3199 |
Human Deoxyribonucleic acid (hDNA) |
Mal-PEG8-Val-Ala-PABC |
[2] |
Basiliximab
| ADC Info | ADC Name | Payload | Target | Linker | Ref |
|---|---|---|---|---|---|
Basiliximab sarotalocan |
Undisclosed |
Undisclosed |
Undisclosed |
[3] |
Undisclosed
| ADC Info | ADC Name | Payload | Target | Linker | Ref |
|---|---|---|---|---|---|
Anti-CD25-IR700 conjugate (Rakuten Medical) |
IRDye 700DX |
Undisclosed |
Undisclosed |
[4] |
Tissue/Disease specific Abundances of This Antigen
Tissue specific Abundances of This Antigen
ICD Disease Classification 01
| Differential expression pattern of antigen in diseases | ||
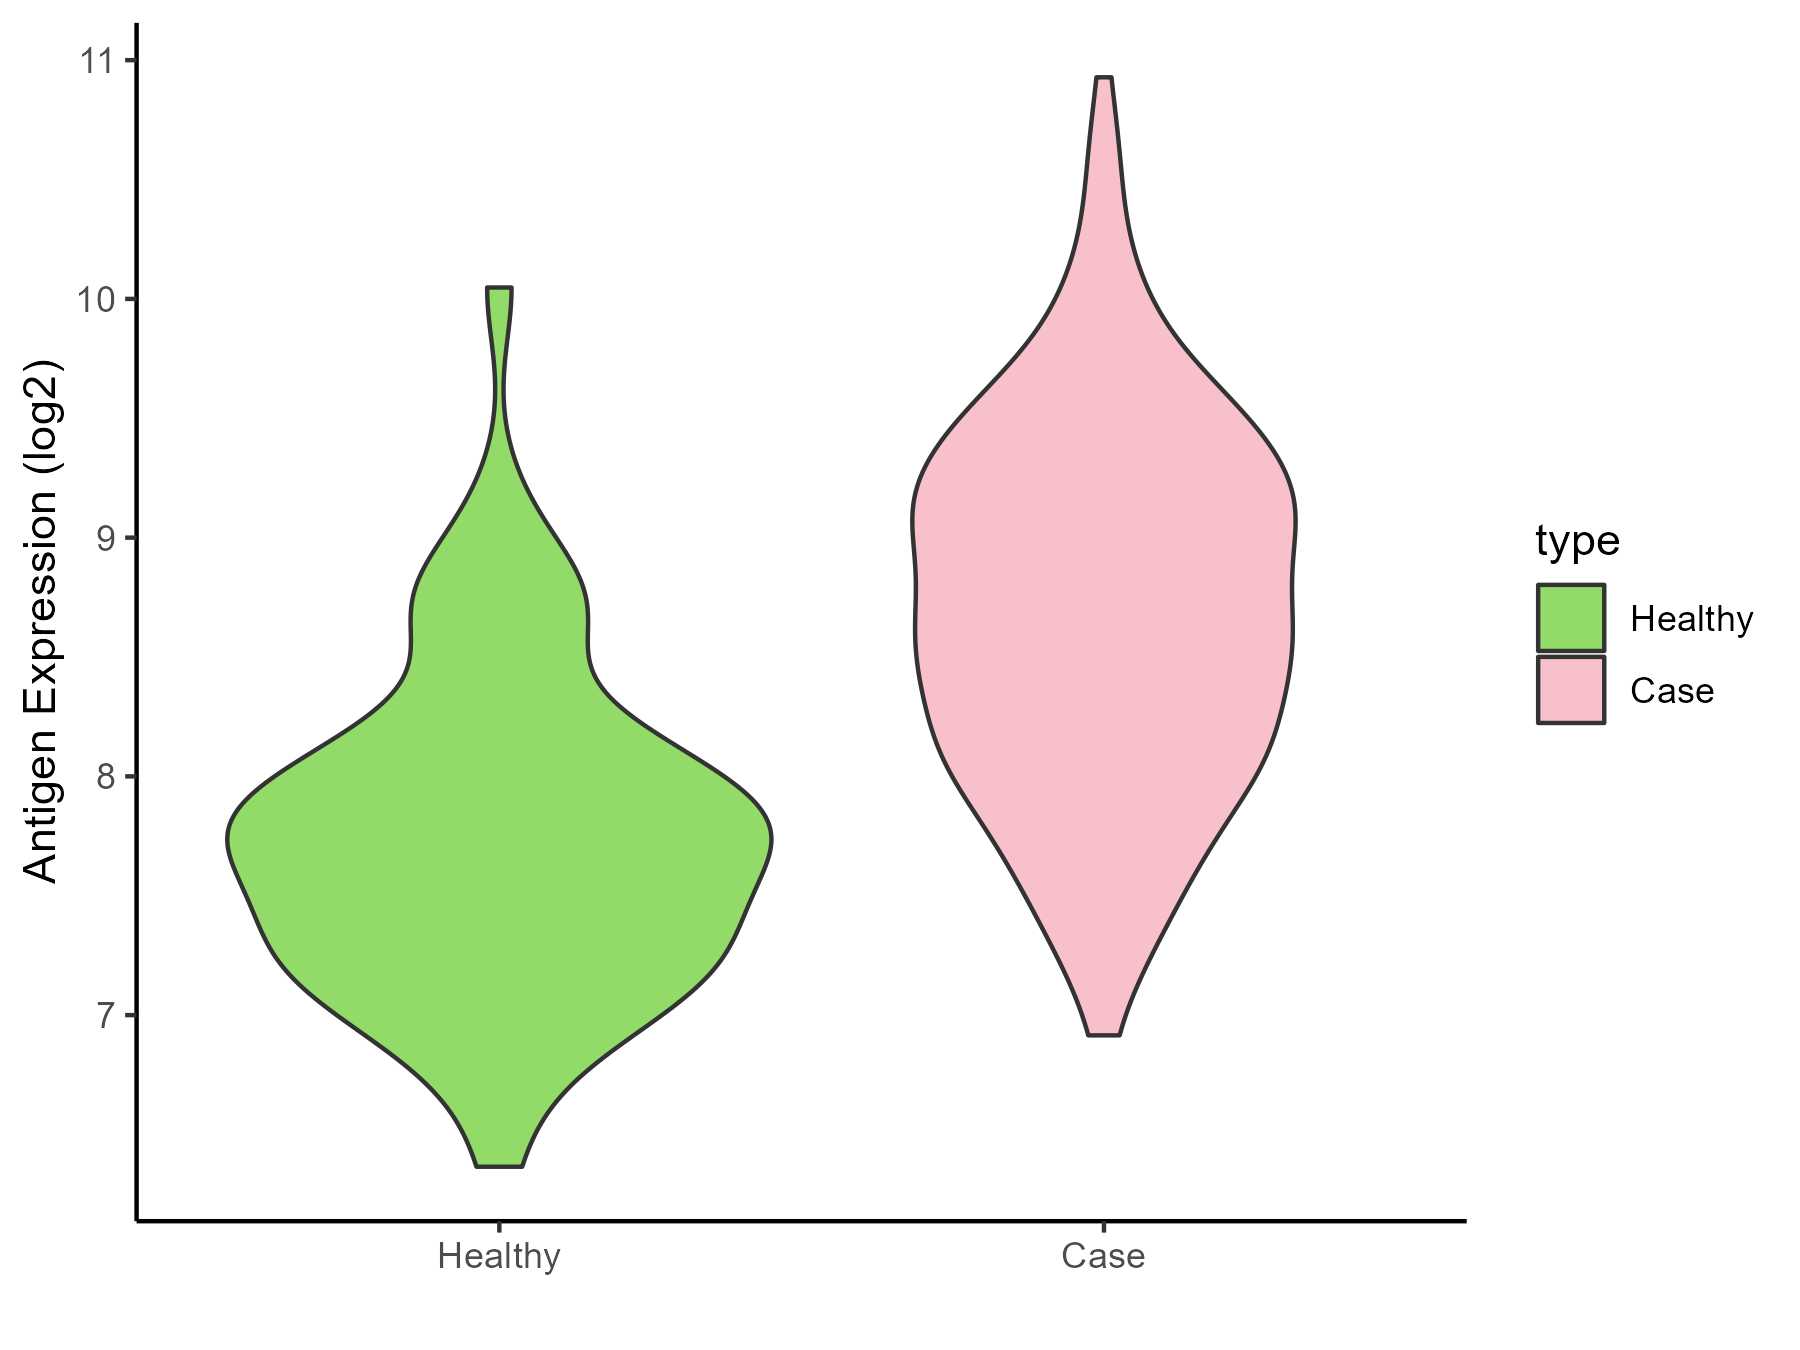
| The Studied Tissue | Gingival | |
| The Specific Disease | Bacterial infection of gingival | |
| The Expression Level of Disease Section Compare with the Healthy Individual Tissue | p-value: 9.95E-16; Fold-change: 0.958507589; Z-score: 1.428750733 | |
| Disease-specific Antigen Abundances |
|
Click to View the Clearer Original Diagram |
ICD Disease Classification 02
| Differential expression pattern of antigen in diseases | ||
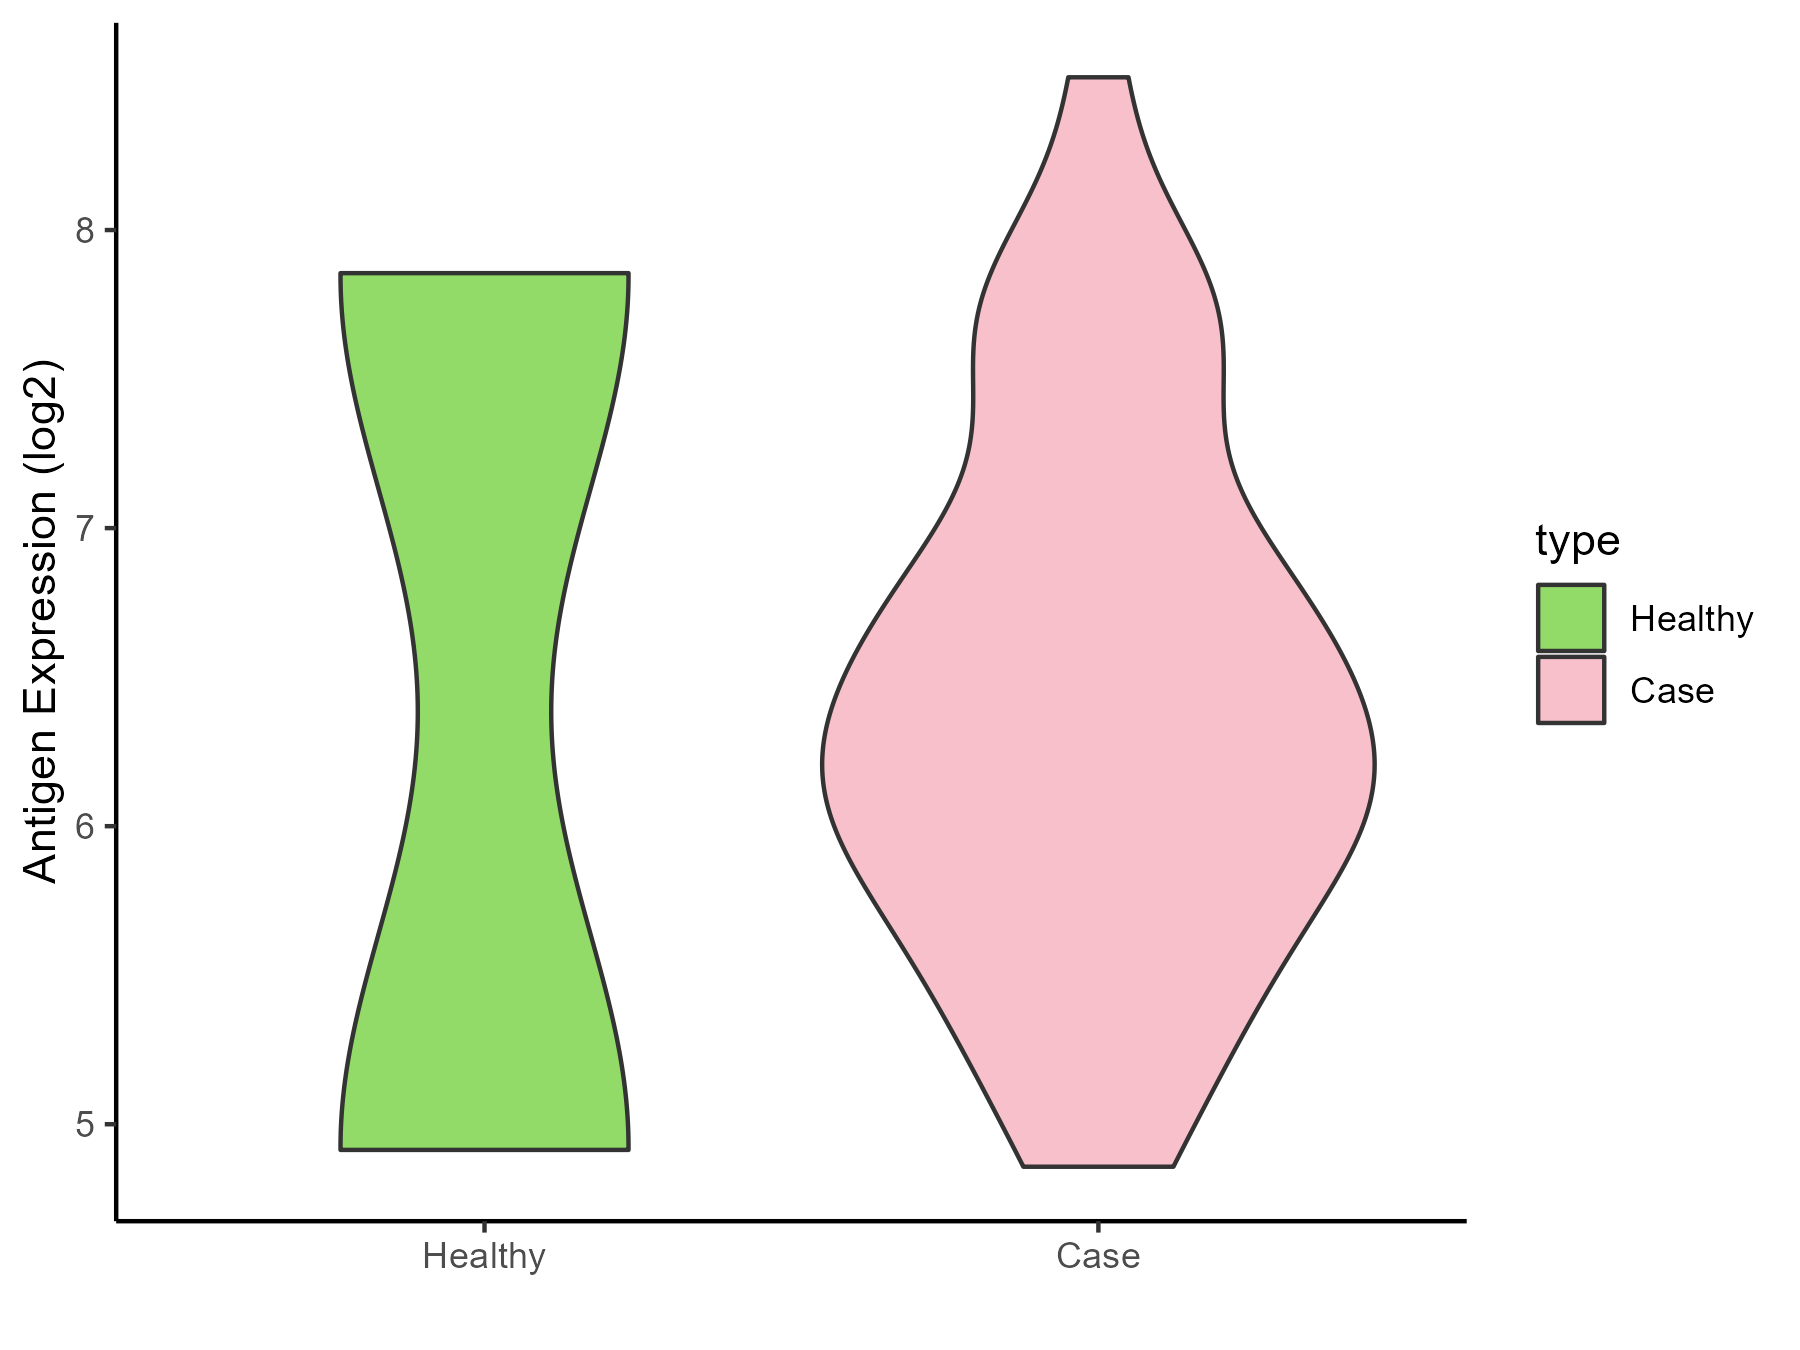
| The Studied Tissue | Brainstem | |
| The Specific Disease | Glioma | |
| The Expression Level of Disease Section Compare with the Healthy Individual Tissue | p-value: 0.98357753; Fold-change: -0.04630644; Z-score: -0.022263066 | |
| Disease-specific Antigen Abundances |
|
Click to View the Clearer Original Diagram |
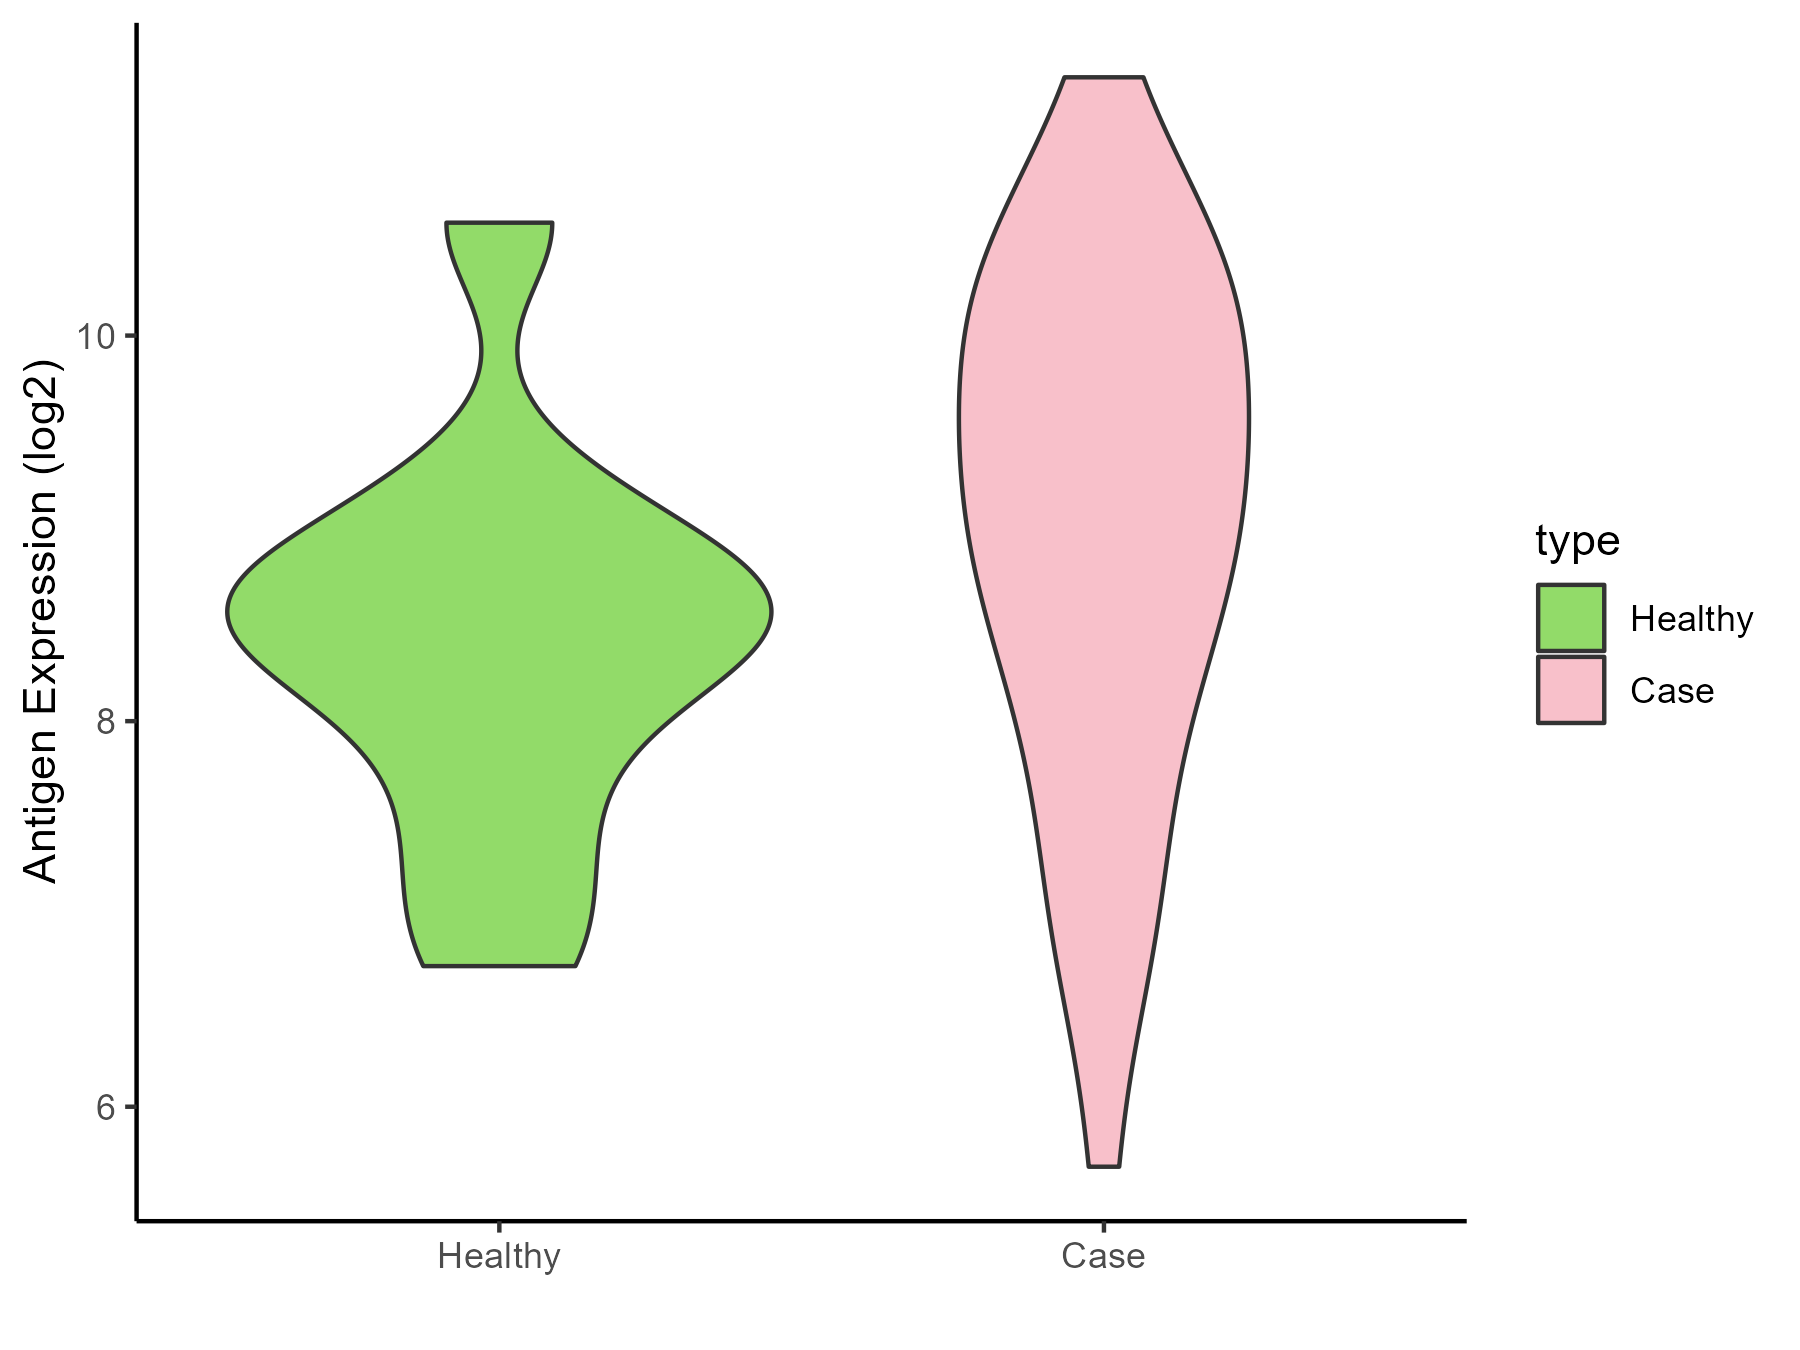
| The Studied Tissue | White matter | |
| The Specific Disease | Glioma | |
| The Expression Level of Disease Section Compare with the Healthy Individual Tissue | p-value: 0.11951453; Fold-change: 0.787062243; Z-score: 0.765857204 | |
| Disease-specific Antigen Abundances |
|
Click to View the Clearer Original Diagram |
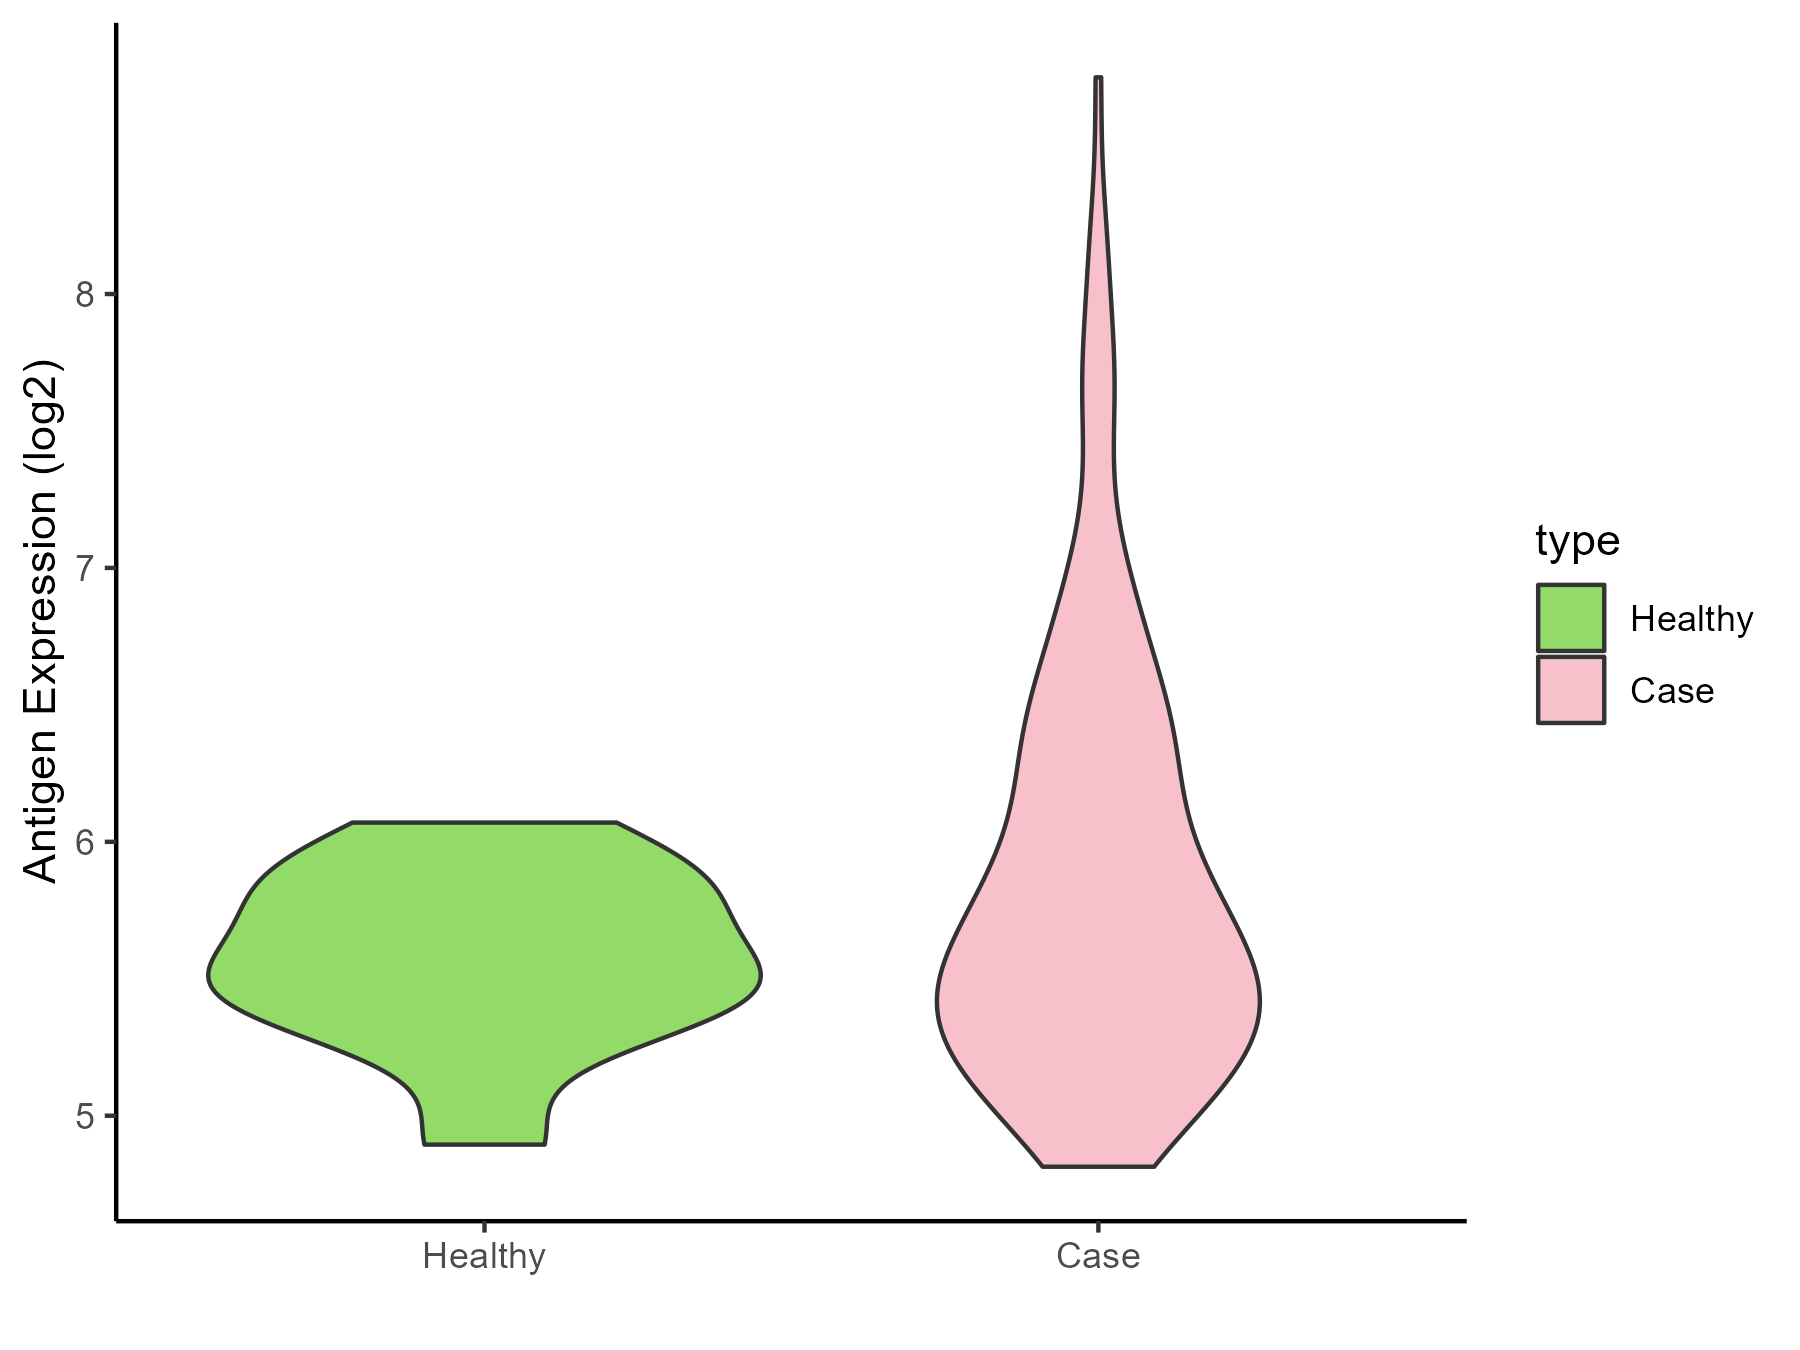
| The Studied Tissue | Brainstem | |
| The Specific Disease | Neuroectodermal tumor | |
| The Expression Level of Disease Section Compare with the Healthy Individual Tissue | p-value: 0.029934506; Fold-change: 0.119592913; Z-score: 0.354417704 | |
| Disease-specific Antigen Abundances |
|
Click to View the Clearer Original Diagram |
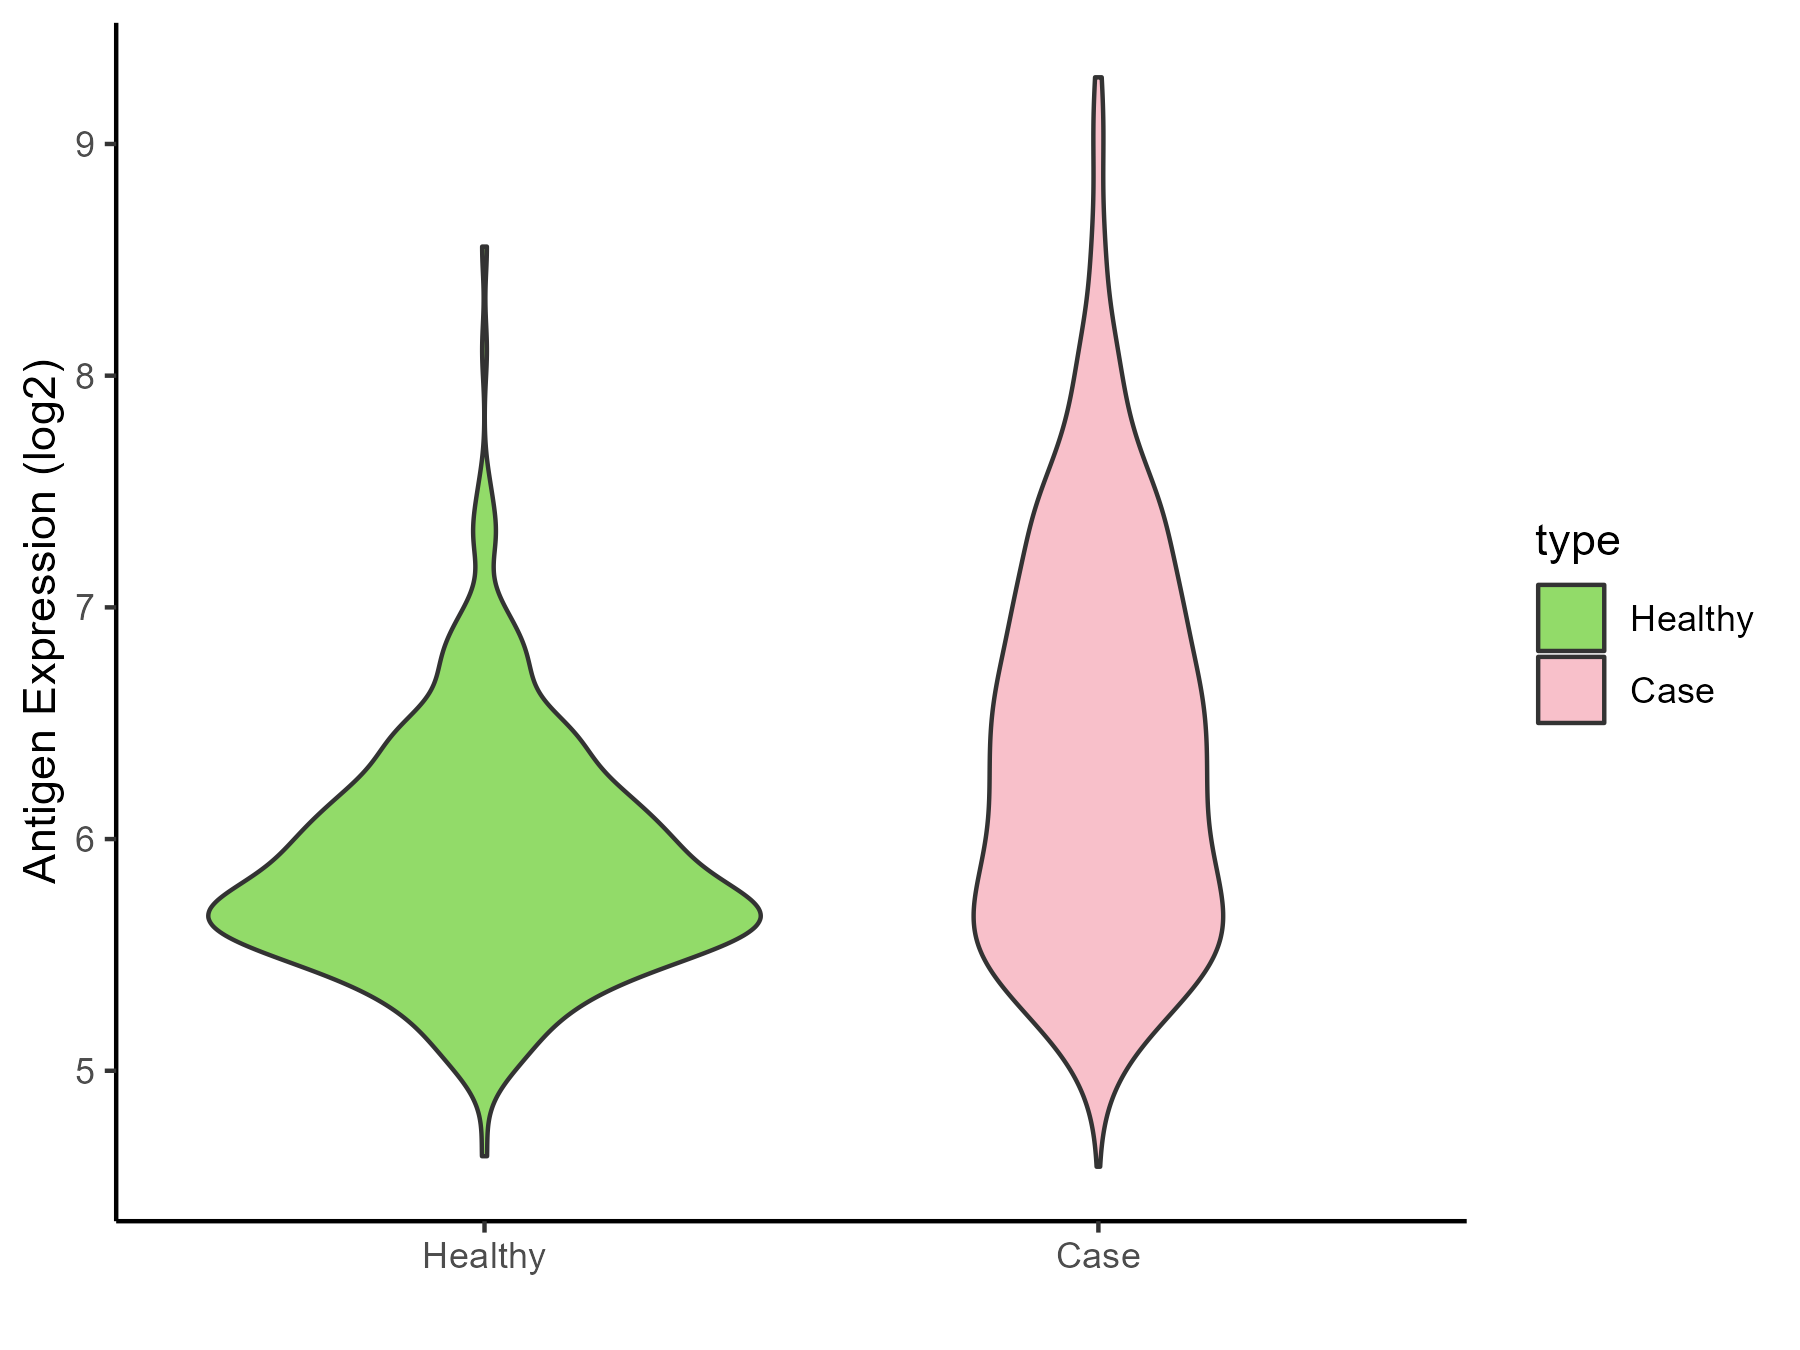
| The Studied Tissue | Nervous | |
| The Specific Disease | Brain cancer | |
| The Expression Level of Disease Section Compare with the Healthy Individual Tissue | p-value: 9.05E-42; Fold-change: 0.509430196; Z-score: 1.020627748 | |
| Disease-specific Antigen Abundances |
|
Click to View the Clearer Original Diagram |
| Differential expression pattern of antigen in diseases | ||
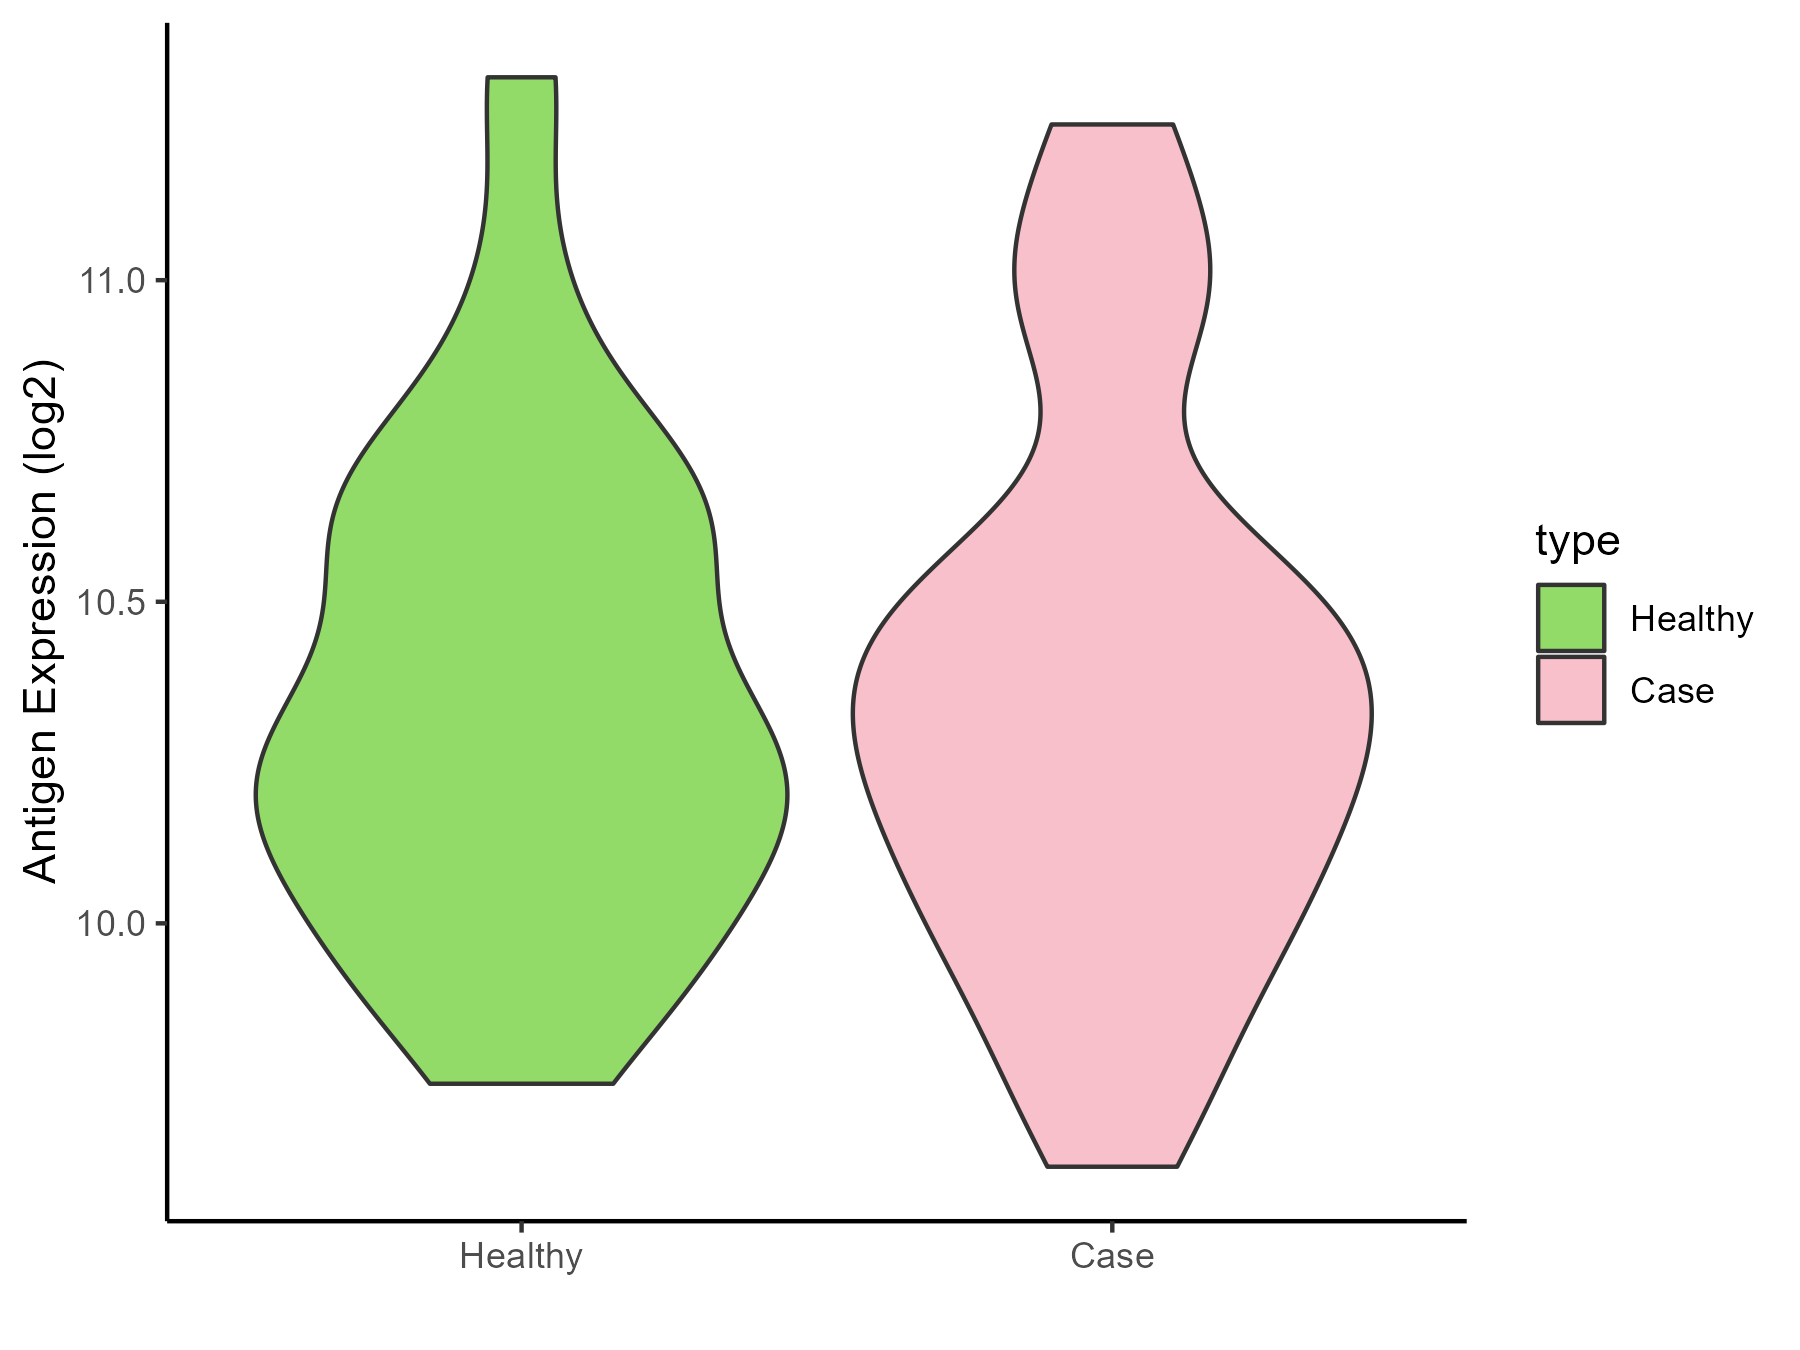
| The Studied Tissue | Whole blood | |
| The Specific Disease | Polycythemia vera | |
| The Expression Level of Disease Section Compare with the Healthy Individual Tissue | p-value: 0.999344276; Fold-change: 0.009509697; Z-score: 0.02498159 | |
| Disease-specific Antigen Abundances |
|
Click to View the Clearer Original Diagram |
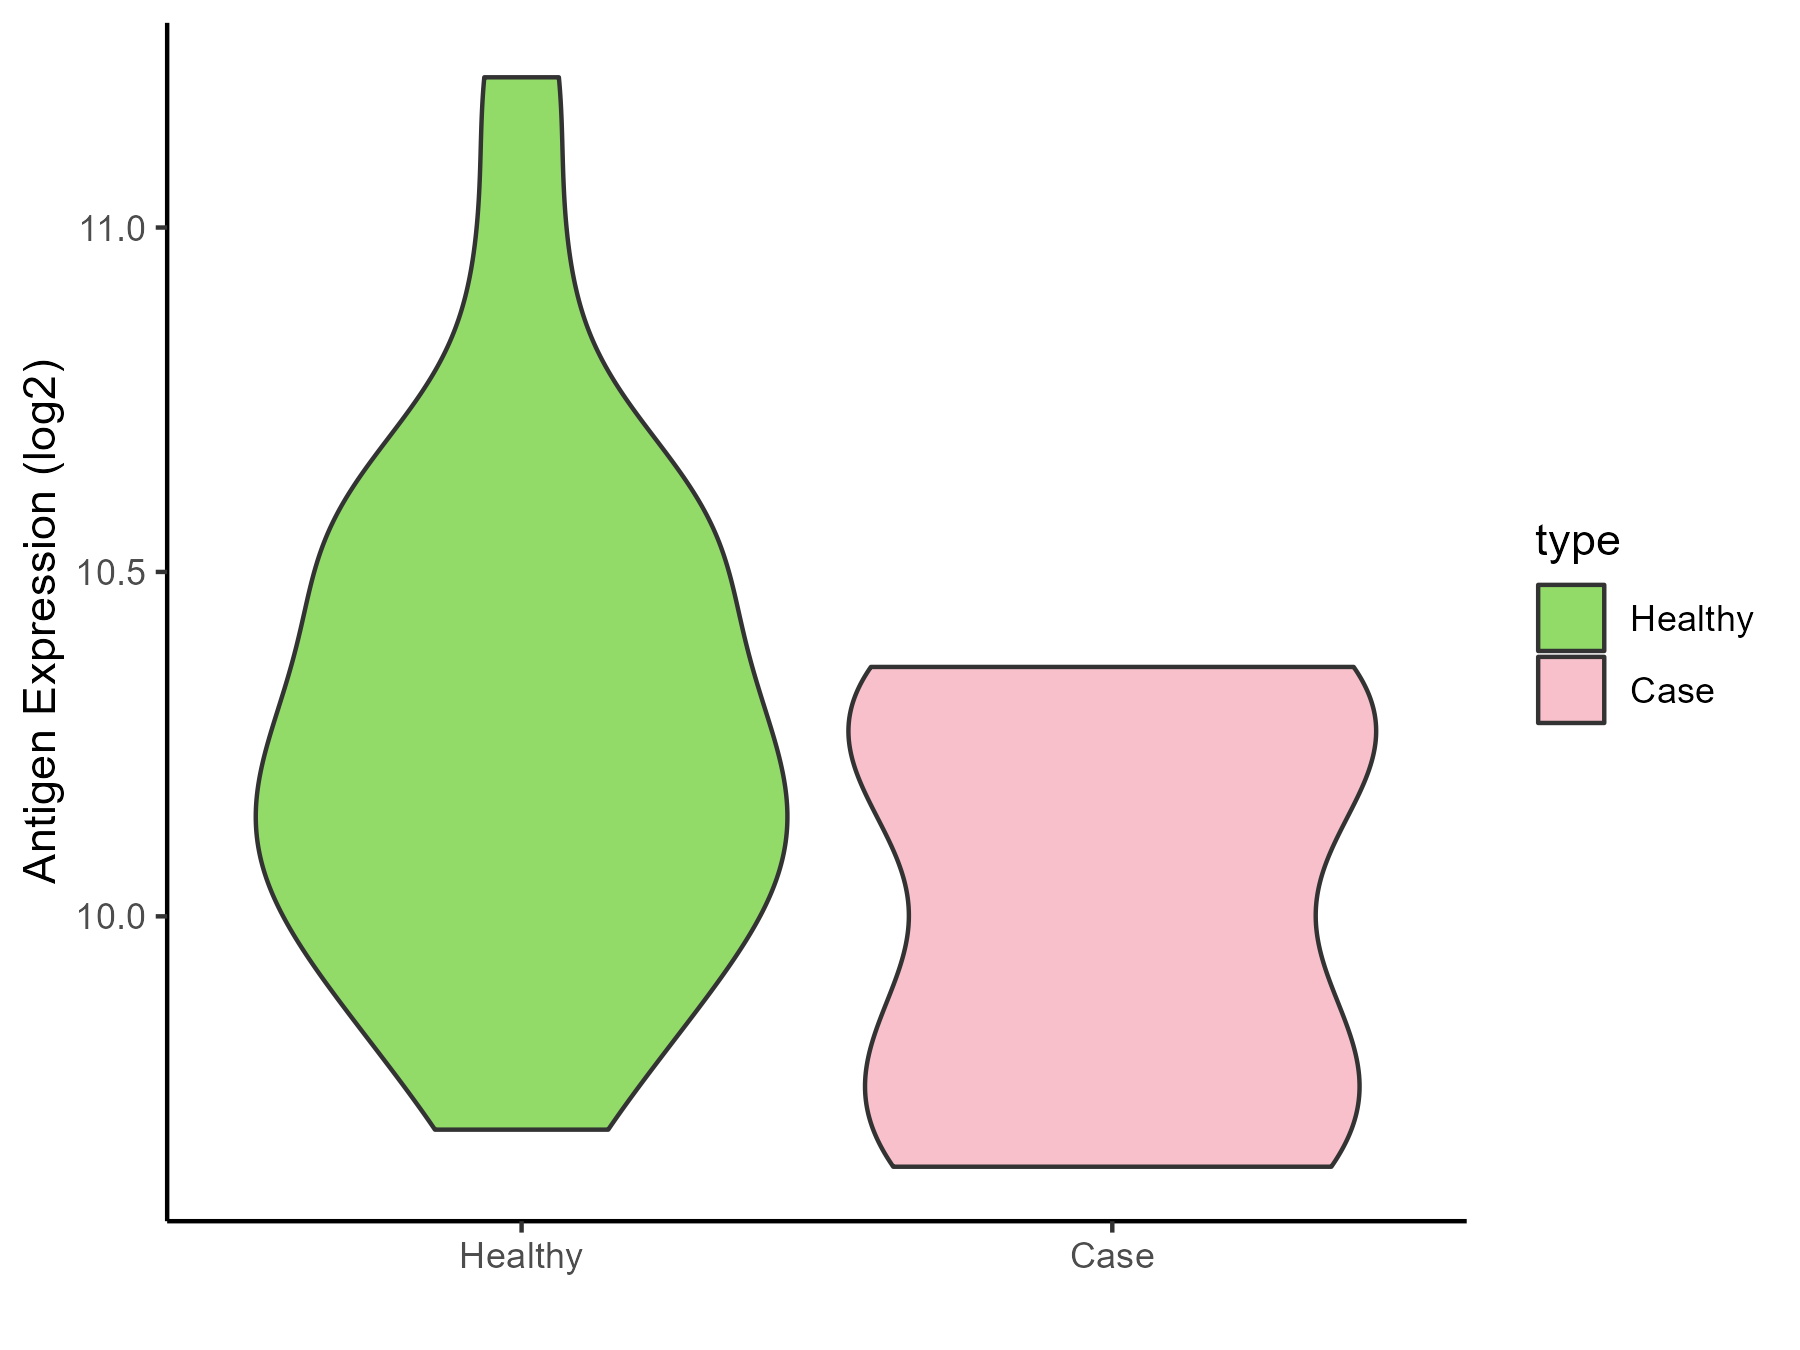
| The Studied Tissue | Whole blood | |
| The Specific Disease | Myelofibrosis | |
| The Expression Level of Disease Section Compare with the Healthy Individual Tissue | p-value: 0.041406516; Fold-change: -0.231093161; Z-score: -0.622106096 | |
| Disease-specific Antigen Abundances |
|
Click to View the Clearer Original Diagram |
| Differential expression pattern of antigen in diseases | ||
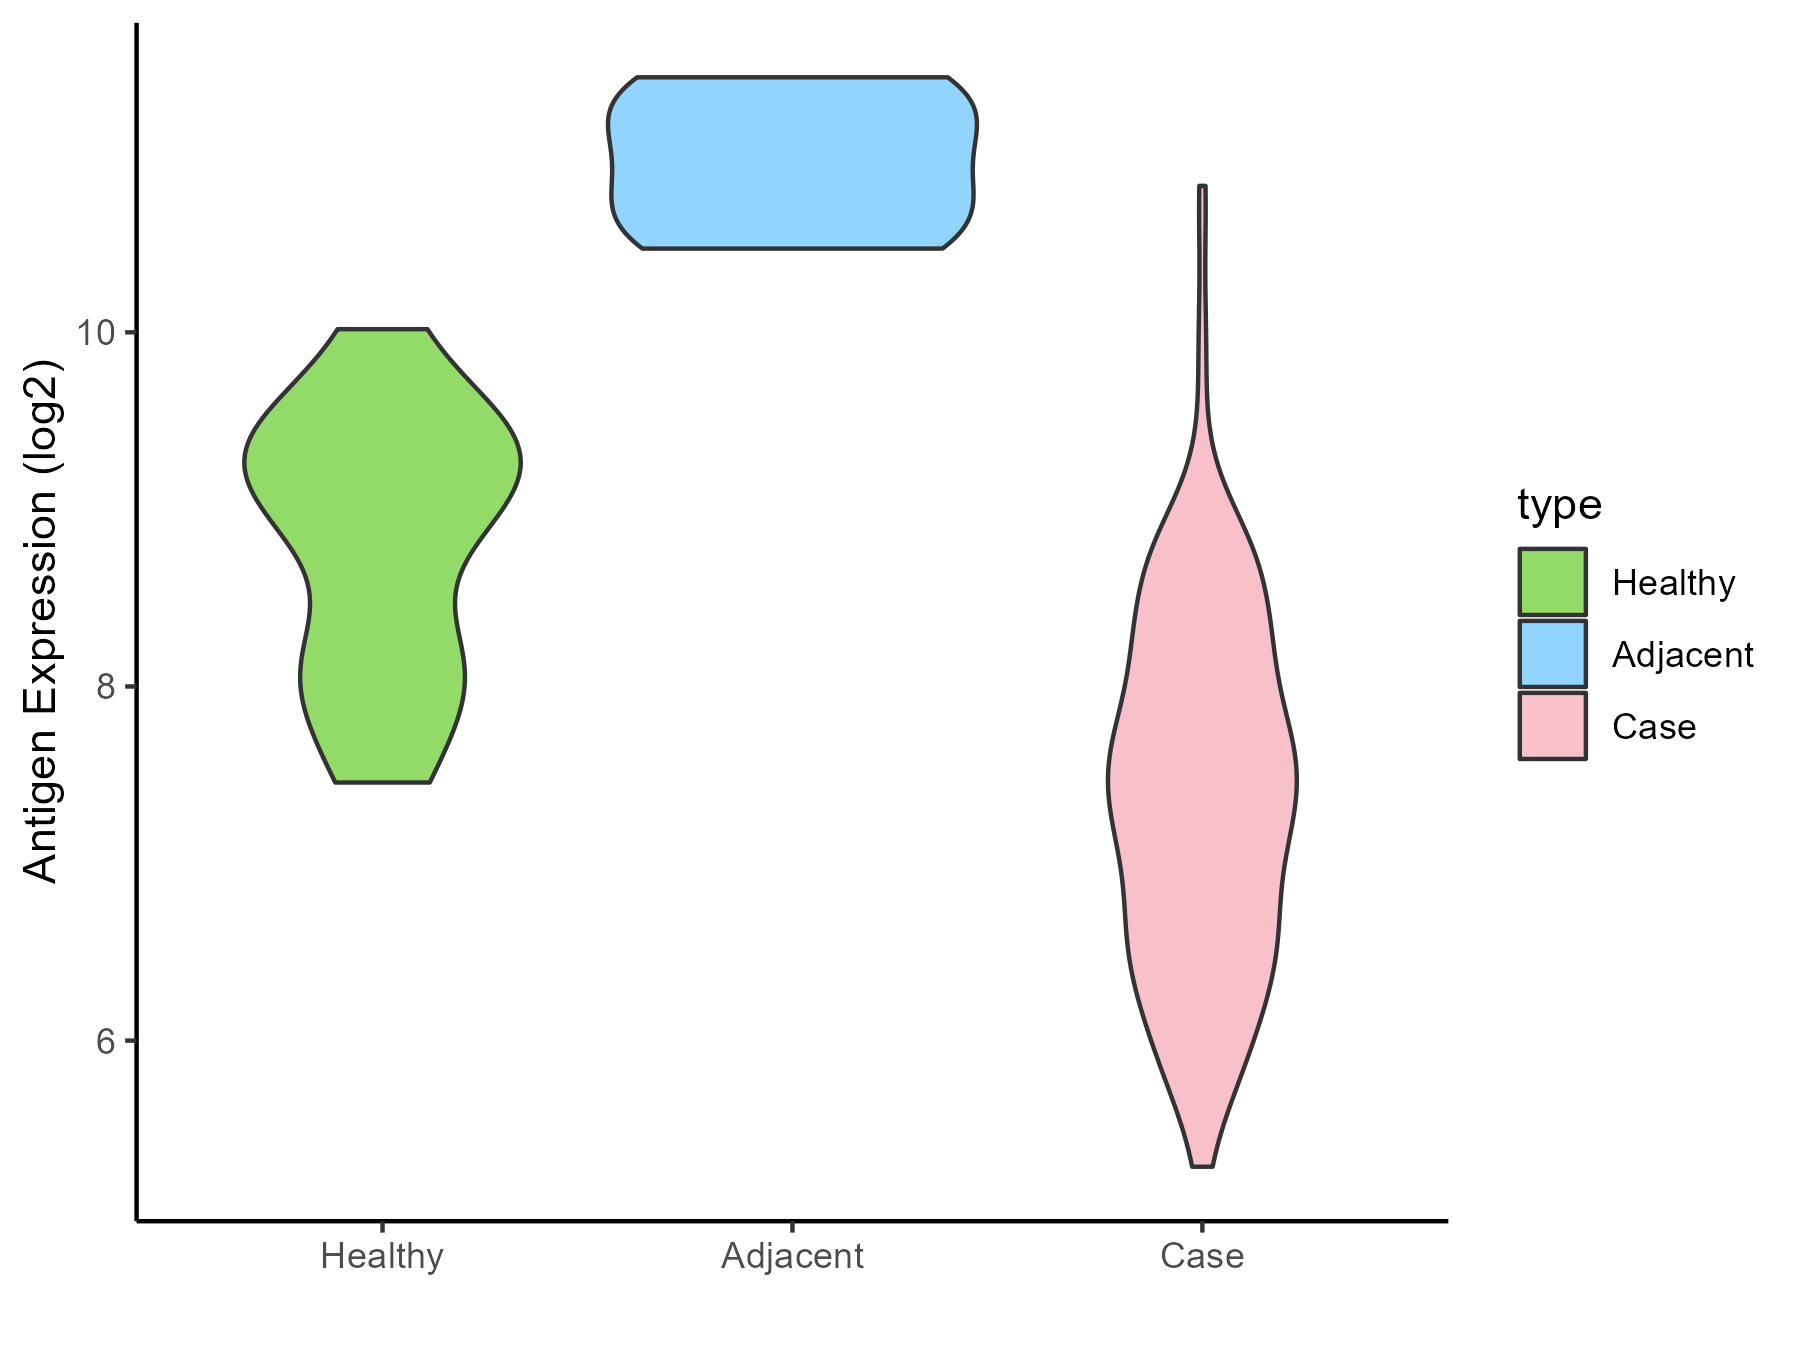
| The Studied Tissue | Bone marrow | |
| The Specific Disease | Myelodysplastic syndromes | |
| The Expression Level of Disease Section Compare with the Healthy Individual Tissue | p-value: 6.21E-11; Fold-change: -1.569970593; Z-score: -2.078486482 | |
| The Expression Level of Disease Section Compare with the Adjacent Tissue | p-value: 0.000232175; Fold-change: -3.563381302; Z-score: -8.274023408 | |
| Disease-specific Antigen Abundances |
|
Click to View the Clearer Original Diagram |
| Differential expression pattern of antigen in diseases | ||
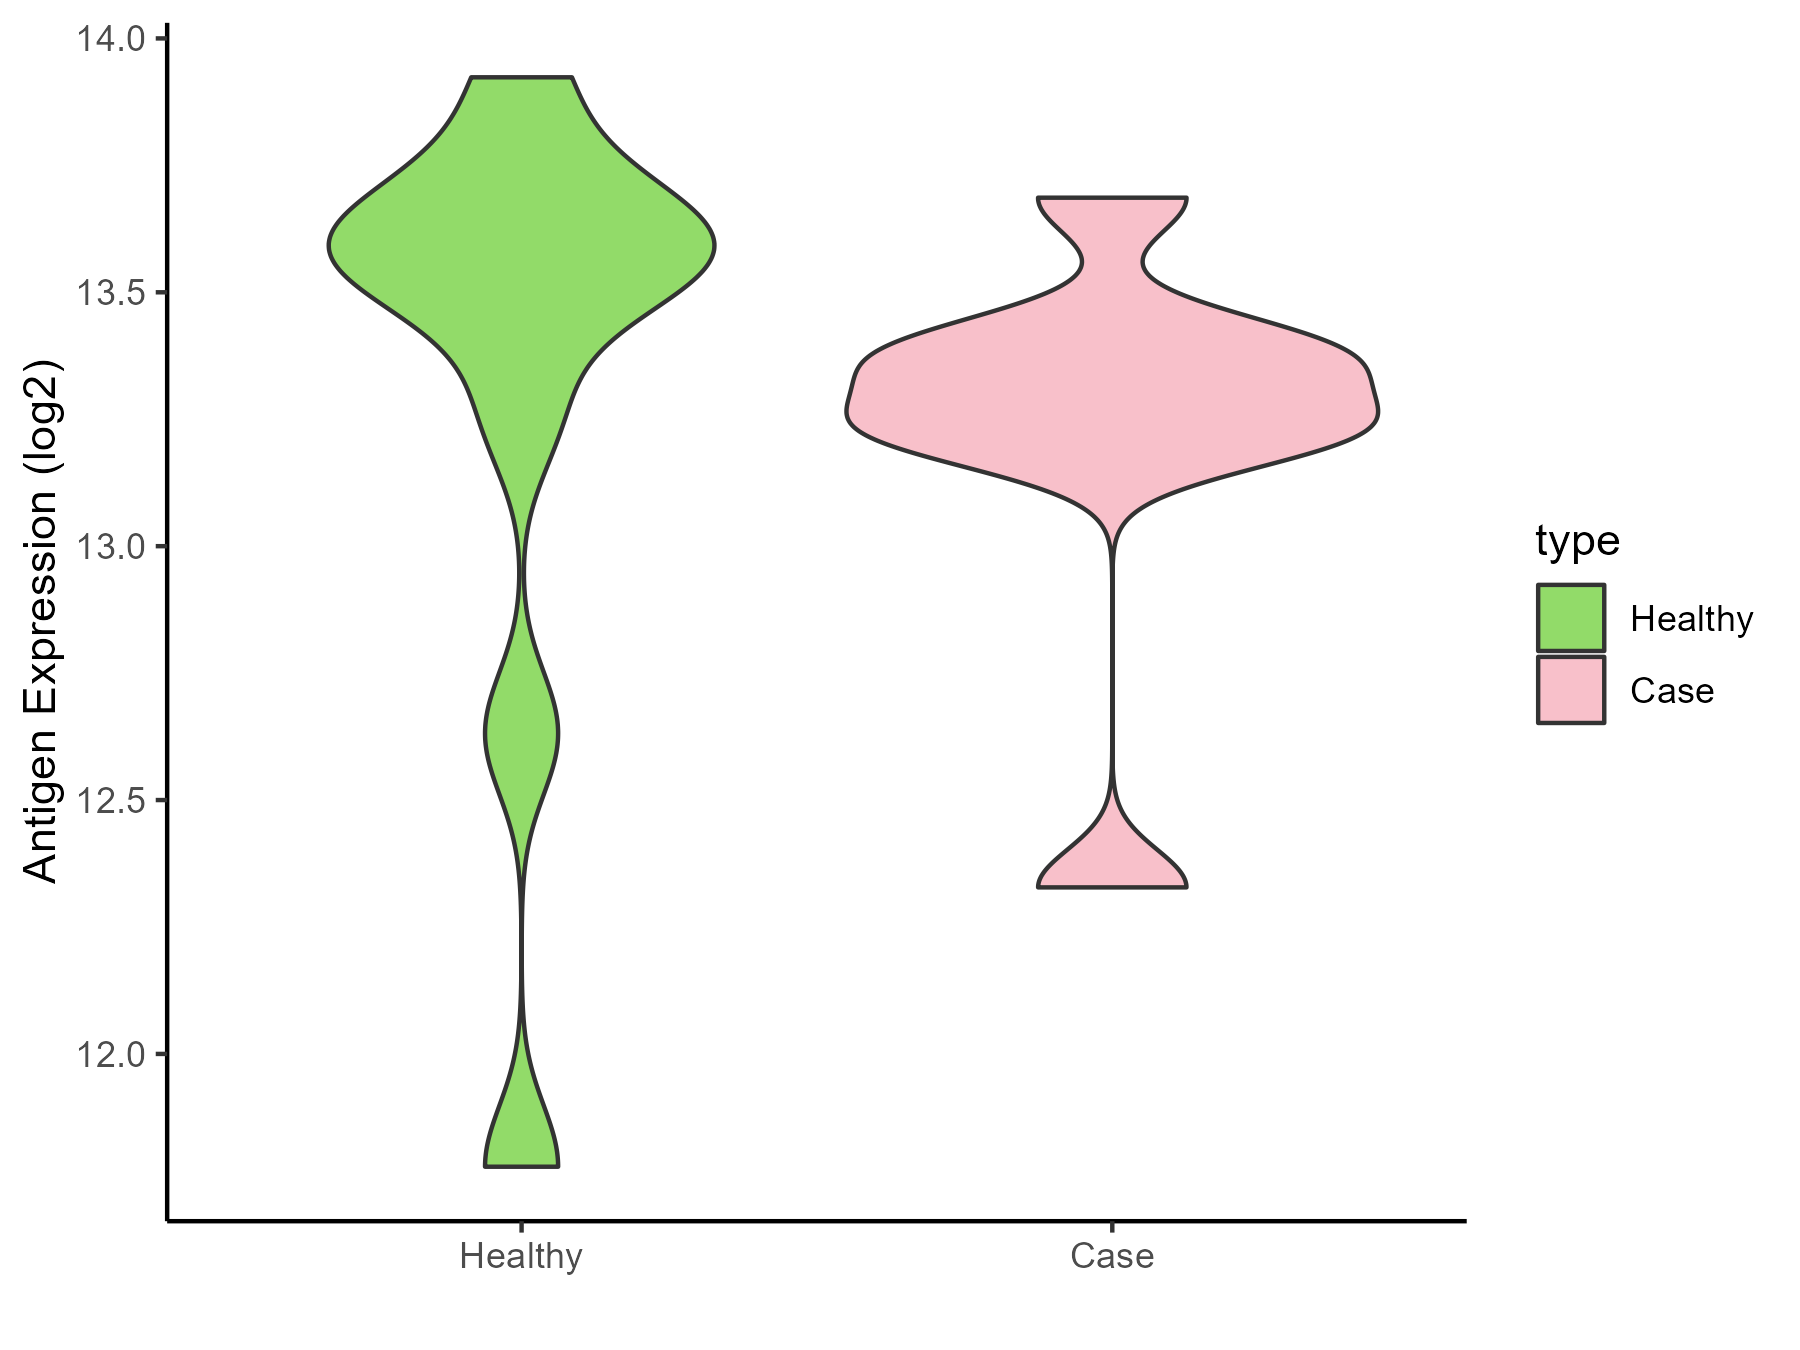
| The Studied Tissue | Tonsil | |
| The Specific Disease | Lymphoma | |
| The Expression Level of Disease Section Compare with the Healthy Individual Tissue | p-value: 0.715376153; Fold-change: -0.290450724; Z-score: -0.45194012 | |
| Disease-specific Antigen Abundances |
|
Click to View the Clearer Original Diagram |
| Differential expression pattern of antigen in diseases | ||
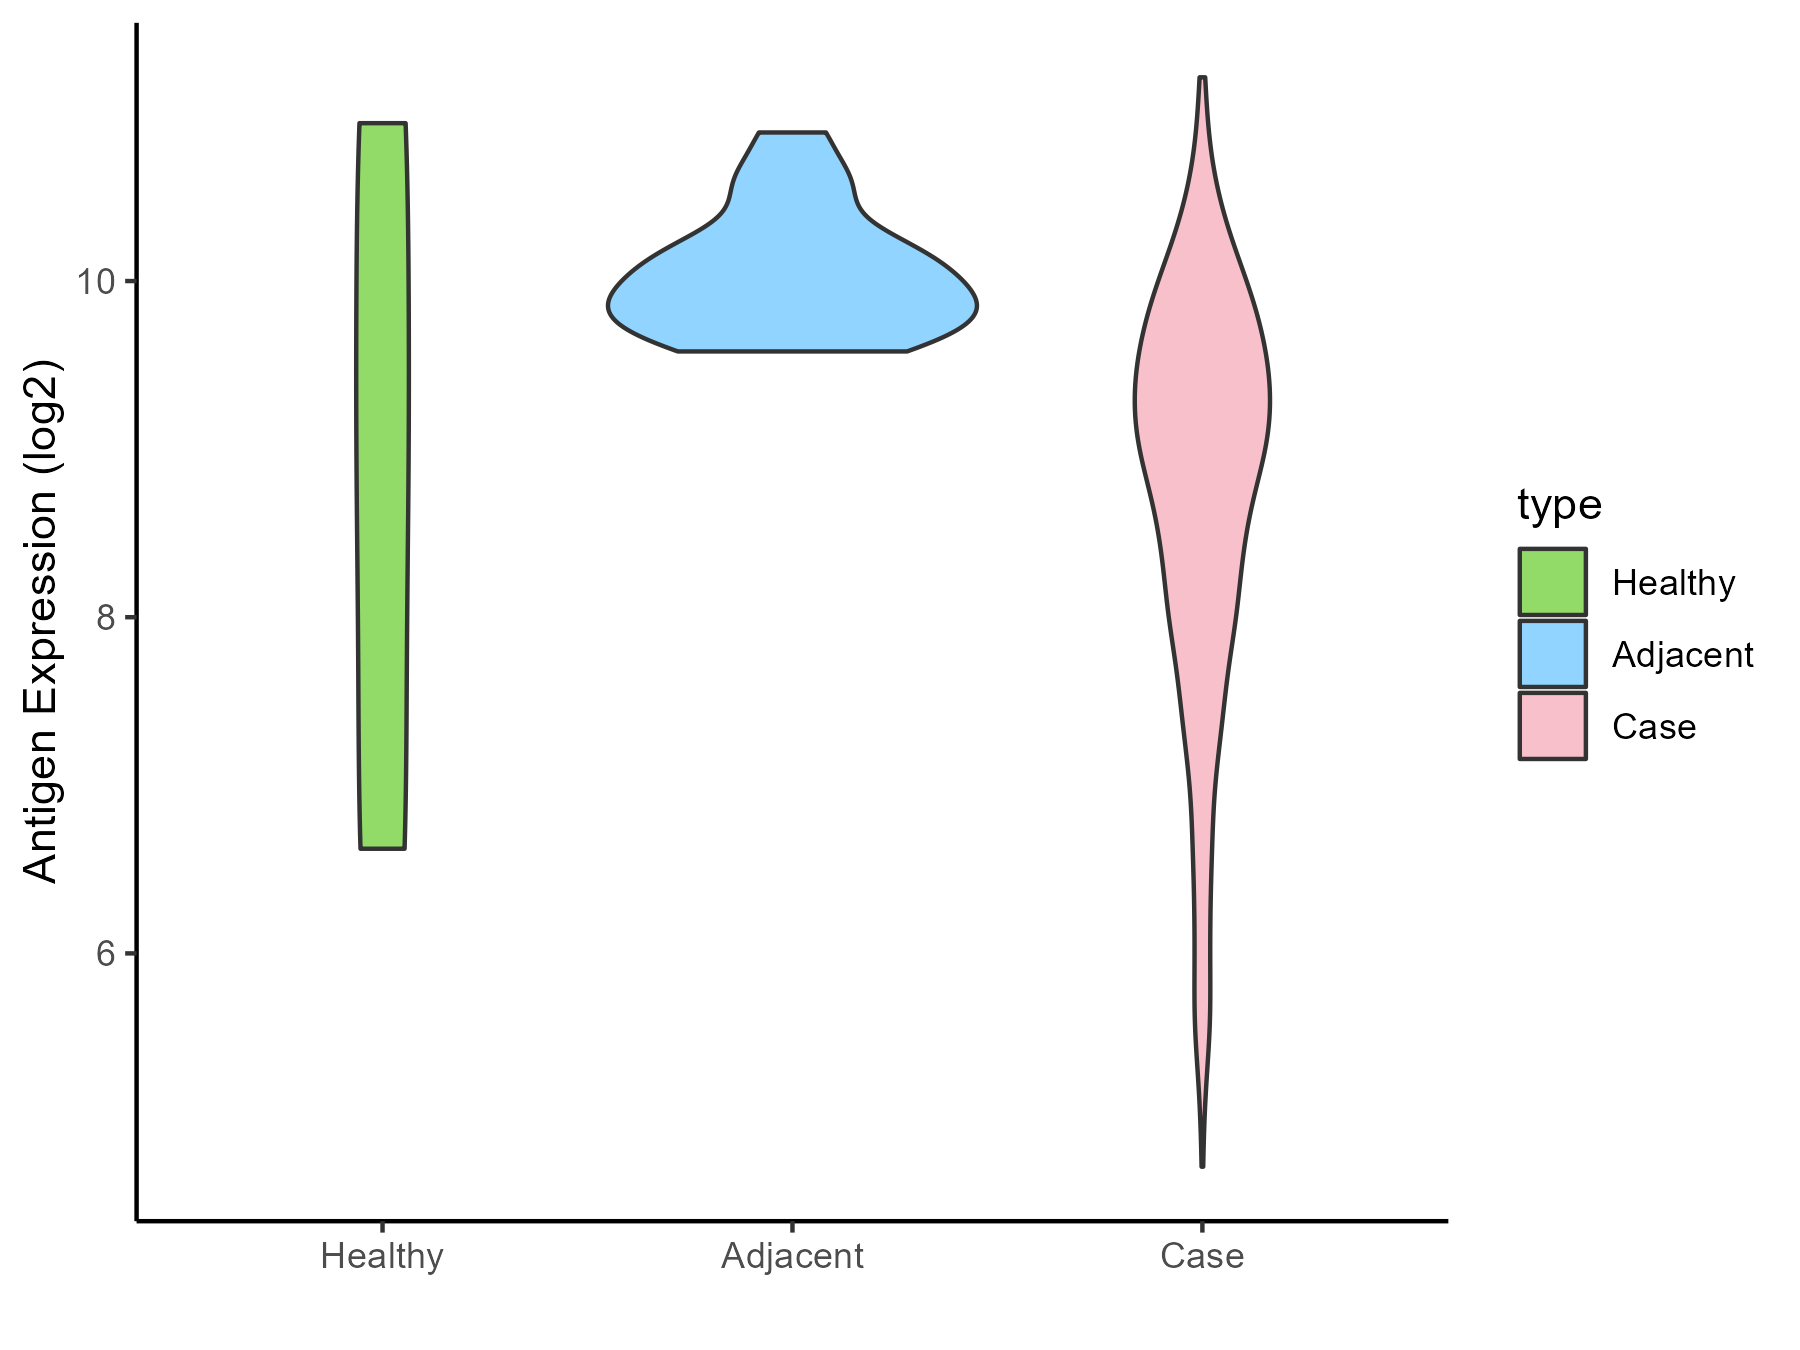
| The Studied Tissue | Gastric | |
| The Specific Disease | Gastric cancer | |
| The Expression Level of Disease Section Compare with the Healthy Individual Tissue | p-value: 0.971229859; Fold-change: 0.123051761; Z-score: 0.056992886 | |
| The Expression Level of Disease Section Compare with the Adjacent Tissue | p-value: 4.47E-12; Fold-change: -0.944955436; Z-score: -2.532905803 | |
| Disease-specific Antigen Abundances |
|
Click to View the Clearer Original Diagram |
| Differential expression pattern of antigen in diseases | ||
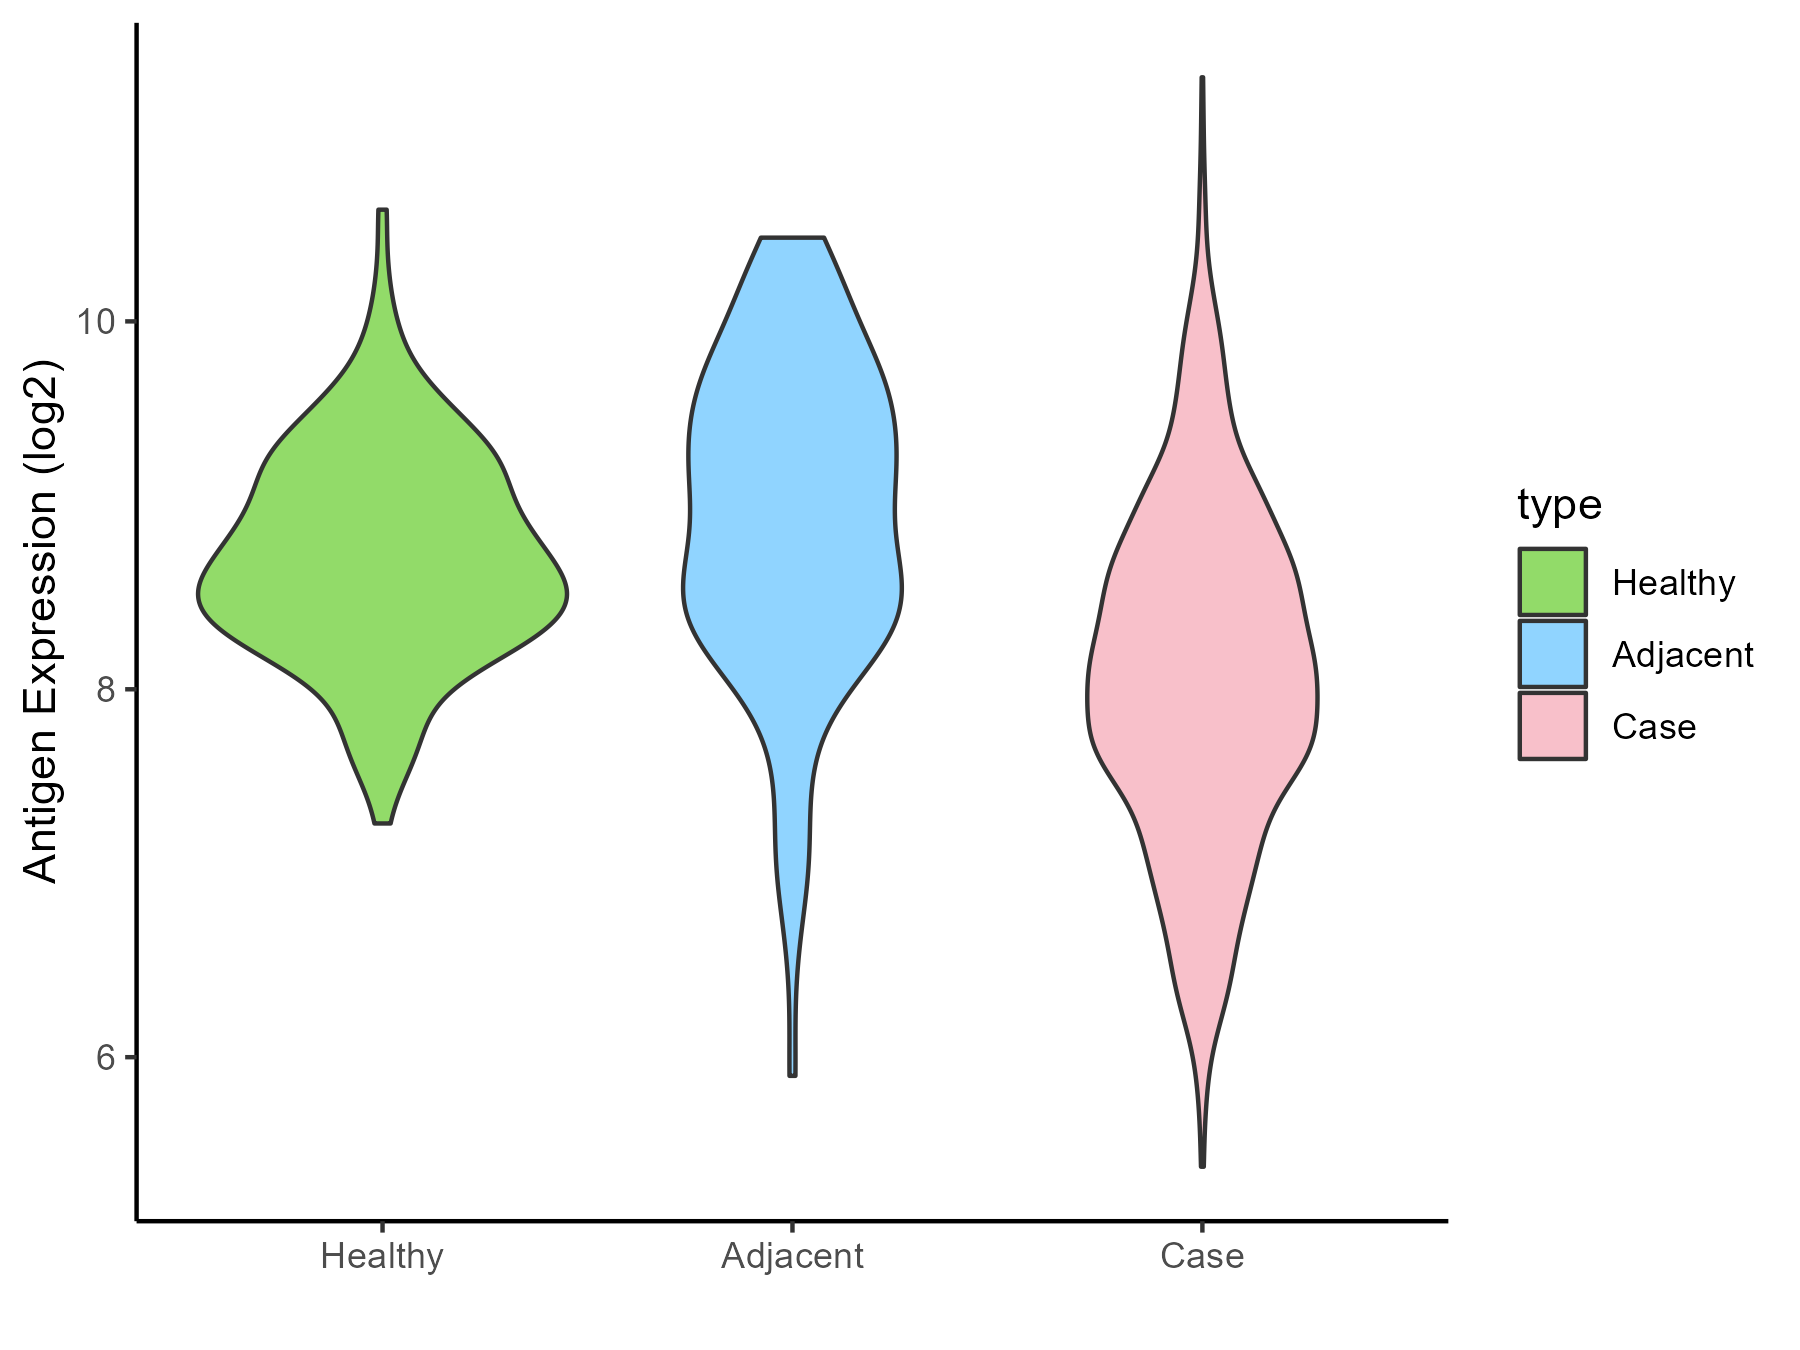
| The Studied Tissue | Colon | |
| The Specific Disease | Colon cancer | |
| The Expression Level of Disease Section Compare with the Healthy Individual Tissue | p-value: 9.56E-28; Fold-change: -0.620327076; Z-score: -1.090429222 | |
| The Expression Level of Disease Section Compare with the Adjacent Tissue | p-value: 2.79E-19; Fold-change: -0.93505537; Z-score: -1.074335285 | |
| Disease-specific Antigen Abundances |
|
Click to View the Clearer Original Diagram |
| Differential expression pattern of antigen in diseases | ||
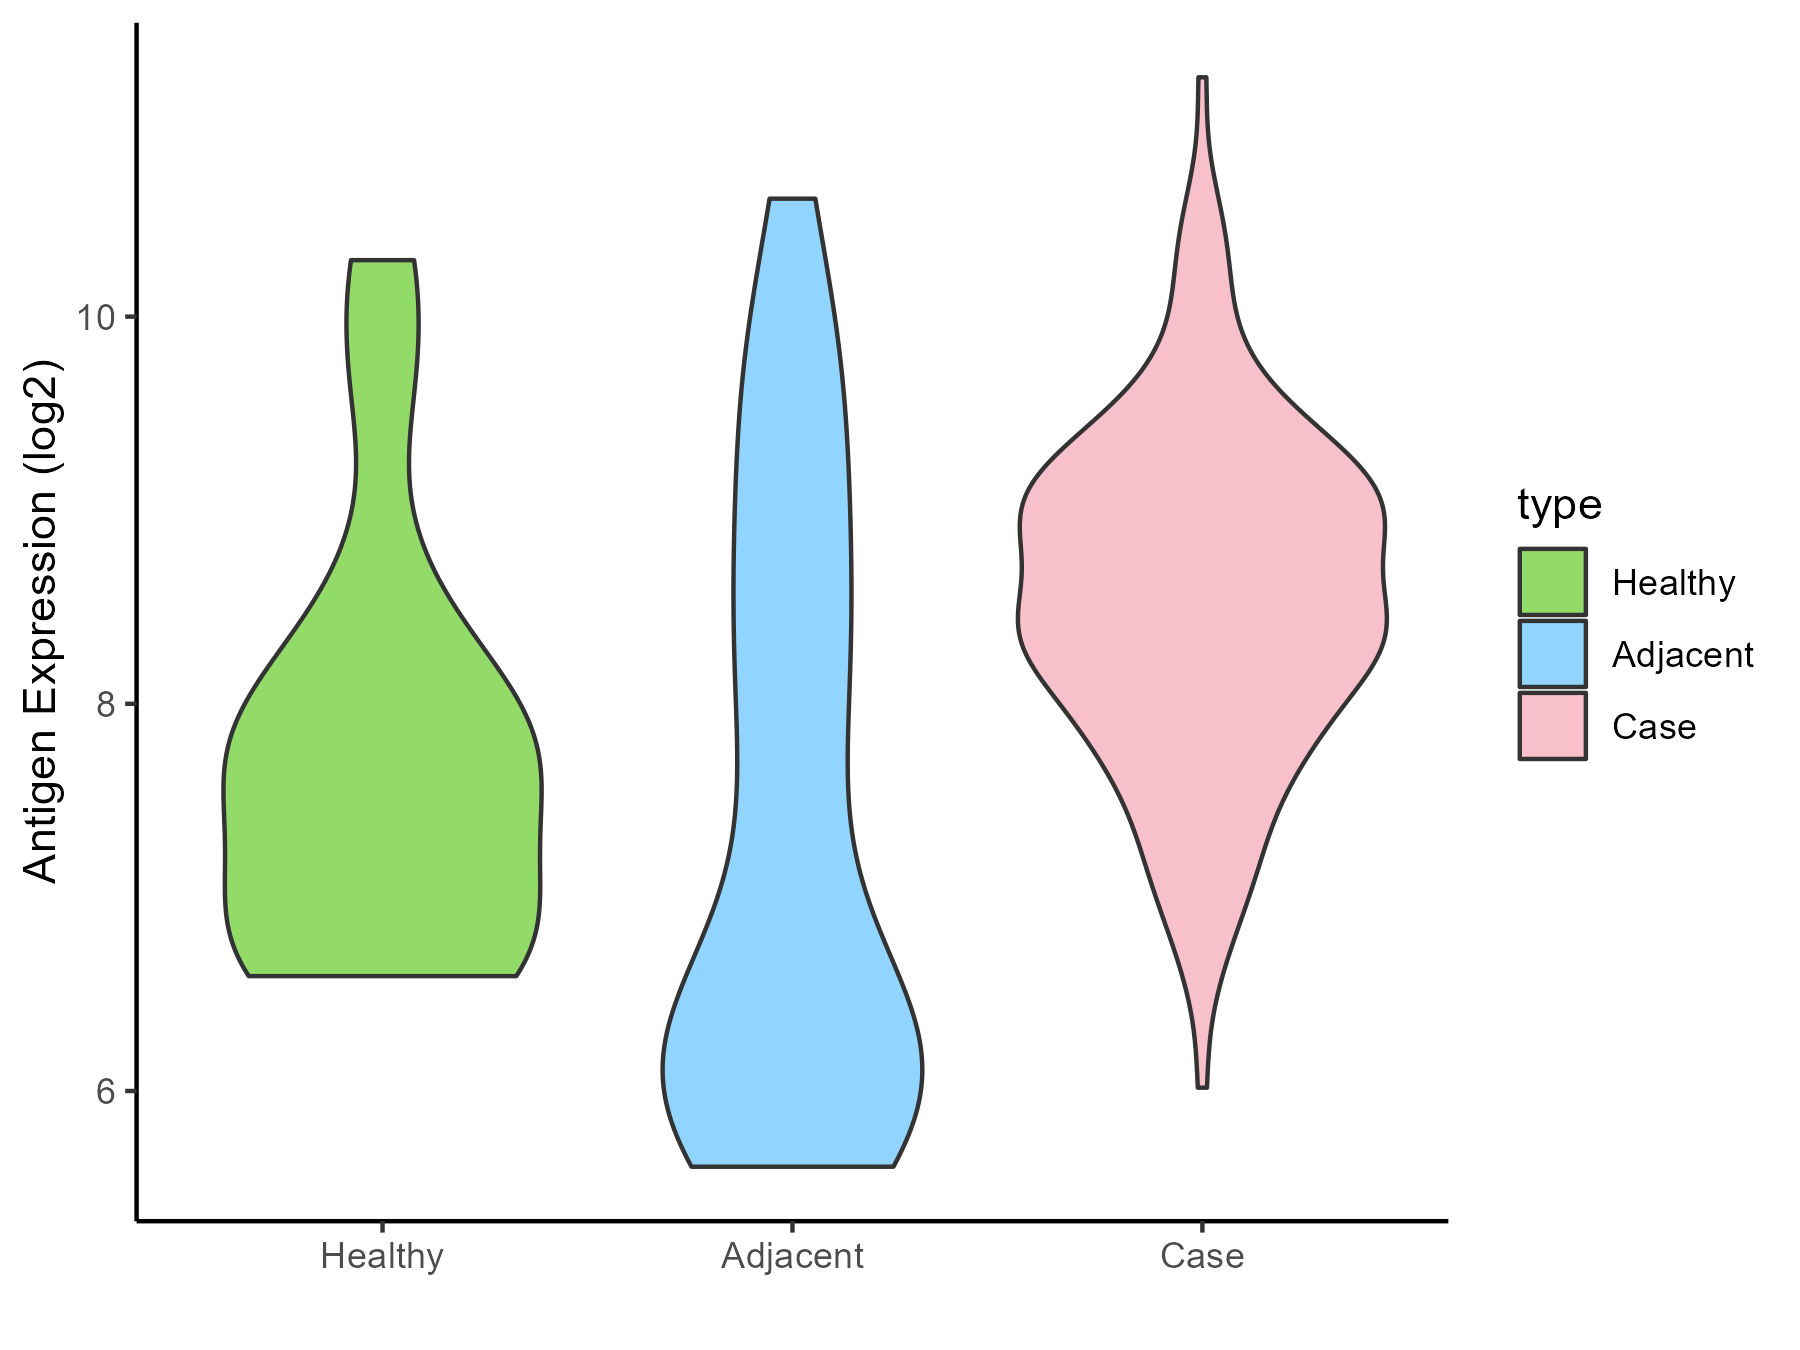
| The Studied Tissue | Pancreas | |
| The Specific Disease | Pancreatic cancer | |
| The Expression Level of Disease Section Compare with the Healthy Individual Tissue | p-value: 0.007940436; Fold-change: 0.850086847; Z-score: 0.786018188 | |
| The Expression Level of Disease Section Compare with the Adjacent Tissue | p-value: 4.73E-07; Fold-change: 1.882225763; Z-score: 1.226049152 | |
| Disease-specific Antigen Abundances |
|
Click to View the Clearer Original Diagram |
| Differential expression pattern of antigen in diseases | ||
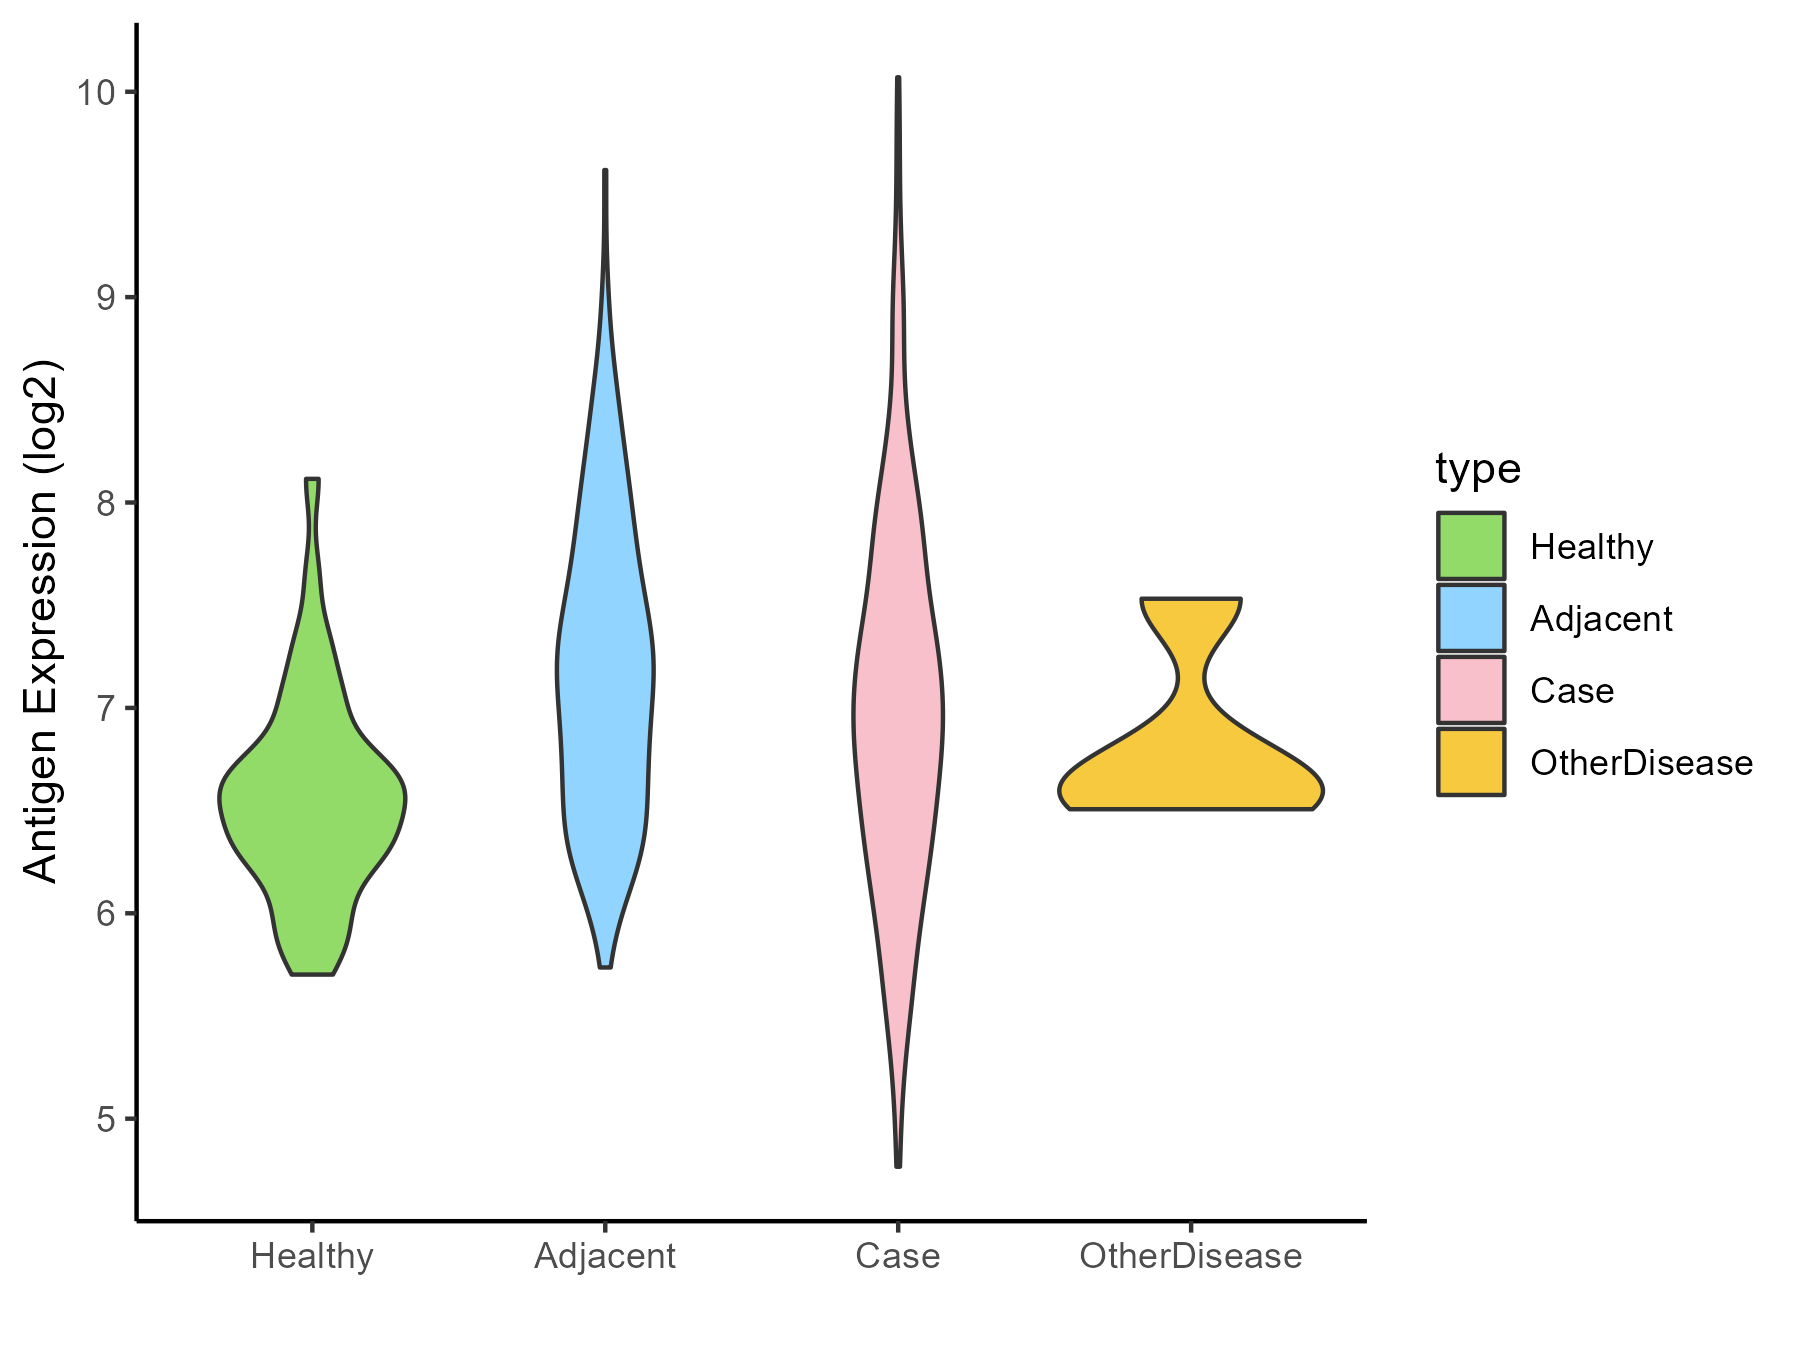
| The Studied Tissue | Liver | |
| The Specific Disease | Liver cancer | |
| The Expression Level of Disease Section Compare with the Healthy Individual Tissue | p-value: 7.16E-06; Fold-change: 0.417313089; Z-score: 0.841540587 | |
| The Expression Level of Disease Section Compare with the Adjacent Tissue | p-value: 0.005432095; Fold-change: -0.199615022; Z-score: -0.273271731 | |
| The Expression Level of Disease Section Compare with the Other Disease Section | p-value: 0.553477242; Fold-change: 0.321695563; Z-score: 0.678888324 | |
| Disease-specific Antigen Abundances |
|
Click to View the Clearer Original Diagram |
| Differential expression pattern of antigen in diseases | ||
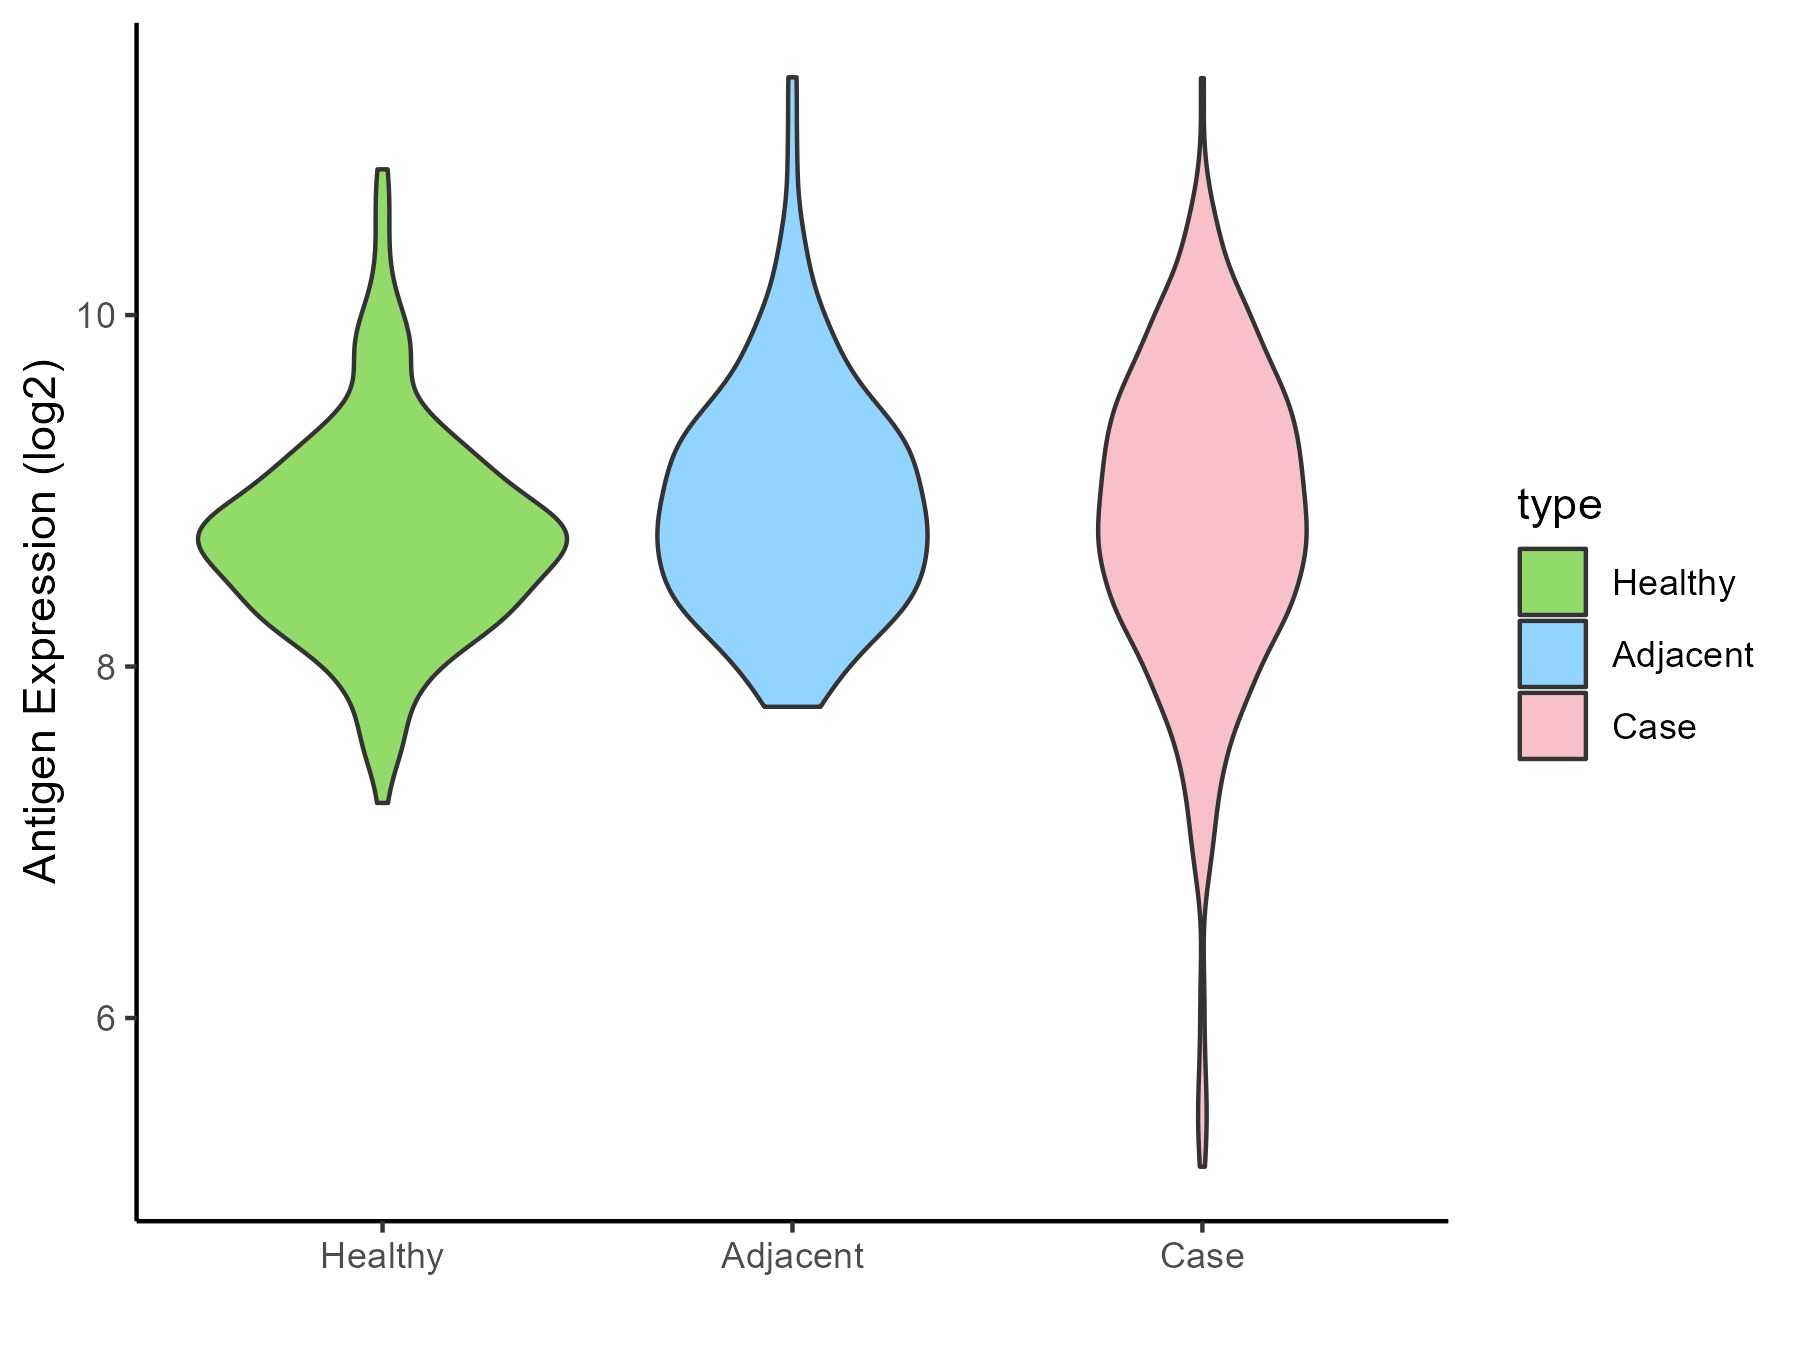
| The Studied Tissue | Lung | |
| The Specific Disease | Lung cancer | |
| The Expression Level of Disease Section Compare with the Healthy Individual Tissue | p-value: 0.124836306; Fold-change: 0.160036116; Z-score: 0.271186127 | |
| The Expression Level of Disease Section Compare with the Adjacent Tissue | p-value: 0.087973255; Fold-change: 0.037294473; Z-score: 0.057070454 | |
| Disease-specific Antigen Abundances |
|
Click to View the Clearer Original Diagram |
| Differential expression pattern of antigen in diseases | ||
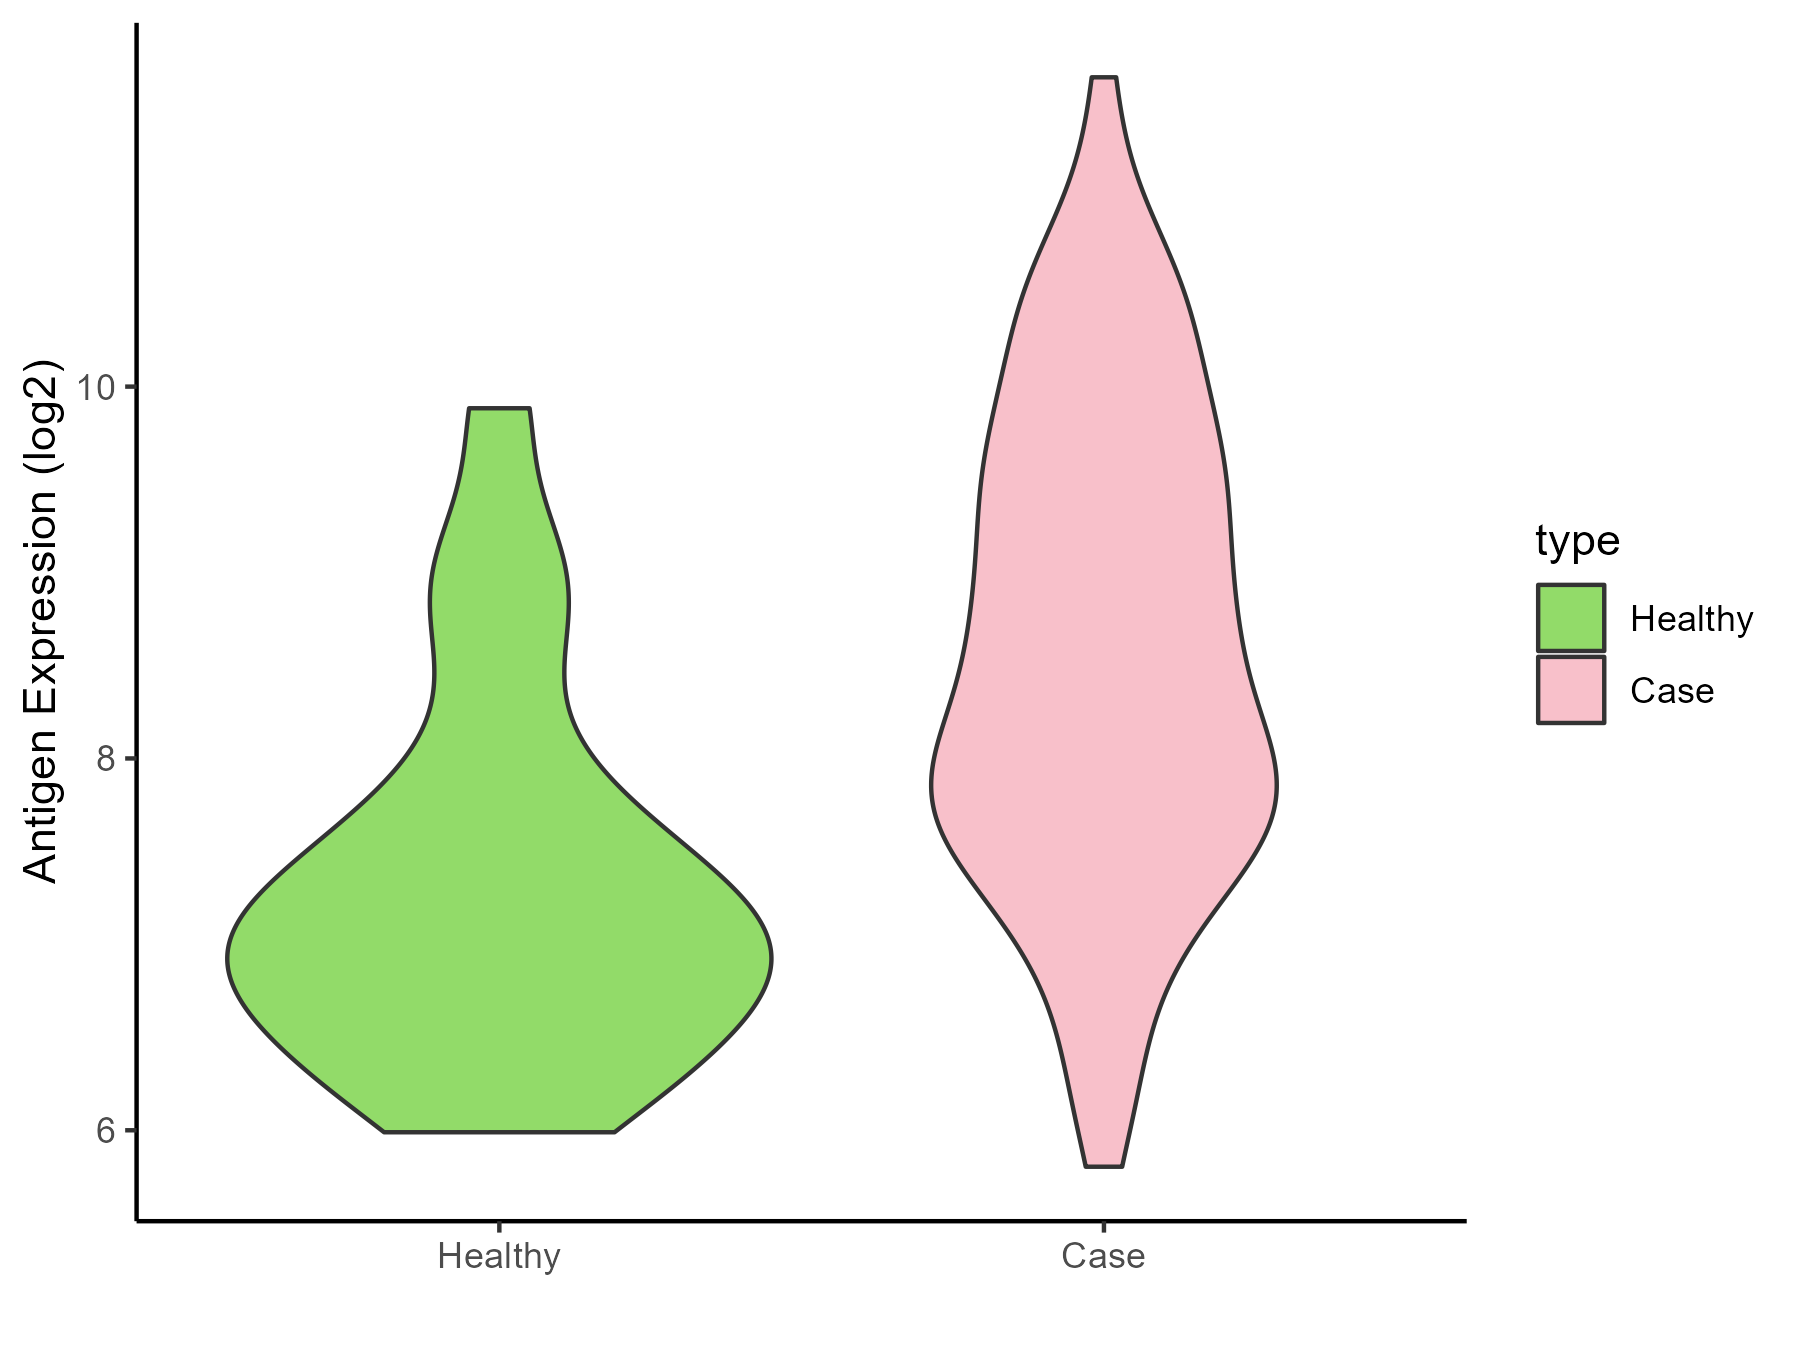
| The Studied Tissue | Skin | |
| The Specific Disease | Melanoma | |
| The Expression Level of Disease Section Compare with the Healthy Individual Tissue | p-value: 3.23E-06; Fold-change: 1.424358926; Z-score: 1.416159937 | |
| Disease-specific Antigen Abundances |
|
Click to View the Clearer Original Diagram |
| Differential expression pattern of antigen in diseases | ||
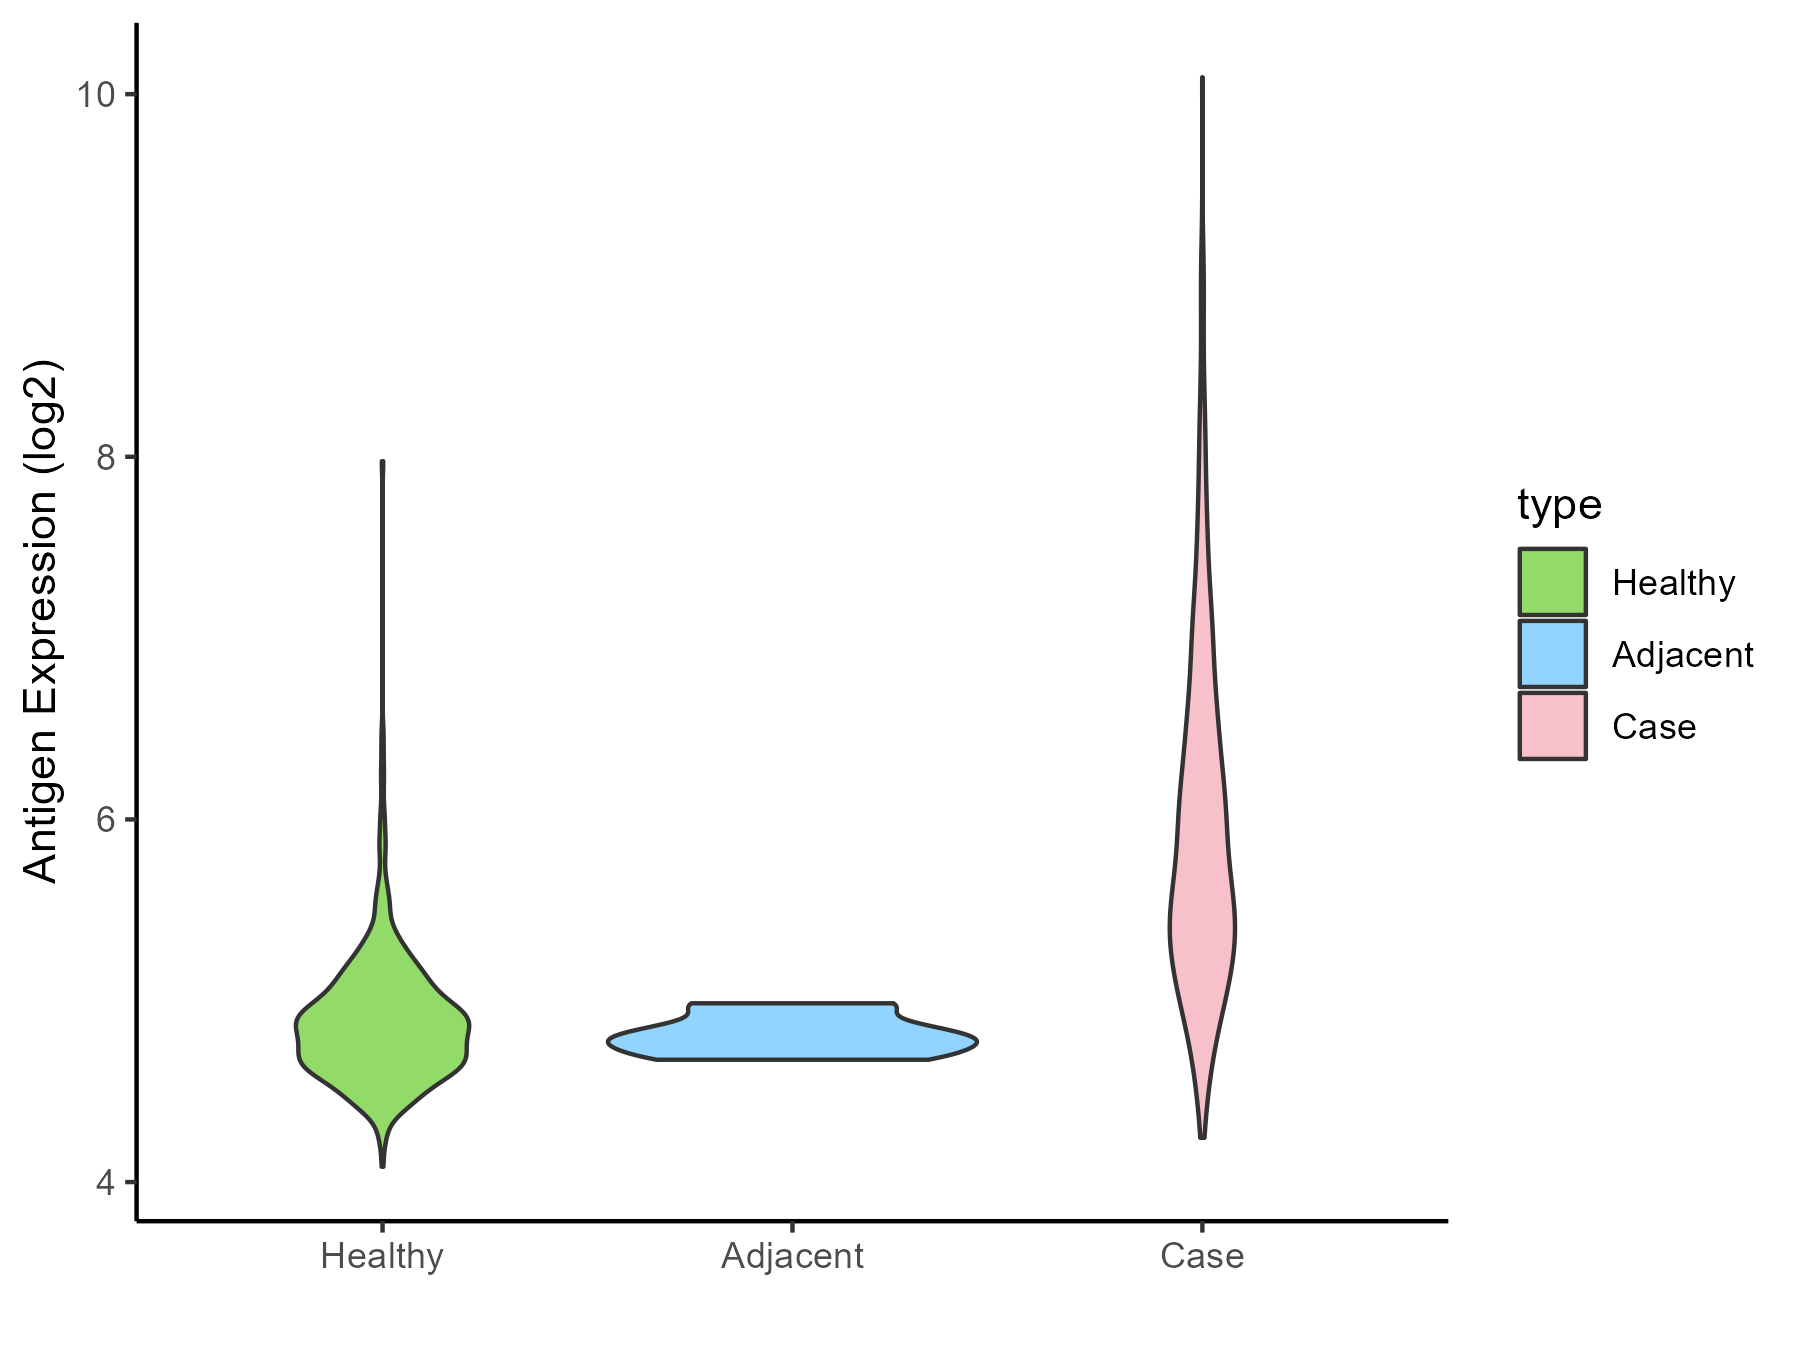
| The Studied Tissue | Muscle | |
| The Specific Disease | Sarcoma | |
| The Expression Level of Disease Section Compare with the Healthy Individual Tissue | p-value: 2.89E-102; Fold-change: 0.924201285; Z-score: 2.615928022 | |
| The Expression Level of Disease Section Compare with the Adjacent Tissue | p-value: 1.17E-05; Fold-change: 0.96332211; Z-score: 7.323429736 | |
| Disease-specific Antigen Abundances |
|
Click to View the Clearer Original Diagram |
| Differential expression pattern of antigen in diseases | ||
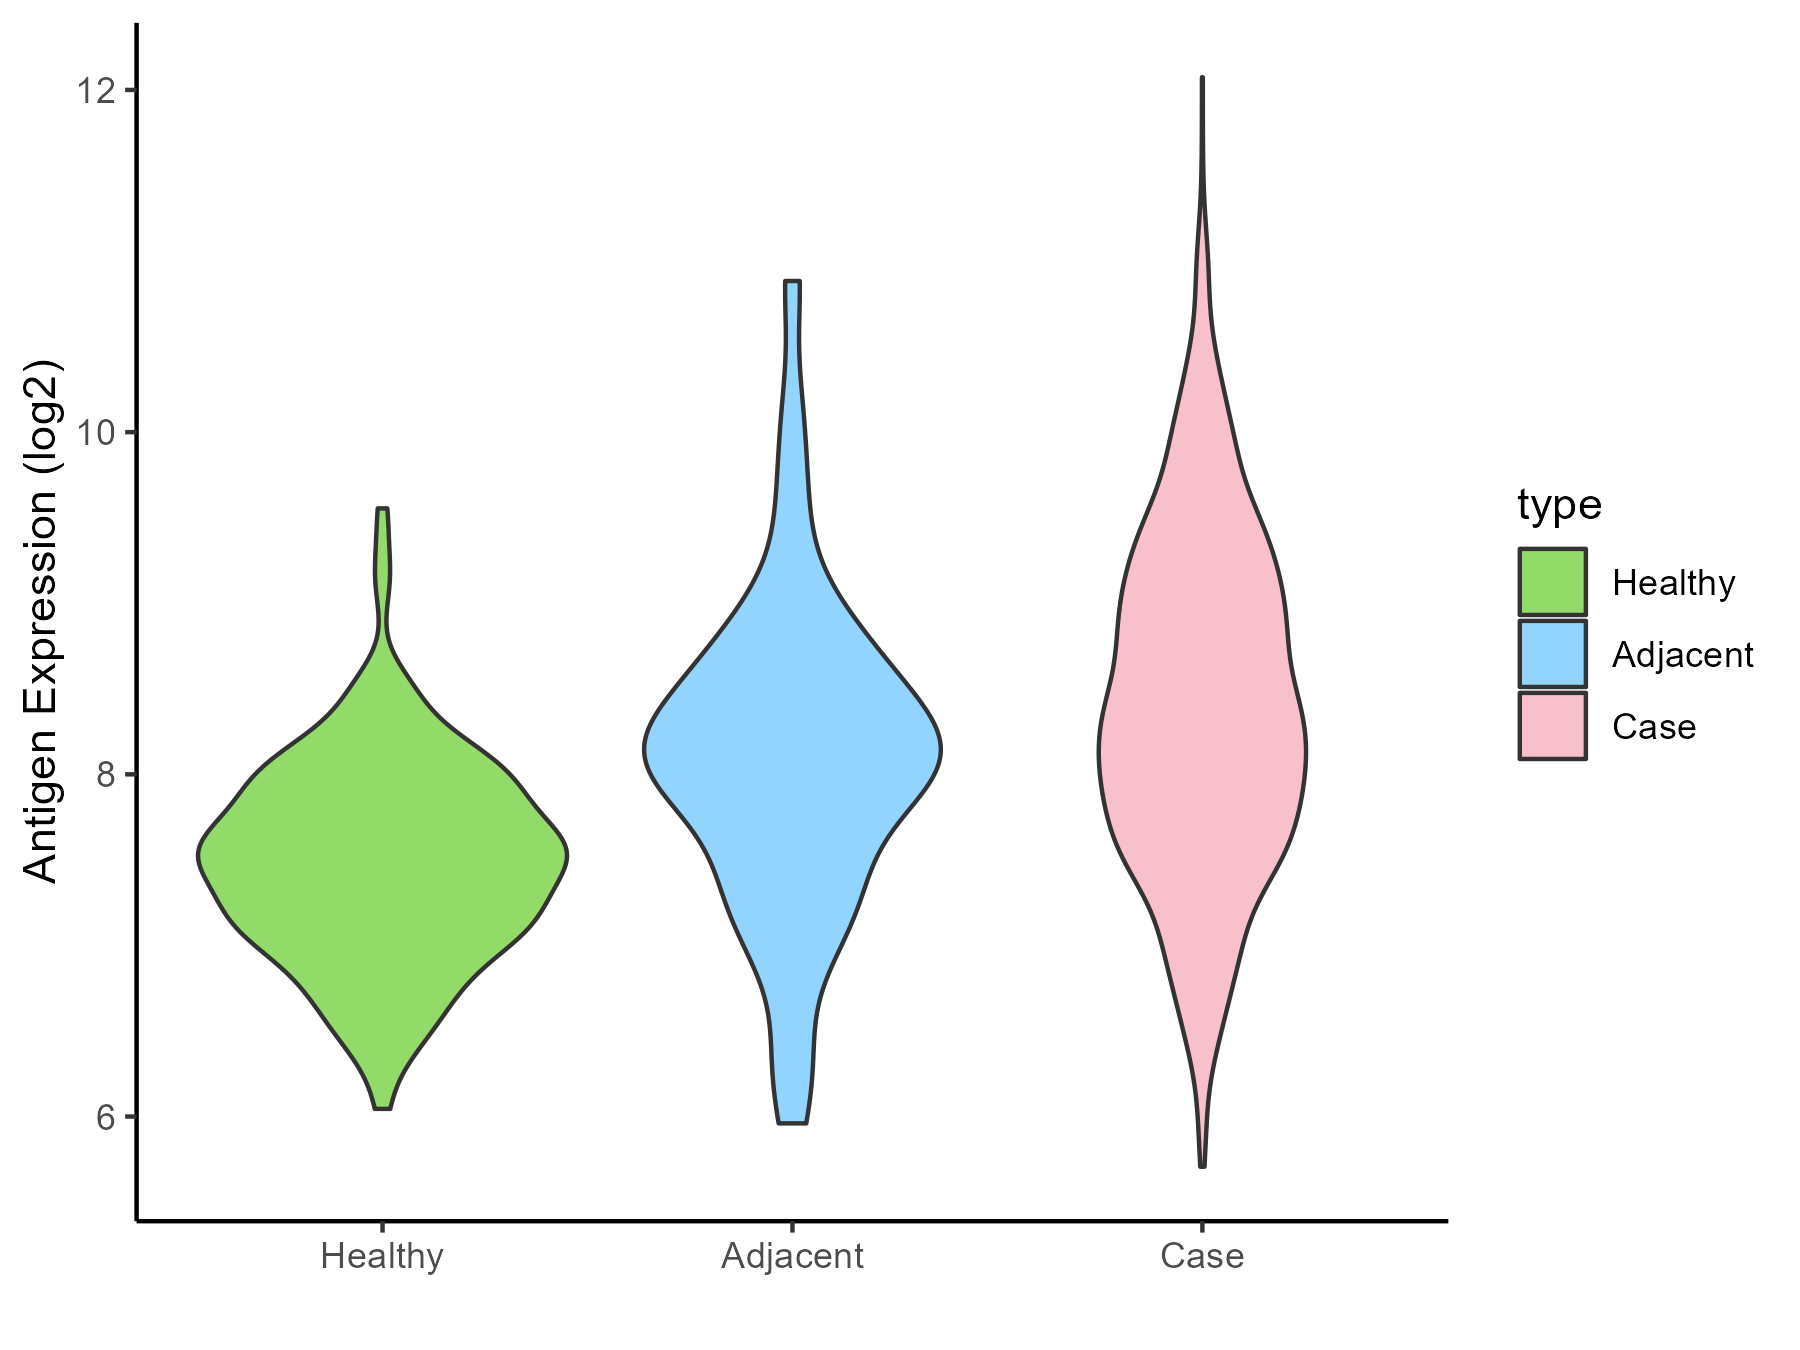
| The Studied Tissue | Breast | |
| The Specific Disease | Breast cancer | |
| The Expression Level of Disease Section Compare with the Healthy Individual Tissue | p-value: 4.86E-71; Fold-change: 0.829905938; Z-score: 1.439548721 | |
| The Expression Level of Disease Section Compare with the Adjacent Tissue | p-value: 0.018967005; Fold-change: 0.196891813; Z-score: 0.216200309 | |
| Disease-specific Antigen Abundances |
|
Click to View the Clearer Original Diagram |
| Differential expression pattern of antigen in diseases | ||
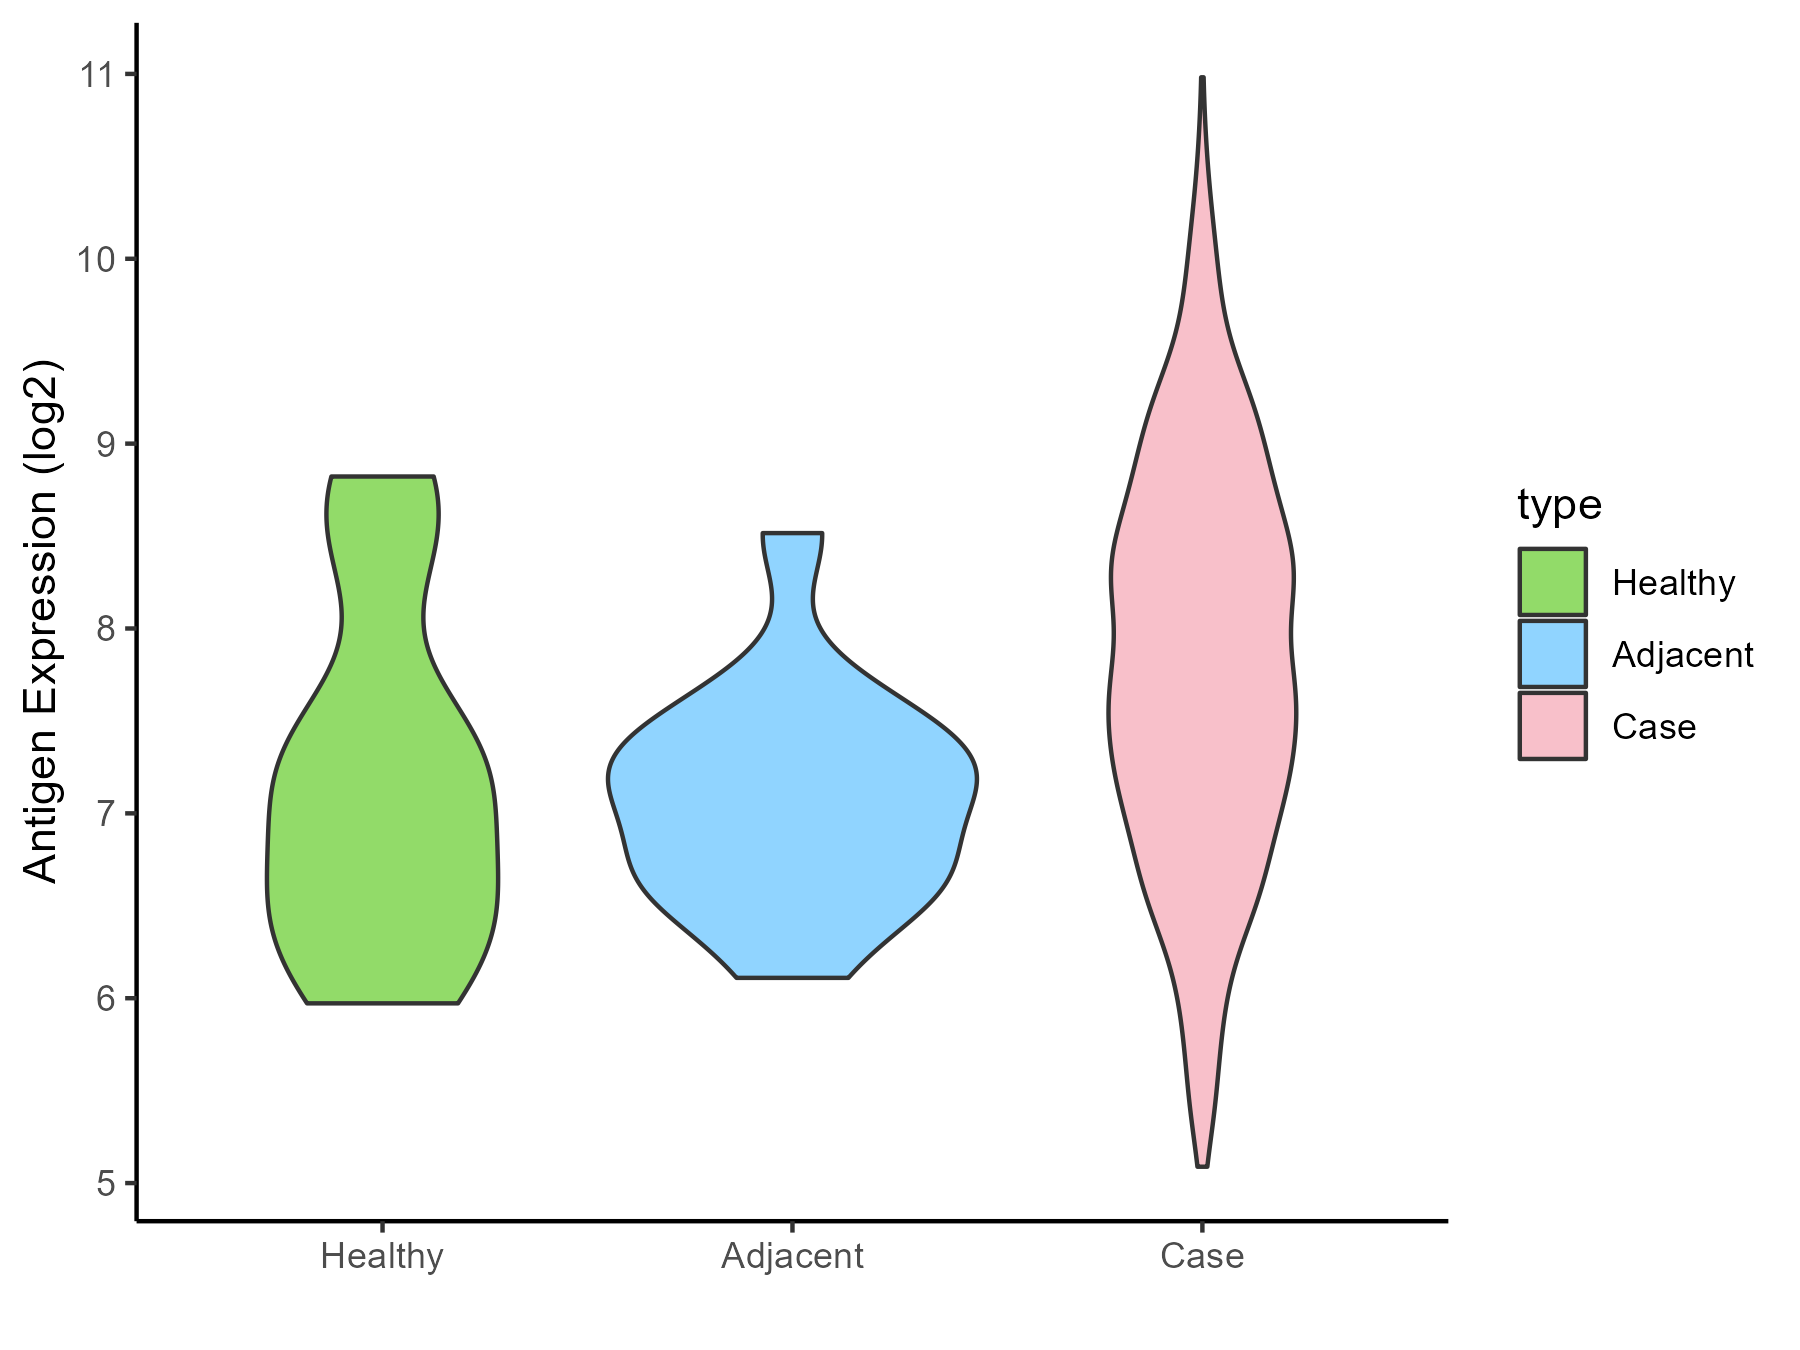
| The Studied Tissue | Ovarian | |
| The Specific Disease | Ovarian cancer | |
| The Expression Level of Disease Section Compare with the Healthy Individual Tissue | p-value: 0.077359435; Fold-change: 0.613587408; Z-score: 0.636787501 | |
| The Expression Level of Disease Section Compare with the Adjacent Tissue | p-value: 0.000483555; Fold-change: 0.654722938; Z-score: 1.089826056 | |
| Disease-specific Antigen Abundances |
|
Click to View the Clearer Original Diagram |
| Differential expression pattern of antigen in diseases | ||
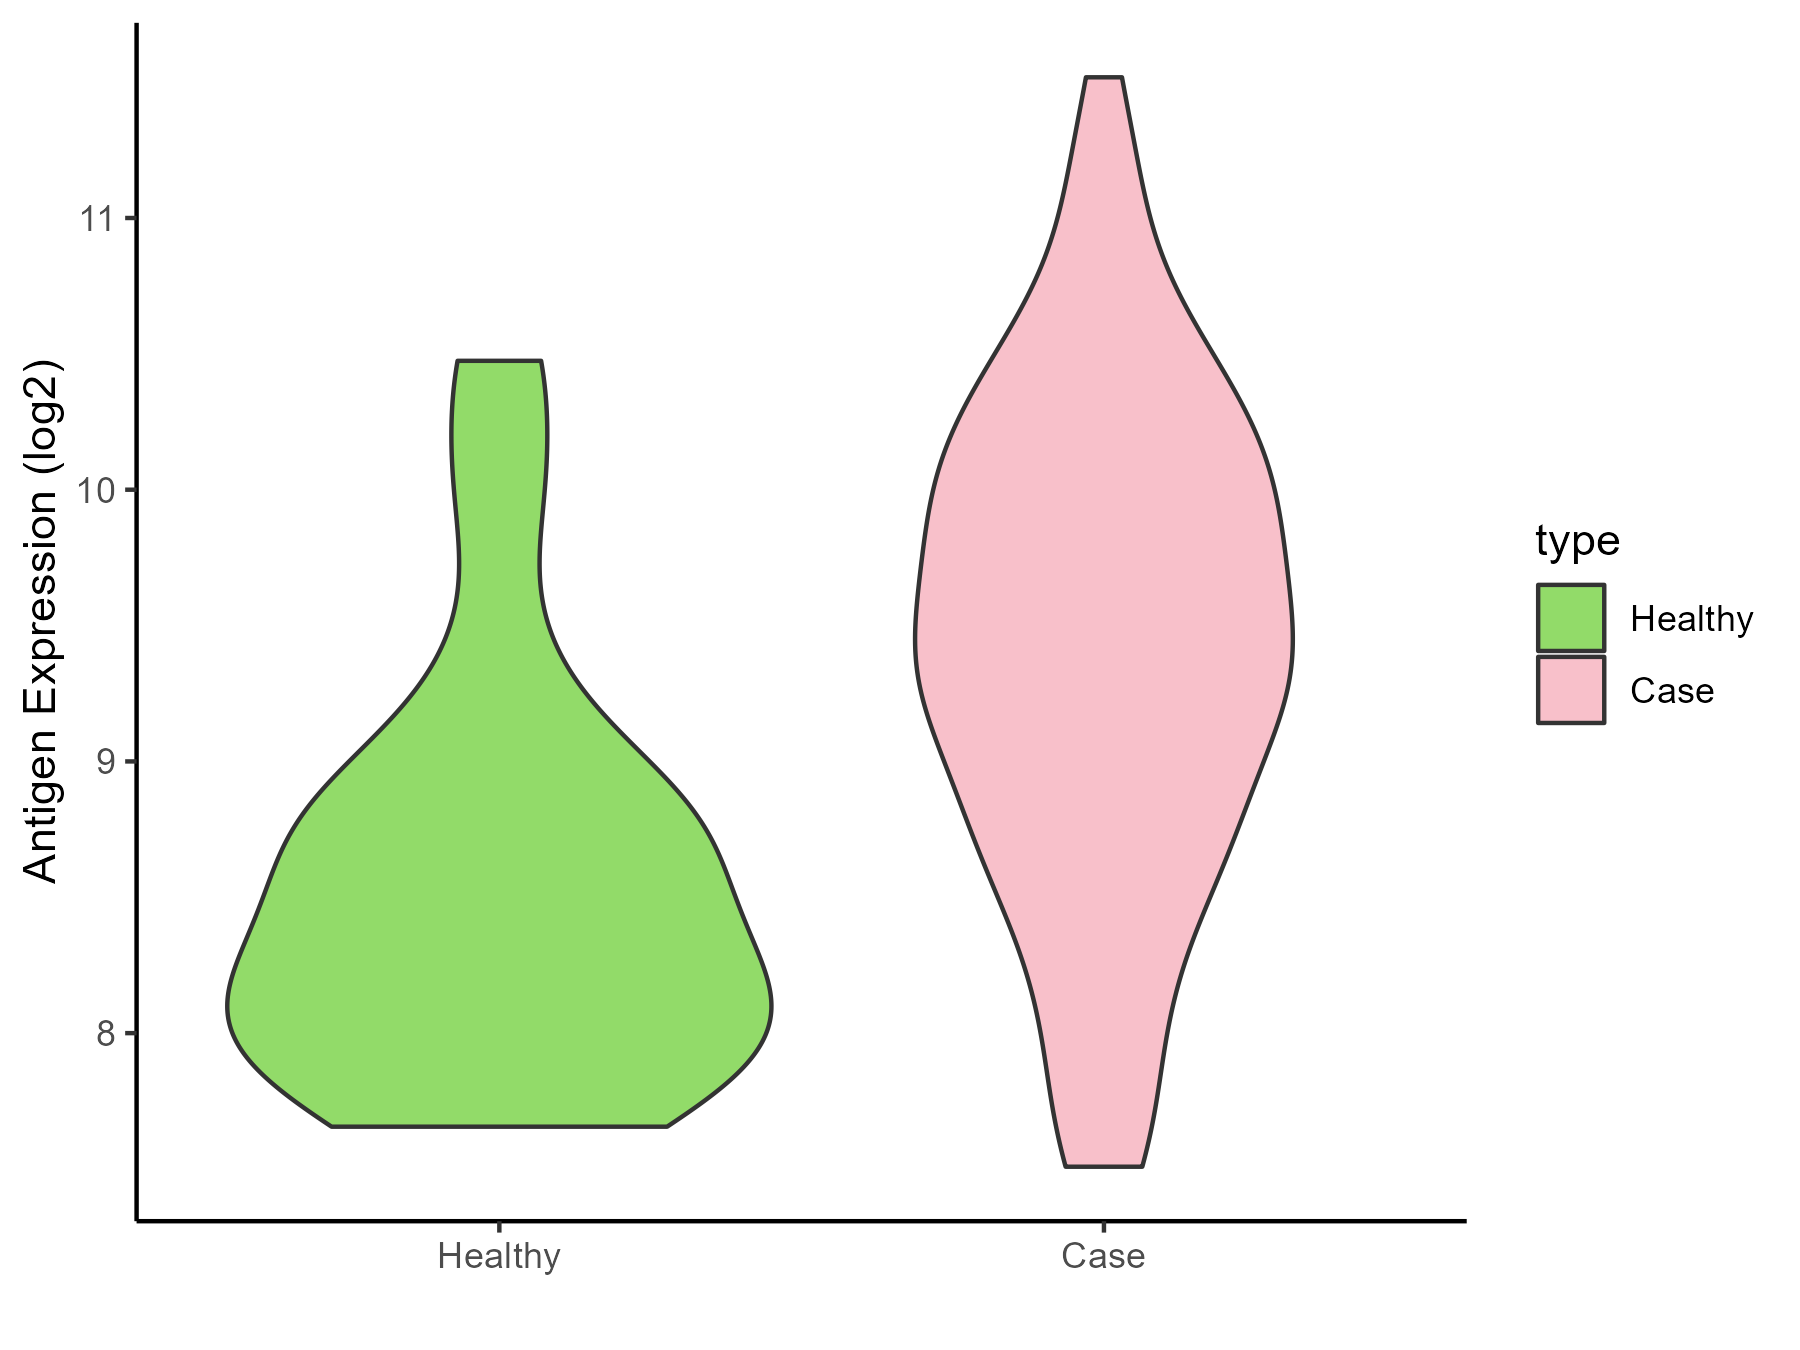
| The Studied Tissue | Cervical | |
| The Specific Disease | Cervical cancer | |
| The Expression Level of Disease Section Compare with the Healthy Individual Tissue | p-value: 0.00014916; Fold-change: 1.107644967; Z-score: 1.454998715 | |
| Disease-specific Antigen Abundances |
|
Click to View the Clearer Original Diagram |
| Differential expression pattern of antigen in diseases | ||
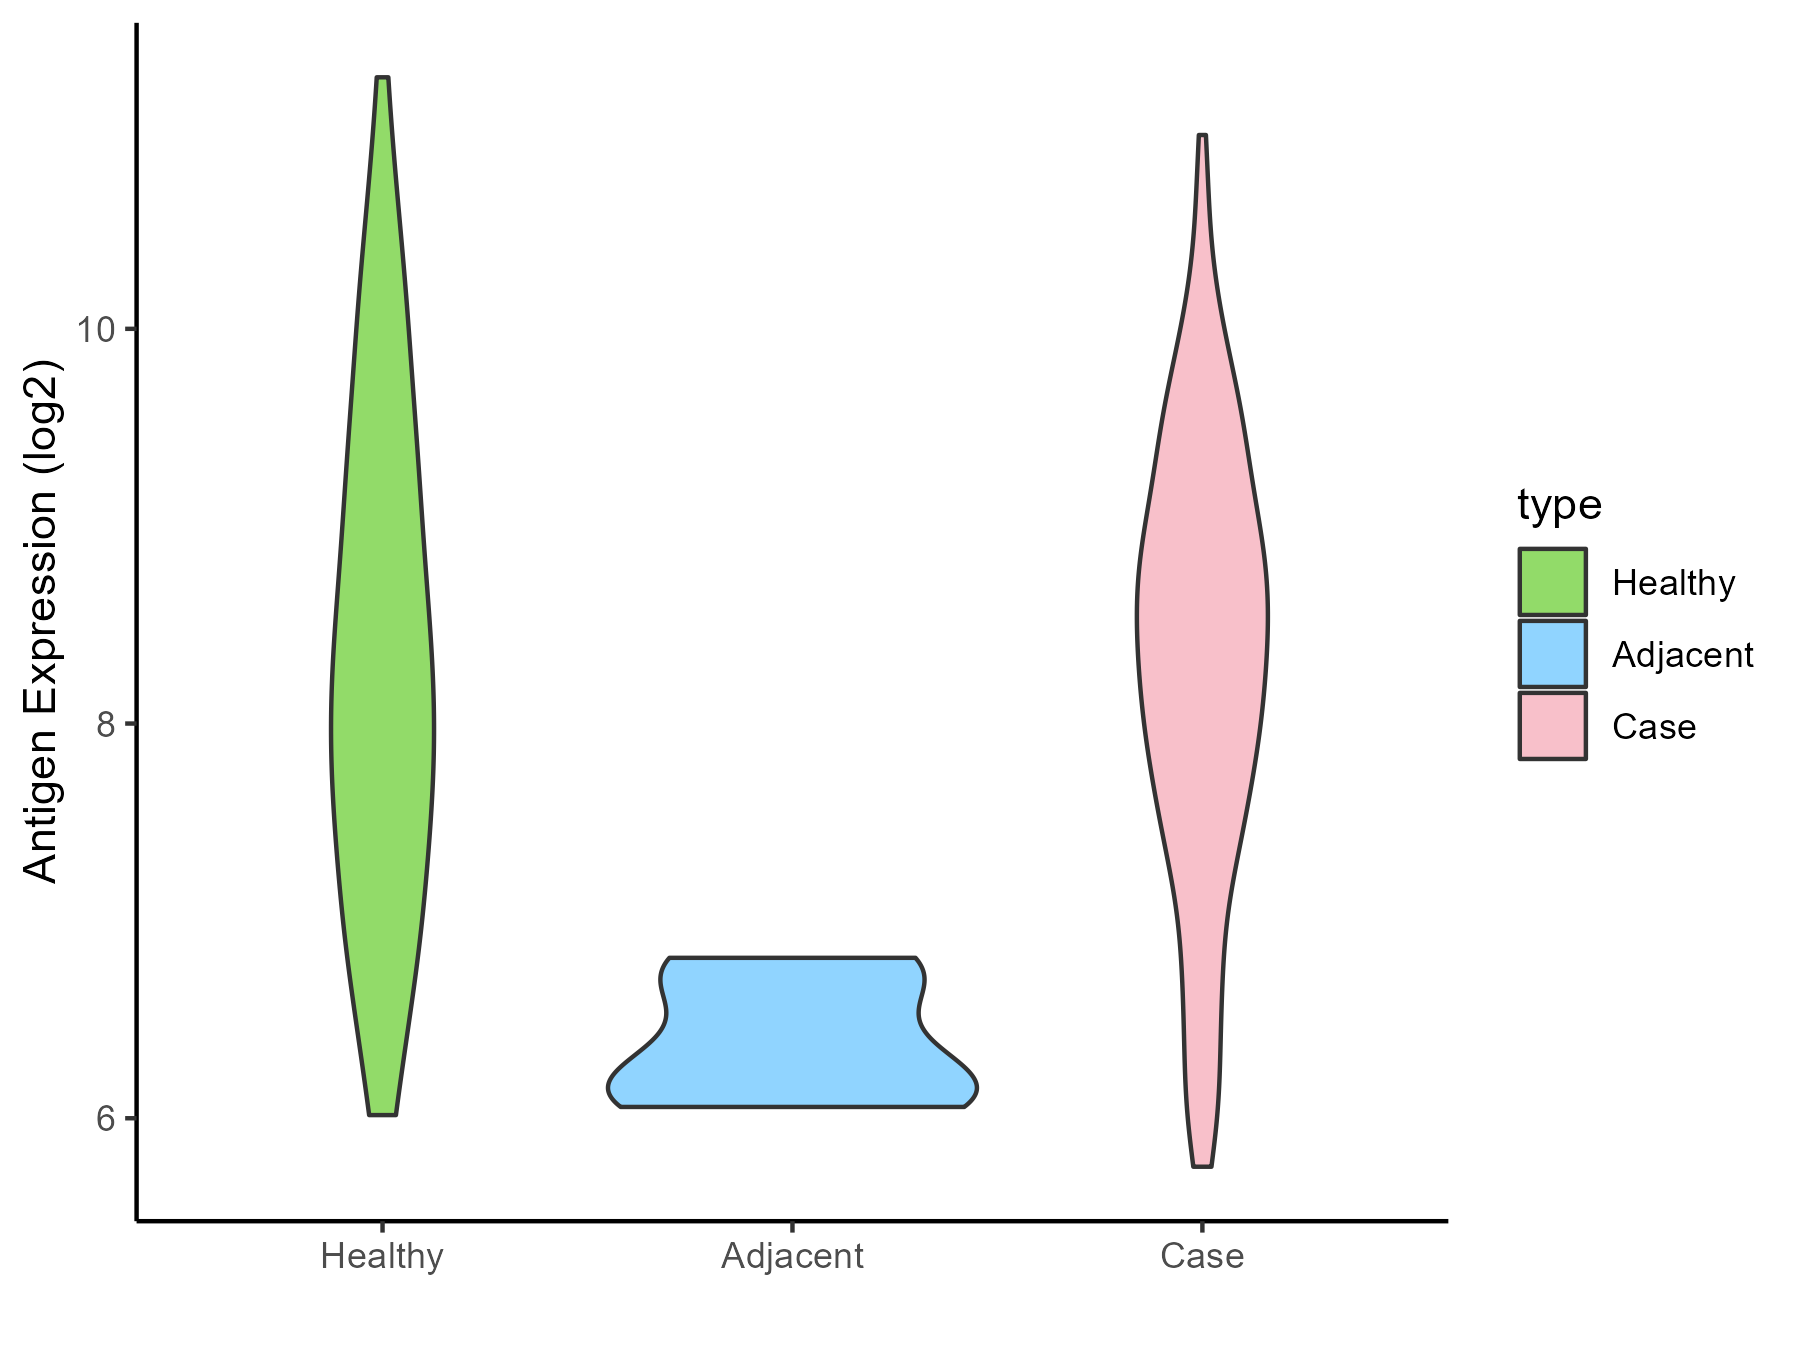
| The Studied Tissue | Endometrium | |
| The Specific Disease | Uterine cancer | |
| The Expression Level of Disease Section Compare with the Healthy Individual Tissue | p-value: 0.975717618; Fold-change: 0.170879356; Z-score: 0.136132441 | |
| The Expression Level of Disease Section Compare with the Adjacent Tissue | p-value: 5.47E-05; Fold-change: 2.133085661; Z-score: 6.177322288 | |
| Disease-specific Antigen Abundances |
|
Click to View the Clearer Original Diagram |
| Differential expression pattern of antigen in diseases | ||
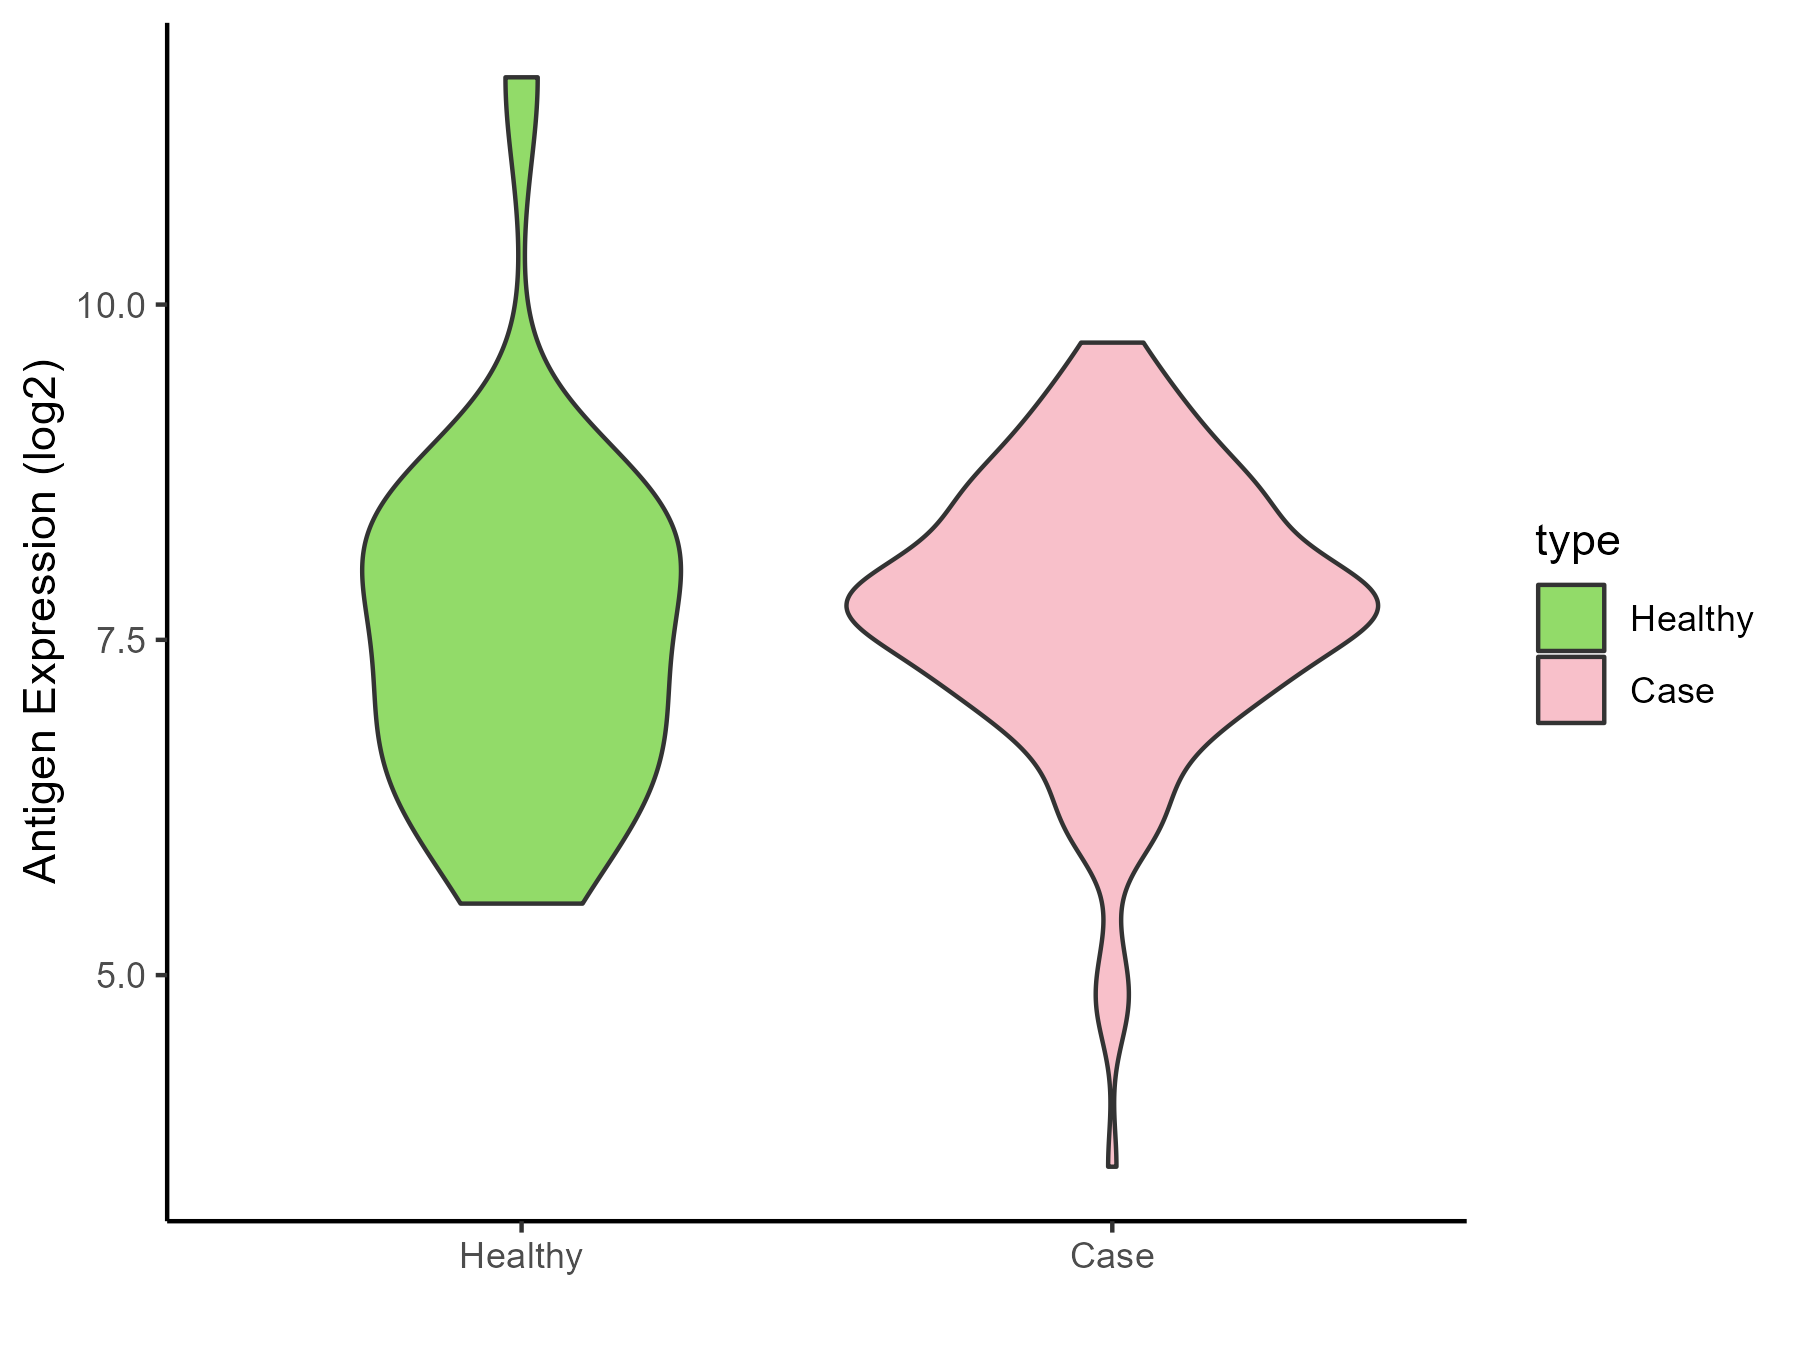
| The Studied Tissue | Prostate | |
| The Specific Disease | Prostate cancer | |
| The Expression Level of Disease Section Compare with the Healthy Individual Tissue | p-value: 0.607428872; Fold-change: 0.400423154; Z-score: 0.298858034 | |
| Disease-specific Antigen Abundances |
|
Click to View the Clearer Original Diagram |
| Differential expression pattern of antigen in diseases | ||
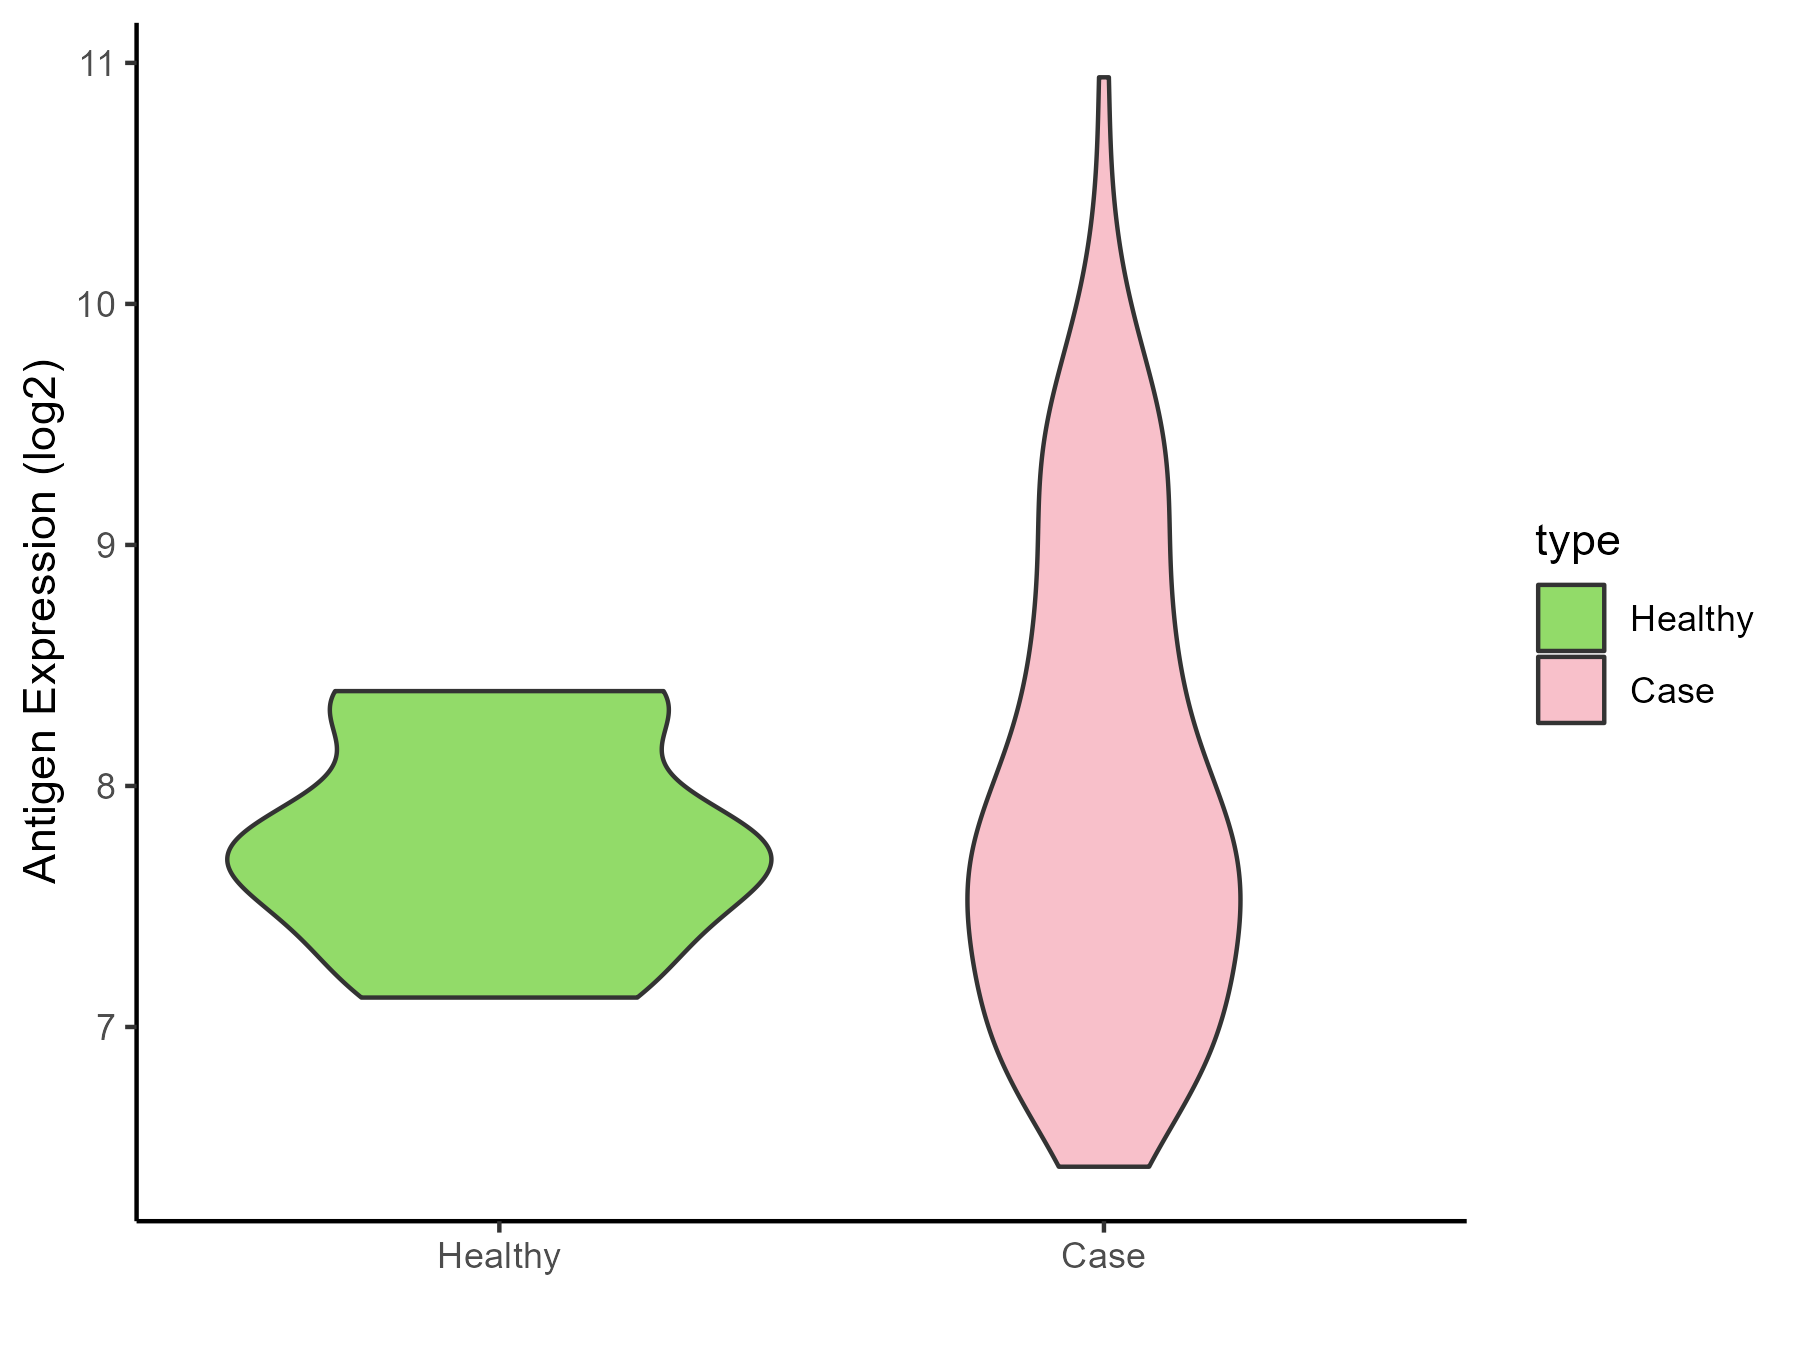
| The Studied Tissue | Bladder | |
| The Specific Disease | Bladder cancer | |
| The Expression Level of Disease Section Compare with the Healthy Individual Tissue | p-value: 0.298274211; Fold-change: 0.013696639; Z-score: 0.029365153 | |
| Disease-specific Antigen Abundances |
|
Click to View the Clearer Original Diagram |
| Differential expression pattern of antigen in diseases | ||
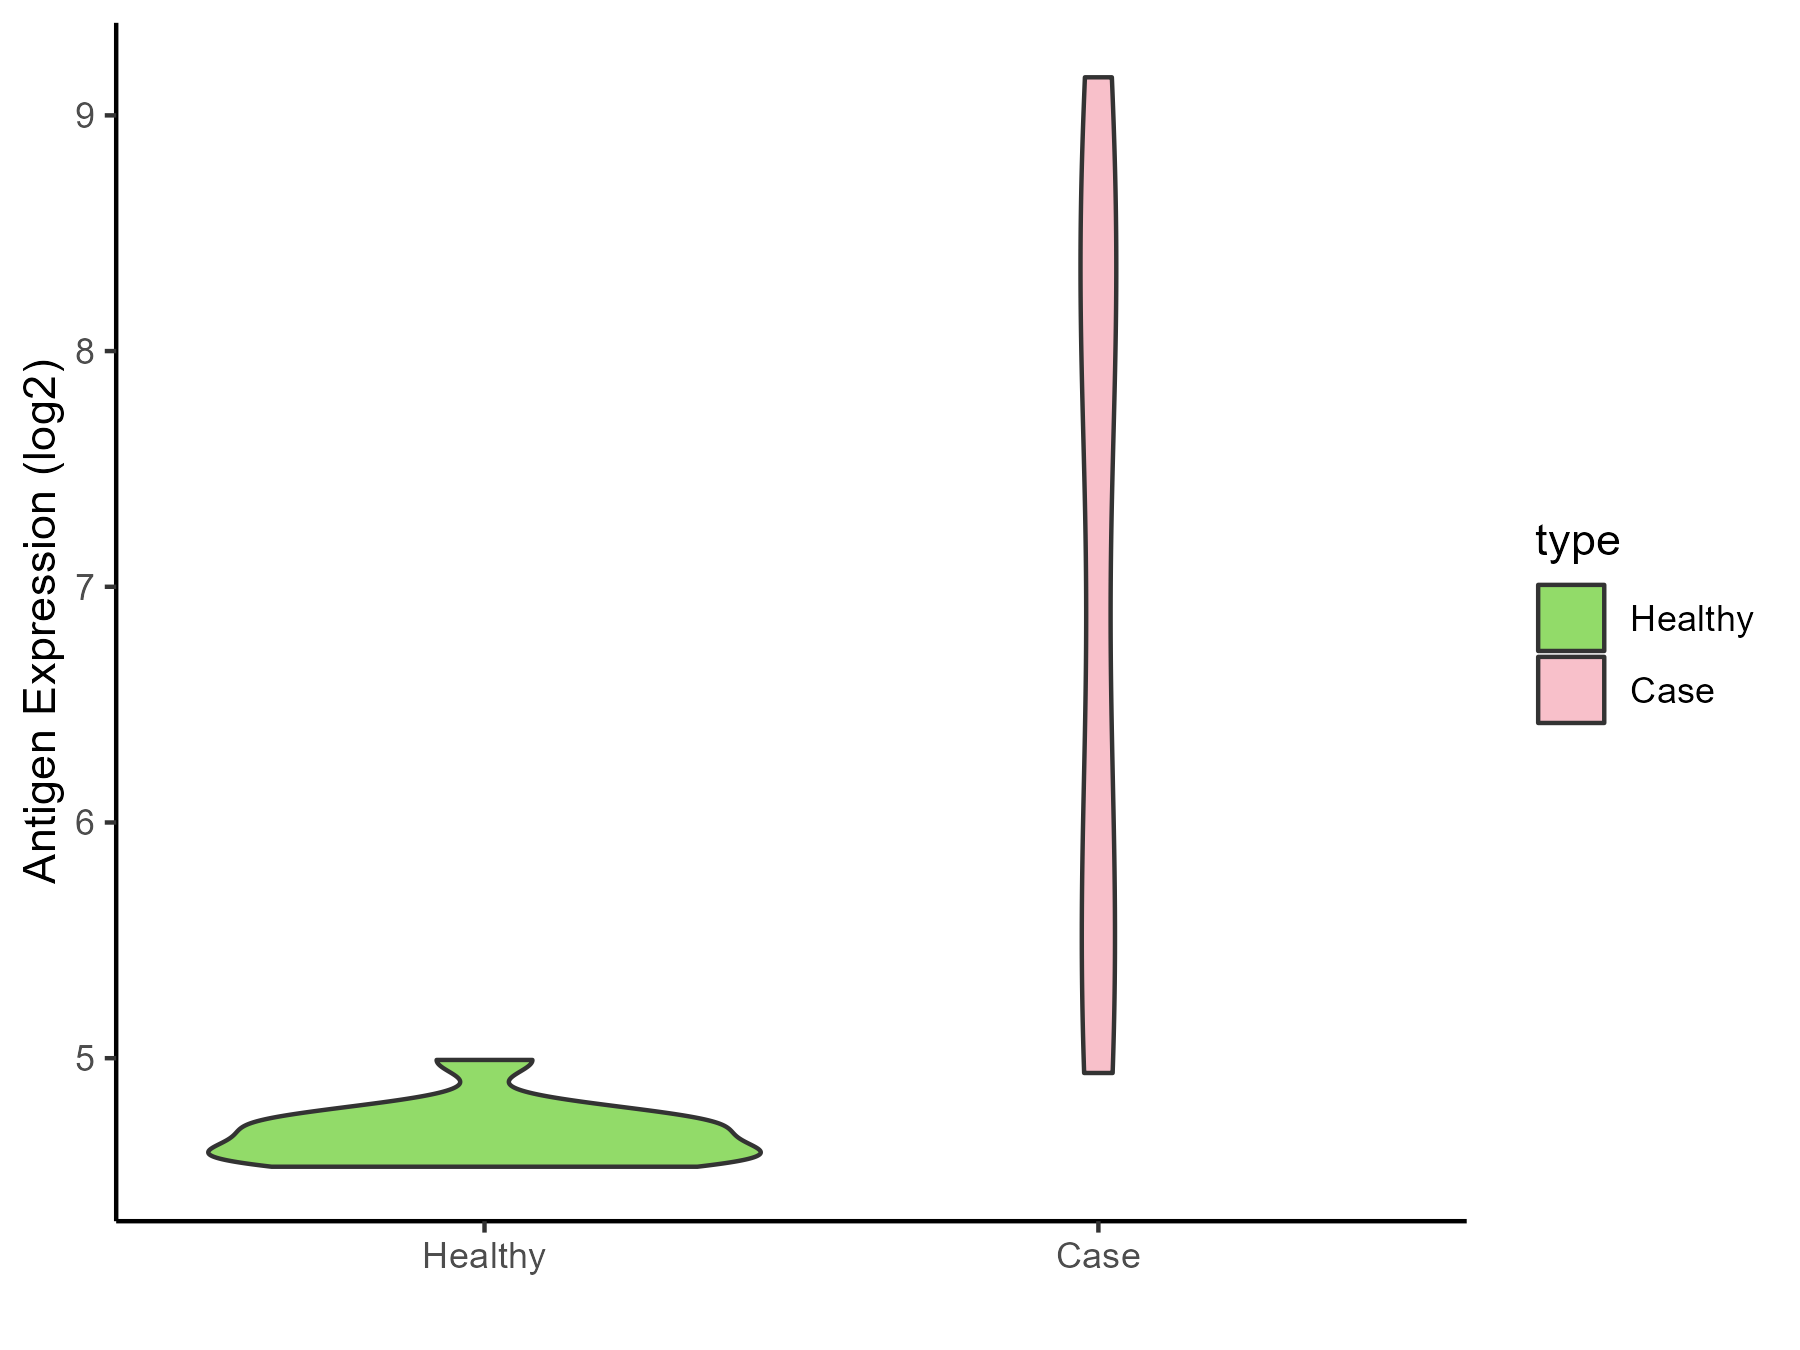
| The Studied Tissue | Uvea | |
| The Specific Disease | Retinoblastoma tumor | |
| The Expression Level of Disease Section Compare with the Healthy Individual Tissue | p-value: 9.56E-05; Fold-change: 2.633472936; Z-score: 20.58684455 | |
| Disease-specific Antigen Abundances |
|
Click to View the Clearer Original Diagram |
| Differential expression pattern of antigen in diseases | ||
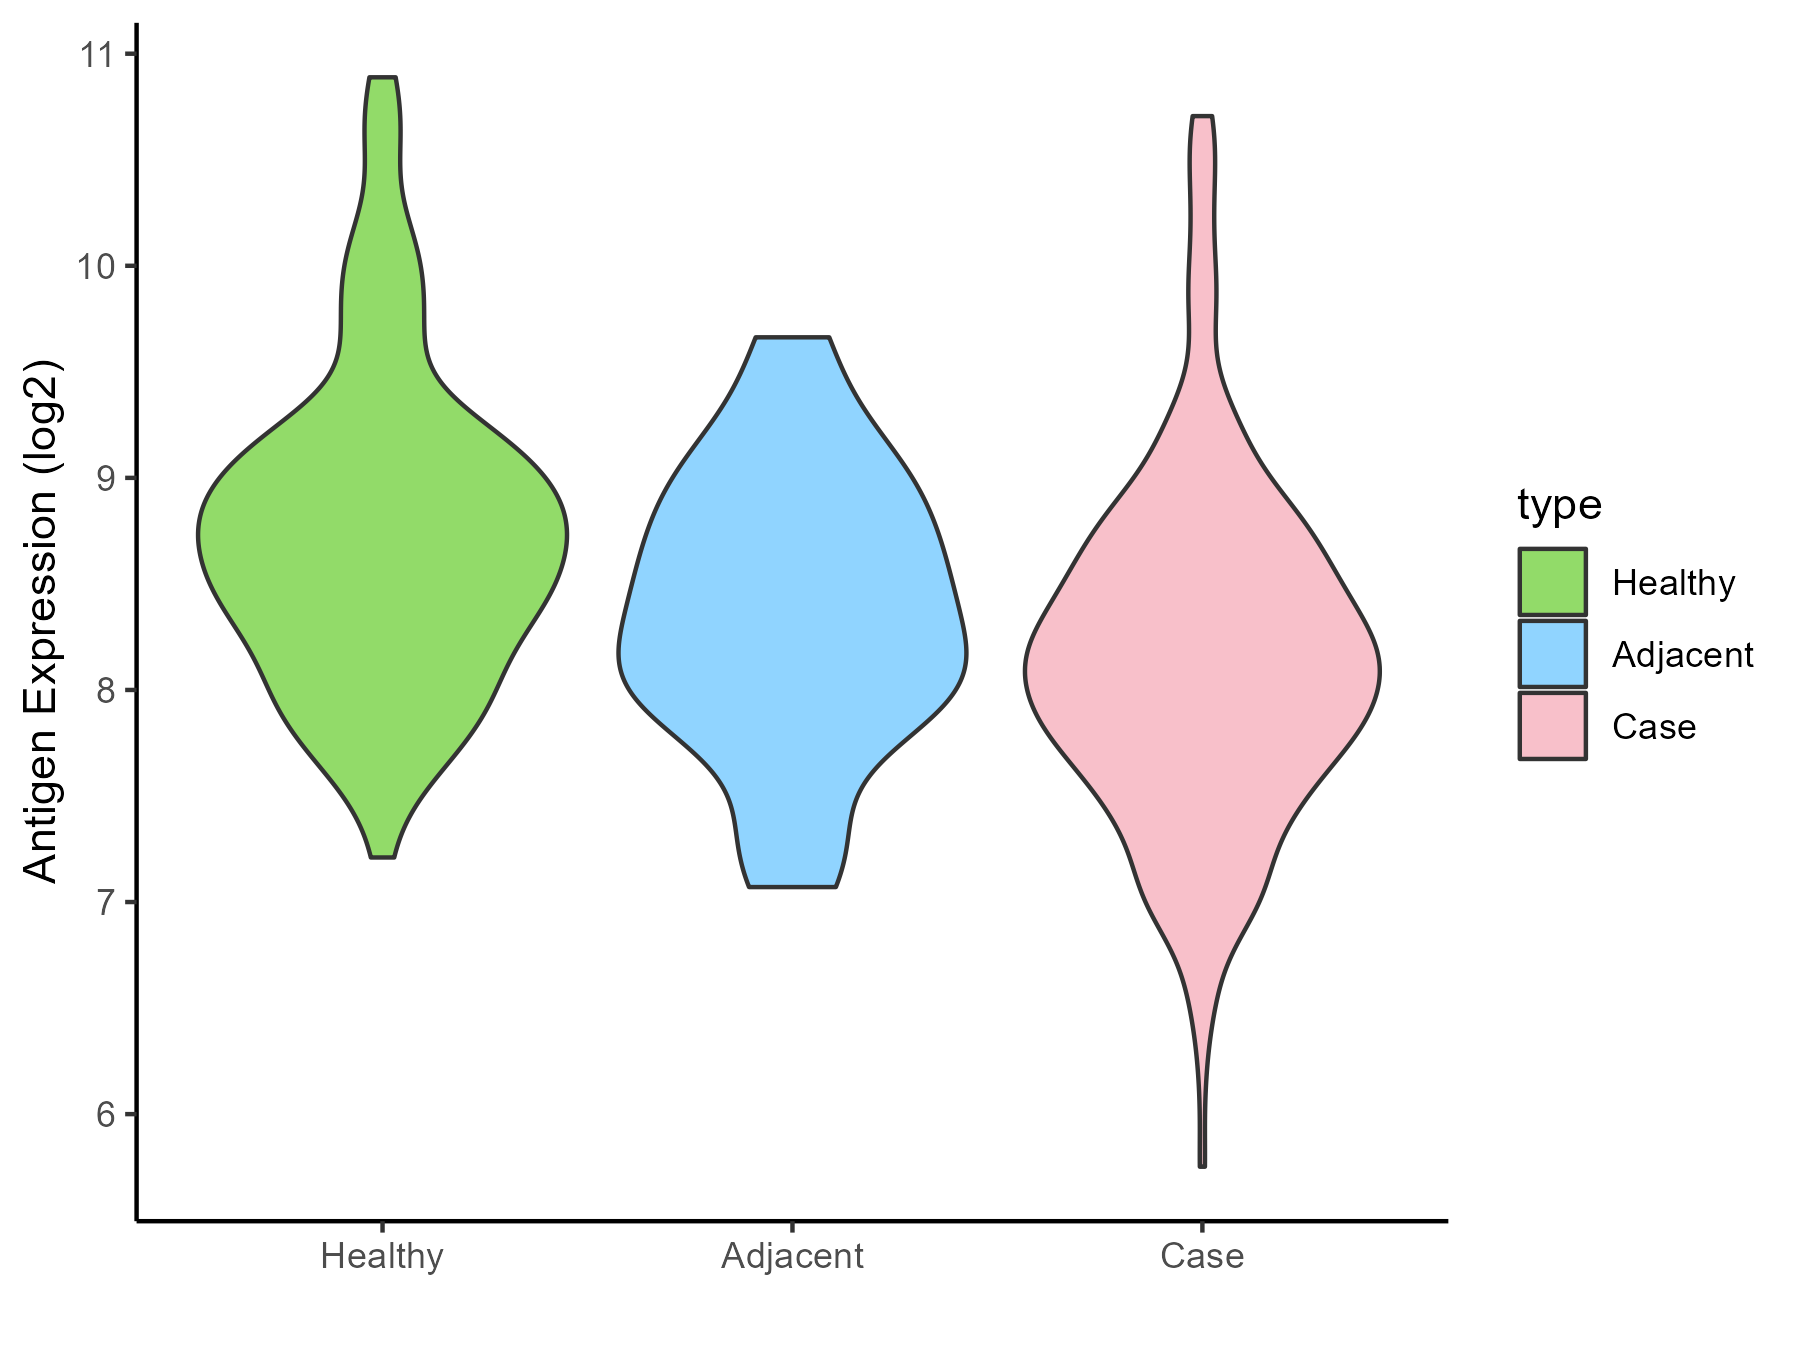
| The Studied Tissue | Thyroid | |
| The Specific Disease | Thyroid cancer | |
| The Expression Level of Disease Section Compare with the Healthy Individual Tissue | p-value: 1.68E-10; Fold-change: -0.57707165; Z-score: -0.791487901 | |
| The Expression Level of Disease Section Compare with the Adjacent Tissue | p-value: 0.064812174; Fold-change: -0.28726846; Z-score: -0.441638669 | |
| Disease-specific Antigen Abundances |
|
Click to View the Clearer Original Diagram |
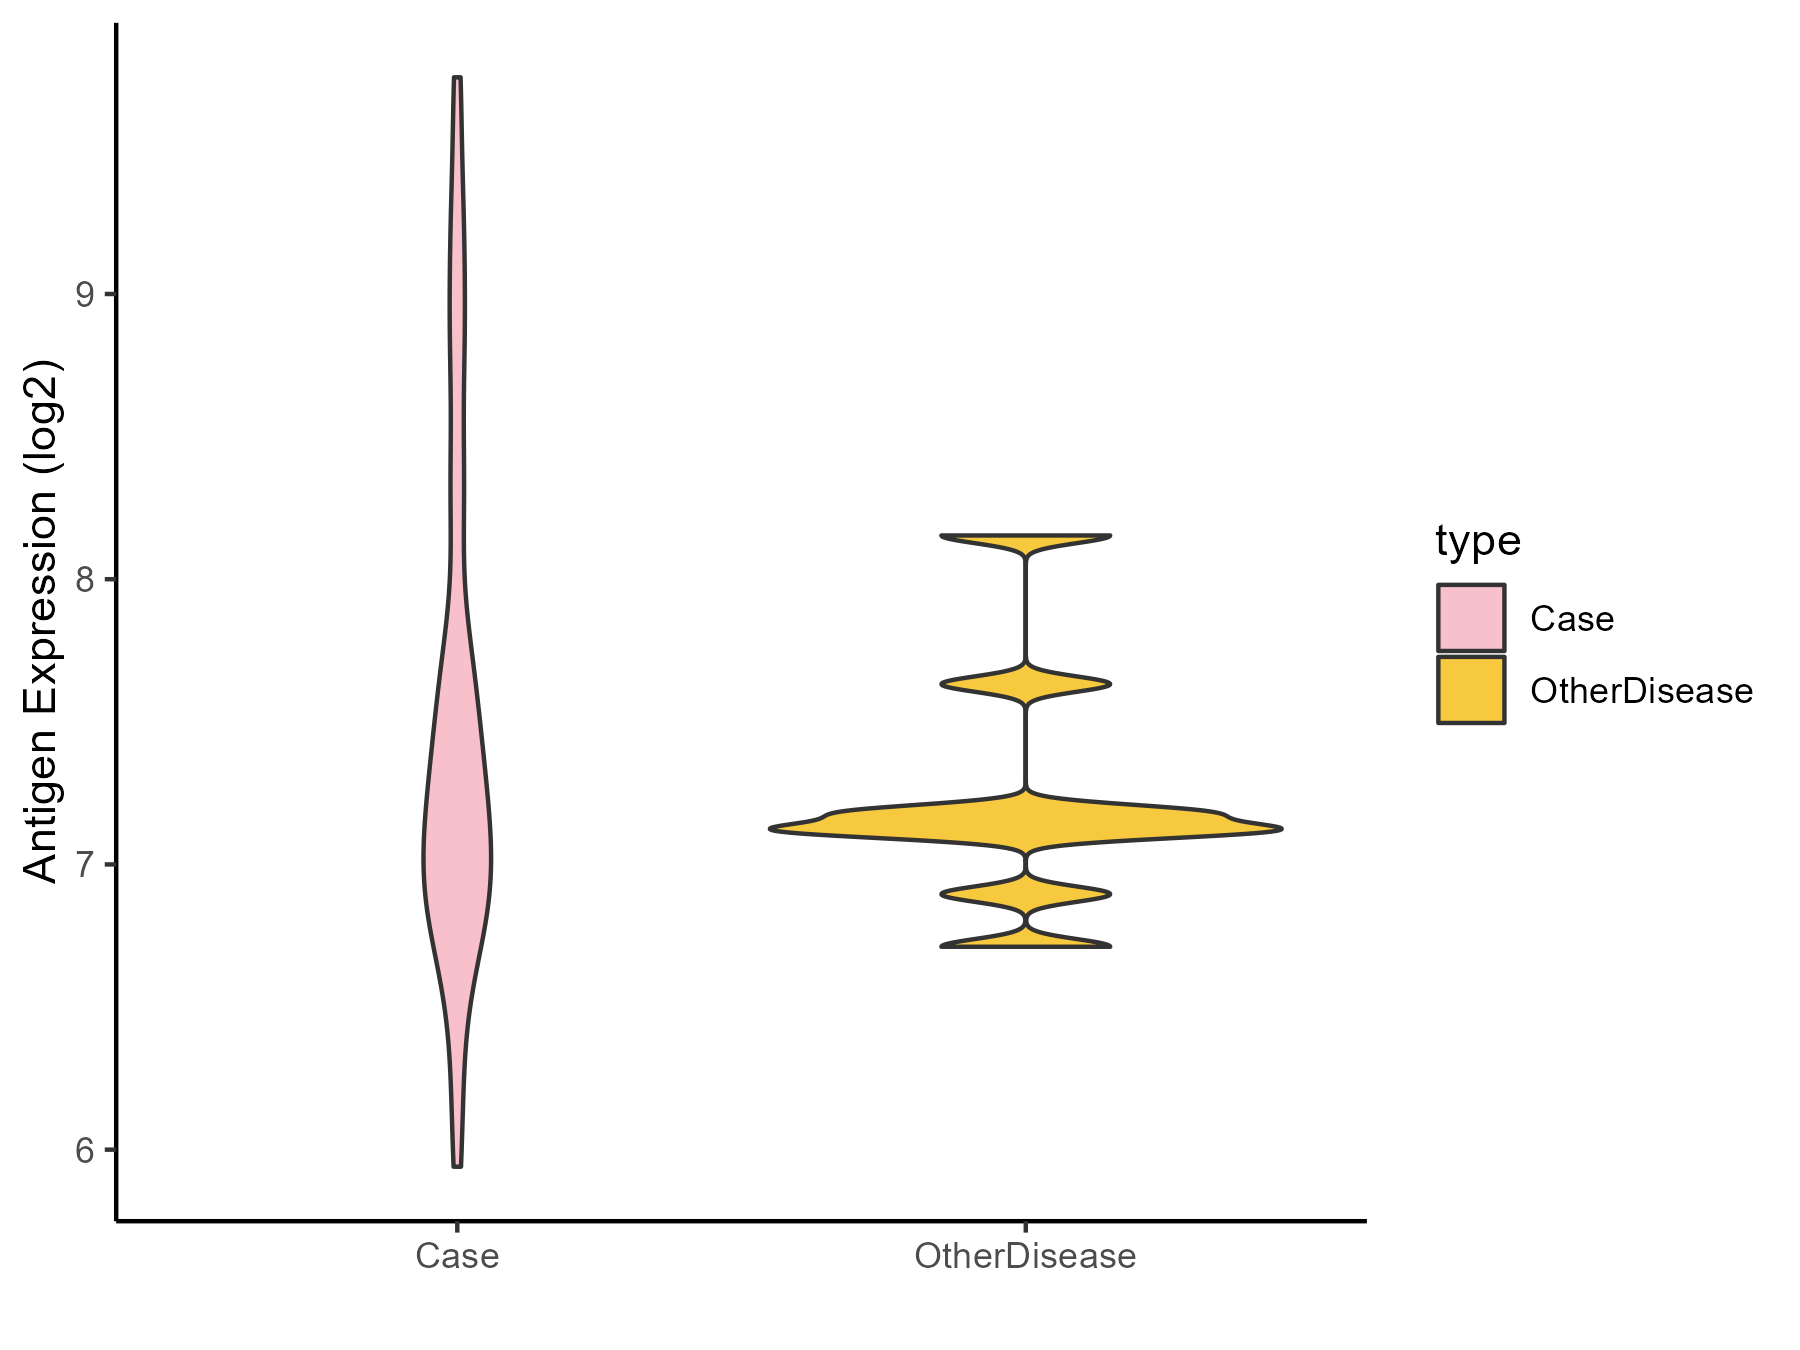
| Differential expression pattern of antigen in diseases | ||
| The Studied Tissue | Adrenal cortex | |
| The Specific Disease | Adrenocortical carcinoma | |
| The Expression Level of Disease Section Compare with the Other Disease Section | p-value: 0.059838431; Fold-change: 0.147815417; Z-score: 0.359722368 | |
| Disease-specific Antigen Abundances |
|
Click to View the Clearer Original Diagram |
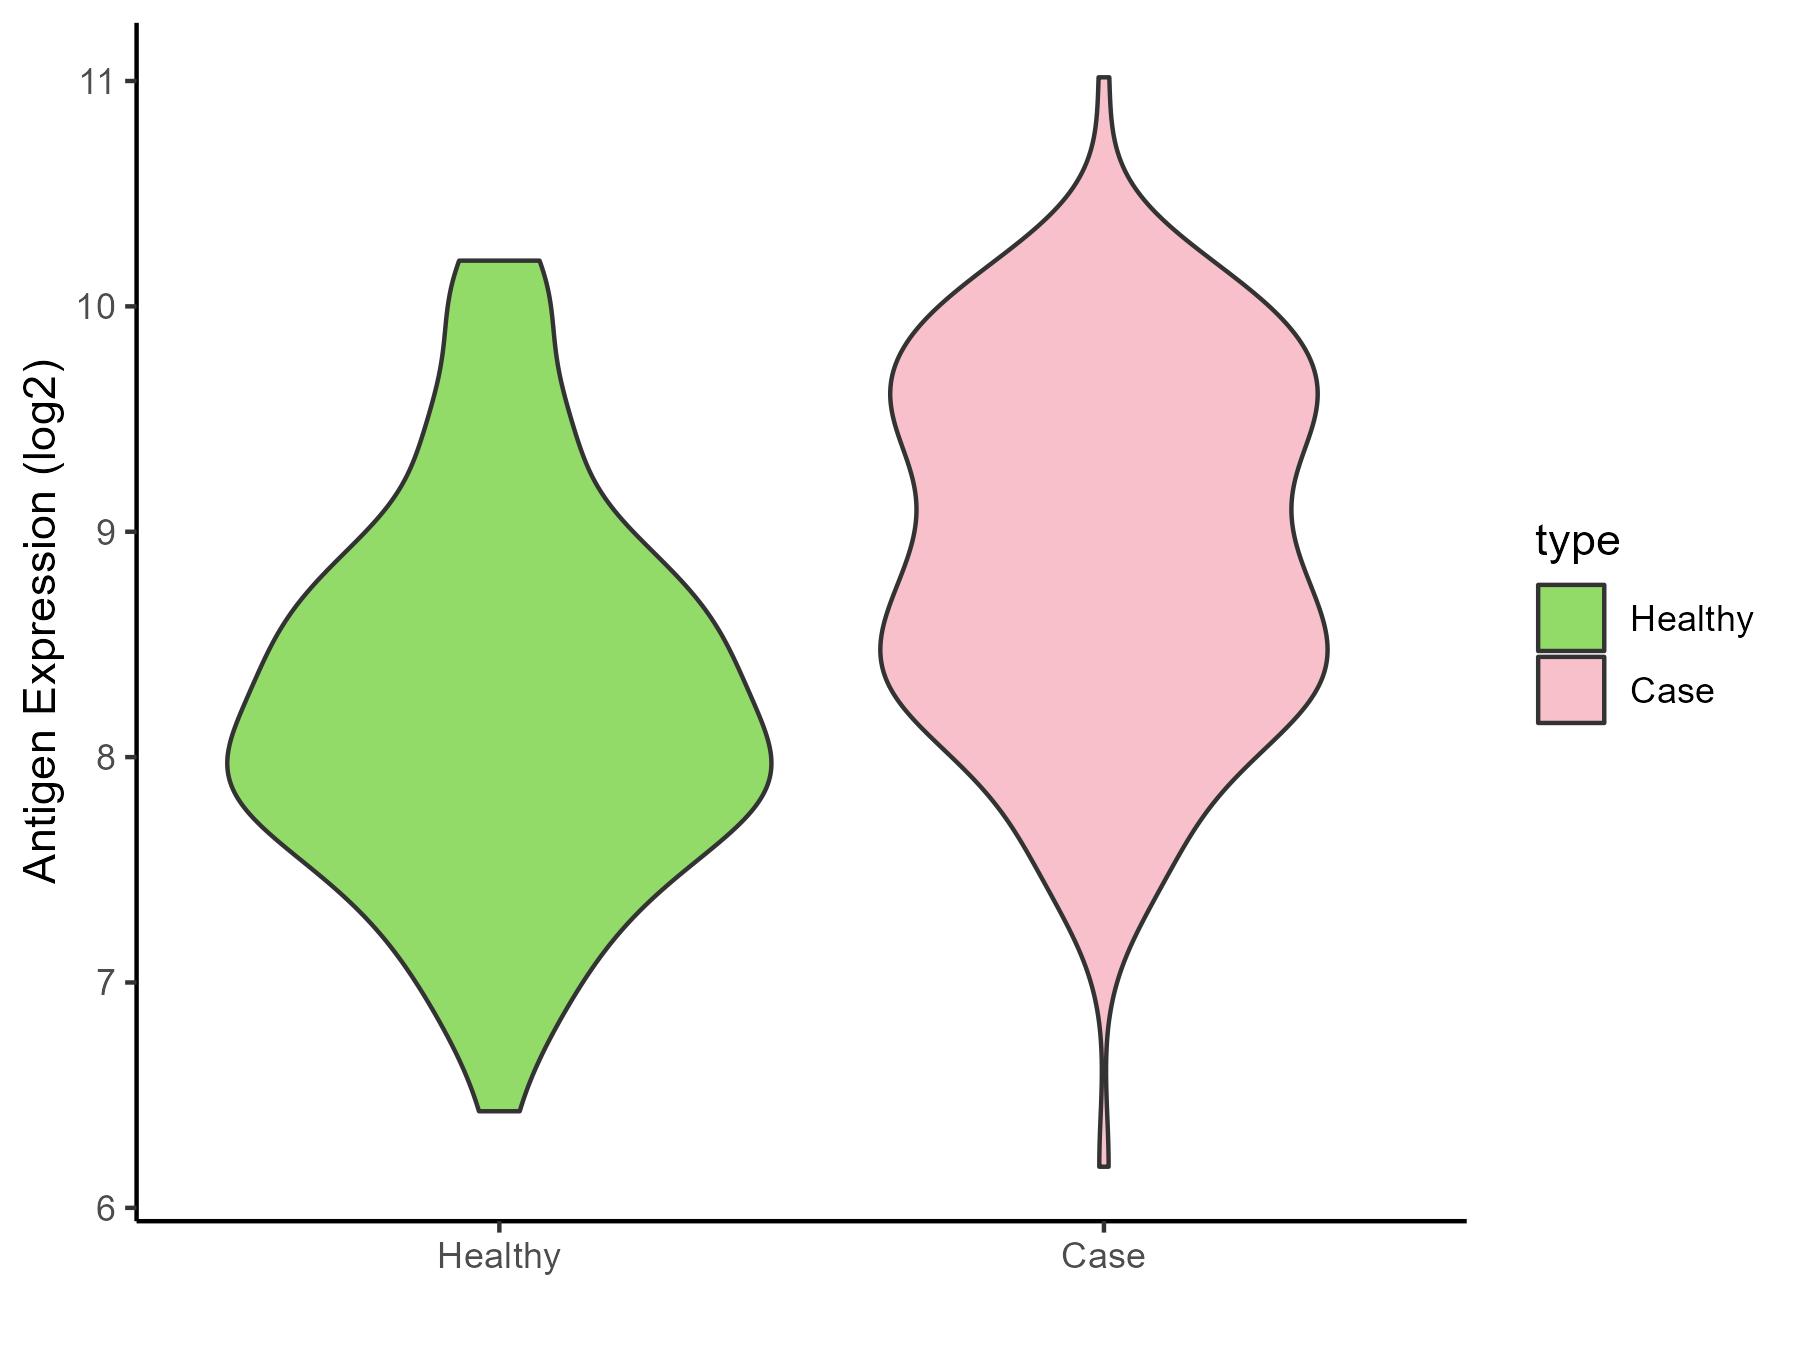
| Differential expression pattern of antigen in diseases | ||
| The Studied Tissue | Head and neck | |
| The Specific Disease | Head and neck cancer | |
| The Expression Level of Disease Section Compare with the Healthy Individual Tissue | p-value: 2.19E-09; Fold-change: 0.750045914; Z-score: 0.921813526 | |
| Disease-specific Antigen Abundances |
|
Click to View the Clearer Original Diagram |
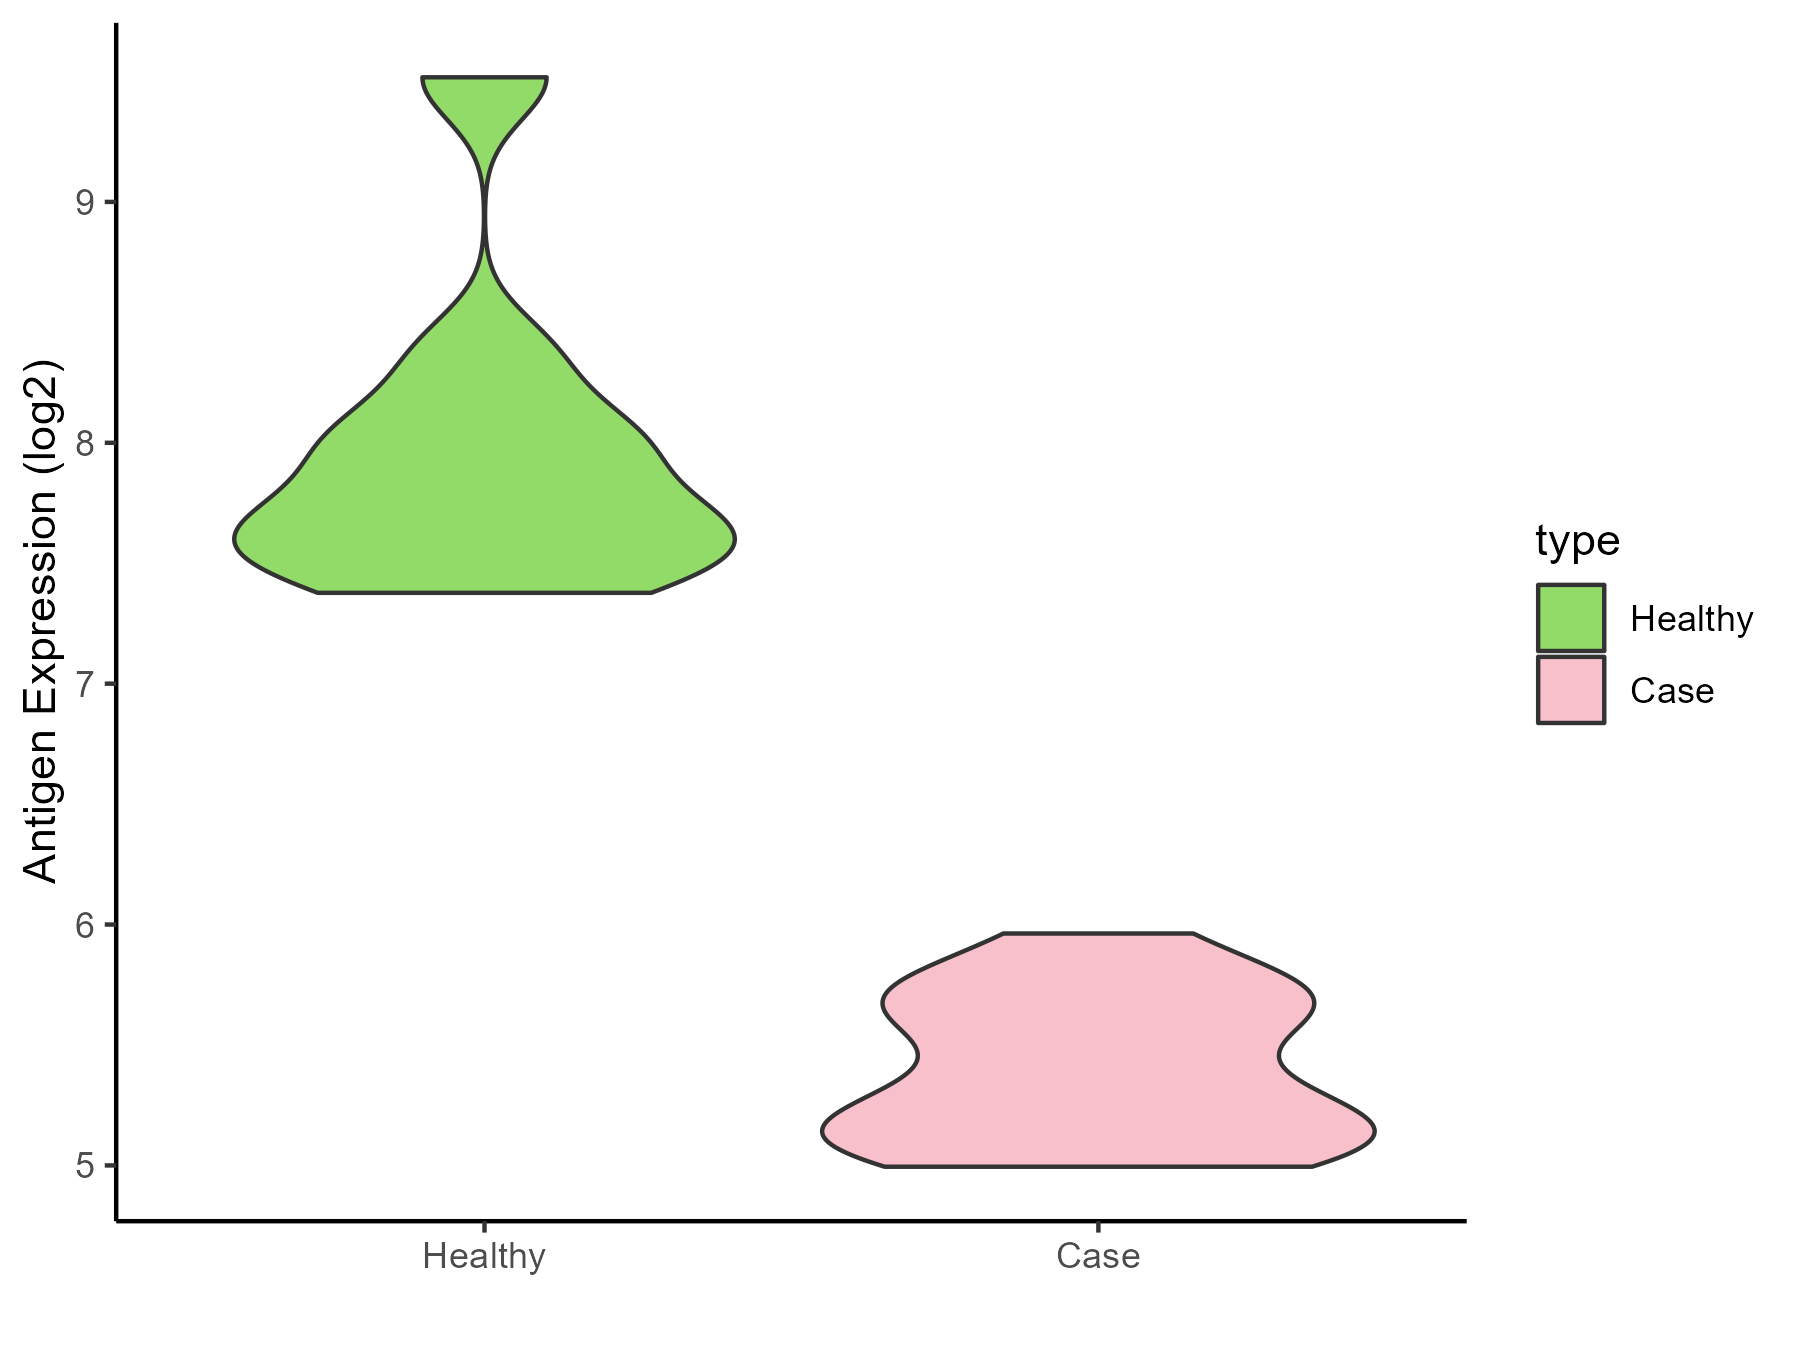
| Differential expression pattern of antigen in diseases | ||
| The Studied Tissue | Pituitary | |
| The Specific Disease | Pituitary gonadotrope tumor | |
| The Expression Level of Disease Section Compare with the Healthy Individual Tissue | p-value: 4.44E-07; Fold-change: -2.438840676; Z-score: -3.723984001 | |
| Disease-specific Antigen Abundances |
|
Click to View the Clearer Original Diagram |
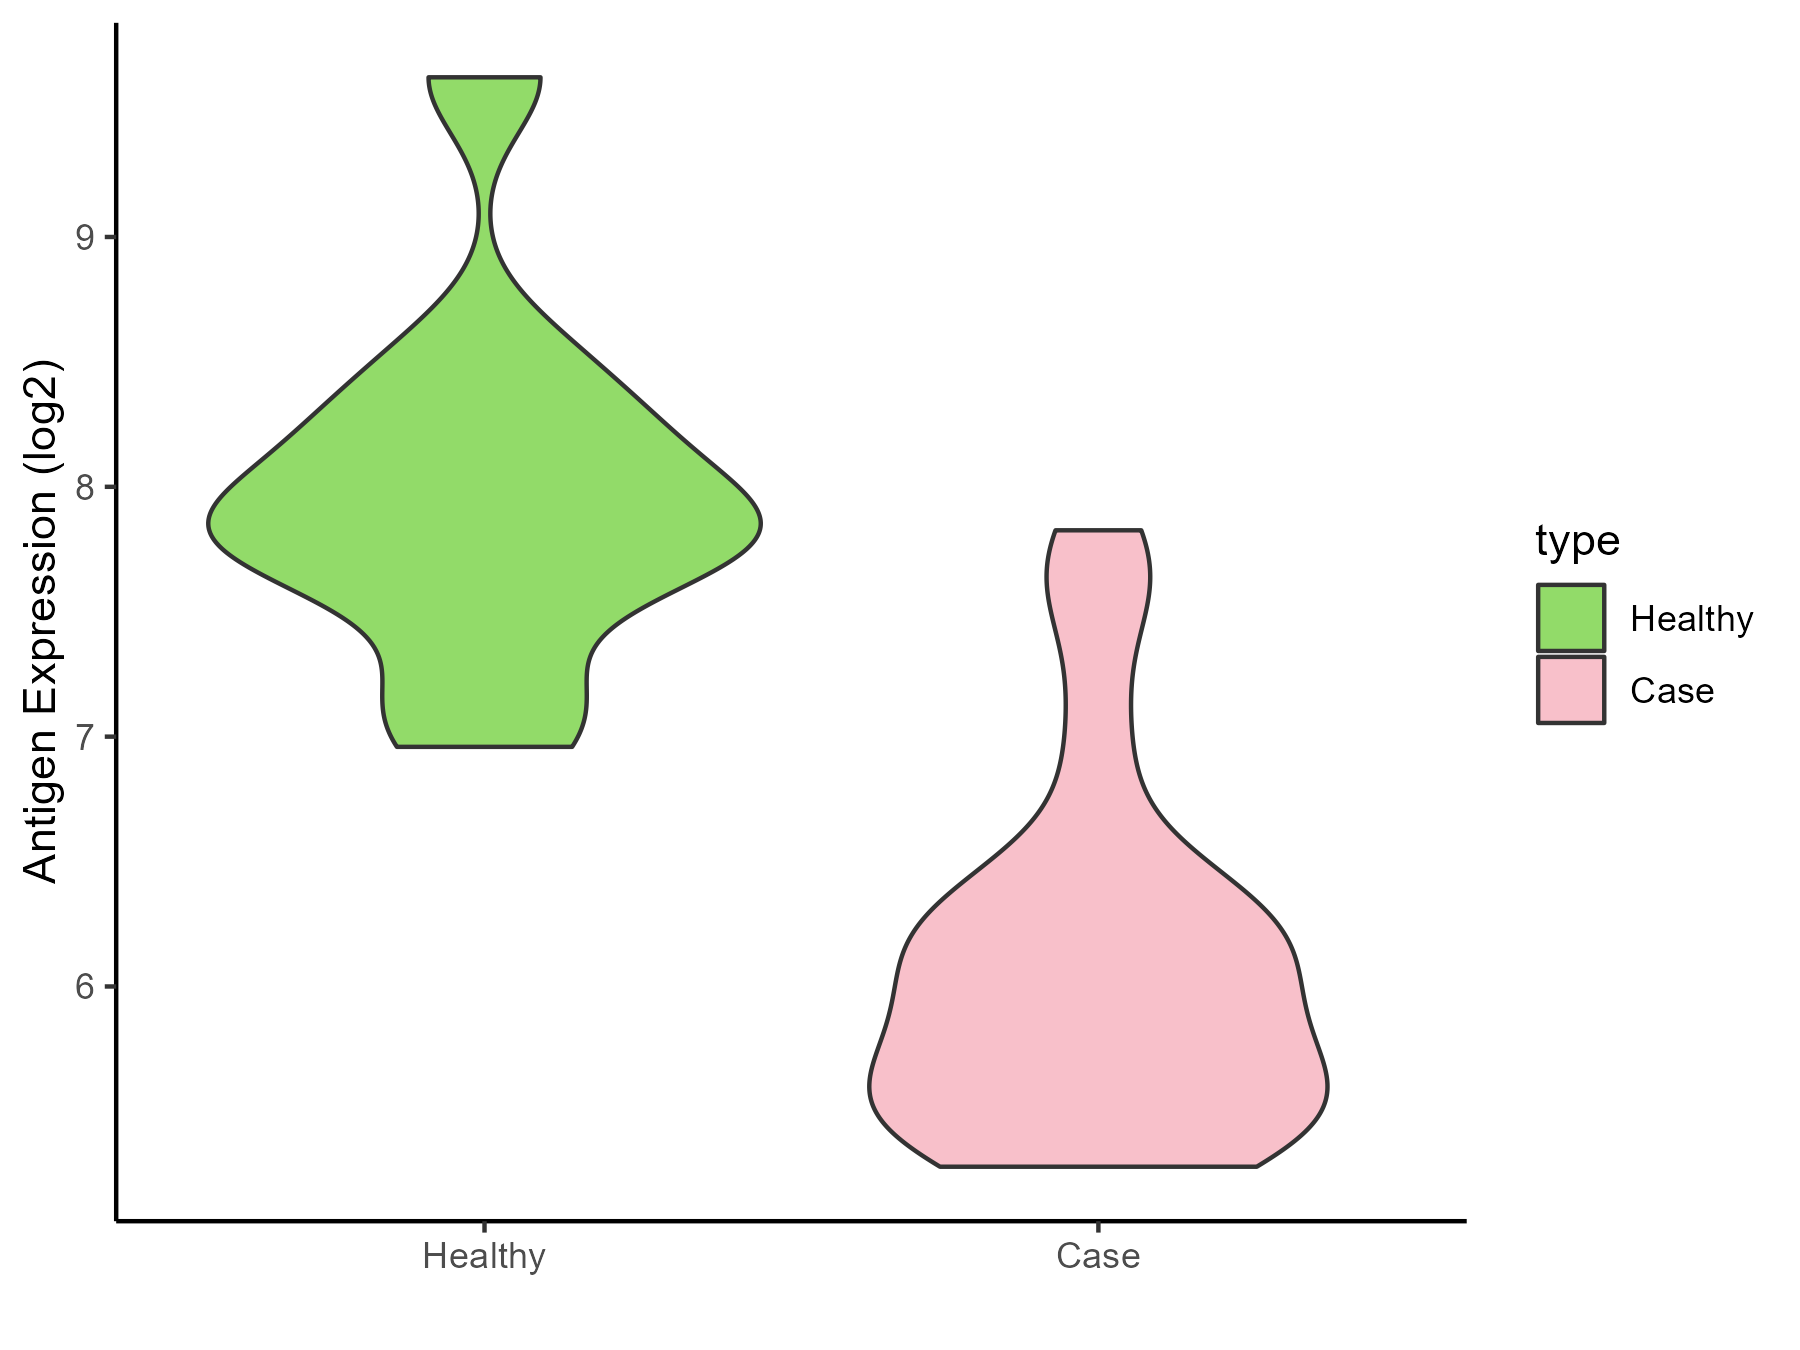
| The Studied Tissue | Pituitary | |
| The Specific Disease | Pituitary cancer | |
| The Expression Level of Disease Section Compare with the Healthy Individual Tissue | p-value: 5.42E-07; Fold-change: -1.926748846; Z-score: -2.708145116 | |
| Disease-specific Antigen Abundances |
|
Click to View the Clearer Original Diagram |
ICD Disease Classification 03
| Differential expression pattern of antigen in diseases | ||
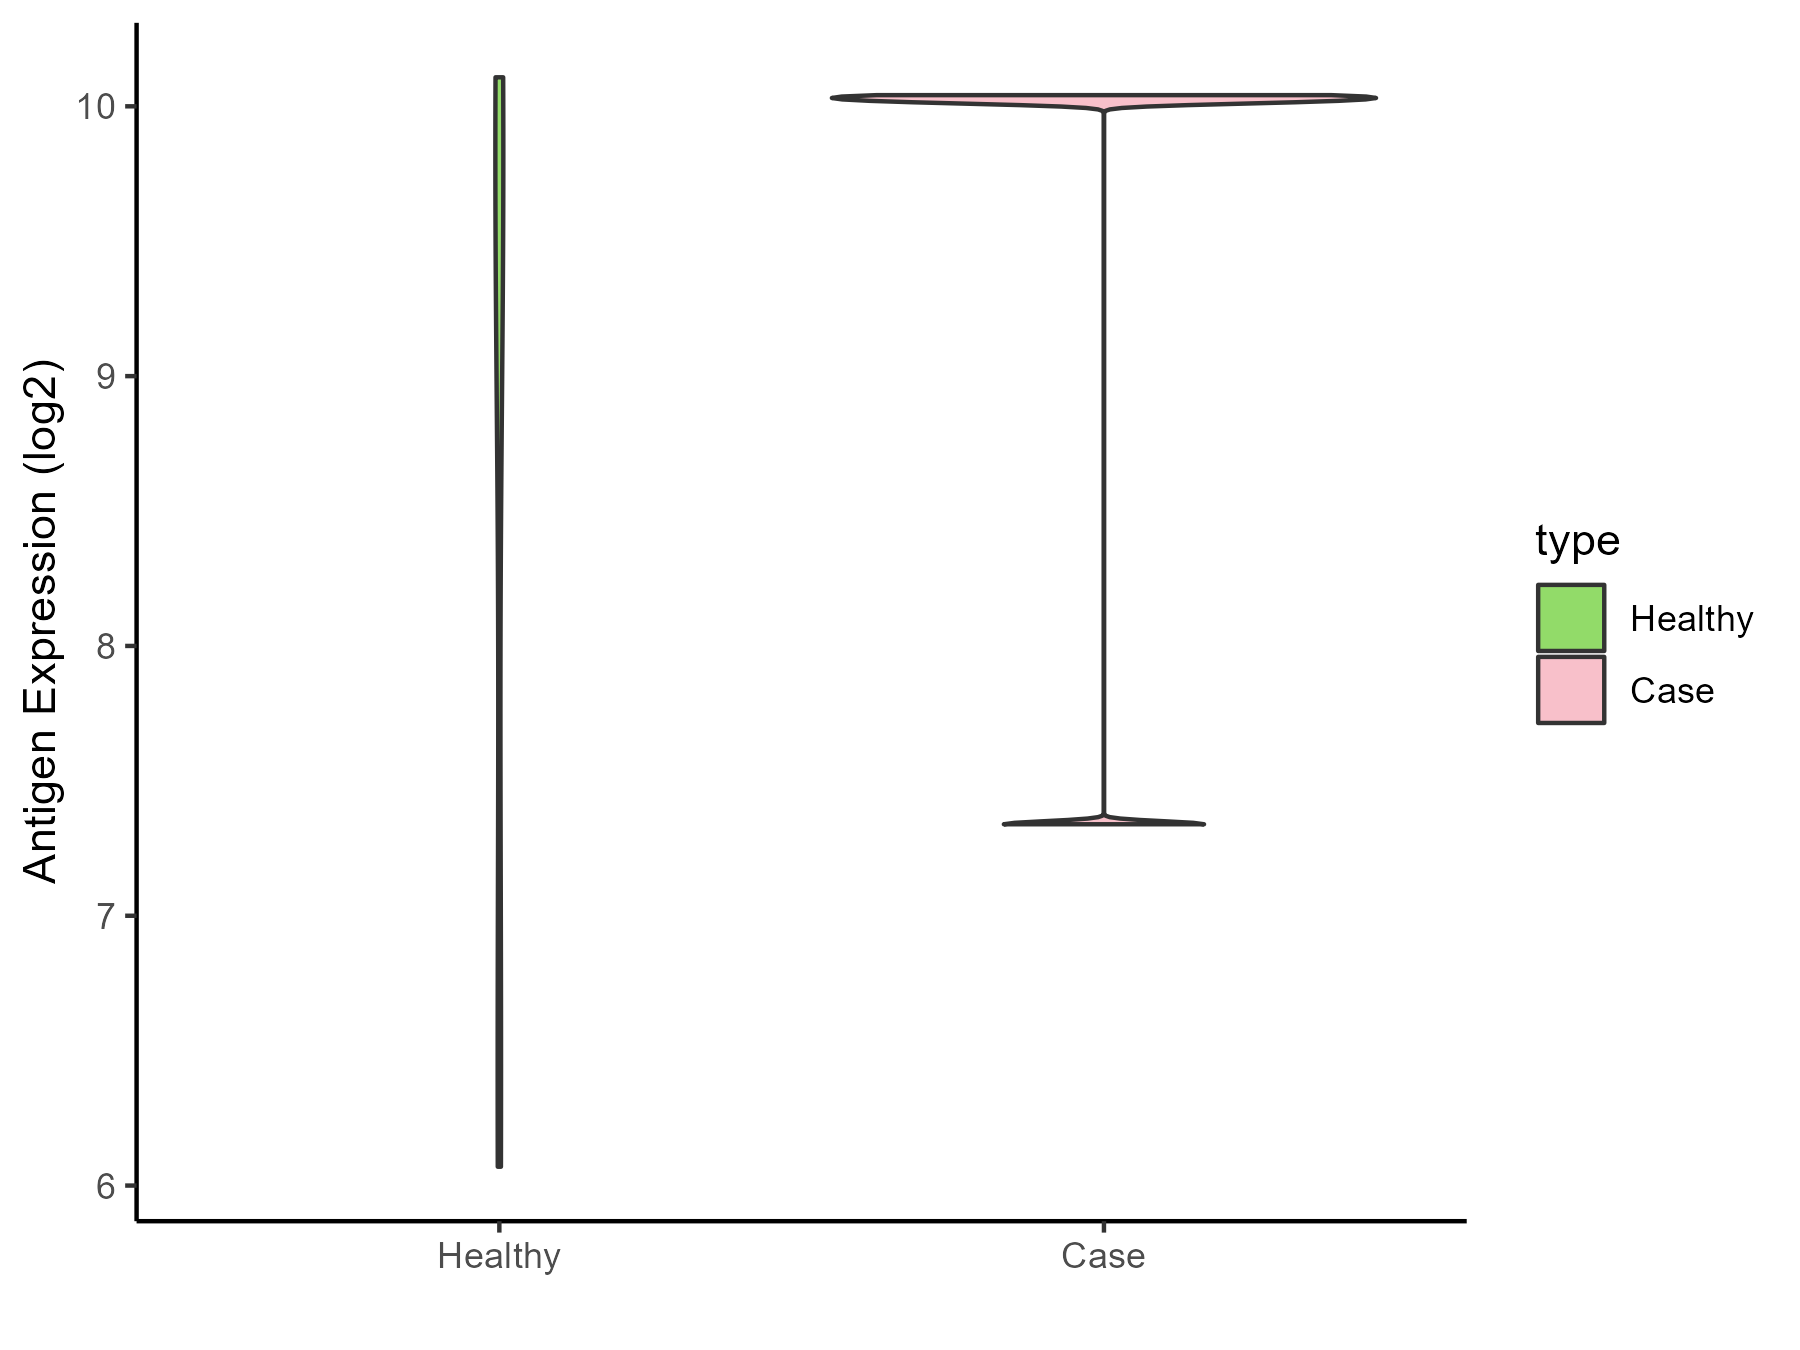
| The Studied Tissue | Whole blood | |
| The Specific Disease | Thrombocytopenia | |
| The Expression Level of Disease Section Compare with the Healthy Individual Tissue | p-value: 0.382167183; Fold-change: 0.298608157; Z-score: 0.178914817 | |
| Disease-specific Antigen Abundances |
|
Click to View the Clearer Original Diagram |
ICD Disease Classification 04
| Differential expression pattern of antigen in diseases | ||
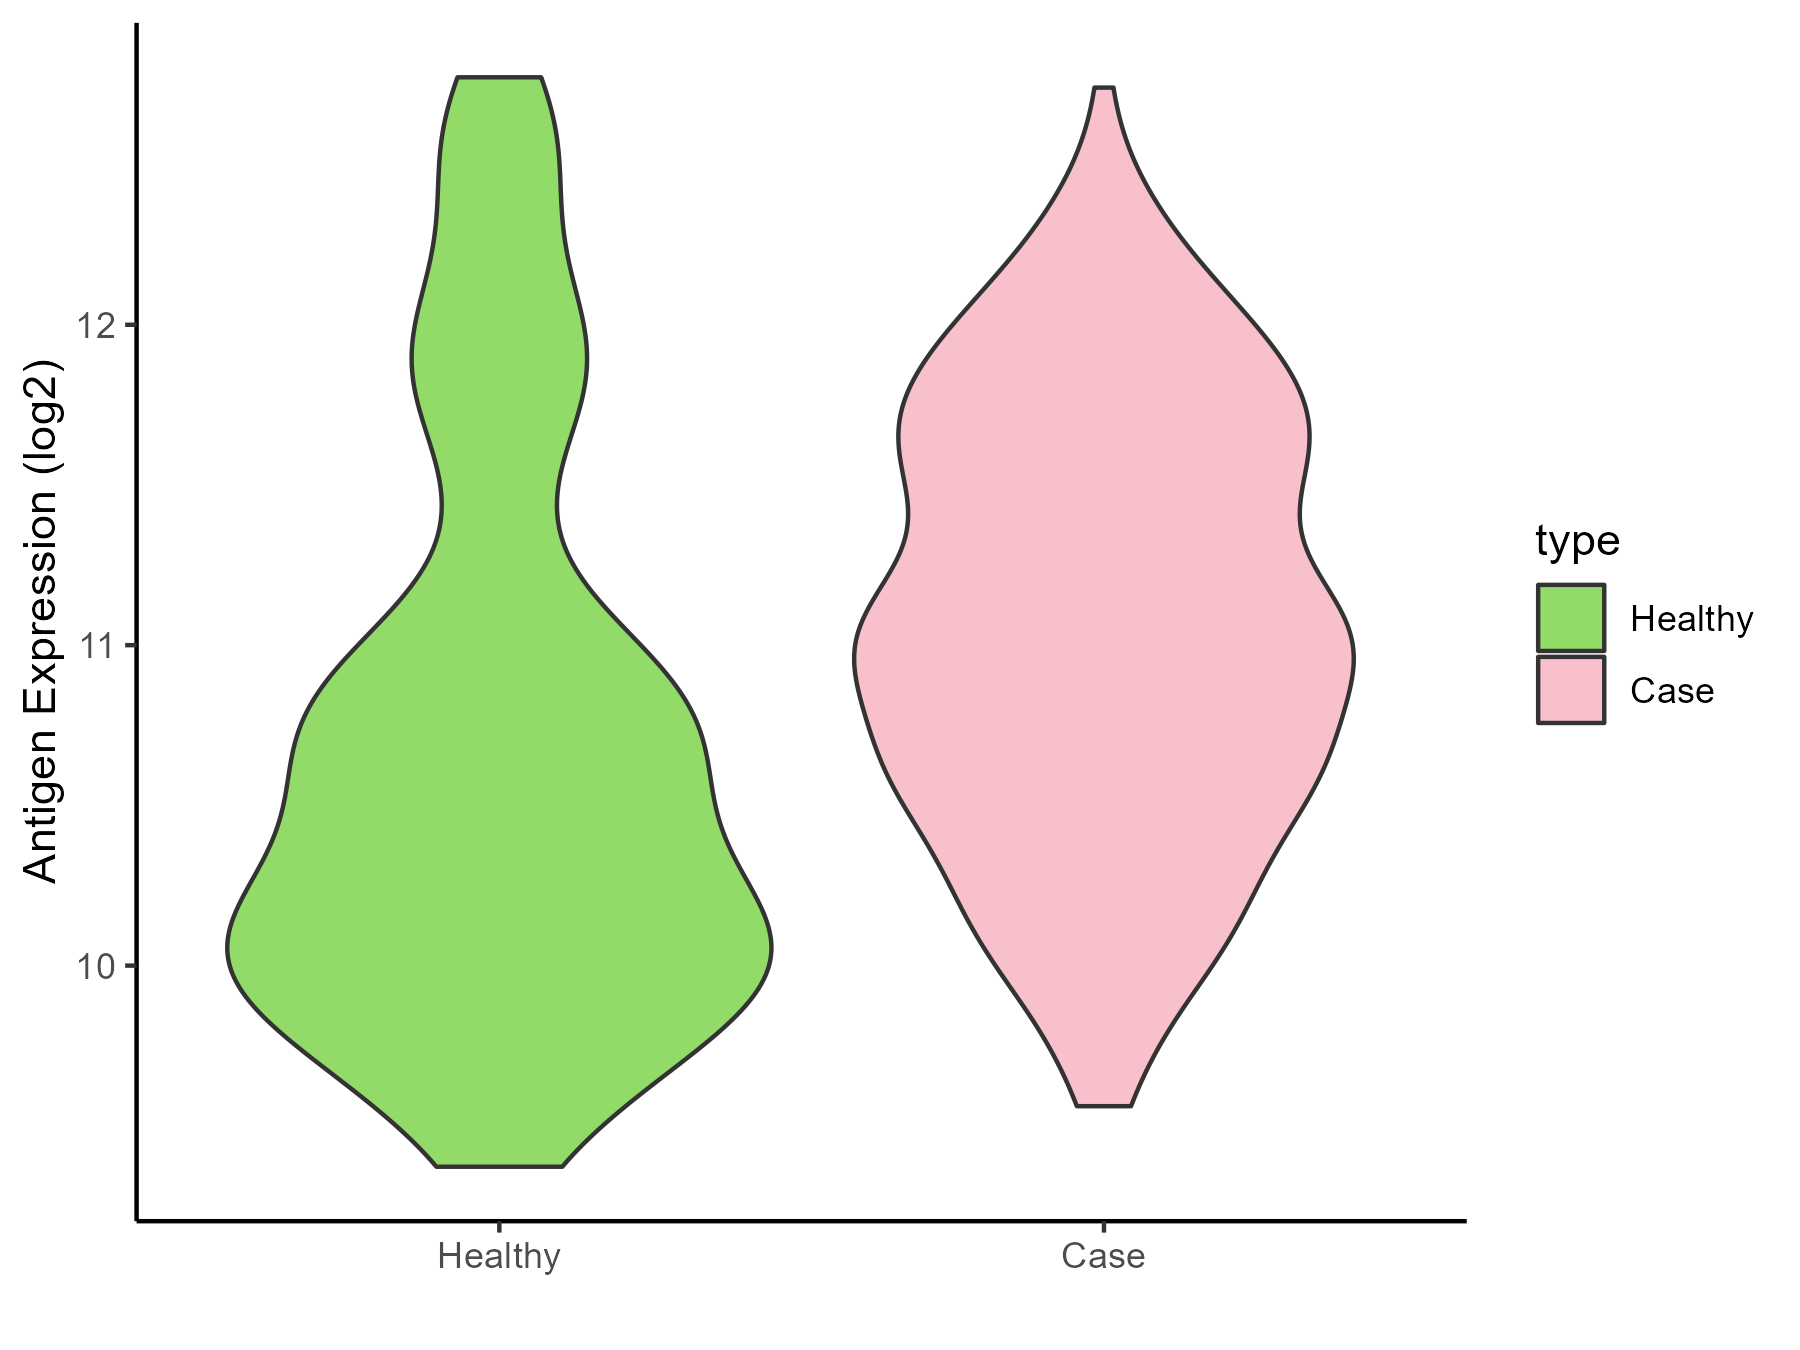
| The Studied Tissue | Whole blood | |
| The Specific Disease | Lupus erythematosus | |
| The Expression Level of Disease Section Compare with the Healthy Individual Tissue | p-value: 2.41E-05; Fold-change: 0.543331052; Z-score: 0.620626551 | |
| Disease-specific Antigen Abundances |
|
Click to View the Clearer Original Diagram |
| Differential expression pattern of antigen in diseases | ||
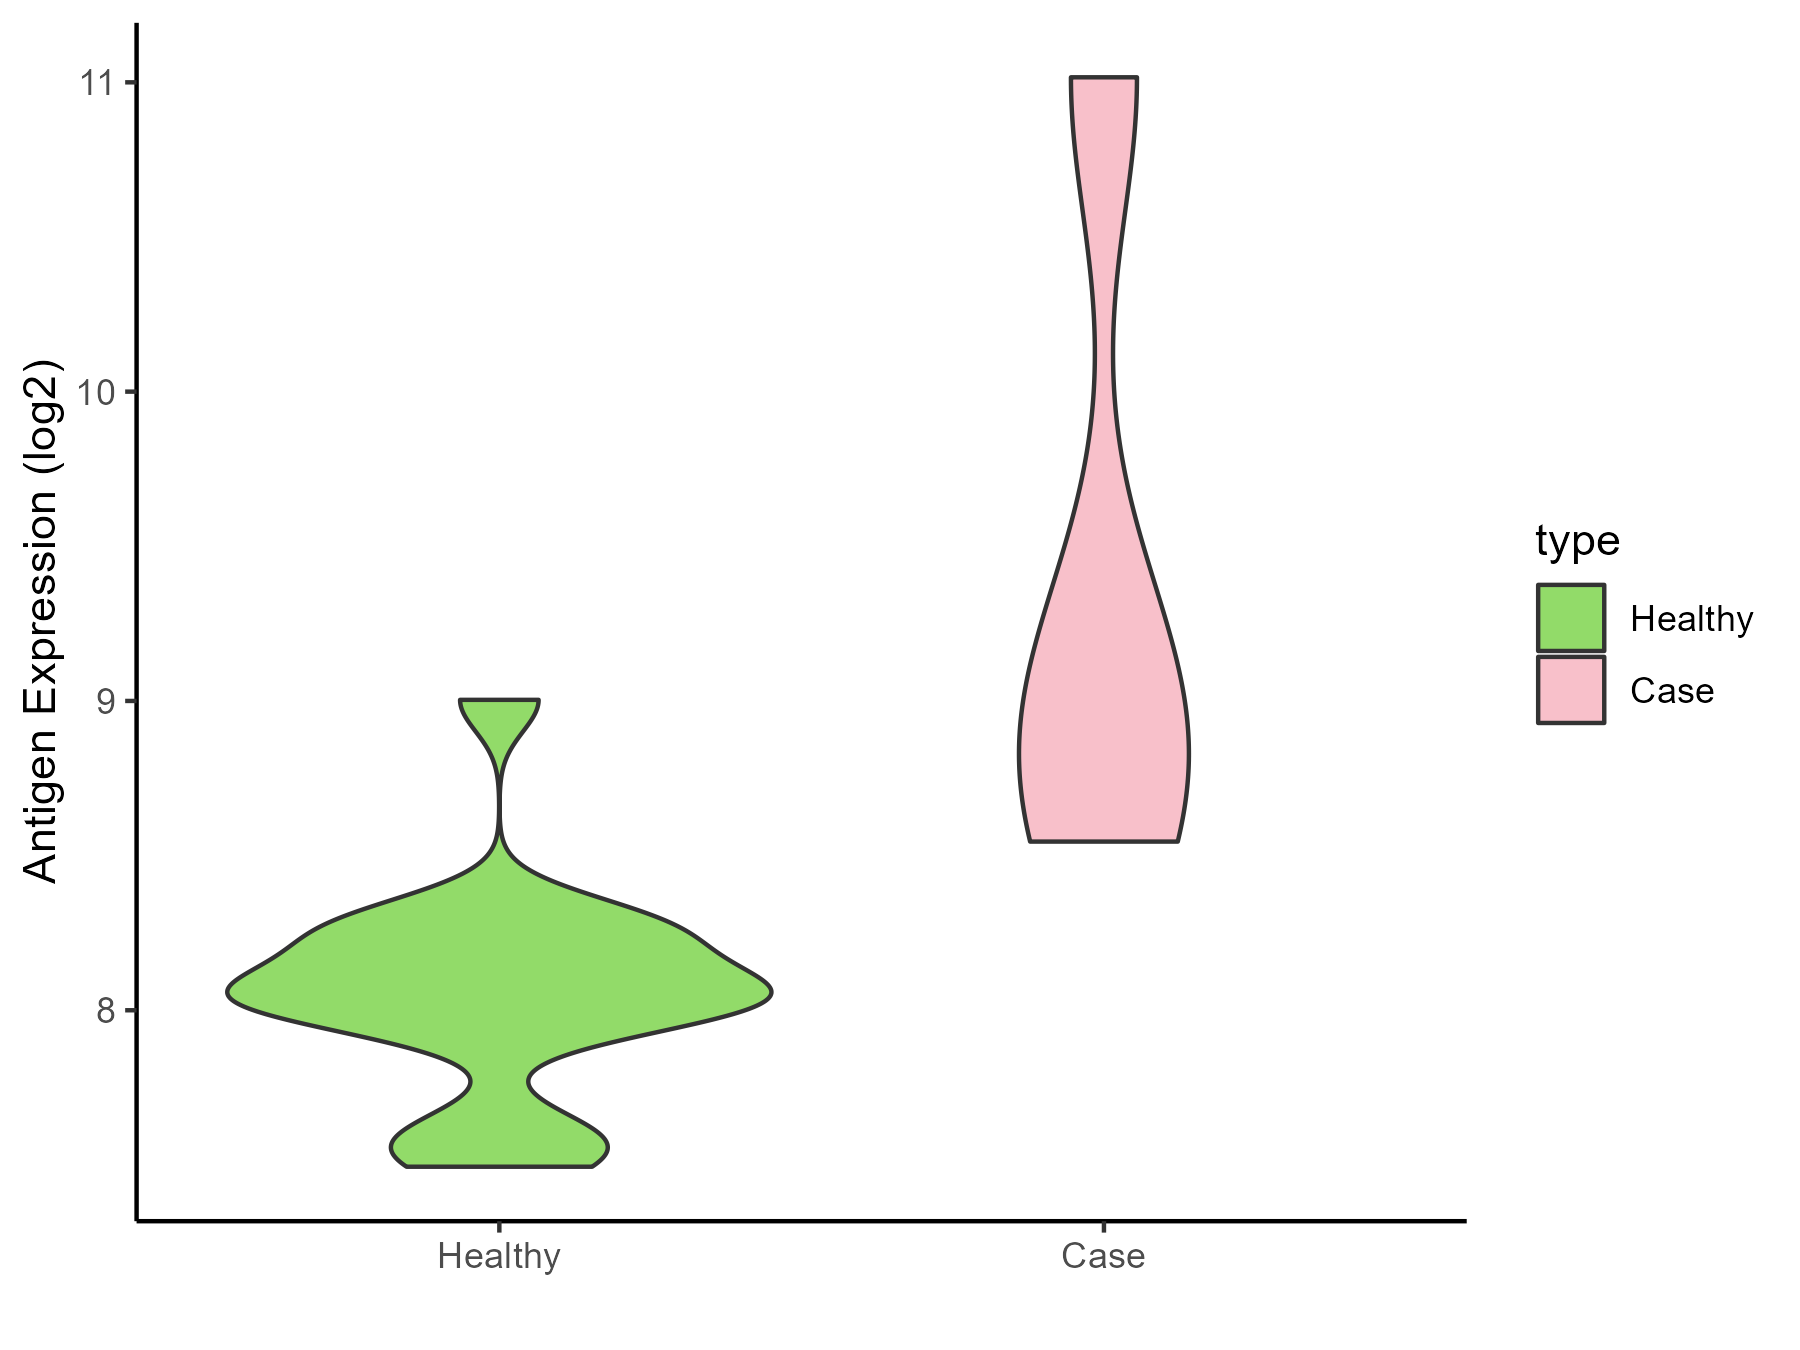
| The Studied Tissue | Peripheral monocyte | |
| The Specific Disease | Autoimmune uveitis | |
| The Expression Level of Disease Section Compare with the Healthy Individual Tissue | p-value: 0.097646107; Fold-change: 0.919882204; Z-score: 2.531293153 | |
| Disease-specific Antigen Abundances |
|
Click to View the Clearer Original Diagram |
ICD Disease Classification 05
| Differential expression pattern of antigen in diseases | ||
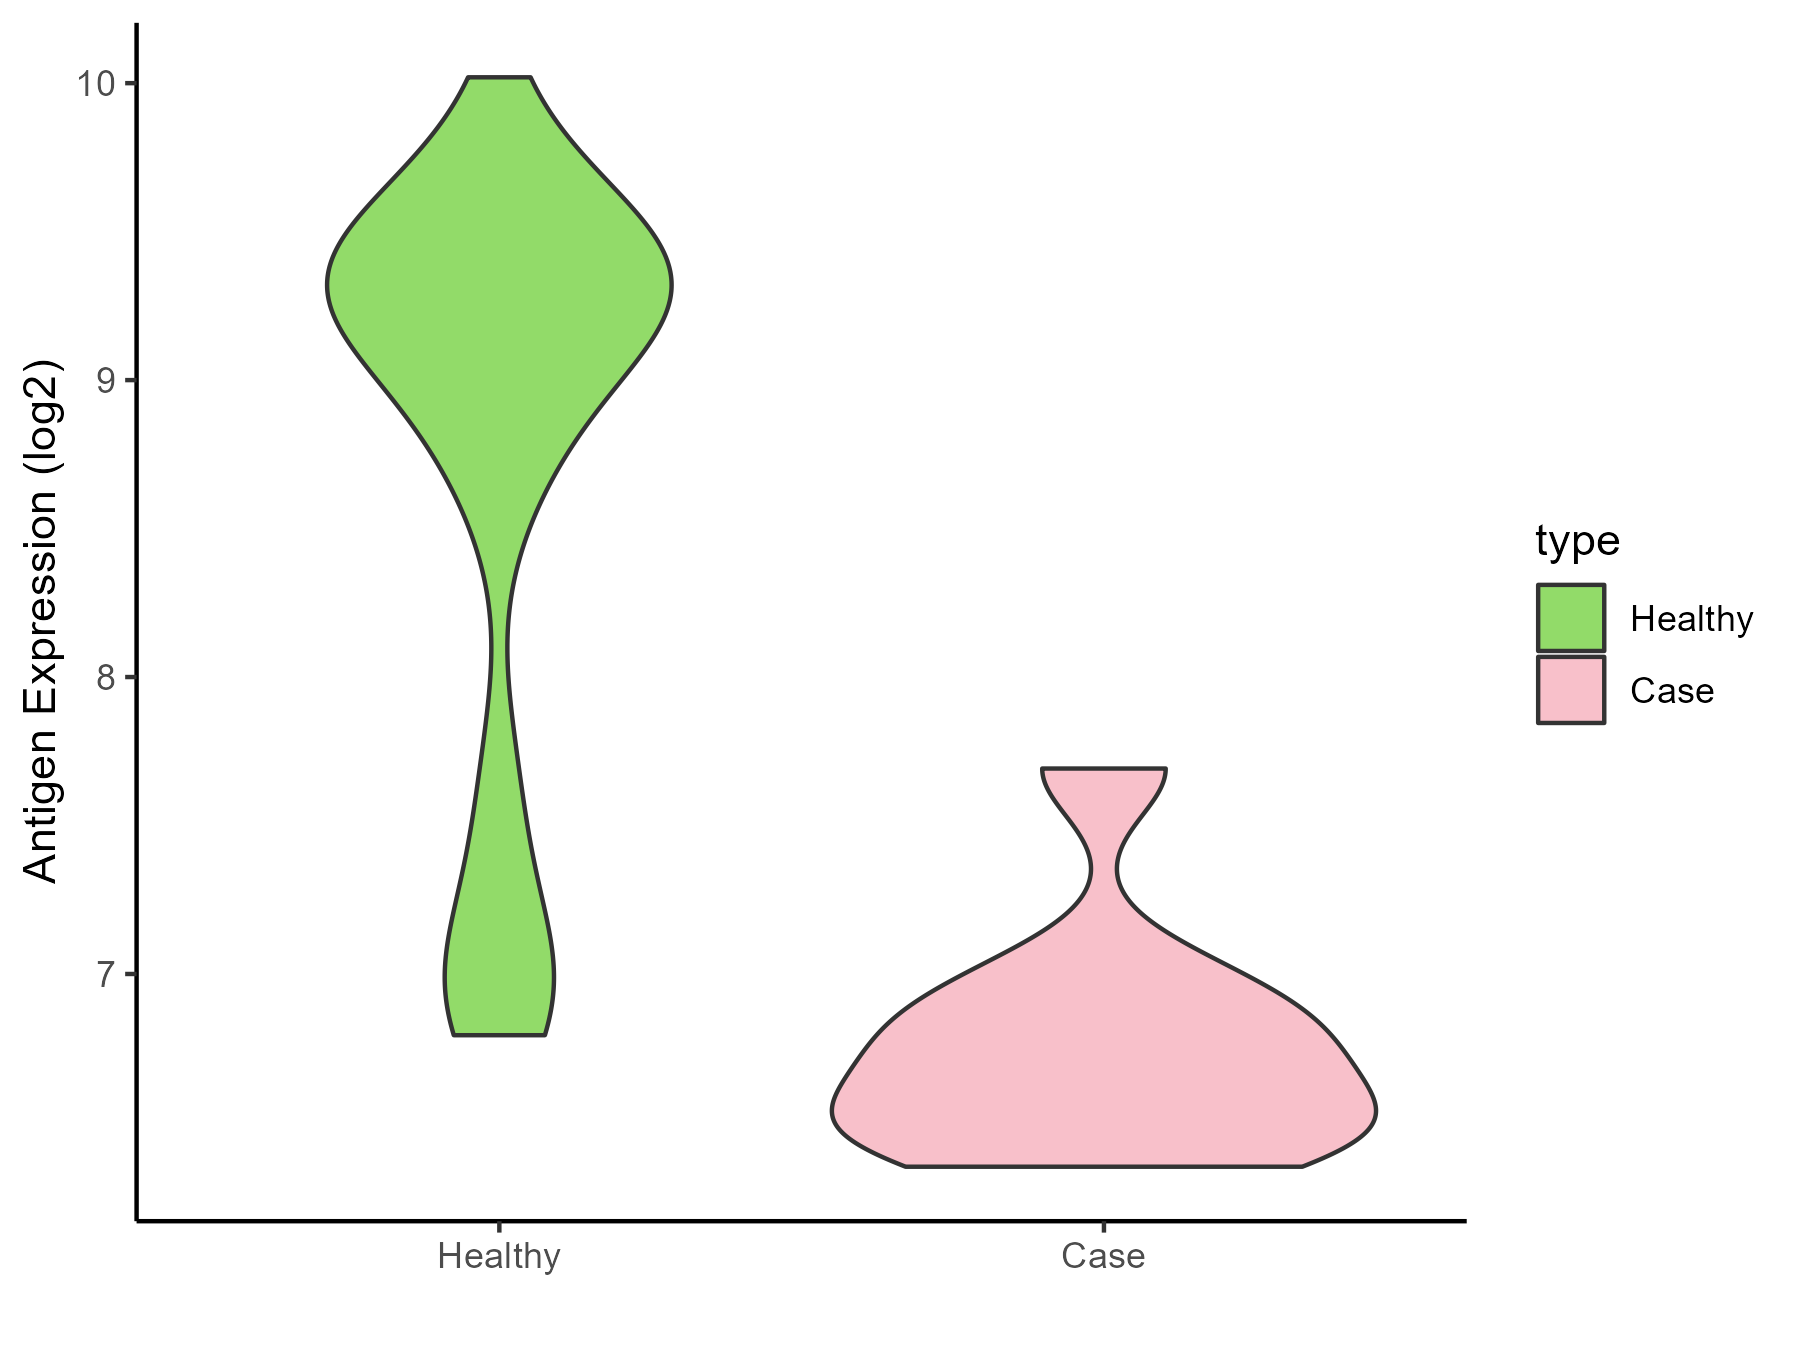
| The Studied Tissue | Whole blood | |
| The Specific Disease | Familial hypercholesterolemia | |
| The Expression Level of Disease Section Compare with the Healthy Individual Tissue | p-value: 4.92E-11; Fold-change: -2.497276905; Z-score: -2.556376201 | |
| Disease-specific Antigen Abundances |
|
Click to View the Clearer Original Diagram |
ICD Disease Classification 06
| Differential expression pattern of antigen in diseases | ||
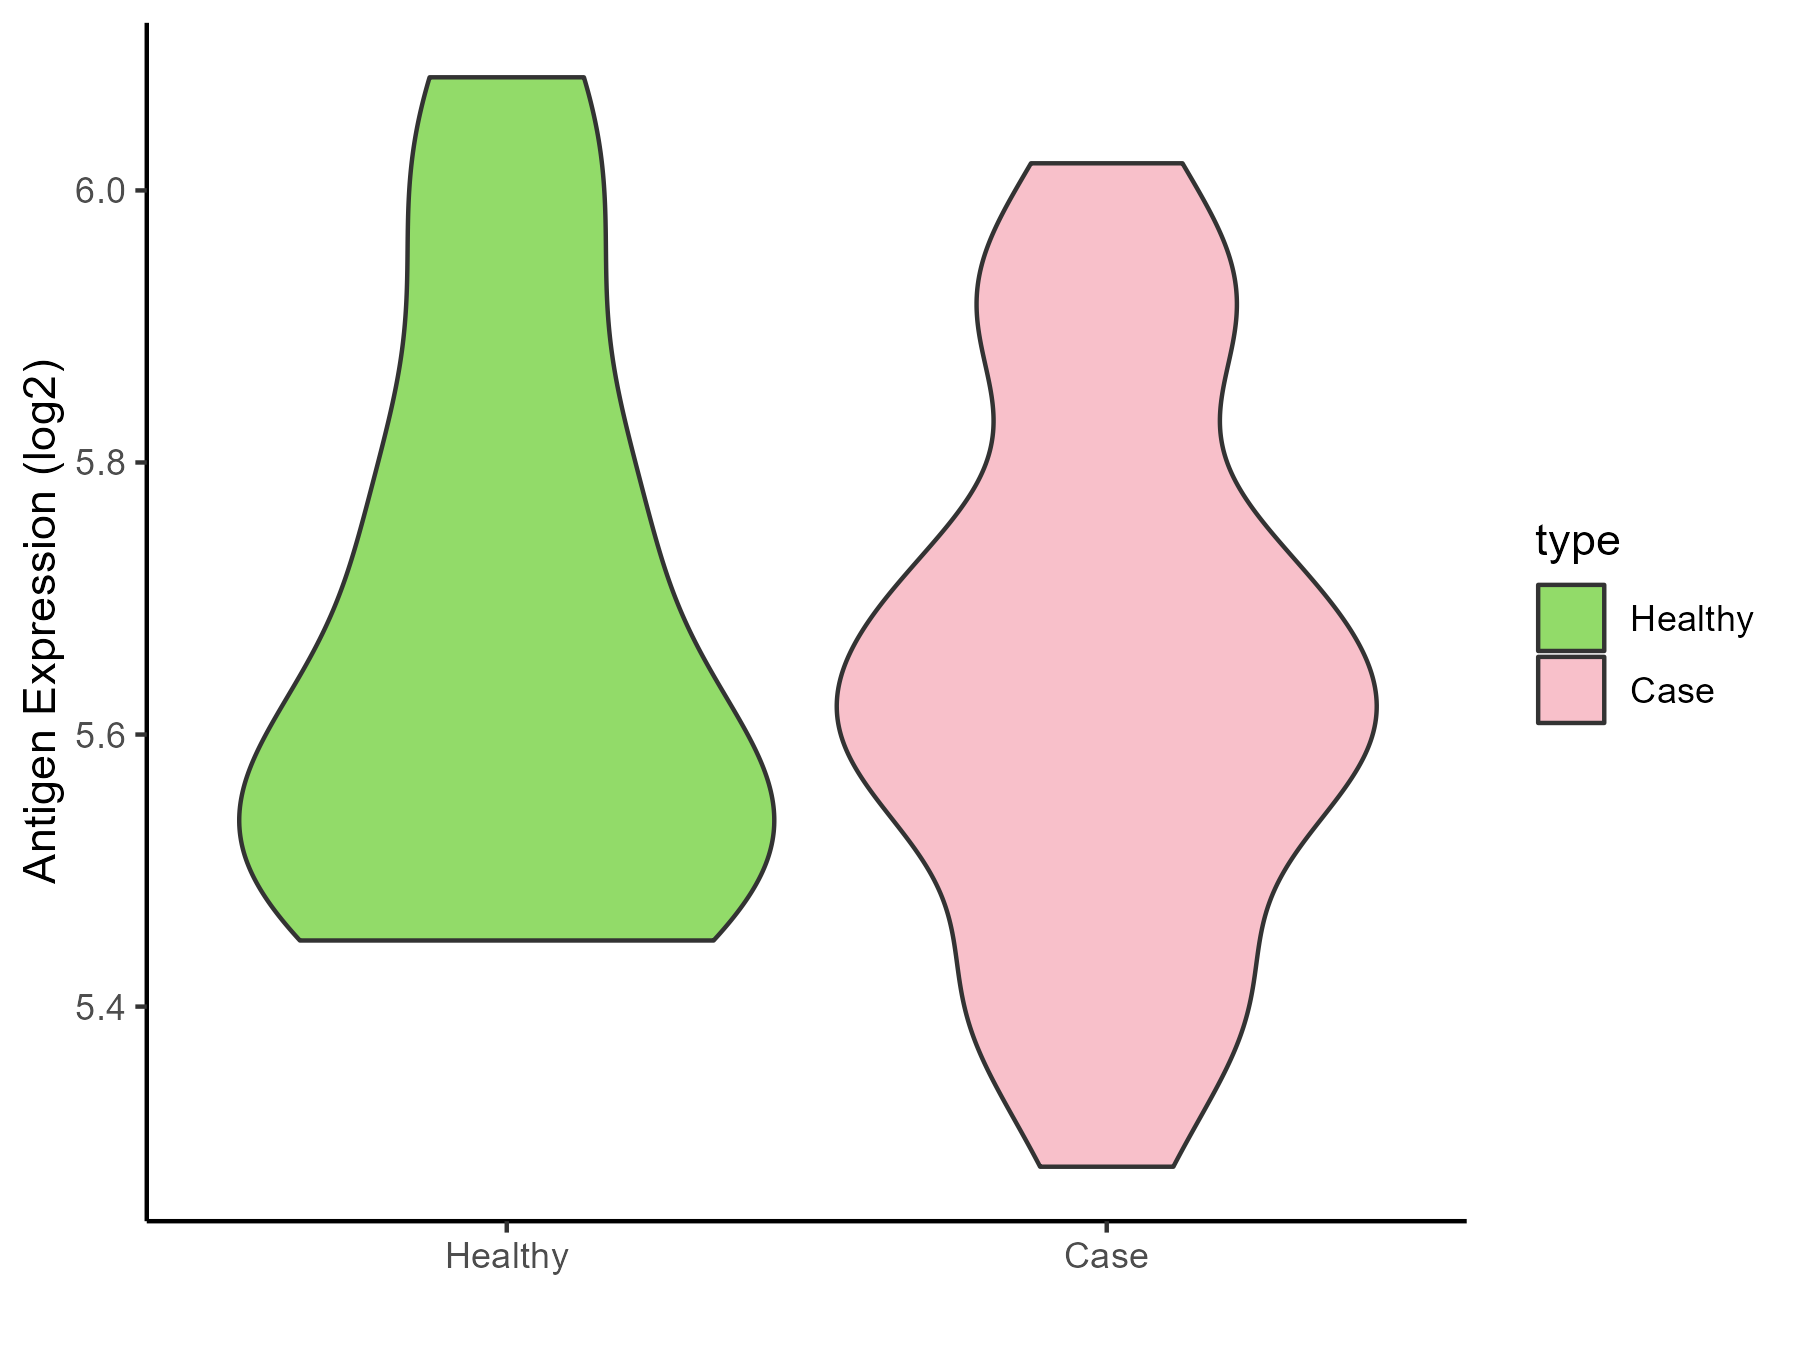
| The Studied Tissue | Superior temporal cortex | |
| The Specific Disease | Schizophrenia | |
| The Expression Level of Disease Section Compare with the Healthy Individual Tissue | p-value: 0.59437211; Fold-change: 0.031707574; Z-score: 0.152794803 | |
| Disease-specific Antigen Abundances |
|
Click to View the Clearer Original Diagram |
ICD Disease Classification 08
| Differential expression pattern of antigen in diseases | ||
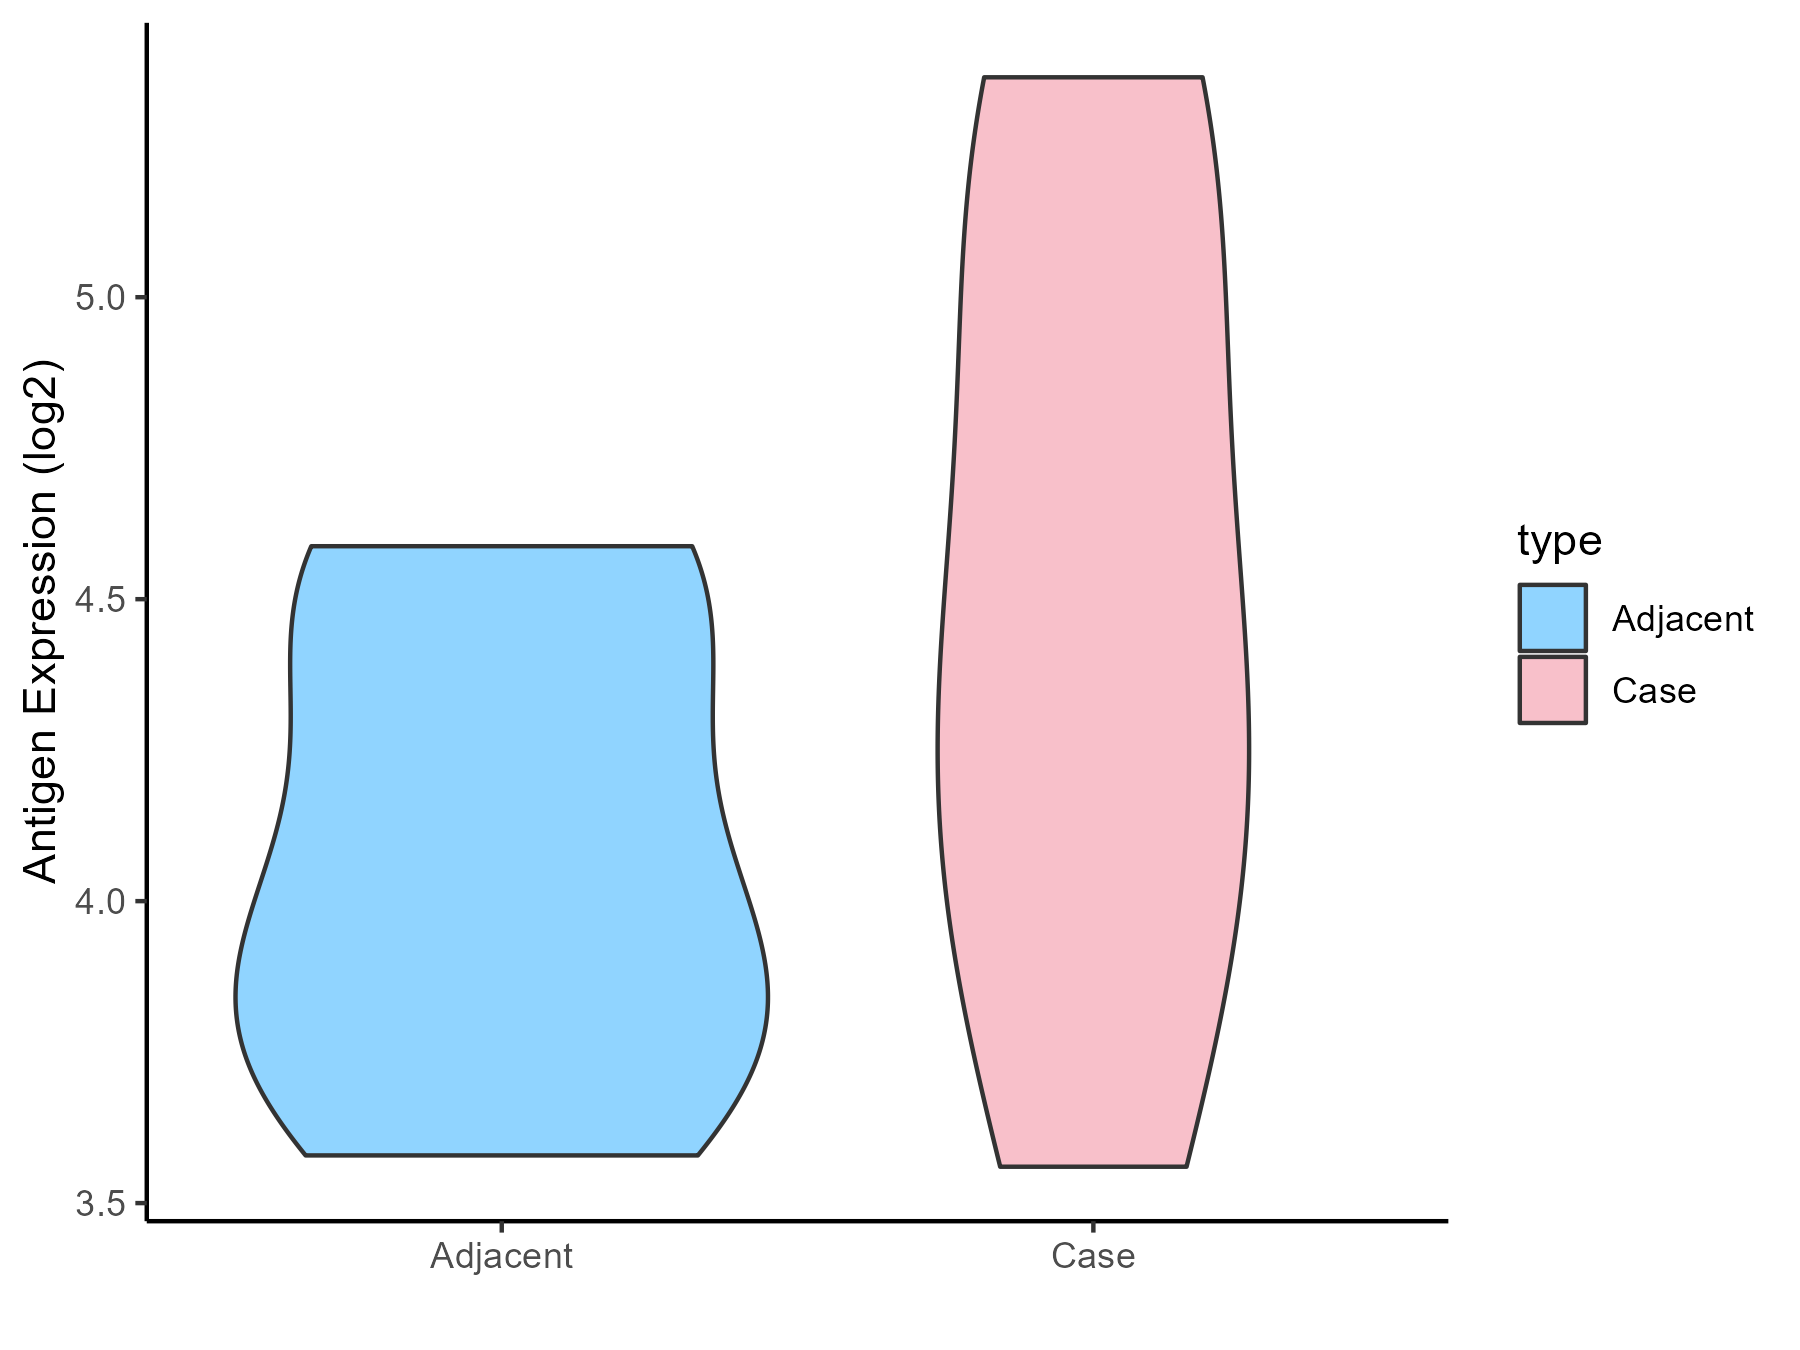
| The Studied Tissue | Spinal cord | |
| The Specific Disease | Multiple sclerosis | |
| The Expression Level of Disease Section Compare with the Adjacent Tissue | p-value: 0.188968433; Fold-change: 0.386483643; Z-score: 0.967153692 | |
| Disease-specific Antigen Abundances |
|
Click to View the Clearer Original Diagram |
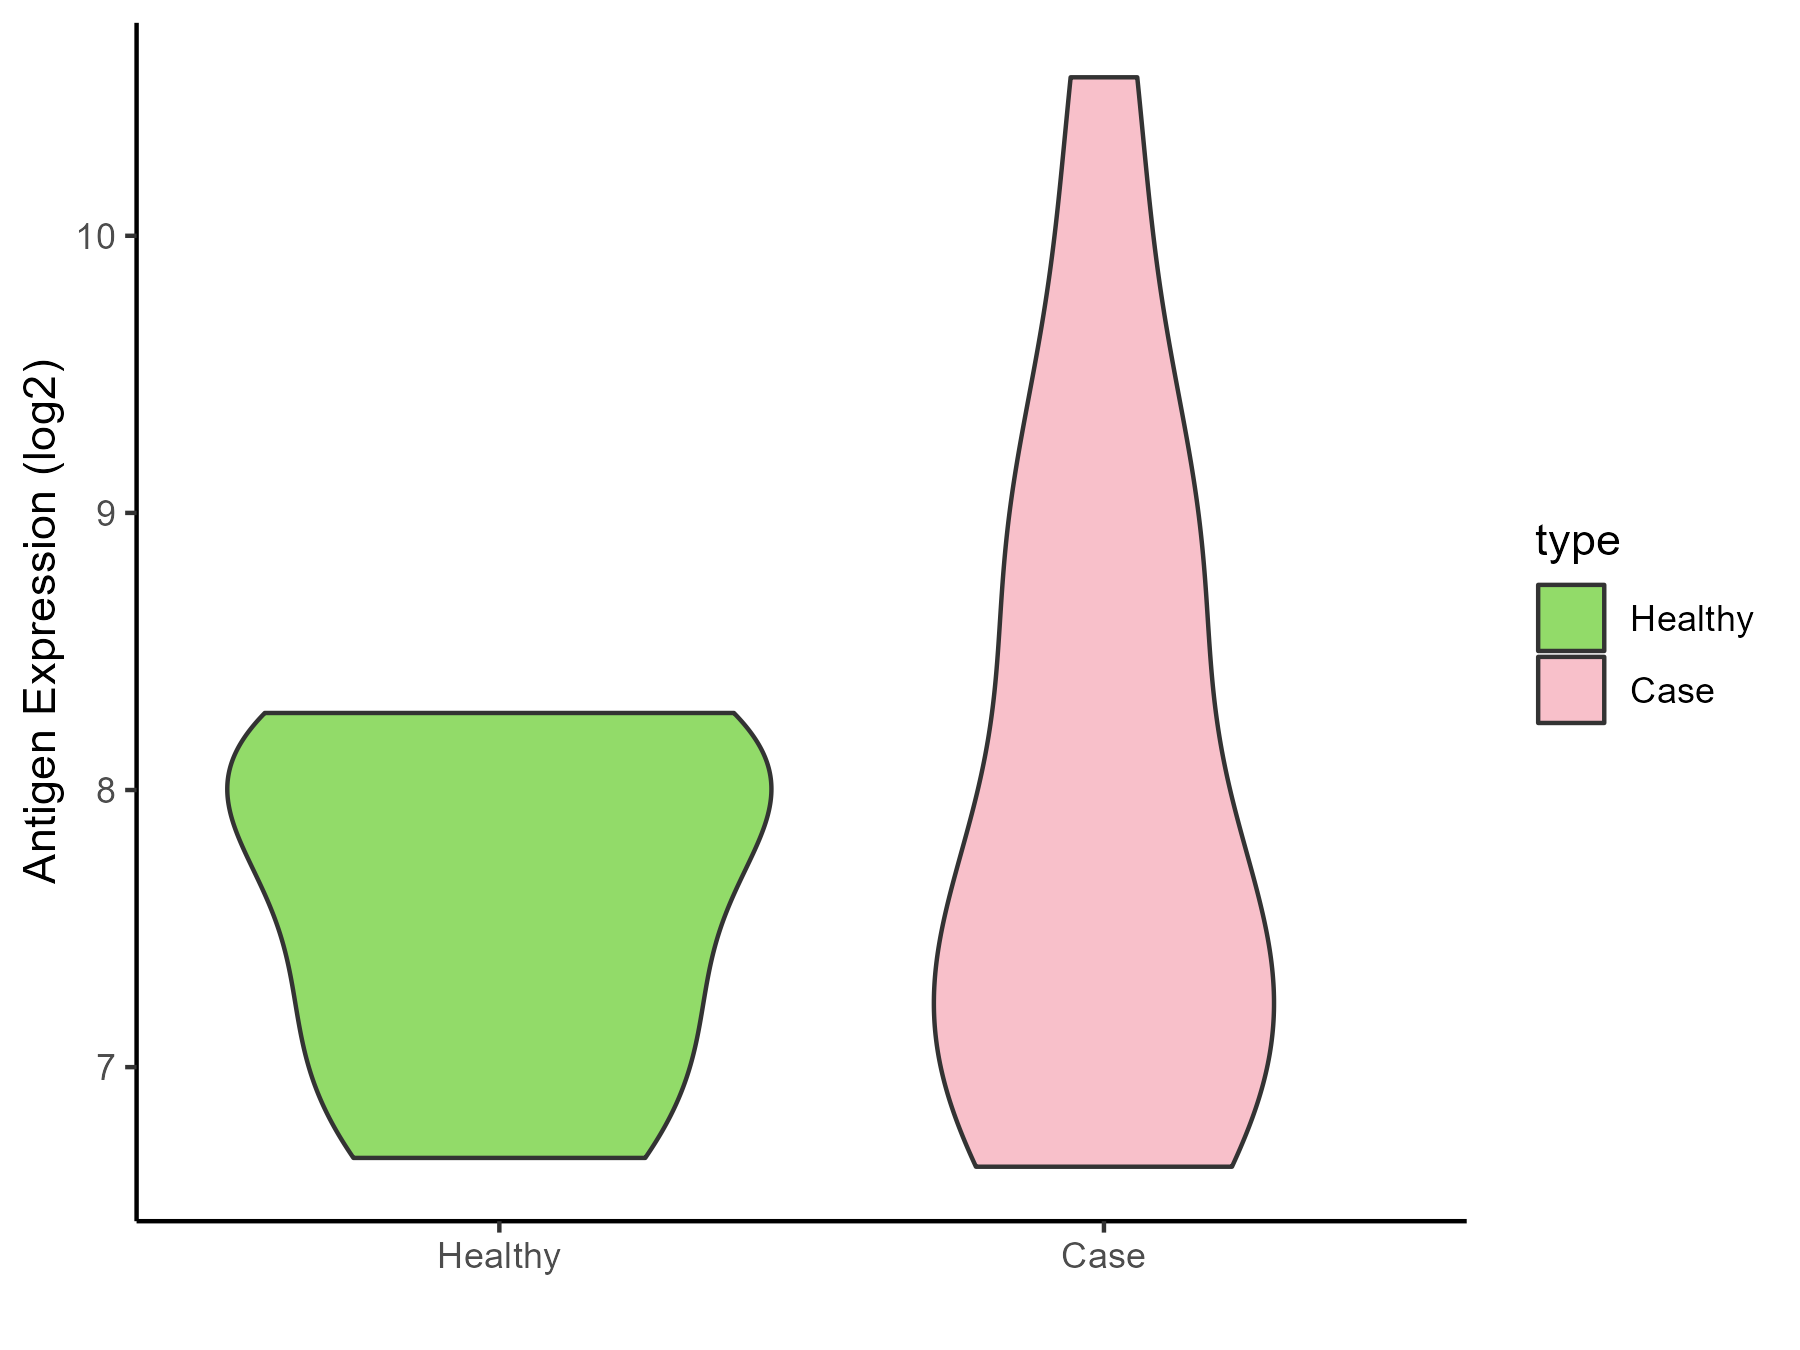
| The Studied Tissue | Plasmacytoid dendritic cells | |
| The Specific Disease | Multiple sclerosis | |
| The Expression Level of Disease Section Compare with the Healthy Individual Tissue | p-value: 0.319603965; Fold-change: -0.157969106; Z-score: -0.249922478 | |
| Disease-specific Antigen Abundances |
|
Click to View the Clearer Original Diagram |
| Differential expression pattern of antigen in diseases | ||
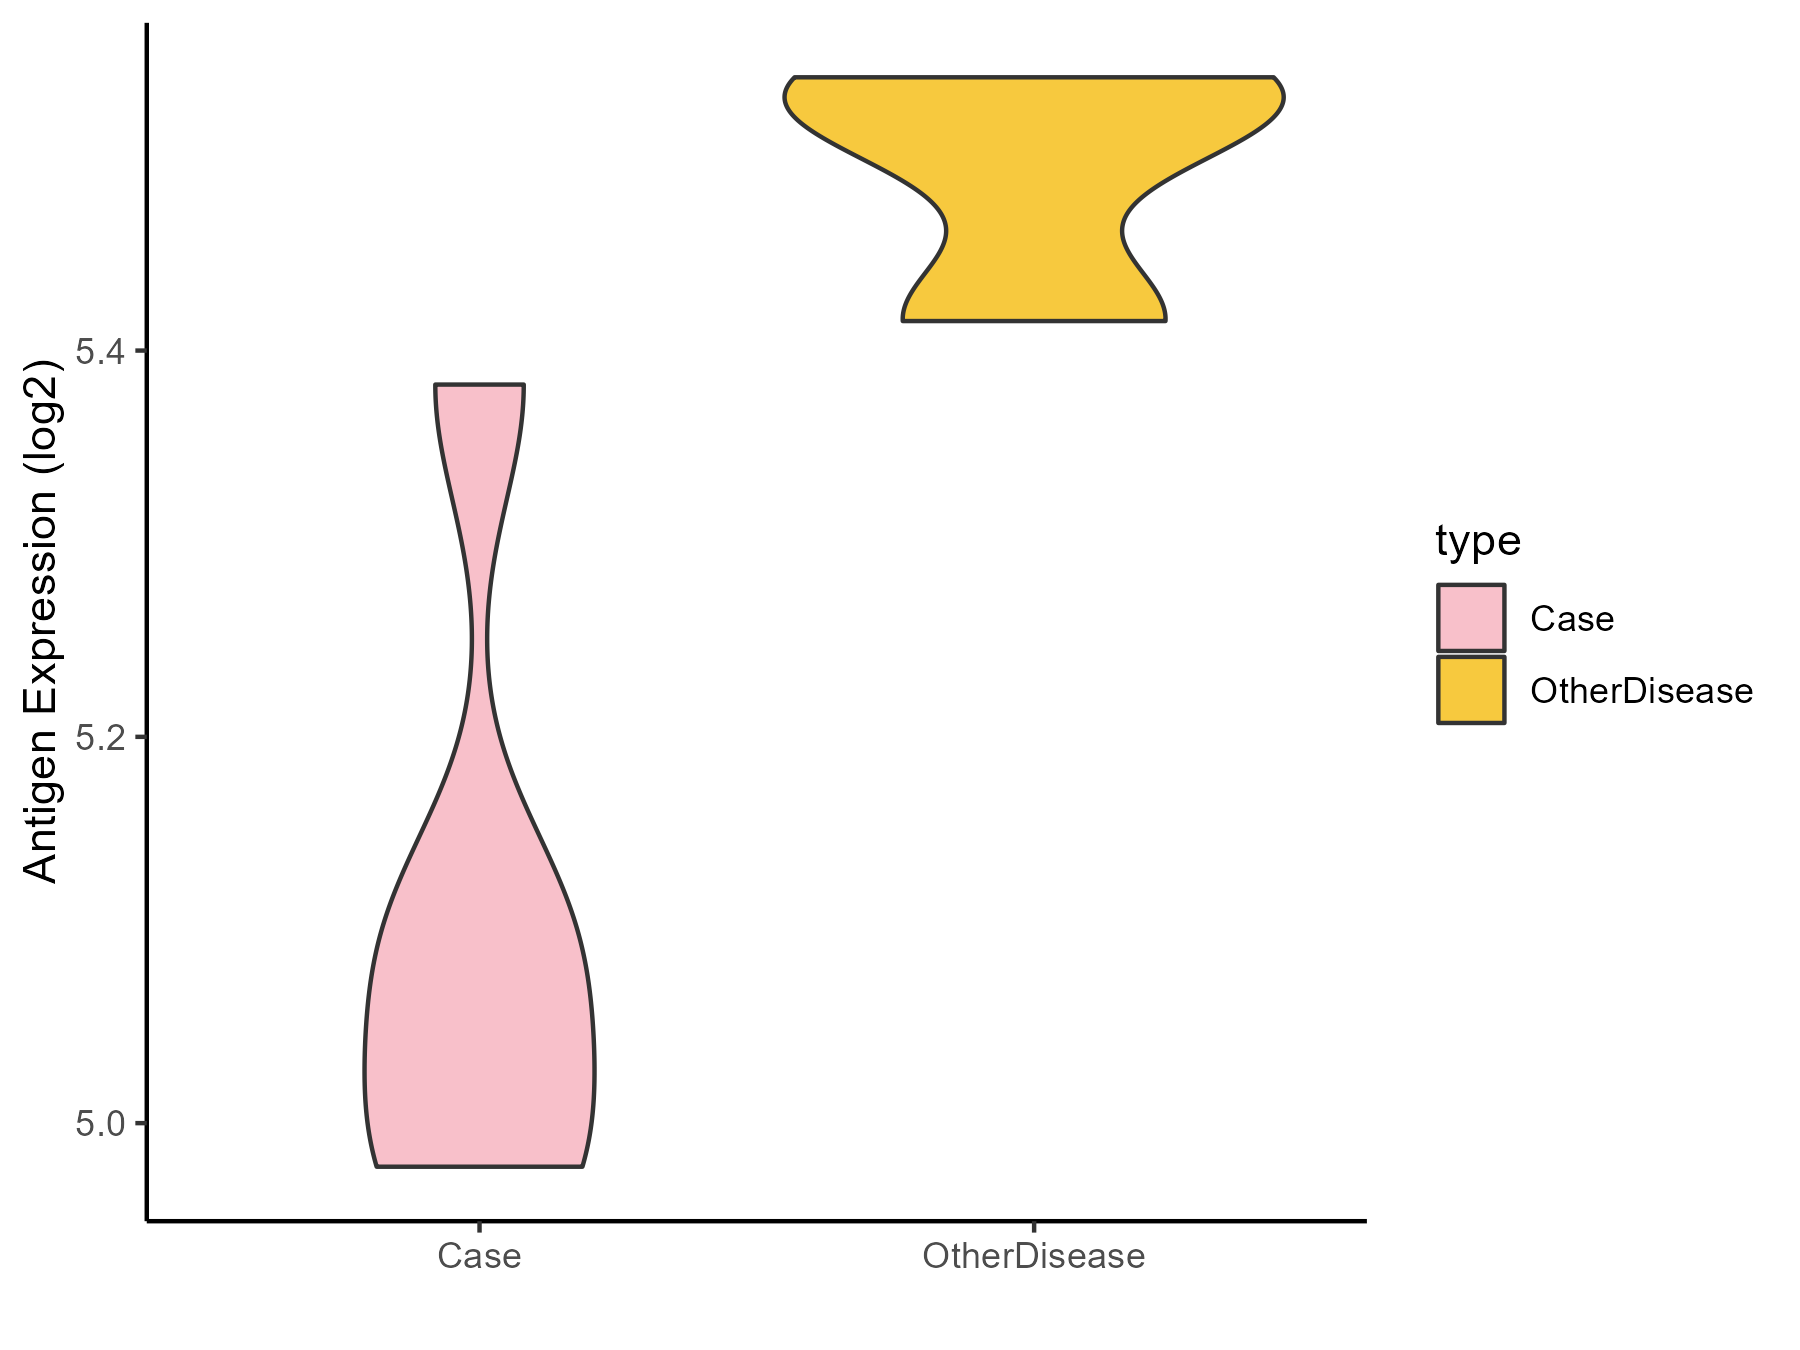
| The Studied Tissue | Peritumoral cortex | |
| The Specific Disease | Epilepsy | |
| The Expression Level of Disease Section Compare with the Other Disease Section | p-value: 0.004101789; Fold-change: -0.443902546; Z-score: -6.548080157 | |
| Disease-specific Antigen Abundances |
|
Click to View the Clearer Original Diagram |
| Differential expression pattern of antigen in diseases | ||
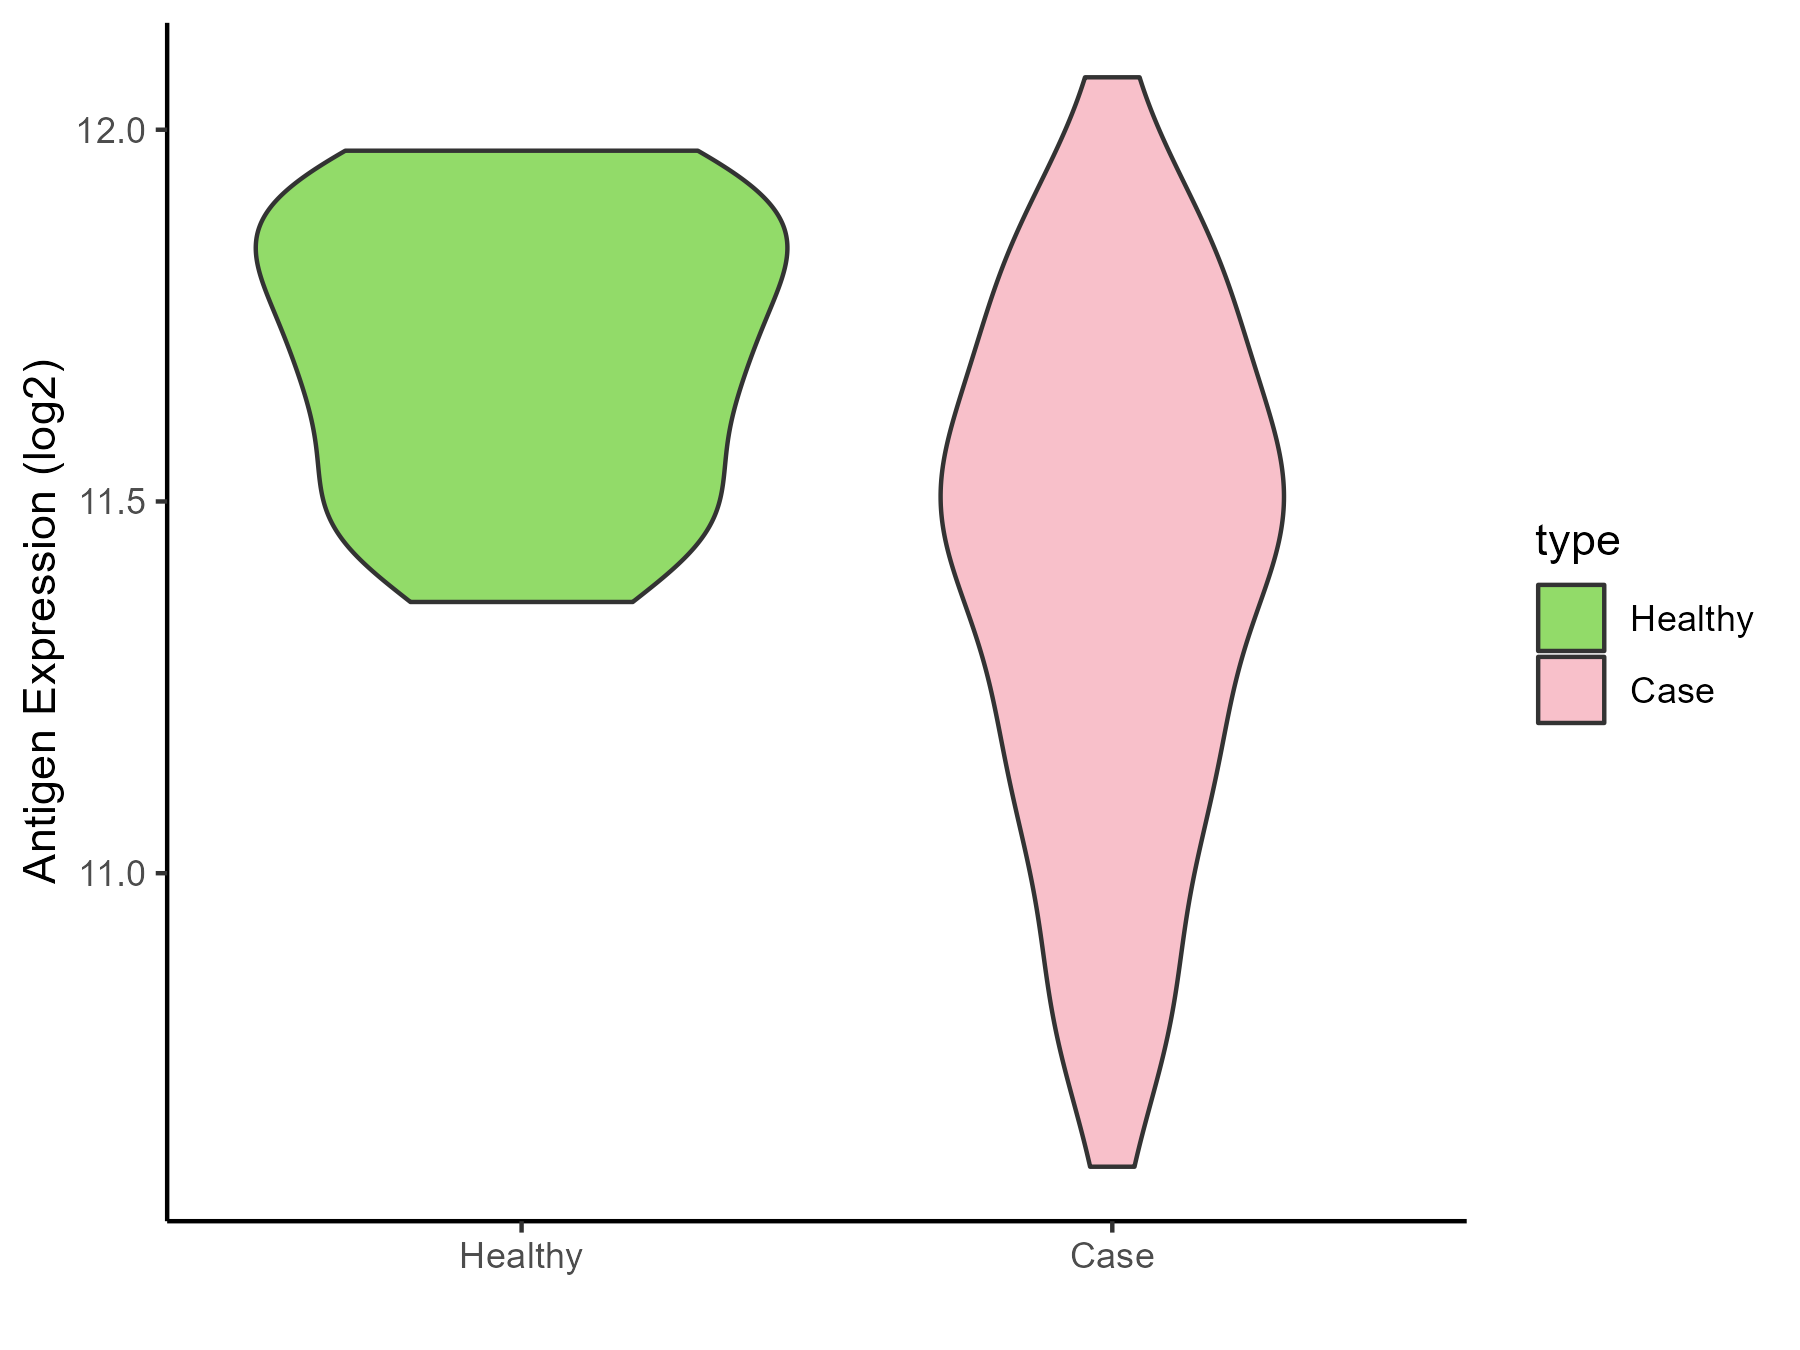
| The Studied Tissue | Whole blood | |
| The Specific Disease | Cardioembolic Stroke | |
| The Expression Level of Disease Section Compare with the Healthy Individual Tissue | p-value: 3.89E-06; Fold-change: -0.271497206; Z-score: -1.432707773 | |
| Disease-specific Antigen Abundances |
|
Click to View the Clearer Original Diagram |
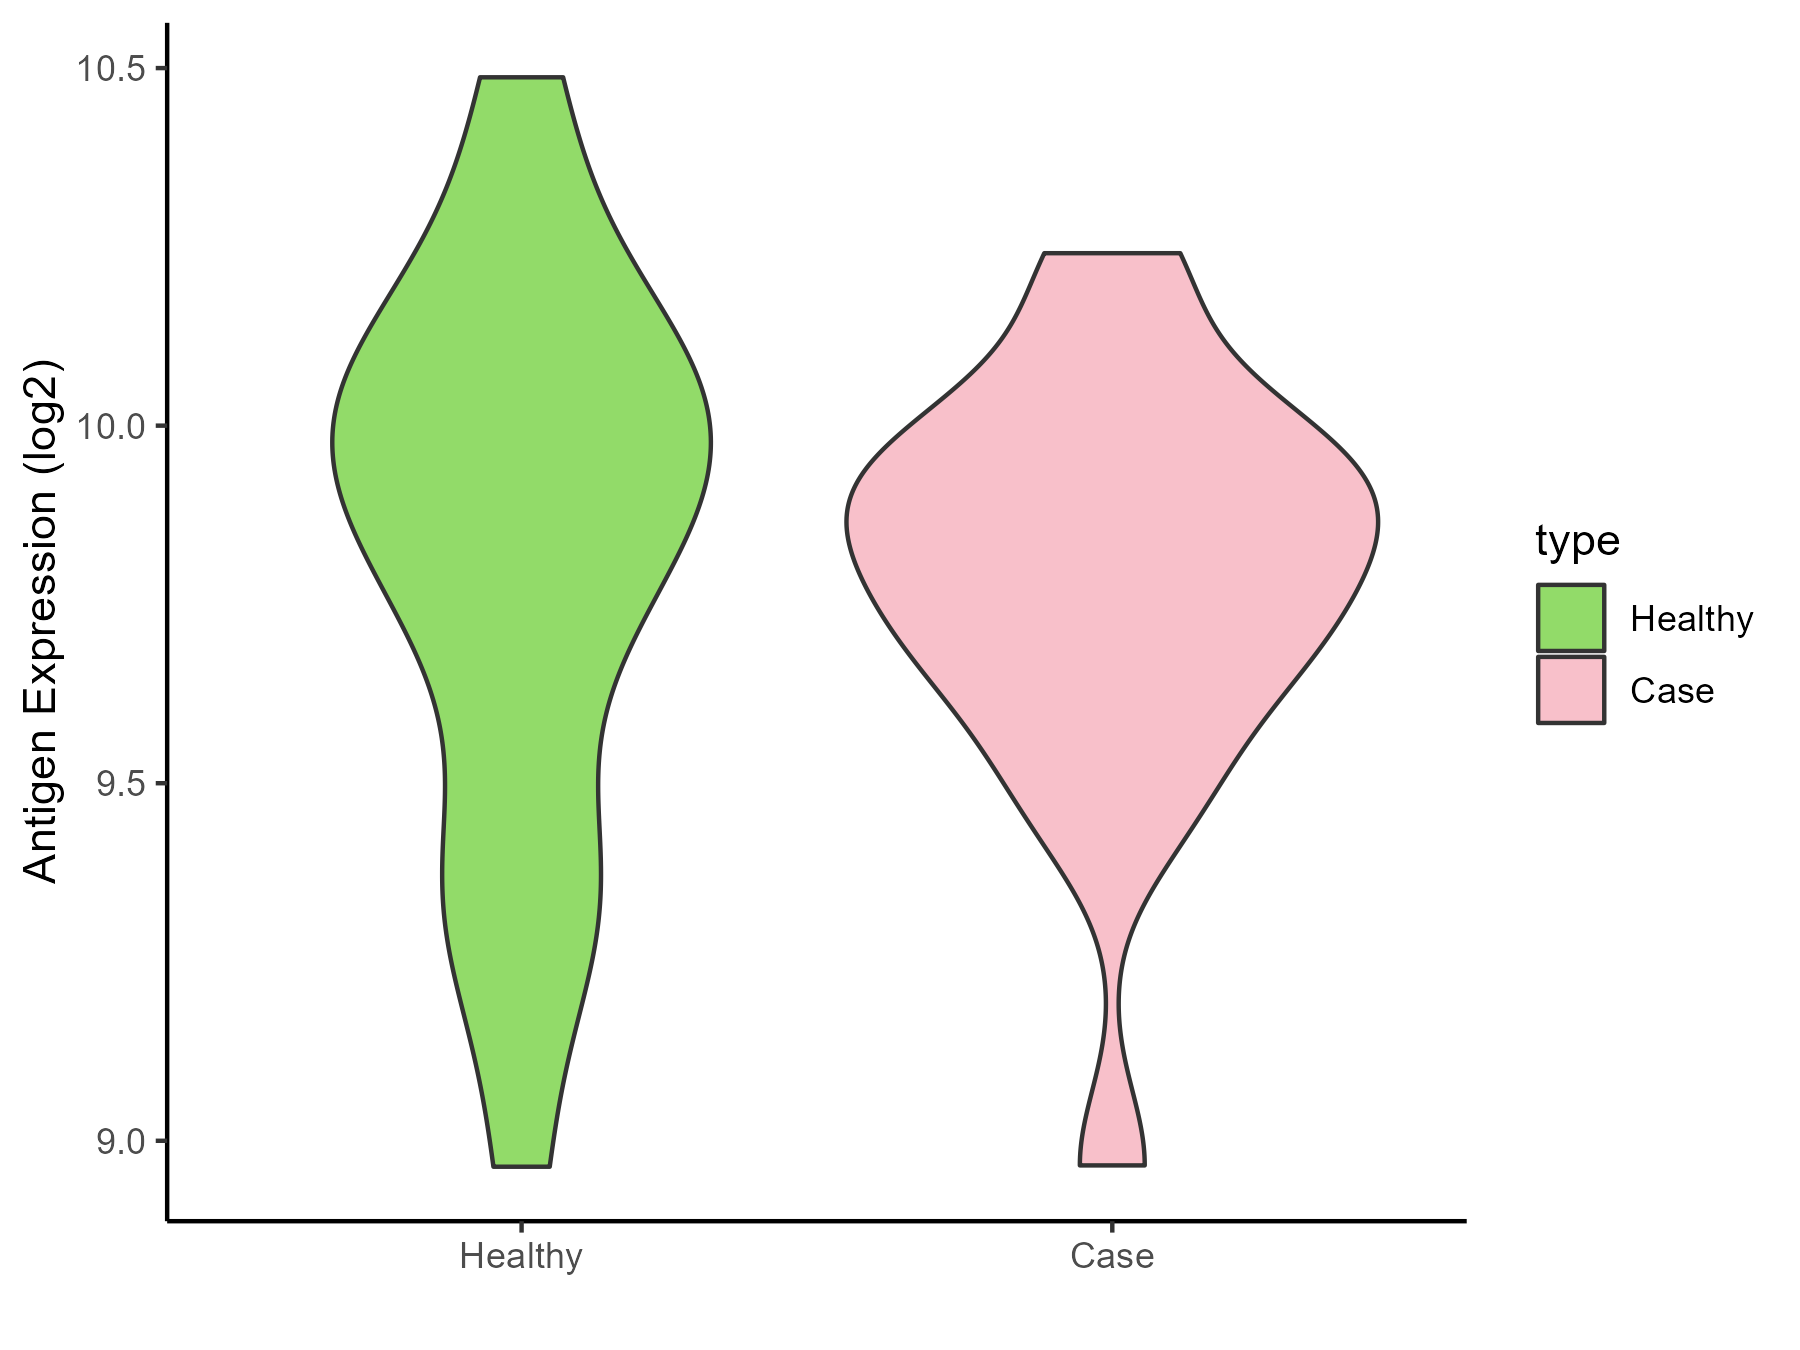
| The Studied Tissue | Peripheral blood | |
| The Specific Disease | Ischemic stroke | |
| The Expression Level of Disease Section Compare with the Healthy Individual Tissue | p-value: 0.725865085; Fold-change: -0.071651242; Z-score: -0.183420645 | |
| Disease-specific Antigen Abundances |
|
Click to View the Clearer Original Diagram |
ICD Disease Classification 1
| Differential expression pattern of antigen in diseases | ||
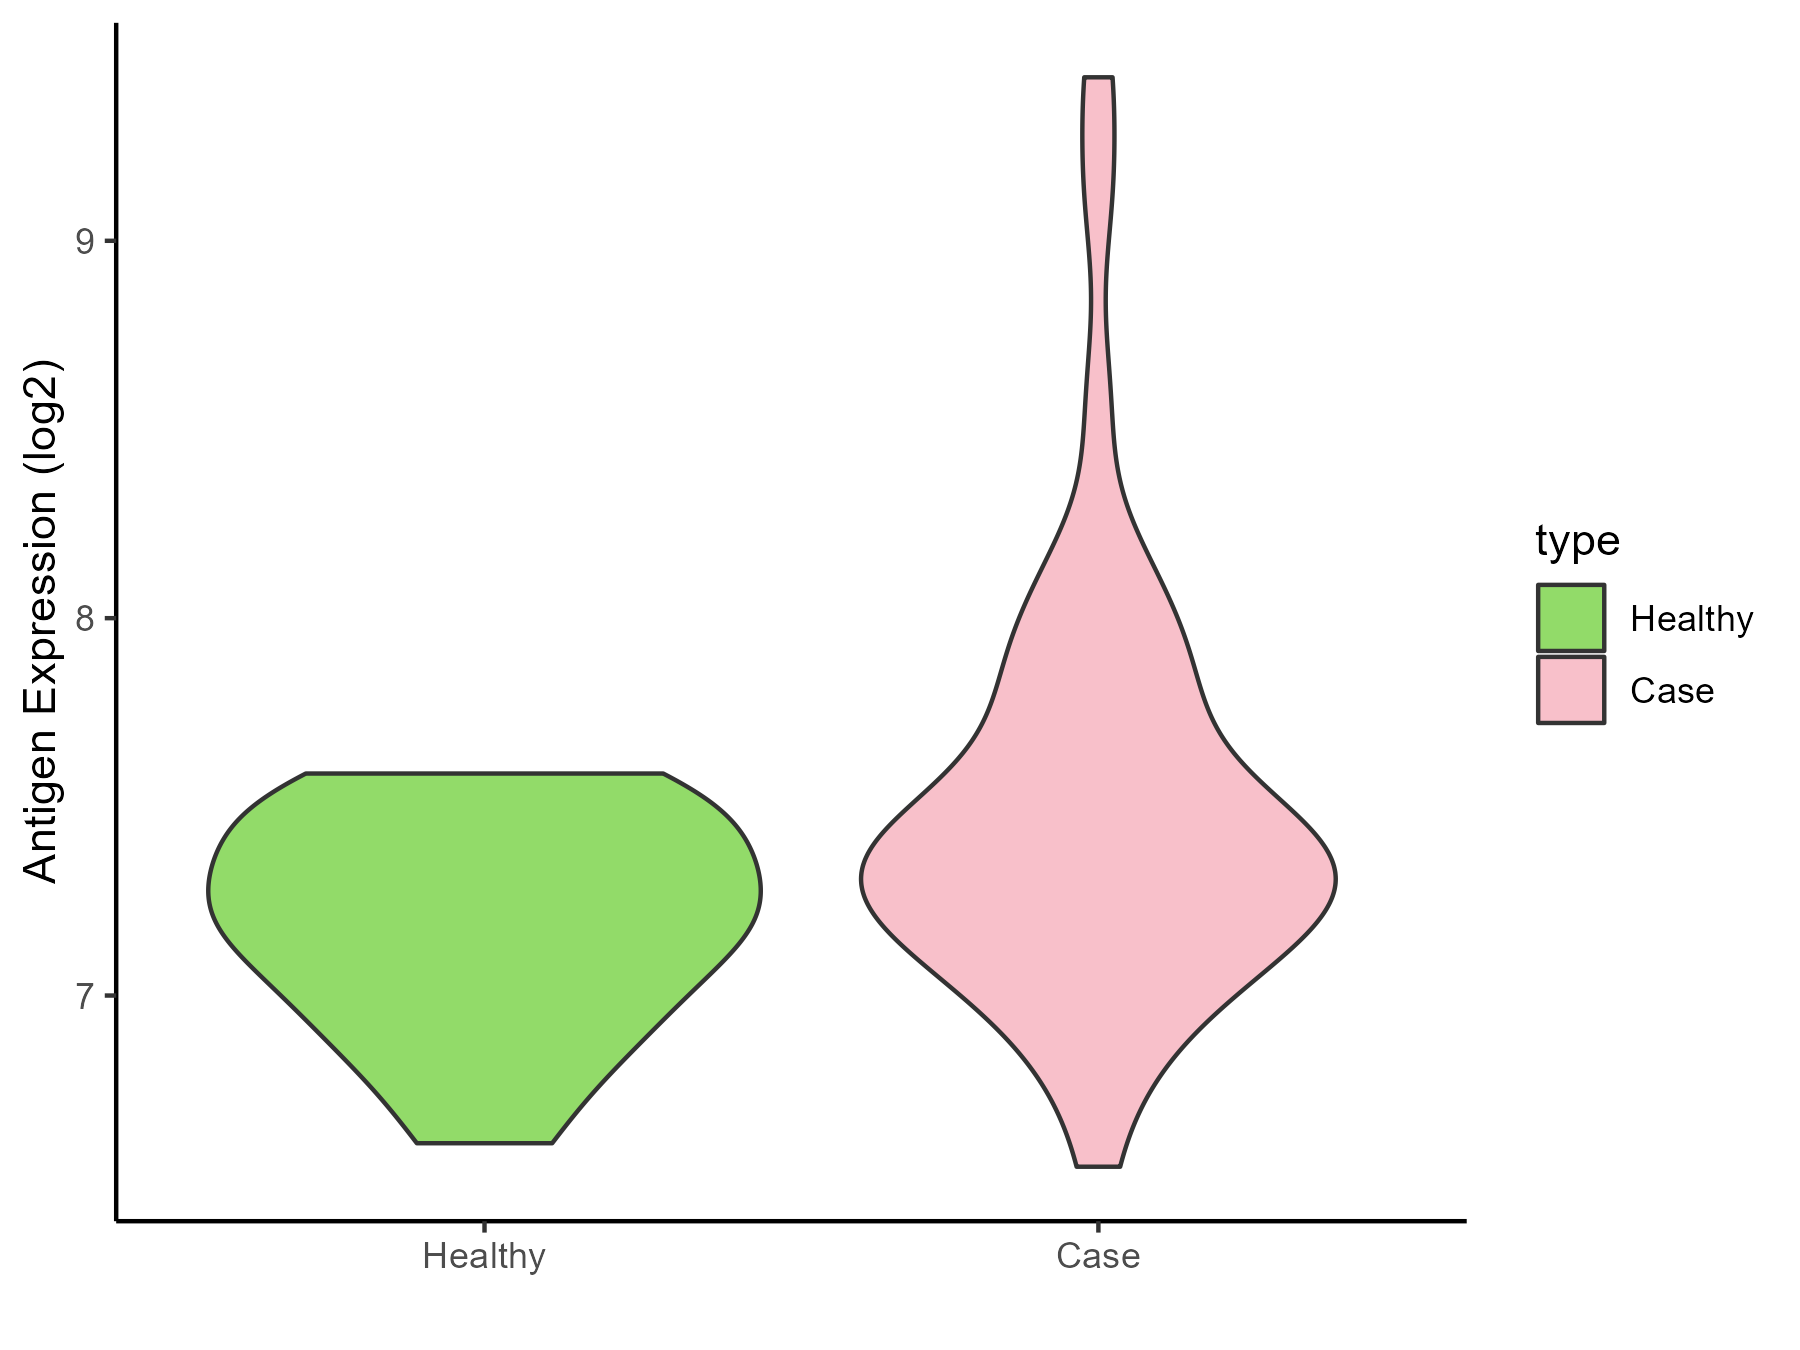
| The Studied Tissue | White matter | |
| The Specific Disease | HIV | |
| The Expression Level of Disease Section Compare with the Healthy Individual Tissue | p-value: 0.007720282; Fold-change: 0.124403359; Z-score: 0.432656328 | |
| Disease-specific Antigen Abundances |
|
Click to View the Clearer Original Diagram |
| Differential expression pattern of antigen in diseases | ||
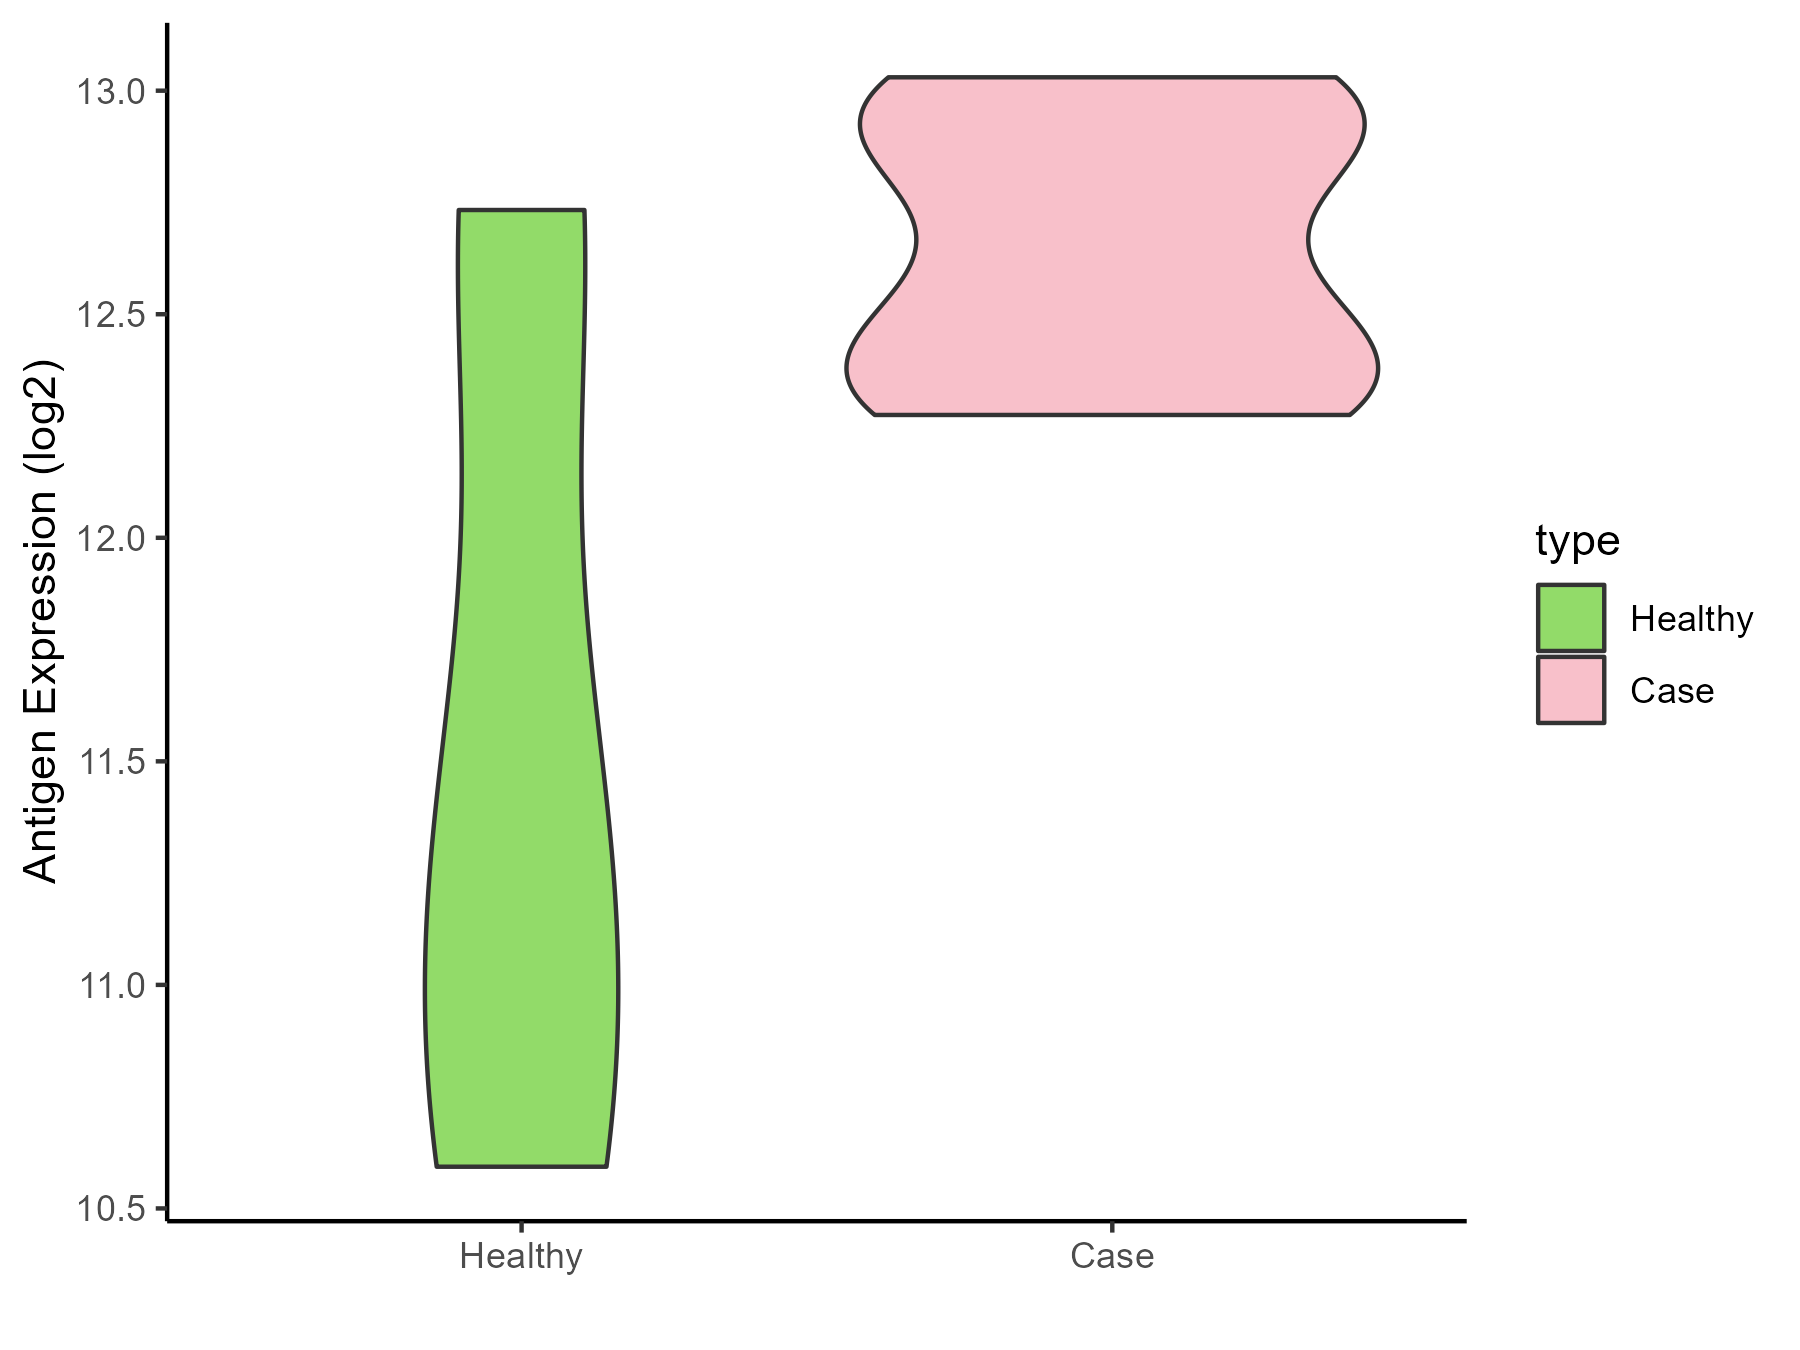
| The Studied Tissue | Whole blood | |
| The Specific Disease | Influenza | |
| The Expression Level of Disease Section Compare with the Healthy Individual Tissue | p-value: 0.223566775; Fold-change: 1.252797666; Z-score: 1.154239025 | |
| Disease-specific Antigen Abundances |
|
Click to View the Clearer Original Diagram |
| Differential expression pattern of antigen in diseases | ||
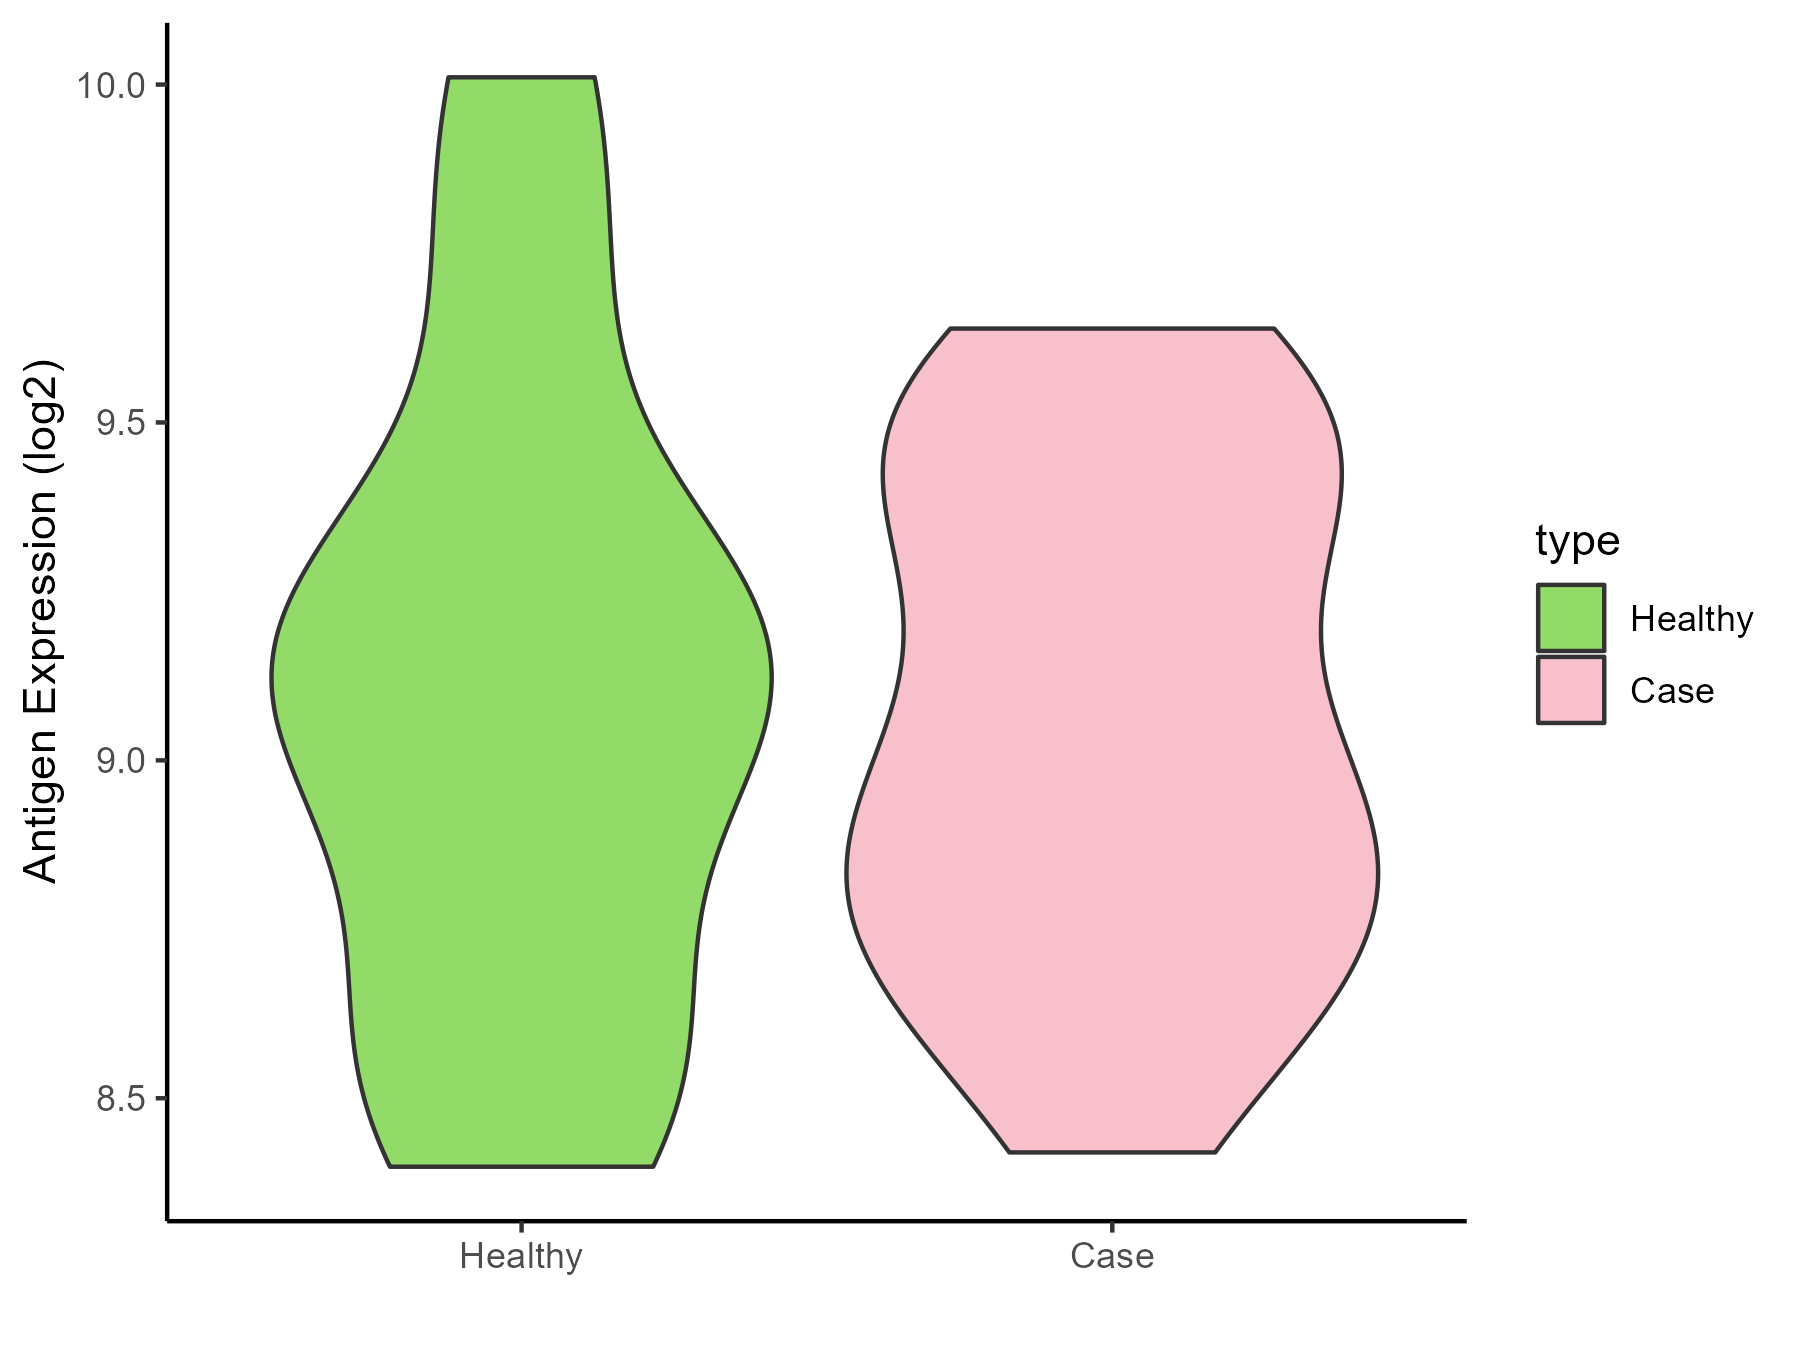
| The Studied Tissue | Whole blood | |
| The Specific Disease | Chronic hepatitis C | |
| The Expression Level of Disease Section Compare with the Healthy Individual Tissue | p-value: 0.872699588; Fold-change: -0.120236078; Z-score: -0.240889603 | |
| Disease-specific Antigen Abundances |
|
Click to View the Clearer Original Diagram |
| Differential expression pattern of antigen in diseases | ||
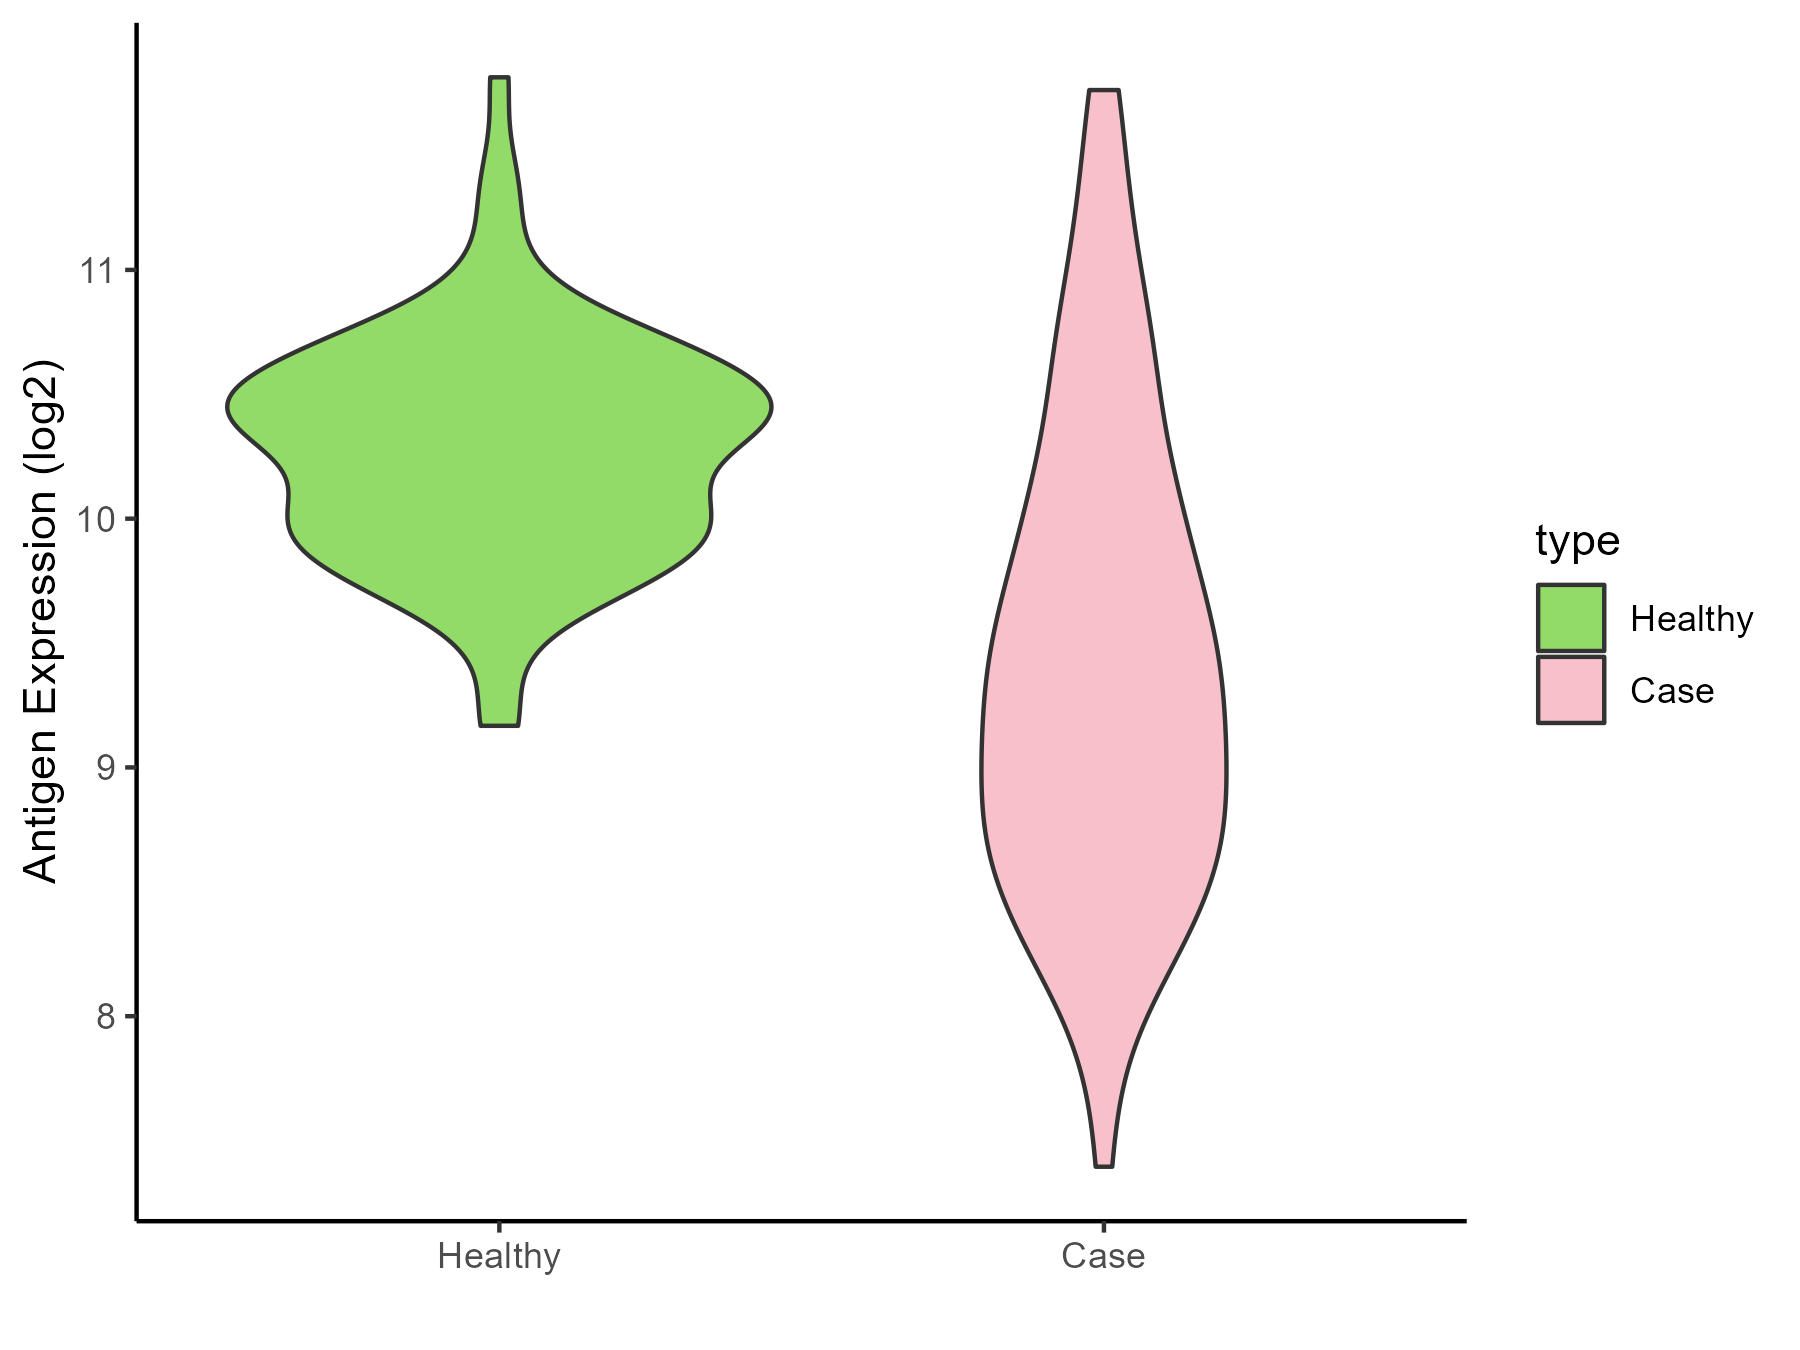
| The Studied Tissue | Whole blood | |
| The Specific Disease | Sepsis | |
| The Expression Level of Disease Section Compare with the Healthy Individual Tissue | p-value: 1.58E-19; Fold-change: -1.088311259; Z-score: -2.42448533 | |
| Disease-specific Antigen Abundances |
|
Click to View the Clearer Original Diagram |
| Differential expression pattern of antigen in diseases | ||
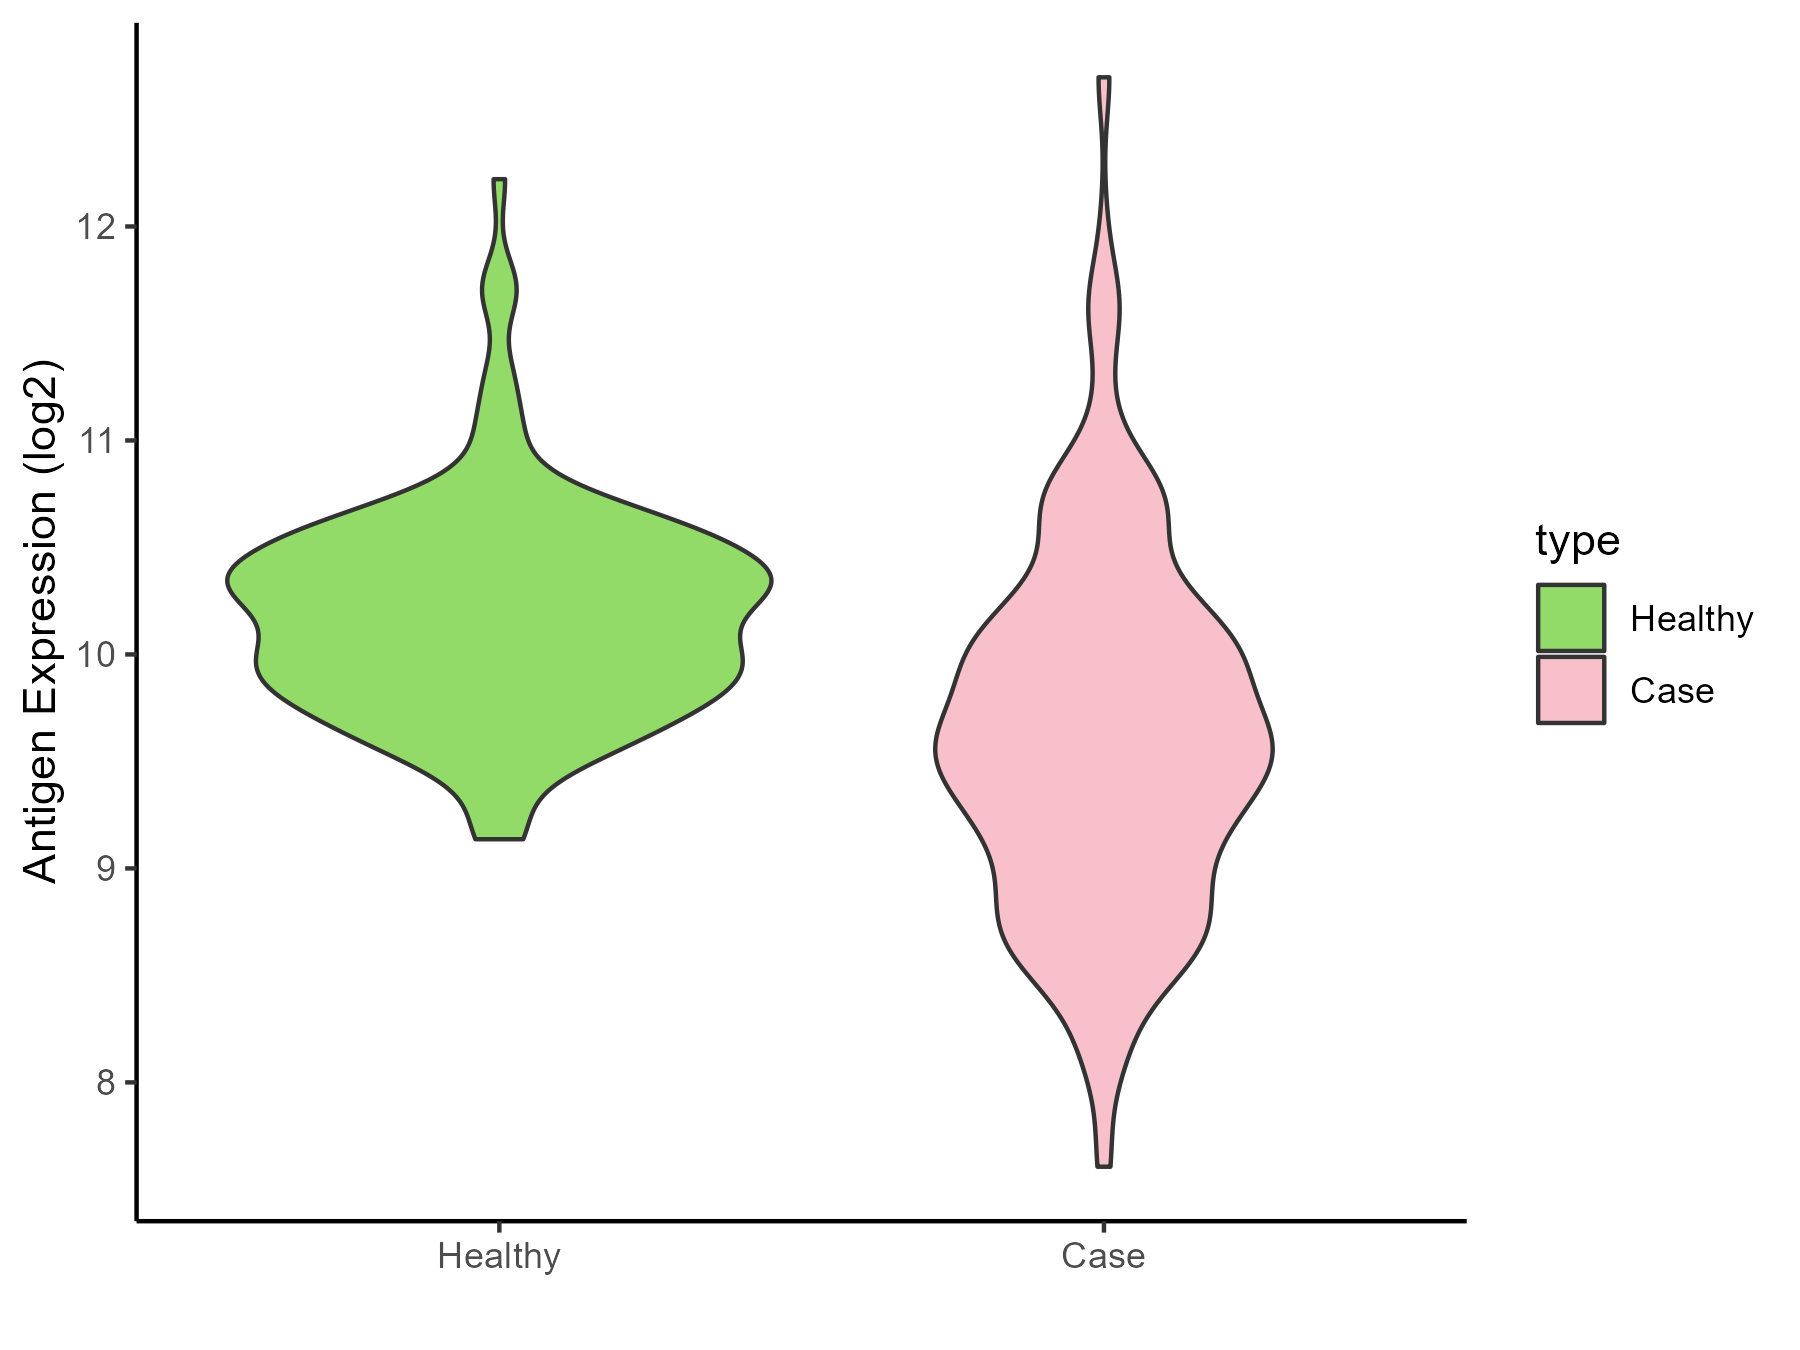
| The Studied Tissue | Whole blood | |
| The Specific Disease | Septic shock | |
| The Expression Level of Disease Section Compare with the Healthy Individual Tissue | p-value: 4.29E-25; Fold-change: -0.610979506; Z-score: -1.24369837 | |
| Disease-specific Antigen Abundances |
|
Click to View the Clearer Original Diagram |
| Differential expression pattern of antigen in diseases | ||
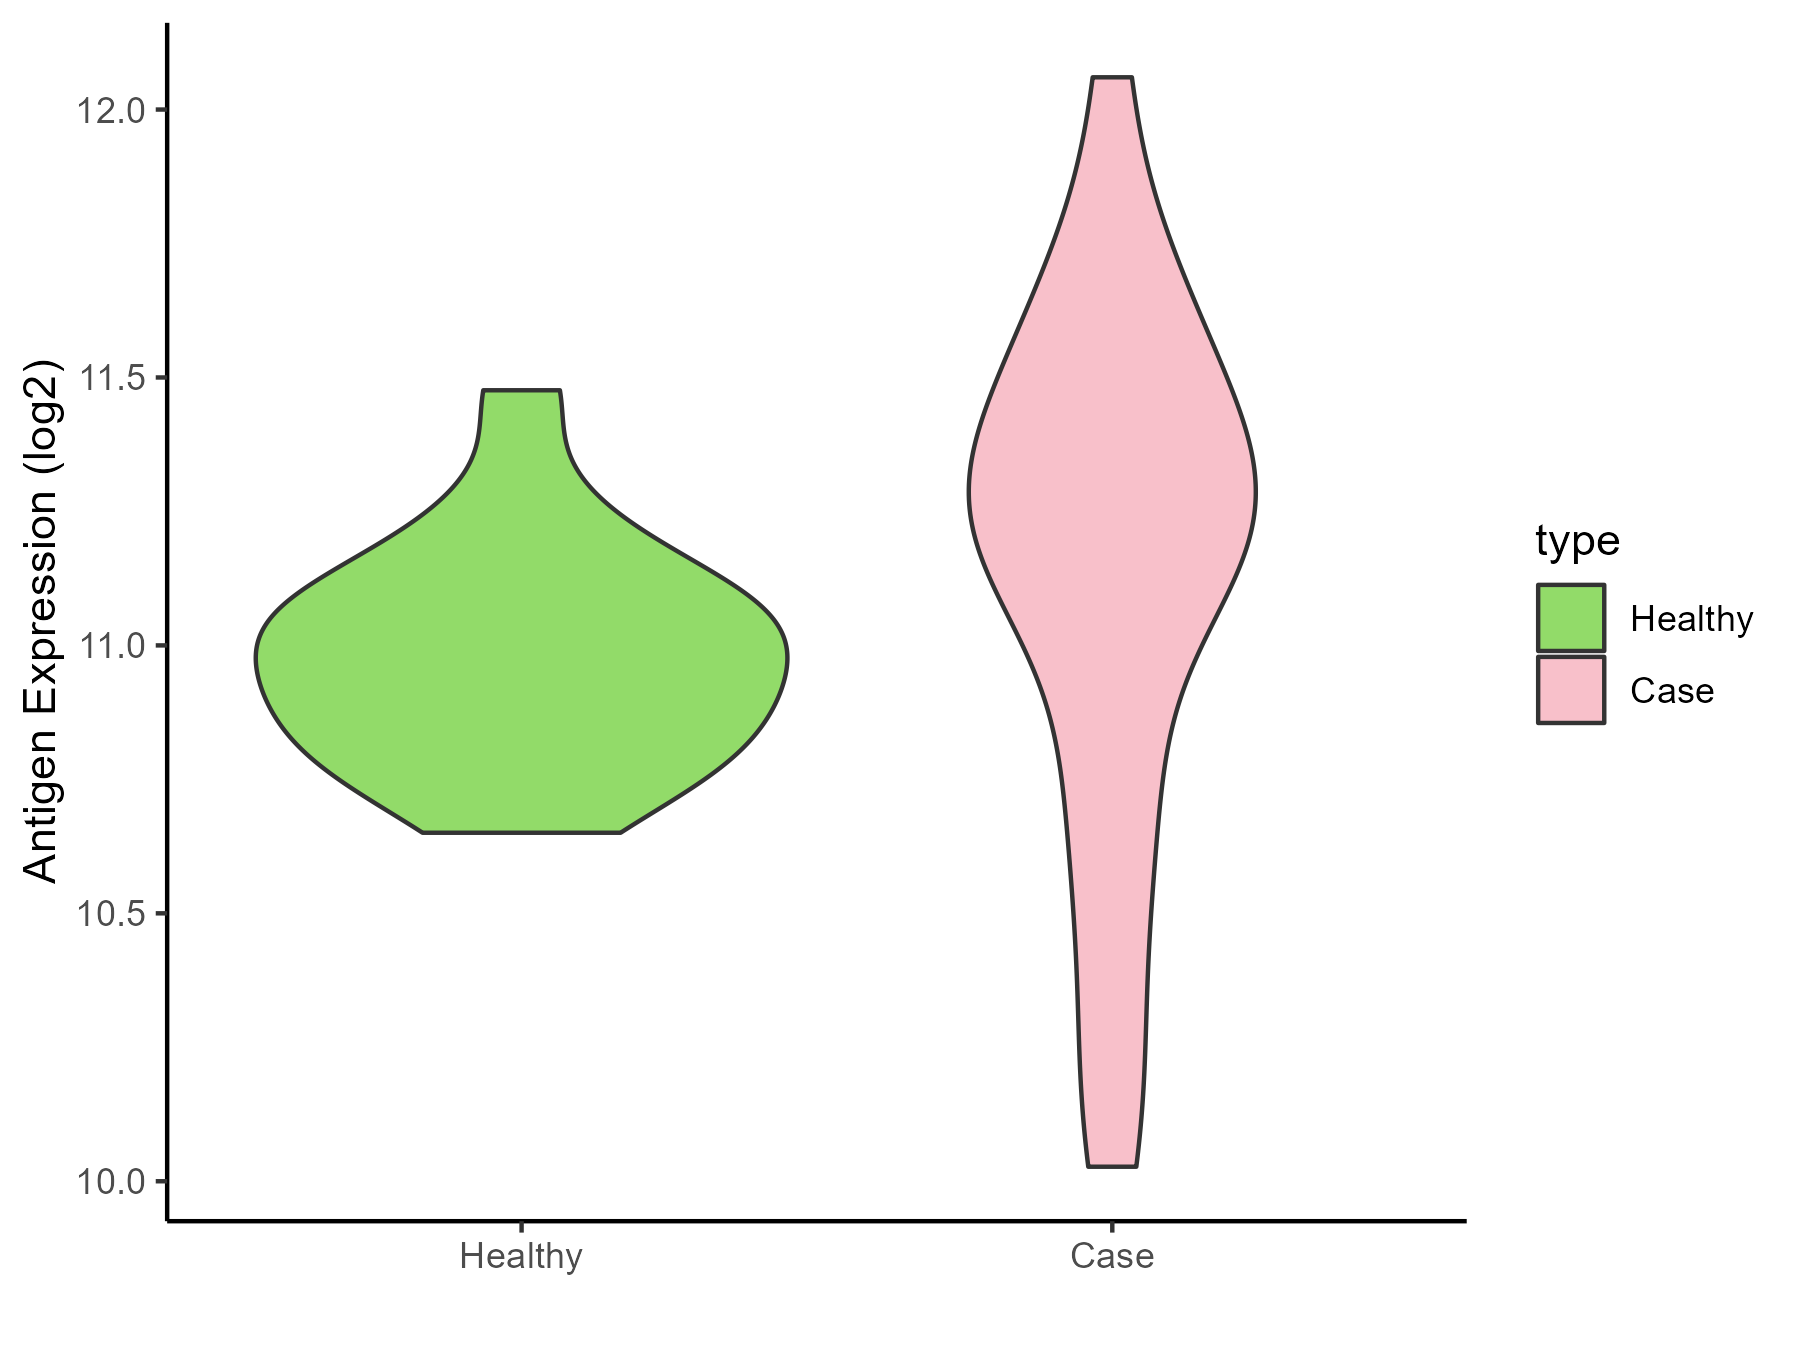
| The Studied Tissue | Peripheral blood | |
| The Specific Disease | Pediatric respiratory syncytial virus infection | |
| The Expression Level of Disease Section Compare with the Healthy Individual Tissue | p-value: 0.140173258; Fold-change: 0.282754839; Z-score: 1.369112155 | |
| Disease-specific Antigen Abundances |
|
Click to View the Clearer Original Diagram |
ICD Disease Classification 11
| Differential expression pattern of antigen in diseases | ||
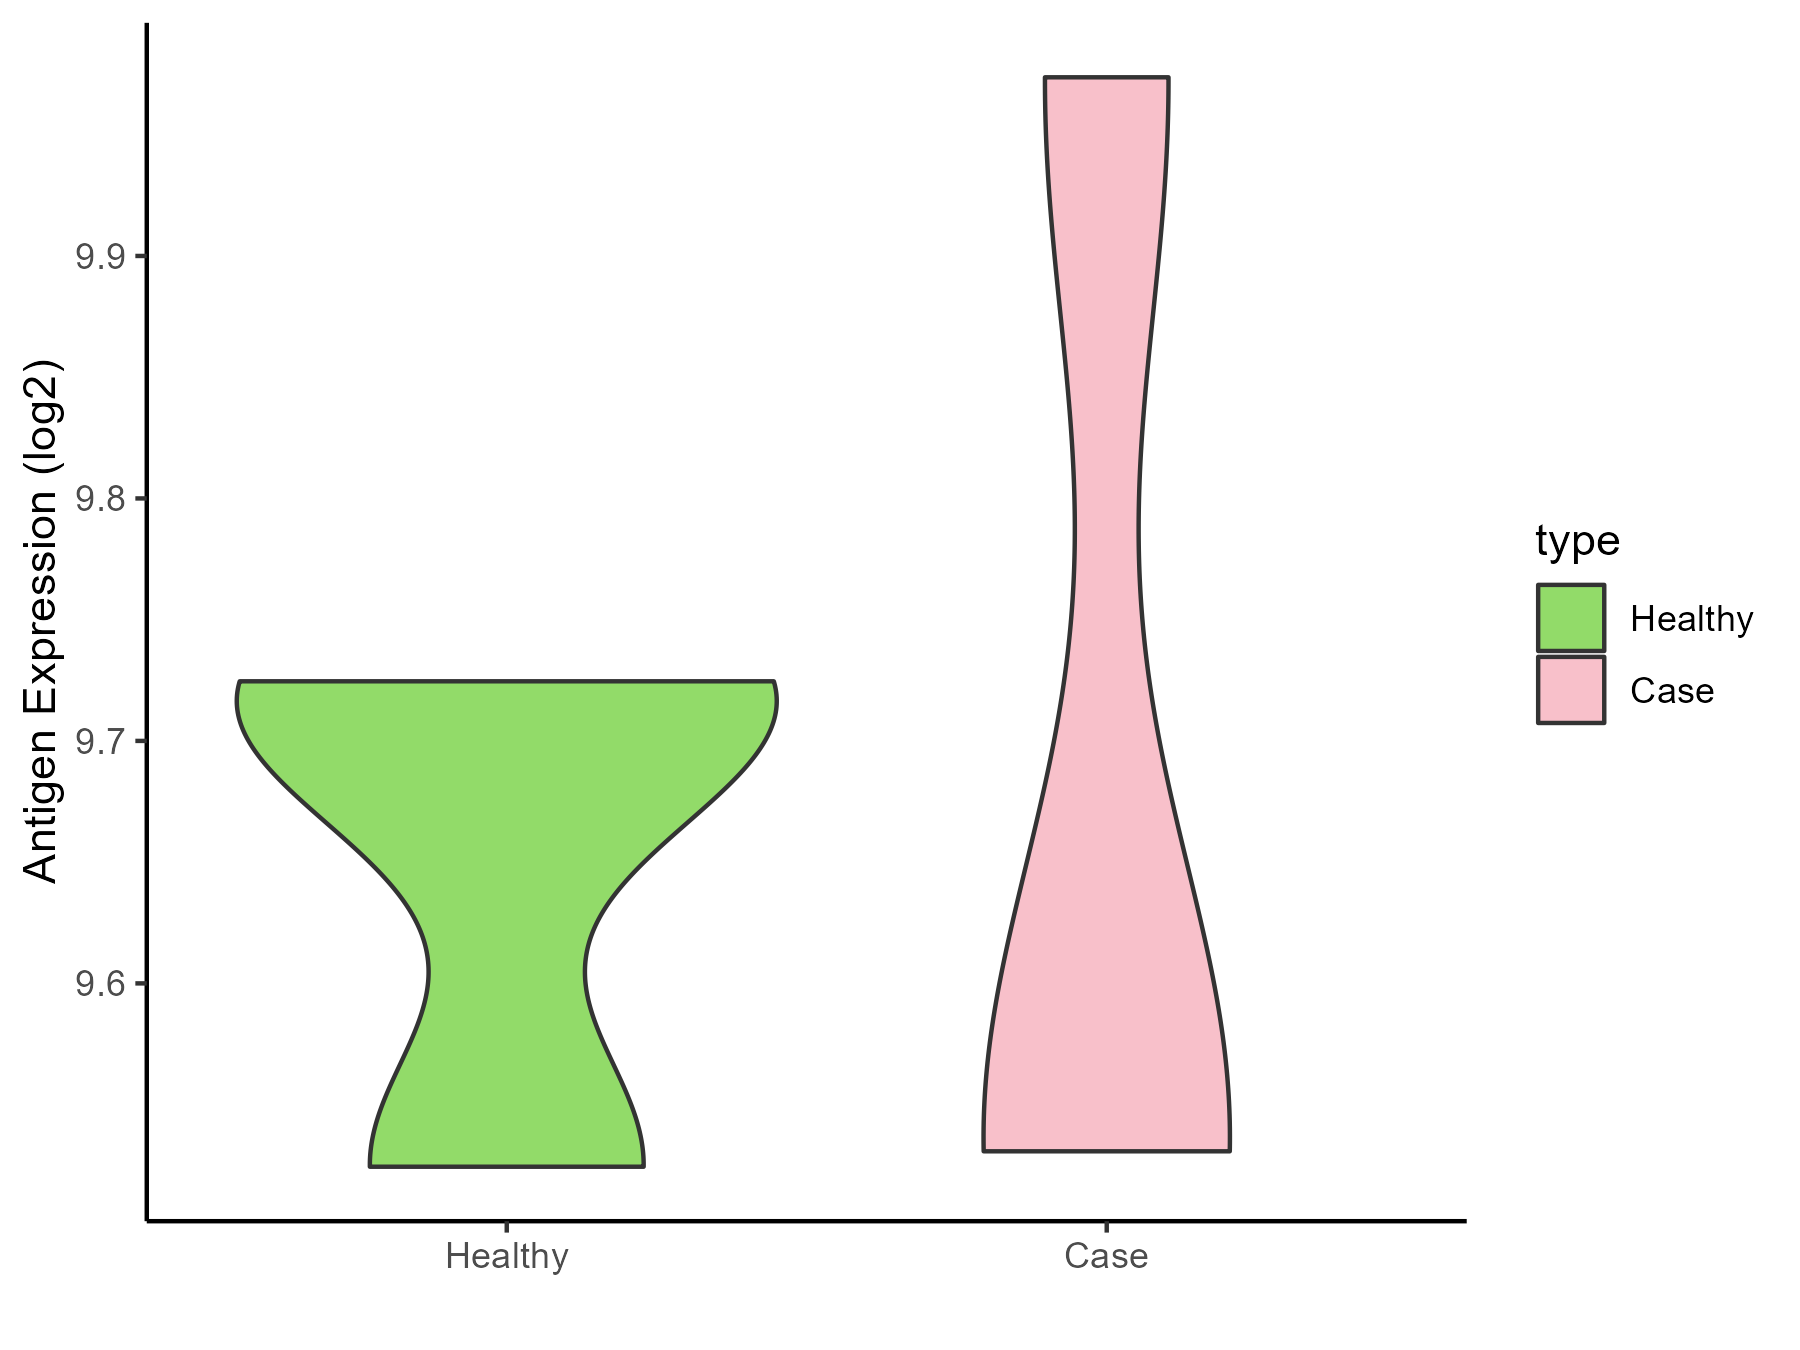
| The Studied Tissue | Peripheral blood | |
| The Specific Disease | Essential hypertension | |
| The Expression Level of Disease Section Compare with the Healthy Individual Tissue | p-value: 0.866007119; Fold-change: -0.166985077; Z-score: -1.500575904 | |
| Disease-specific Antigen Abundances |
|
Click to View the Clearer Original Diagram |
| Differential expression pattern of antigen in diseases | ||
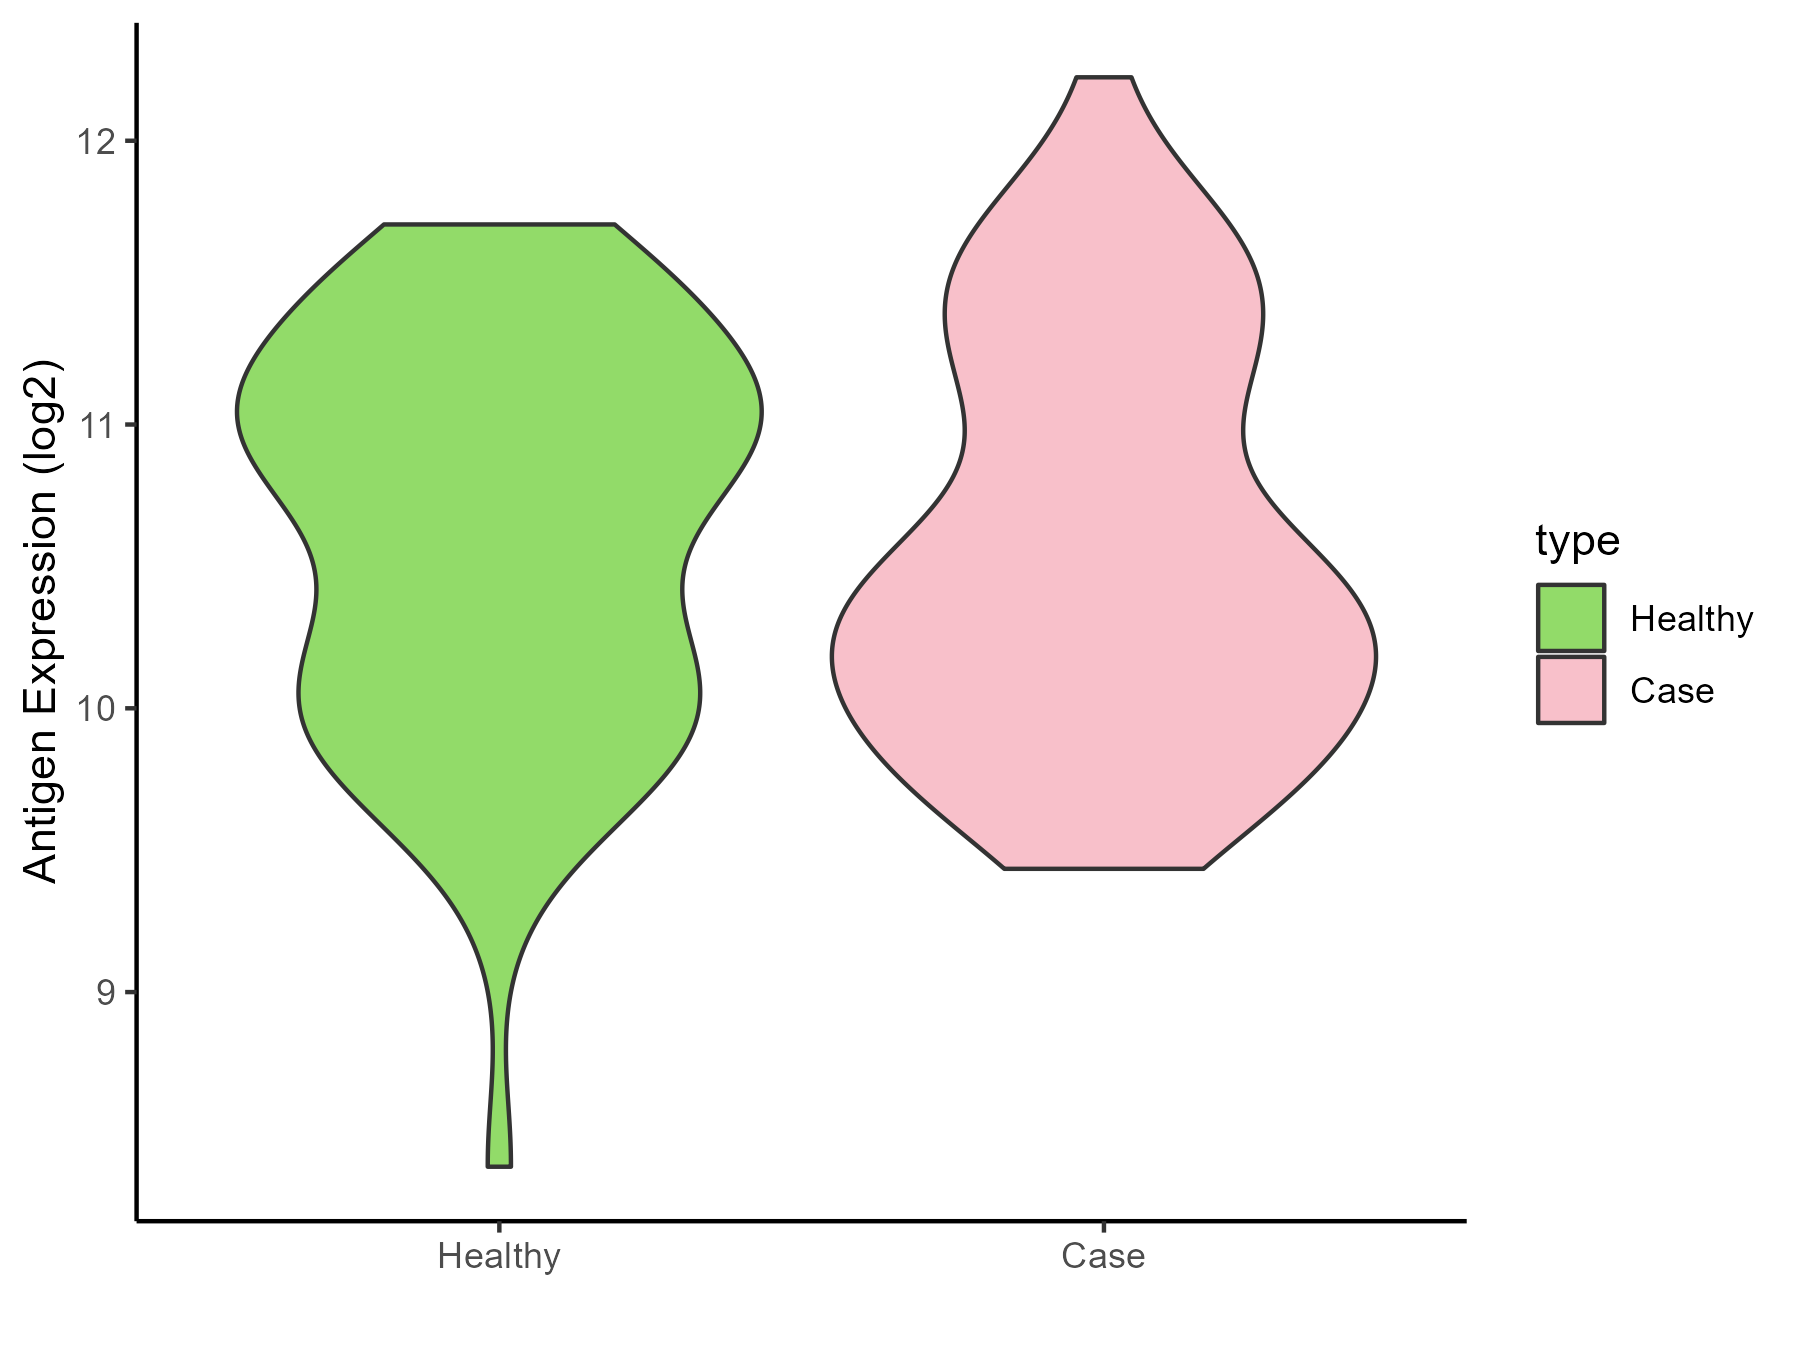
| The Studied Tissue | Peripheral blood | |
| The Specific Disease | Myocardial infarction | |
| The Expression Level of Disease Section Compare with the Healthy Individual Tissue | p-value: 0.668588015; Fold-change: -0.391425928; Z-score: -0.557682605 | |
| Disease-specific Antigen Abundances |
|
Click to View the Clearer Original Diagram |
| Differential expression pattern of antigen in diseases | ||
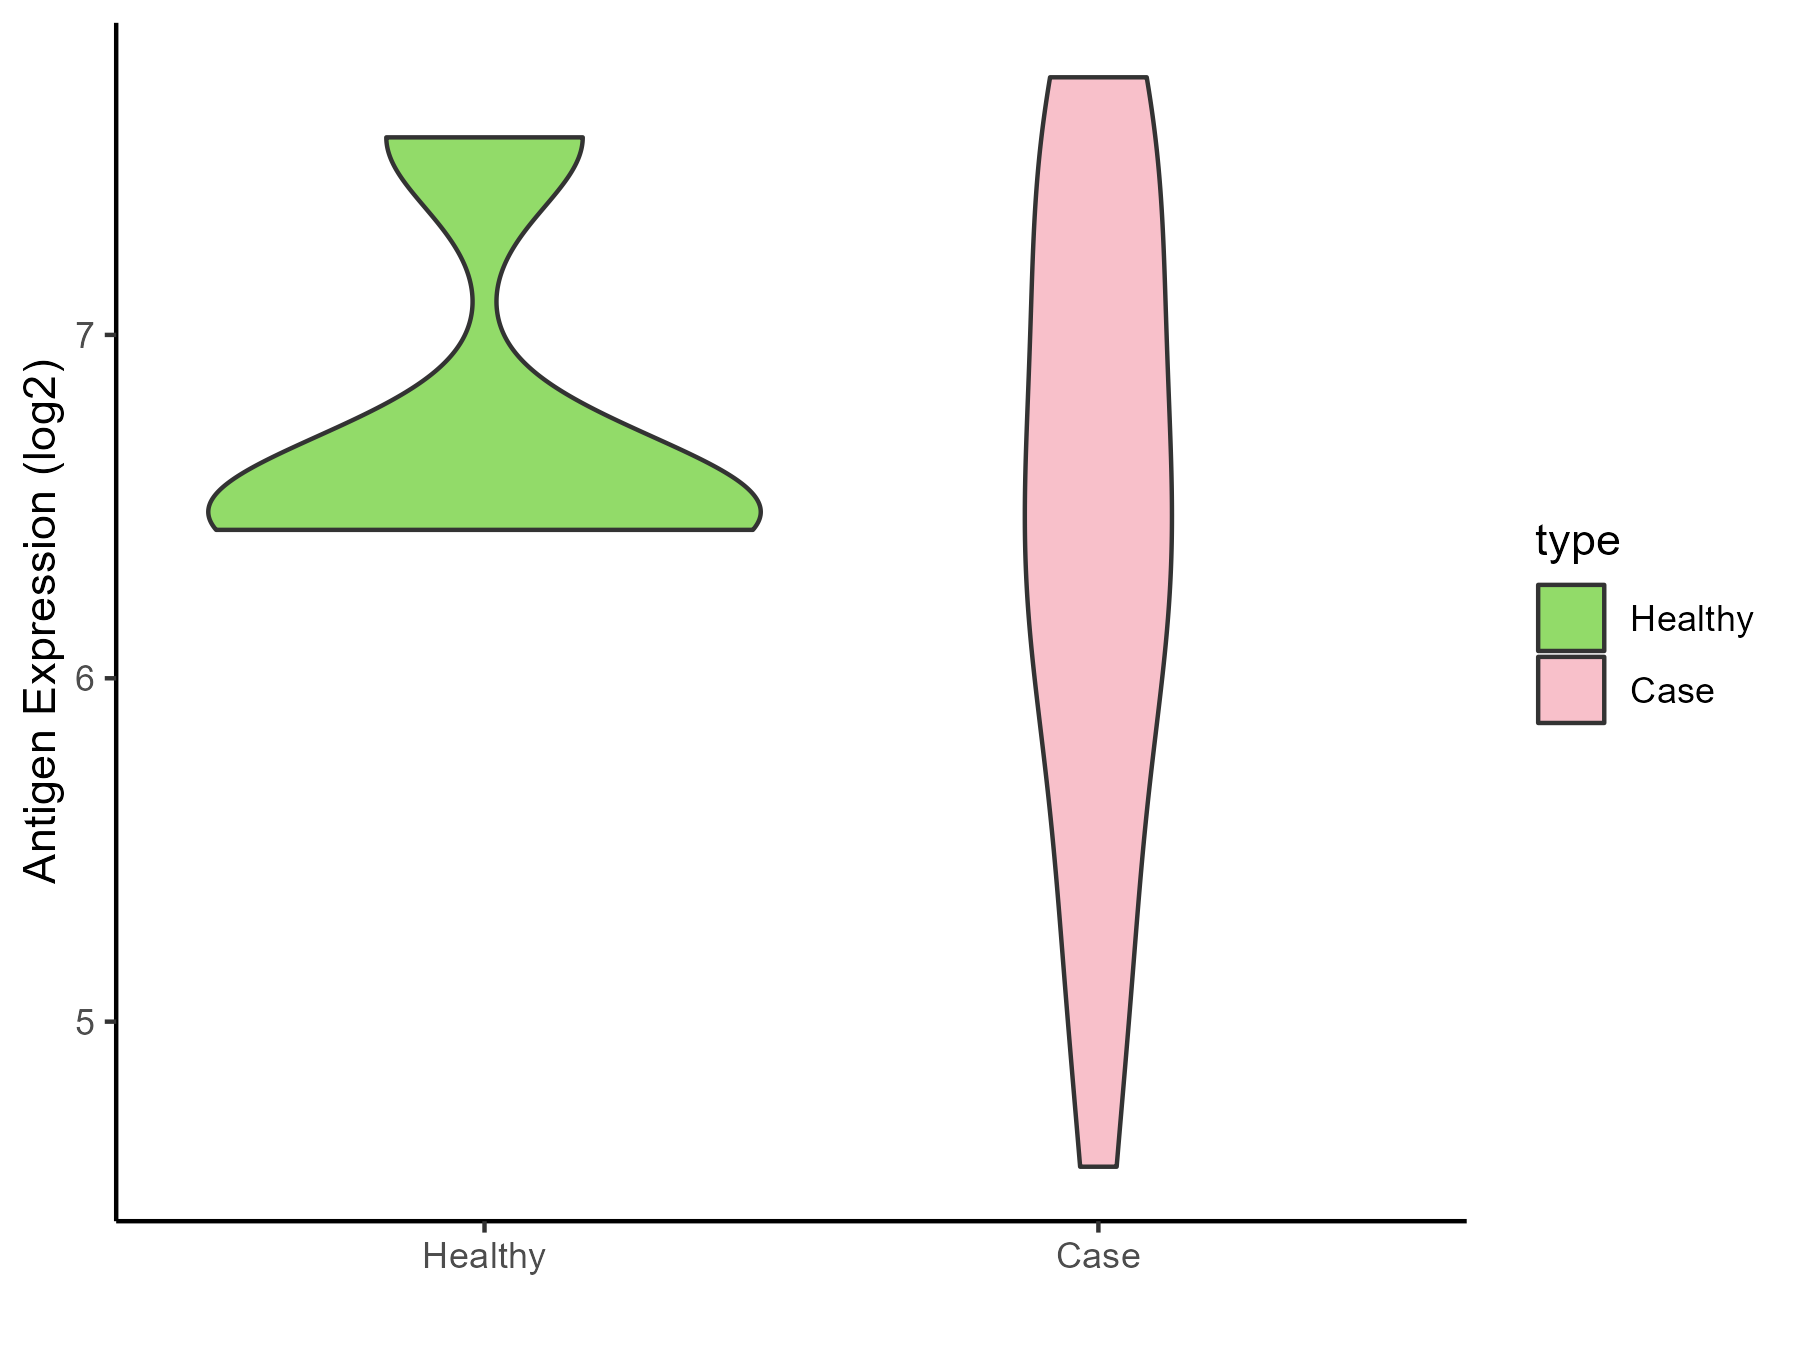
| The Studied Tissue | Peripheral blood | |
| The Specific Disease | Coronary artery disease | |
| The Expression Level of Disease Section Compare with the Healthy Individual Tissue | p-value: 0.432057974; Fold-change: -0.056641093; Z-score: -0.103273302 | |
| Disease-specific Antigen Abundances |
|
Click to View the Clearer Original Diagram |
| Differential expression pattern of antigen in diseases | ||
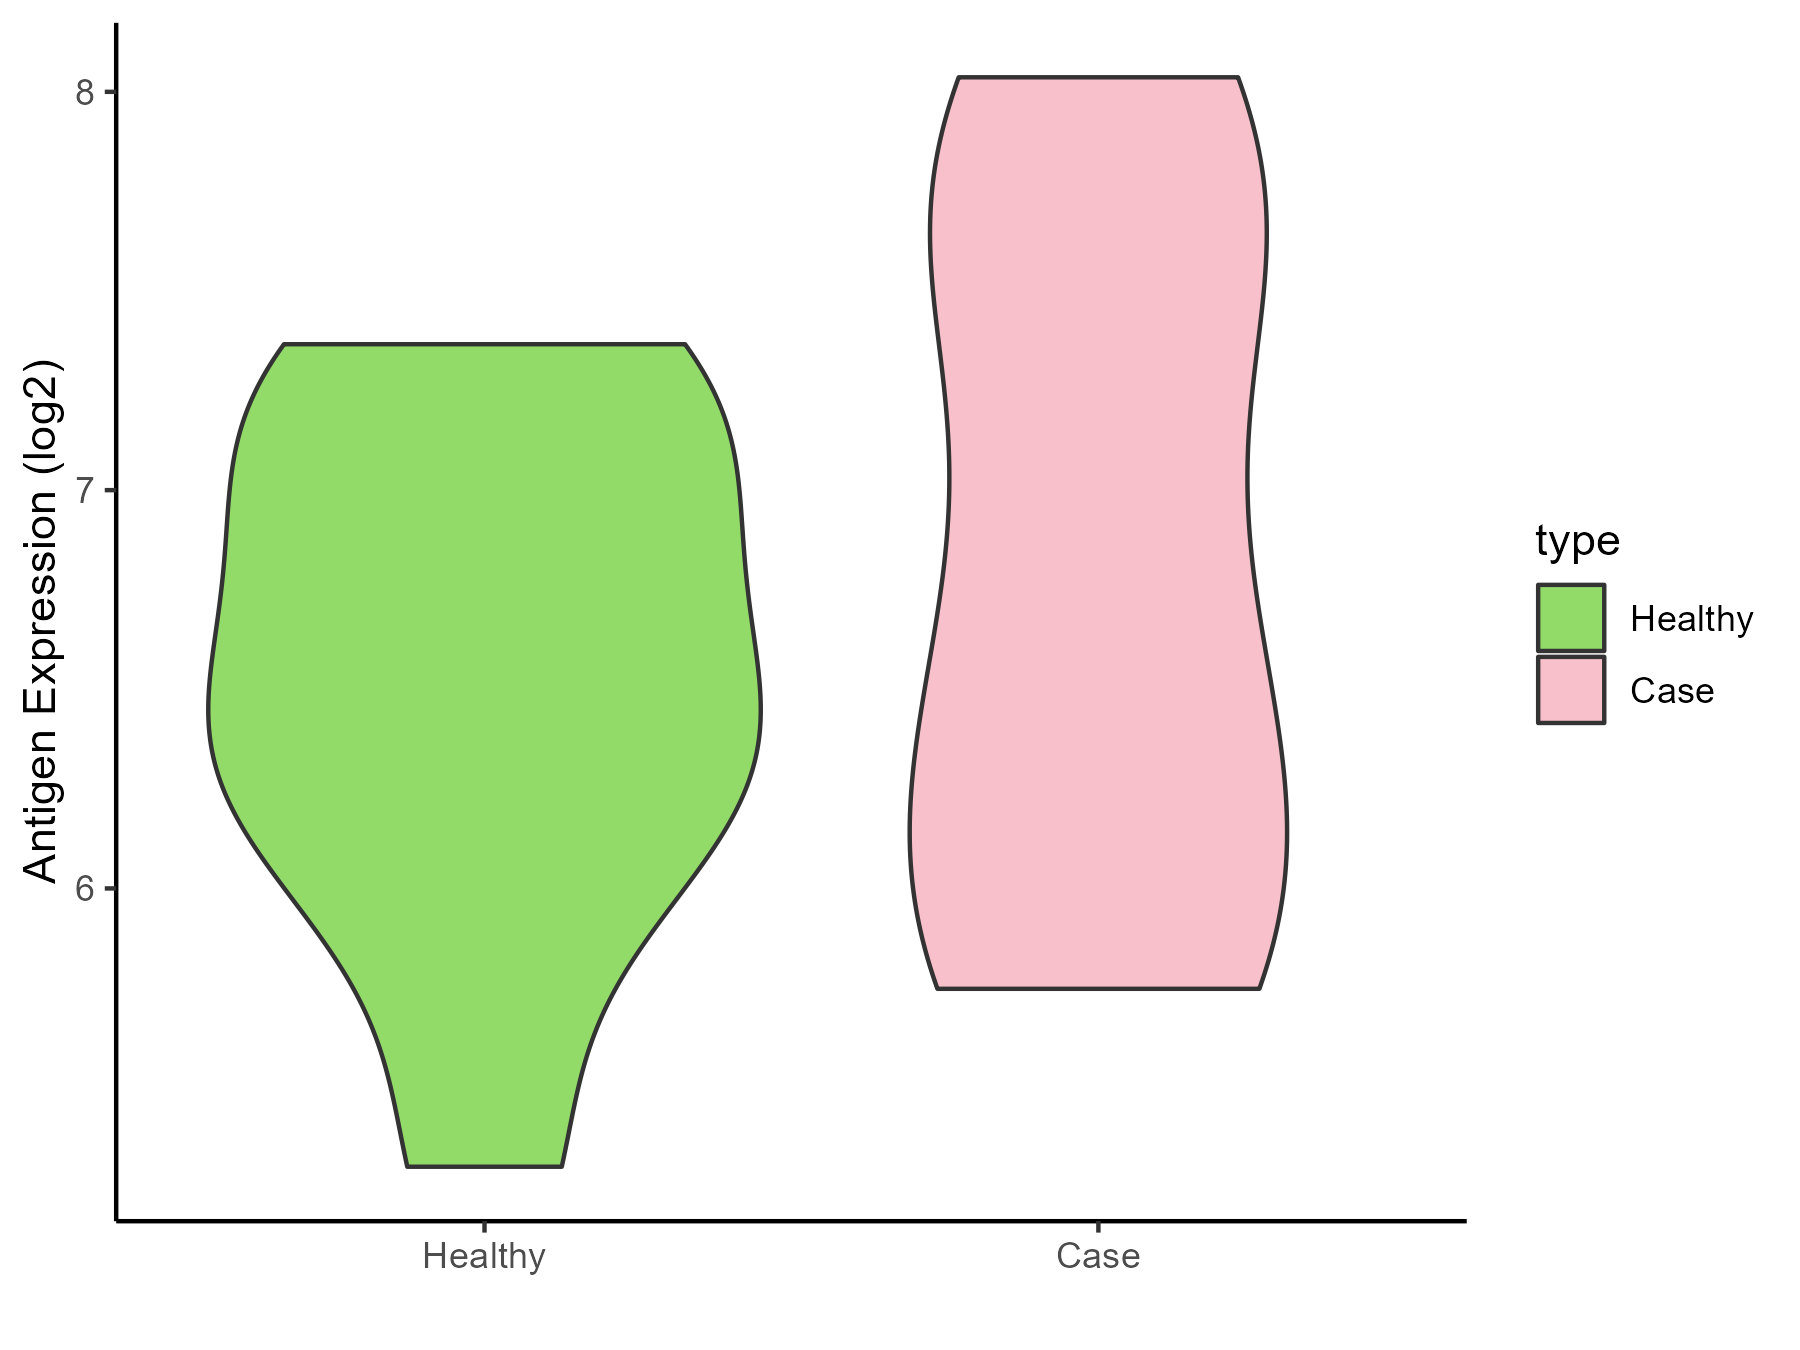
| The Studied Tissue | Calcified aortic valve | |
| The Specific Disease | Aortic stenosis | |
| The Expression Level of Disease Section Compare with the Healthy Individual Tissue | p-value: 0.437975657; Fold-change: 0.173803254; Z-score: 0.26590746 | |
| Disease-specific Antigen Abundances |
|
Click to View the Clearer Original Diagram |
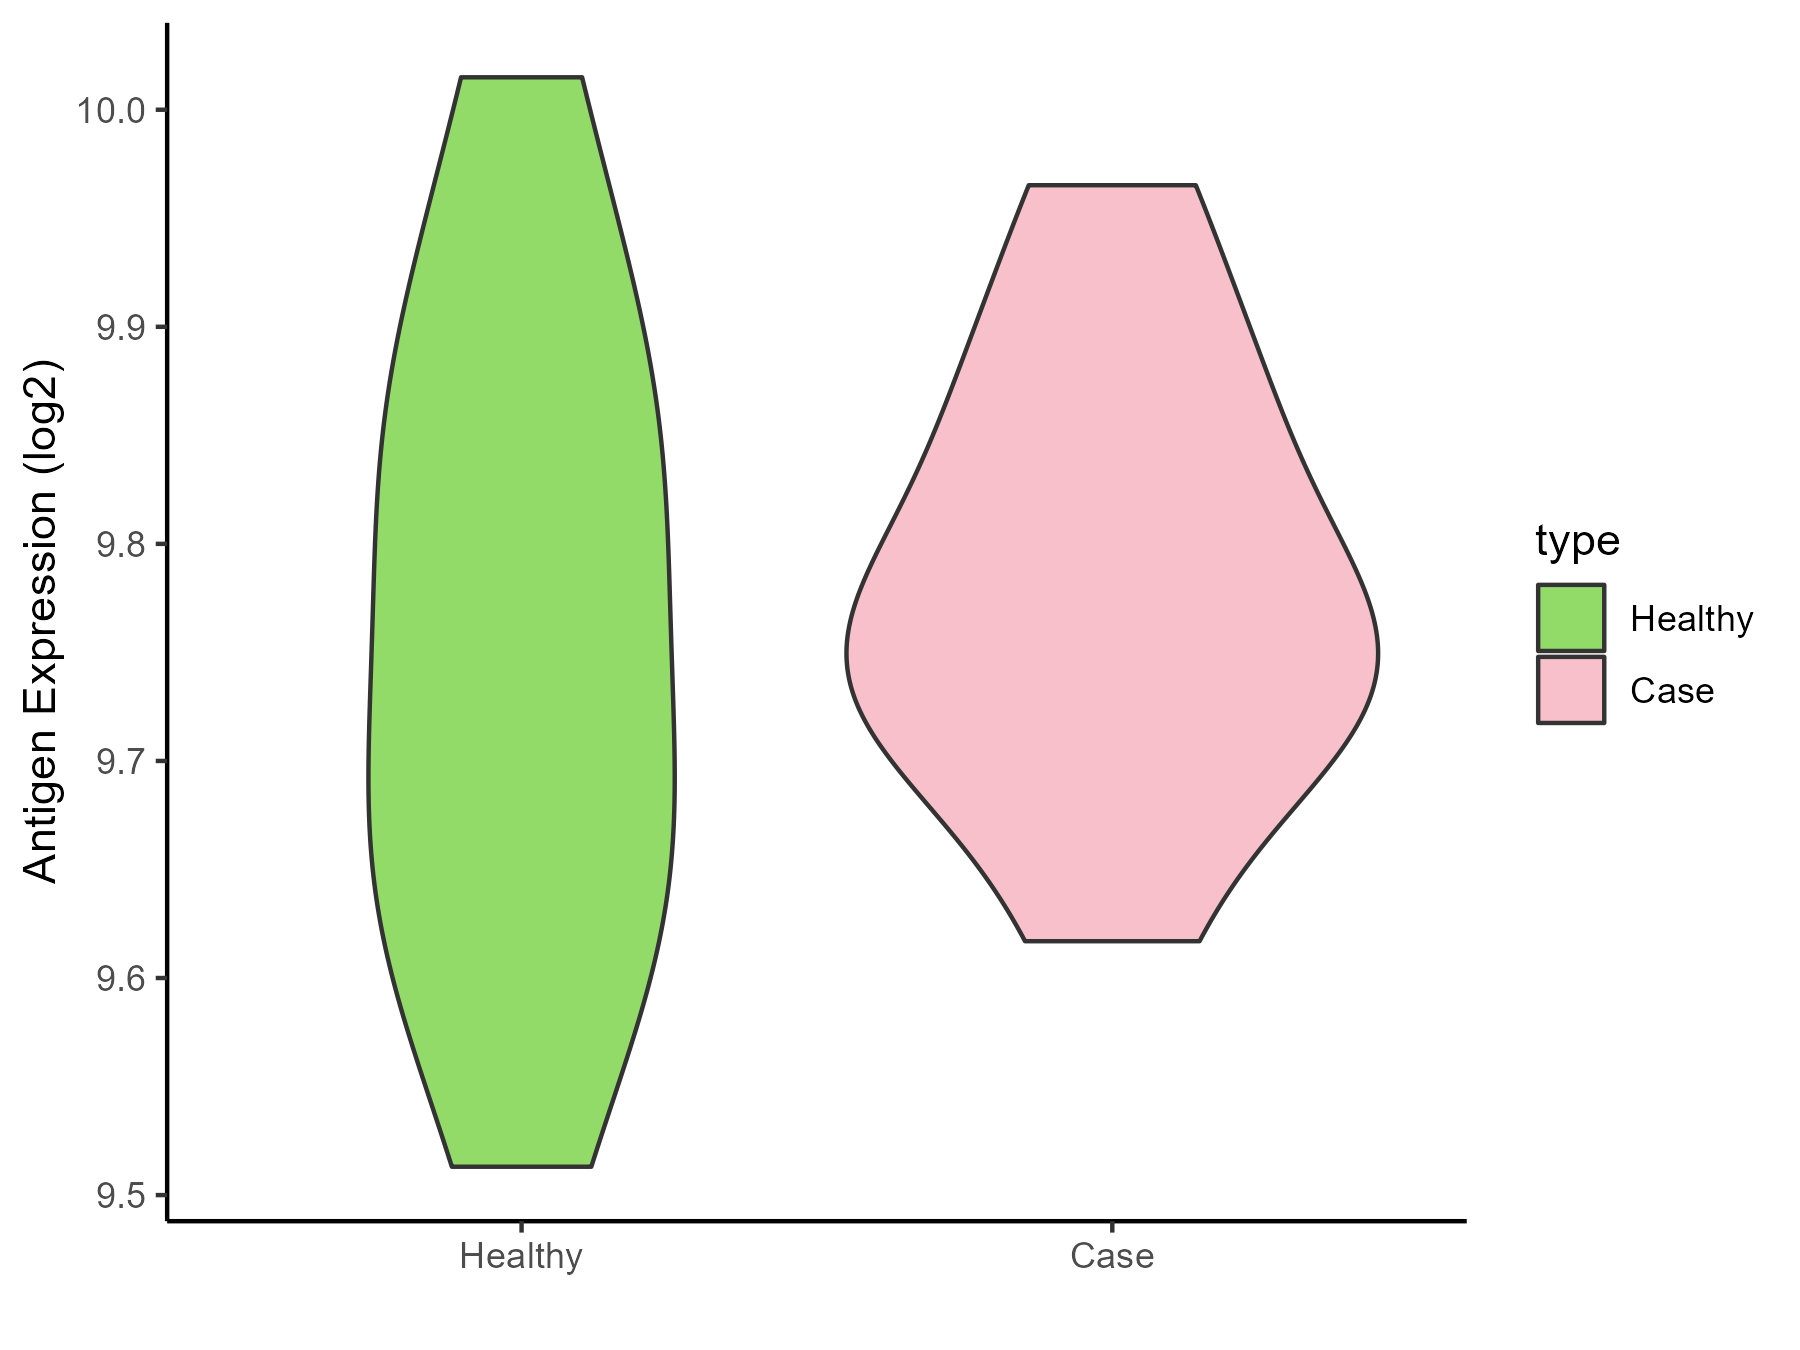
| Differential expression pattern of antigen in diseases | ||
| The Studied Tissue | Peripheral blood | |
| The Specific Disease | Arteriosclerosis | |
| The Expression Level of Disease Section Compare with the Healthy Individual Tissue | p-value: 0.6178541; Fold-change: 0.01800253; Z-score: 0.120391198 | |
| Disease-specific Antigen Abundances |
|
Click to View the Clearer Original Diagram |
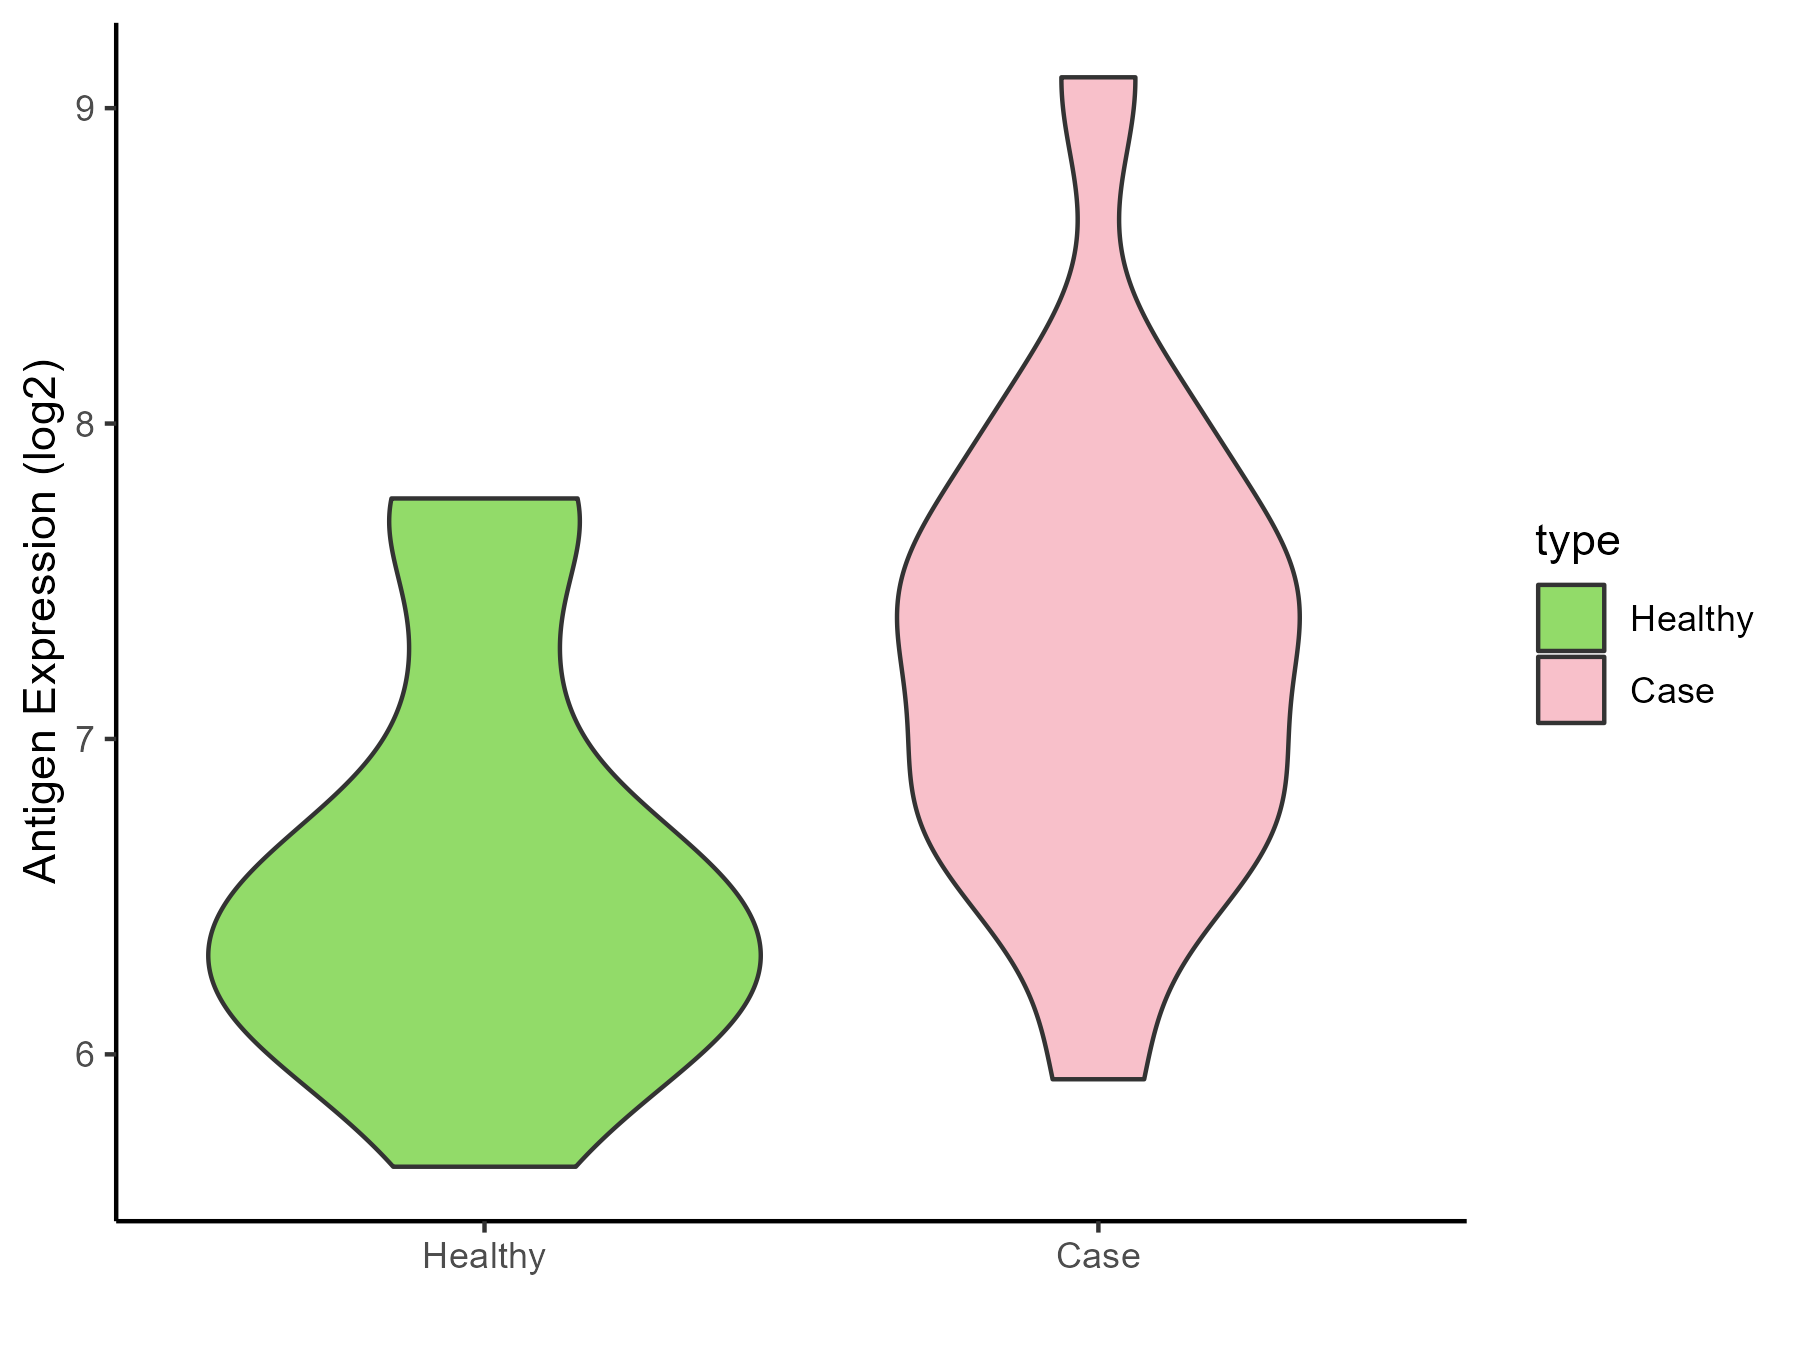
| Differential expression pattern of antigen in diseases | ||
| The Studied Tissue | Intracranial artery | |
| The Specific Disease | Aneurysm | |
| The Expression Level of Disease Section Compare with the Healthy Individual Tissue | p-value: 0.017254186; Fold-change: 0.817987139; Z-score: 1.261262327 | |
| Disease-specific Antigen Abundances |
|
Click to View the Clearer Original Diagram |
ICD Disease Classification 12
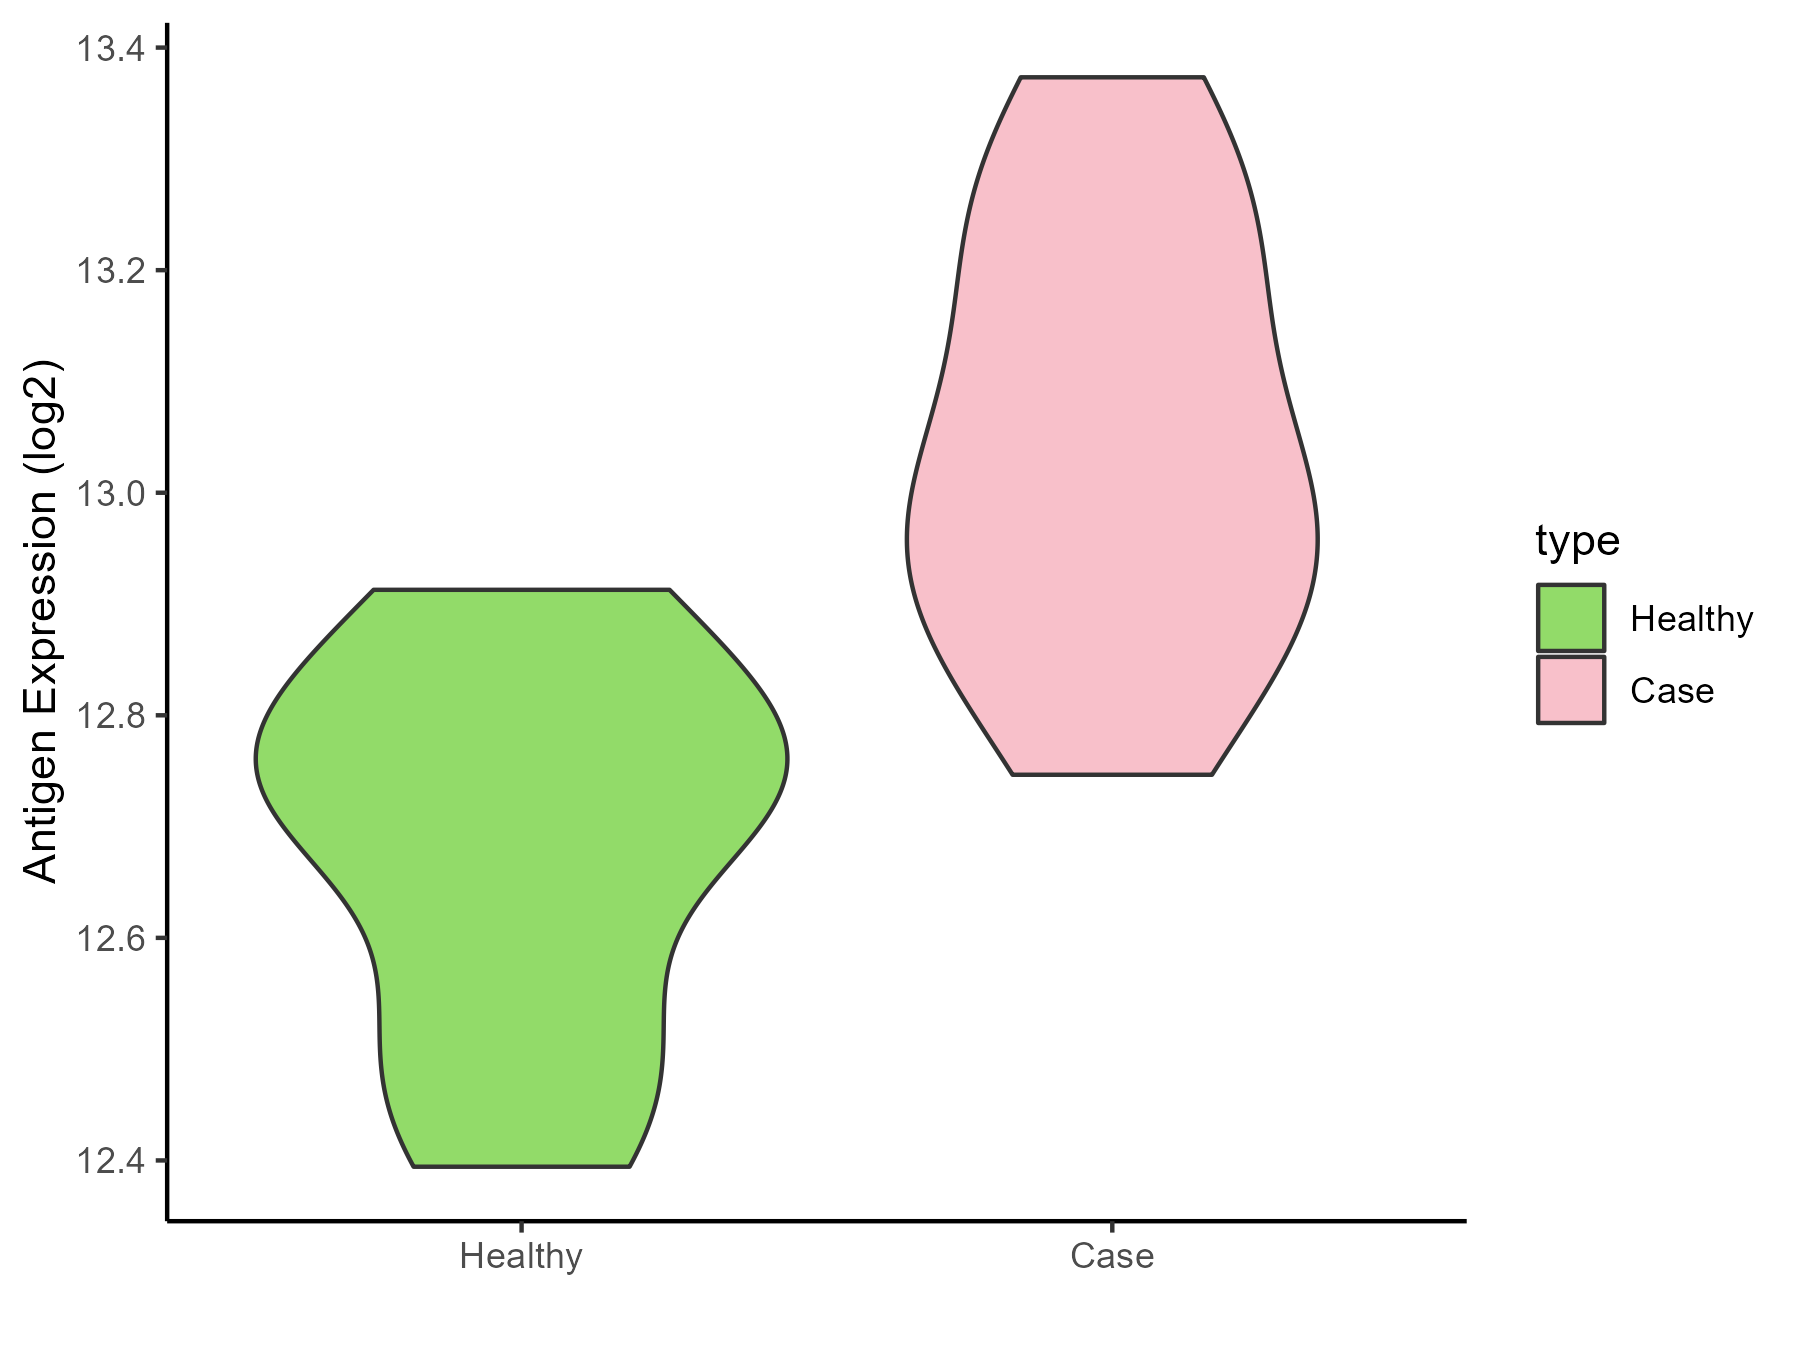
| Differential expression pattern of antigen in diseases | ||
| The Studied Tissue | Peripheral blood | |
| The Specific Disease | Immunodeficiency | |
| The Expression Level of Disease Section Compare with the Healthy Individual Tissue | p-value: 0.000366052; Fold-change: 0.261612656; Z-score: 1.504551054 | |
| Disease-specific Antigen Abundances |
|
Click to View the Clearer Original Diagram |
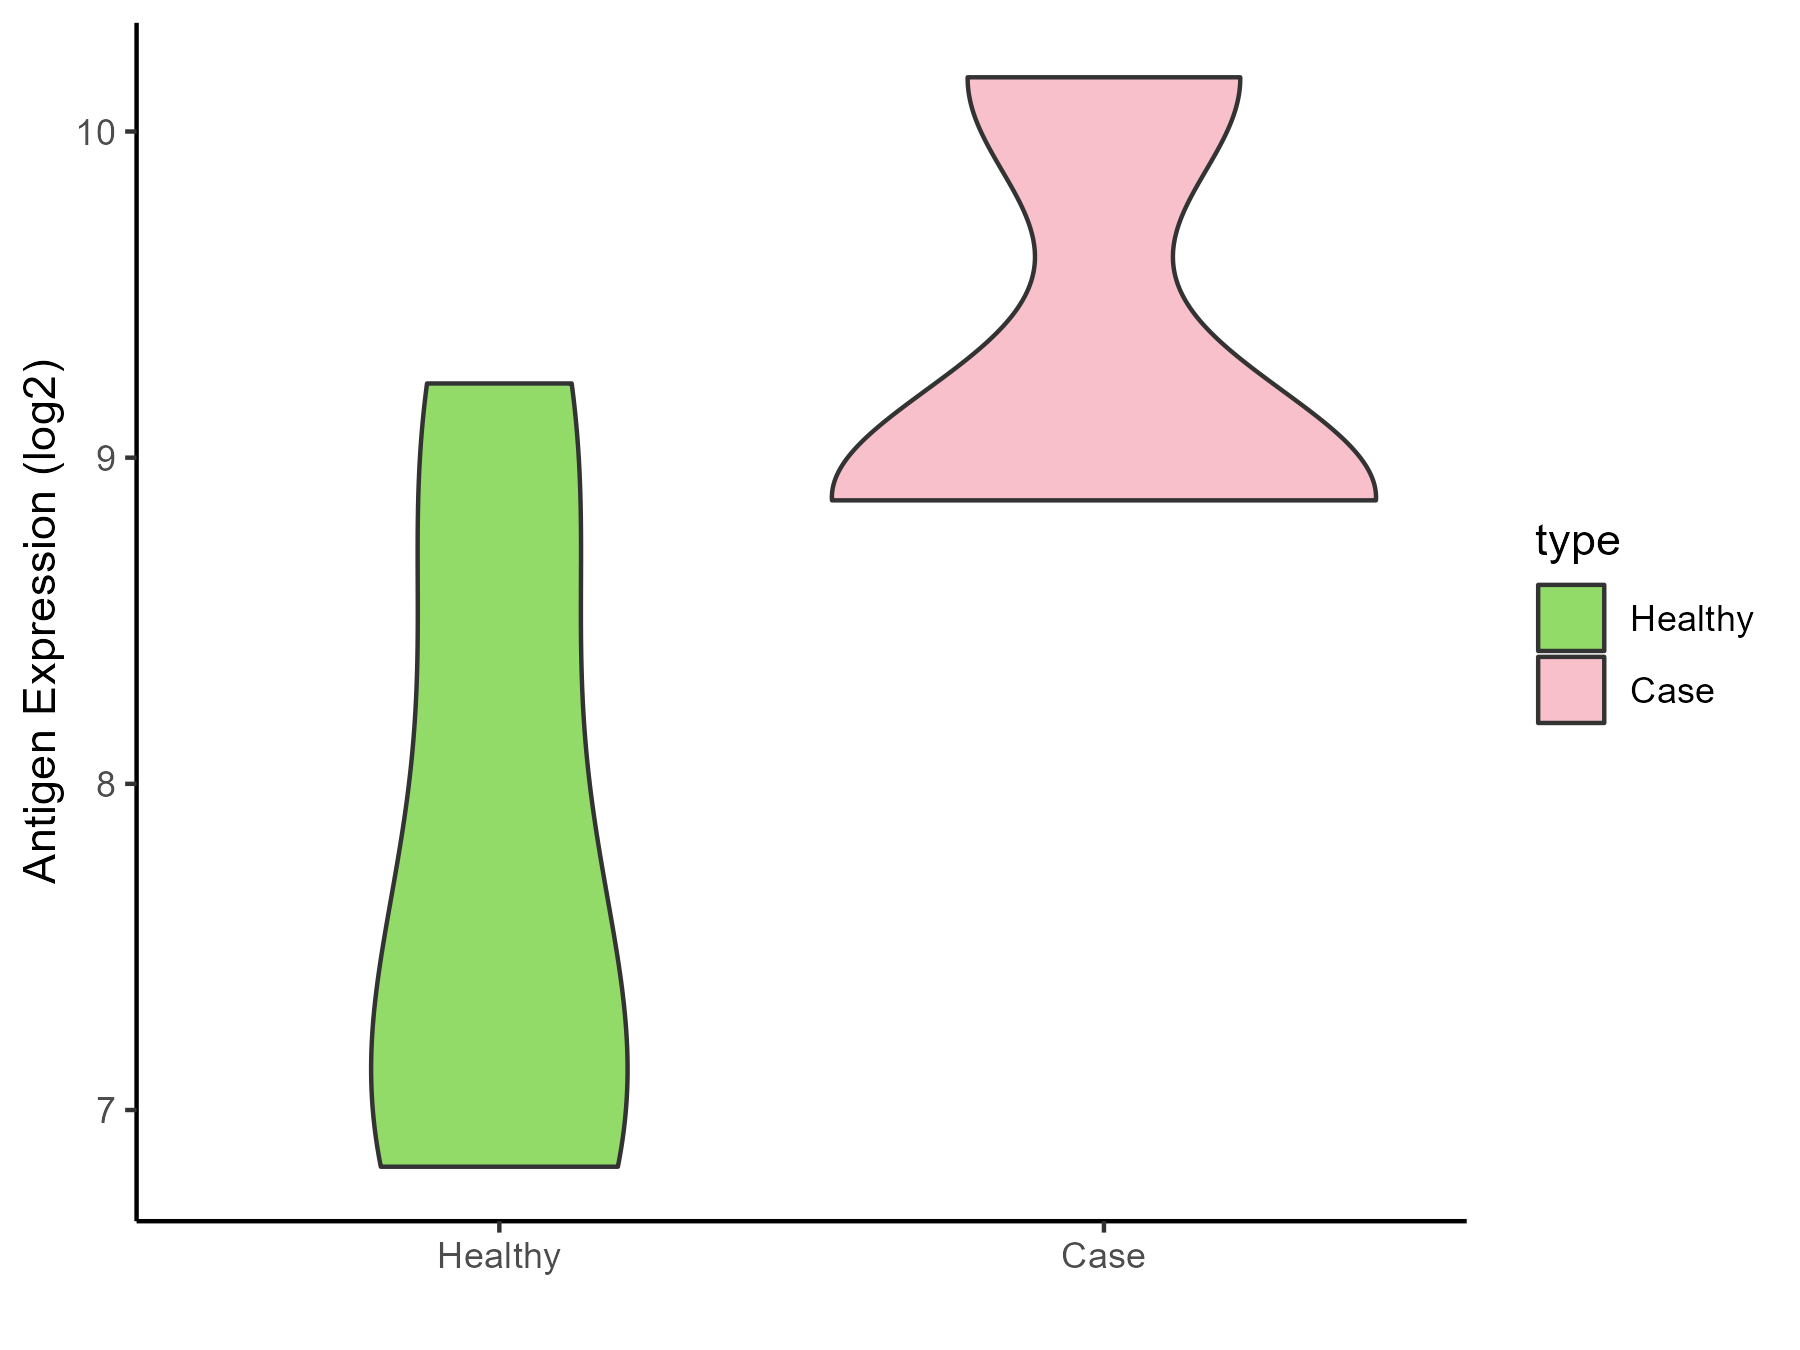
| Differential expression pattern of antigen in diseases | ||
| The Studied Tissue | Hyperplastic tonsil | |
| The Specific Disease | Apnea | |
| The Expression Level of Disease Section Compare with the Healthy Individual Tissue | p-value: 0.044600423; Fold-change: 1.397651856; Z-score: 1.384496045 | |
| Disease-specific Antigen Abundances |
|
Click to View the Clearer Original Diagram |
| Differential expression pattern of antigen in diseases | ||
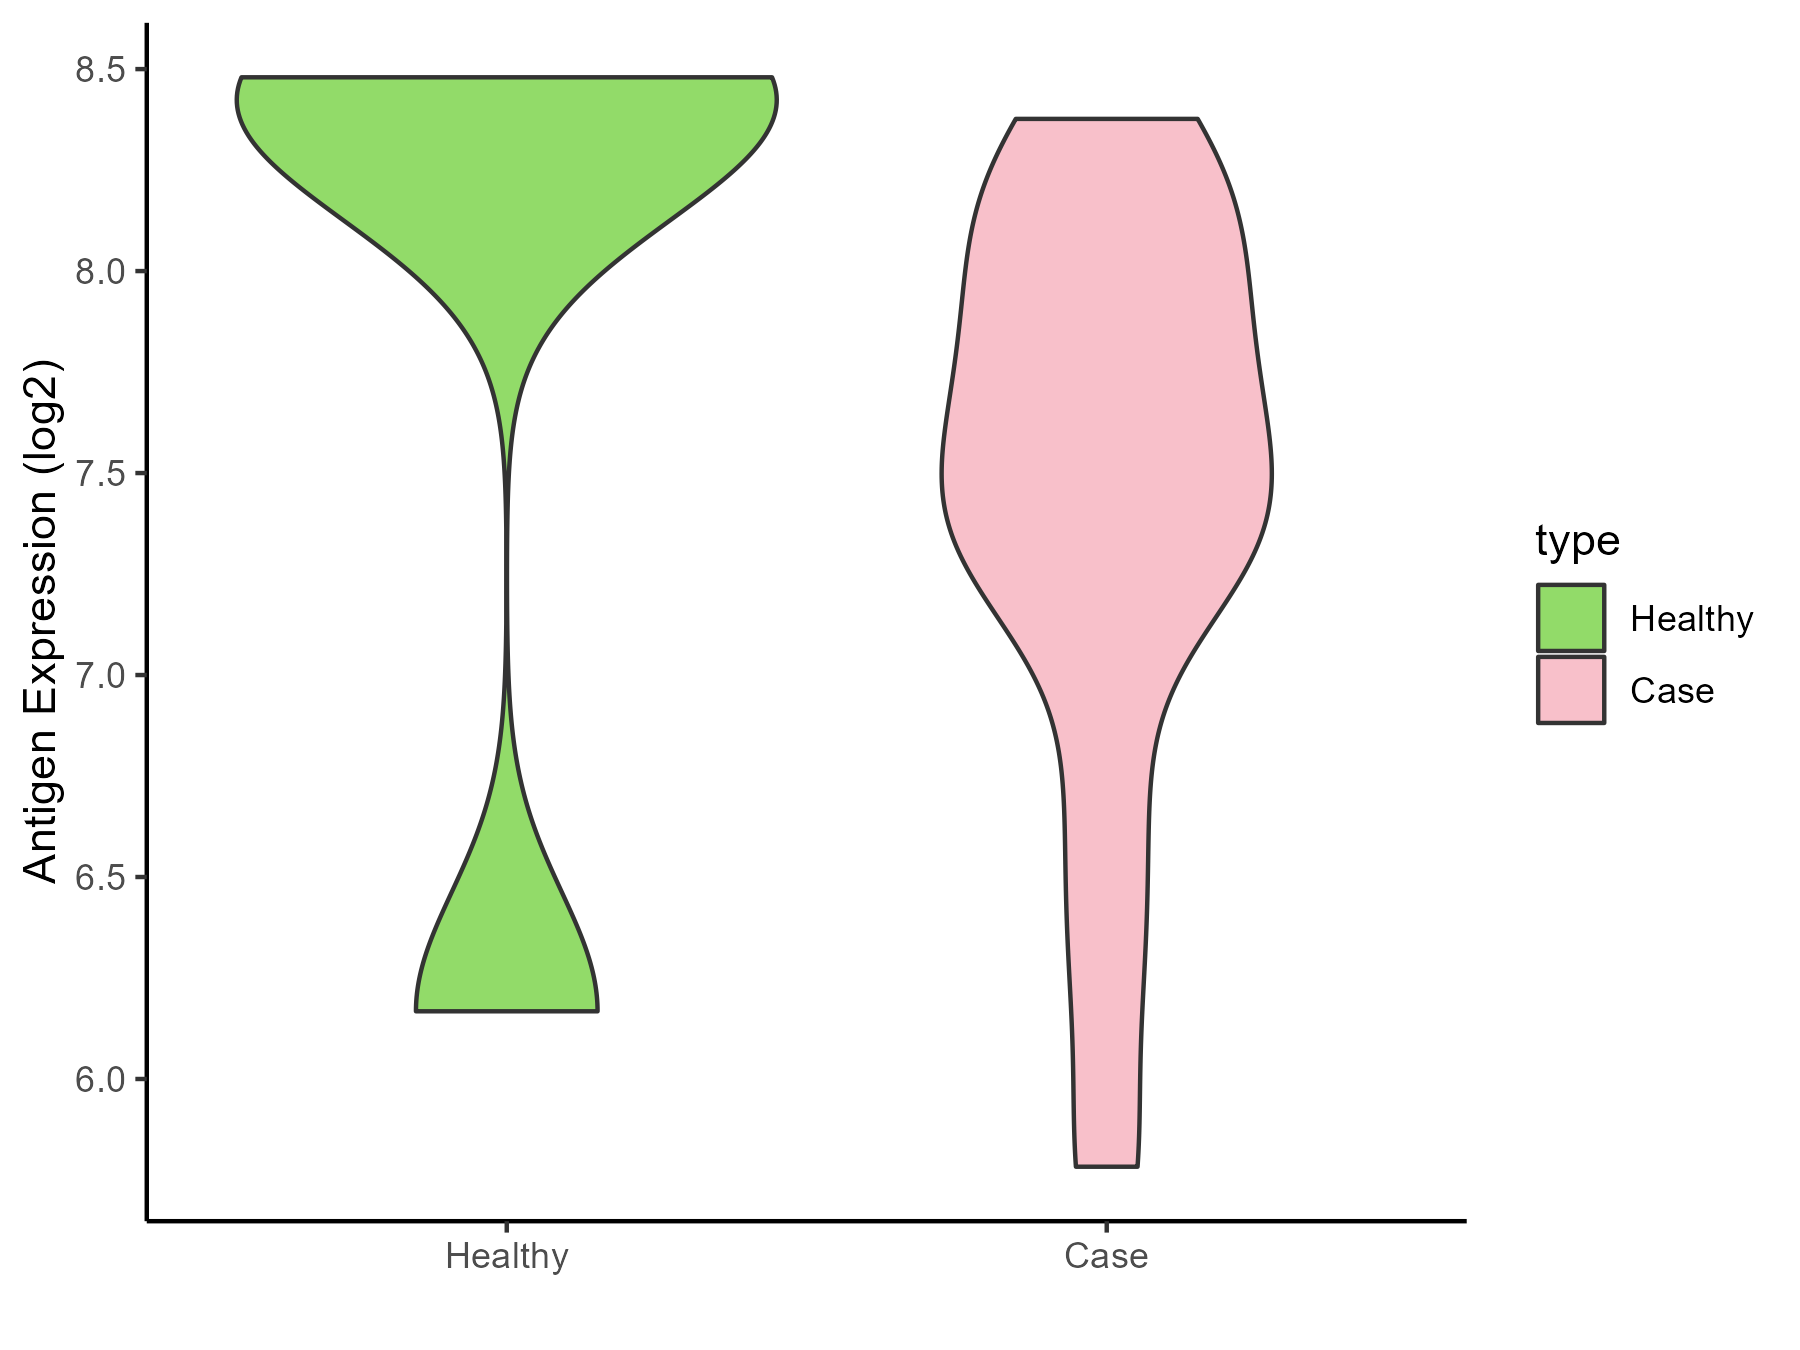
| The Studied Tissue | Peripheral blood | |
| The Specific Disease | Olive pollen allergy | |
| The Expression Level of Disease Section Compare with the Healthy Individual Tissue | p-value: 0.533979705; Fold-change: -0.903393948; Z-score: -0.800223651 | |
| Disease-specific Antigen Abundances |
|
Click to View the Clearer Original Diagram |
| Differential expression pattern of antigen in diseases | ||
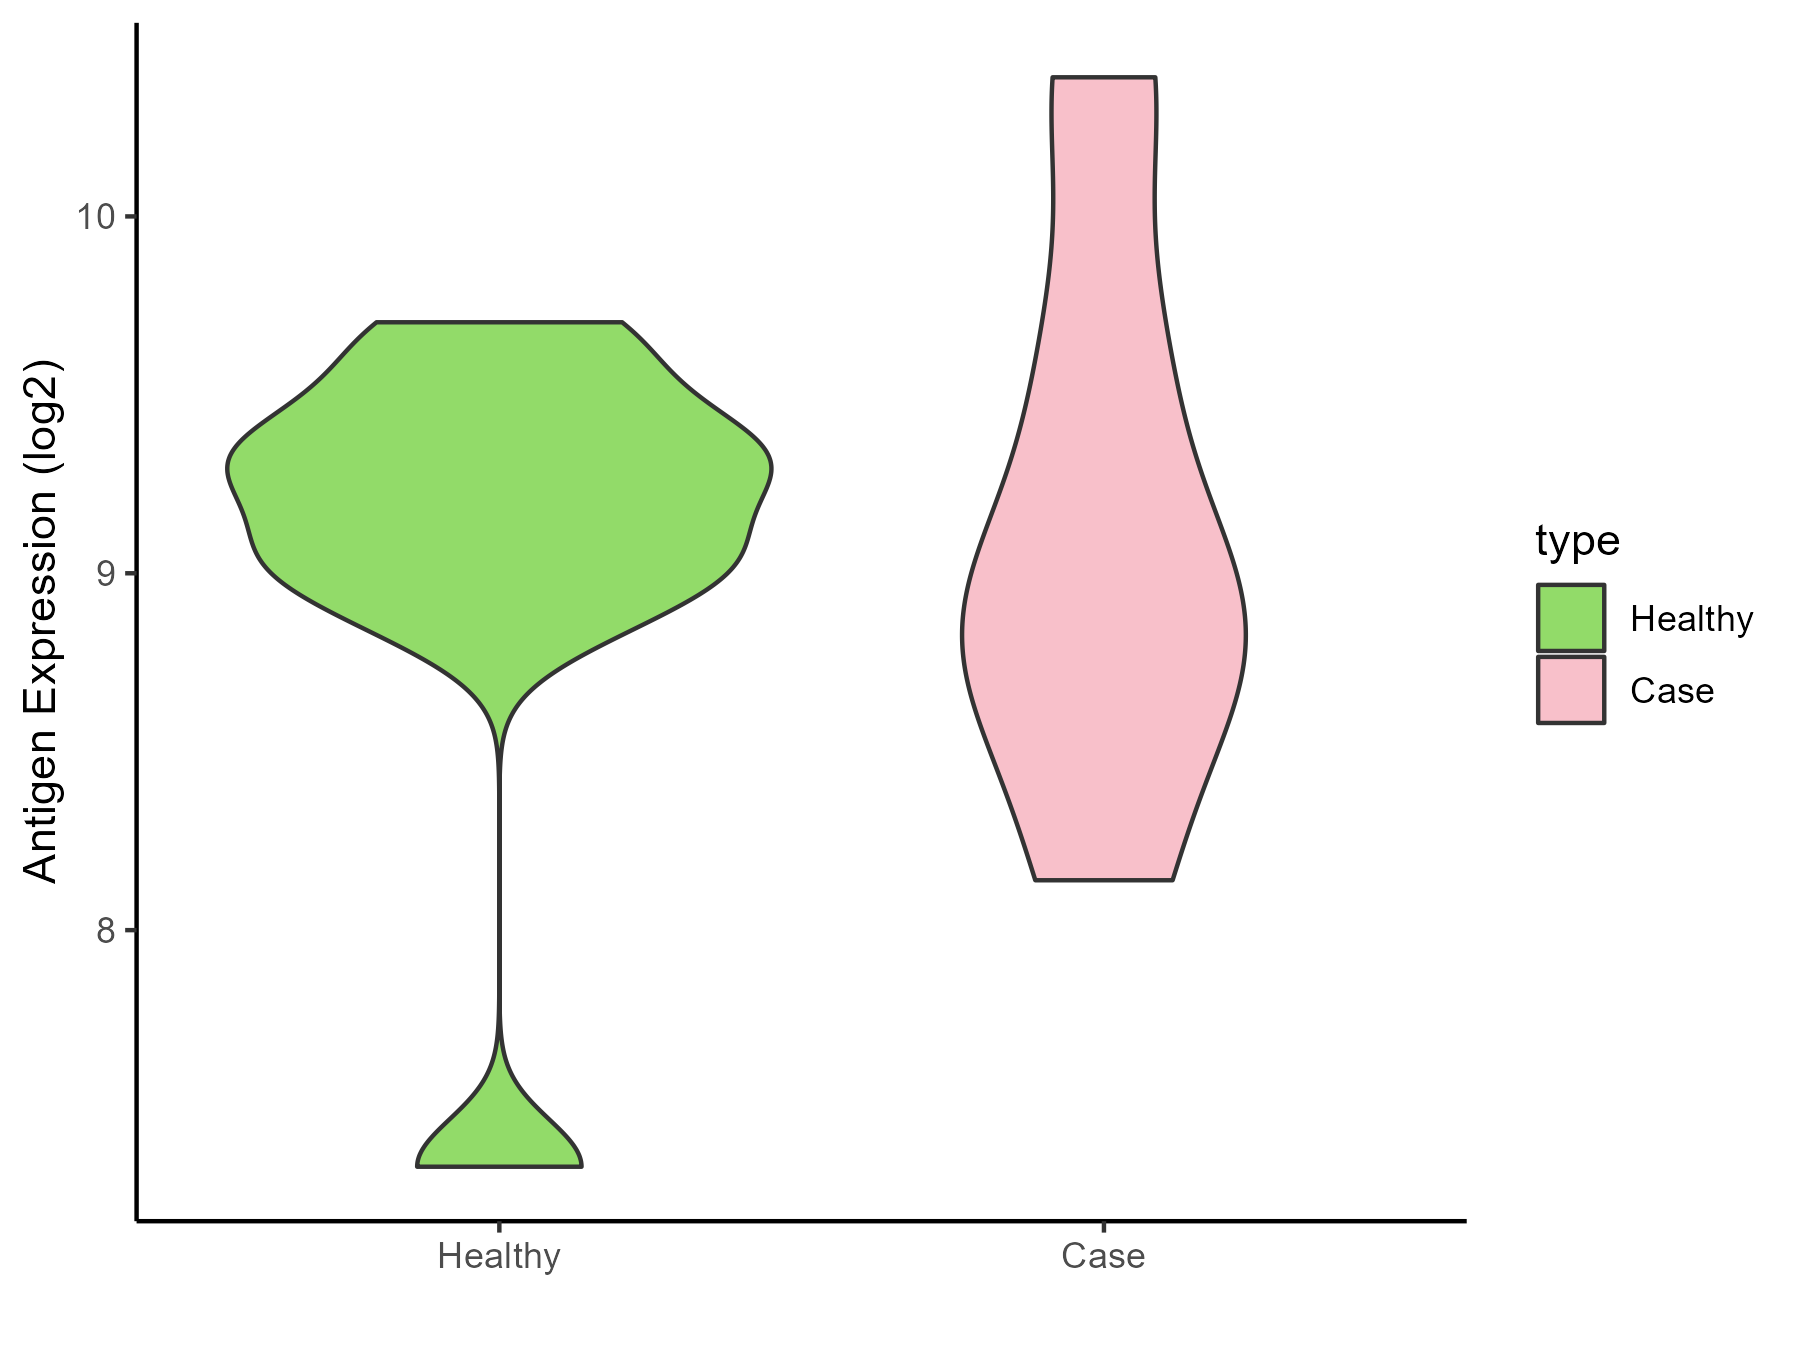
| The Studied Tissue | Sinus mucosa | |
| The Specific Disease | Chronic rhinosinusitis | |
| The Expression Level of Disease Section Compare with the Healthy Individual Tissue | p-value: 0.872269073; Fold-change: -0.319655206; Z-score: -0.461695577 | |
| Disease-specific Antigen Abundances |
|
Click to View the Clearer Original Diagram |
| Differential expression pattern of antigen in diseases | ||
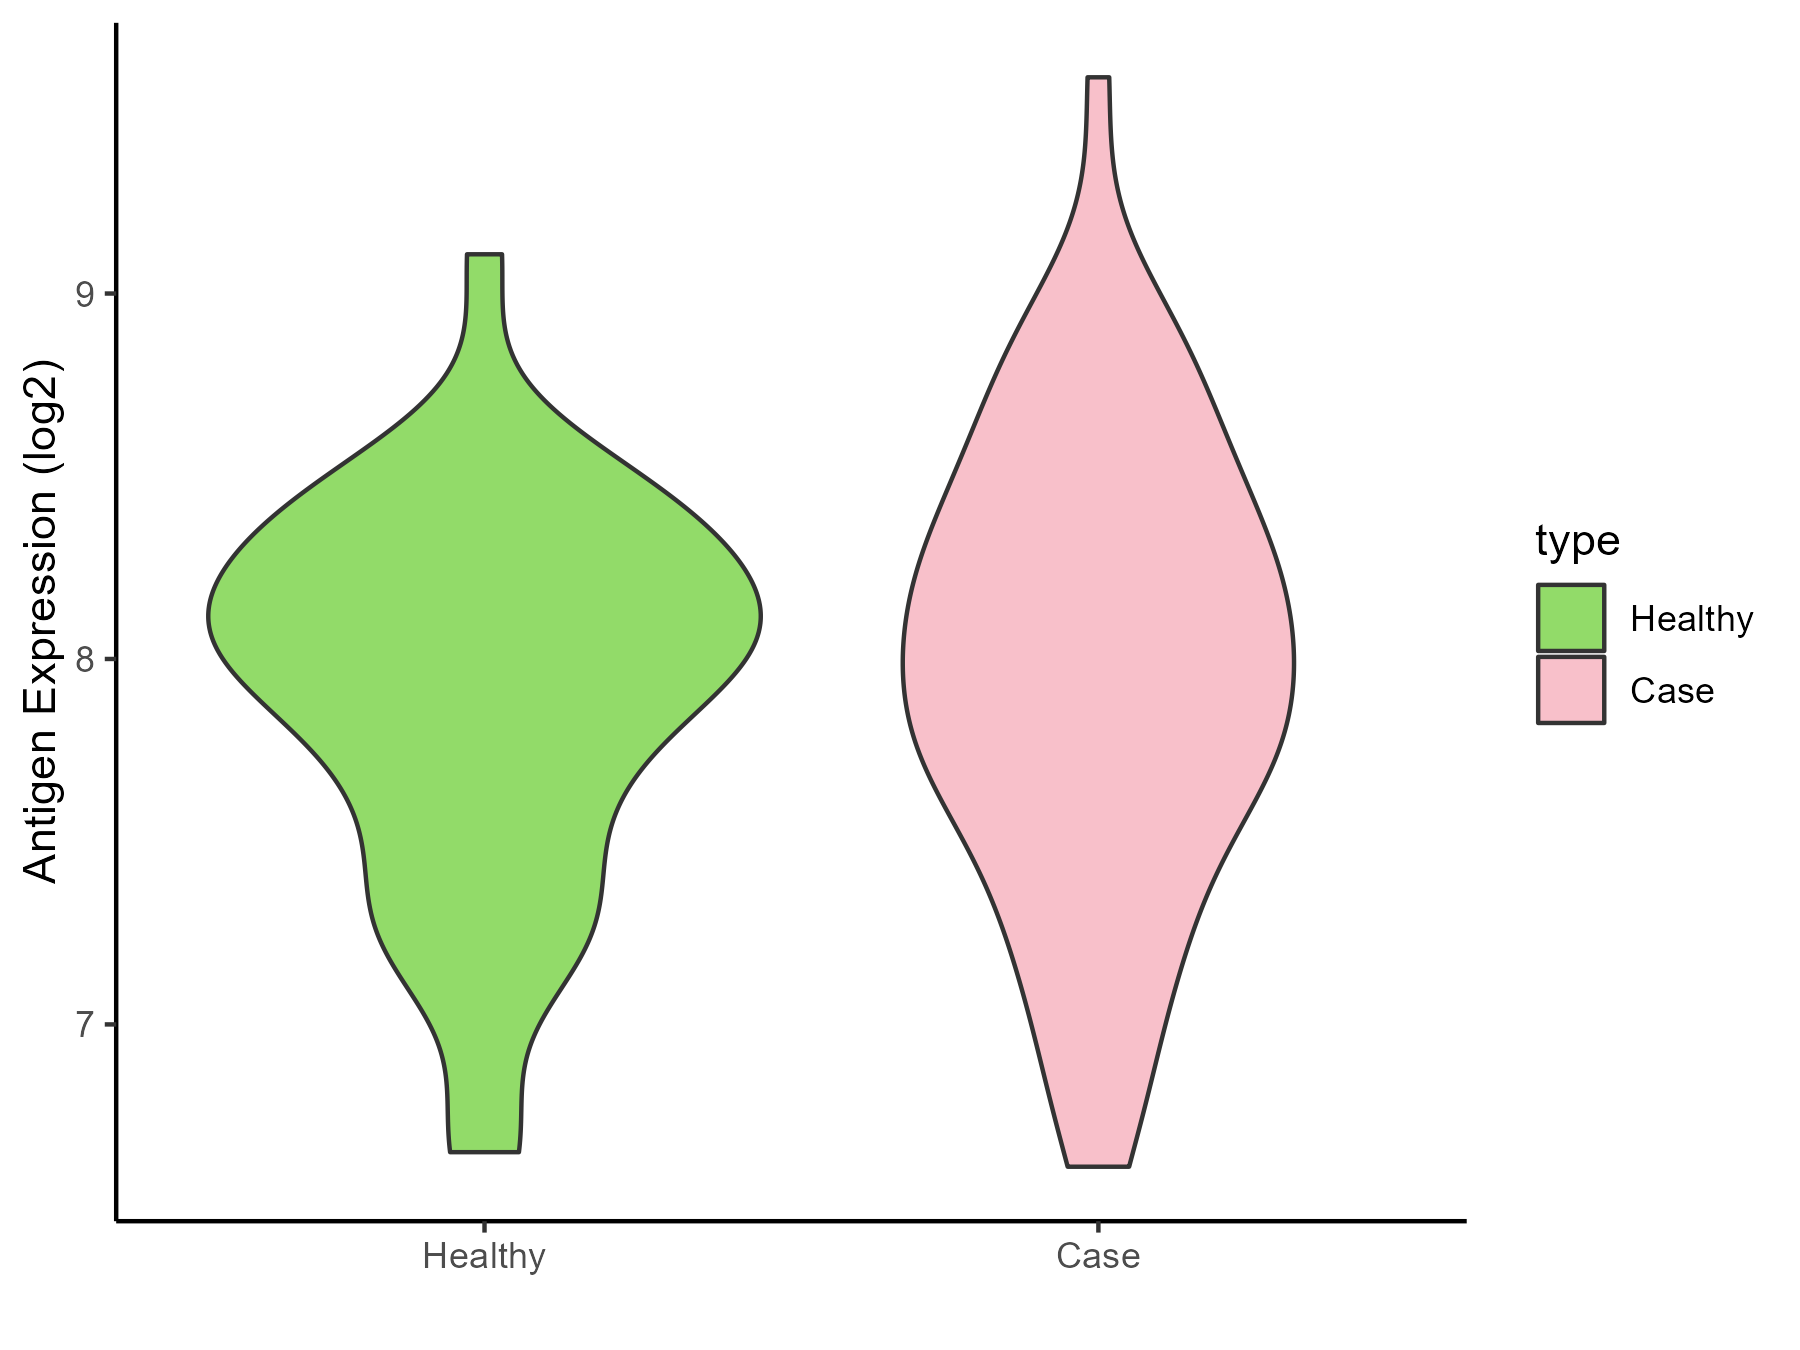
| The Studied Tissue | Lung | |
| The Specific Disease | Chronic obstructive pulmonary disease | |
| The Expression Level of Disease Section Compare with the Healthy Individual Tissue | p-value: 0.563348901; Fold-change: 0.013208686; Z-score: 0.025246085 | |
| Disease-specific Antigen Abundances |
|
Click to View the Clearer Original Diagram |
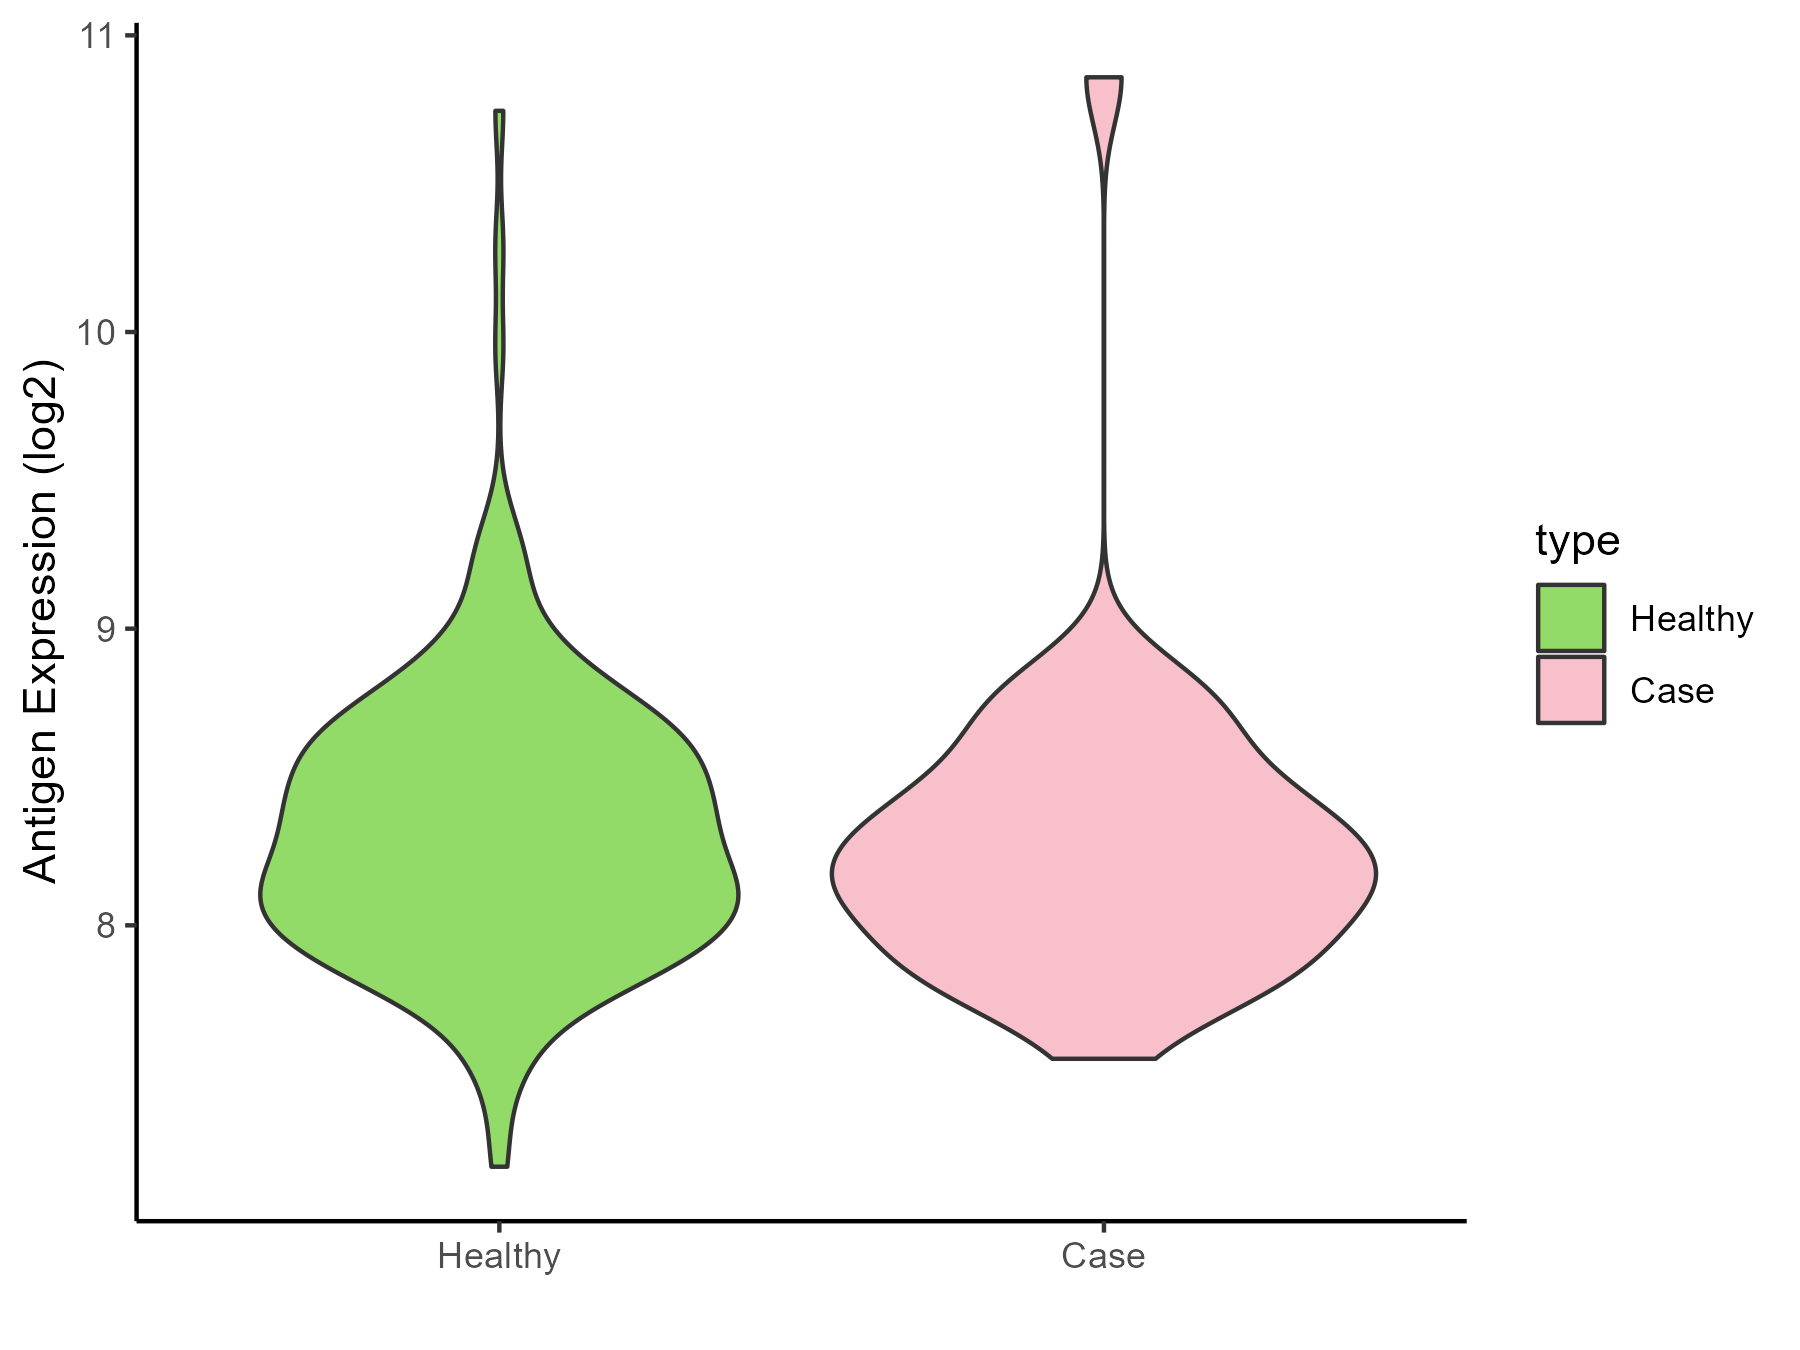
| The Studied Tissue | Small airway epithelium | |
| The Specific Disease | Chronic obstructive pulmonary disease | |
| The Expression Level of Disease Section Compare with the Healthy Individual Tissue | p-value: 0.63572209; Fold-change: -0.074926532; Z-score: -0.160687875 | |
| Disease-specific Antigen Abundances |
|
Click to View the Clearer Original Diagram |
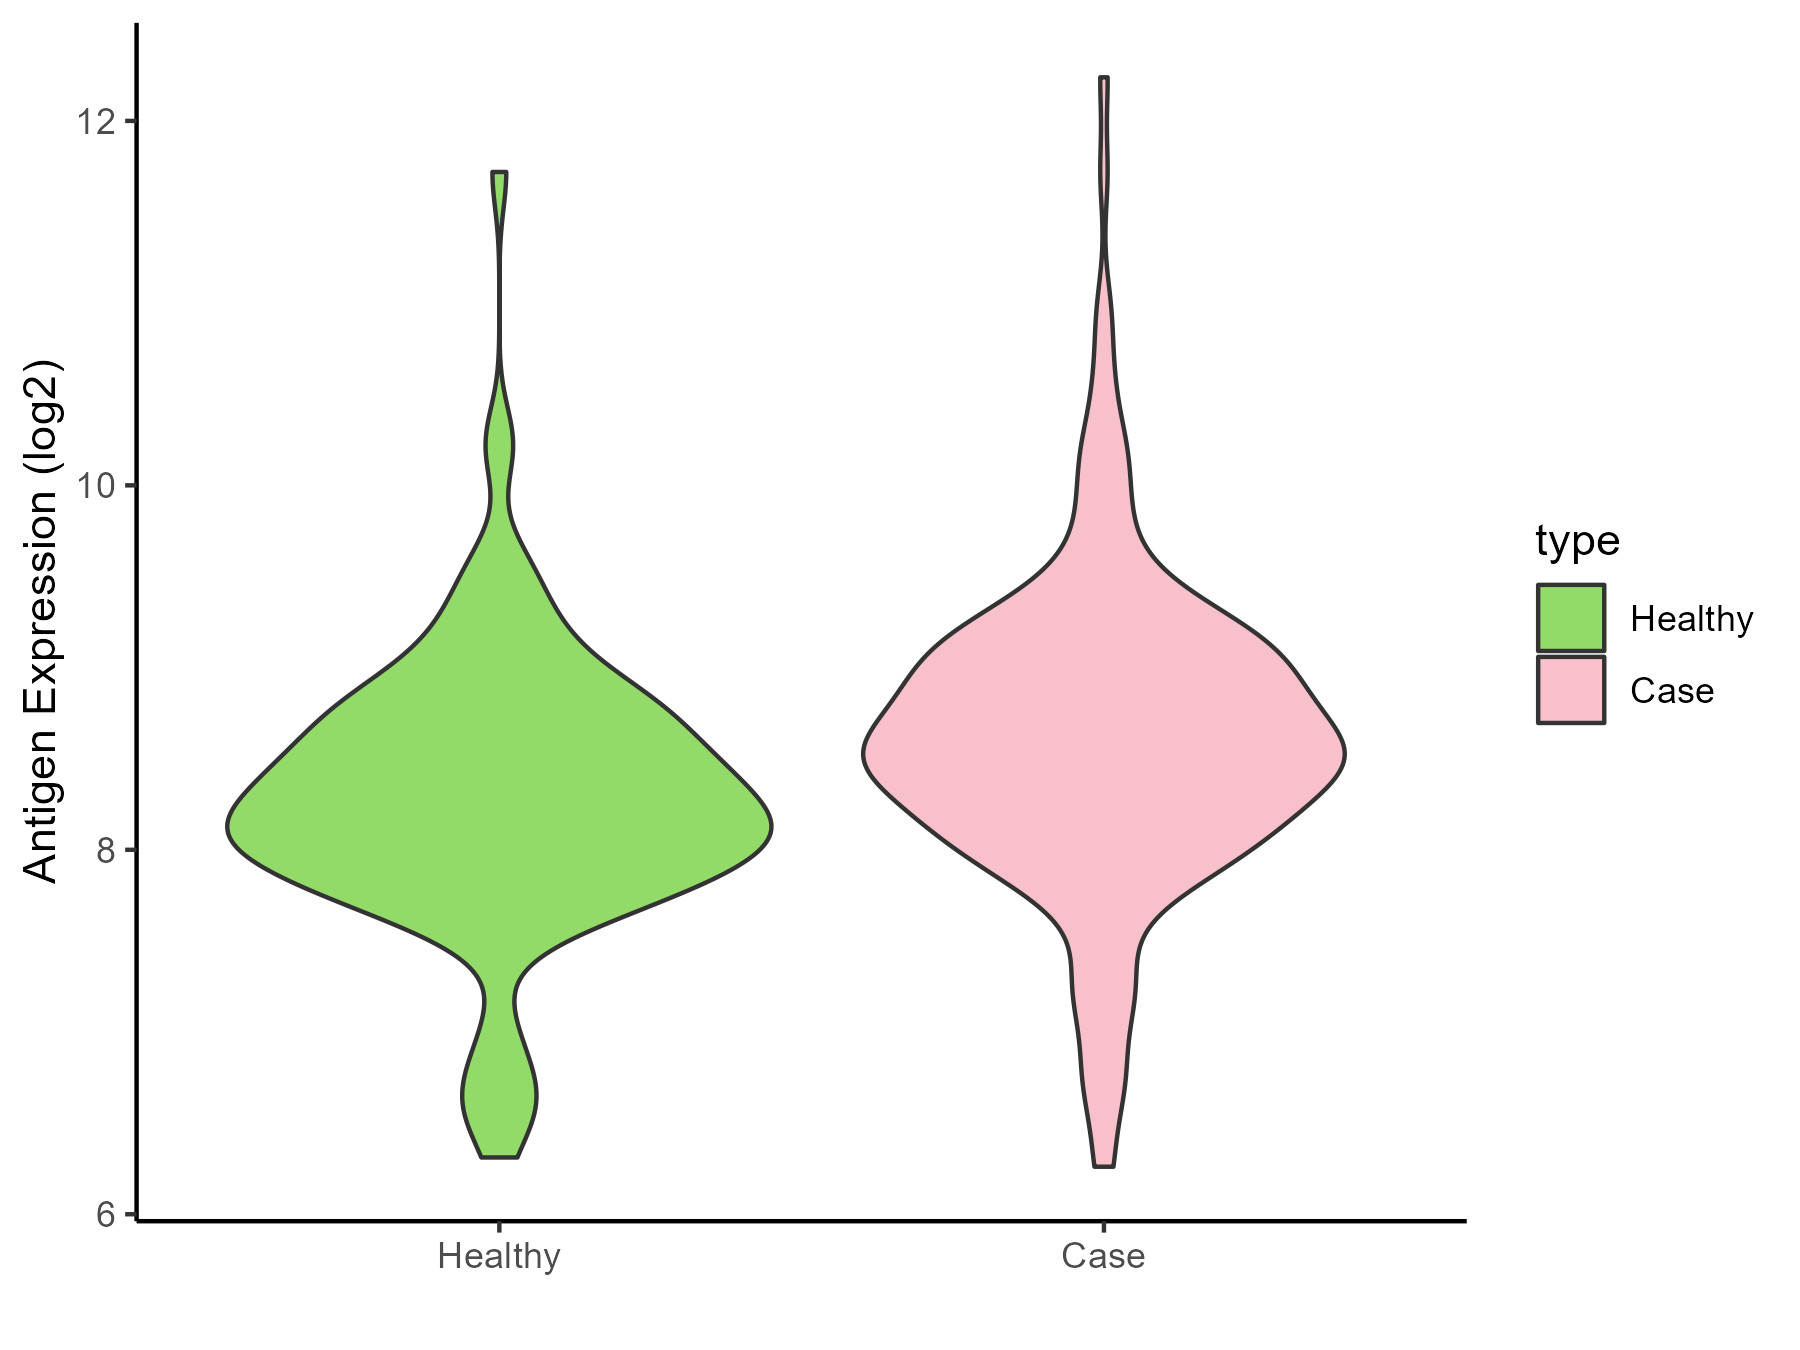
| Differential expression pattern of antigen in diseases | ||
| The Studied Tissue | Nasal and bronchial airway | |
| The Specific Disease | Asthma | |
| The Expression Level of Disease Section Compare with the Healthy Individual Tissue | p-value: 0.00096602; Fold-change: 0.310390634; Z-score: 0.408108685 | |
| Disease-specific Antigen Abundances |
|
Click to View the Clearer Original Diagram |
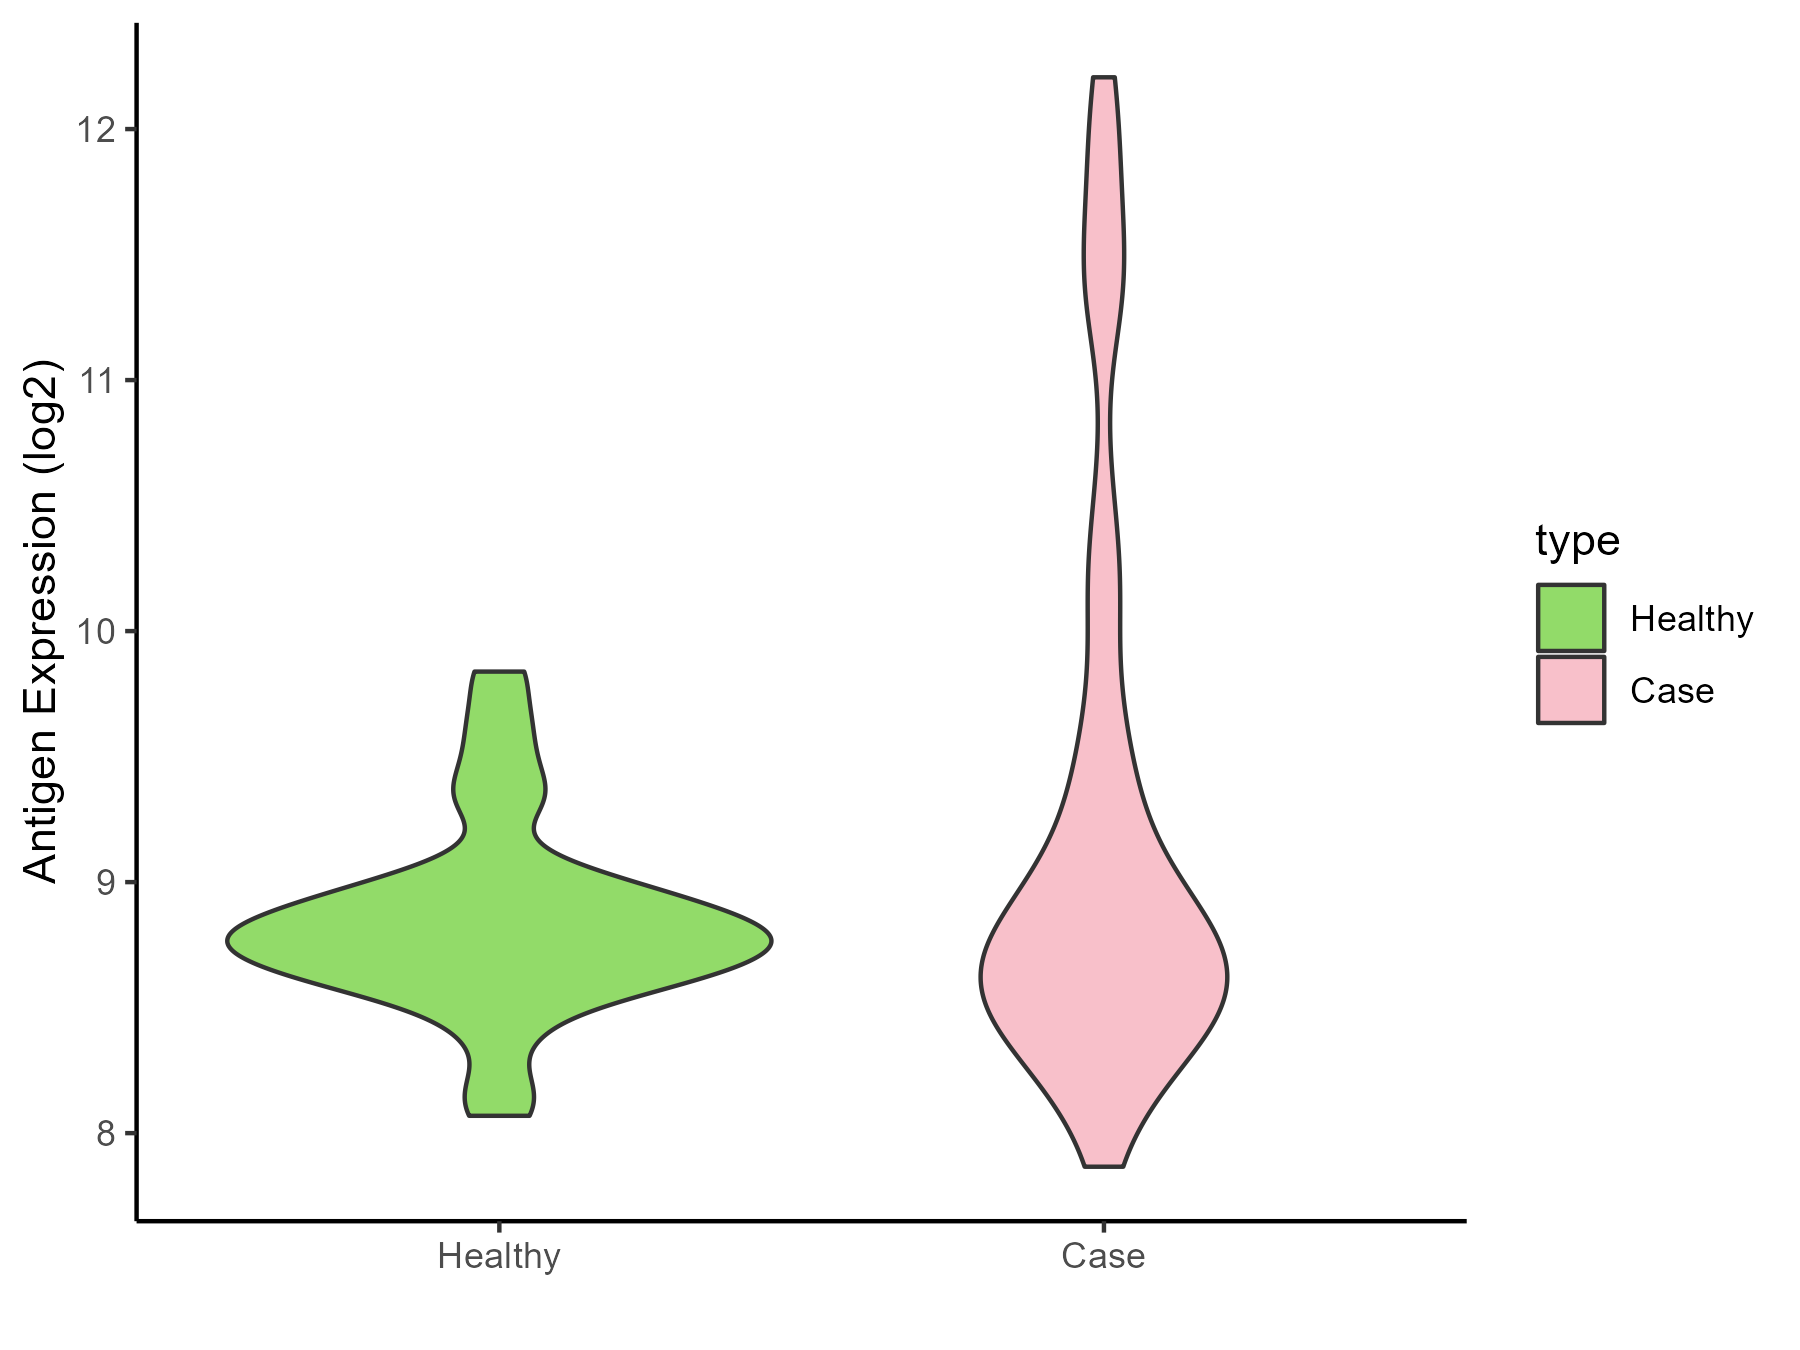
| Differential expression pattern of antigen in diseases | ||
| The Studied Tissue | Nasal Epithelium | |
| The Specific Disease | Human rhinovirus infection | |
| The Expression Level of Disease Section Compare with the Healthy Individual Tissue | p-value: 0.019480272; Fold-change: 0.004269845; Z-score: 0.011337424 | |
| Disease-specific Antigen Abundances |
|
Click to View the Clearer Original Diagram |
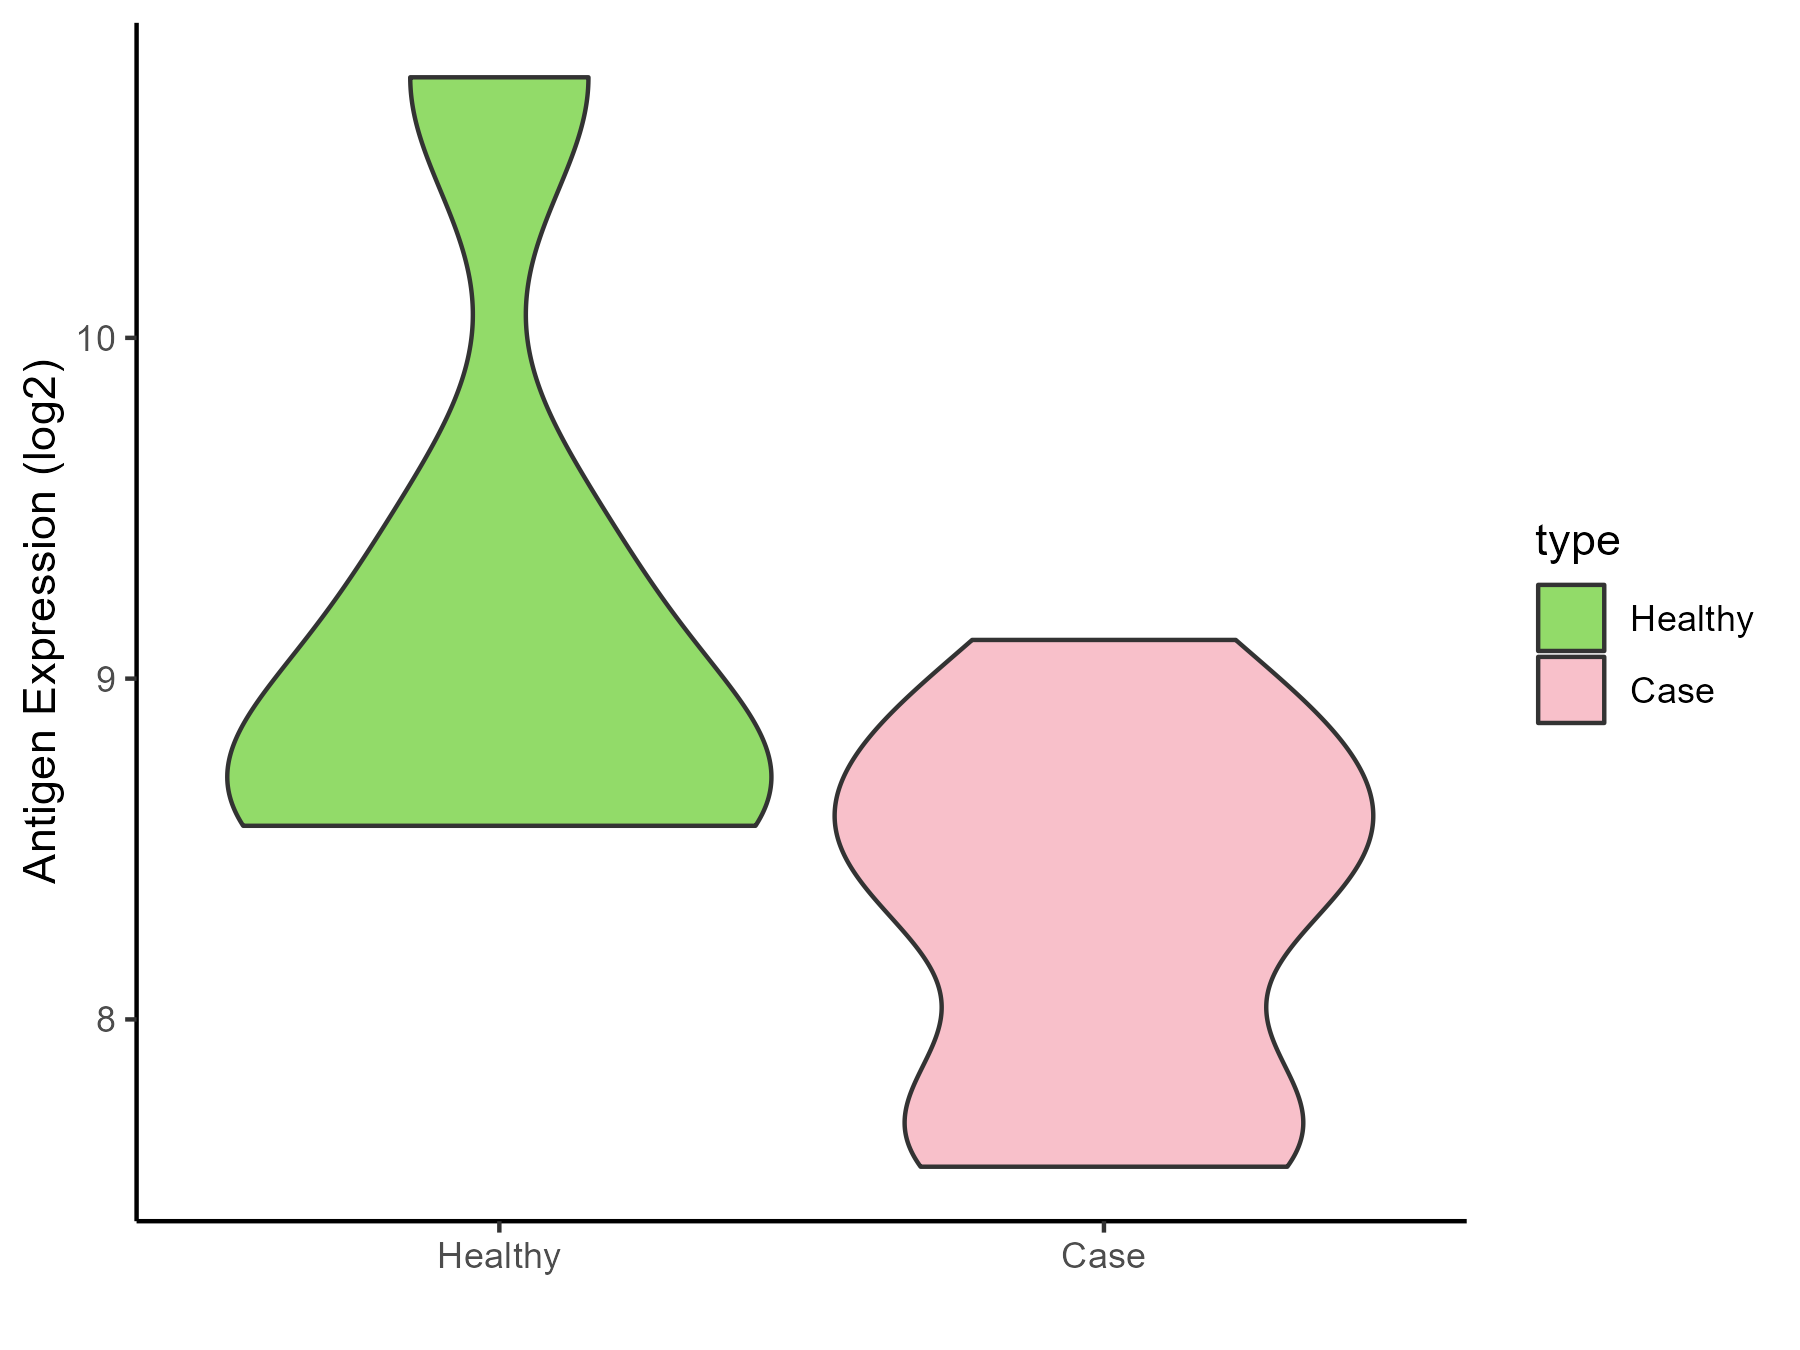
| Differential expression pattern of antigen in diseases | ||
| The Studied Tissue | Lung | |
| The Specific Disease | Idiopathic pulmonary fibrosis | |
| The Expression Level of Disease Section Compare with the Healthy Individual Tissue | p-value: 0.088096002; Fold-change: -0.398905247; Z-score: -0.435663044 | |
| Disease-specific Antigen Abundances |
|
Click to View the Clearer Original Diagram |
ICD Disease Classification 13
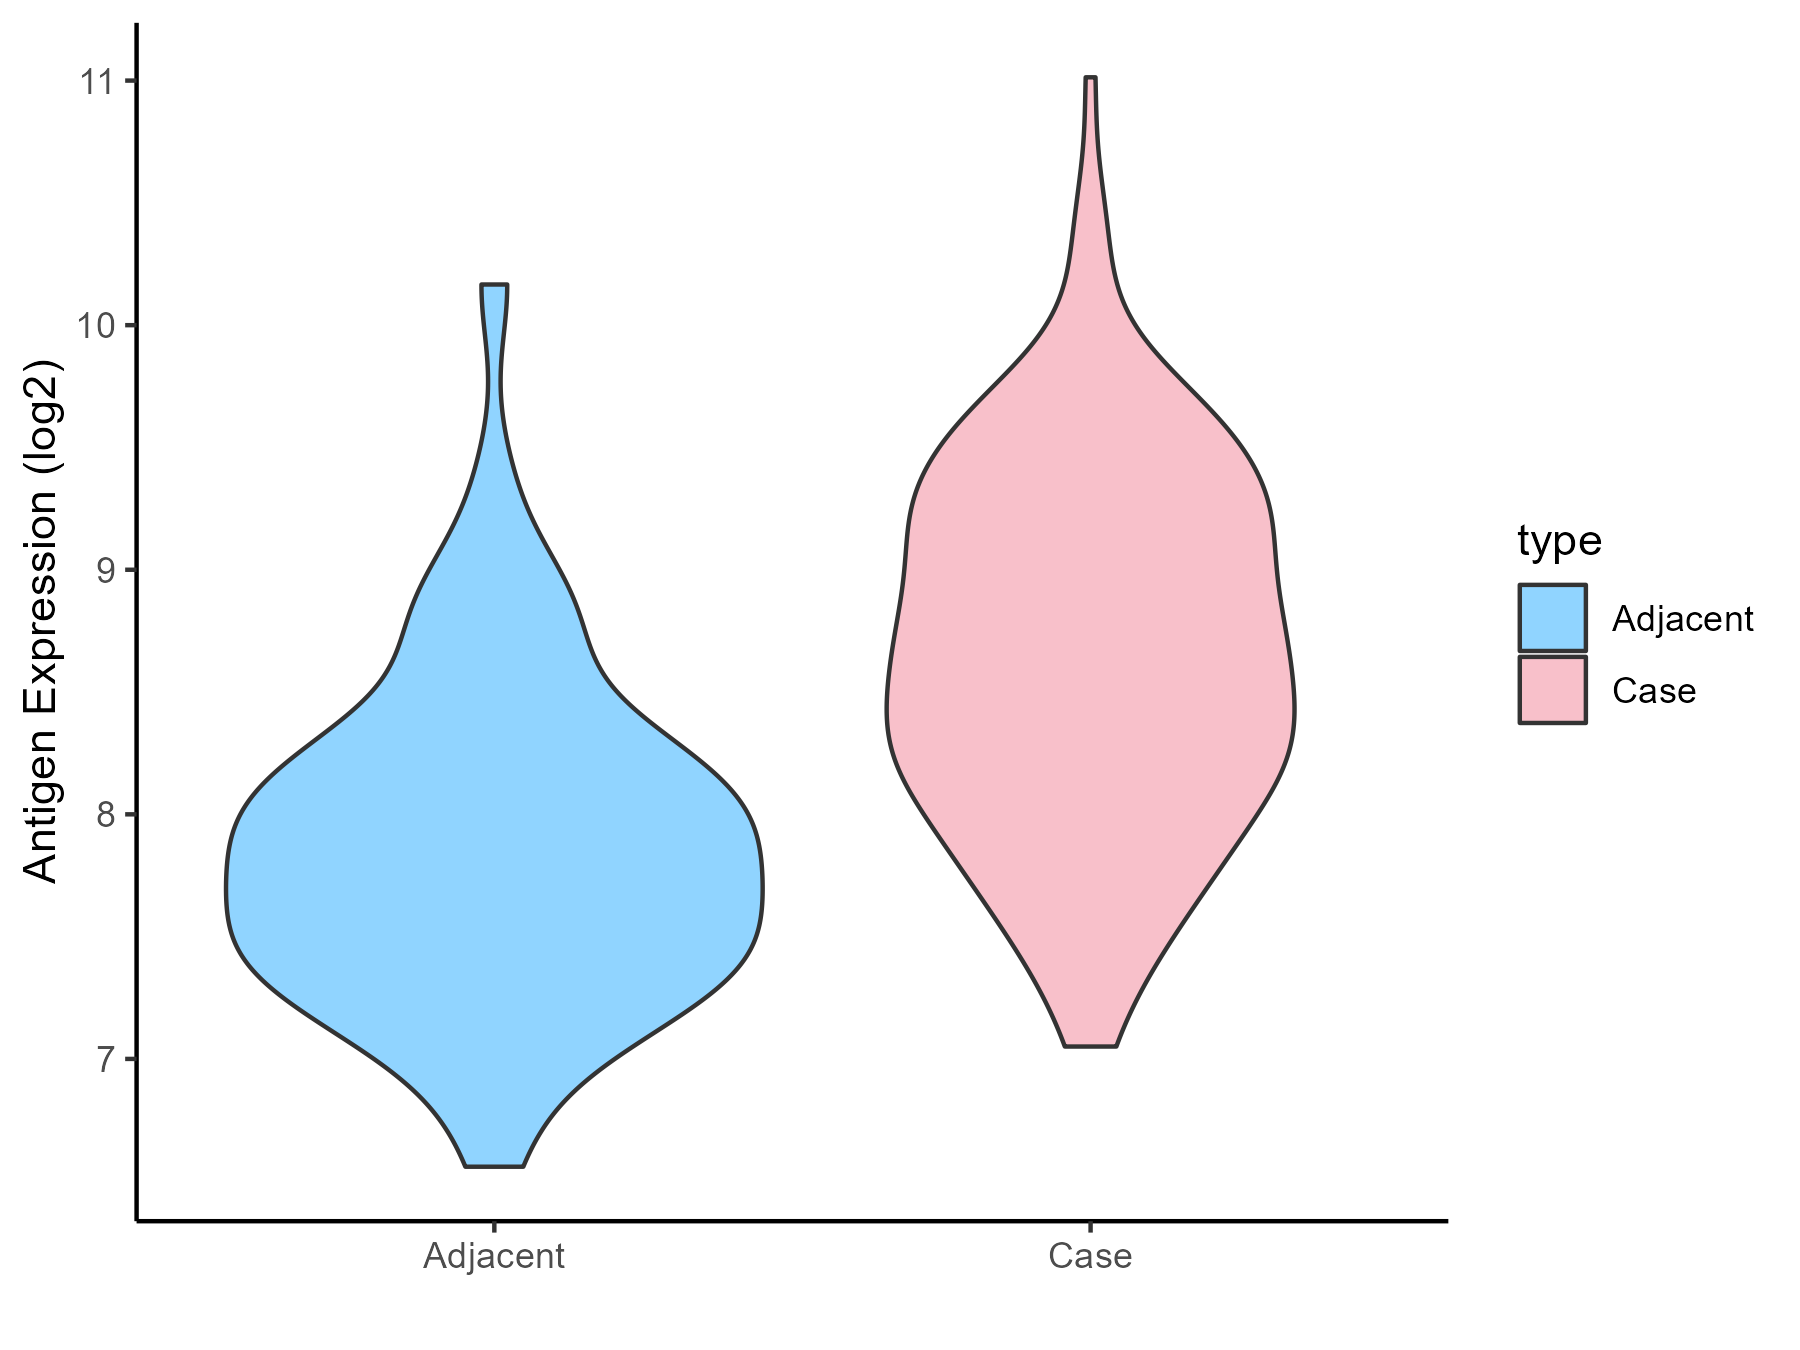
| Differential expression pattern of antigen in diseases | ||
| The Studied Tissue | Gingival | |
| The Specific Disease | Periodontal disease | |
| The Expression Level of Disease Section Compare with the Adjacent Tissue | p-value: 1.24E-11; Fold-change: 0.8363451; Z-score: 1.262089171 | |
| Disease-specific Antigen Abundances |
|
Click to View the Clearer Original Diagram |
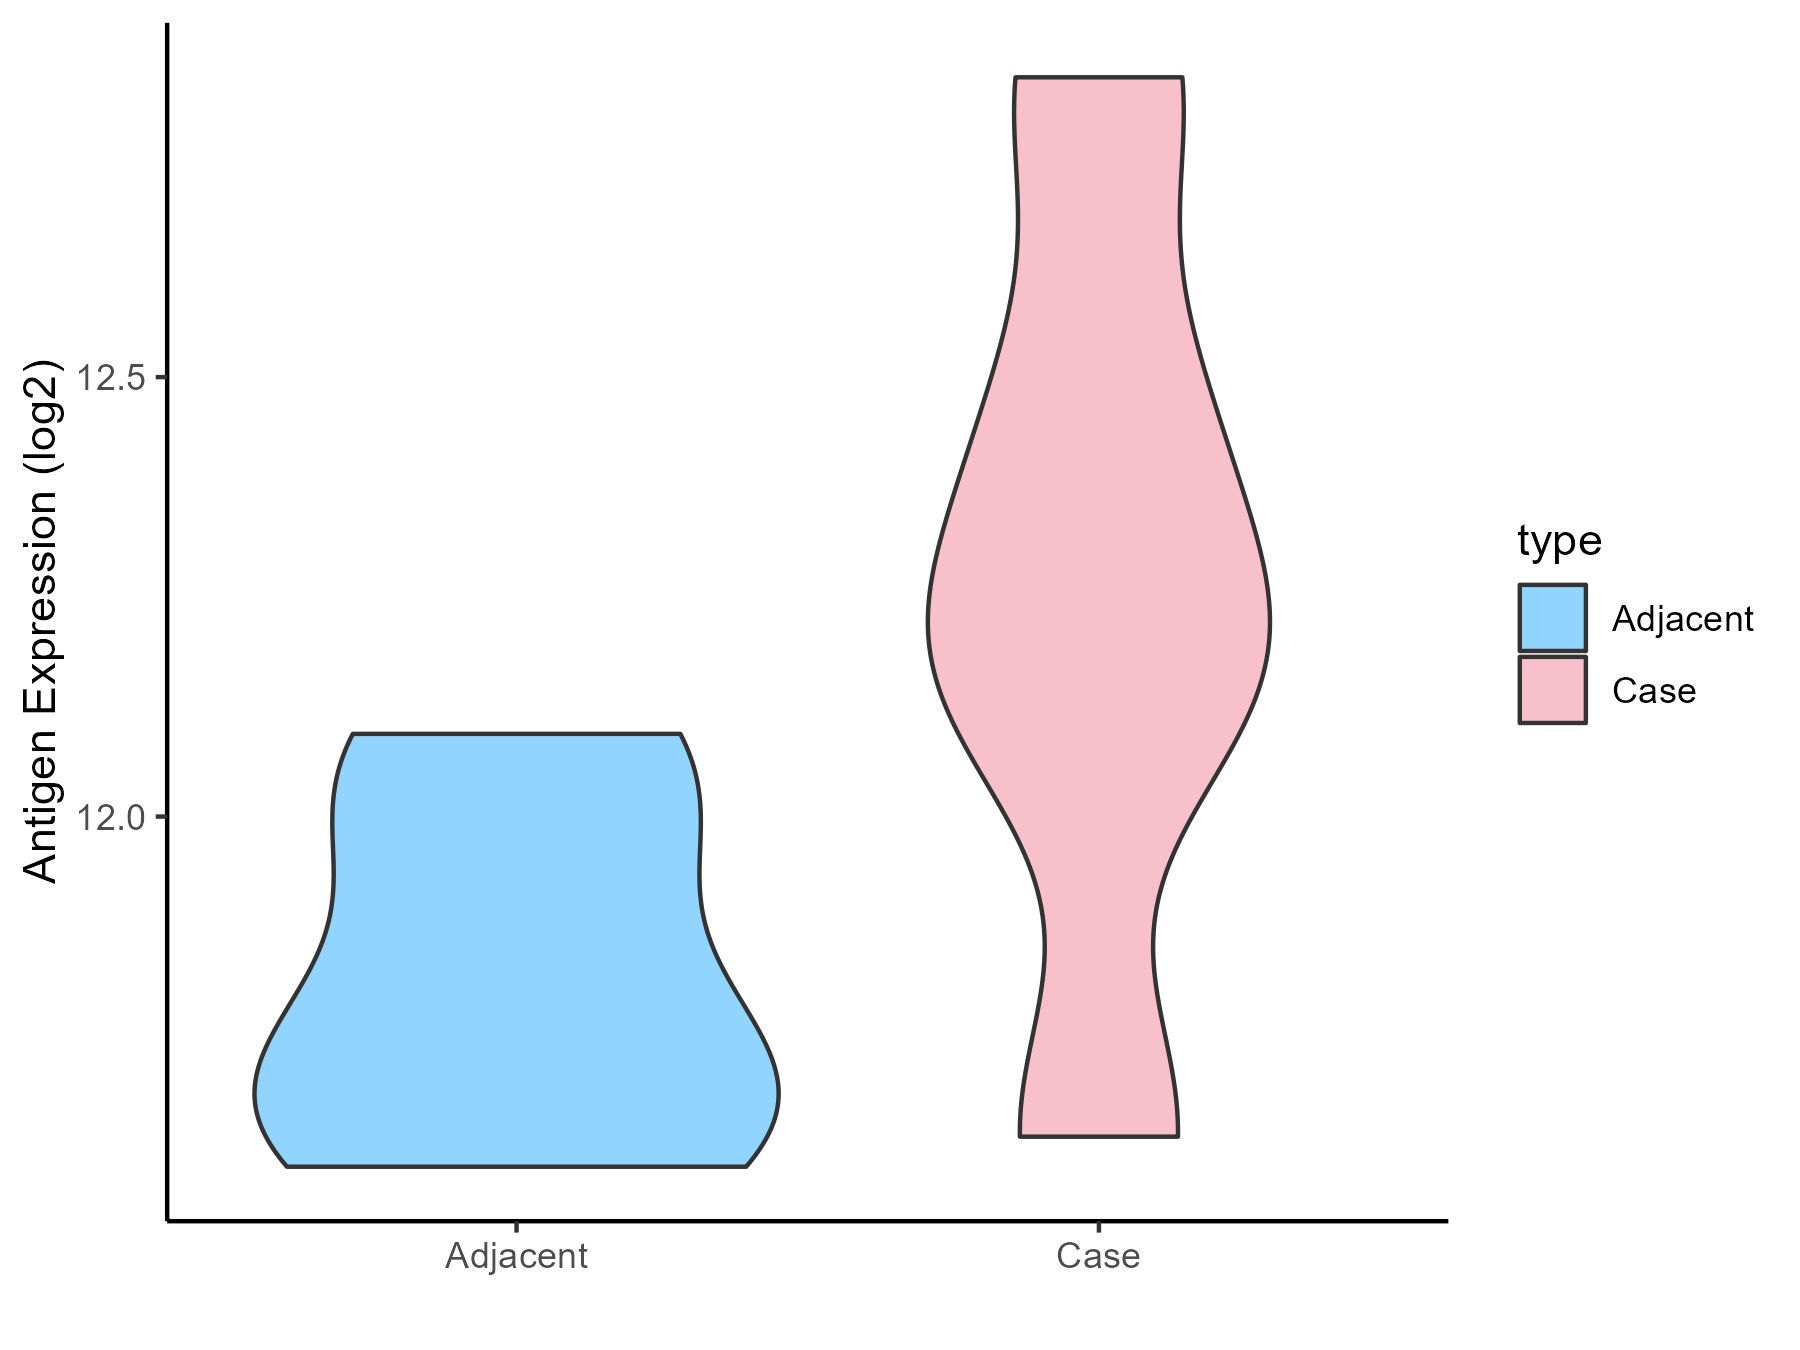
| Differential expression pattern of antigen in diseases | ||
| The Studied Tissue | Gastric antrum | |
| The Specific Disease | Eosinophilic gastritis | |
| The Expression Level of Disease Section Compare with the Adjacent Tissue | p-value: 0.094350069; Fold-change: 0.489180463; Z-score: 2.307625025 | |
| Disease-specific Antigen Abundances |
|
Click to View the Clearer Original Diagram |
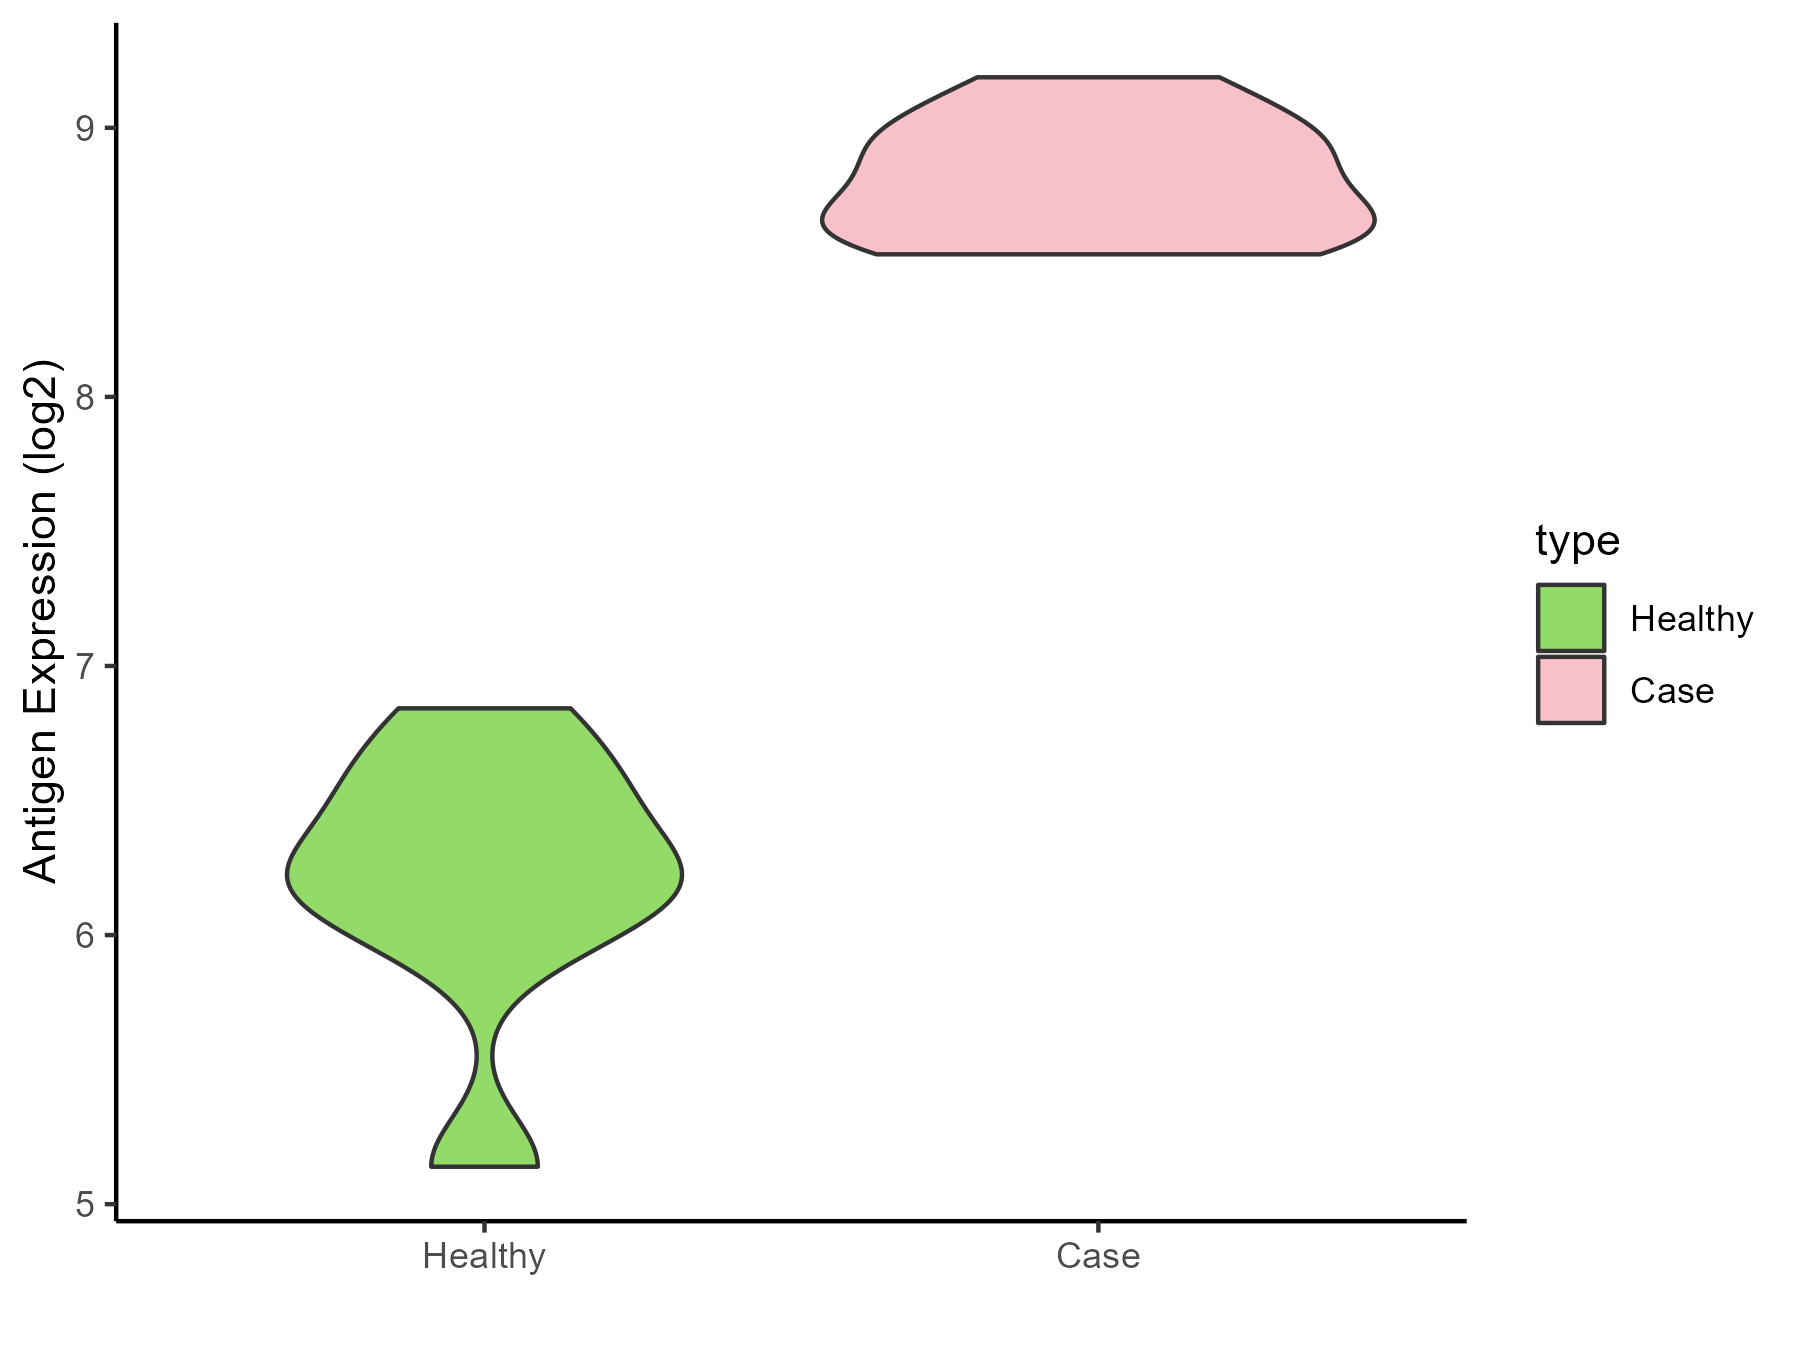
| Differential expression pattern of antigen in diseases | ||
| The Studied Tissue | Liver | |
| The Specific Disease | Liver failure | |
| The Expression Level of Disease Section Compare with the Healthy Individual Tissue | p-value: 1.78E-07; Fold-change: 2.533703616; Z-score: 4.927717486 | |
| Disease-specific Antigen Abundances |
|
Click to View the Clearer Original Diagram |
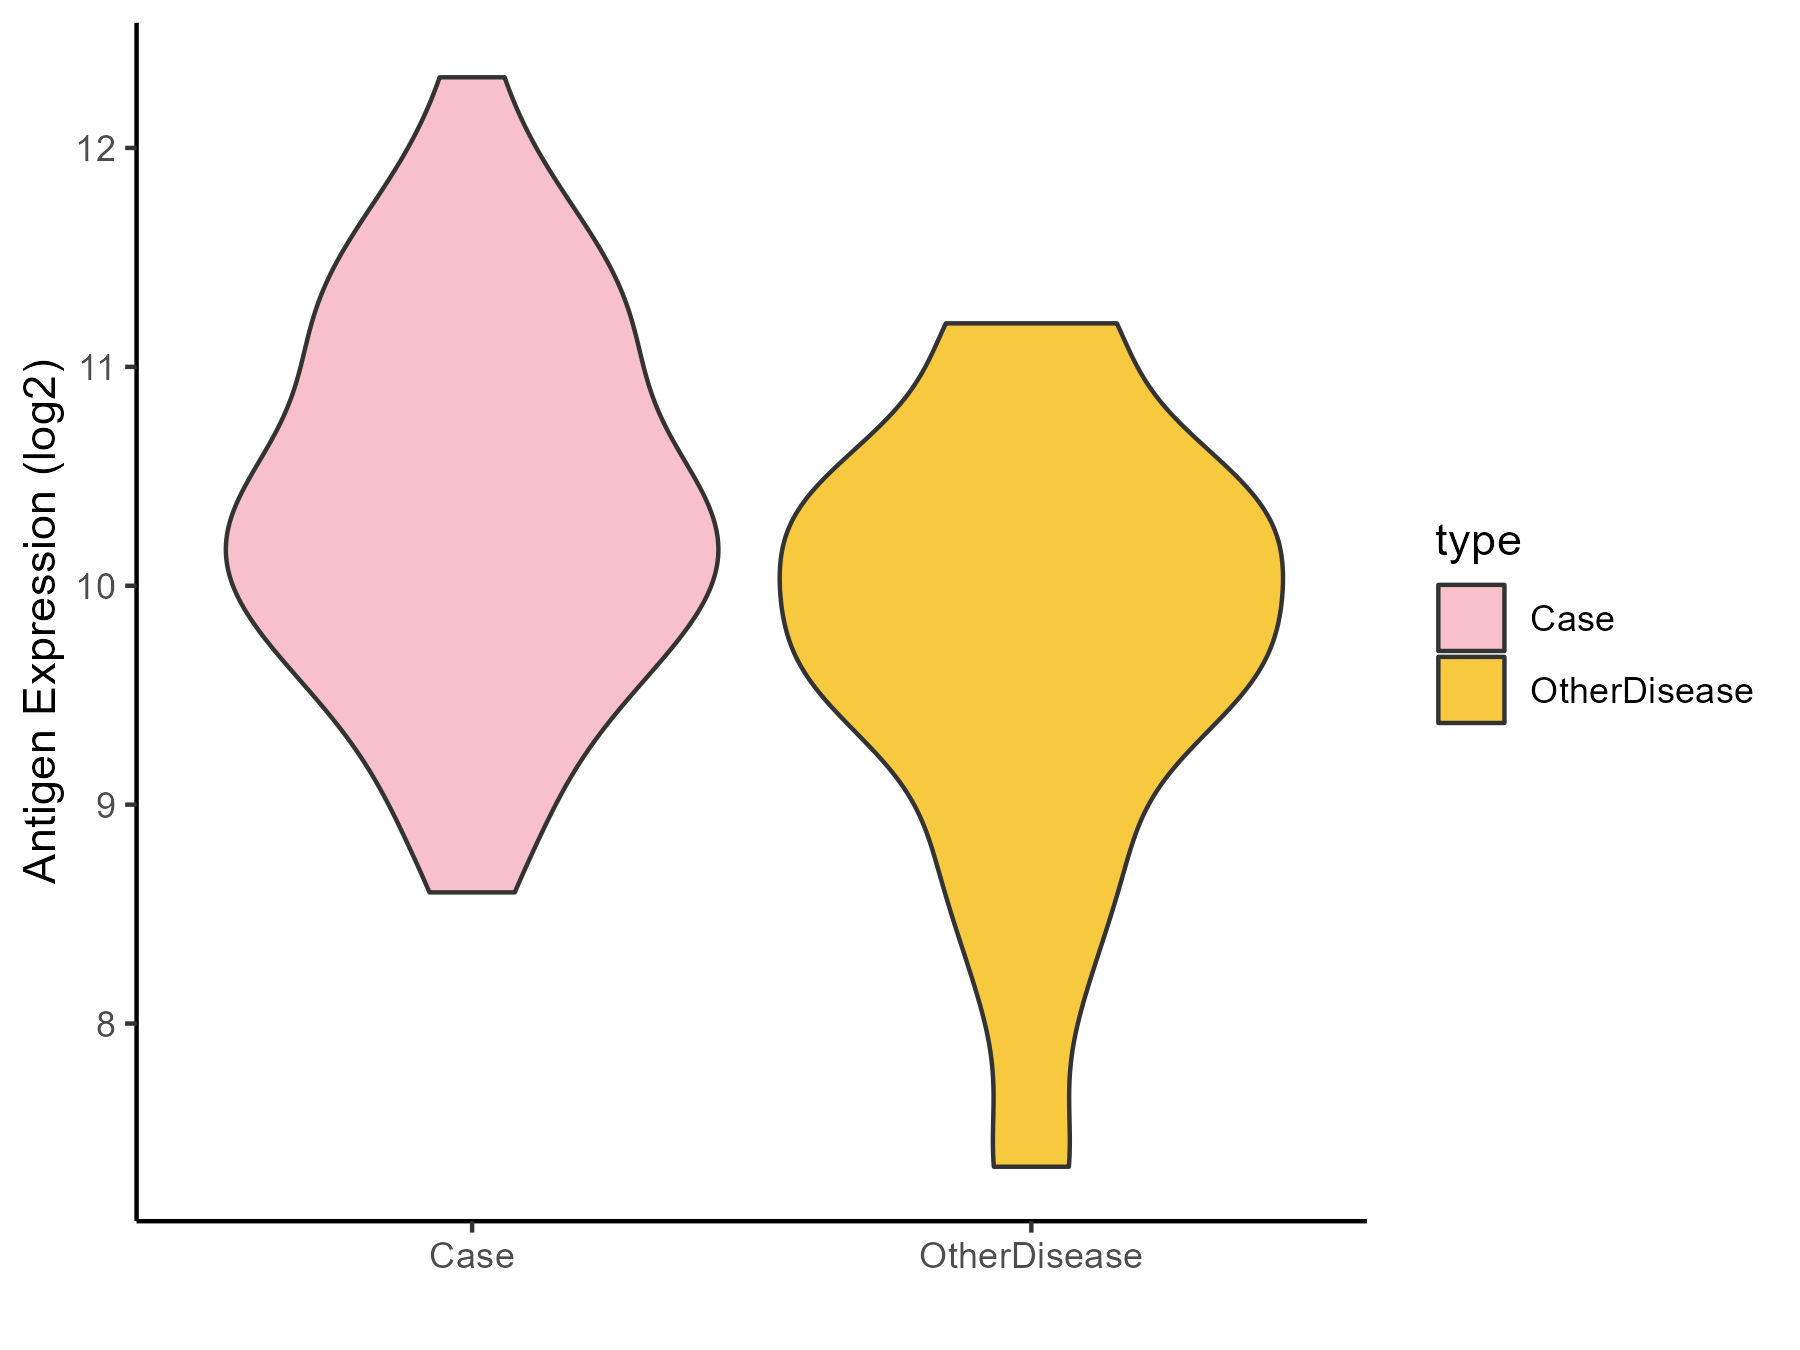
| Differential expression pattern of antigen in diseases | ||
| The Studied Tissue | Colon mucosal | |
| The Specific Disease | Ulcerative colitis | |
| The Expression Level of Disease Section Compare with the Adjacent Tissue | p-value: 0.019039136; Fold-change: 0.56894482; Z-score: 0.571588577 | |
| Disease-specific Antigen Abundances |
|
Click to View the Clearer Original Diagram |
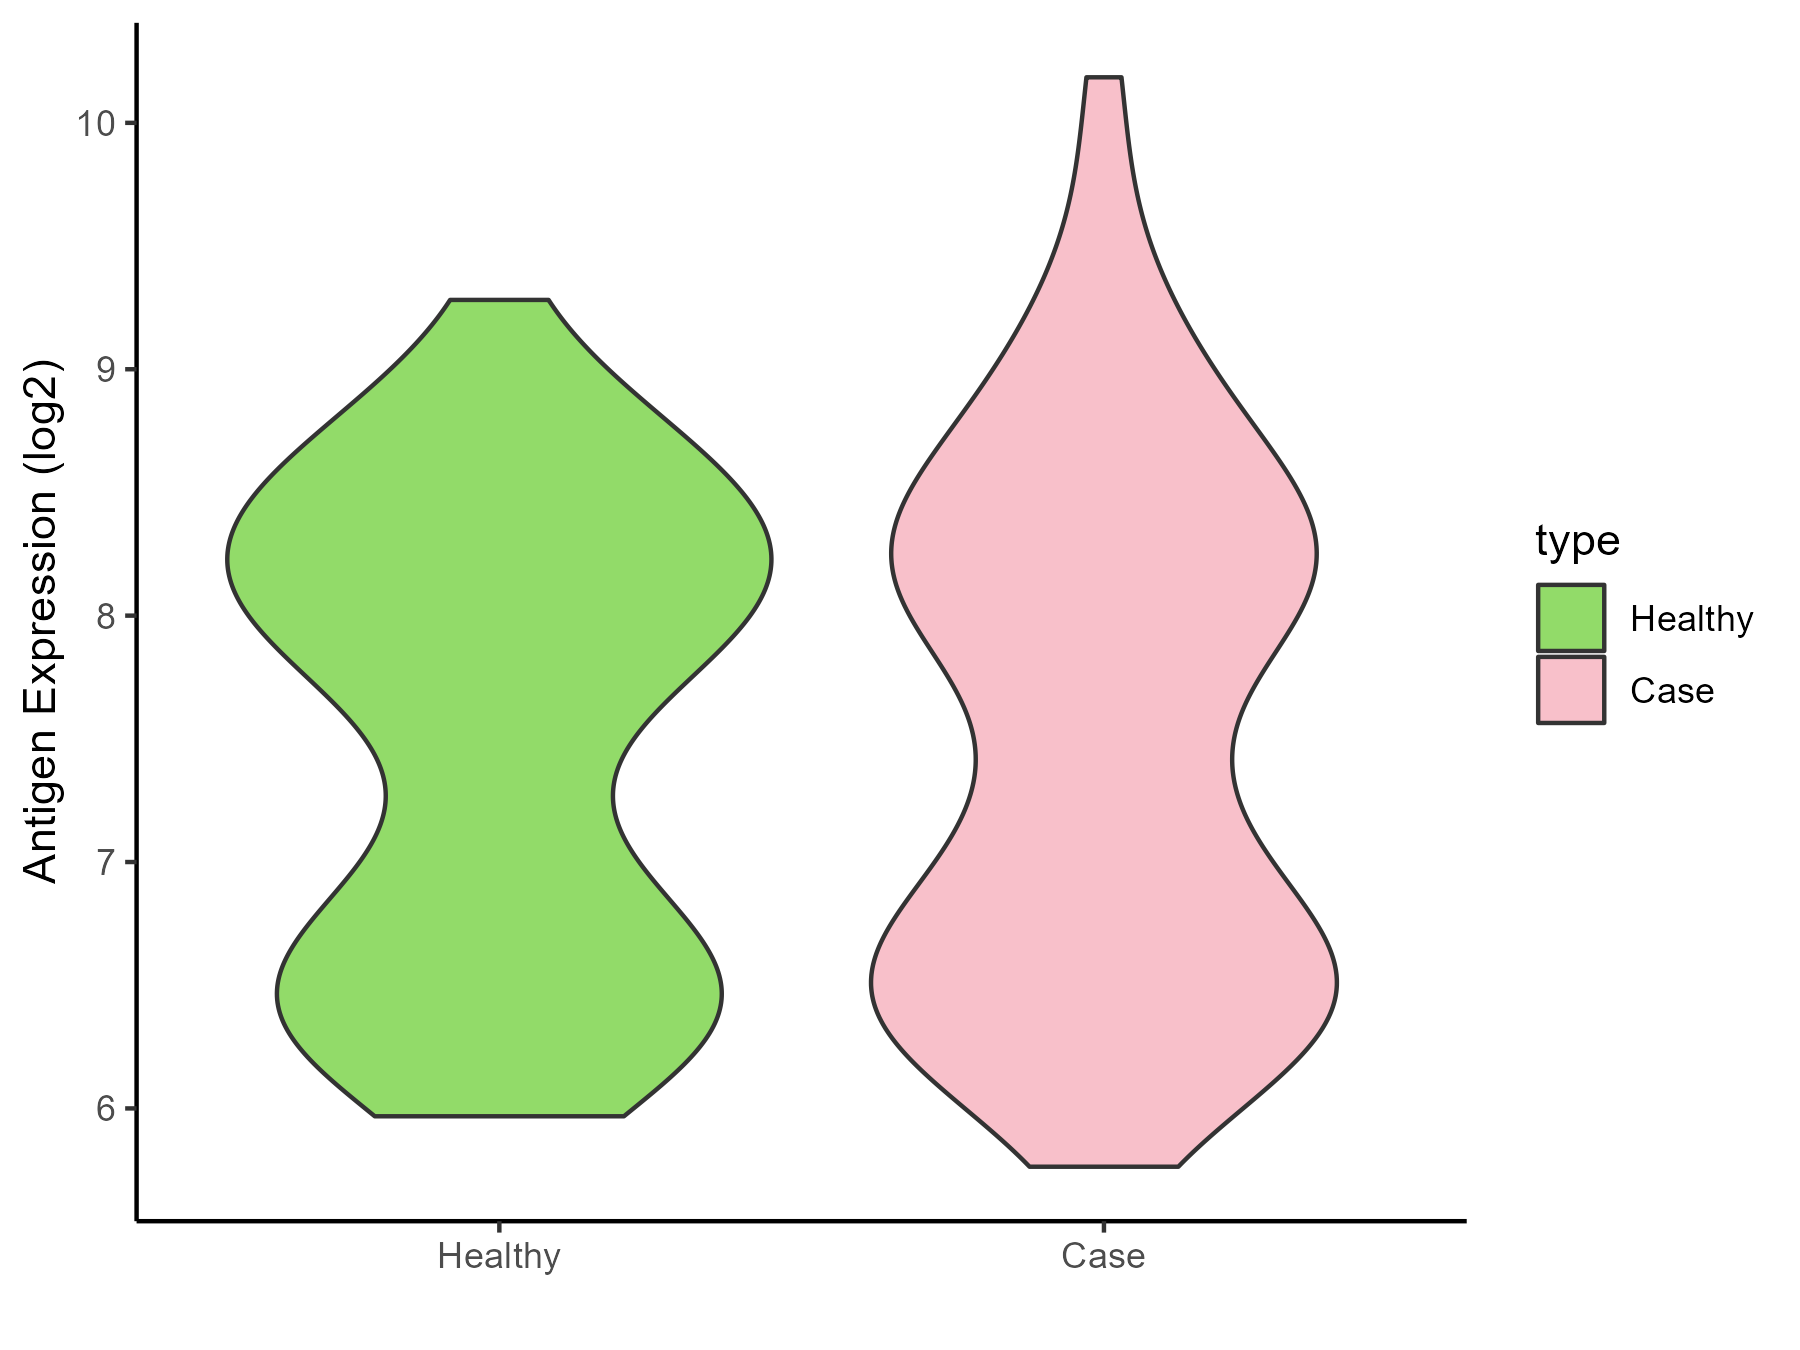
| Differential expression pattern of antigen in diseases | ||
| The Studied Tissue | Rectal colon | |
| The Specific Disease | Irritable bowel syndrome | |
| The Expression Level of Disease Section Compare with the Healthy Individual Tissue | p-value: 0.953562509; Fold-change: -0.279943353; Z-score: -0.295880203 | |
| Disease-specific Antigen Abundances |
|
Click to View the Clearer Original Diagram |
ICD Disease Classification 14
| Differential expression pattern of antigen in diseases | ||
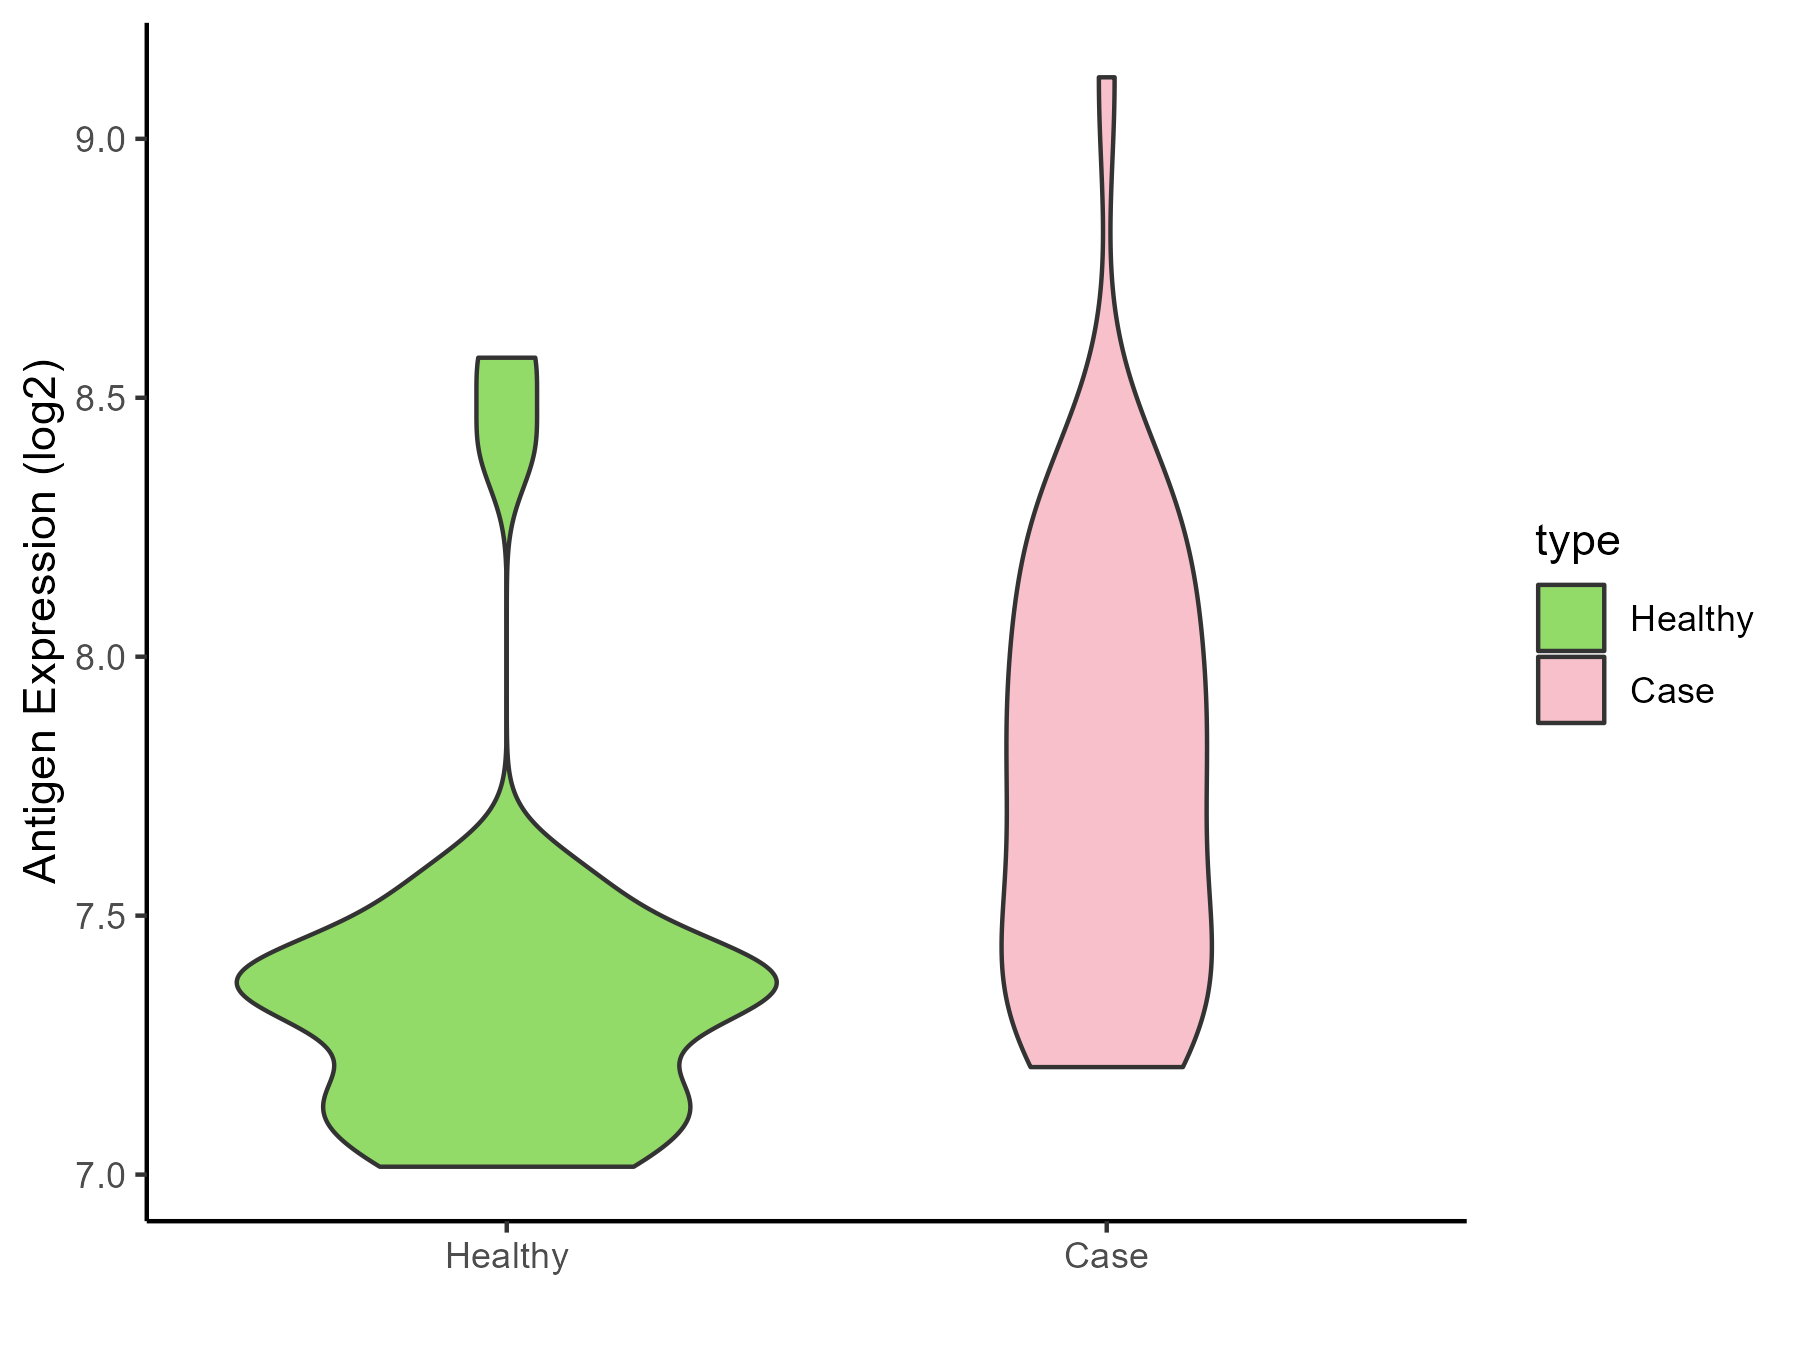
| The Studied Tissue | Skin | |
| The Specific Disease | Atopic dermatitis | |
| The Expression Level of Disease Section Compare with the Healthy Individual Tissue | p-value: 0.000273165; Fold-change: 0.372145233; Z-score: 0.999109881 | |
| Disease-specific Antigen Abundances |
|
Click to View the Clearer Original Diagram |
| Differential expression pattern of antigen in diseases | ||
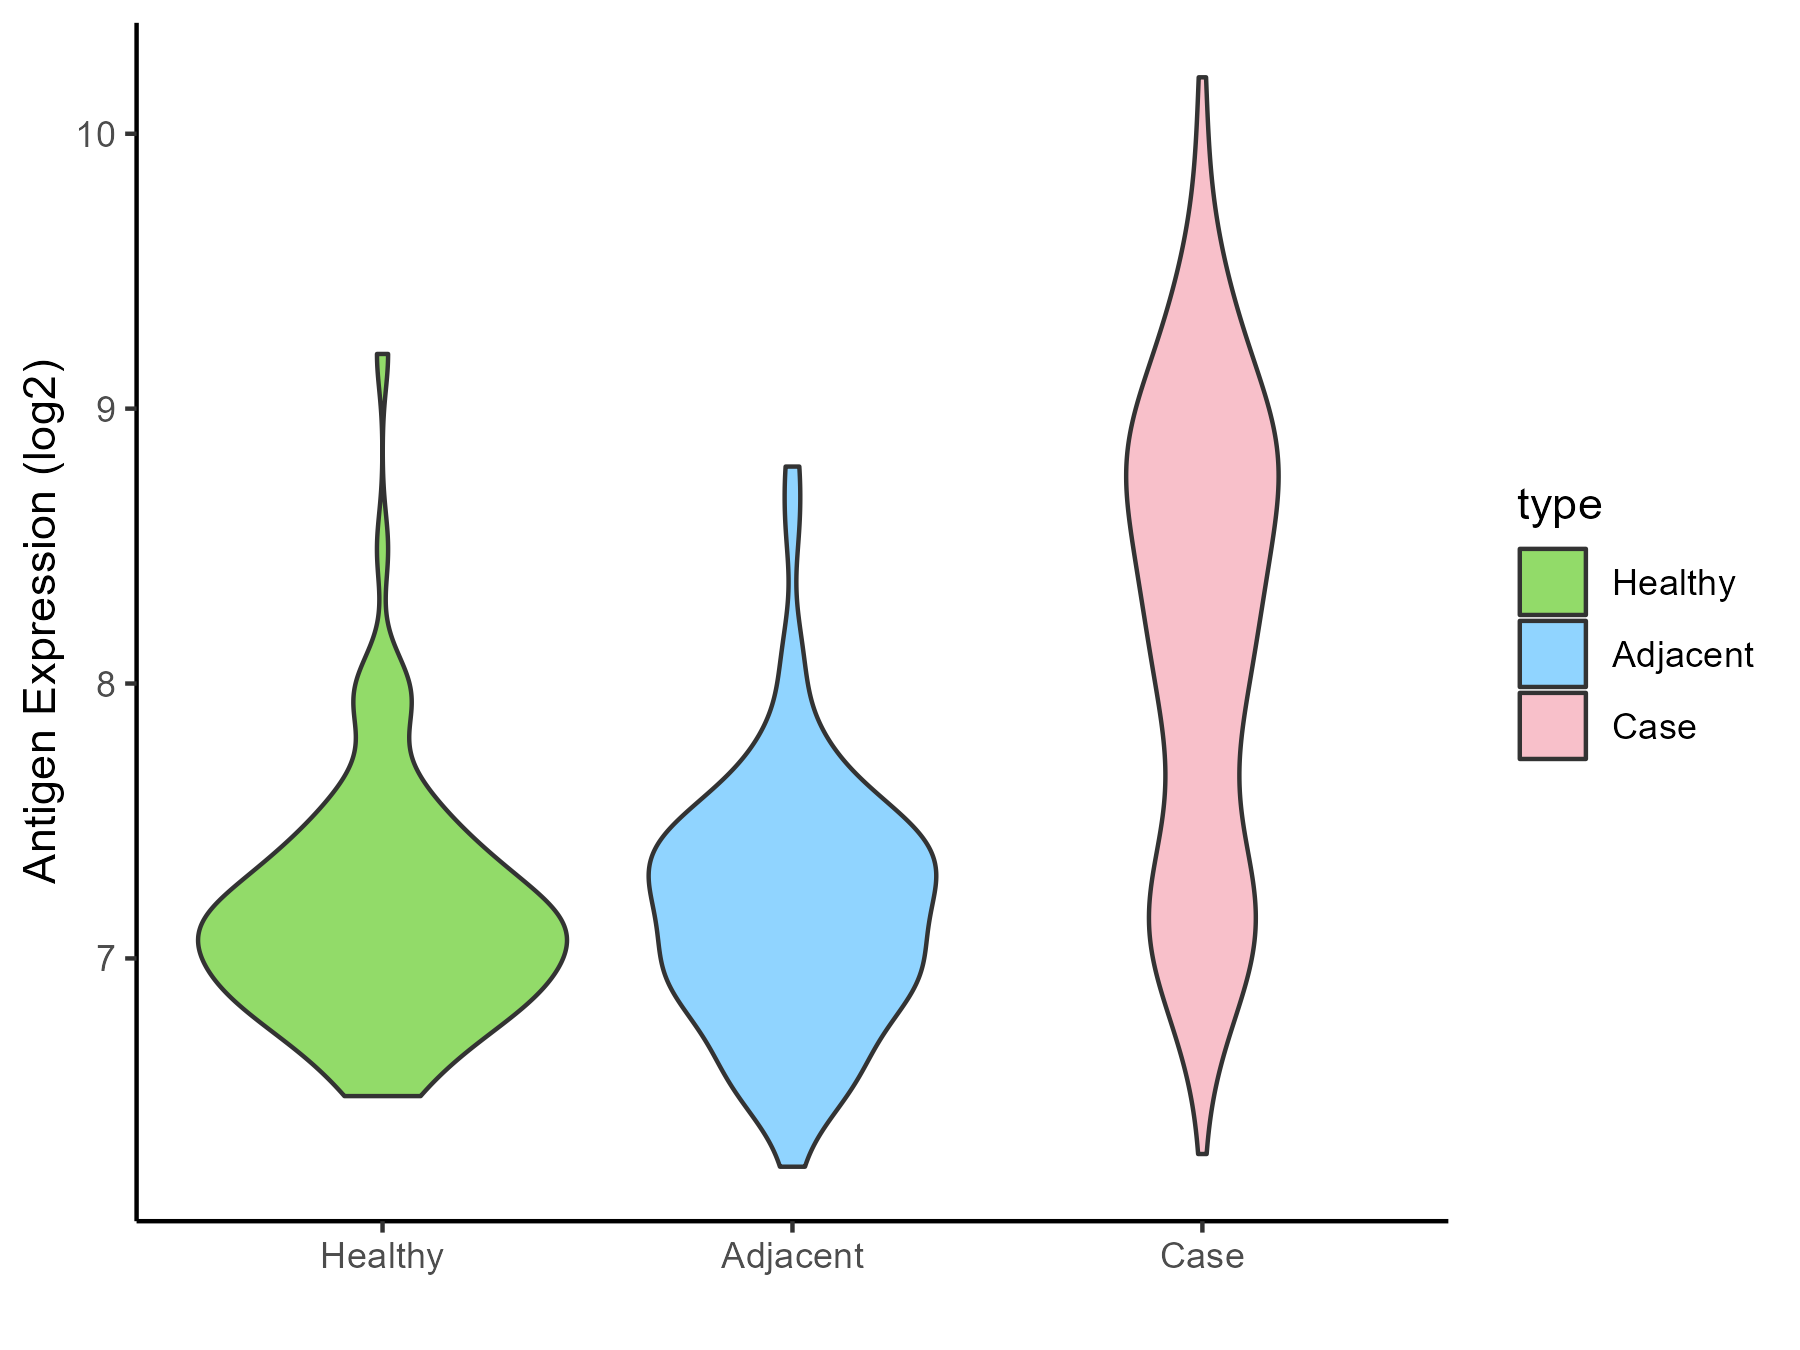
| The Studied Tissue | Skin | |
| The Specific Disease | Psoriasis | |
| The Expression Level of Disease Section Compare with the Healthy Individual Tissue | p-value: 3.10E-39; Fold-change: 1.263888797; Z-score: 2.927709492 | |
| The Expression Level of Disease Section Compare with the Adjacent Tissue | p-value: 1.18E-35; Fold-change: 1.196047269; Z-score: 2.675547623 | |
| Disease-specific Antigen Abundances |
|
Click to View the Clearer Original Diagram |
| Differential expression pattern of antigen in diseases | ||
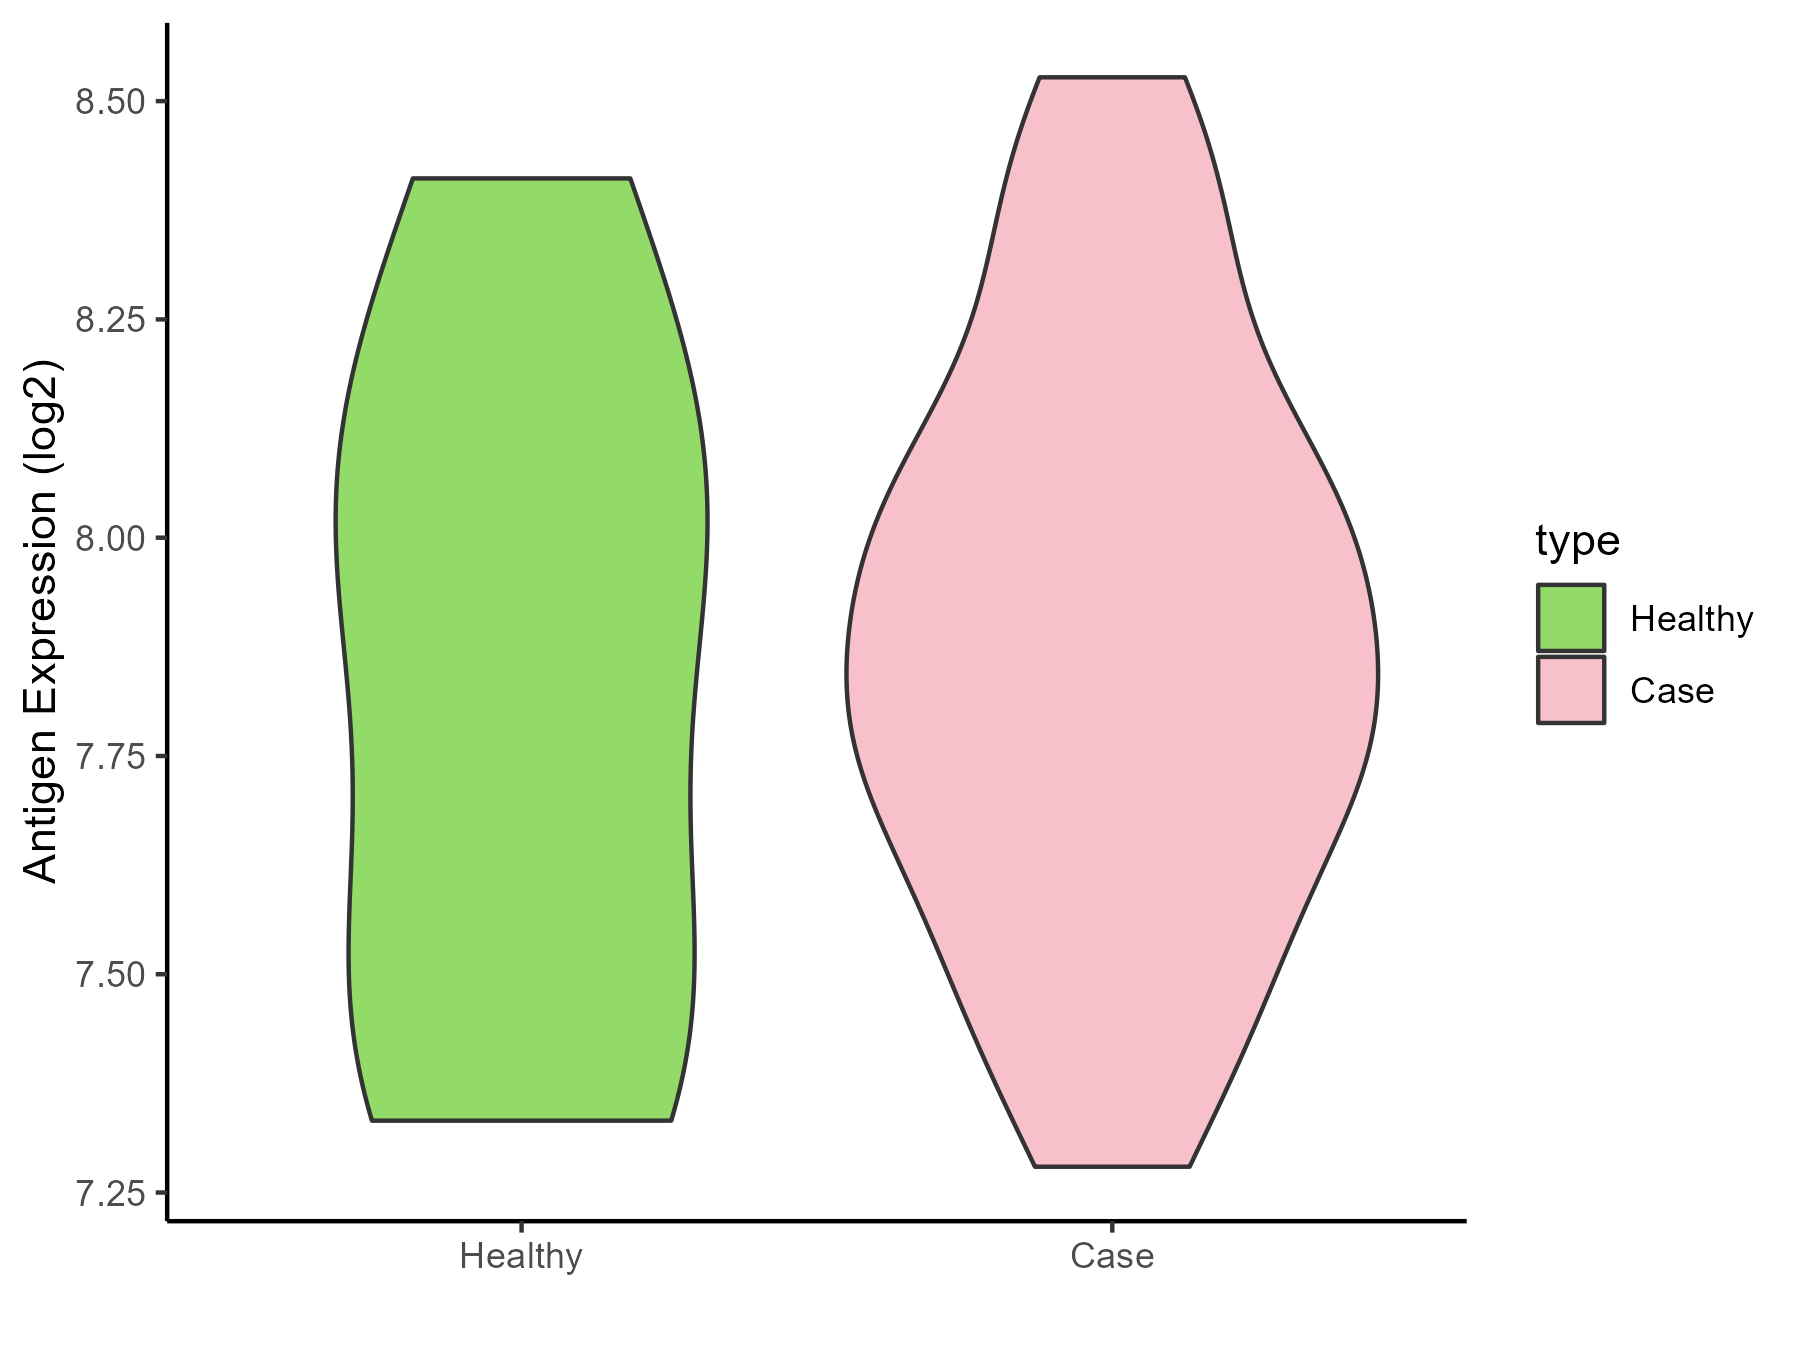
| The Studied Tissue | Skin | |
| The Specific Disease | Vitiligo | |
| The Expression Level of Disease Section Compare with the Healthy Individual Tissue | p-value: 0.751817215; Fold-change: -0.035763847; Z-score: -0.089109498 | |
| Disease-specific Antigen Abundances |
|
Click to View the Clearer Original Diagram |
| Differential expression pattern of antigen in diseases | ||
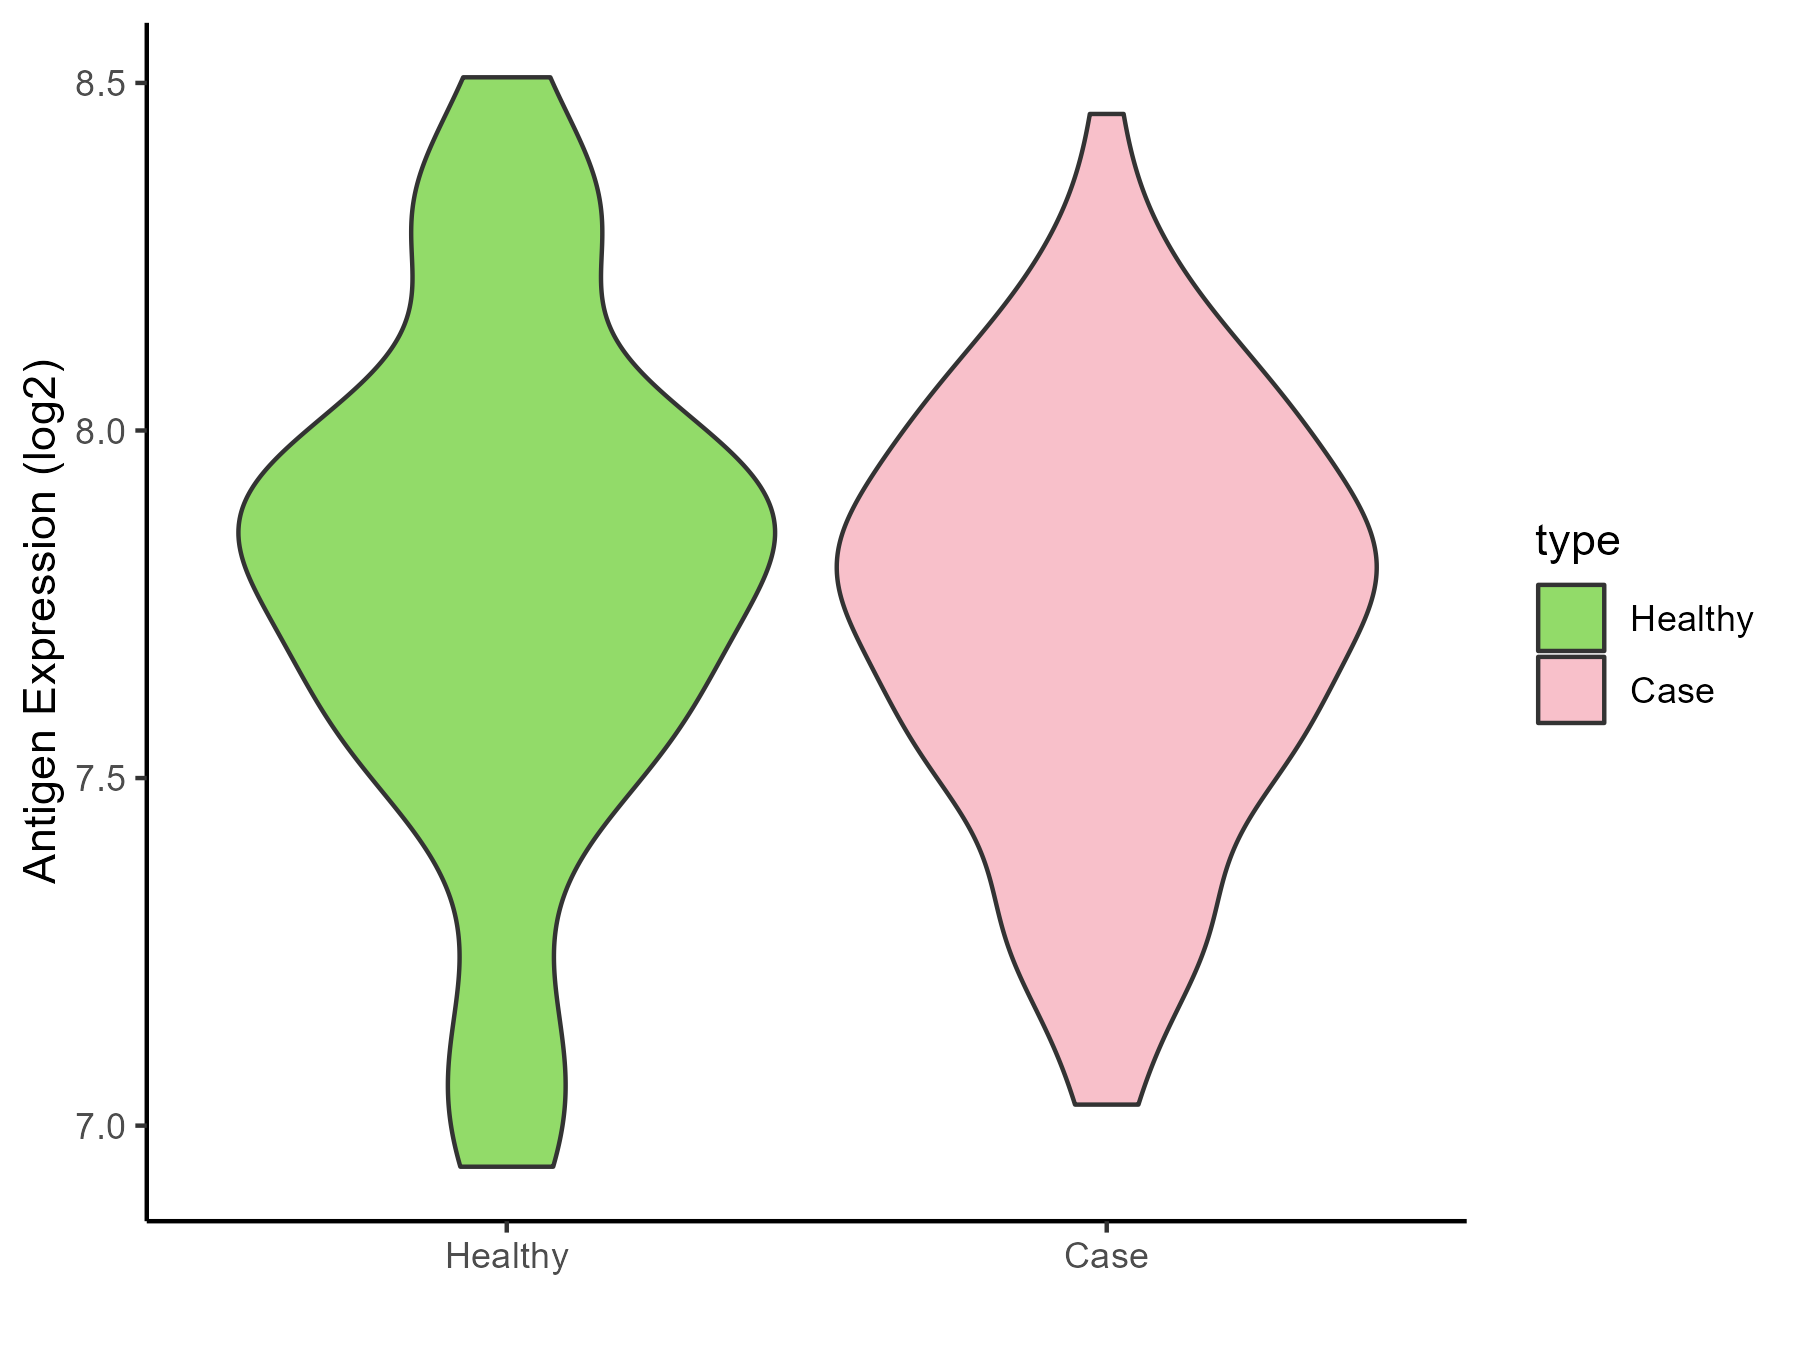
| The Studied Tissue | Skin from scalp | |
| The Specific Disease | Alopecia | |
| The Expression Level of Disease Section Compare with the Healthy Individual Tissue | p-value: 0.478042788; Fold-change: -0.073070066; Z-score: -0.197422948 | |
| Disease-specific Antigen Abundances |
|
Click to View the Clearer Original Diagram |
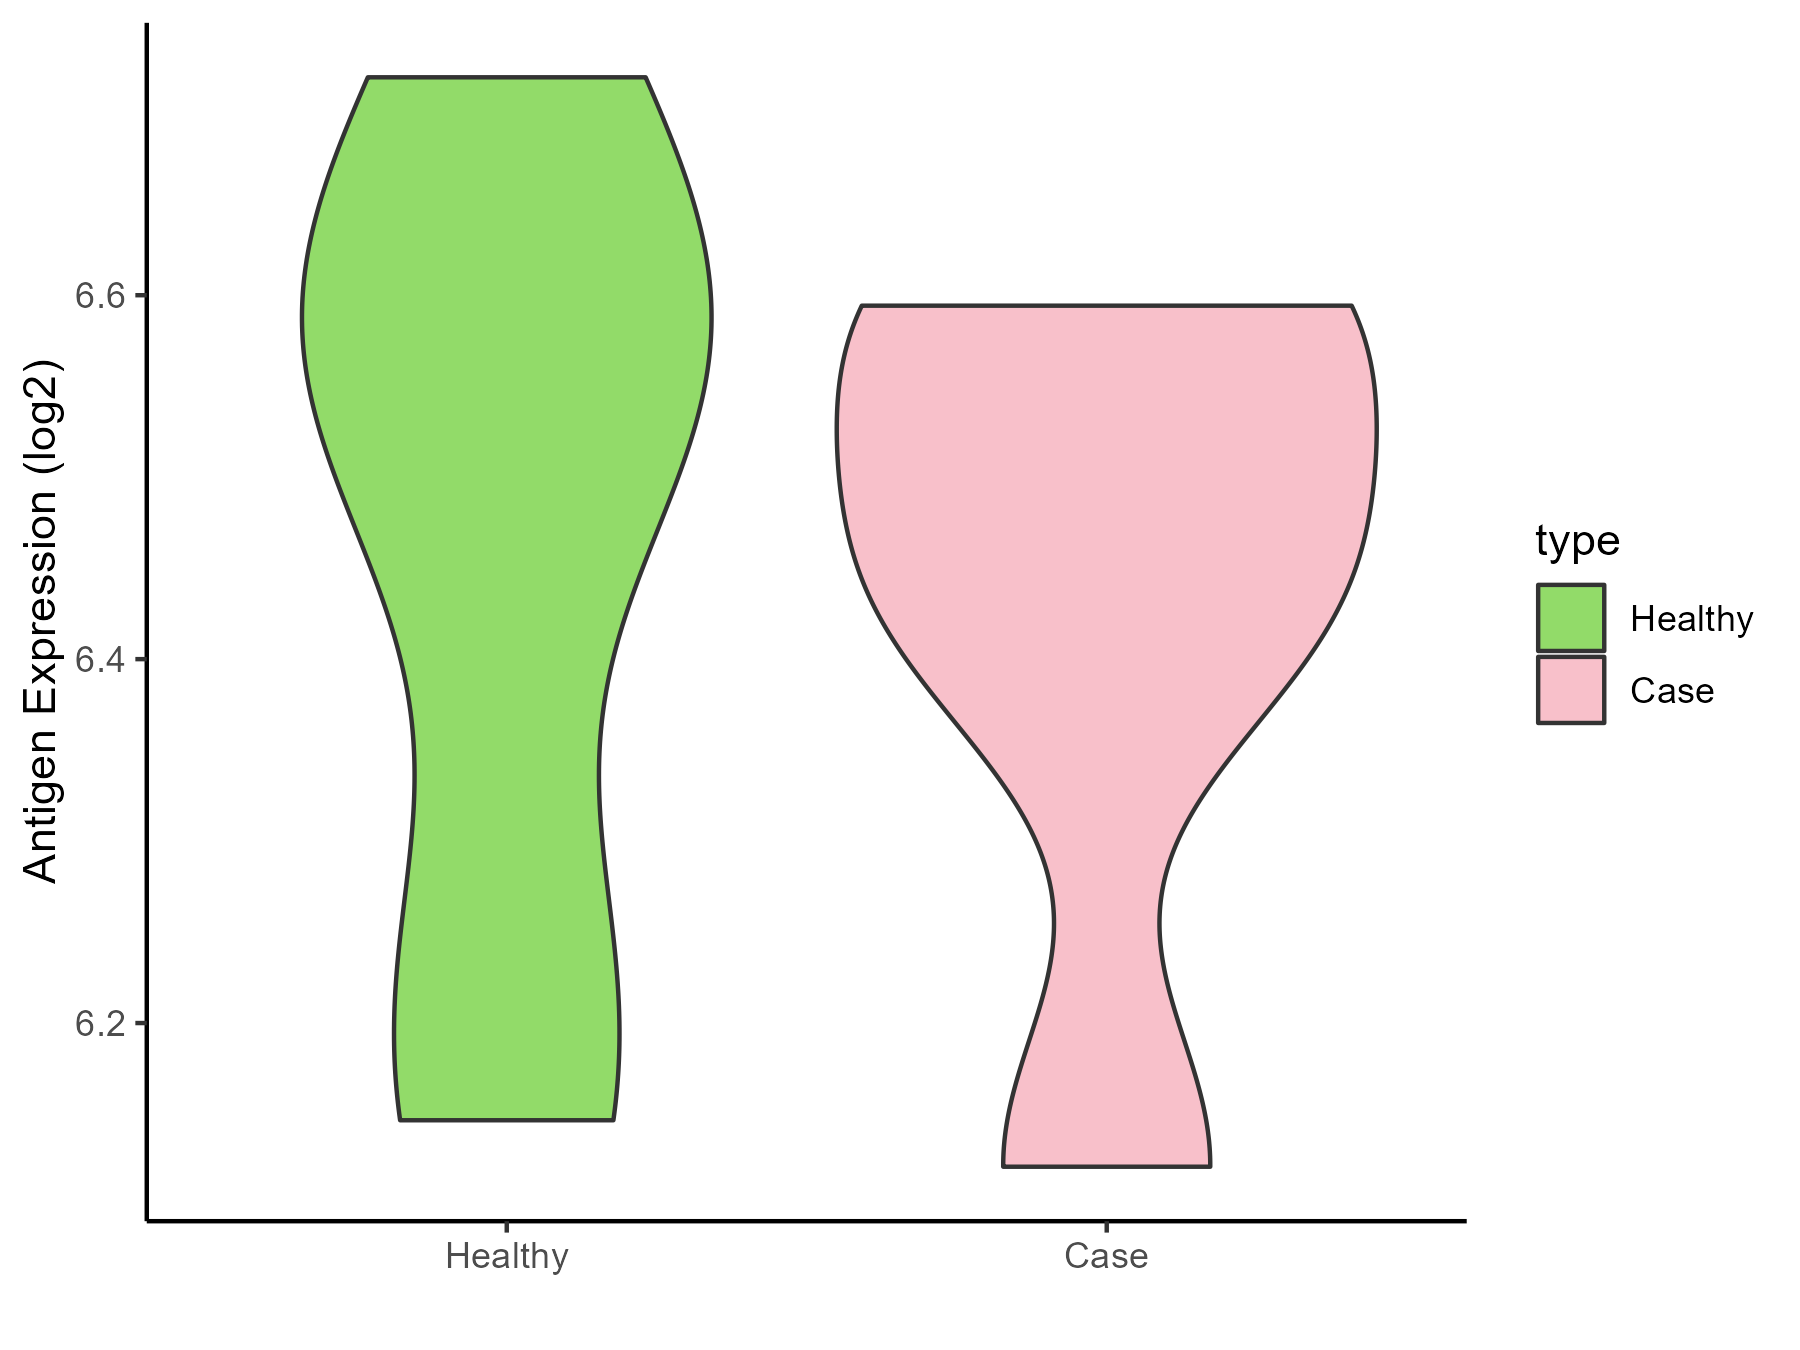
| Differential expression pattern of antigen in diseases | ||
| The Studied Tissue | Skin | |
| The Specific Disease | Sensitive skin | |
| The Expression Level of Disease Section Compare with the Healthy Individual Tissue | p-value: 0.828144757; Fold-change: -0.102570554; Z-score: -0.45521214 | |
| Disease-specific Antigen Abundances |
|
Click to View the Clearer Original Diagram |
ICD Disease Classification 15
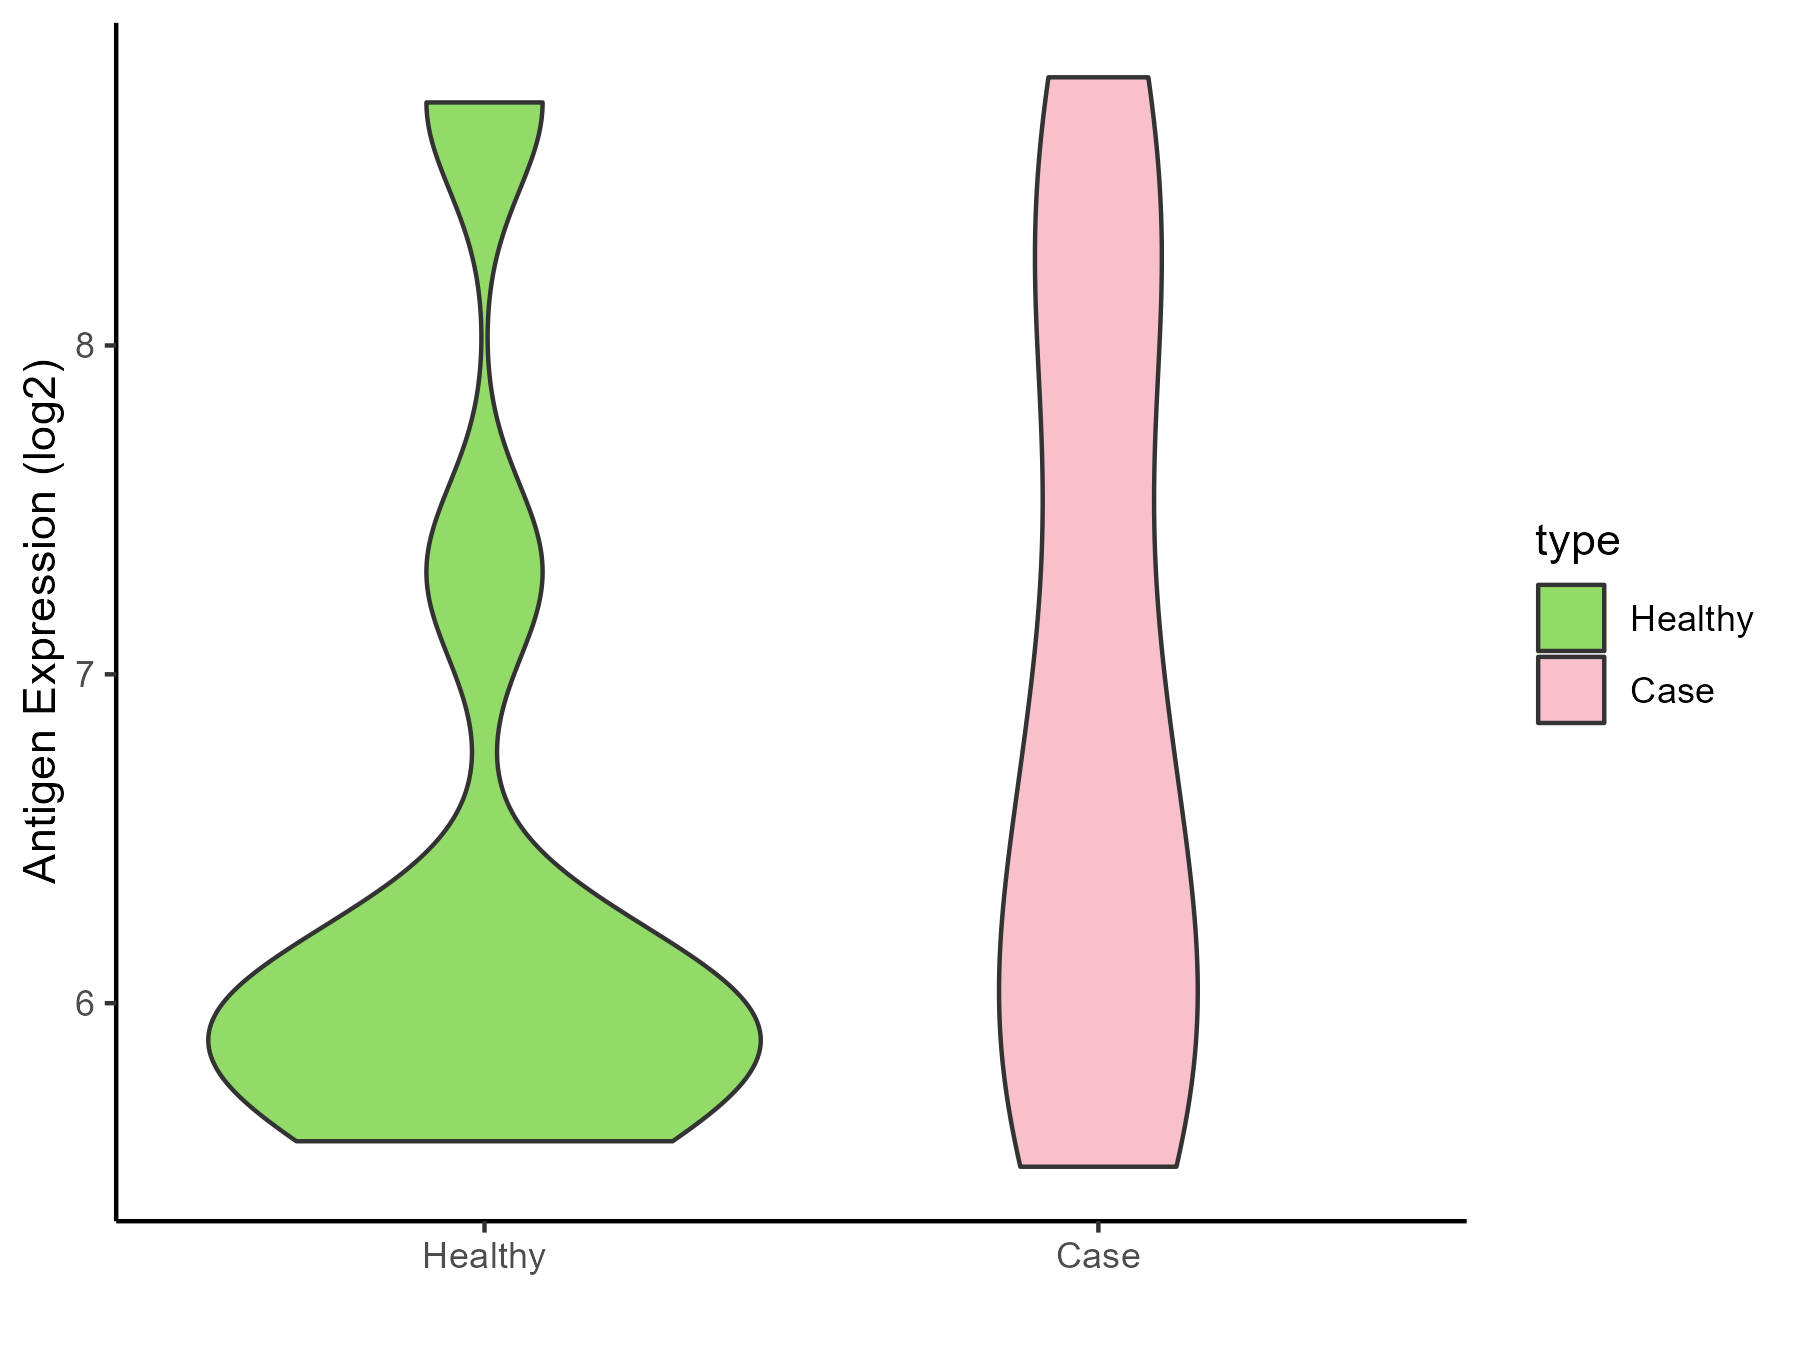
| Differential expression pattern of antigen in diseases | ||
| The Studied Tissue | Synovial | |
| The Specific Disease | Osteoarthritis | |
| The Expression Level of Disease Section Compare with the Healthy Individual Tissue | p-value: 0.308076282; Fold-change: 0.716616674; Z-score: 0.662729703 | |
| Disease-specific Antigen Abundances |
|
Click to View the Clearer Original Diagram |
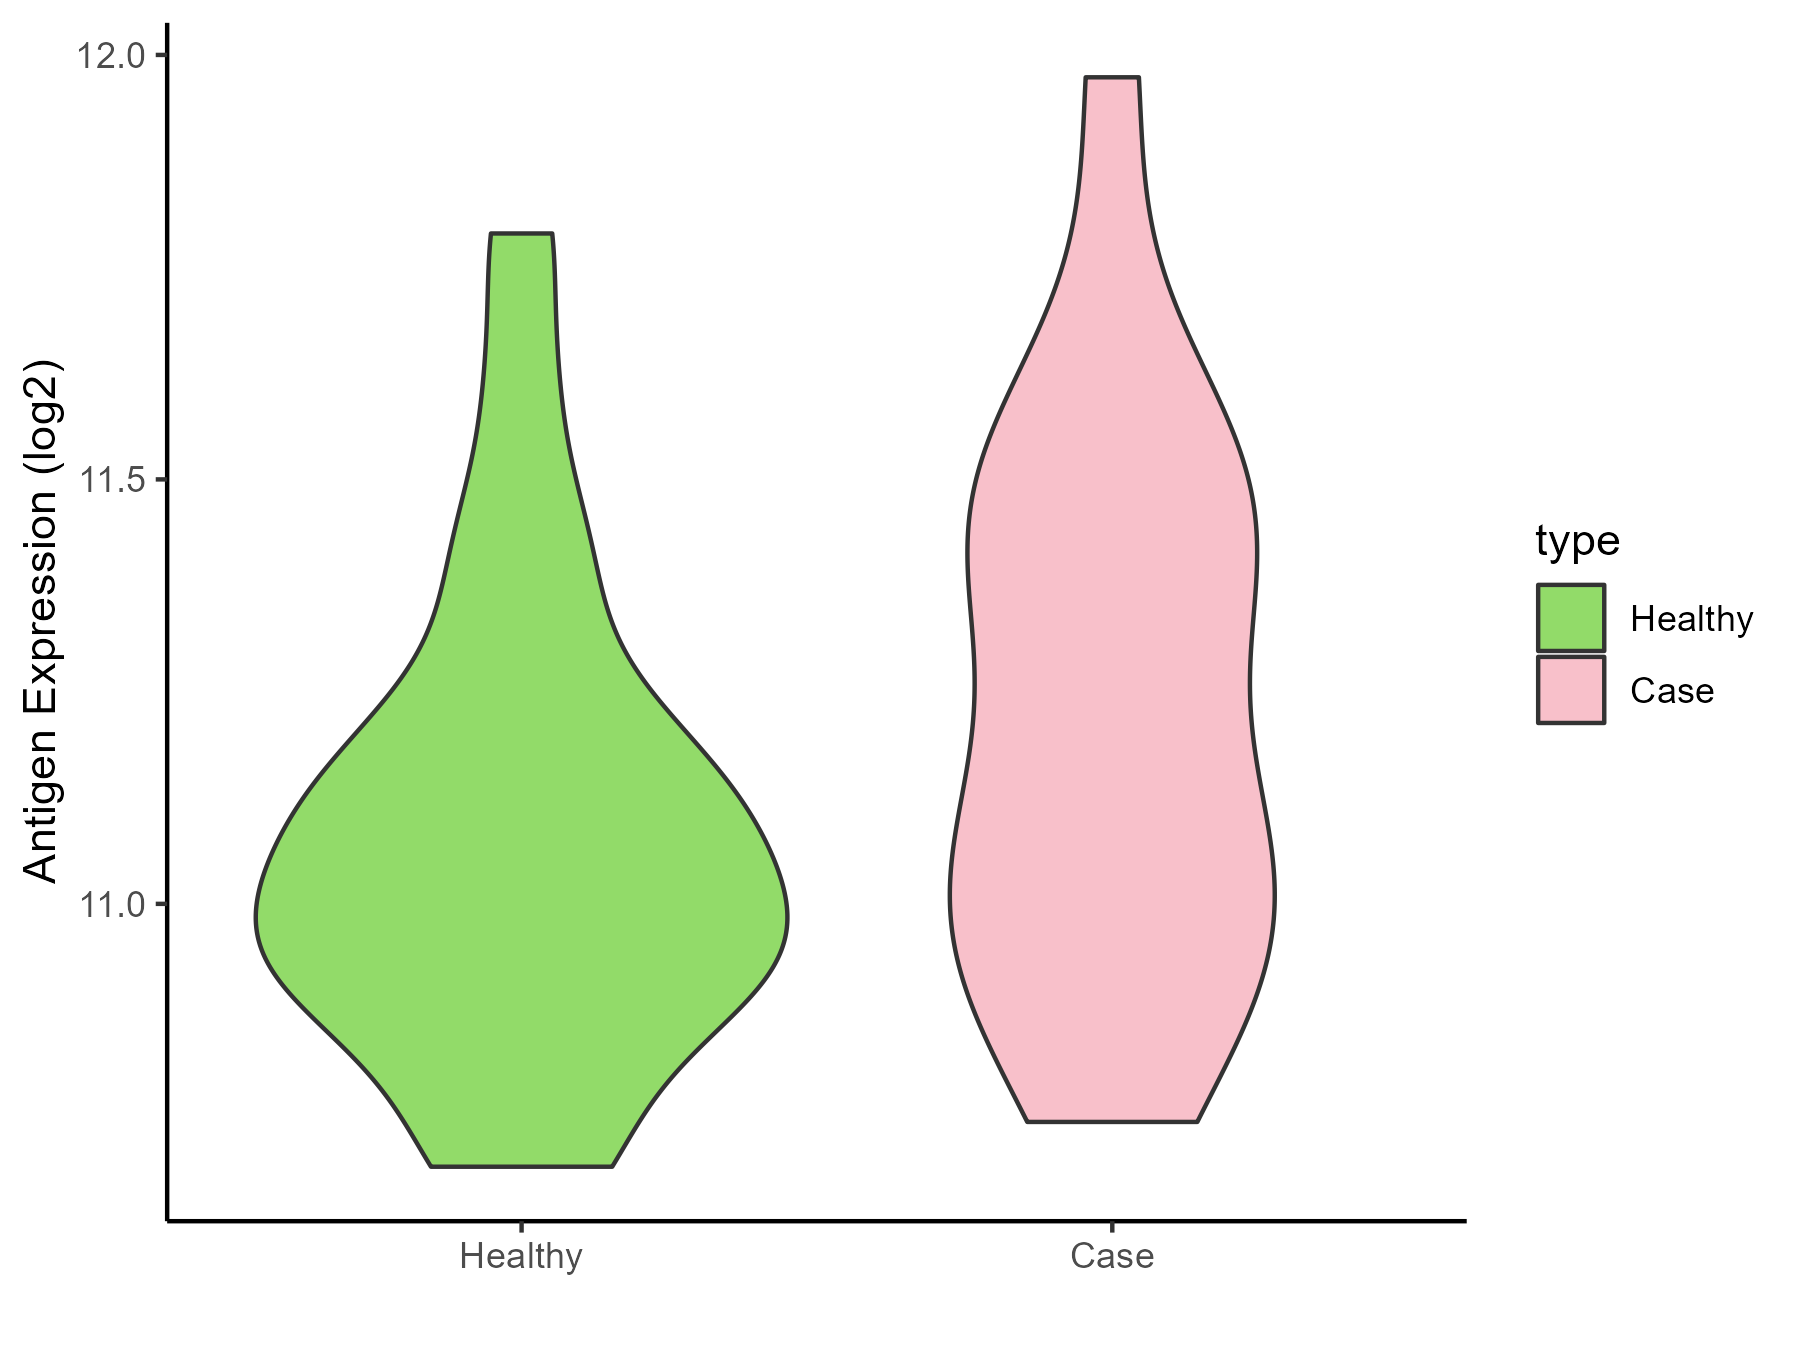
| Differential expression pattern of antigen in diseases | ||
| The Studied Tissue | Peripheral blood | |
| The Specific Disease | Arthropathy | |
| The Expression Level of Disease Section Compare with the Healthy Individual Tissue | p-value: 0.149493876; Fold-change: 0.092443123; Z-score: 0.341293545 | |
| Disease-specific Antigen Abundances |
|
Click to View the Clearer Original Diagram |
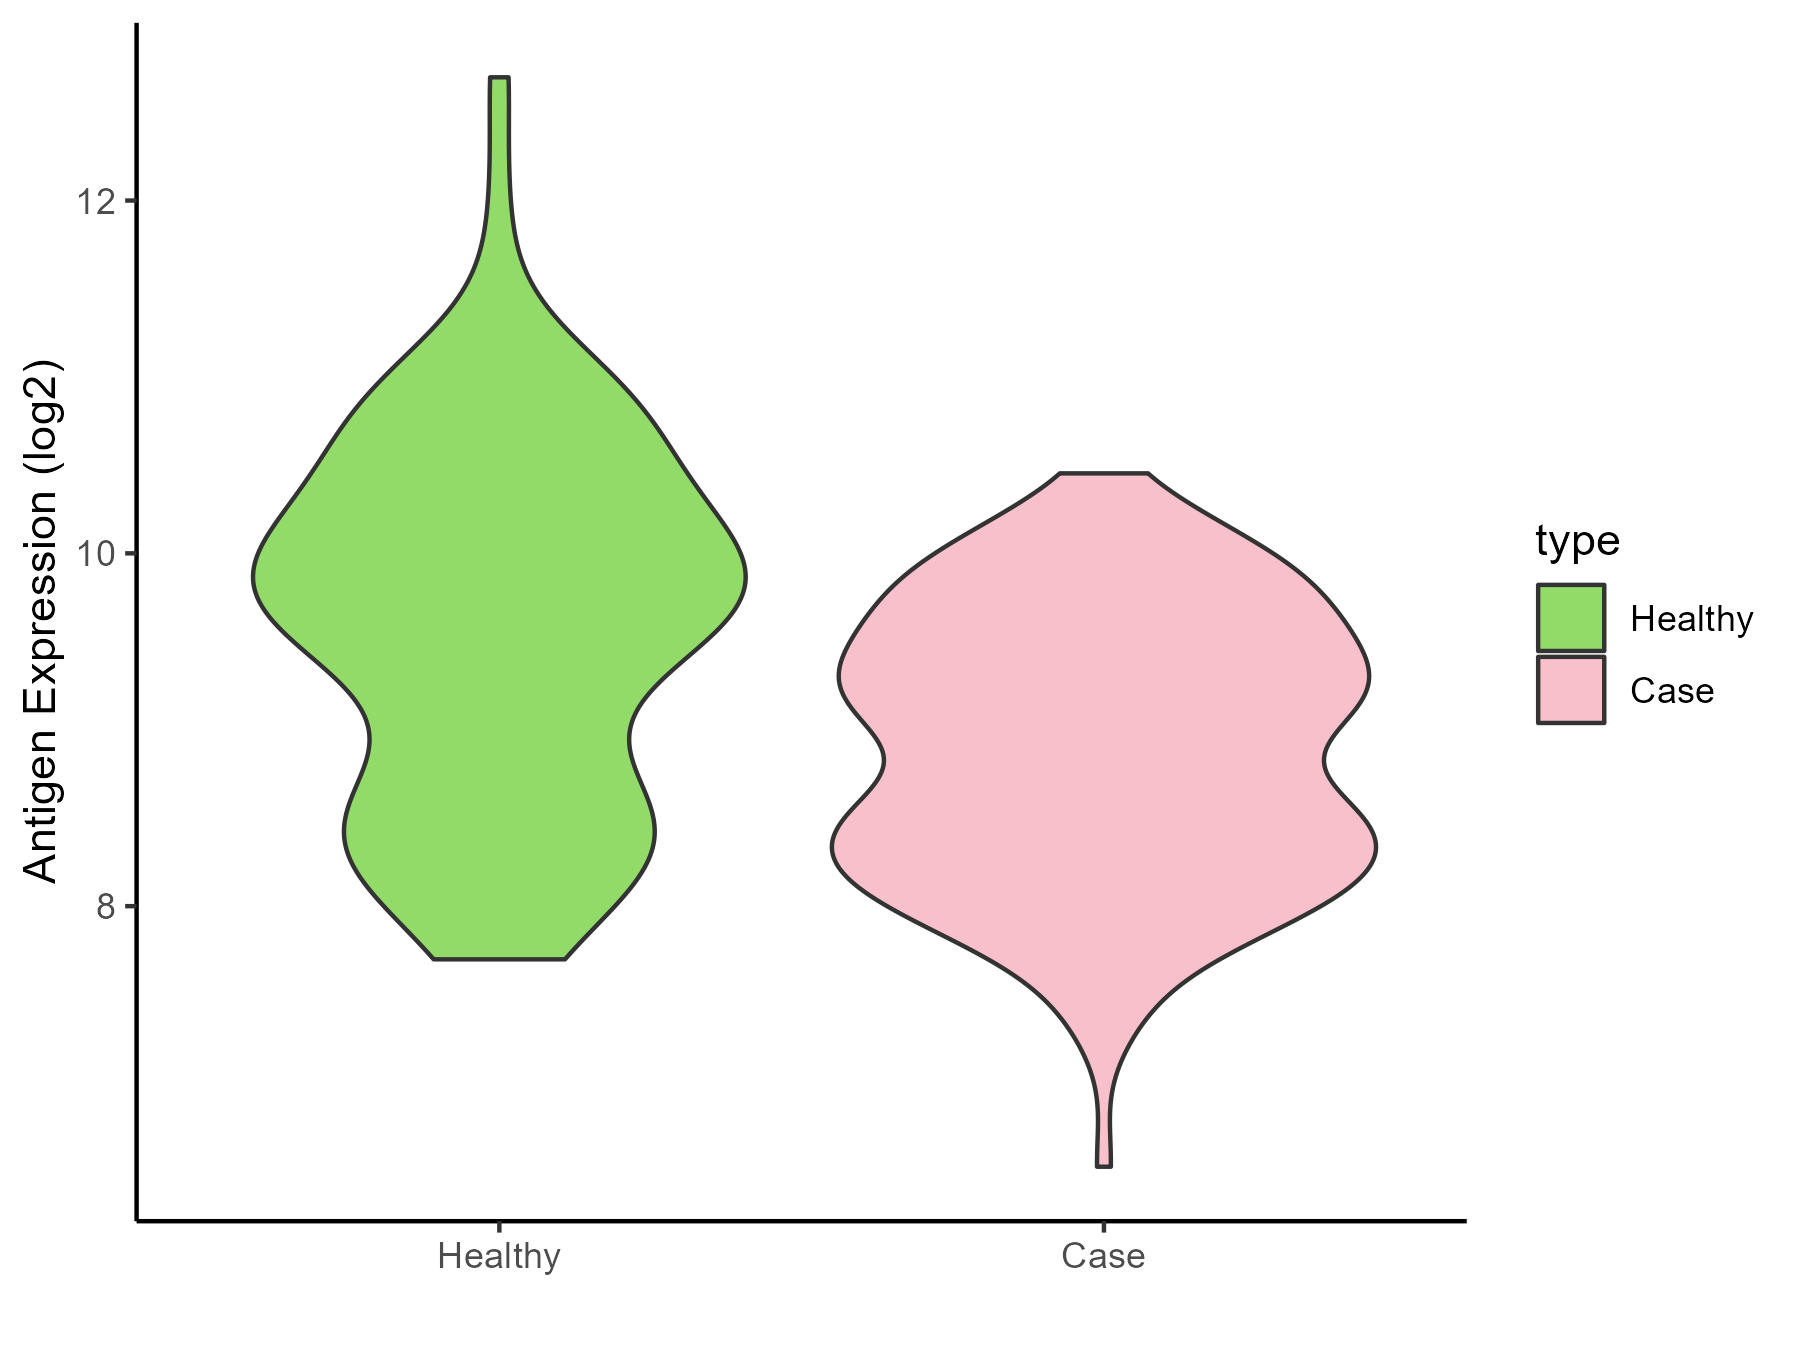
| Differential expression pattern of antigen in diseases | ||
| The Studied Tissue | Peripheral blood | |
| The Specific Disease | Arthritis | |
| The Expression Level of Disease Section Compare with the Healthy Individual Tissue | p-value: 3.86E-07; Fold-change: -0.733834966; Z-score: -0.709961424 | |
| Disease-specific Antigen Abundances |
|
Click to View the Clearer Original Diagram |
| Differential expression pattern of antigen in diseases | ||
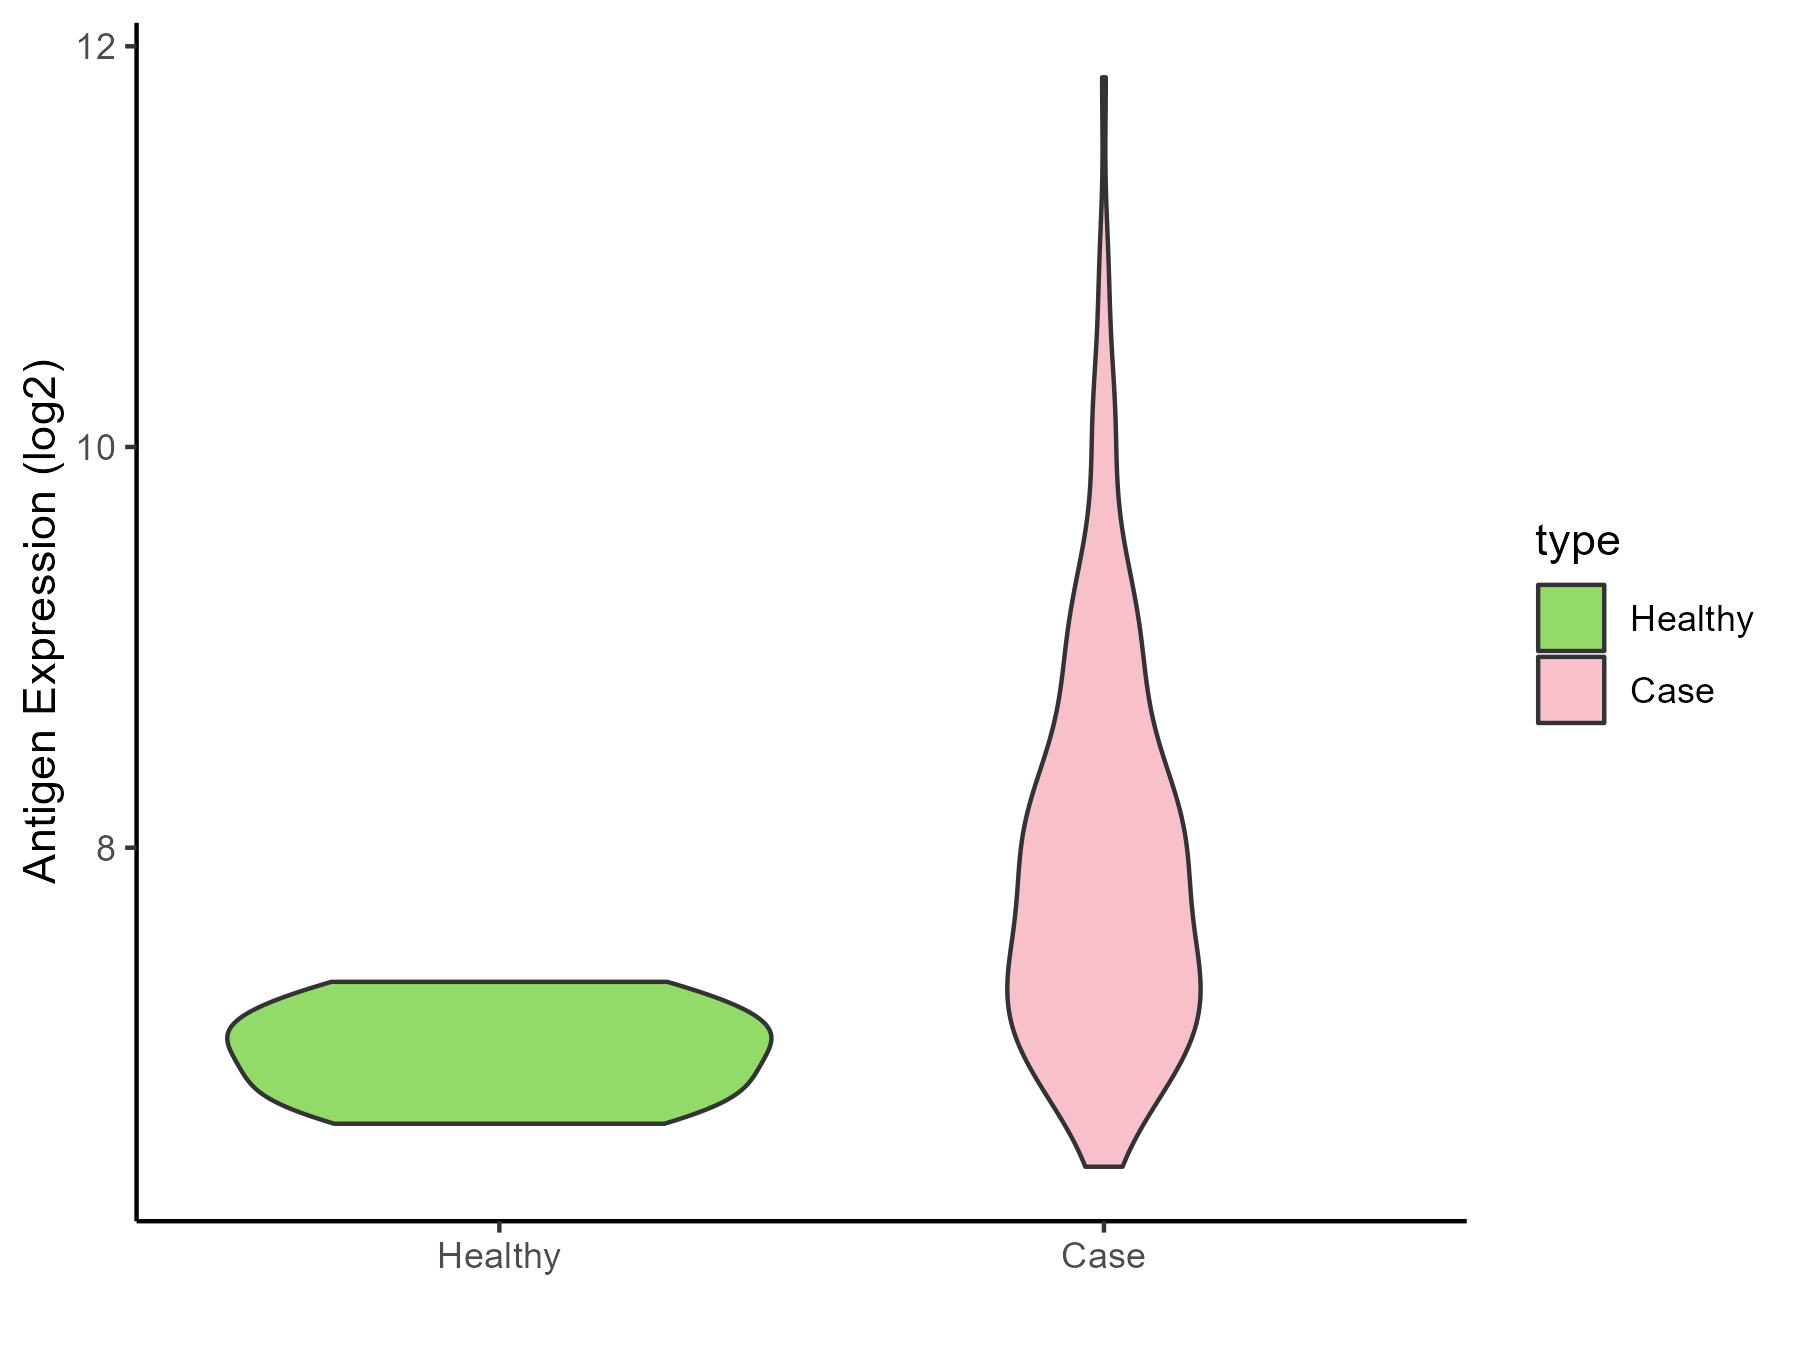
| The Studied Tissue | Synovial | |
| The Specific Disease | Rheumatoid arthritis | |
| The Expression Level of Disease Section Compare with the Healthy Individual Tissue | p-value: 3.06E-07; Fold-change: 0.786198888; Z-score: 3.142982321 | |
| Disease-specific Antigen Abundances |
|
Click to View the Clearer Original Diagram |
| Differential expression pattern of antigen in diseases | ||
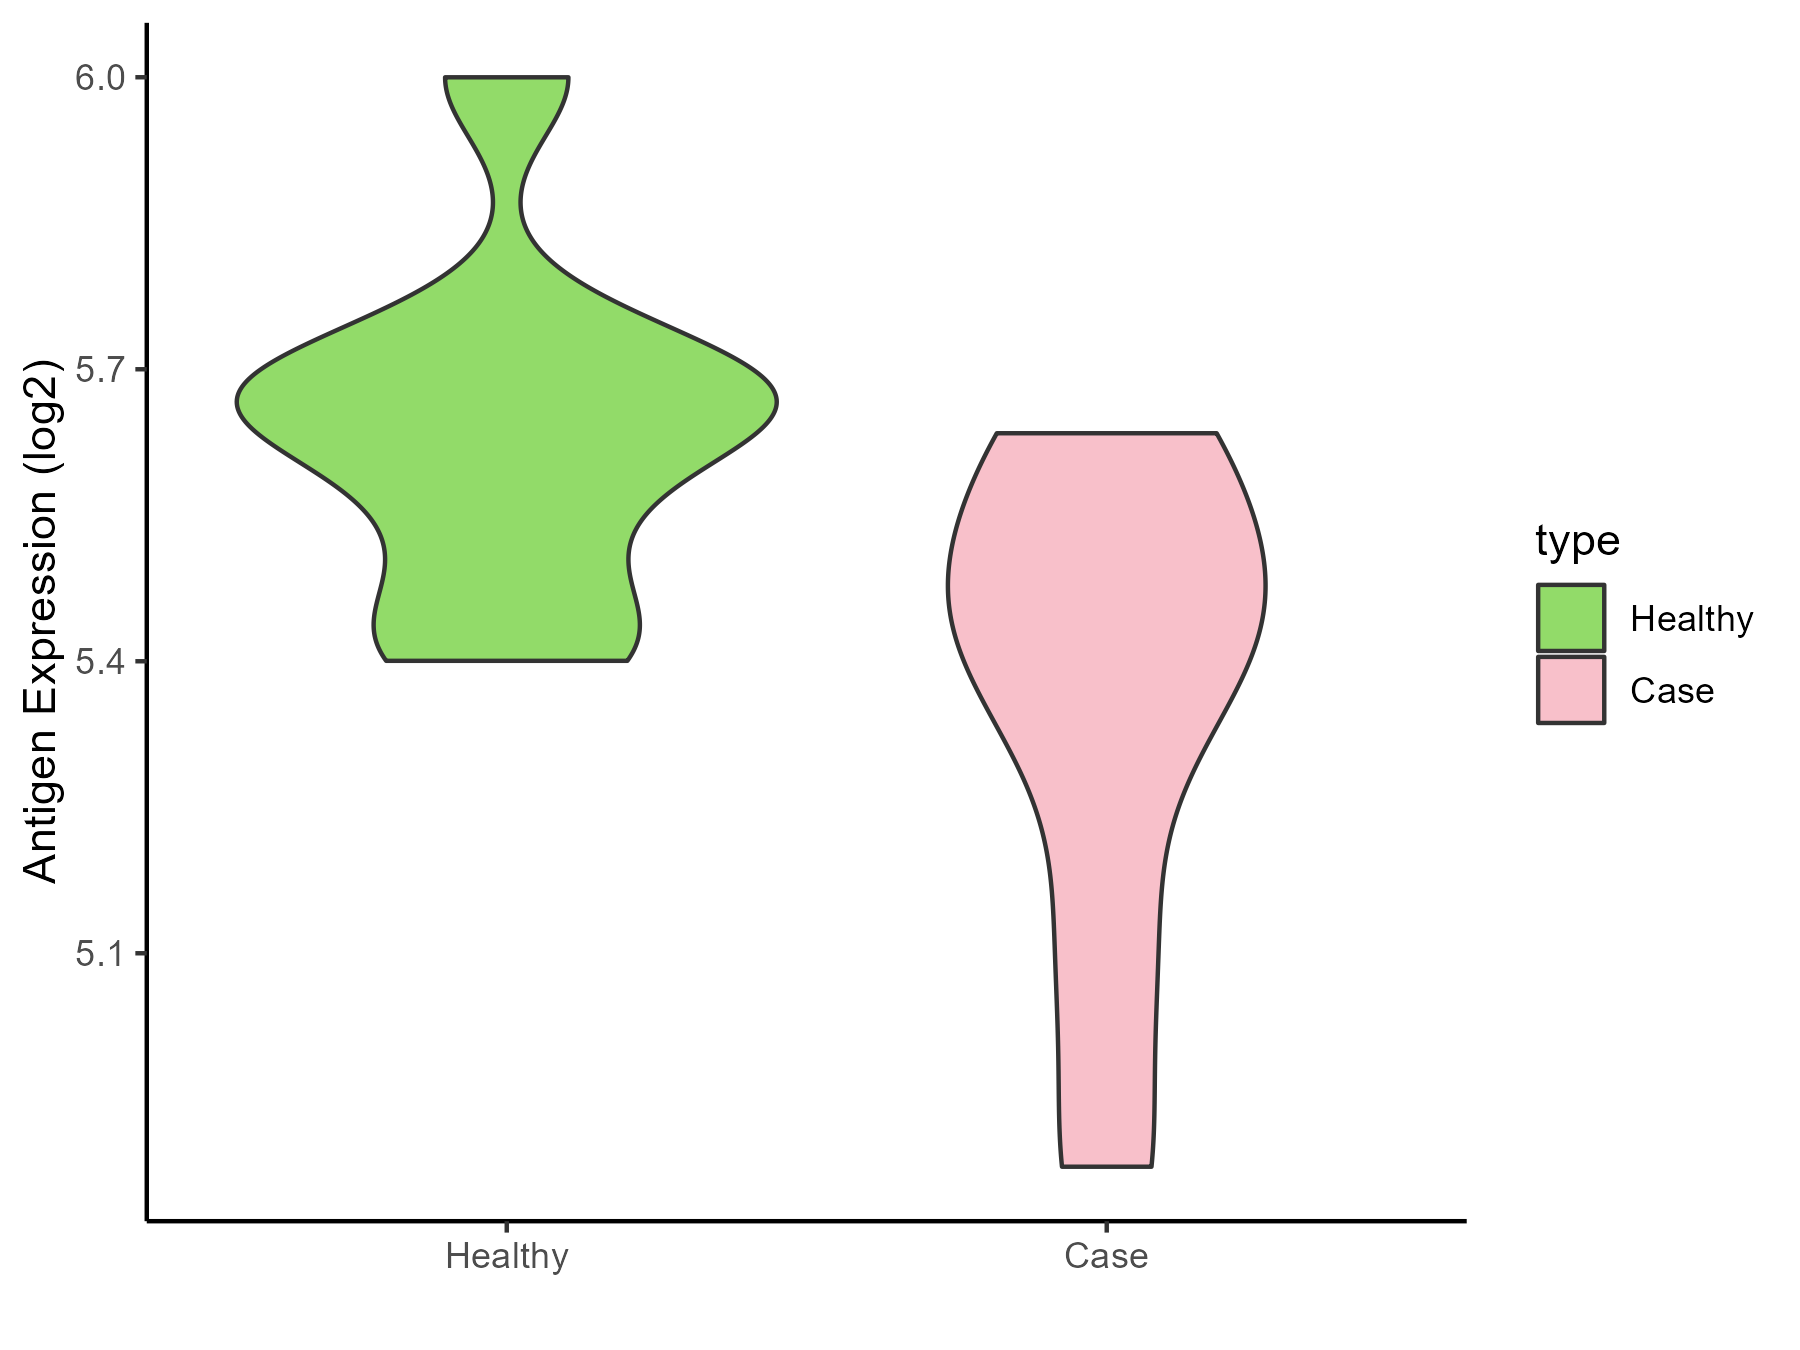
| The Studied Tissue | Pheripheral blood | |
| The Specific Disease | Ankylosing spondylitis | |
| The Expression Level of Disease Section Compare with the Healthy Individual Tissue | p-value: 0.026320174; Fold-change: -0.217680577; Z-score: -1.226429559 | |
| Disease-specific Antigen Abundances |
|
Click to View the Clearer Original Diagram |
| Differential expression pattern of antigen in diseases | ||
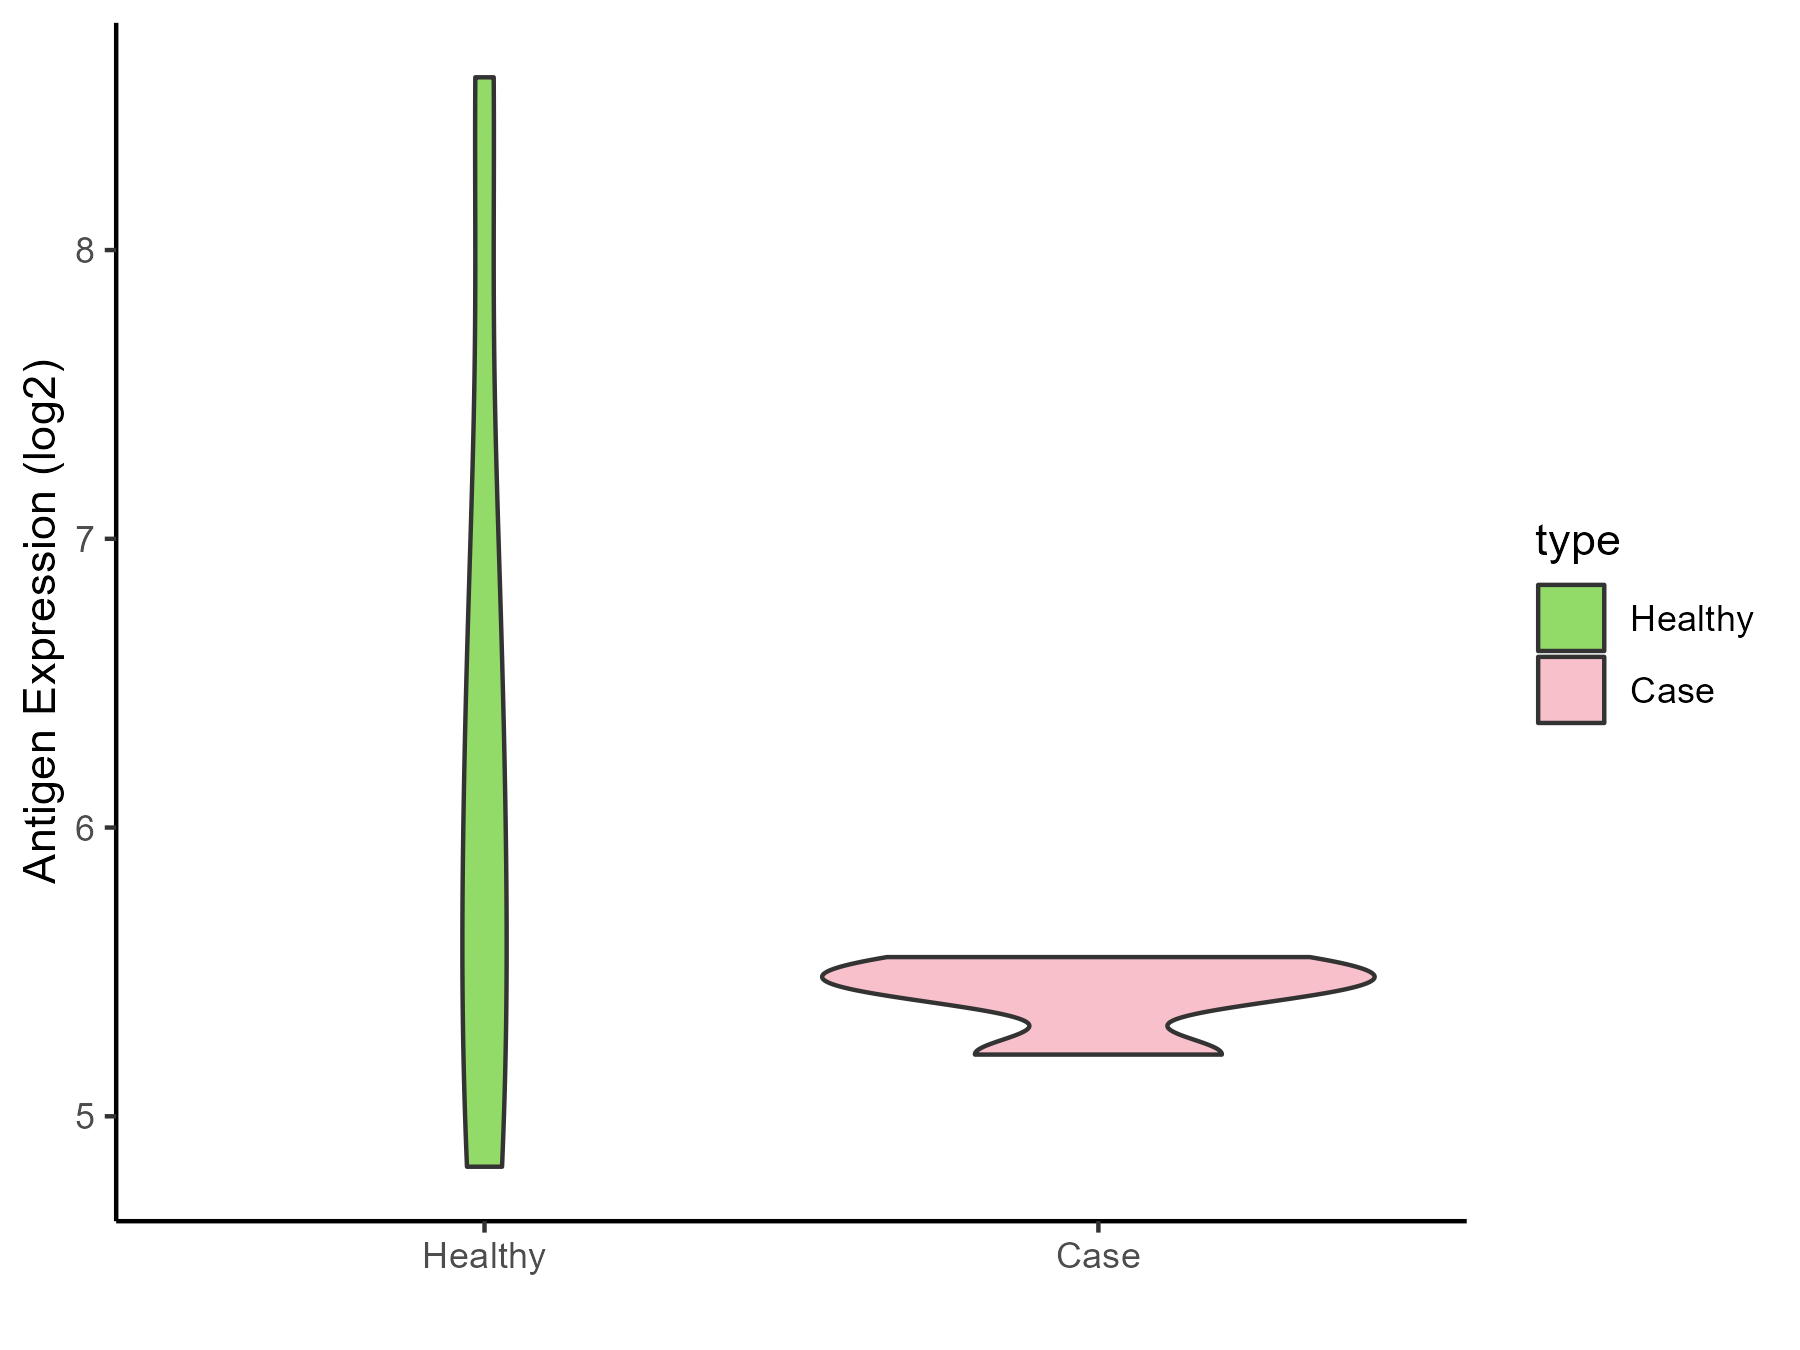
| The Studied Tissue | Bone marrow | |
| The Specific Disease | Osteoporosis | |
| The Expression Level of Disease Section Compare with the Healthy Individual Tissue | p-value: 0.234067766; Fold-change: -0.610622078; Z-score: -0.413562343 | |
| Disease-specific Antigen Abundances |
|
Click to View the Clearer Original Diagram |
ICD Disease Classification 16
| Differential expression pattern of antigen in diseases | ||
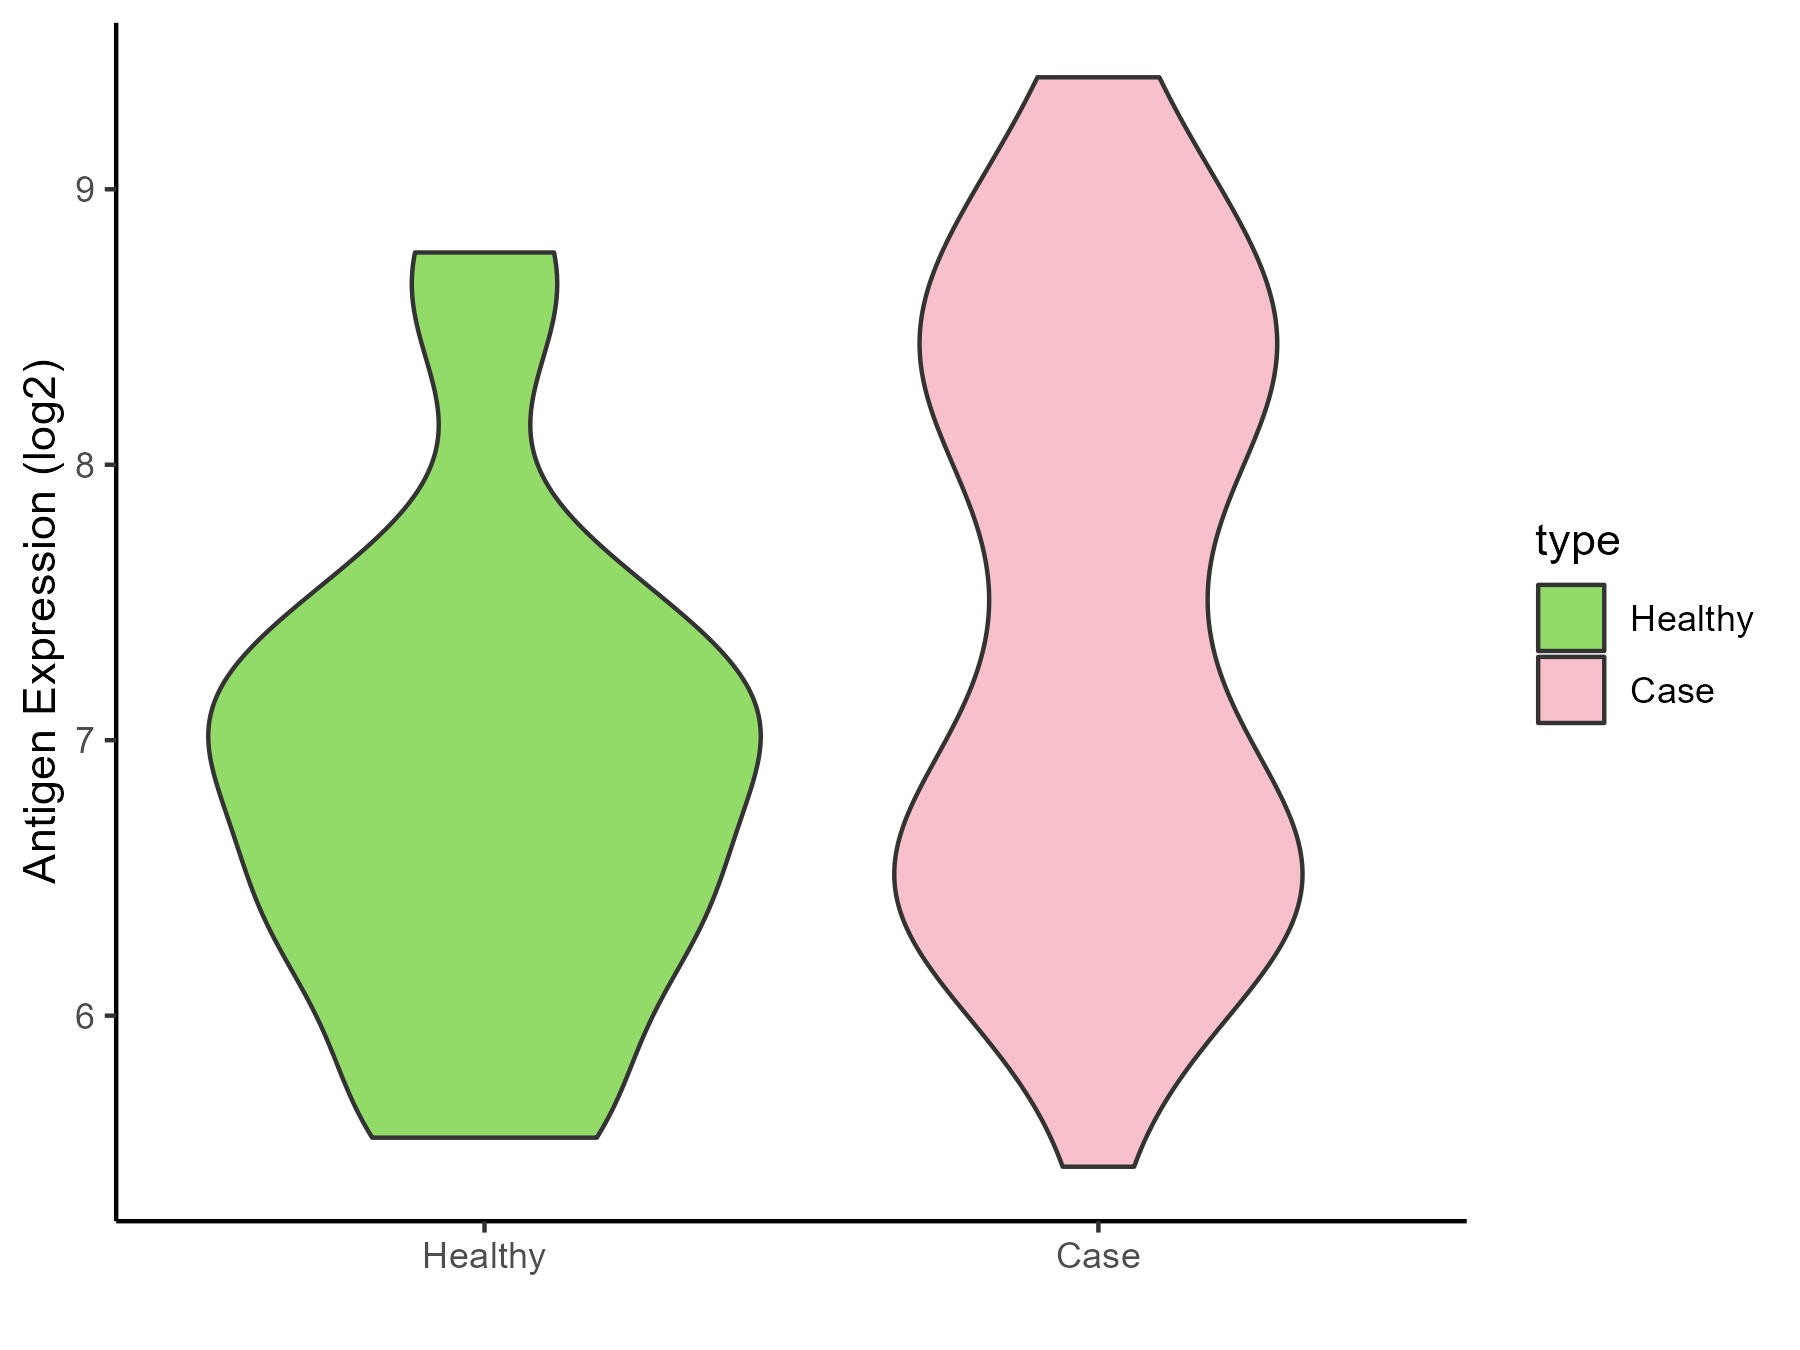
| The Studied Tissue | Endometrium | |
| The Specific Disease | Endometriosis | |
| The Expression Level of Disease Section Compare with the Healthy Individual Tissue | p-value: 0.014439788; Fold-change: 0.459103276; Z-score: 0.524133912 | |
| Disease-specific Antigen Abundances |
|
Click to View the Clearer Original Diagram |
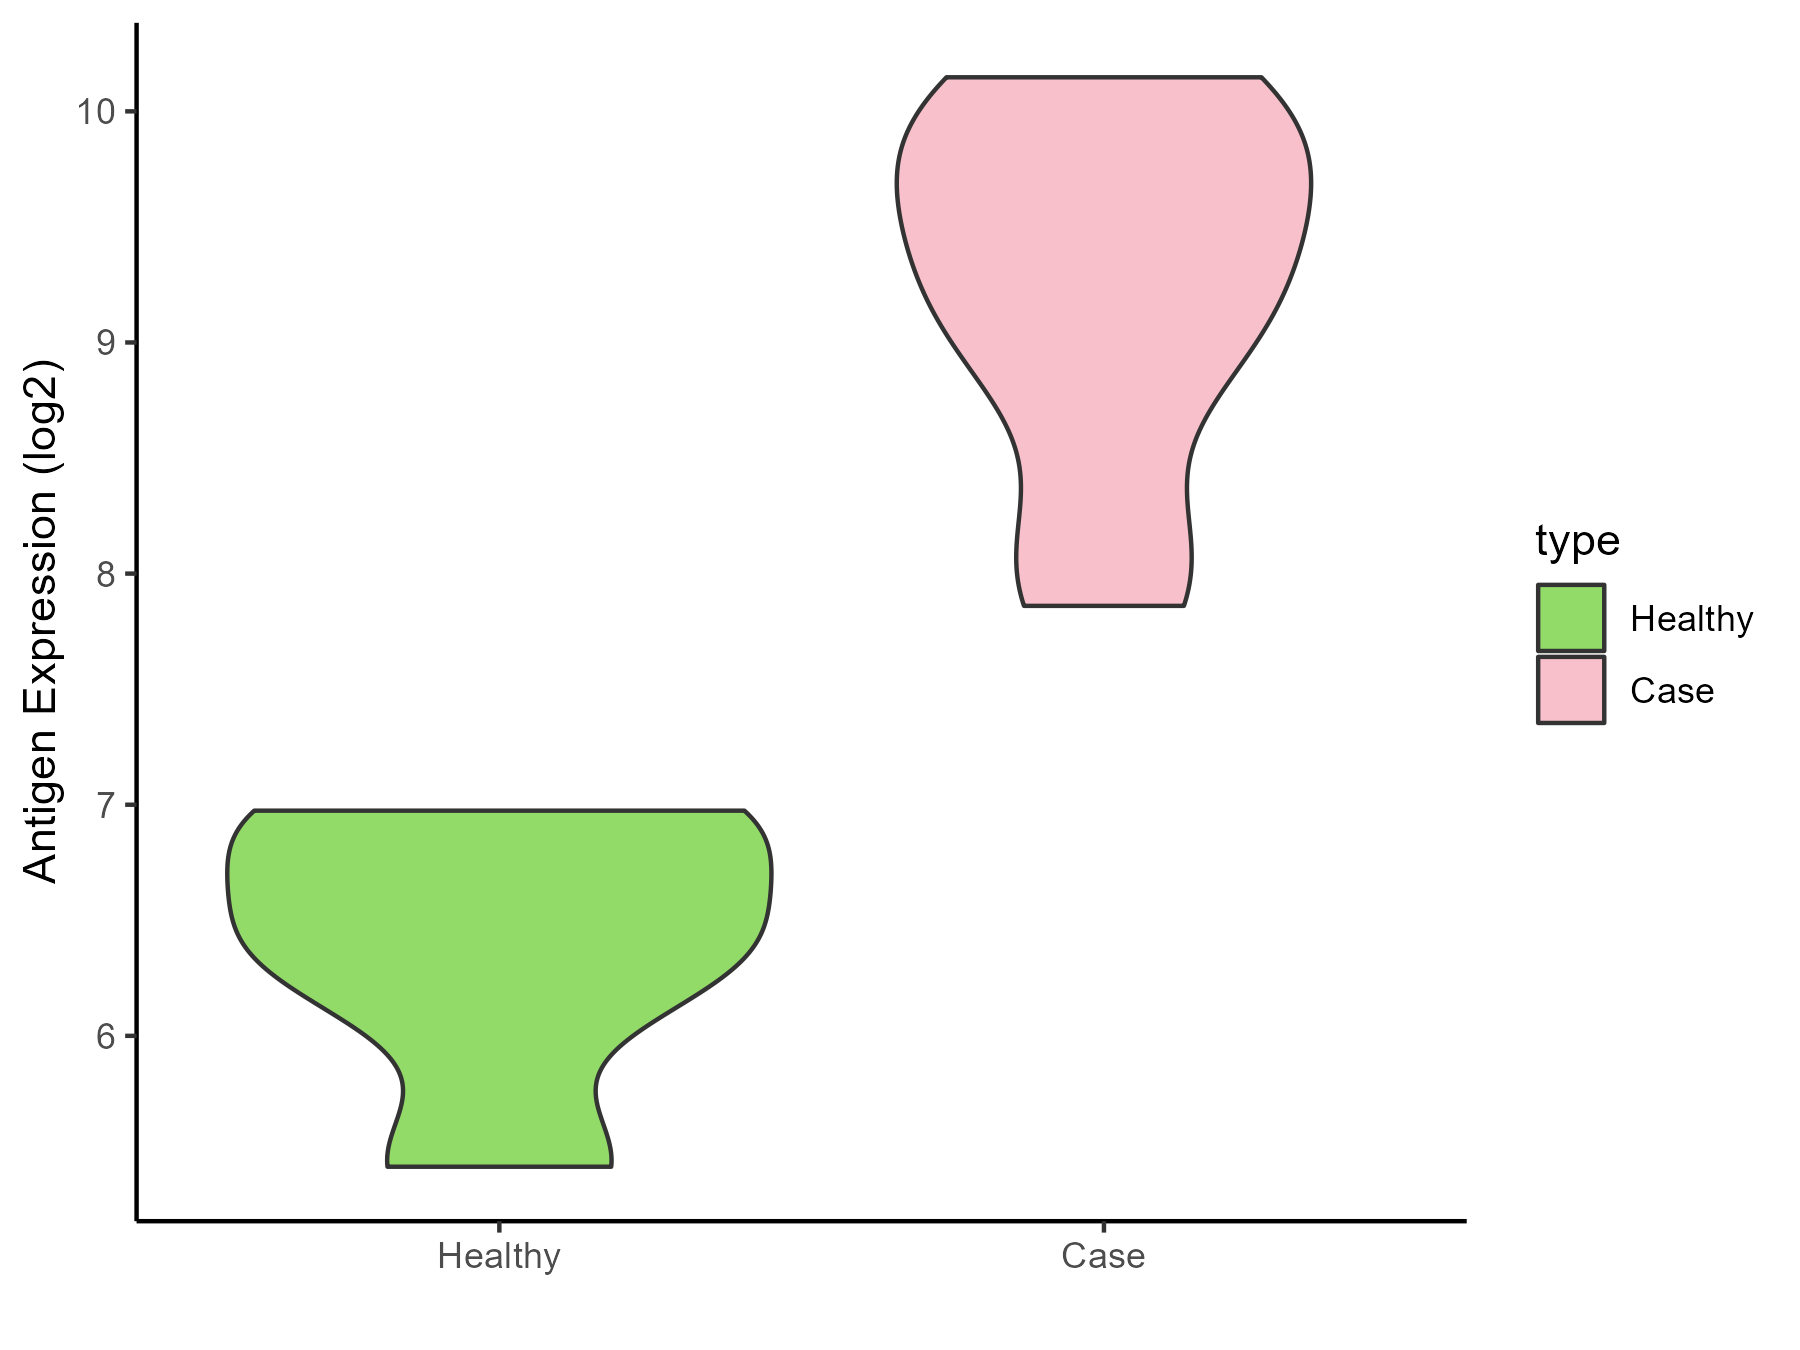
| Differential expression pattern of antigen in diseases | ||
| The Studied Tissue | Bladder | |
| The Specific Disease | Interstitial cystitis | |
| The Expression Level of Disease Section Compare with the Healthy Individual Tissue | p-value: 1.66E-05; Fold-change: 2.969755403; Z-score: 4.784776058 | |
| Disease-specific Antigen Abundances |
|
Click to View the Clearer Original Diagram |
ICD Disease Classification 19
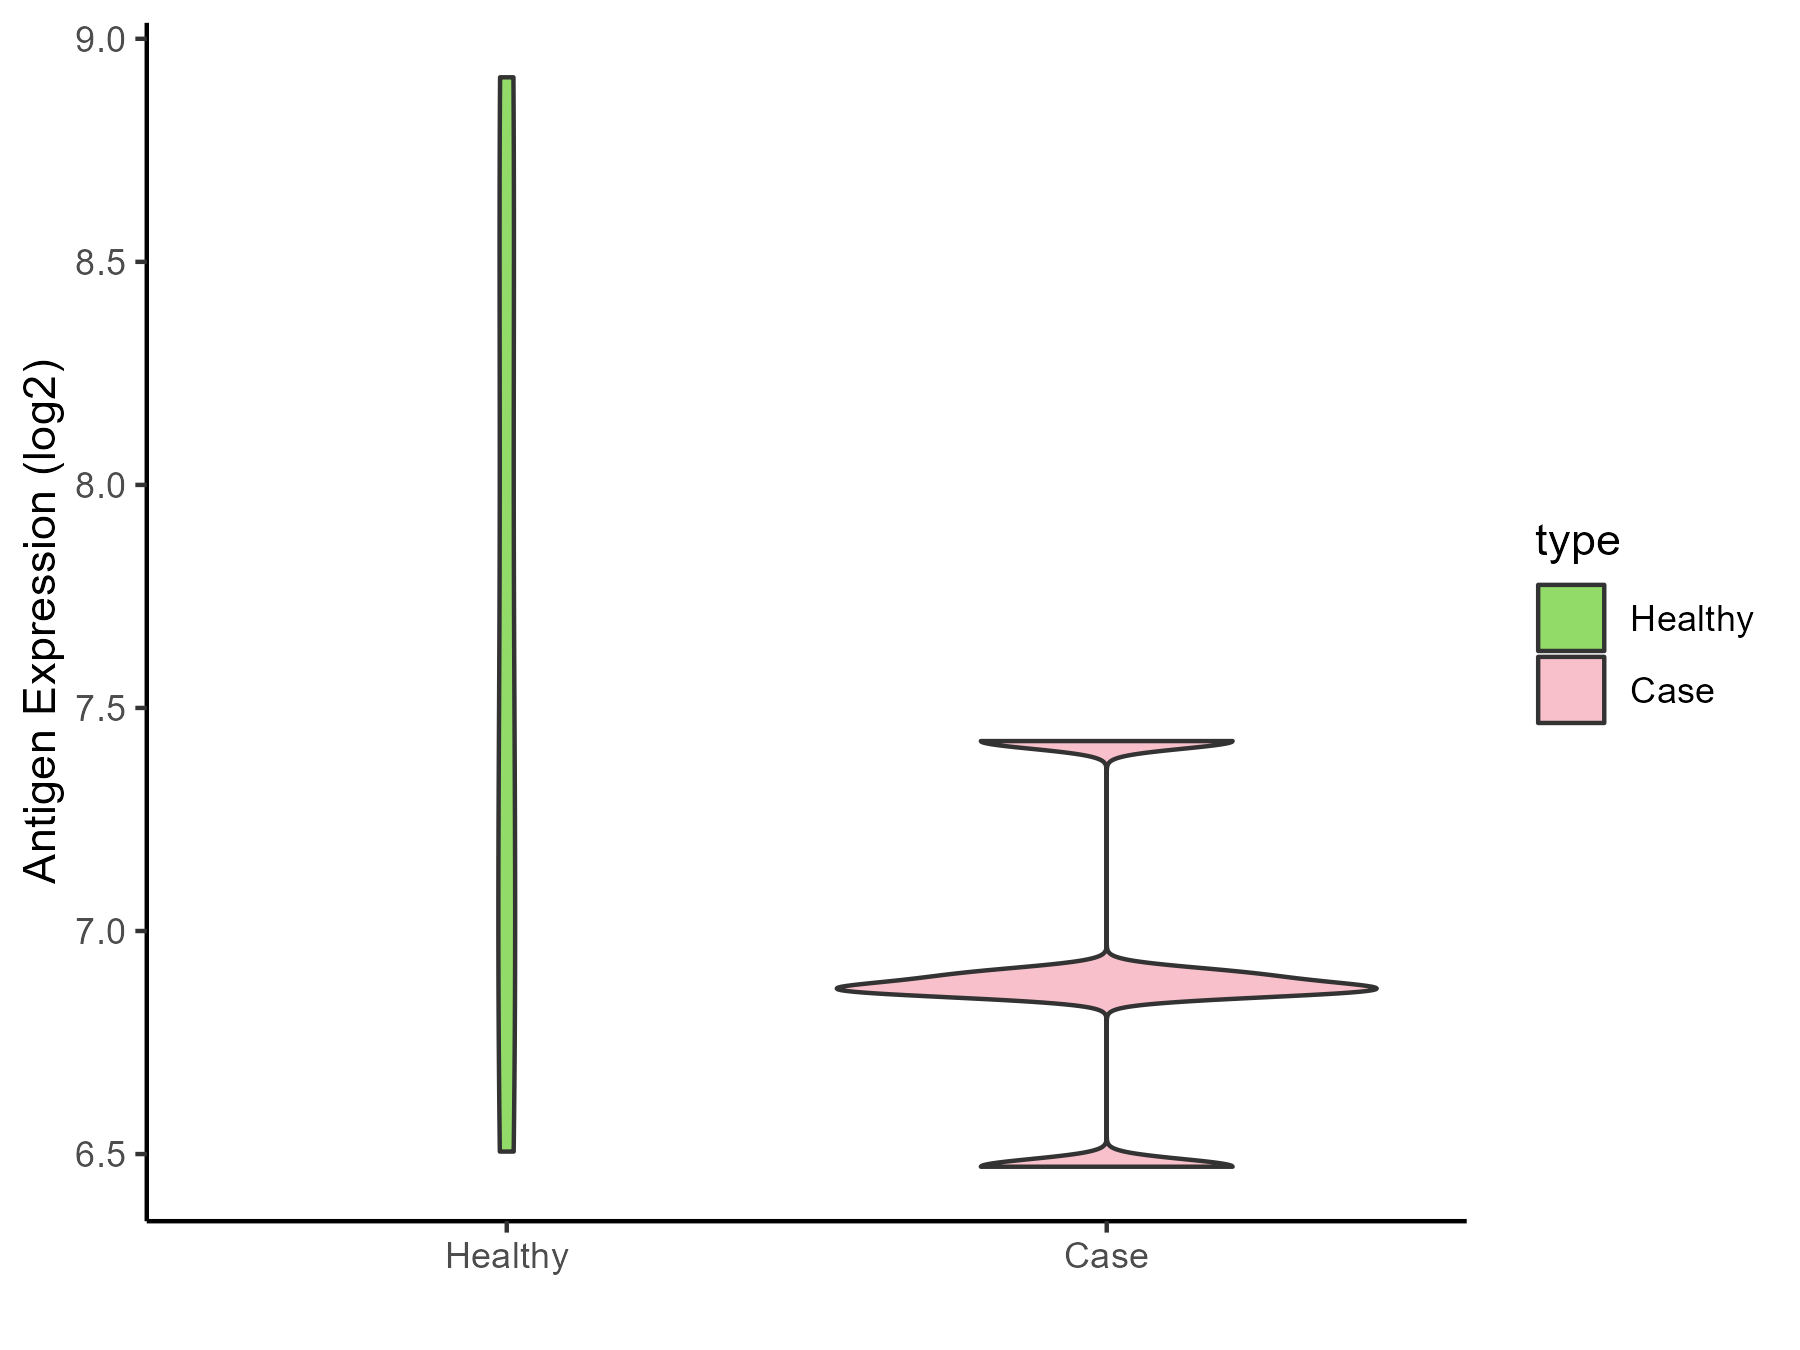
| Differential expression pattern of antigen in diseases | ||
| The Studied Tissue | Myometrium | |
| The Specific Disease | Preterm birth | |
| The Expression Level of Disease Section Compare with the Healthy Individual Tissue | p-value: 0.114479987; Fold-change: -0.72501873; Z-score: -0.703856298 | |
| Disease-specific Antigen Abundances |
|
Click to View the Clearer Original Diagram |
ICD Disease Classification 2
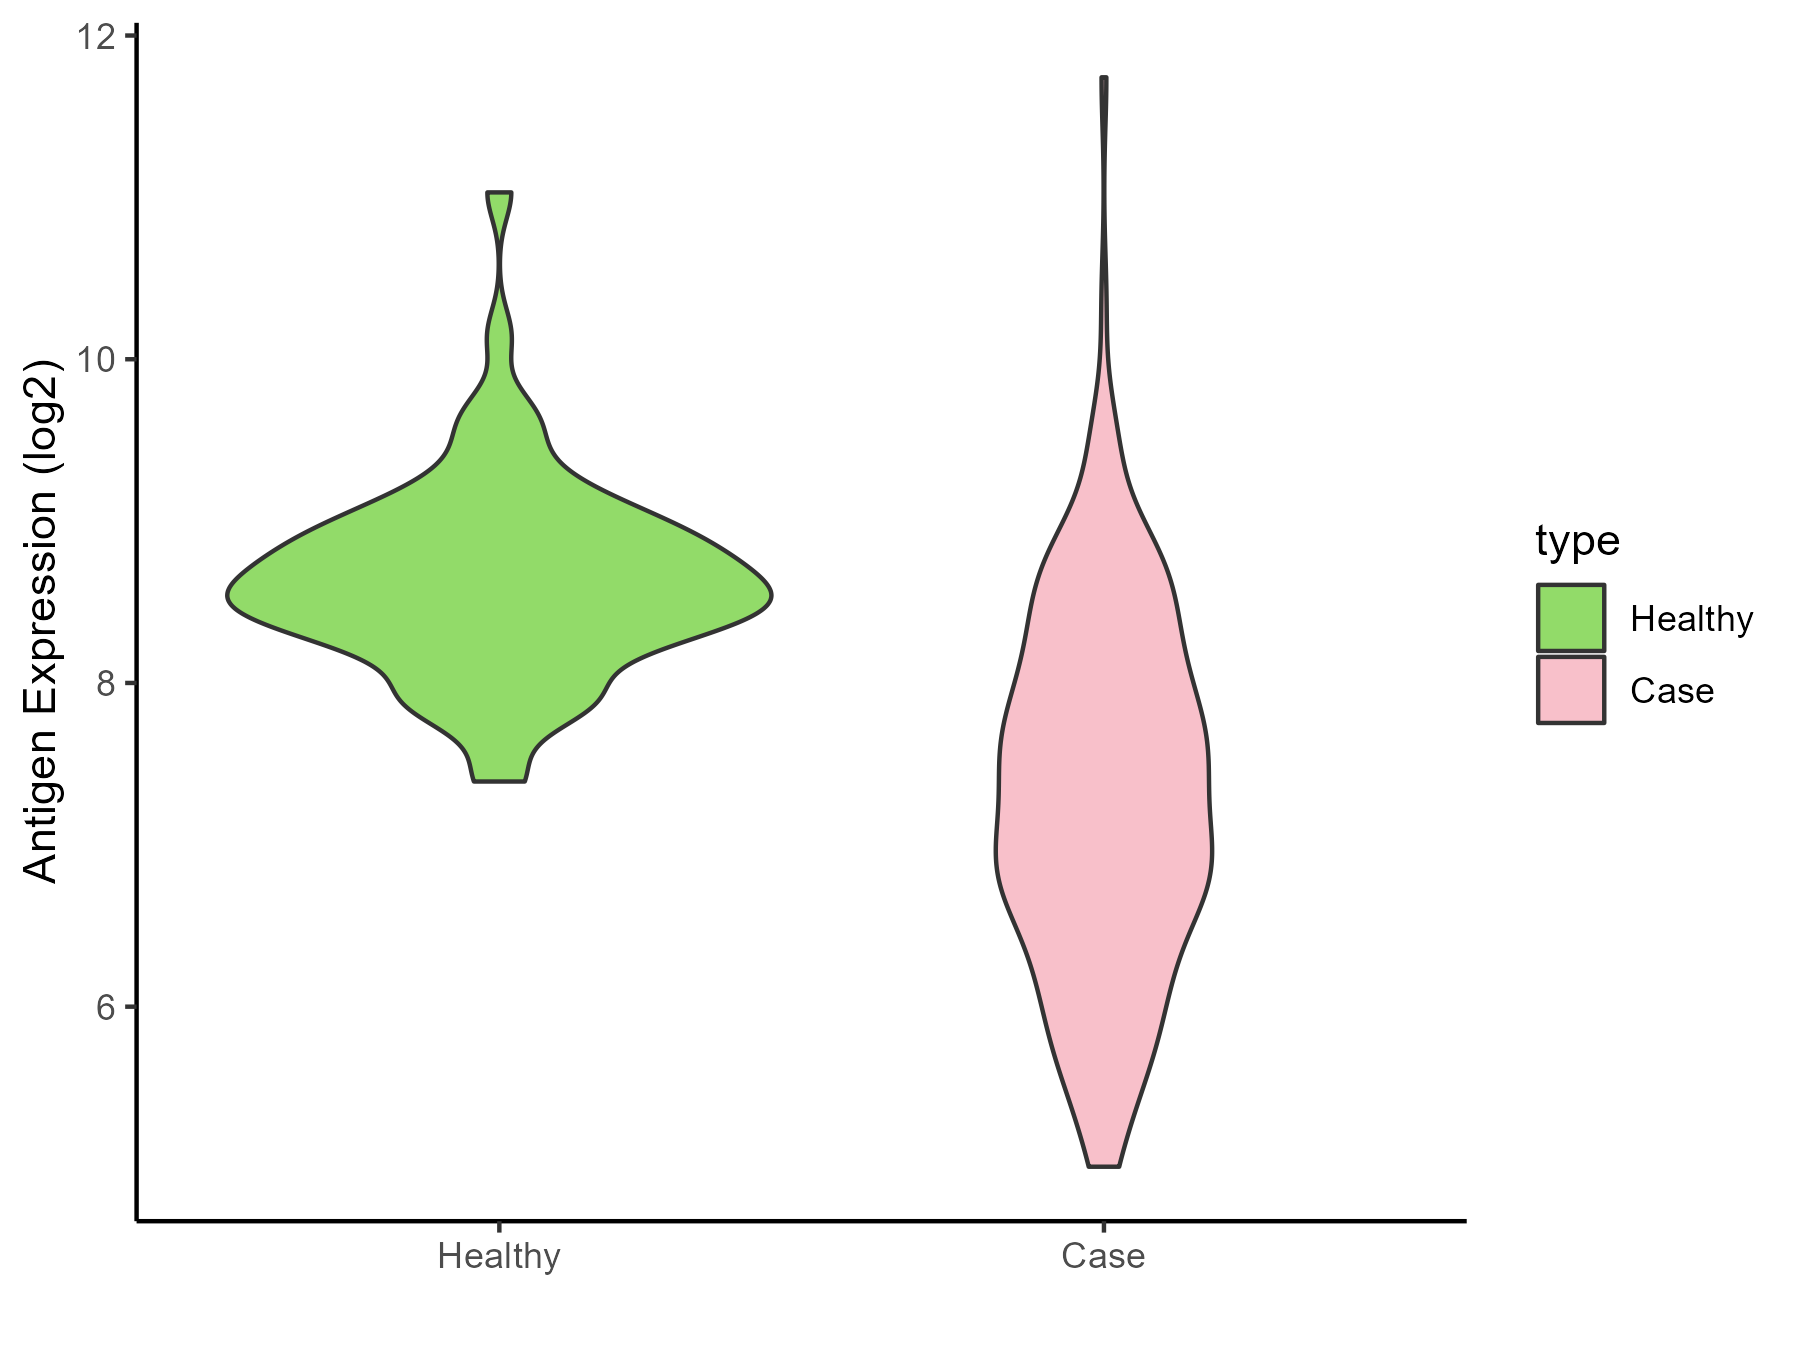
| Differential expression pattern of antigen in diseases | ||
| The Studied Tissue | Bone marrow | |
| The Specific Disease | Acute myelocytic leukemia | |
| The Expression Level of Disease Section Compare with the Healthy Individual Tissue | p-value: 2.62E-48; Fold-change: -1.283895215; Z-score: -2.144399822 | |
| Disease-specific Antigen Abundances |
|
Click to View the Clearer Original Diagram |
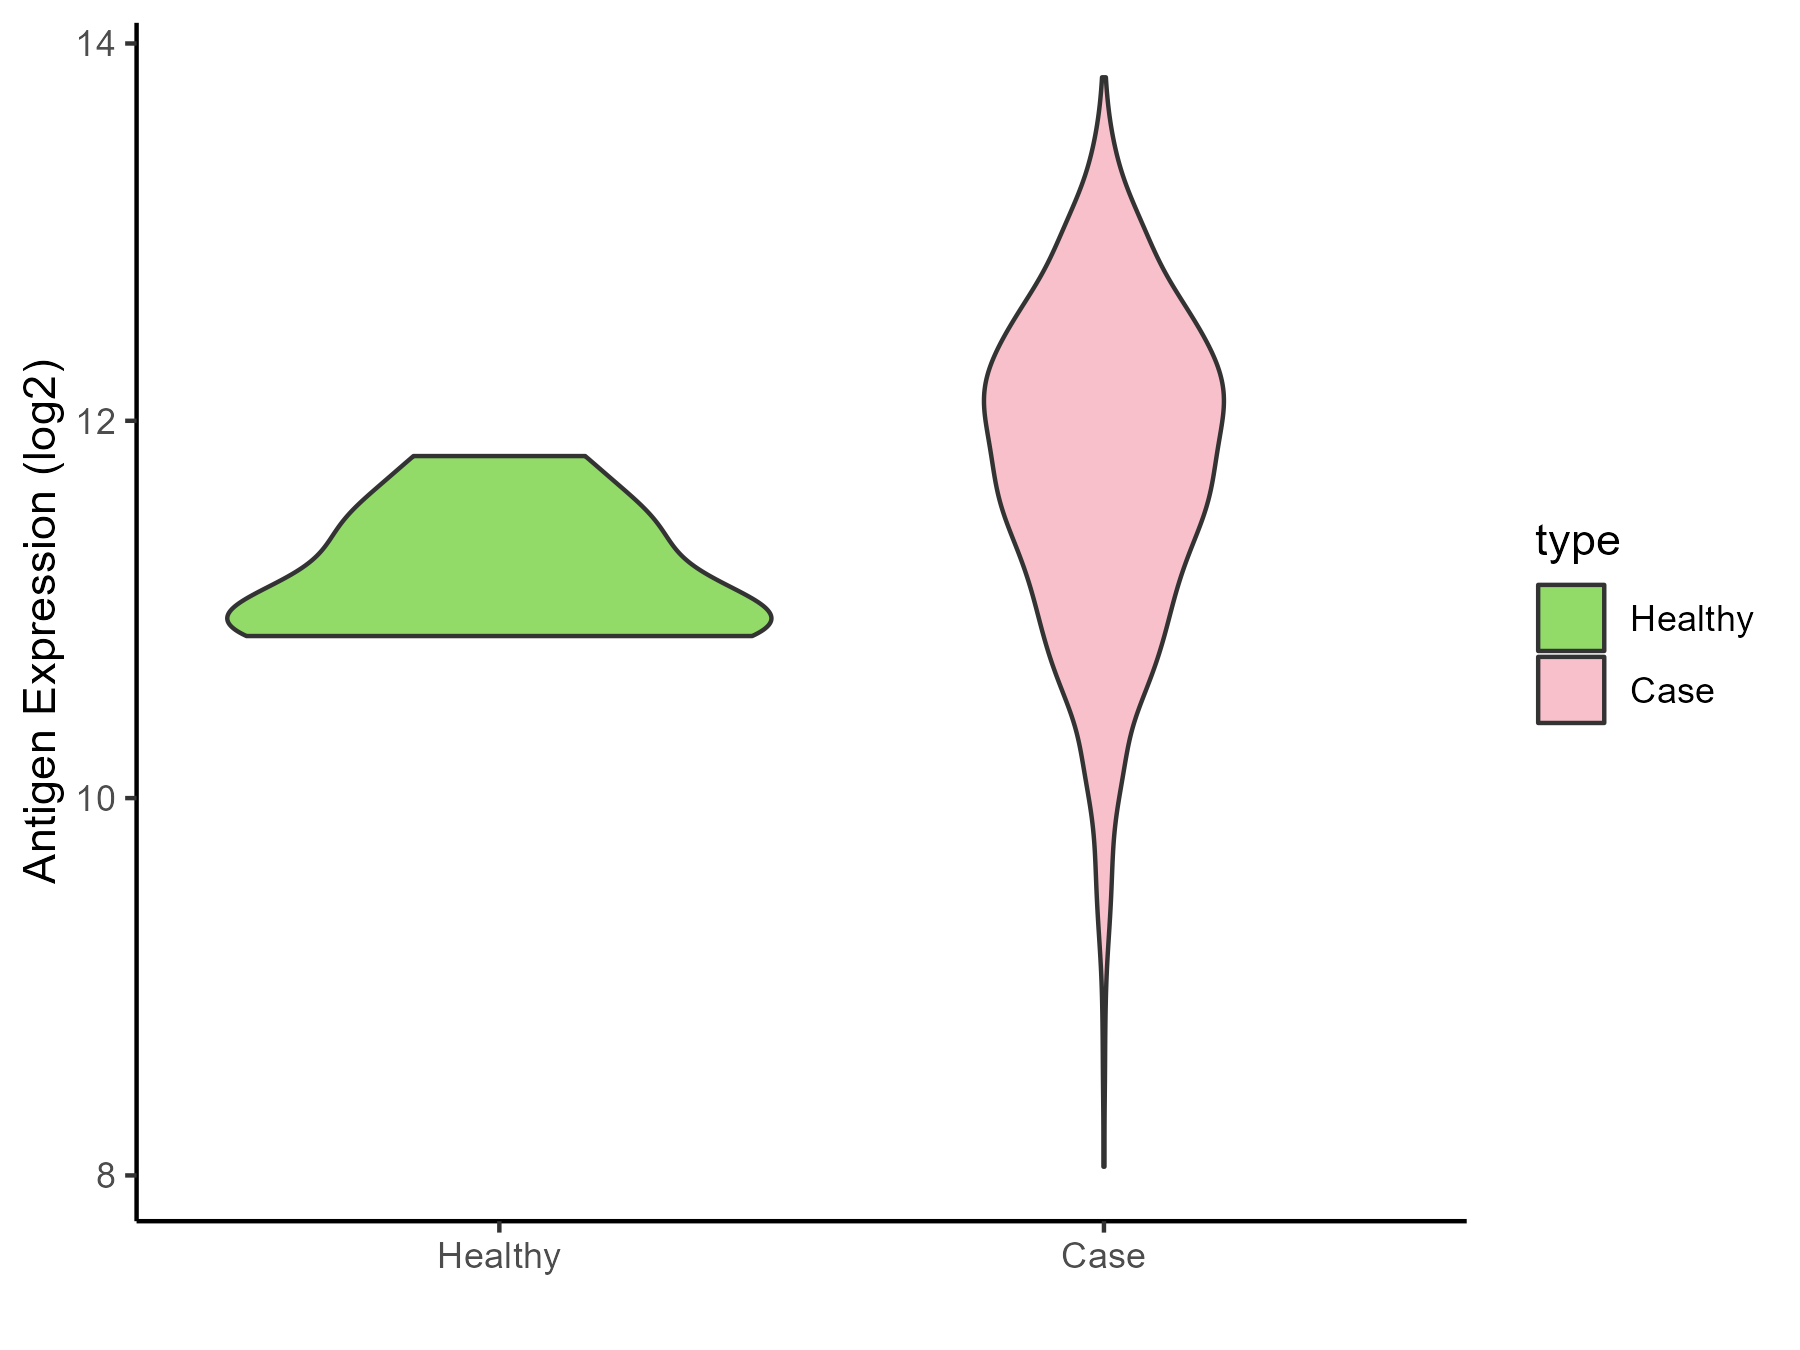
| Differential expression pattern of antigen in diseases | ||
| The Studied Tissue | Bone marrow | |
| The Specific Disease | Myeloma | |
| The Expression Level of Disease Section Compare with the Healthy Individual Tissue | p-value: 0.002631146; Fold-change: 0.77870789; Z-score: 2.224013234 | |
| Disease-specific Antigen Abundances |
|
Click to View the Clearer Original Diagram |
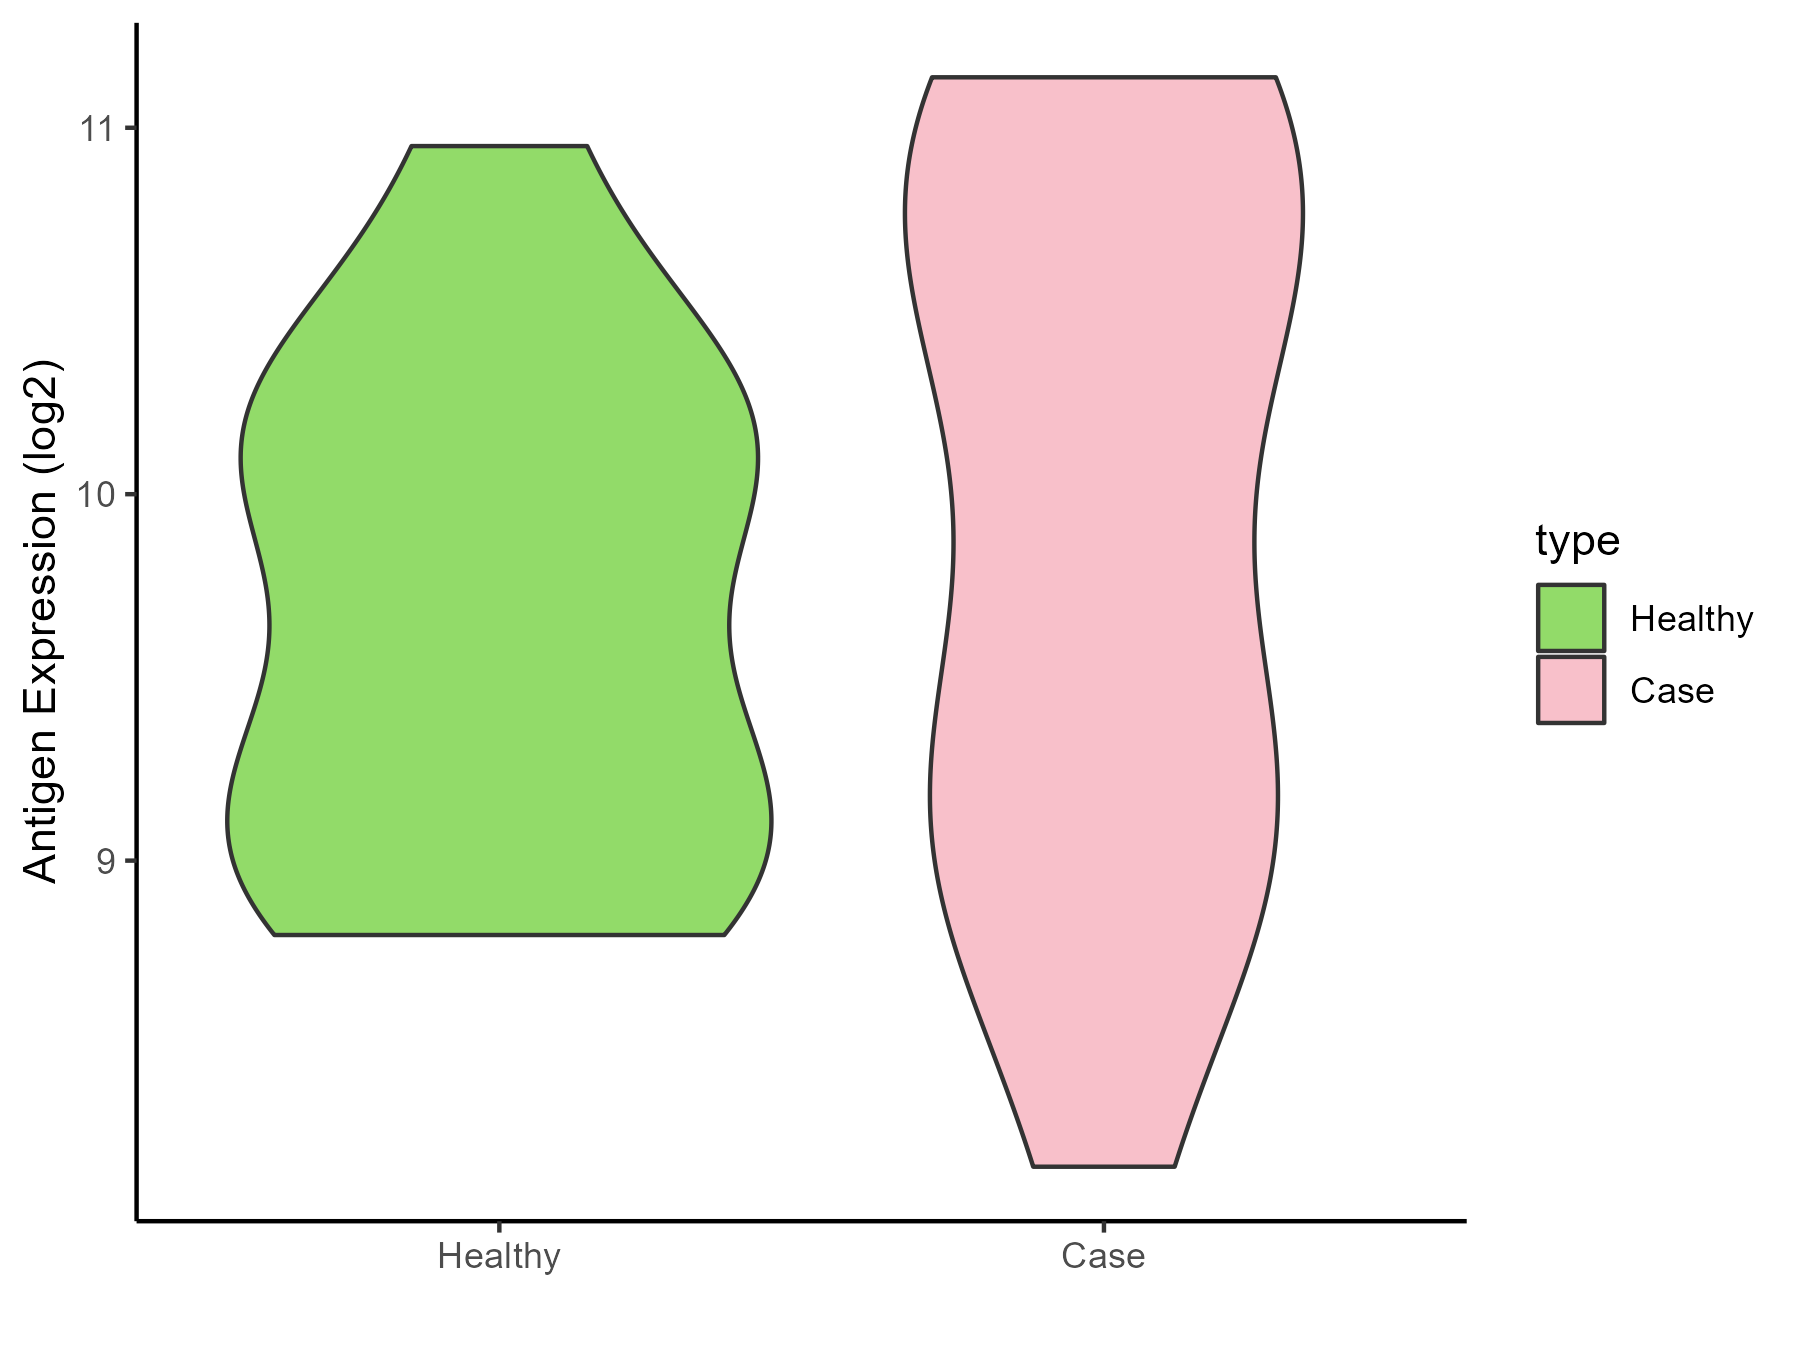
| The Studied Tissue | Peripheral blood | |
| The Specific Disease | Myeloma | |
| The Expression Level of Disease Section Compare with the Healthy Individual Tissue | p-value: 0.433006445; Fold-change: 0.425562826; Z-score: 0.608332361 | |
| Disease-specific Antigen Abundances |
|
Click to View the Clearer Original Diagram |
| Differential expression pattern of antigen in diseases | ||
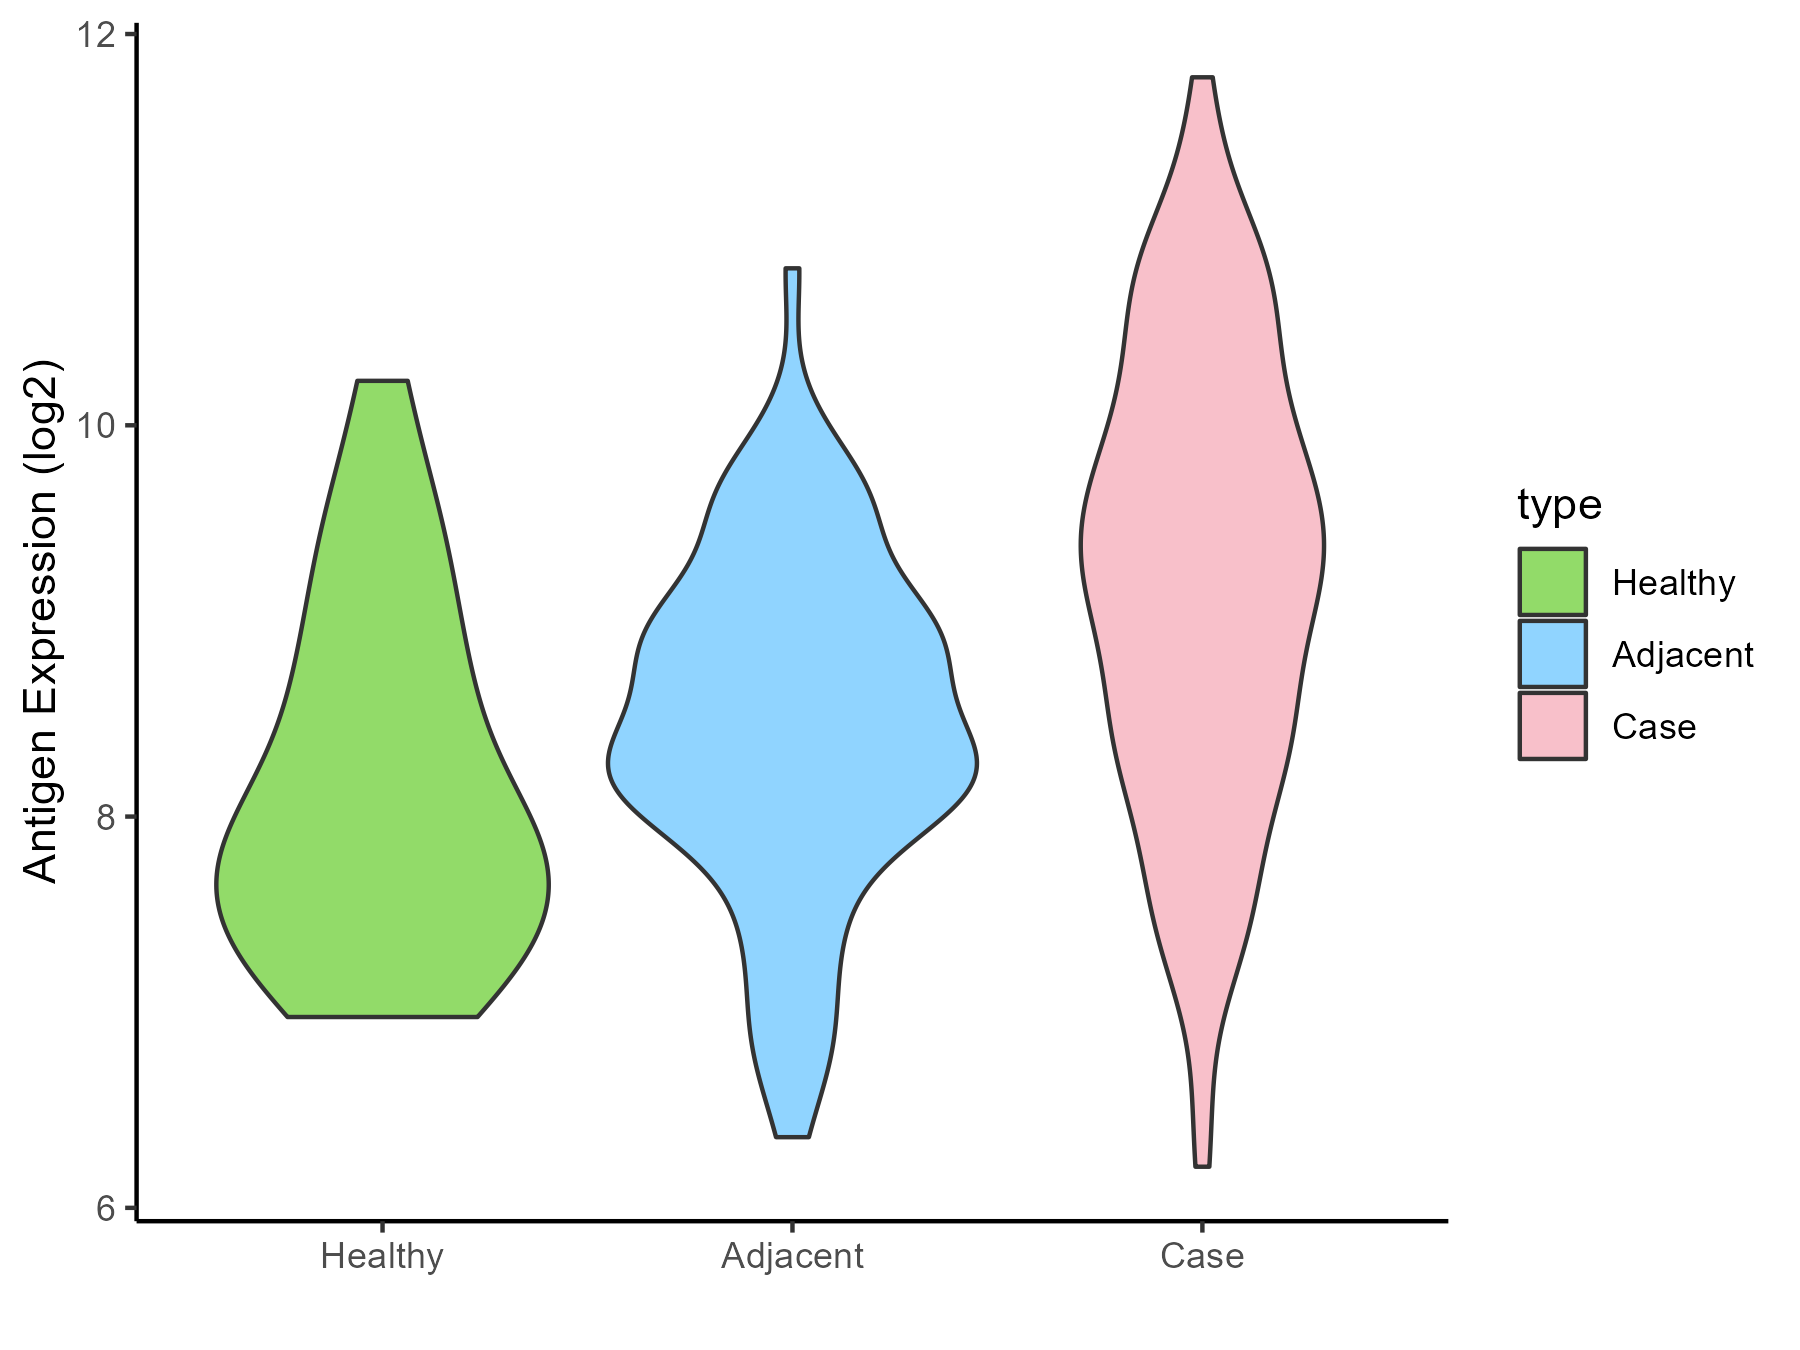
| The Studied Tissue | Oral | |
| The Specific Disease | Oral cancer | |
| The Expression Level of Disease Section Compare with the Healthy Individual Tissue | p-value: 1.58E-06; Fold-change: 1.357478776; Z-score: 1.523097164 | |
| The Expression Level of Disease Section Compare with the Adjacent Tissue | p-value: 3.84E-09; Fold-change: 0.813092286; Z-score: 0.951307958 | |
| Disease-specific Antigen Abundances |
|
Click to View the Clearer Original Diagram |
| Differential expression pattern of antigen in diseases | ||
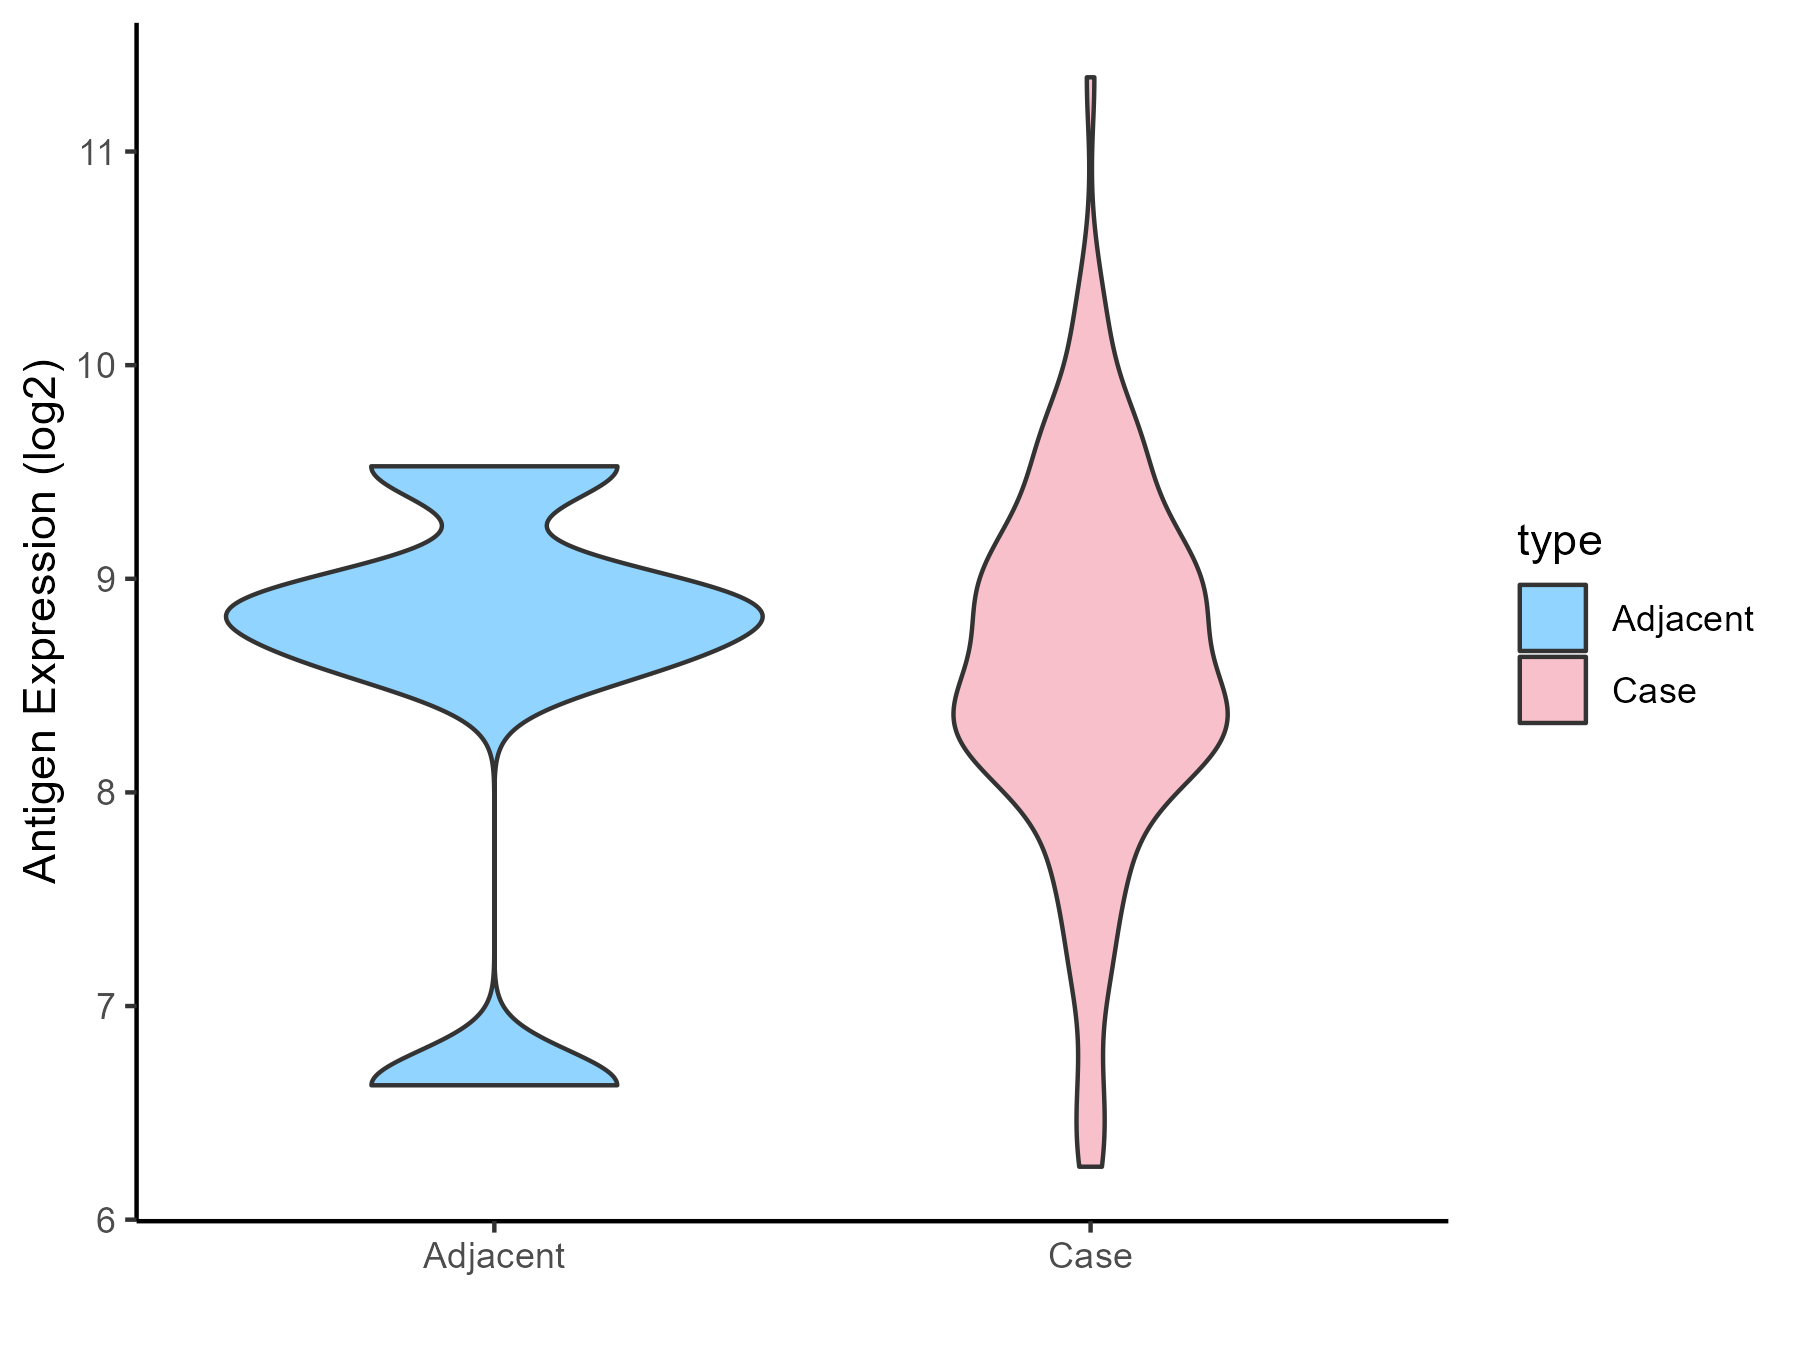
| The Studied Tissue | Esophagus | |
| The Specific Disease | Esophagal cancer | |
| The Expression Level of Disease Section Compare with the Adjacent Tissue | p-value: 0.863774812; Fold-change: -0.314593068; Z-score: -0.285350696 | |
| Disease-specific Antigen Abundances |
|
Click to View the Clearer Original Diagram |
| Differential expression pattern of antigen in diseases | ||
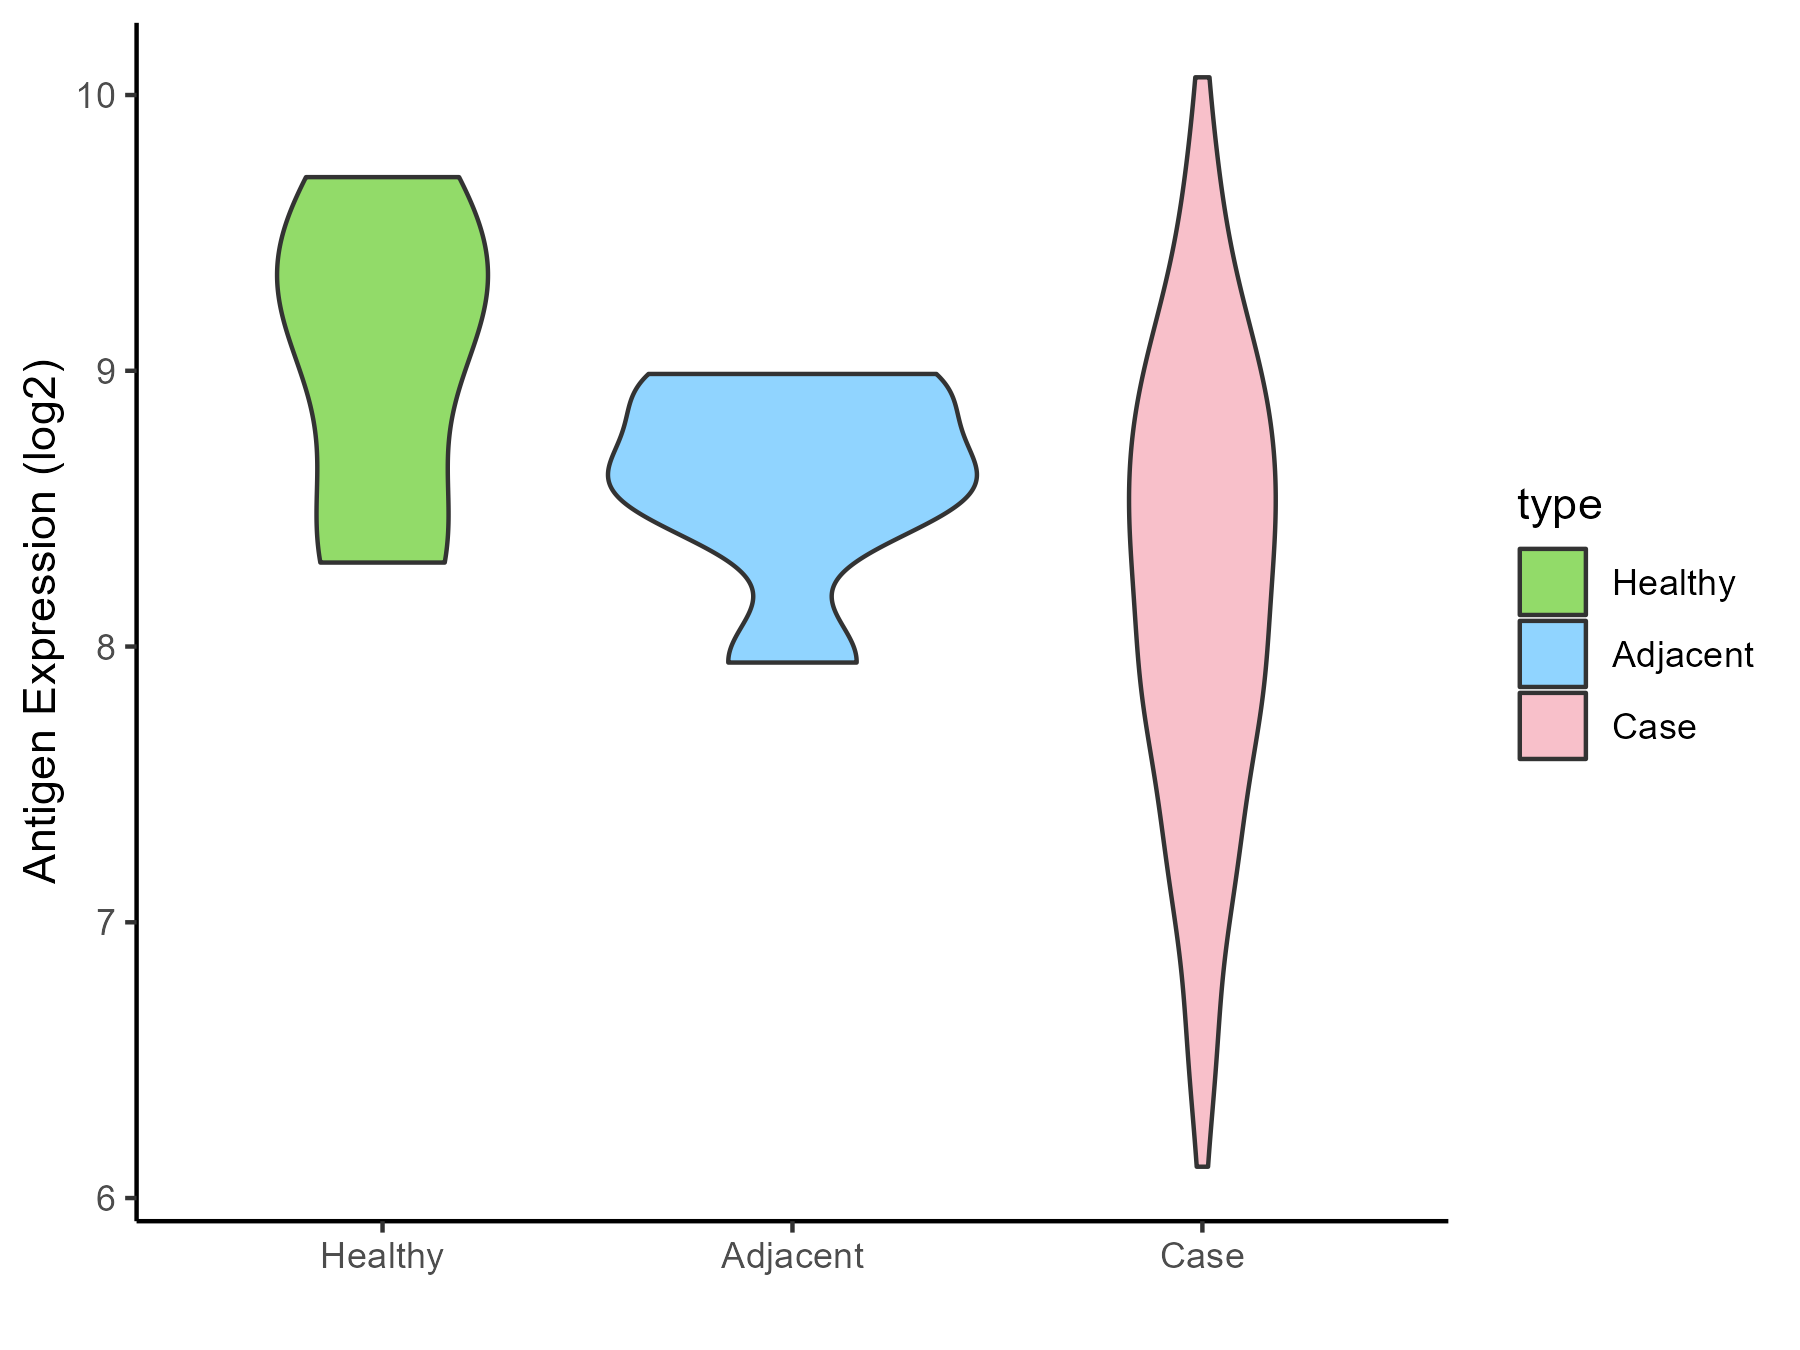
| The Studied Tissue | Rectal colon | |
| The Specific Disease | Rectal cancer | |
| The Expression Level of Disease Section Compare with the Healthy Individual Tissue | p-value: 0.014088611; Fold-change: -0.899955784; Z-score: -1.606697947 | |
| The Expression Level of Disease Section Compare with the Adjacent Tissue | p-value: 0.062158684; Fold-change: -0.318490907; Z-score: -0.837457339 | |
| Disease-specific Antigen Abundances |
|
Click to View the Clearer Original Diagram |
| Differential expression pattern of antigen in diseases | ||
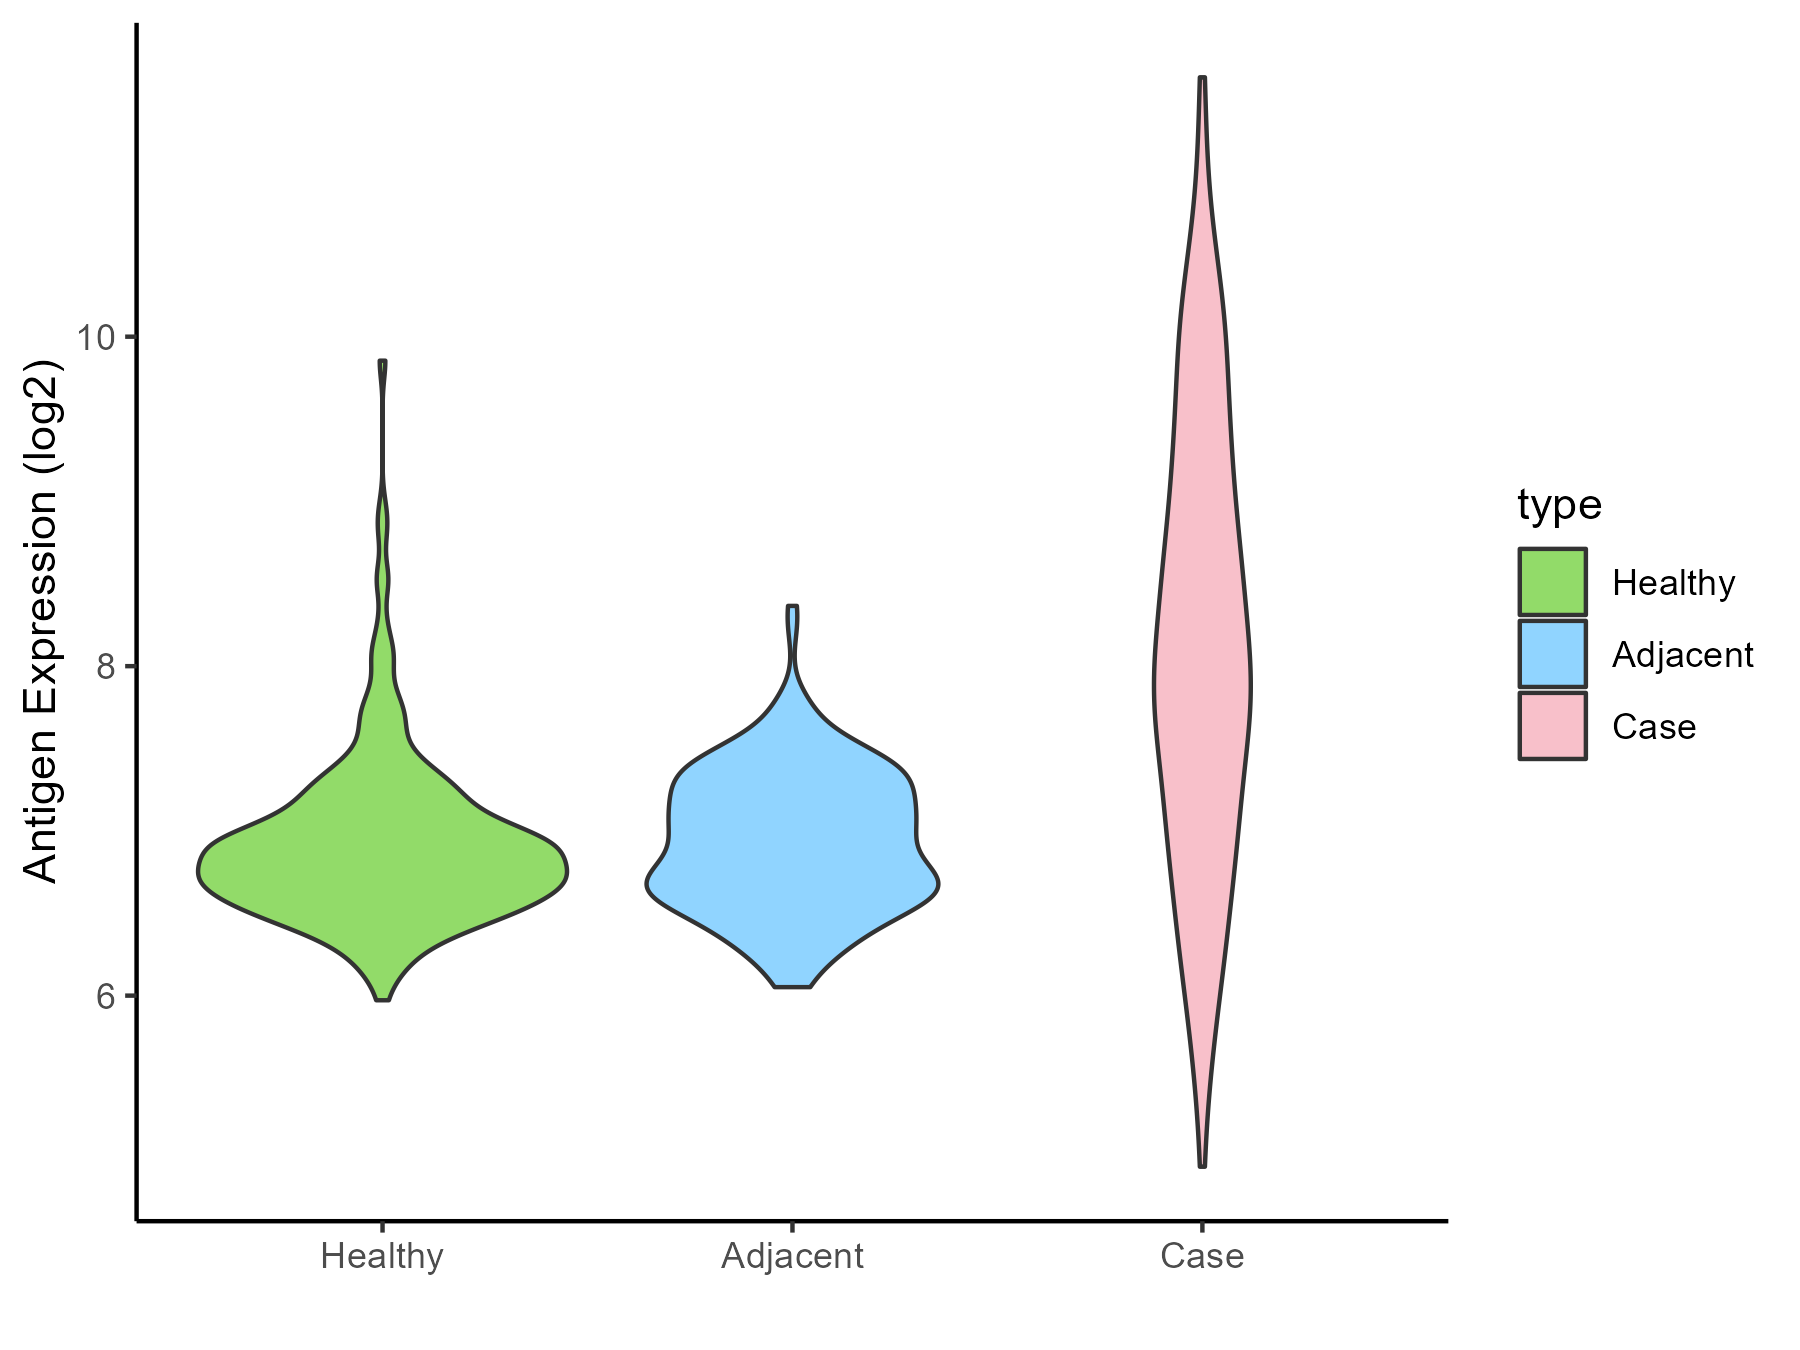
| The Studied Tissue | Skin | |
| The Specific Disease | Skin cancer | |
| The Expression Level of Disease Section Compare with the Healthy Individual Tissue | p-value: 7.13E-46; Fold-change: 1.203404159; Z-score: 2.387242303 | |
| The Expression Level of Disease Section Compare with the Adjacent Tissue | p-value: 5.46E-46; Fold-change: 1.121966348; Z-score: 2.675562126 | |
| Disease-specific Antigen Abundances |
|
Click to View the Clearer Original Diagram |
| Differential expression pattern of antigen in diseases | ||
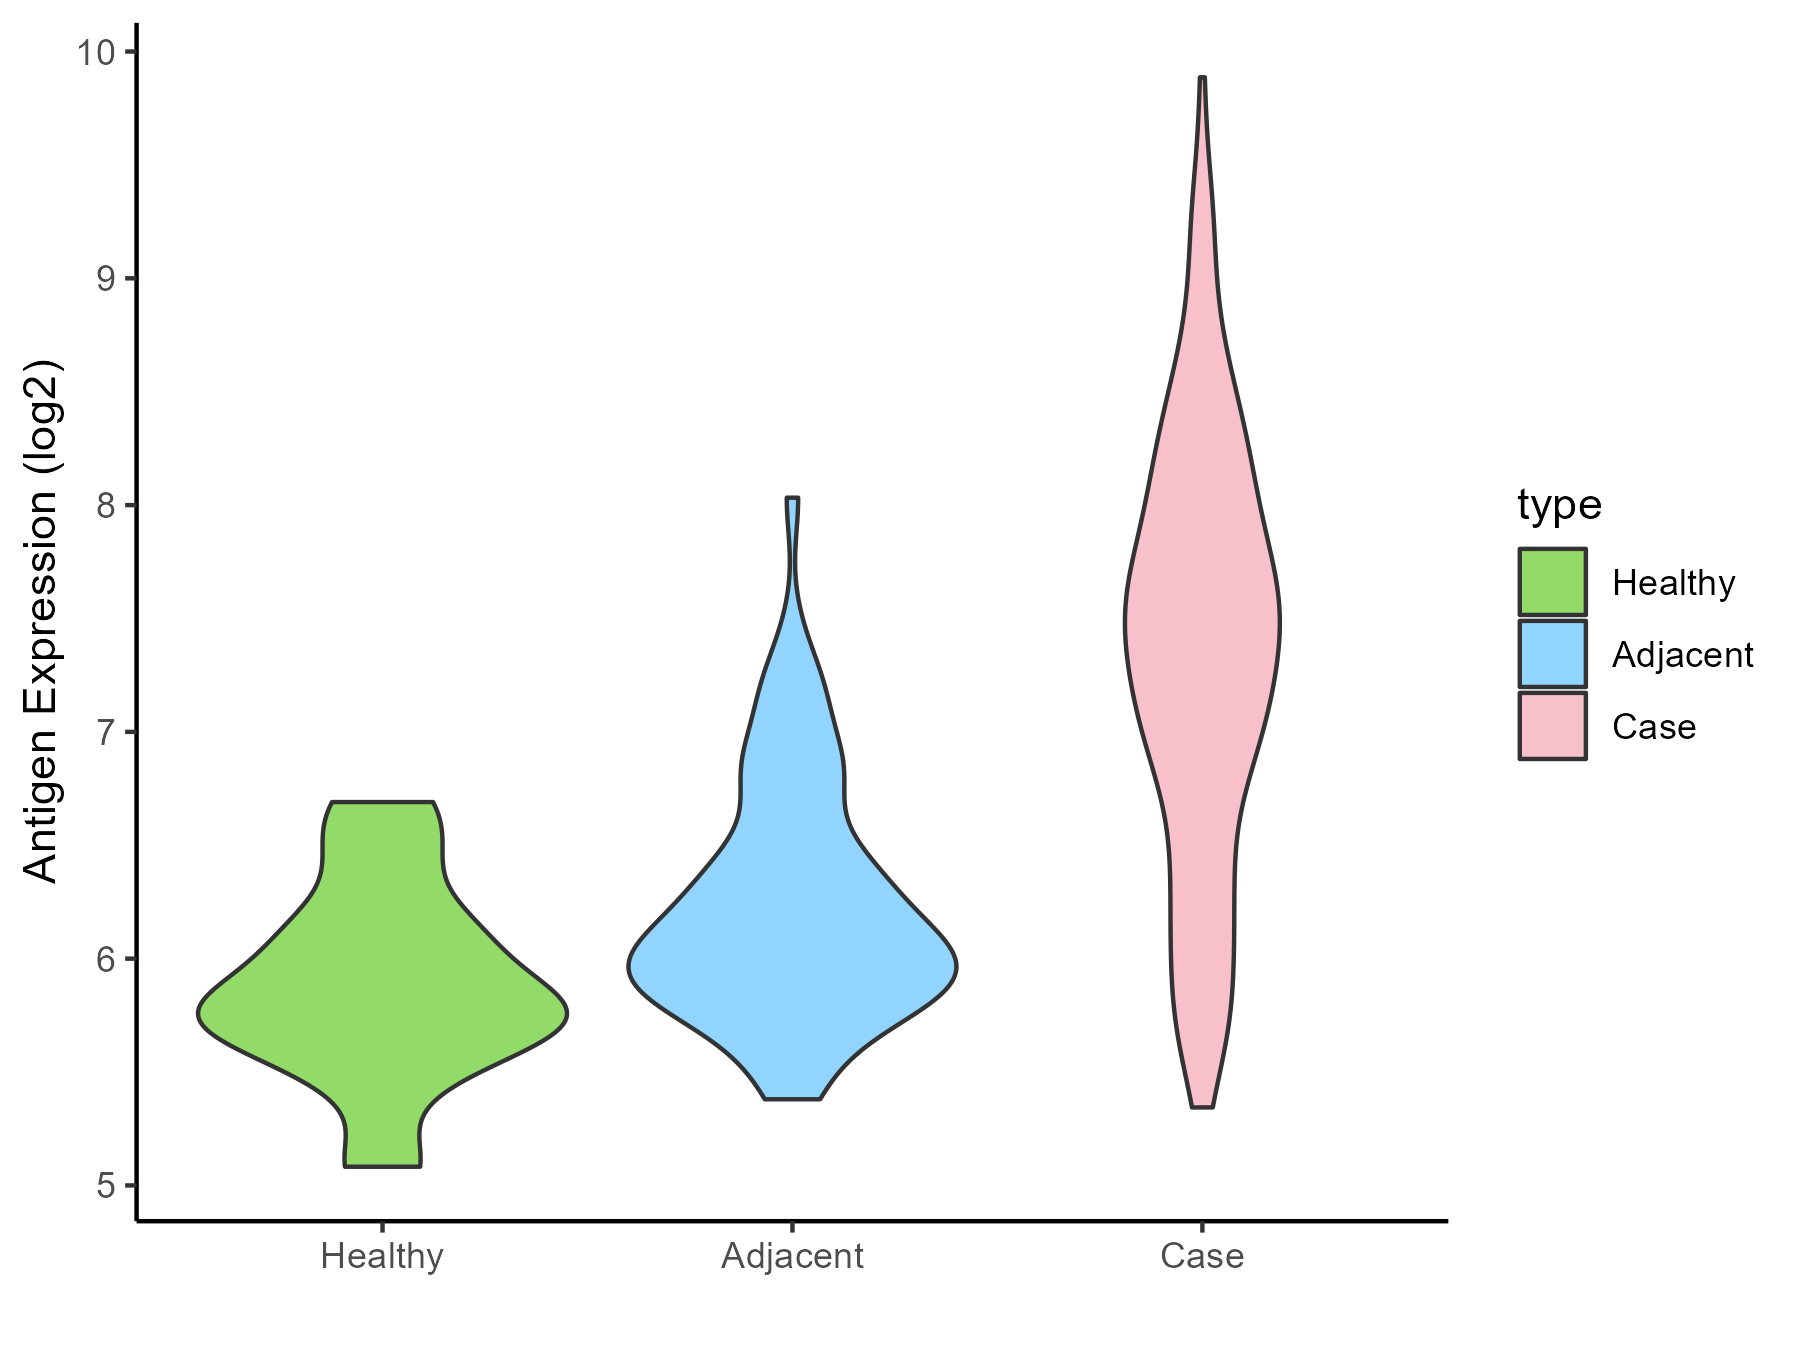
| The Studied Tissue | Kidney | |
| The Specific Disease | Renal cancer | |
| The Expression Level of Disease Section Compare with the Healthy Individual Tissue | p-value: 1.53E-07; Fold-change: 1.640424963; Z-score: 3.692218165 | |
| The Expression Level of Disease Section Compare with the Adjacent Tissue | p-value: 7.45E-31; Fold-change: 1.329051232; Z-score: 2.540847788 | |
| Disease-specific Antigen Abundances |
|
Click to View the Clearer Original Diagram |
| Differential expression pattern of antigen in diseases | ||
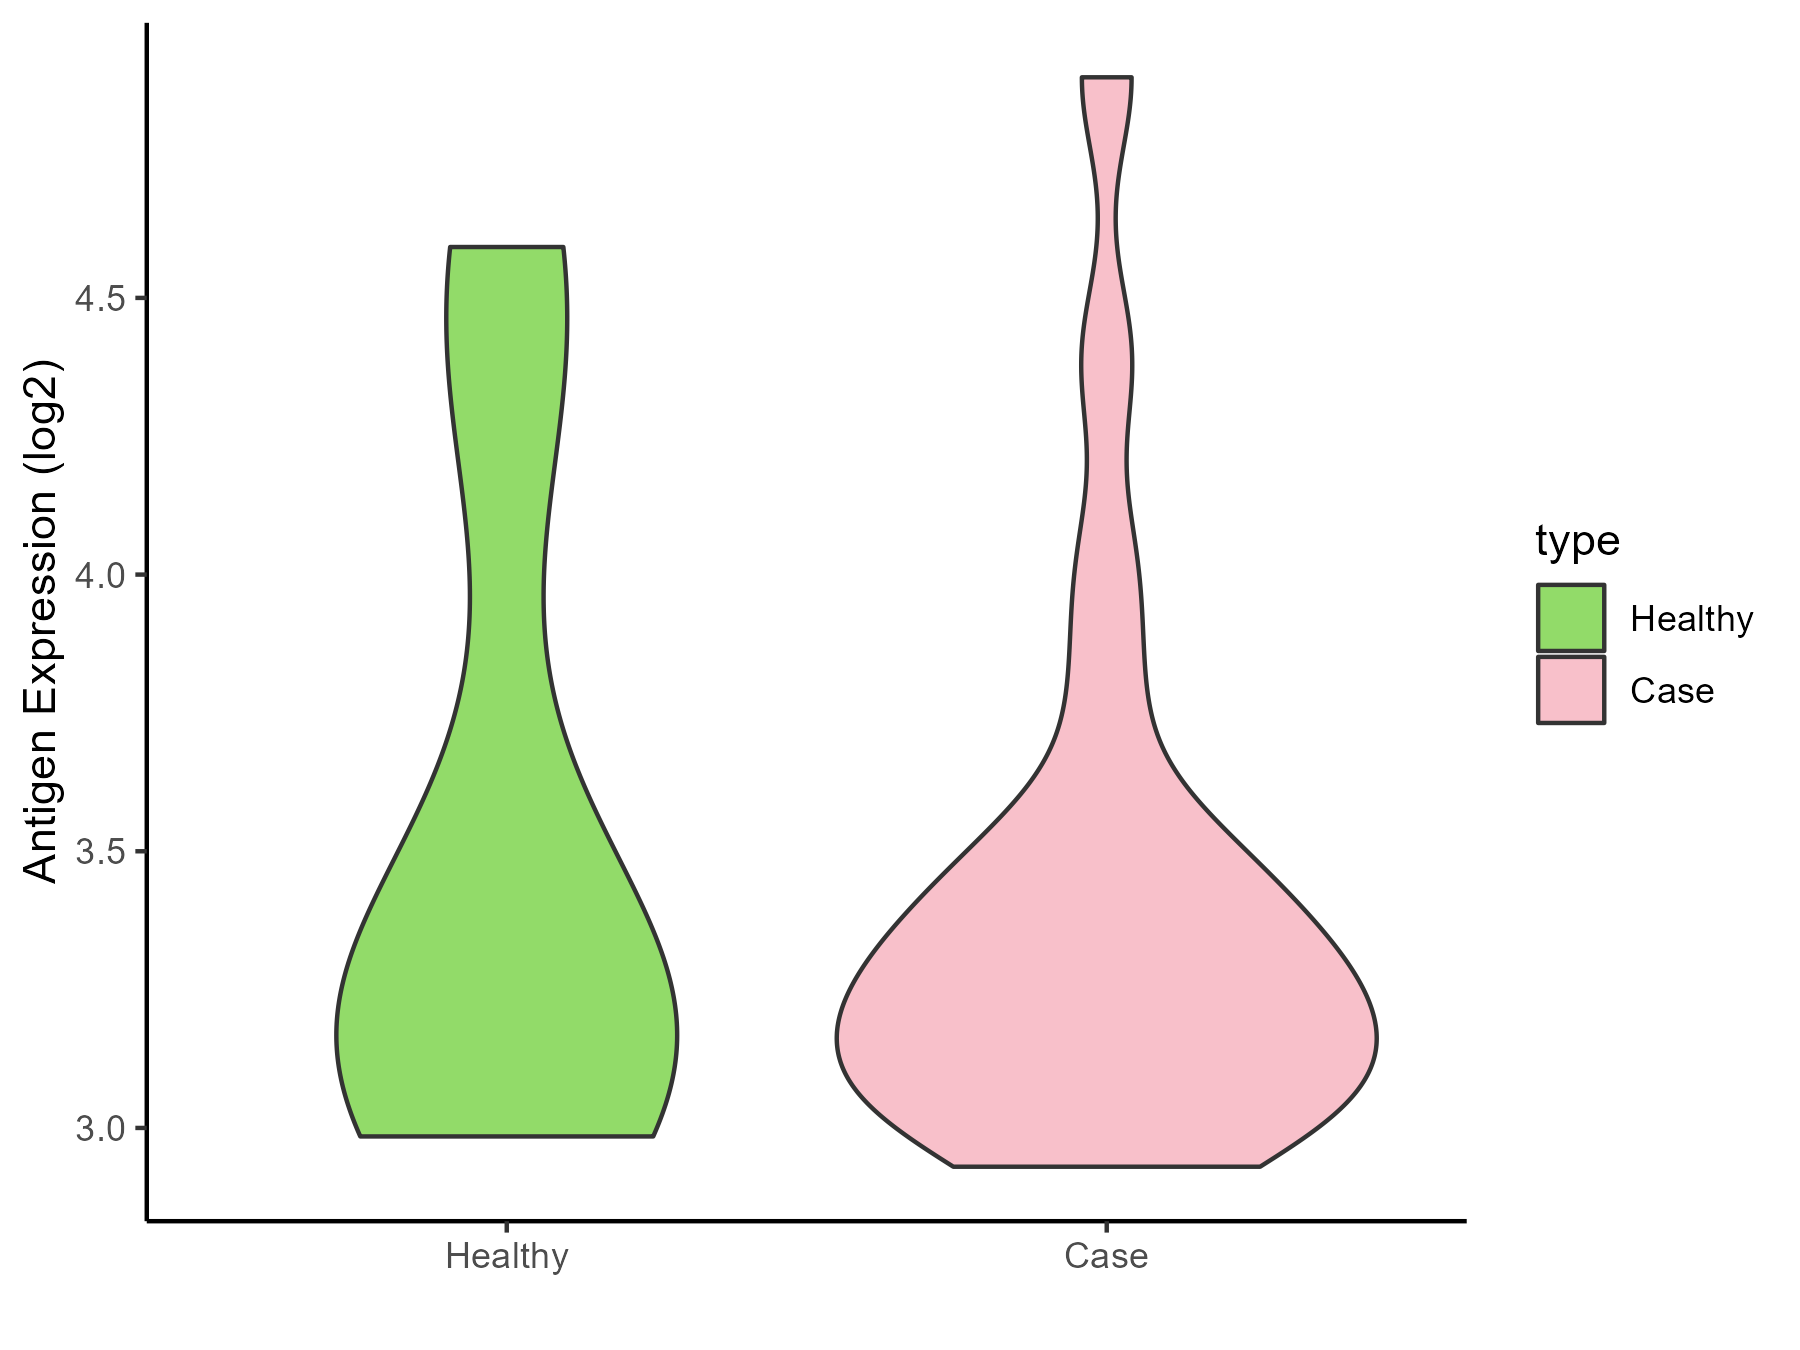
| The Studied Tissue | Urothelium | |
| The Specific Disease | Ureter cancer | |
| The Expression Level of Disease Section Compare with the Healthy Individual Tissue | p-value: 0.494667291; Fold-change: 0.048912494; Z-score: 0.081650979 | |
| Disease-specific Antigen Abundances |
|
Click to View the Clearer Original Diagram |
ICD Disease Classification 20
| Differential expression pattern of antigen in diseases | ||
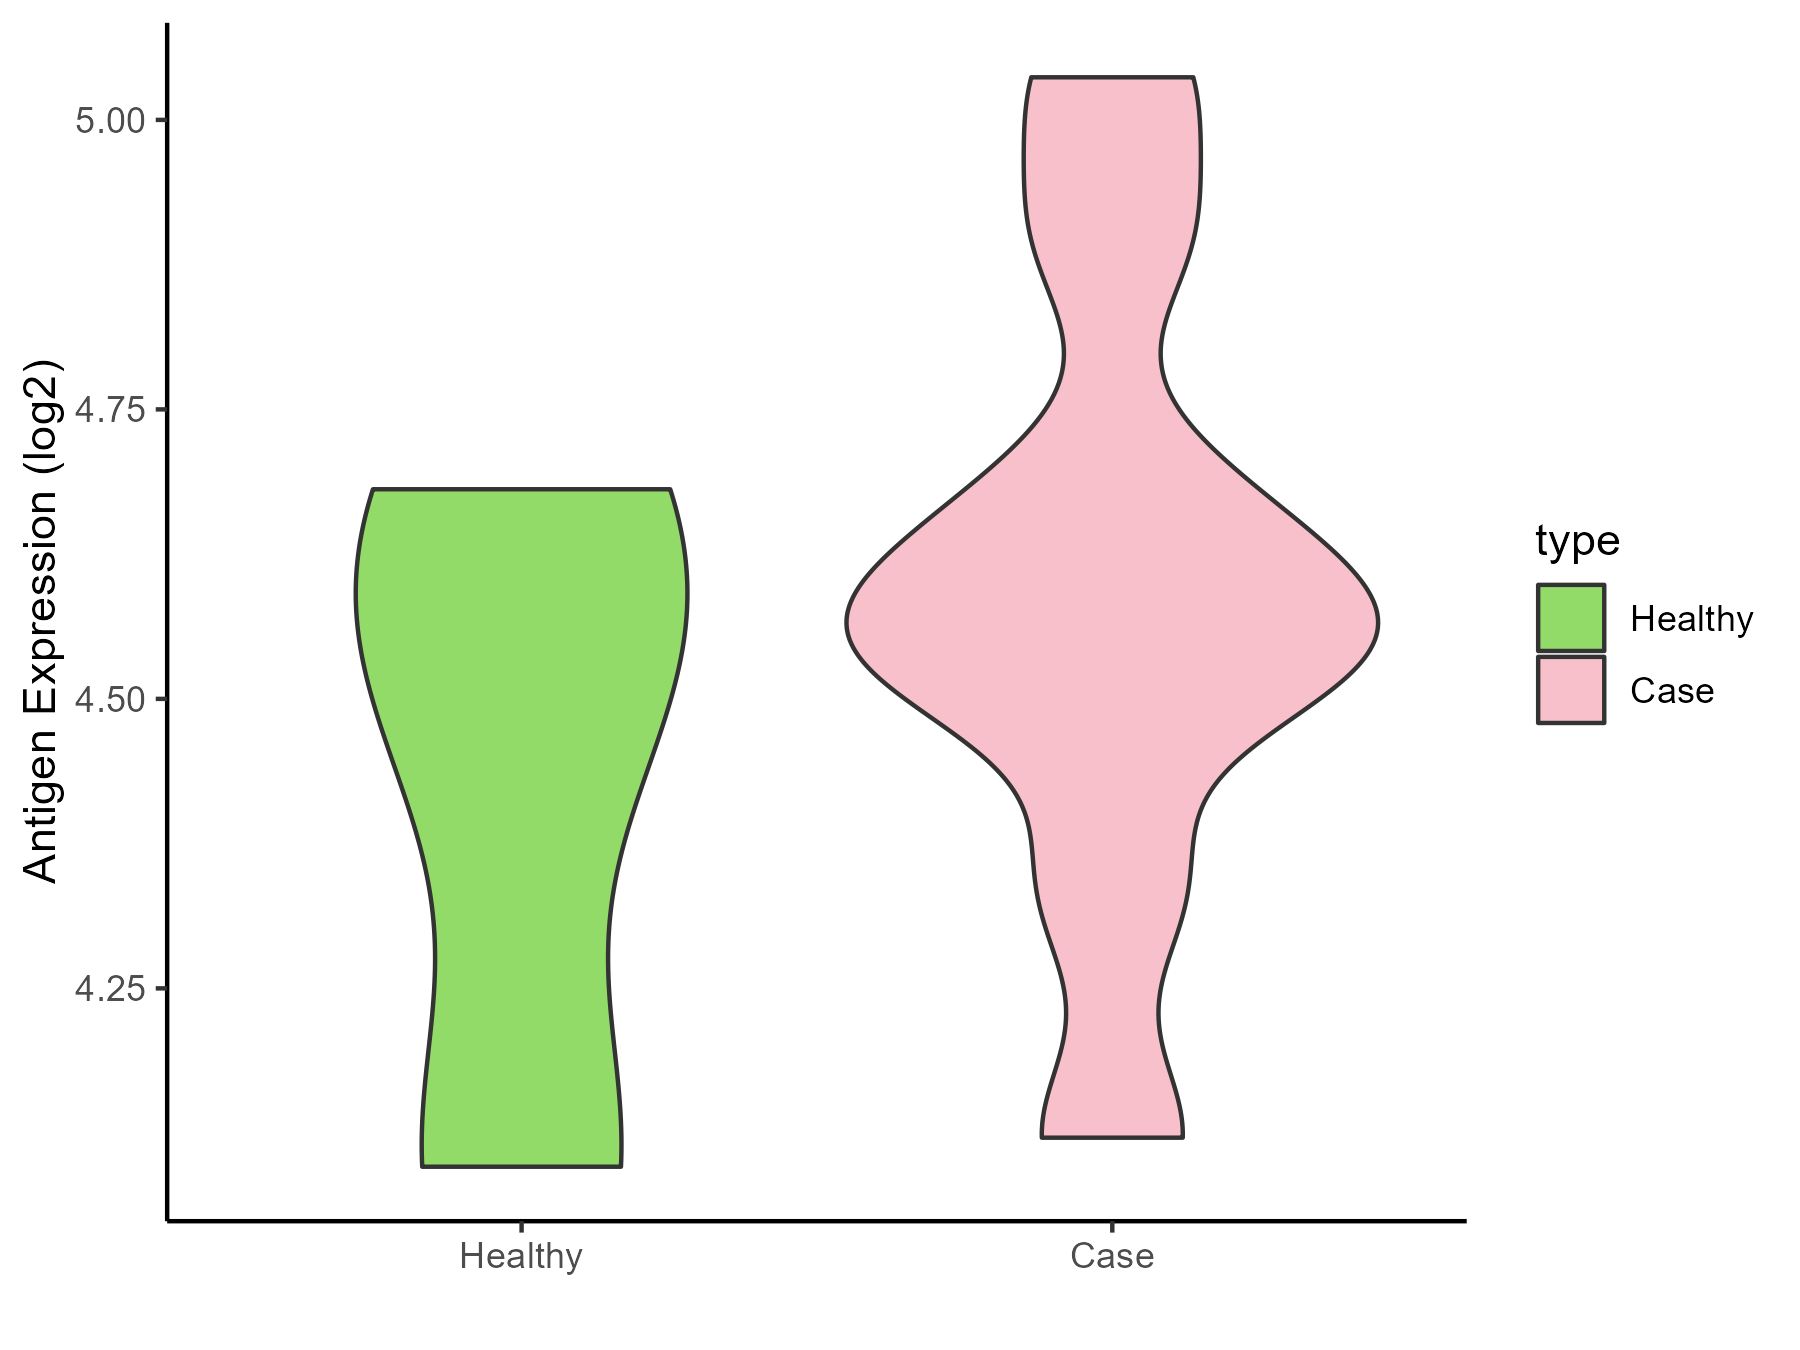
| The Studied Tissue | Adipose | |
| The Specific Disease | Simpson golabi behmel syndrome | |
| The Expression Level of Disease Section Compare with the Healthy Individual Tissue | p-value: 0.469580102; Fold-change: 0.057117293; Z-score: 0.190085851 | |
| Disease-specific Antigen Abundances |
|
Click to View the Clearer Original Diagram |
| Differential expression pattern of antigen in diseases | ||
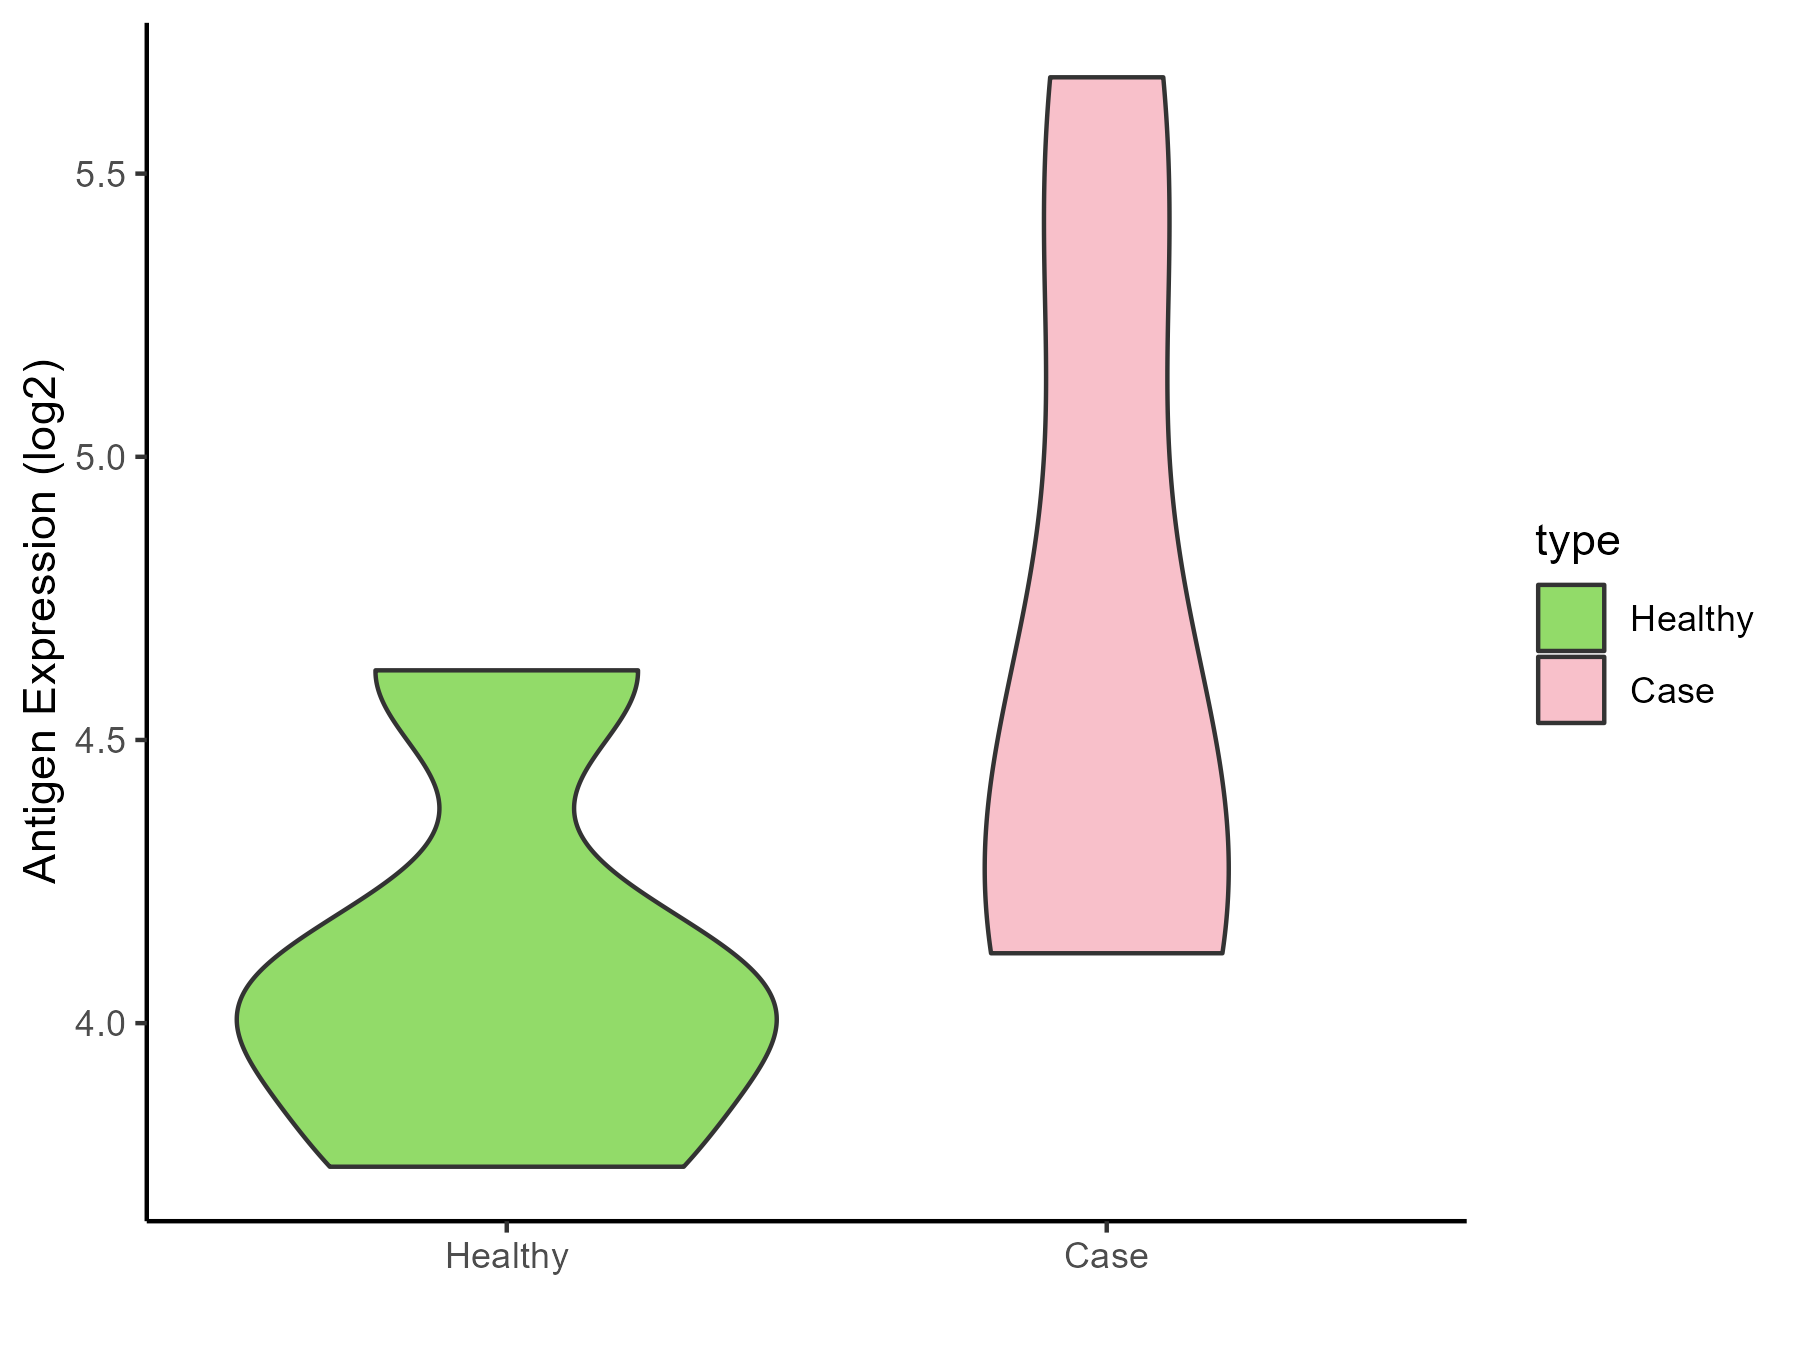
| The Studied Tissue | Perituberal | |
| The Specific Disease | Tuberous sclerosis complex | |
| The Expression Level of Disease Section Compare with the Healthy Individual Tissue | p-value: 0.122328101; Fold-change: 0.338313077; Z-score: 0.915669883 | |
| Disease-specific Antigen Abundances |
|
Click to View the Clearer Original Diagram |
ICD Disease Classification 3
| Differential expression pattern of antigen in diseases | ||
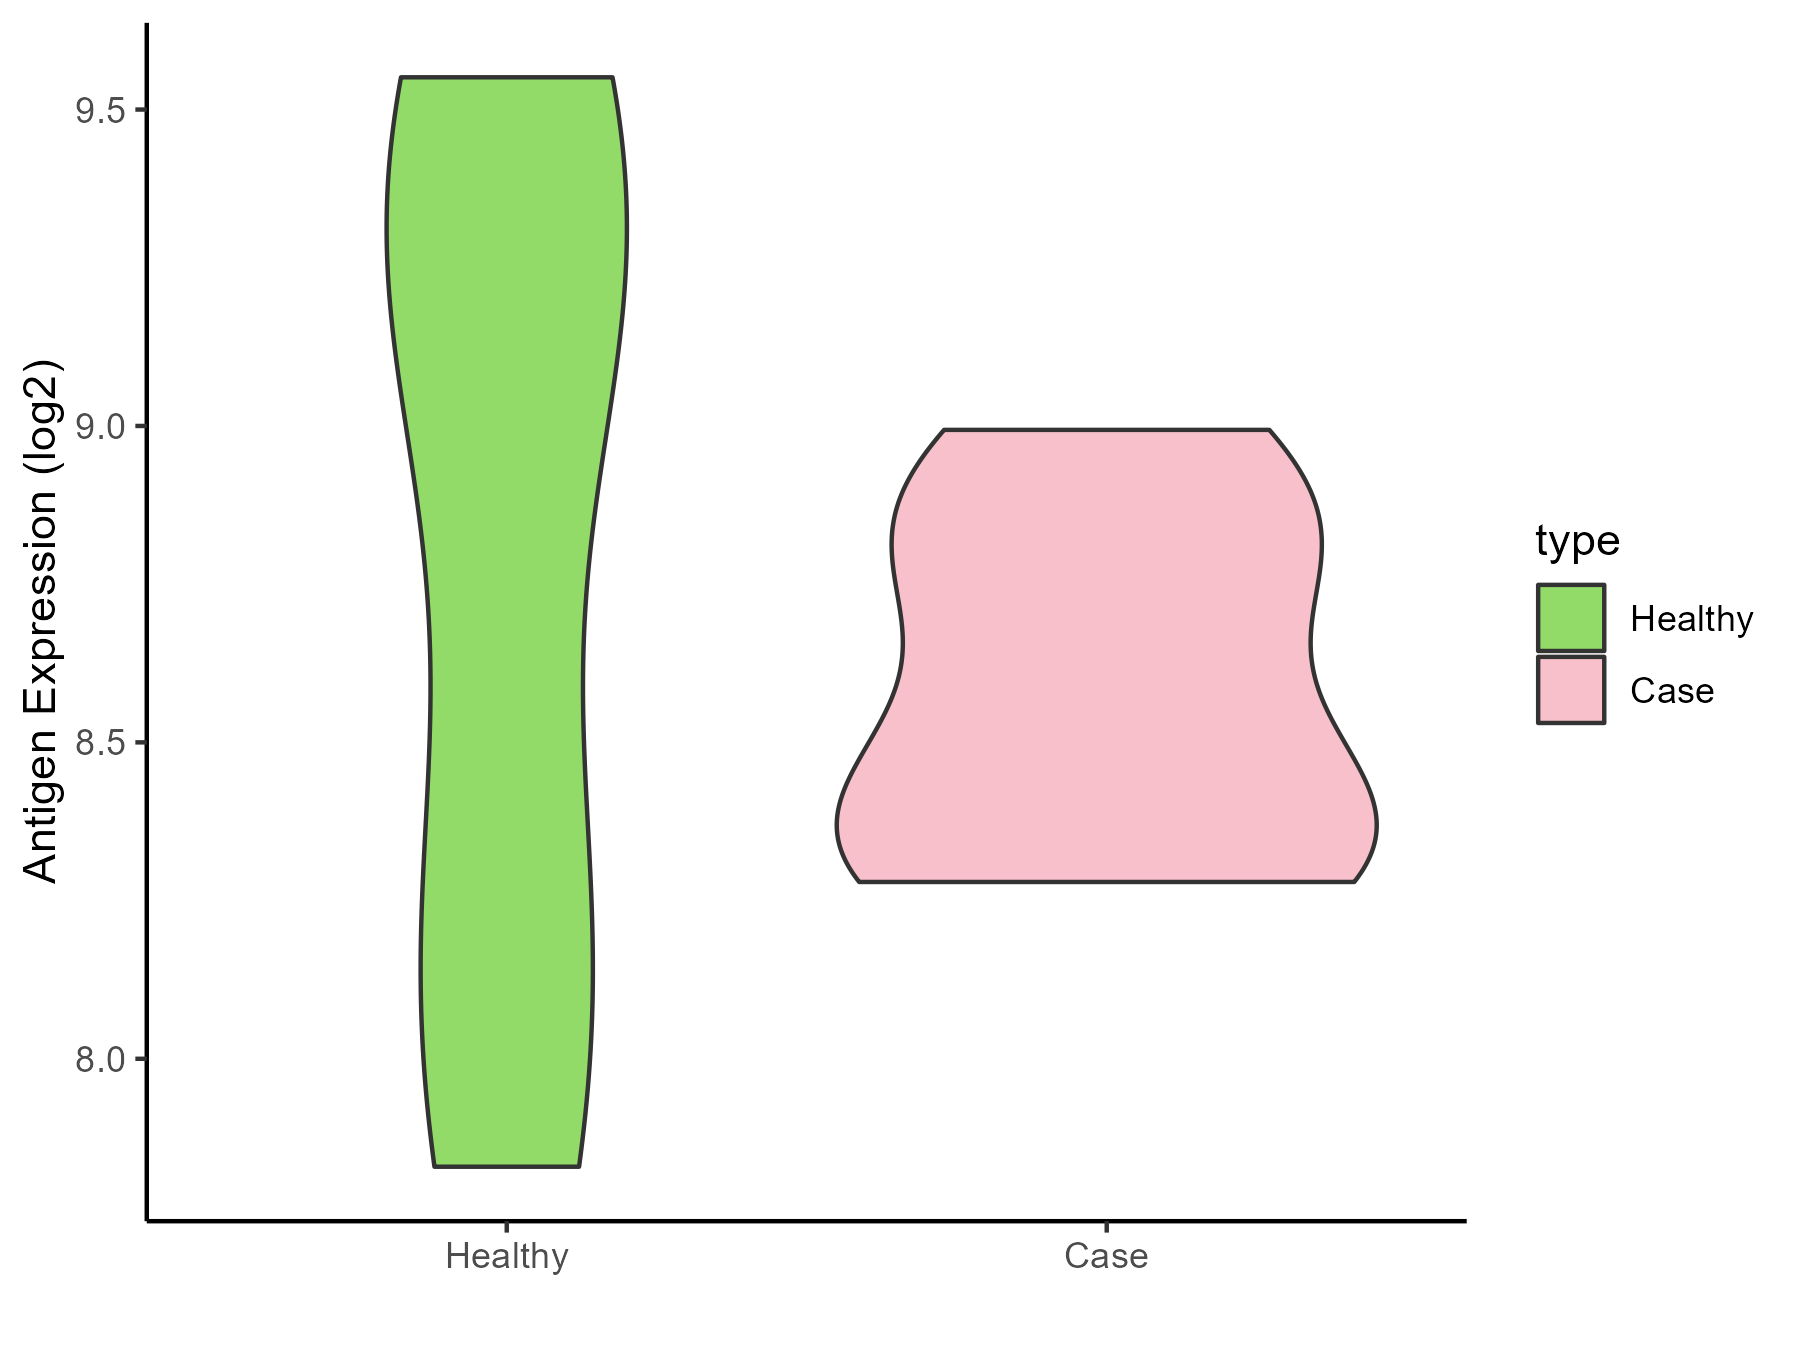
| The Studied Tissue | Bone marrow | |
| The Specific Disease | Anemia | |
| The Expression Level of Disease Section Compare with the Healthy Individual Tissue | p-value: 0.456446426; Fold-change: -0.690106696; Z-score: -0.992310828 | |
| Disease-specific Antigen Abundances |
|
Click to View the Clearer Original Diagram |
| Differential expression pattern of antigen in diseases | ||
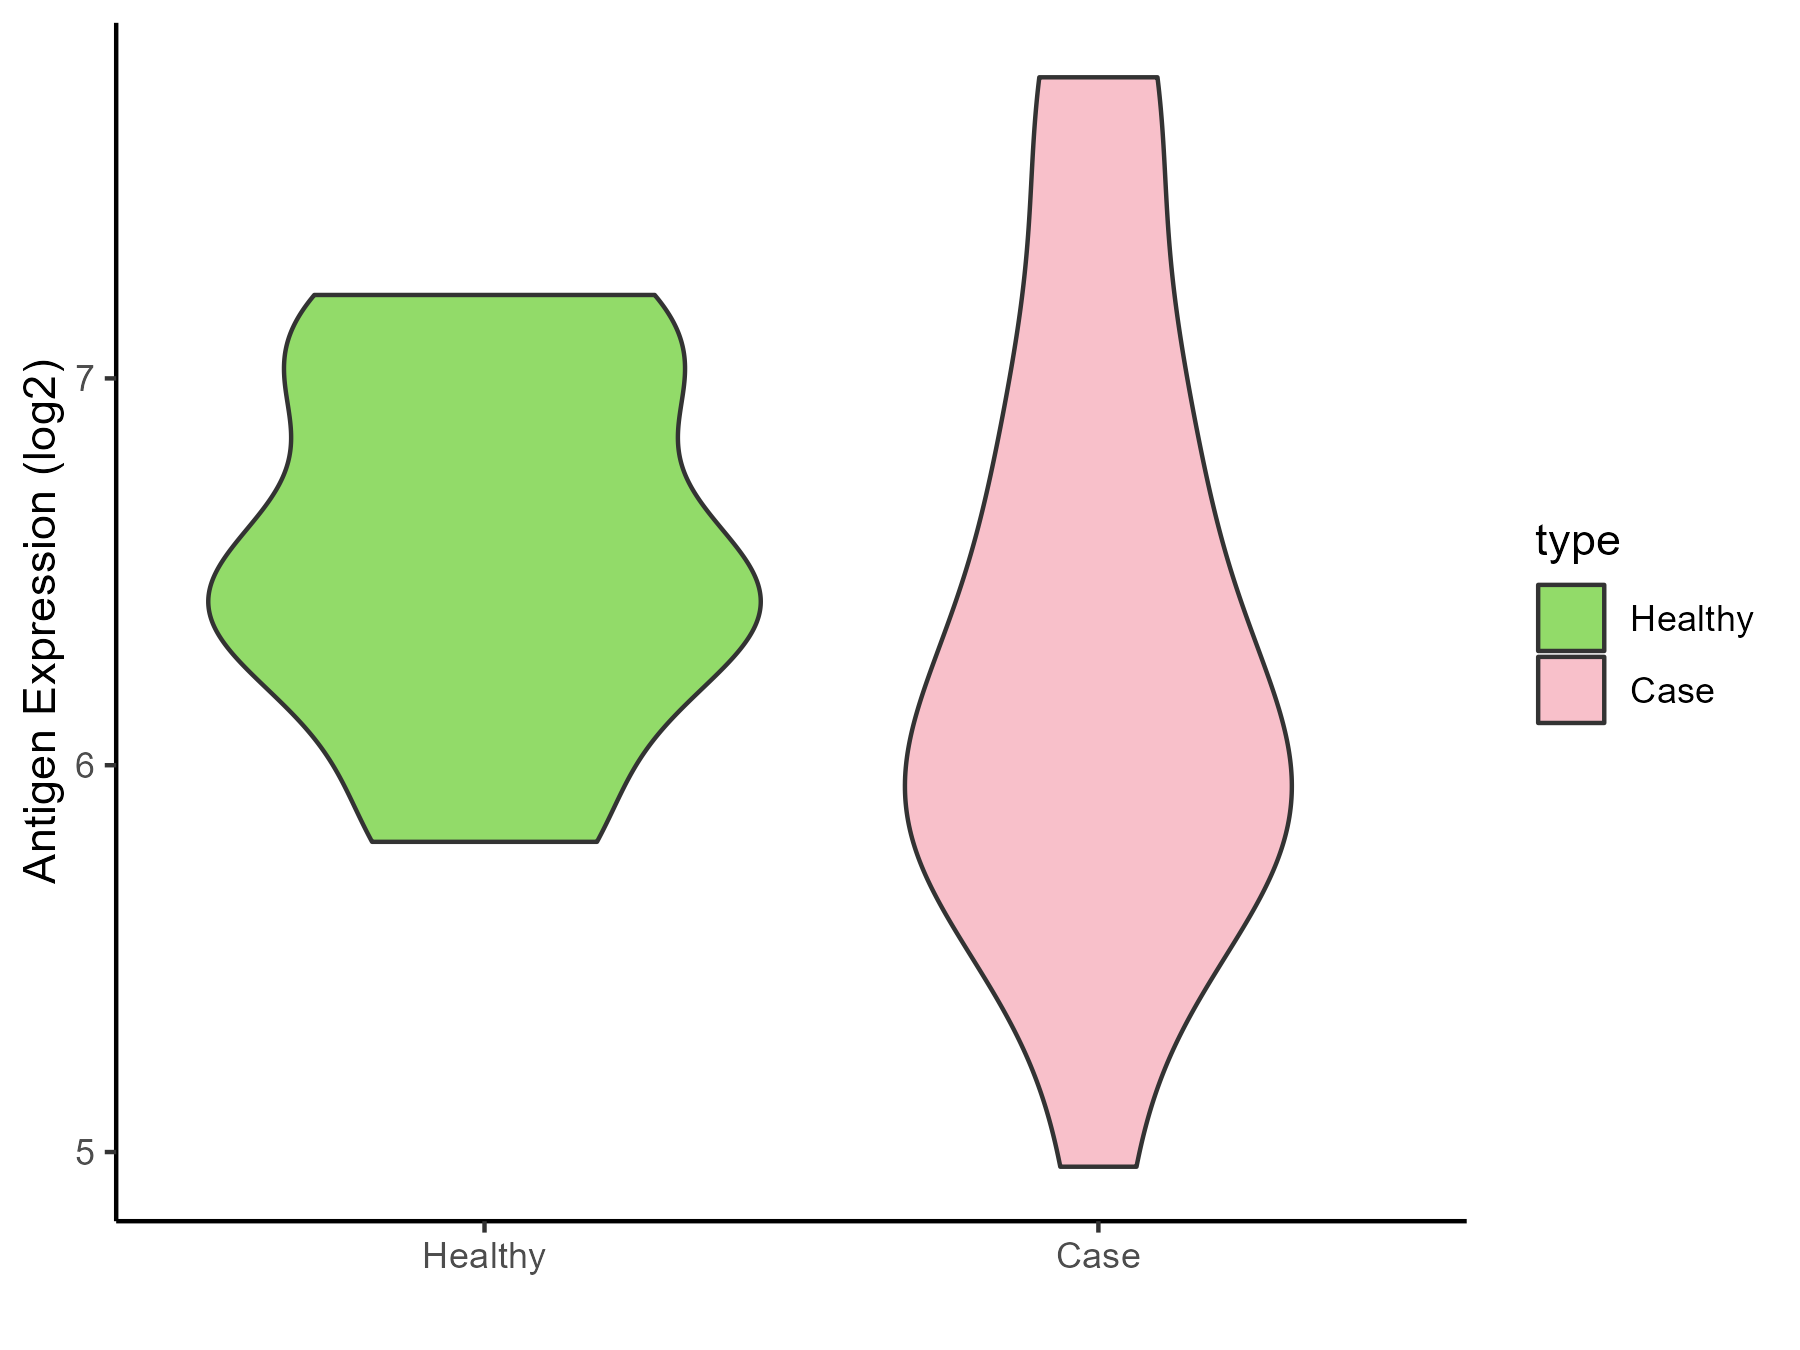
| The Studied Tissue | Peripheral blood | |
| The Specific Disease | Sickle cell disease | |
| The Expression Level of Disease Section Compare with the Healthy Individual Tissue | p-value: 0.390889782; Fold-change: -0.313083227; Z-score: -0.662841078 | |
| Disease-specific Antigen Abundances |
|
Click to View the Clearer Original Diagram |
| Differential expression pattern of antigen in diseases | ||
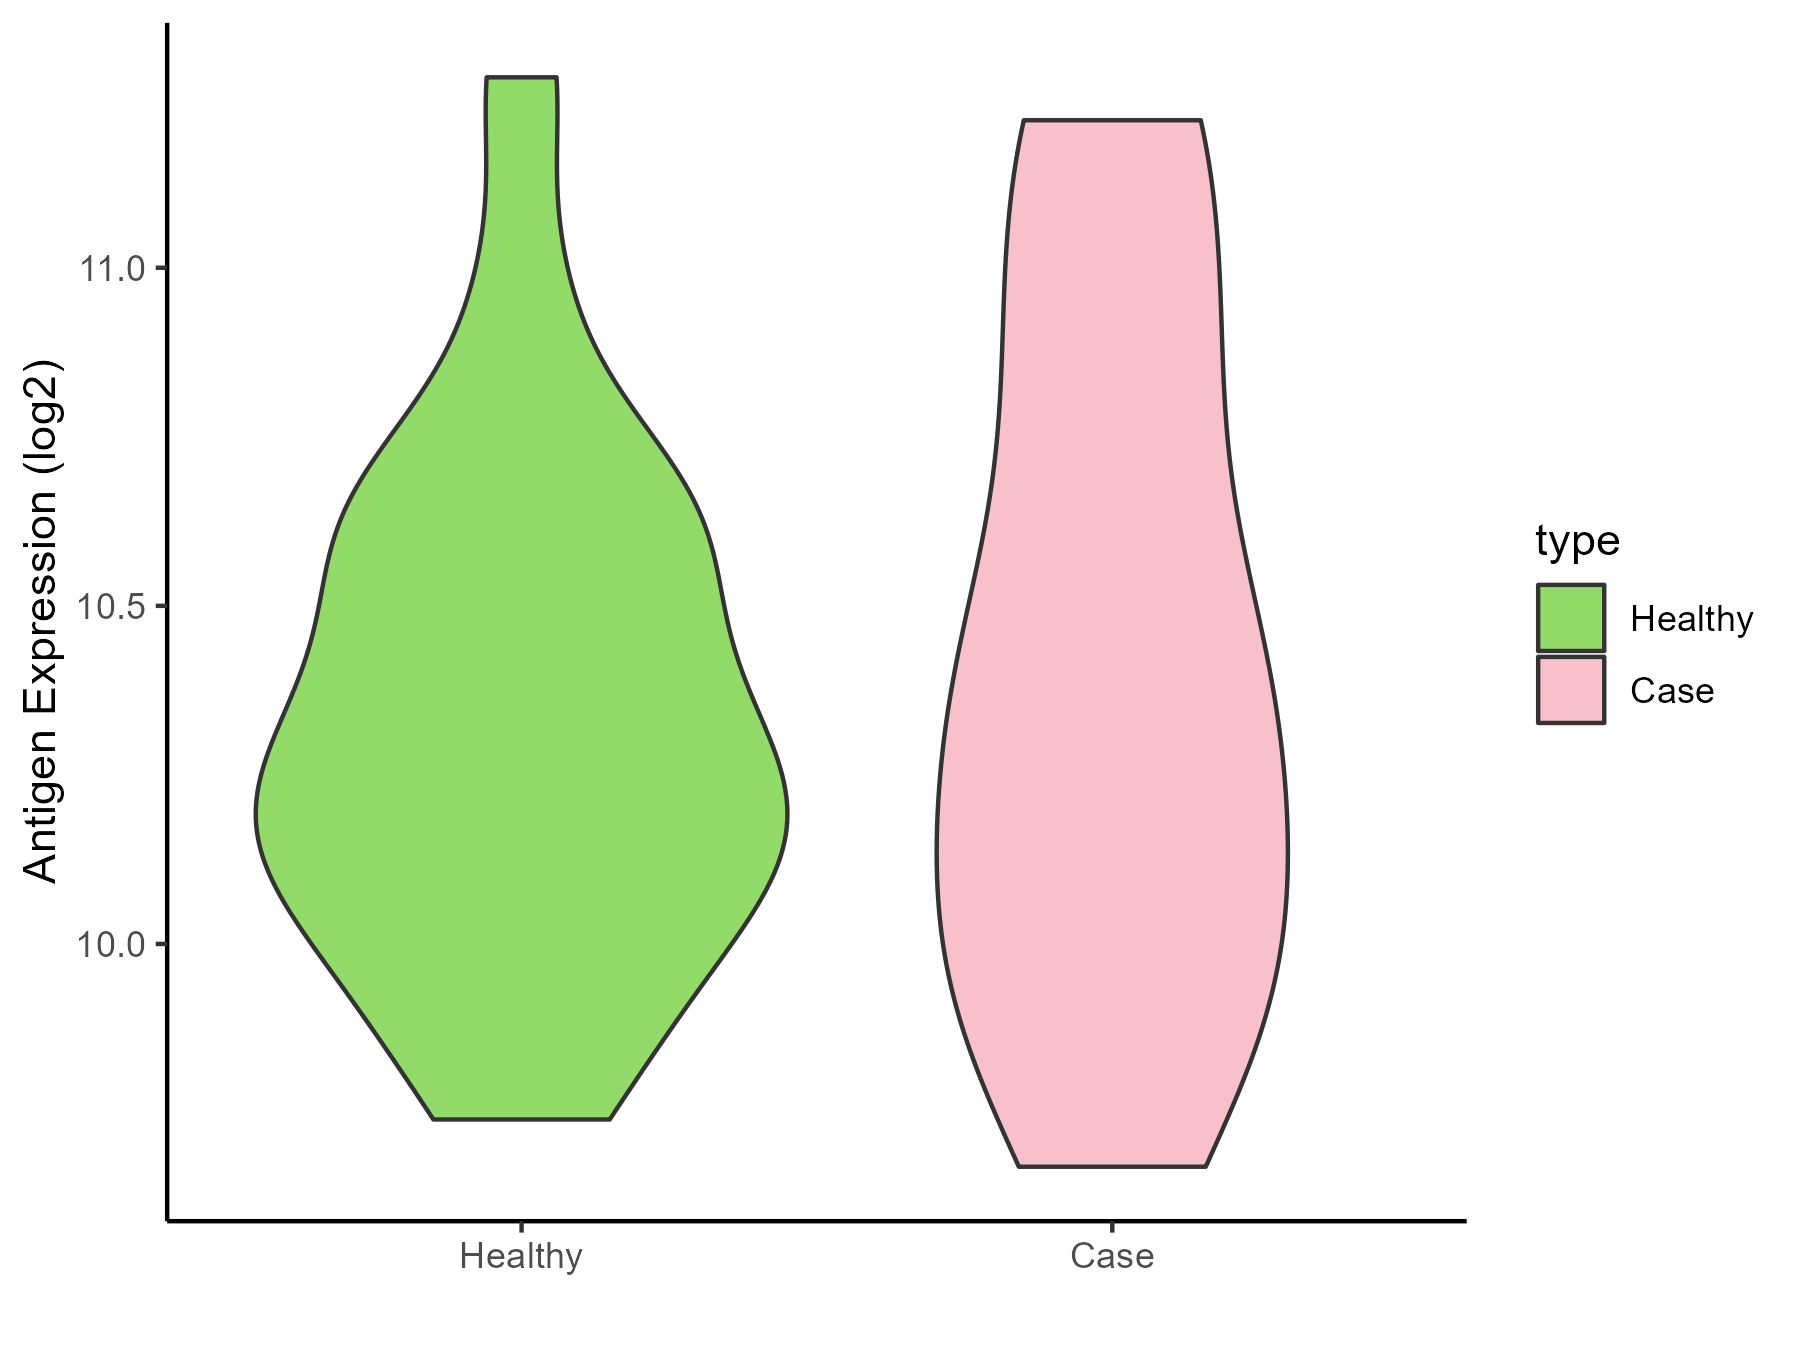
| The Studied Tissue | Whole blood | |
| The Specific Disease | Thrombocythemia | |
| The Expression Level of Disease Section Compare with the Healthy Individual Tissue | p-value: 0.544979546; Fold-change: 0.079558355; Z-score: 0.212548078 | |
| Disease-specific Antigen Abundances |
|
Click to View the Clearer Original Diagram |
ICD Disease Classification 4
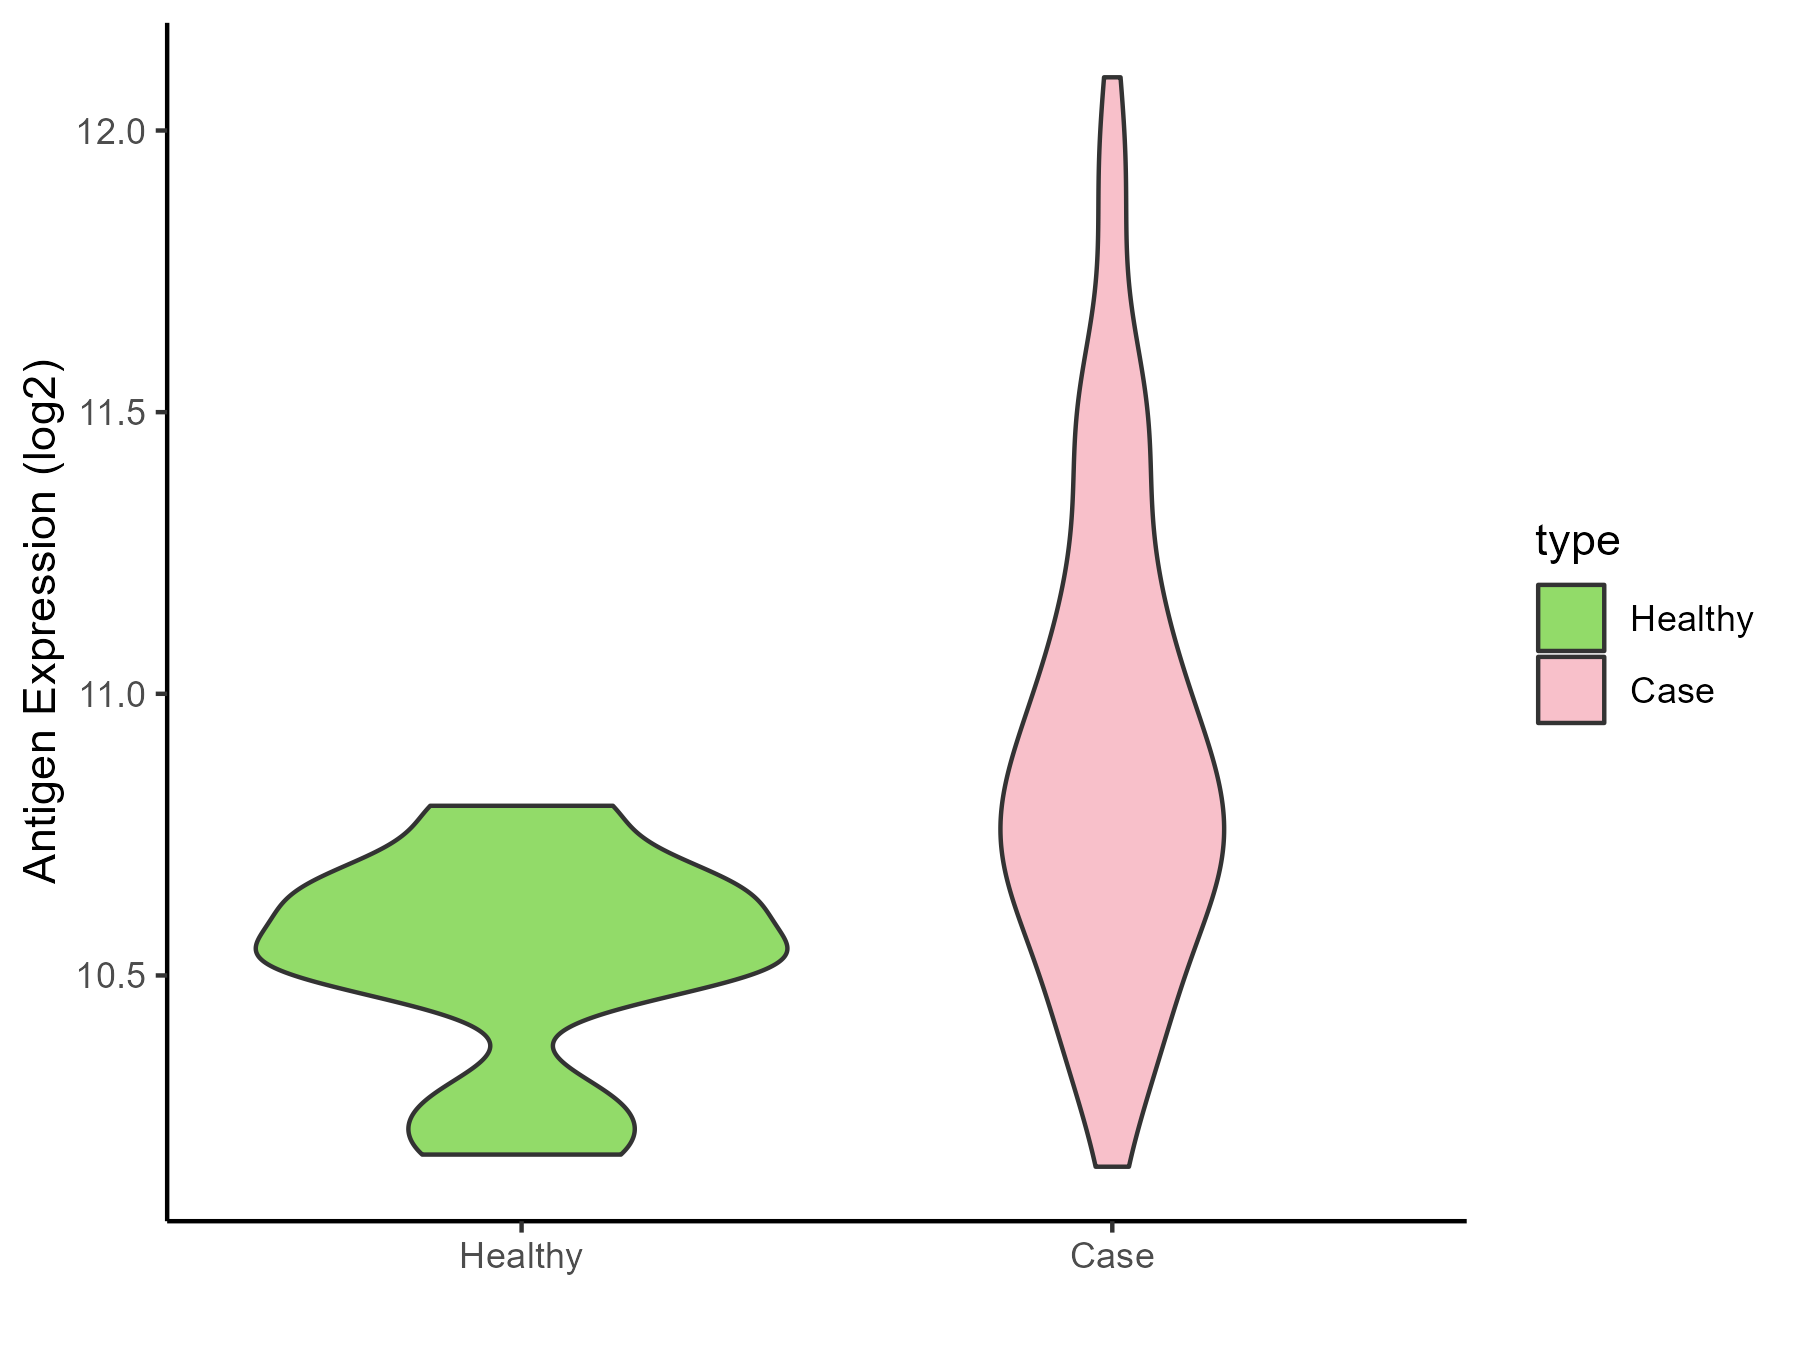
| Differential expression pattern of antigen in diseases | ||
| The Studied Tissue | Whole blood | |
| The Specific Disease | Scleroderma | |
| The Expression Level of Disease Section Compare with the Healthy Individual Tissue | p-value: 0.000144127; Fold-change: 0.282418613; Z-score: 1.442555337 | |
| Disease-specific Antigen Abundances |
|
Click to View the Clearer Original Diagram |
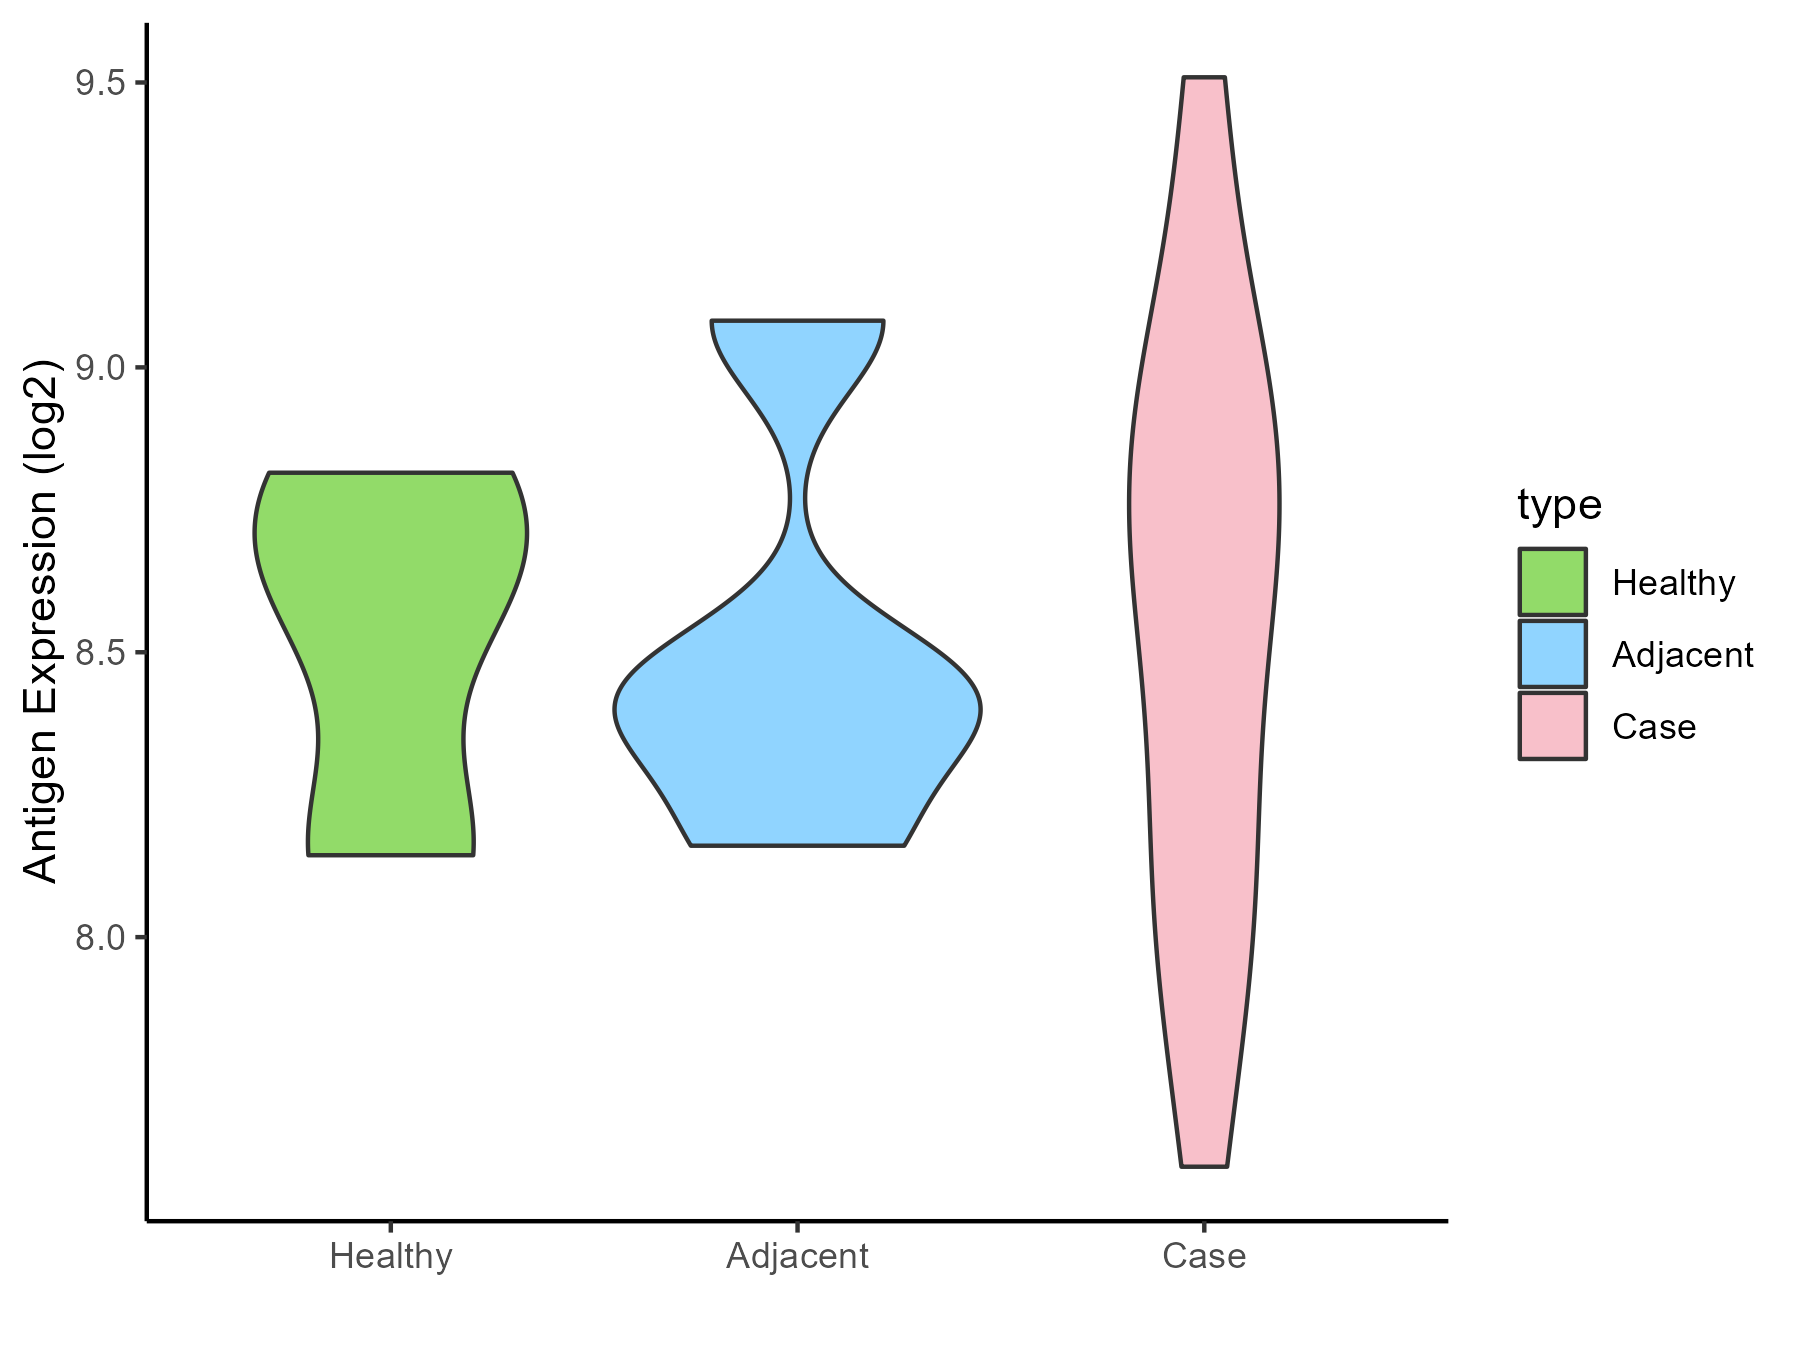
| Differential expression pattern of antigen in diseases | ||
| The Studied Tissue | Salivary gland | |
| The Specific Disease | Sjogren syndrome | |
| The Expression Level of Disease Section Compare with the Healthy Individual Tissue | p-value: 0.877338344; Fold-change: -0.018077176; Z-score: -0.052521383 | |
| The Expression Level of Disease Section Compare with the Adjacent Tissue | p-value: 0.863979615; Fold-change: 0.173565418; Z-score: 0.440616225 | |
| Disease-specific Antigen Abundances |
|
Click to View the Clearer Original Diagram |
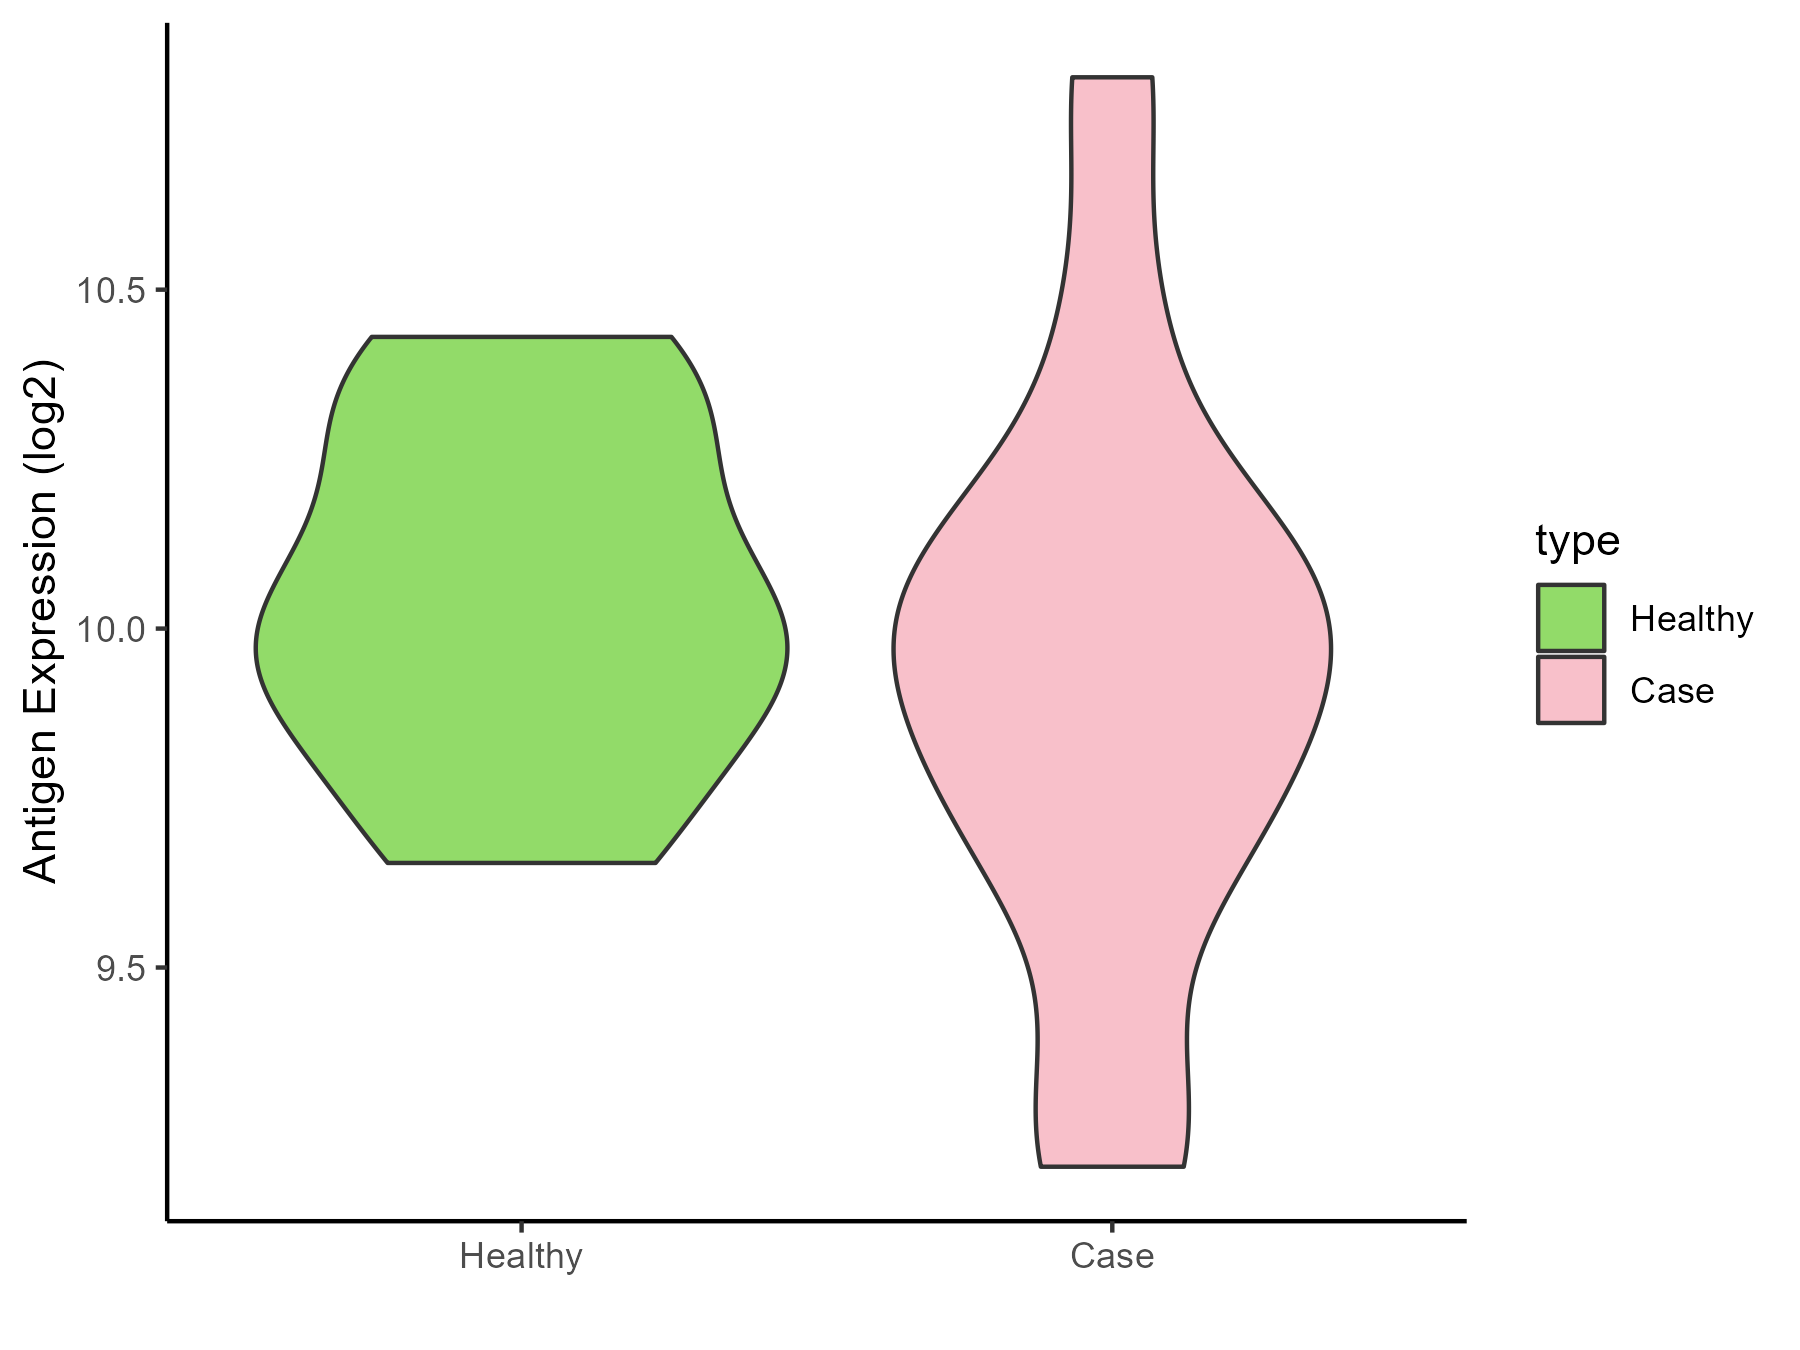
| Differential expression pattern of antigen in diseases | ||
| The Studied Tissue | Peripheral blood | |
| The Specific Disease | Behcet disease | |
| The Expression Level of Disease Section Compare with the Healthy Individual Tissue | p-value: 0.410600765; Fold-change: -0.054591346; Z-score: -0.211108188 | |
| Disease-specific Antigen Abundances |
|
Click to View the Clearer Original Diagram |
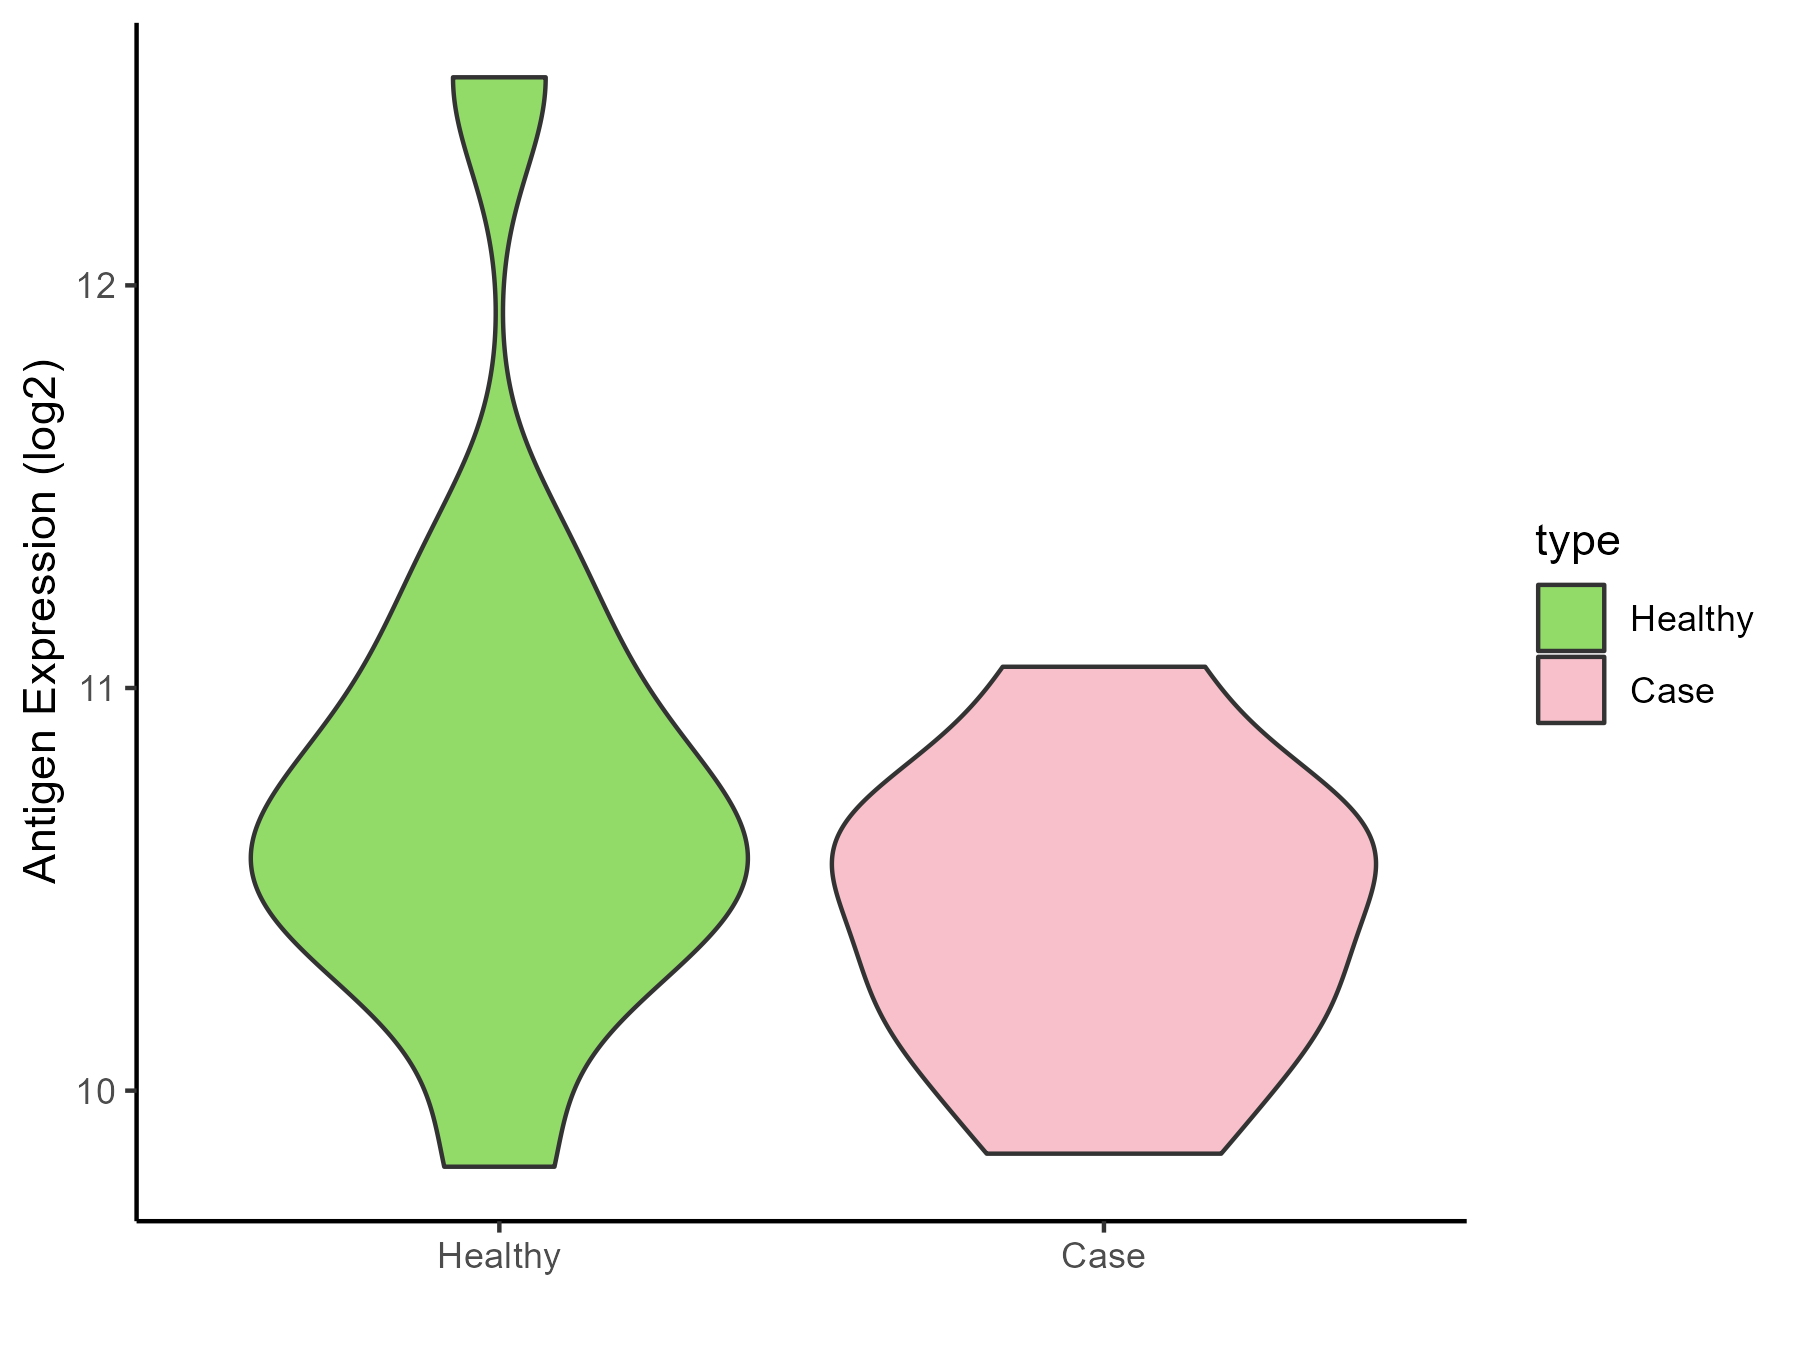
| Differential expression pattern of antigen in diseases | ||
| The Studied Tissue | Whole blood | |
| The Specific Disease | Autosomal dominant monocytopenia | |
| The Expression Level of Disease Section Compare with the Healthy Individual Tissue | p-value: 0.179935603; Fold-change: -0.13828854; Z-score: -0.197012132 | |
| Disease-specific Antigen Abundances |
|
Click to View the Clearer Original Diagram |
ICD Disease Classification 5
| Differential expression pattern of antigen in diseases | ||
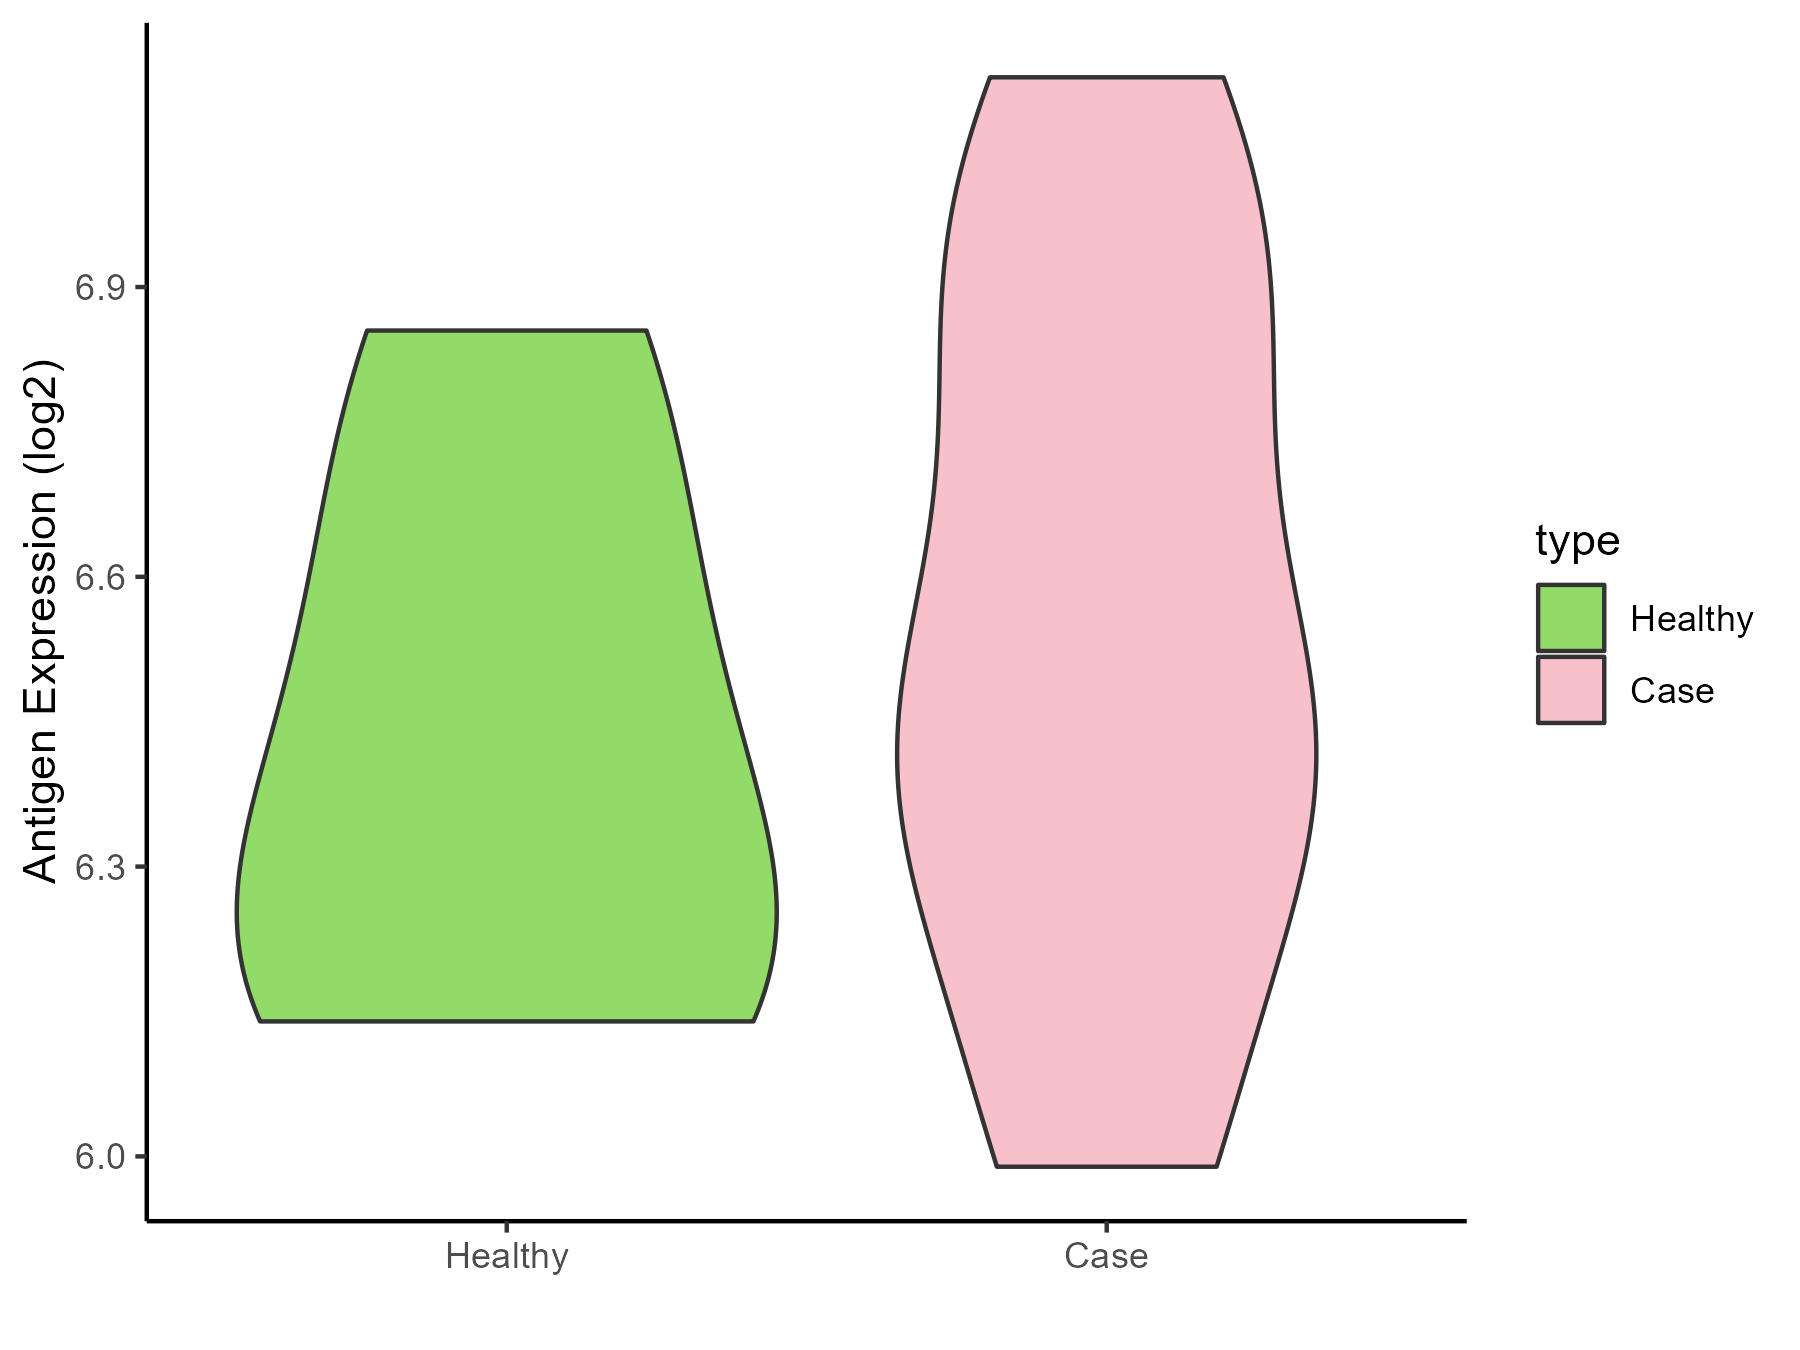
| The Studied Tissue | Liver | |
| The Specific Disease | Type 2 diabetes | |
| The Expression Level of Disease Section Compare with the Healthy Individual Tissue | p-value: 0.507536963; Fold-change: 0.076778482; Z-score: 0.253168575 | |
| Disease-specific Antigen Abundances |
|
Click to View the Clearer Original Diagram |
| Differential expression pattern of antigen in diseases | ||
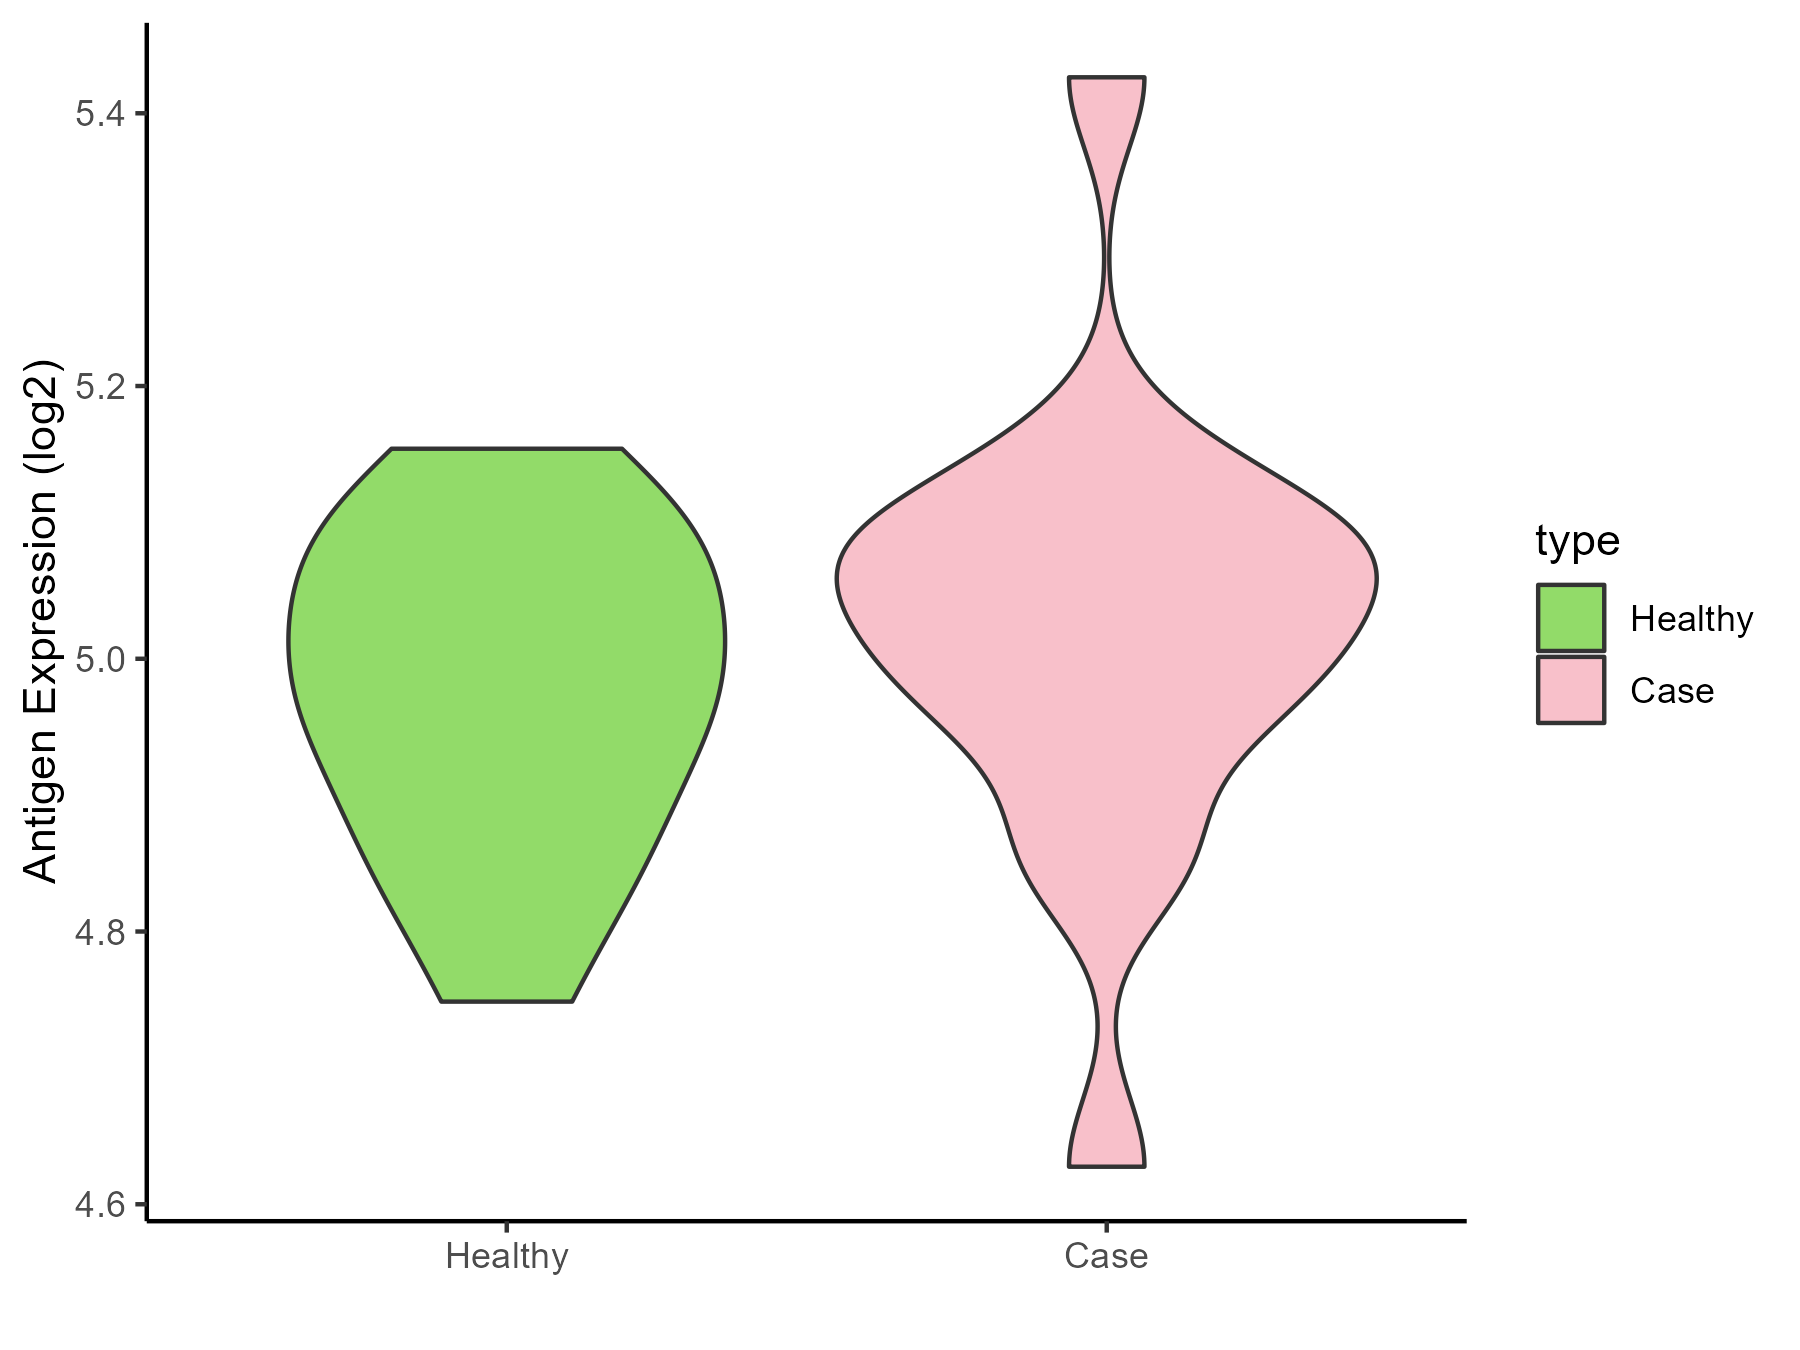
| The Studied Tissue | Vastus lateralis muscle | |
| The Specific Disease | Polycystic ovary syndrome | |
| The Expression Level of Disease Section Compare with the Healthy Individual Tissue | p-value: 0.414867423; Fold-change: 0.038495554; Z-score: 0.32330724 | |
| Disease-specific Antigen Abundances |
|
Click to View the Clearer Original Diagram |
| Differential expression pattern of antigen in diseases | ||
| The Studied Tissue | Subcutaneous Adipose | |
| The Specific Disease | Obesity | |
| The Expression Level of Disease Section Compare with the Healthy Individual Tissue | p-value: 0.58054815; Fold-change: -0.041962799; Z-score: -0.129028316 | |
| Disease-specific Antigen Abundances |

|
Click to View the Clearer Original Diagram |
| Differential expression pattern of antigen in diseases | ||
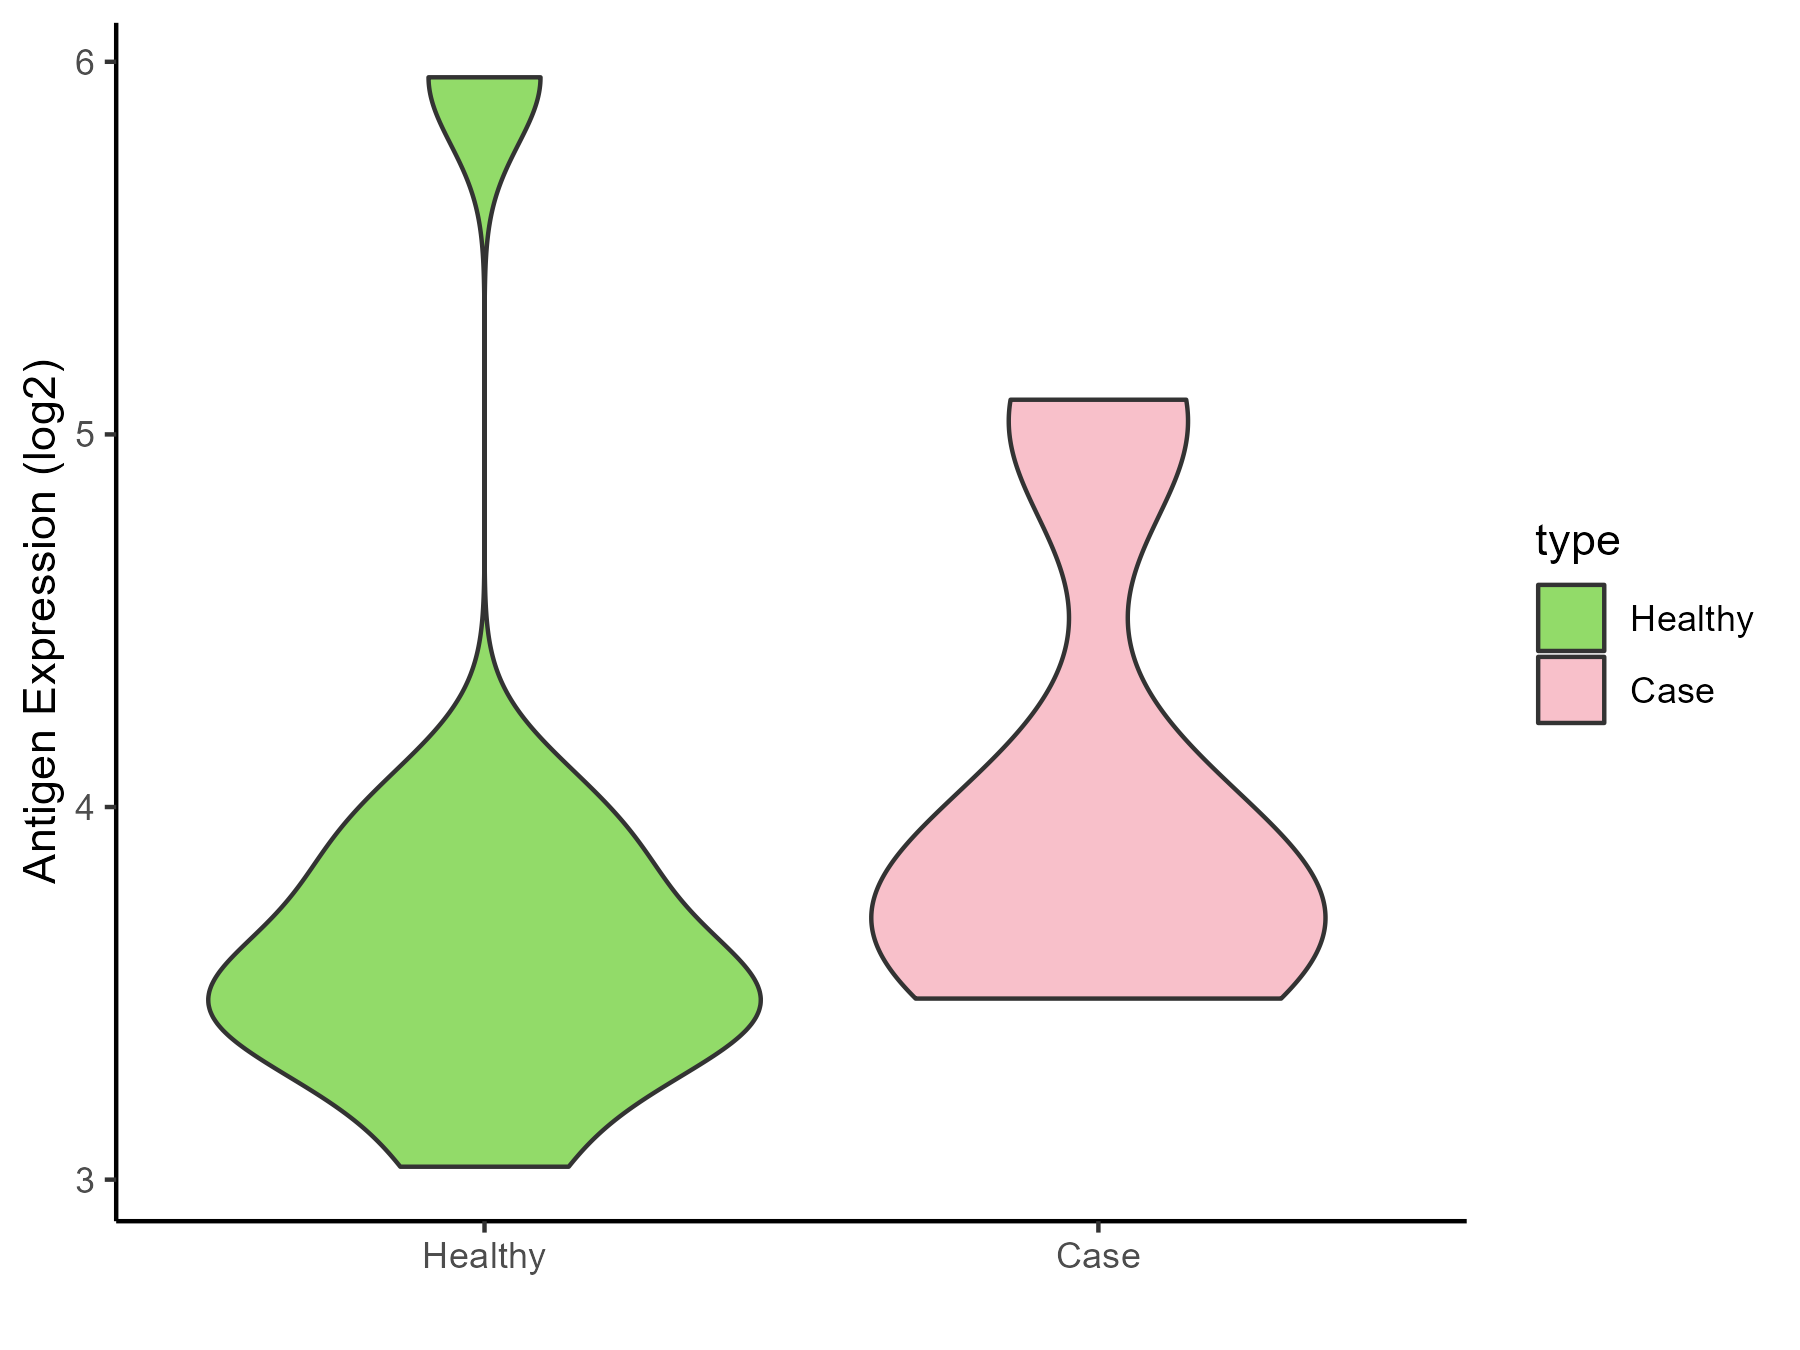
| The Studied Tissue | Biceps muscle | |
| The Specific Disease | Pompe disease | |
| The Expression Level of Disease Section Compare with the Healthy Individual Tissue | p-value: 0.460004391; Fold-change: 0.250979768; Z-score: 0.308584161 | |
| Disease-specific Antigen Abundances |
|
Click to View the Clearer Original Diagram |
| Differential expression pattern of antigen in diseases | ||
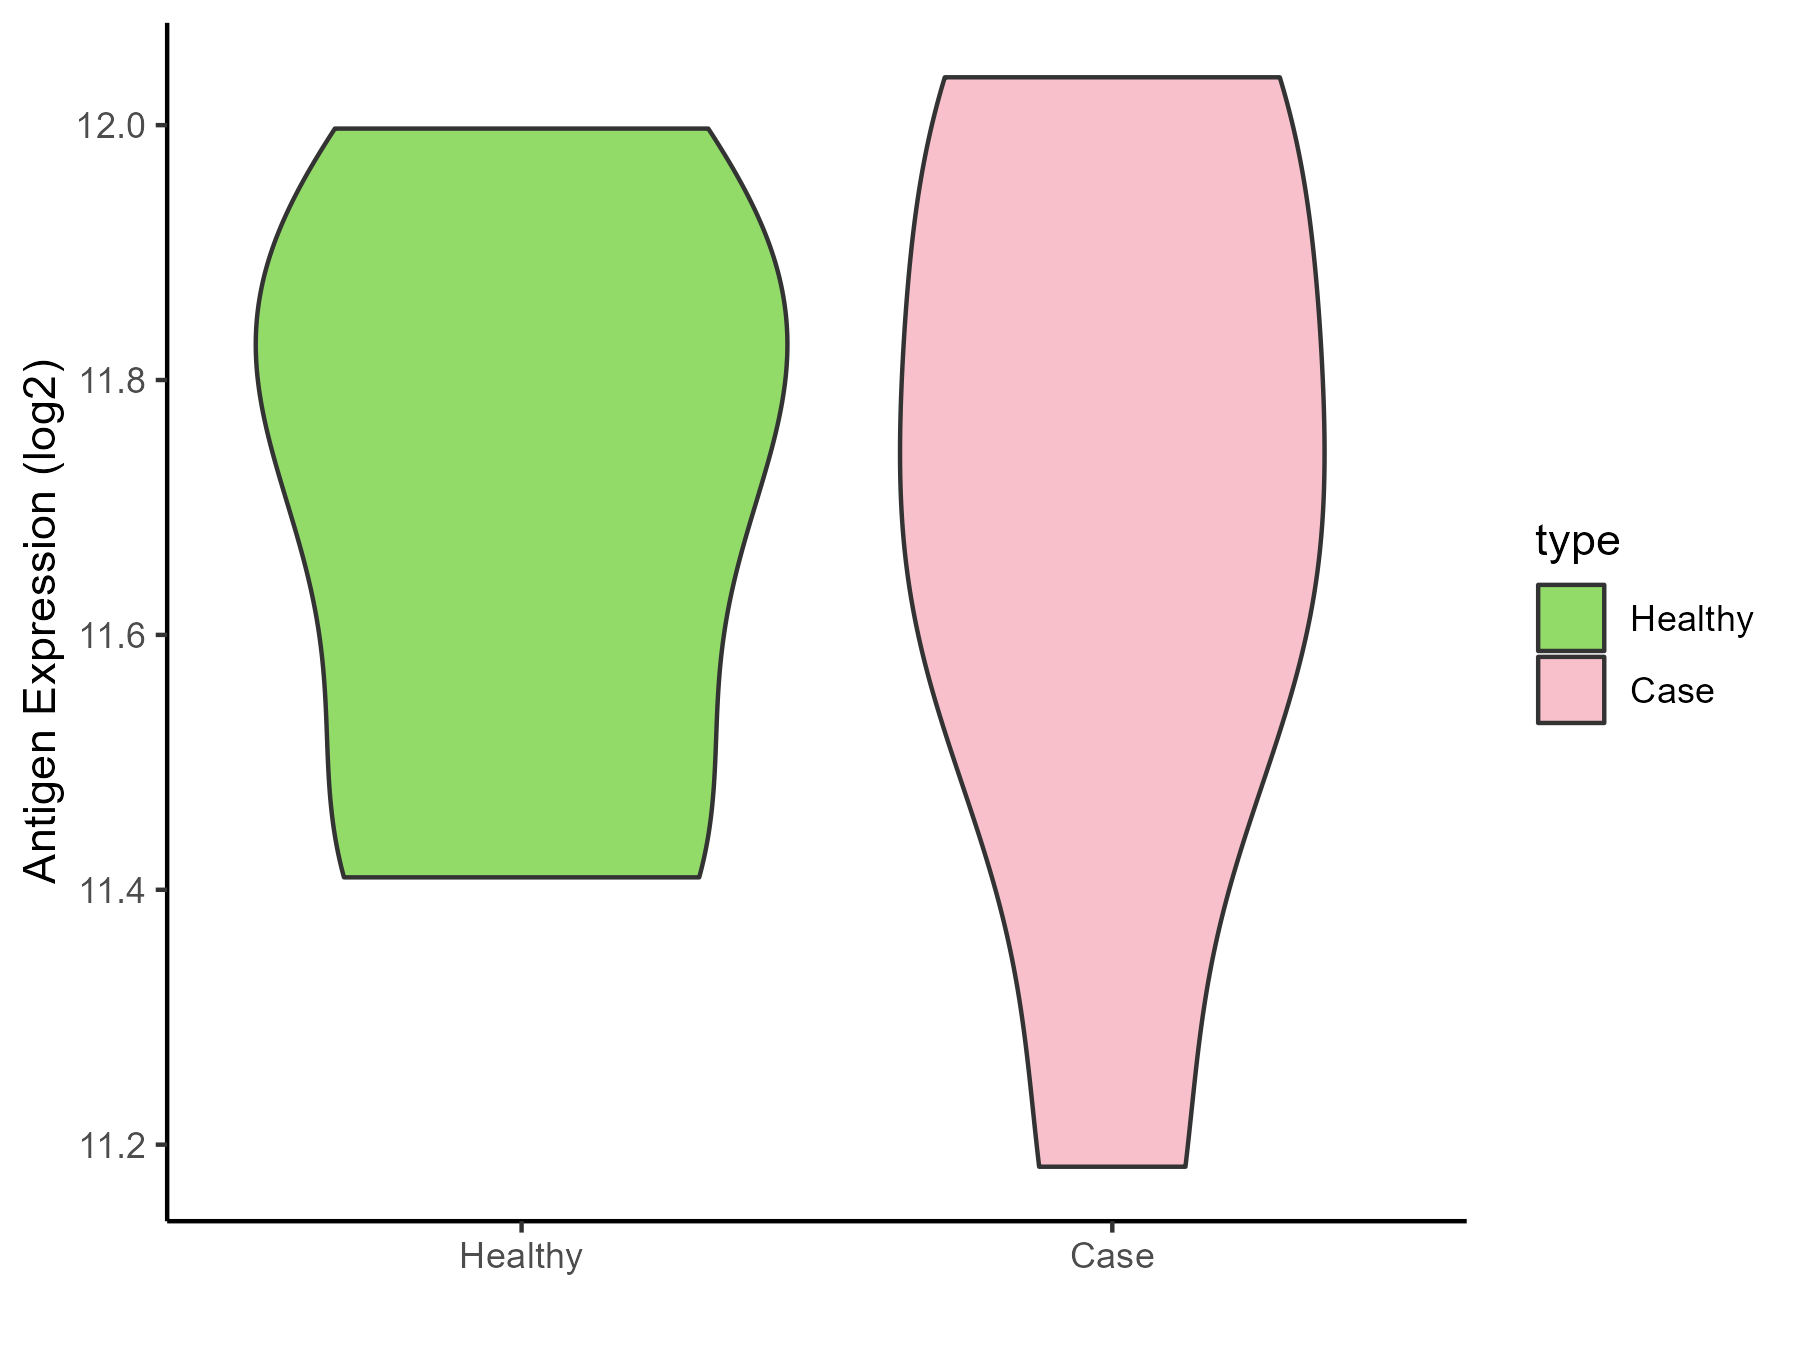
| The Studied Tissue | Whole blood | |
| The Specific Disease | Batten disease | |
| The Expression Level of Disease Section Compare with the Healthy Individual Tissue | p-value: 0.980944188; Fold-change: -0.036279299; Z-score: -0.156311246 | |
| Disease-specific Antigen Abundances |
|
Click to View the Clearer Original Diagram |
ICD Disease Classification 6
| Differential expression pattern of antigen in diseases | ||
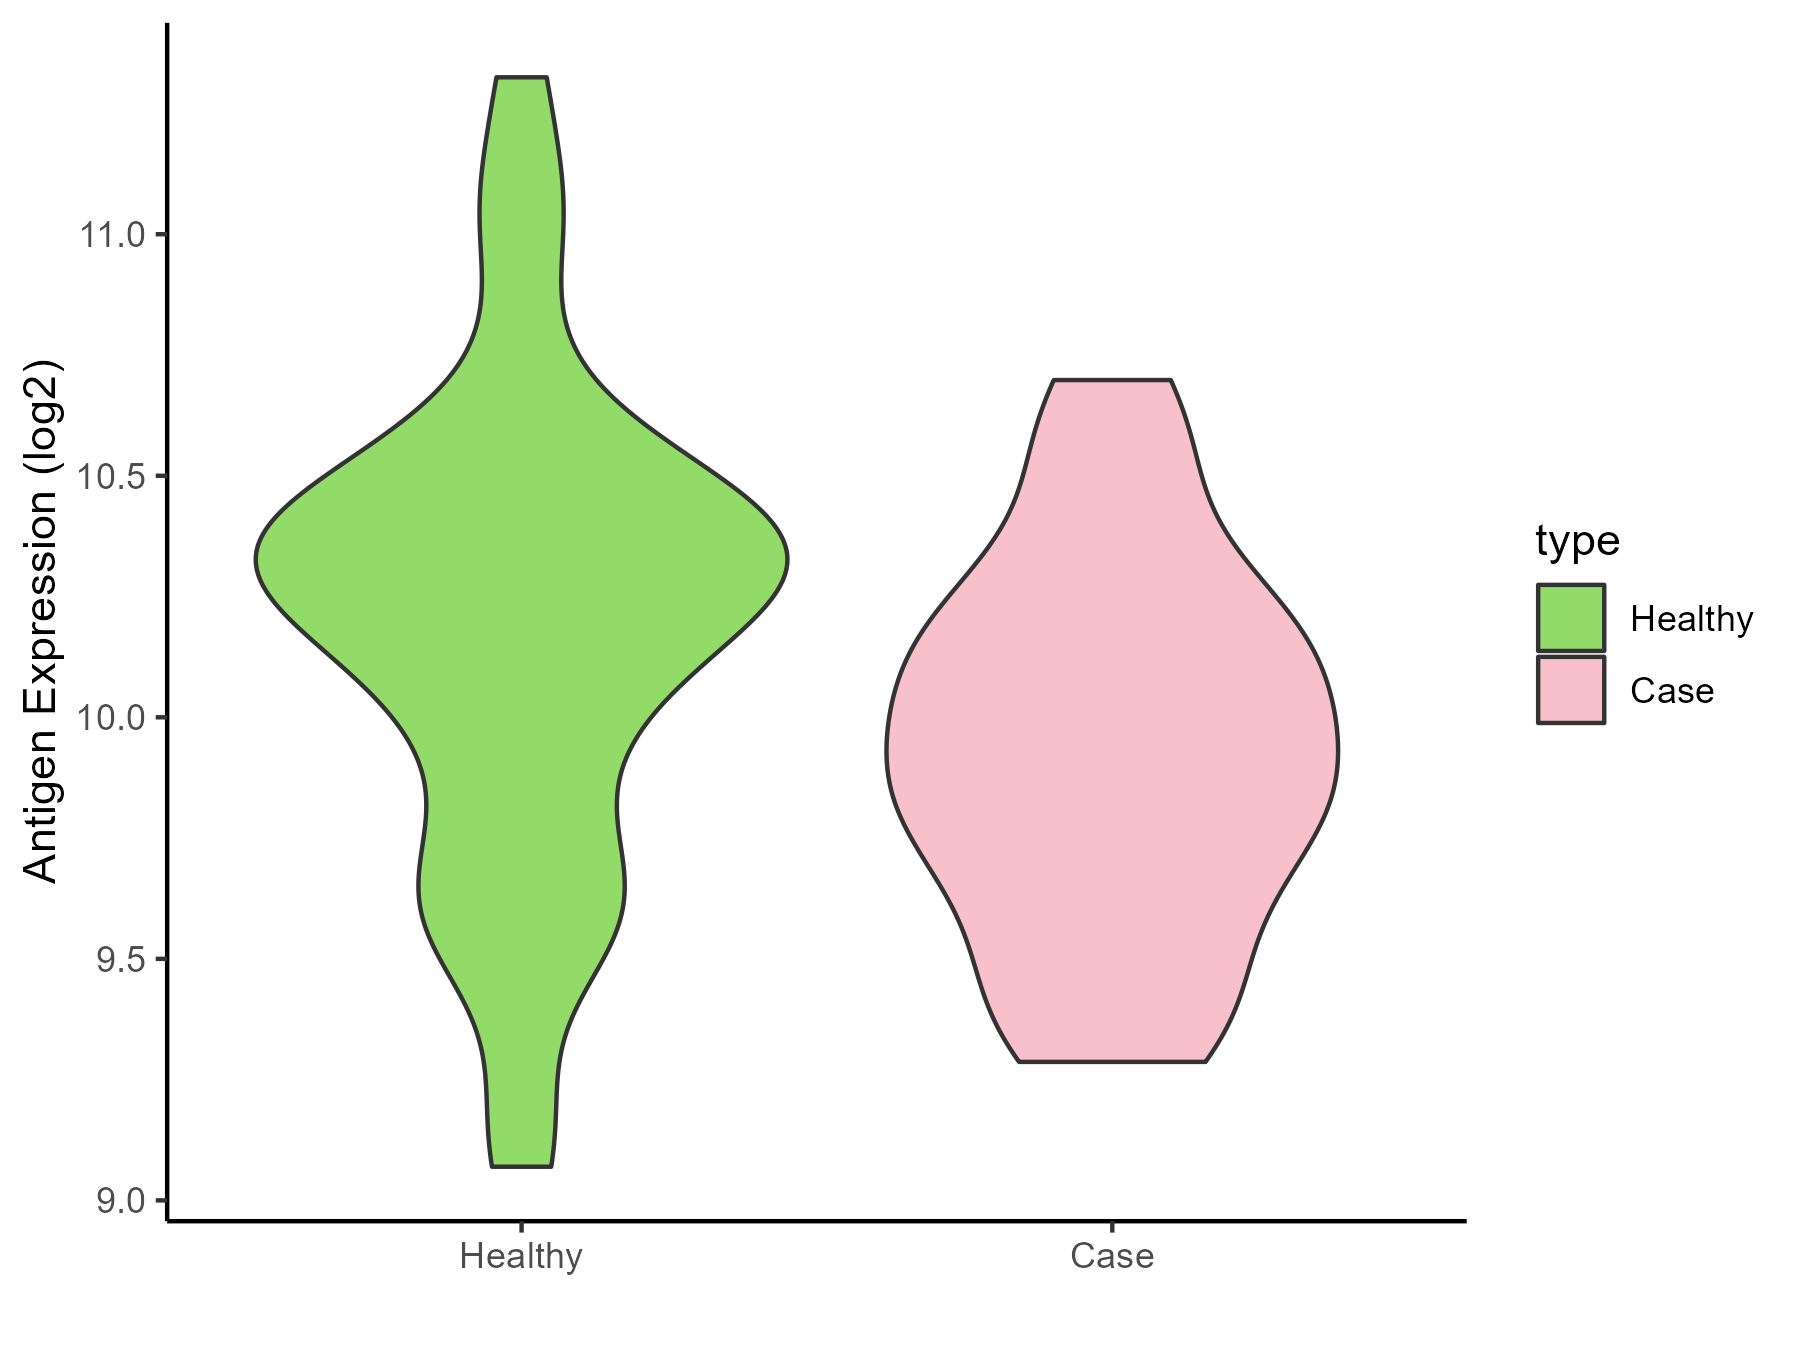
| The Studied Tissue | Whole blood | |
| The Specific Disease | Autism | |
| The Expression Level of Disease Section Compare with the Healthy Individual Tissue | p-value: 0.021720095; Fold-change: -0.374502022; Z-score: -0.759287385 | |
| Disease-specific Antigen Abundances |
|
Click to View the Clearer Original Diagram |
| Differential expression pattern of antigen in diseases | ||
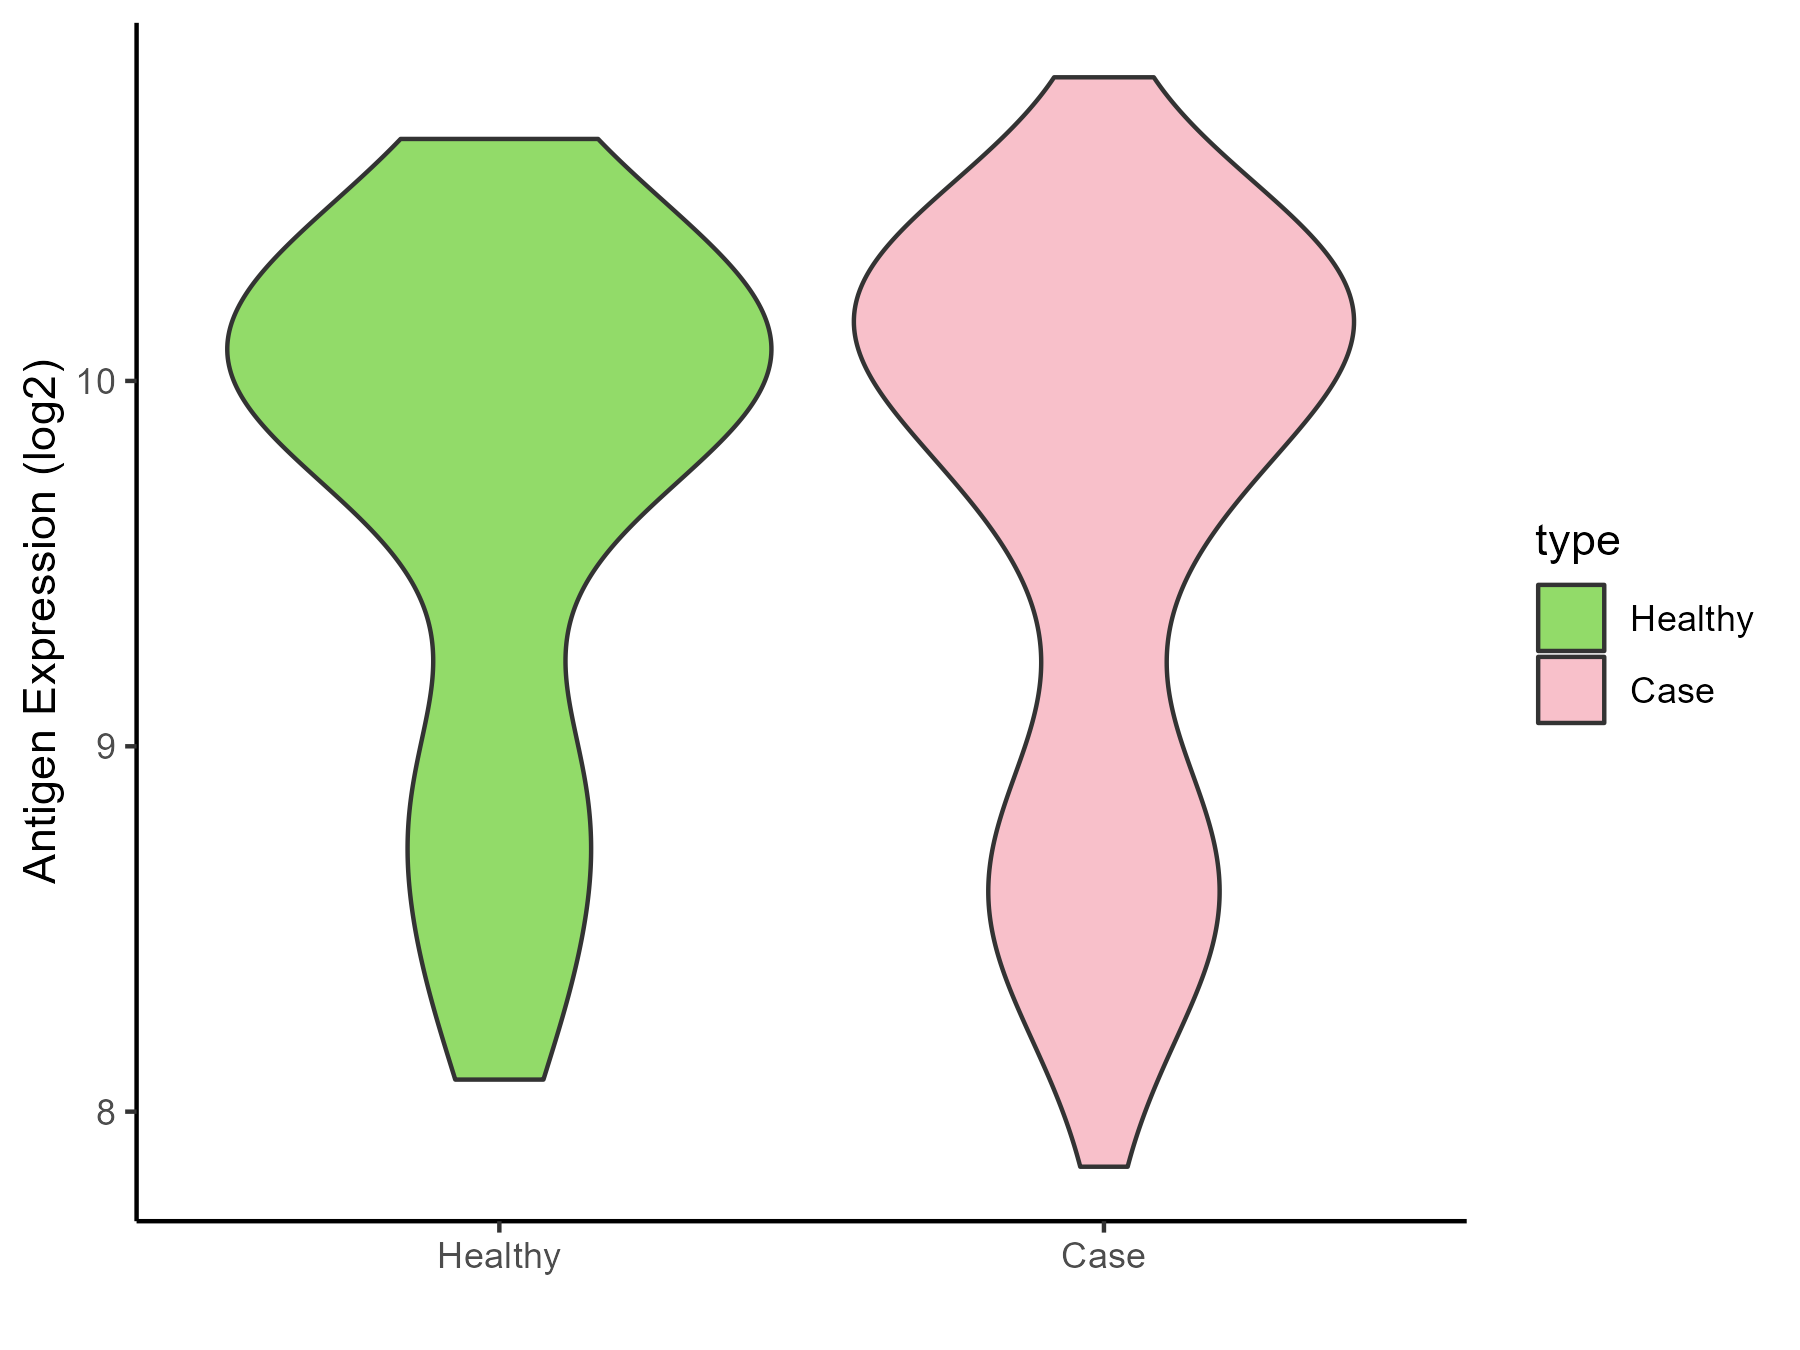
| The Studied Tissue | Whole blood | |
| The Specific Disease | Anxiety disorder | |
| The Expression Level of Disease Section Compare with the Healthy Individual Tissue | p-value: 0.604900883; Fold-change: -0.016378355; Z-score: -0.022972912 | |
| Disease-specific Antigen Abundances |
|
Click to View the Clearer Original Diagram |
ICD Disease Classification 8
| Differential expression pattern of antigen in diseases | ||
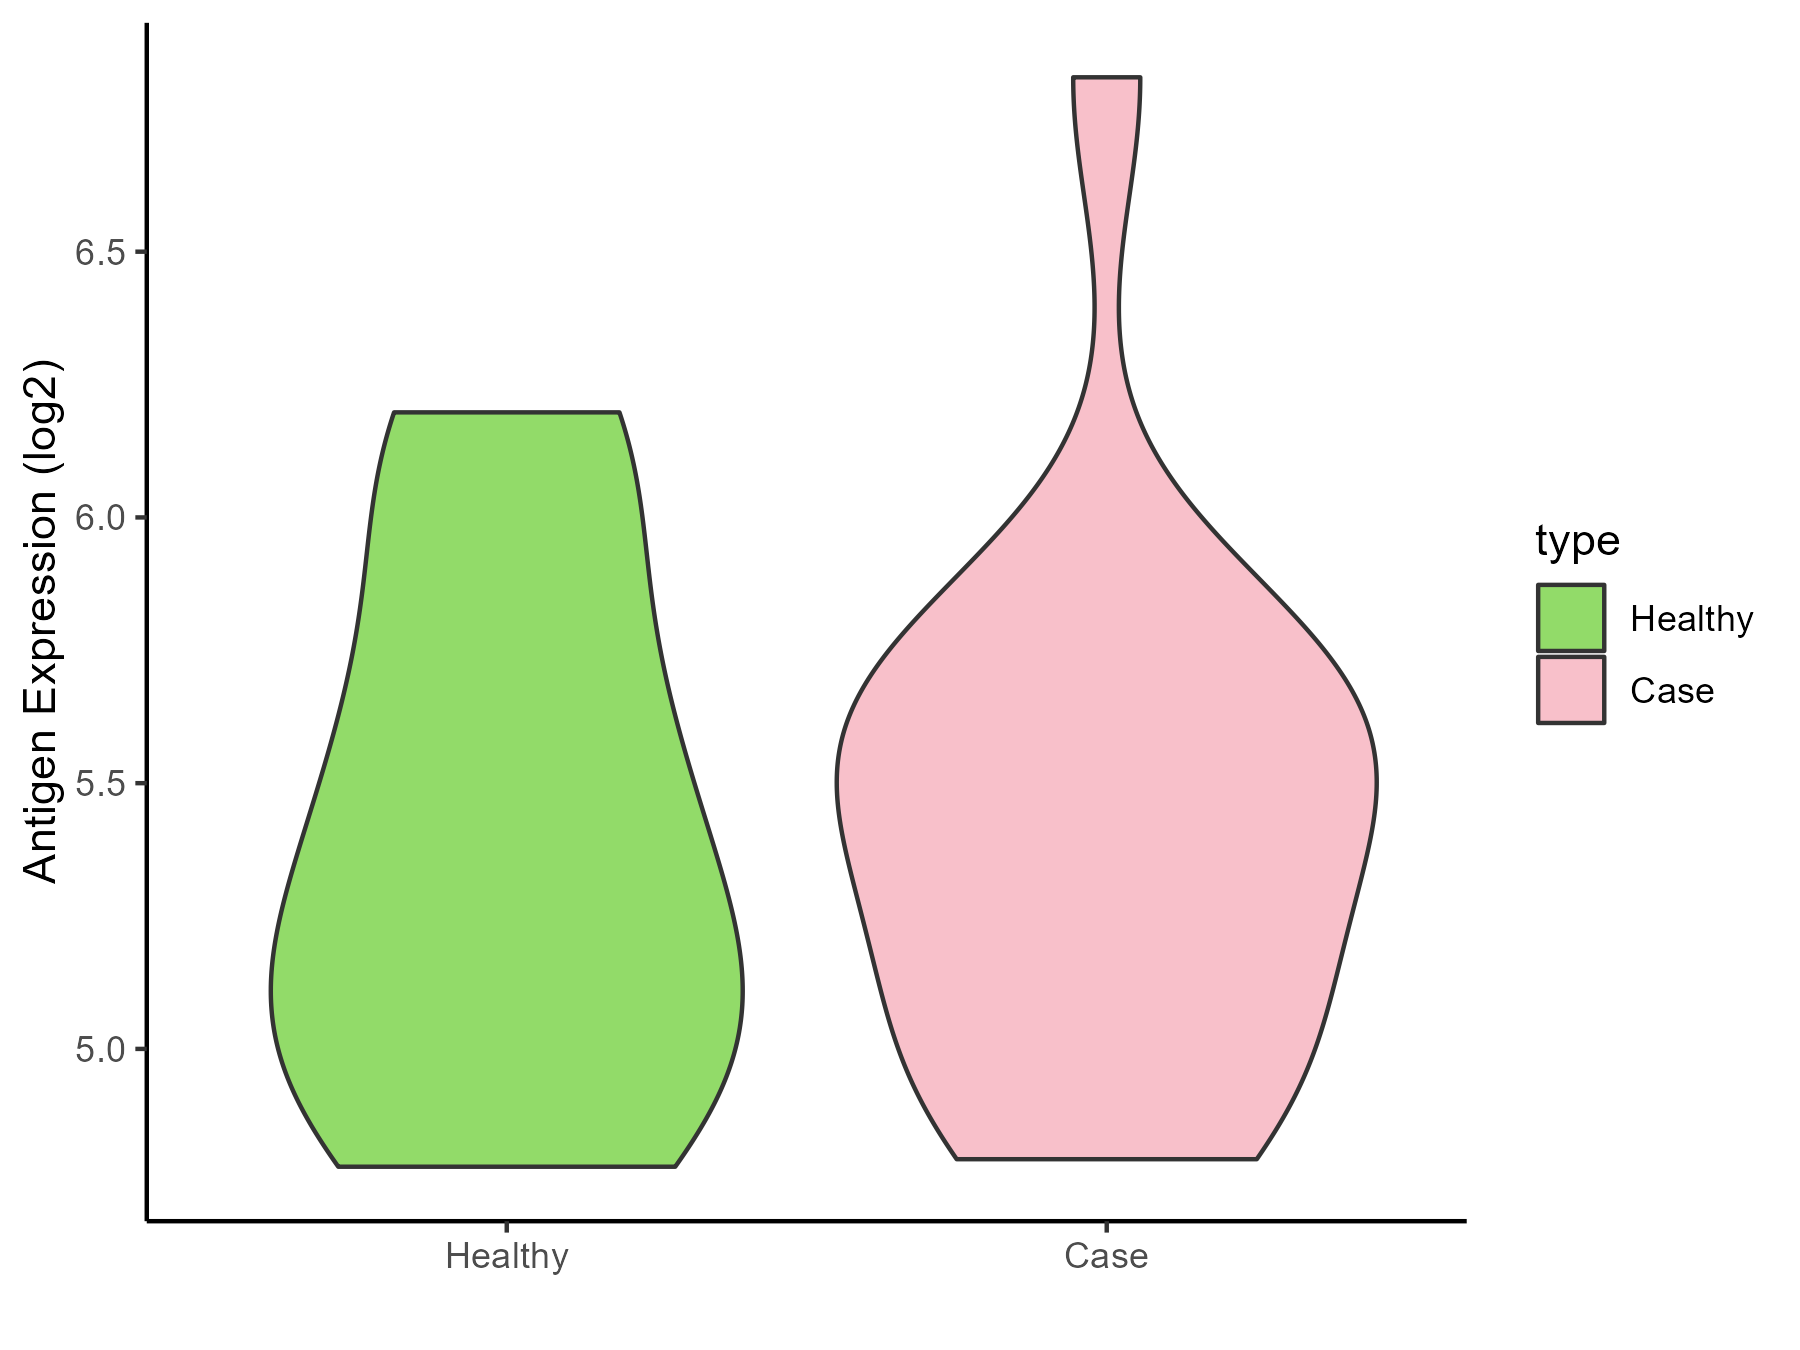
| The Studied Tissue | Substantia nigra | |
| The Specific Disease | Parkinson disease | |
| The Expression Level of Disease Section Compare with the Healthy Individual Tissue | p-value: 0.890780201; Fold-change: 0.145054885; Z-score: 0.289058813 | |
| Disease-specific Antigen Abundances |
|
Click to View the Clearer Original Diagram |
| Differential expression pattern of antigen in diseases | ||
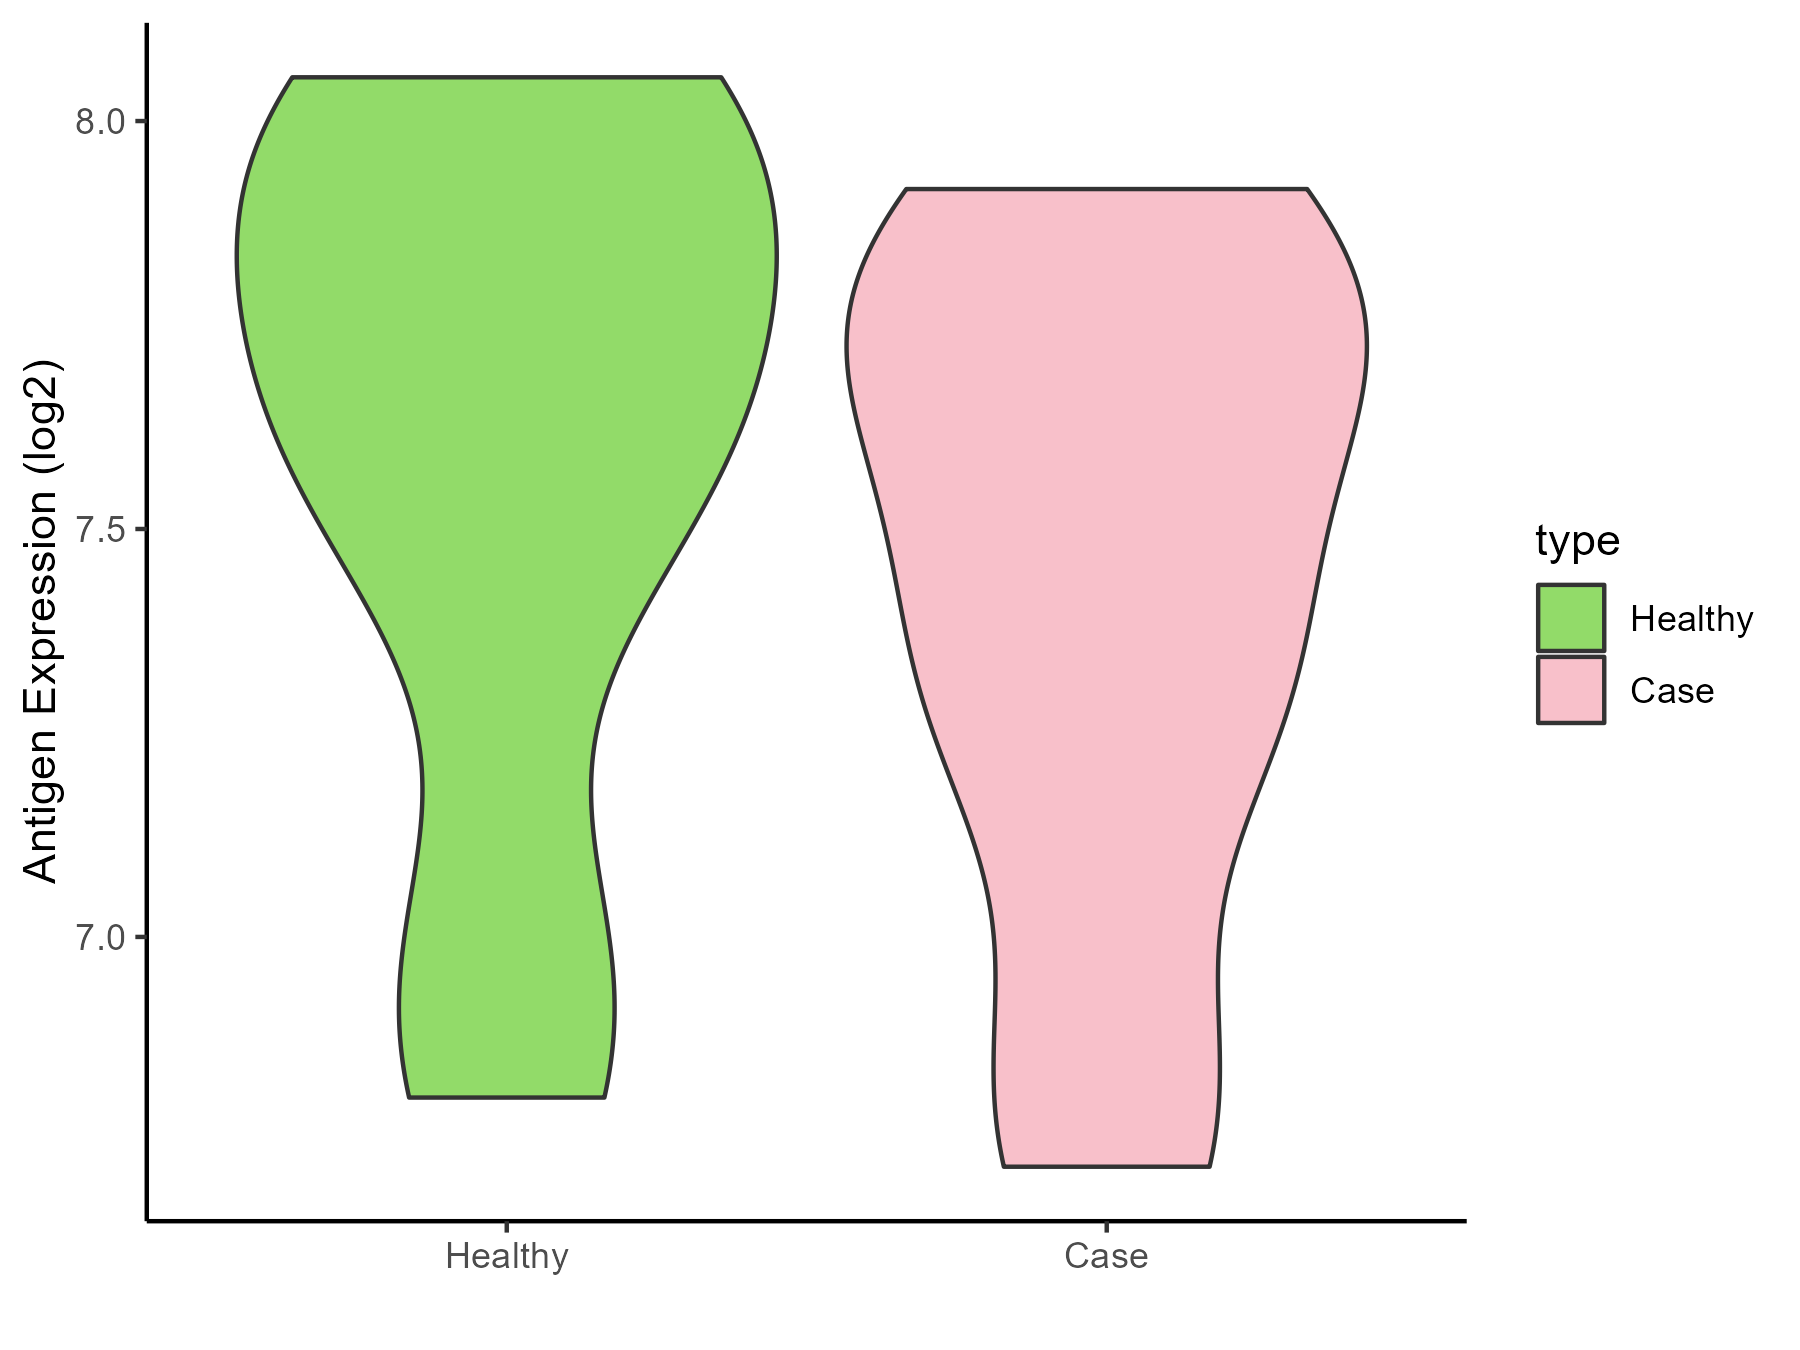
| The Studied Tissue | Whole blood | |
| The Specific Disease | Huntington disease | |
| The Expression Level of Disease Section Compare with the Healthy Individual Tissue | p-value: 0.434376091; Fold-change: -0.126539524; Z-score: -0.286367688 | |
| Disease-specific Antigen Abundances |
|
Click to View the Clearer Original Diagram |
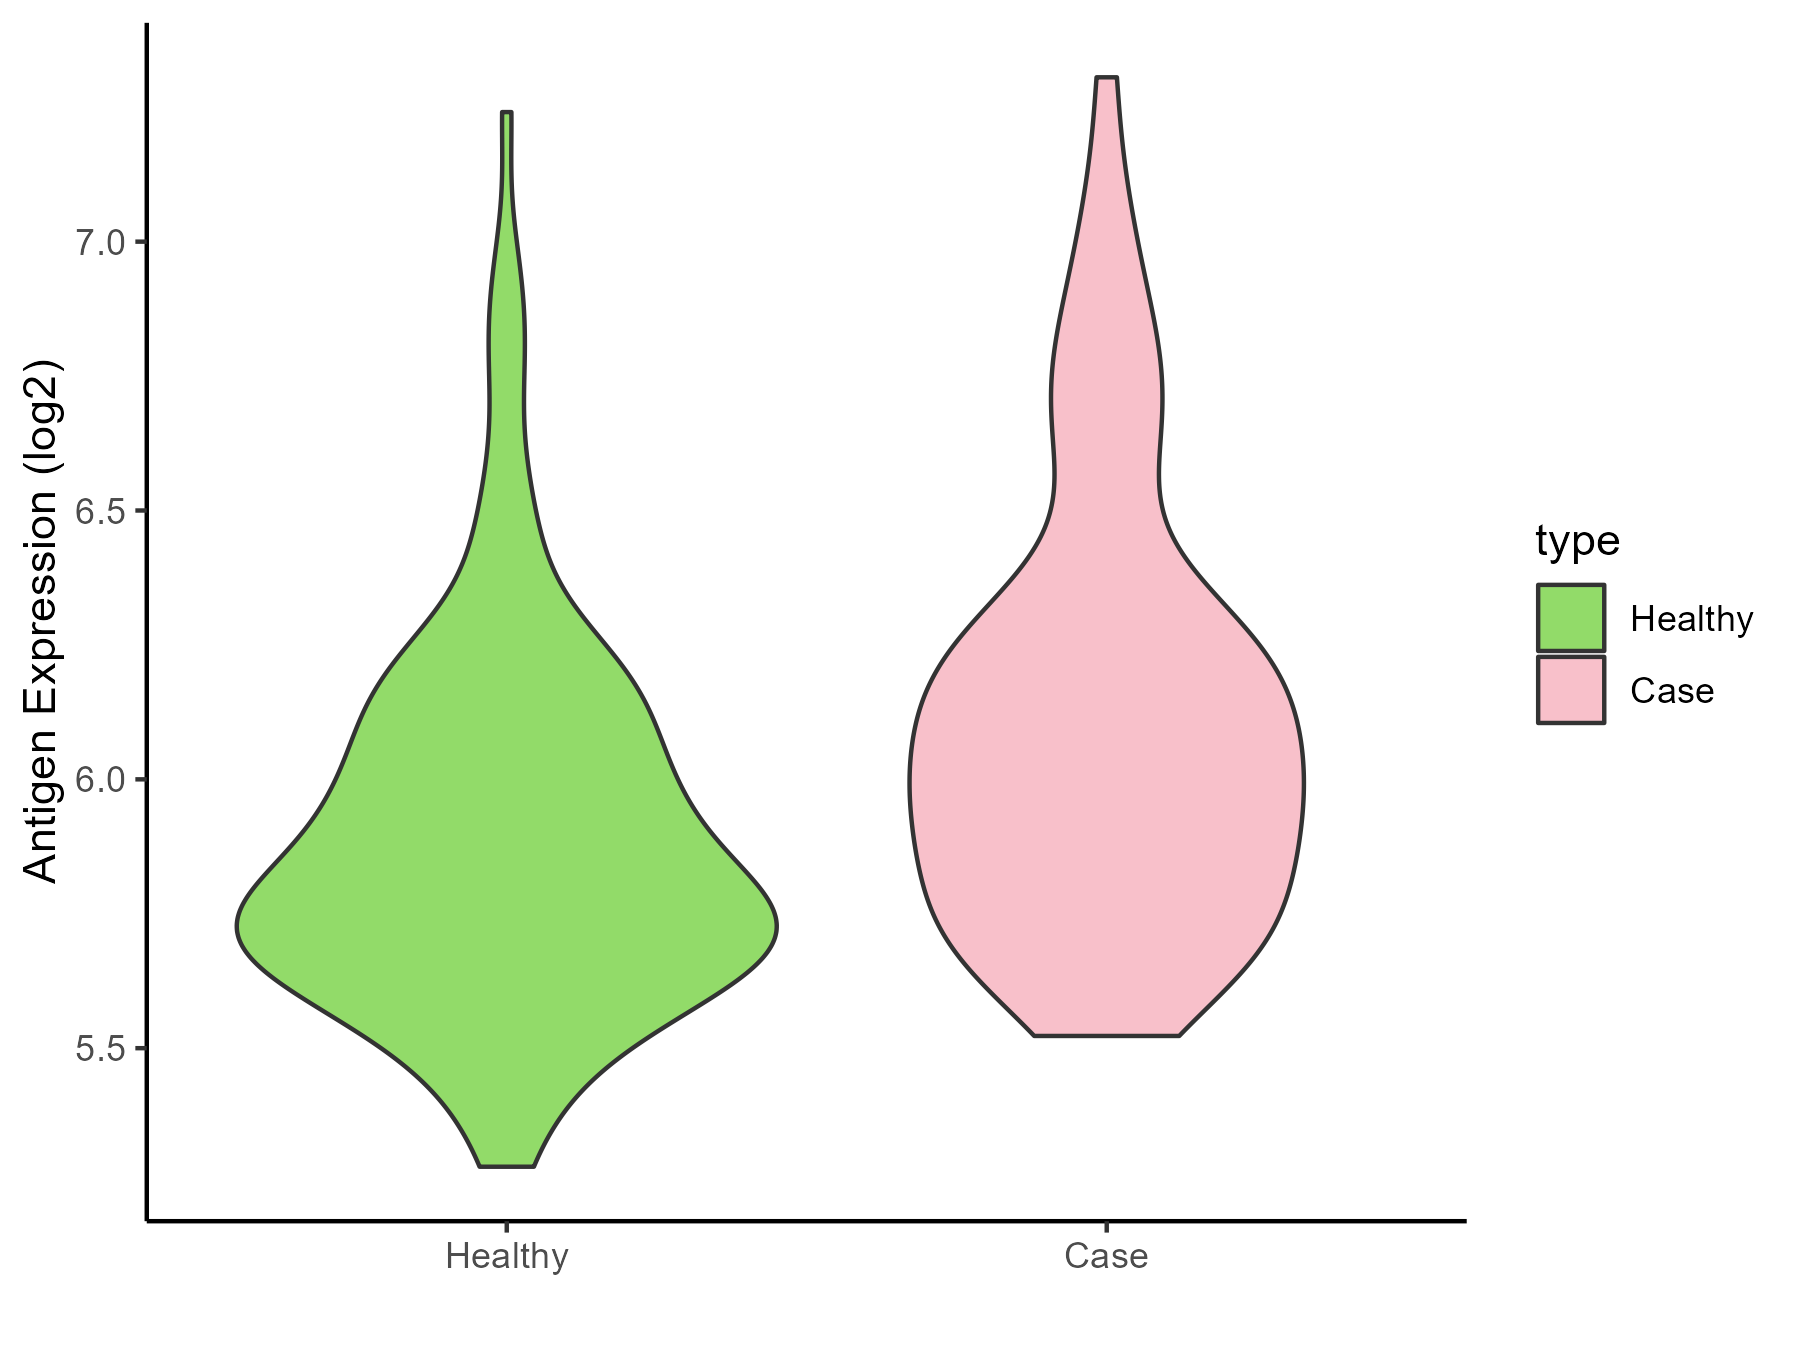
| Differential expression pattern of antigen in diseases | ||
| The Studied Tissue | Entorhinal cortex | |
| The Specific Disease | Alzheimer disease | |
| The Expression Level of Disease Section Compare with the Healthy Individual Tissue | p-value: 9.49E-05; Fold-change: 0.2266551; Z-score: 0.672168741 | |
| Disease-specific Antigen Abundances |
|
Click to View the Clearer Original Diagram |
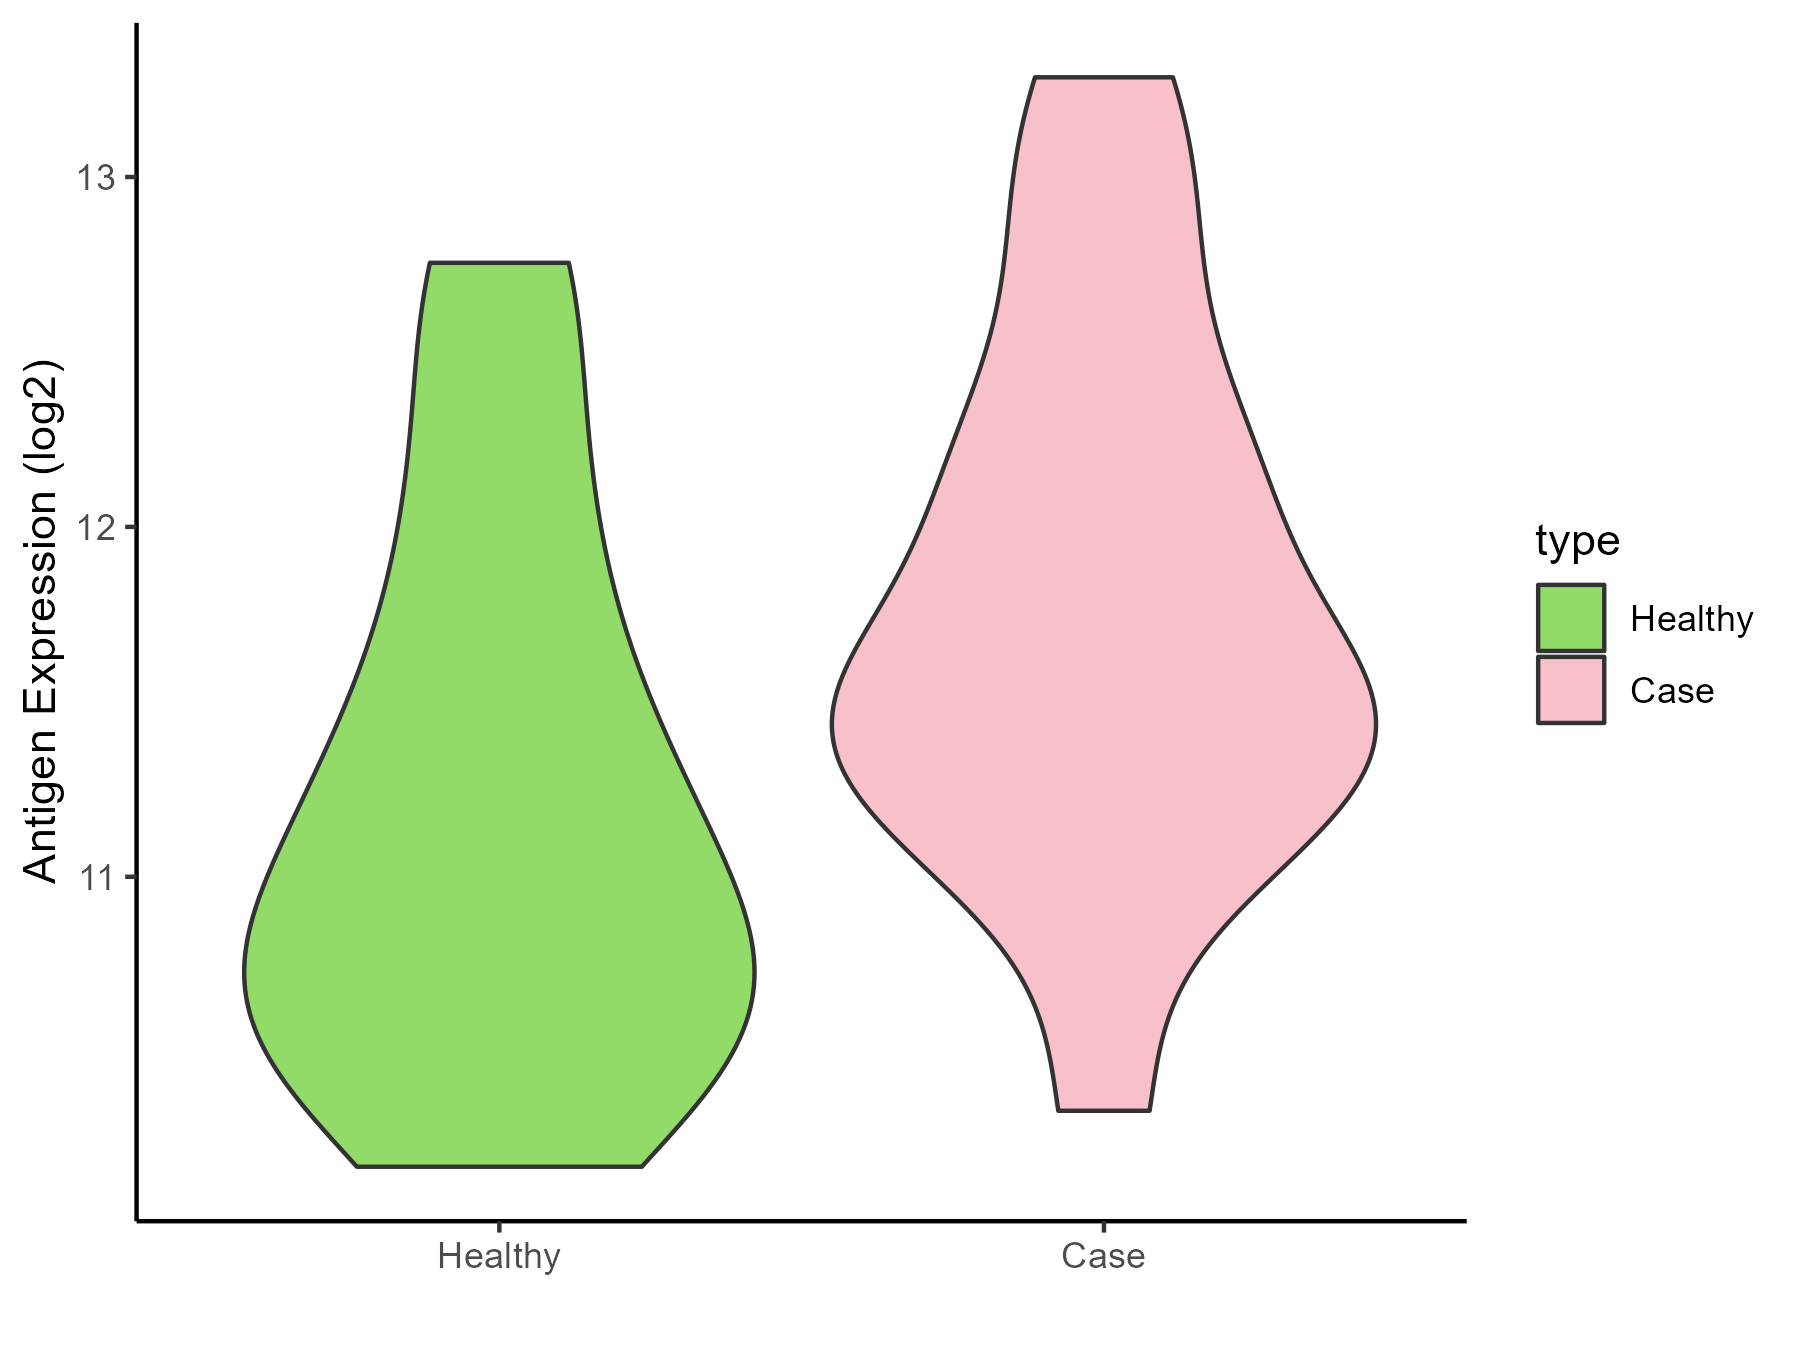
| Differential expression pattern of antigen in diseases | ||
| The Studied Tissue | Whole blood | |
| The Specific Disease | Seizure | |
| The Expression Level of Disease Section Compare with the Healthy Individual Tissue | p-value: 0.04896434; Fold-change: 0.526468369; Z-score: 0.671050731 | |
| Disease-specific Antigen Abundances |
|
Click to View the Clearer Original Diagram |
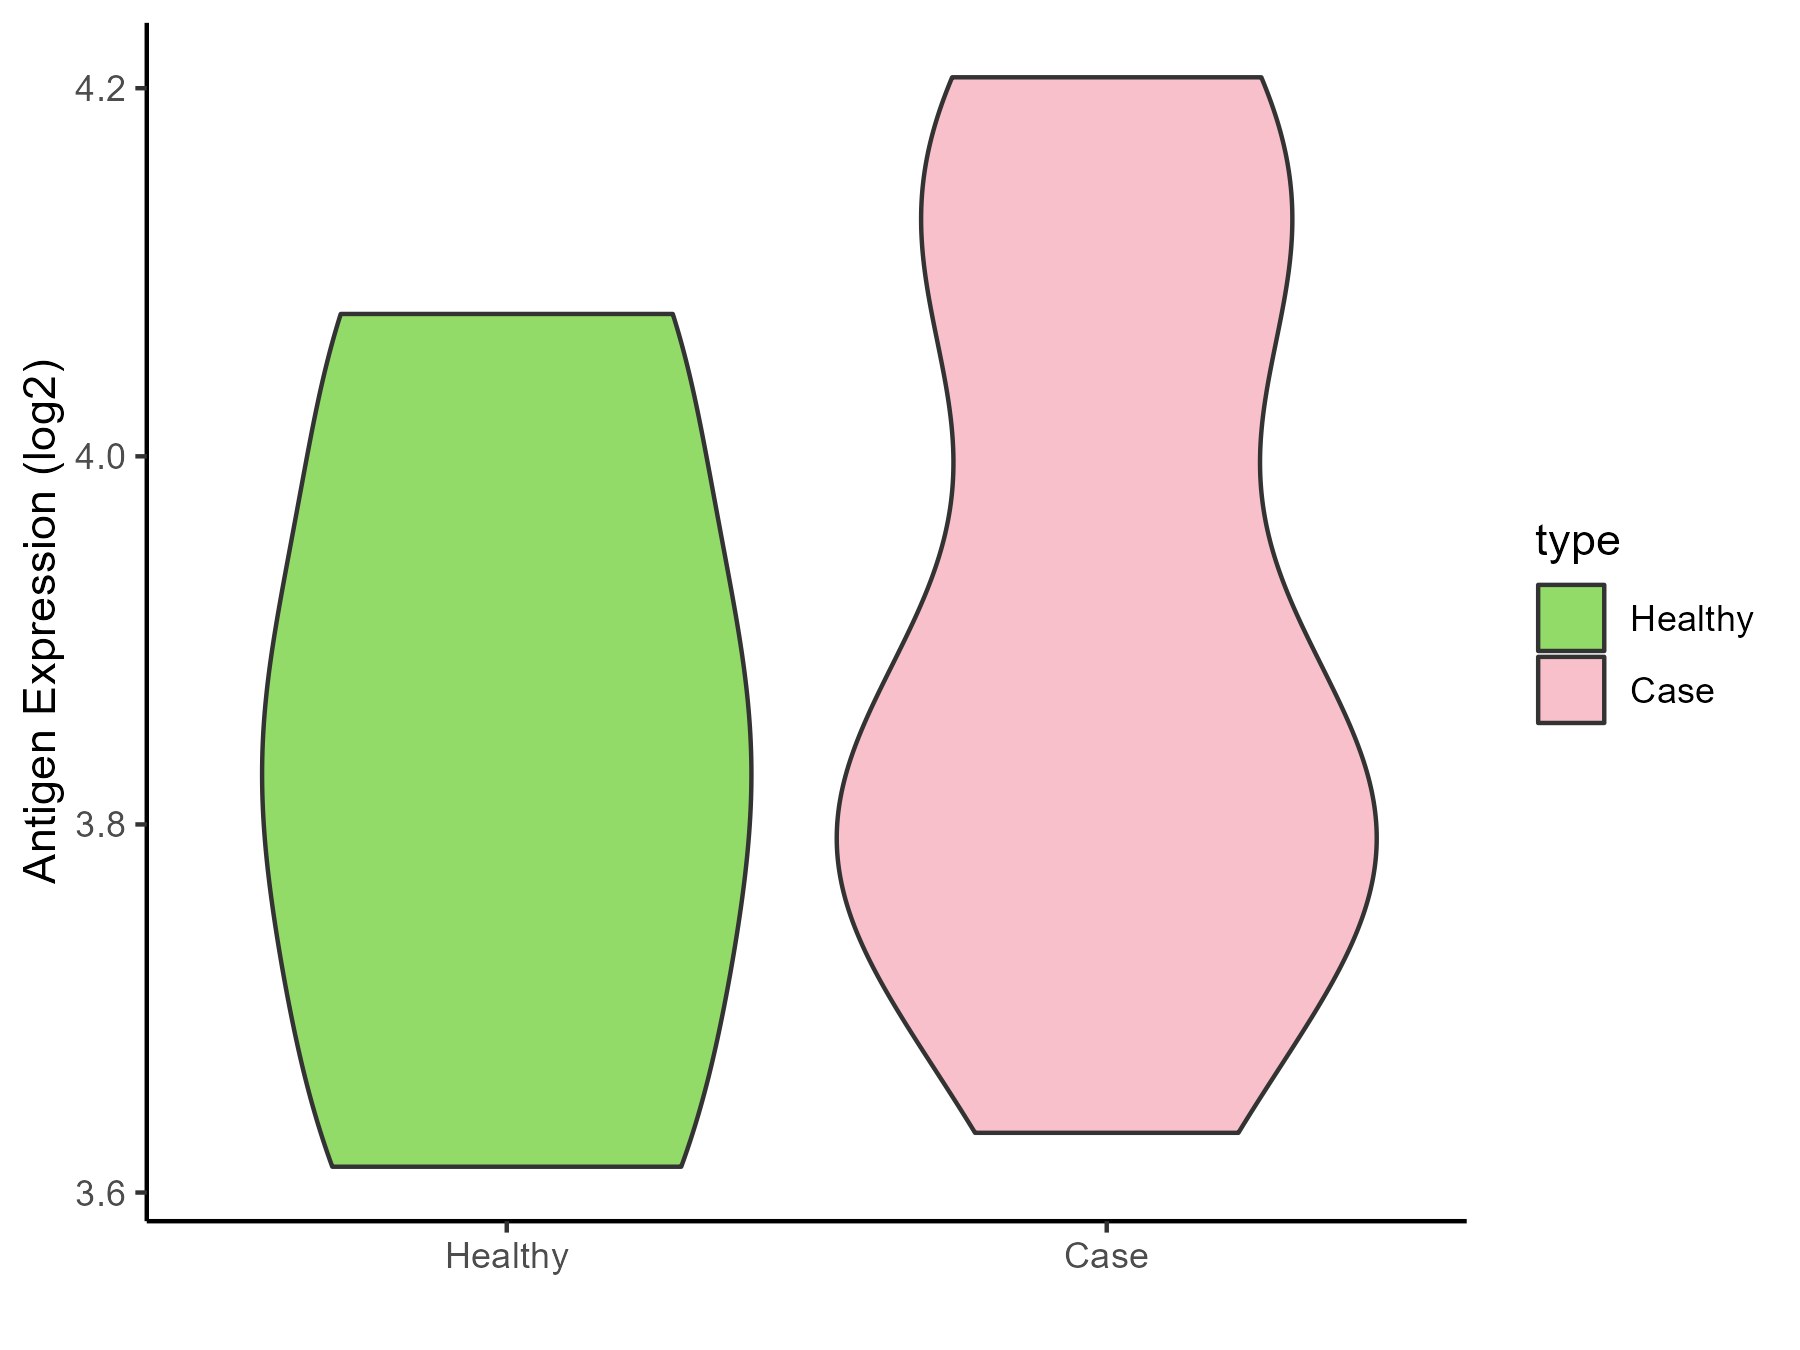
| Differential expression pattern of antigen in diseases | ||
| The Studied Tissue | Skin | |
| The Specific Disease | Lateral sclerosis | |
| The Expression Level of Disease Section Compare with the Healthy Individual Tissue | p-value: 0.538219632; Fold-change: -0.0149996; Z-score: -0.076559598 | |
| Disease-specific Antigen Abundances |
|
Click to View the Clearer Original Diagram |
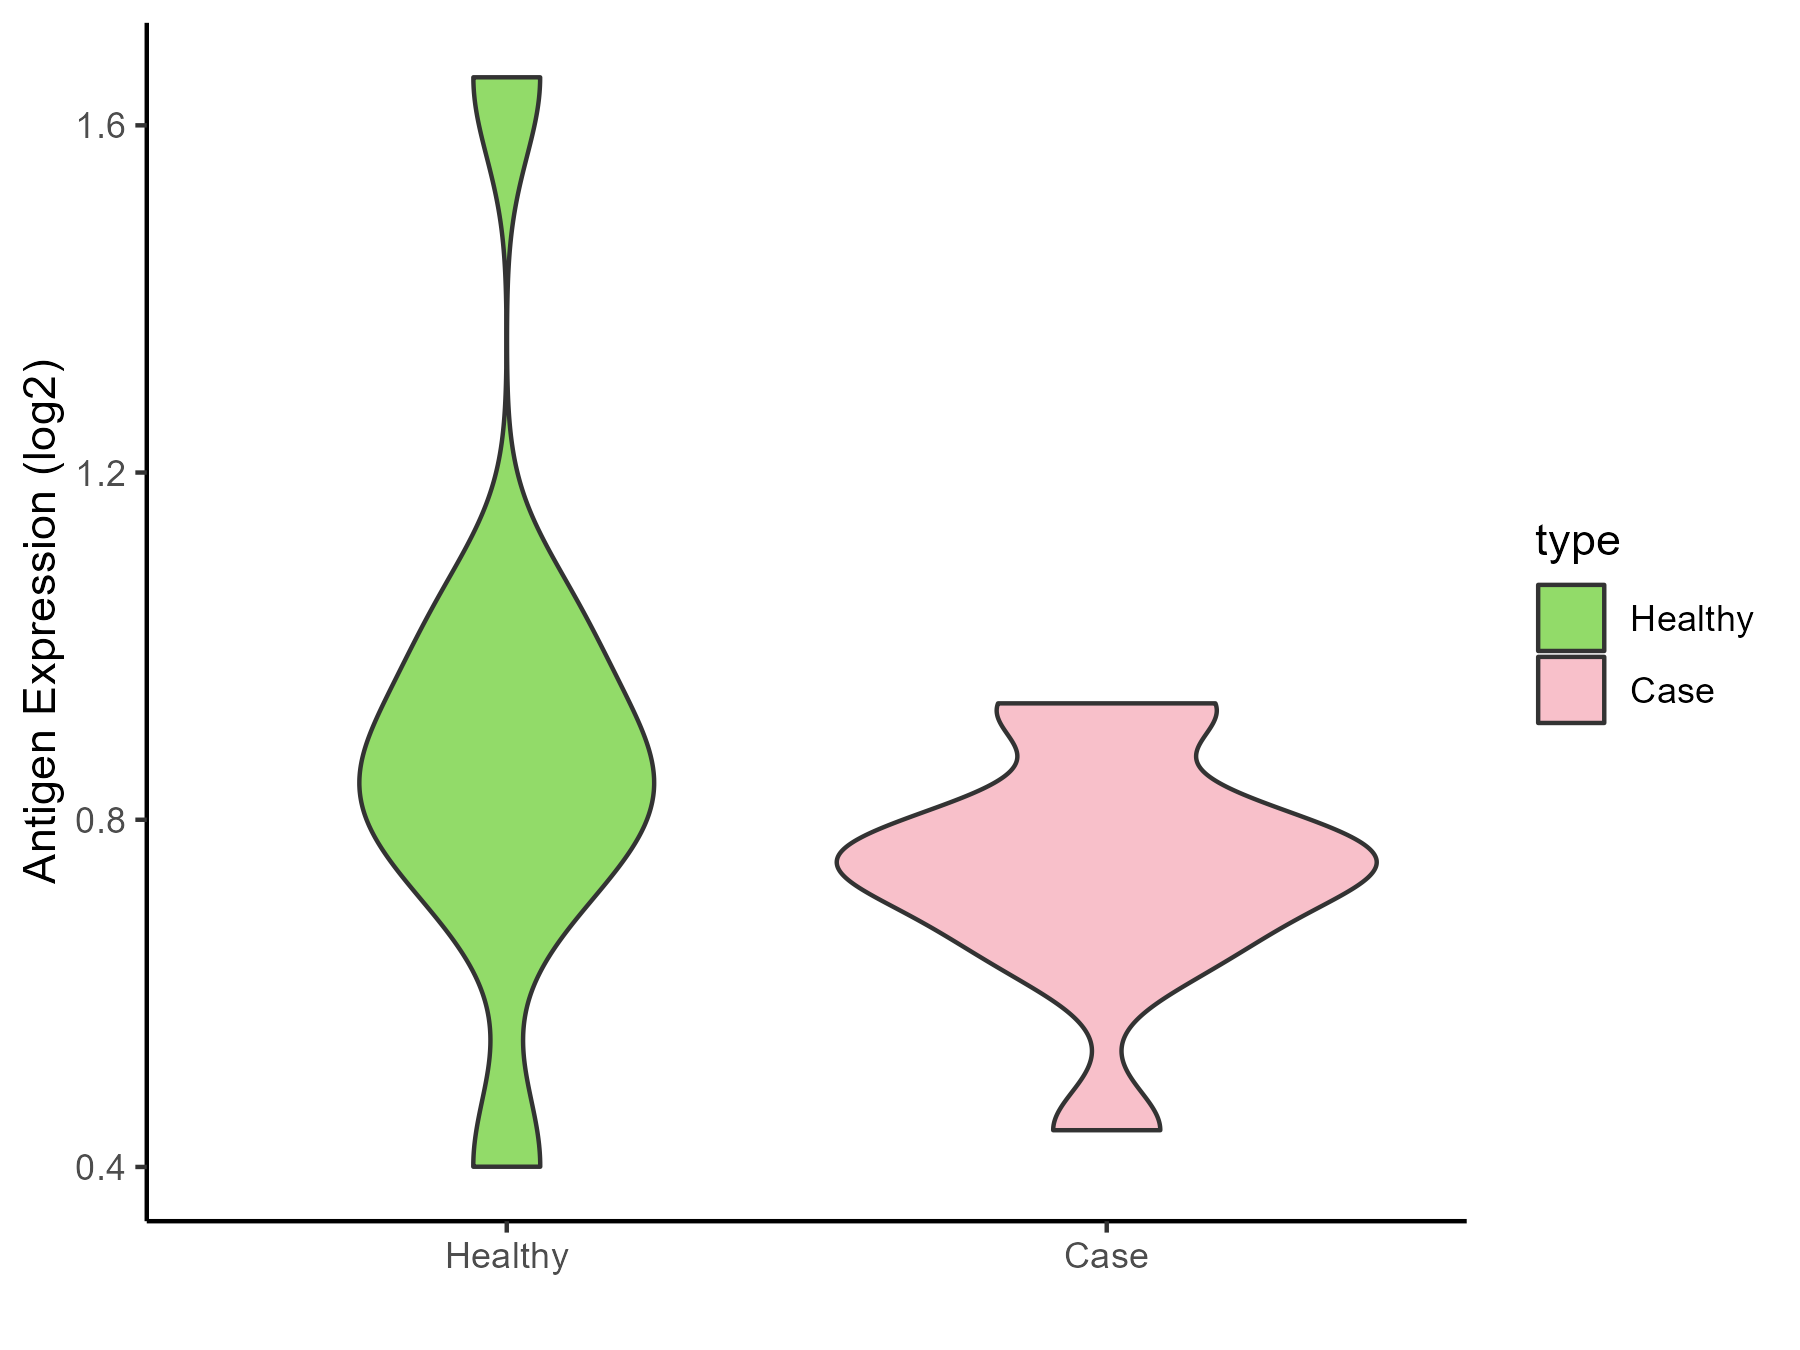
| The Studied Tissue | Cervical spinal cord | |
| The Specific Disease | Lateral sclerosis | |
| The Expression Level of Disease Section Compare with the Healthy Individual Tissue | p-value: 0.197242769; Fold-change: -0.11192451; Z-score: -0.332999907 | |
| Disease-specific Antigen Abundances |
|
Click to View the Clearer Original Diagram |
| Differential expression pattern of antigen in diseases | ||
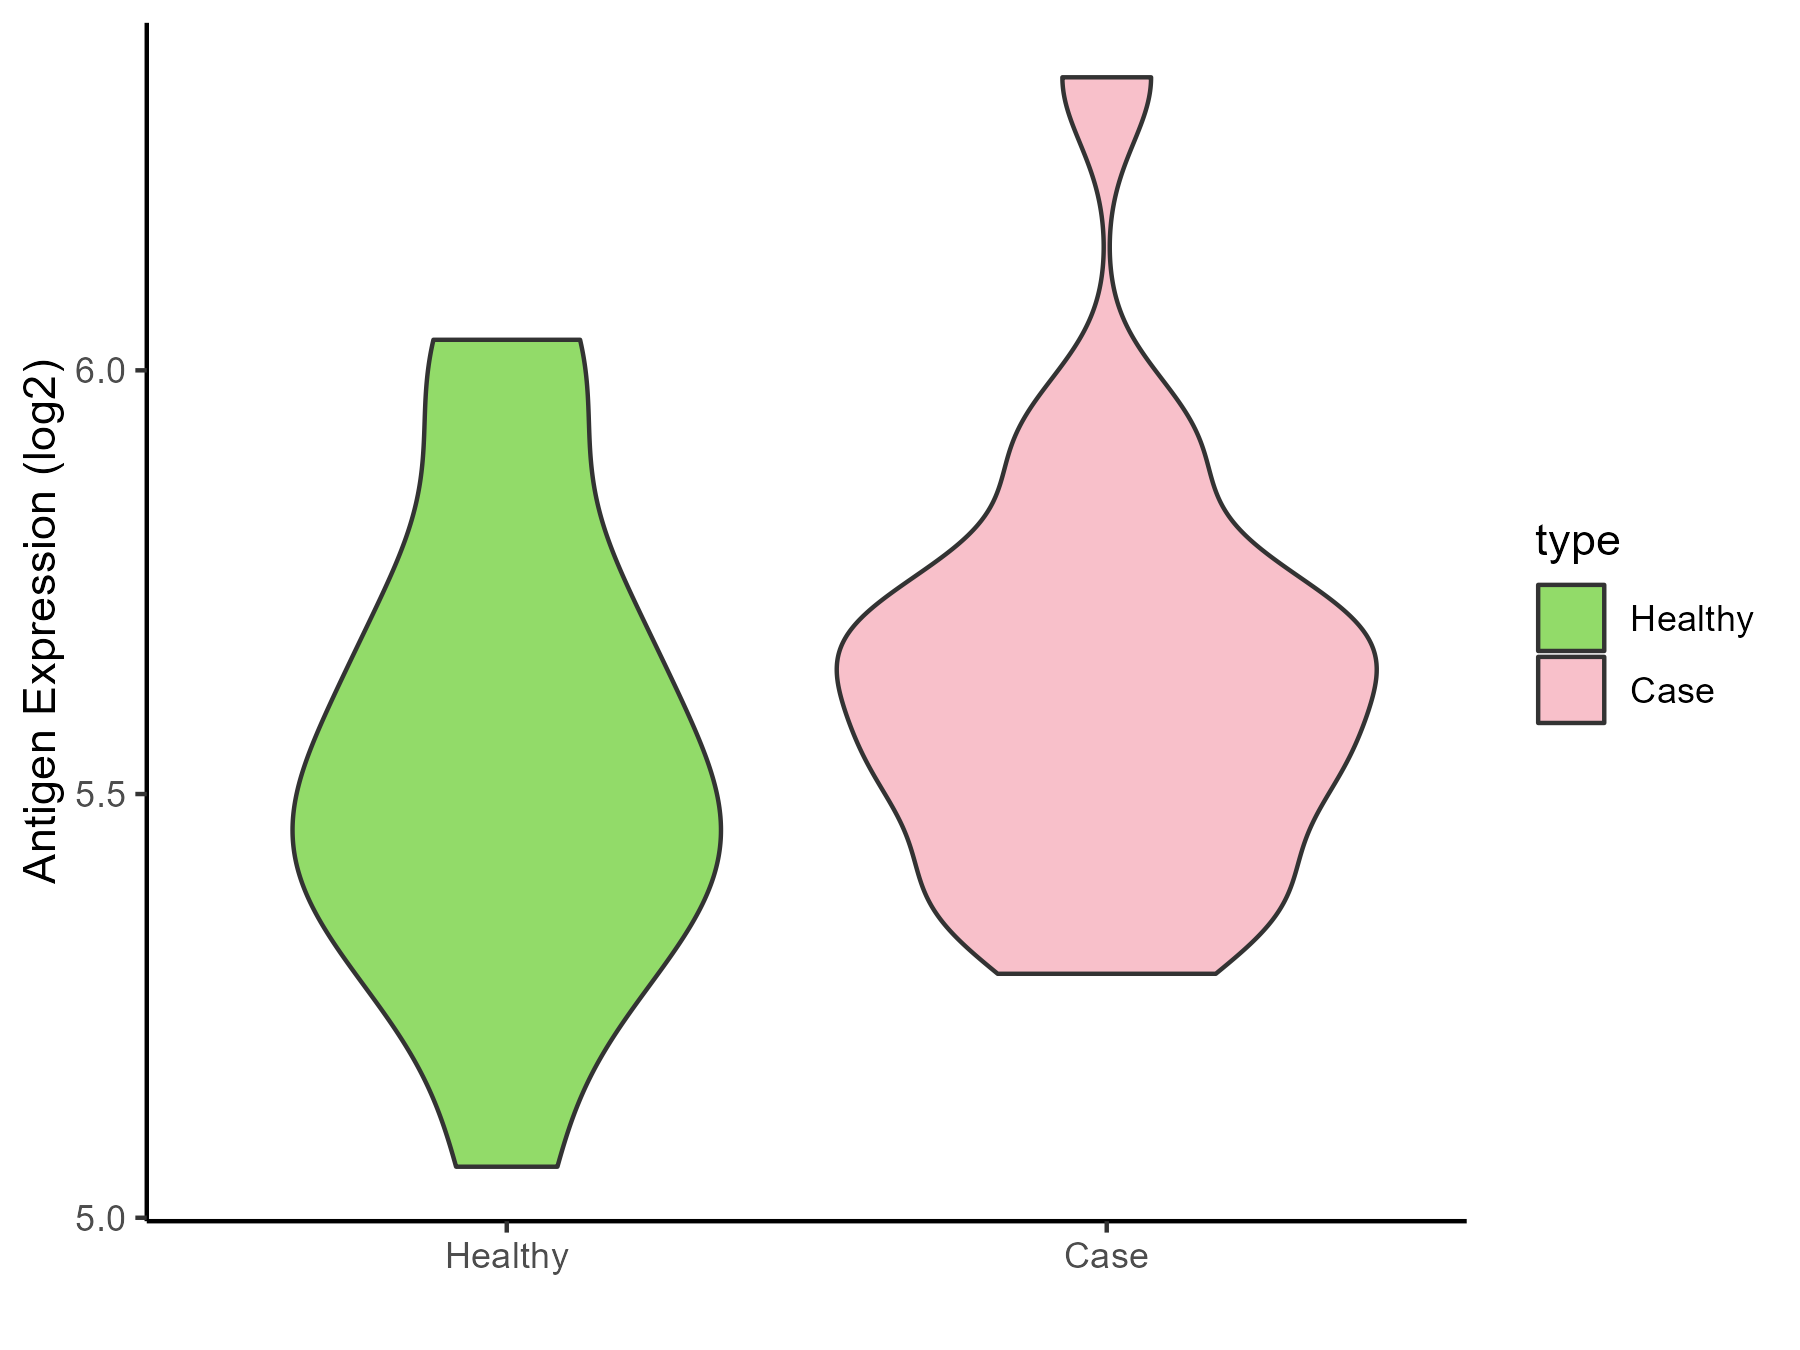
| The Studied Tissue | Muscle | |
| The Specific Disease | Muscular atrophy | |
| The Expression Level of Disease Section Compare with the Healthy Individual Tissue | p-value: 0.340315971; Fold-change: 0.159192657; Z-score: 0.573297133 | |
| Disease-specific Antigen Abundances |
|
Click to View the Clearer Original Diagram |
| Differential expression pattern of antigen in diseases | ||
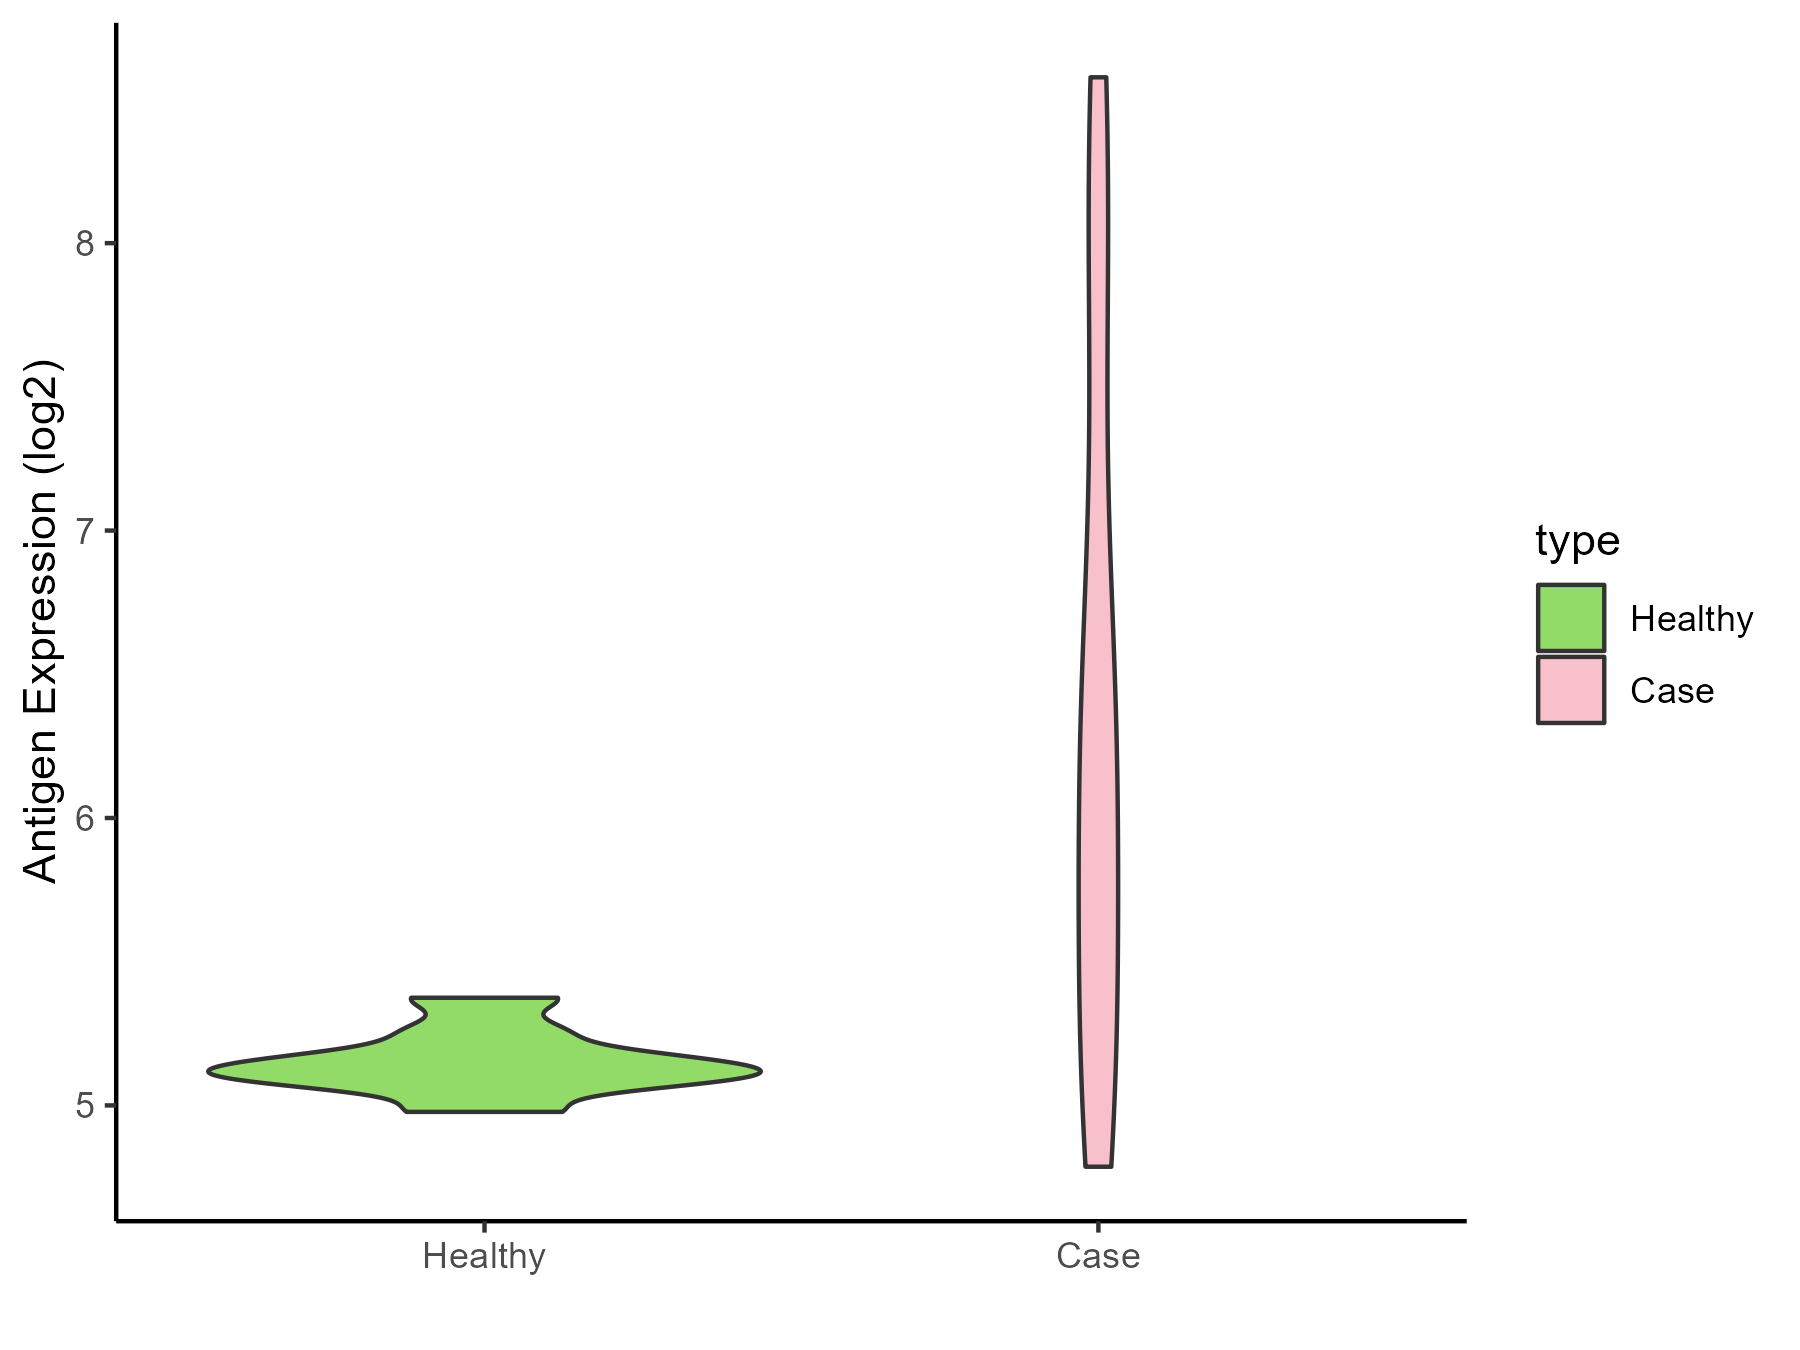
| The Studied Tissue | Muscle | |
| The Specific Disease | Myopathy | |
| The Expression Level of Disease Section Compare with the Healthy Individual Tissue | p-value: 3.71E-06; Fold-change: 1.03707397; Z-score: 8.635822725 | |
| Disease-specific Antigen Abundances |
|
Click to View the Clearer Original Diagram |
References
