
Linker Information
General Information of This Linker (ID: LIN0XBXXP)
| Name |
CN116785448A ADC4 linker
|
|||||
|---|---|---|---|---|---|---|
| Linker Type |
Cathepsin-cleavable linker
|
|||||
| Antibody-Linker Relation |
Cleavable
|
|||||
| Structure |
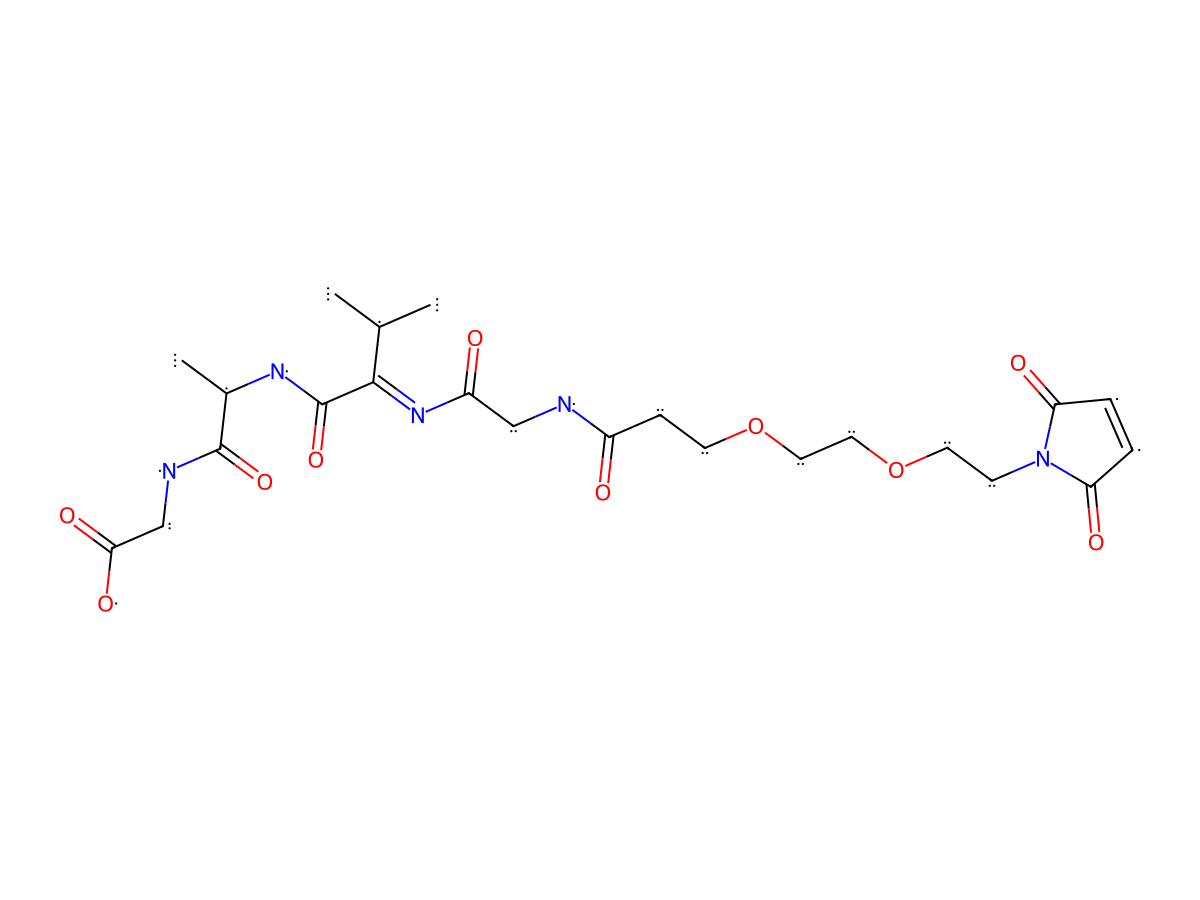
|
|||||
| Formula |
C23H33N5O10
|
|||||
| Isosmiles |
C[C@@H](NC(/C(C(C)C)=N/C(CNC(CCOCCOCCN1C(C=CC1=O)=O)=O)=O)=O)C(NCC(O)=O)=O
|
|||||
| InChI |
InChI=1S/C23H33N5O10/c1-14(2)21(23(36)26-15(3)22(35)25-13-20(33)34)27-17(30)12-24-16(29)6-8-37-10-11-38-9-7-28-18(31)4-5-19(28)32/h4-5,14-15H,6-13H2,1-3H3,(H,24,29)(H,25,35)(H,26,36)(H,33,34)/b27-21+/t15-/m1/s1
|
|||||
| InChIKey |
GNJOYOPXGHHWQT-FEMJLHABSA-N
|
|||||
| Pharmaceutical Properties |
Molecule Weight
|
539.542
|
Polar area
|
209.87
|
||
|
Complexity
|
907.0851273
|
xlogp Value
|
-2.22
|
|||
|
Heavy Count
|
38
|
Rot Bonds
|
17
|
|||
|
Hbond acc
|
9
|
Hbond Donor
|
4
|
|||
Each Antibody-drug Conjugate Related to This Linker
Full Information of The Activity Data of The ADC(s) Related to This Linker
CN116785448A ADC4 [Investigative]
Revealed Based on the Cell Line Data
| Experiment 1 Reporting the Activity Date of This ADC | [1] | ||||
| Efficacy Data | Half Maximal inhibitory Concentration (lC50) |
7.24 nM
|
|||
| Method Description |
Human esophageal cancer cells OE33 were cultured in the medium until the exponential growth phase. After trypsin digestion, the cells were centrifuged and the supernatant was discarded. The medium was diluted to 3×10⁴ cells/mL, 0.5×10⁴ cells/mL and 1.5×10⁴ cells/mL respectively. 100 uL of H100 was added to 96231 cells in RPMI 1640 (Cellmax), RPM11640 (Cellmax) and cell culture plates with 10% fetal bovine serum (Cellmax), and placed in a 37°C, 5% CO2 incubator for overnight culture. The next day, the ADC to be tested was diluted in the medium to 2000 nM, 400 nM, 80 nM, 16 nM, 3.2 nM, 0.64 nM, 0.128 nM, 0.026 nM, and 100 uL of the diluted ADC was added to each well of the 96-well cell culture plate. Three replicates were set for each concentration. The negative control and blank control groups without ADC were added 100 uL of the medium to each well. After the addition of the sample, the plate was returned to the 37°C, 5% CO2 incubator for further incubation for 6 days. After incubation, the cell culture plate was removed, and the medium in the plate was aspirated using a pipette. 100 uL of the medium containing 10% CCK-8 was added to each well, and incubated at 37°C for 3 hours. After incubation, the plate was removed, placed in an enzyme-linked plate, and selected 630 nm as the reference wavelength and 450 nm as the measurement wavelength to determine the absorbance. Based on the absorbance value, the IC50 was calculated using the four-parameter regression in GraphPad.
Click to Show/Hide
|
||||
| In Vitro Model | Barrett adenocarcinoma | OE33 cells | CVCL_0471 | ||
| Experiment 2 Reporting the Activity Date of This ADC | [1] | ||||
| Efficacy Data | Half Maximal inhibitory Concentration (lC50) |
9.2 nM
|
|||
| Method Description |
Breast cancer cells MDA-MBDMEM (Cellmax) were cultured in the medium until the exponential growth phase. After trypsin digestion, the cells were centrifuged and the supernatant was discarded. The medium was diluted to 3×10⁴ cells/mL, 0.5×10⁴ cells/mL and 1.5×10⁴ cells/mL respectively. 100 uL of H100 was added to 96231 cells in RPMI 1640 (Cellmax), RPM11640 (Cellmax) and cell culture plates with 10% fetal bovine serum (Cellmax), and placed in a 37°C, 5% CO2 incubator for overnight culture. The next day, the ADC to be tested was diluted in the medium to 2000 nM, 400 nM, 80 nM, 16 nM, 3.2 nM, 0.64 nM, 0.128 nM, 0.026 nM, and 100 uL of the diluted ADC was added to each well of the 96-well cell culture plate. Three replicates were set for each concentration. The negative control and blank control groups without ADC were added 100 uL of the medium to each well. After the addition of the sample, the plate was returned to the 37°C, 5% CO2 incubator for further incubation for 6 days. After incubation, the cell culture plate was removed, and the medium in the plate was aspirated using a pipette. 100 uL of the medium containing 10% CCK-8 was added to each well, and incubated at 37°C for 3 hours. After incubation, the plate was removed, placed in an enzyme-linked plate, and selected 630 nm as the reference wavelength and 450 nm as the measurement wavelength to determine the absorbance. Based on the absorbance value, the IC50 was calculated using the four-parameter regression in GraphPad.
Click to Show/Hide
|
||||
| In Vitro Model | Breast adenocarcinoma | MDA-MBDMEM cells | CVCL_0062 | ||
| Experiment 3 Reporting the Activity Date of This ADC | [1] | ||||
| Efficacy Data | Half Maximal inhibitory Concentration (lC50) |
30.88 nM
|
|||
| Method Description |
Lung cancer cells NCI-H1975 were cultured in the medium until the exponential growth phase. After trypsin digestion, the cells were centrifuged and the supernatant was discarded. The medium was diluted to 3×10⁴ cells/mL, 0.5×10⁴ cells/mL and 1.5×10⁴ cells/mL respectively. 100 uL of H100 was added to 96231 cells in RPMI 1640 (Cellmax), RPM11640 (Cellmax) and cell culture plates with 10% fetal bovine serum (Cellmax), and placed in a 37°C, 5% CO2 incubator for overnight culture. The next day, the ADC to be tested was diluted in the medium to 2000 nM, 400 nM, 80 nM, 16 nM, 3.2 nM, 0.64 nM, 0.128 nM, 0.026 nM, and 100 uL of the diluted ADC was added to each well of the 96-well cell culture plate. Three replicates were set for each concentration. The negative control and blank control groups without ADC were added 100 uL of the medium to each well. After the addition of the sample, the plate was returned to the 37°C, 5% CO2 incubator for further incubation for 6 days. After incubation, the cell culture plate was removed, and the medium in the plate was aspirated using a pipette. 100 uL of the medium containing 10% CCK-8 was added to each well, and incubated at 37°C for 3 hours. After incubation, the plate was removed, placed in an enzyme-linked plate, and selected 630 nm as the reference wavelength and 450 nm as the measurement wavelength to determine the absorbance. Based on the absorbance value, the IC50 was calculated using the four-parameter regression in GraphPad.
Click to Show/Hide
|
||||
| In Vitro Model | Lung adenocarcinoma | NCI-H1975 cells | CVCL_1511 | ||
References