Linker Information
General Information of This Linker
| Linker ID |
LIN0VMJDS
|
|||||
|---|---|---|---|---|---|---|
| Linker Name |
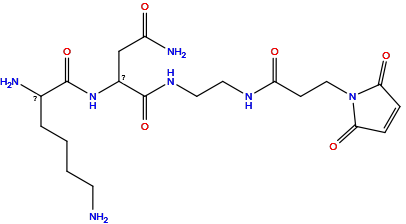
Mal-Asn-D-Lys
|
|||||
| Linker Type |
Cathepsin-cleavable linker
|
|||||
| Antibody-Linker Relation |
Cleavable
|
|||||
| Structure |

|
|||||
| Formula |
C19H31N7O6
|
|||||
| Isosmiles |
NCCCCC(N)C(=O)NC(CC(N)=O)C(=O)NCCNC(=O)CCN1C(=O)C=CC1=O
|
|||||
| InChI |
InChI=1S/C19H31N7O6/c20-7-2-1-3-12(21)18(31)25-13(11-14(22)27)19(32)24-9-8-23-15(28)6-10-26-16(29)4-5-17(26)30/h4-5,12-13H,1-3,6-11,20-21H2,(H2,22,27)(H,23,28)(H,24,32)(H,25,31)
|
|||||
| InChIKey |
XTXHJSHXQXVMEO-UHFFFAOYSA-N
|
|||||
| Pharmaceutical Properties |
Molecule Weight
|
453.5
|
Polar area
|
219.81
|
||
|
Complexity
|
32
|
xlogp Value
|
-3.6496
|
|||
|
Heavy Count
|
32
|
Rot Bonds
|
15
|
|||
|
Hbond acc
|
8
|
Hbond Donor
|
6
|
|||
Each Antibody-drug Conjugate Related to This Linker
Full Information of The Activity Data of The ADC(s) Related to This Linker
1F6-Asn- (D)Lys-AM [Investigative]
Discovered Using Cell Line-derived Xenograft Model
| Experiment 1 Reporting the Activity Date of This ADC | [1] | ||||
| Efficacy Data | Tumor Growth Inhibition value (TGI) |
93.91% (Day 30)
|
Positive TNF expression (TNF+++/++) | ||
| Method Description |
1 mg mAb component/kg in vivo therapeutic efficacy of the conjugates in nude mice(5 animals/group).
|
||||
| In Vivo Model | 786-O human RCC cell line xenograft model | ||||
| In Vitro Model | Renal cell carcinoma | 786-O cells | CVCL_1051 | ||
Revealed Based on the Cell Line Data
| Experiment 1 Reporting the Activity Date of This ADC | [1] | ||||
| Efficacy Data | Half Maximal Inhibitory Concentration (IC50) |
20.00 ng/mL
|
Positive TNF expression (TNF+++/++) | ||
| Method Description |
IC50 values are the mean and SD of 21 independent experimental titrations, each performed at least in duplicate.
|
||||
| In Vitro Model | Renal cell carcinoma | 786-O cells | CVCL_1051 | ||
| Experiment 2 Reporting the Activity Date of This ADC | [1] | ||||
| Efficacy Data | Half Maximal Inhibitory Concentration (IC50) |
20.00 ng/mL
|
Positive TNF expression (TNF+++/++) | ||
| Method Description |
IC50 values are the mean and SD of 21 independent experimental titrations, each performed at least in duplicate.
|
||||
| In Vitro Model | Clear cell renal cell carcinoma | Caki-1 cells | CVCL_0234 | ||
| Experiment 3 Reporting the Activity Date of This ADC | [1] | ||||
| Efficacy Data | Half Maximal Inhibitory Concentration (IC50) |
28.00 ng/mL
|
Positive TNF expression (TNF+++/++) | ||
| Method Description |
IC50 values are the mean and SD of 21 independent experimental titrations, each performed at least in duplicate.
|
||||
| In Vitro Model | Hodgkin lymphoma | L-428 cells | CVCL_1361 | ||
1F6-Asn- (D)Lys-MMAF [Investigative]
Revealed Based on the Cell Line Data
| Experiment 1 Reporting the Activity Date of This ADC | [1] | ||||
| Efficacy Data | Half Maximal Inhibitory Concentration (IC50) |
7.00 ng/mL
|
Positive TNF expression (TNF+++/++) | ||
| Method Description |
IC50 values are the mean and SD of 21 independent experimental titrations, each performed at least in duplicate.
|
||||
| In Vitro Model | Clear cell renal cell carcinoma | Caki-1 cells | CVCL_0234 | ||
| Experiment 2 Reporting the Activity Date of This ADC | [1] | ||||
| Efficacy Data | Half Maximal Inhibitory Concentration (IC50) |
7.00 ng/mL
|
Positive TNF expression (TNF+++/++) | ||
| Method Description |
IC50 values are the mean and SD of 21 independent experimental titrations, each performed at least in duplicate.
|
||||
| In Vitro Model | Hodgkin lymphoma | L-428 cells | CVCL_1361 | ||
| Experiment 3 Reporting the Activity Date of This ADC | [1] | ||||
| Efficacy Data | Half Maximal Inhibitory Concentration (IC50) |
9.00 ng/mL
|
Positive TNF expression (TNF+++/++) | ||
| Method Description |
IC50 values are the mean and SD of 21 independent experimental titrations, each performed at least in duplicate.
|
||||
| In Vitro Model | Renal cell carcinoma | 786-O cells | CVCL_1051 | ||
1F6-Asn- (D)Lys-AW [Investigative]
Revealed Based on the Cell Line Data
| Experiment 1 Reporting the Activity Date of This ADC | [1] | ||||
| Efficacy Data | Half Maximal Inhibitory Concentration (IC50) |
20.00 ng/mL
|
Positive TNF expression (TNF+++/++) | ||
| Method Description |
IC50 values are the mean and SD of 21 independent experimental titrations, each performed at least in duplicate.
|
||||
| In Vitro Model | Renal cell carcinoma | 786-O cells | CVCL_1051 | ||
| Experiment 2 Reporting the Activity Date of This ADC | [1] | ||||
| Efficacy Data | Half Maximal Inhibitory Concentration (IC50) |
22.00 ng/mL
|
Positive TNF expression (TNF+++/++) | ||
| Method Description |
IC50 values are the mean and SD of 21 independent experimental titrations, each performed at least in duplicate.
|
||||
| In Vitro Model | Clear cell renal cell carcinoma | Caki-1 cells | CVCL_0234 | ||
| Experiment 3 Reporting the Activity Date of This ADC | [1] | ||||
| Efficacy Data | Half Maximal Inhibitory Concentration (IC50) | > 1000.00 ng/mL | Positive TNF expression (TNF+++/++) | ||
| Method Description |
IC50 values are the mean and SD of 21 independent experimental titrations, each performed at least in duplicate.
|
||||
| In Vitro Model | Hodgkin lymphoma | L-428 cells | CVCL_1361 | ||
