
Linker Information
General Information of This Linker (ID: LIN0ETPPP)
| Name |
azaNIRII-BCN-PEG4-VAC-PAB
|
|||||
|---|---|---|---|---|---|---|
| Linker Type |
Cathepsin-cleavable linker
|
|||||
| Antibody-Linker Relation |
Cleavable
|
|||||
| Structure |
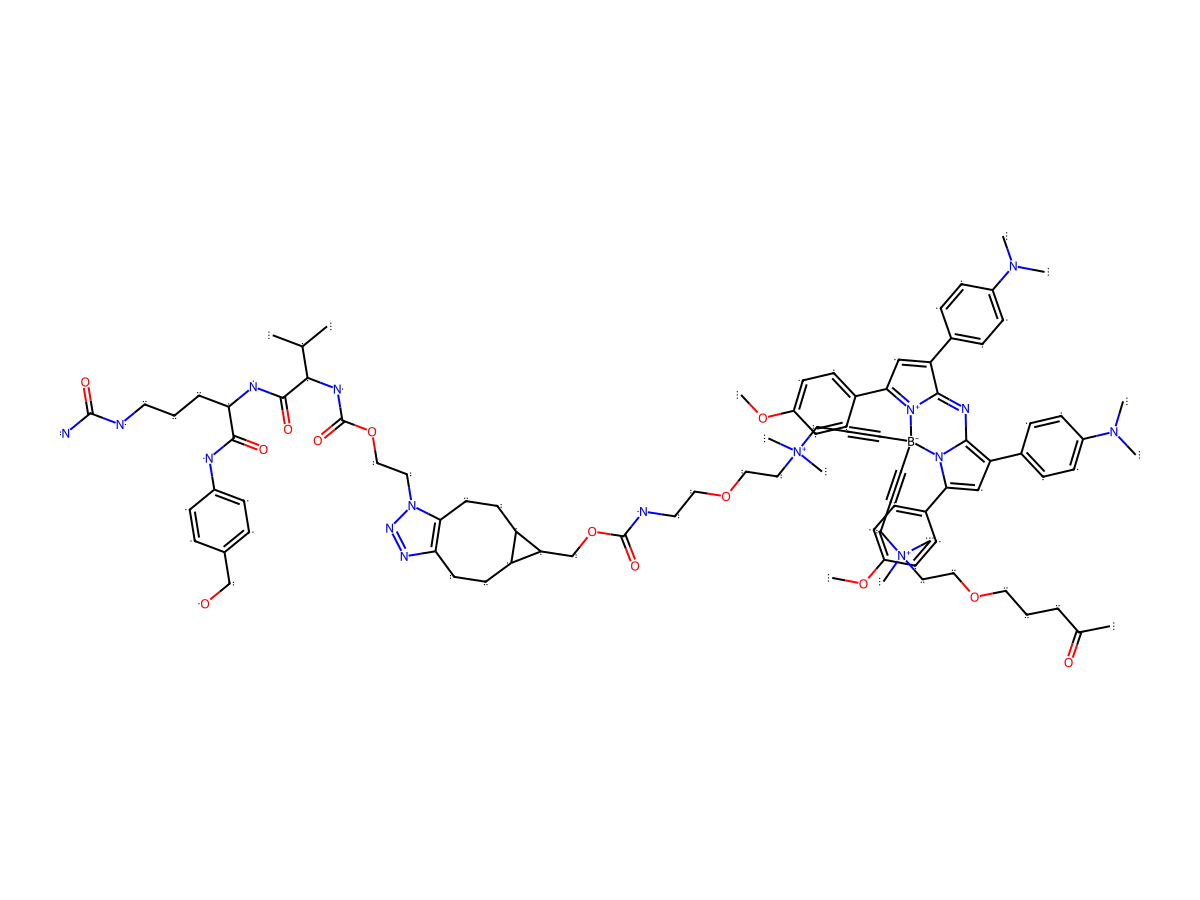
|
|||||
| Formula |
C109H155BN16O22+2
|
|||||
| Isosmiles |
CC(CCCOCCOCCOCCOCC[N+](C)(C)CC#C[B-]1(N2C(N=C3C(C4=CC=C(N(C)C)C=C4)=CC(C5=CC=C(OC)C=C5)=[N+]31)=C(C=C2C6=CC=C(OC)C=C6)C7=CC=C(N(C)C)C=C7)C#CC[N+](C)(CCOCCOCCOCCOCCNC(OCC8C9C8CCC%10=C(N=NN%10CCOCCOCCOCCOC(N[C@H](C(N[C@@H](CCCNC(N)=O)C(NC%11=CC=C(CO)C=C%11)=O)=O)C(C)C)=O)CC9)=O)C)=O
|
|||||
| InChI |
InChI=1S/C109H153BN16O22/c1-80(2)102(106(130)115-98(19-14-46-112-107(111)131)105(129)114-87-30-20-82(78-127)21-31-87)116-109(133)147-75-74-146-73-72-143-65-60-138-55-48-122-99-43-41-93-92(40-42-97(99)118-119-122)96(93)79-148-108(132)113-47-54-137-59-64-142-69-71-145-67-62-140-57-52-126(10,11)50-17-45-110(44-16-49-125(8,9)51-56-139-61-66-144-70-68-141-63-58-136-53-15-18-81(3)128)123-100(85-26-36-90(134-12)37-27-85)76-94(83-22-32-88(33-23-83)120(4)5)103(123)117-104-95(84-24-34-89(35-25-84)121(6)7)77-101(124(104)110)86-28-38-91(135-13)39-29-86/h20-39,76-77,80,92-93,96,98,102,127H,14-15,18-19,40-43,46-75,78-79H2,1-13H3,(H5-2,111,112,113,114,115,116,129,130,131,132,133)/p+2/t92?,93?,96?,98-,102-/m0/s1
|
|||||
| InChIKey |
NQPYNVVMISHJAX-XCNRYTFGSA-P
|
|||||
| Pharmaceutical Properties |
Molecule Weight
|
2052.341
|
Polar area
|
404.76
|
||
|
Complexity
|
.
|
xlogp Value
|
9.268
|
|||
|
Heavy Count
|
148
|
Rot Bonds
|
66
|
|||
|
Hbond acc
|
29
|
Hbond Donor
|
7
|
|||
Each Antibody-drug Conjugate Related to This Linker
Full Information of The Activity Data of The ADC(s) Related to This Linker
Trastu-AzaNIRII-MMAE [Investigative]
Revealed Based on the Cell Line Data
| Experiment 1 Reporting the Activity Date of This ADC | [1] | ||||
| Efficacy Data | Half Maximal inhibitory Concentration (lC50) |
0.1 nM
|
Positive HER2 expression (HER2+++/++) | ||
| Method Description |
According to Vichai et al., (31) experiments were performed in 96-well plates (flat bottom, transparent plate, with lid; Corning-Falcon cat. n° 353072) using a CLARIOstar Plus plate-reader device (BMG LABTECH). Cells were seeded in a 96-well plate at a density of 2 × 10³ cells in 100 uL per well, keeping a column of the plate without cells (background control), and allowed to recover for 24 h. Cells were treated live with 100 uL of various concentrations (final concentrations ranging from 0.003 to 100 nM) of trastuzumab conjugates (diluted in supplemented RPMI for HCC1954 and MDA-MB-231 cell lines and in DMEM for MCF7 cell line) or not (negative control = untreated cells; only supplemented with 100 uL of RPMI for HCC1954 and MDA-MB-231 cell lines or with 100 uL of DMEM for MCF7 cell line) in technical triplicates. Cells were incubated for 96 h at 37 °C and 5% CO2 under a humid atmosphere in an IncuCyteS3 (from Sartorius). Cells were fixed with an addition of 100 uL of cold 10% (w/v) trichloroacetic acid (TCA) to wells for 1 h at 4 °C, washed with tap water (×3), allowed to dry overnight at 25 °C, stained with 0.057% (w/v) SRB (in 1% (v/v) acetic acid) for 30 min at 25 °C, then quickly washed with 1% (v/v) acetic acid (×3) and allowed to dry overnight at 25 °C. After incubating the plate with 100 uL of cold 10 mM unbuffered Trizma base solution for 5 min at 25 °C under agitation, the Abs 530 nm was recorded. Final data were analyzed with Excel (Microsoft Corp.) and GraphPad Prism version 10.1.2 for Windows (GraphPad Software, Boston, Massachusetts USA). Mean Abs values and Normalized % cell viability (see below) were calculated. IC50 was calculated in performing a sigmoidal fit ([inhibitor] vs response-variable slope, GraphPad Prism v10.0.0). A minimum of three independent experiments (n = 3) was used. Normalized % cell viability [x] = [ (Mean Abs 530 nm conjugates [x] - Mean Abs 530 nm background control)/ (Mean Abs 530 nm negative control - Mean Abs 530 nm background control)] × 100; with [x] corresponding to the final conjugate's concentration.
Click to Show/Hide
|
||||
| In Vitro Model | Breast ductal carcinoma | HCC1954 cells | CVCL_1259 | ||
| Experiment 2 Reporting the Activity Date of This ADC | [1] | ||||
| Efficacy Data | Half Maximal inhibitory Concentration (lC50) | > 100 nM | Negative HER2 expression (HER2-) | ||
| Method Description |
According to Vichai et al., (31) experiments were performed in 96-well plates (flat bottom, transparent plate, with lid; Corning-Falcon cat. n° 353072) using a CLARIOstar Plus plate-reader device (BMG LABTECH). Cells were seeded in a 96-well plate at a density of 2 × 10³ cells in 100 uL per well, keeping a column of the plate without cells (background control), and allowed to recover for 24 h. Cells were treated live with 100 uL of various concentrations (final concentrations ranging from 0.003 to 100 nM) of trastuzumab conjugates (diluted in supplemented RPMI for HCC1954 and MDA-MB-231 cell lines and in DMEM for MCF7 cell line) or not (negative control = untreated cells; only supplemented with 100 uL of RPMI for HCC1954 and MDA-MB-231 cell lines or with 100 uL of DMEM for MCF7 cell line) in technical triplicates. Cells were incubated for 96 h at 37 °C and 5% CO2 under a humid atmosphere in an IncuCyteS3 (from Sartorius). Cells were fixed with an addition of 100 uL of cold 10% (w/v) trichloroacetic acid (TCA) to wells for 1 h at 4 °C, washed with tap water (×3), allowed to dry overnight at 25 °C, stained with 0.057% (w/v) SRB (in 1% (v/v) acetic acid) for 30 min at 25 °C, then quickly washed with 1% (v/v) acetic acid (×3) and allowed to dry overnight at 25 °C. After incubating the plate with 100 uL of cold 10 mM unbuffered Trizma base solution for 5 min at 25 °C under agitation, the Abs 530 nm was recorded. Final data were analyzed with Excel (Microsoft Corp.) and GraphPad Prism version 10.1.2 for Windows (GraphPad Software, Boston, Massachusetts USA). Mean Abs values and Normalized % cell viability (see below) were calculated. IC50 was calculated in performing a sigmoidal fit ([inhibitor] vs response-variable slope, GraphPad Prism v10.0.0). A minimum of three independent experiments (n = 3) was used. Normalized % cell viability [x] = [ (Mean Abs 530 nm conjugates [x] - Mean Abs 530 nm background control)/ (Mean Abs 530 nm negative control - Mean Abs 530 nm background control)] × 100; with [x] corresponding to the final conjugate's concentration.
Click to Show/Hide
|
||||
| In Vitro Model | Invasive breast carcinoma | MCF-7 cells | CVCL_0031 | ||
| Experiment 3 Reporting the Activity Date of This ADC | [1] | ||||
| Efficacy Data | Half Maximal inhibitory Concentration (lC50) | > 100 nM | Negative HER2 expression (HER2-) | ||
| Method Description |
According to Vichai et al., (31) experiments were performed in 96-well plates (flat bottom, transparent plate, with lid; Corning-Falcon cat. n° 353072) using a CLARIOstar Plus plate-reader device (BMG LABTECH). Cells were seeded in a 96-well plate at a density of 2 × 10³ cells in 100 uL per well, keeping a column of the plate without cells (background control), and allowed to recover for 24 h. Cells were treated live with 100 uL of various concentrations (final concentrations ranging from 0.003 to 100 nM) of trastuzumab conjugates (diluted in supplemented RPMI for HCC1954 and MDA-MB-231 cell lines and in DMEM for MCF7 cell line) or not (negative control = untreated cells; only supplemented with 100 uL of RPMI for HCC1954 and MDA-MB-231 cell lines or with 100 uL of DMEM for MCF7 cell line) in technical triplicates. Cells were incubated for 96 h at 37 °C and 5% CO2 under a humid atmosphere in an IncuCyteS3 (from Sartorius). Cells were fixed with an addition of 100 uL of cold 10% (w/v) trichloroacetic acid (TCA) to wells for 1 h at 4 °C, washed with tap water (×3), allowed to dry overnight at 25 °C, stained with 0.057% (w/v) SRB (in 1% (v/v) acetic acid) for 30 min at 25 °C, then quickly washed with 1% (v/v) acetic acid (×3) and allowed to dry overnight at 25 °C. After incubating the plate with 100 uL of cold 10 mM unbuffered Trizma base solution for 5 min at 25 °C under agitation, the Abs 530 nm was recorded. Final data were analyzed with Excel (Microsoft Corp.) and GraphPad Prism version 10.1.2 for Windows (GraphPad Software, Boston, Massachusetts USA). Mean Abs values and Normalized % cell viability (see below) were calculated. IC50 was calculated in performing a sigmoidal fit ([inhibitor] vs response-variable slope, GraphPad Prism v10.0.0). A minimum of three independent experiments (n = 3) was used. Normalized % cell viability [x] = [ (Mean Abs 530 nm conjugates [x] - Mean Abs 530 nm background control)/ (Mean Abs 530 nm negative control - Mean Abs 530 nm background control)] × 100; with [x] corresponding to the final conjugate's concentration.
Click to Show/Hide
|
||||
| In Vitro Model | Breast adenocarcinoma | MDA-MB-231 cells | CVCL_0062 | ||
References