
Linker Information
General Information of This Linker (ID: LIN0CCVXL)
| Name |
CN119343152A 1C1-Example4 Linker
|
|||||
|---|---|---|---|---|---|---|
| Linker Type |
Cathepsin-cleavable linker
|
|||||
| Antibody-Linker Relation |
Cleavable
|
|||||
| Structure |
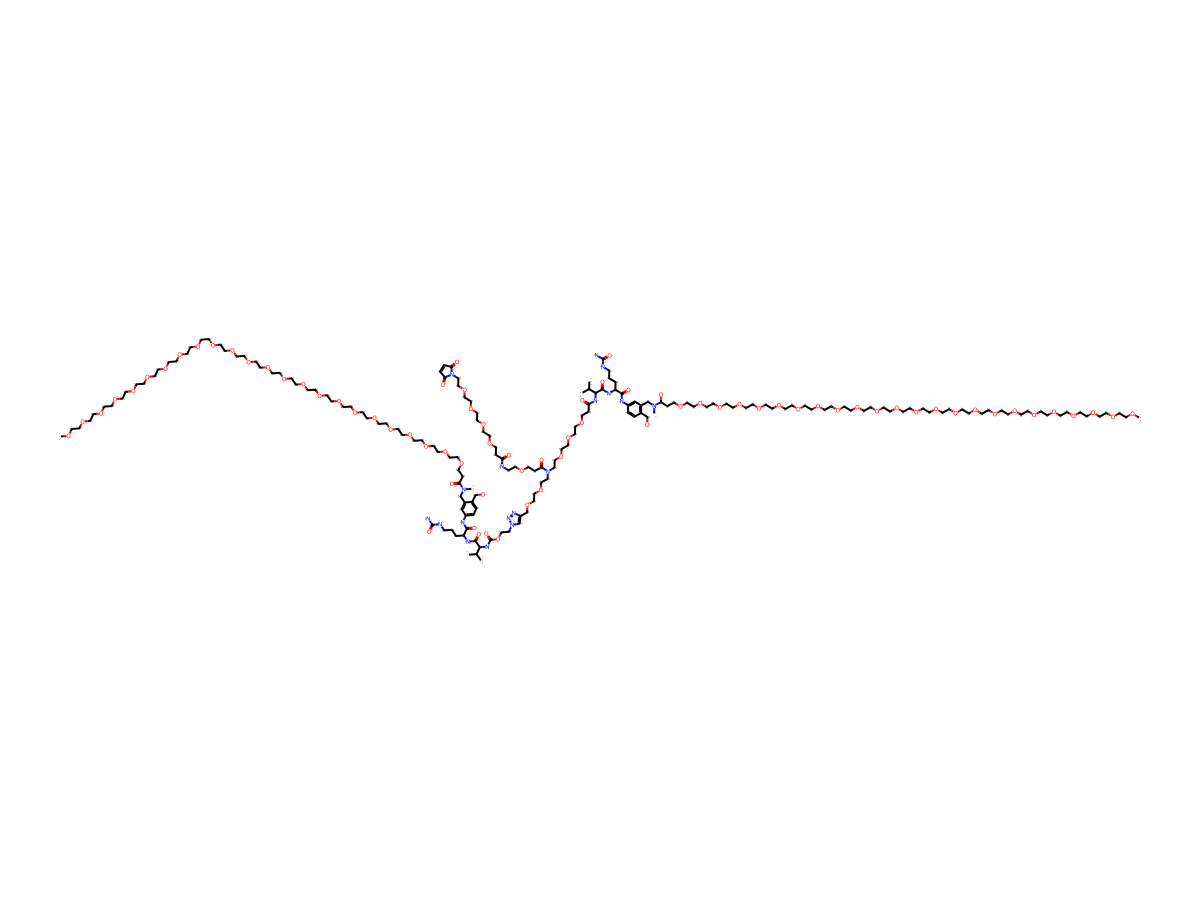
|
|||||
| Formula |
C179H326N18O75
|
|||||
| Isosmiles |
CN(CC1=CC(NC([C@@H](NC([C@@H](NC(OCCN(N=N2)C=C2COCCOCCN(CCOCCOCCOCCC(N[C@H](C(N[C@@H](CCCNC(N)=O)C(NC3=CC(CN(C)C(O)CCOCCOCCOCCOCCOCCOCCOCCOCCOCCOCCOCCOCCOCCOCCOCCOCCOCCOCCOCCOCCOCCOCCOCCOC)=C(CO)C=C3)=O)=O)C(C)C)=O)C(CCOCCNC(CCOCCOCCOCCOCCN4C(C=CC4=O)=O)=O)=O)=O)C(C)C)=O)CCCNC(N)=O)=O)=CC=C1CO)C(CCOCCOCCOCCOCCOCCOCCOCCOCCOCCOCCOCCOCCOCCOCCOCCOCCOCCOCCOCCOCCOCCOCCOCCOC)=O
|
|||||
| InChI |
InChI=1S/C179H326N18O75/c1-153(2)171(175(209)187-162(11-9-24-183-177(180)211)173(207)185-159-15-13-155(150-198)157(145-159)147-193(5)166(202)21-33-219-47-53-228-62-65-233-71-73-237-79-81-241-87-89-245-95-97-249-103-105-253-111-113-257-119-121-261-127-129-265-135-137-269-141-139-267-133-131-263-125-123-259-117-115-255-109-107-251-101-99-247-93-91-243-85-83-239-77-75-235-69-67-231-59-57-224-43-41-214-7)189-165(201)20-32-218-46-52-226-55-49-221-37-27-195(168(204)23-35-216-36-26-182-164(200)19-31-217-45-51-227-61-64-230-56-50-223-39-30-197-169(205)17-18-170(197)206)28-38-222-143-144-271-152-161-149-196(192-191-161)29-40-272-179(213)190-172(154(3)4)176(210)188-163(12-10-25-184-178(181)212)174(208)186-160-16-14-156(151-199)158(146-160)148-194(6)167(203)22-34-220-48-54-229-63-66-234-72-74-238-80-82-242-88-90-246-96-98-250-104-106-254-112-114-258-120-122-262-128-130-266-136-138-270-142-140-268-134-132-264-126-124-260-118-116-256-110-108-252-102-100-248-94-92-244-86-84-240-78-76-236-70-68-232-60-58-225-44-42-215-8/h13-18,145-146,149,153-154,162-163,166,171-172,198-199,202H,9-12,19-144,147-148,150-152H2,1-8H3,(H,182,200)(H,185,207)(H,186,208)(H,187,209)(H,188,210)(H,189,201)(H,190,213)(H3,180,183,211)(H3,181,184,212)/t162-,163-,166?,171-,172-/m0/s1
|
|||||
| InChIKey |
DSNPPIWOIVHRHD-FVQGPQSOSA-N
|
|||||
| Pharmaceutical Properties |
Molecule Weight
|
3930.628
|
Polar area
|
1031.15
|
||
|
Complexity
|
.
|
xlogp Value
|
-0.4504
|
|||
|
Heavy Count
|
272
|
Rot Bonds
|
215
|
|||
|
Hbond acc
|
79
|
Hbond Donor
|
14
|
|||
Each Antibody-drug Conjugate Related to This Linker
Full Information of The Activity Data of The ADC(s) Related to This Linker
Trastuzumab-Example 4 [Investigative]
Revealed Based on the Cell Line Data
| Experiment 1 Reporting the Activity Date of This ADC | [1] | ||||
| Efficacy Data | Half Maximal inhibitory Concentration (lC50) |
0.057 nM
|
High HER2 expression (HER2 +++) | ||
| Method Description |
Cultivate the cell line in a tissue culture incubator at 5% CO2 and 37 °C in the optimal growth medium. Separate cells at least 2 days prior to inoculation for proliferation assays to ensure optimal growth density. On the day of vaccination, cell viability and cell density were determined using a cell counter (Vi Cell XR Cell viability analyzer, Beckman Coulter). Inoculate cells with vitality above 85% into a 384 well TC treated plate (Corning catalog number 3765) with a white transparent bottom. Inoculate cells at a density of 1000 cells per well into 45 u L of standard growth medium. Incubate the plate overnight in a tissue culture incubator at 5% CO2 and 37 °C. On the second day, prepare free atorvastatin payload and targeted ADC at a 10 fold ratio in standard growth medium. Add the prepared treatment substance to the cells to obtain a final concentration of 0.005-100nM and a final volume of 50 u L/well. Each drug concentration is tested in quadruplicate. Incubate the plates in a tissue culture incubator at 5% CO2 and 37 °C for 5 days, and then evaluate cell viability by adding 25 u L of CellTiterGlo (Promega, catalog number G7573) (a reagent for cell lysis and measurement of total adenosine triphosphate (ATP) content). Incubate the plate at room temperature for 10 minutes to stabilize the luminescence signal, and then read using a luminescence reader (EnVision multi label enzyme-linked immunosorbent assay, PerkinElmer). To evaluate the effectiveness of drug treatment, luminescence counts from wells containing untreated cells (100% viability) were used to normalize the treated samples. Apply a variable slope model to fit the nonlinear regression curve to the data in GraphPad PRISM version 7.02 software. Extrapolating IC50 from the obtained curve
Click to Show/Hide
|
||||
| In Vitro Model | Gastric tubular adenocarcinoma | NCI-N87 cells | CVCL_1603 | ||
CN119343152A 1C1-Example 4 [Investigative]
Revealed Based on the Cell Line Data
| Experiment 1 Reporting the Activity Date of This ADC | [1] | ||||
| Efficacy Data | Half Maximal inhibitory Concentration (lC50) |
0.146 nM
|
High EPH2 expression (EPH2 +++) | ||
| Method Description |
Cultivate the cell line in a tissue culture incubator at 5% CO2 and 37 °C in the optimal growth medium. Separate cells at least 2 days prior to inoculation for proliferation assays to ensure optimal growth density. On the day of vaccination, cell viability and cell density were determined using a cell counter (Vi Cell XR Cell viability analyzer, Beckman Coulter). Inoculate cells with vitality above 85% into a 384 well TC treated plate (Corning catalog number 3765) with a white transparent bottom. Inoculate cells at a density of 1000 cells per well into 45 u L of standard growth medium. Incubate the plate overnight in a tissue culture incubator at 5% CO2 and 37 °C. On the second day, prepare free atorvastatin payload and targeted ADC at a 10 fold ratio in standard growth medium. Add the prepared treatment substance to the cells to obtain a final concentration of 0.005-100nM and a final volume of 50 u L/well. Each drug concentration is tested in quadruplicate. Incubate the plates in a tissue culture incubator at 5% CO2 and 37 °C for 5 days, and then evaluate cell viability by adding 25 u L of CellTiterGlo (Promega, catalog number G7573) (a reagent for cell lysis and measurement of total adenosine triphosphate (ATP) content). Incubate the plate at room temperature for 10 minutes to stabilize the luminescence signal, and then read using a luminescence reader (EnVision multi label enzyme-linked immunosorbent assay, PerkinElmer). To evaluate the effectiveness of drug treatment, luminescence counts from wells containing untreated cells (100% viability) were used to normalize the treated samples. Apply a variable slope model to fit the nonlinear regression curve to the data in GraphPad PRISM version 7.02 software. Extrapolating IC50 from the obtained curve
Click to Show/Hide
|
||||
| In Vitro Model | Lung squamous cell carcinoma | EBC1 cells | CVCL_2891 | ||
| Experiment 2 Reporting the Activity Date of This ADC | [1] | ||||
| Efficacy Data | Half Maximal inhibitory Concentration (lC50) |
0.166 nM
|
High EPH2 expression (EPH2 +++) | ||
| Method Description |
Cultivate the cell line in a tissue culture incubator at 5% CO2 and 37 °C in the optimal growth medium. Separate cells at least 2 days prior to inoculation for proliferation assays to ensure optimal growth density. On the day of vaccination, cell viability and cell density were determined using a cell counter (Vi Cell XR Cell viability analyzer, Beckman Coulter). Inoculate cells with vitality above 85% into a 384 well TC treated plate (Corning catalog number 3765) with a white transparent bottom. Inoculate cells at a density of 1000 cells per well into 45 u L of standard growth medium. Incubate the plate overnight in a tissue culture incubator at 5% CO2 and 37 °C. On the second day, prepare free atorvastatin payload and targeted ADC at a 10 fold ratio in standard growth medium. Add the prepared treatment substance to the cells to obtain a final concentration of 0.005-100nM and a final volume of 50 u L/well. Each drug concentration is tested in quadruplicate. Incubate the plates in a tissue culture incubator at 5% CO2 and 37 °C for 5 days, and then evaluate cell viability by adding 25 u L of CellTiterGlo (Promega, catalog number G7573) (a reagent for cell lysis and measurement of total adenosine triphosphate (ATP) content). Incubate the plate at room temperature for 10 minutes to stabilize the luminescence signal, and then read using a luminescence reader (EnVision multi label enzyme-linked immunosorbent assay, PerkinElmer). To evaluate the effectiveness of drug treatment, luminescence counts from wells containing untreated cells (100% viability) were used to normalize the treated samples. Apply a variable slope model to fit the nonlinear regression curve to the data in GraphPad PRISM version 7.02 software. Extrapolating IC50 from the obtained curve
Click to Show/Hide
|
||||
| In Vitro Model | Colon adenocarcinoma | SKCO1 cells | CVCL_0626 | ||
| Experiment 3 Reporting the Activity Date of This ADC | [1] | ||||
| Efficacy Data | Half Maximal inhibitory Concentration (lC50) |
1.73 nM
|
High EPH2 expression (EPH2 +++) | ||
| Method Description |
Cultivate the cell line in a tissue culture incubator at 5% CO2 and 37 °C in the optimal growth medium. Separate cells at least 2 days prior to inoculation for proliferation assays to ensure optimal growth density. On the day of vaccination, cell viability and cell density were determined using a cell counter (Vi Cell XR Cell viability analyzer, Beckman Coulter). Inoculate cells with vitality above 85% into a 384 well TC treated plate (Corning catalog number 3765) with a white transparent bottom. Inoculate cells at a density of 1000 cells per well into 45 u L of standard growth medium. Incubate the plate overnight in a tissue culture incubator at 5% CO2 and 37 °C. On the second day, prepare free atorvastatin payload and targeted ADC at a 10 fold ratio in standard growth medium. Add the prepared treatment substance to the cells to obtain a final concentration of 0.005-100nM and a final volume of 50 u L/well. Each drug concentration is tested in quadruplicate. Incubate the plates in a tissue culture incubator at 5% CO2 and 37 °C for 5 days, and then evaluate cell viability by adding 25 u L of CellTiterGlo (Promega, catalog number G7573) (a reagent for cell lysis and measurement of total adenosine triphosphate (ATP) content). Incubate the plate at room temperature for 10 minutes to stabilize the luminescence signal, and then read using a luminescence reader (EnVision multi label enzyme-linked immunosorbent assay, PerkinElmer). To evaluate the effectiveness of drug treatment, luminescence counts from wells containing untreated cells (100% viability) were used to normalize the treated samples. Apply a variable slope model to fit the nonlinear regression curve to the data in GraphPad PRISM version 7.02 software. Extrapolating IC50 from the obtained curve
Click to Show/Hide
|
||||
| In Vitro Model | Gastric signet ring cell adenocarcinoma | OCUM1 cells | CVCL_3084 | ||
NOV169N31Q-Example 4 [Investigative]
Revealed Based on the Cell Line Data
| Experiment 1 Reporting the Activity Date of This ADC | [1] | ||||
| Efficacy Data | Half Maximal inhibitory Concentration (lC50) |
0.685 nM
|
High pCAD expression (pCAD +++) | ||
| Method Description |
Cultivate the cell line in a tissue culture incubator at 5% CO2 and 37 °C in the optimal growth medium. Separate cells at least 2 days prior to inoculation for proliferation assays to ensure optimal growth density. On the day of vaccination, cell viability and cell density were determined using a cell counter (Vi Cell XR Cell viability analyzer, Beckman Coulter). Inoculate cells with vitality above 85% into a 384 well TC treated plate (Corning catalog number 3765) with a white transparent bottom. Inoculate cells at a density of 1000 cells per well into 45 u L of standard growth medium. Incubate the plate overnight in a tissue culture incubator at 5% CO2 and 37 °C. On the second day, prepare free atorvastatin payload and targeted ADC at a 10 fold ratio in standard growth medium. Add the prepared treatment substance to the cells to obtain a final concentration of 0.005-100nM and a final volume of 50 u L/well. Each drug concentration is tested in quadruplicate. Incubate the plates in a tissue culture incubator at 5% CO2 and 37 °C for 5 days, and then evaluate cell viability by adding 25 u L of CellTiterGlo (Promega, catalog number G7573) (a reagent for cell lysis and measurement of total adenosine triphosphate (ATP) content). Incubate the plate at room temperature for 10 minutes to stabilize the luminescence signal, and then read using a luminescence reader (EnVision multi label enzyme-linked immunosorbent assay, PerkinElmer). To evaluate the effectiveness of drug treatment, luminescence counts from wells containing untreated cells (100% viability) were used to normalize the treated samples. Apply a variable slope model to fit the nonlinear regression curve to the data in GraphPad PRISM version 7.02 software. Extrapolating IC50 from the obtained curve
Click to Show/Hide
|
||||
| In Vitro Model | Squamous cell carcinoma of the oral tongue, Tongue squamous cell carcinoma | BICR22 cells | CVCL_2310 | ||