Tissue specific Abundances of This Antigen
ICD Disease Classification 01
Click to Show/Hide the 1 Disease of This Class
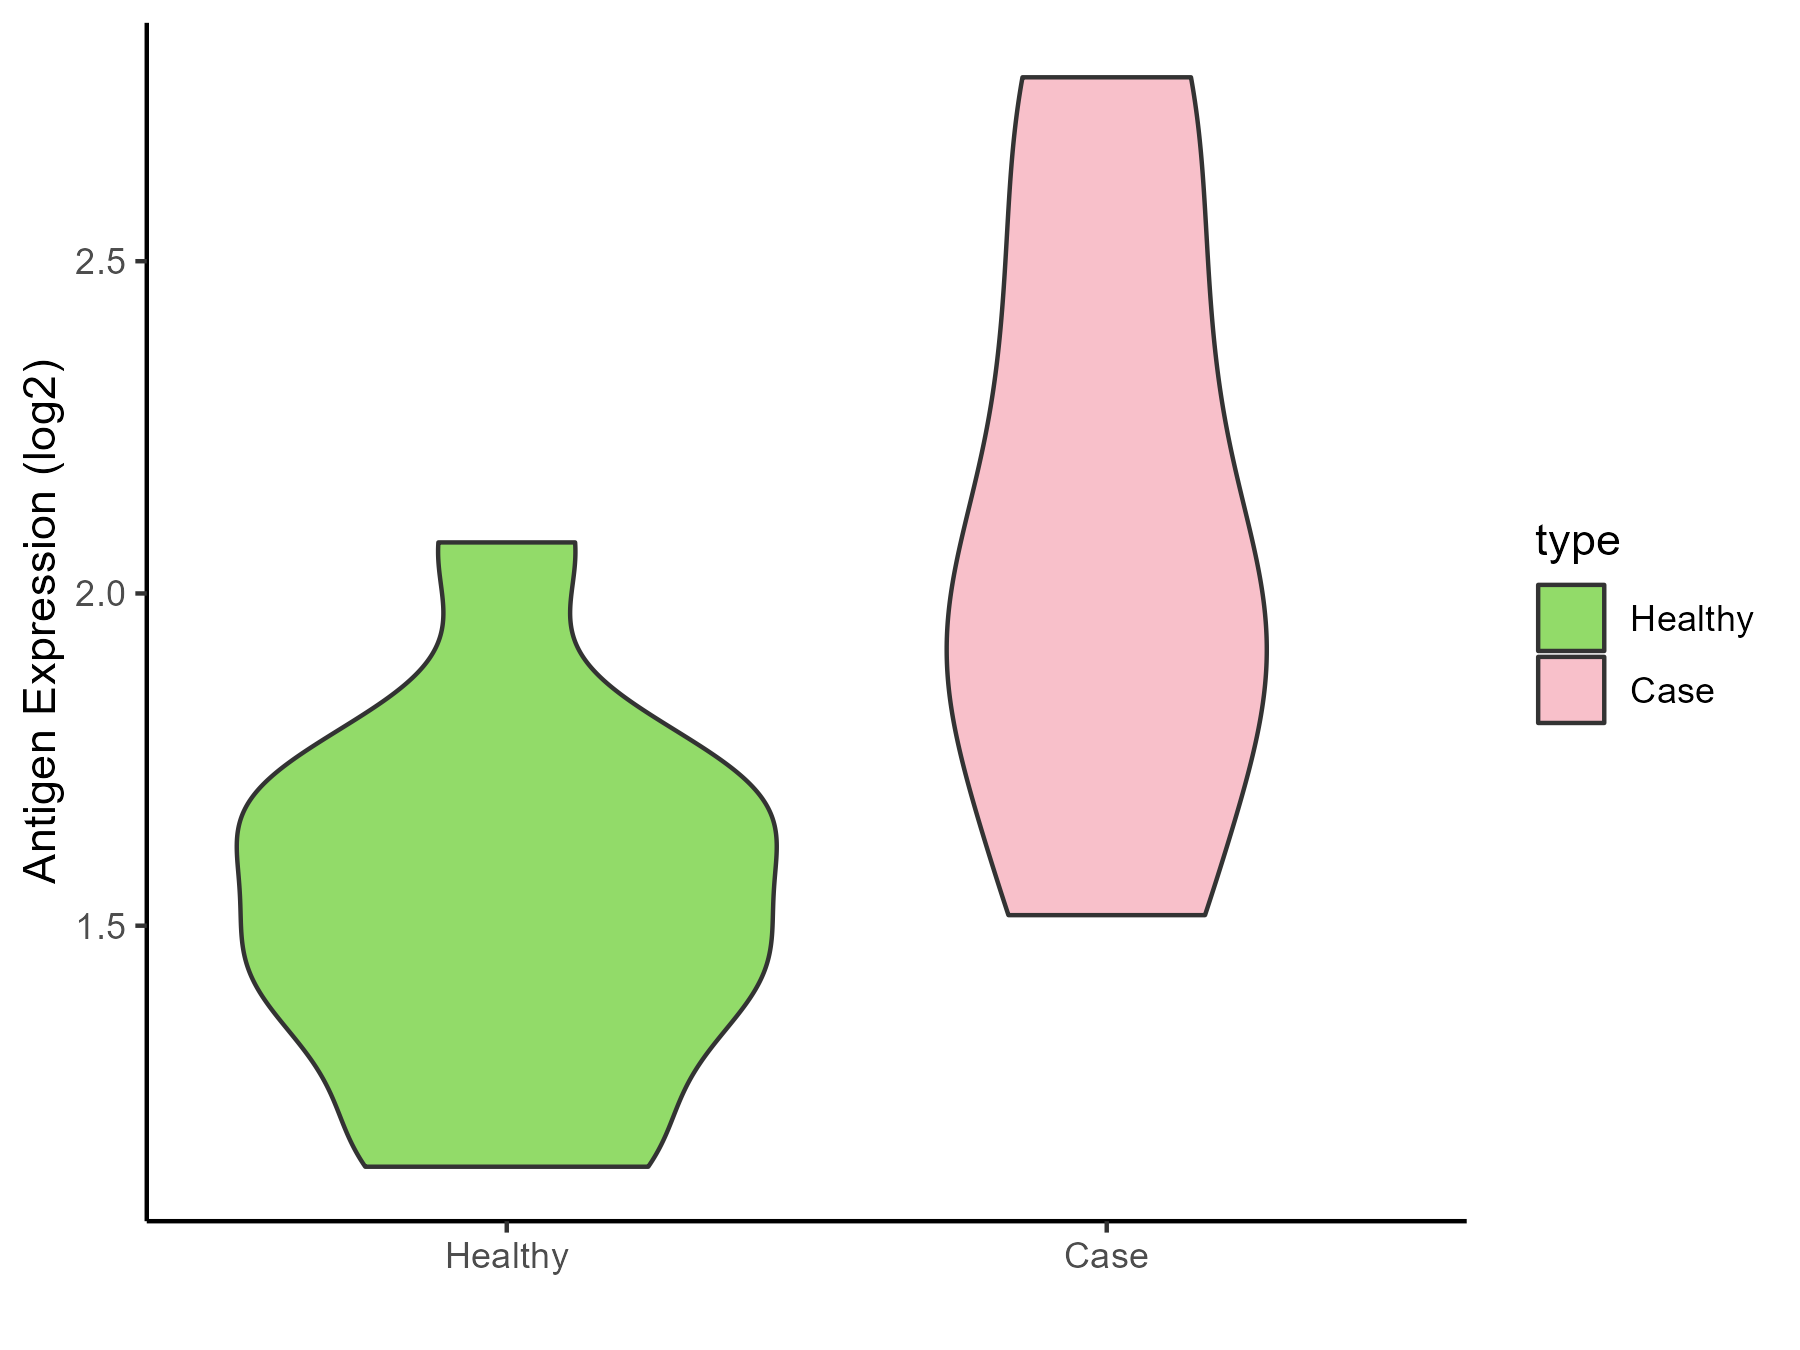
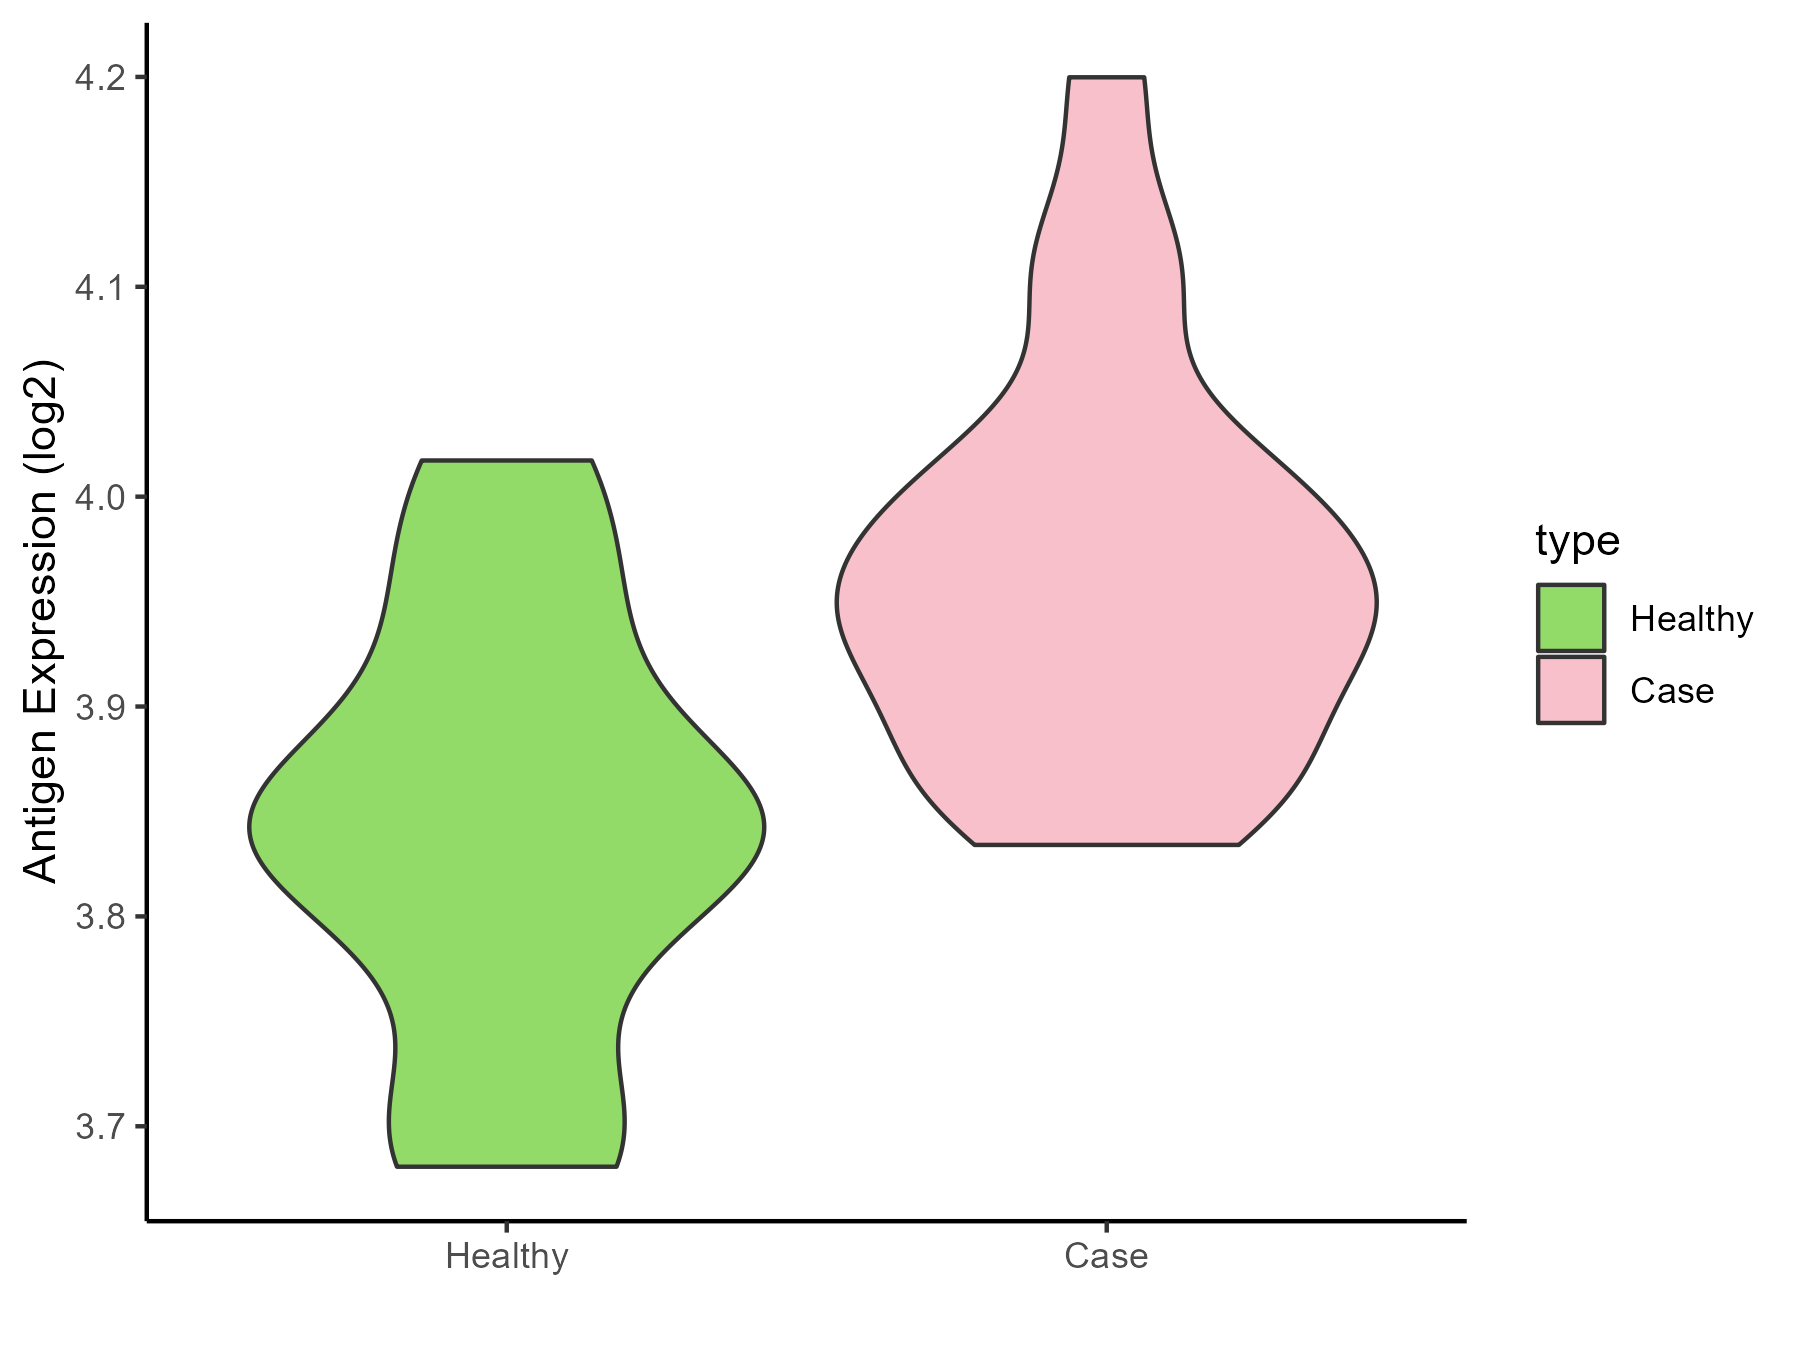
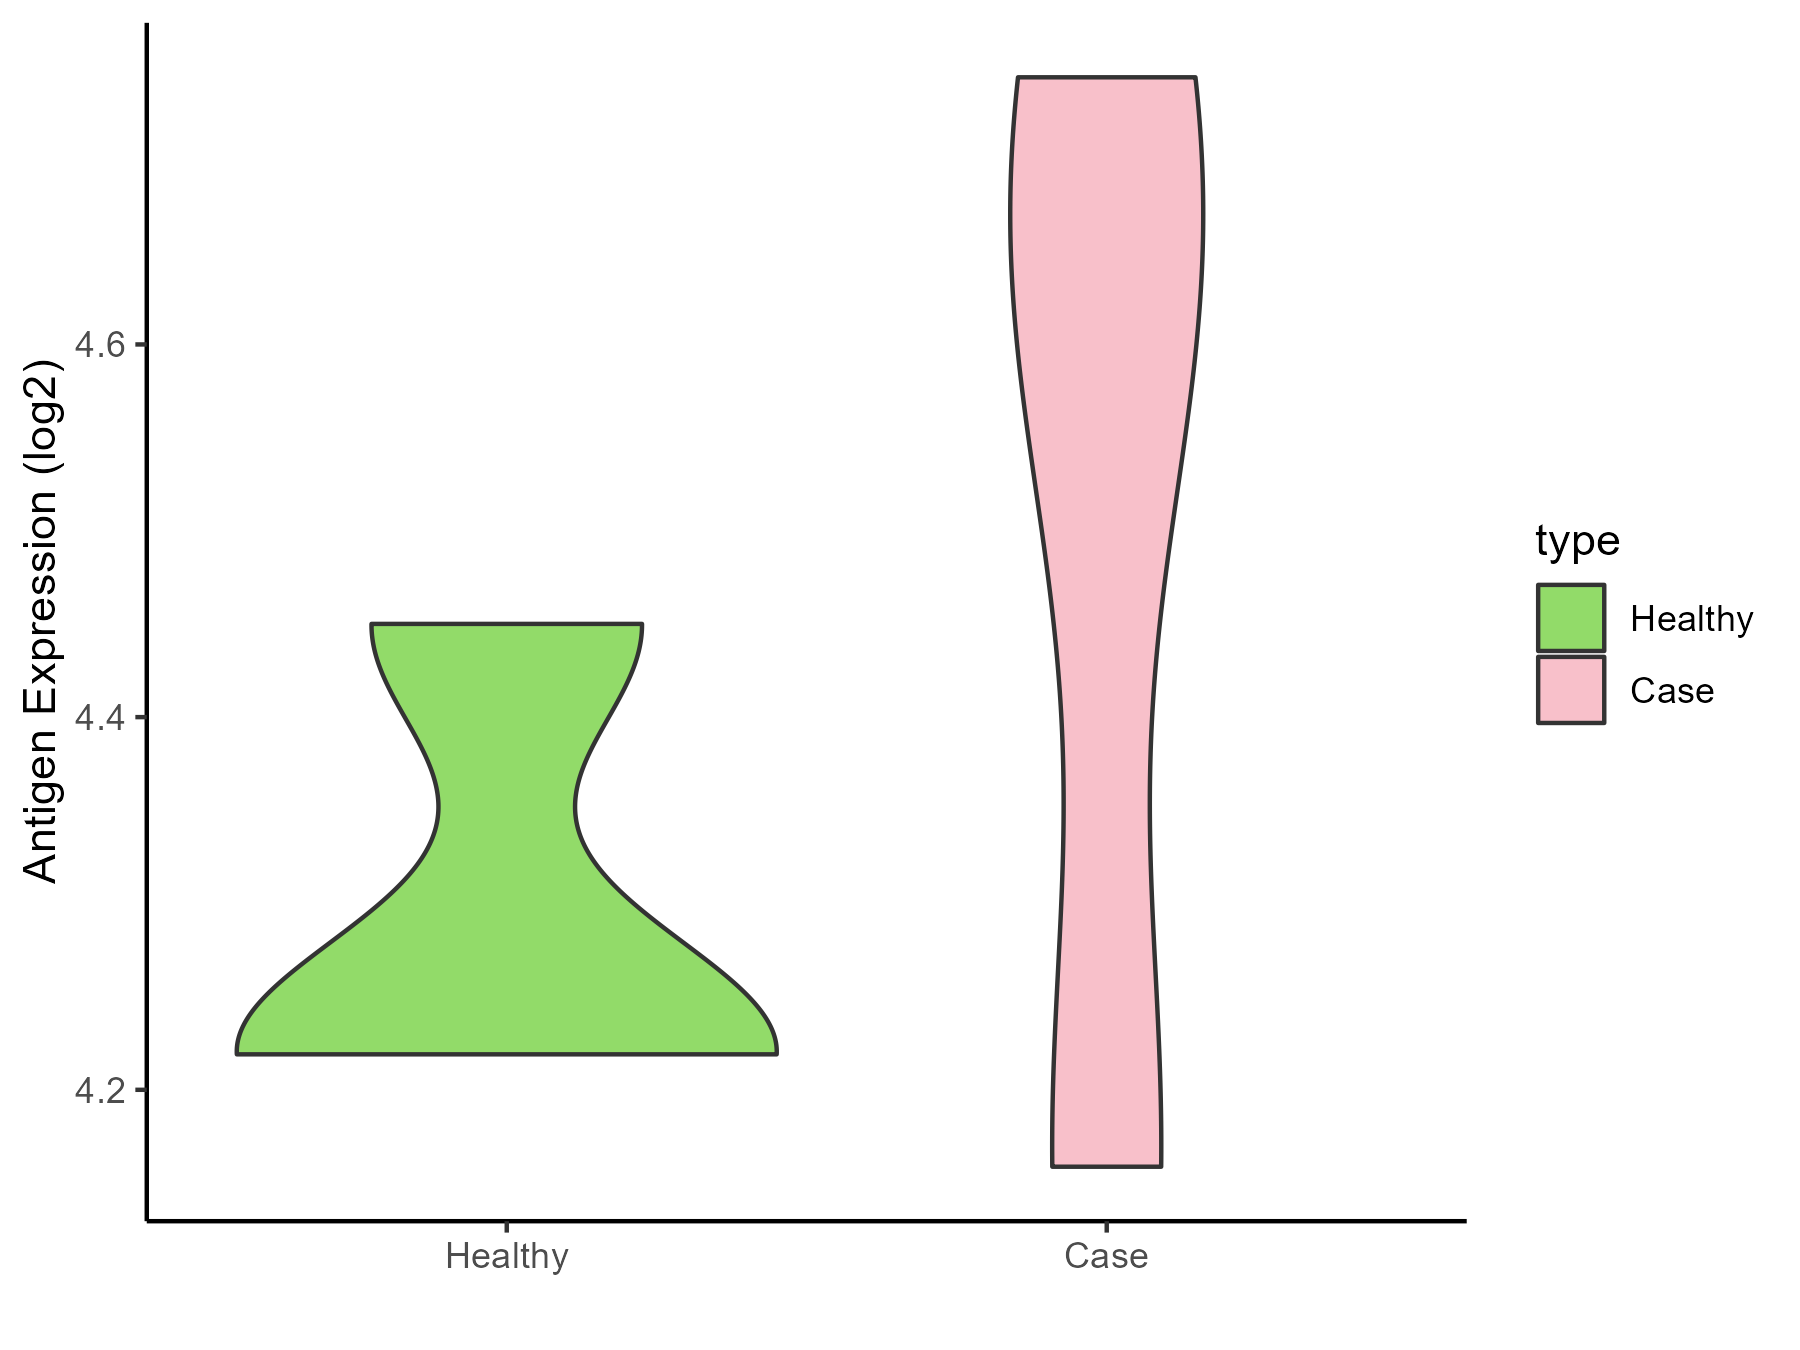
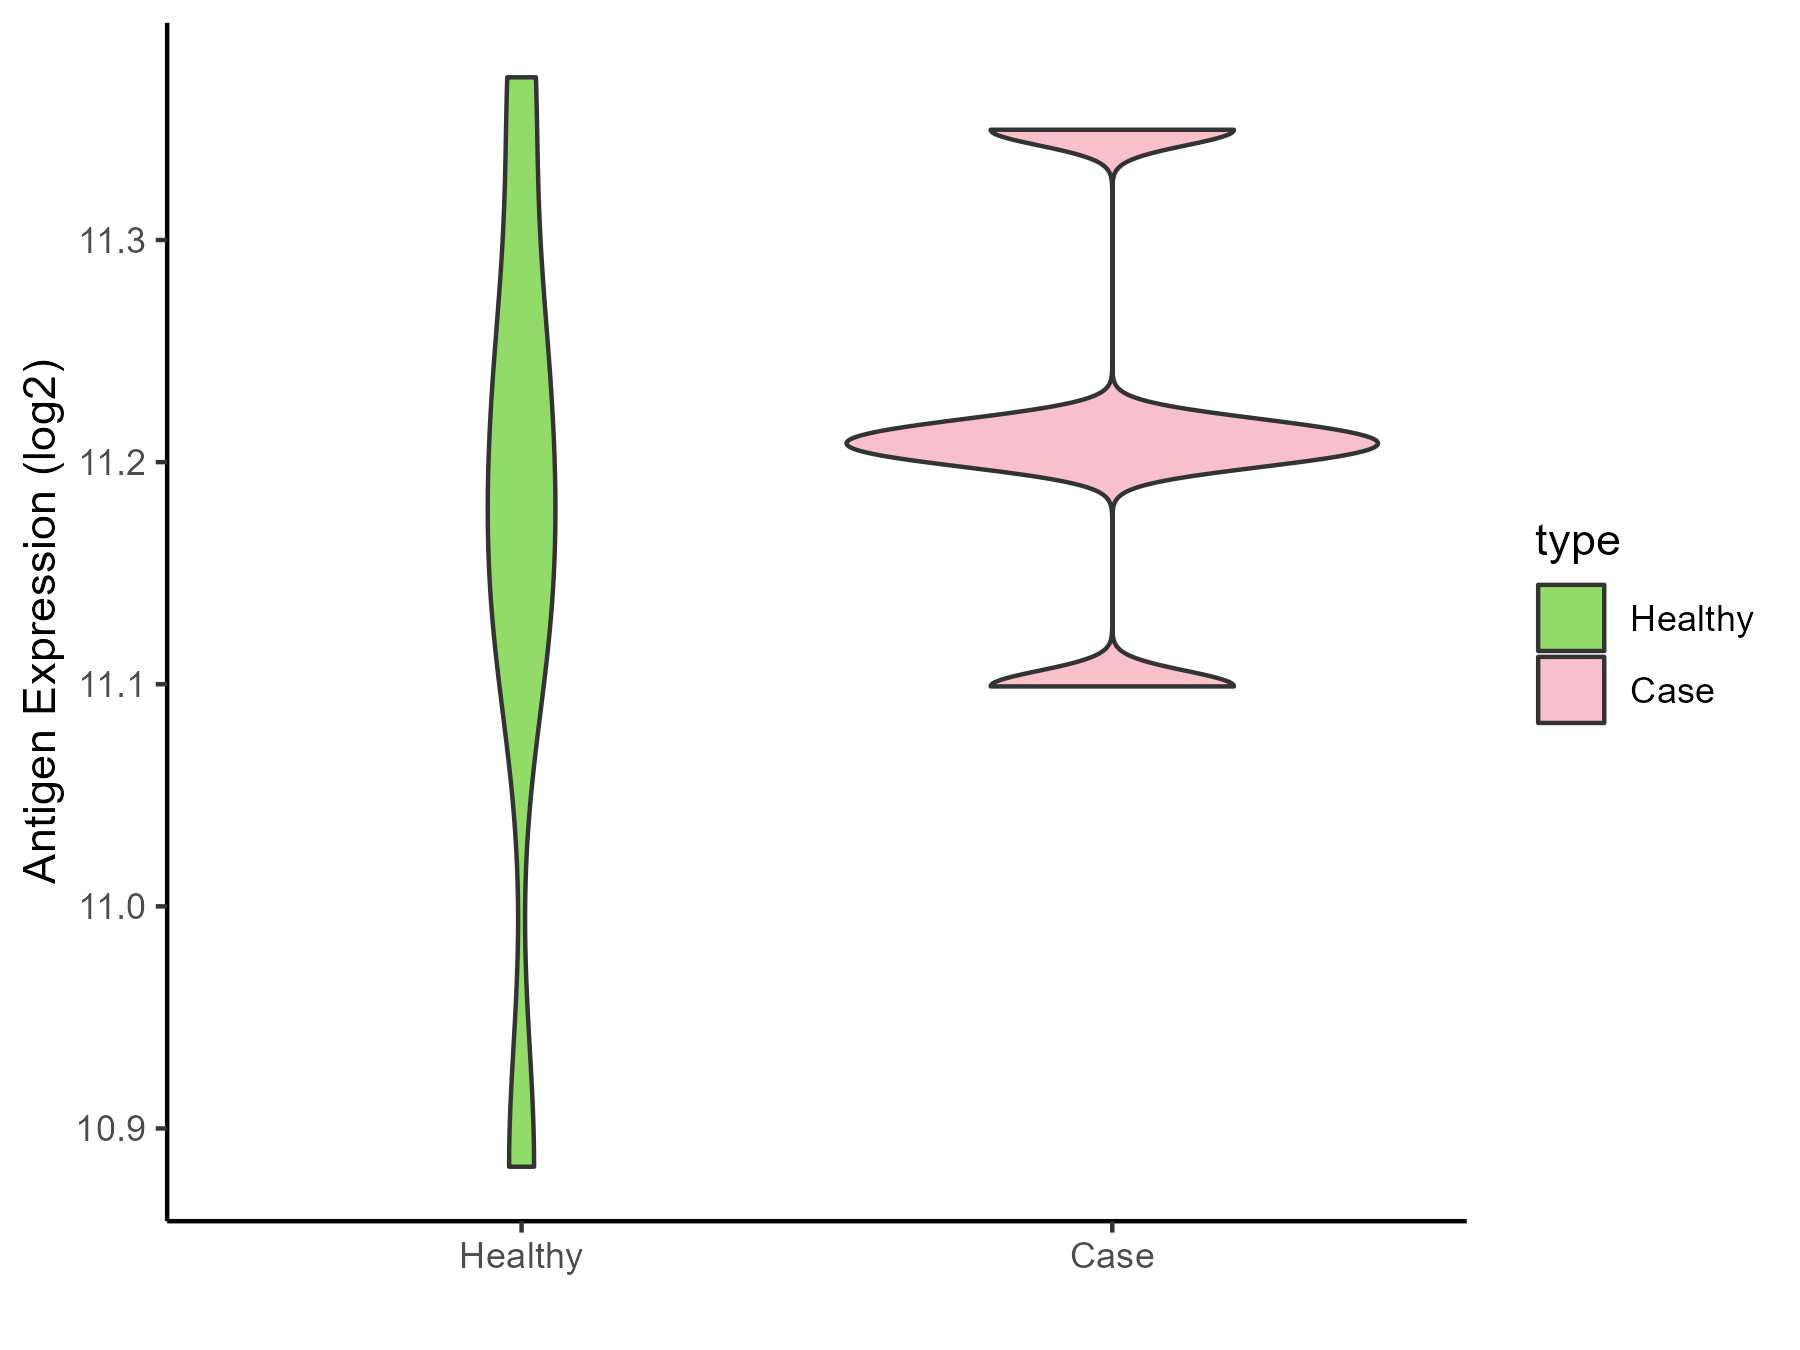
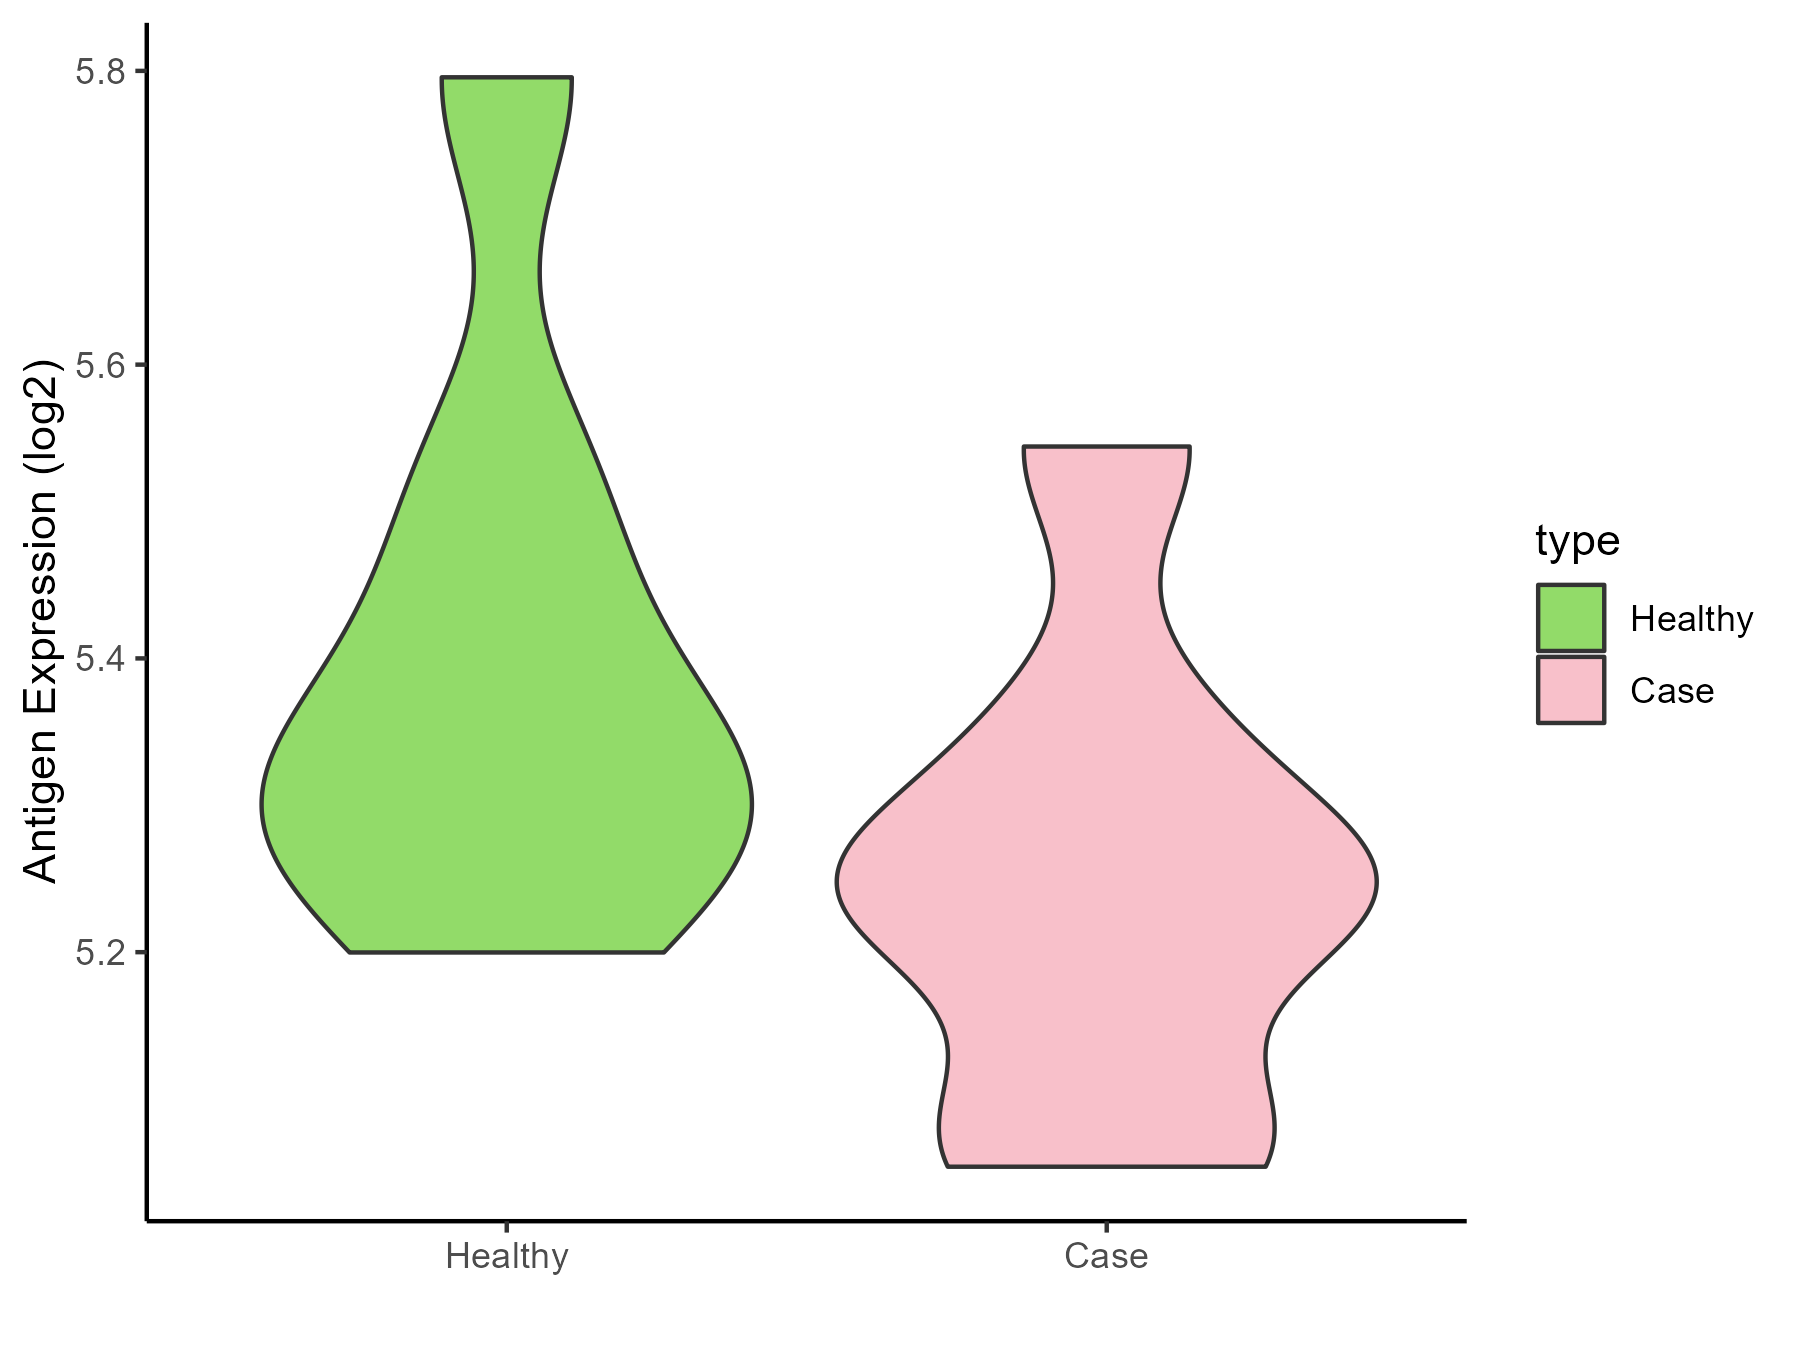
 Bacterial infection [ICD-11: 1A00-1C4Z]
Click to Show/Hide
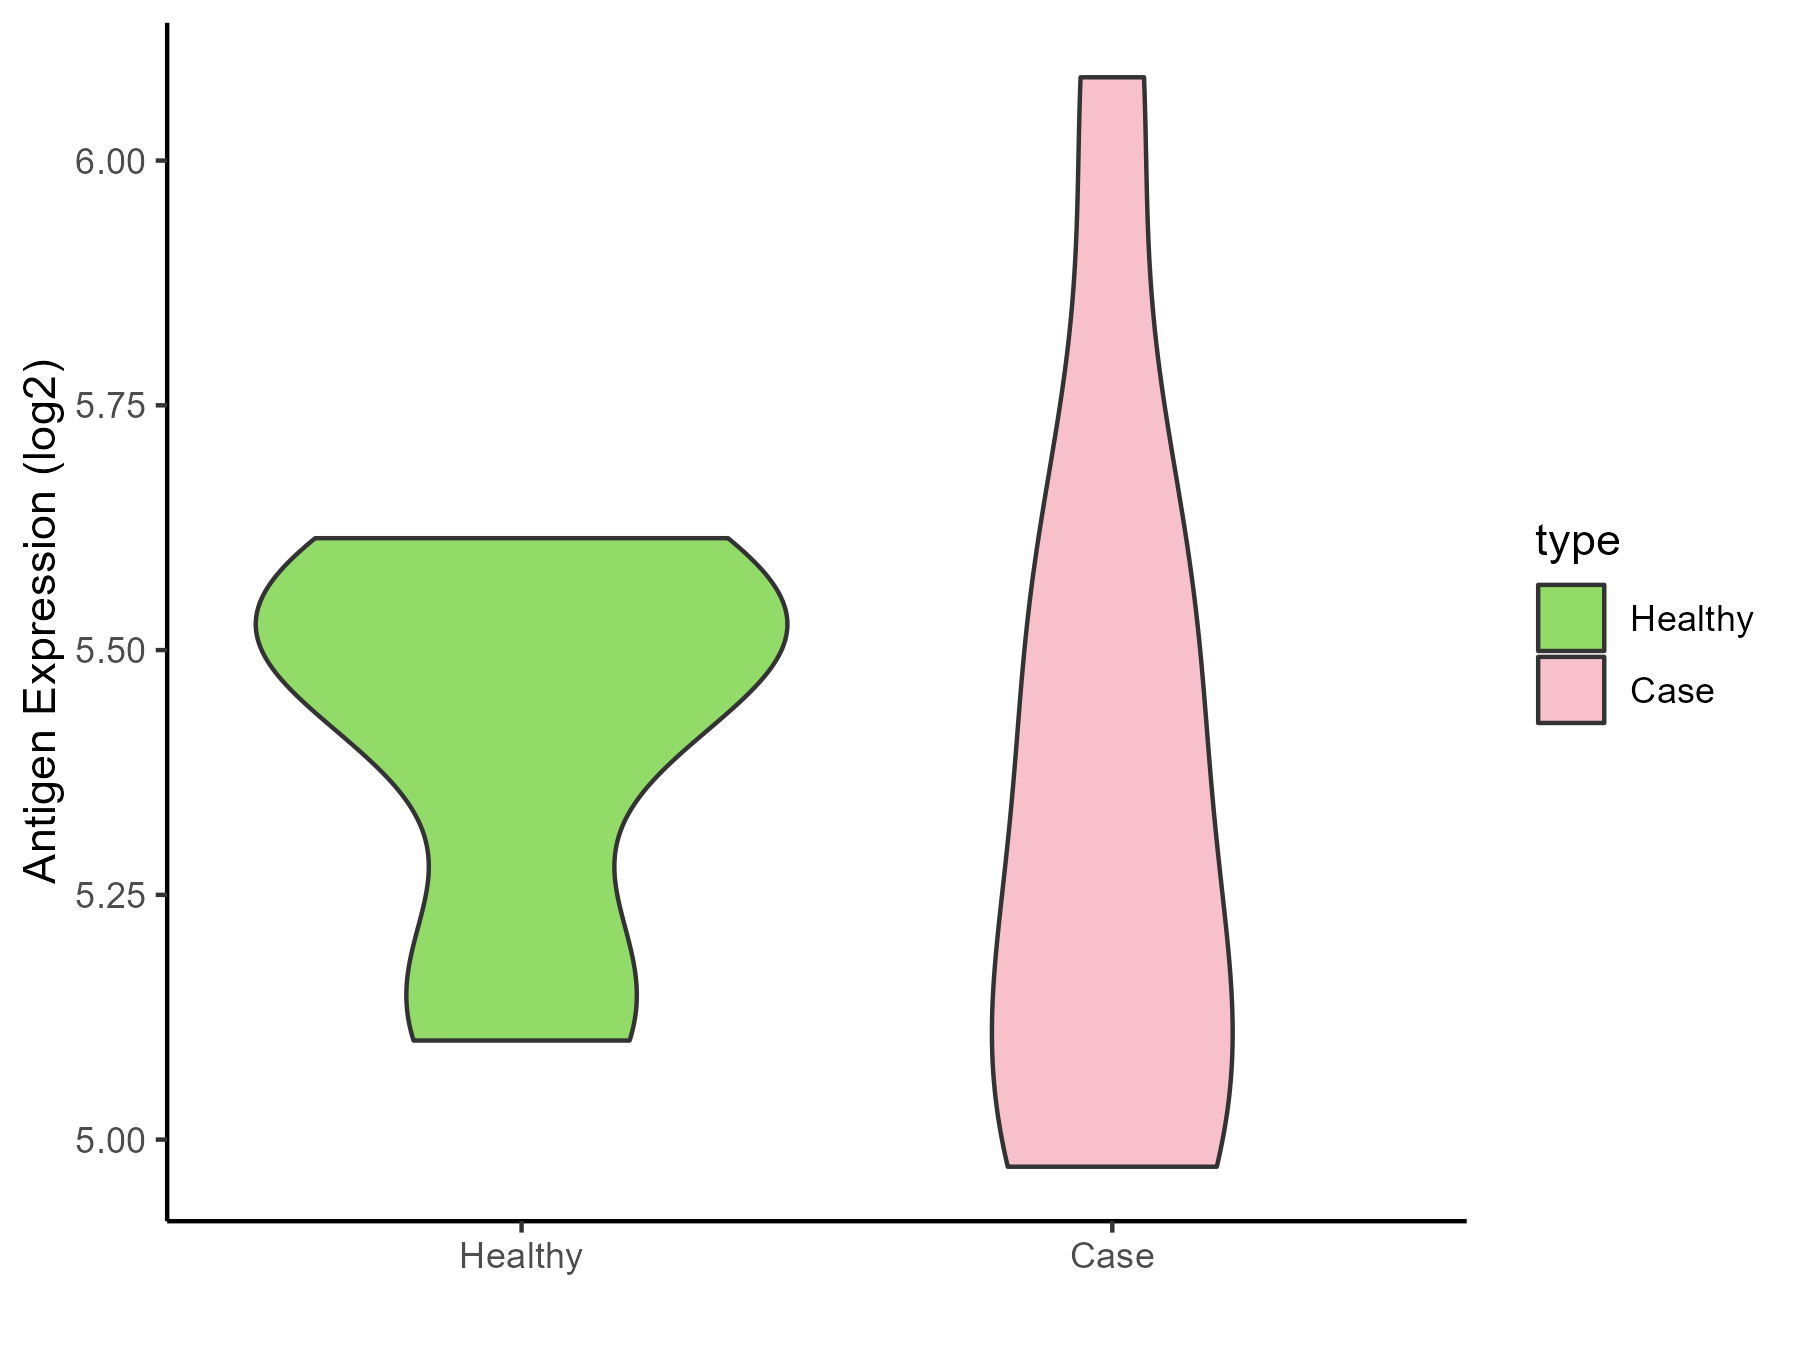
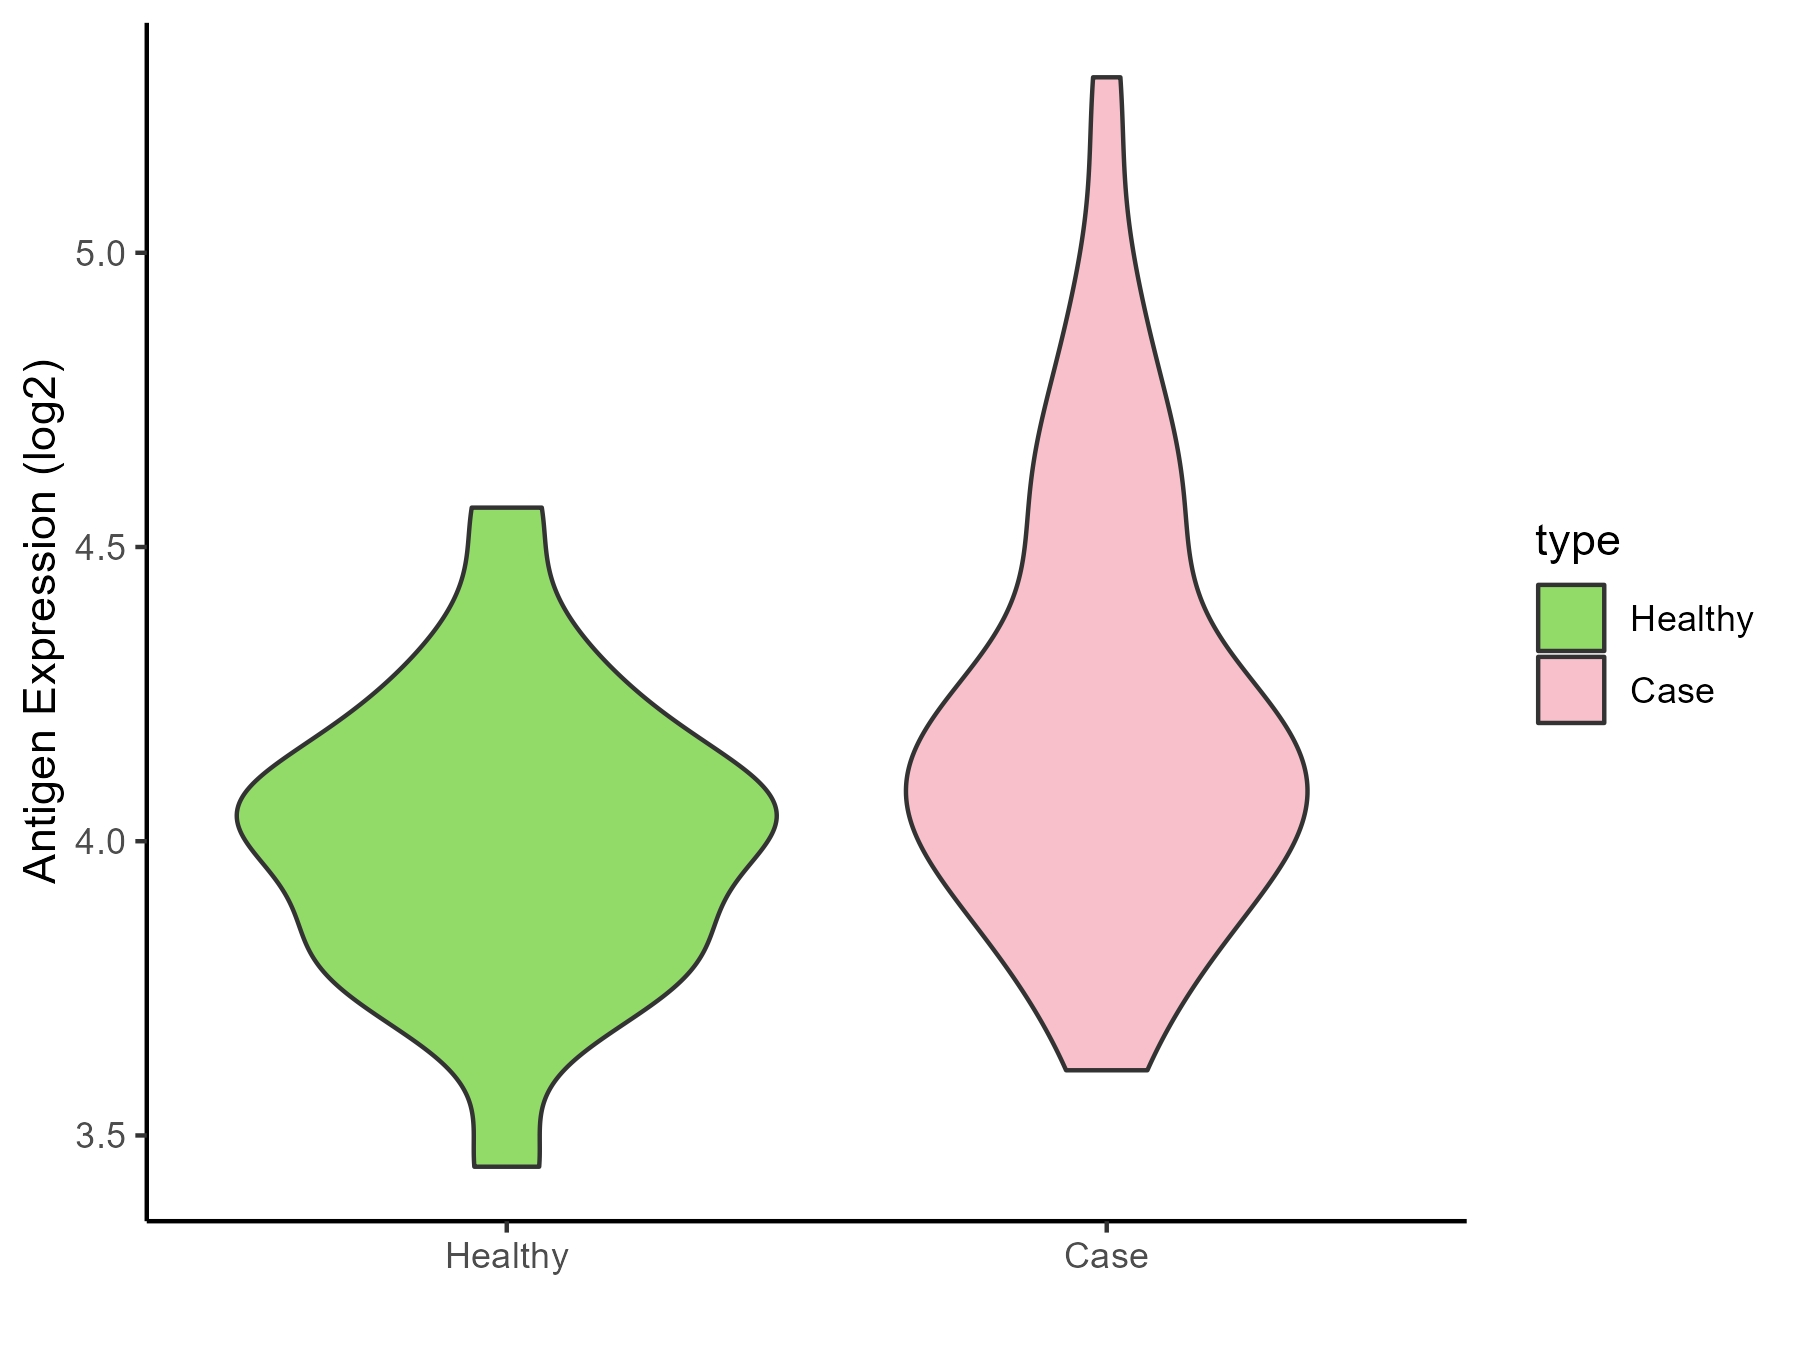
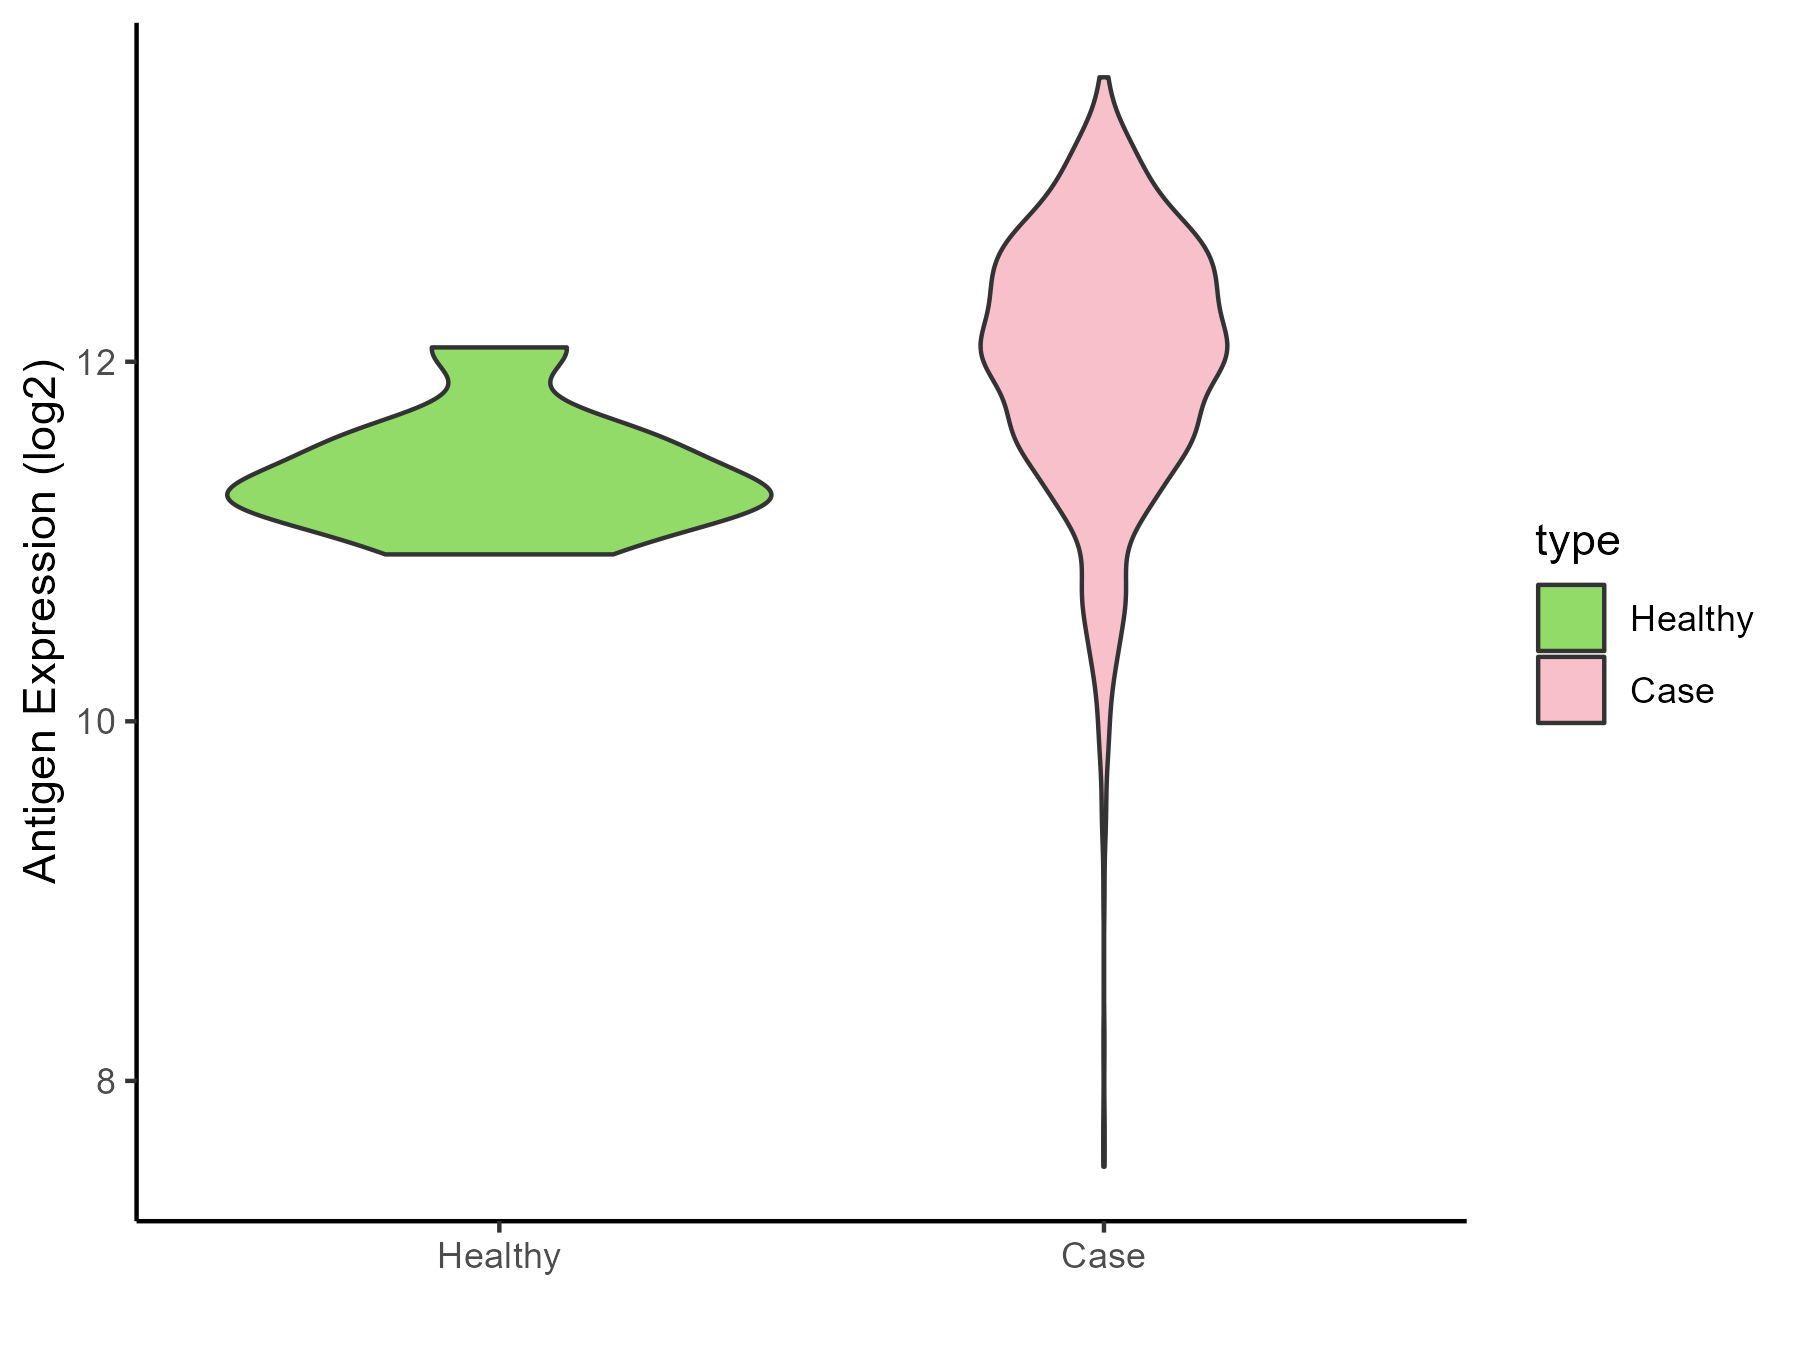
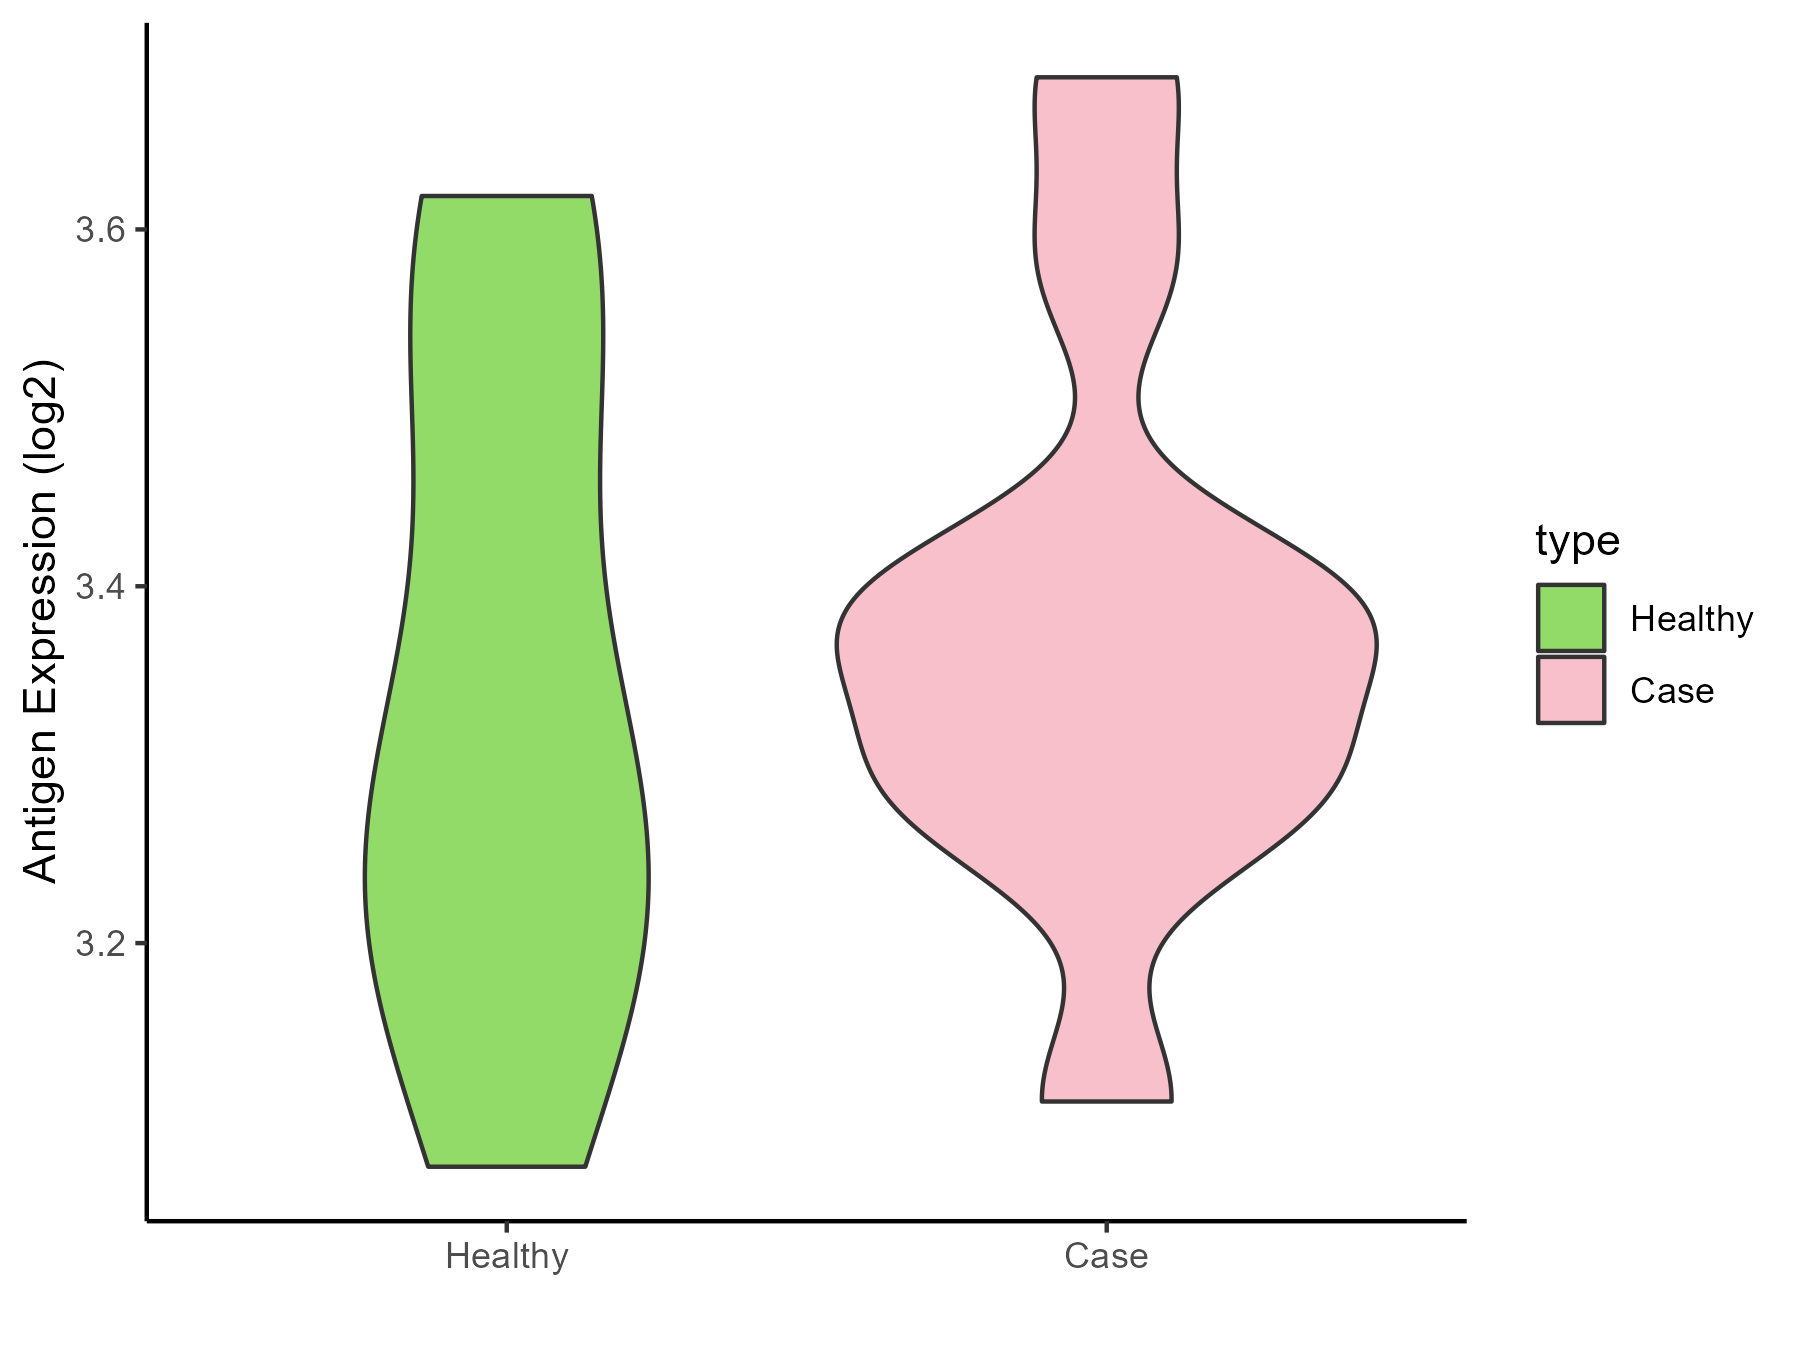
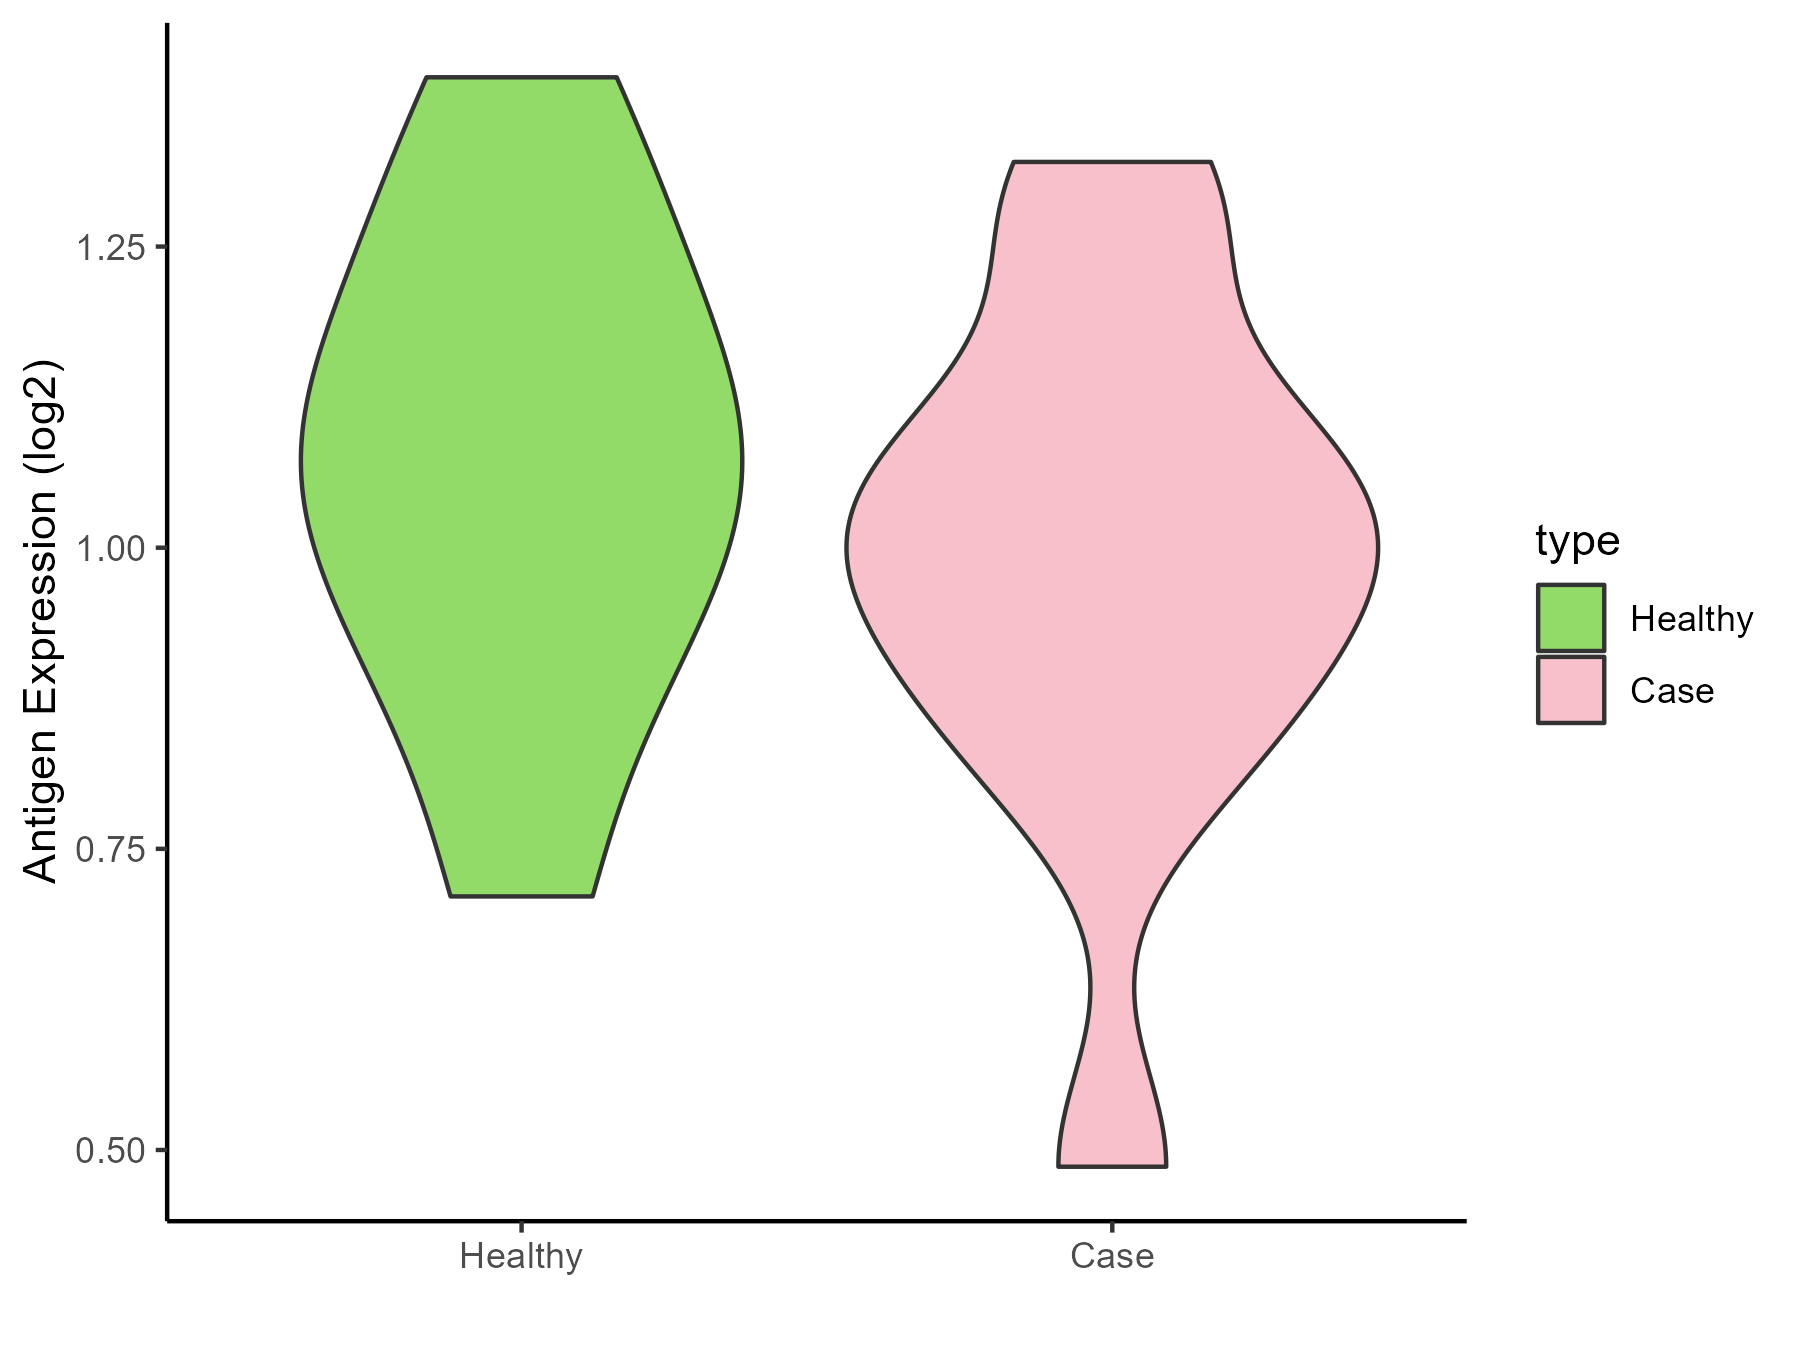
| Differential expression pattern of antigen in diseases |
| The Studied Tissue |
Gingival |
| The Specific Disease |
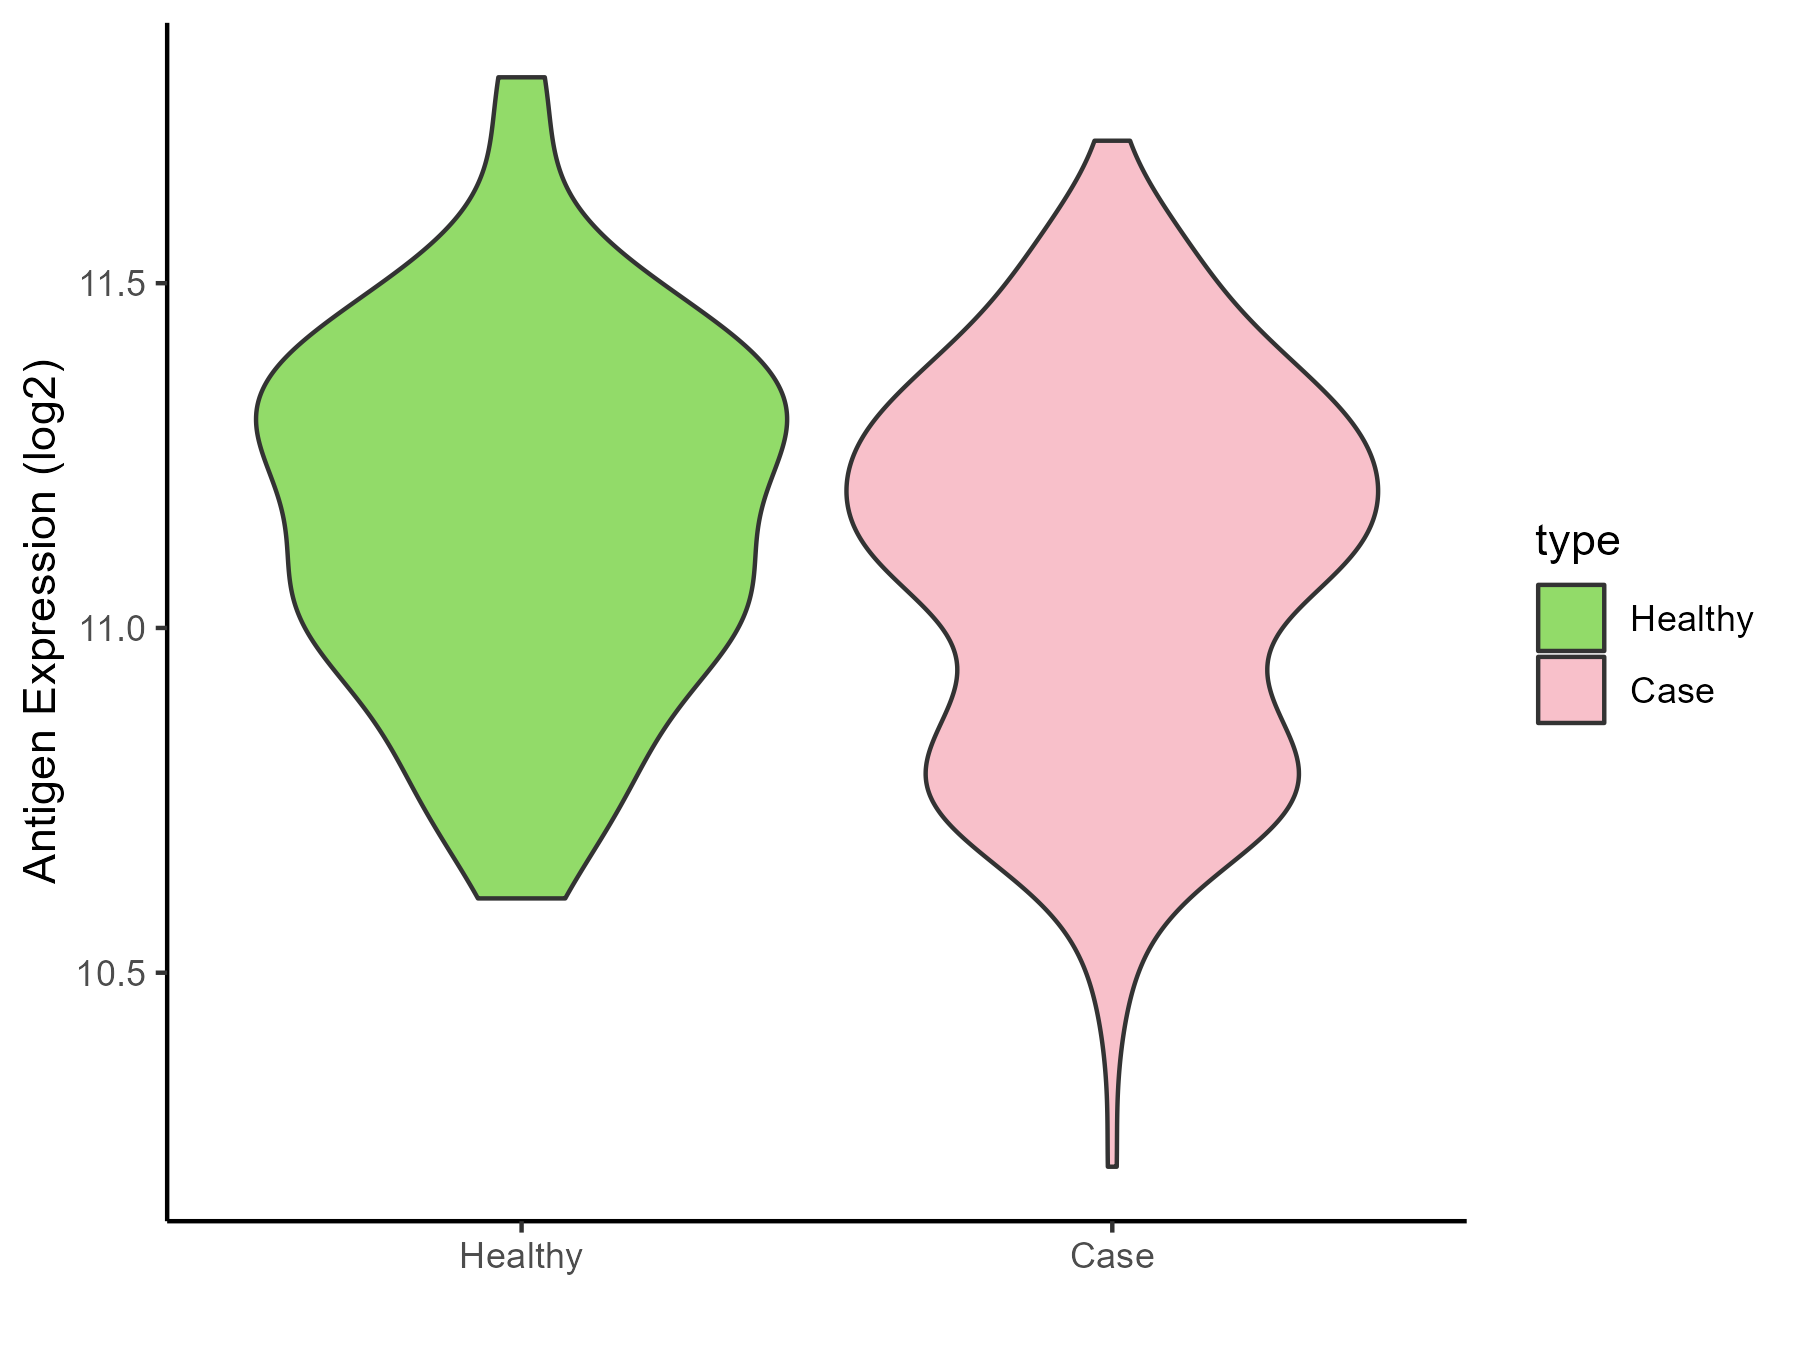
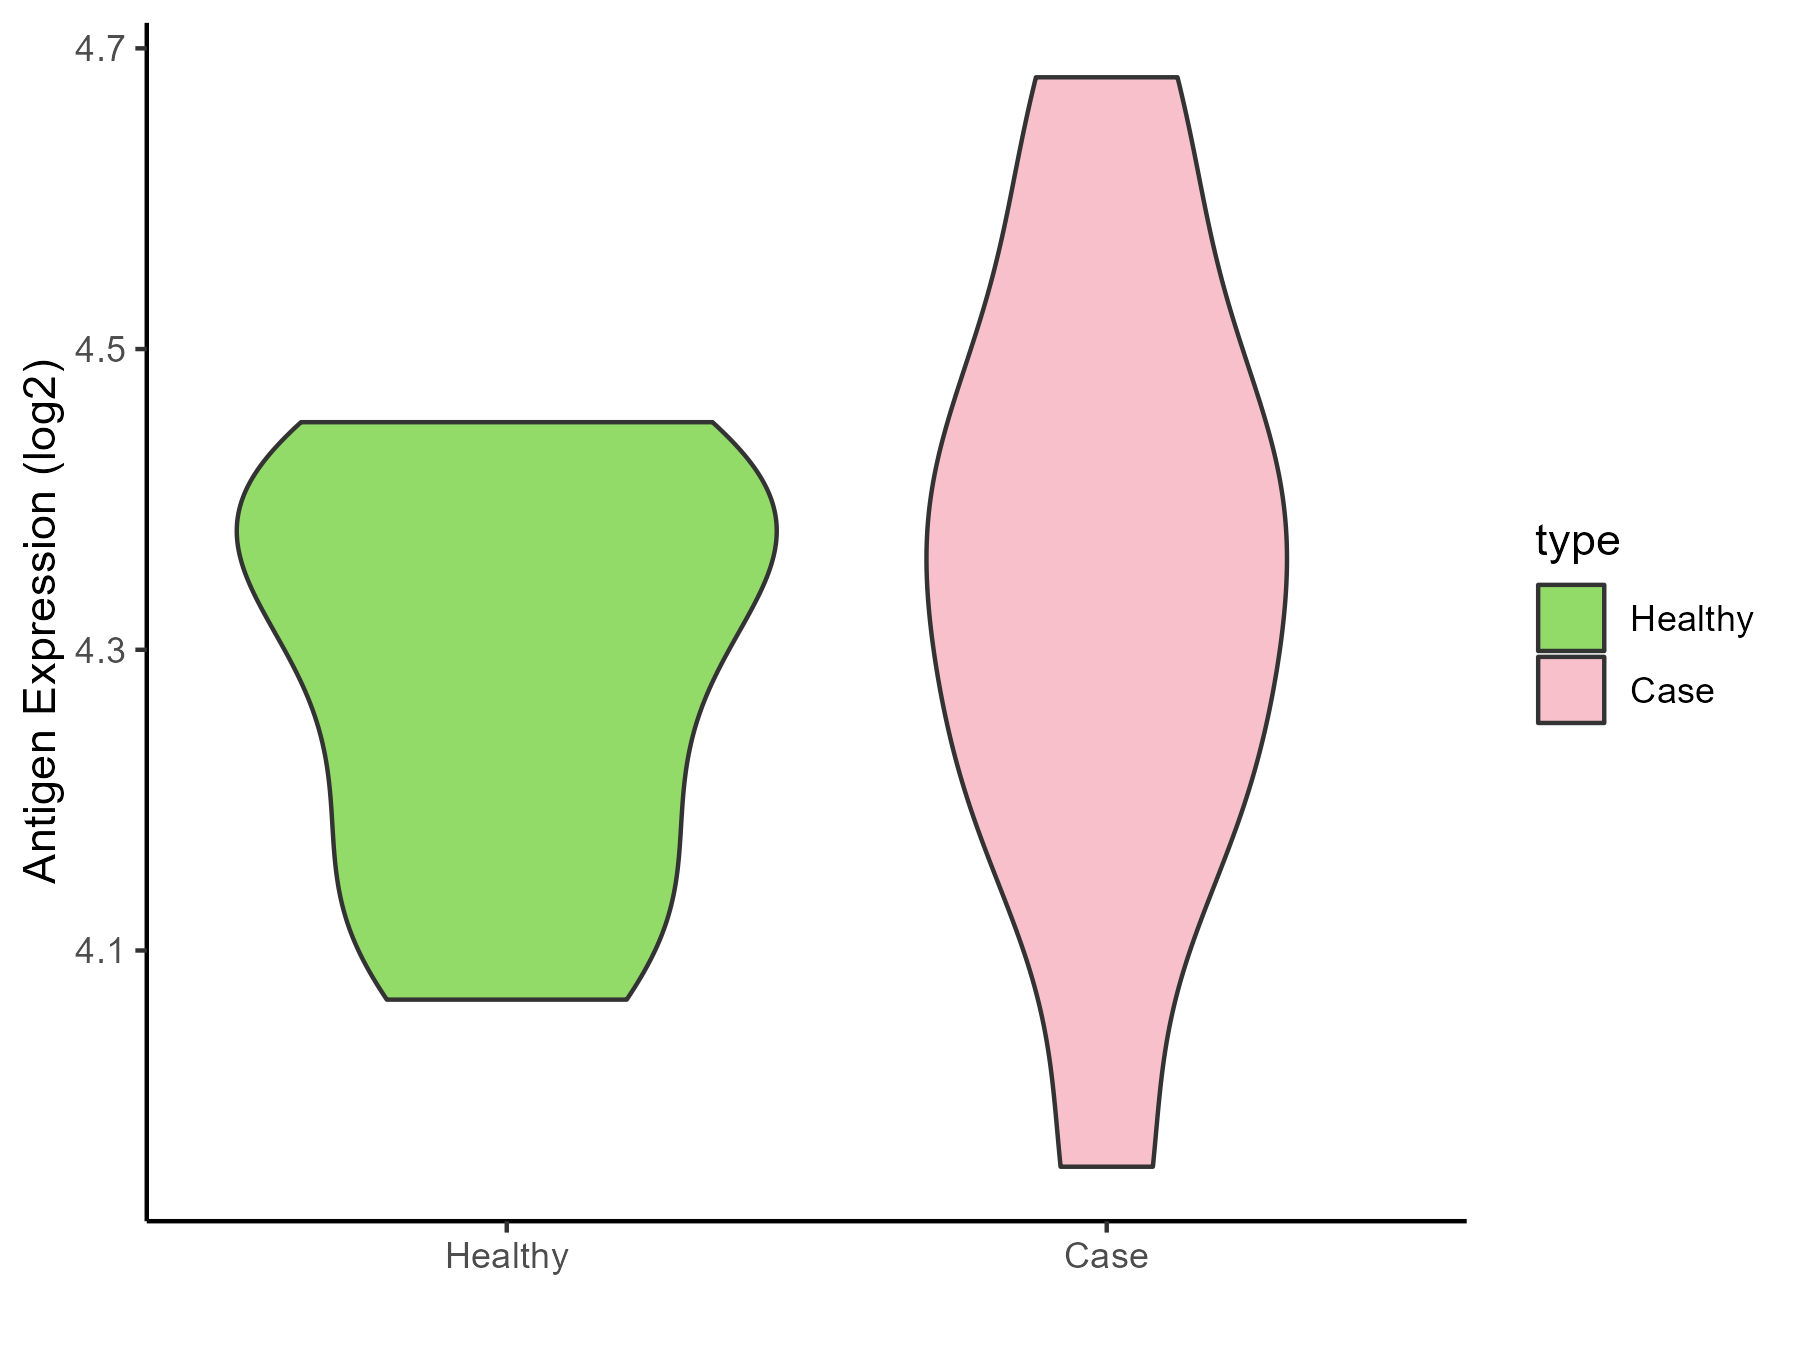
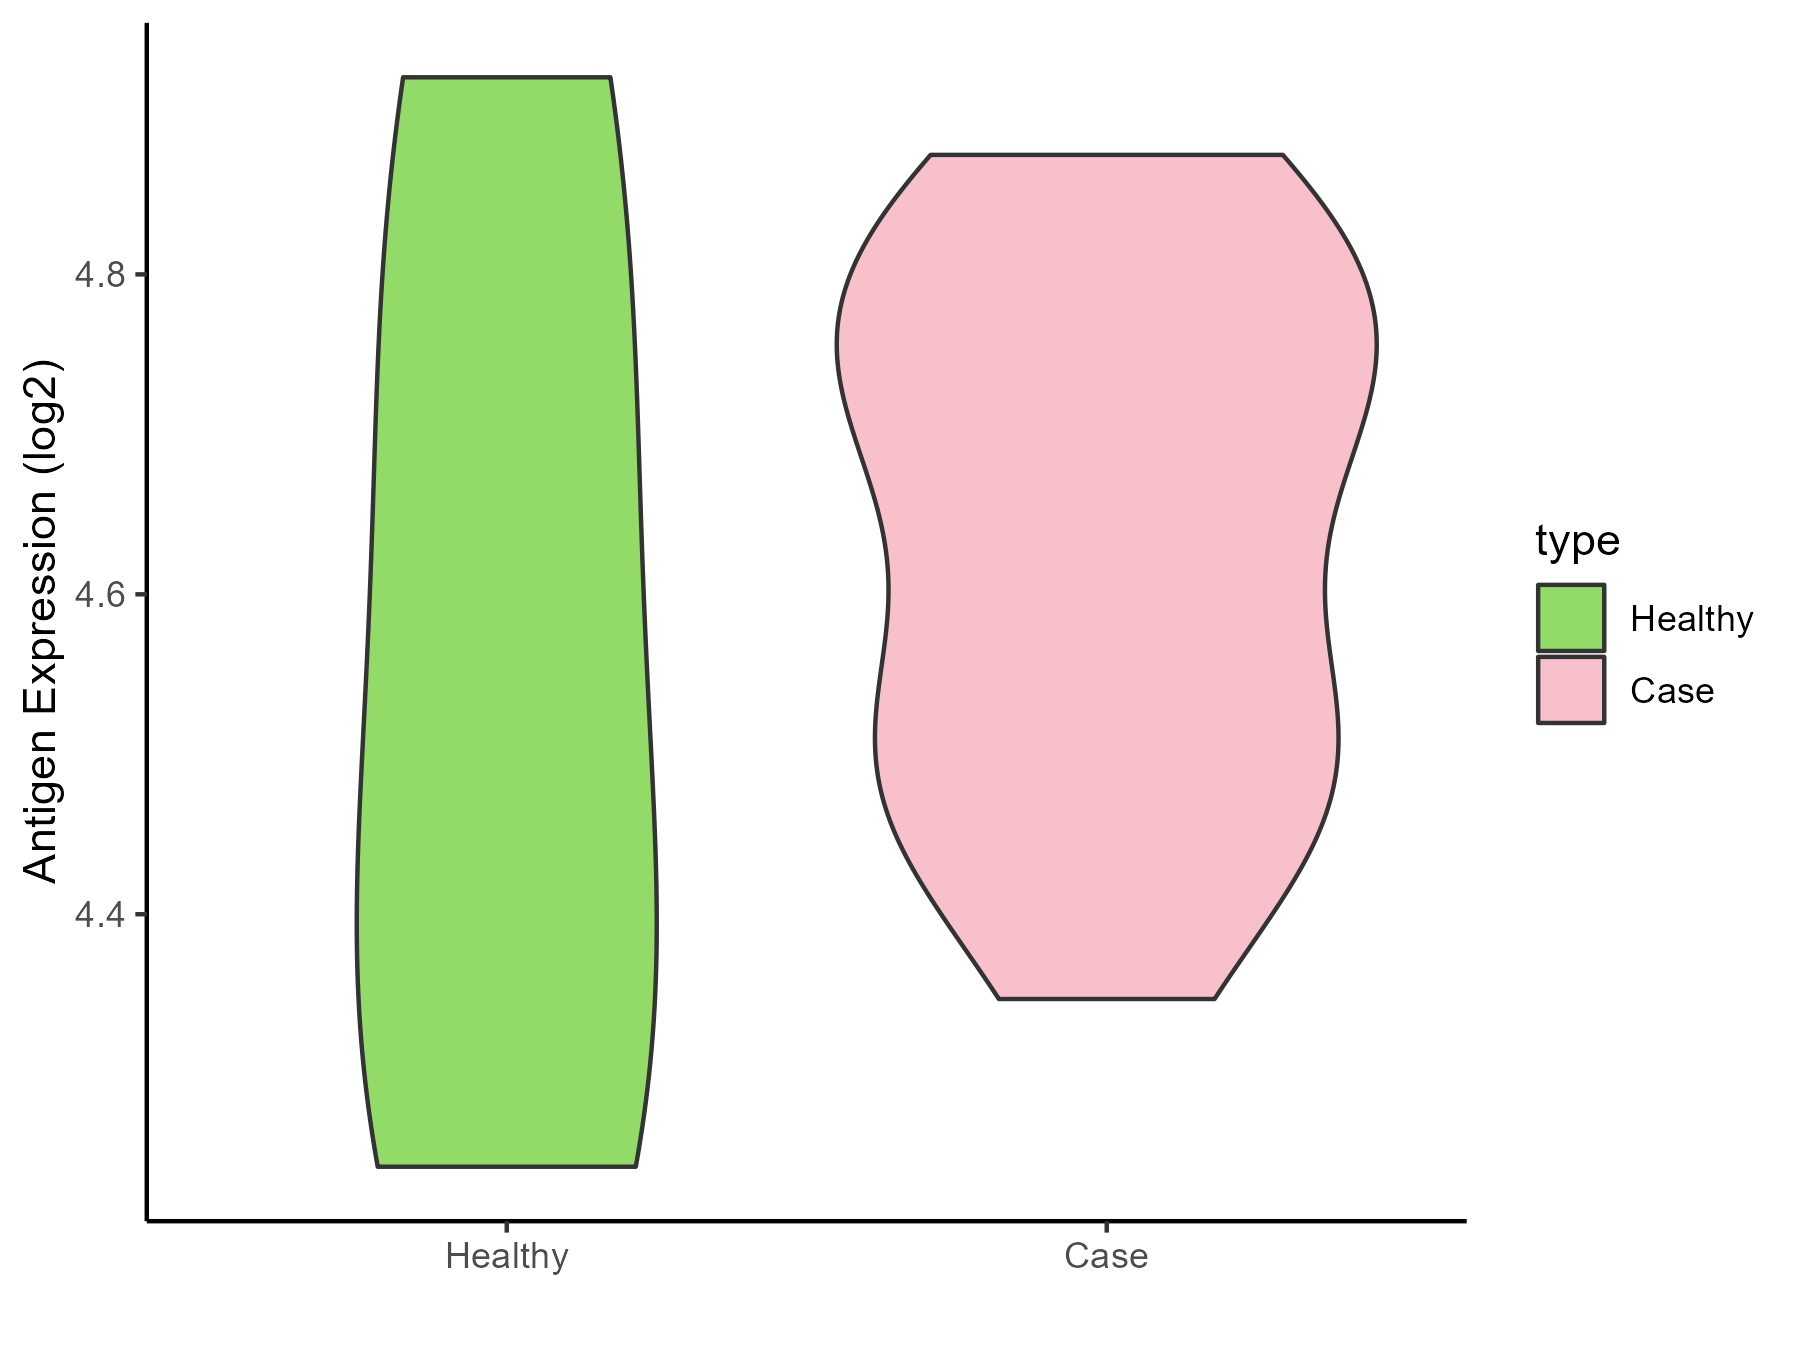
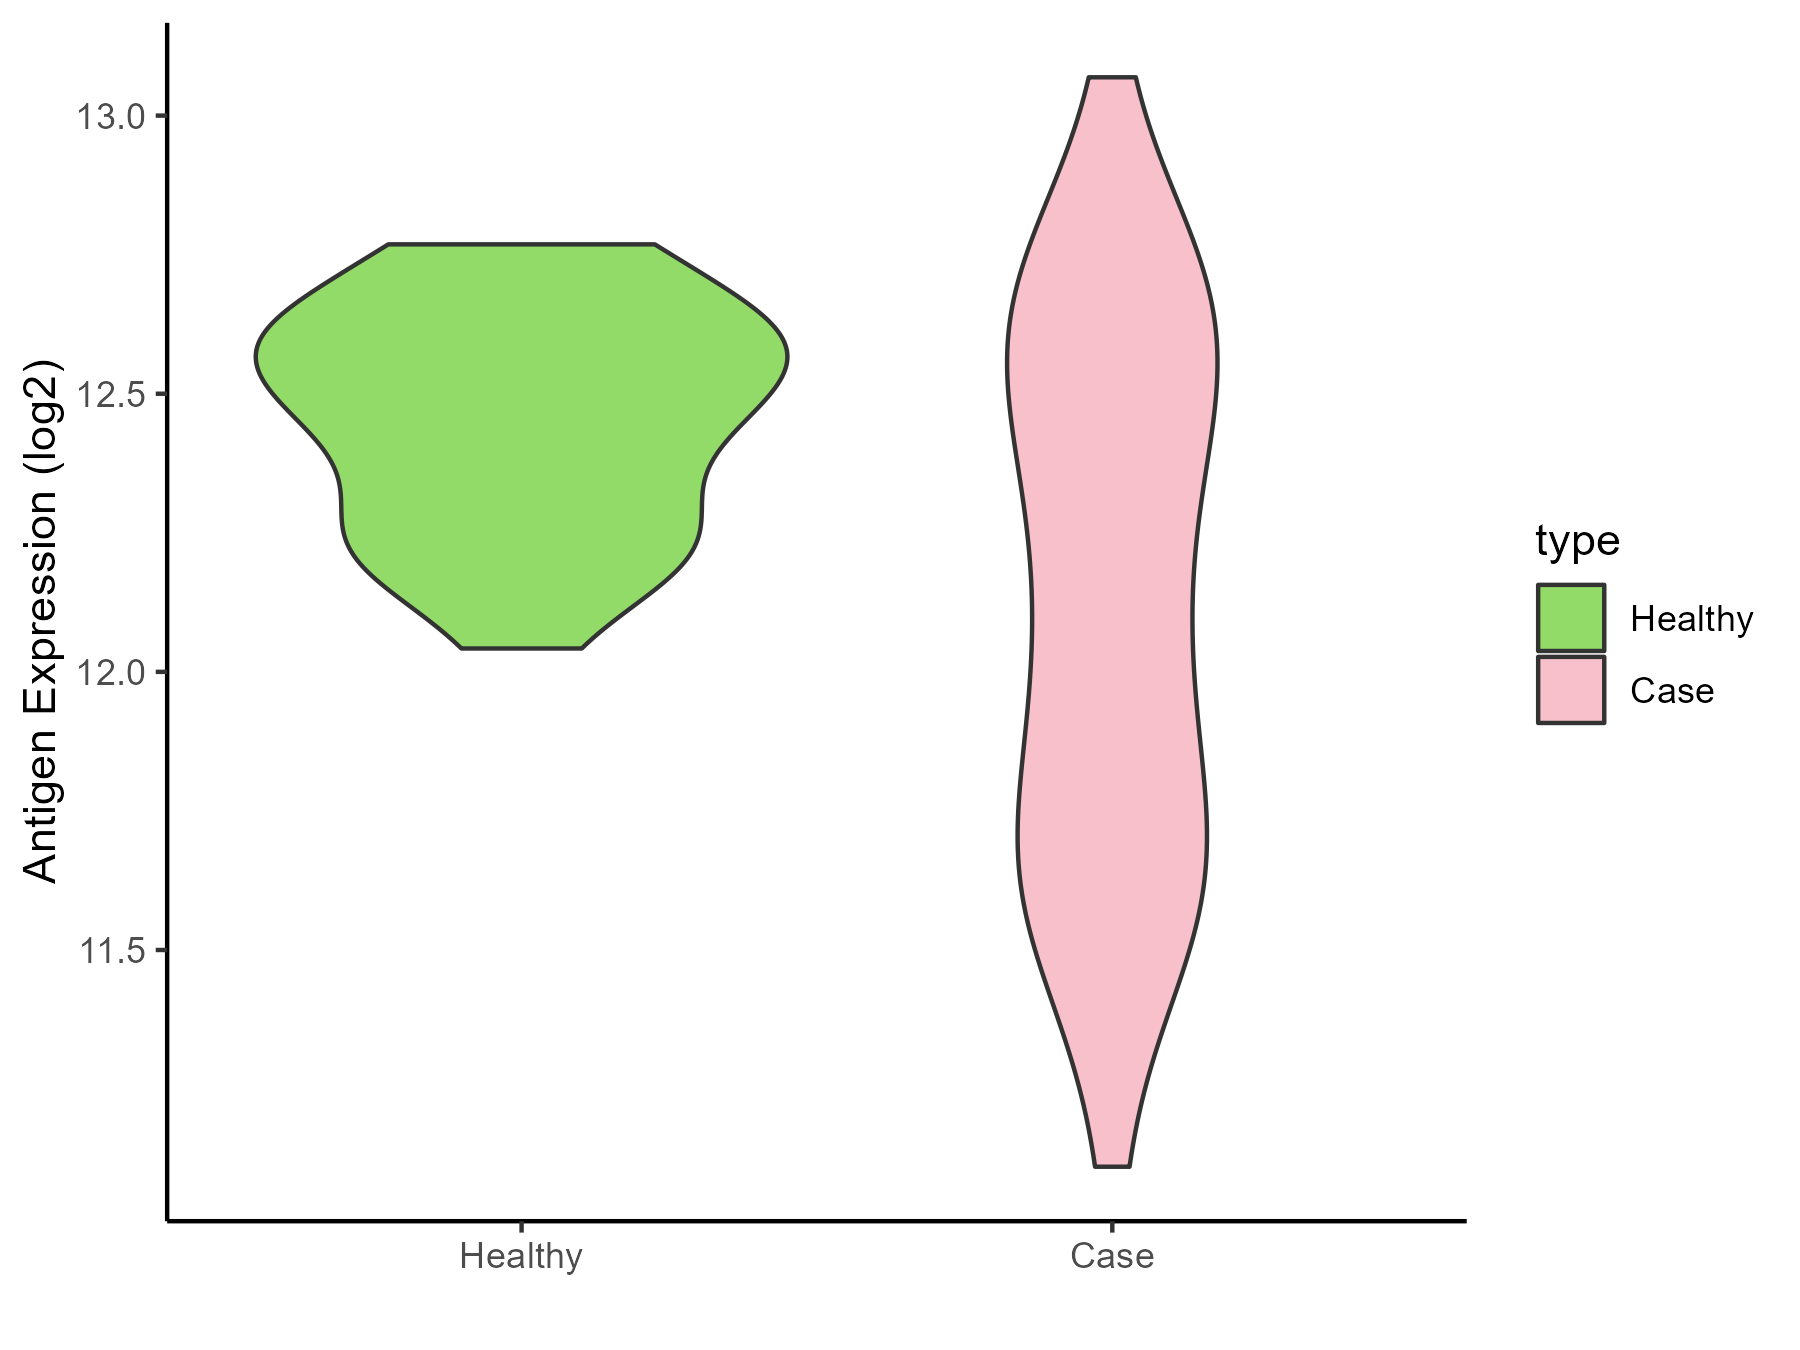
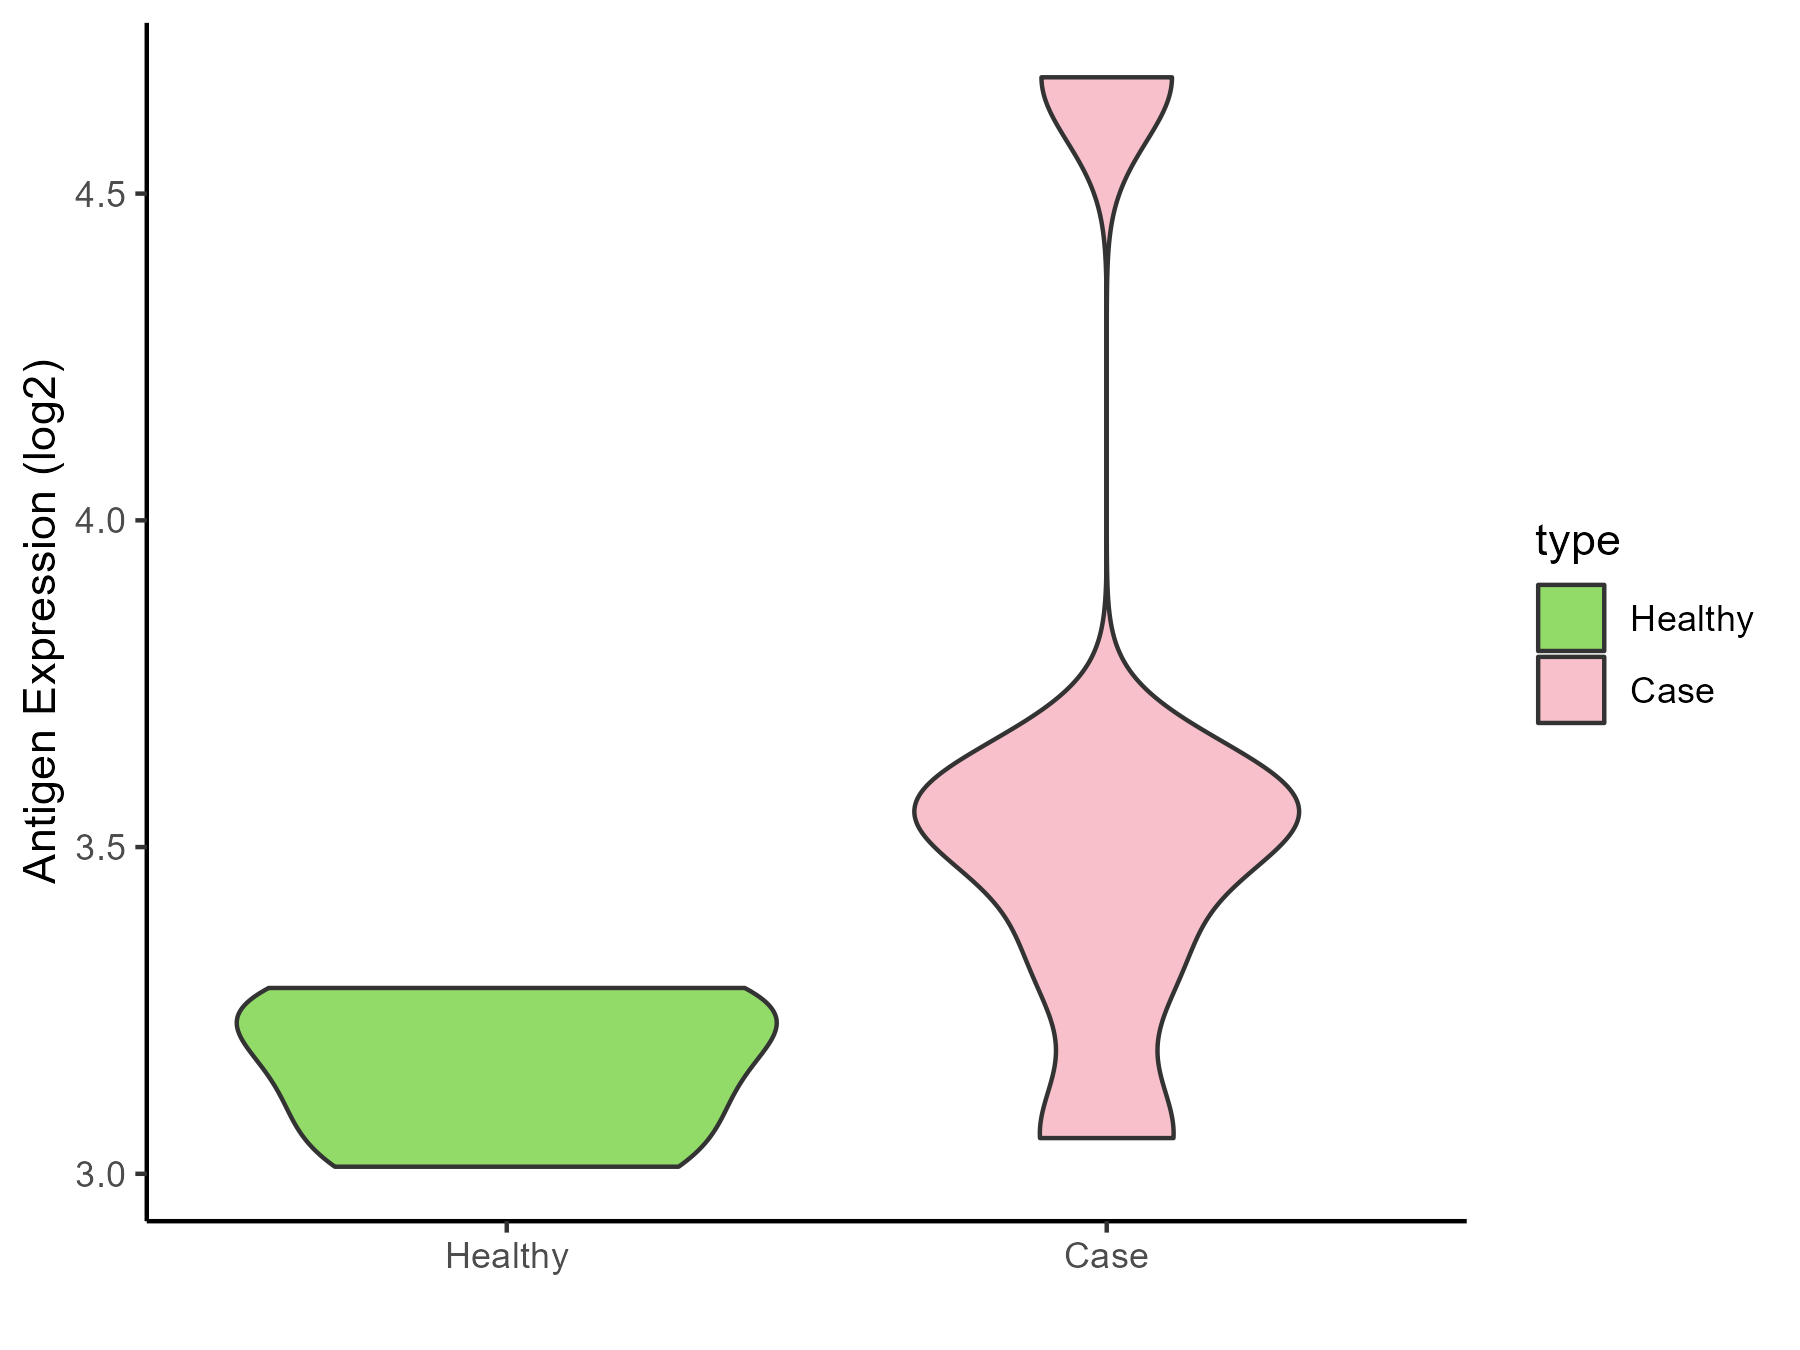
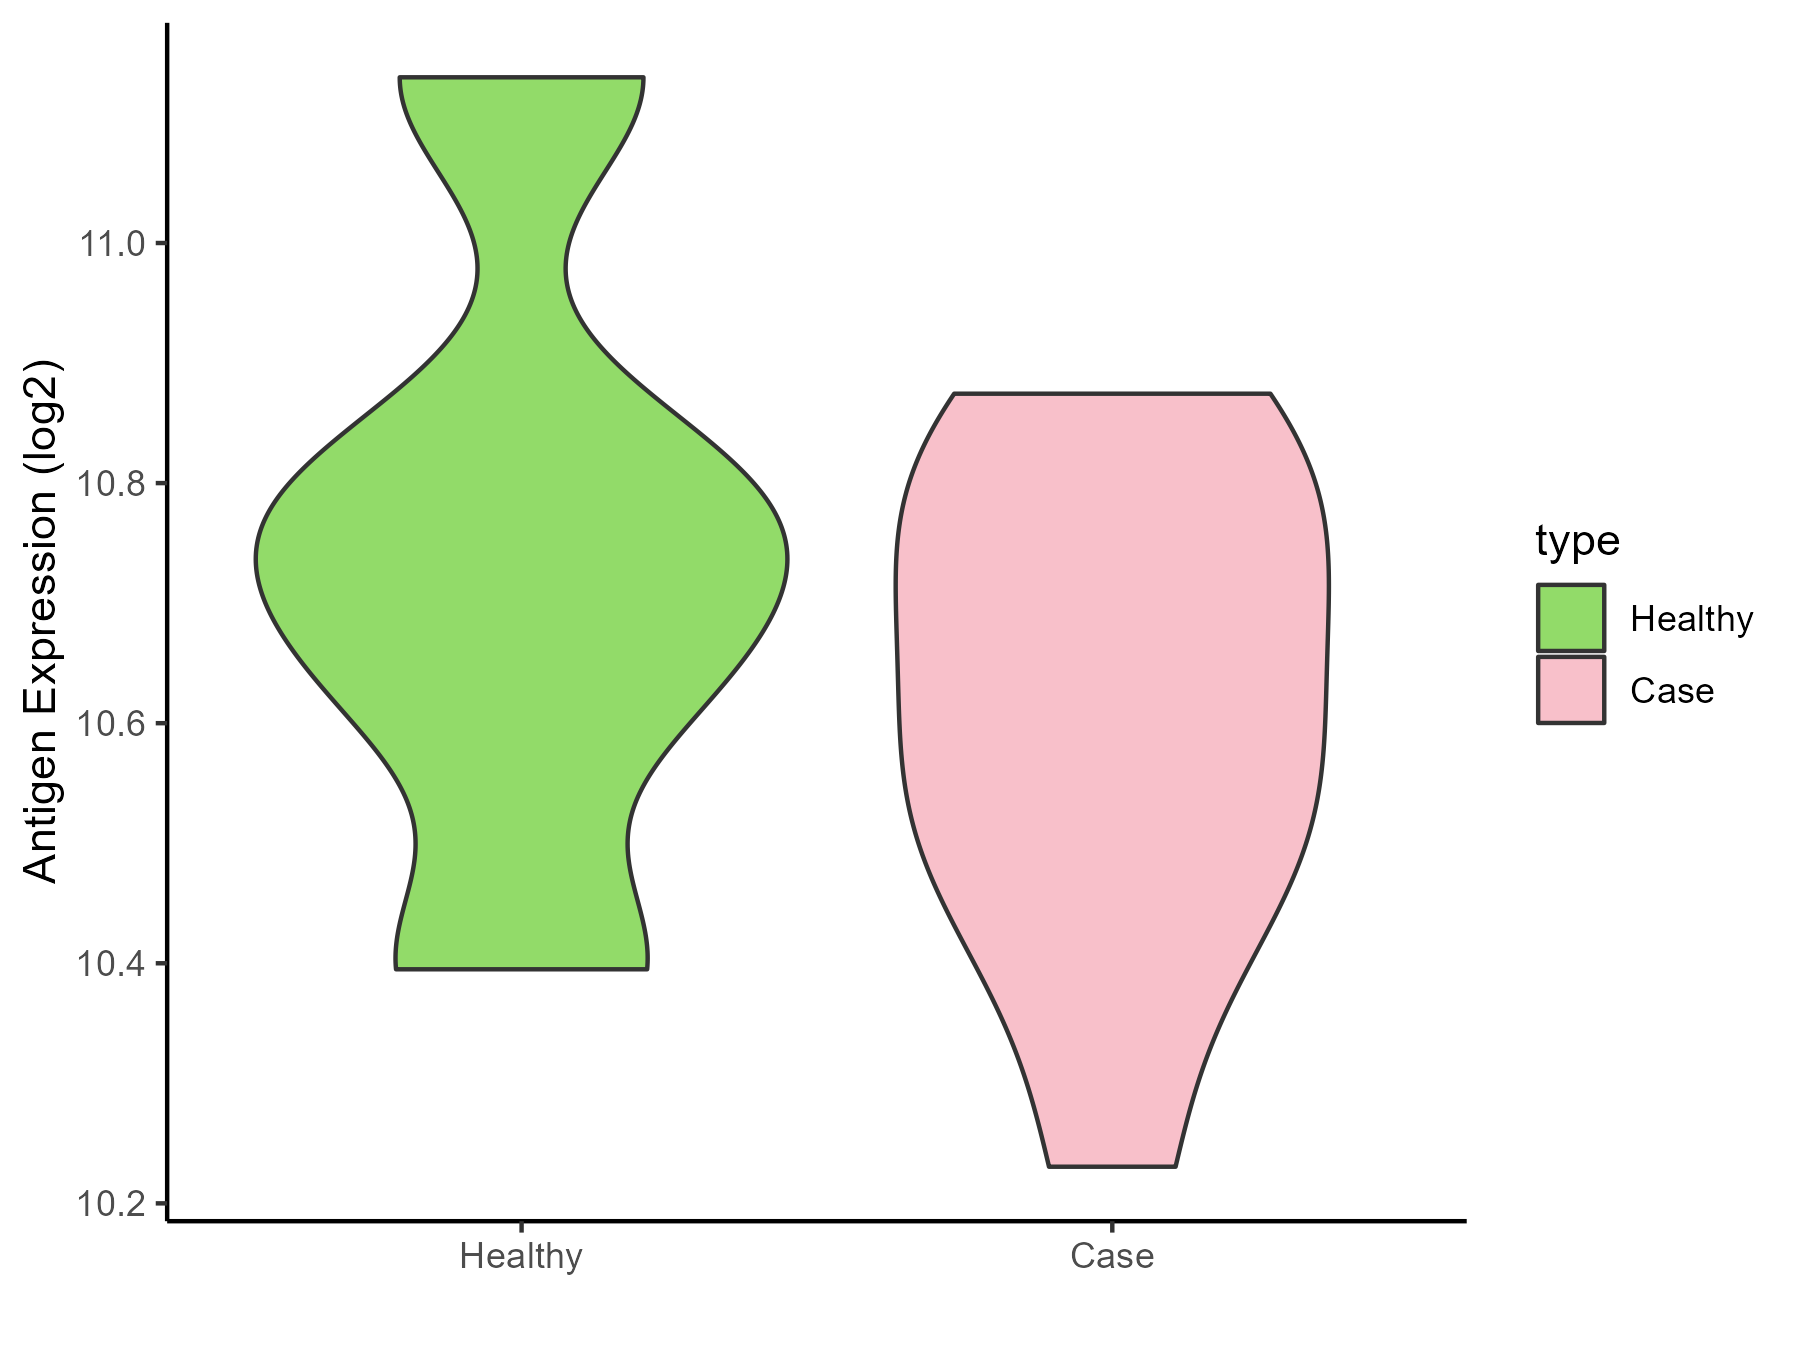
Bacterial infection of gingival |
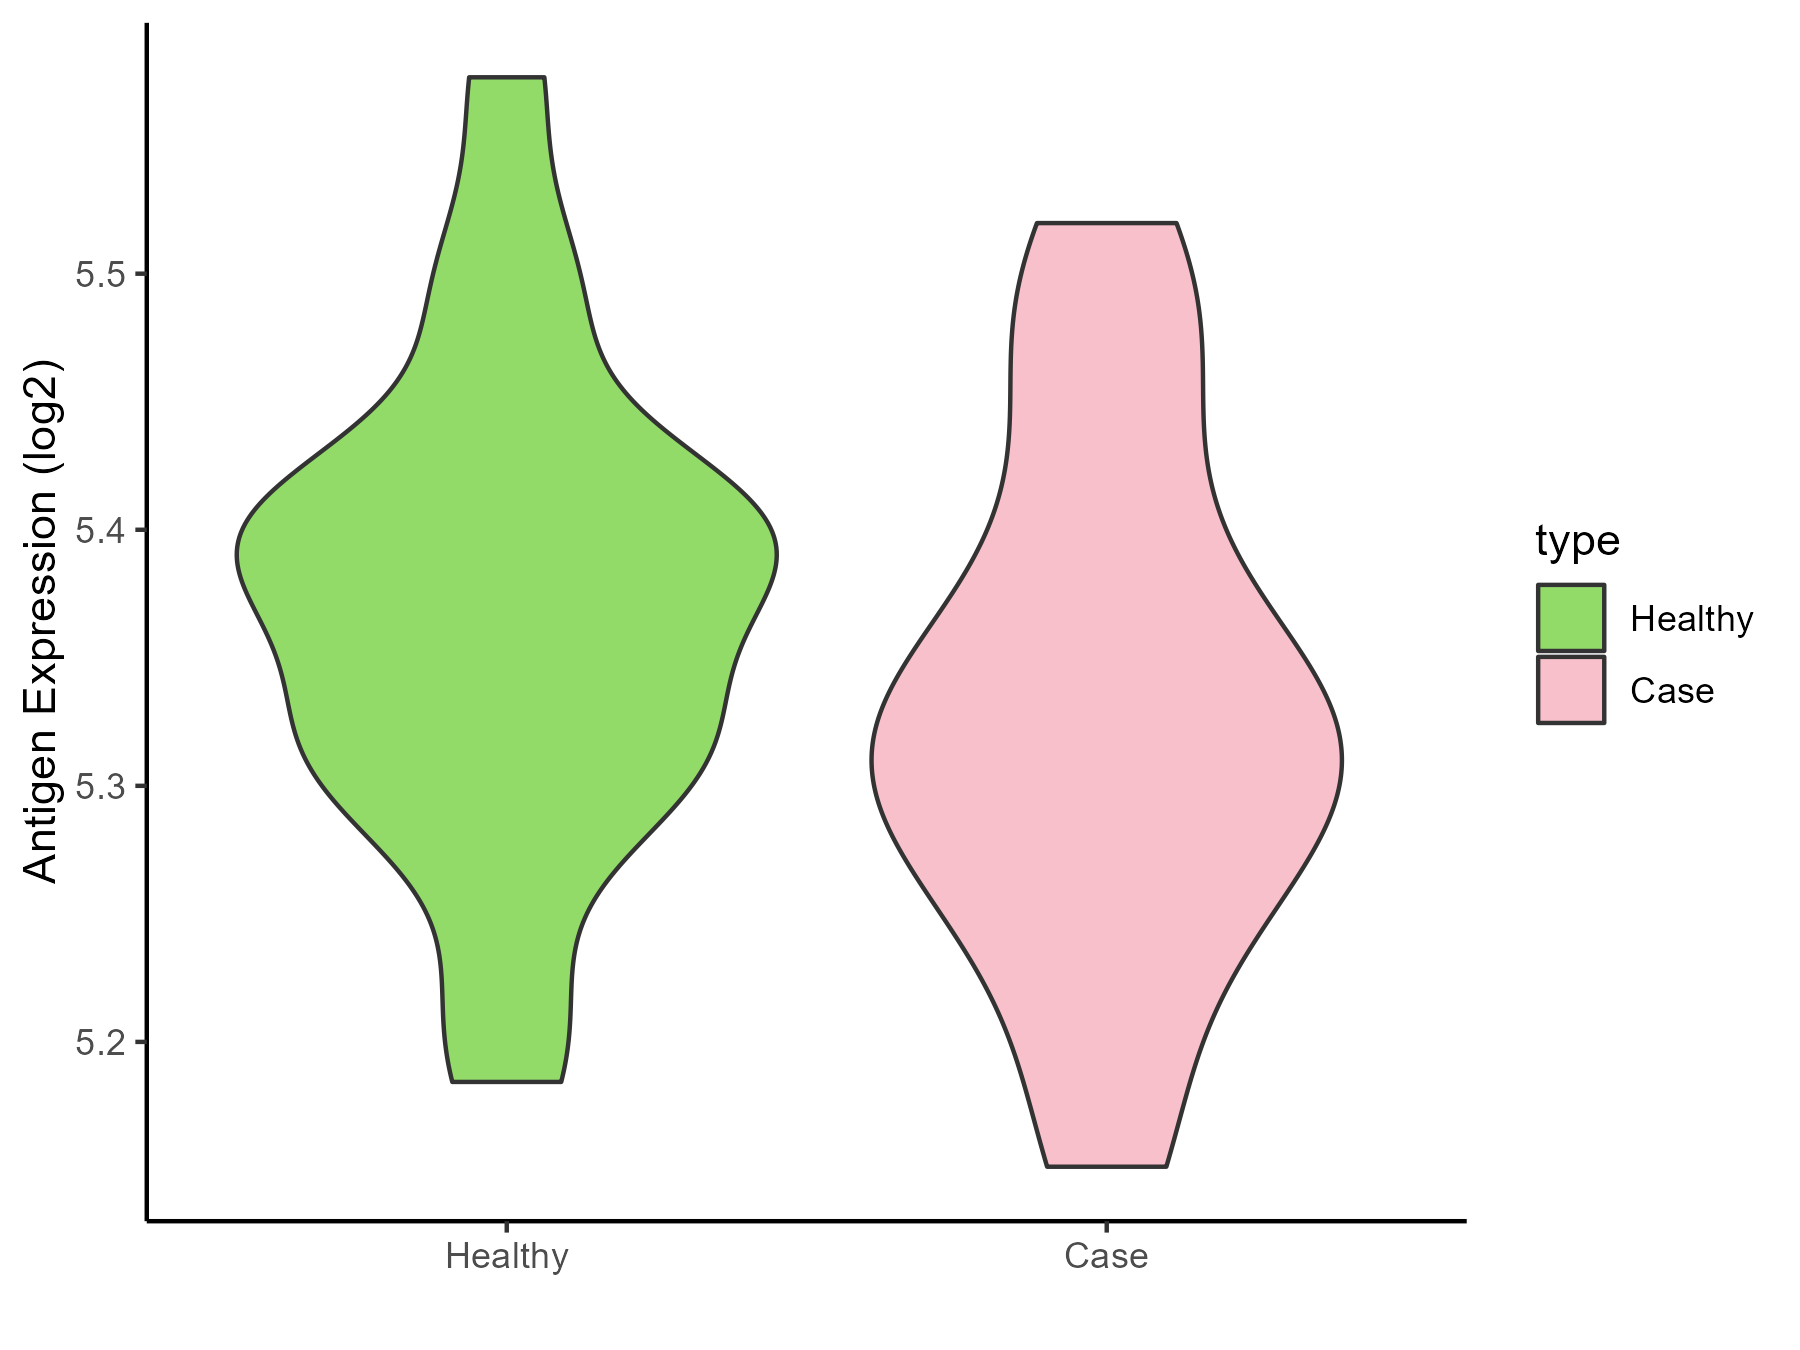
| The Expression Level of Disease Section Compare with the Healthy Individual Tissue |
p-value: 0.040476003;
Fold-change: -0.071147307;
Z-score: -0.275625311
|
| Disease-specific Antigen Abundances |
|
Click to View the Clearer Original Diagram
|
|
|
ICD Disease Classification 02
Click to Show/Hide the 22 Disease of This Class
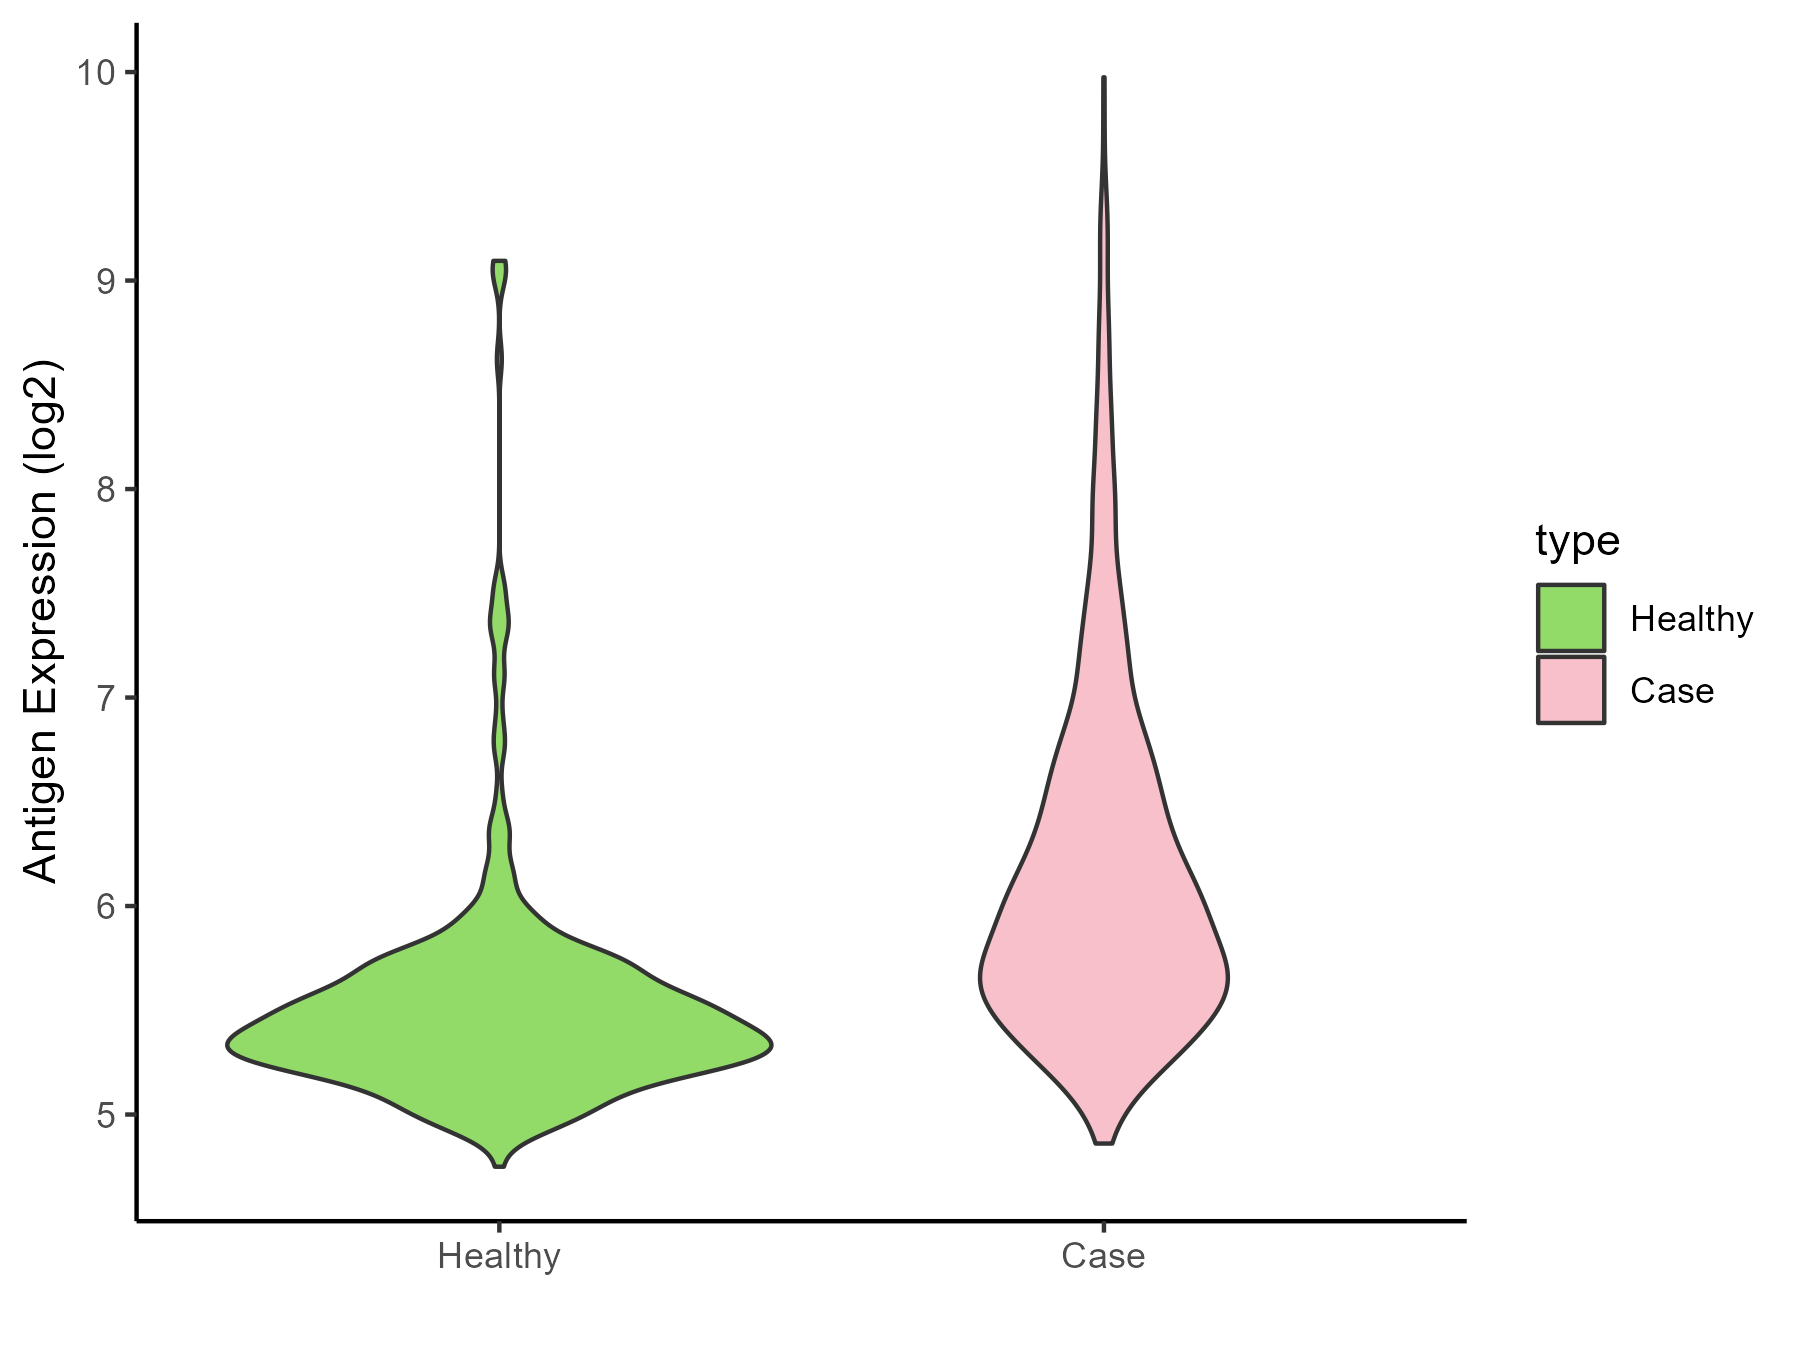
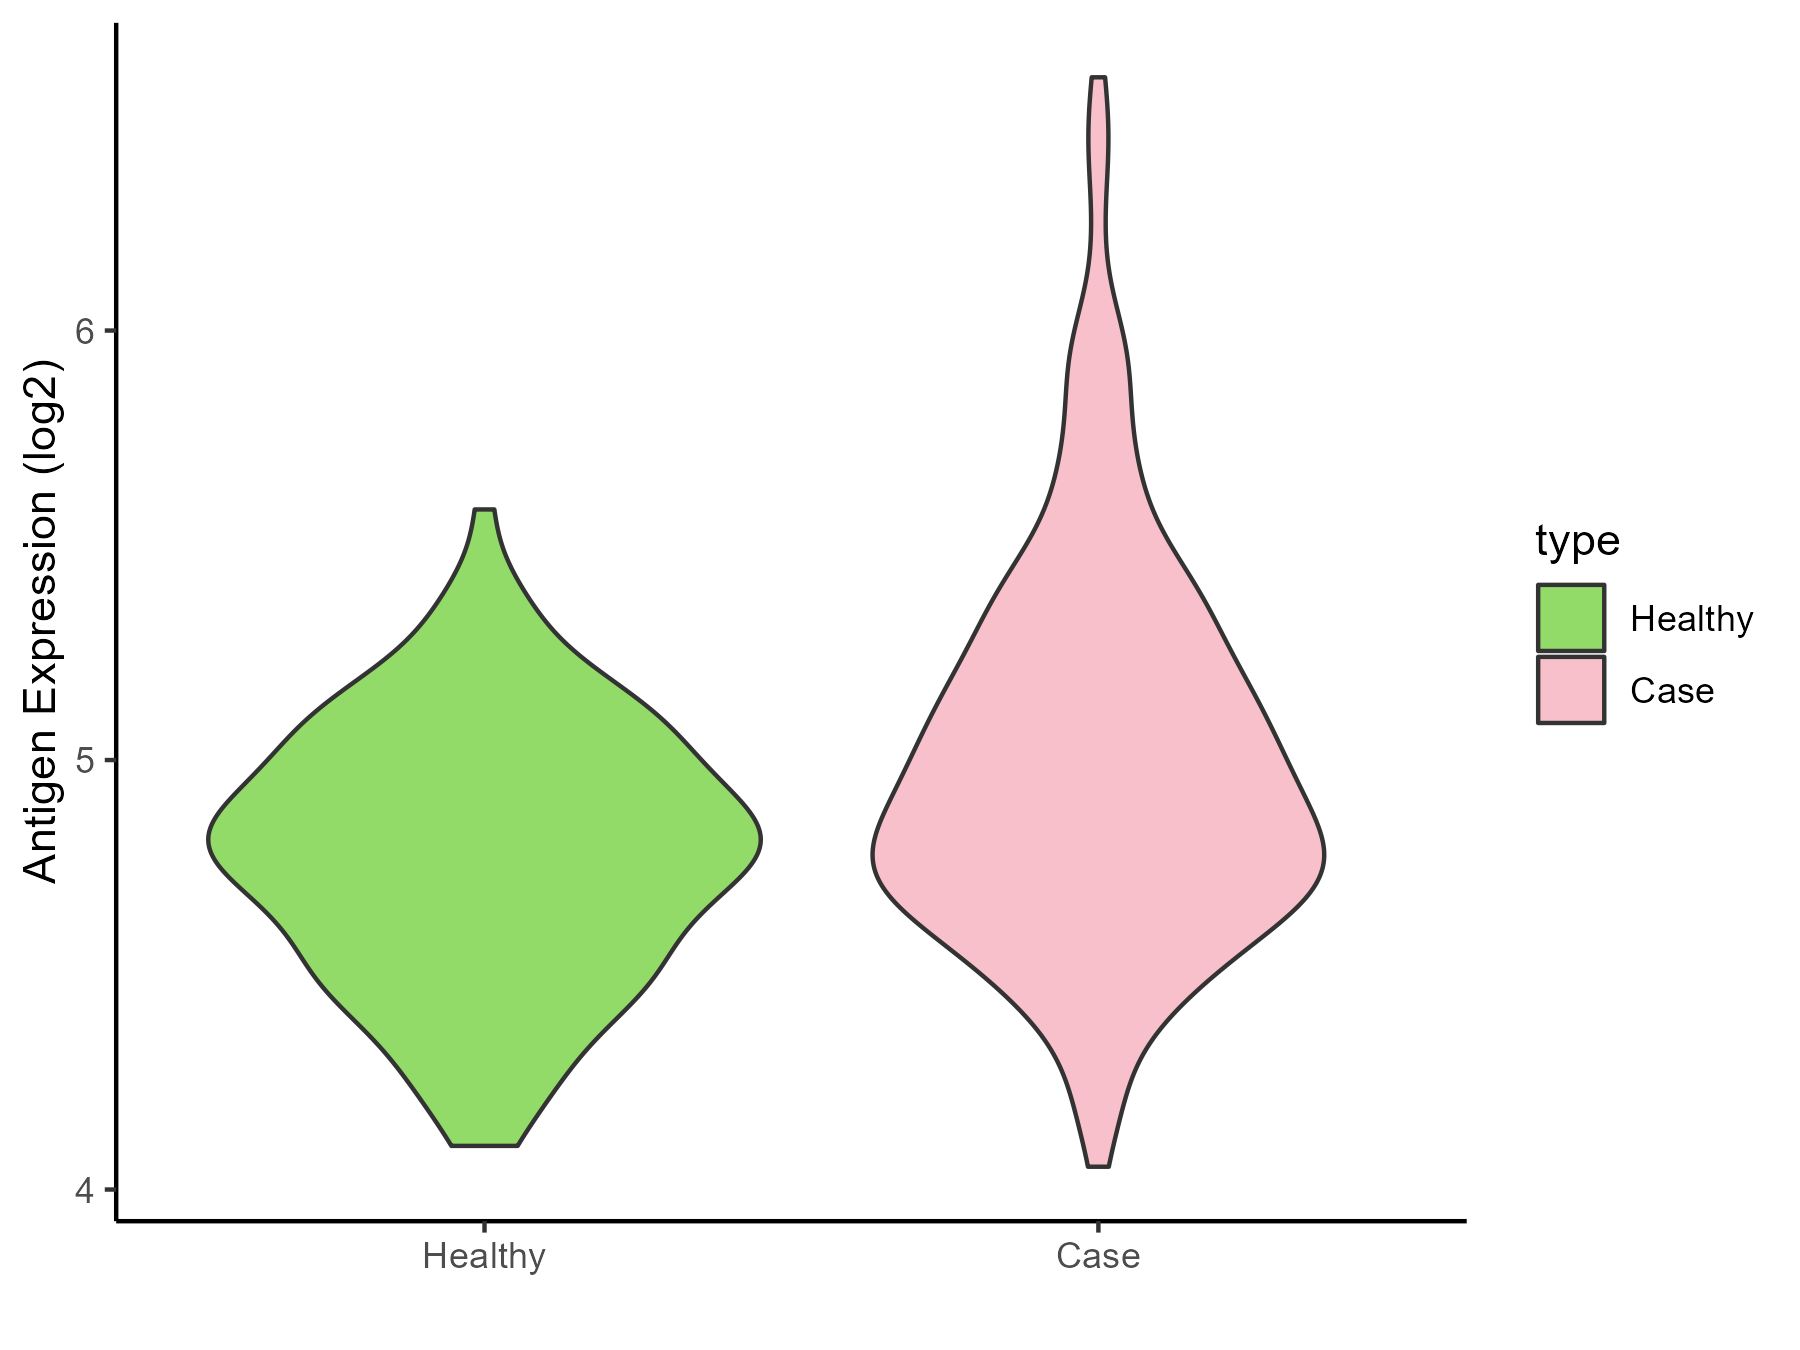
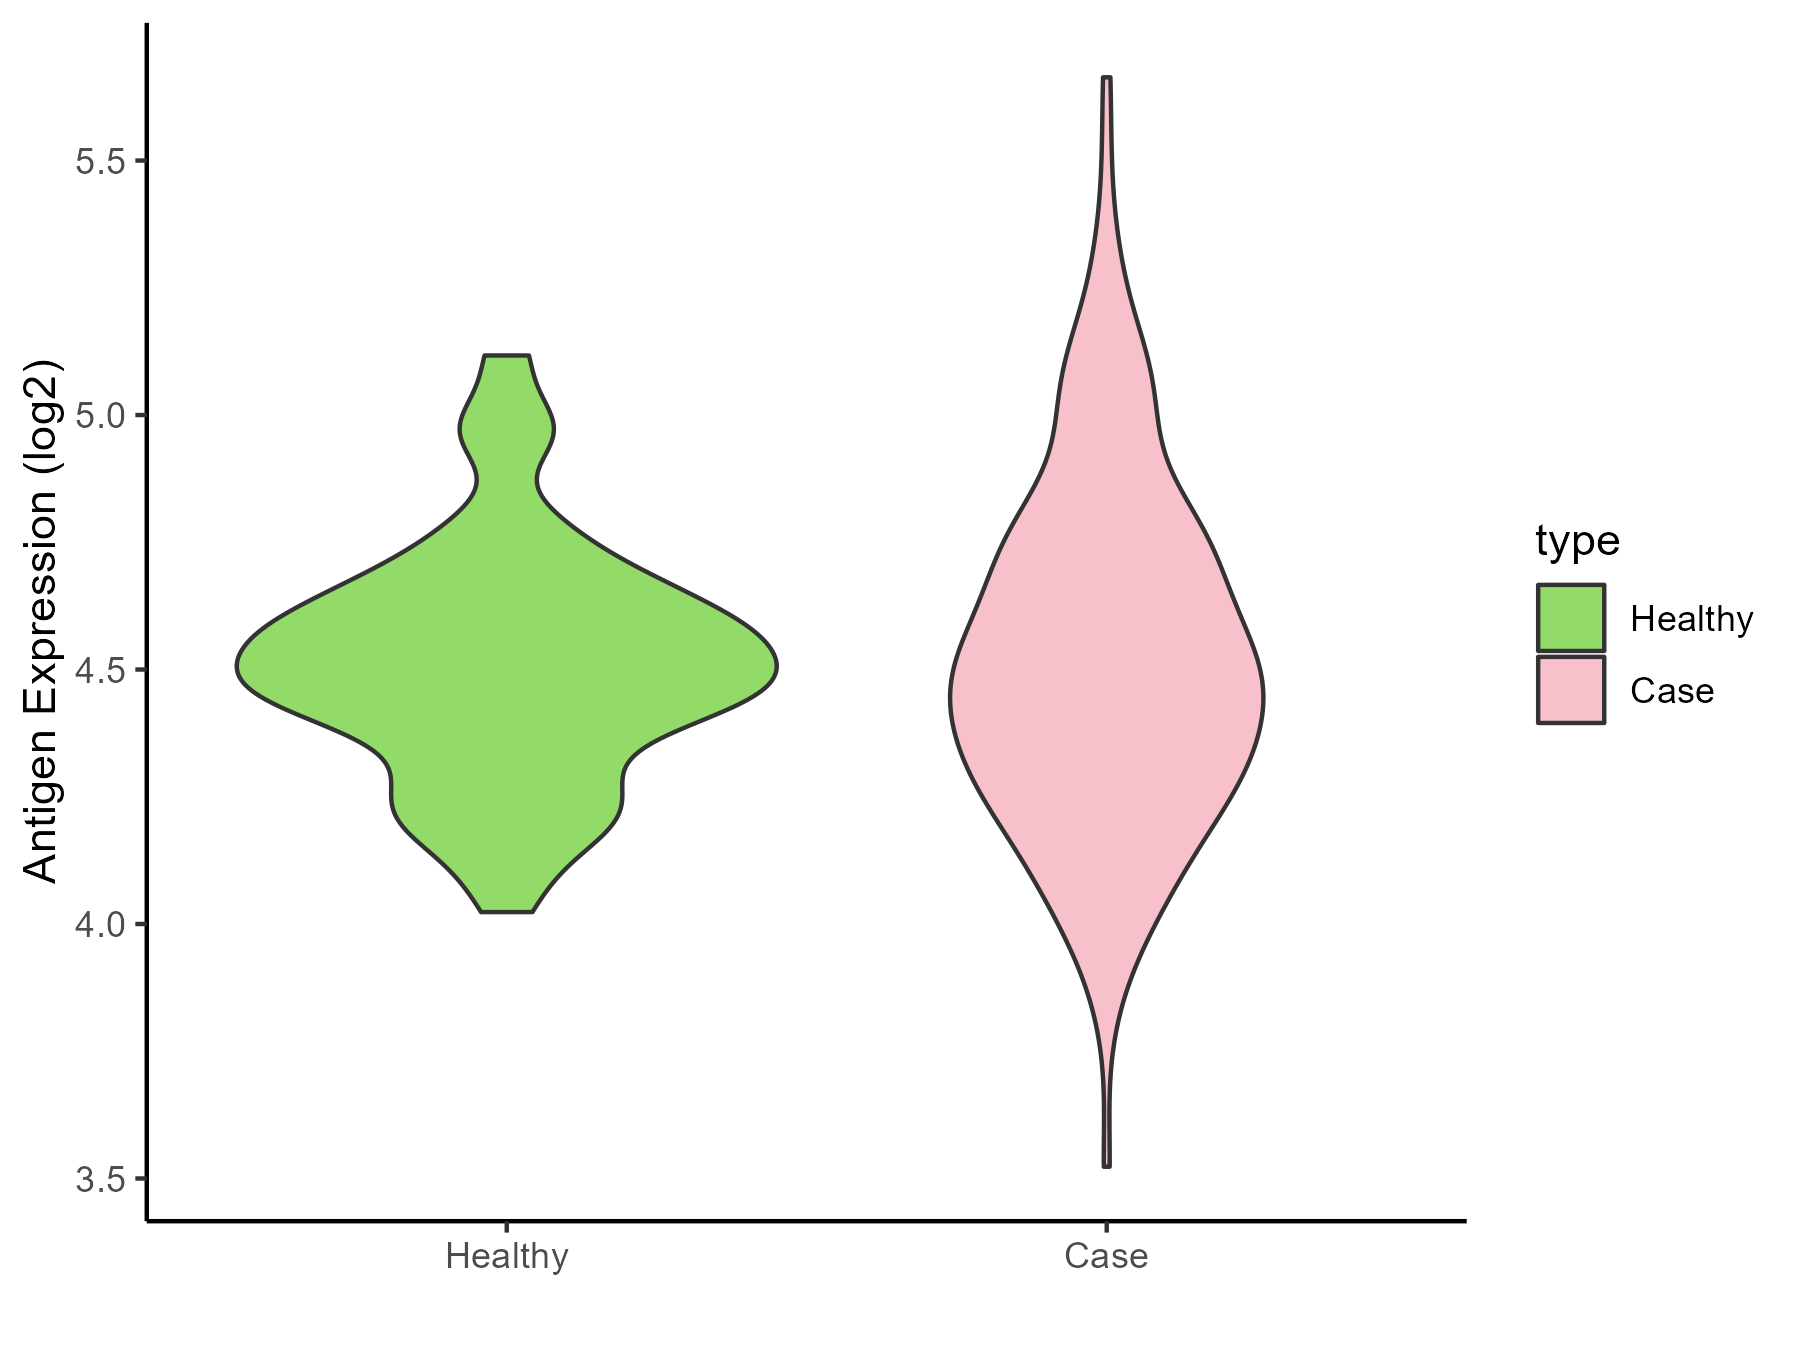
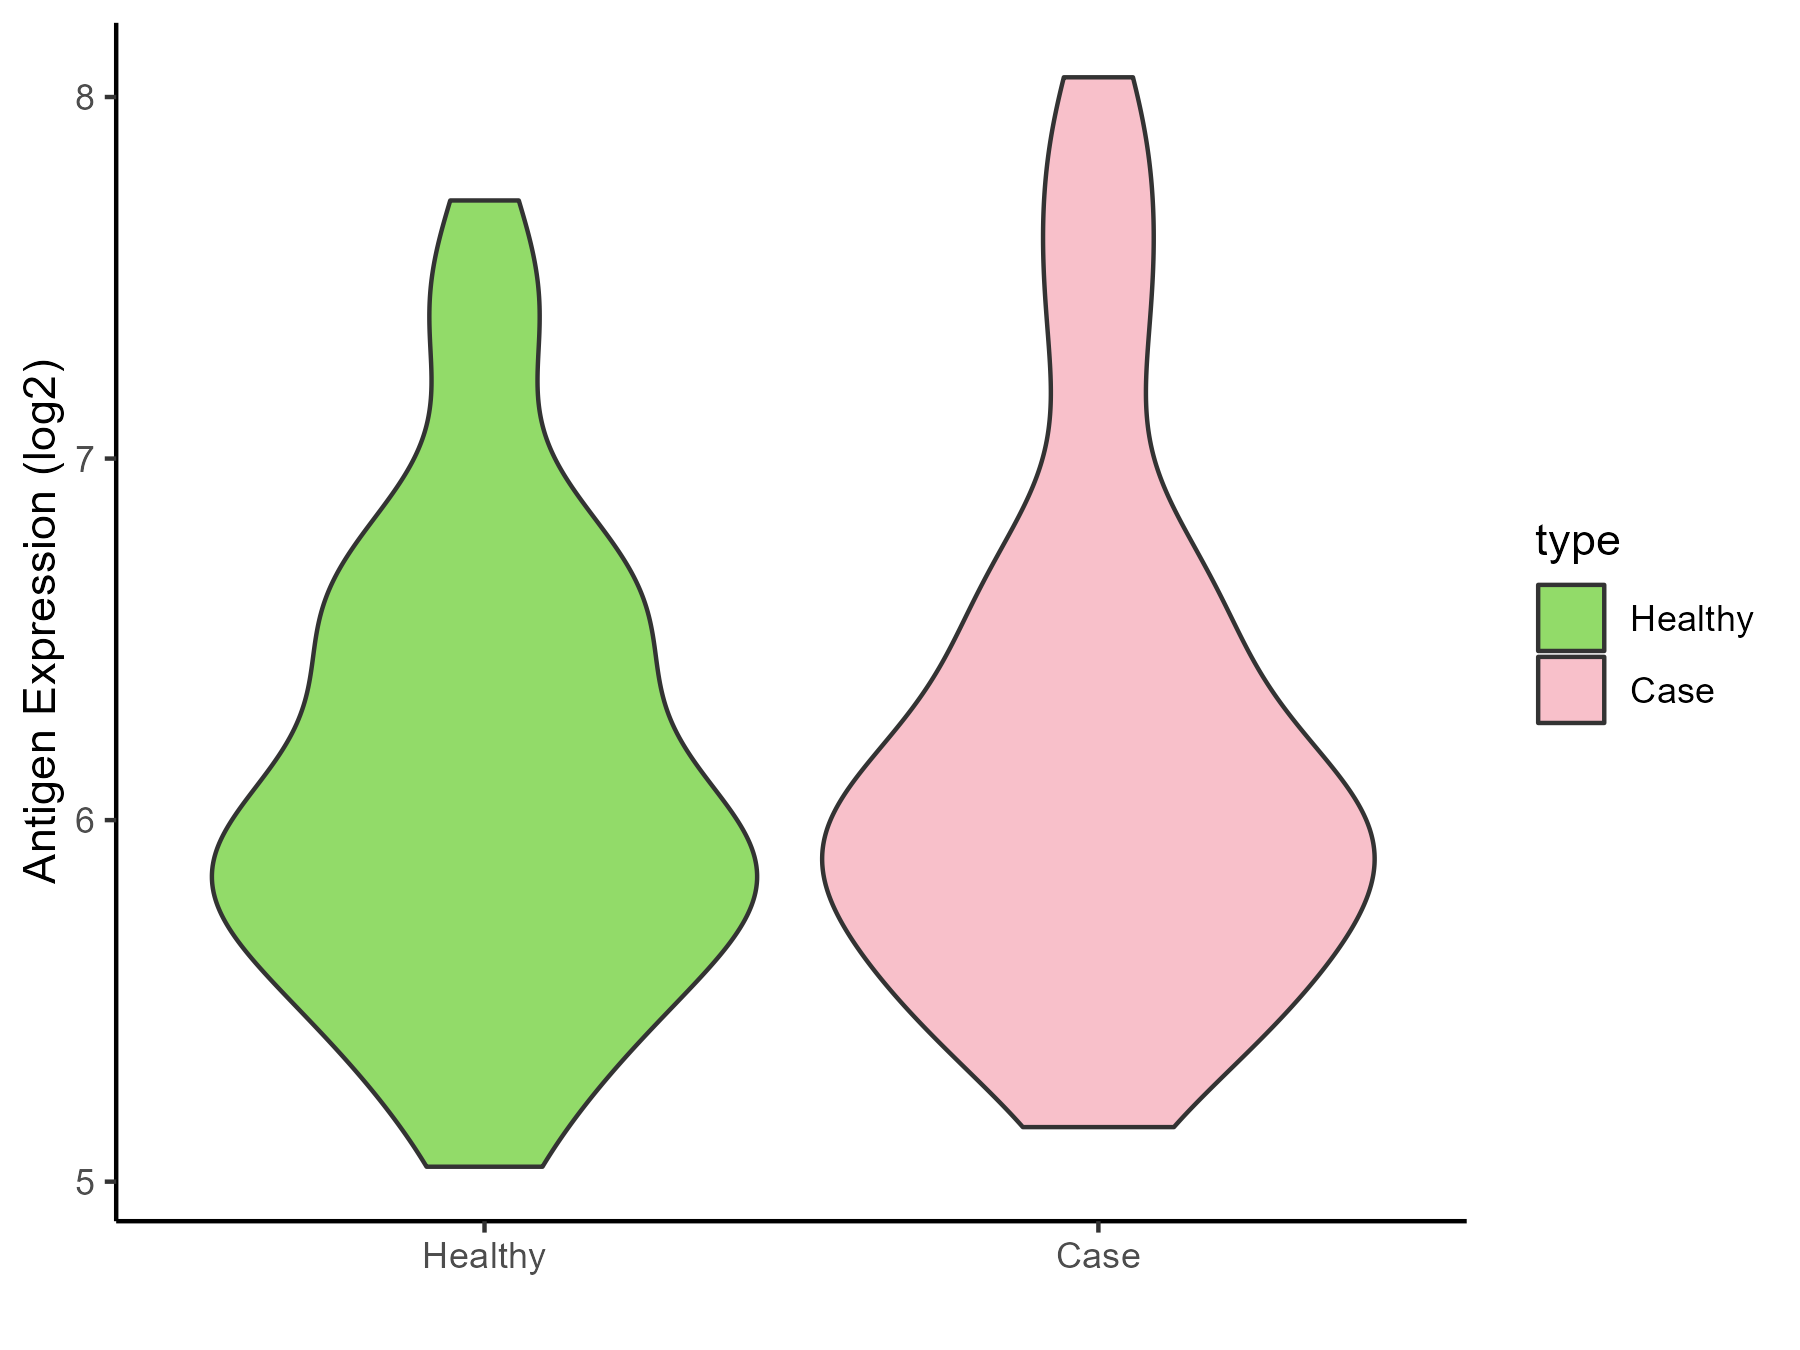
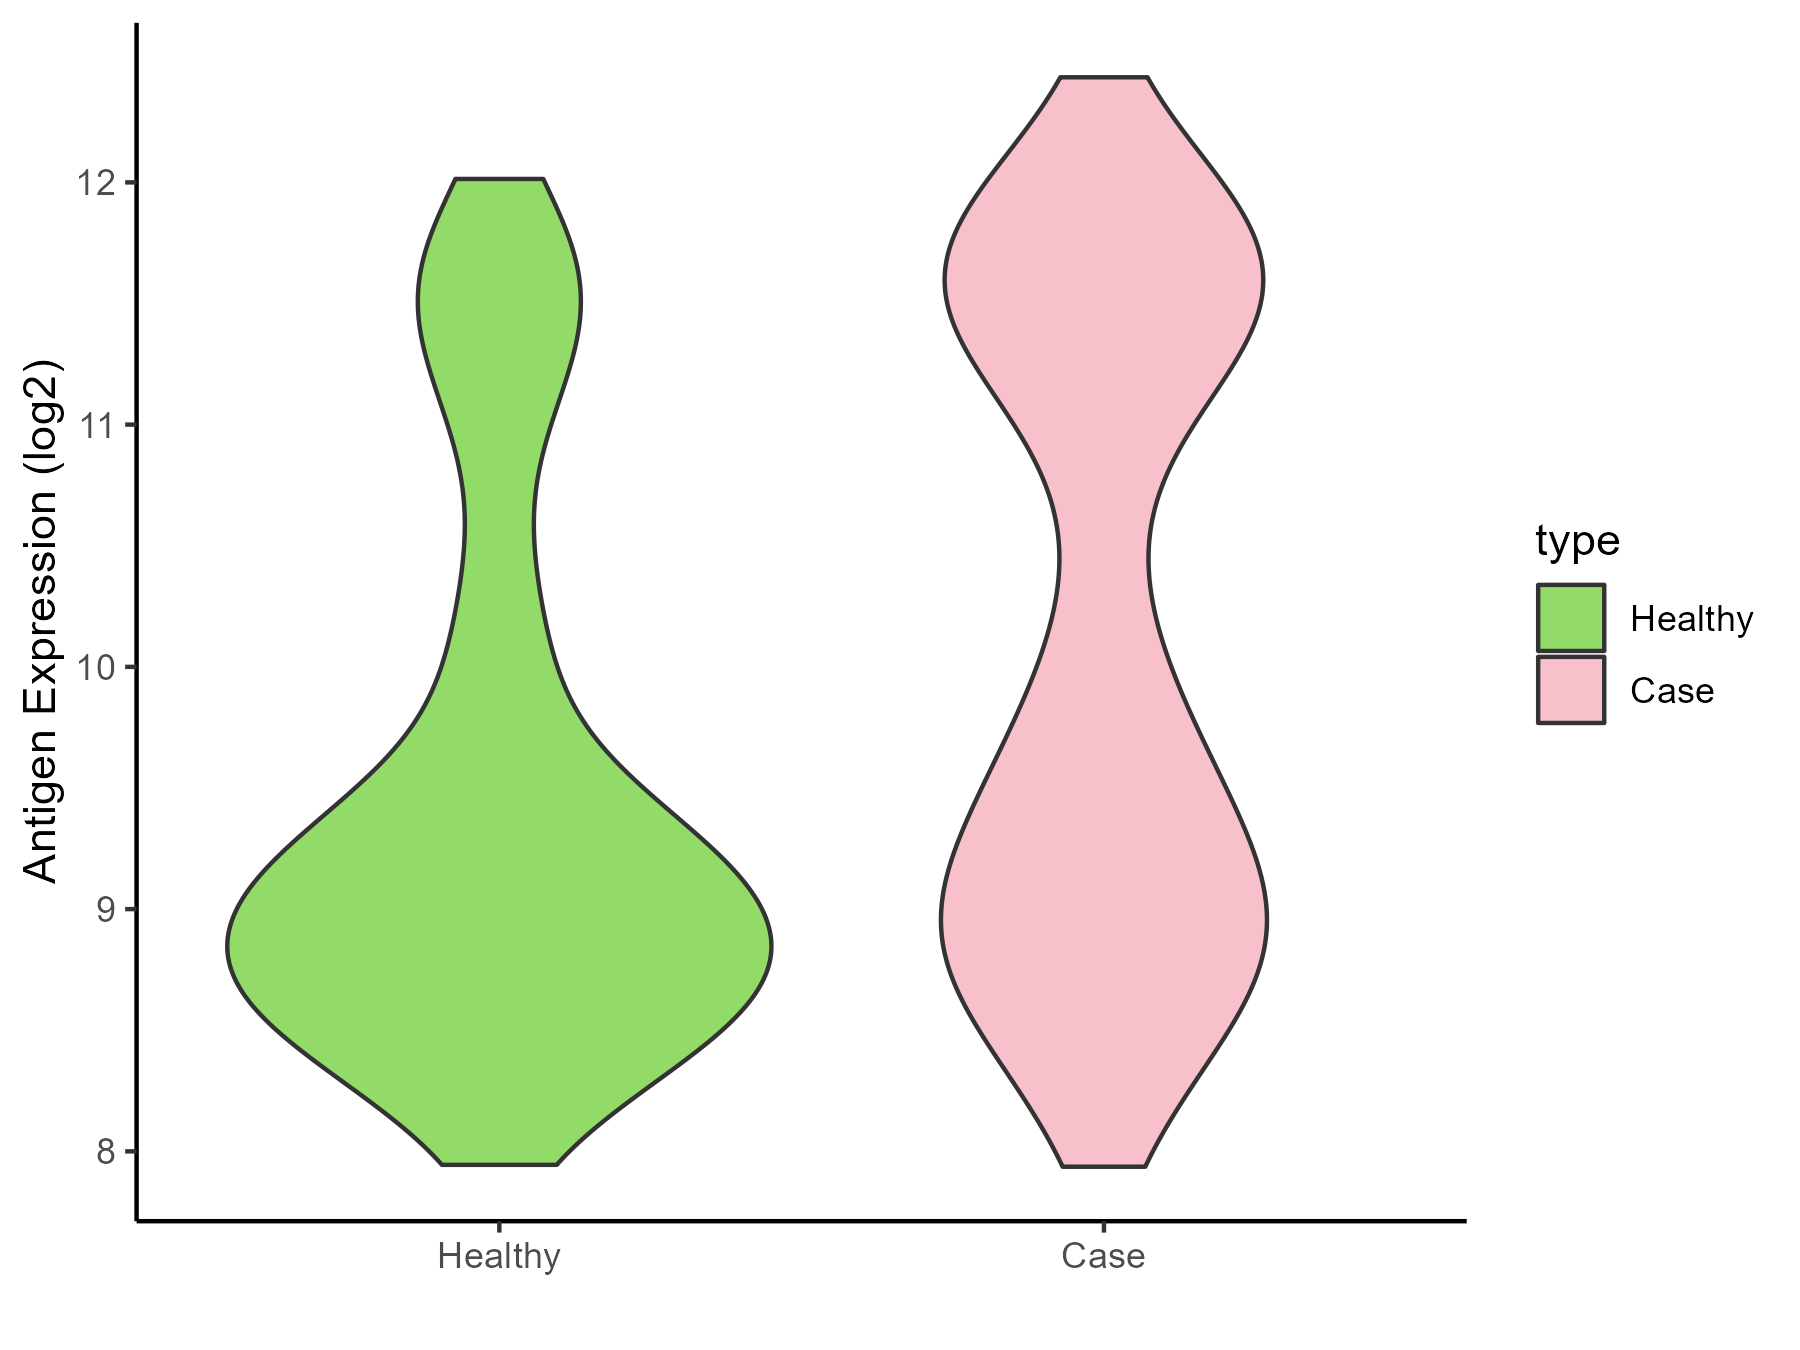
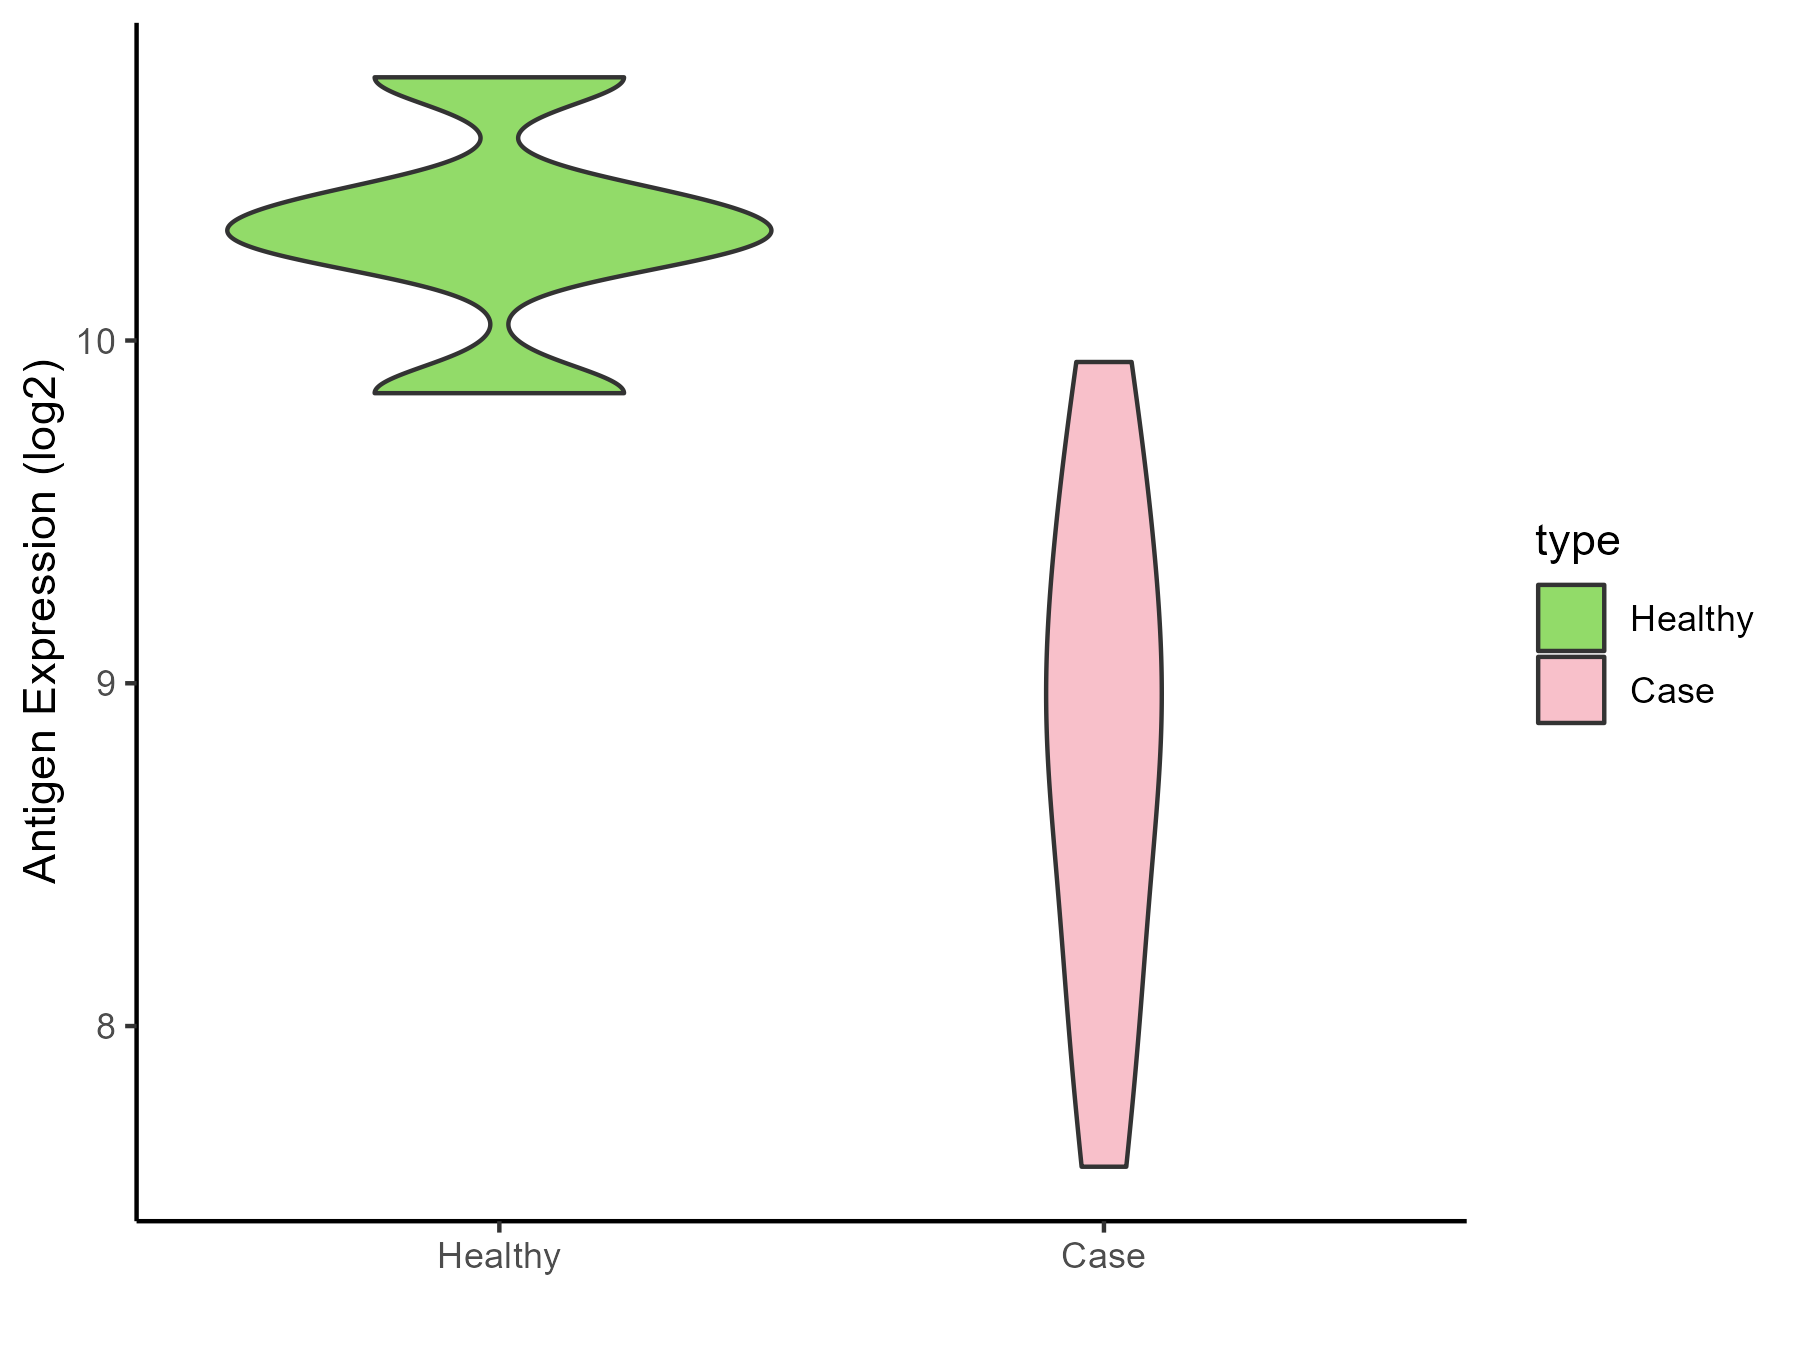
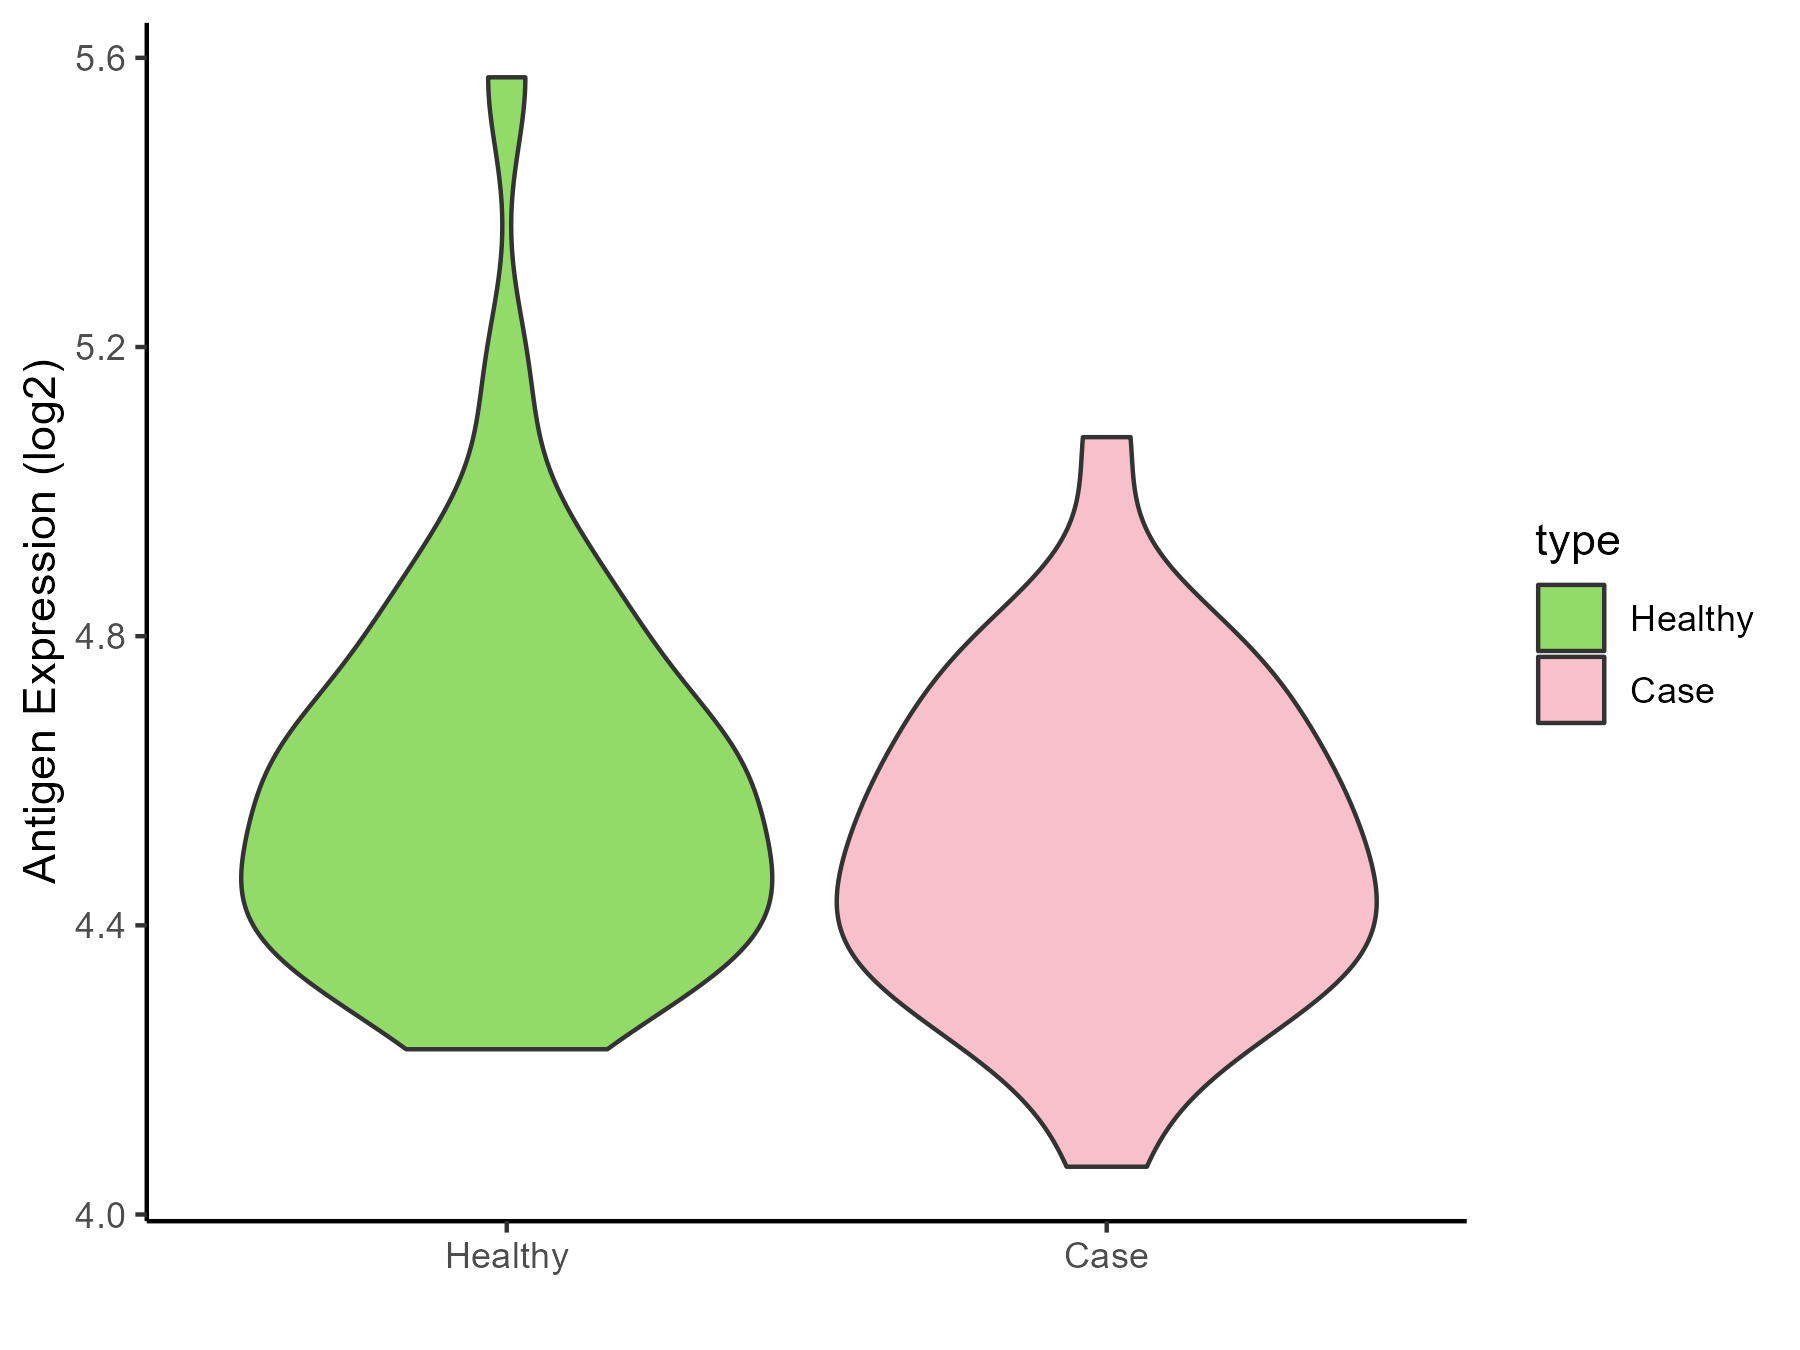
Brain cancer [ICD-11: 2A00]
Click to Show/Hide
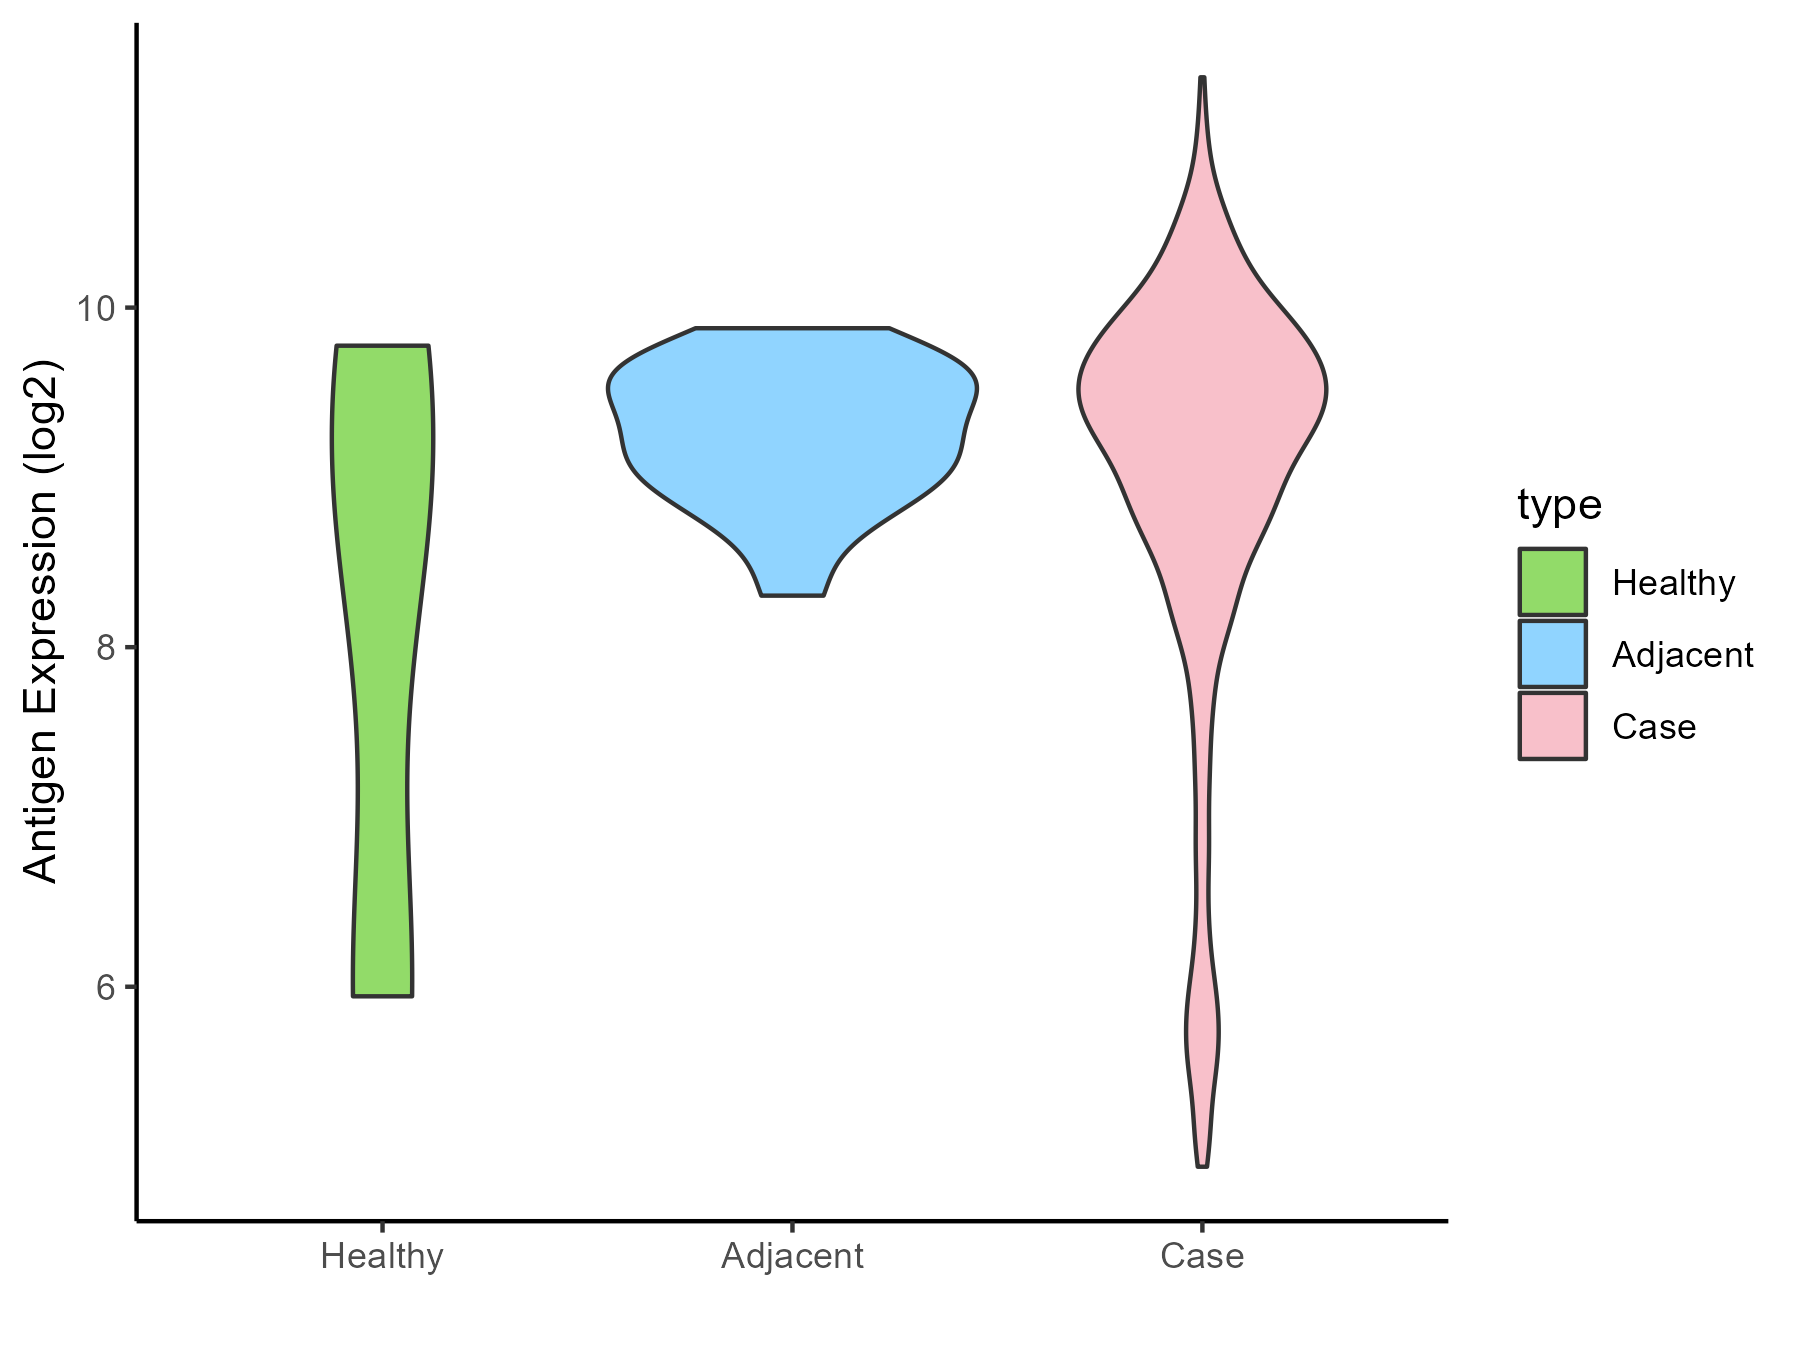
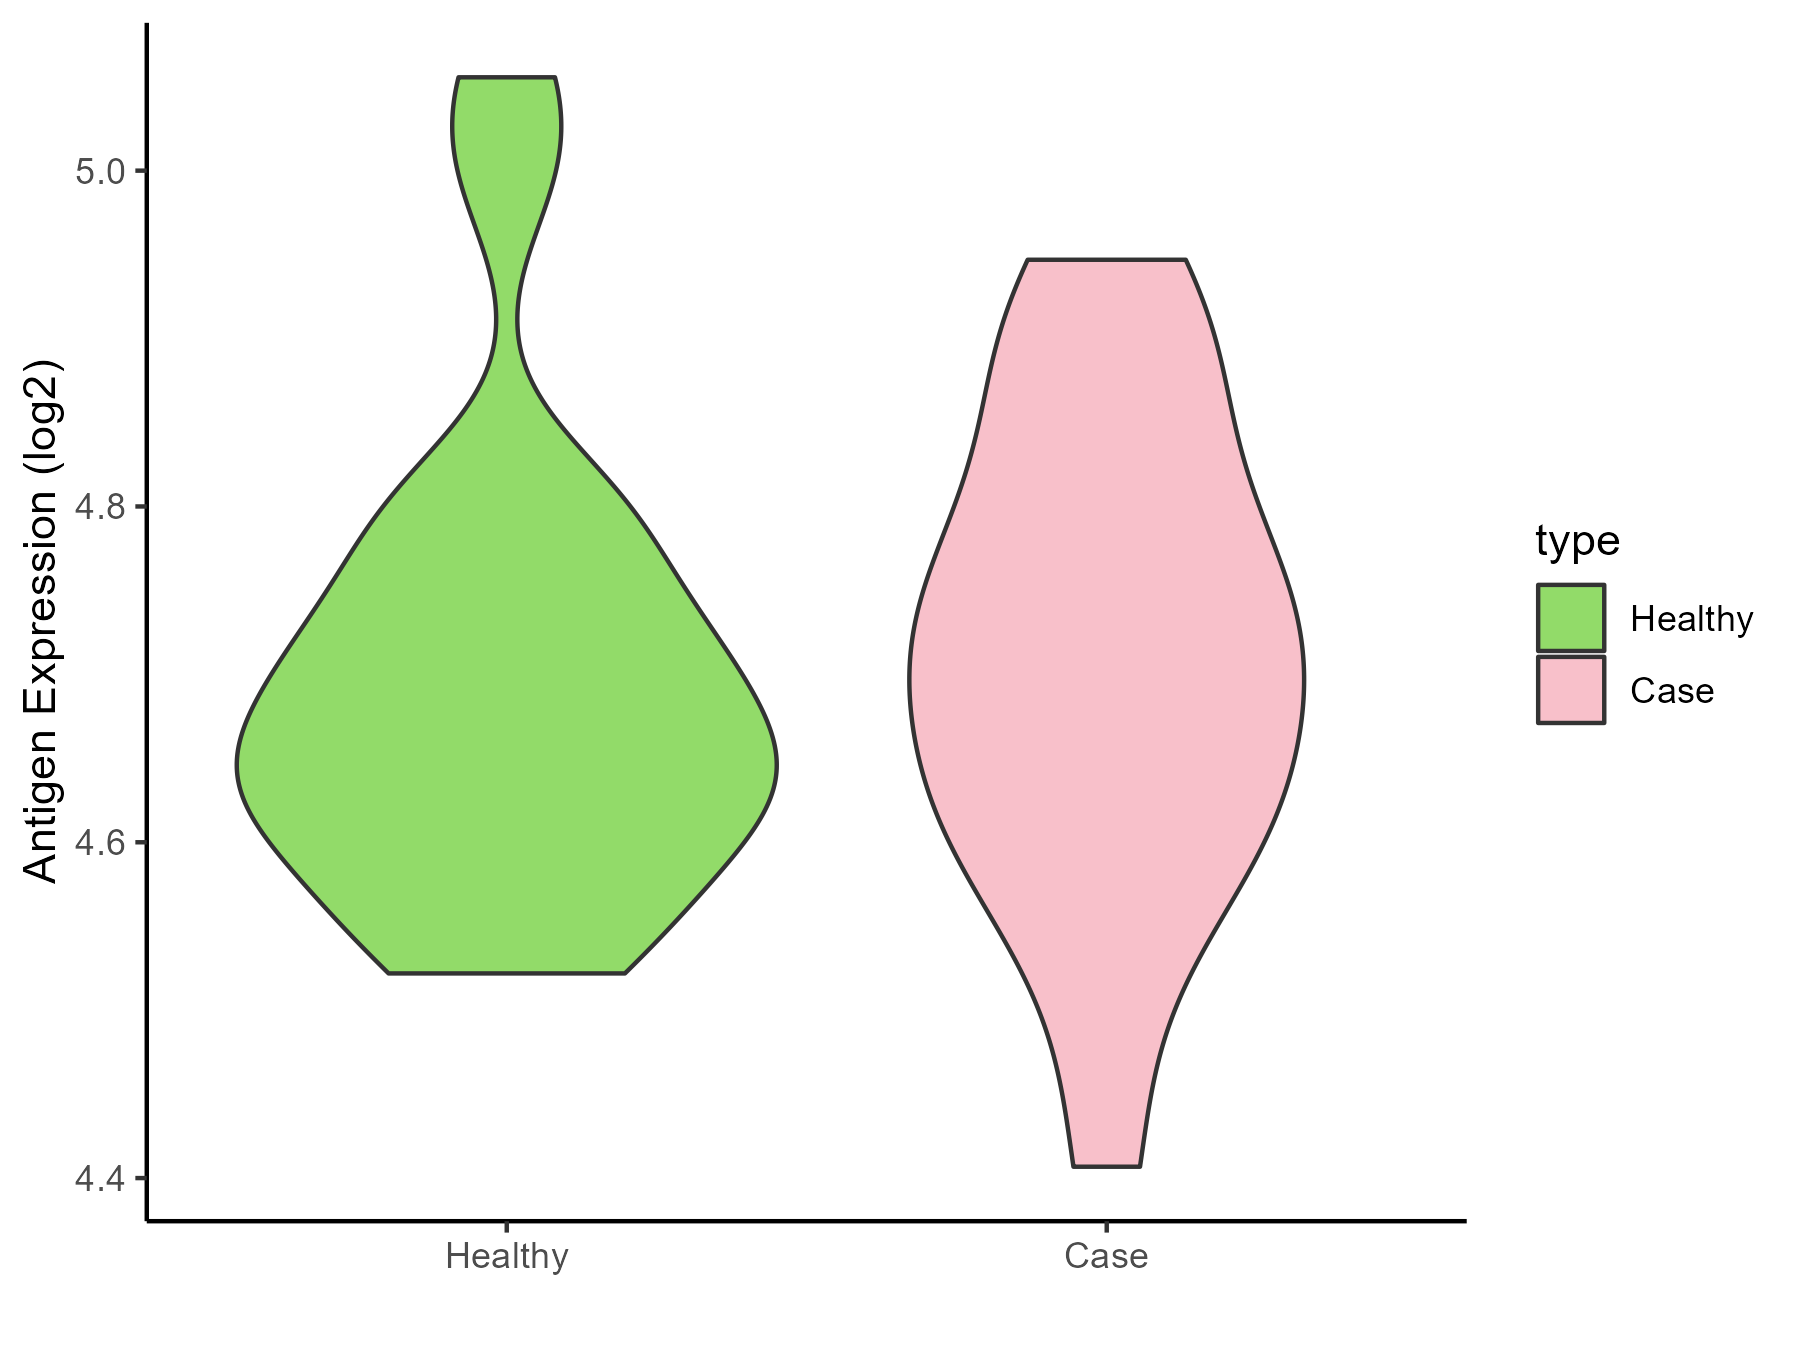
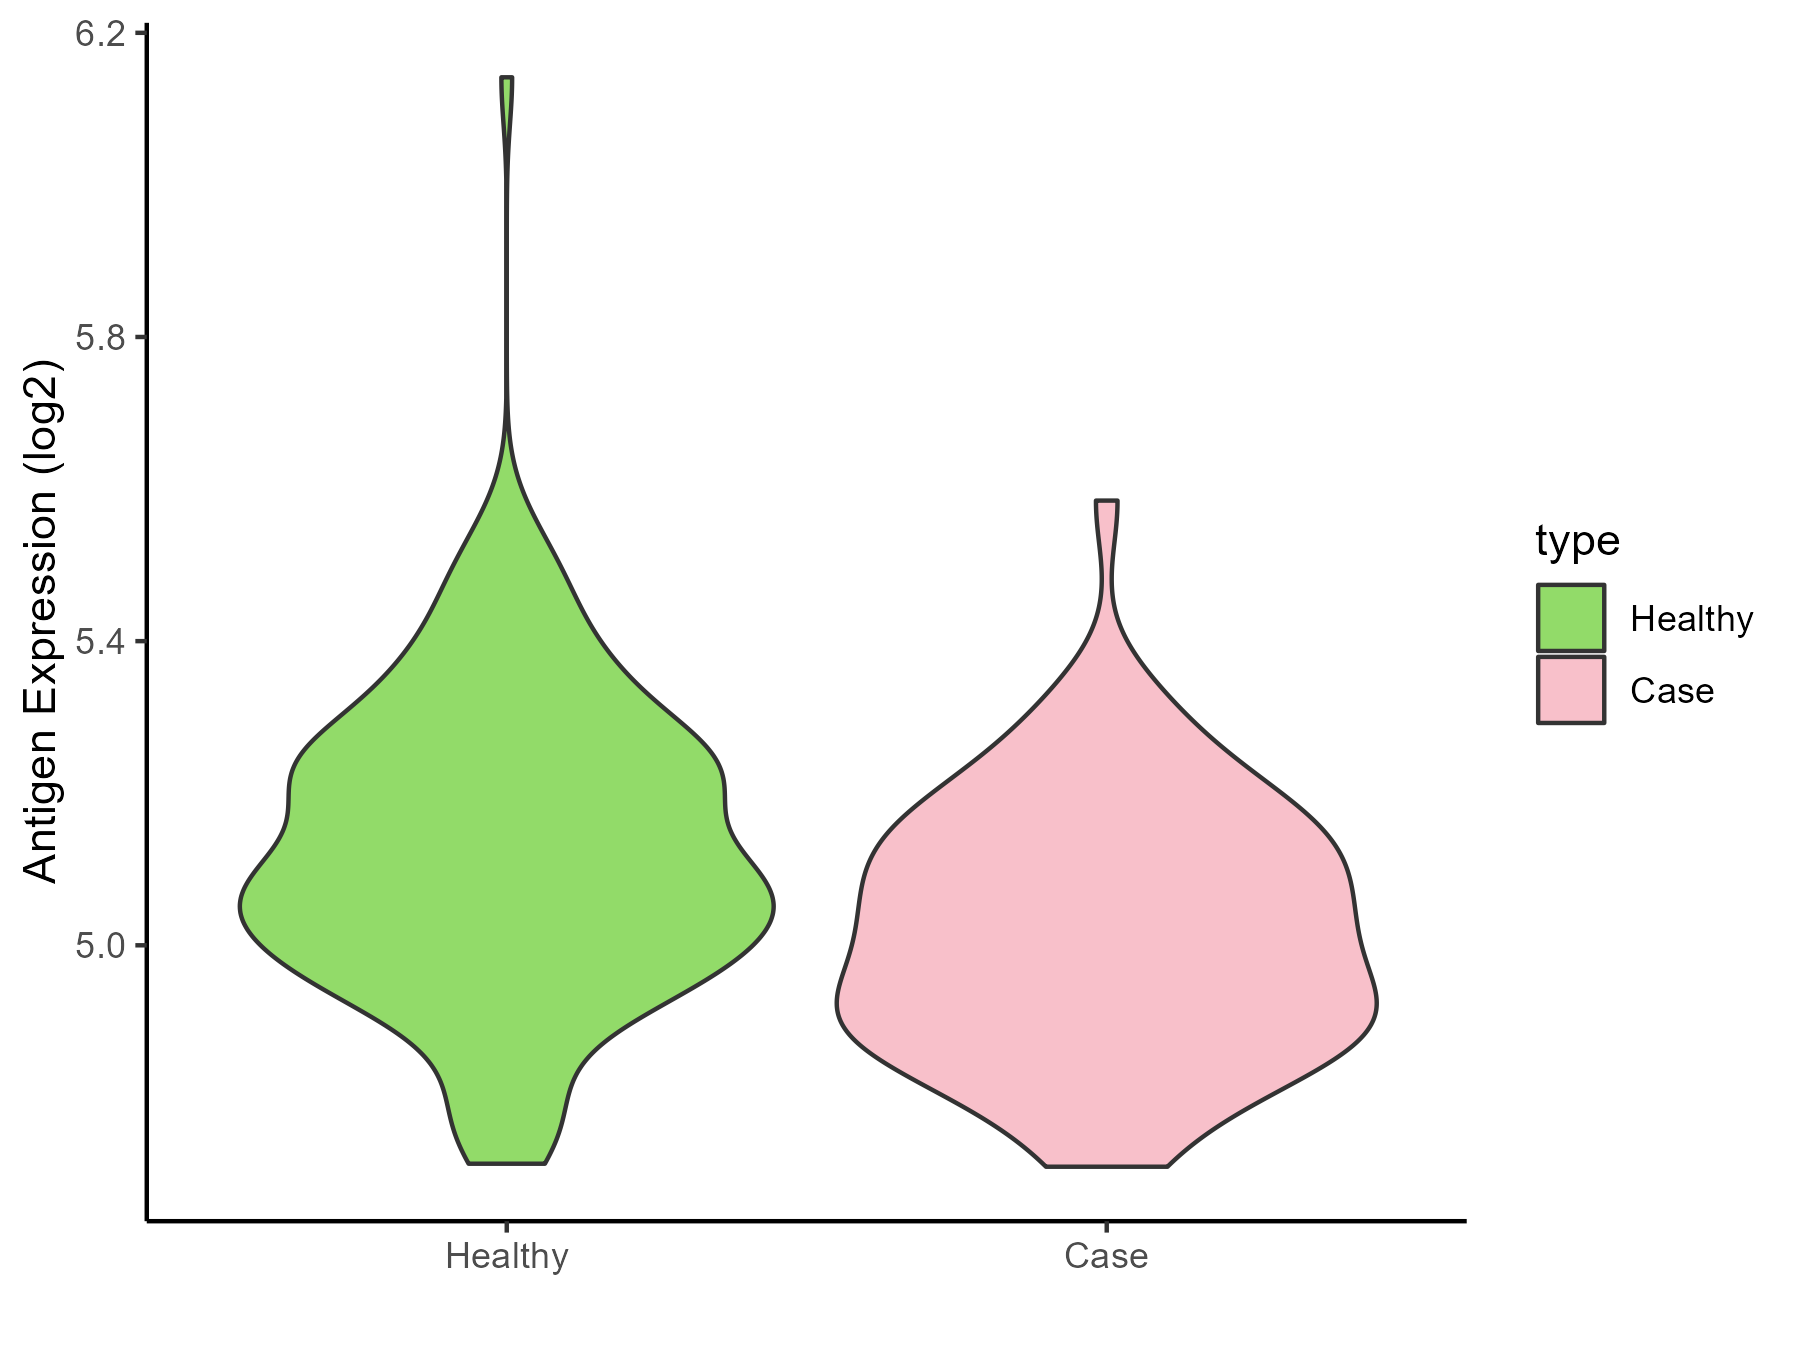
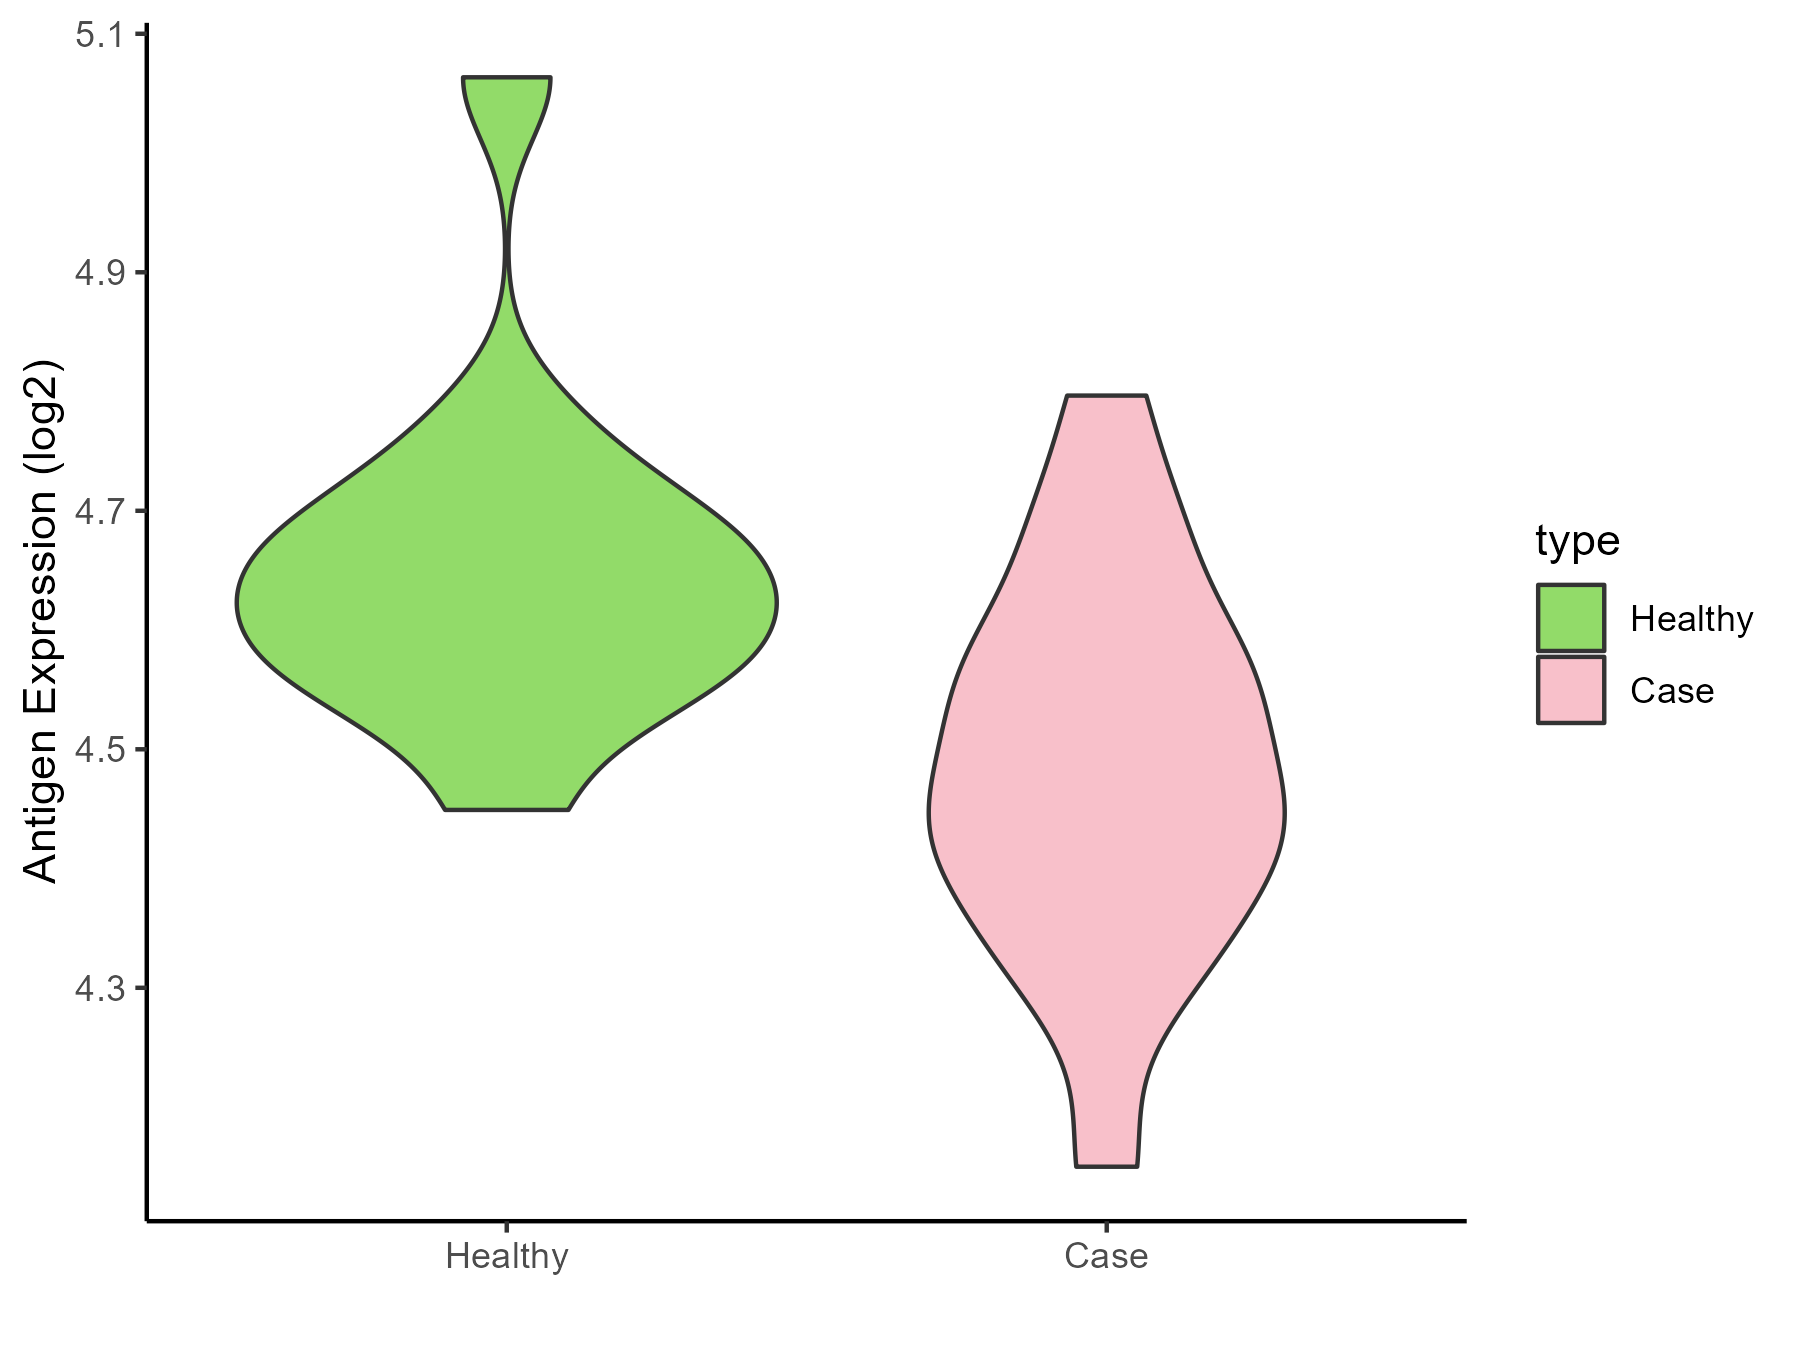
| Differential expression pattern of antigen in diseases |
| The Studied Tissue |
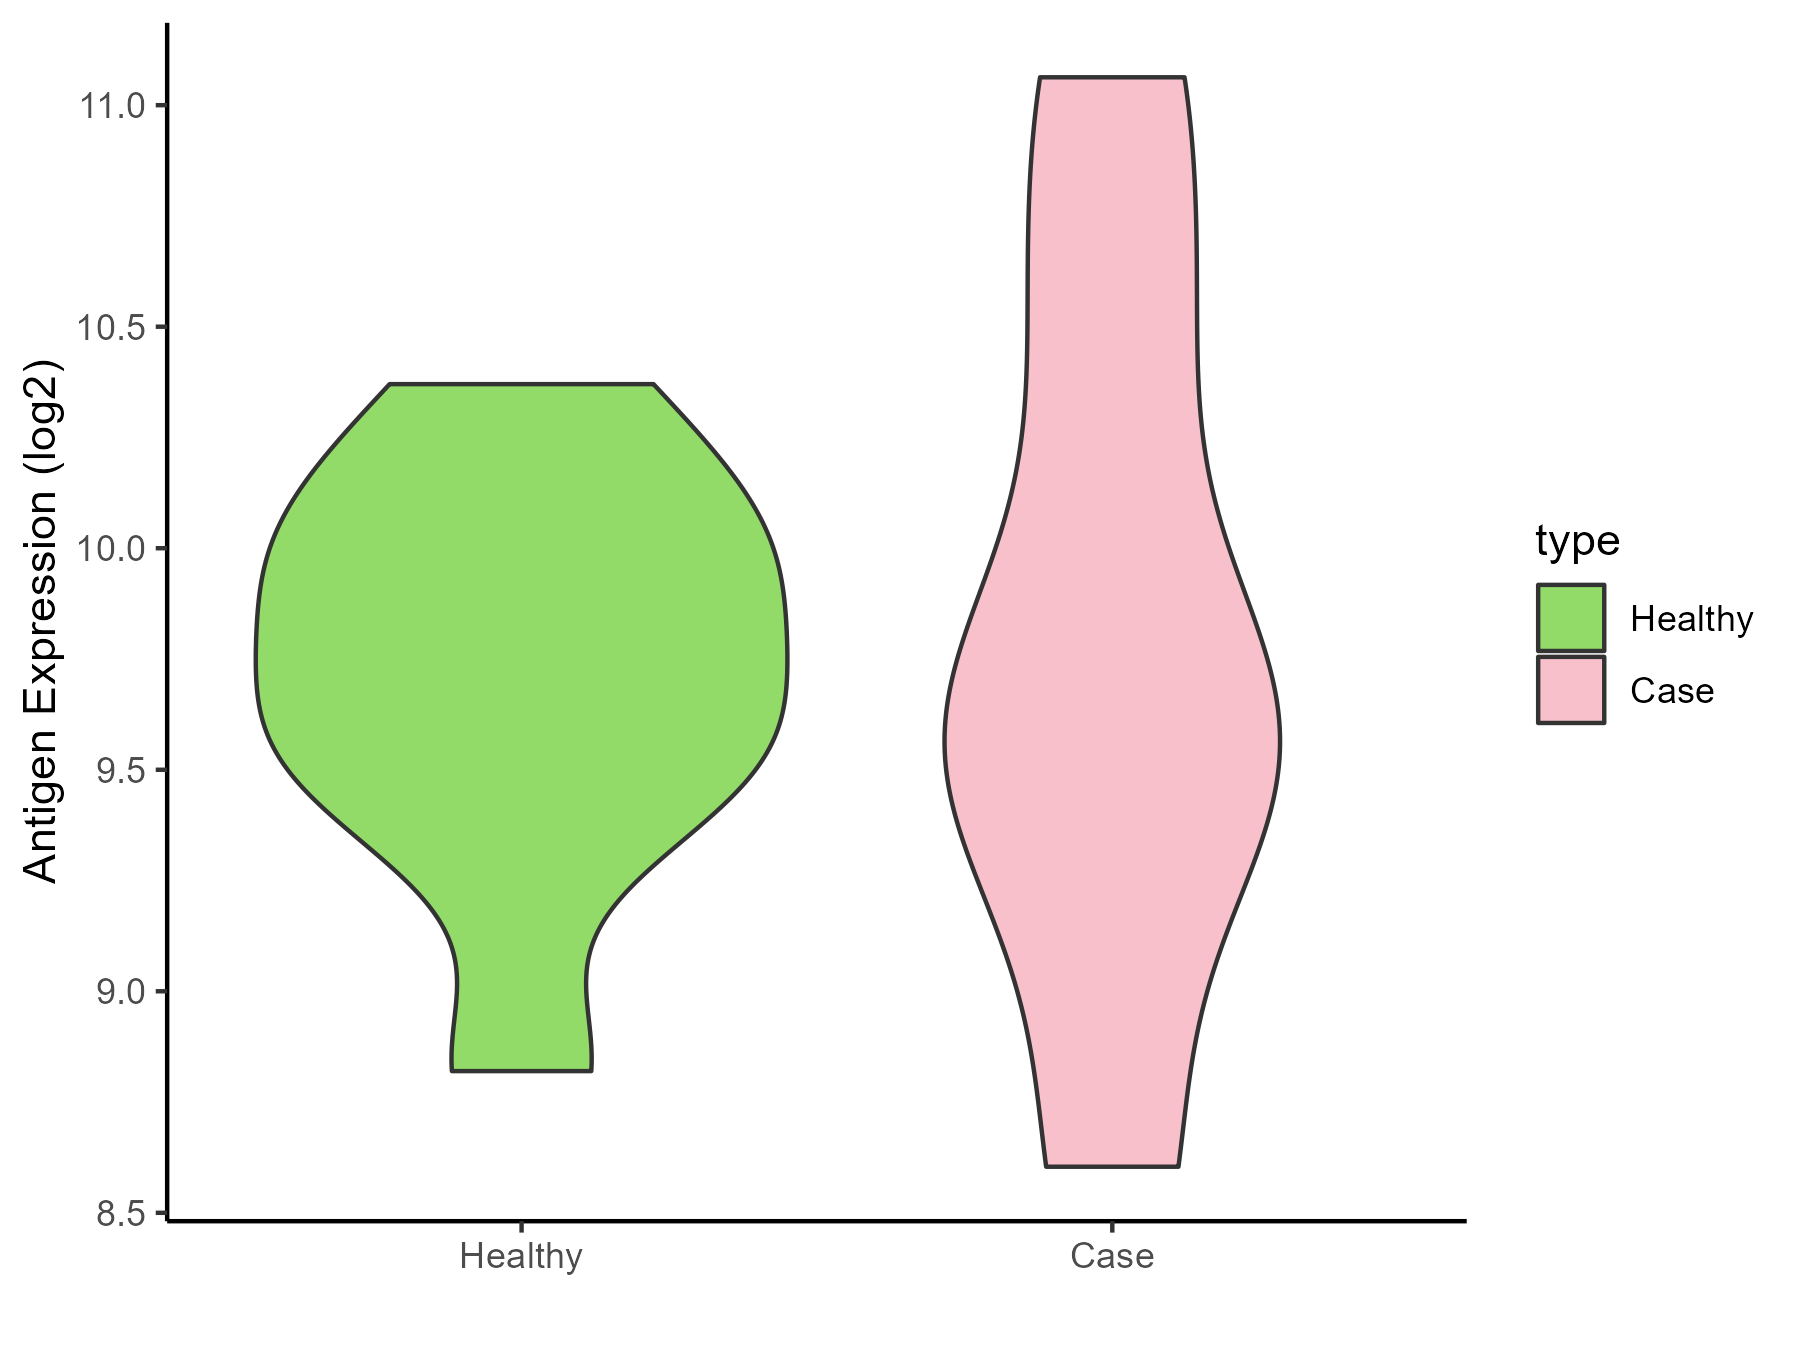
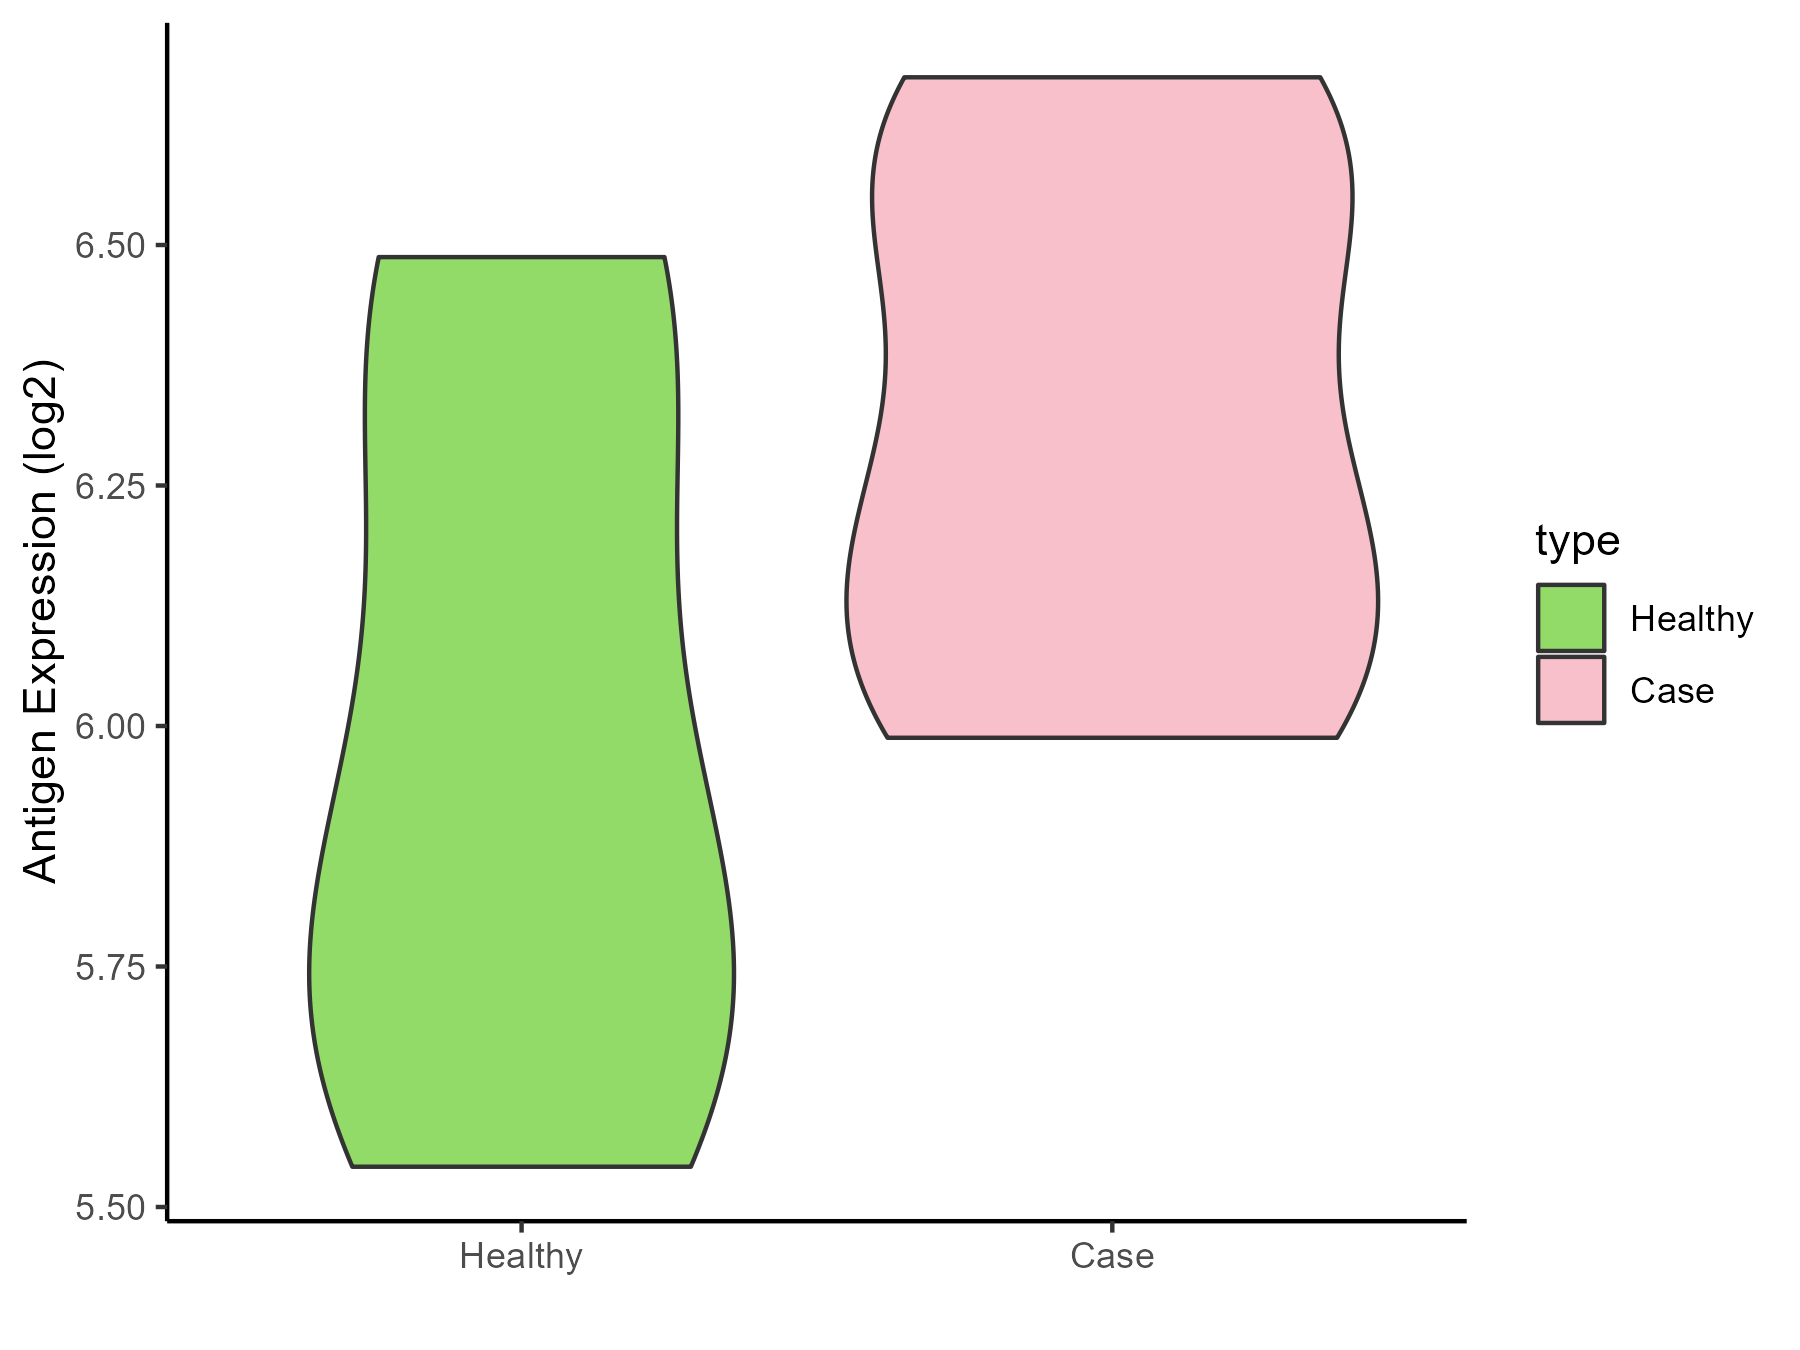
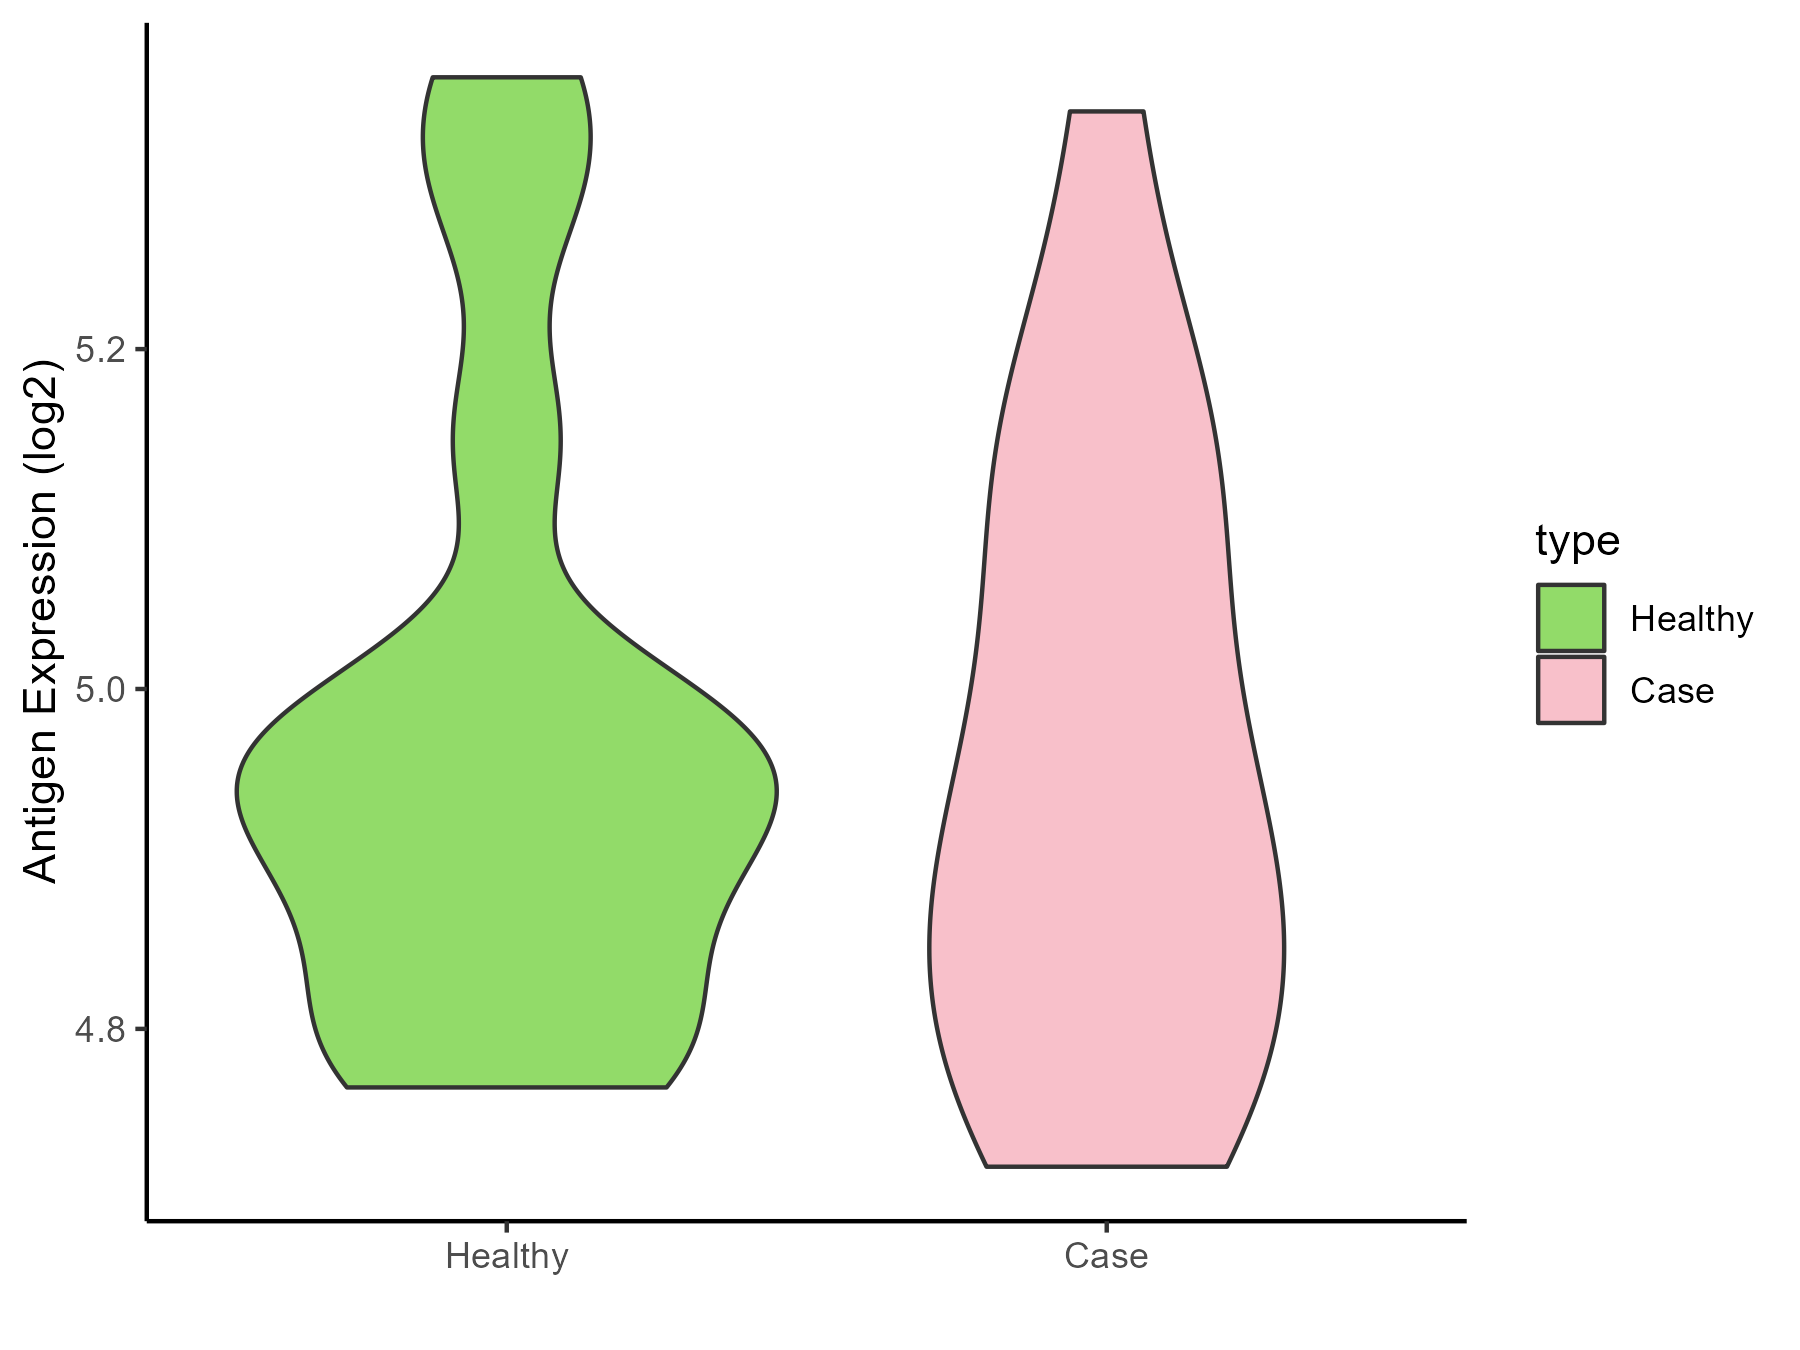
White matter |
| The Specific Disease |
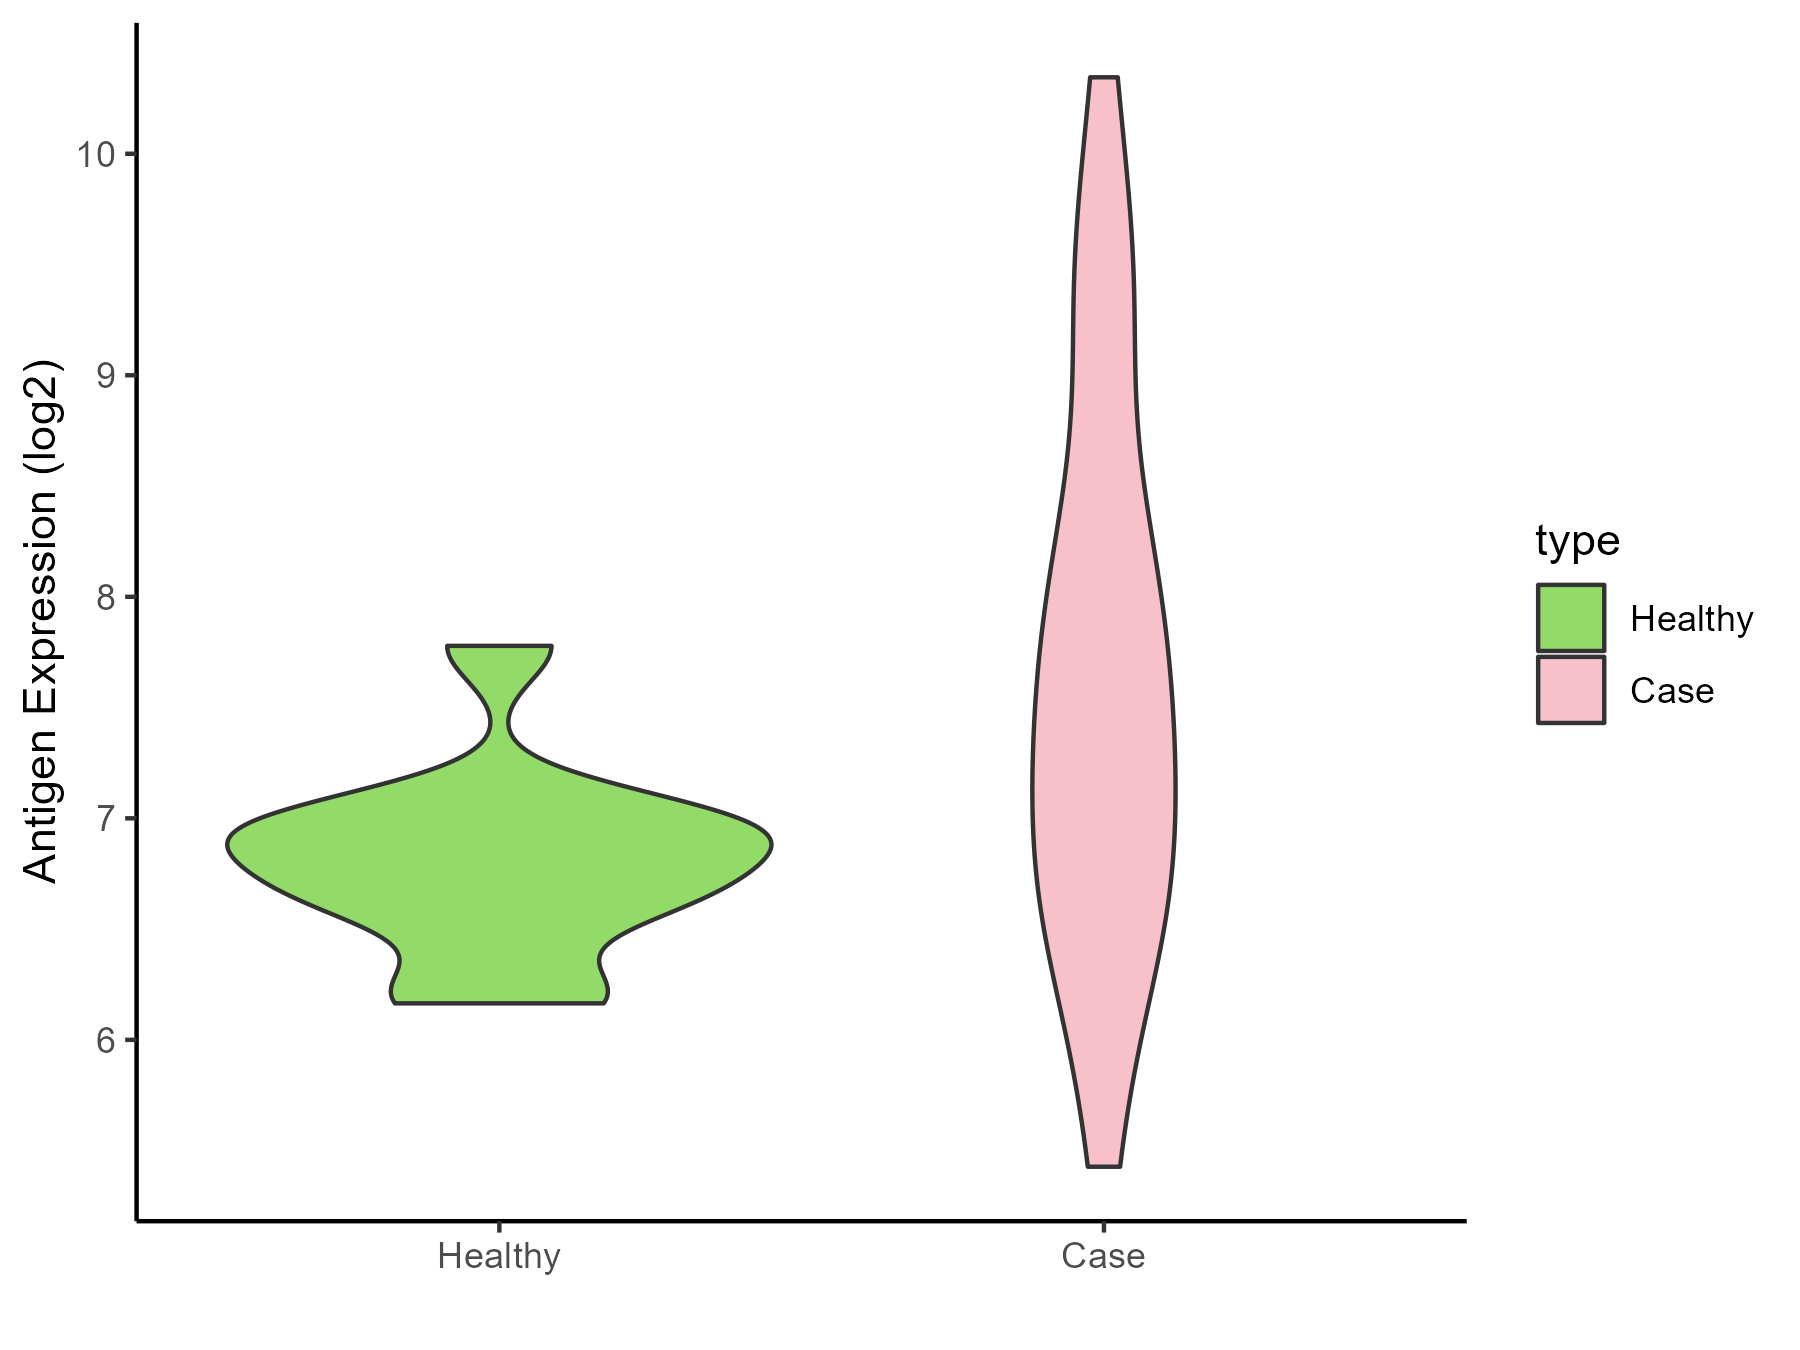
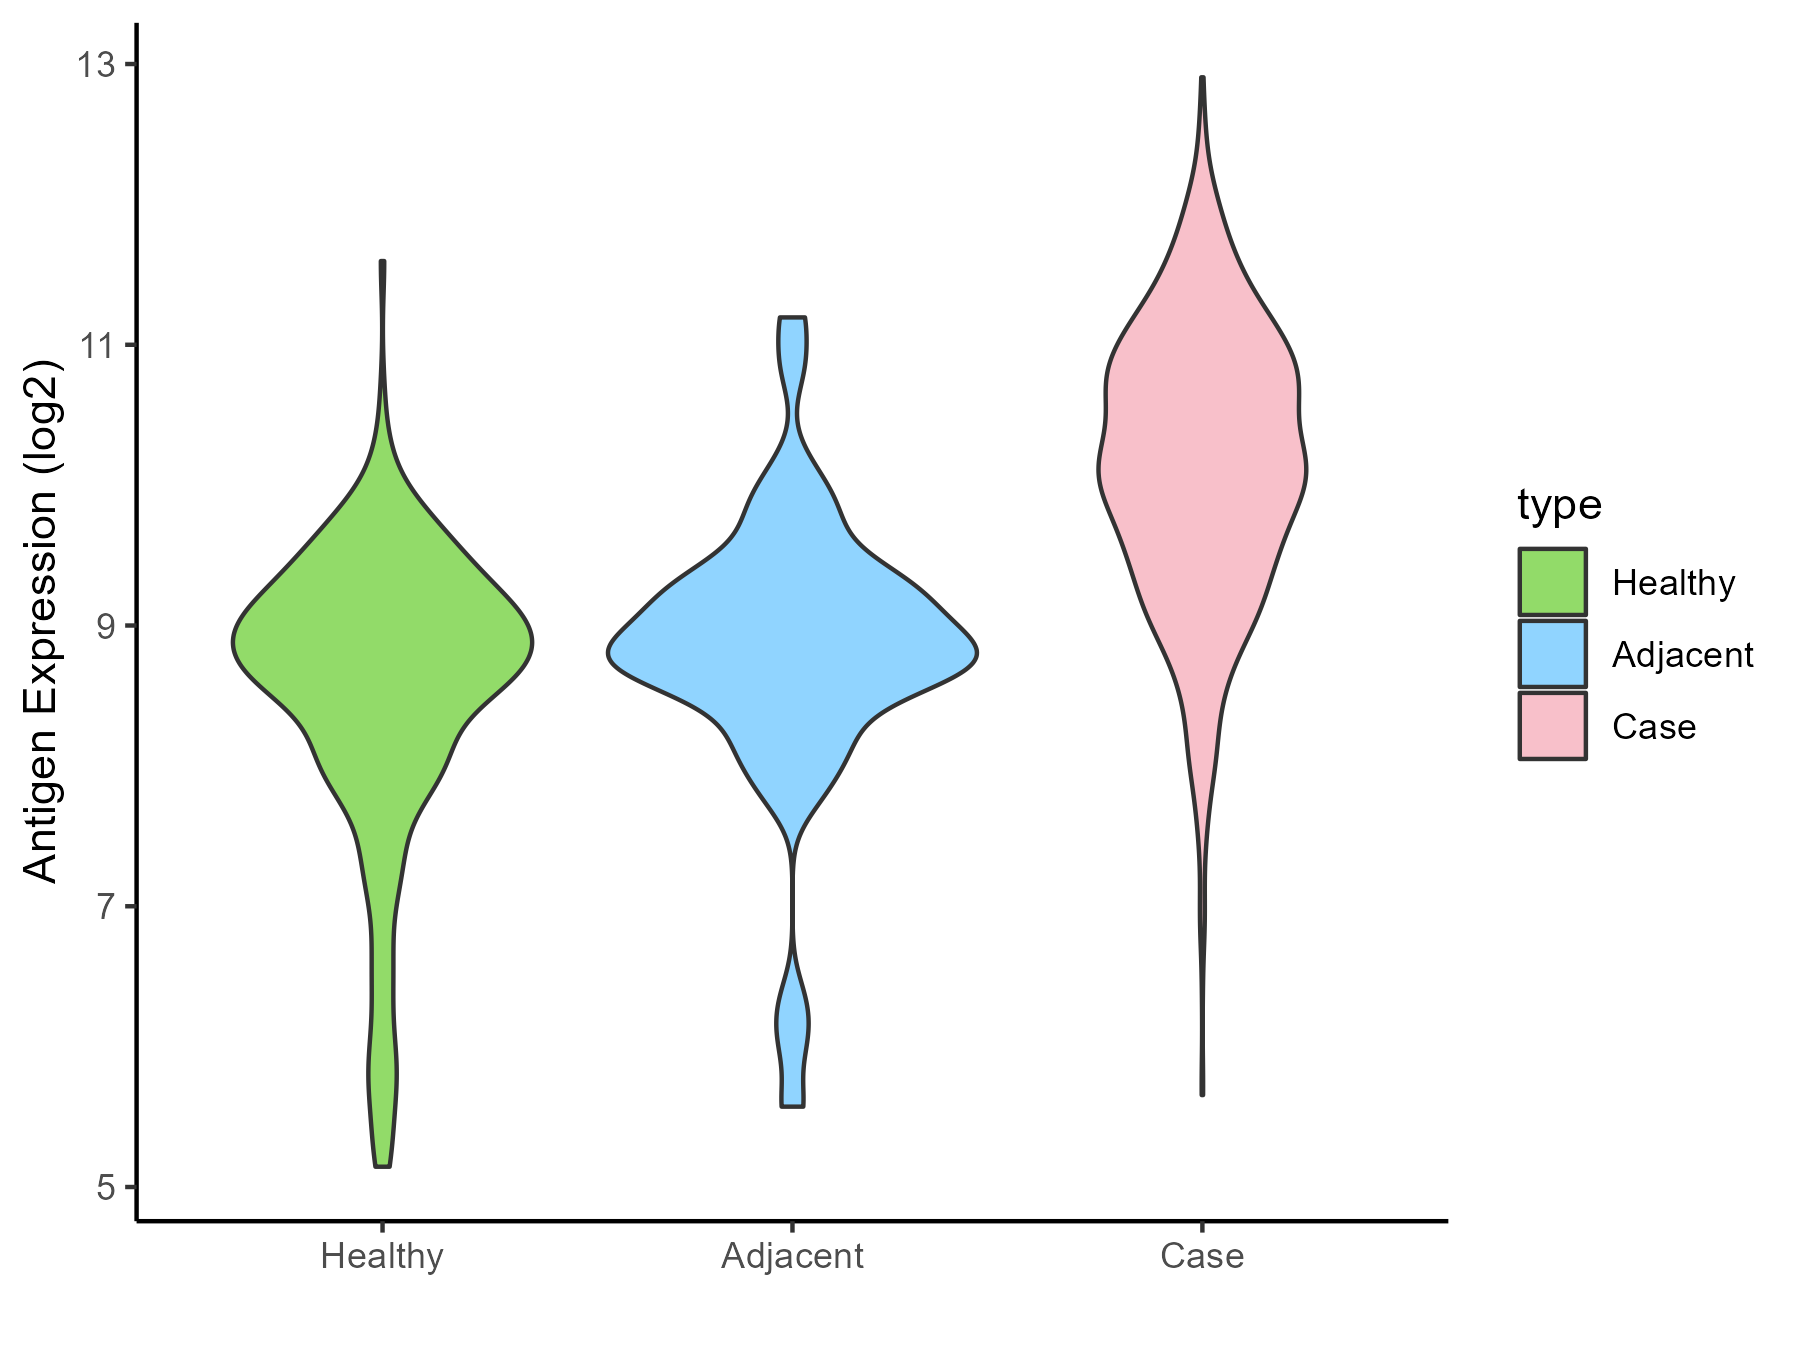
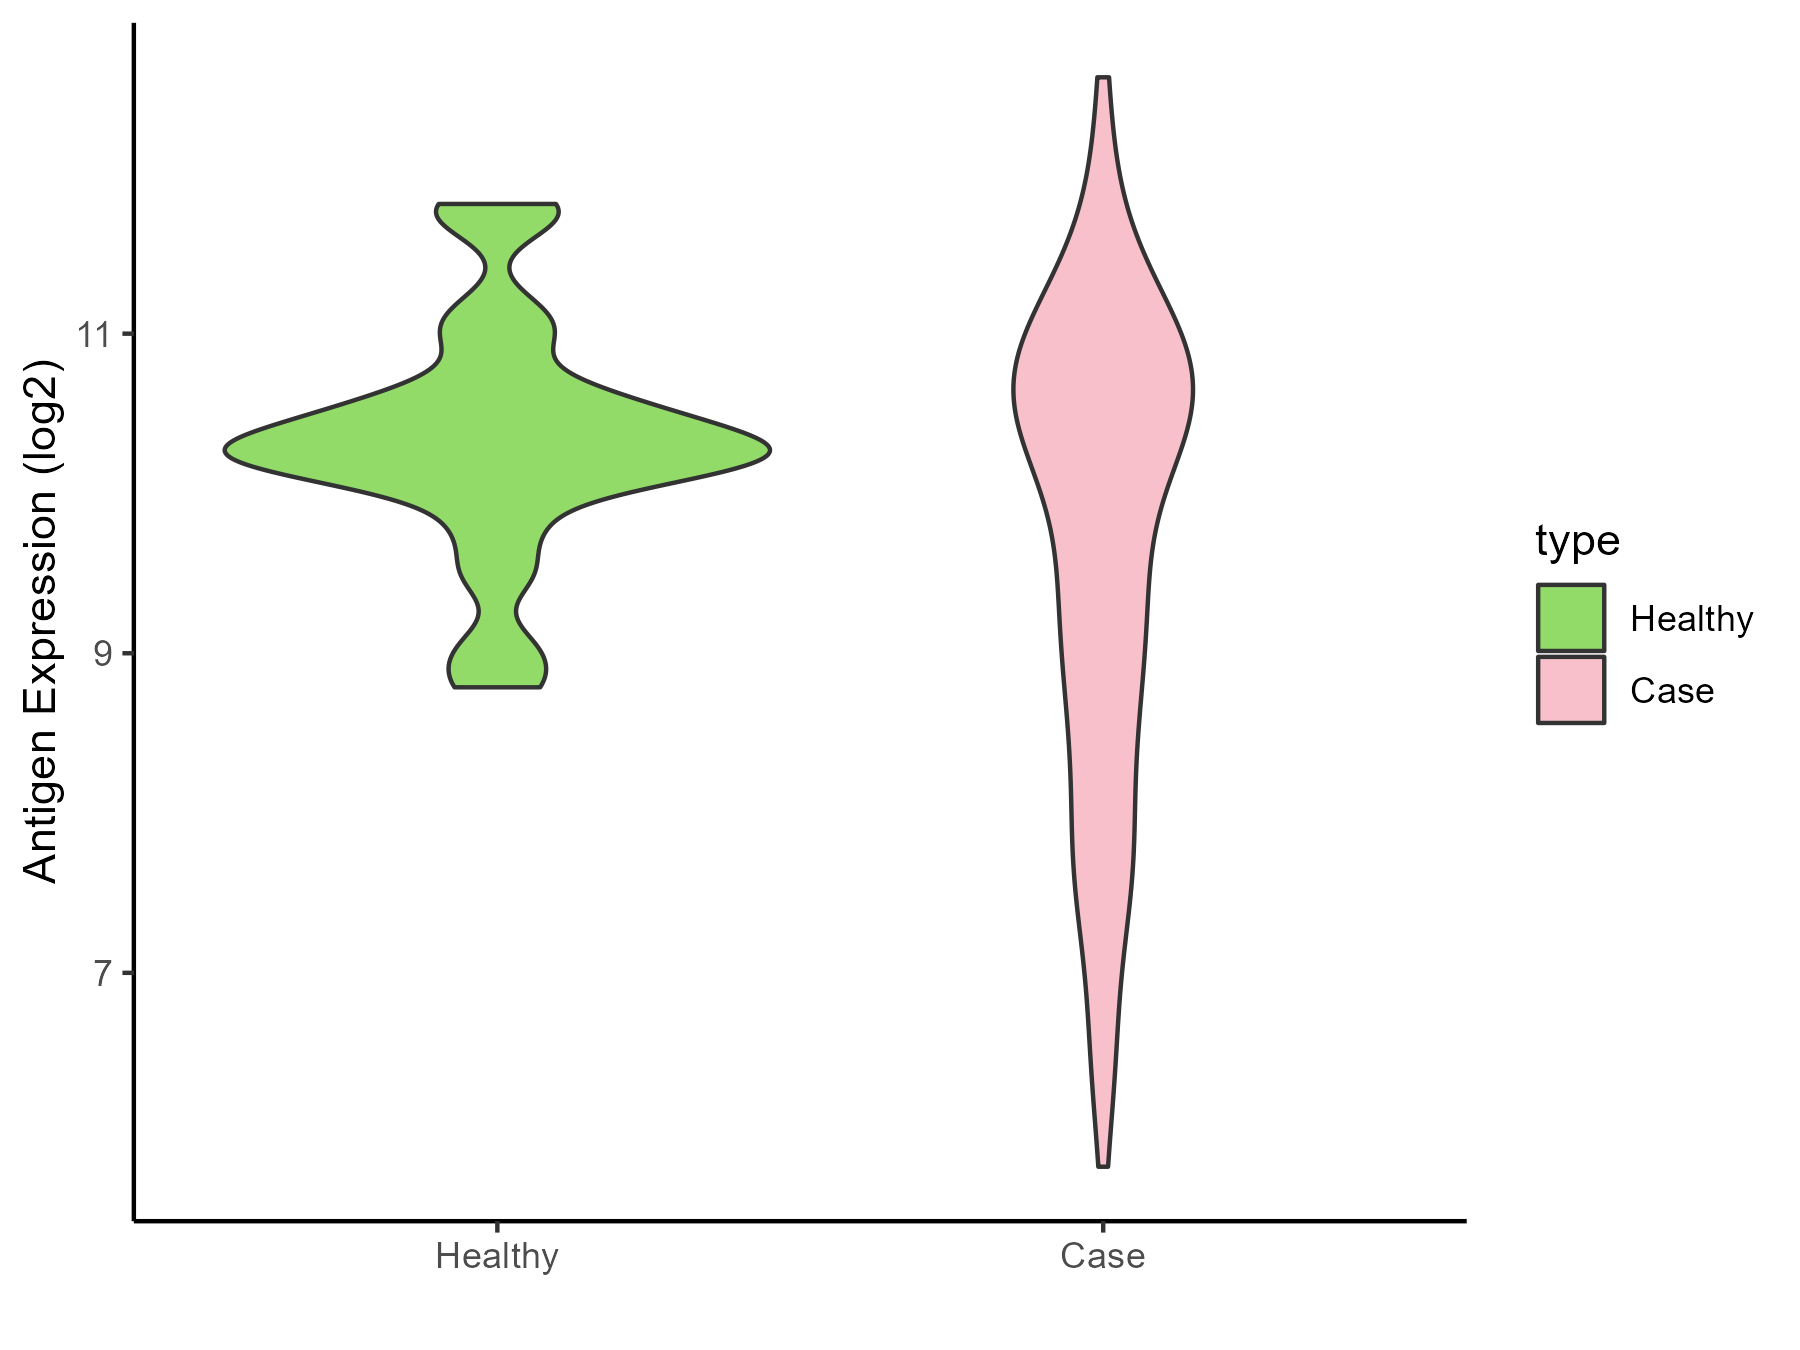
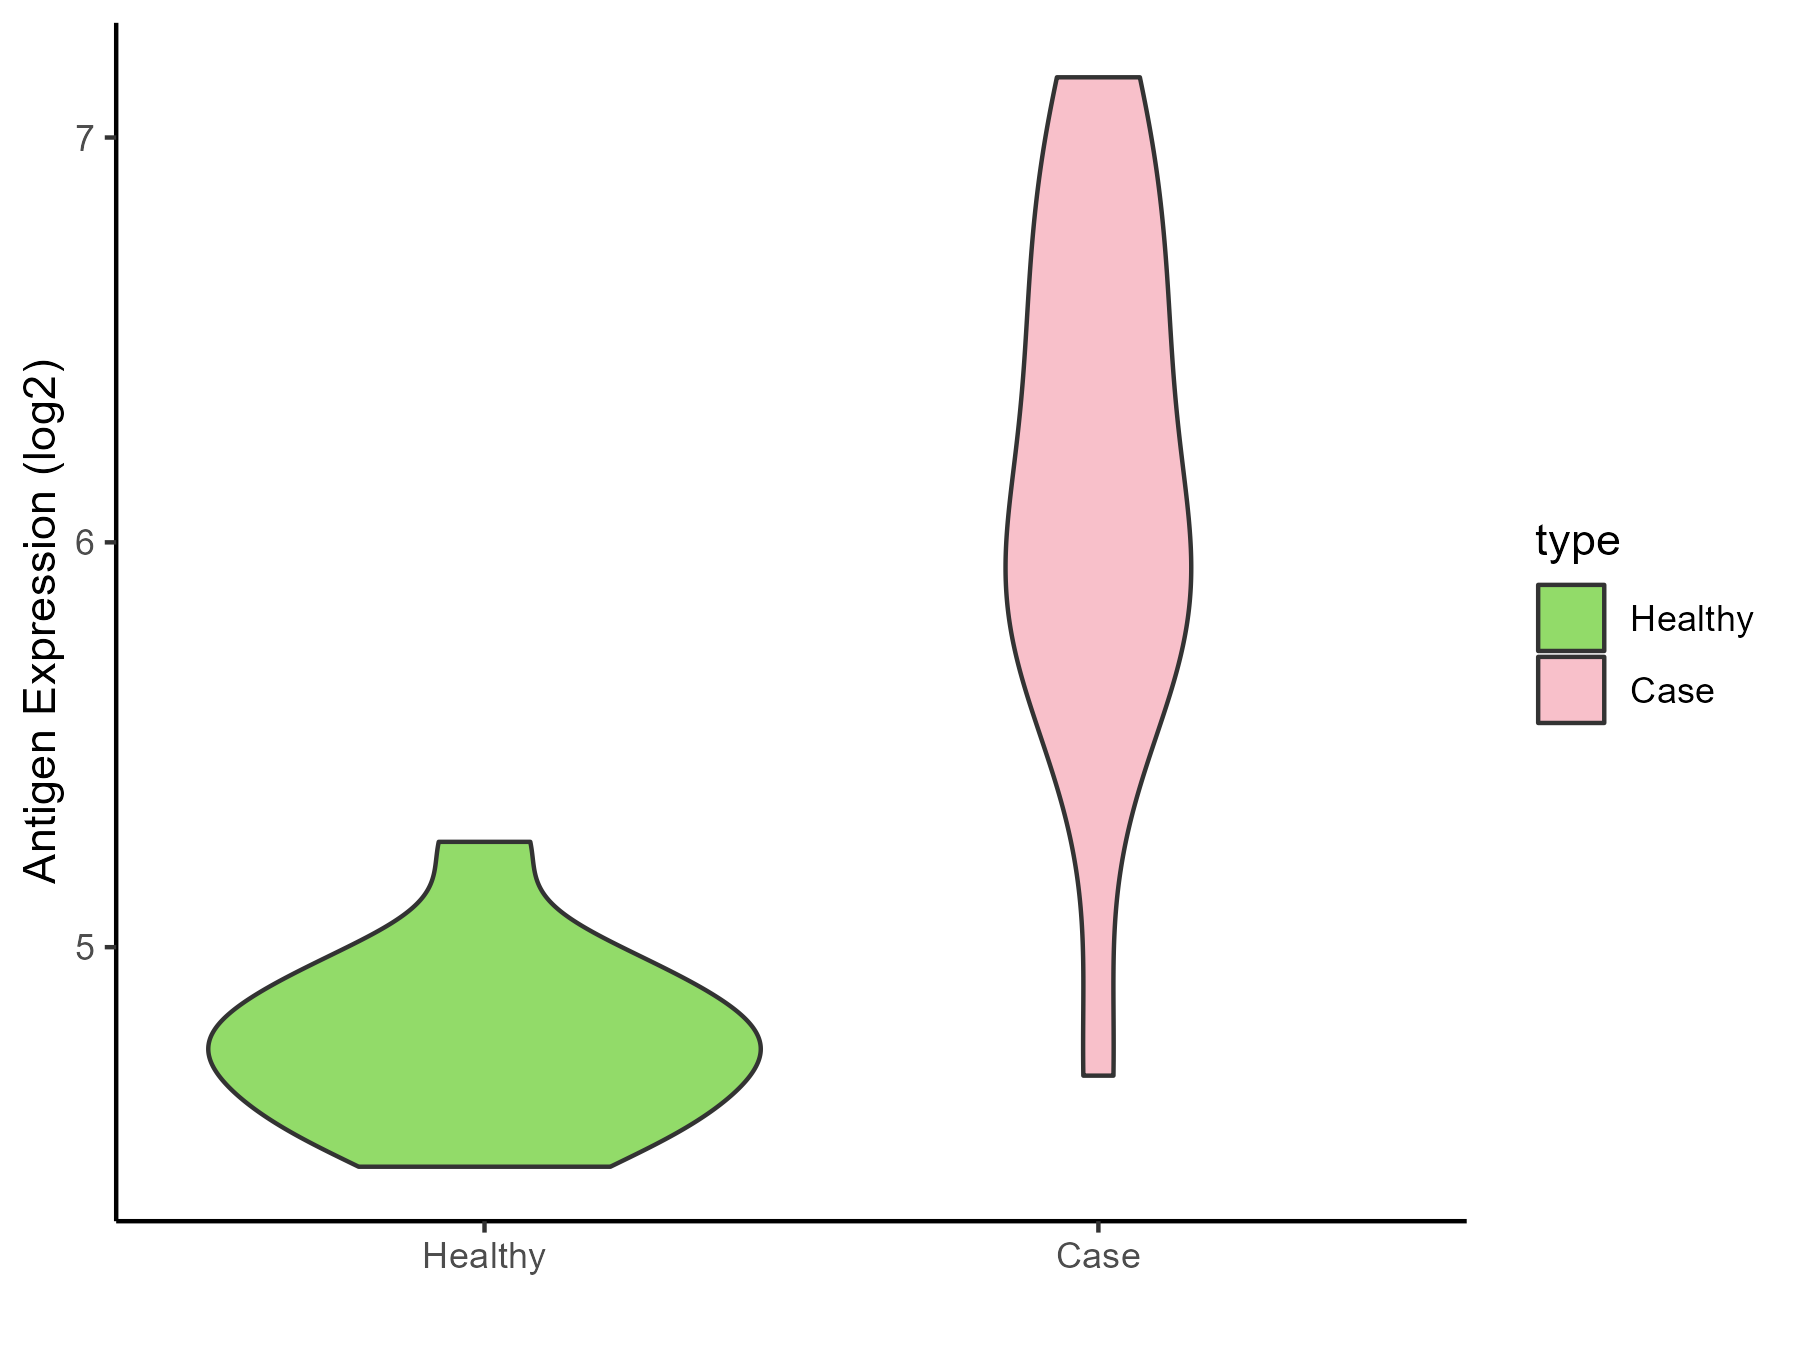
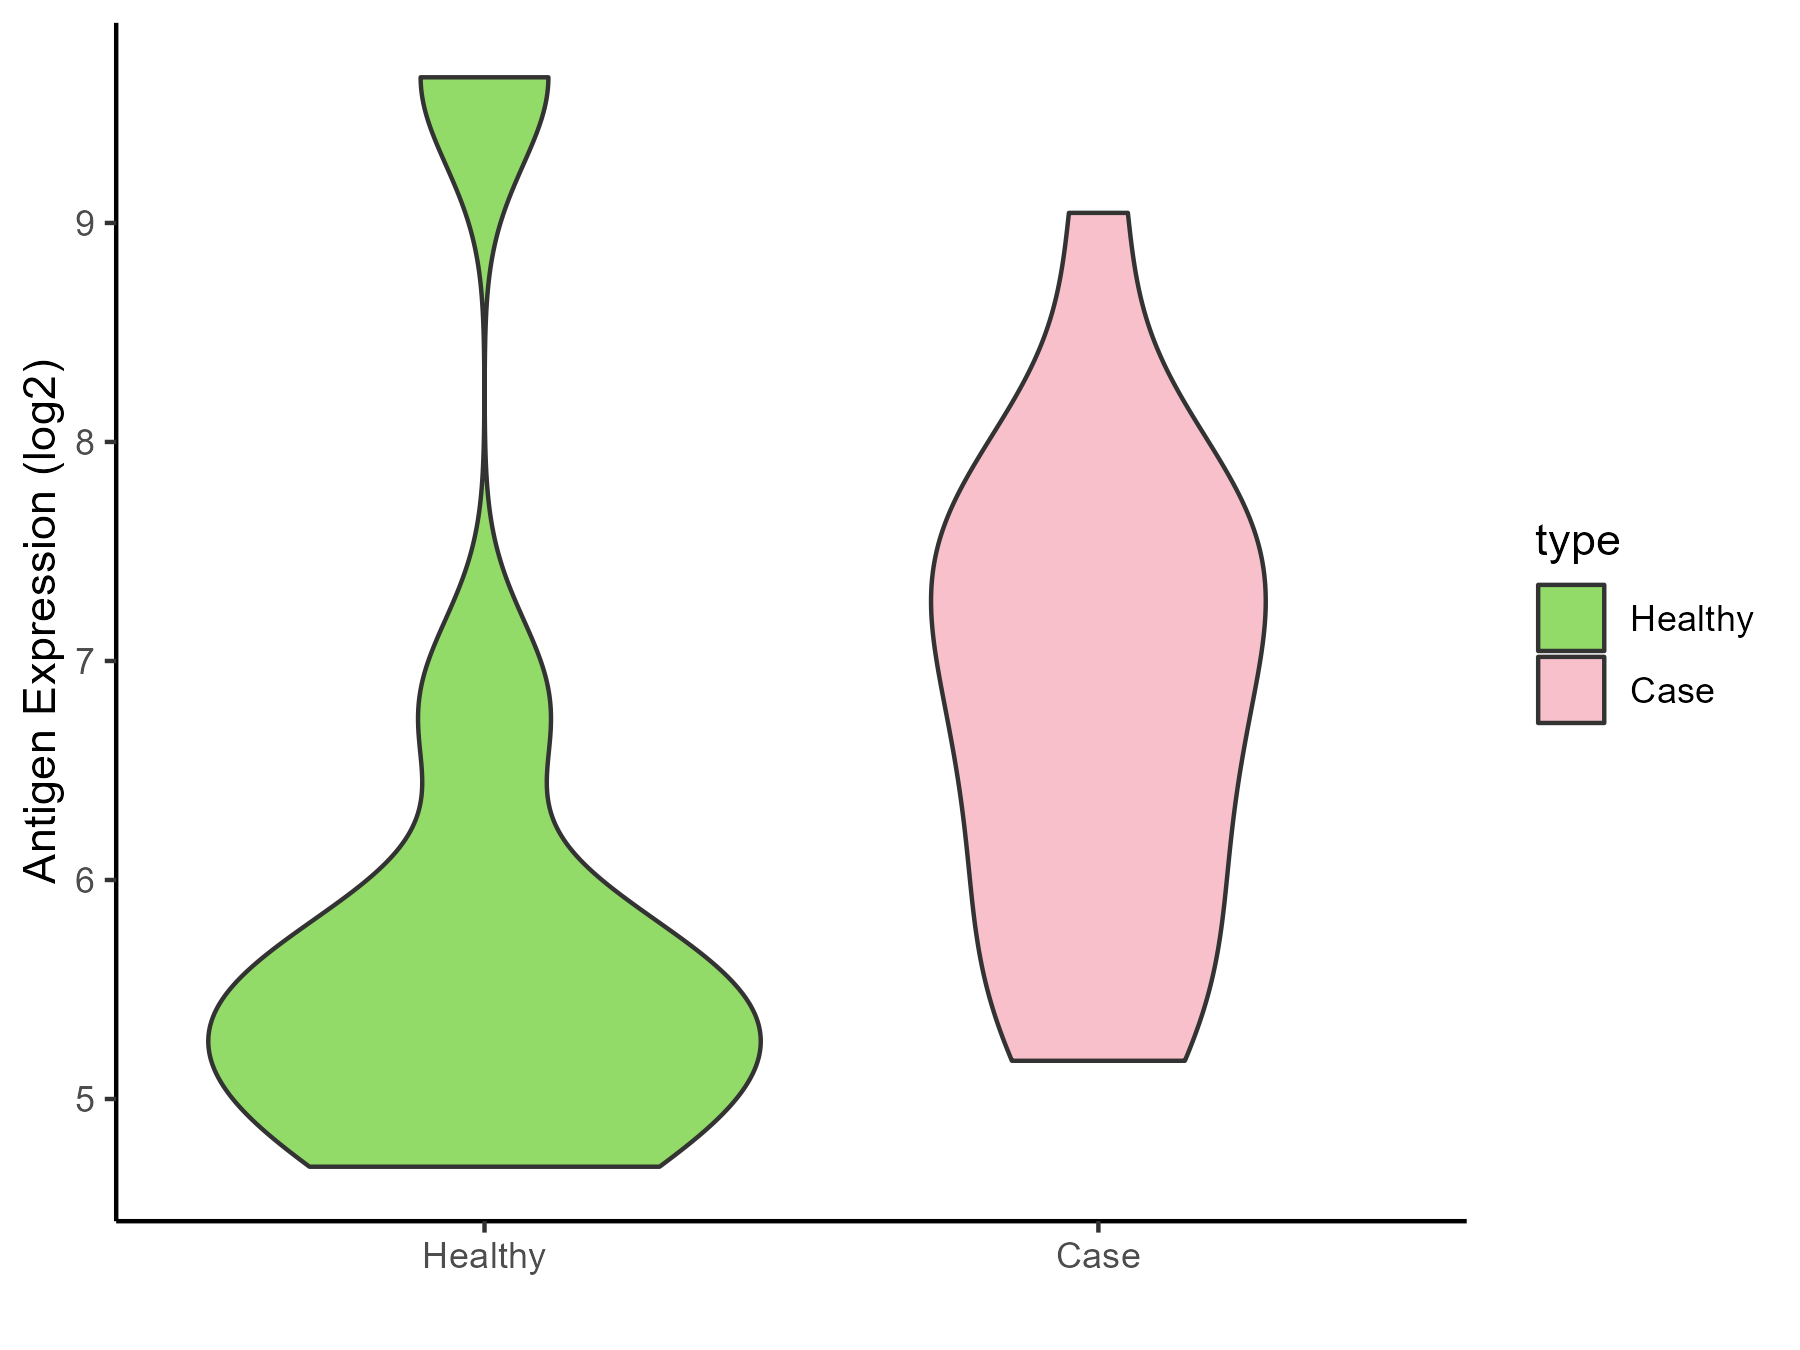
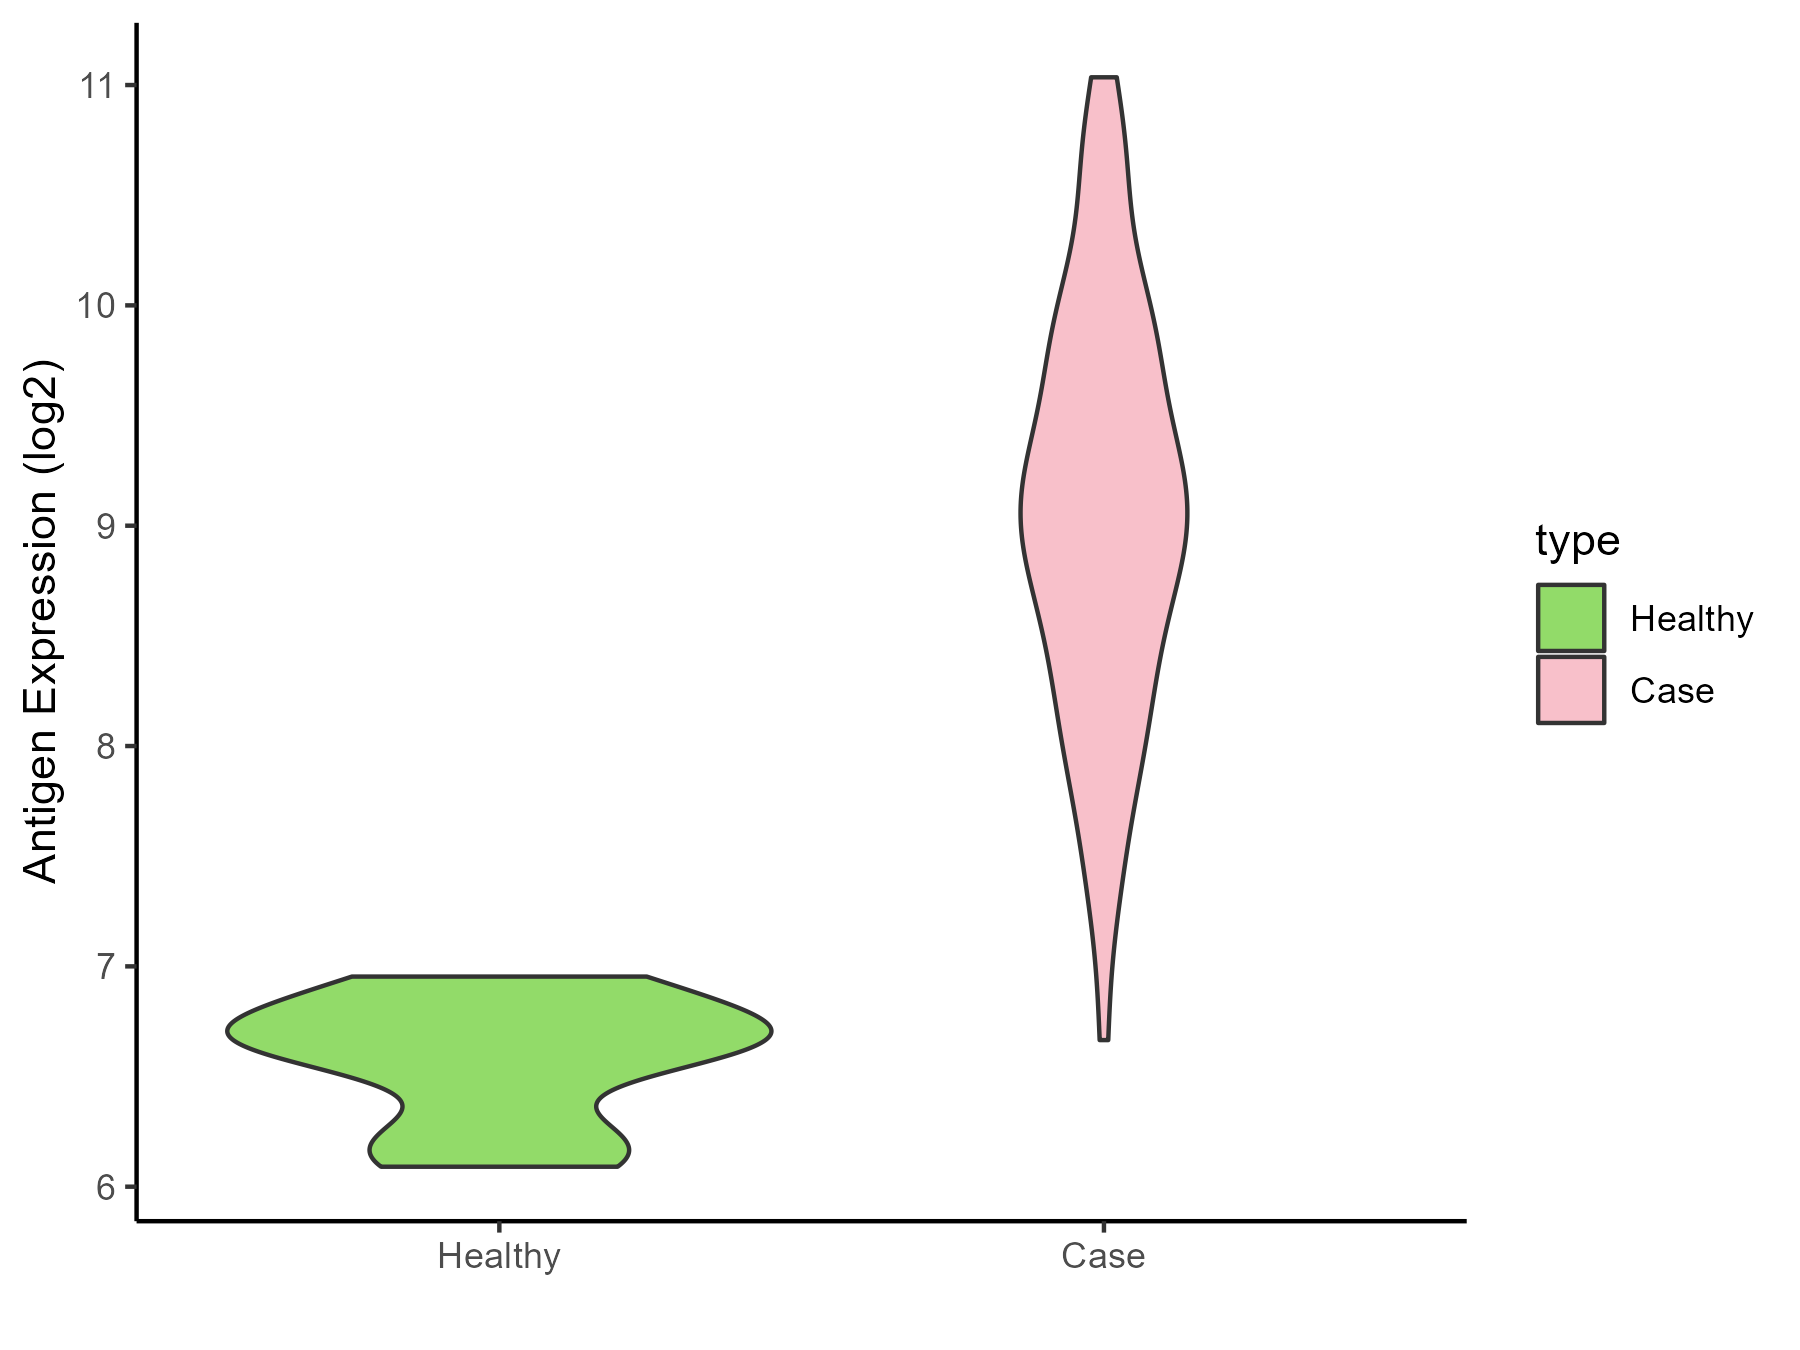
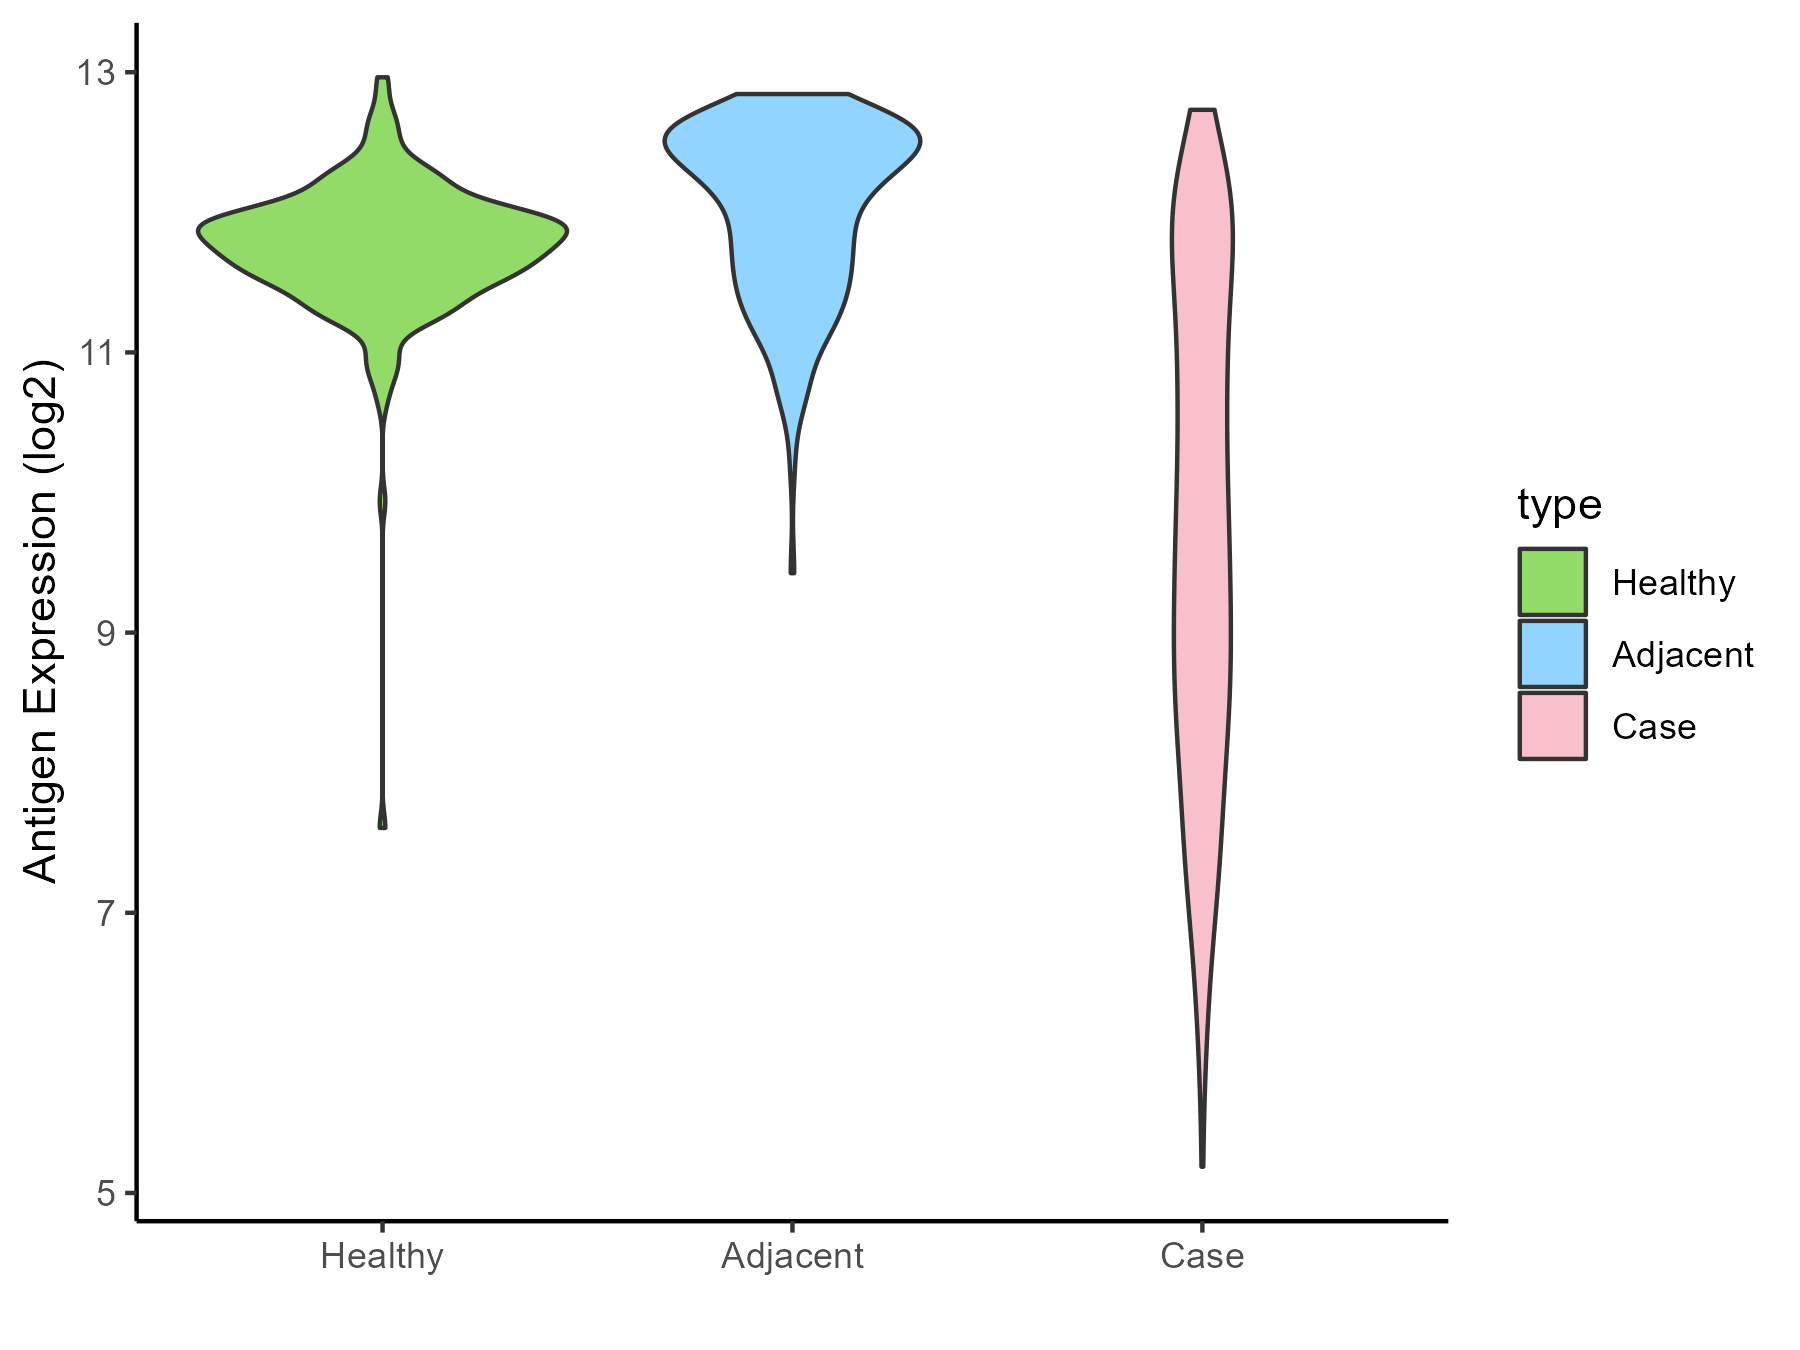
Glioma |
| The Expression Level of Disease Section Compare with the Healthy Individual Tissue |
p-value: 0.000860769;
Fold-change: 0.723919588;
Z-score: 1.654610517
|
| Disease-specific Antigen Abundances |
|
Click to View the Clearer Original Diagram
|
|
|
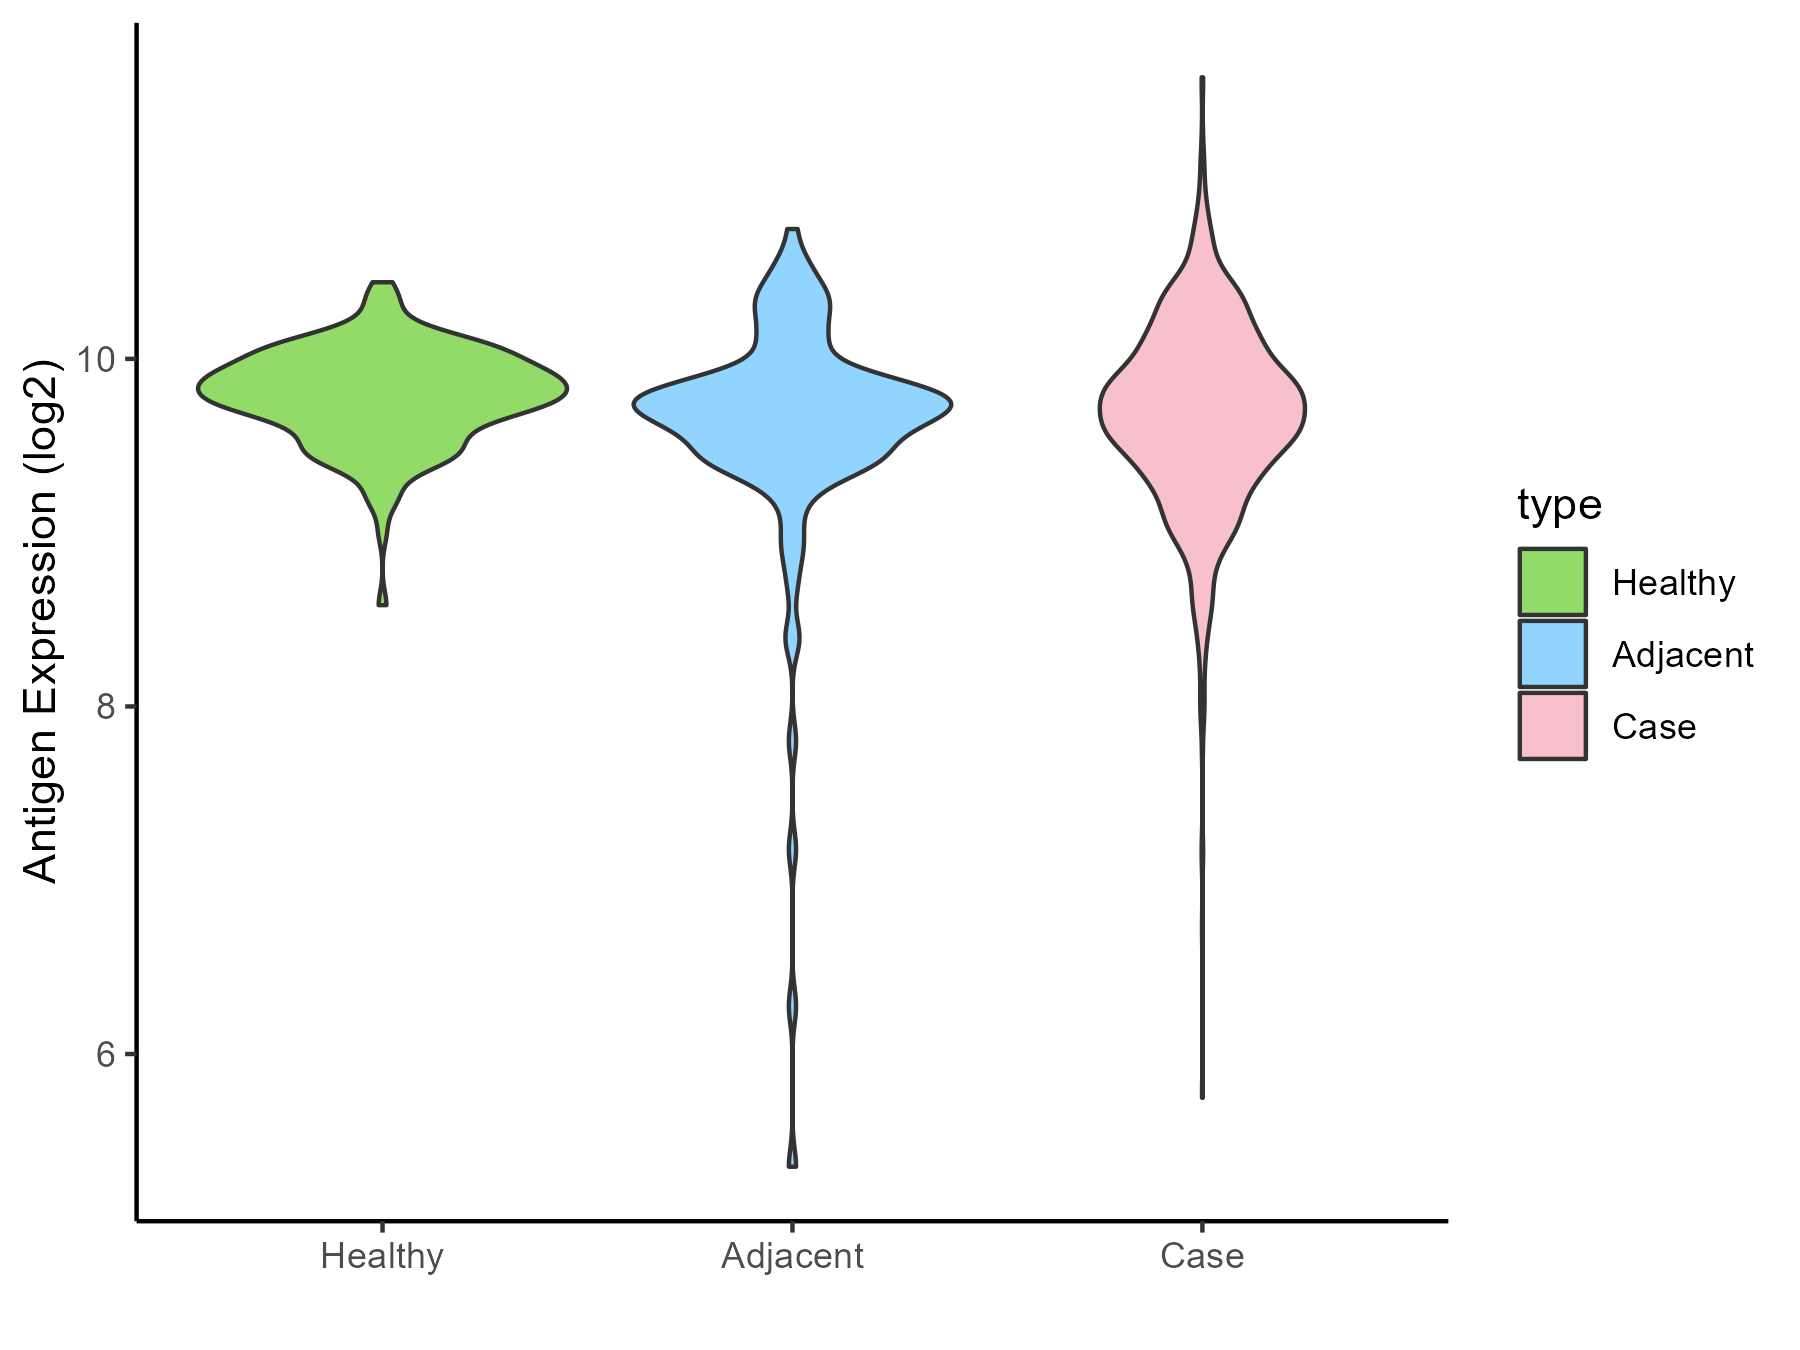
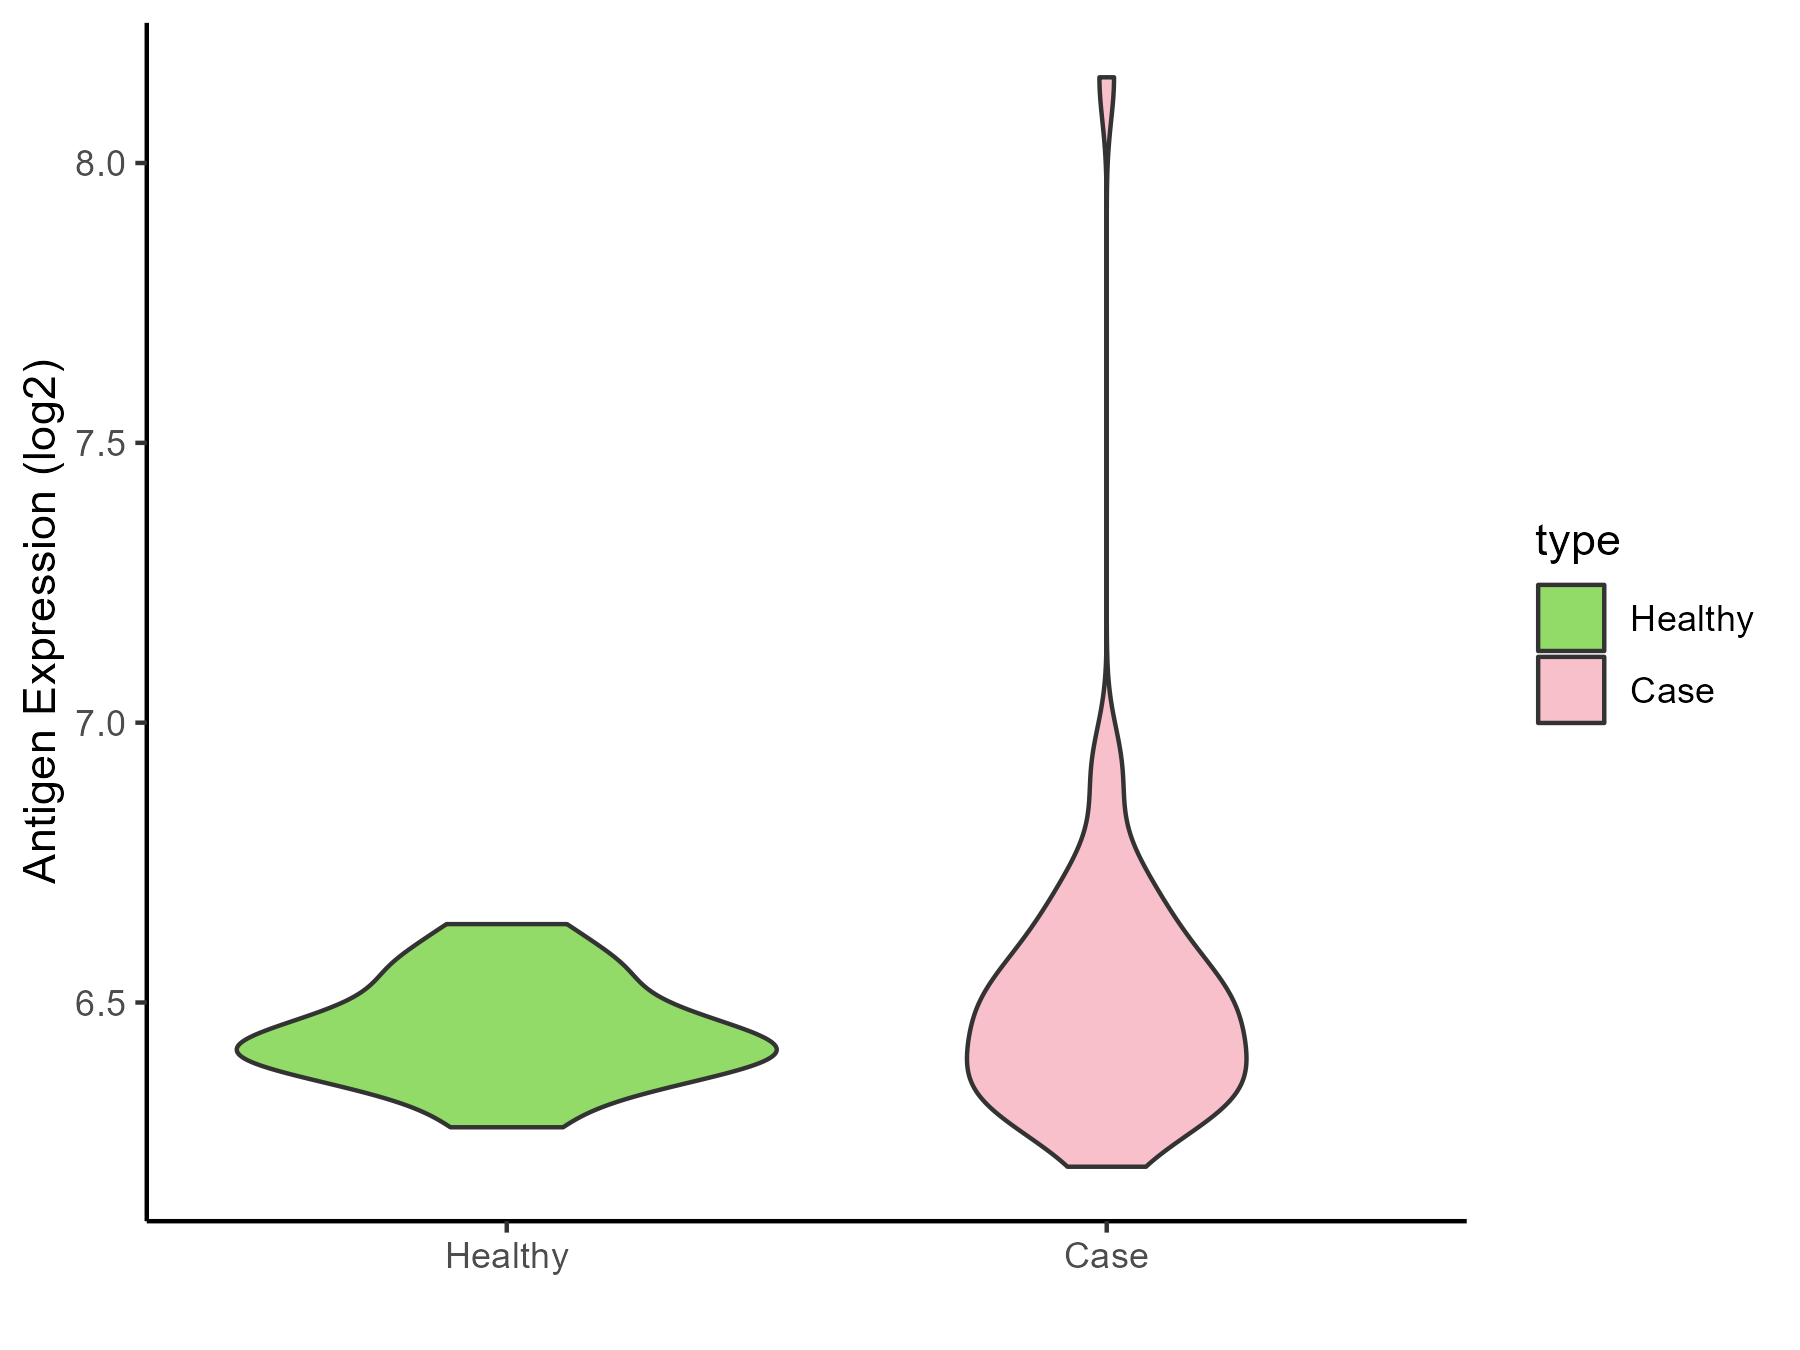
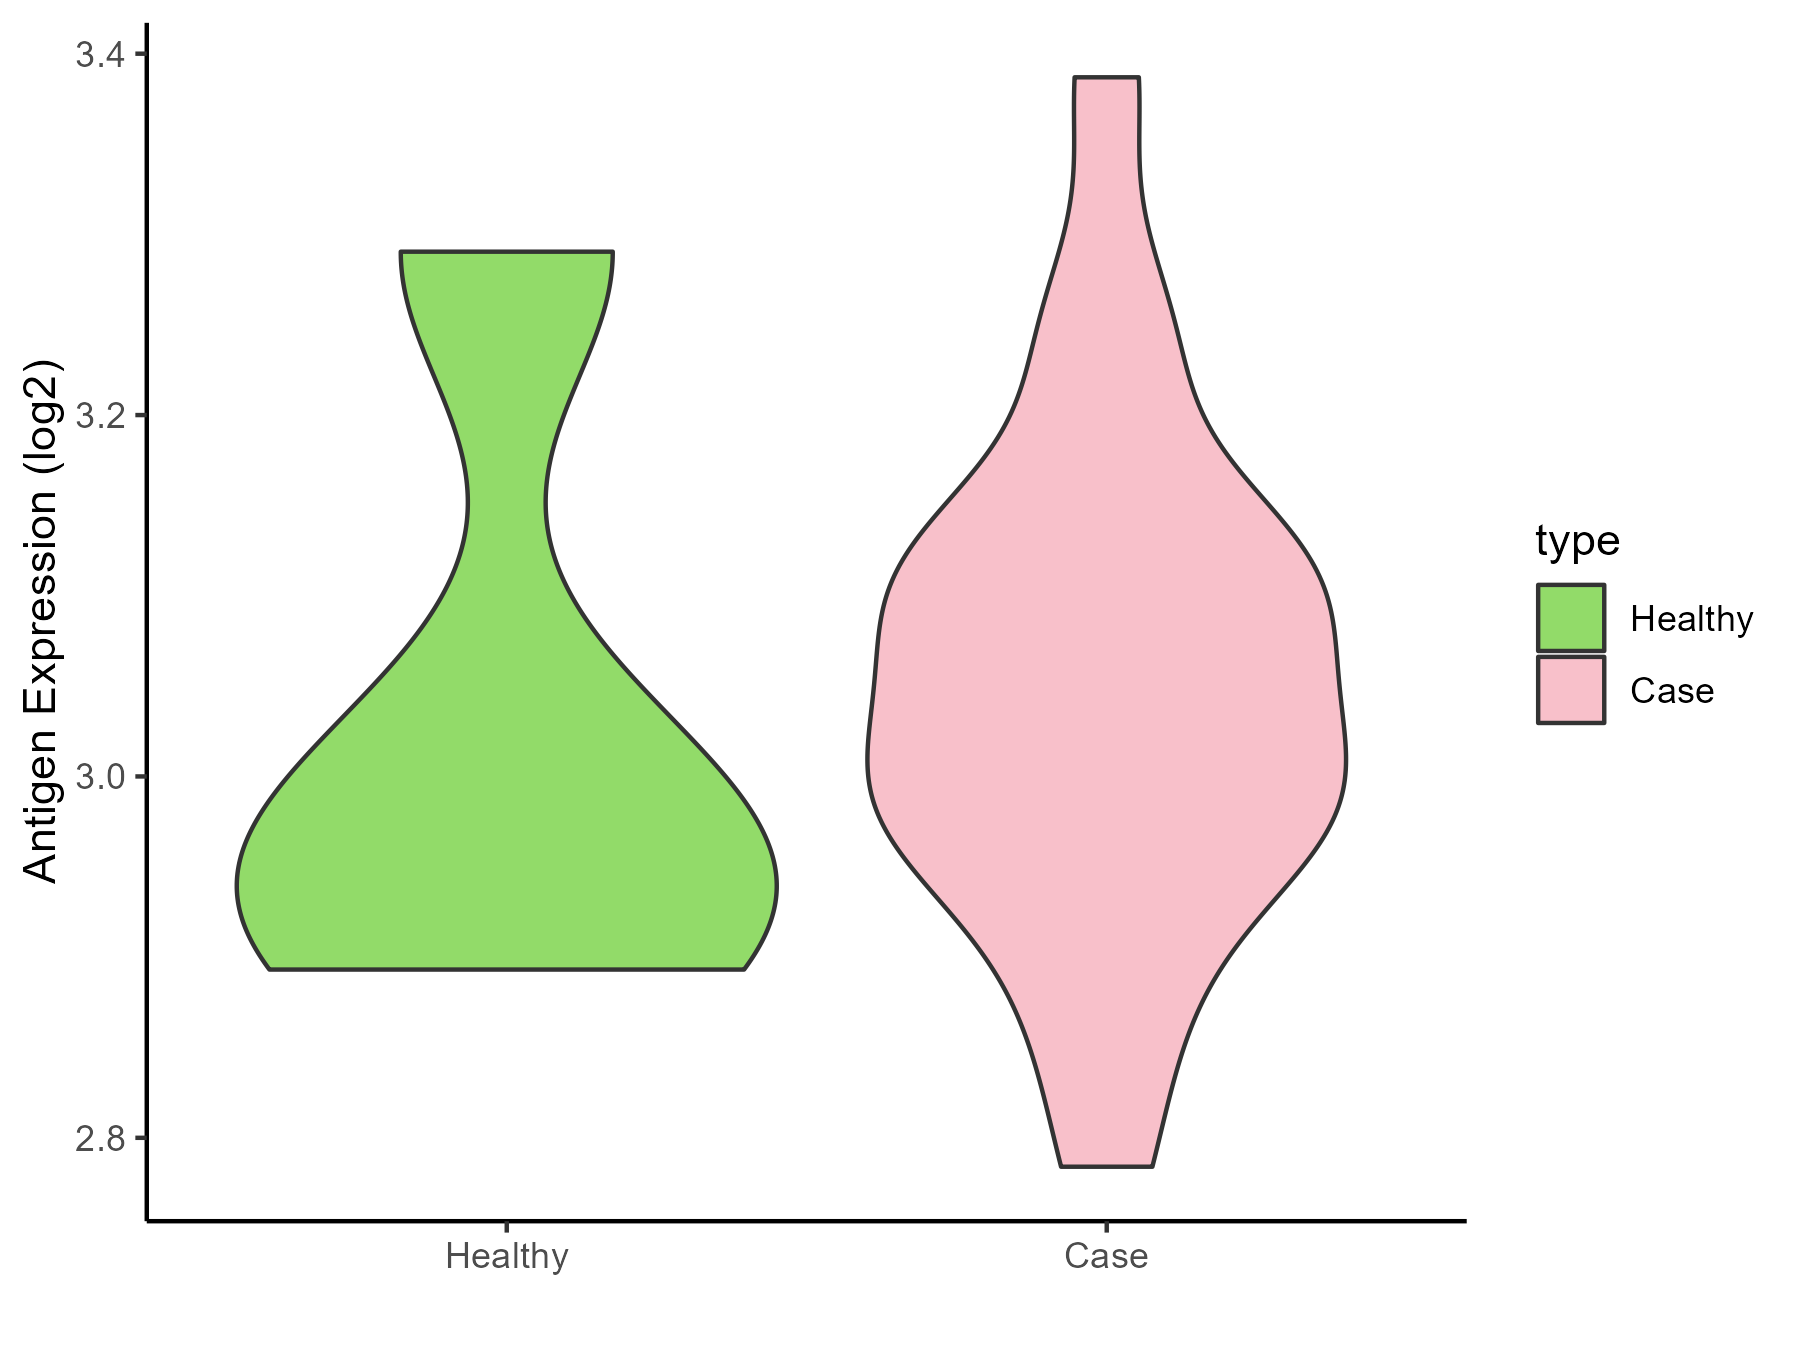
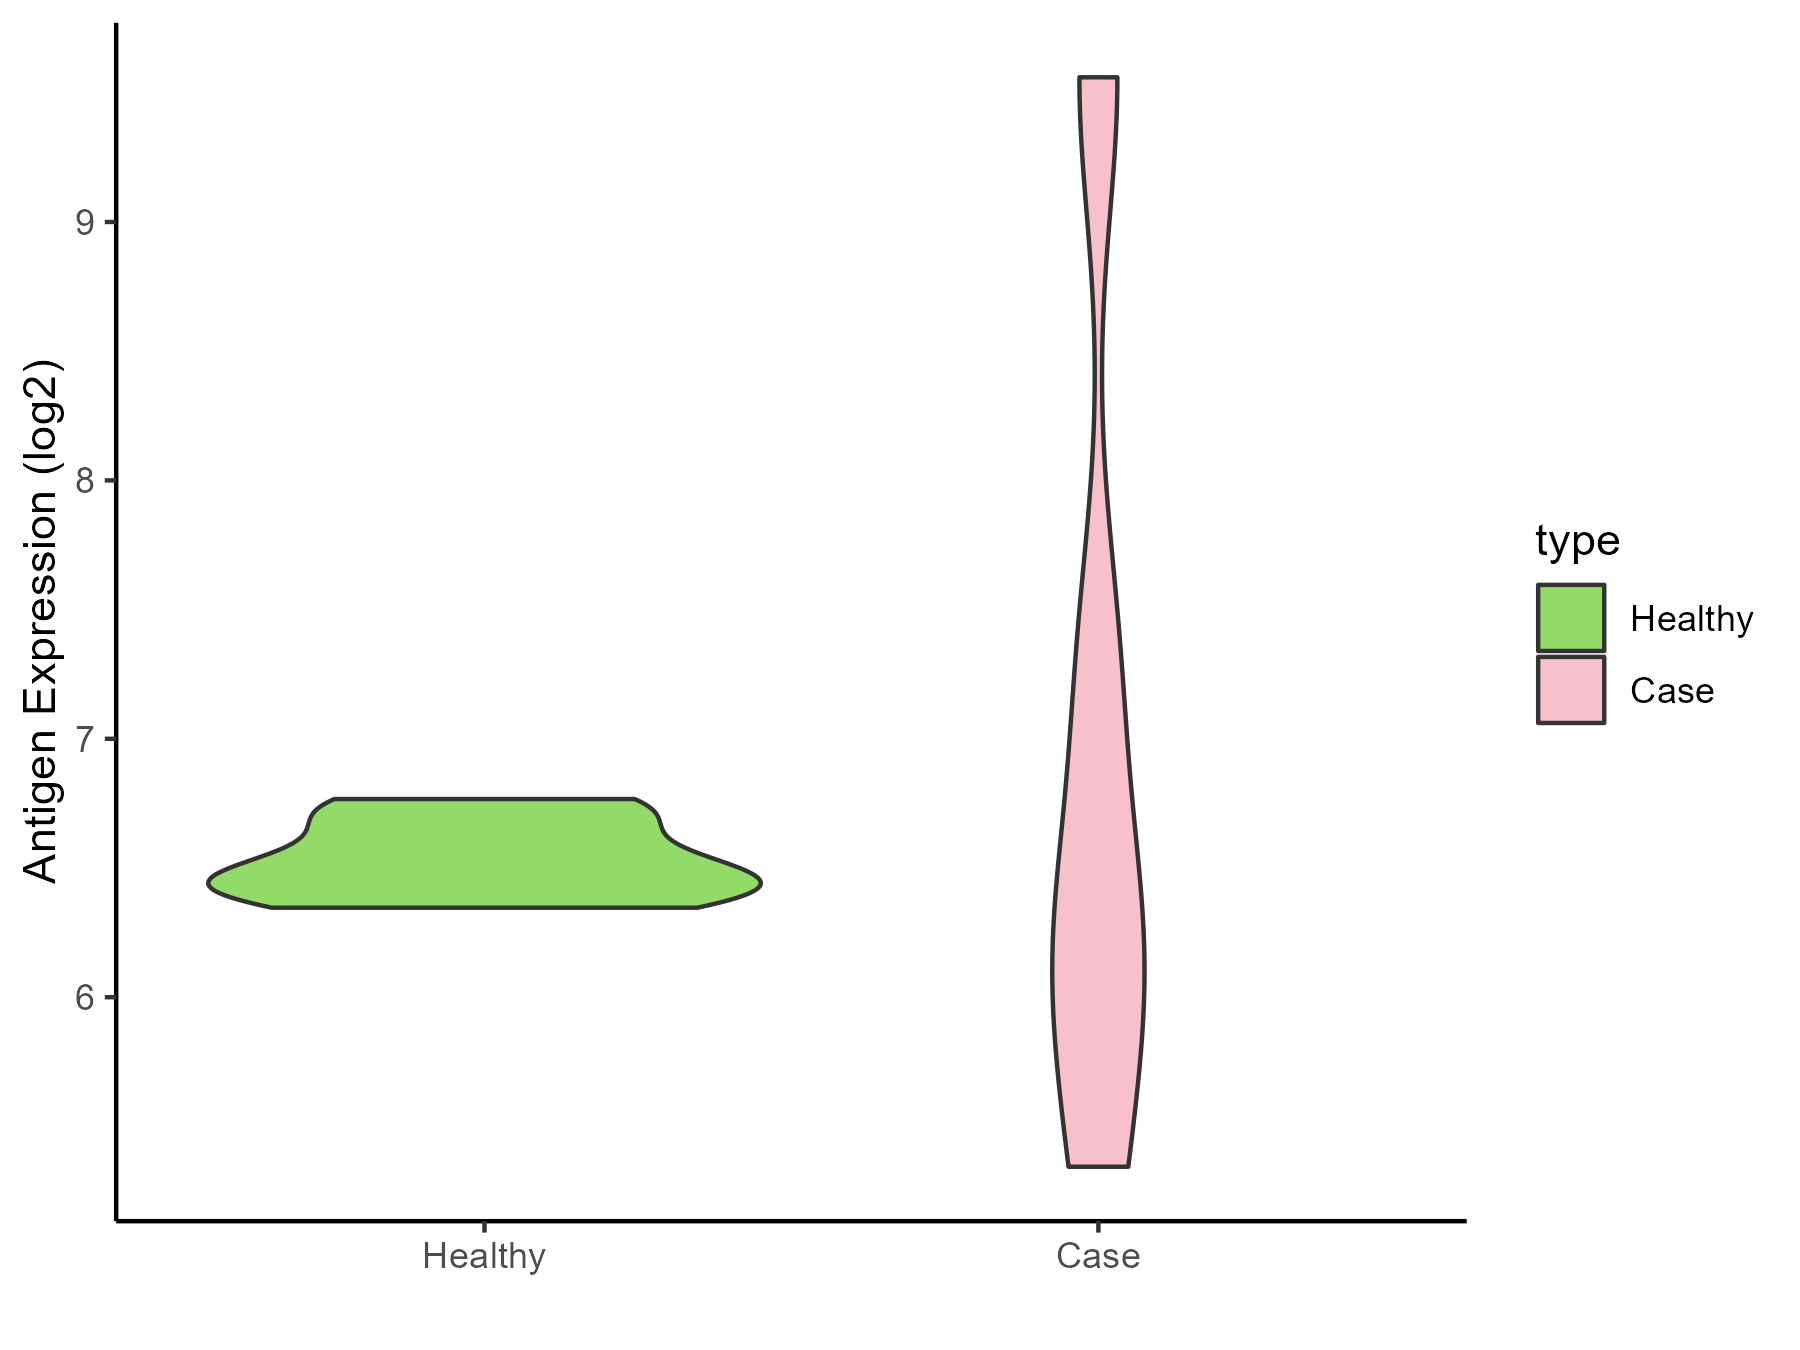
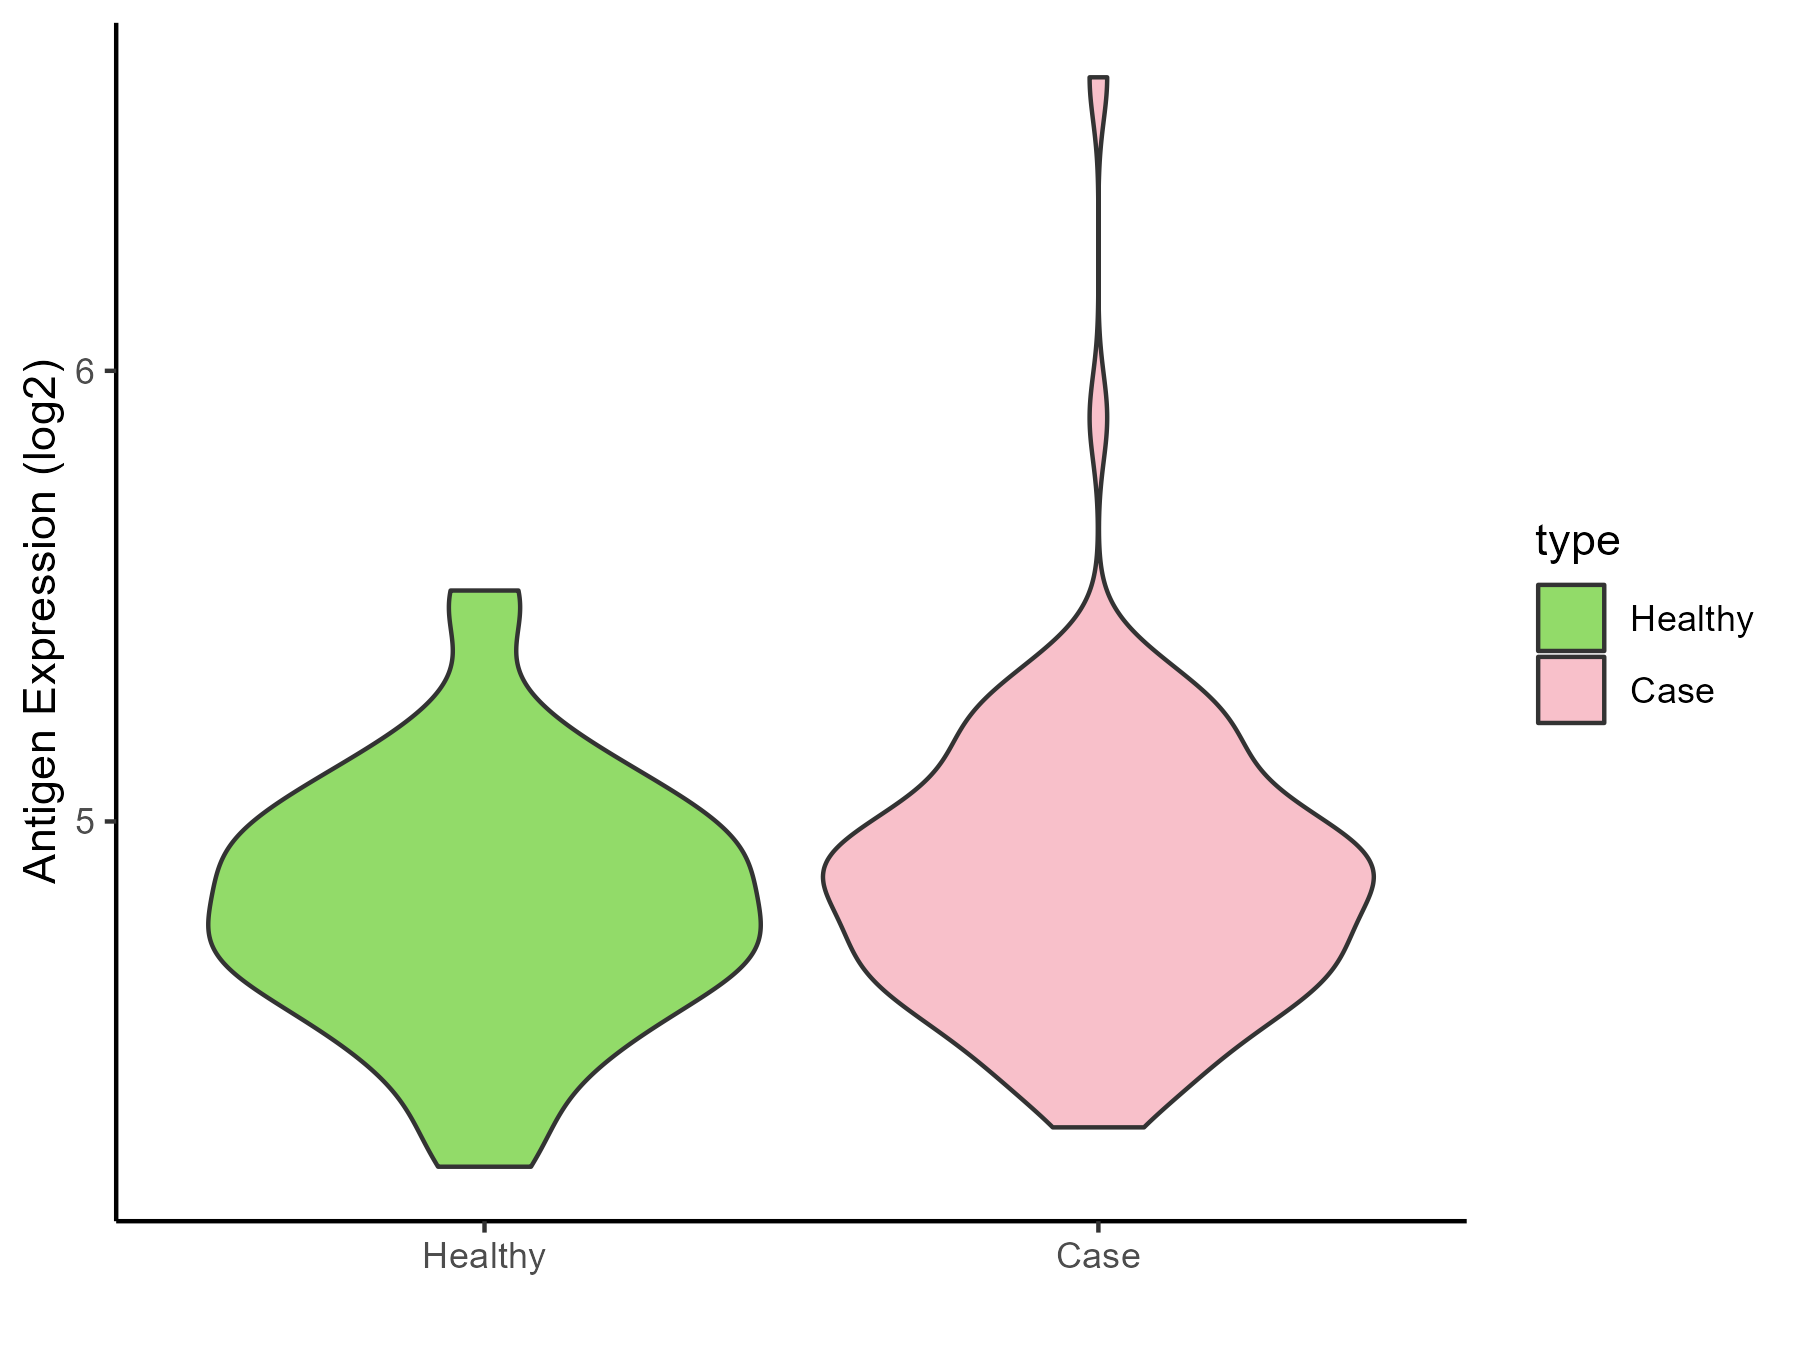
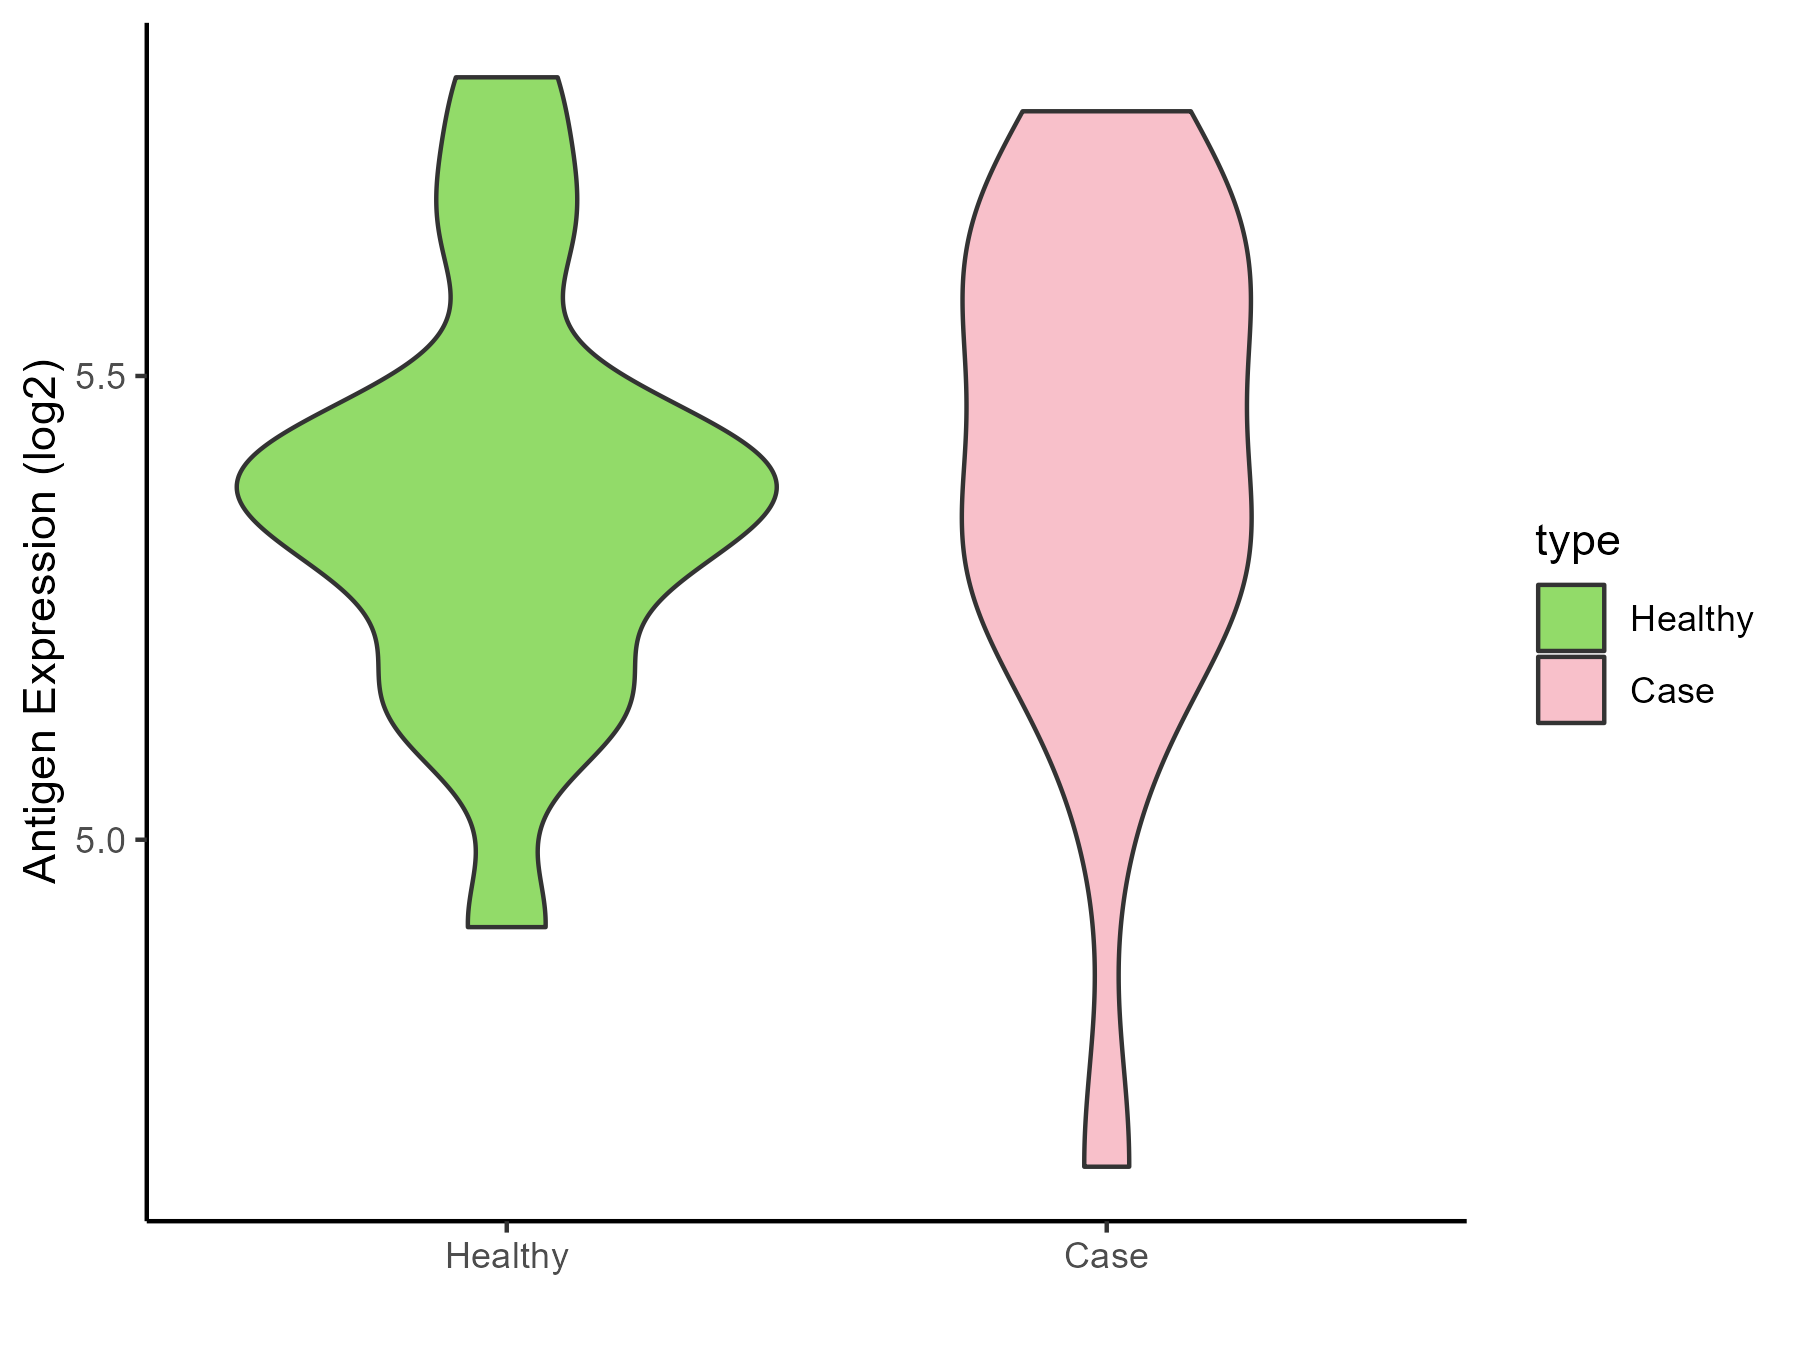
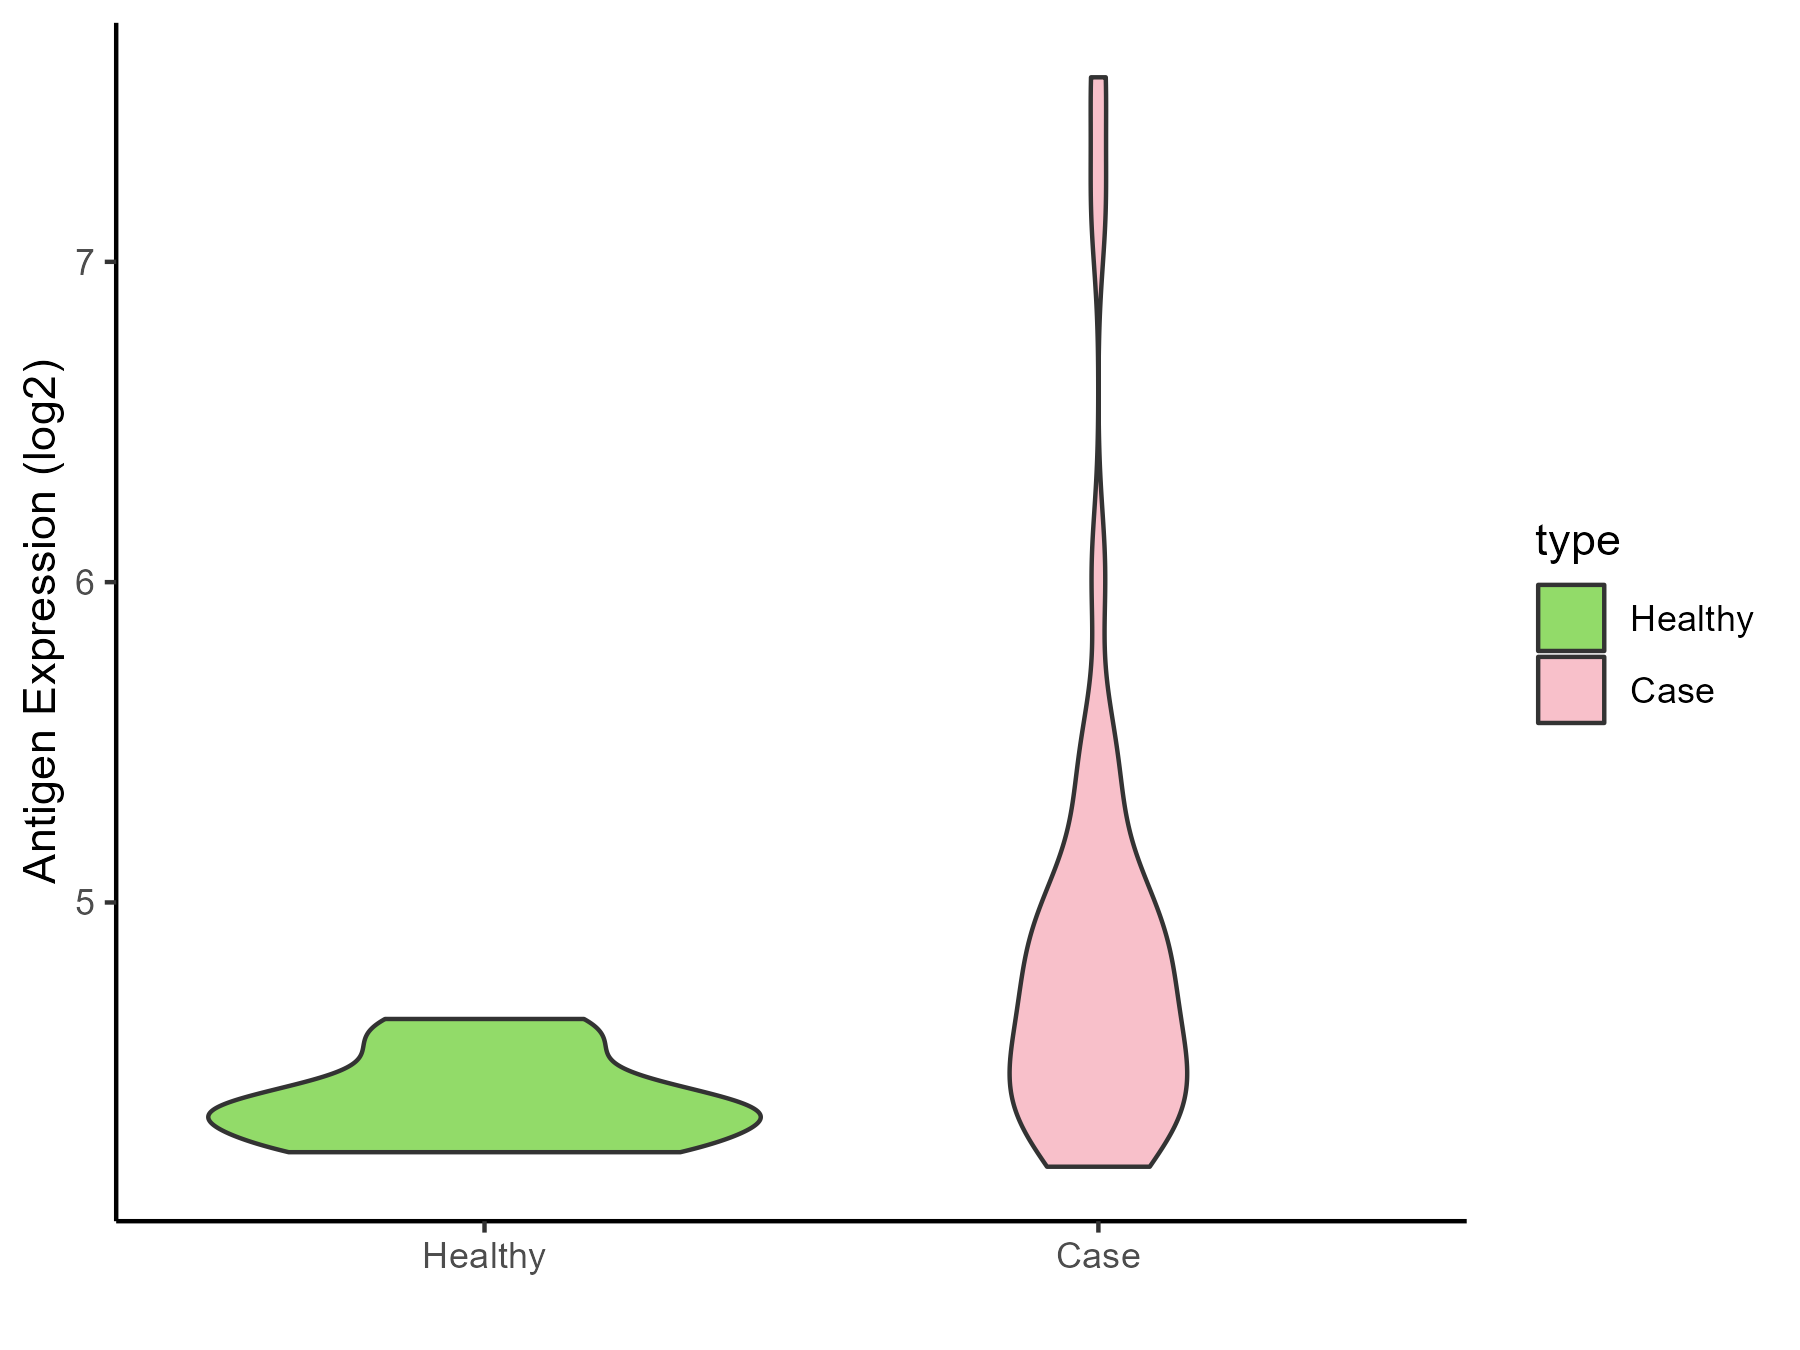
| The Studied Tissue |
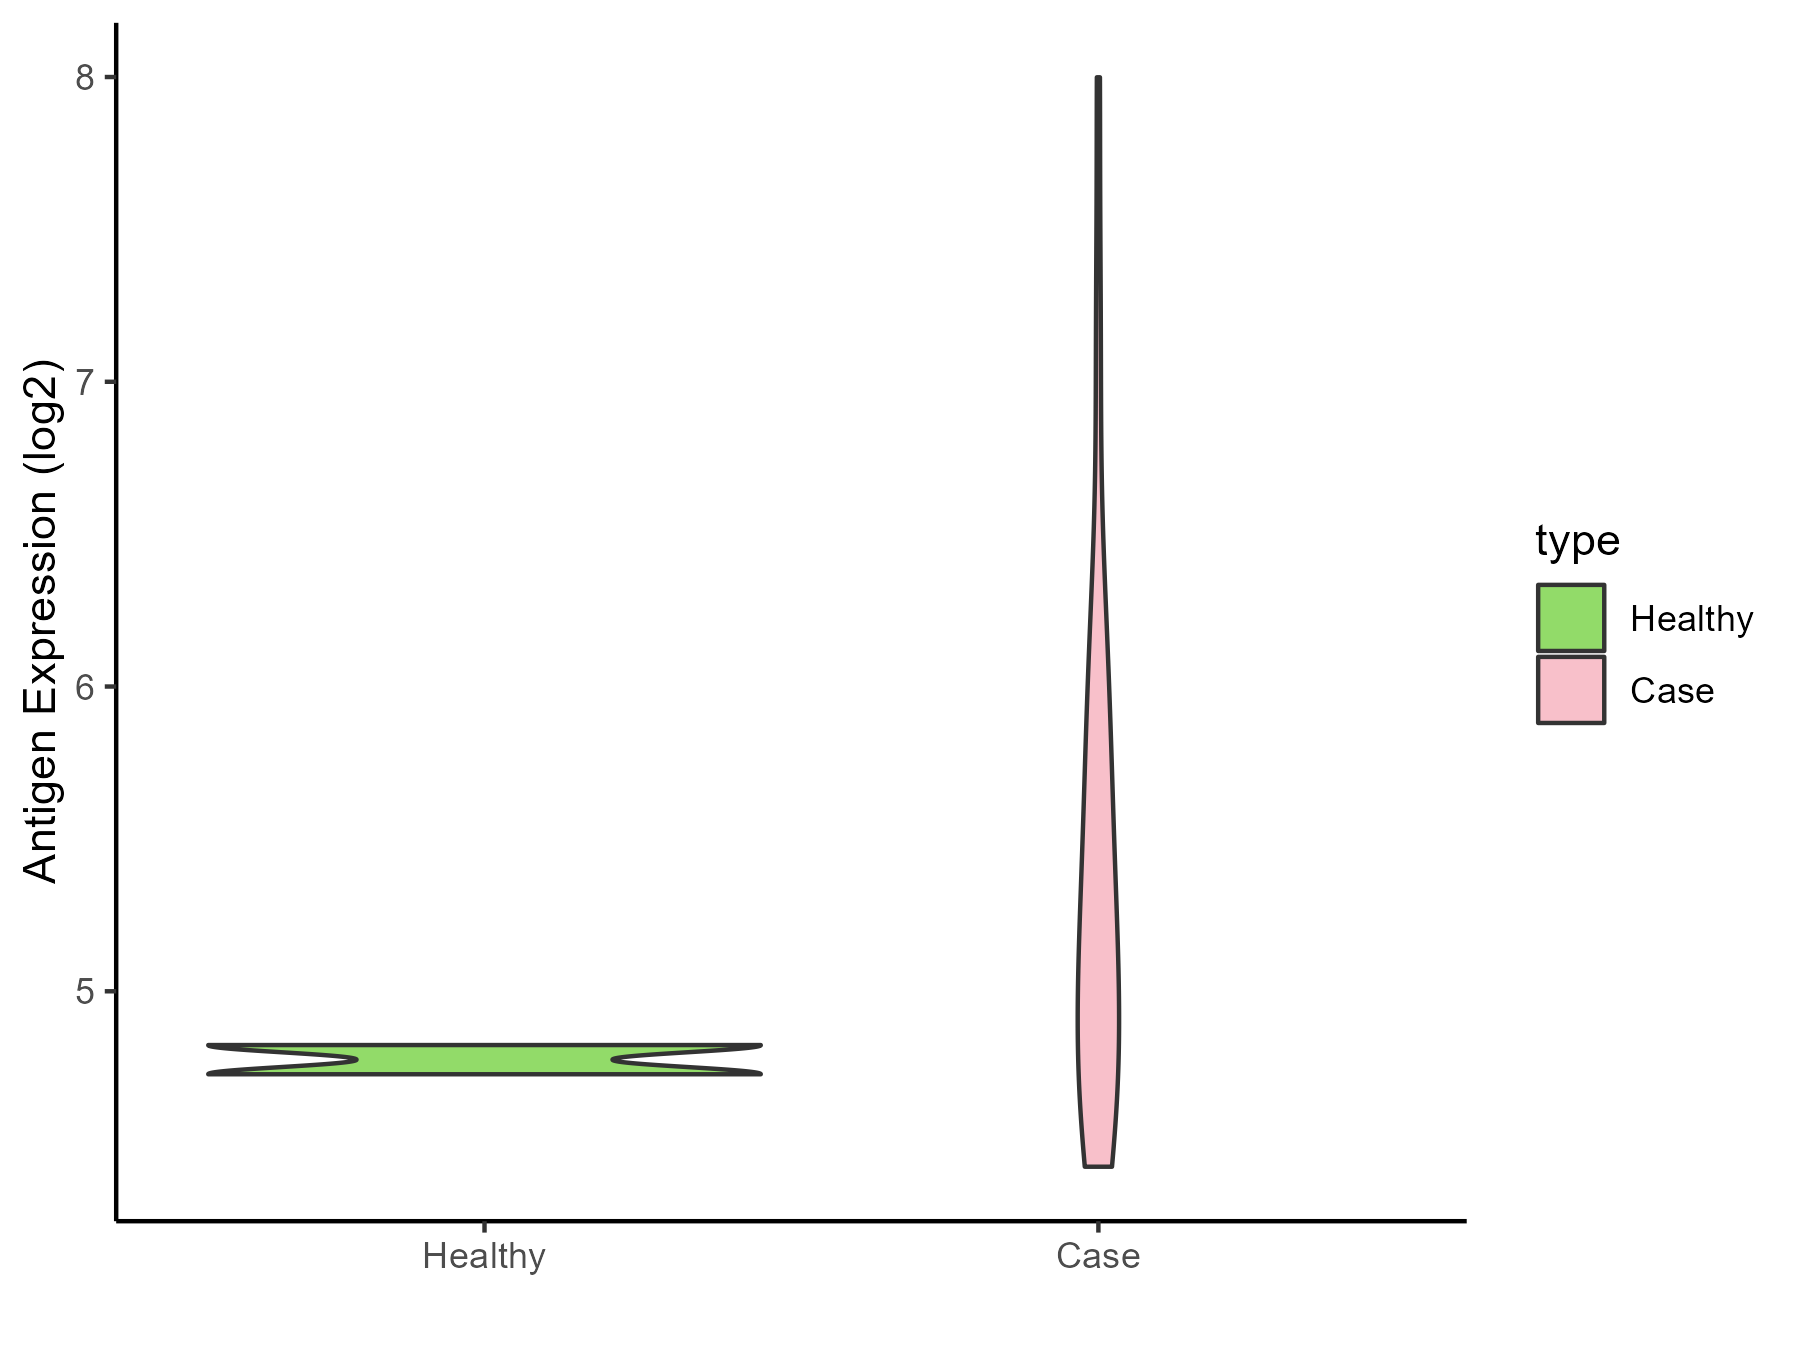
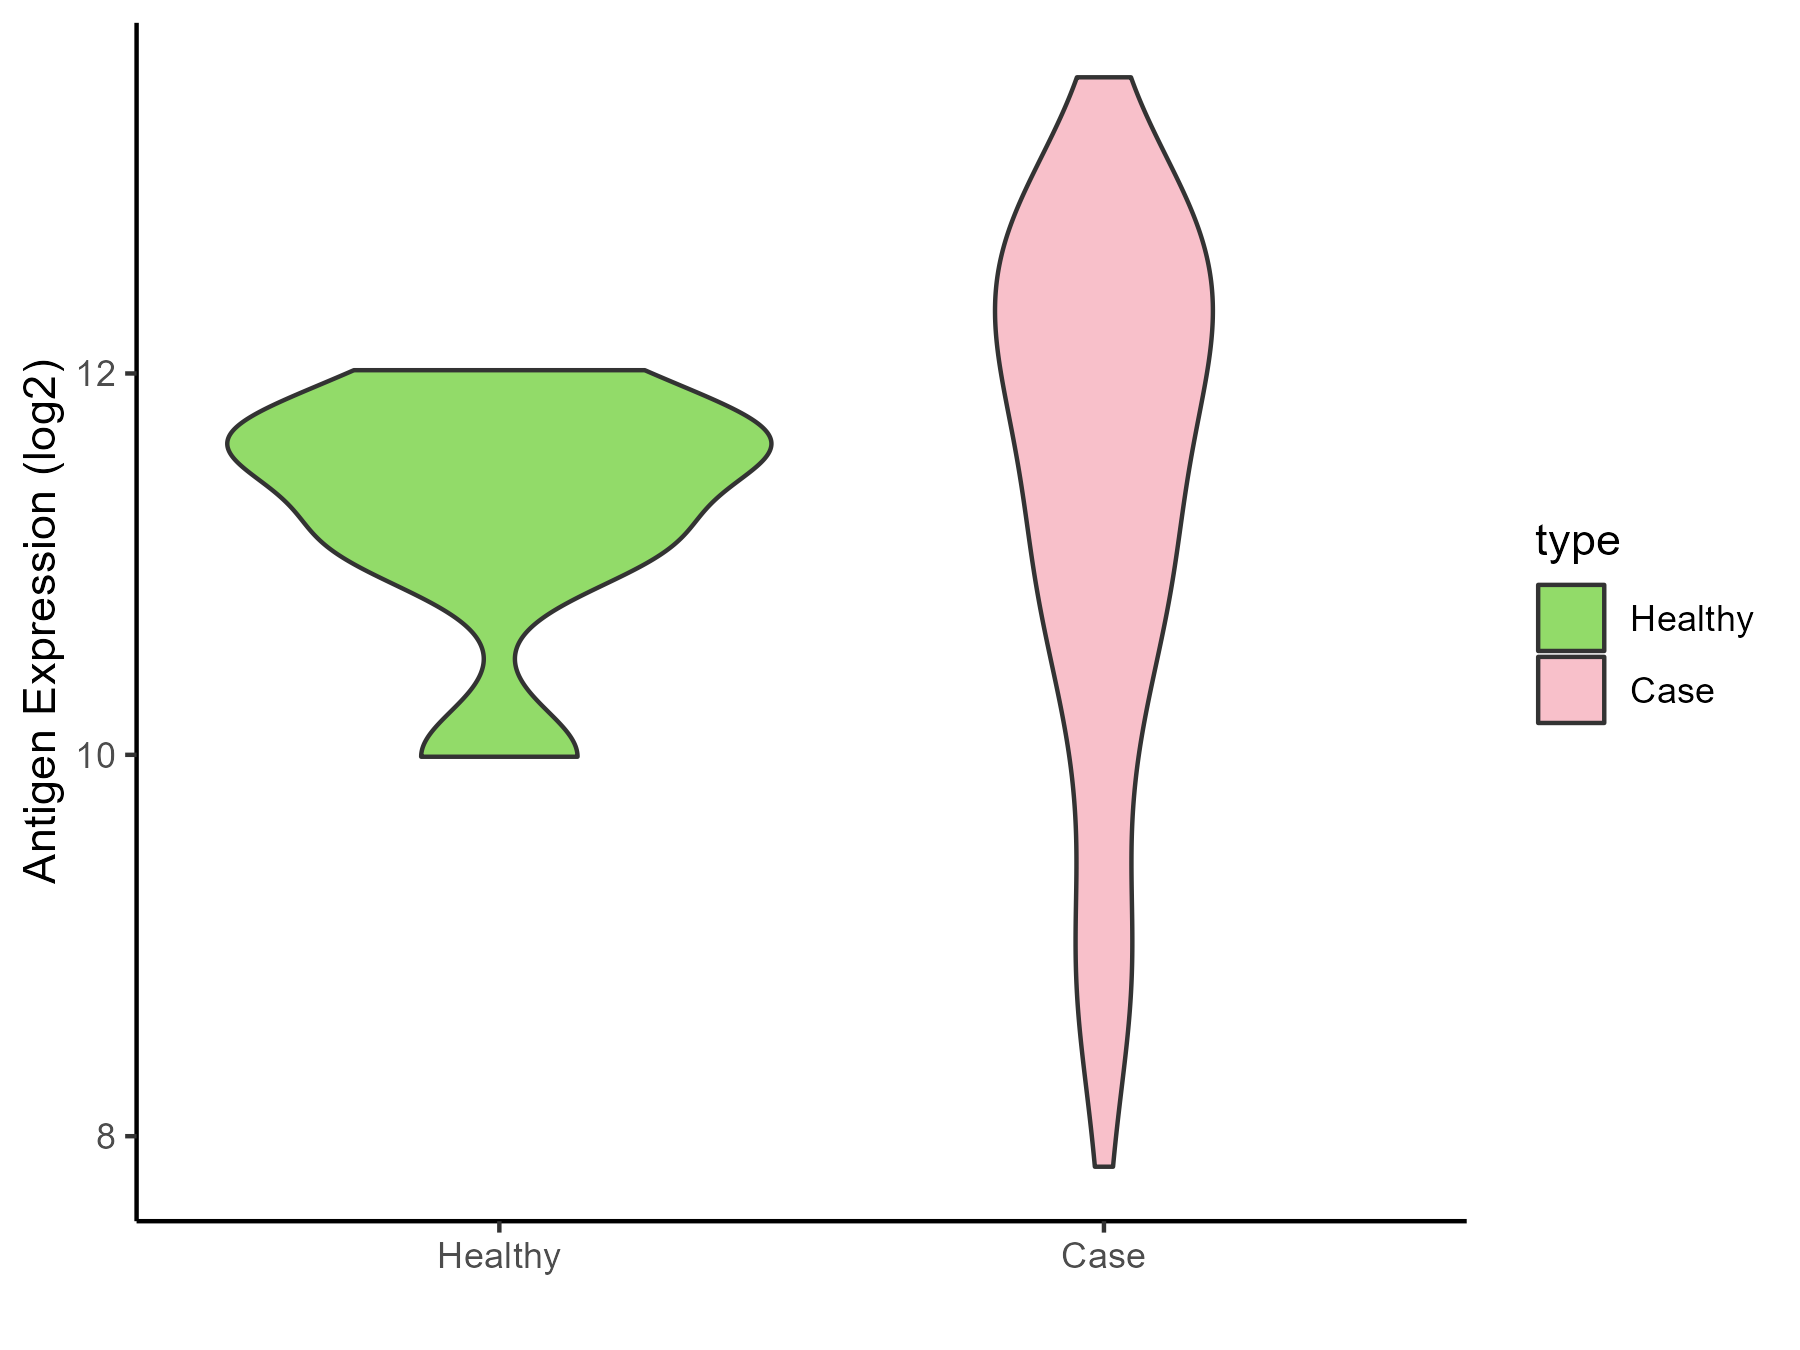
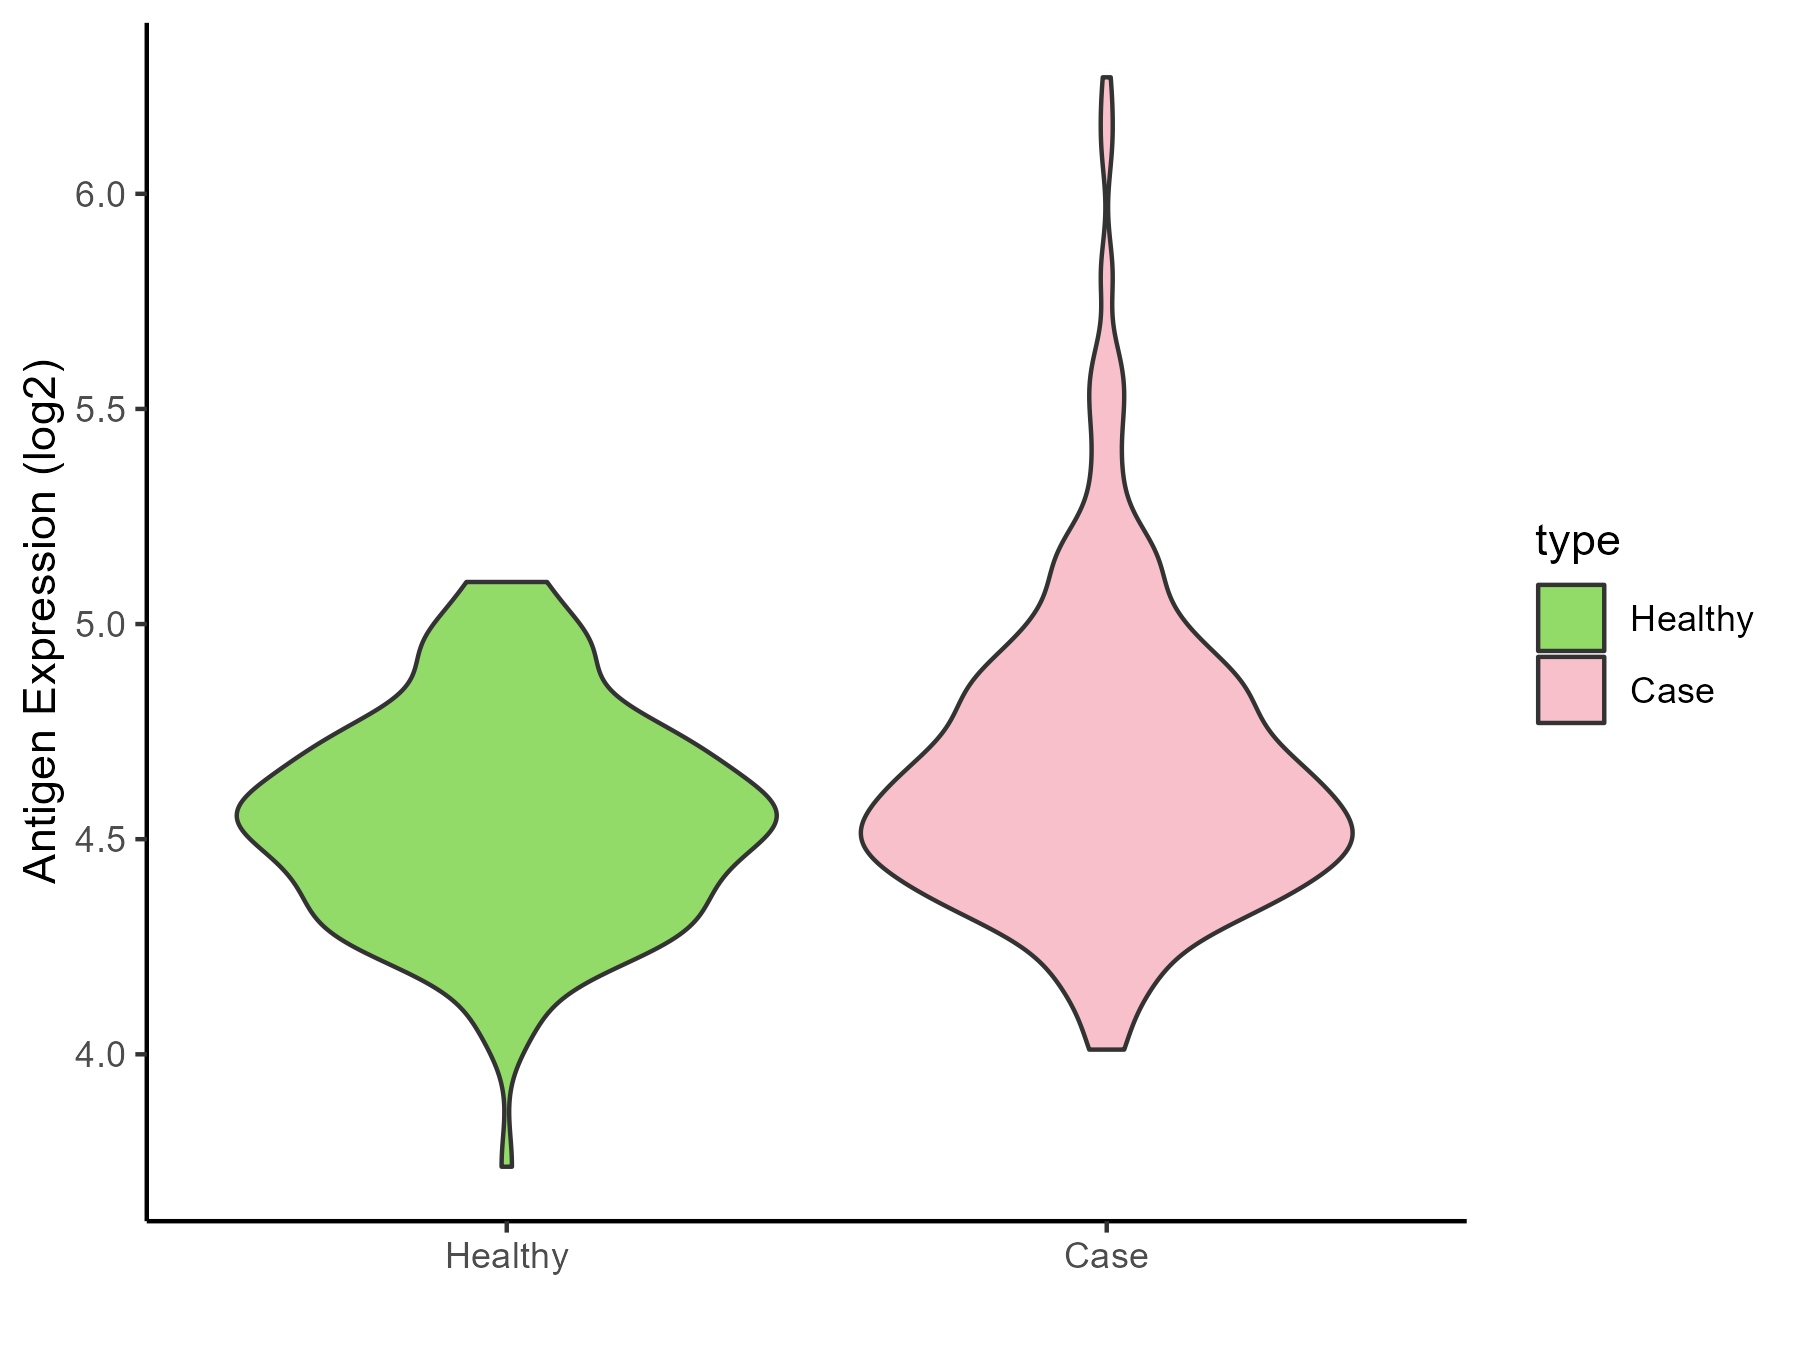
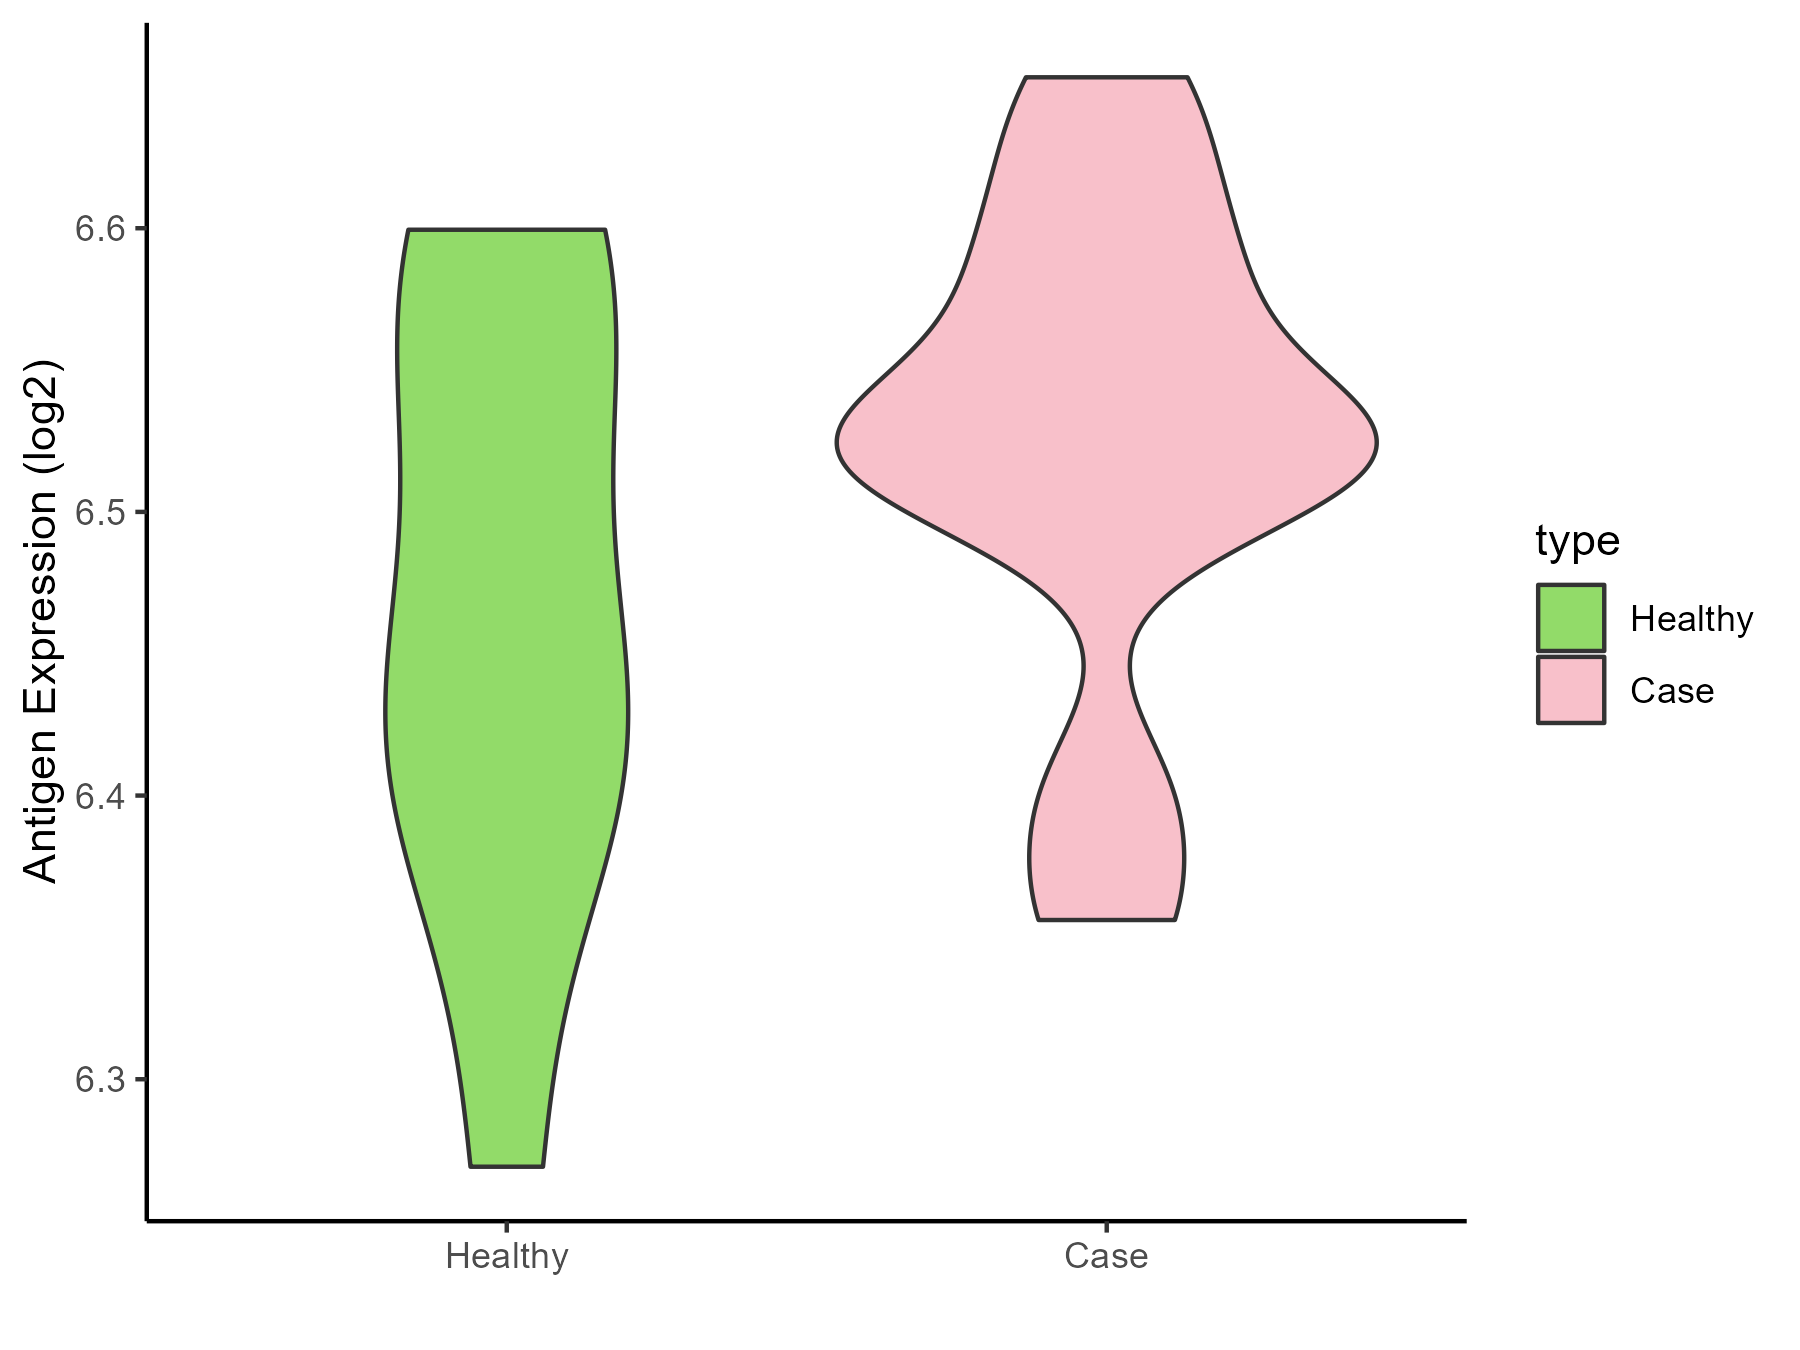
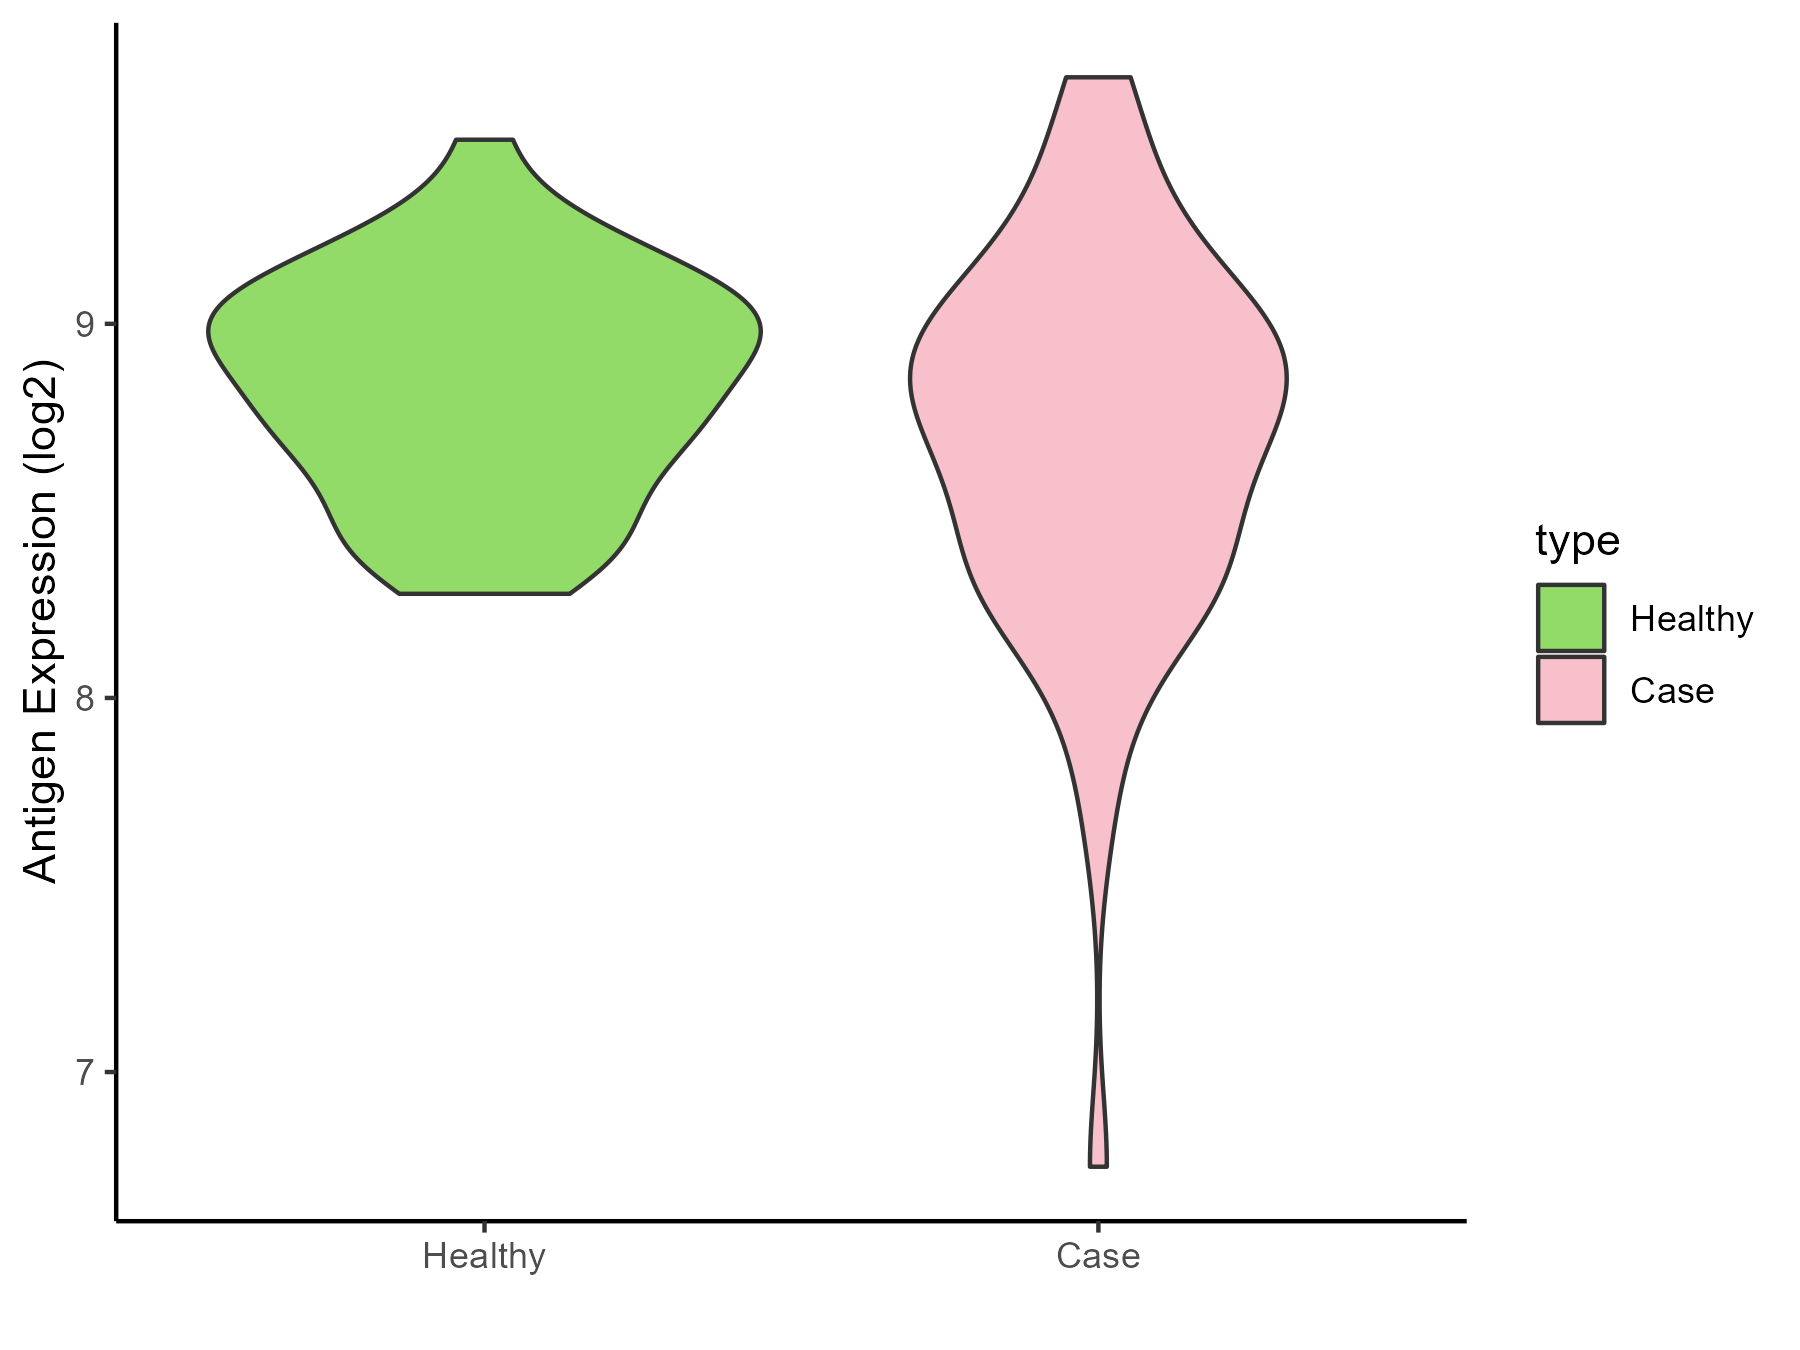
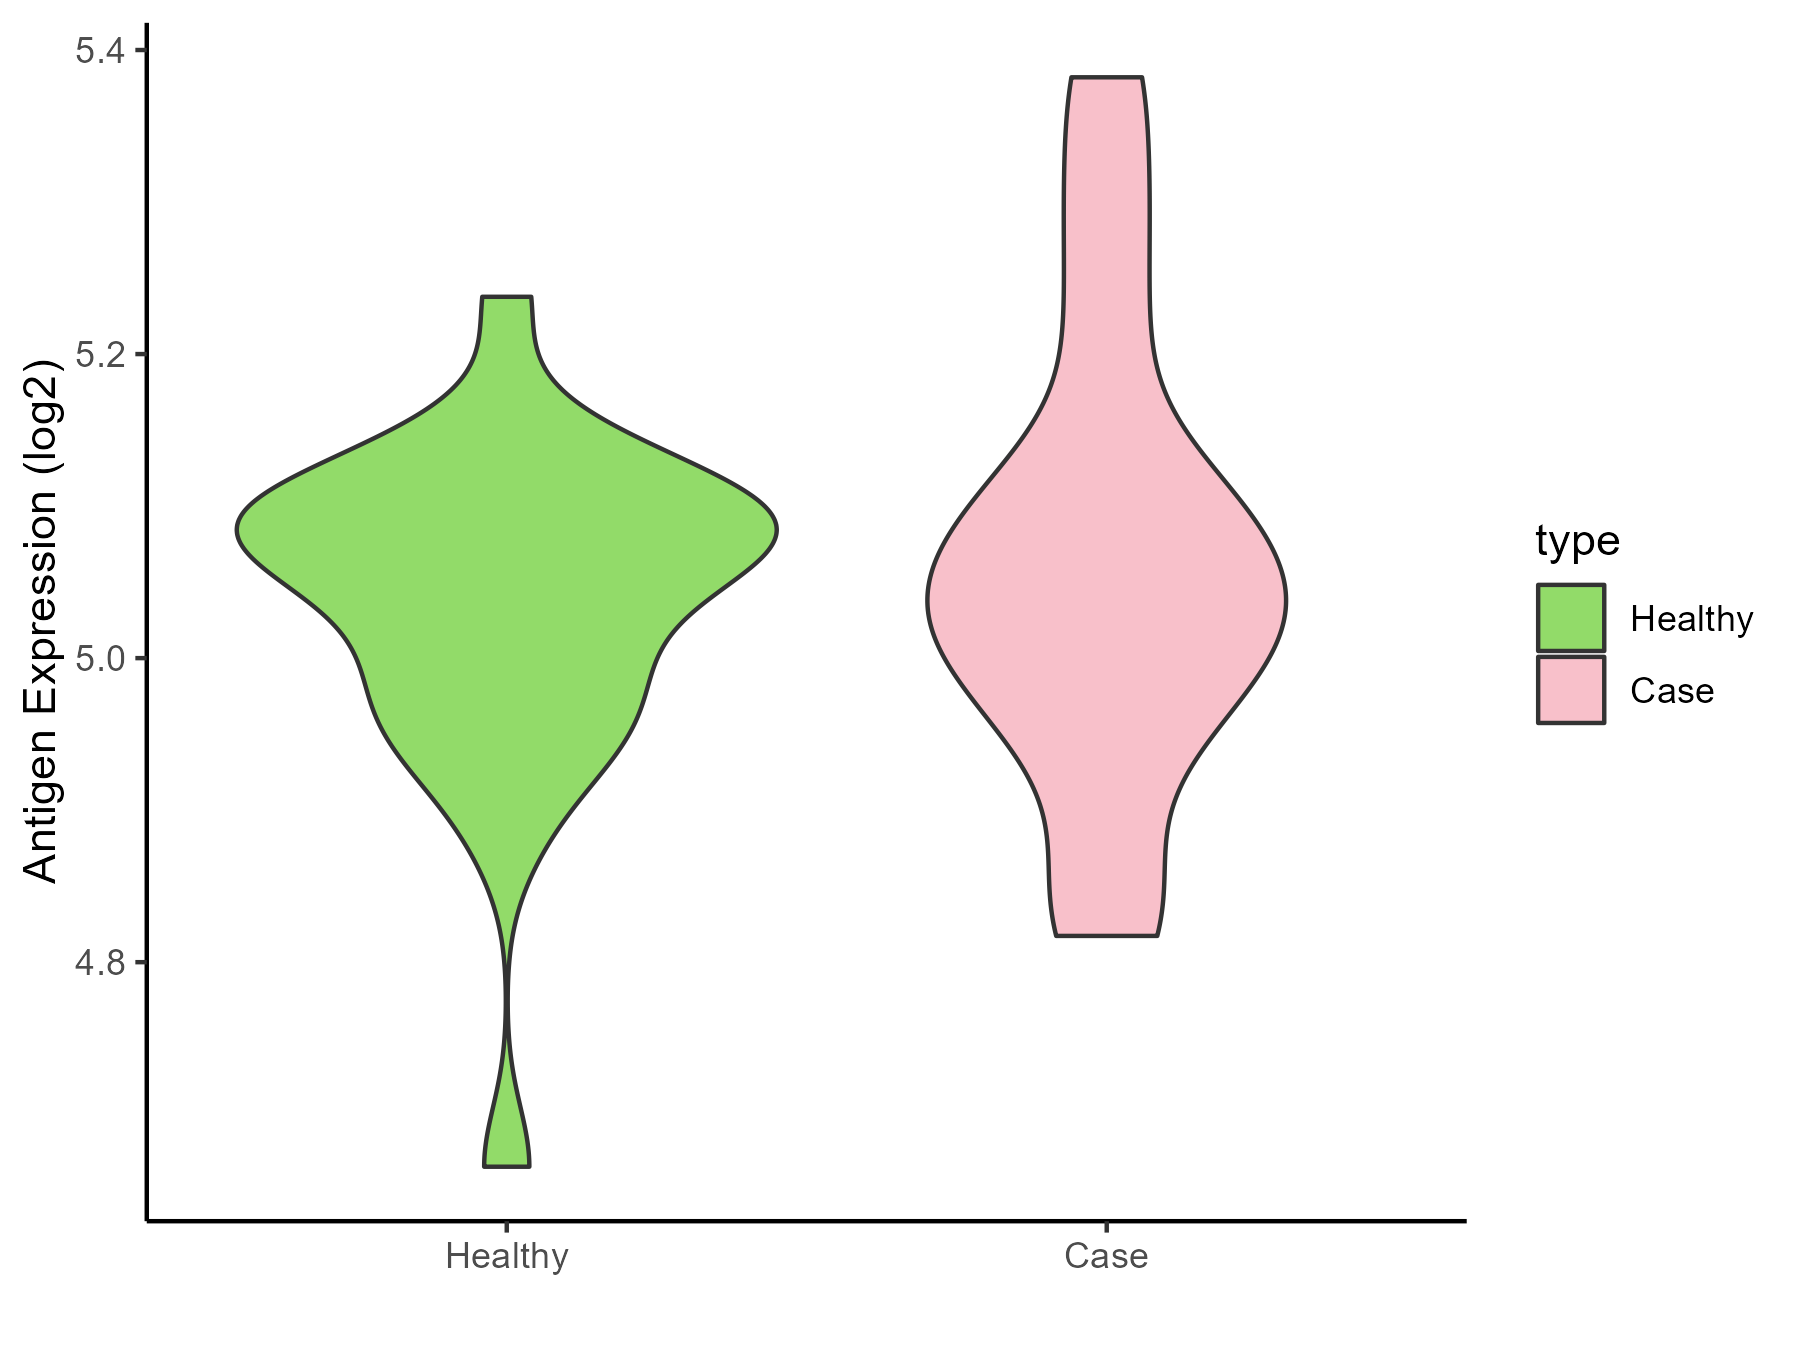
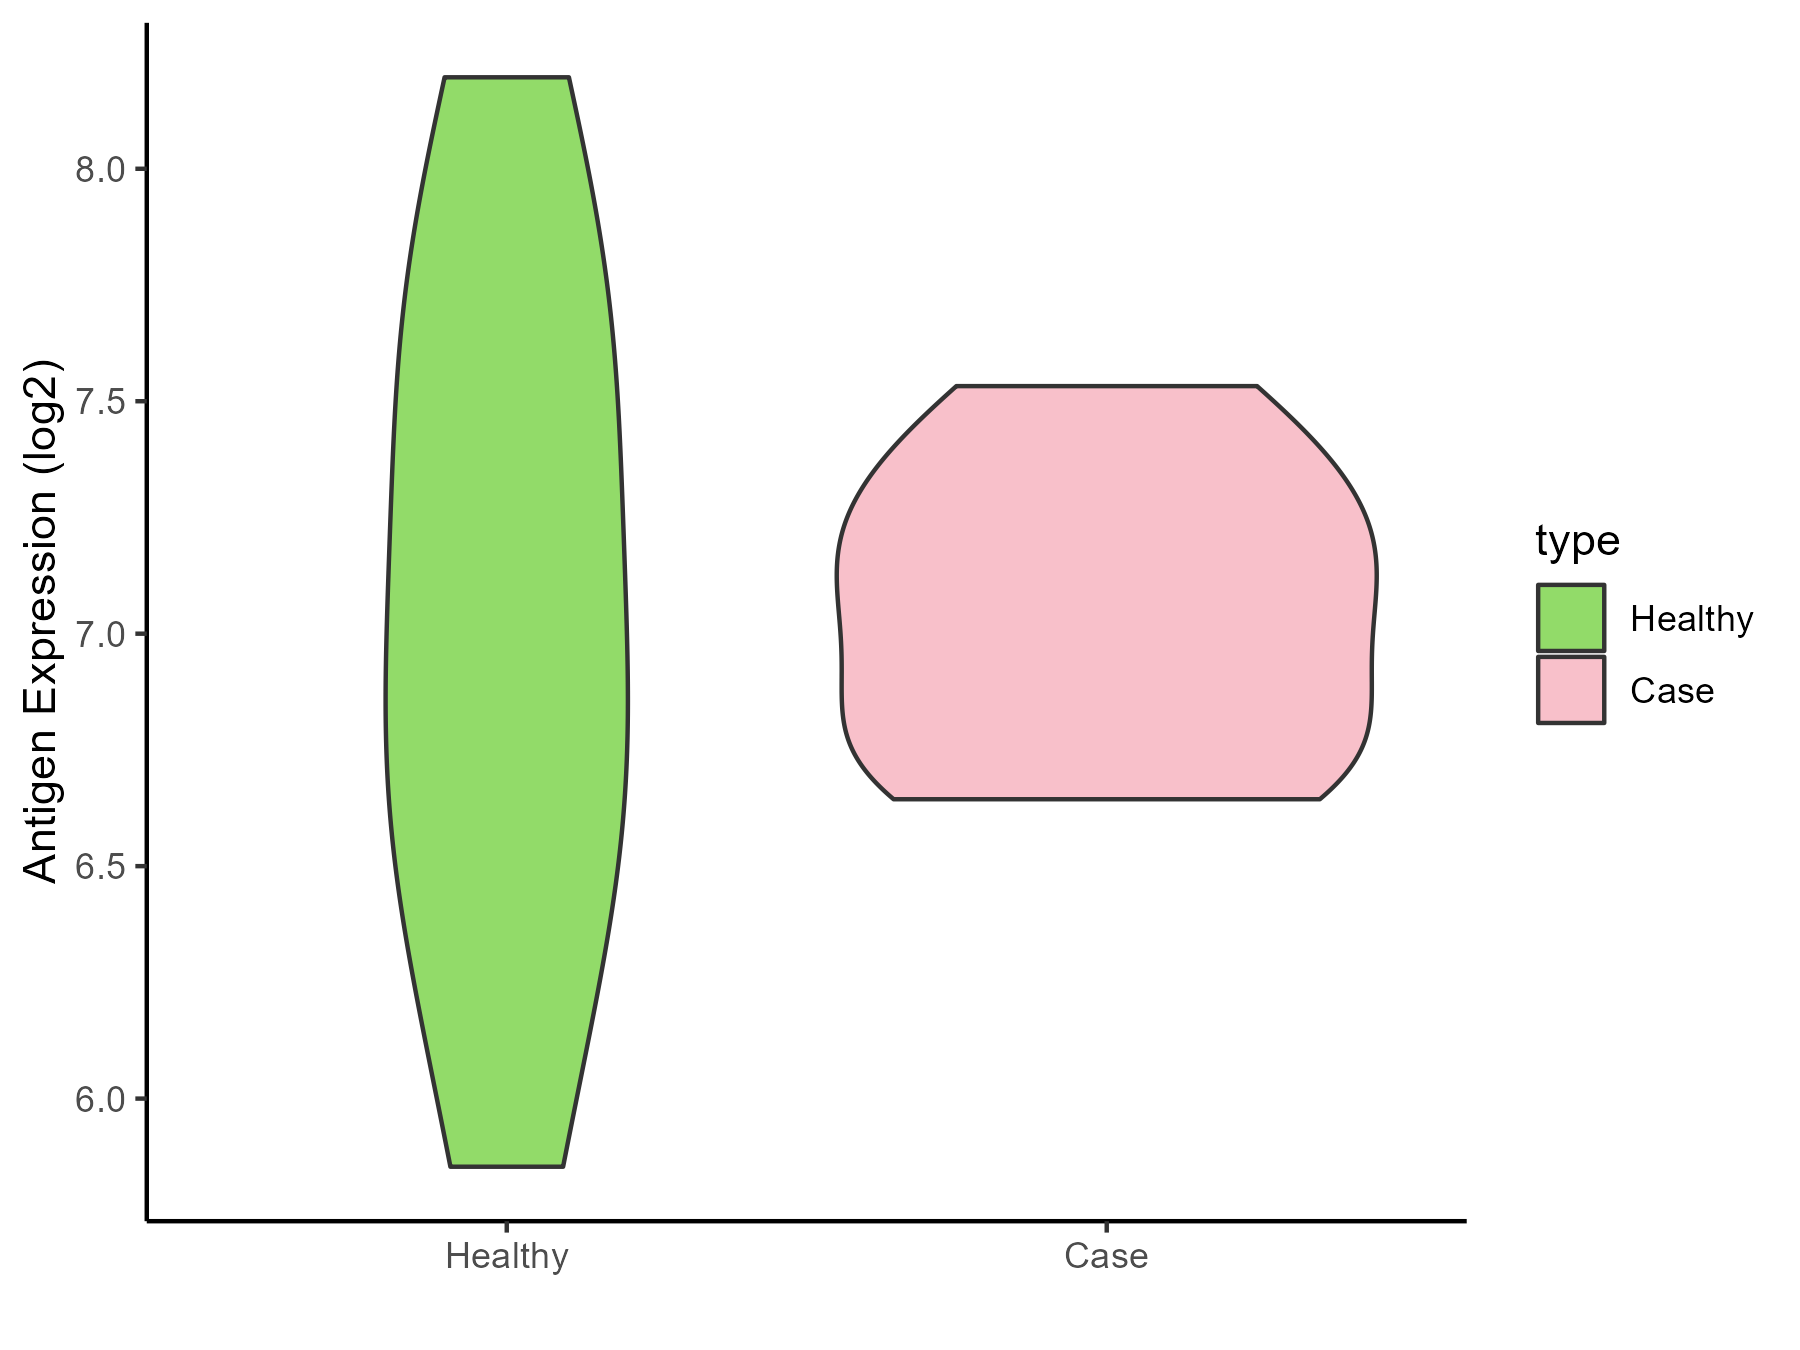
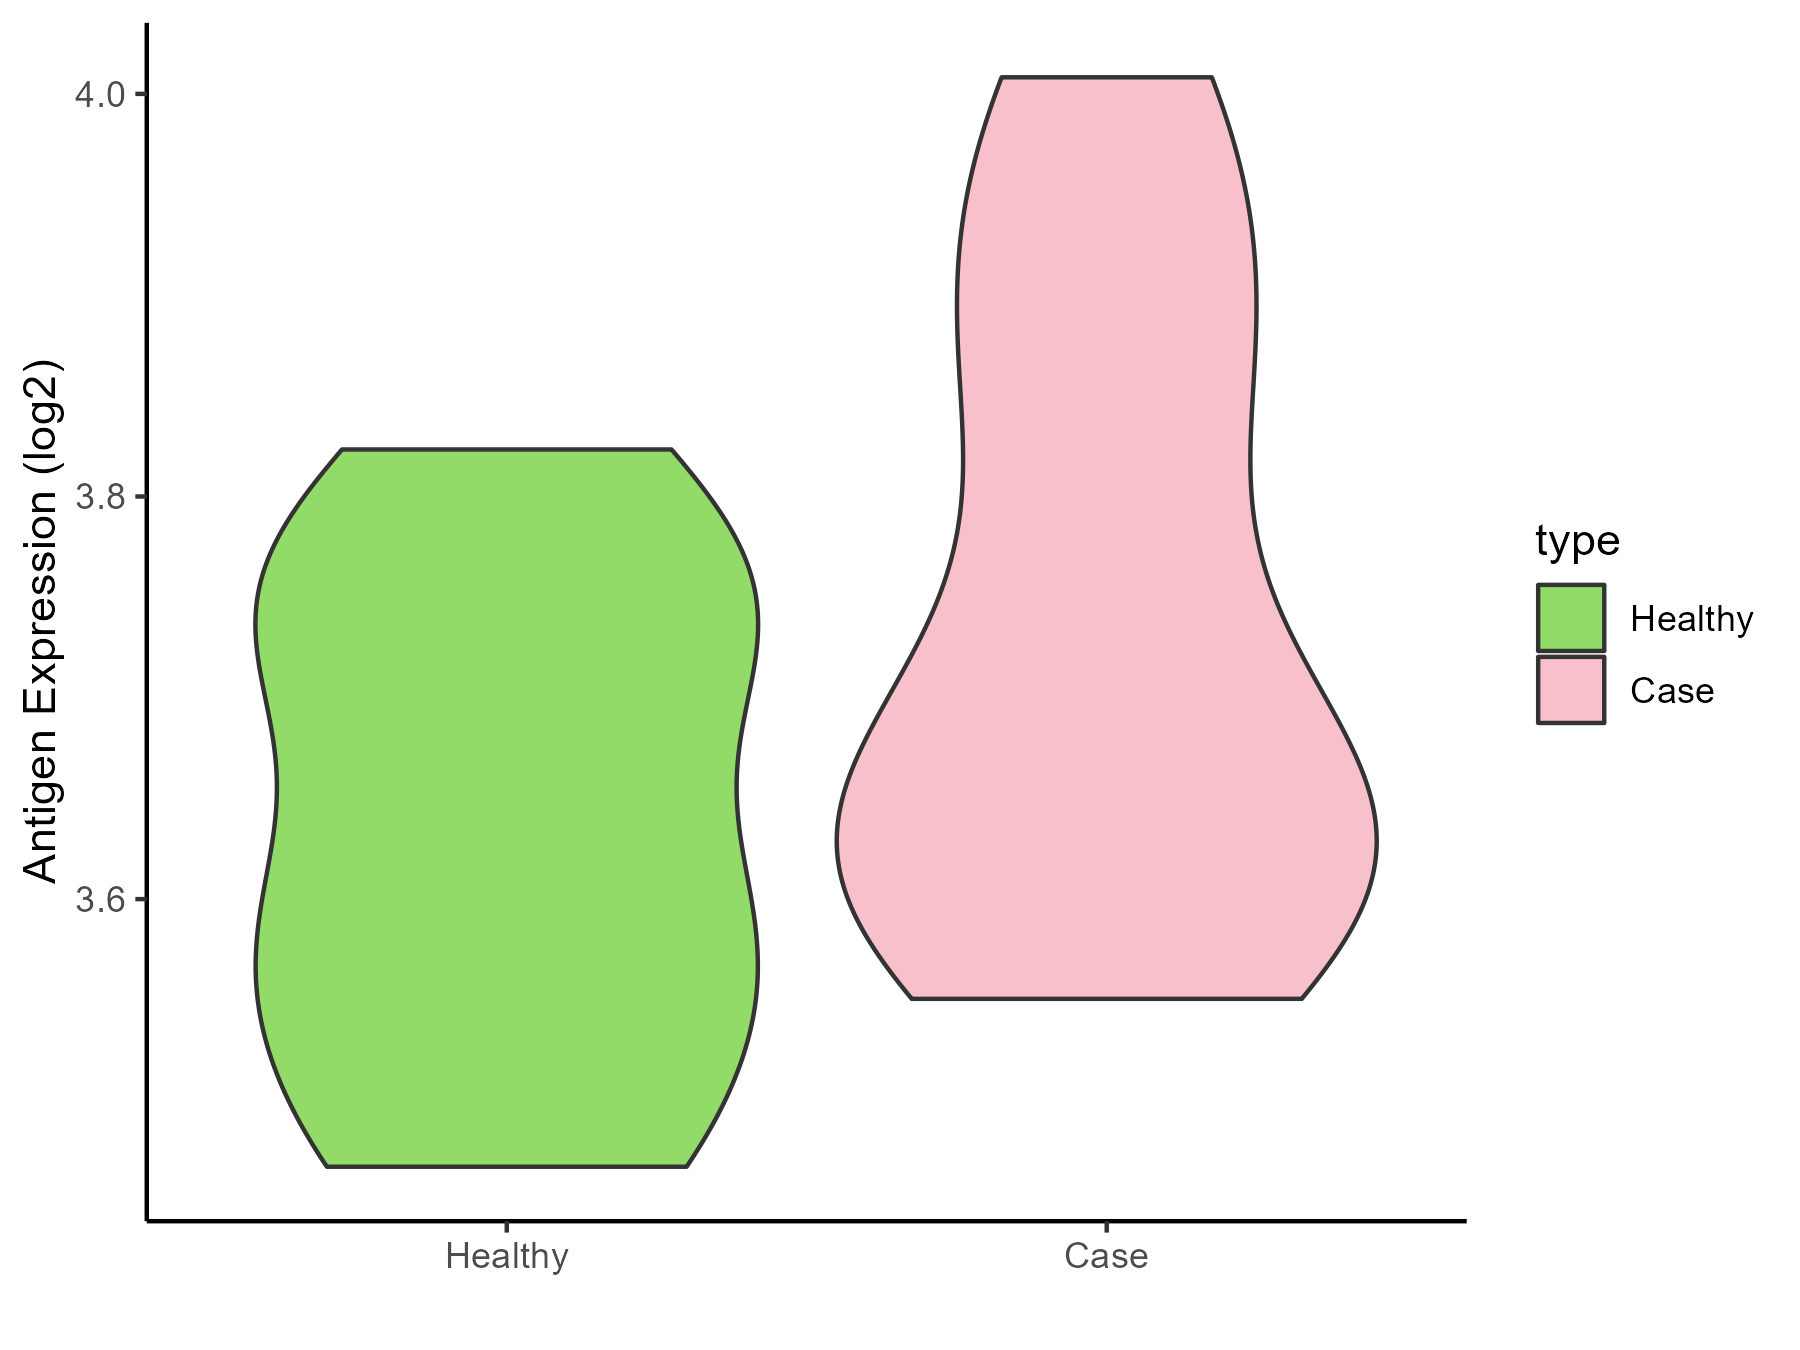
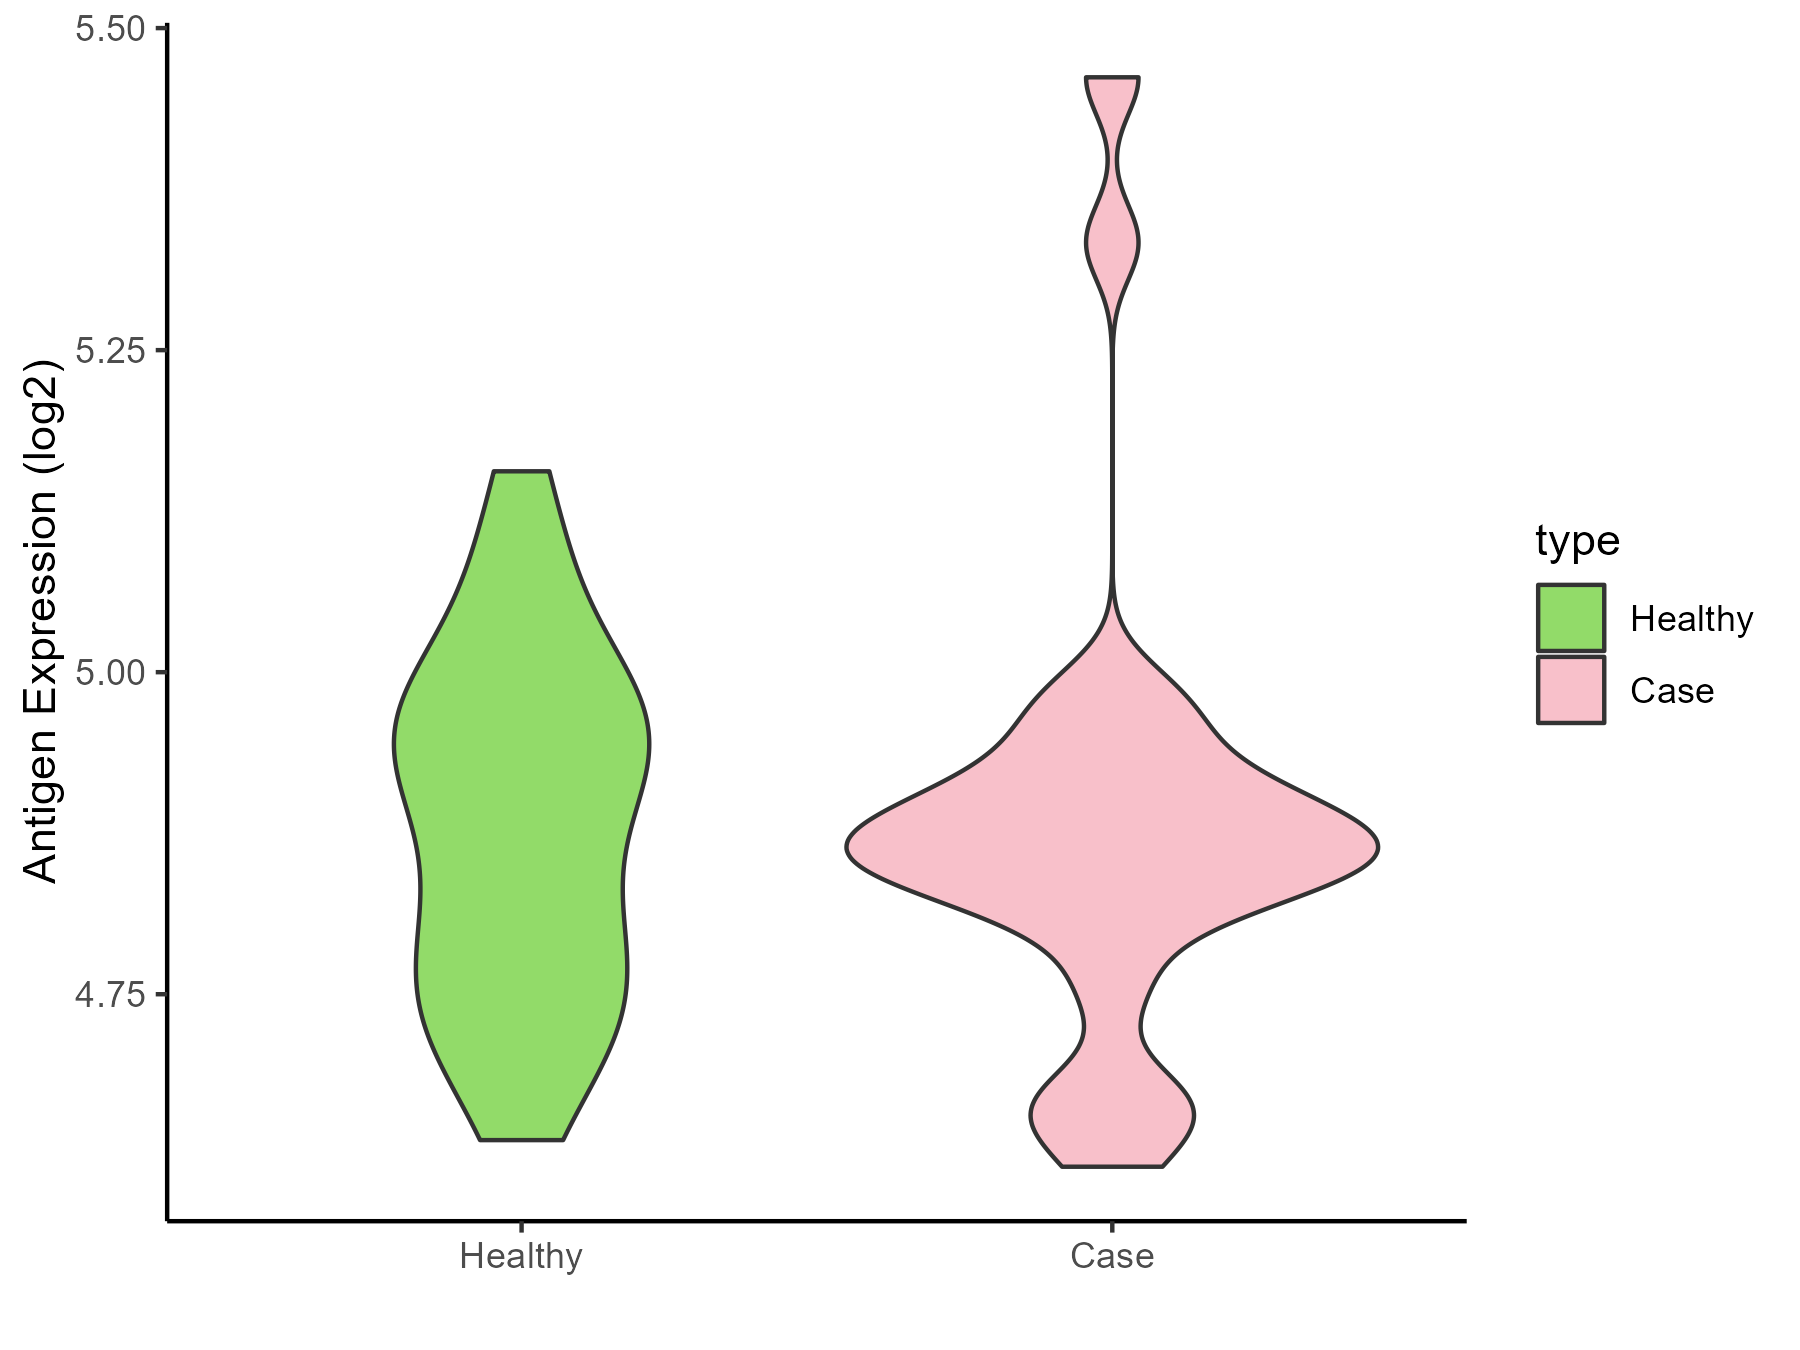
Brainstem |
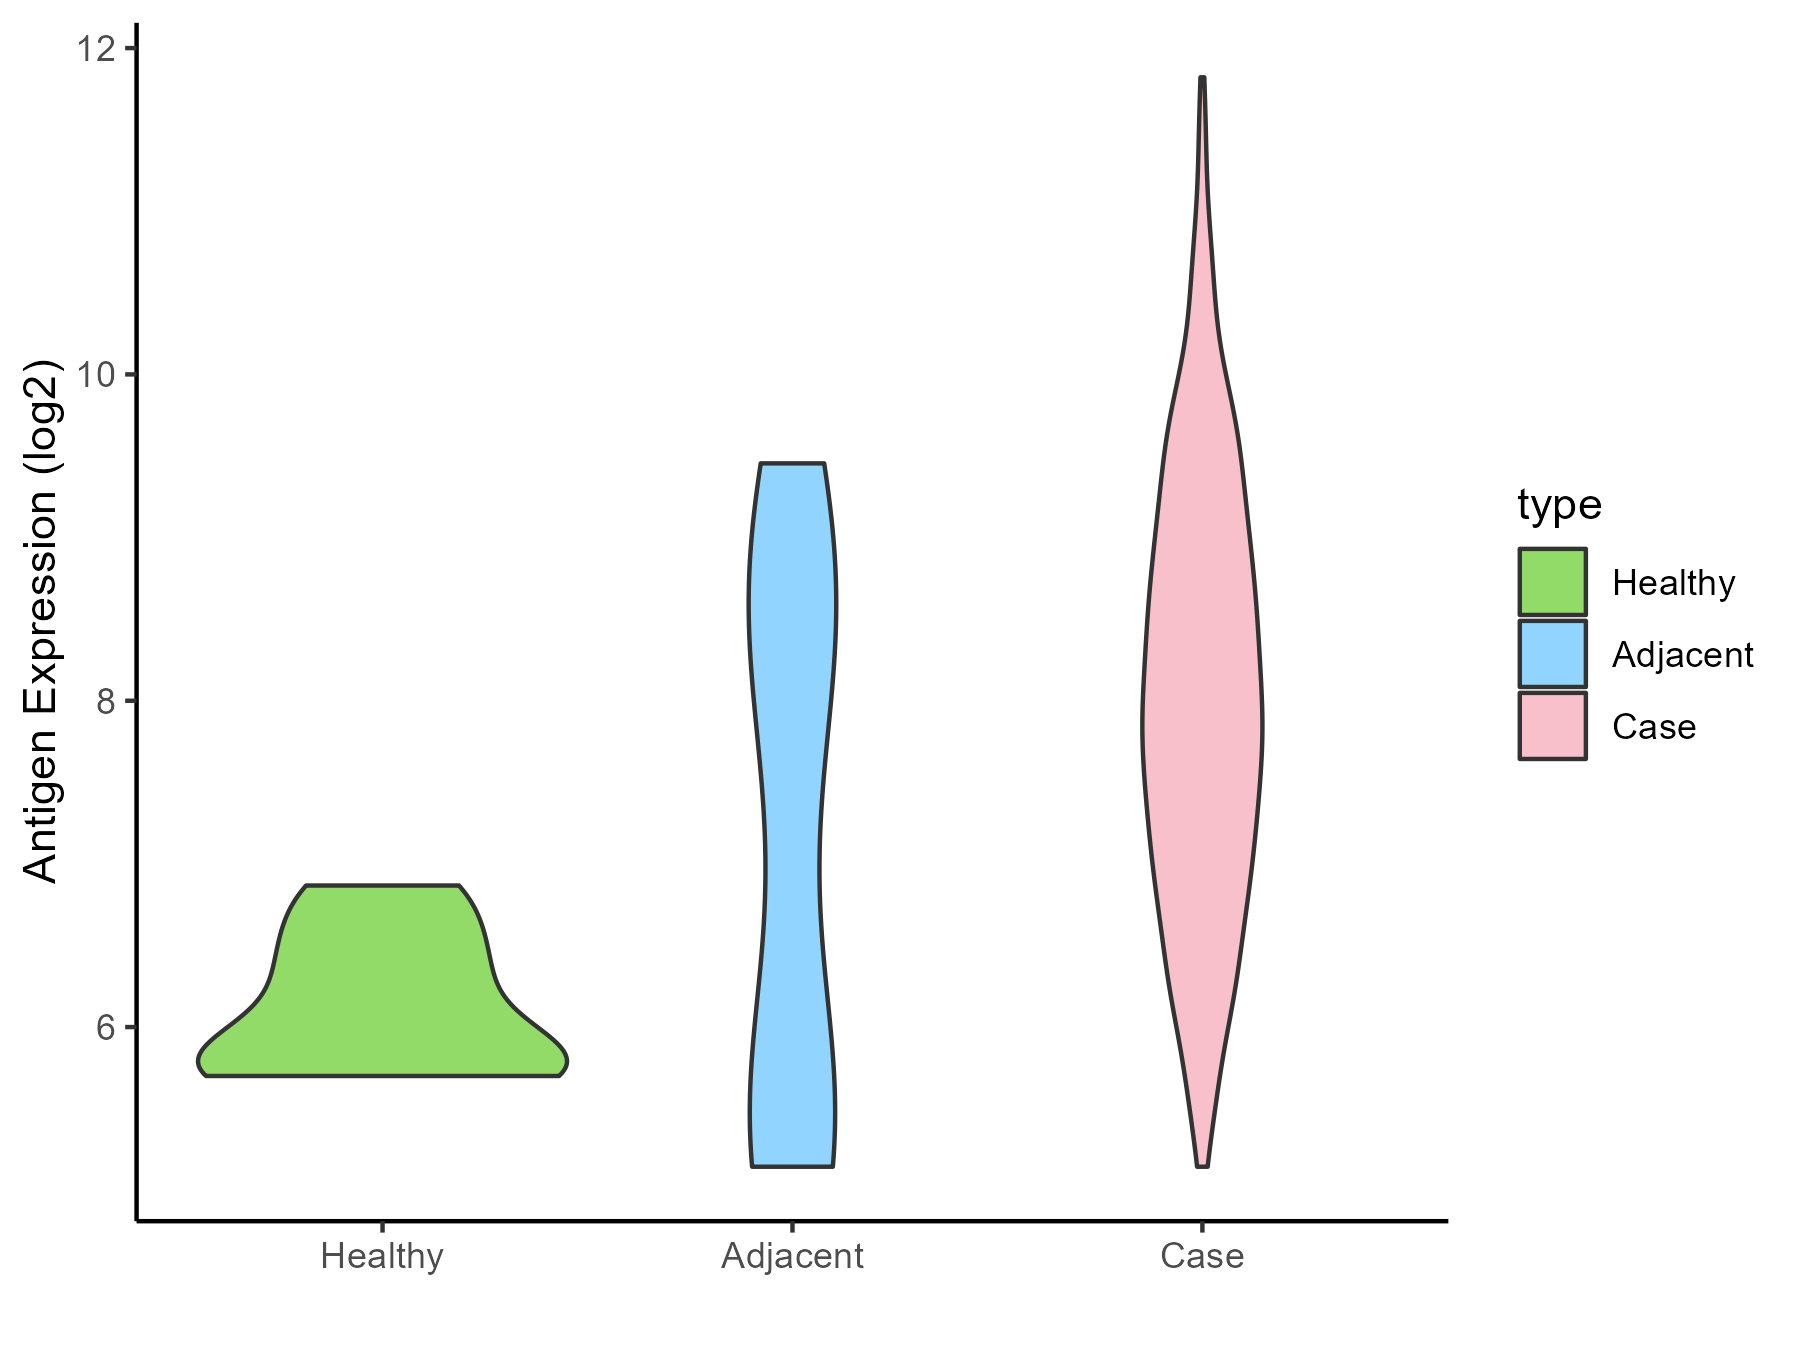
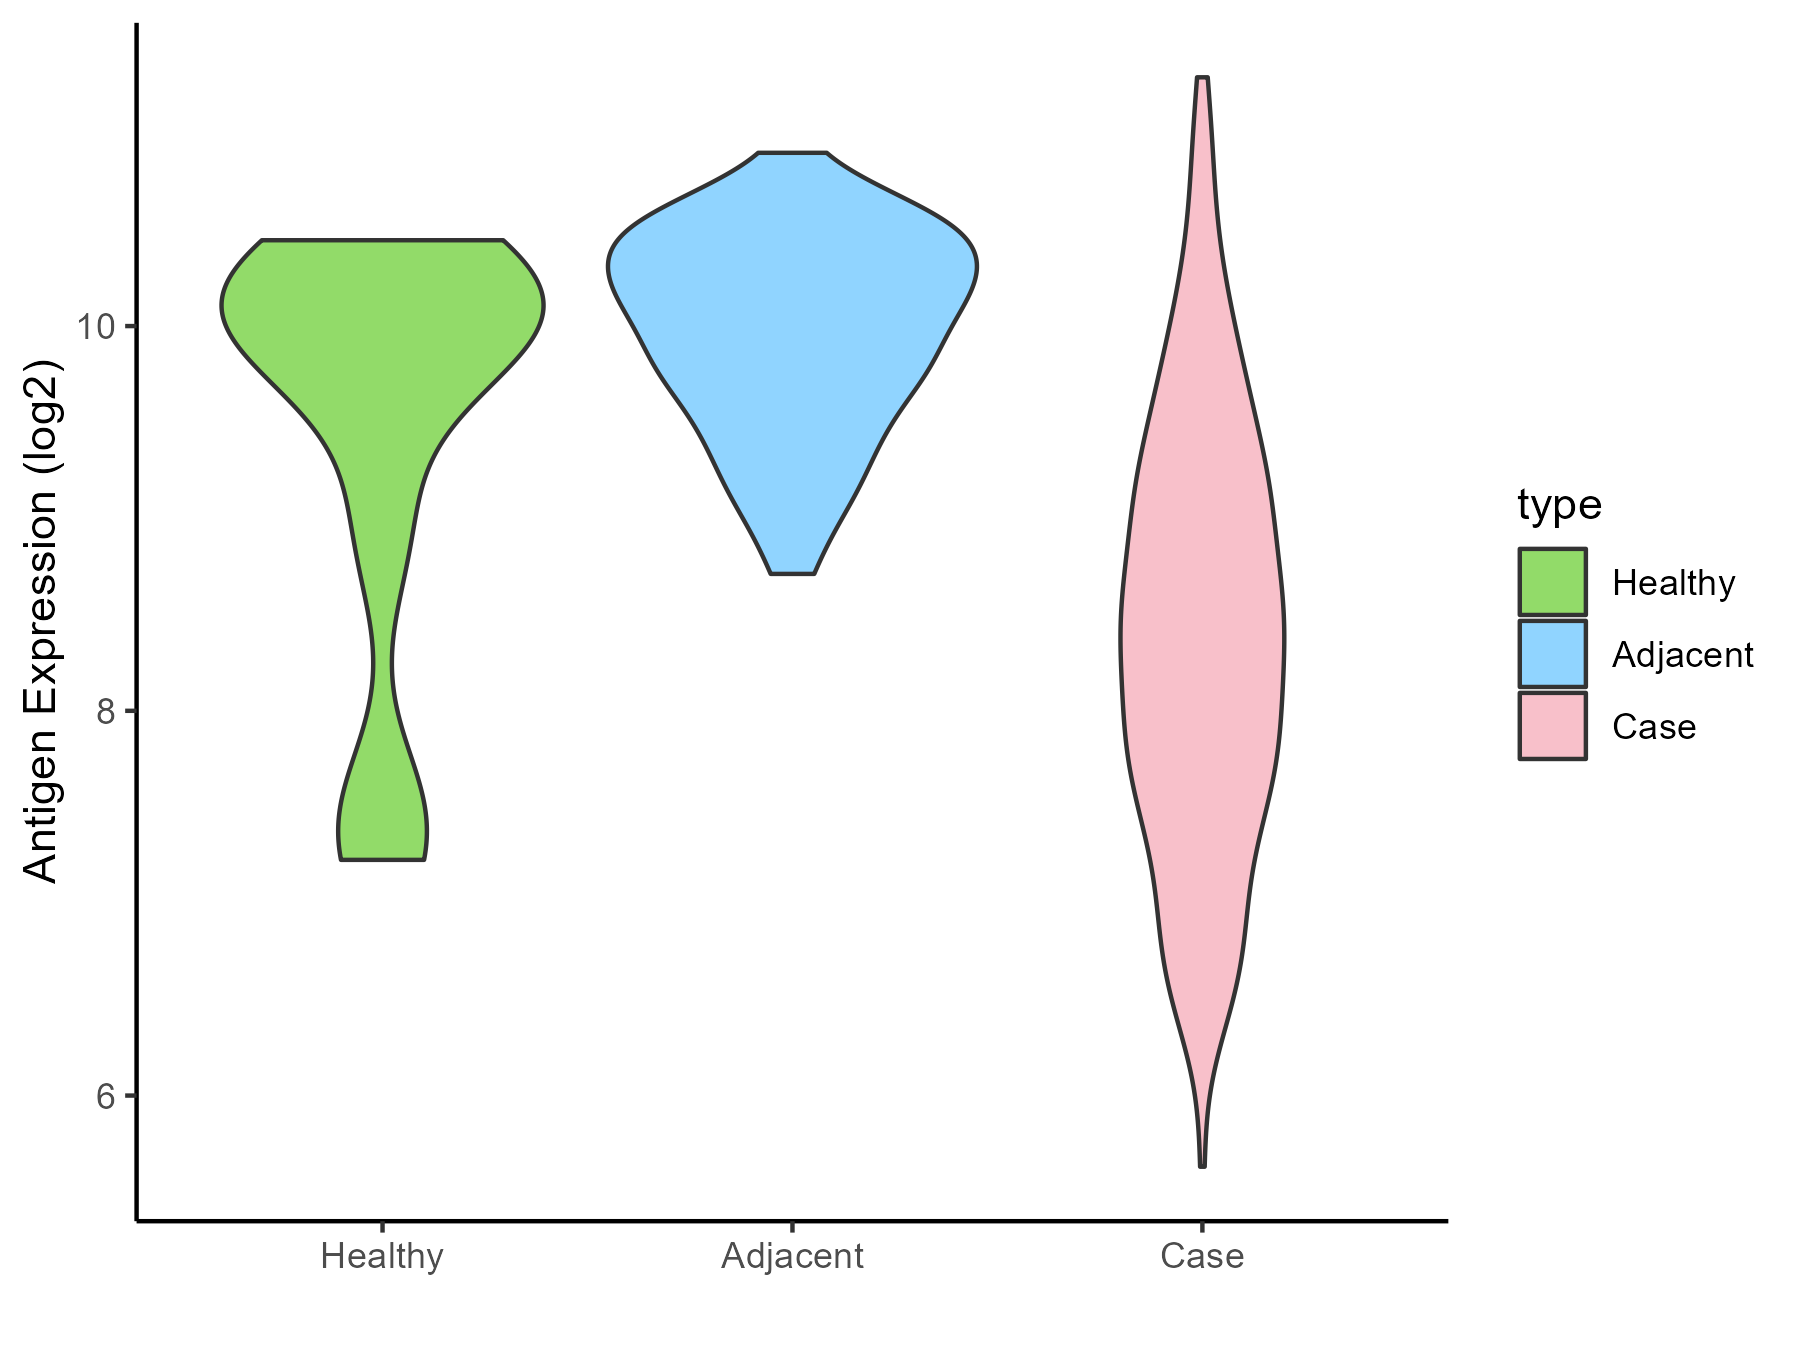
| The Specific Disease |
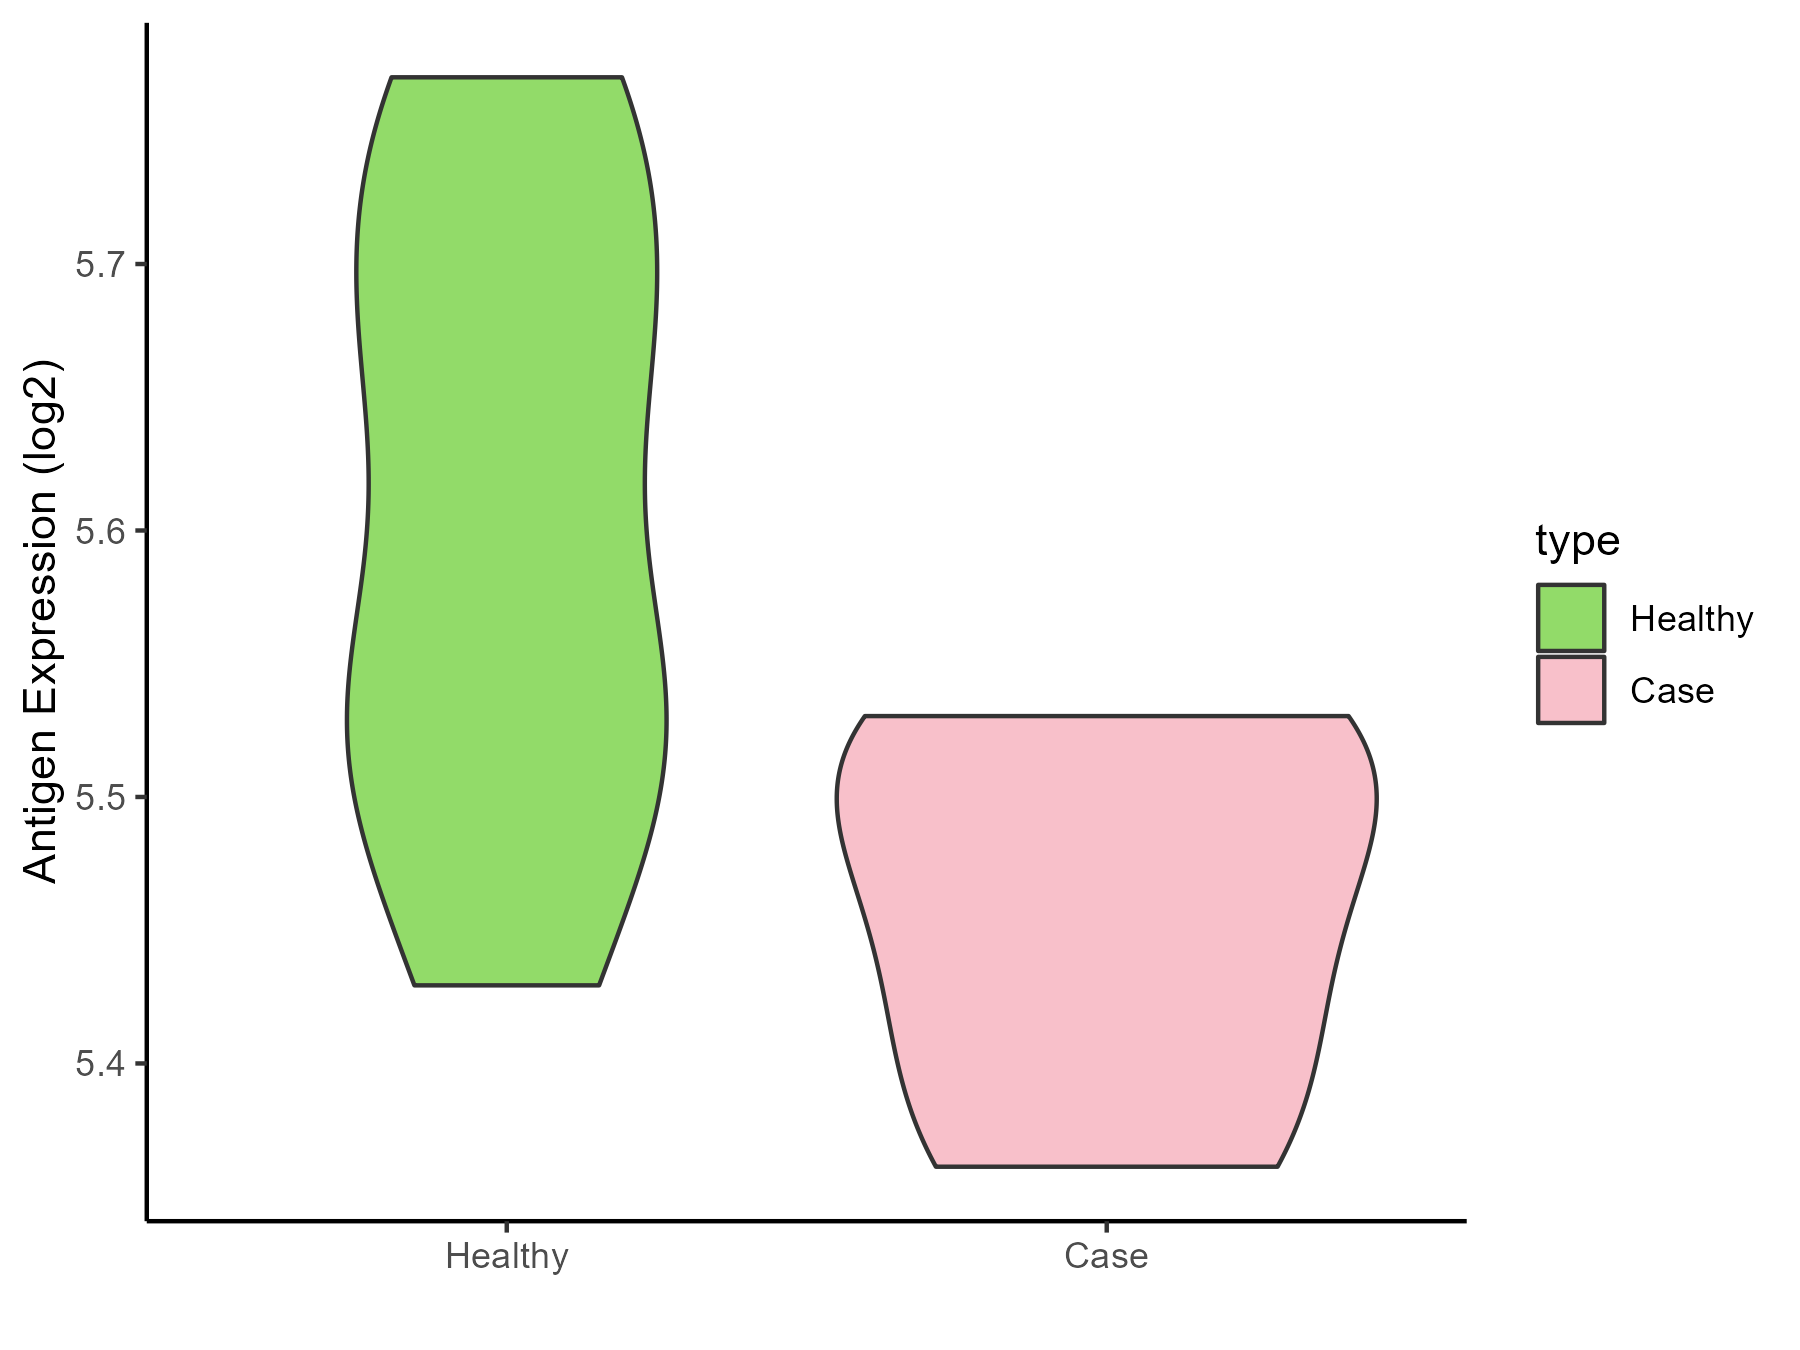
Glioma |
| The Expression Level of Disease Section Compare with the Healthy Individual Tissue |
p-value: 0.000334842;
Fold-change: 0.477995488;
Z-score: 7.052568499
|
| Disease-specific Antigen Abundances |
|
Click to View the Clearer Original Diagram
|
|
|
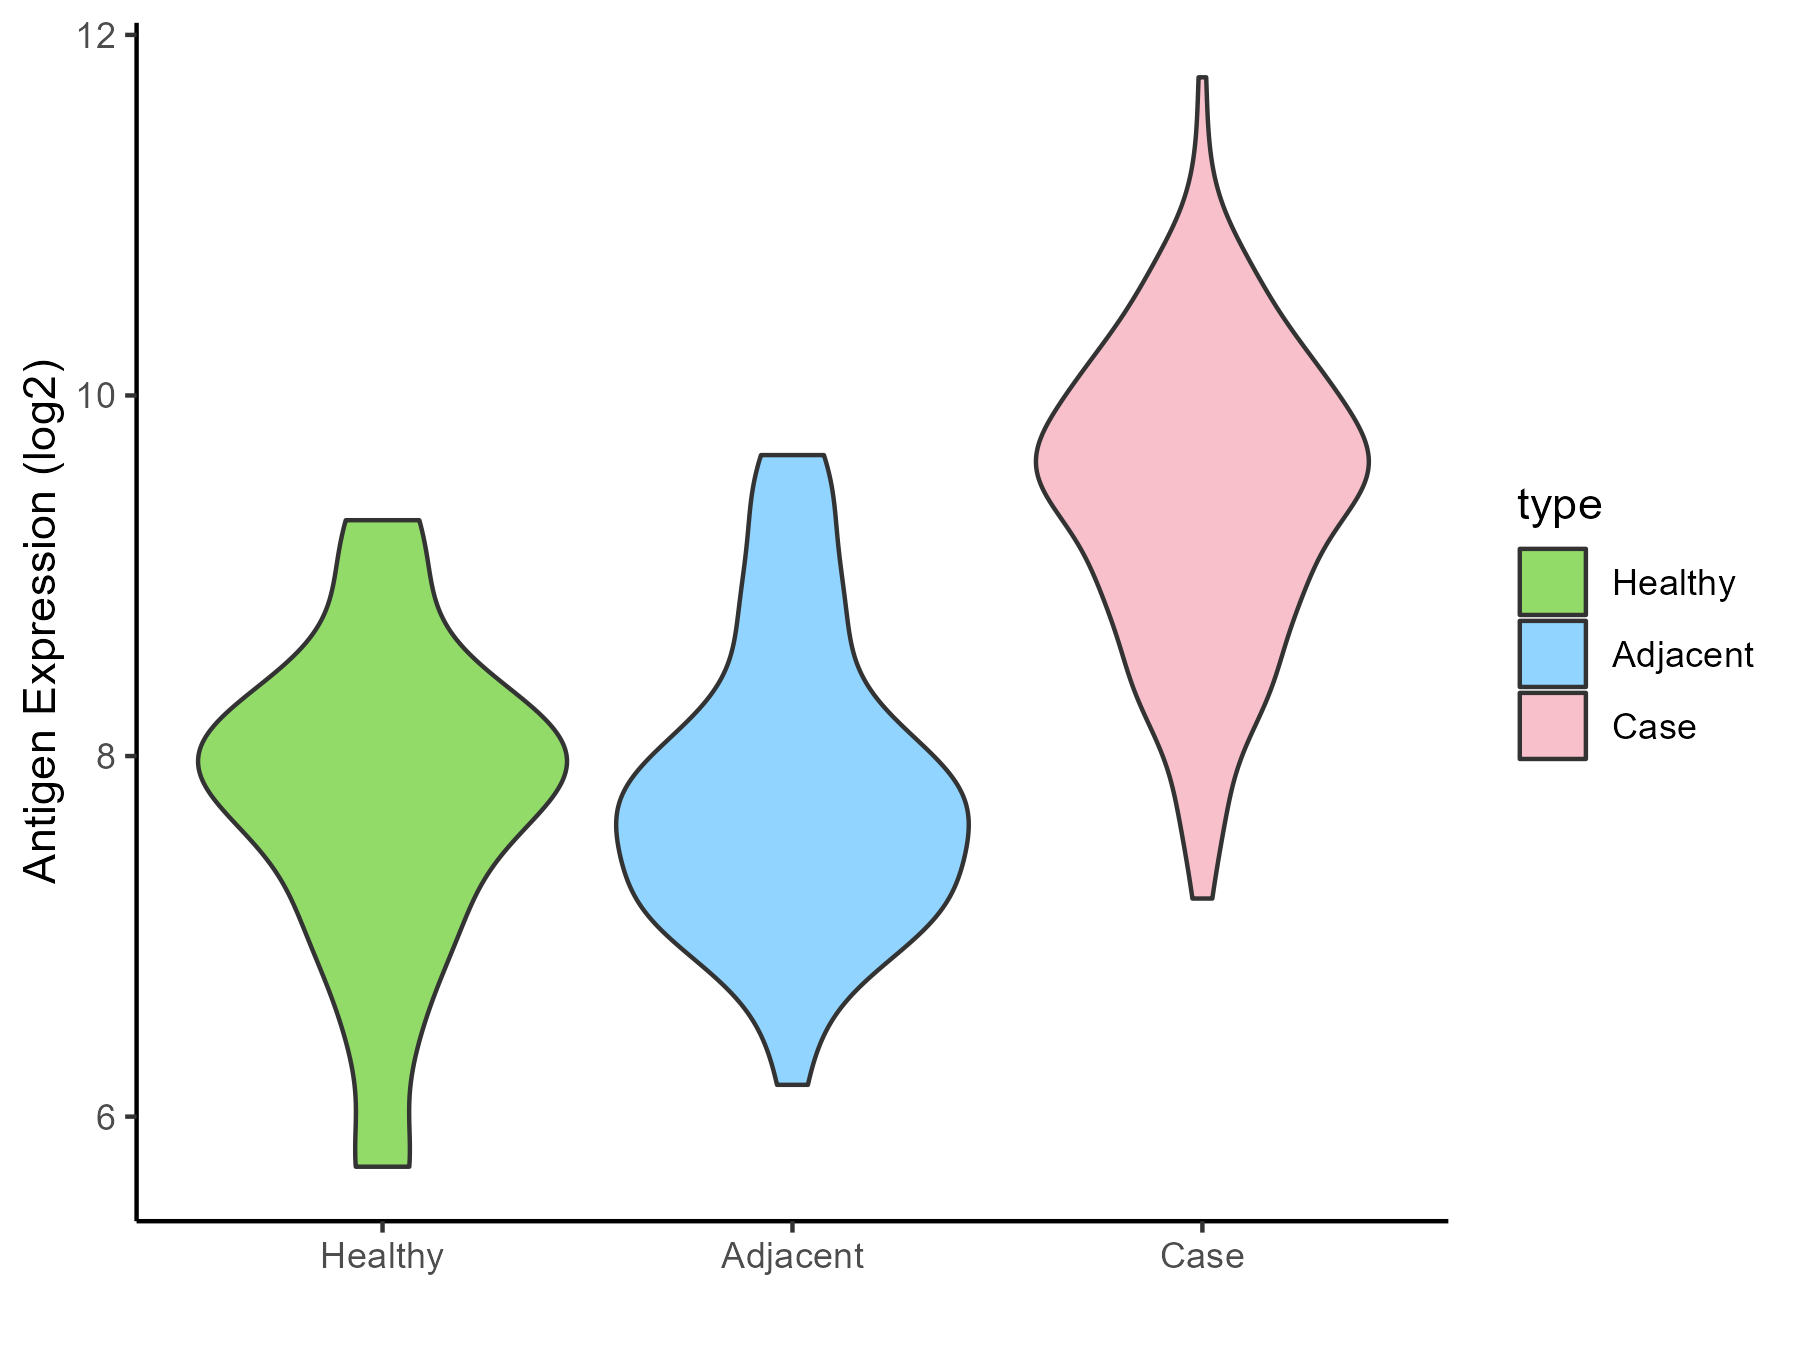
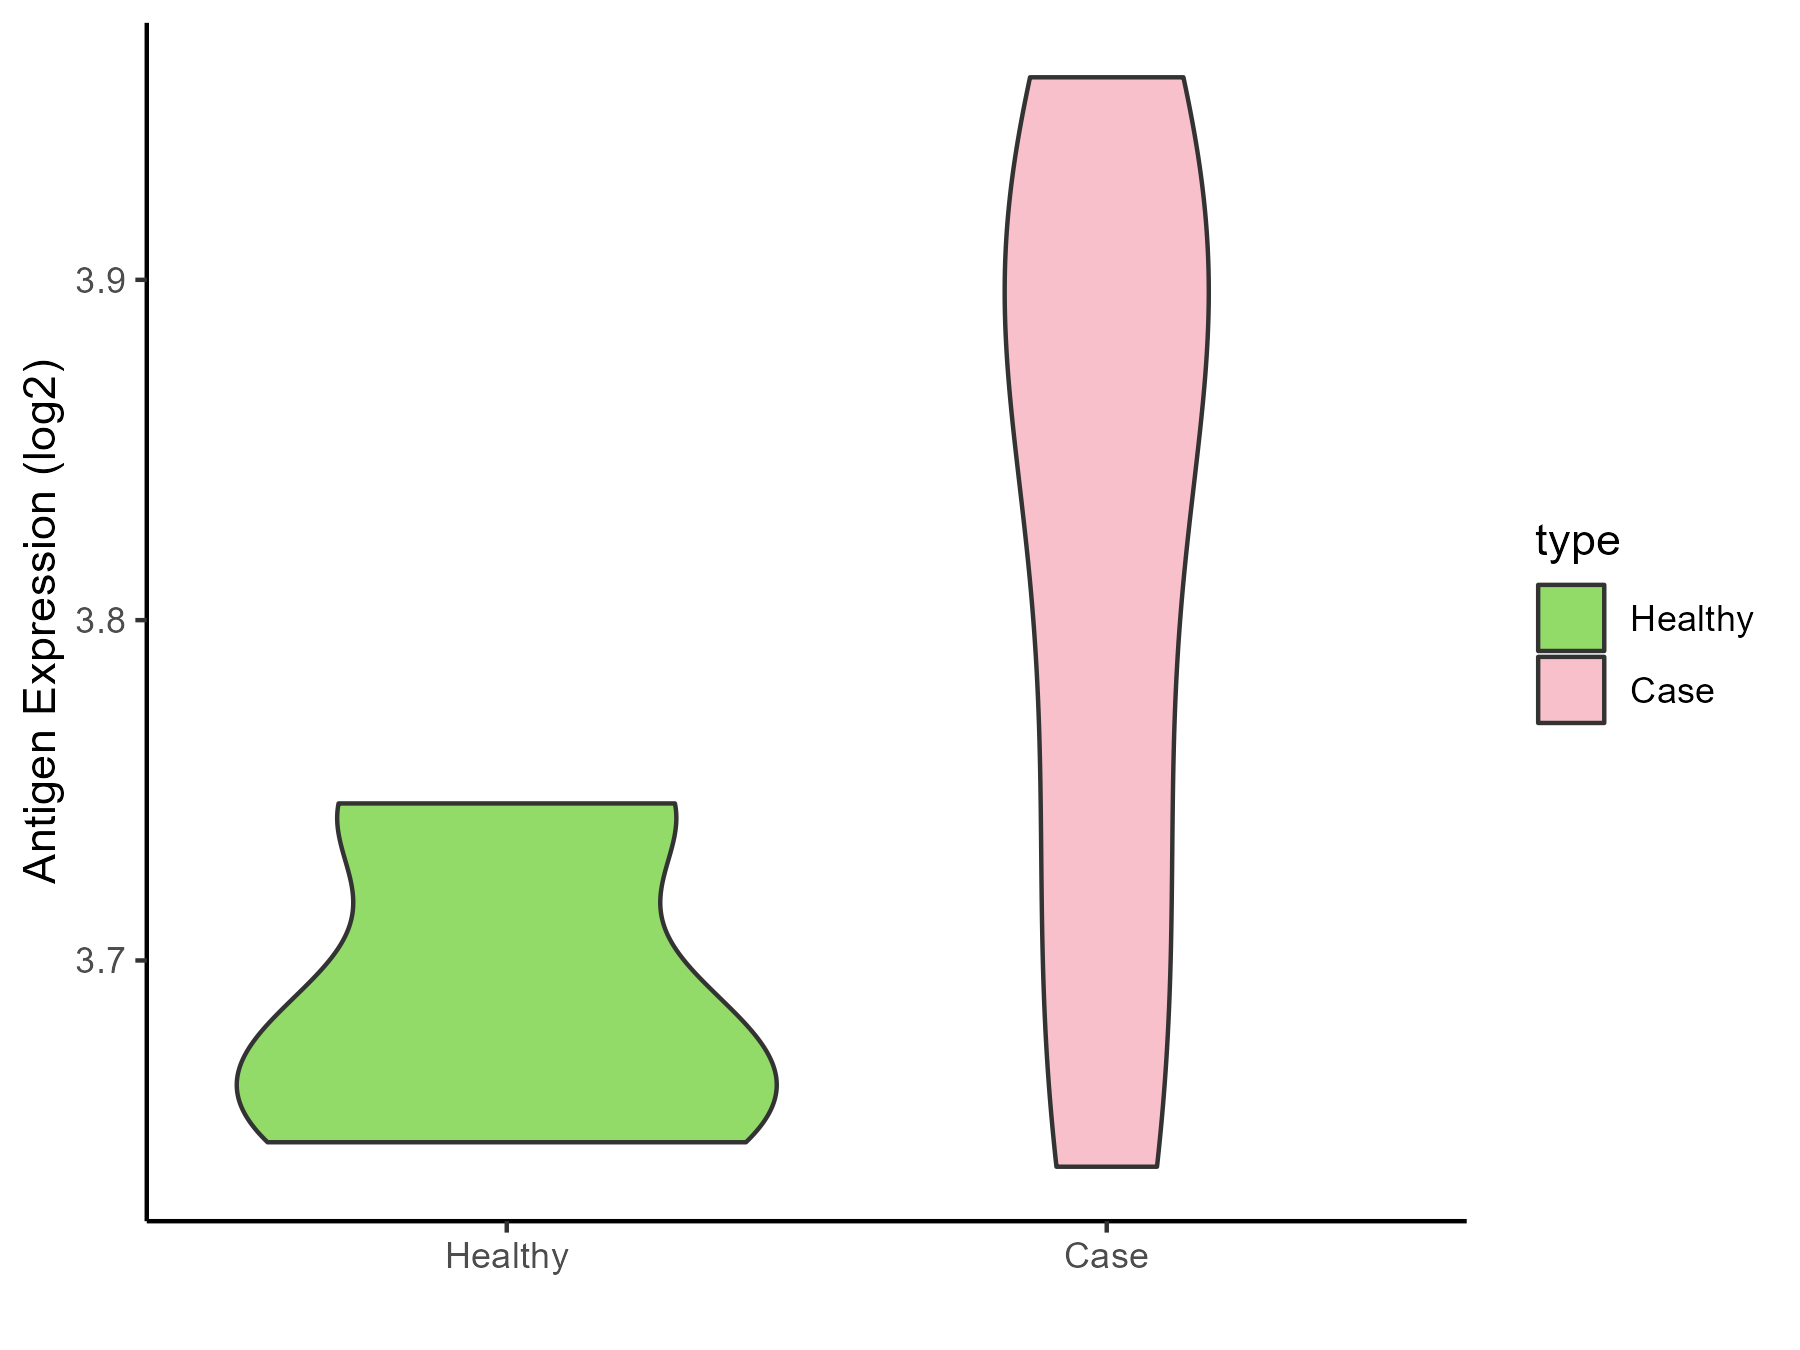
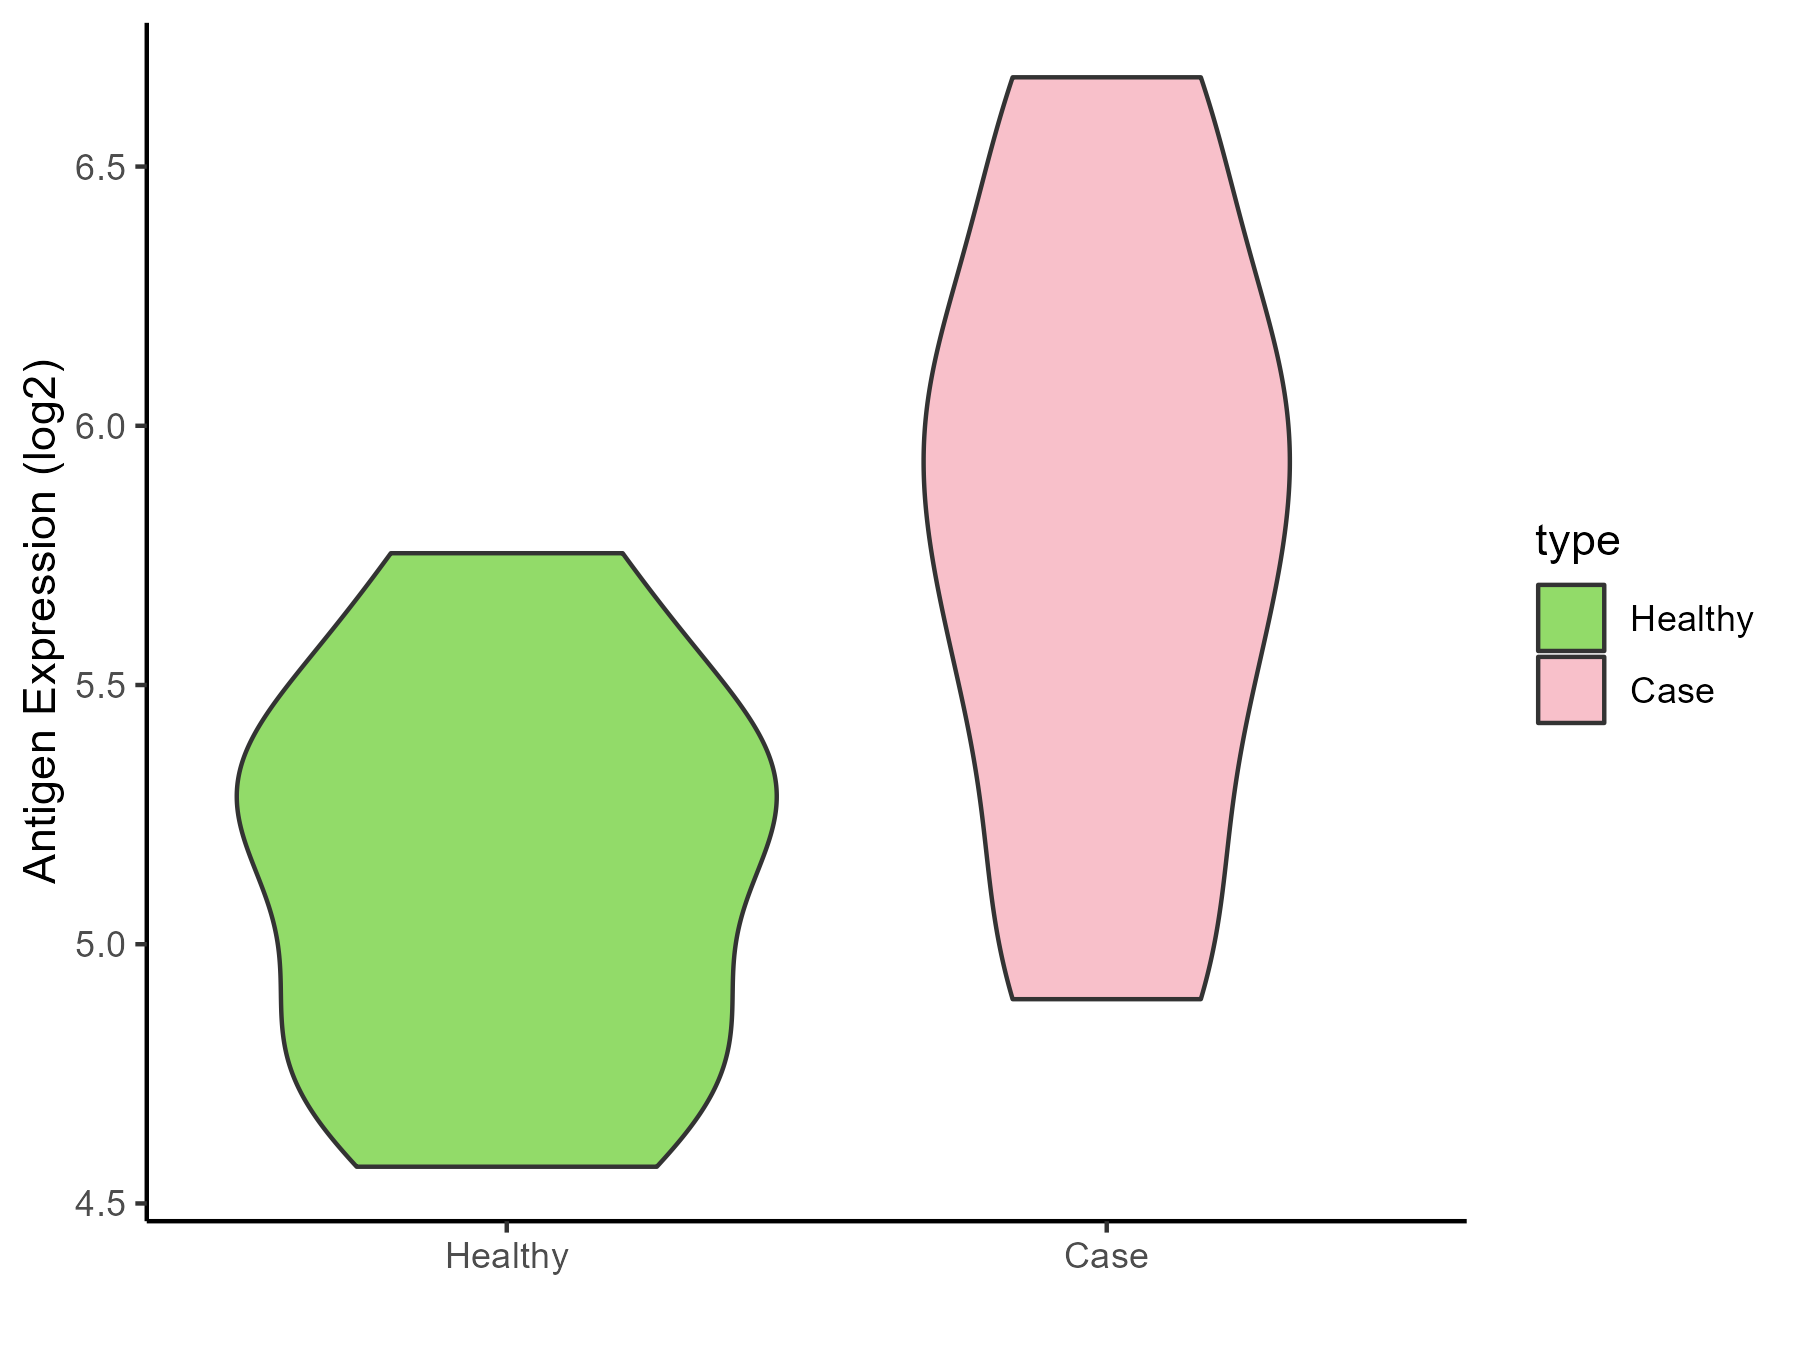
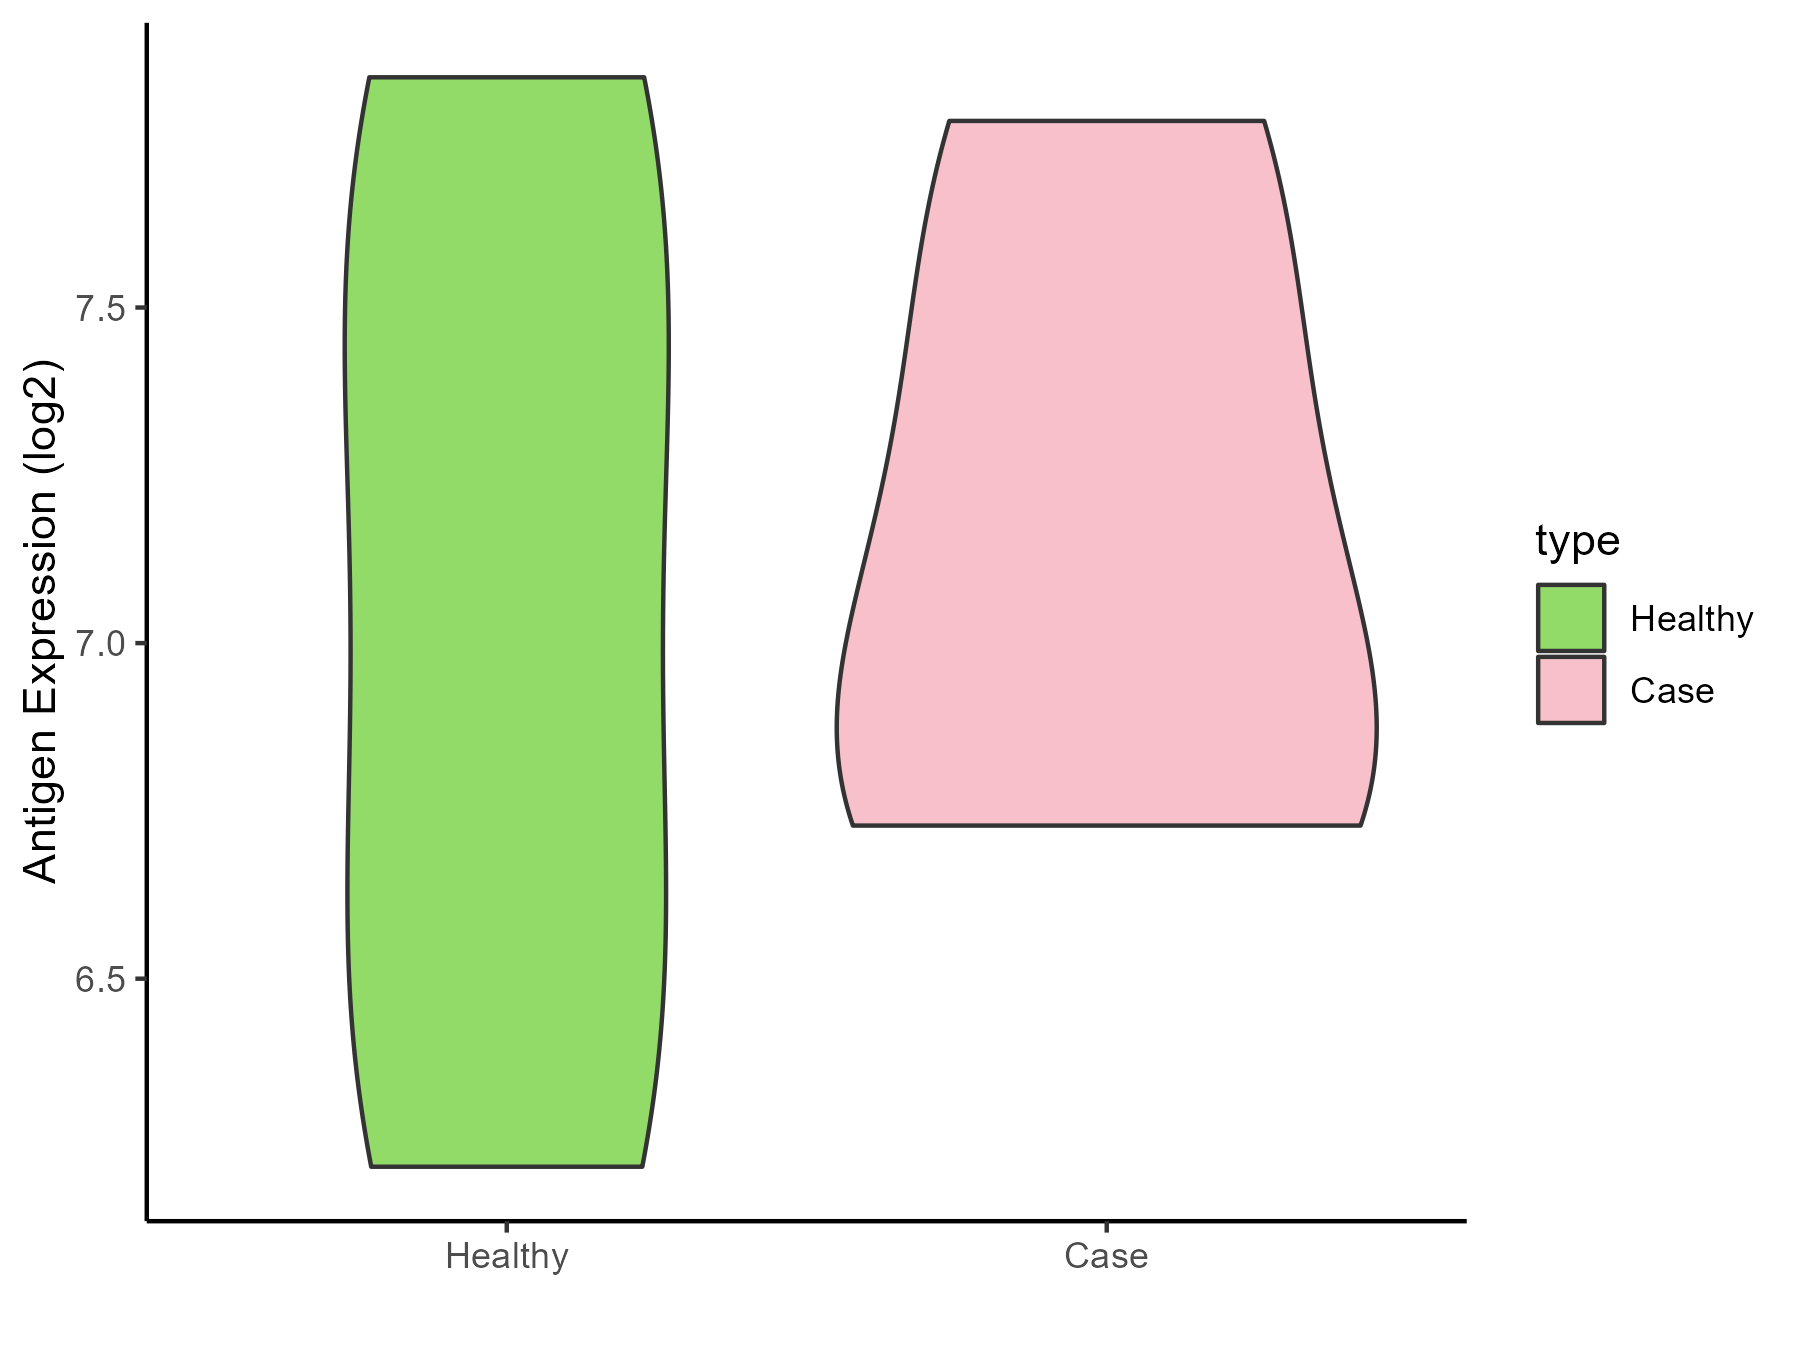
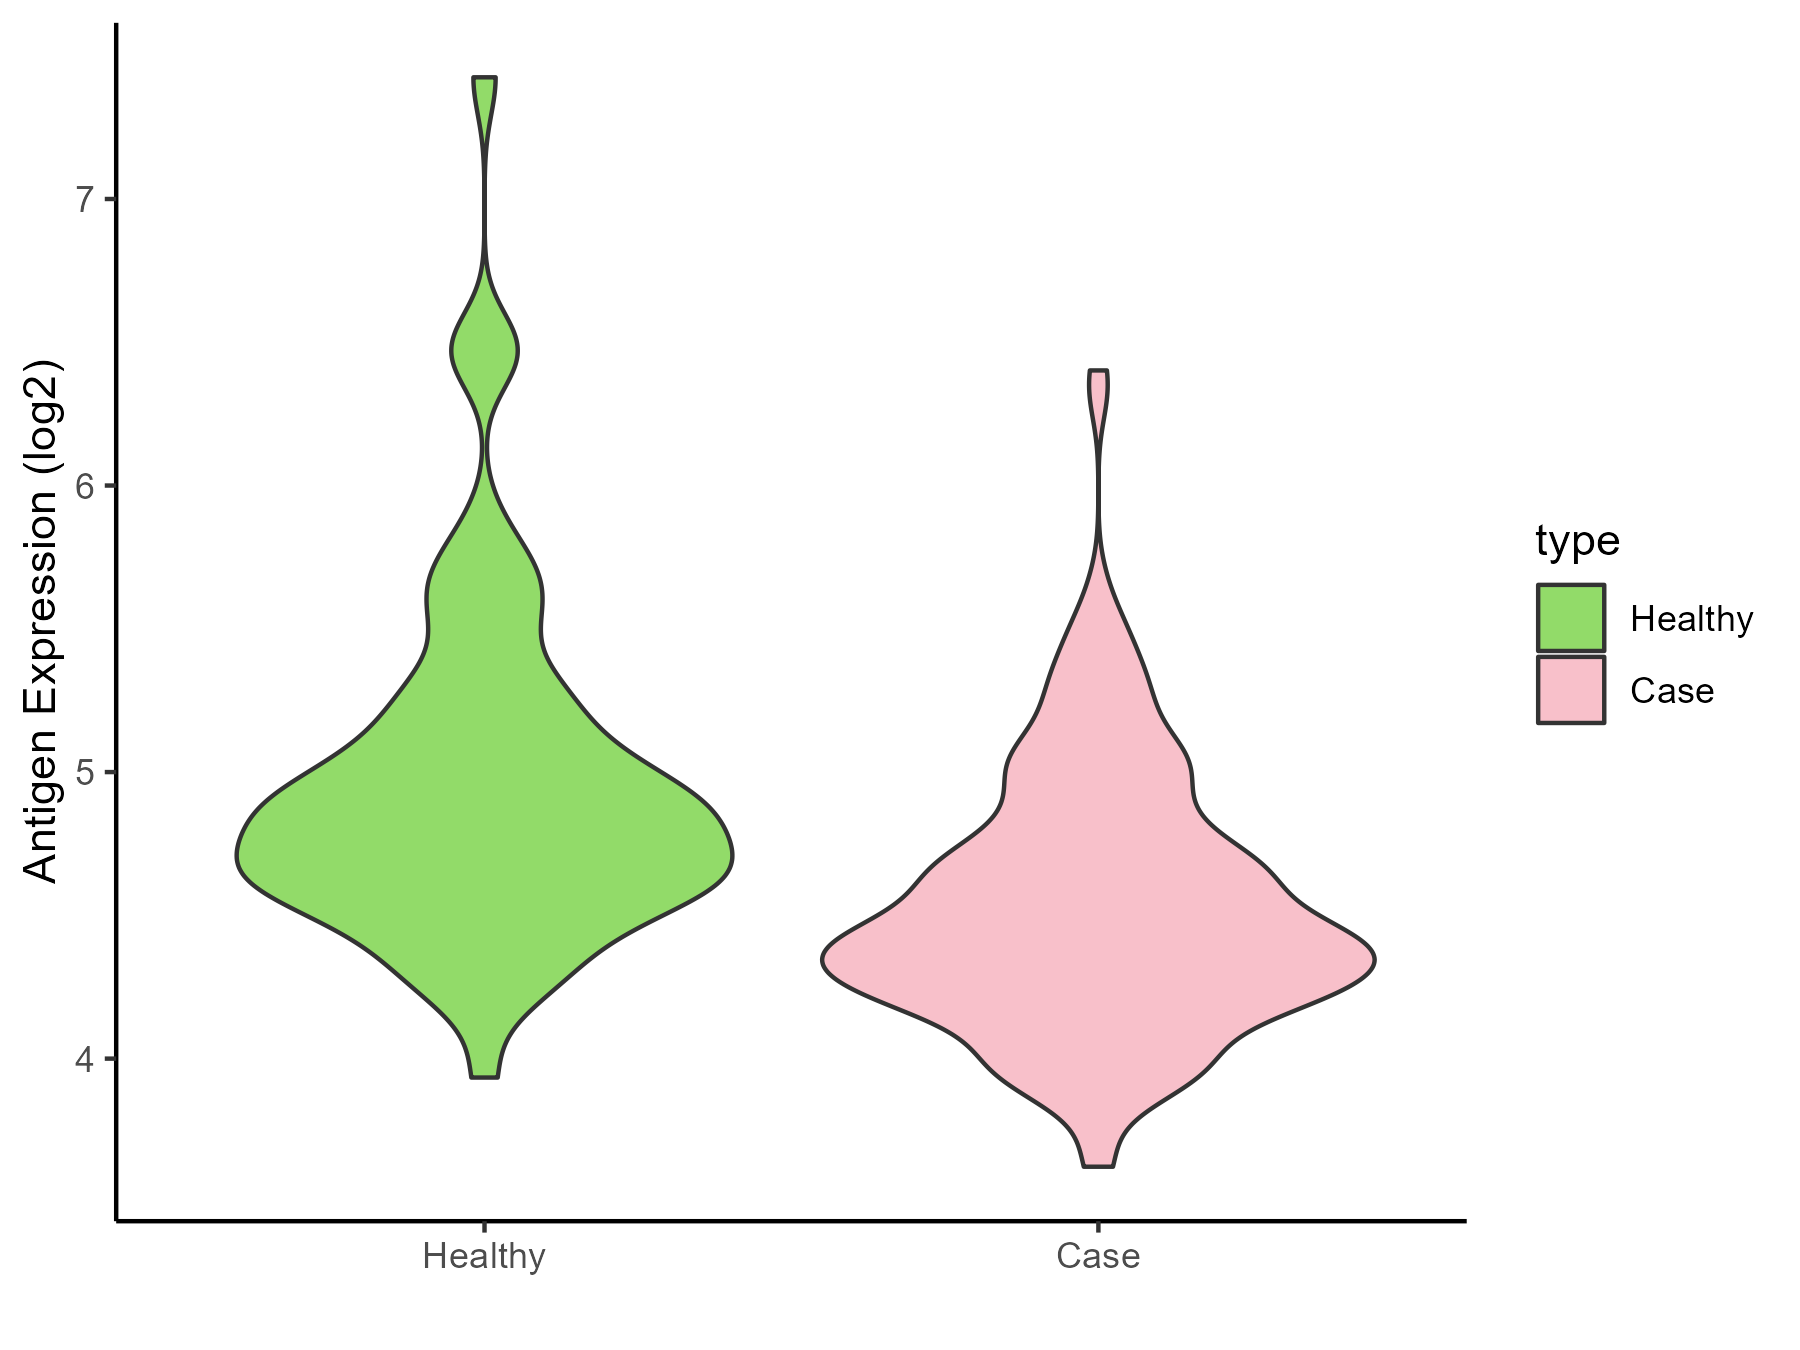
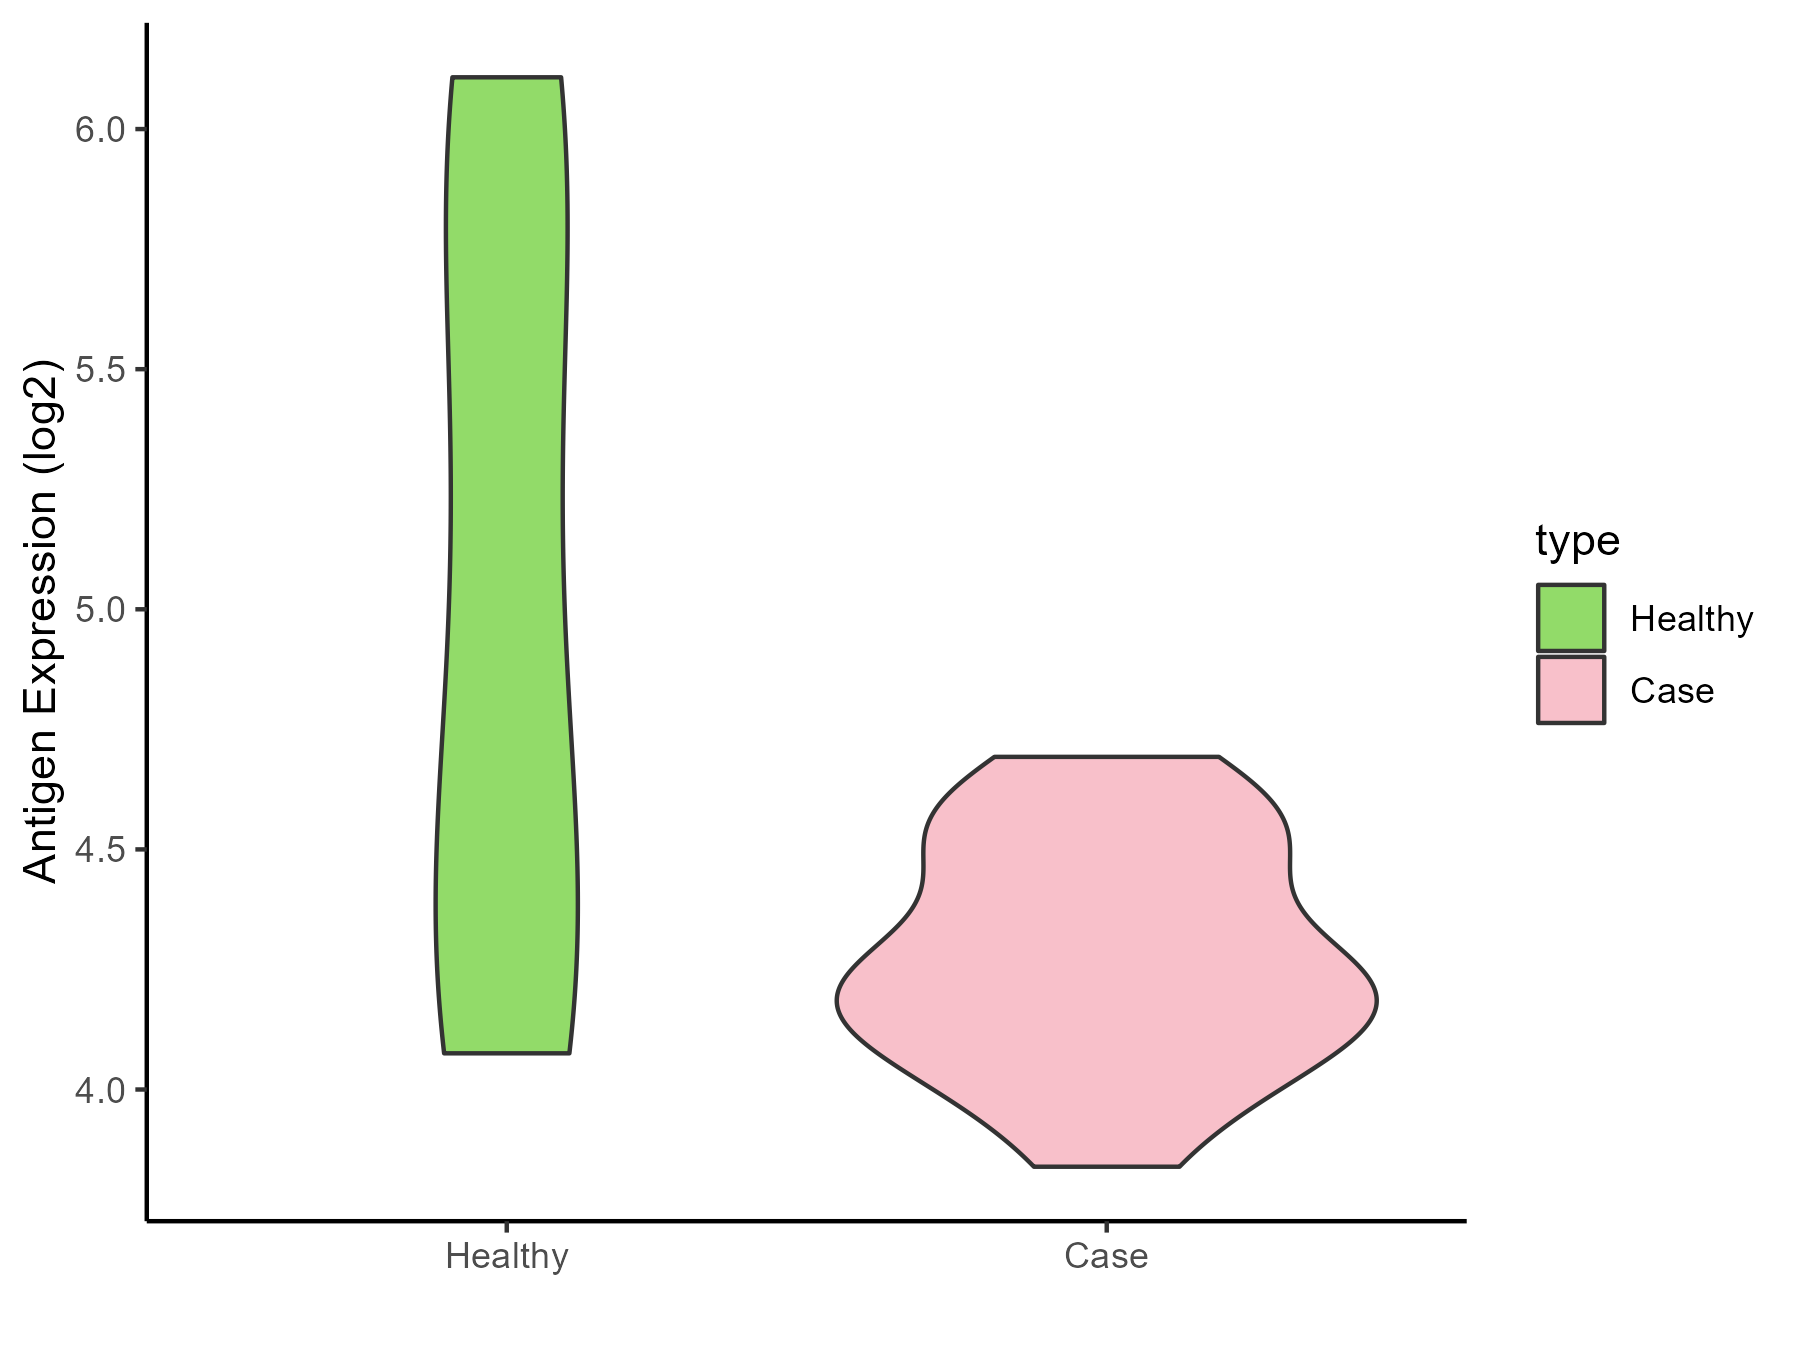
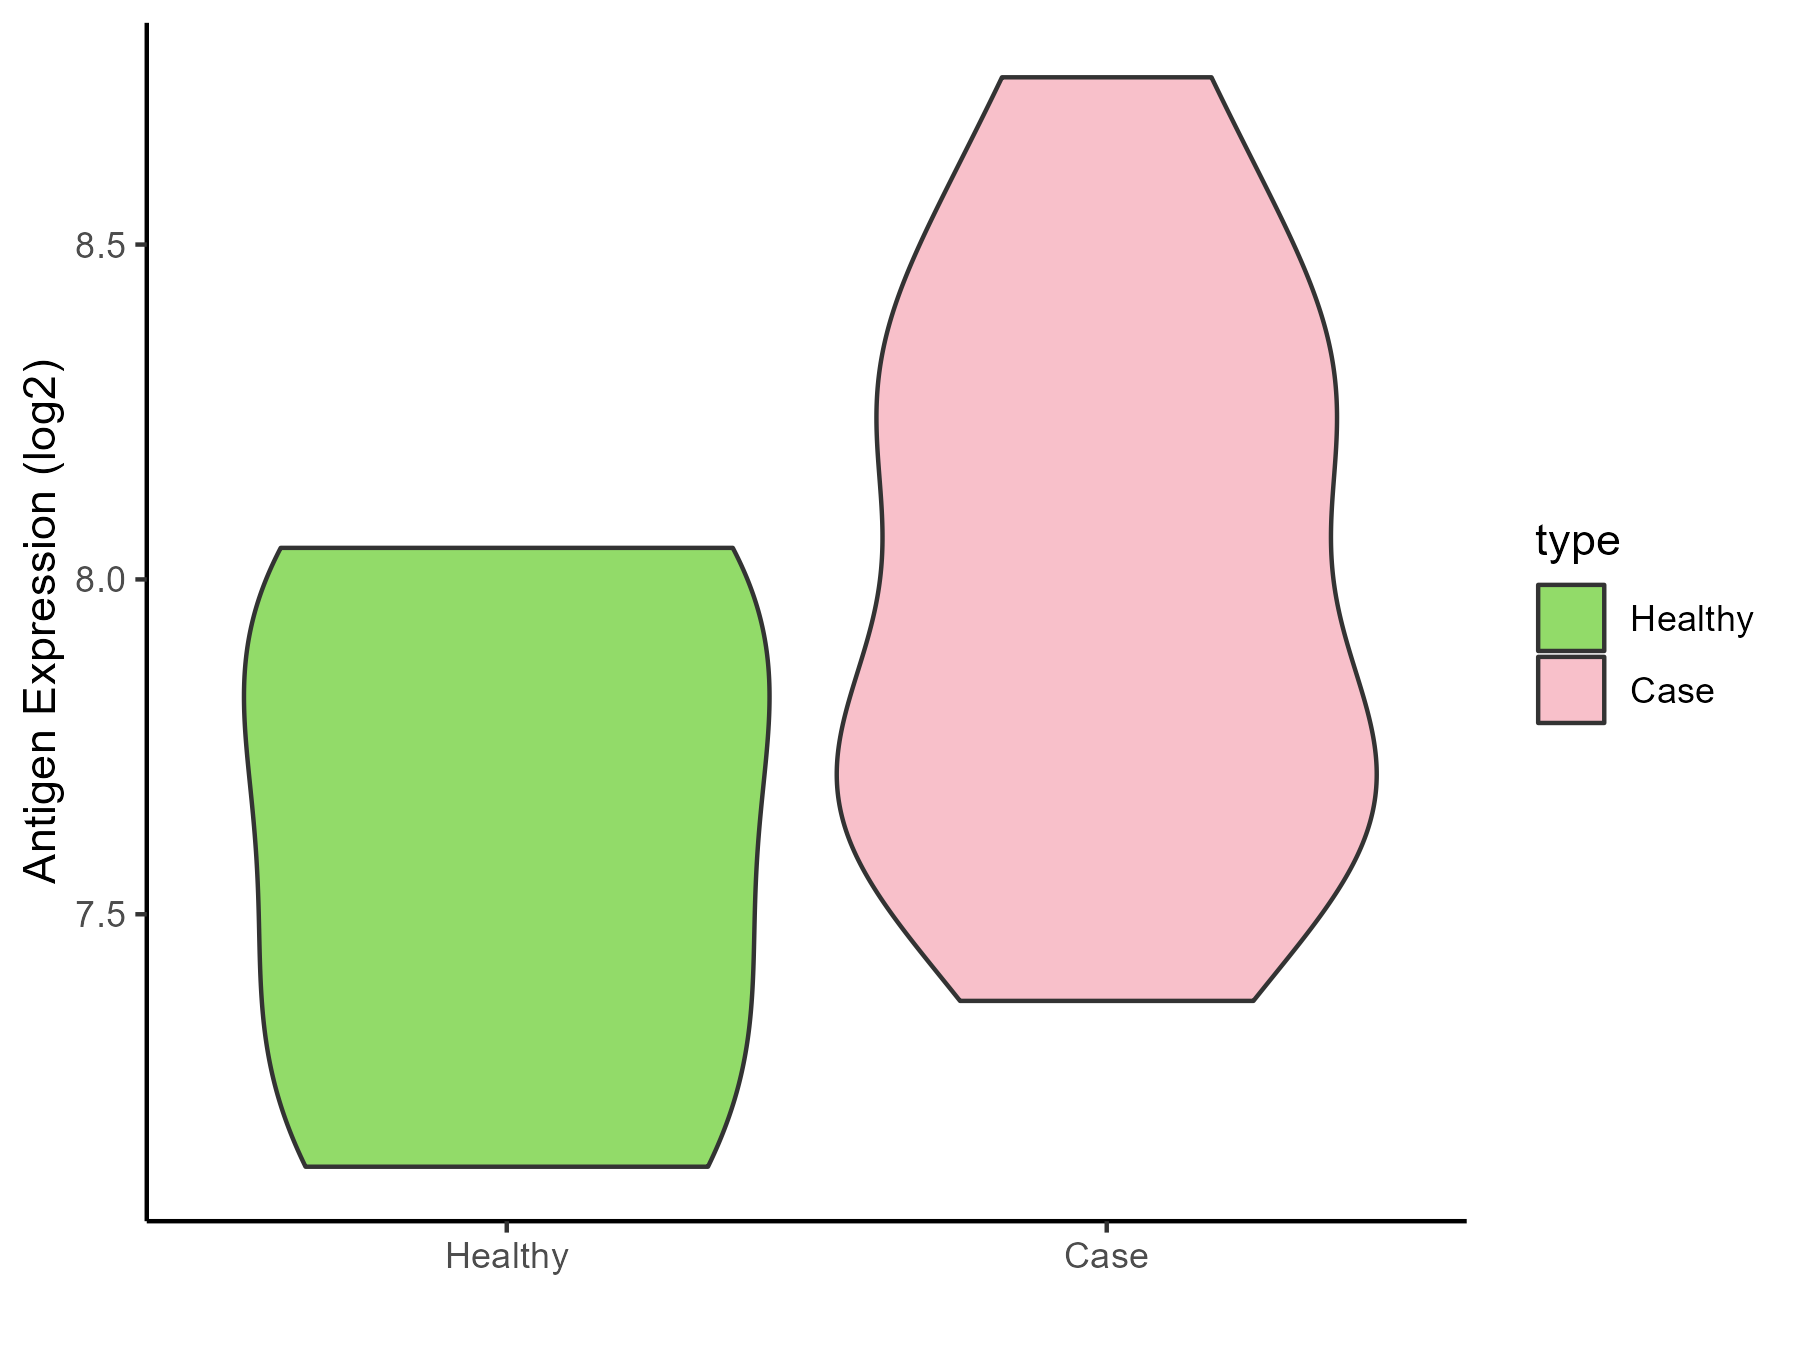
| The Studied Tissue |
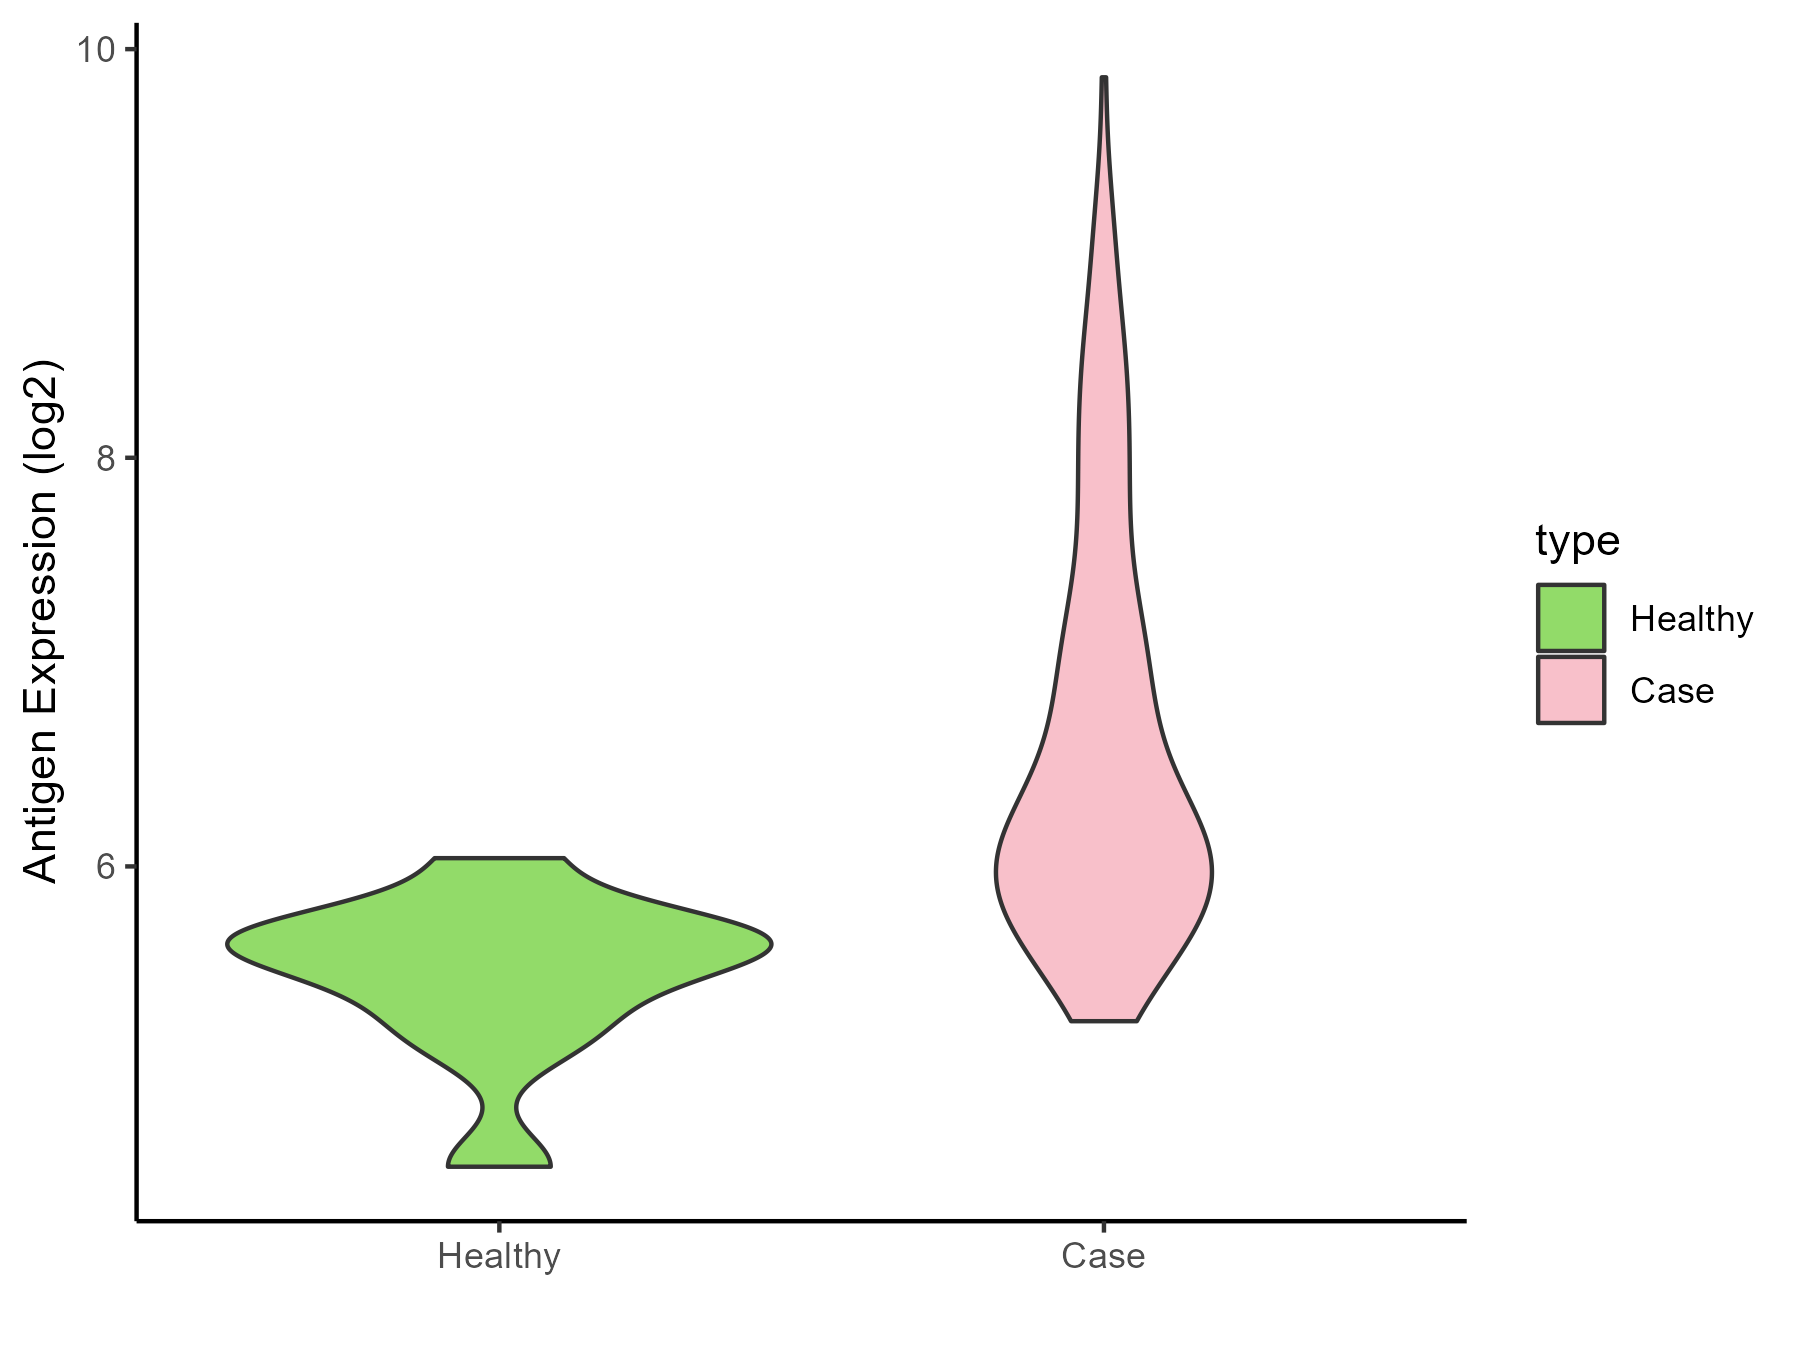
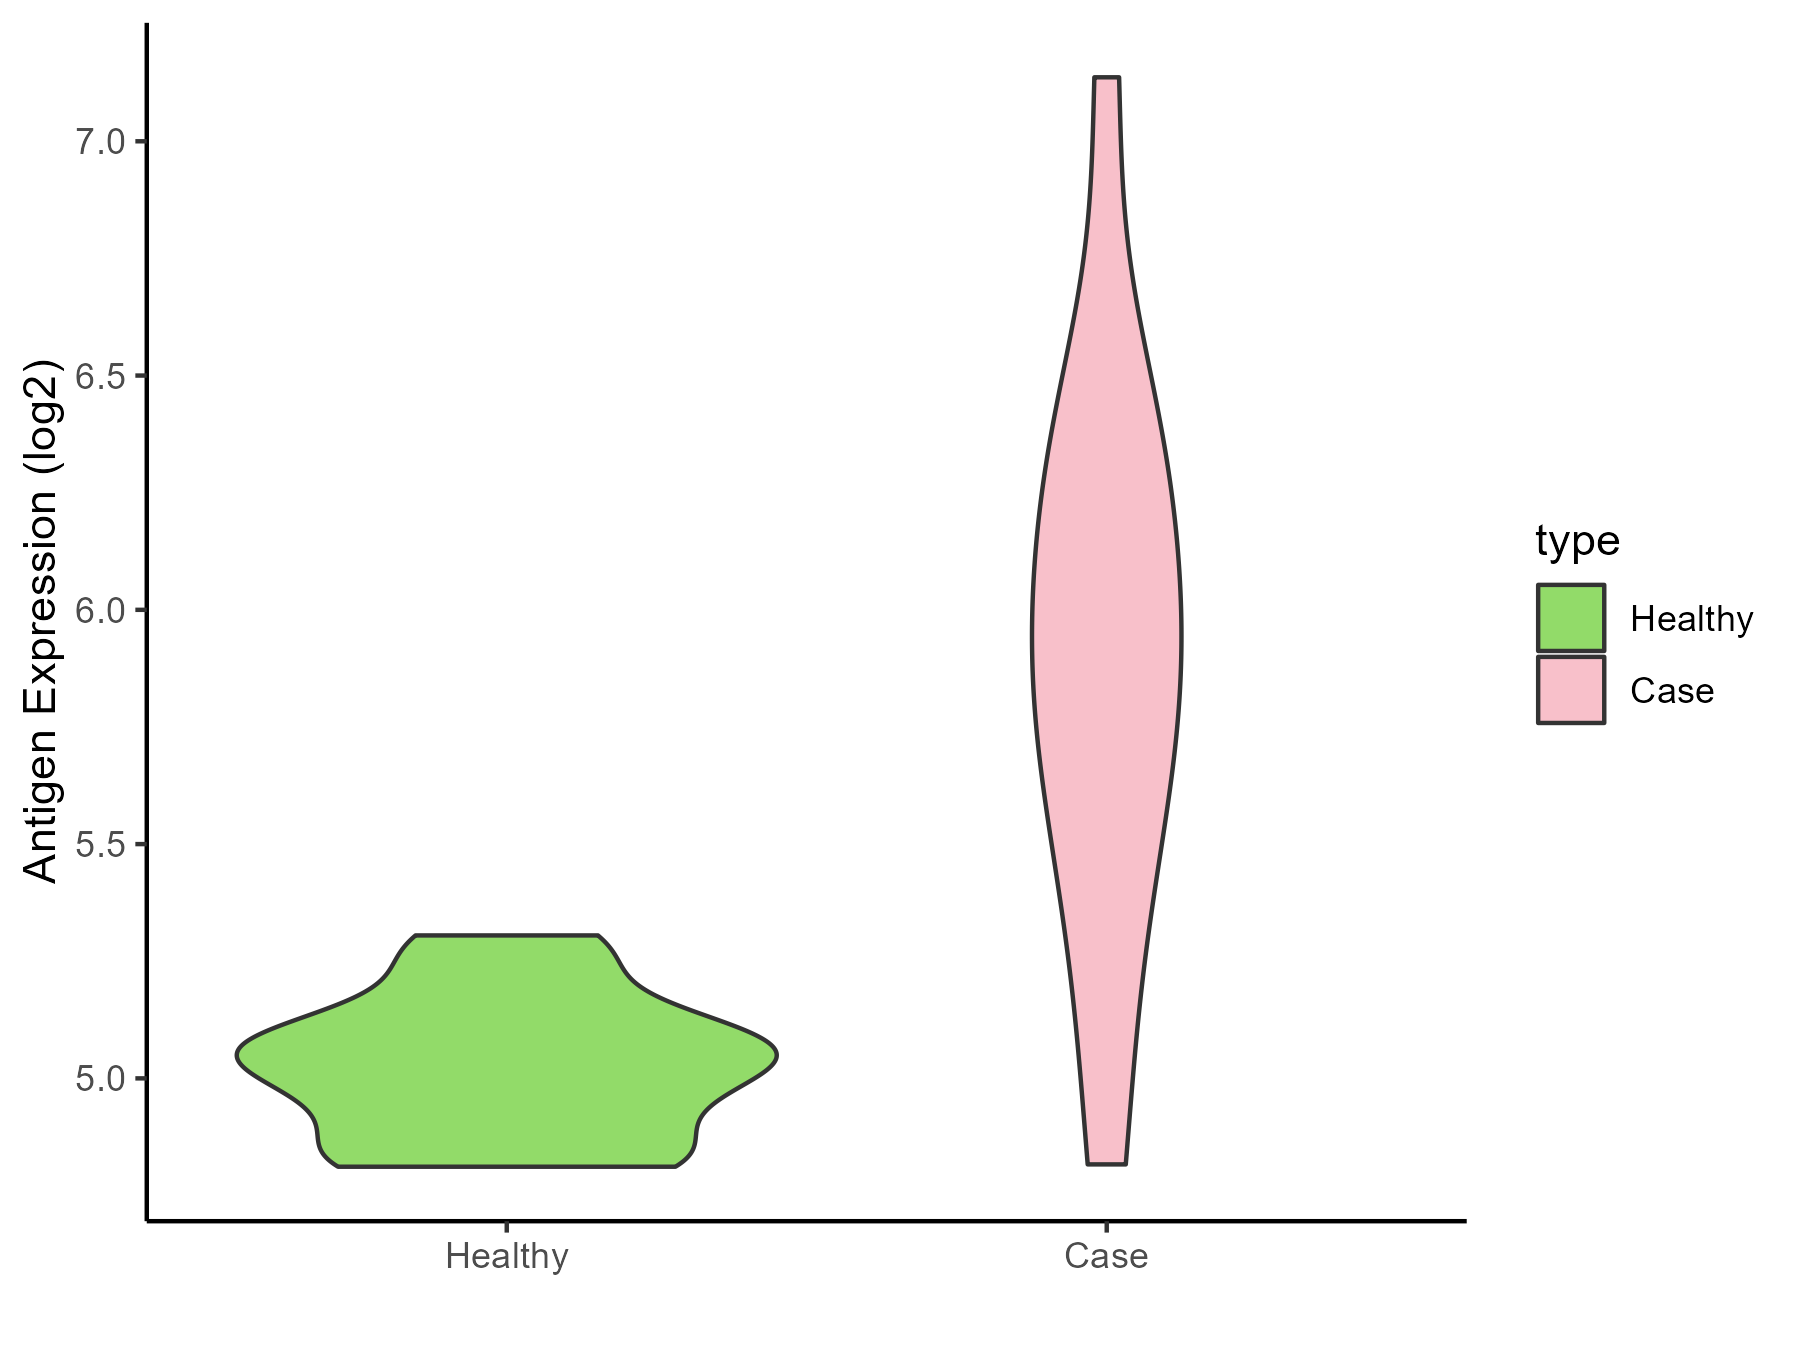
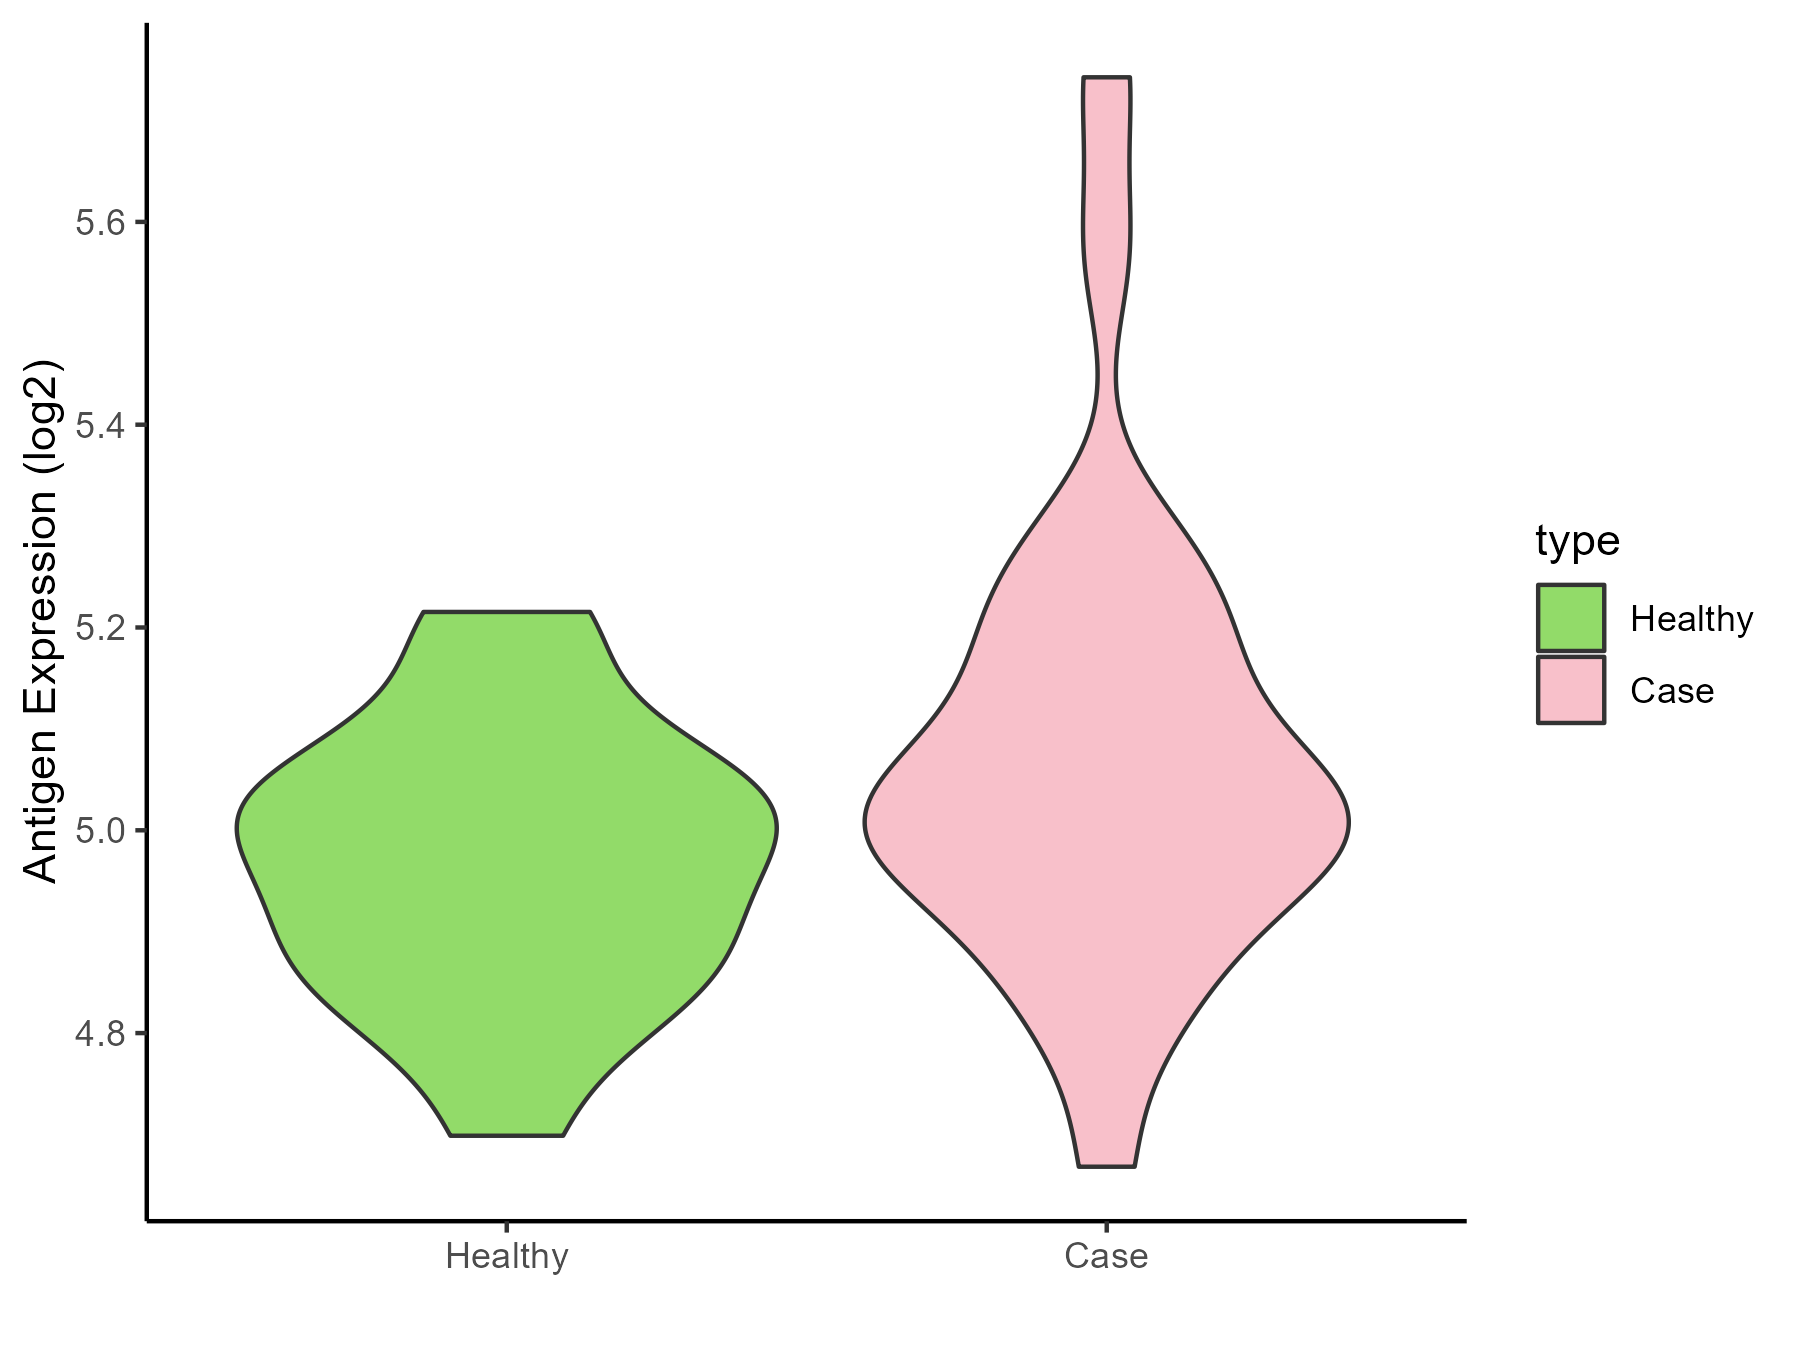
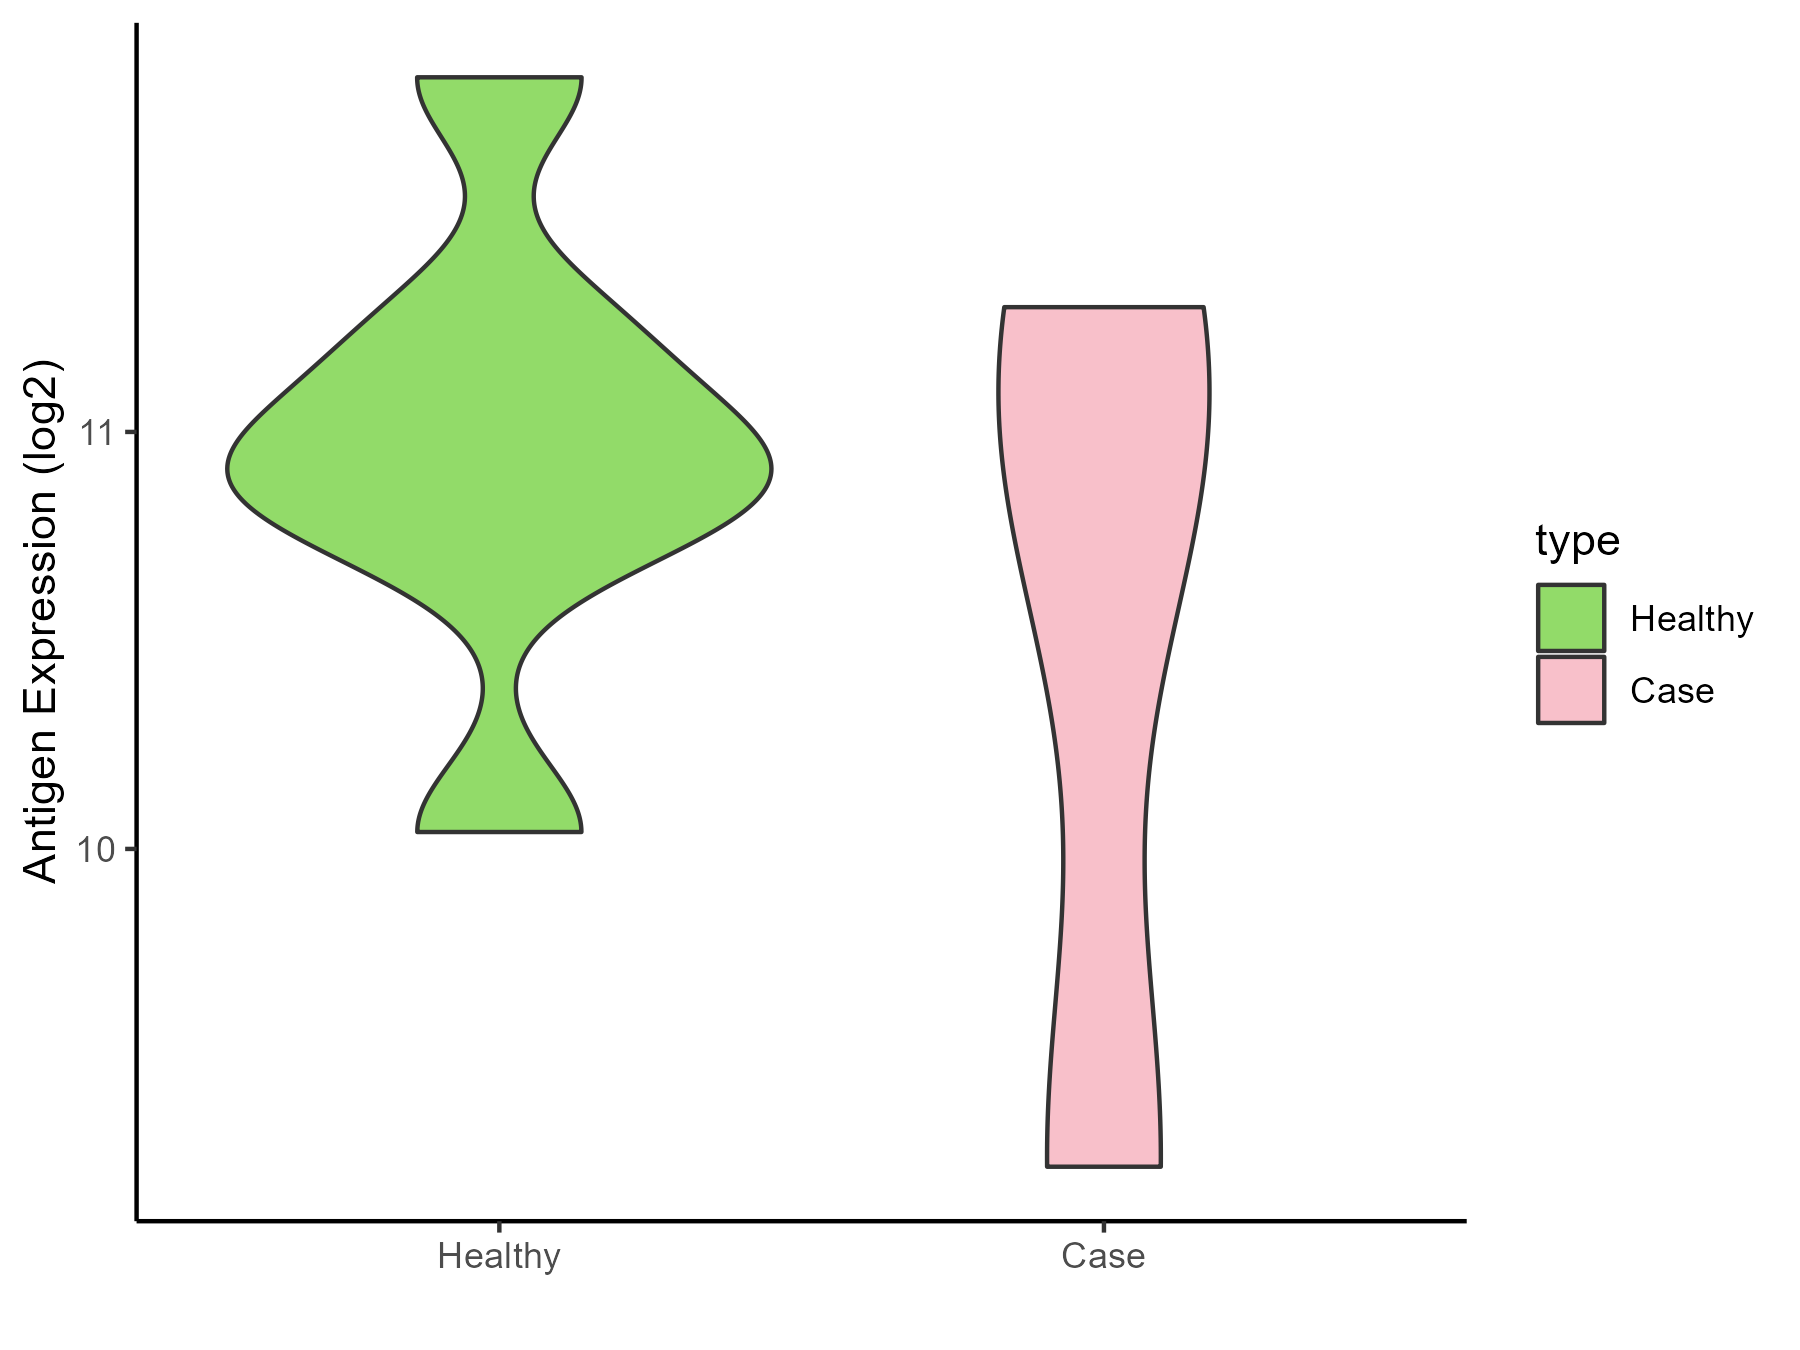
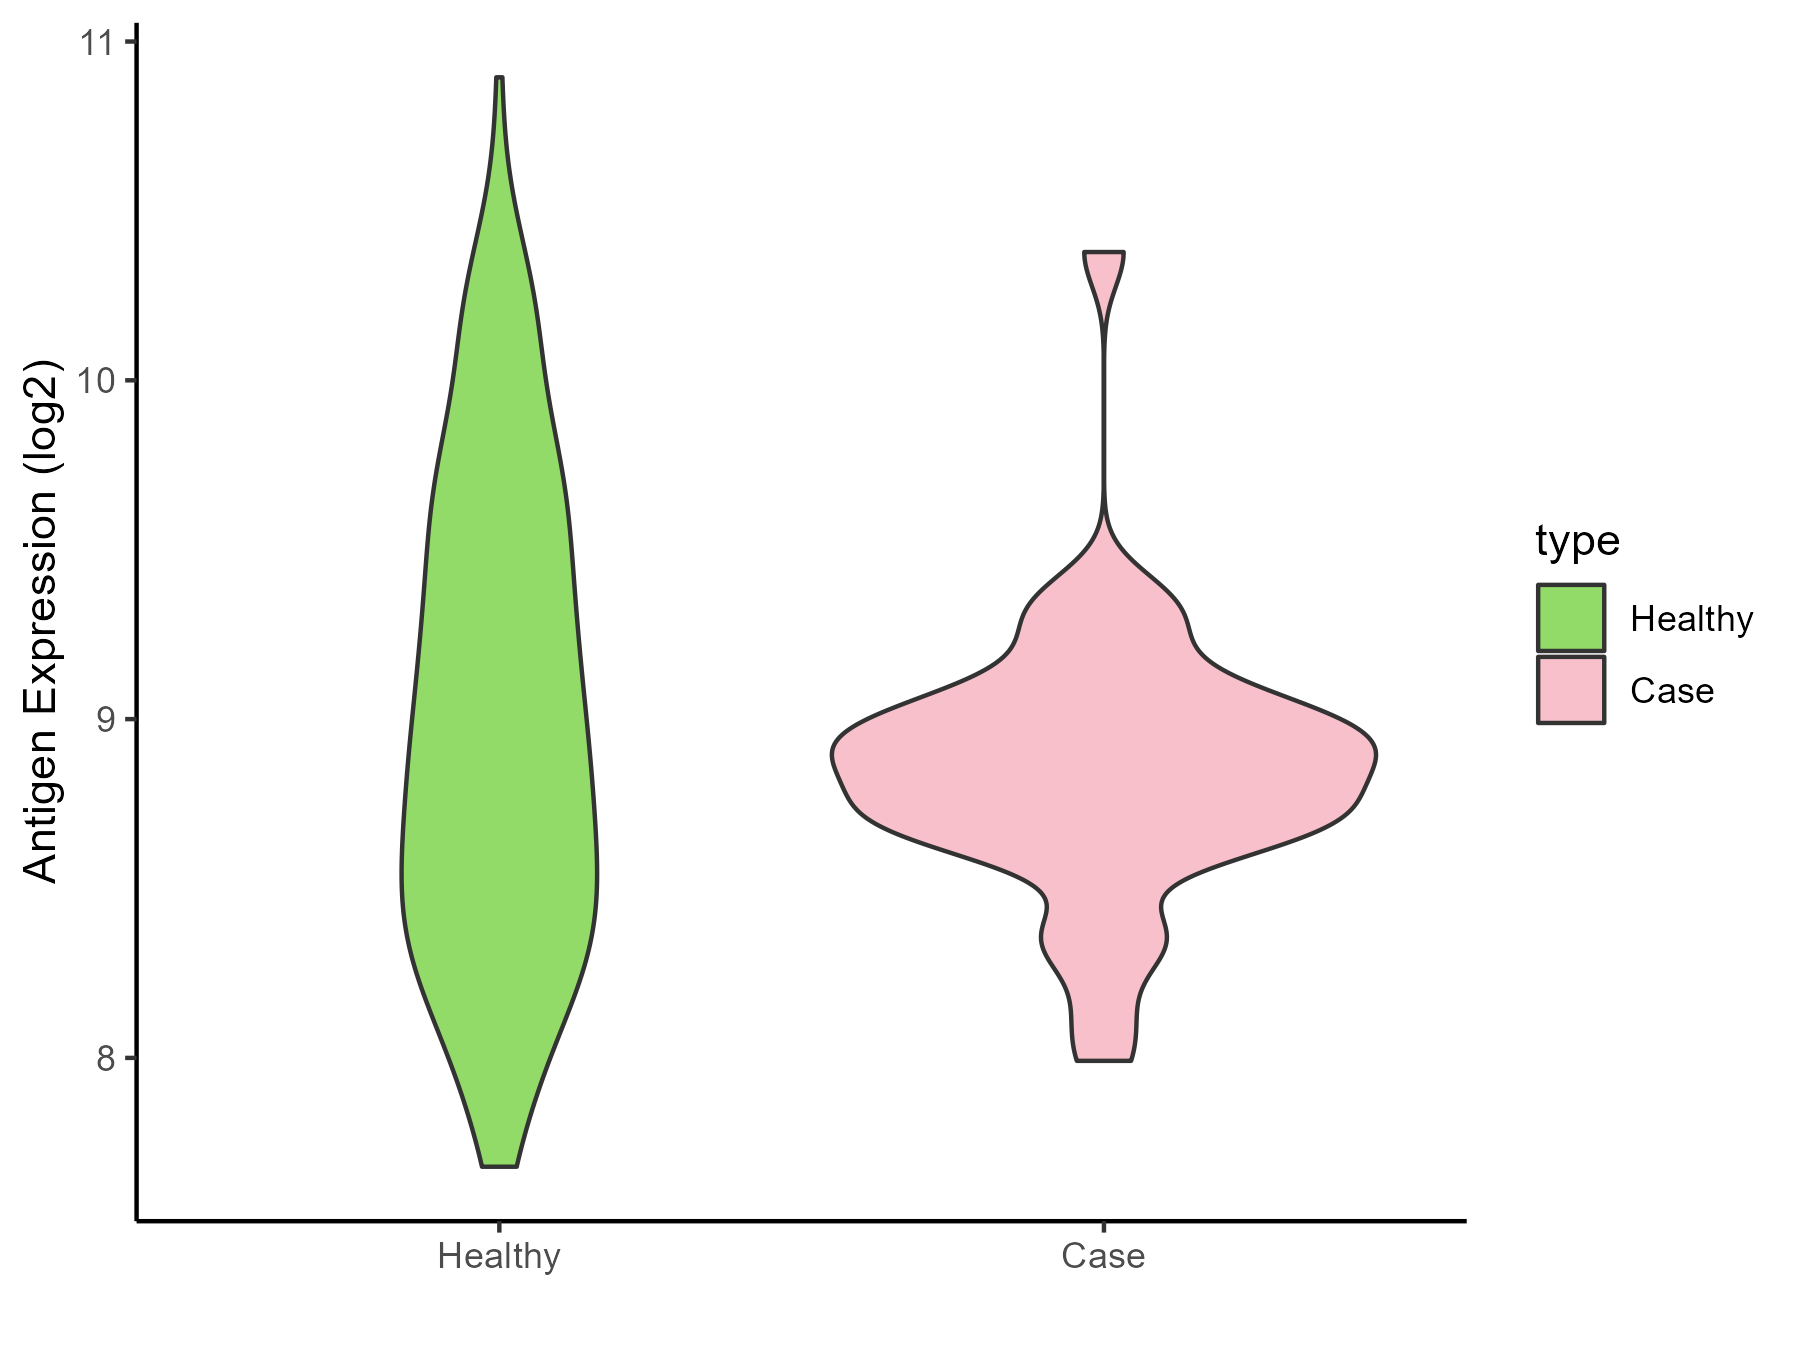
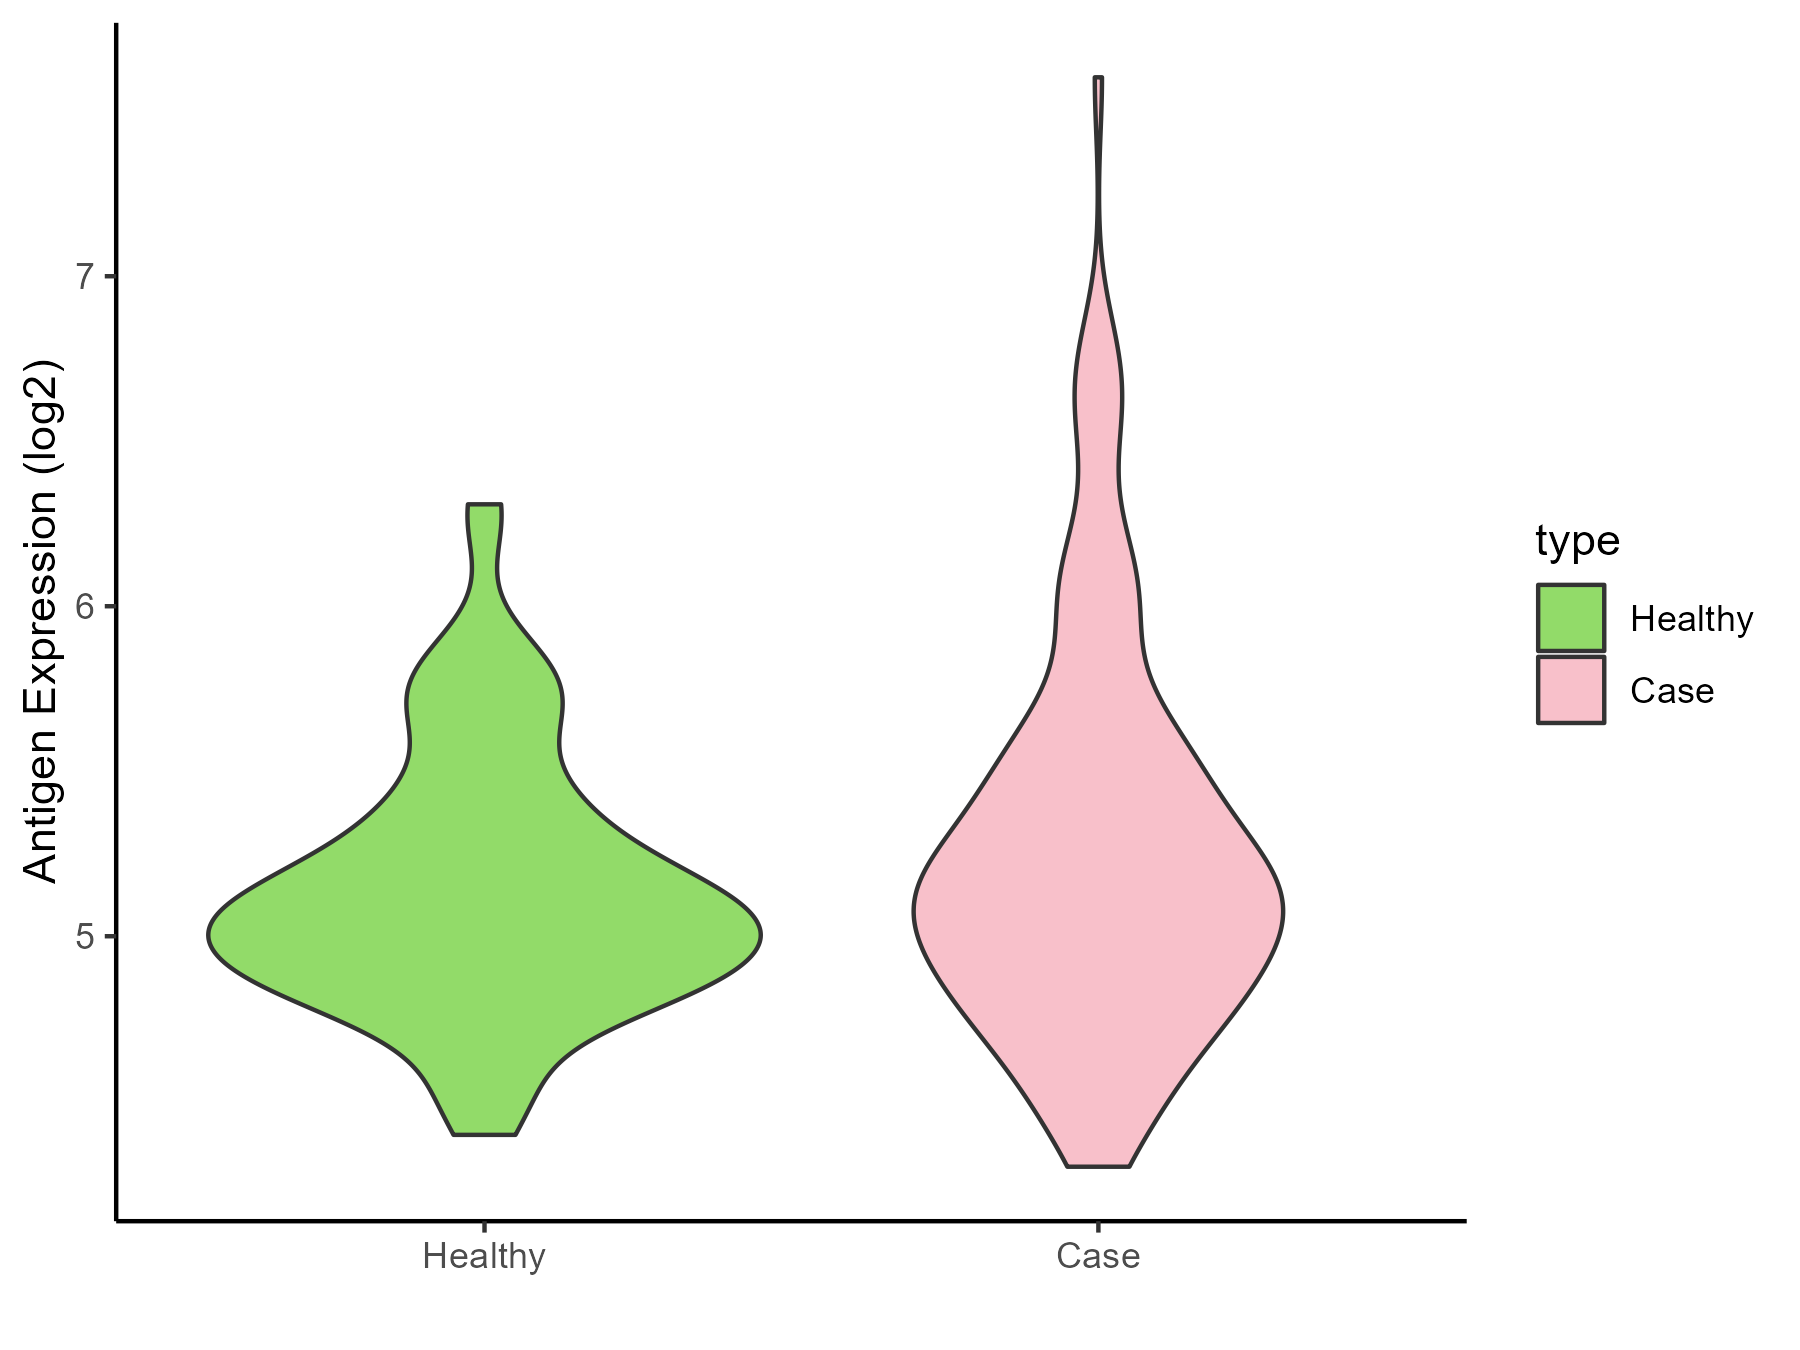
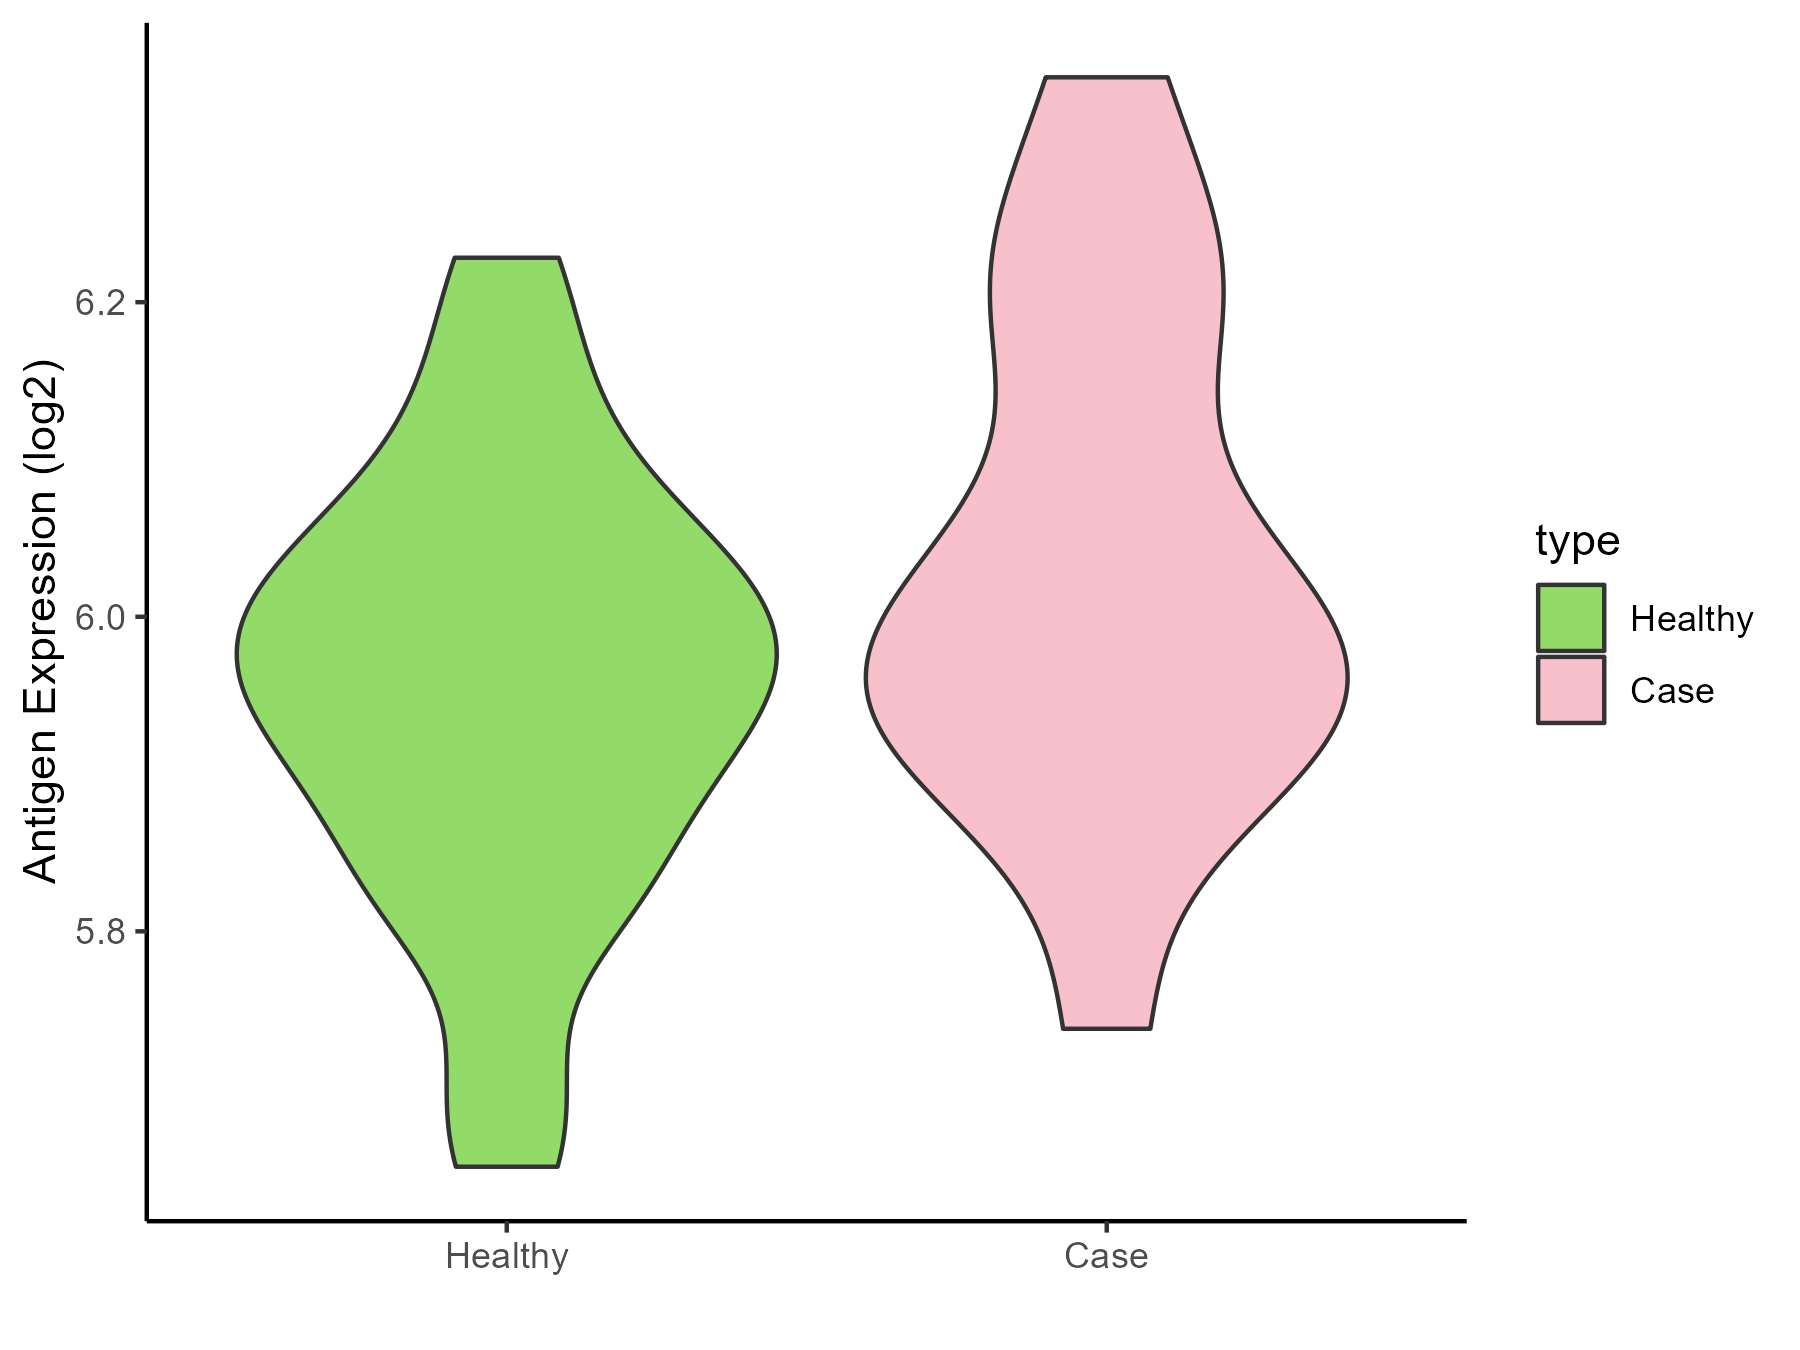
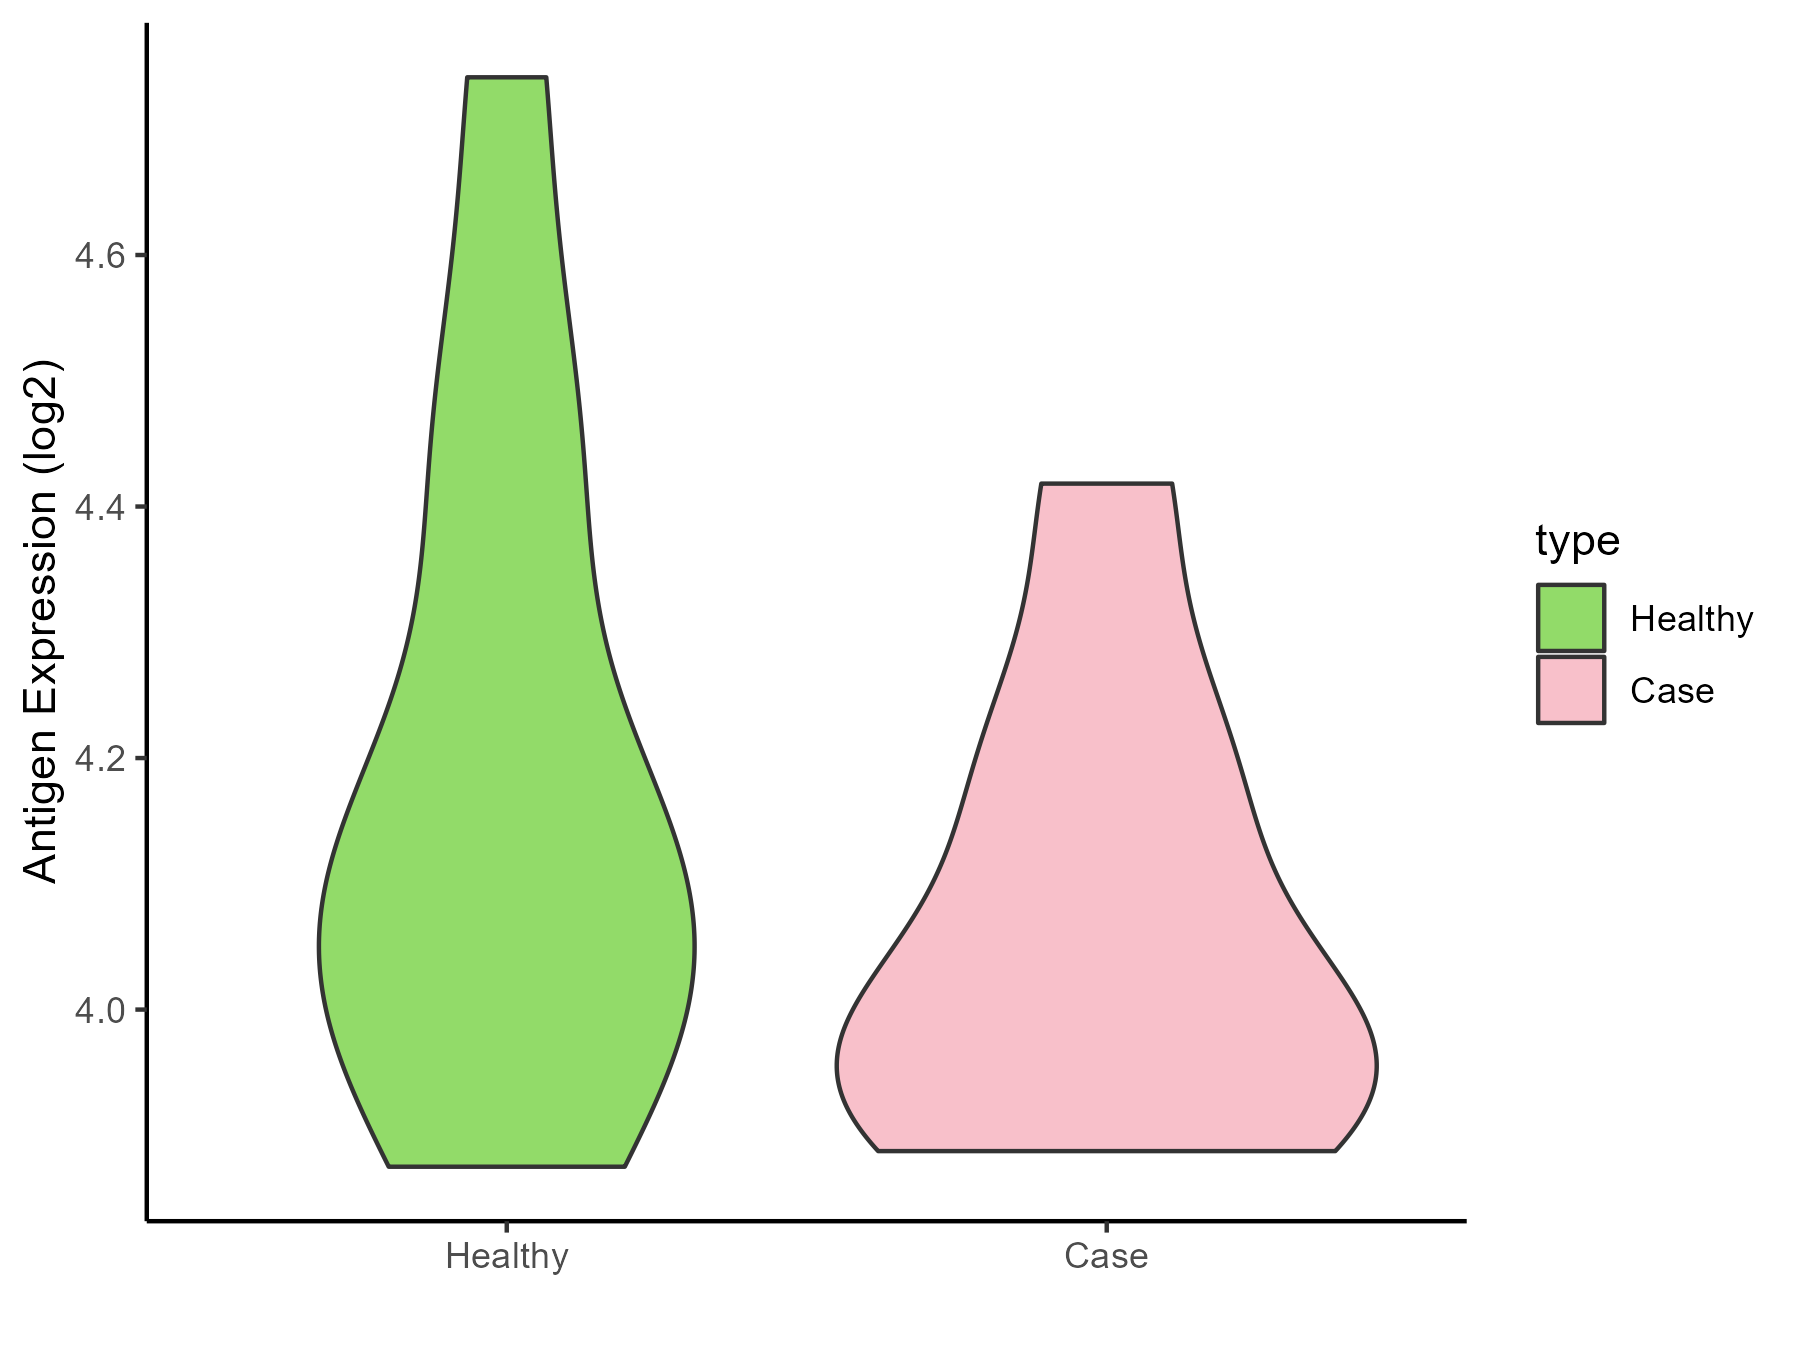
Brainstem |
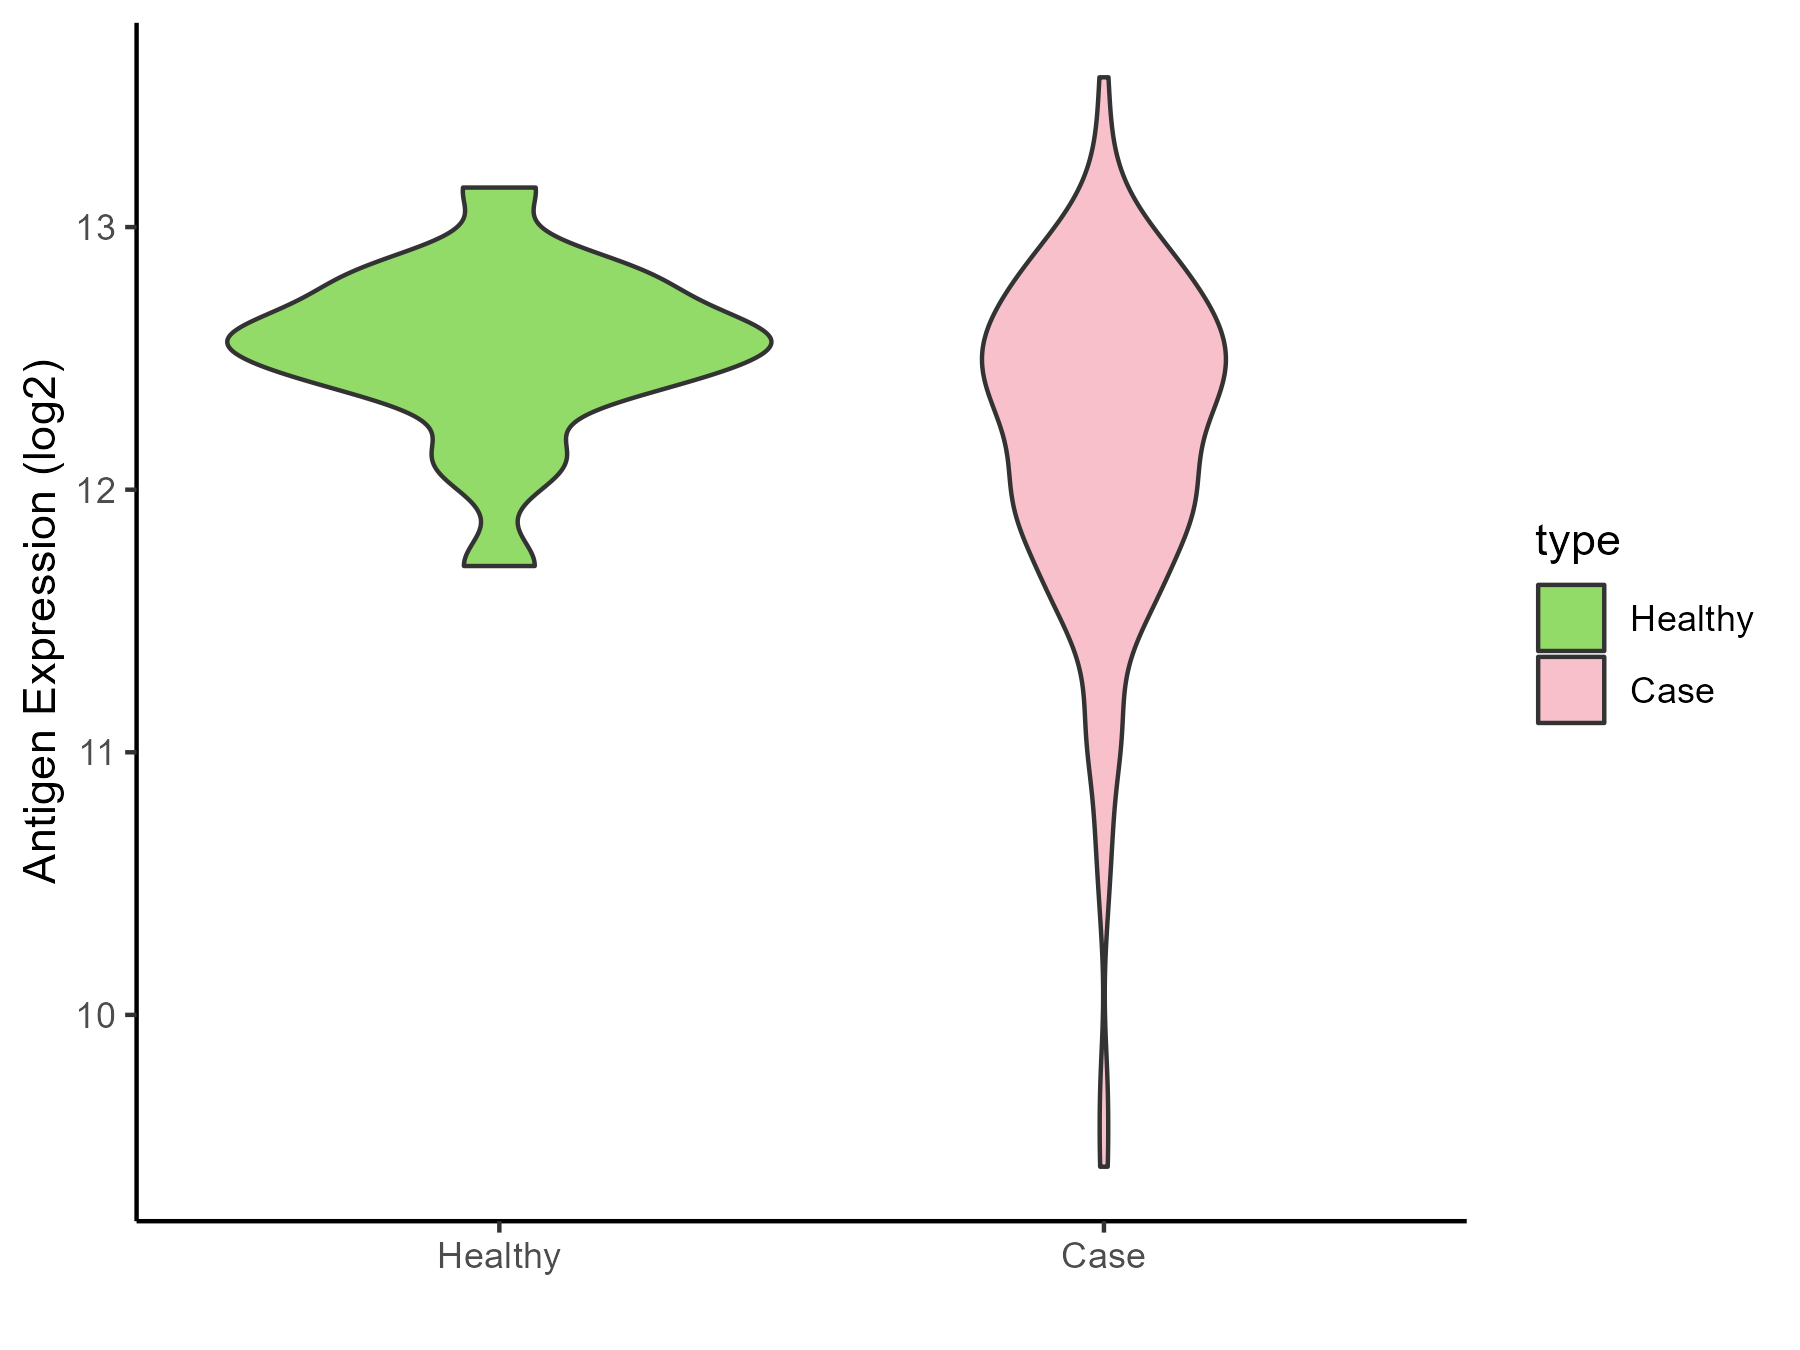
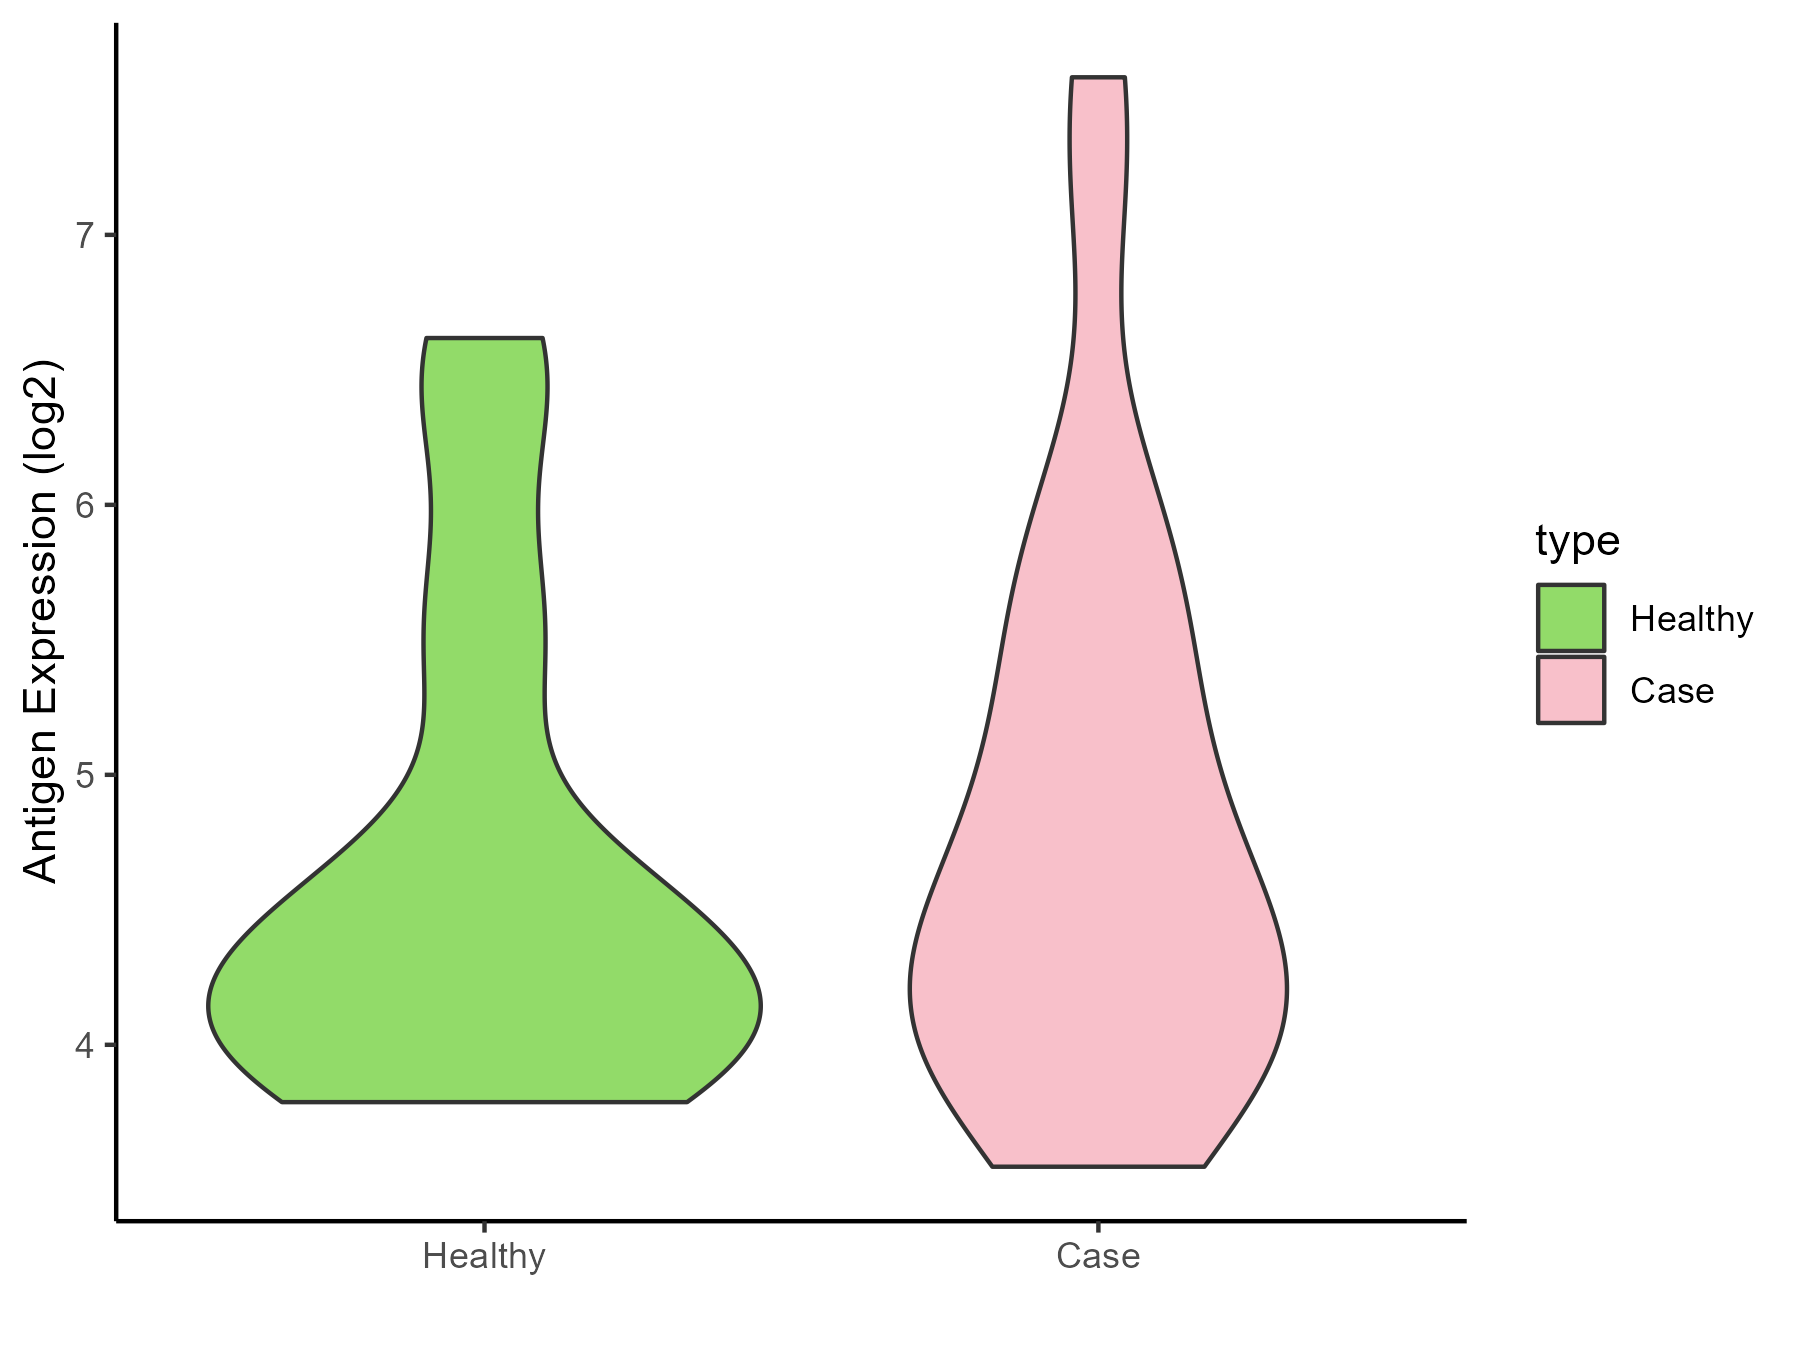
| The Specific Disease |
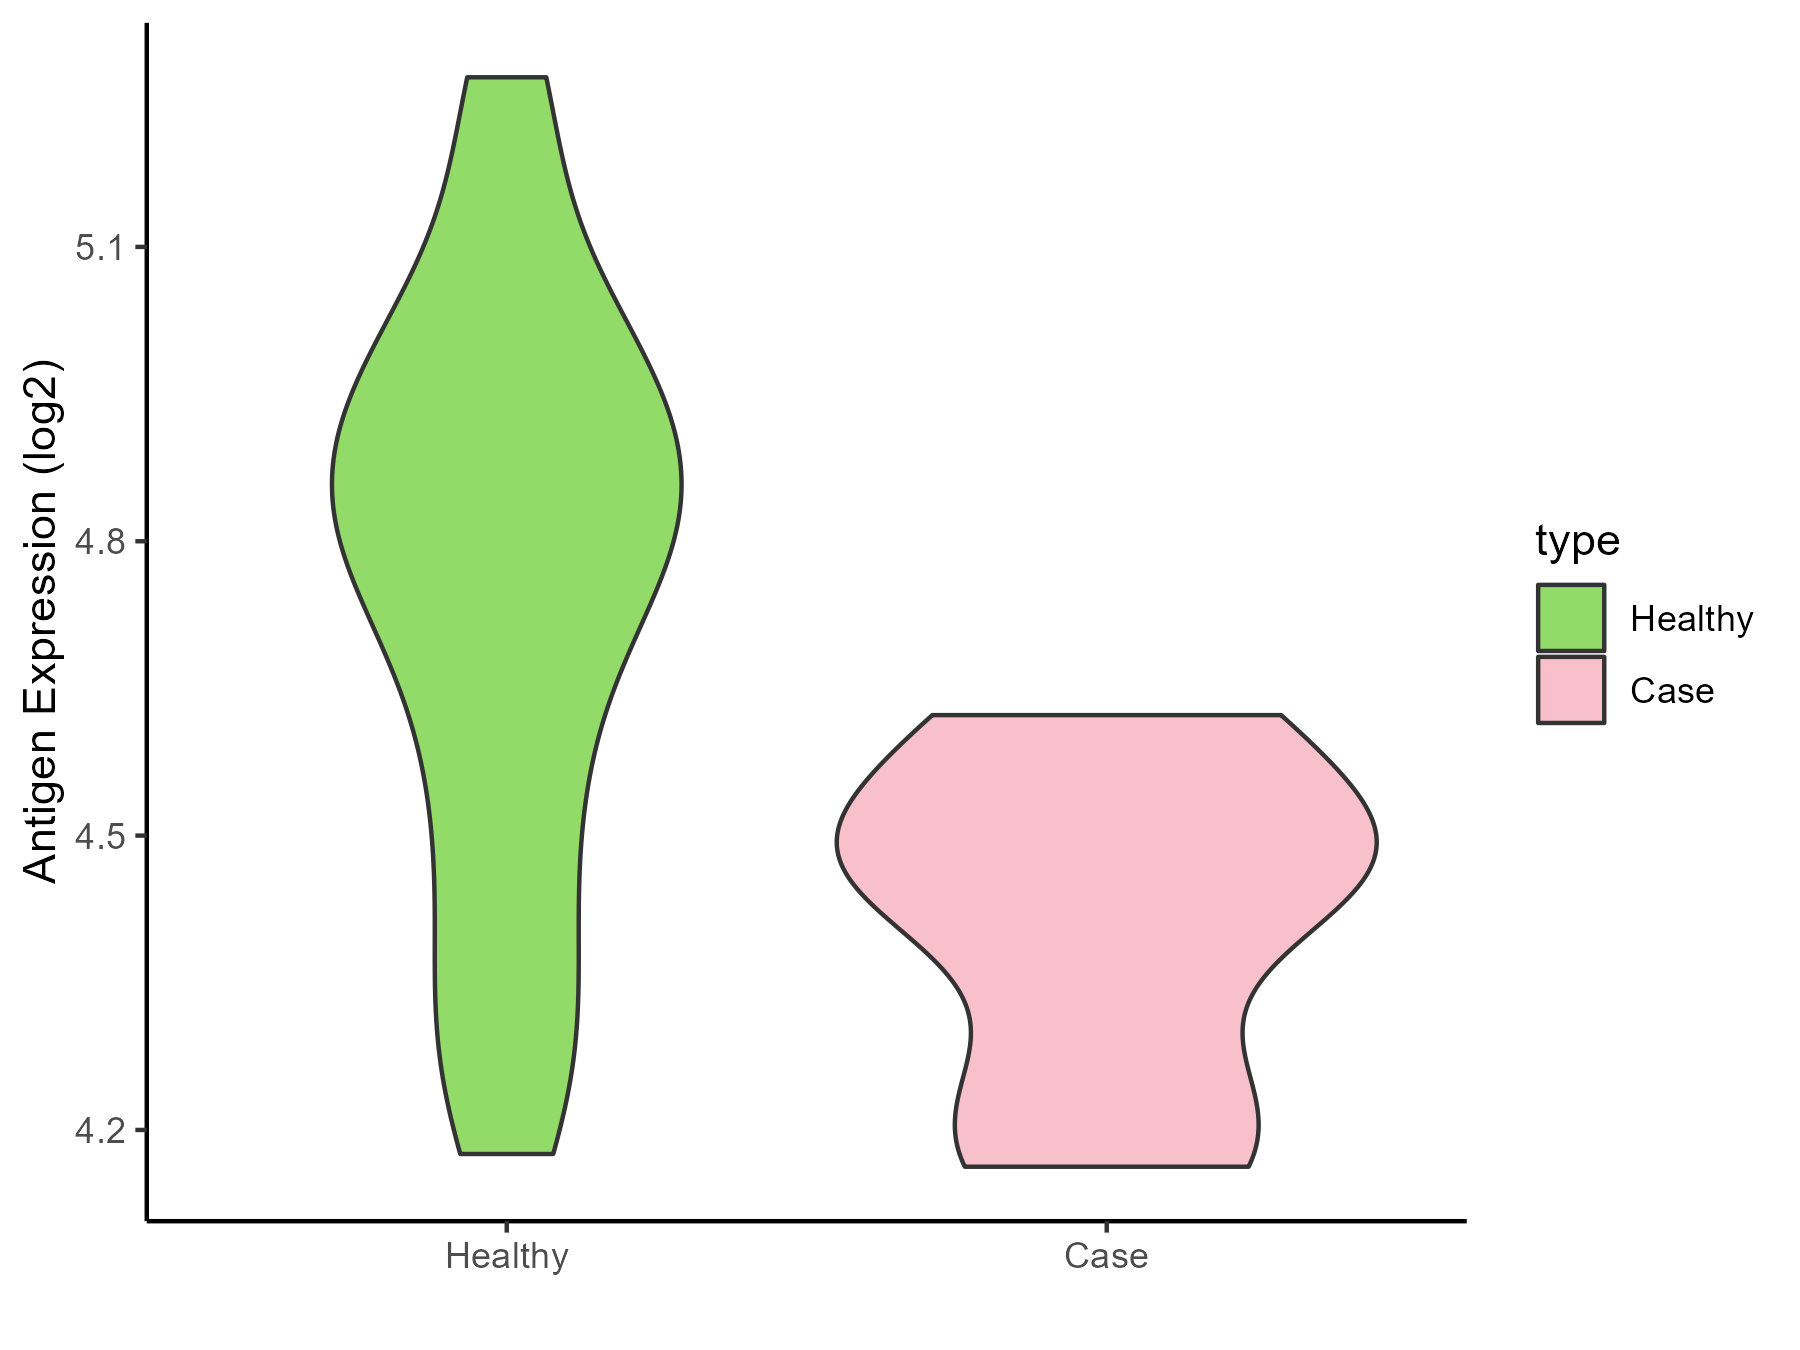
Neuroectodermal tumor |
| The Expression Level of Disease Section Compare with the Healthy Individual Tissue |
p-value: 9.15E-07;
Fold-change: 0.662444752;
Z-score: 1.603334847
|
| Disease-specific Antigen Abundances |
|
Click to View the Clearer Original Diagram
|
|
|
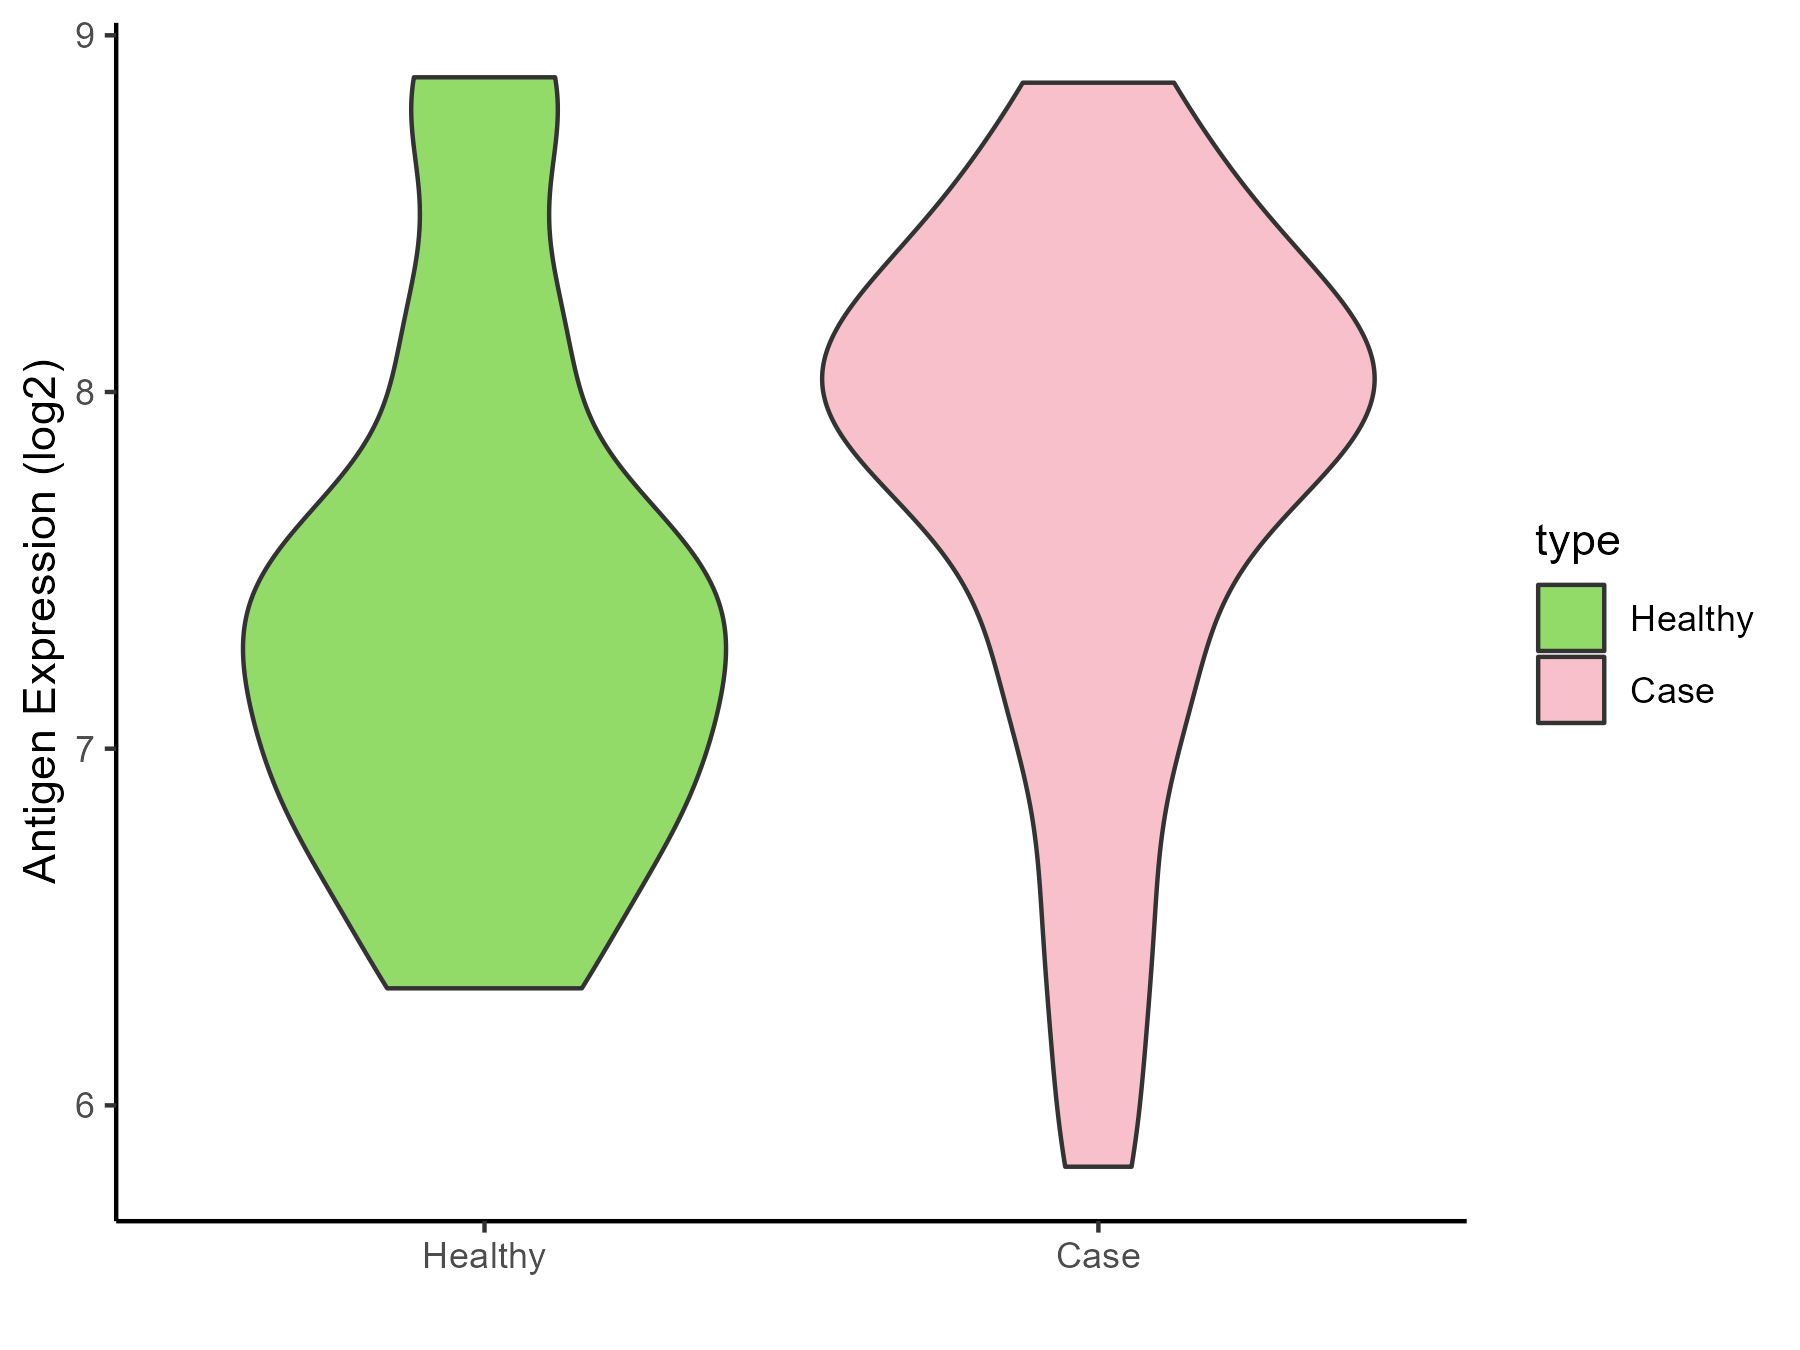
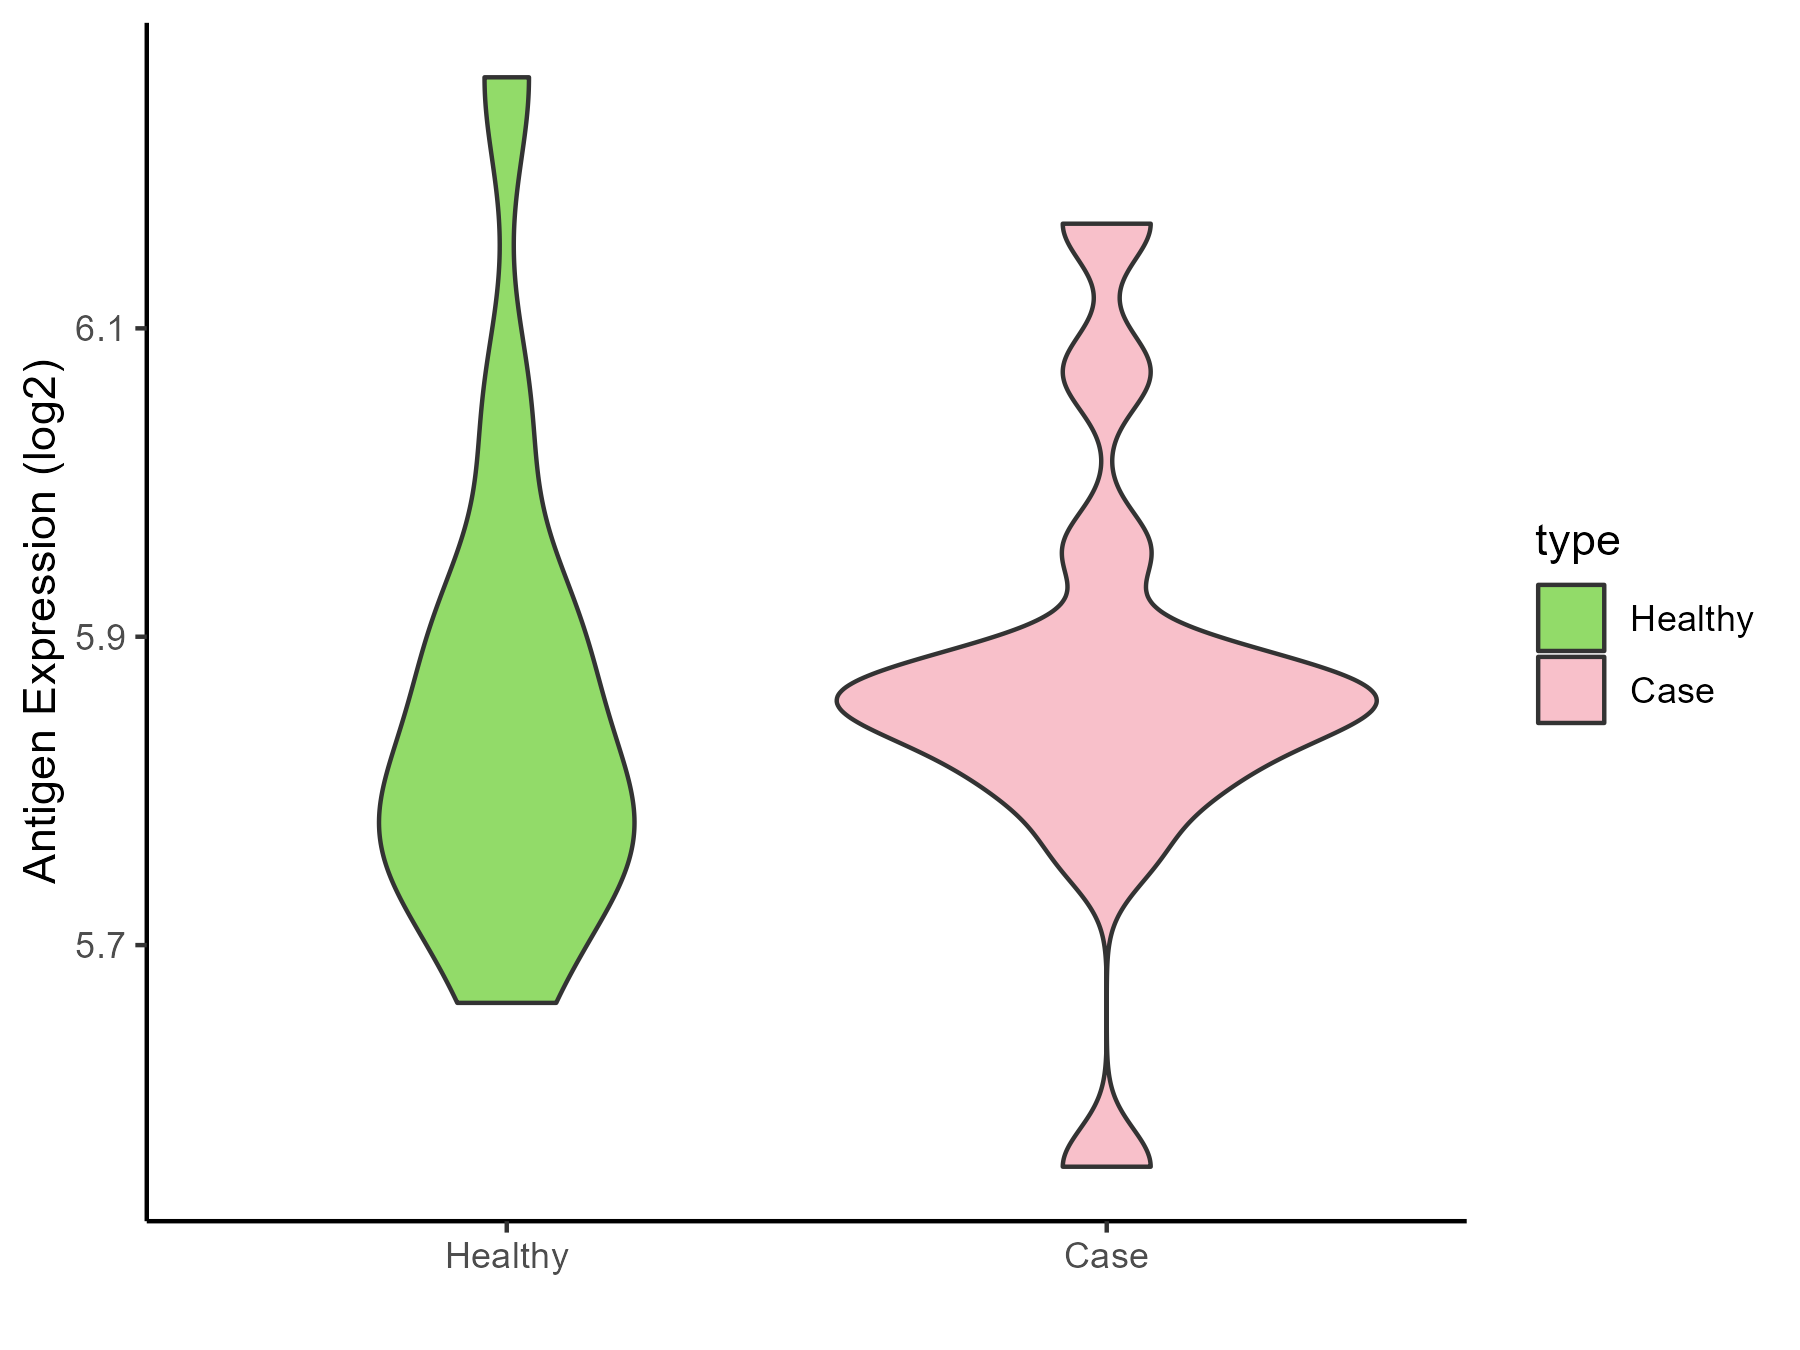
| The Studied Tissue |
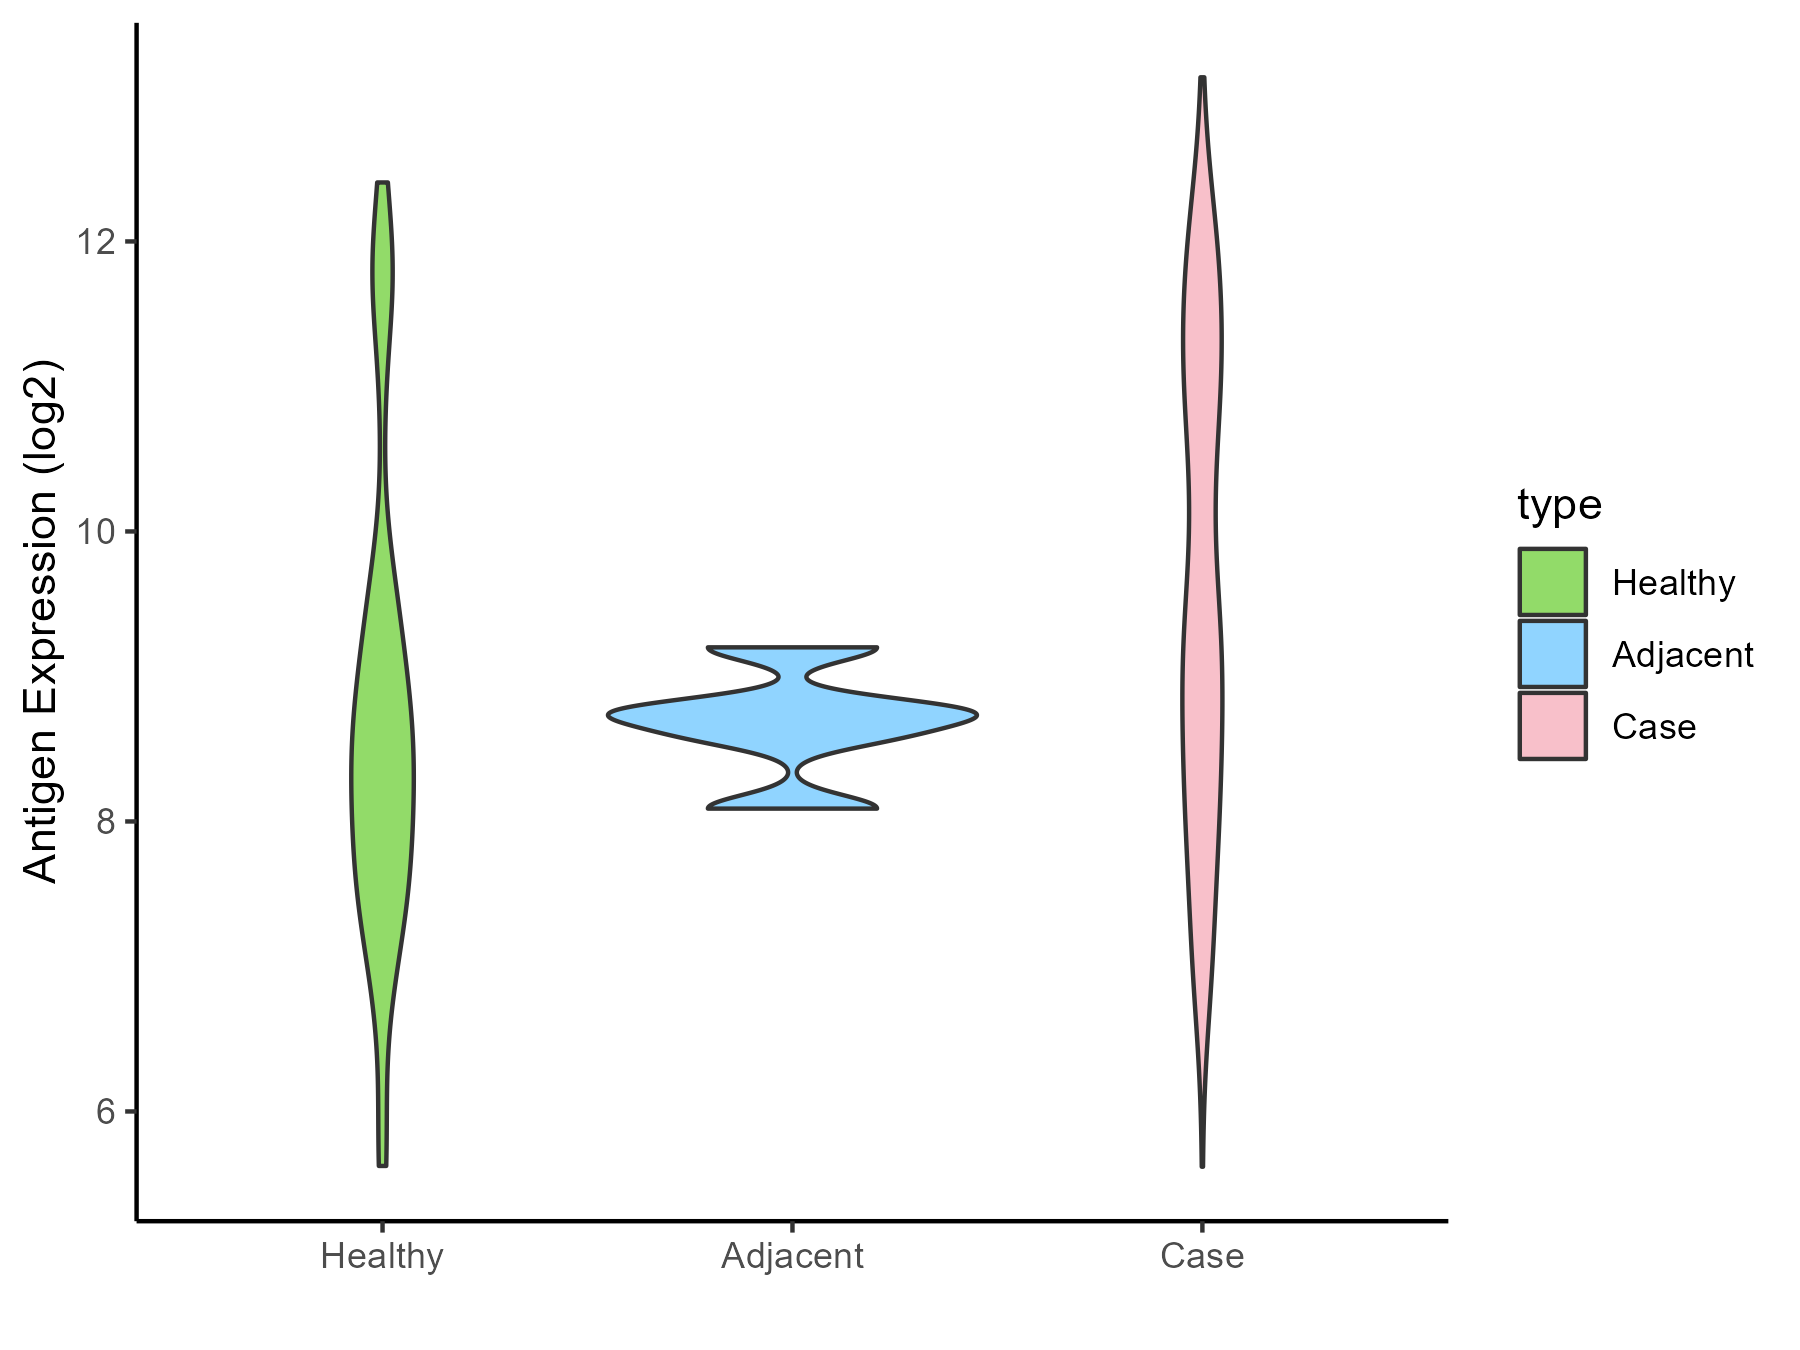
Nervous |
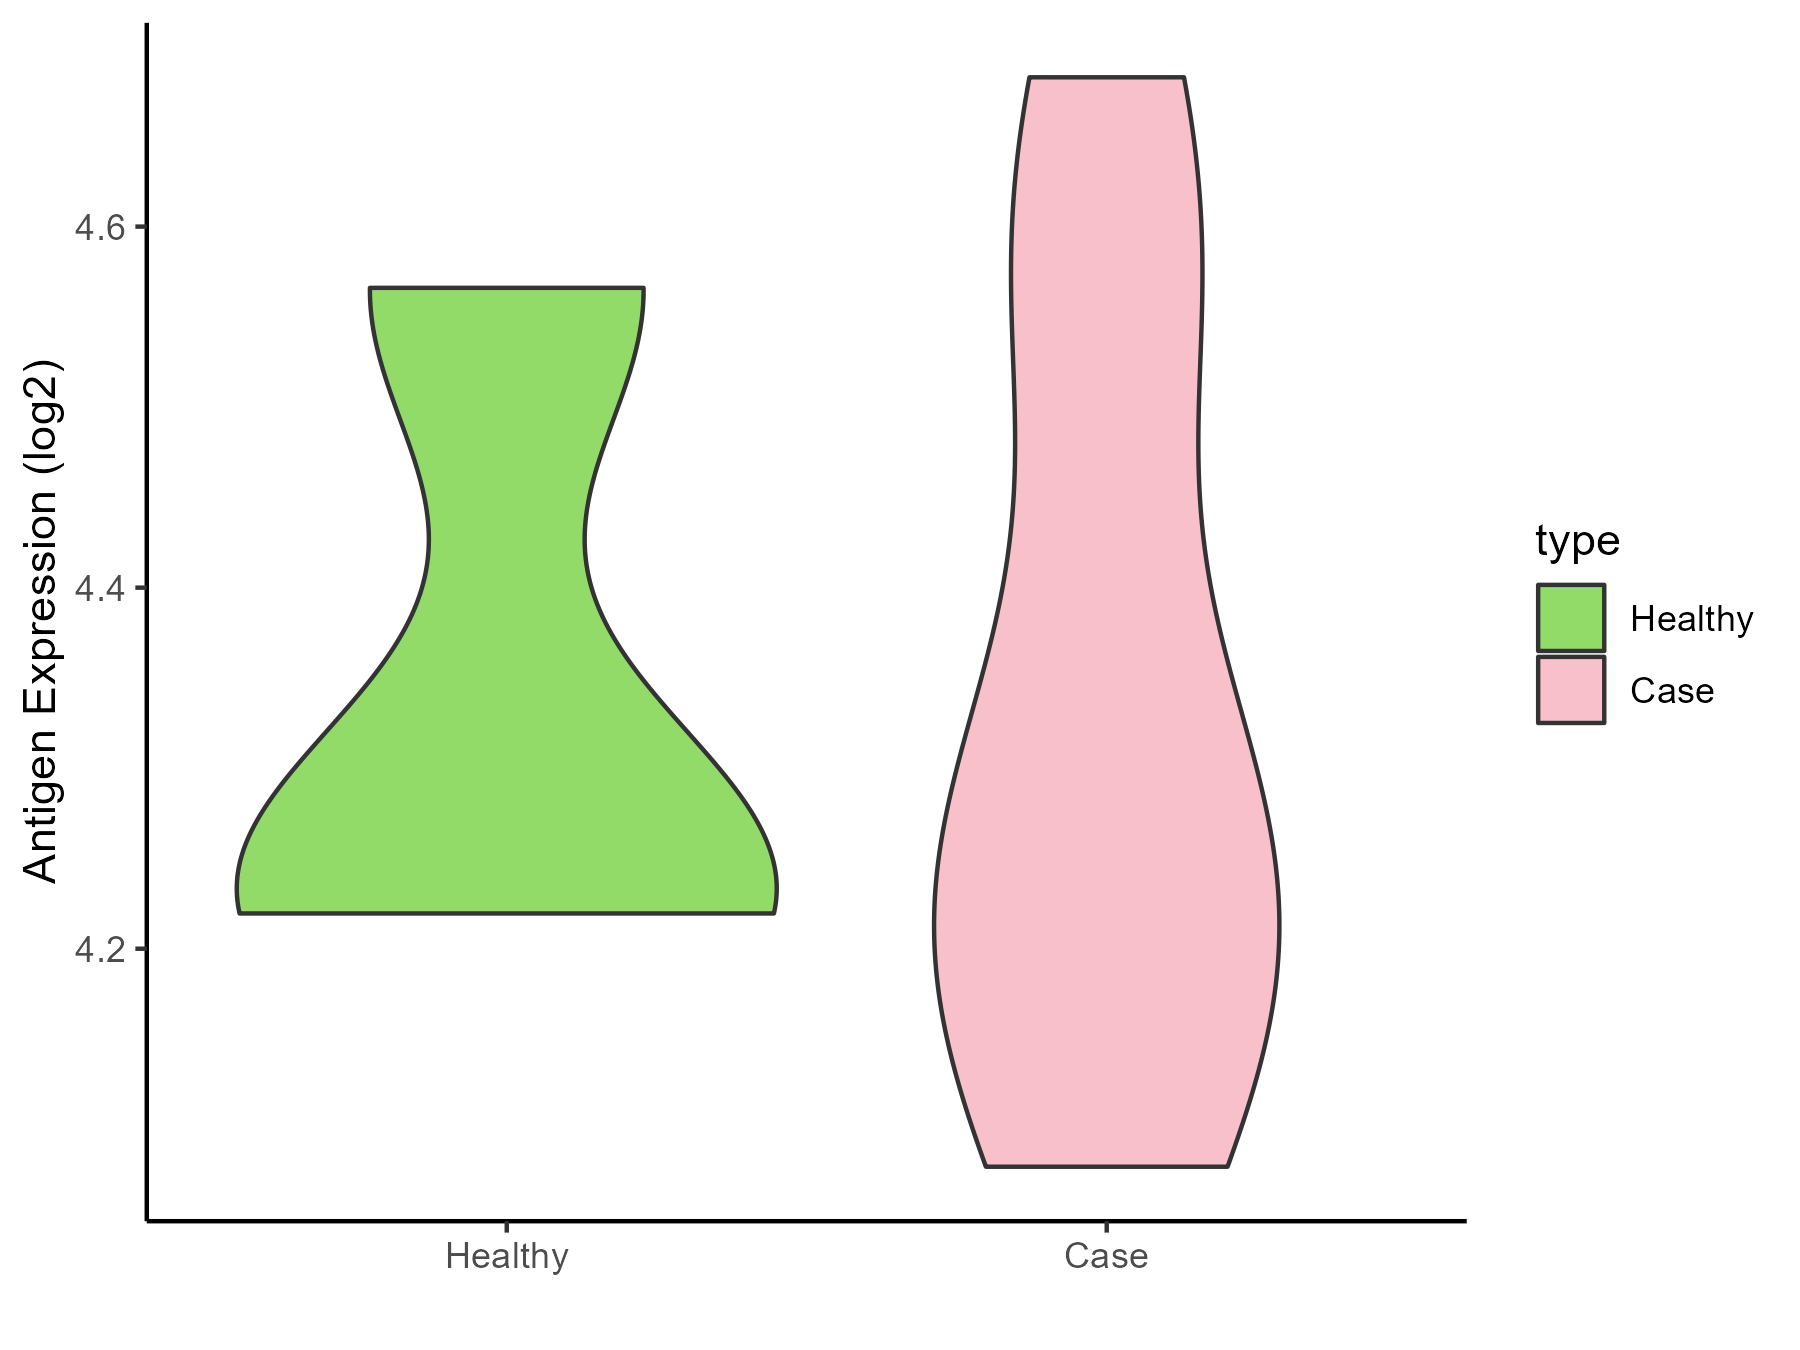
| The Specific Disease |
Brain cancer |
| The Expression Level of Disease Section Compare with the Healthy Individual Tissue |
p-value: 1.76E-60;
Fold-change: 0.568919909;
Z-score: 1.05372912
|
| Disease-specific Antigen Abundances |
|
Click to View the Clearer Original Diagram
|
|
|
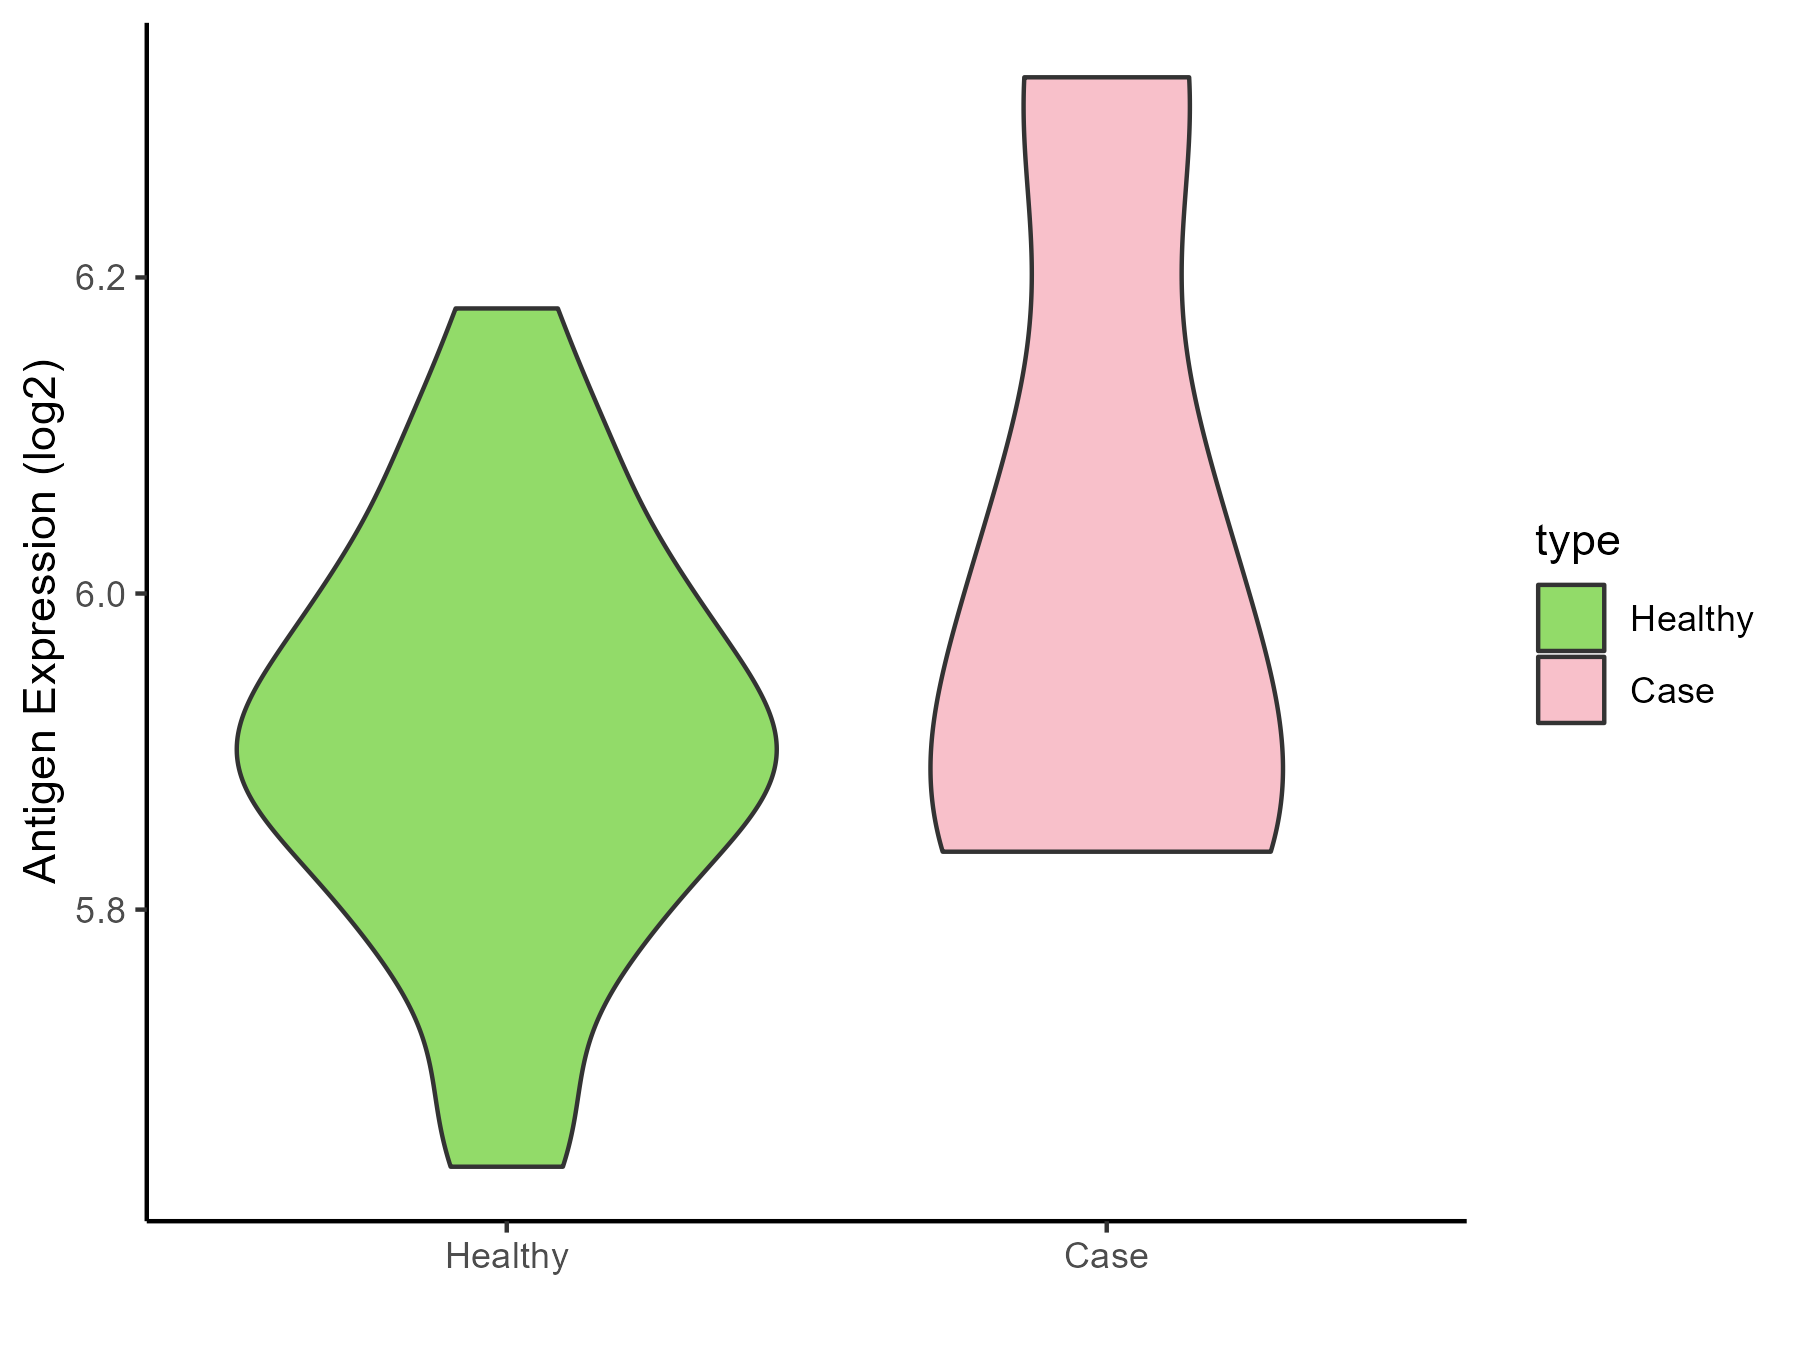
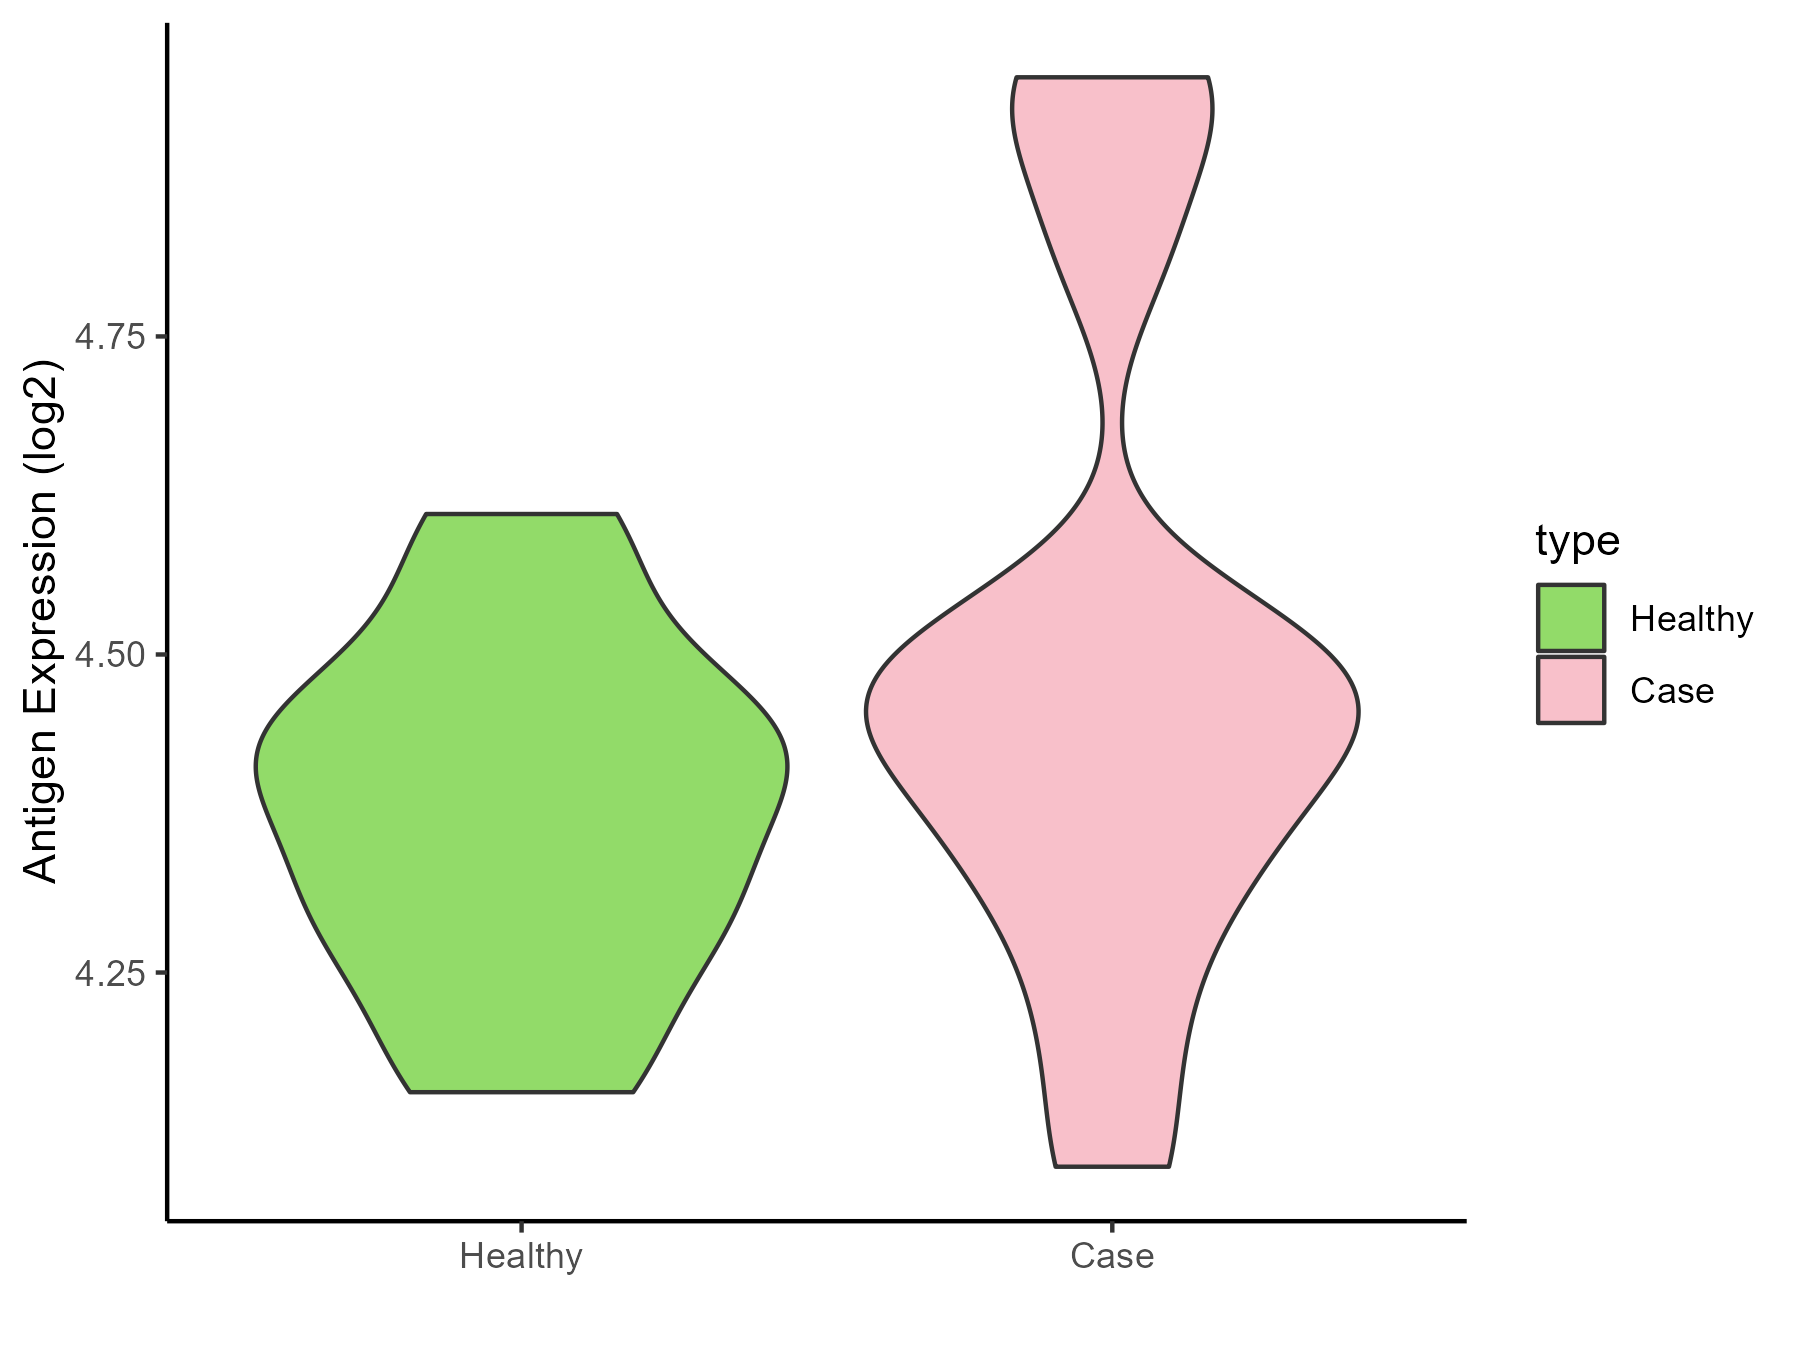
Chronic myeloid leukemia [ICD-11: 2A20]
Click to Show/Hide
| Differential expression pattern of antigen in diseases |
| The Studied Tissue |
Whole blood |
| The Specific Disease |
Myelofibrosis |
| The Expression Level of Disease Section Compare with the Healthy Individual Tissue |
p-value: 0.174523561;
Fold-change: 0.062570559;
Z-score: 0.467319817
|
| Disease-specific Antigen Abundances |
|
Click to View the Clearer Original Diagram
|
|
|
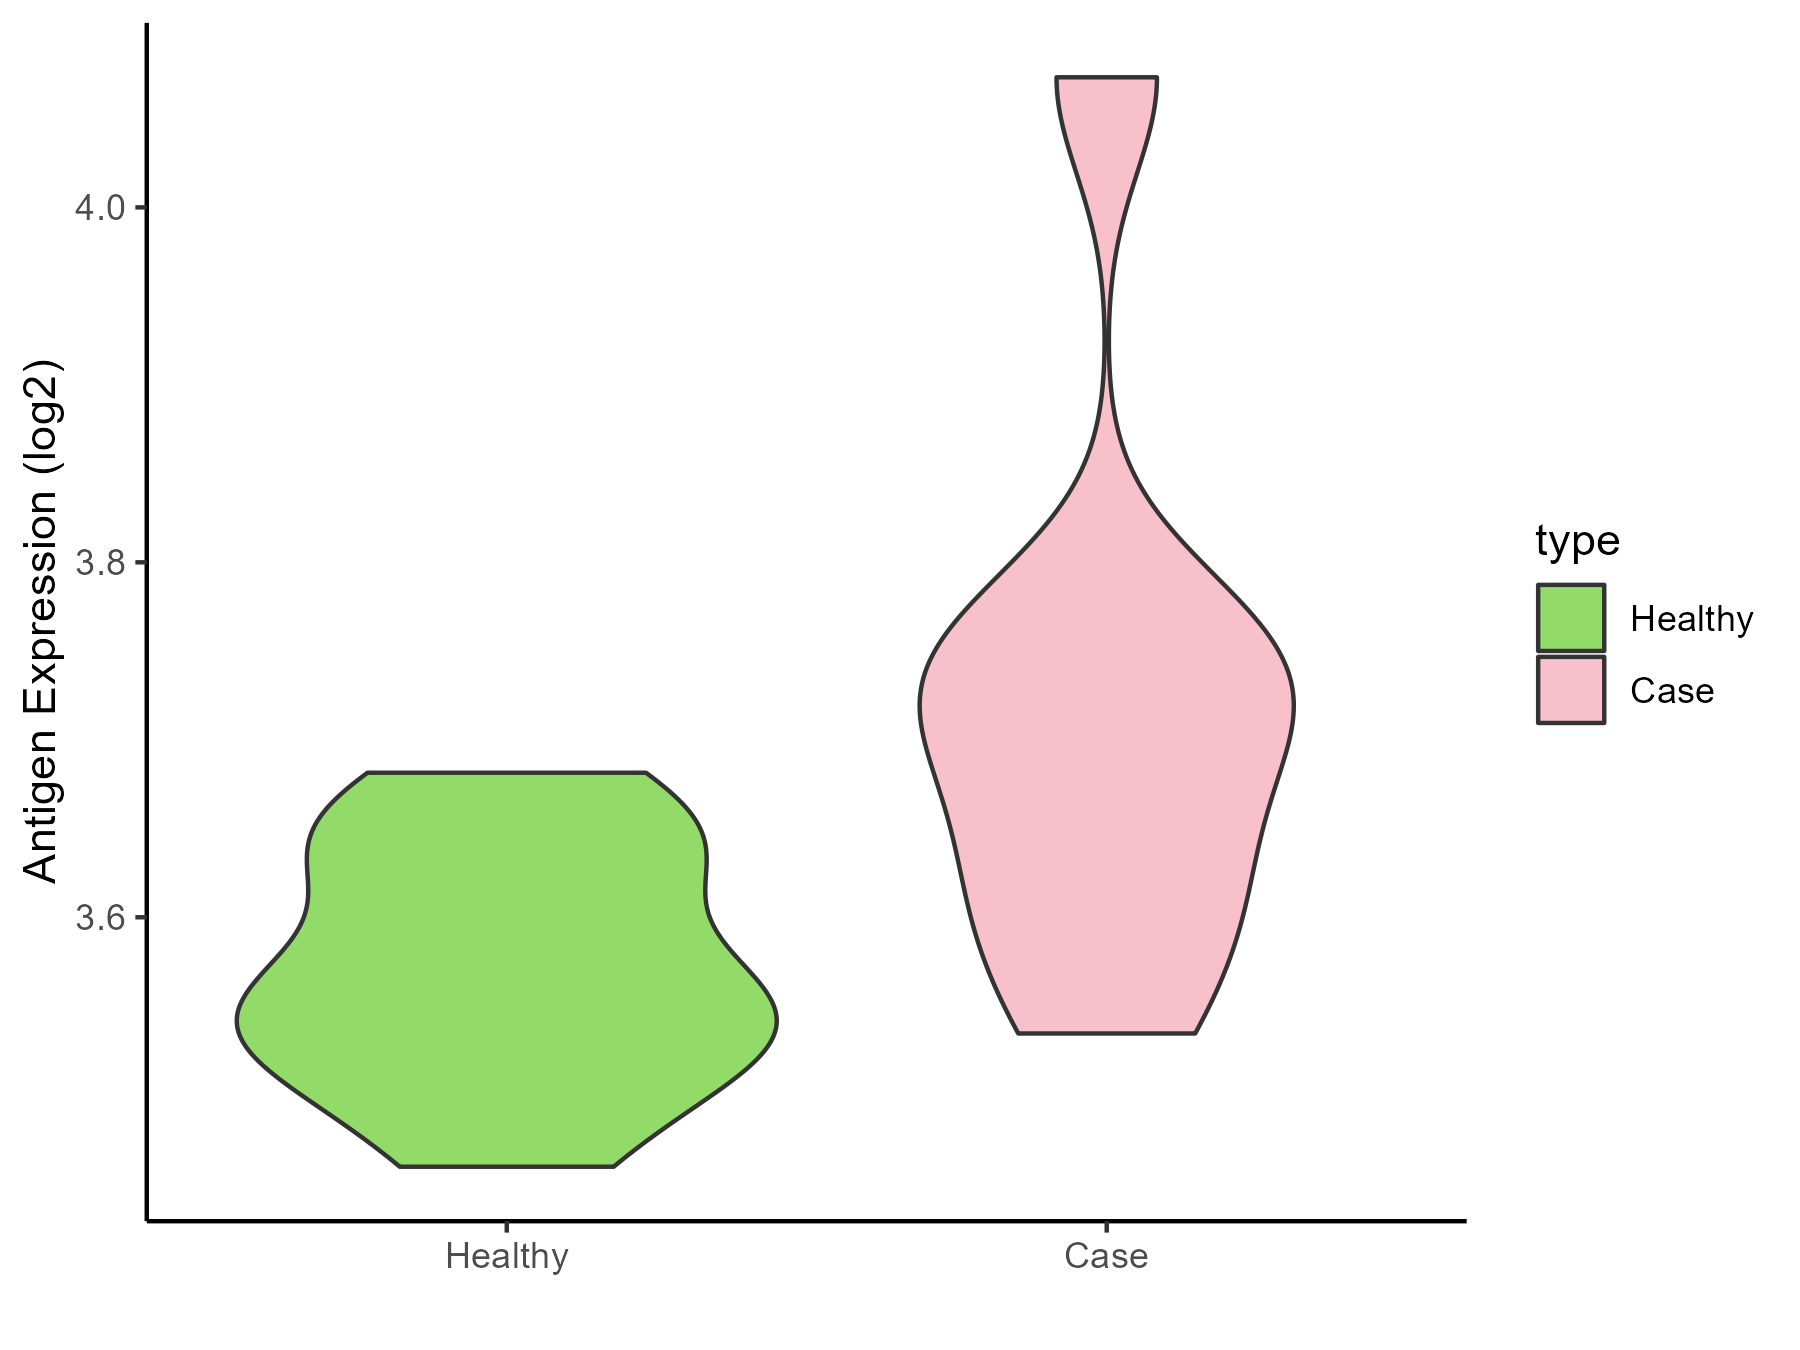
| The Studied Tissue |
Whole blood |
| The Specific Disease |
Polycythemia vera |
| The Expression Level of Disease Section Compare with the Healthy Individual Tissue |
p-value: 1.58E-05;
Fold-change: 0.117593319;
Z-score: 0.832368187
|
| Disease-specific Antigen Abundances |
|
Click to View the Clearer Original Diagram
|
|
|
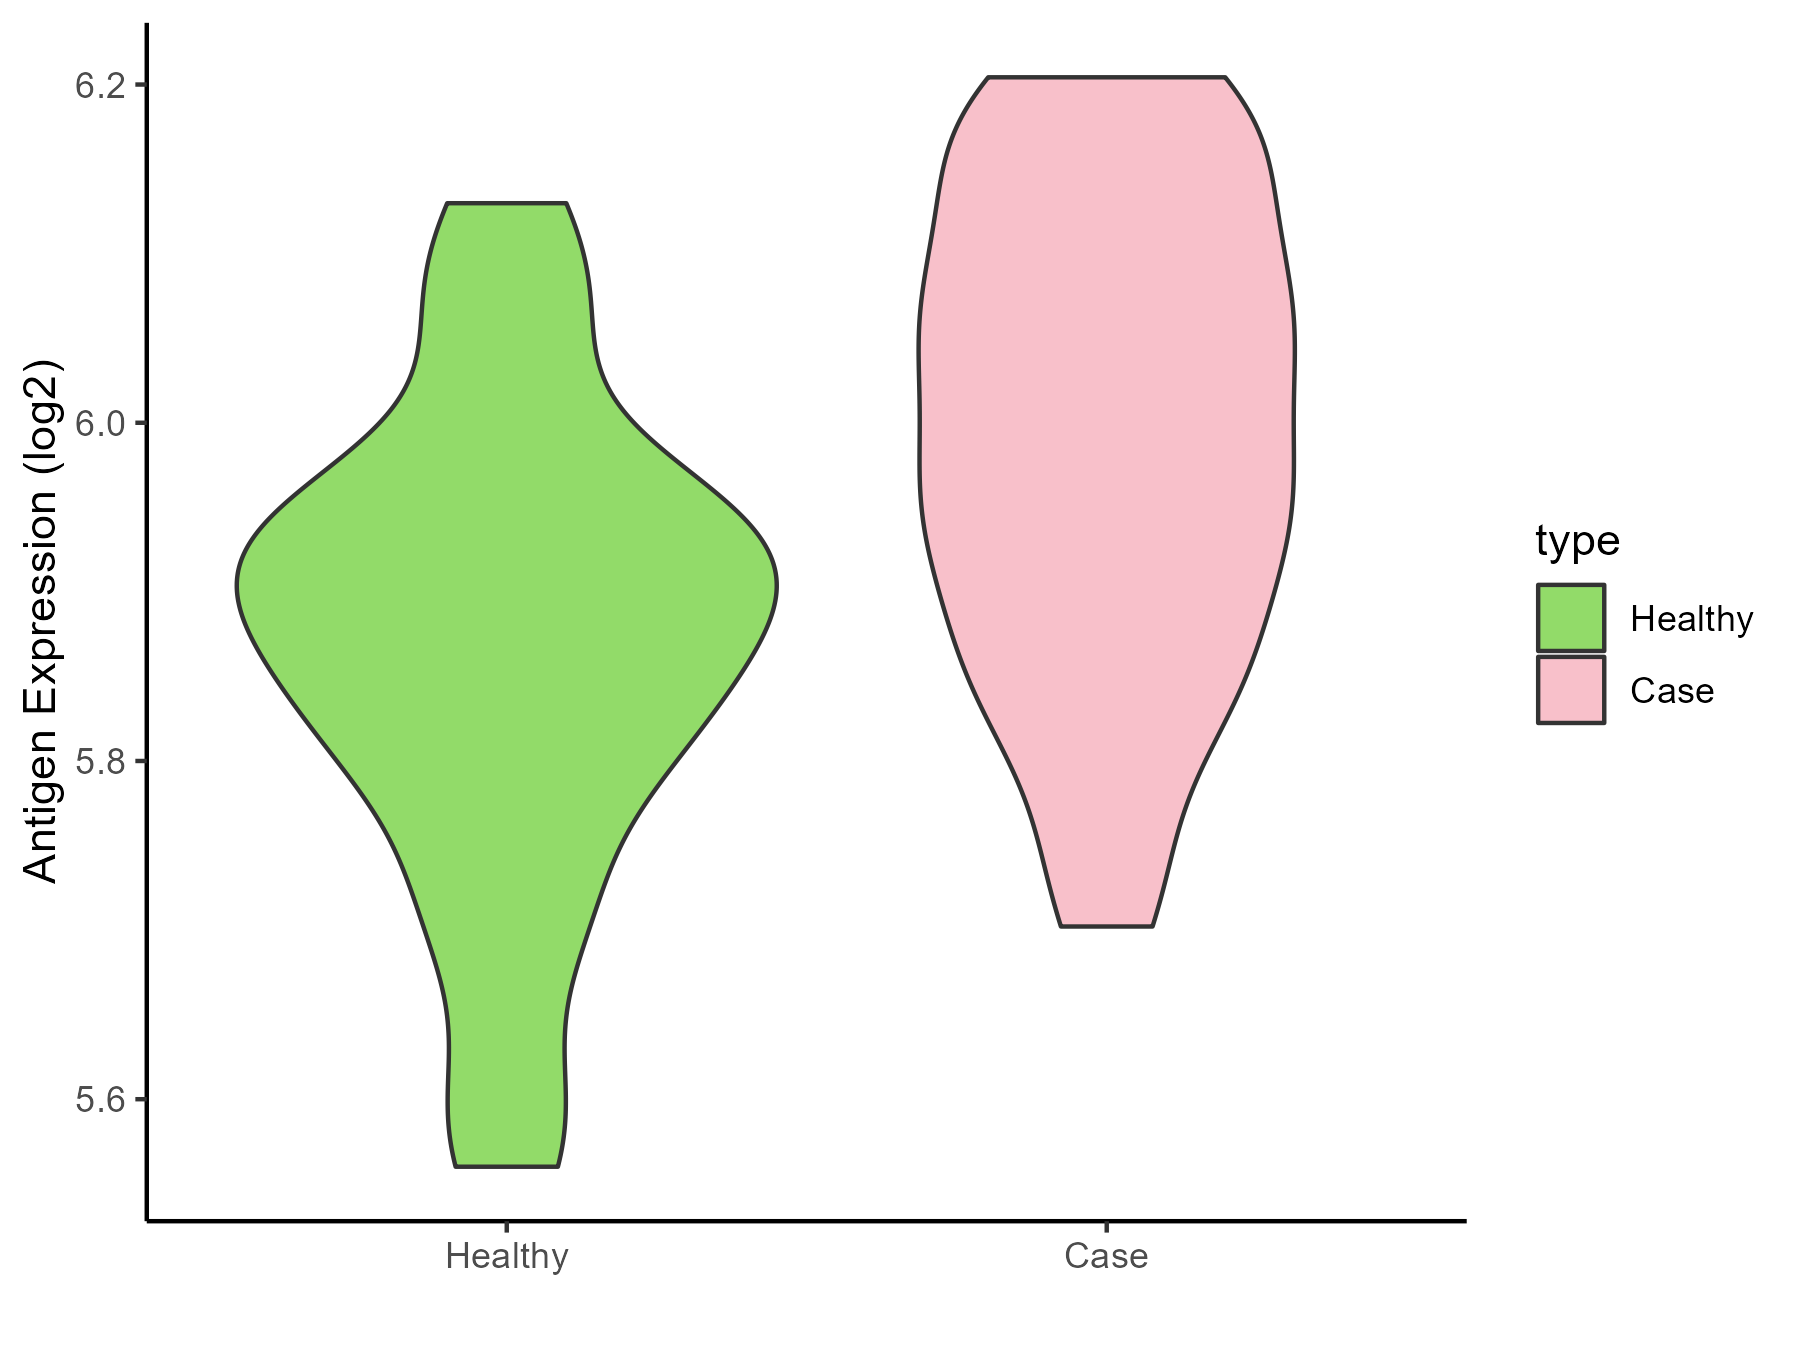
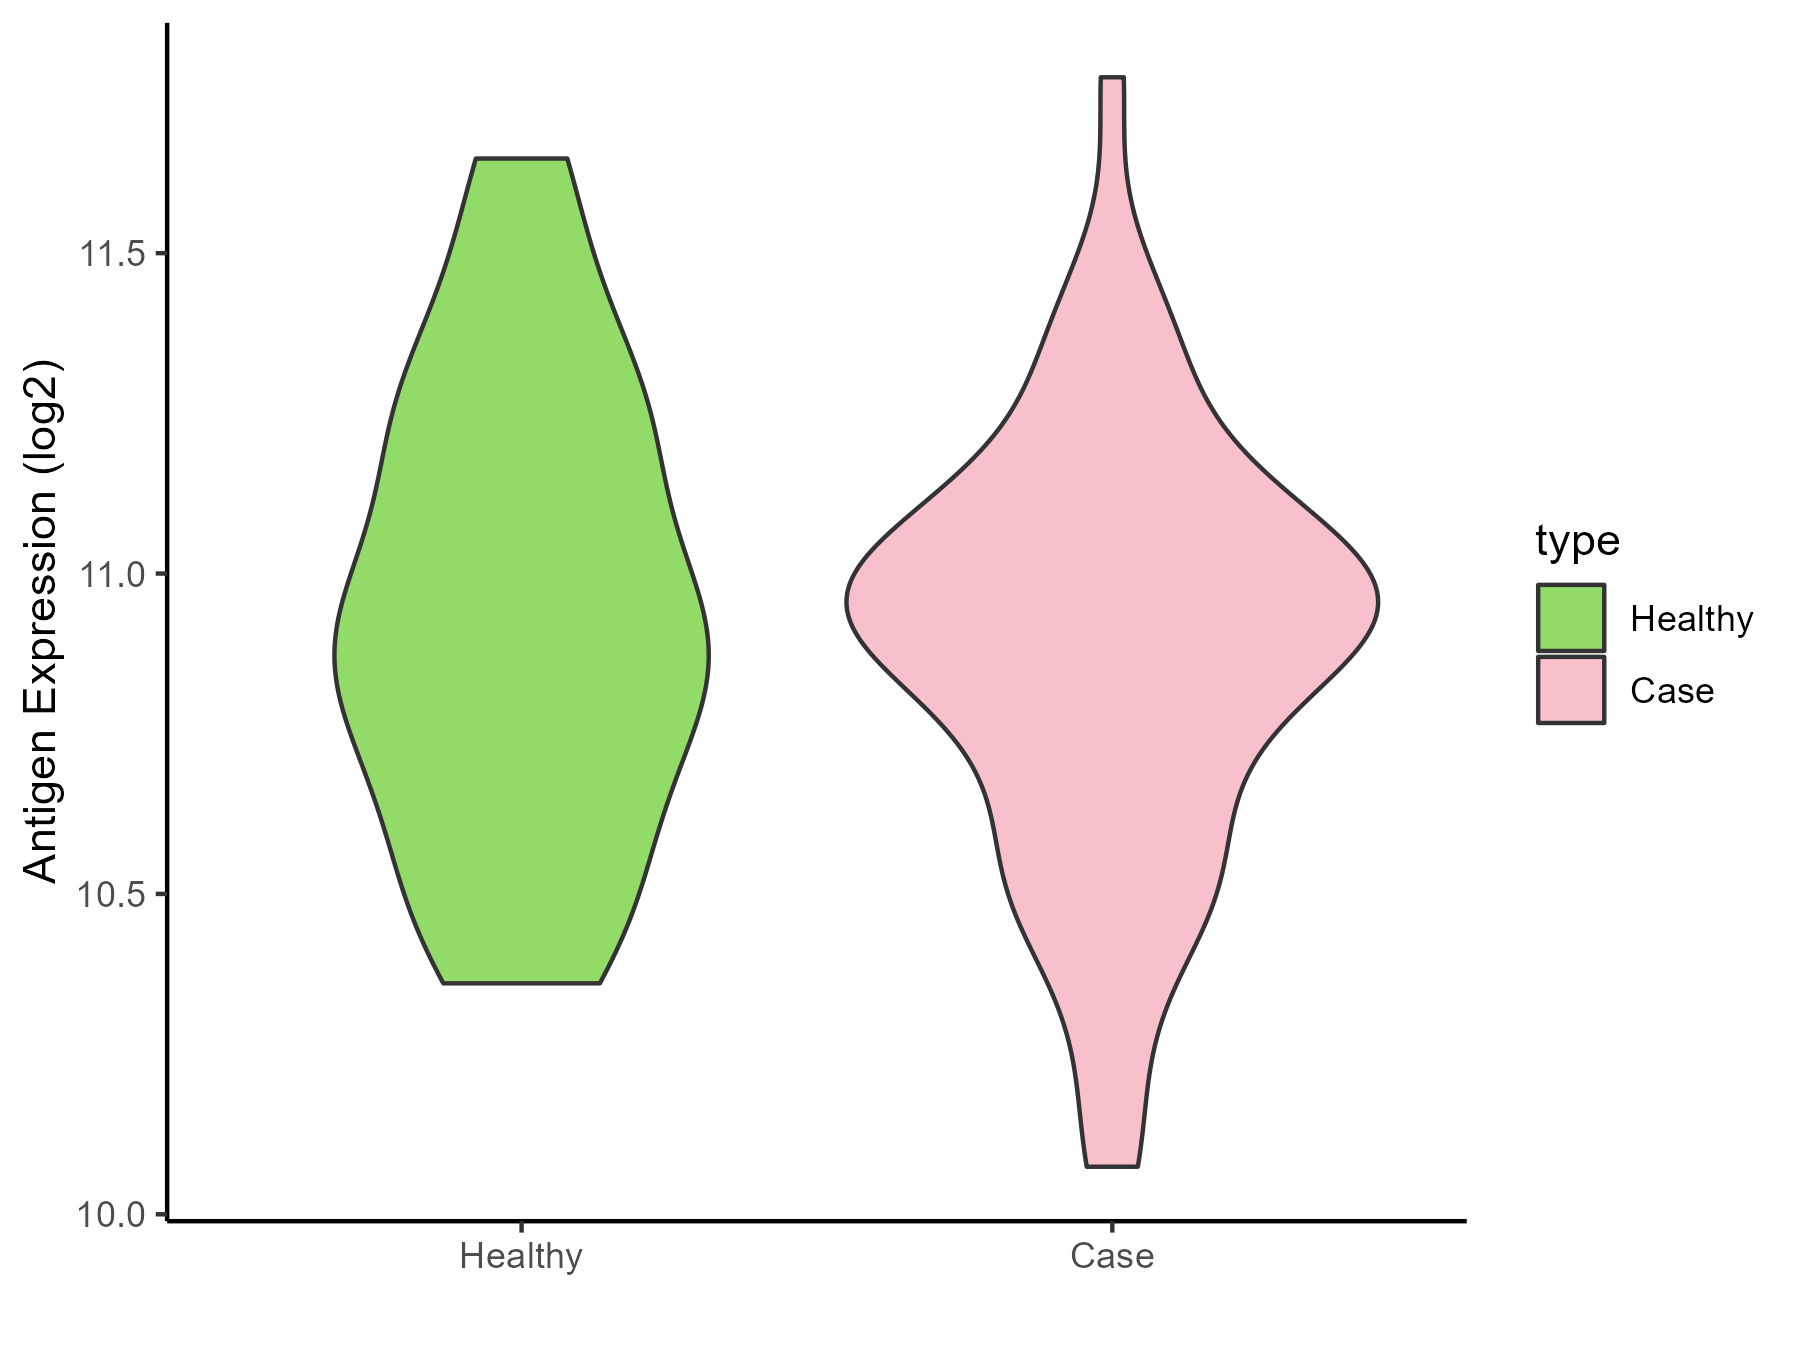
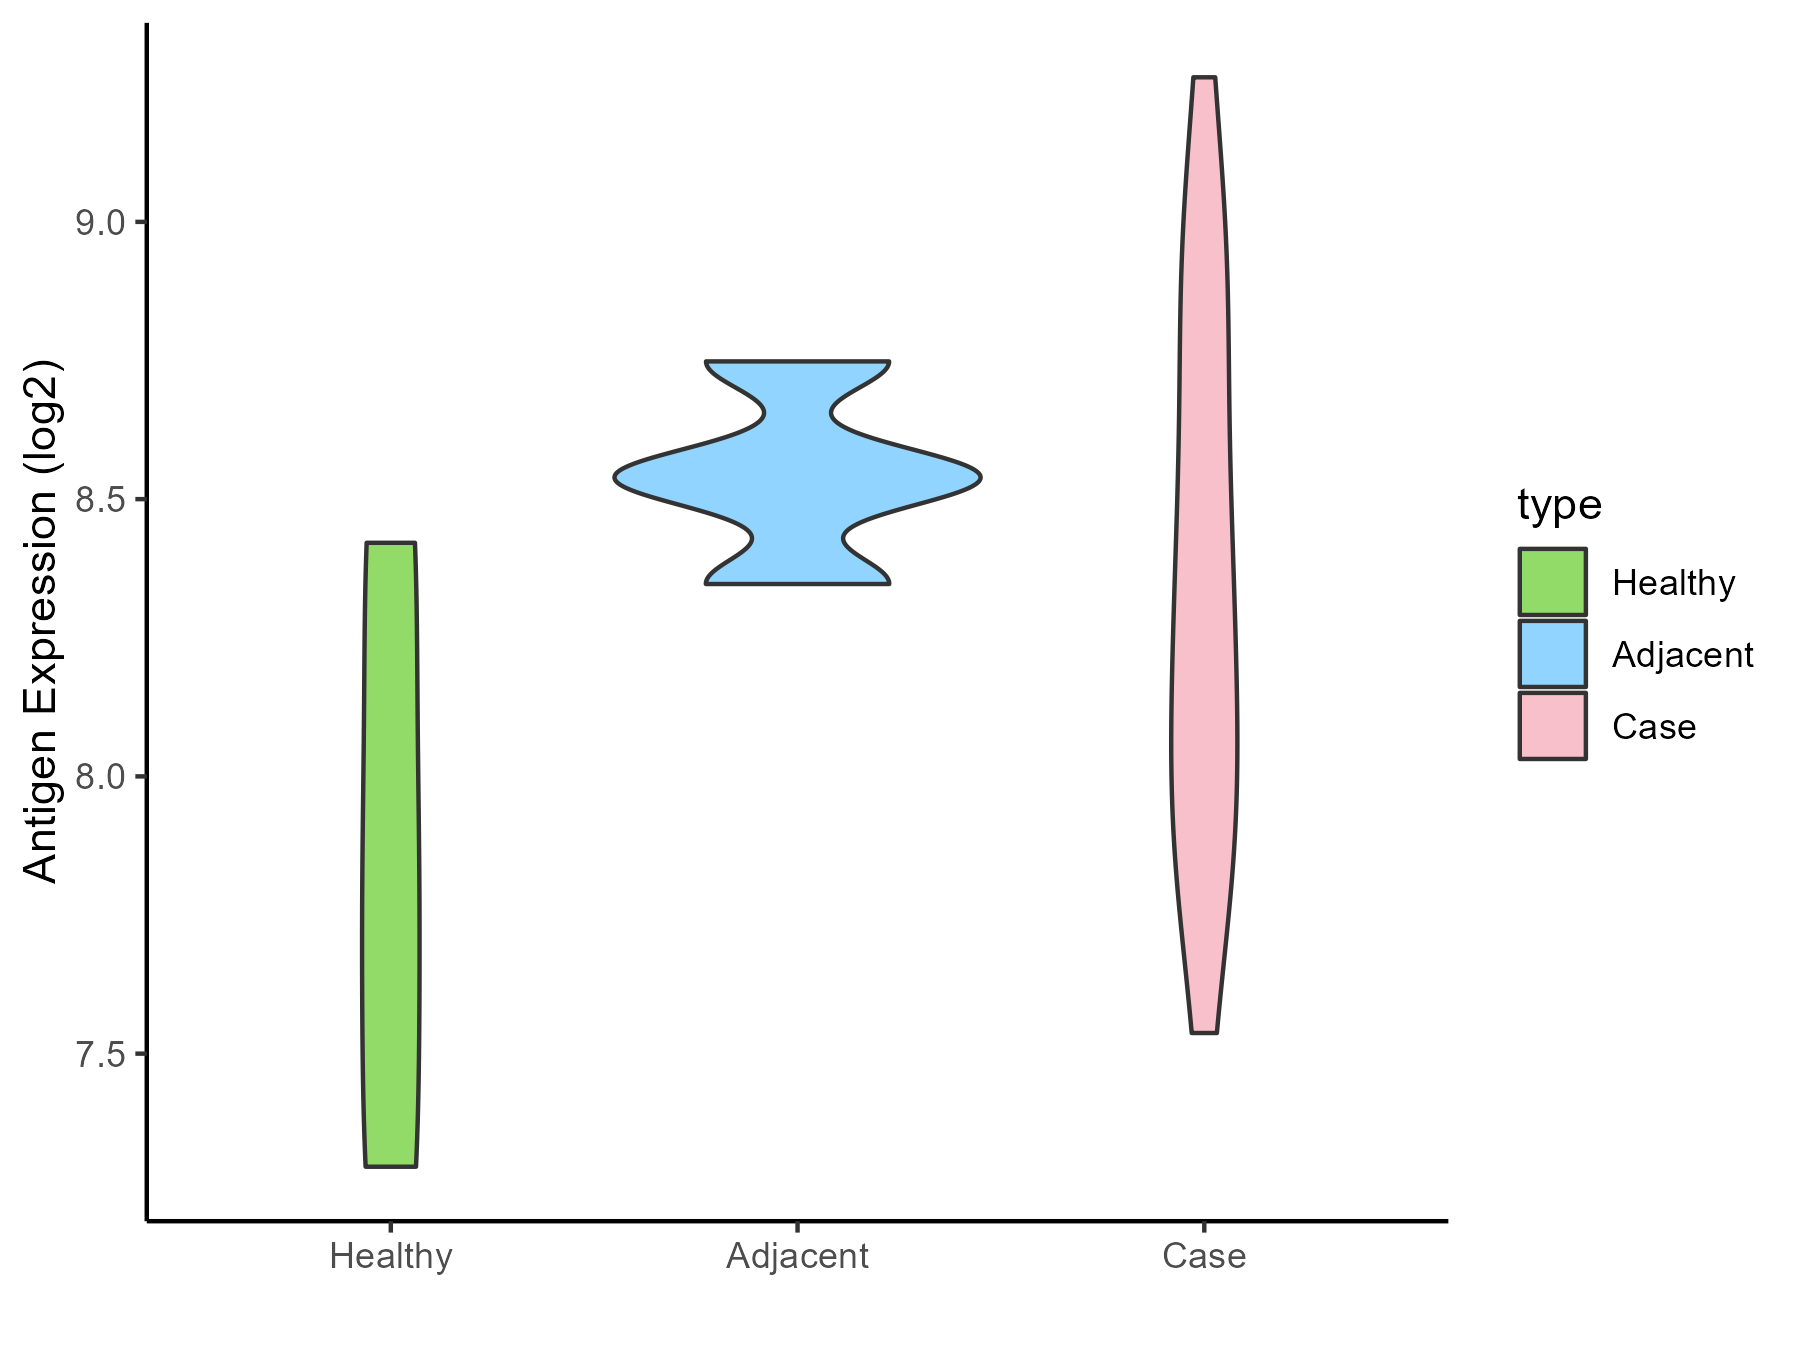
MyeloDysplastic syndromes [ICD-11: 2A37]
Click to Show/Hide
| Differential expression pattern of antigen in diseases |
| The Studied Tissue |
Bone marrow |
| The Specific Disease |
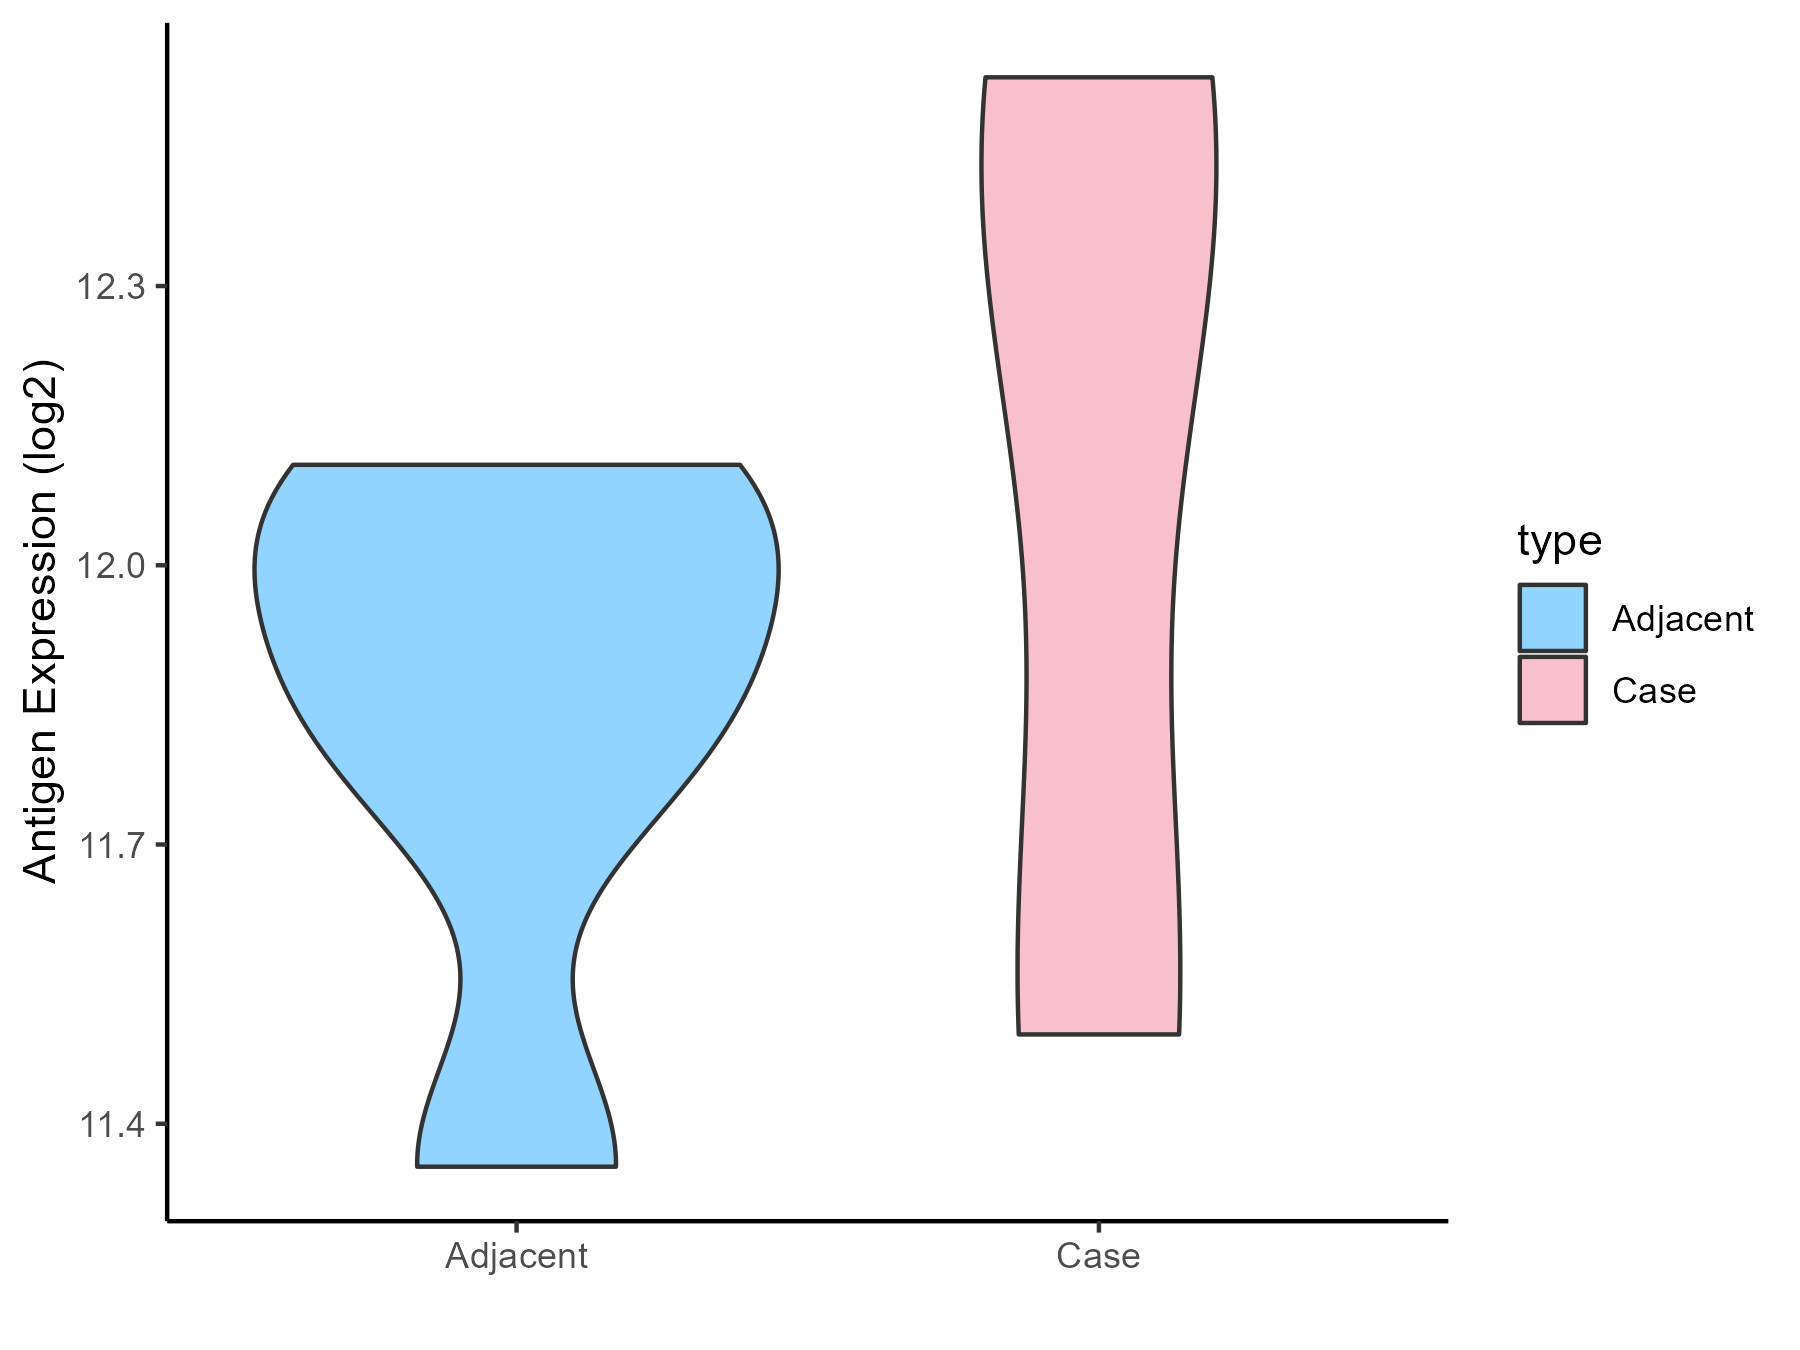
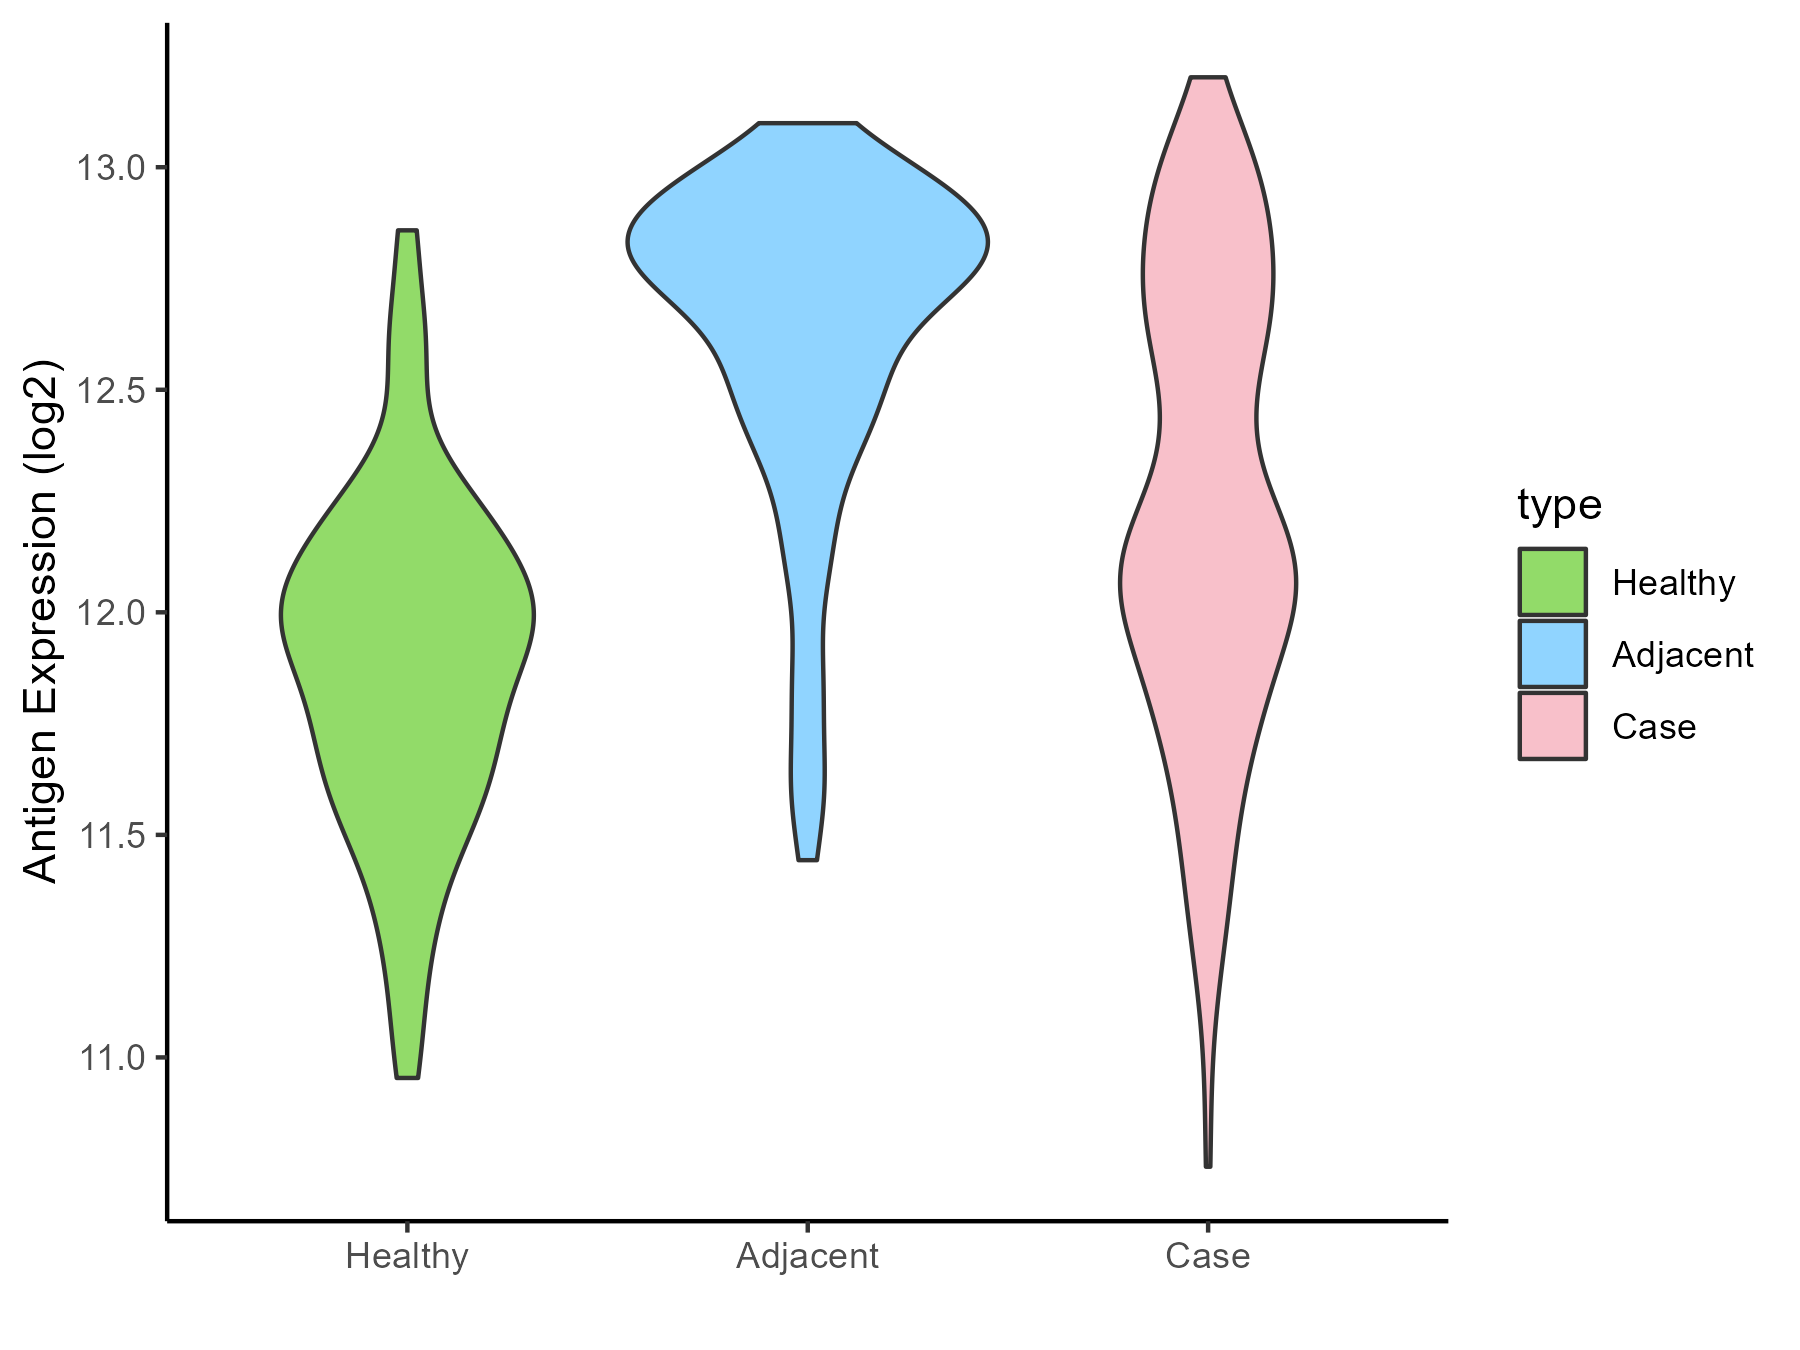
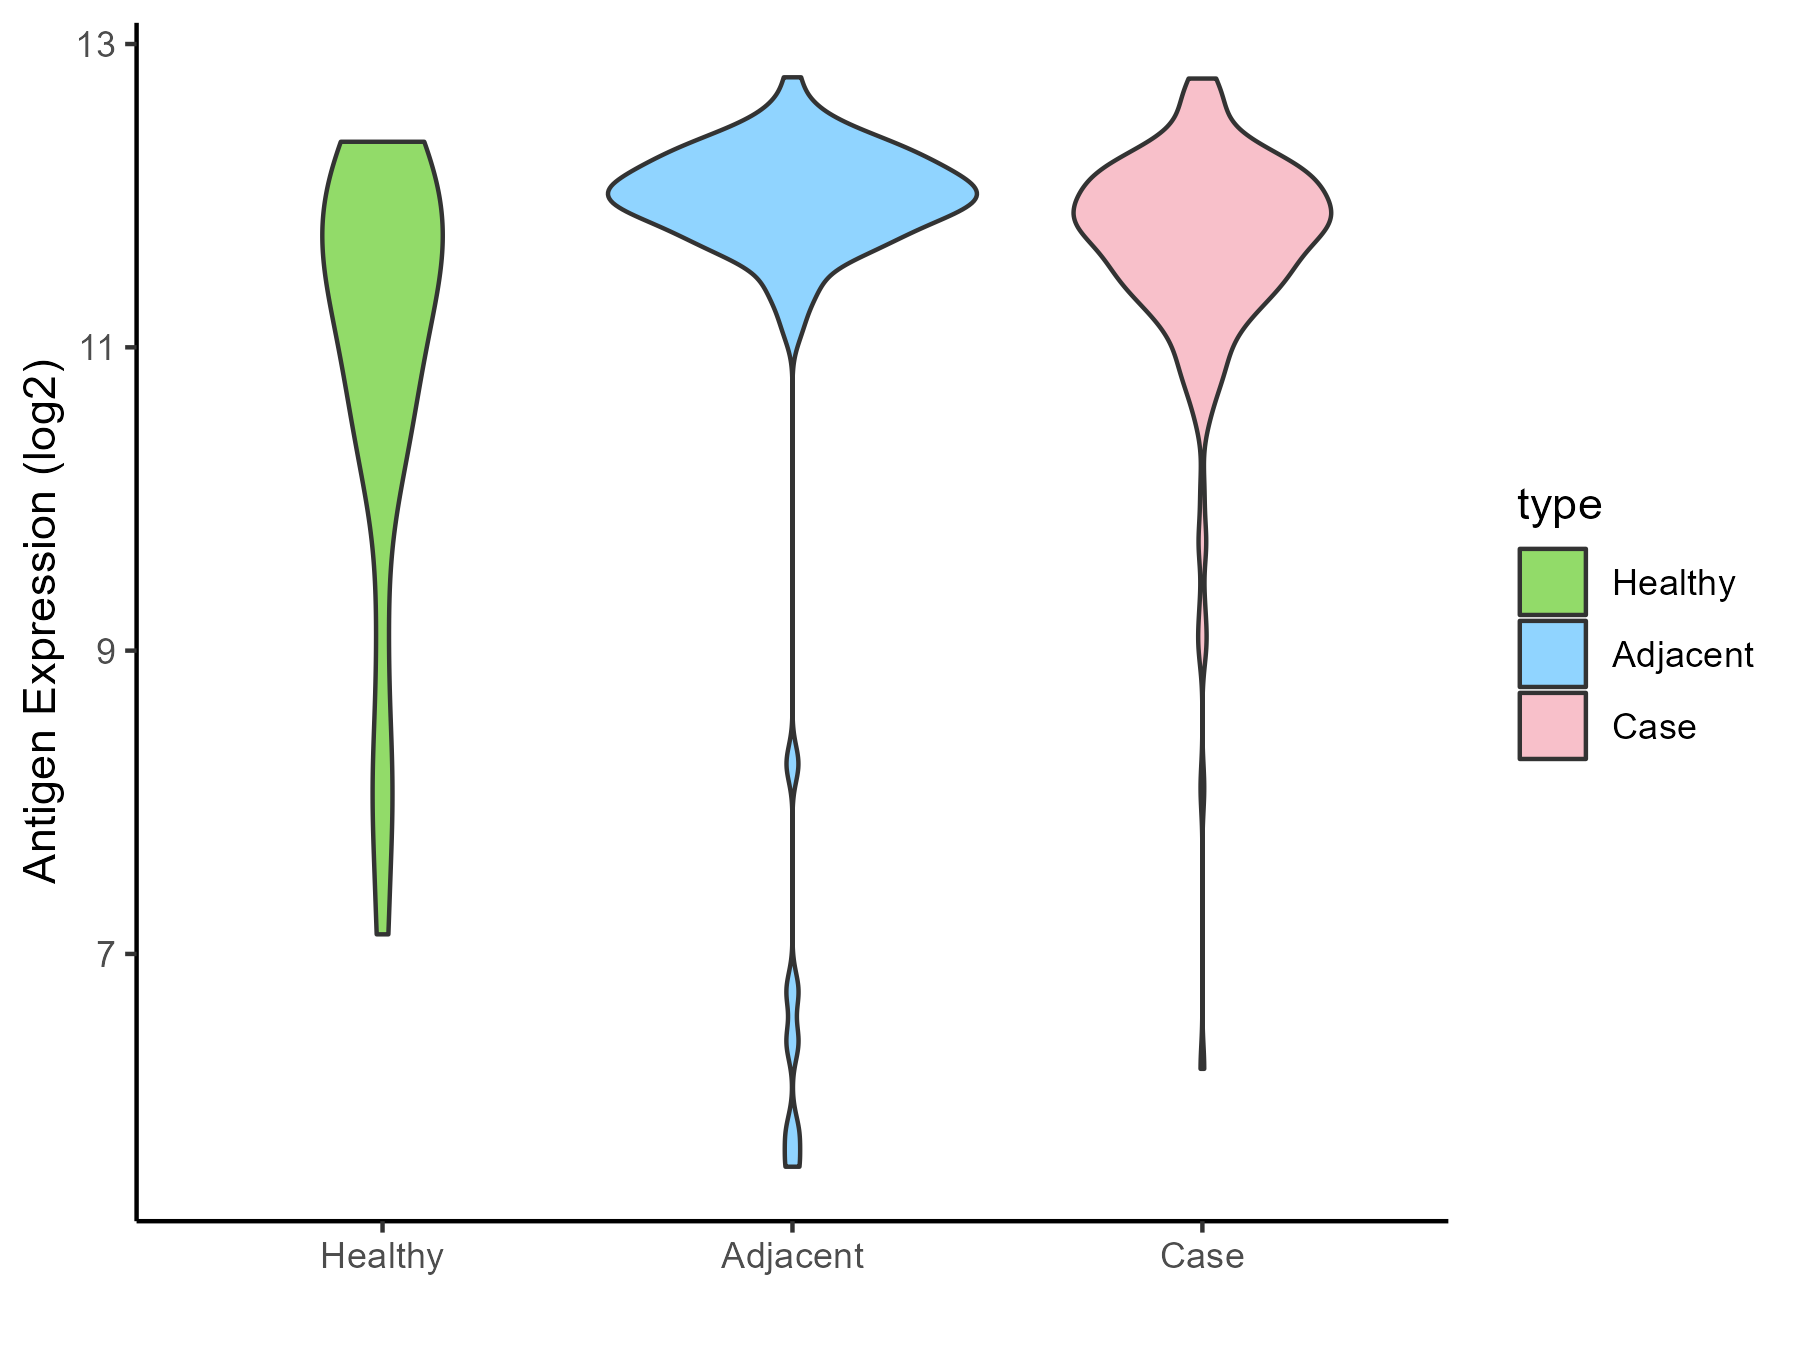
Myelodysplastic syndromes |
| The Expression Level of Disease Section Compare with the Healthy Individual Tissue |
p-value: 0.59944863;
Fold-change: -0.152730217;
Z-score: -0.569517792
|
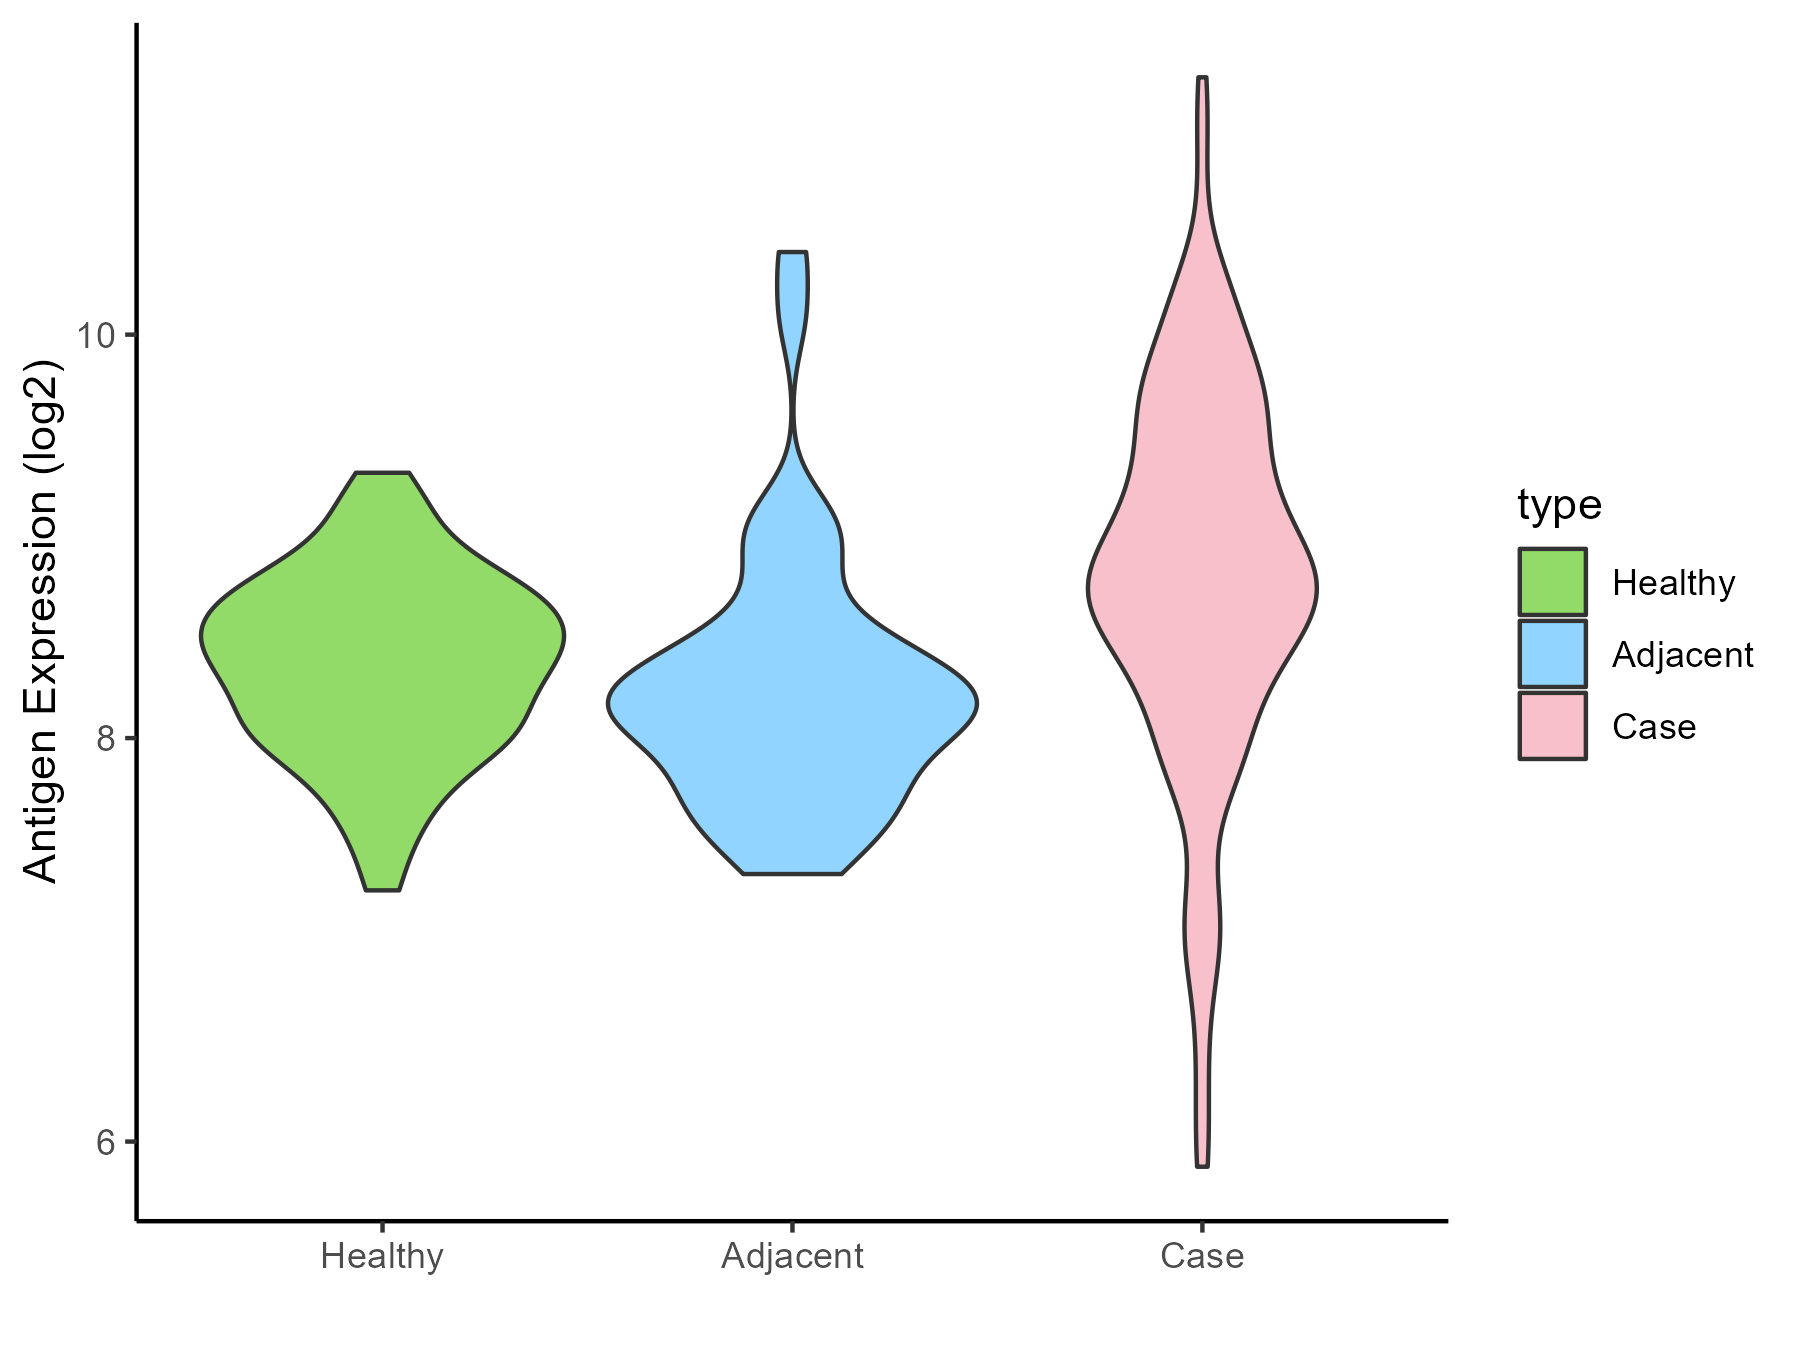
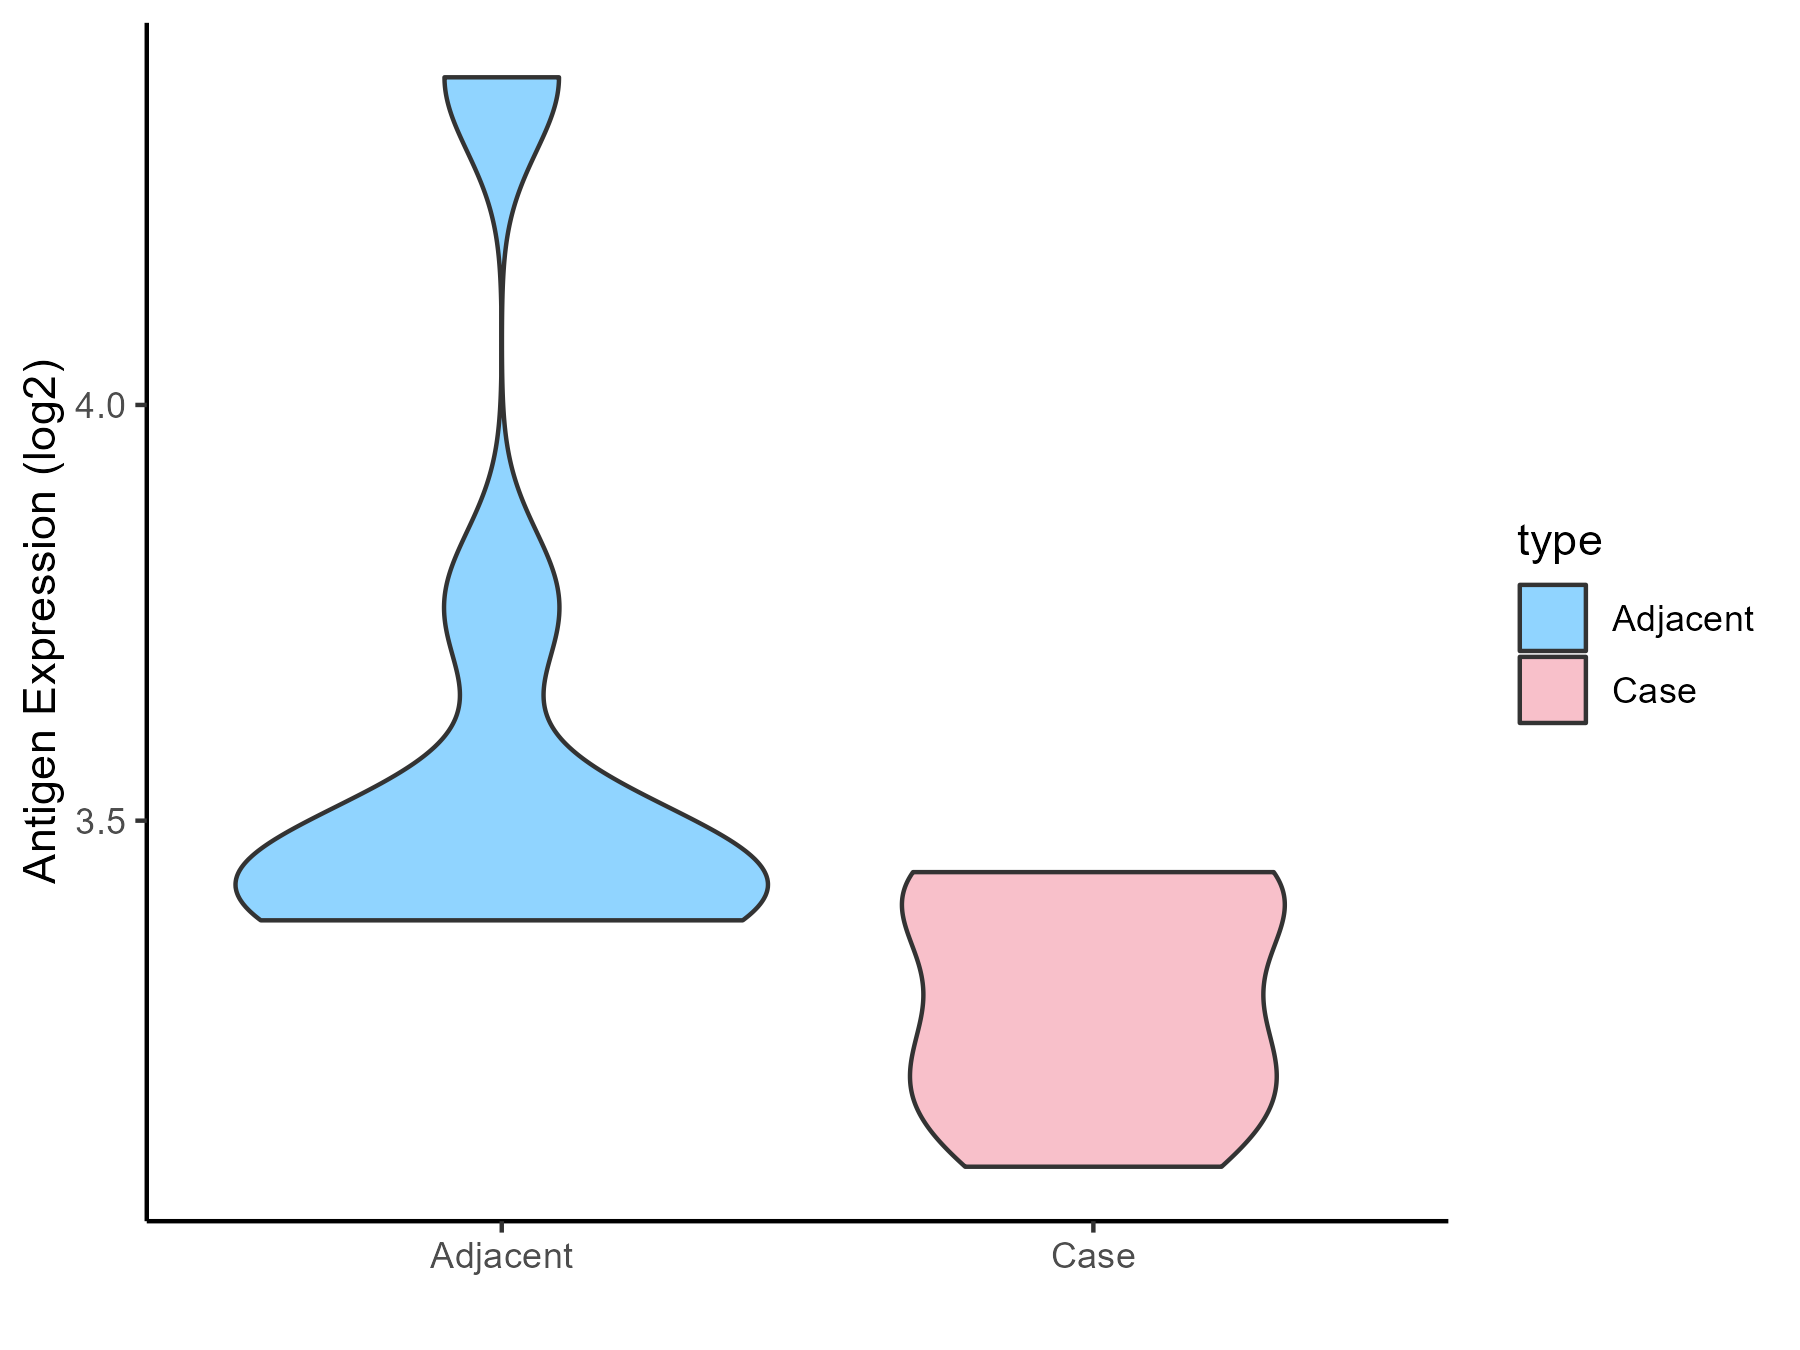
| The Expression Level of Disease Section Compare with the Adjacent Tissue |
p-value: 0.052253762;
Fold-change: 0.114990655;
Z-score: 0.810587474
|
| Disease-specific Antigen Abundances |
|
Click to View the Clearer Original Diagram
|
|
|
Lymphoma [ICD-11: 2A90- 2A85]
Click to Show/Hide
| Differential expression pattern of antigen in diseases |
| The Studied Tissue |
Tonsil |
| The Specific Disease |
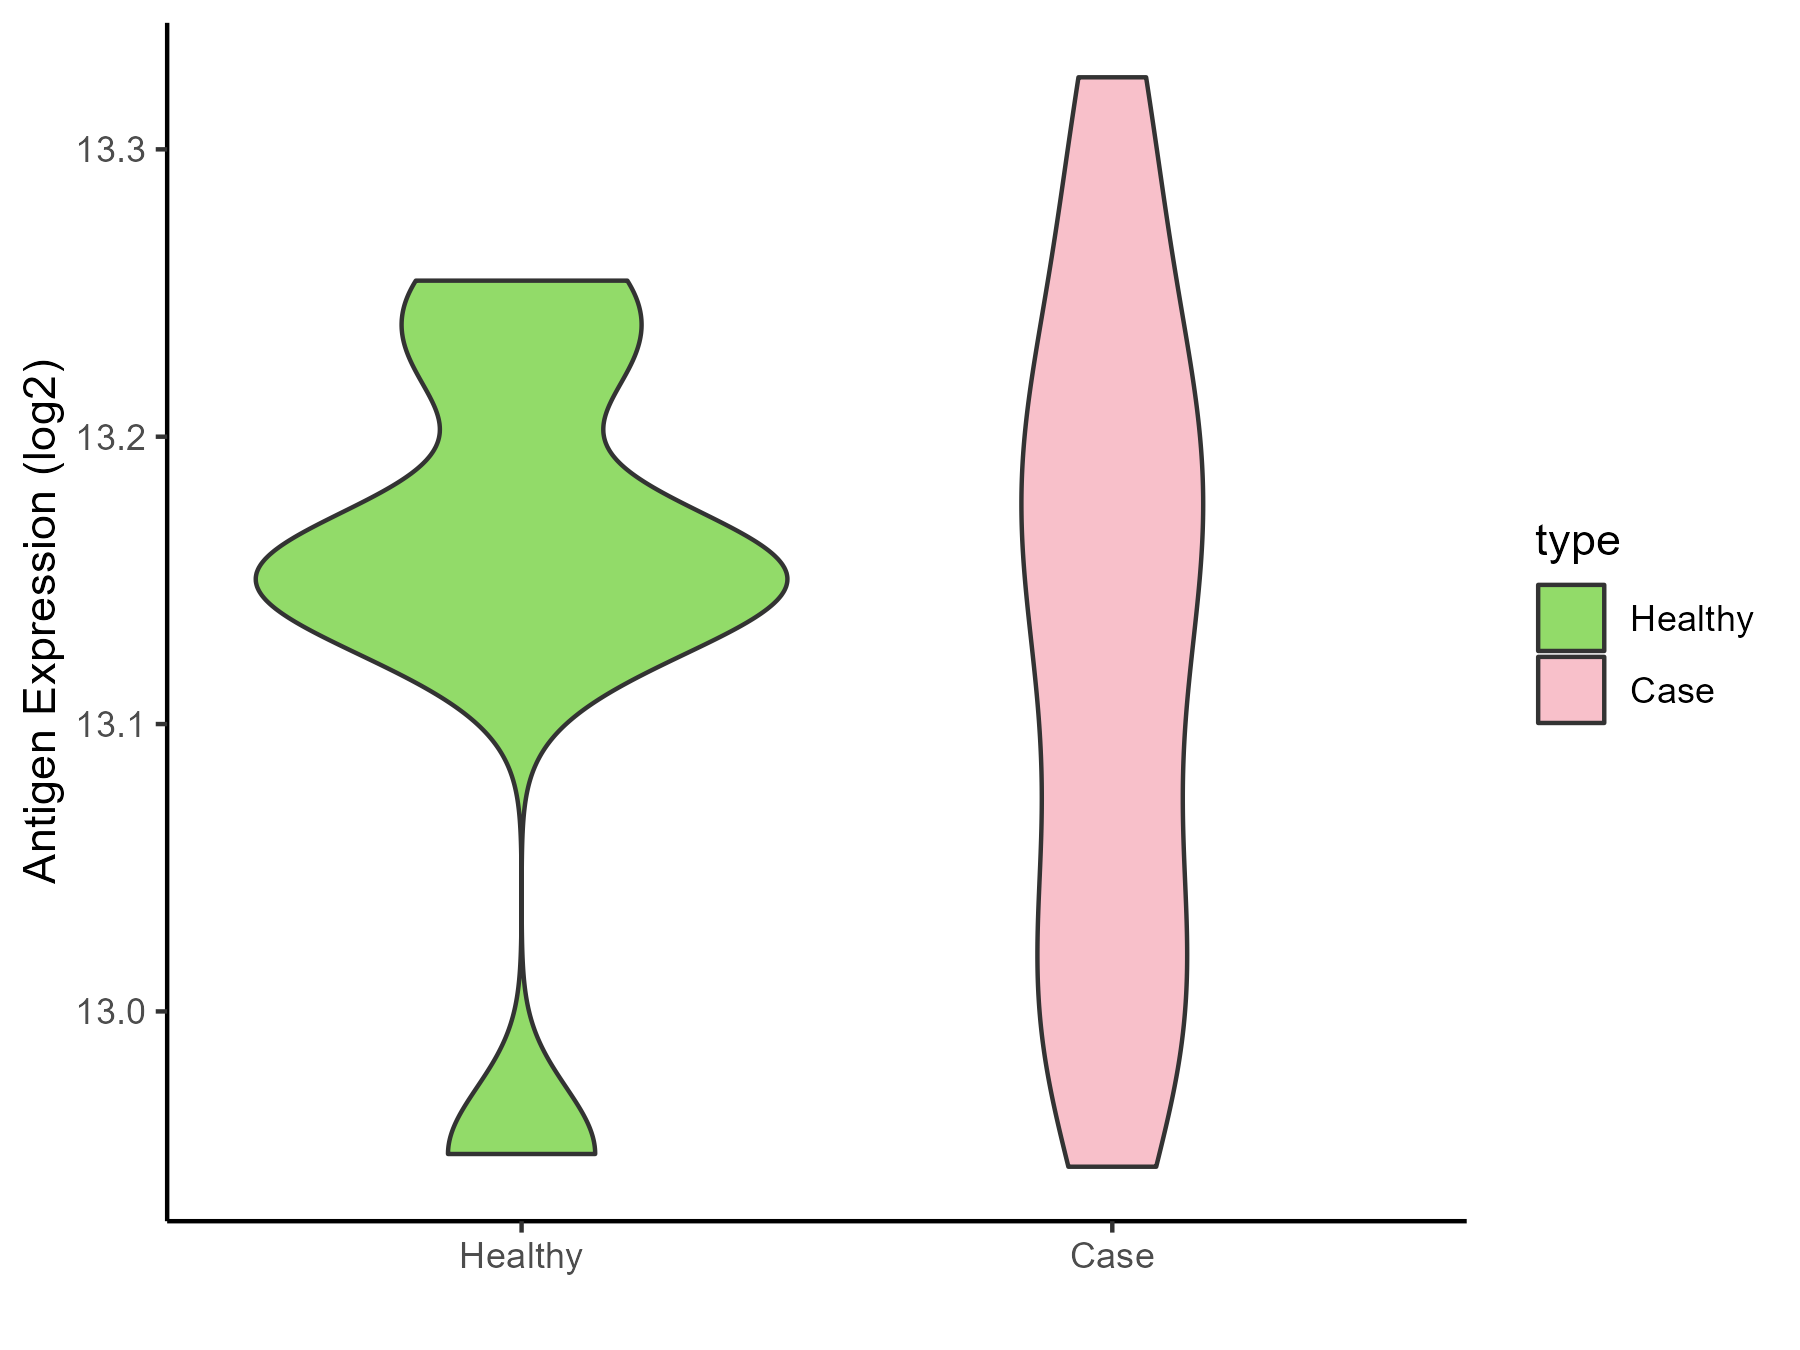
Lymphoma |
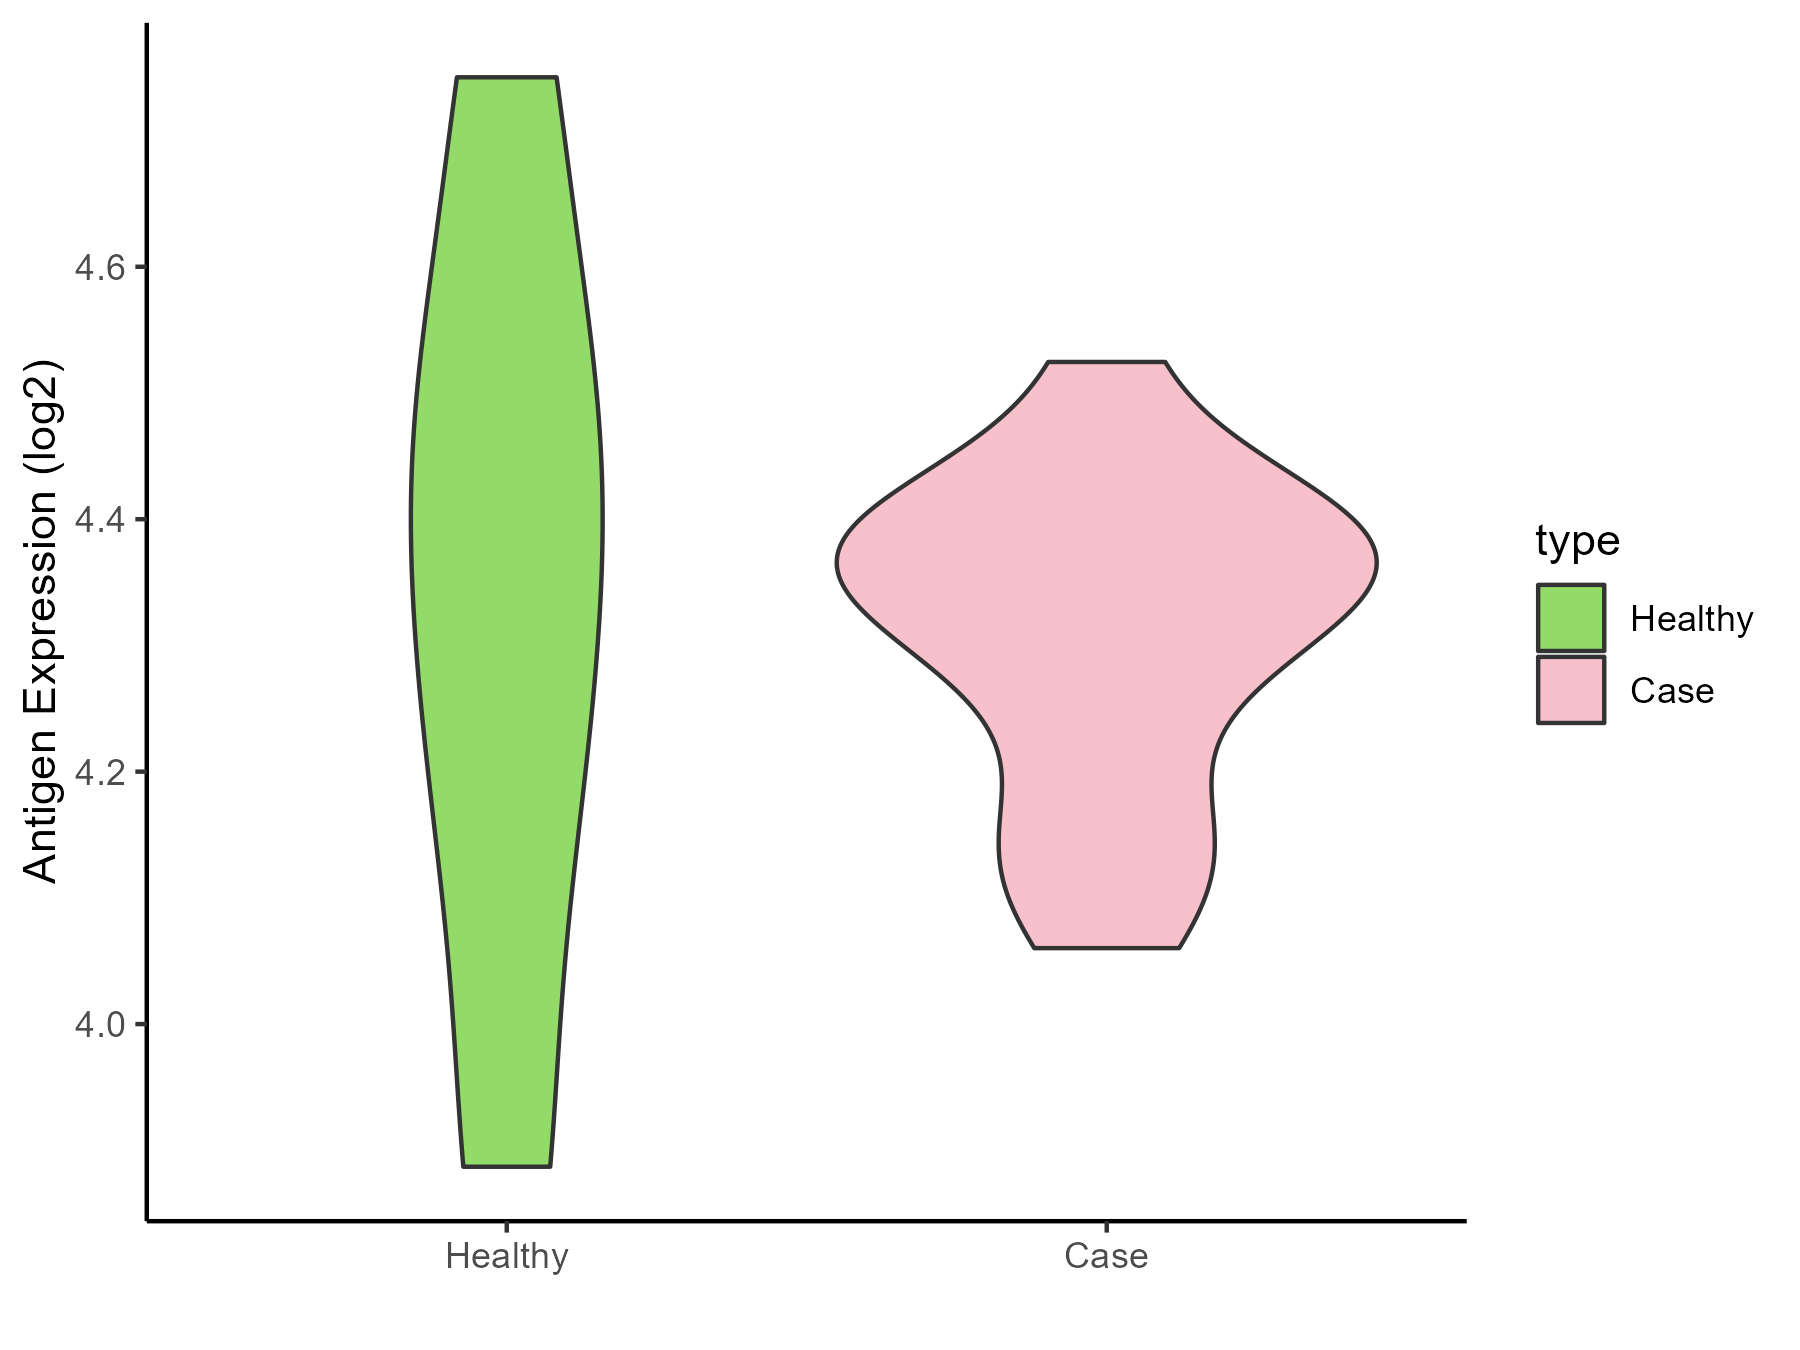
| The Expression Level of Disease Section Compare with the Healthy Individual Tissue |
p-value: 0.706066723;
Fold-change: -0.223671035;
Z-score: -1.160862966
|
| Disease-specific Antigen Abundances |
|
Click to View the Clearer Original Diagram
|
|
|
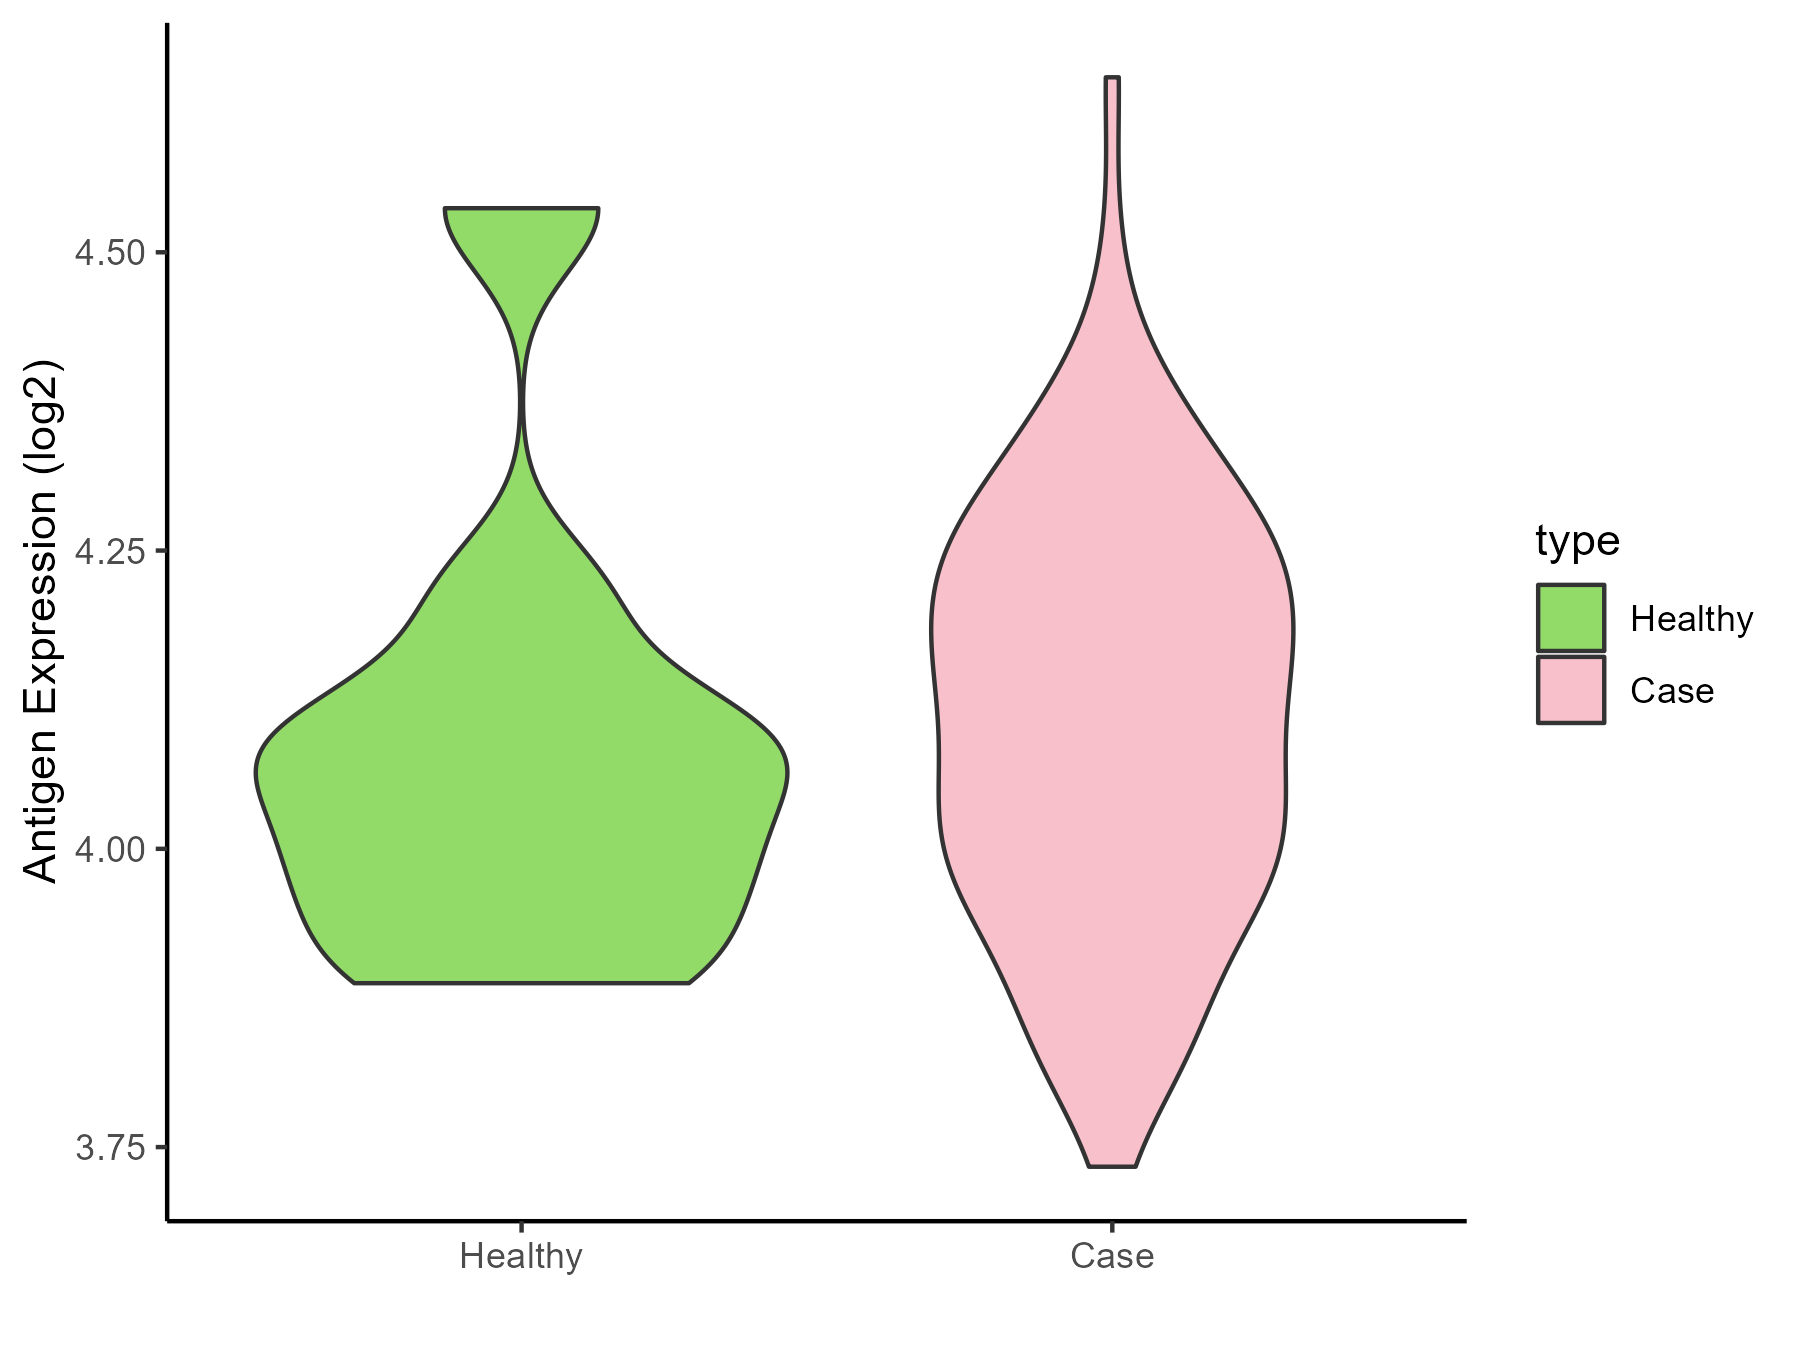
Gastric cancer [ICD-11: 2B72]
Click to Show/Hide
| Differential expression pattern of antigen in diseases |
| The Studied Tissue |
Gastric |
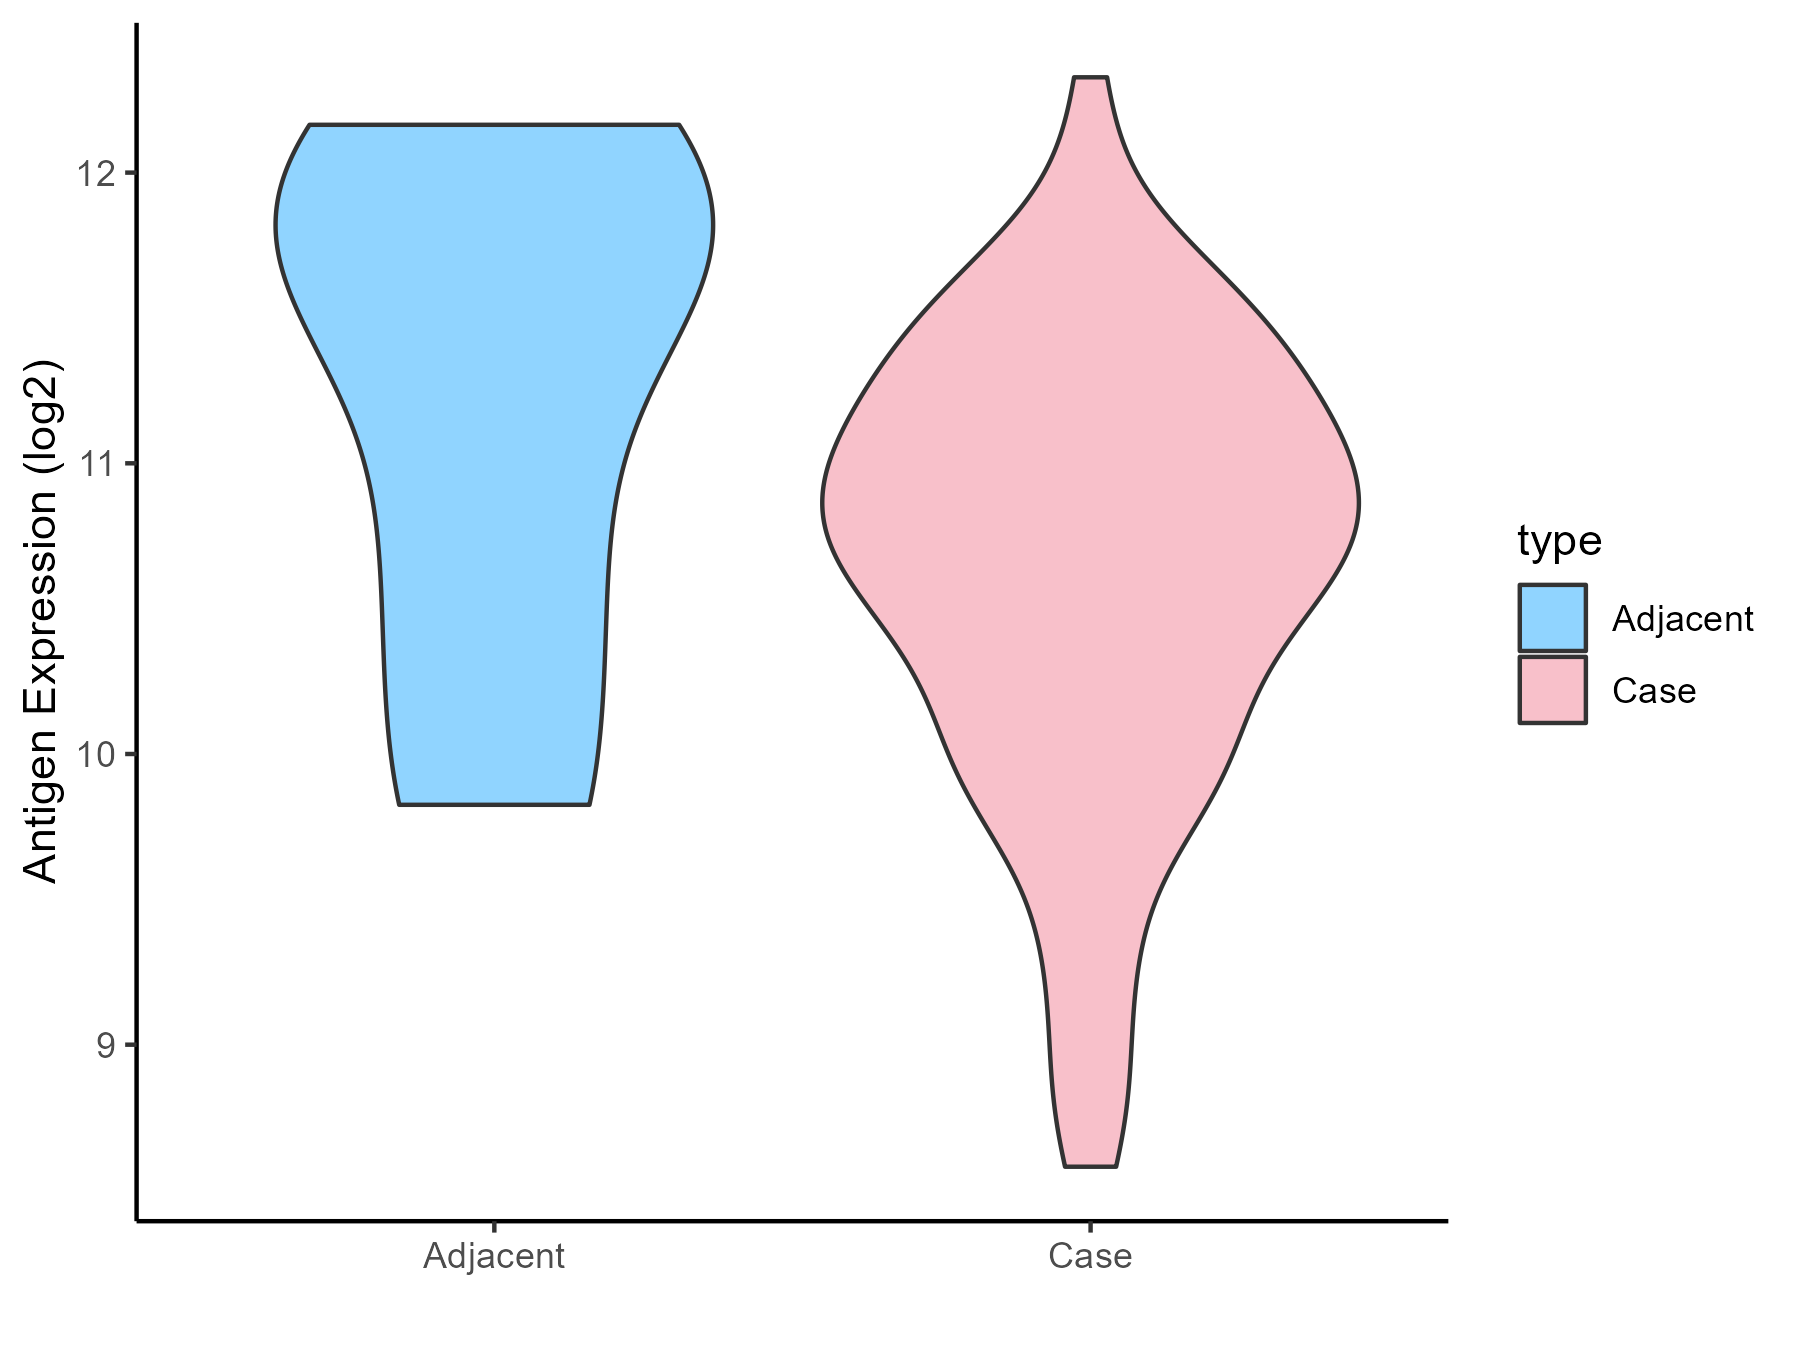
| The Specific Disease |
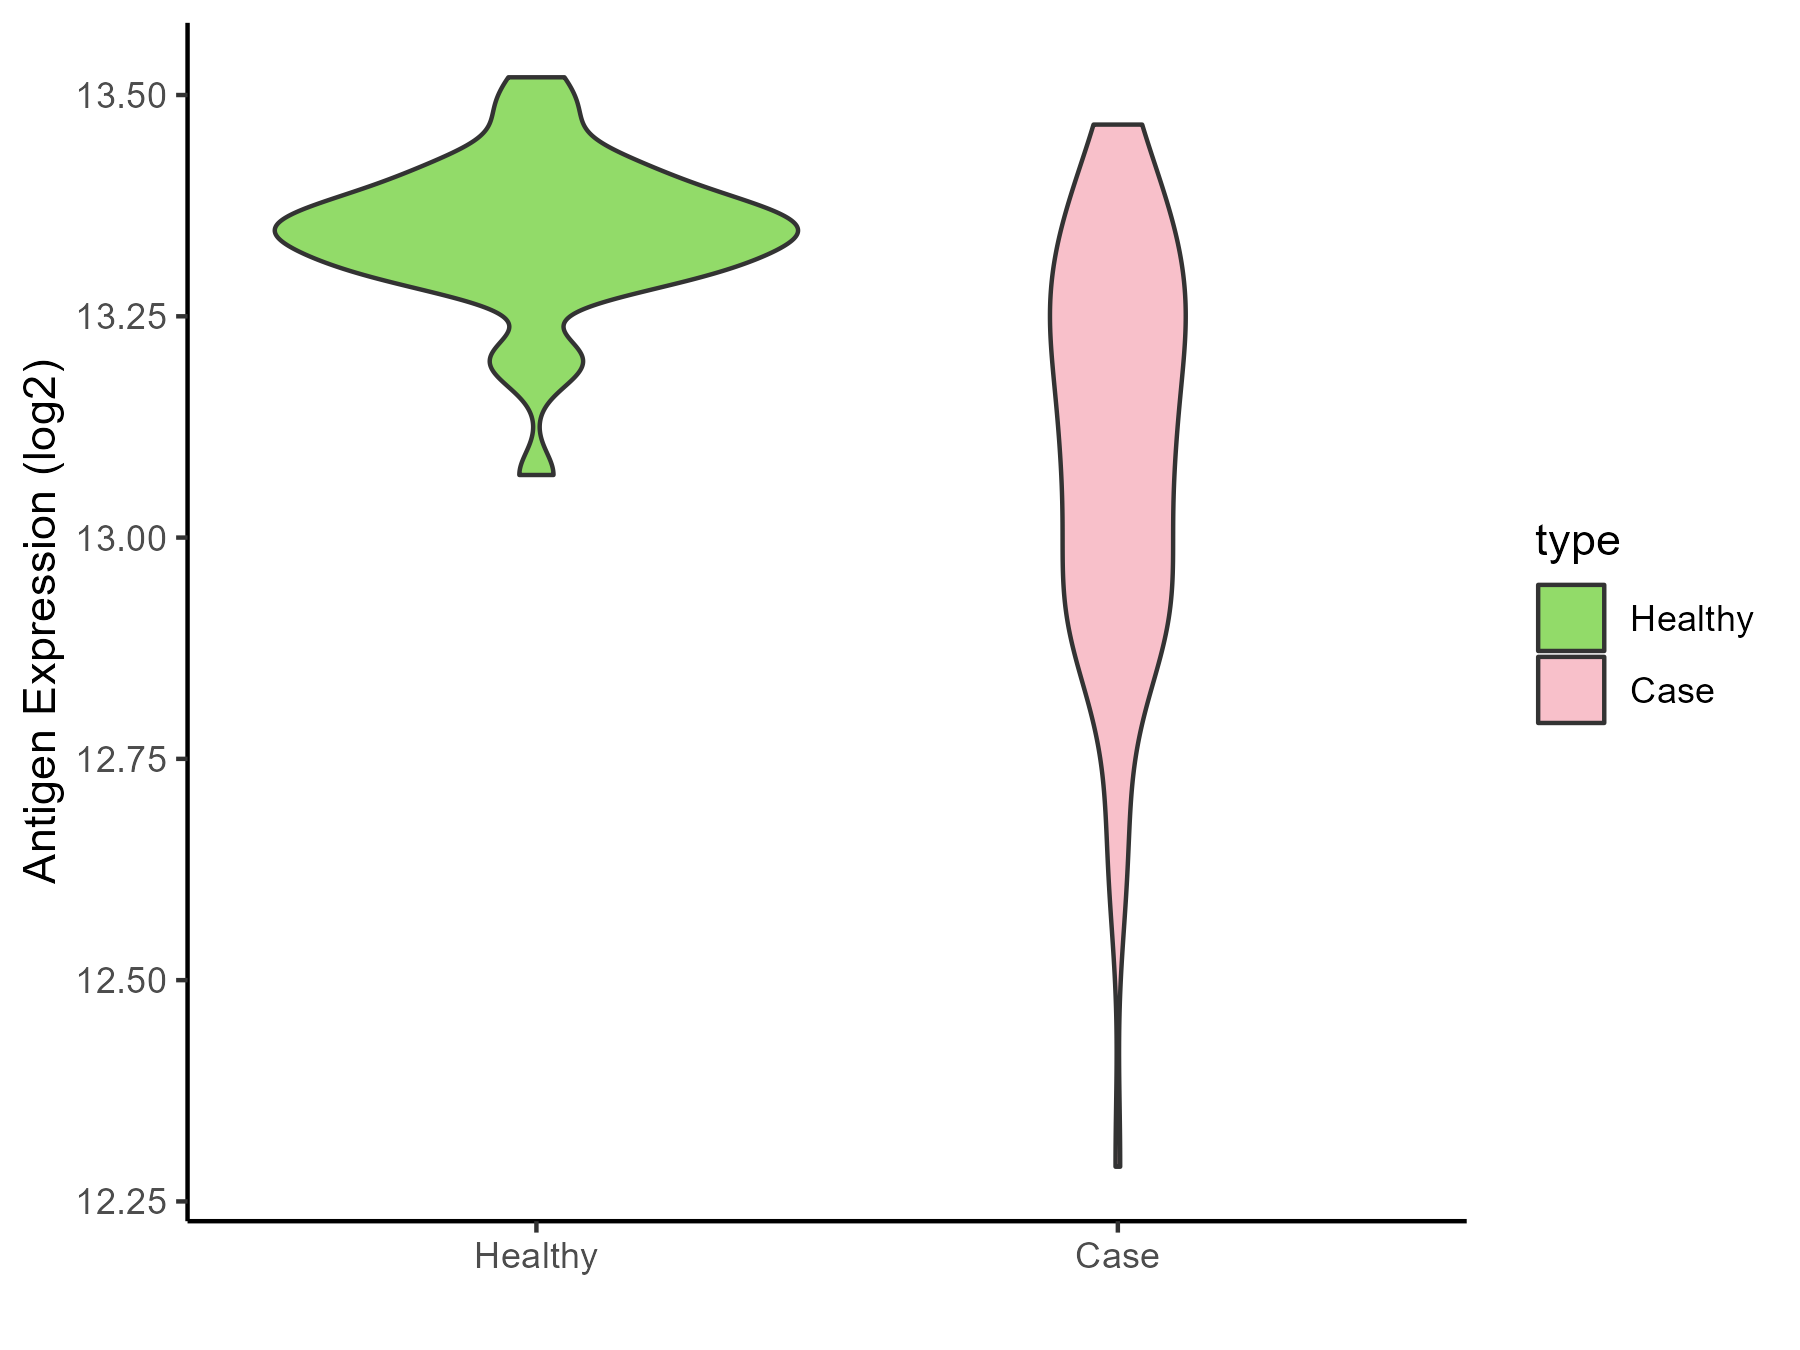
Gastric cancer |
| The Expression Level of Disease Section Compare with the Healthy Individual Tissue |
p-value: 0.53528938;
Fold-change: 0.594394522;
Z-score: 0.300207767
|
| The Expression Level of Disease Section Compare with the Adjacent Tissue |
p-value: 0.026591422;
Fold-change: 0.010040289;
Z-score: 0.023912169
|
| Disease-specific Antigen Abundances |
|
Click to View the Clearer Original Diagram
|
|
|
Colon cancer [ICD-11: 2B90]
Click to Show/Hide
| Differential expression pattern of antigen in diseases |
| The Studied Tissue |
Colon |
| The Specific Disease |
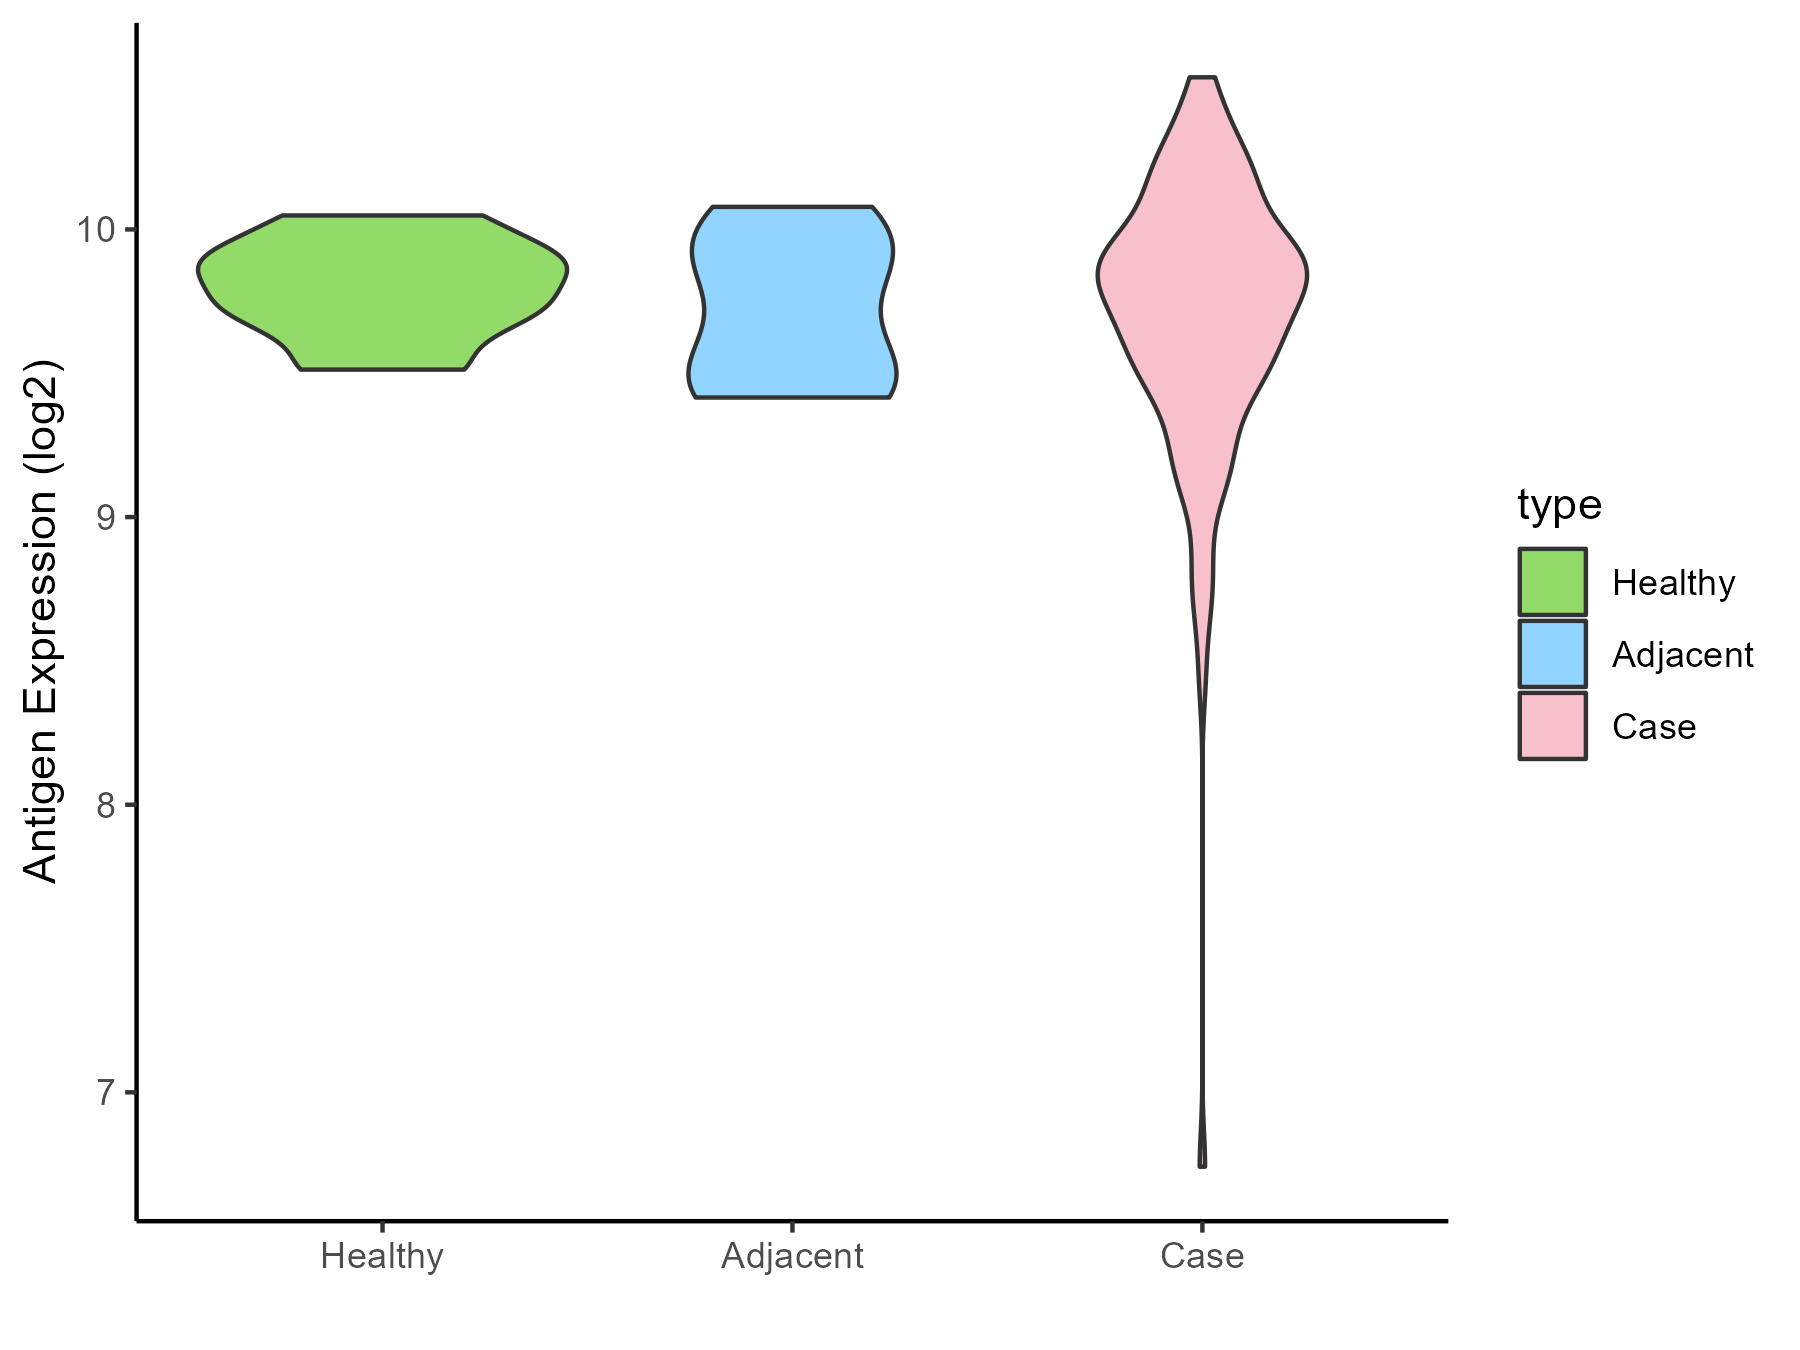
Colon cancer |
| The Expression Level of Disease Section Compare with the Healthy Individual Tissue |
p-value: 8.63E-05;
Fold-change: -0.102223815;
Z-score: -0.373659263
|
| The Expression Level of Disease Section Compare with the Adjacent Tissue |
p-value: 0.286950309;
Fold-change: -0.006279184;
Z-score: -0.009084405
|
| Disease-specific Antigen Abundances |
|
Click to View the Clearer Original Diagram
|
|
|
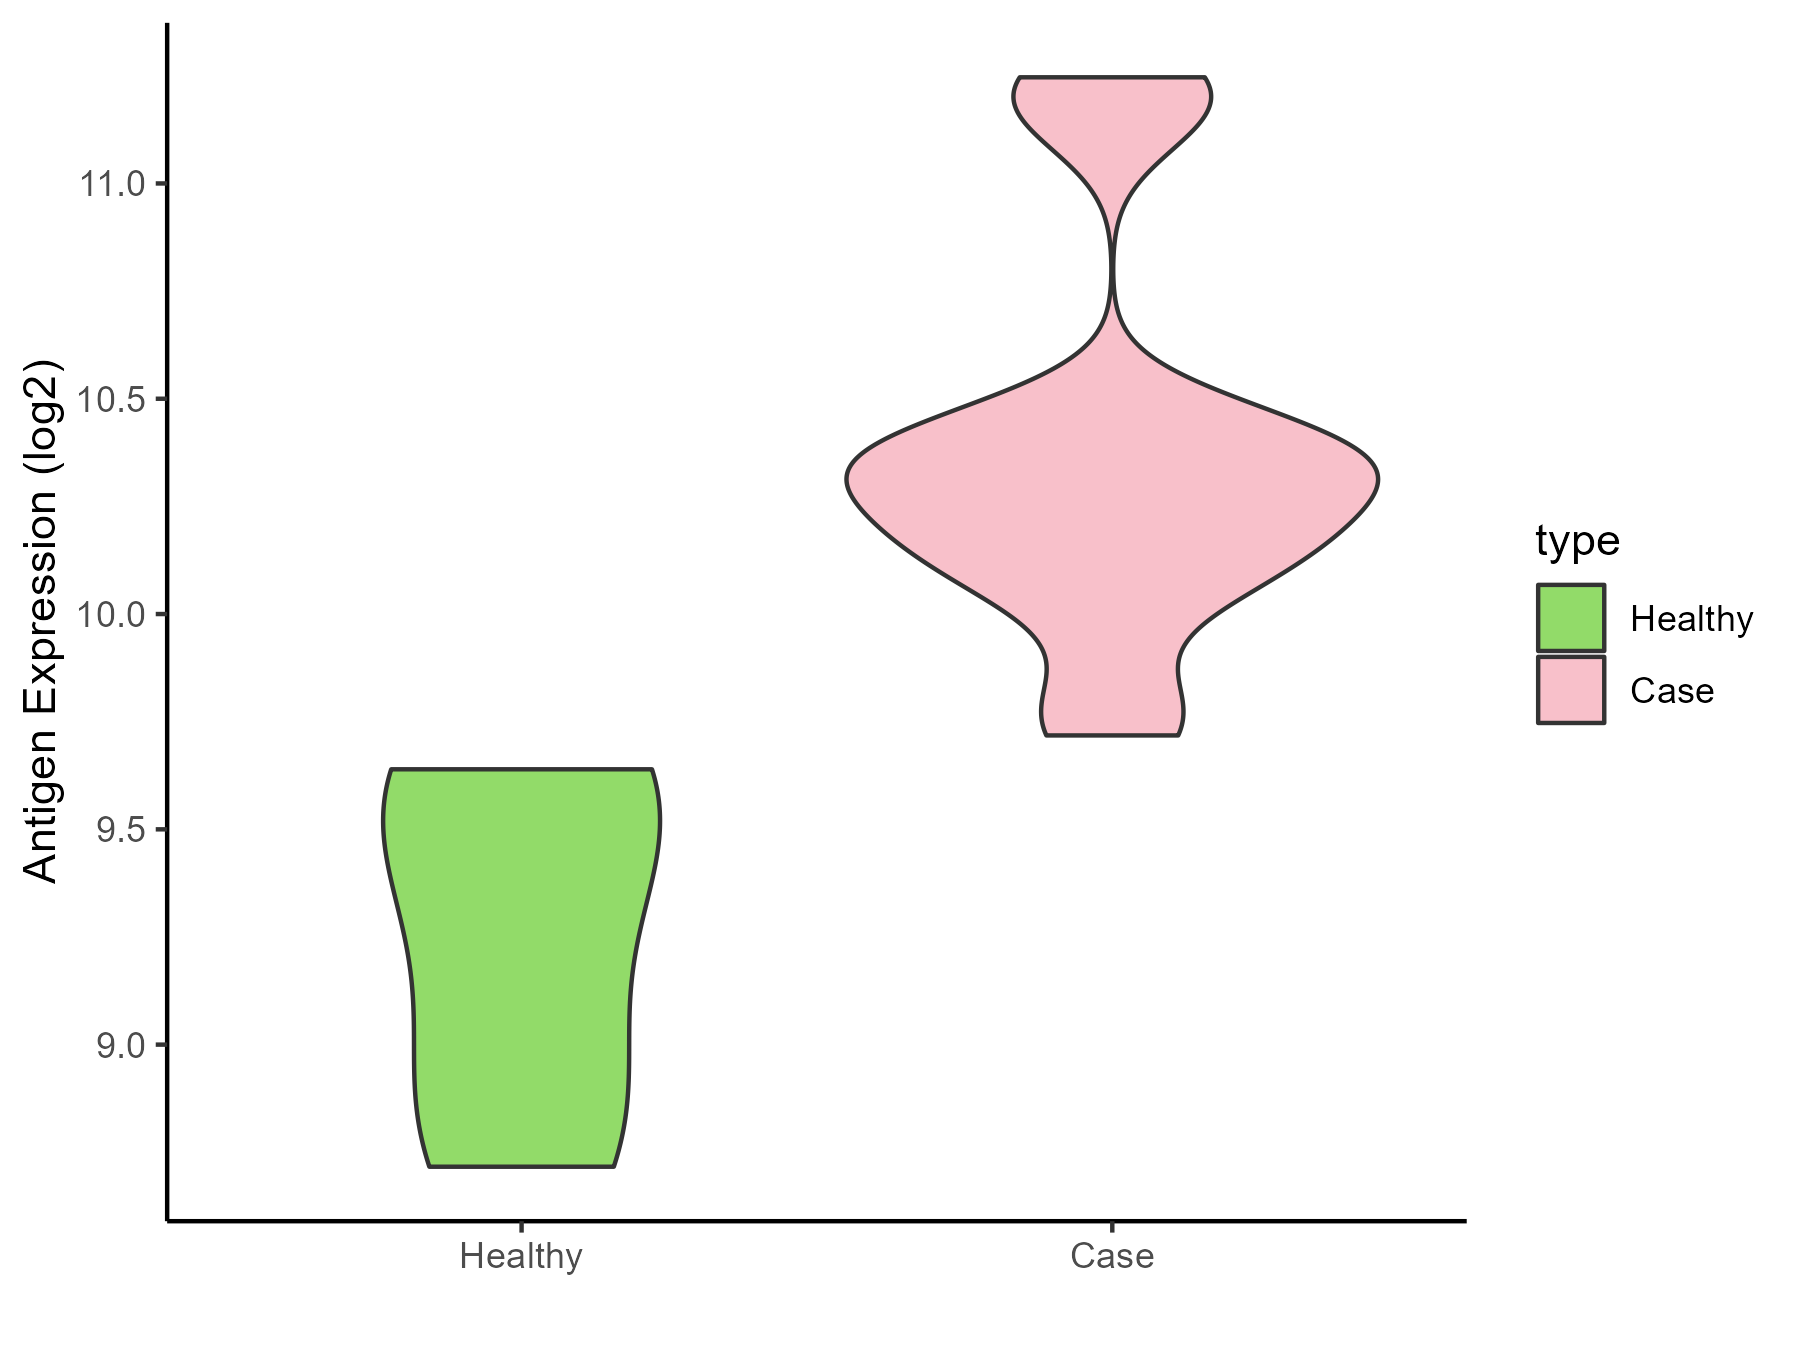
Pancreatic cancer [ICD-11: 2C10]
Click to Show/Hide
| Differential expression pattern of antigen in diseases |
| The Studied Tissue |
Pancreas |
| The Specific Disease |
Pancreatic cancer |
| The Expression Level of Disease Section Compare with the Healthy Individual Tissue |
p-value: 9.37E-07;
Fold-change: 1.637616007;
Z-score: 1.849542899
|
| The Expression Level of Disease Section Compare with the Adjacent Tissue |
p-value: 1.93E-23;
Fold-change: 1.827354003;
Z-score: 2.29013514
|
| Disease-specific Antigen Abundances |
|
Click to View the Clearer Original Diagram
|
|
|
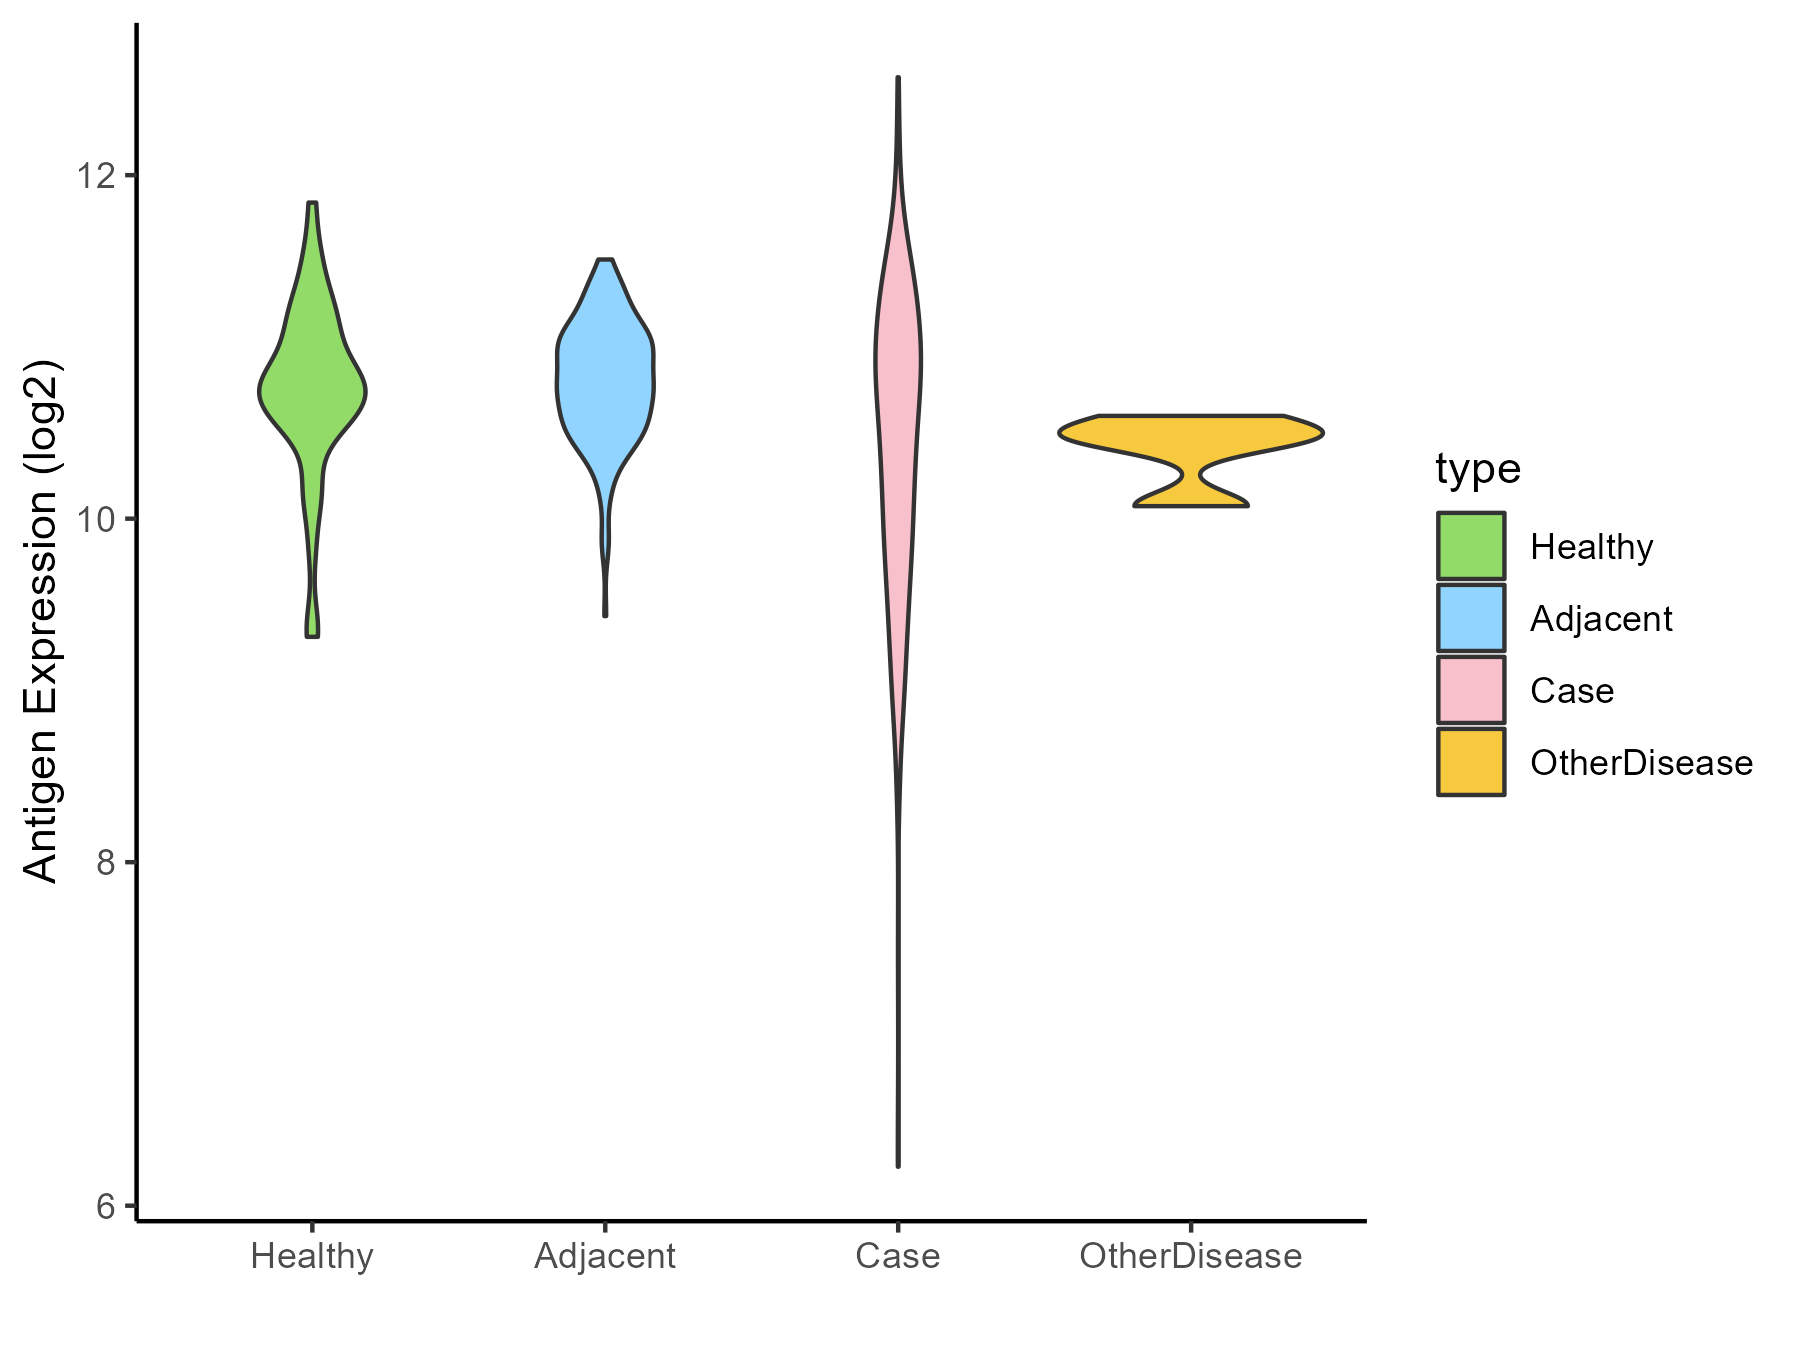
Liver cancer [ICD-11: 2C12]
Click to Show/Hide
| Differential expression pattern of antigen in diseases |
| The Studied Tissue |
Liver |
| The Specific Disease |
Liver cancer |
| The Expression Level of Disease Section Compare with the Healthy Individual Tissue |
p-value: 0.000893792;
Fold-change: -0.190076736;
Z-score: -0.374925915
|
| The Expression Level of Disease Section Compare with the Adjacent Tissue |
p-value: 9.89E-12;
Fold-change: -0.224052365;
Z-score: -0.641085137
|
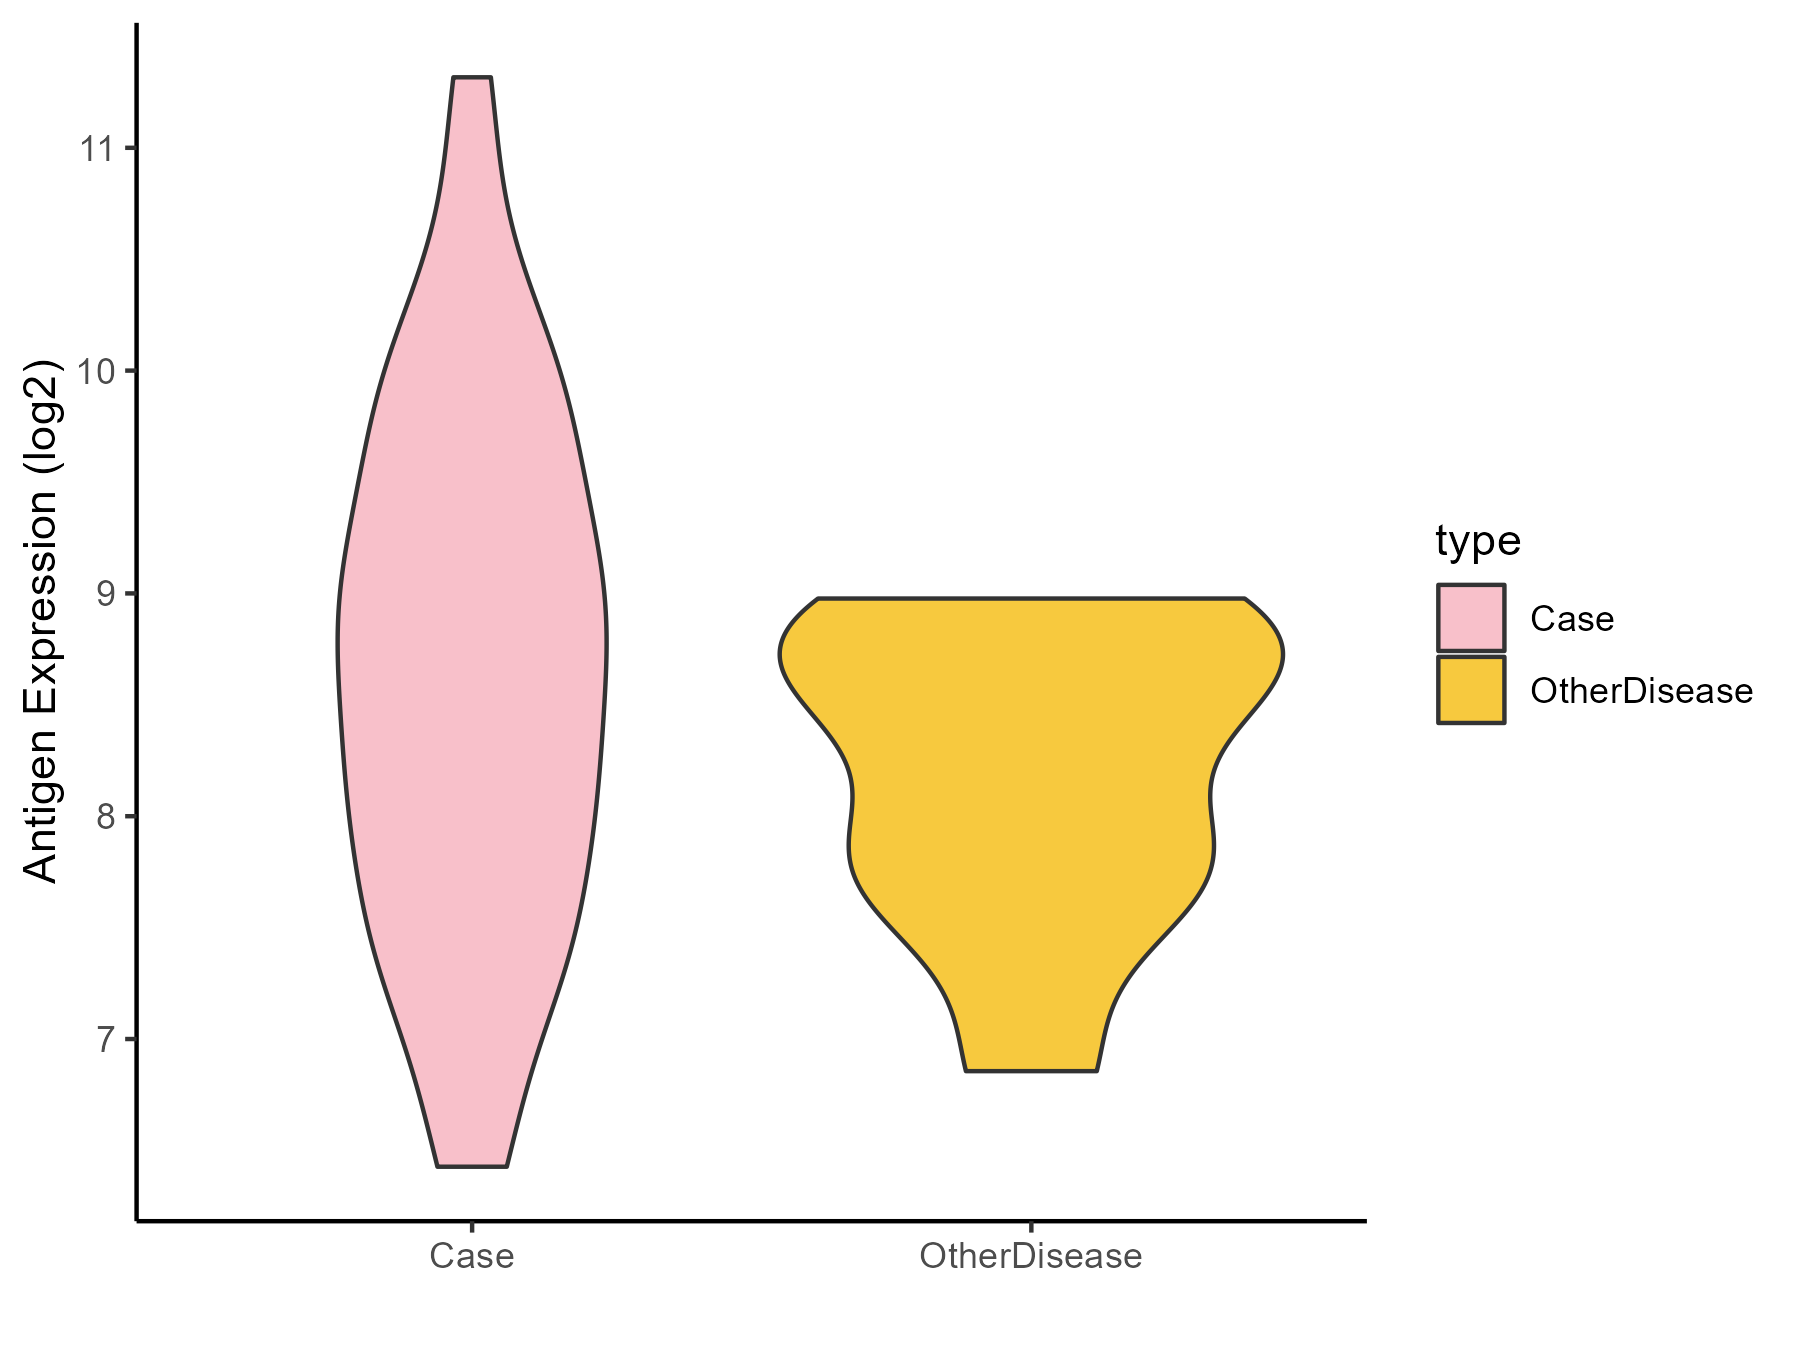
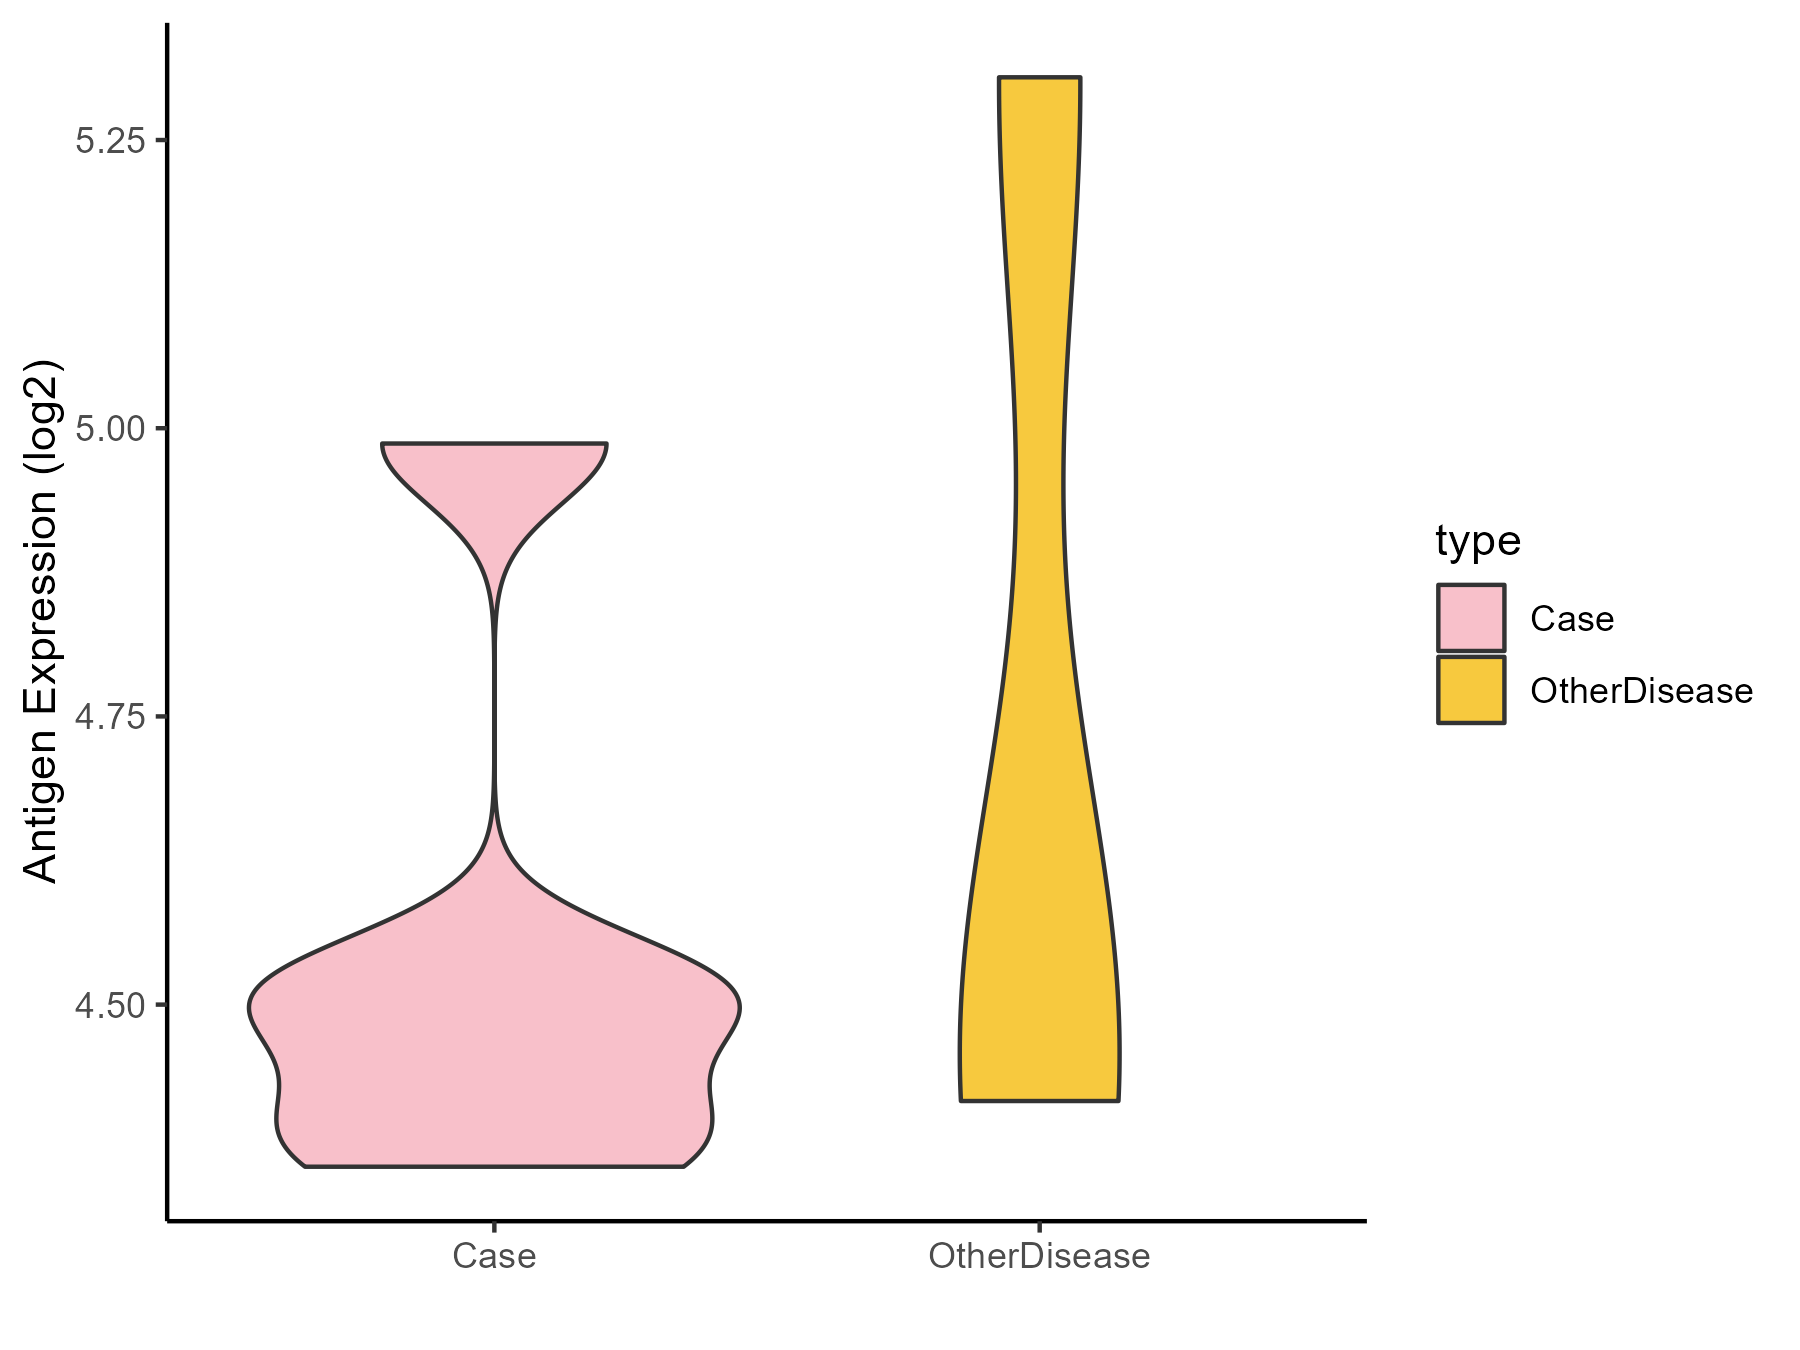
| The Expression Level of Disease Section Compare with the Other Disease Section |
p-value: 0.734542024;
Fold-change: 0.116924847;
Z-score: 0.510623946
|
| Disease-specific Antigen Abundances |
|
Click to View the Clearer Original Diagram
|
|
|
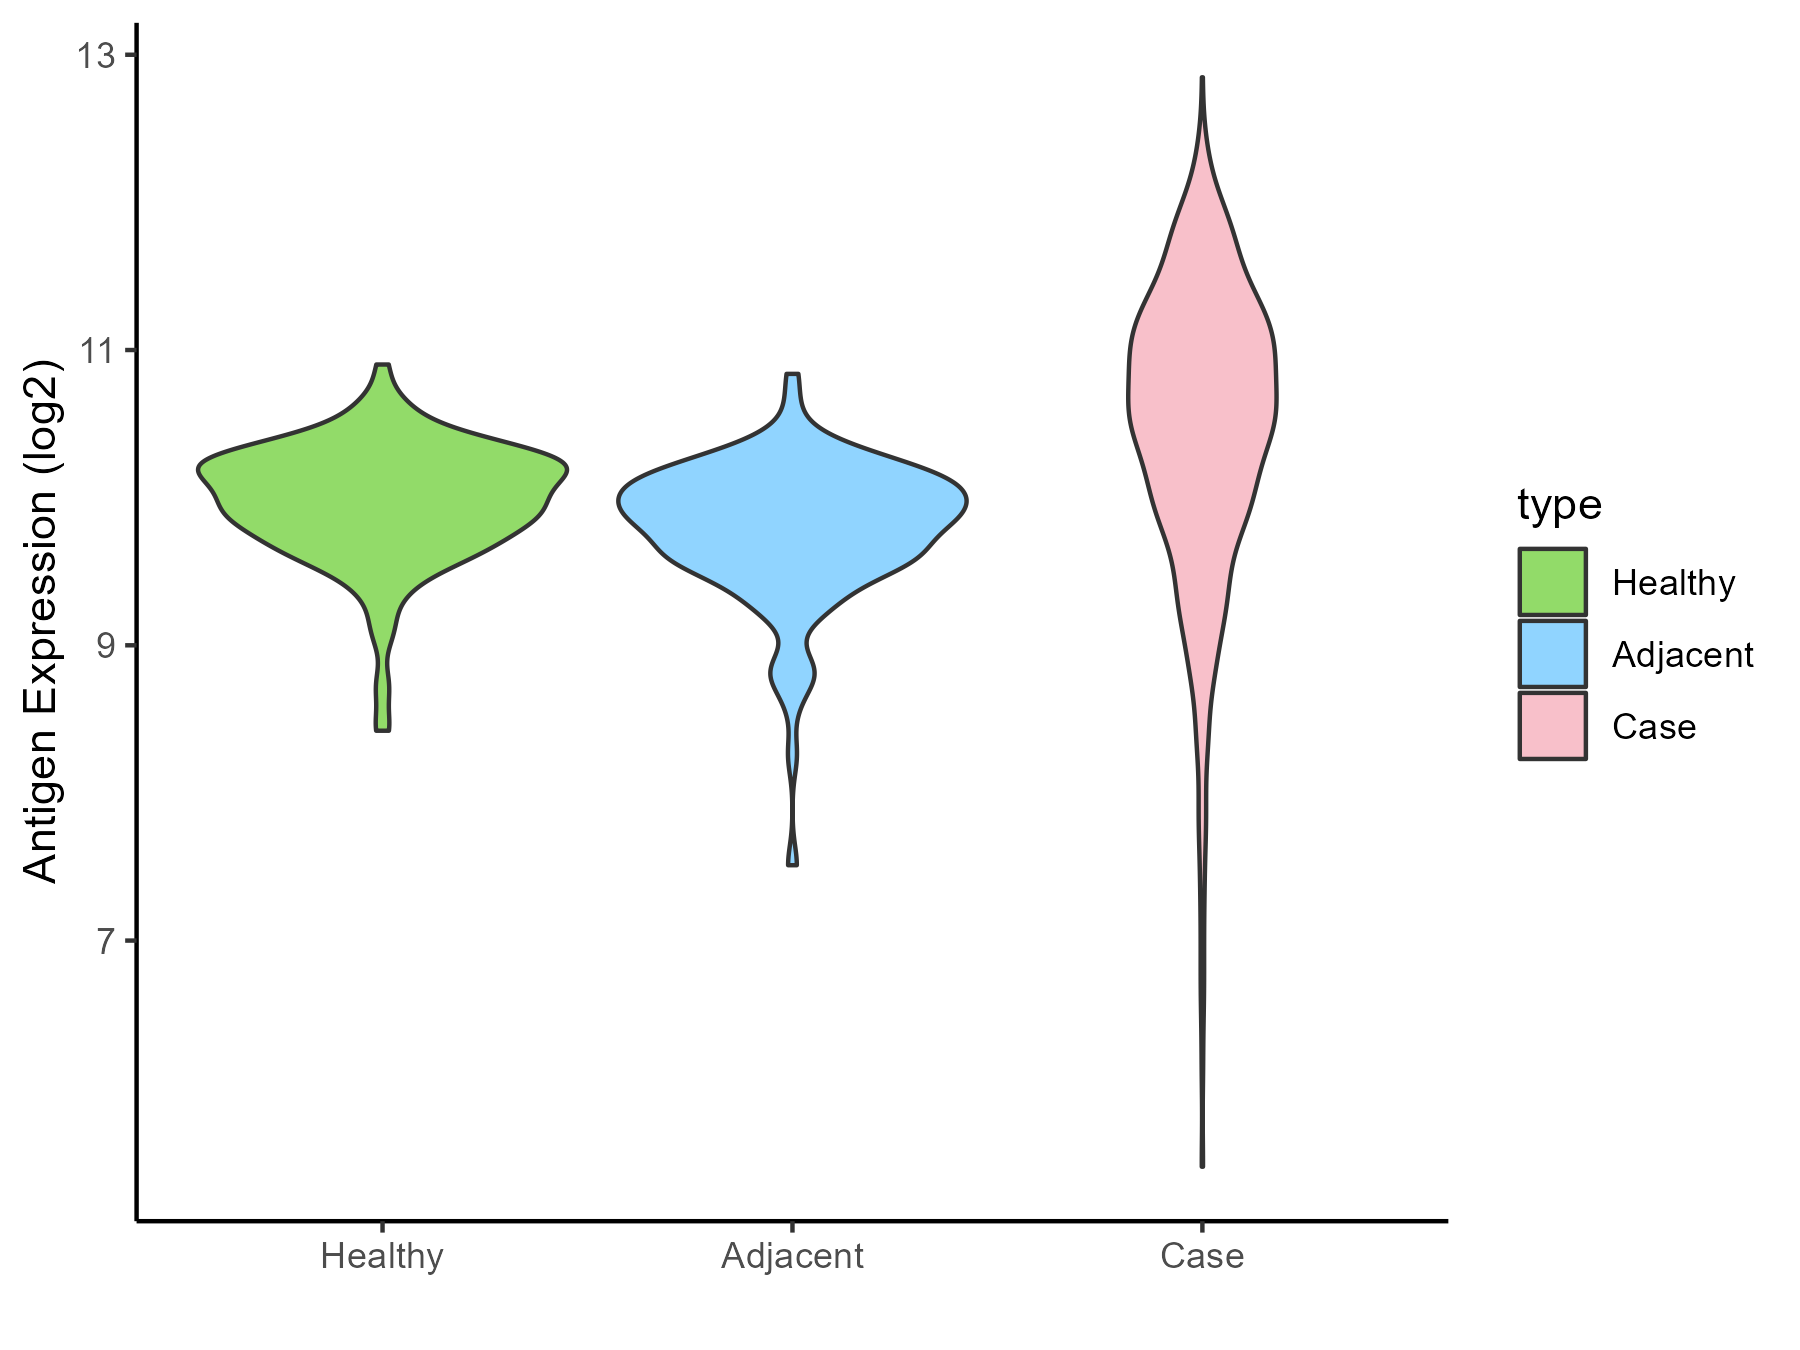
Lung cancer [ICD-11: 2C25]
Click to Show/Hide
| Differential expression pattern of antigen in diseases |
| The Studied Tissue |
Lung |
| The Specific Disease |
Lung cancer |
| The Expression Level of Disease Section Compare with the Healthy Individual Tissue |
p-value: 2.40E-28;
Fold-change: 0.584429407;
Z-score: 1.494462129
|
| The Expression Level of Disease Section Compare with the Adjacent Tissue |
p-value: 3.08E-29;
Fold-change: 0.747969719;
Z-score: 1.594218476
|
| Disease-specific Antigen Abundances |
|
Click to View the Clearer Original Diagram
|
|
|
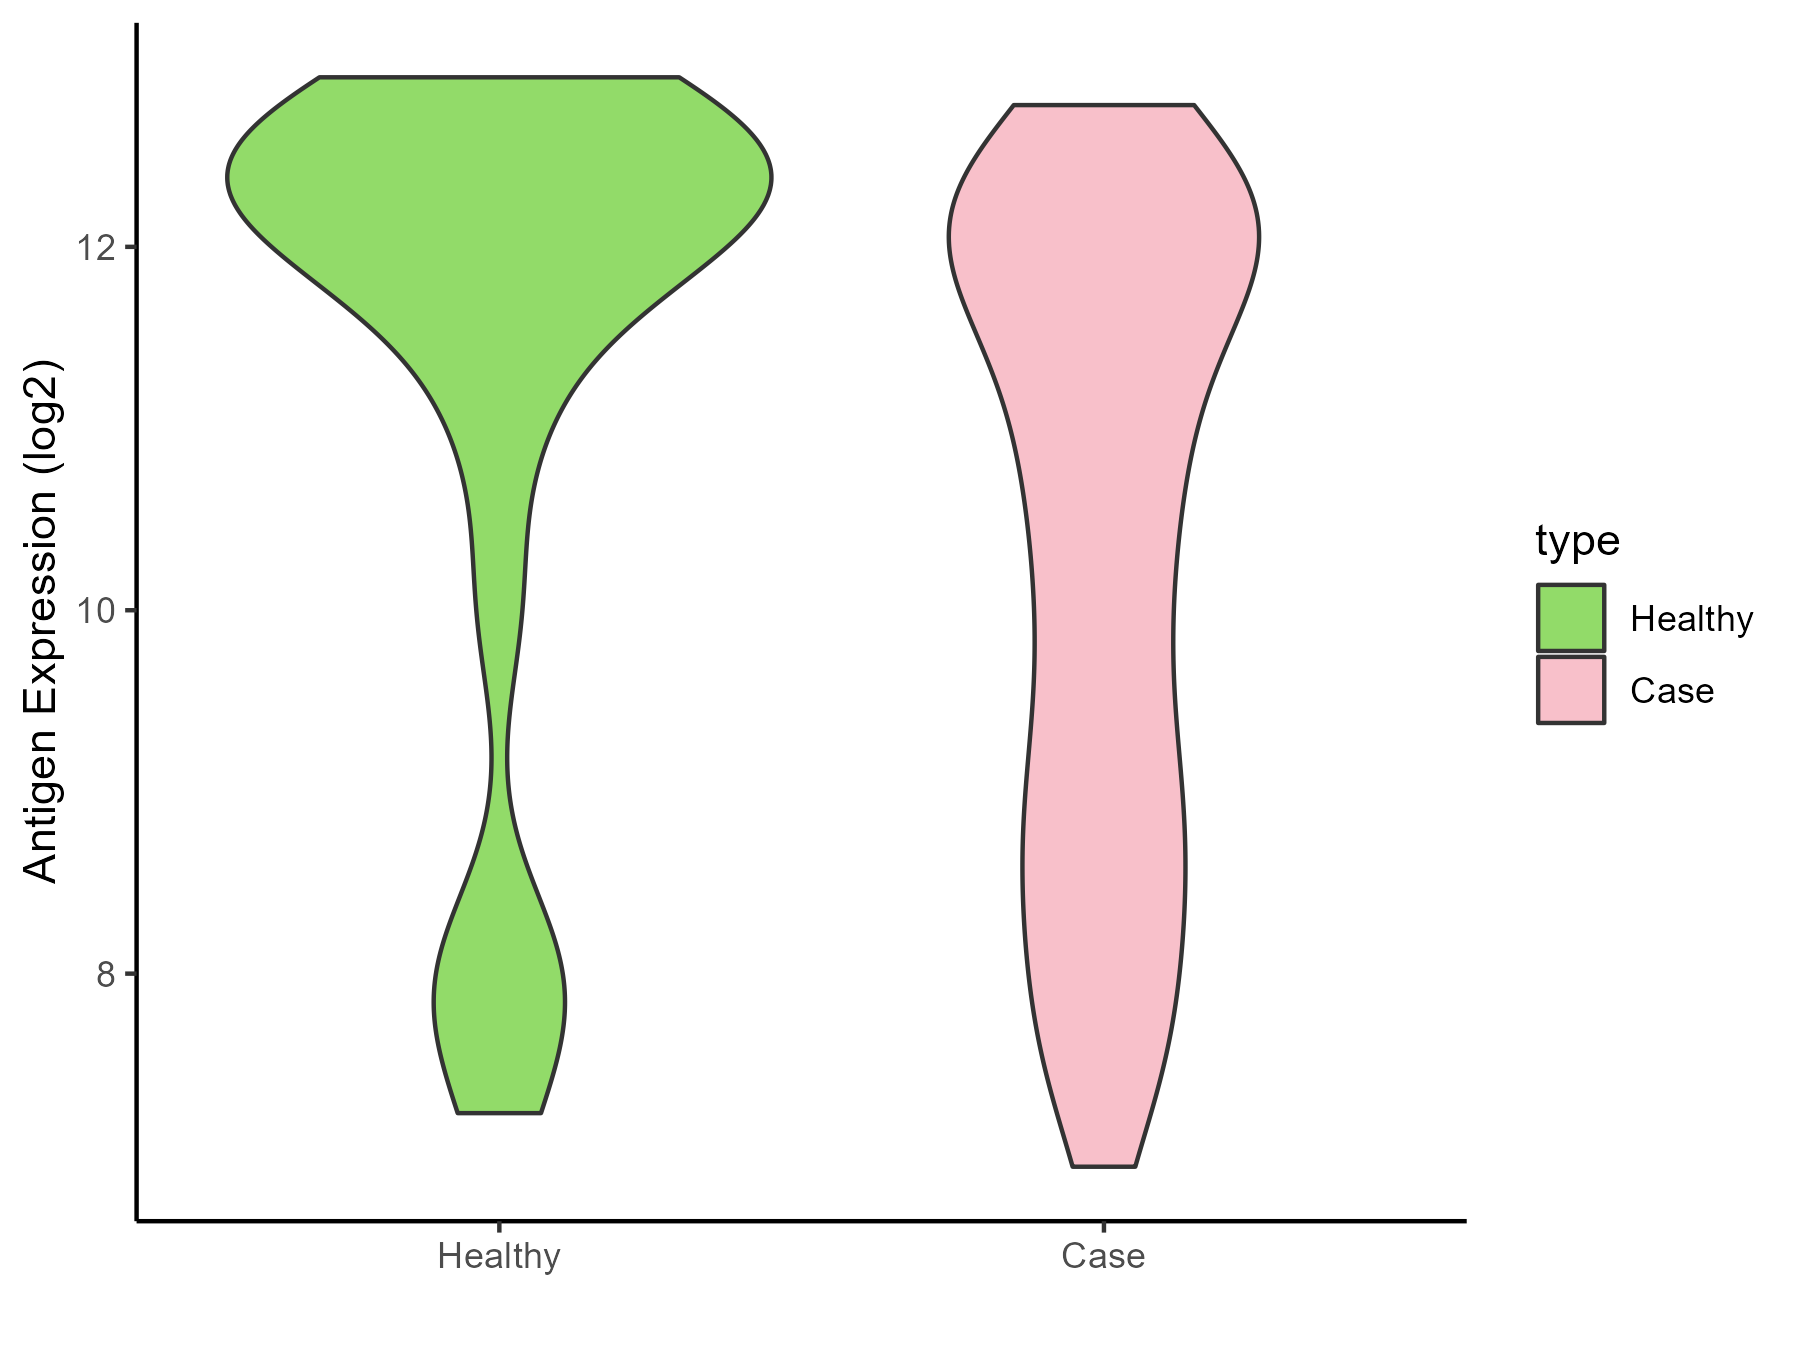
Melanoma [ICD-11: 2C30]
Click to Show/Hide
| Differential expression pattern of antigen in diseases |
| The Studied Tissue |
Skin |
| The Specific Disease |
Melanoma |
| The Expression Level of Disease Section Compare with the Healthy Individual Tissue |
p-value: 0.025150119;
Fold-change: -1.401983326;
Z-score: -0.773294395
|
| Disease-specific Antigen Abundances |
|
Click to View the Clearer Original Diagram
|
|
|
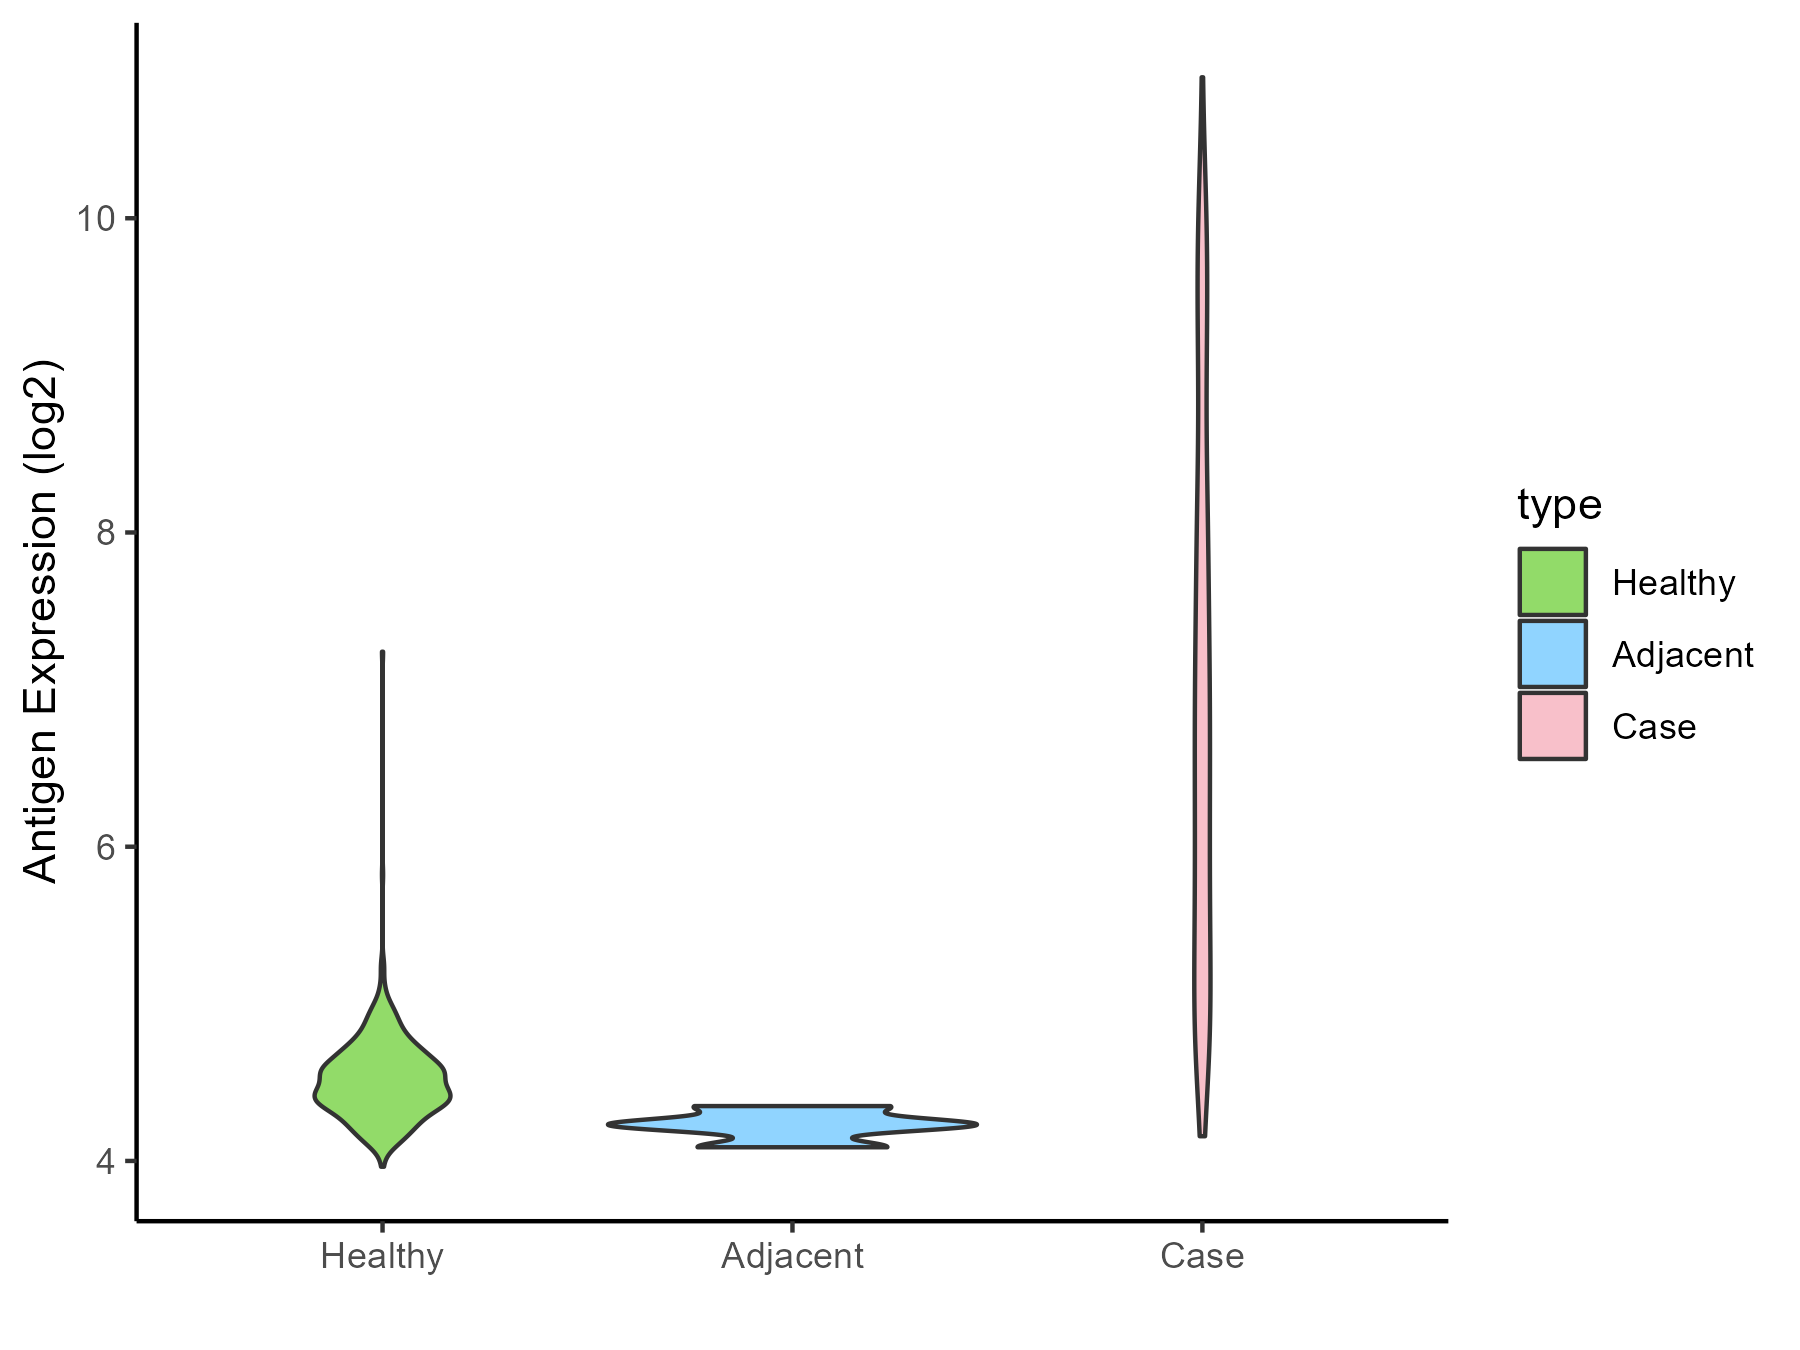
Sarcoma [ICD-11: 2C35]
Click to Show/Hide
| Differential expression pattern of antigen in diseases |
| The Studied Tissue |
Muscle |
| The Specific Disease |
Sarcoma |
| The Expression Level of Disease Section Compare with the Healthy Individual Tissue |
p-value: 2.04E-140;
Fold-change: 2.305899409;
Z-score: 8.784569166
|
| The Expression Level of Disease Section Compare with the Adjacent Tissue |
p-value: 2.22E-20;
Fold-change: 2.56460858;
Z-score: 23.84474651
|
| Disease-specific Antigen Abundances |
|
Click to View the Clearer Original Diagram
|
|
|
Breast cancer [ICD-11: 2C60]
Click to Show/Hide
| Differential expression pattern of antigen in diseases |
| The Studied Tissue |
Breast |
| The Specific Disease |
Breast cancer |
| The Expression Level of Disease Section Compare with the Healthy Individual Tissue |
p-value: 6.27E-73;
Fold-change: 1.419066558;
Z-score: 1.373004701
|
| The Expression Level of Disease Section Compare with the Adjacent Tissue |
p-value: 4.61E-13;
Fold-change: 1.321078824;
Z-score: 1.350788881
|
| Disease-specific Antigen Abundances |
|
Click to View the Clearer Original Diagram
|
|
|
Ovarian cancer [ICD-11: 2C73]
Click to Show/Hide
| Differential expression pattern of antigen in diseases |
| The Studied Tissue |
Ovarian |
| The Specific Disease |
Ovarian cancer |
| The Expression Level of Disease Section Compare with the Healthy Individual Tissue |
p-value: 4.17E-07;
Fold-change: 2.122237653;
Z-score: 4.655151952
|
| The Expression Level of Disease Section Compare with the Adjacent Tissue |
p-value: 0.065881537;
Fold-change: 0.615988745;
Z-score: 0.367538089
|
| Disease-specific Antigen Abundances |
|
Click to View the Clearer Original Diagram
|
|
|
Cervical cancer [ICD-11: 2C77]
Click to Show/Hide
| Differential expression pattern of antigen in diseases |
| The Studied Tissue |
Cervical |
| The Specific Disease |
Cervical cancer |
| The Expression Level of Disease Section Compare with the Healthy Individual Tissue |
p-value: 0.000692169;
Fold-change: -0.258951024;
Z-score: -0.795637831
|
| Disease-specific Antigen Abundances |
|
Click to View the Clearer Original Diagram
|
|
|
Uterine cancer [ICD-11: 2C78]
Click to Show/Hide
| Differential expression pattern of antigen in diseases |
| The Studied Tissue |
Endometrium |
| The Specific Disease |
Uterine cancer |
| The Expression Level of Disease Section Compare with the Healthy Individual Tissue |
p-value: 4.95E-08;
Fold-change: 1.005558068;
Z-score: 0.640349825
|
| The Expression Level of Disease Section Compare with the Adjacent Tissue |
p-value: 0.002494071;
Fold-change: 0.706202955;
Z-score: 1.762660543
|
| Disease-specific Antigen Abundances |
|
Click to View the Clearer Original Diagram
|
|
|
Prostate cancer [ICD-11: 2C82]
Click to Show/Hide
| Differential expression pattern of antigen in diseases |
| The Studied Tissue |
Prostate |
| The Specific Disease |
Prostate cancer |
| The Expression Level of Disease Section Compare with the Healthy Individual Tissue |
p-value: 0.002428339;
Fold-change: -0.087346598;
Z-score: -0.119872007
|
| Disease-specific Antigen Abundances |
|
Click to View the Clearer Original Diagram
|
|
|
Bladder cancer [ICD-11: 2C94]
Click to Show/Hide
| Differential expression pattern of antigen in diseases |
| The Studied Tissue |
Bladder |
| The Specific Disease |
Bladder cancer |
| The Expression Level of Disease Section Compare with the Healthy Individual Tissue |
p-value: 0.675520597;
Fold-change: 0.148247437;
Z-score: 0.223562619
|
| Disease-specific Antigen Abundances |
|
Click to View the Clearer Original Diagram
|
|
|
Retina cancer [ICD-11: 2D02]
Click to Show/Hide
| Differential expression pattern of antigen in diseases |
| The Studied Tissue |
Uvea |
| The Specific Disease |
Retinoblastoma tumor |
| The Expression Level of Disease Section Compare with the Healthy Individual Tissue |
p-value: 7.17E-05;
Fold-change: 0.863525048;
Z-score: 5.430371399
|
| Disease-specific Antigen Abundances |
|
Click to View the Clearer Original Diagram
|
|
|
Thyroid cancer [ICD-11: 2D10]
Click to Show/Hide
| Differential expression pattern of antigen in diseases |
| The Studied Tissue |
Thyroid |
| The Specific Disease |
Thyroid cancer |
| The Expression Level of Disease Section Compare with the Healthy Individual Tissue |
p-value: 1.06E-08;
Fold-change: 0.384678206;
Z-score: 0.859051249
|
| The Expression Level of Disease Section Compare with the Adjacent Tissue |
p-value: 1.13E-05;
Fold-change: 0.63063012;
Z-score: 0.983815551
|
| Disease-specific Antigen Abundances |
|
Click to View the Clearer Original Diagram
|
|
|
Adrenal cancer [ICD-11: 2D11]
Click to Show/Hide
| Differential expression pattern of antigen in diseases |
| The Studied Tissue |
Adrenal cortex |
| The Specific Disease |
Adrenocortical carcinoma |
| The Expression Level of Disease Section Compare with the Other Disease Section |
p-value: 0.027570299;
Fold-change: 0.284267841;
Z-score: 0.409663152
|
| Disease-specific Antigen Abundances |
|
Click to View the Clearer Original Diagram
|
|
|
Head and neck cancer [ICD-11: 2D42]
Click to Show/Hide
| Differential expression pattern of antigen in diseases |
| The Studied Tissue |
Head and neck |
| The Specific Disease |
Head and neck cancer |
| The Expression Level of Disease Section Compare with the Healthy Individual Tissue |
p-value: 5.81E-07;
Fold-change: 0.606945128;
Z-score: 0.713648944
|
| Disease-specific Antigen Abundances |
|
Click to View the Clearer Original Diagram
|
|
|
Pituitary cancer [ICD-11: 2F37]
Click to Show/Hide
| Differential expression pattern of antigen in diseases |
| The Studied Tissue |
Pituitary |
| The Specific Disease |
Pituitary gonadotrope tumor |
| The Expression Level of Disease Section Compare with the Healthy Individual Tissue |
p-value: 0.714827919;
Fold-change: -0.125802715;
Z-score: -0.529530419
|
| Disease-specific Antigen Abundances |
|
Click to View the Clearer Original Diagram
|
|
|
| The Studied Tissue |
Pituitary |
| The Specific Disease |
Pituitary cancer |
| The Expression Level of Disease Section Compare with the Healthy Individual Tissue |
p-value: 0.01417975;
Fold-change: 0.221577786;
Z-score: 0.908547174
|
| Disease-specific Antigen Abundances |
|
Click to View the Clearer Original Diagram
|
|
|
ICD Disease Classification 03
Click to Show/Hide the 1 Disease of This Class
Thrombocytopenia [ICD-11: 3B64]
Click to Show/Hide
| Differential expression pattern of antigen in diseases |
| The Studied Tissue |
Whole blood |
| The Specific Disease |
Thrombocytopenia |
| The Expression Level of Disease Section Compare with the Healthy Individual Tissue |
p-value: 0.055015081;
Fold-change: 0.461904158;
Z-score: 1.653110626
|
| Disease-specific Antigen Abundances |
|
Click to View the Clearer Original Diagram
|
|
|
ICD Disease Classification 04
Click to Show/Hide the 2 Disease of This Class
Lupus erythematosus [ICD-11: 4A40]
Click to Show/Hide
| Differential expression pattern of antigen in diseases |
| The Studied Tissue |
Whole blood |
| The Specific Disease |
Lupus erythematosus |
| The Expression Level of Disease Section Compare with the Healthy Individual Tissue |
p-value: 4.84E-08;
Fold-change: 0.140704615;
Z-score: 0.470010298
|
| Disease-specific Antigen Abundances |
|
Click to View the Clearer Original Diagram
|
|
|
Autoimmune disease [ICD-11: 4A4Z]
Click to Show/Hide
| Differential expression pattern of antigen in diseases |
| The Studied Tissue |
Peripheral monocyte |
| The Specific Disease |
Autoimmune uveitis |
| The Expression Level of Disease Section Compare with the Healthy Individual Tissue |
p-value: 0.016176617;
Fold-change: -0.14109845;
Z-score: -1.200254354
|
| Disease-specific Antigen Abundances |
|
Click to View the Clearer Original Diagram
|
|
|
ICD Disease Classification 05
Click to Show/Hide the 1 Disease of This Class
Hyperlipoproteinaemia [ICD-11: 5C80]
Click to Show/Hide
| Differential expression pattern of antigen in diseases |
| The Studied Tissue |
Whole blood |
| The Specific Disease |
Familial hypercholesterolemia |
| The Expression Level of Disease Section Compare with the Healthy Individual Tissue |
p-value: 0.000164376;
Fold-change: -0.348398104;
Z-score: -1.198979054
|
| Disease-specific Antigen Abundances |
|
Click to View the Clearer Original Diagram
|
|
|
ICD Disease Classification 06
Click to Show/Hide the 1 Disease of This Class
Schizophrenia [ICD-11: 6A20]
Click to Show/Hide
| Differential expression pattern of antigen in diseases |
| The Studied Tissue |
Superior temporal cortex |
| The Specific Disease |
Schizophrenia |
| The Expression Level of Disease Section Compare with the Healthy Individual Tissue |
p-value: 0.207636291;
Fold-change: -0.067020709;
Z-score: -0.71375319
|
| Disease-specific Antigen Abundances |
|
Click to View the Clearer Original Diagram
|
|
|
ICD Disease Classification 08
Click to Show/Hide the 3 Disease of This Class
Multiple sclerosis [ICD-11: 8A40]
Click to Show/Hide
| Differential expression pattern of antigen in diseases |
| The Studied Tissue |
Spinal cord |
| The Specific Disease |
Multiple sclerosis |
| The Expression Level of Disease Section Compare with the Adjacent Tissue |
p-value: 0.062792544;
Fold-change: -0.172216865;
Z-score: -0.466004246
|
| Disease-specific Antigen Abundances |
|
Click to View the Clearer Original Diagram
|
|
|
| The Studied Tissue |
Plasmacytoid dendritic cells |
| The Specific Disease |
Multiple sclerosis |
| The Expression Level of Disease Section Compare with the Healthy Individual Tissue |
p-value: 0.823804203;
Fold-change: -0.024517295;
Z-score: -0.081199326
|
| Disease-specific Antigen Abundances |
|
Click to View the Clearer Original Diagram
|
|
|
Epilepsy [ICD-11: 8A60]
Click to Show/Hide
| Differential expression pattern of antigen in diseases |
| The Studied Tissue |
Peritumoral cortex |
| The Specific Disease |
Epilepsy |
| The Expression Level of Disease Section Compare with the Other Disease Section |
p-value: 0.592682896;
Fold-change: 0.009197339;
Z-score: 0.018726126
|
| Disease-specific Antigen Abundances |
|
Click to View the Clearer Original Diagram
|
|
|
Cerebral ischaemic stroke [ICD-11: 8B11]
Click to Show/Hide
| Differential expression pattern of antigen in diseases |
| The Studied Tissue |
Whole blood |
| The Specific Disease |
Cardioembolic Stroke |
| The Expression Level of Disease Section Compare with the Healthy Individual Tissue |
p-value: 0.002255019;
Fold-change: 0.138023775;
Z-score: 0.553399747
|
| Disease-specific Antigen Abundances |
|
Click to View the Clearer Original Diagram
|
|
|
| The Studied Tissue |
Peripheral blood |
| The Specific Disease |
Ischemic stroke |
| The Expression Level of Disease Section Compare with the Healthy Individual Tissue |
p-value: 0.796599739;
Fold-change: 0.051501199;
Z-score: 0.369998915
|
| Disease-specific Antigen Abundances |
|
Click to View the Clearer Original Diagram
|
|
|
ICD Disease Classification 1
Click to Show/Hide the 6 Disease of This Class
HIV [ICD-11: 1C60-1C62]
Click to Show/Hide
| Differential expression pattern of antigen in diseases |
| The Studied Tissue |
White matter |
| The Specific Disease |
HIV |
| The Expression Level of Disease Section Compare with the Healthy Individual Tissue |
p-value: 0.167447721;
Fold-change: 0.043526892;
Z-score: 0.455350333
|
| Disease-specific Antigen Abundances |
|
Click to View the Clearer Original Diagram
|
|
|
Influenza [ICD-11: 1E30]
Click to Show/Hide
| Differential expression pattern of antigen in diseases |
| The Studied Tissue |
Whole blood |
| The Specific Disease |
Influenza |
| The Expression Level of Disease Section Compare with the Healthy Individual Tissue |
p-value: 0.027263563;
Fold-change: 0.184899853;
Z-score: 3.64057613
|
| Disease-specific Antigen Abundances |
|
Click to View the Clearer Original Diagram
|
|
|
Chronic hepatitis C [ICD-11: 1E51.1]
Click to Show/Hide
| Differential expression pattern of antigen in diseases |
| The Studied Tissue |
Whole blood |
| The Specific Disease |
Chronic hepatitis C |
| The Expression Level of Disease Section Compare with the Healthy Individual Tissue |
p-value: 0.006742793;
Fold-change: 0.102728582;
Z-score: 0.973547288
|
| Disease-specific Antigen Abundances |
|
Click to View the Clearer Original Diagram
|
|
|
Sepsis [ICD-11: 1G40-1G41]
Click to Show/Hide
| Differential expression pattern of antigen in diseases |
| The Studied Tissue |
Whole blood |
| The Specific Disease |
Sepsis |
| The Expression Level of Disease Section Compare with the Healthy Individual Tissue |
p-value: 0.713816746;
Fold-change: -0.024146943;
Z-score: -0.105615846
|
| Disease-specific Antigen Abundances |
|
Click to View the Clearer Original Diagram
|
|
|
Septic shock [ICD-11: 1G41]
Click to Show/Hide
| Differential expression pattern of antigen in diseases |
| The Studied Tissue |
Whole blood |
| The Specific Disease |
Septic shock |
| The Expression Level of Disease Section Compare with the Healthy Individual Tissue |
p-value: 1.22E-06;
Fold-change: 0.064444426;
Z-score: 0.262648822
|
| Disease-specific Antigen Abundances |
|
Click to View the Clearer Original Diagram
|
|
|
Pediatric respiratory syncytial virus infection [ICD-11: CA40.11]
Click to Show/Hide
| Differential expression pattern of antigen in diseases |
| The Studied Tissue |
Peripheral blood |
| The Specific Disease |
Pediatric respiratory syncytial virus infection |
| The Expression Level of Disease Section Compare with the Healthy Individual Tissue |
p-value: 0.063947198;
Fold-change: 0.053623094;
Z-score: 0.390315441
|
| Disease-specific Antigen Abundances |
|
Click to View the Clearer Original Diagram
|
|
|
ICD Disease Classification 11
Click to Show/Hide the 6 Disease of This Class
Essential hypertension [ICD-11: BA00]
Click to Show/Hide
| Differential expression pattern of antigen in diseases |
| The Studied Tissue |
Peripheral blood |
| The Specific Disease |
Essential hypertension |
| The Expression Level of Disease Section Compare with the Healthy Individual Tissue |
p-value: 0.372897058;
Fold-change: 0.378464302;
Z-score: 2.854753007
|
| Disease-specific Antigen Abundances |
|
Click to View the Clearer Original Diagram
|
|
|
Myocardial infarction [ICD-11: BA41]
Click to Show/Hide
| Differential expression pattern of antigen in diseases |
| The Studied Tissue |
Peripheral blood |
| The Specific Disease |
Myocardial infarction |
| The Expression Level of Disease Section Compare with the Healthy Individual Tissue |
p-value: 0.539831727;
Fold-change: 0.057221519;
Z-score: 0.091499788
|
| Disease-specific Antigen Abundances |
|
Click to View the Clearer Original Diagram
|
|
|
Coronary artery disease [ICD-11: BA8Z]
Click to Show/Hide
| Differential expression pattern of antigen in diseases |
| The Studied Tissue |
Peripheral blood |
| The Specific Disease |
Coronary artery disease |
| The Expression Level of Disease Section Compare with the Healthy Individual Tissue |
p-value: 0.82601391;
Fold-change: 0.070285938;
Z-score: 0.391424839
|
| Disease-specific Antigen Abundances |
|
Click to View the Clearer Original Diagram
|
|
|
Aortic stenosis [ICD-11: BB70]
Click to Show/Hide
| Differential expression pattern of antigen in diseases |
| The Studied Tissue |
Calcified aortic valve |
| The Specific Disease |
Aortic stenosis |
| The Expression Level of Disease Section Compare with the Healthy Individual Tissue |
p-value: 0.009293282;
Fold-change: 0.620883968;
Z-score: 1.639315271
|
| Disease-specific Antigen Abundances |
|
Click to View the Clearer Original Diagram
|
|
|
Arteriosclerosis [ICD-11: BD40]
Click to Show/Hide
| Differential expression pattern of antigen in diseases |
| The Studied Tissue |
Peripheral blood |
| The Specific Disease |
Arteriosclerosis |
| The Expression Level of Disease Section Compare with the Healthy Individual Tissue |
p-value: 0.474330546;
Fold-change: 0.031792414;
Z-score: 0.239878496
|
| Disease-specific Antigen Abundances |
|
Click to View the Clearer Original Diagram
|
|
|
Aneurysm [ICD-11: BD50]
Click to Show/Hide
| Differential expression pattern of antigen in diseases |
| The Studied Tissue |
Intracranial artery |
| The Specific Disease |
Aneurysm |
| The Expression Level of Disease Section Compare with the Healthy Individual Tissue |
p-value: 1.61E-06;
Fold-change: 1.27438611;
Z-score: 5.941272729
|
| Disease-specific Antigen Abundances |
|
Click to View the Clearer Original Diagram
|
|
|
ICD Disease Classification 12
Click to Show/Hide the 8 Disease of This Class
Immunodeficiency [ICD-11: 4A00-4A20]
Click to Show/Hide
| Differential expression pattern of antigen in diseases |
| The Studied Tissue |
Peripheral blood |
| The Specific Disease |
Immunodeficiency |
| The Expression Level of Disease Section Compare with the Healthy Individual Tissue |
p-value: 0.237386722;
Fold-change: 0.091450621;
Z-score: 0.8271442
|
| Disease-specific Antigen Abundances |
|
Click to View the Clearer Original Diagram
|
|
|
Apnea [ICD-11: 7A40]
Click to Show/Hide
| Differential expression pattern of antigen in diseases |
| The Studied Tissue |
Hyperplastic tonsil |
| The Specific Disease |
Apnea |
| The Expression Level of Disease Section Compare with the Healthy Individual Tissue |
p-value: 0.526941023;
Fold-change: -0.023990327;
Z-score: -0.043834743
|
| Disease-specific Antigen Abundances |
|
Click to View the Clearer Original Diagram
|
|
|
Olive pollen allergy [ICD-11: CA08.00]
Click to Show/Hide
| Differential expression pattern of antigen in diseases |
| The Studied Tissue |
Peripheral blood |
| The Specific Disease |
Olive pollen allergy |
| The Expression Level of Disease Section Compare with the Healthy Individual Tissue |
p-value: 0.642509194;
Fold-change: 0.145290102;
Z-score: 0.481829187
|
| Disease-specific Antigen Abundances |
|
Click to View the Clearer Original Diagram
|
|
|
Chronic rhinosinusitis [ICD-11: CA0A]
Click to Show/Hide
| Differential expression pattern of antigen in diseases |
| The Studied Tissue |
Sinus mucosa |
| The Specific Disease |
Chronic rhinosinusitis |
| The Expression Level of Disease Section Compare with the Healthy Individual Tissue |
p-value: 0.859678104;
Fold-change: -0.122672299;
Z-score: -0.265442252
|
| Disease-specific Antigen Abundances |
|
Click to View the Clearer Original Diagram
|
|
|
Chronic obstructive pulmonary disease [ICD-11: CA22]
Click to Show/Hide
| Differential expression pattern of antigen in diseases |
| The Studied Tissue |
Lung |
| The Specific Disease |
Chronic obstructive pulmonary disease |
| The Expression Level of Disease Section Compare with the Healthy Individual Tissue |
p-value: 0.097687157;
Fold-change: -0.104109618;
Z-score: -0.353798986
|
| Disease-specific Antigen Abundances |
|
Click to View the Clearer Original Diagram
|
|
|
| The Studied Tissue |
Small airway epithelium |
| The Specific Disease |
Chronic obstructive pulmonary disease |
| The Expression Level of Disease Section Compare with the Healthy Individual Tissue |
p-value: 0.069553457;
Fold-change: -0.070678261;
Z-score: -0.101305017
|
| Disease-specific Antigen Abundances |
|
Click to View the Clearer Original Diagram
|
|
|
Asthma [ICD-11: CA23]
Click to Show/Hide
| Differential expression pattern of antigen in diseases |
| The Studied Tissue |
Nasal and bronchial airway |
| The Specific Disease |
Asthma |
| The Expression Level of Disease Section Compare with the Healthy Individual Tissue |
p-value: 9.28E-07;
Fold-change: 0.672200955;
Z-score: 0.608082062
|
| Disease-specific Antigen Abundances |
|
Click to View the Clearer Original Diagram
|
|
|
Human rhinovirus infection [ICD-11: CA42]
Click to Show/Hide
| Differential expression pattern of antigen in diseases |
| The Studied Tissue |
Nasal Epithelium |
| The Specific Disease |
Human rhinovirus infection |
| The Expression Level of Disease Section Compare with the Healthy Individual Tissue |
p-value: 0.439506905;
Fold-change: 0.046506737;
Z-score: 0.132537511
|
| Disease-specific Antigen Abundances |
|
Click to View the Clearer Original Diagram
|
|
|
Idiopathic pulmonary fibrosis [ICD-11: CB03.4]
Click to Show/Hide
| Differential expression pattern of antigen in diseases |
| The Studied Tissue |
Lung |
| The Specific Disease |
Idiopathic pulmonary fibrosis |
| The Expression Level of Disease Section Compare with the Healthy Individual Tissue |
p-value: 0.001278483;
Fold-change: 0.997474378;
Z-score: 2.395371815
|
| Disease-specific Antigen Abundances |
|
Click to View the Clearer Original Diagram
|
|
|
ICD Disease Classification 13
Click to Show/Hide the 5 Disease of This Class
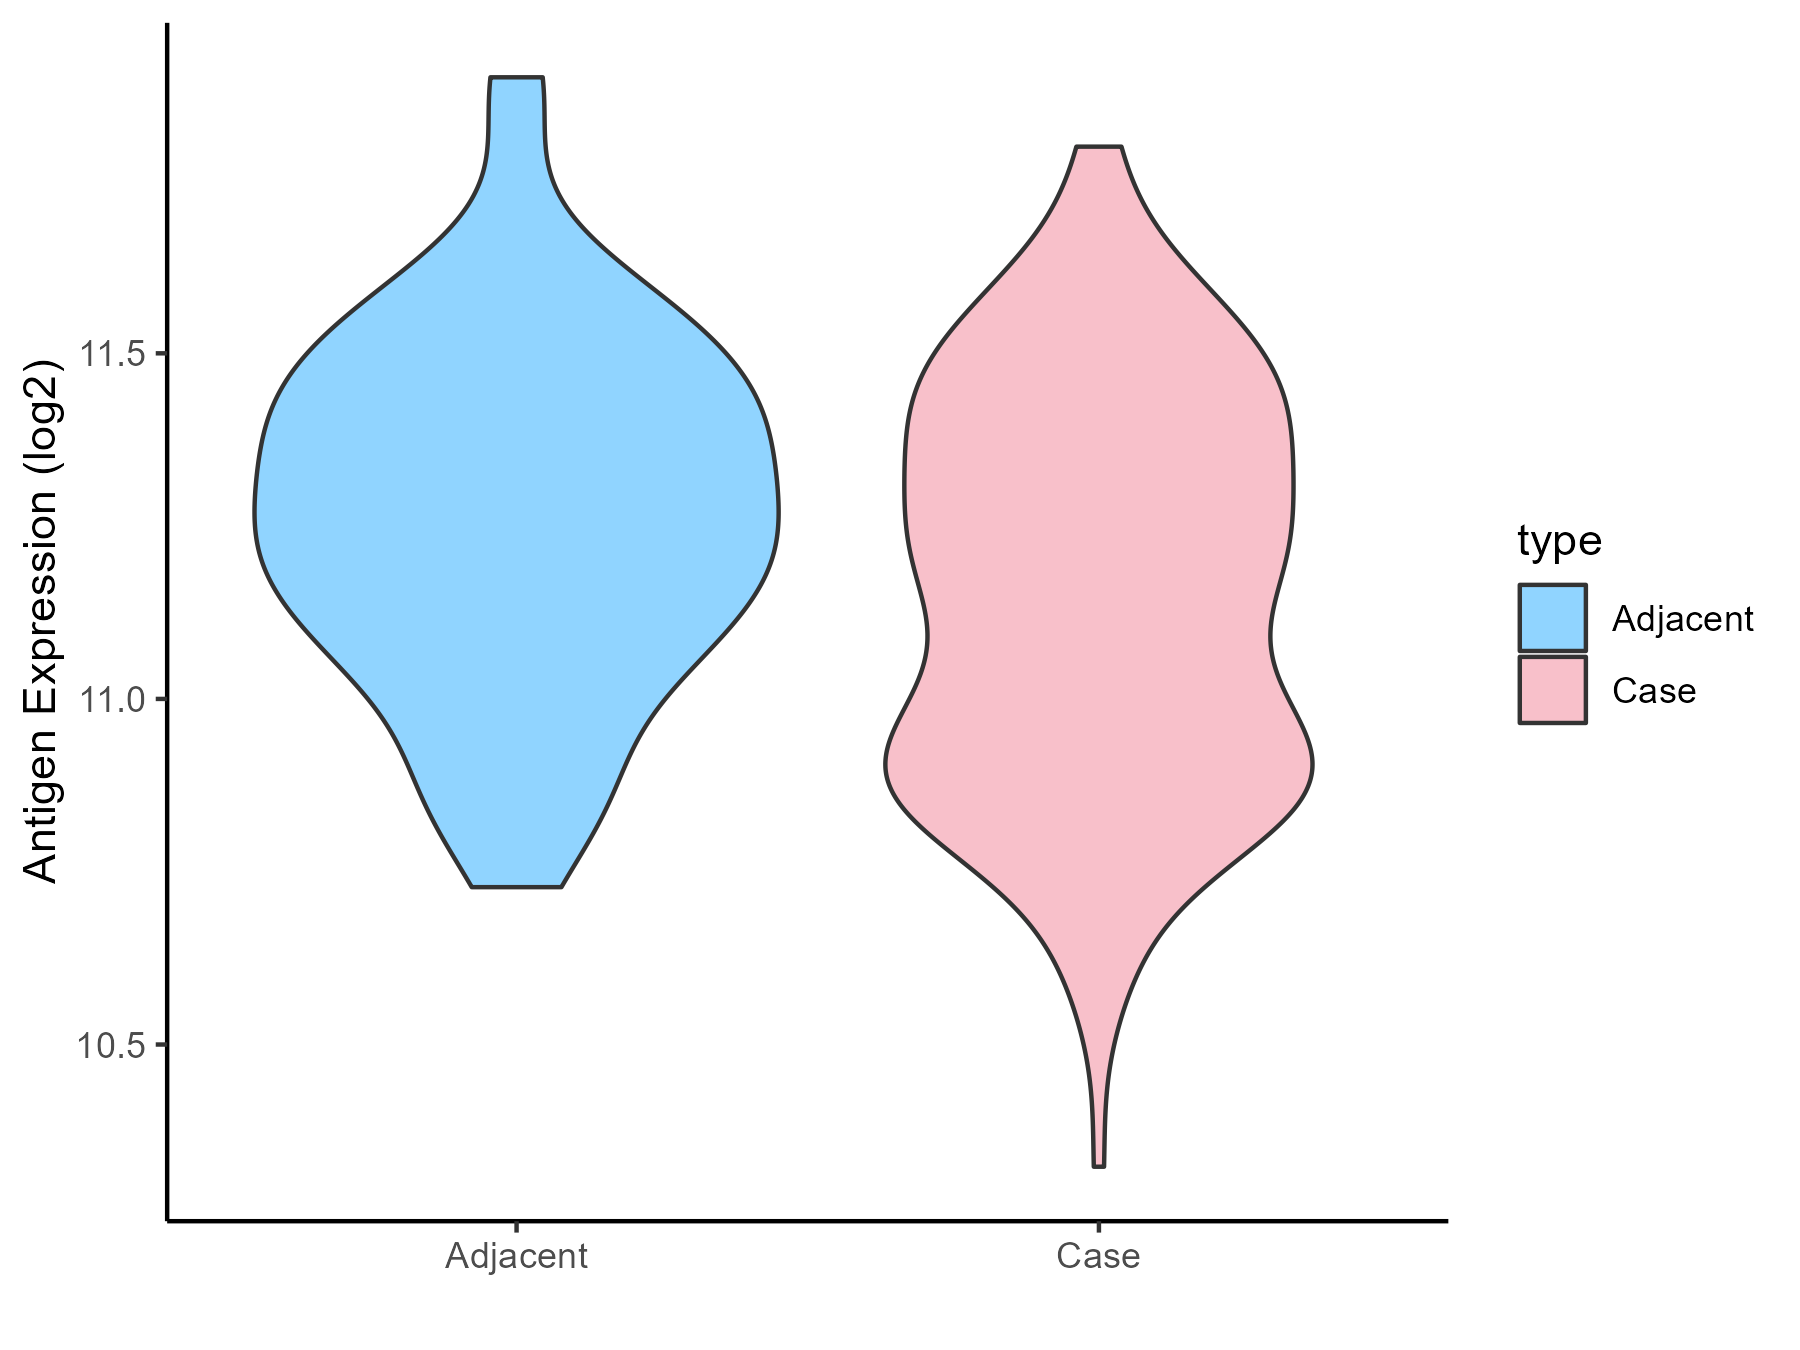
Periodontal disease [ICD-11: DA0C]
Click to Show/Hide
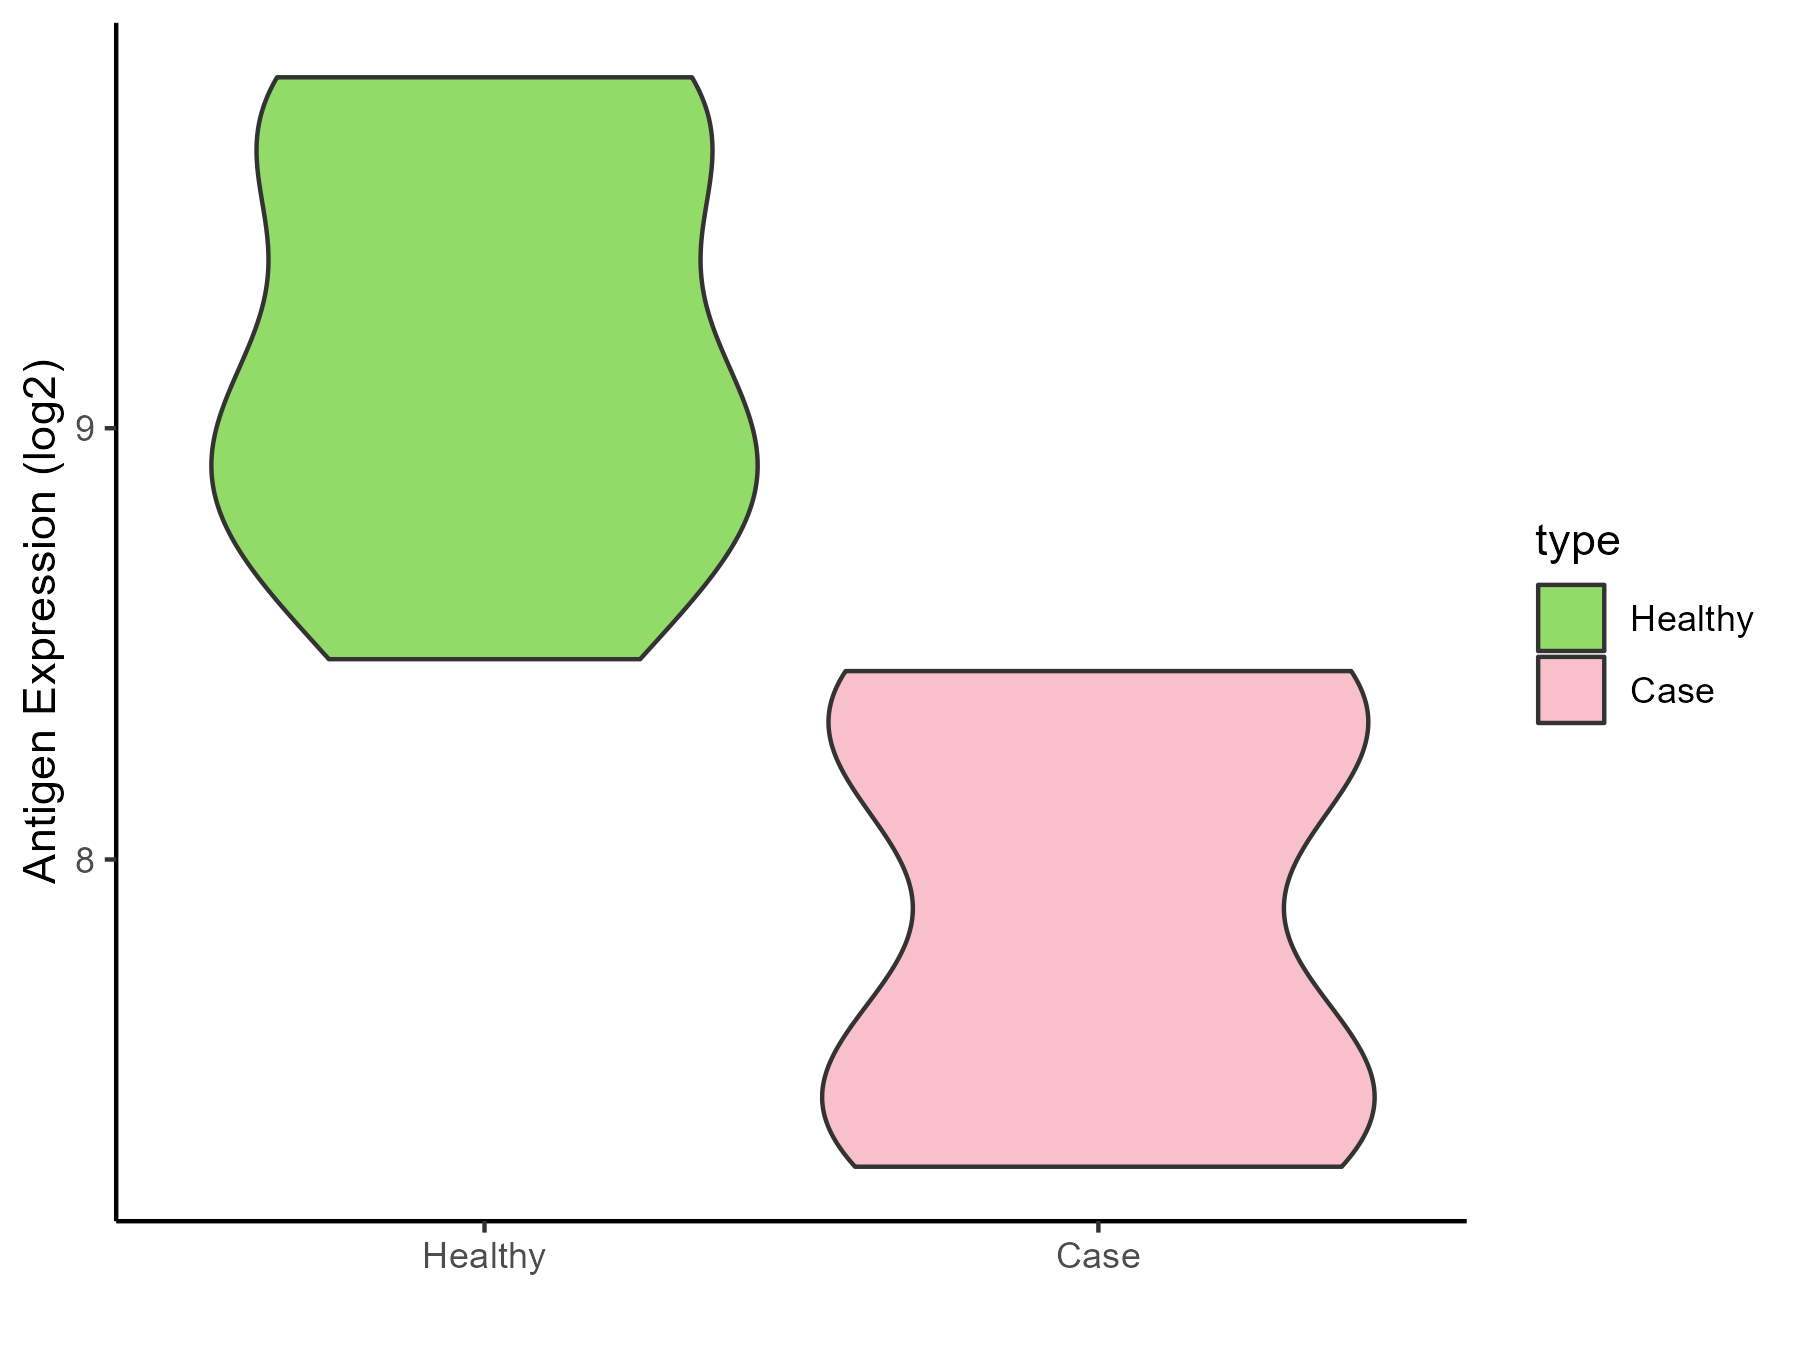
| Differential expression pattern of antigen in diseases |
| The Studied Tissue |
Gingival |
| The Specific Disease |
Periodontal disease |
| The Expression Level of Disease Section Compare with the Adjacent Tissue |
p-value: 0.005096091;
Fold-change: -0.104970637;
Z-score: -0.414631389
|
| Disease-specific Antigen Abundances |
|
Click to View the Clearer Original Diagram
|
|
|
Eosinophilic gastritis [ICD-11: DA42.2]
Click to Show/Hide
| Differential expression pattern of antigen in diseases |
| The Studied Tissue |
Gastric antrum |
| The Specific Disease |
Eosinophilic gastritis |
| The Expression Level of Disease Section Compare with the Adjacent Tissue |
p-value: 0.403700424;
Fold-change: 0.475710204;
Z-score: 1.583953621
|
| Disease-specific Antigen Abundances |
|
Click to View the Clearer Original Diagram
|
|
|
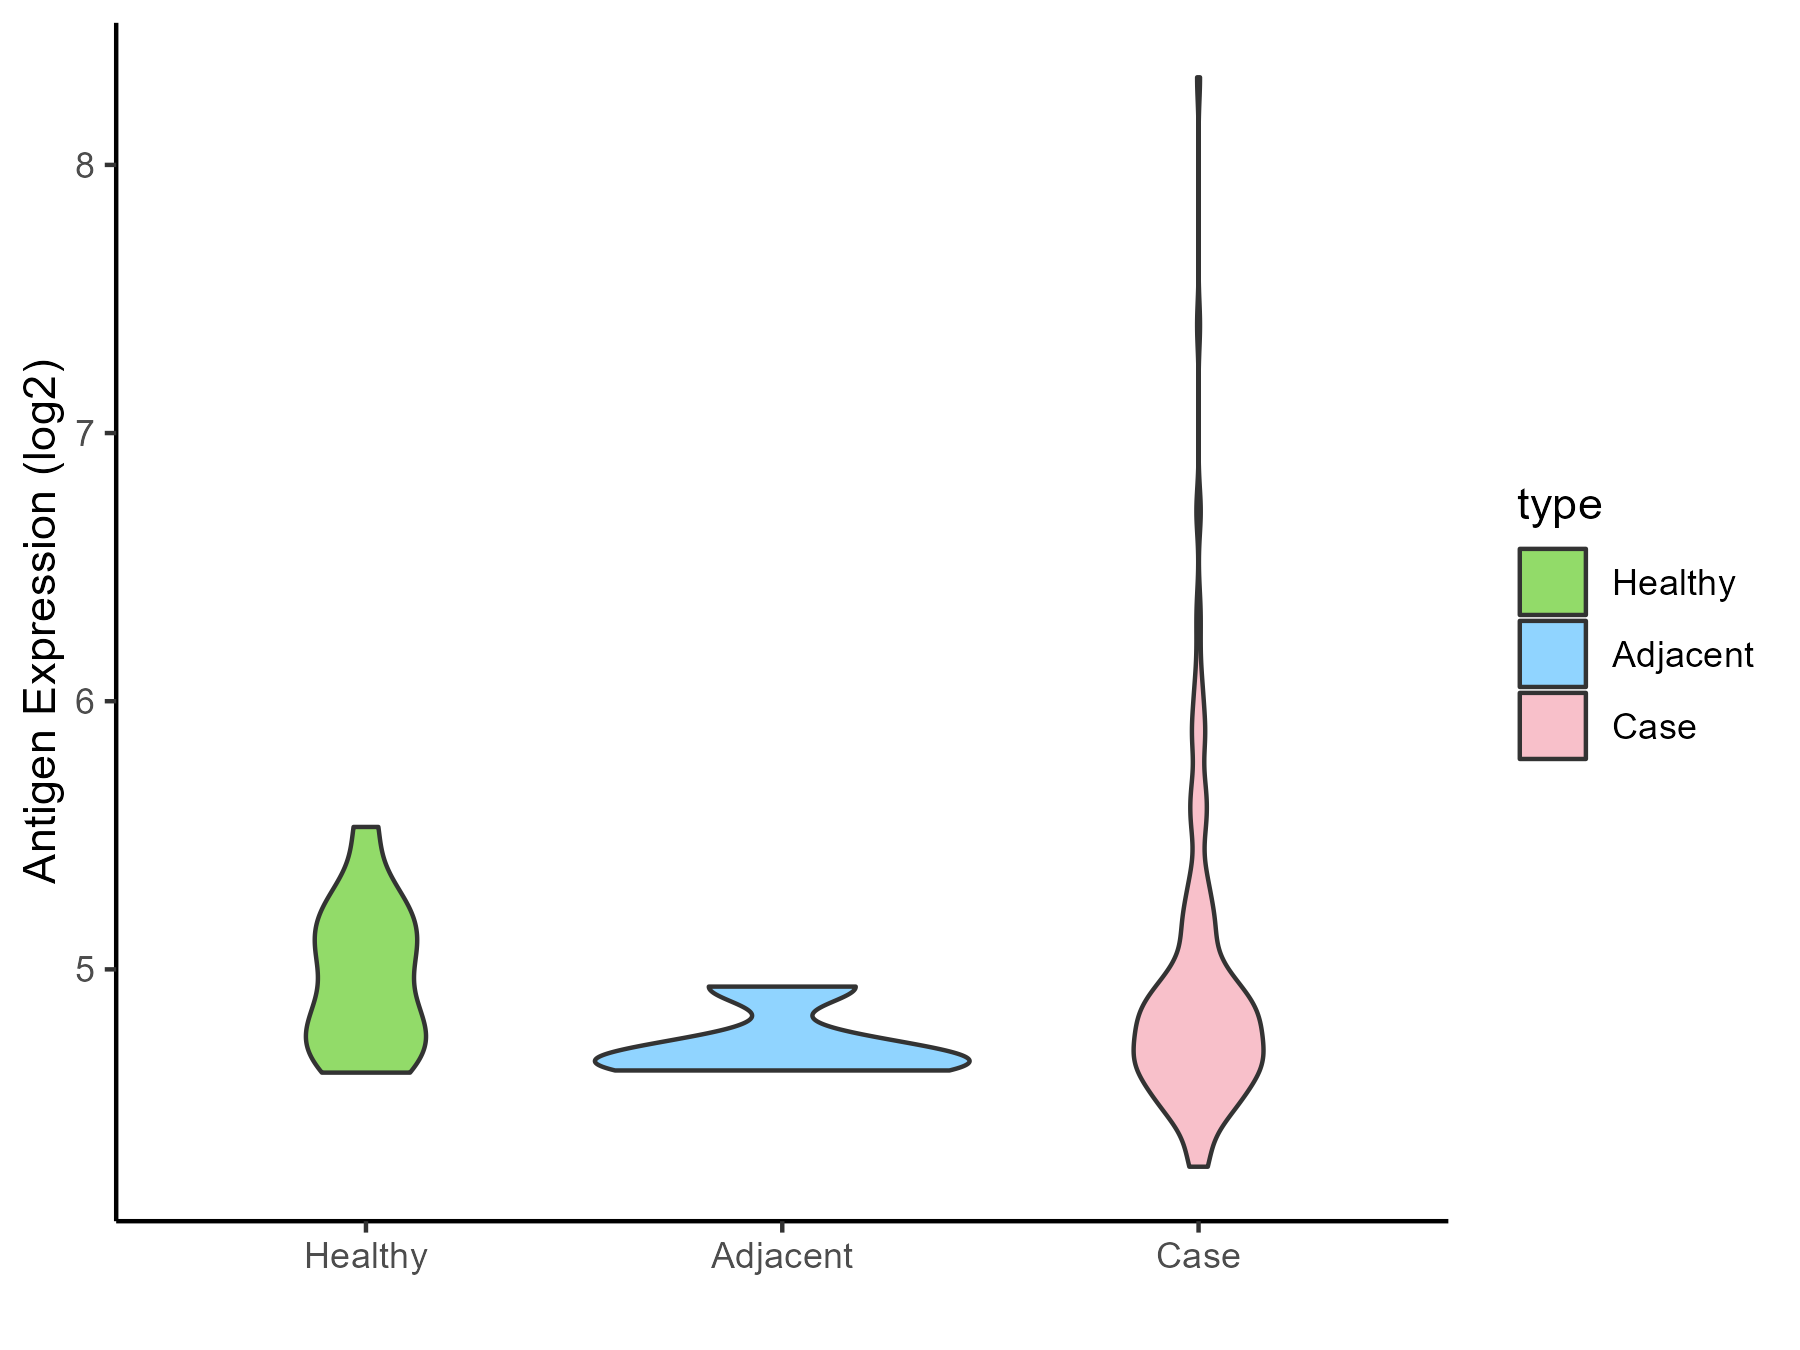
Liver failure [ICD-11: DB99.7-DB99.8]
Click to Show/Hide
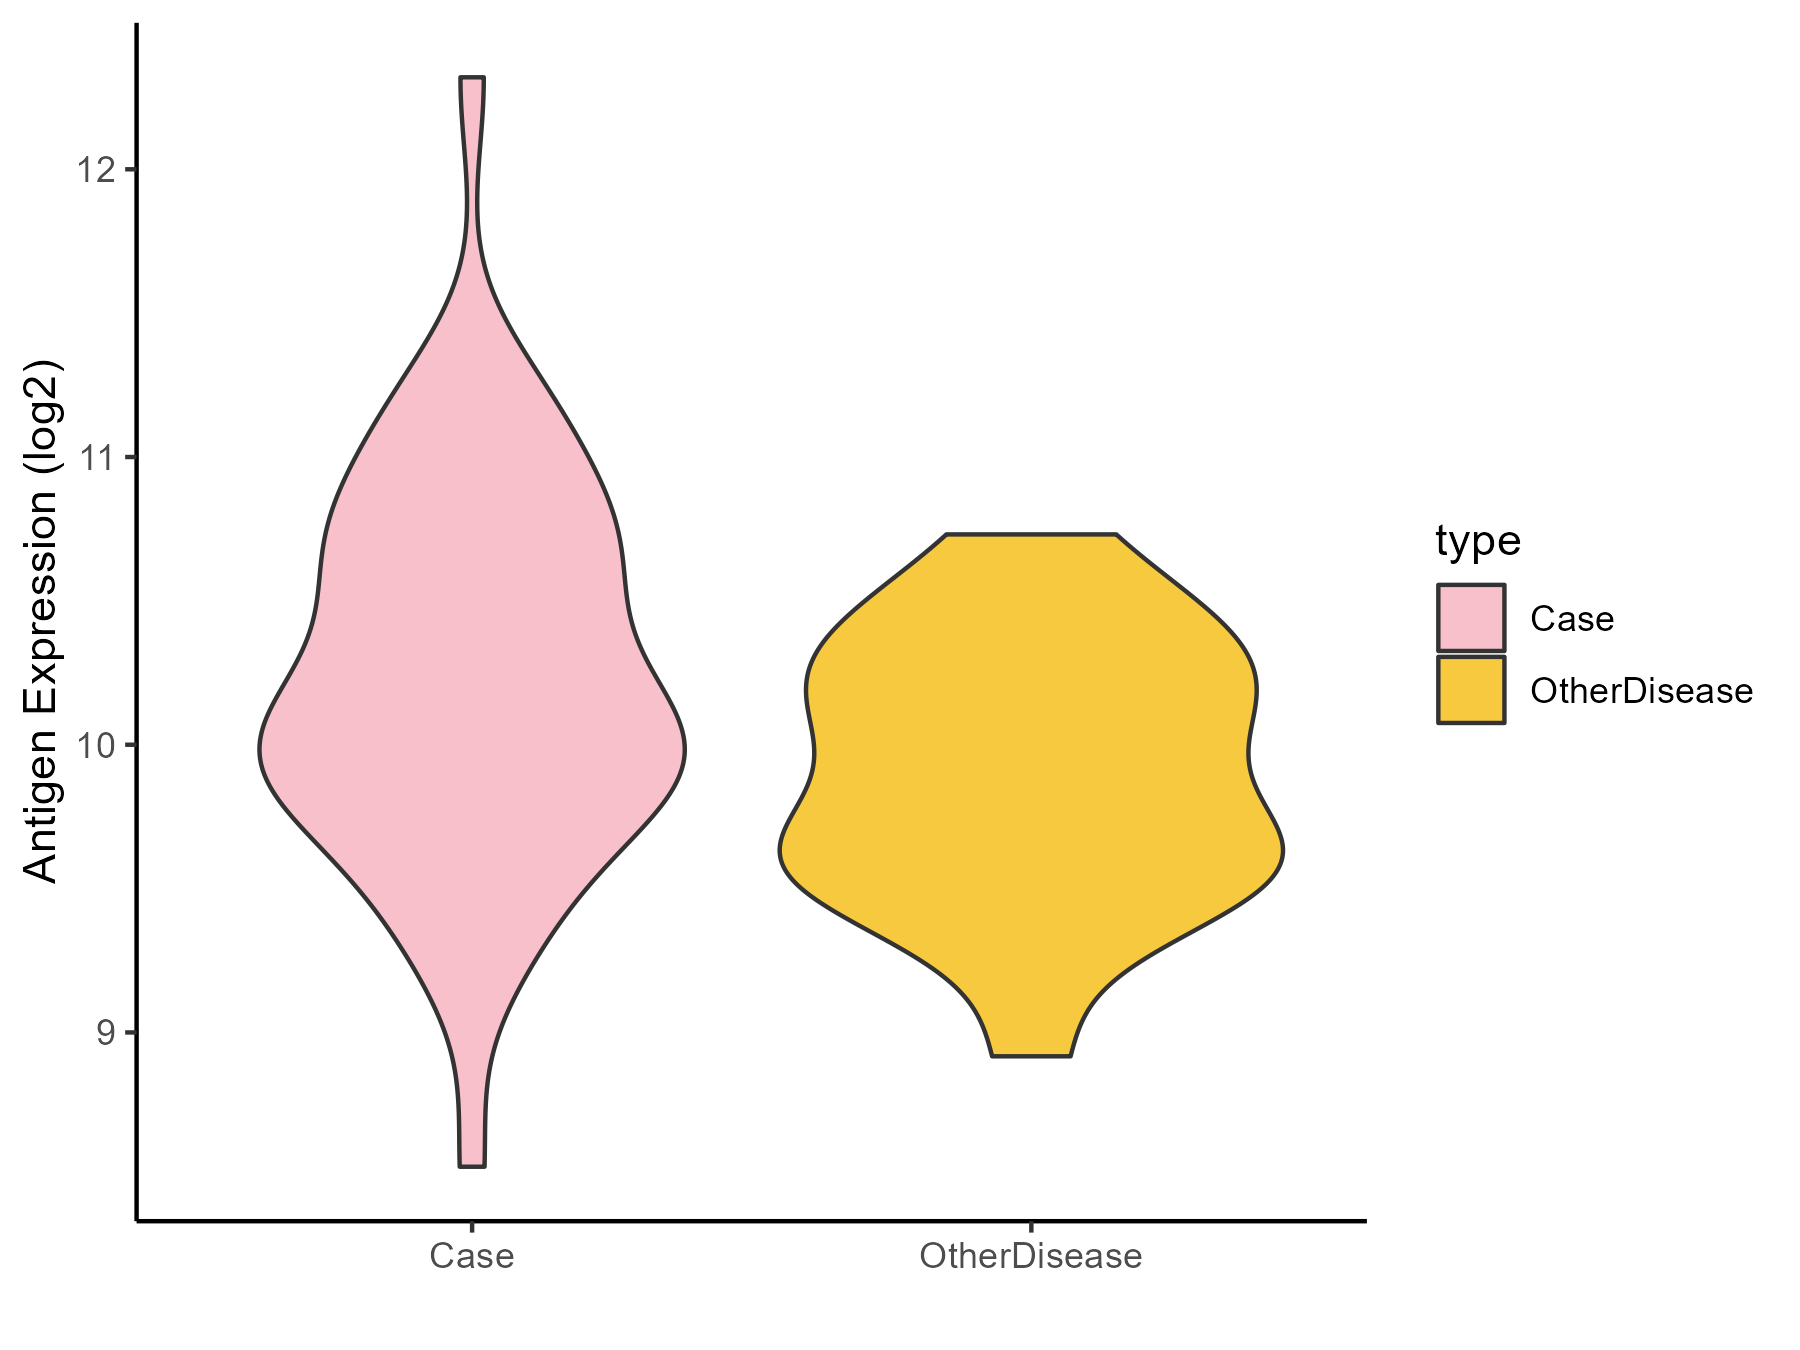
| Differential expression pattern of antigen in diseases |
| The Studied Tissue |
Liver |
| The Specific Disease |
Liver failure |
| The Expression Level of Disease Section Compare with the Healthy Individual Tissue |
p-value: 0.000115964;
Fold-change: -1.250617446;
Z-score: -2.516993002
|
| Disease-specific Antigen Abundances |
|
Click to View the Clearer Original Diagram
|
|
|
Ulcerative colitis [ICD-11: DD71]
Click to Show/Hide
| Differential expression pattern of antigen in diseases |
| The Studied Tissue |
Colon mucosal |
| The Specific Disease |
Ulcerative colitis |
| The Expression Level of Disease Section Compare with the Adjacent Tissue |
p-value: 0.028164164;
Fold-change: 0.193703367;
Z-score: 0.416826267
|
| Disease-specific Antigen Abundances |
|
Click to View the Clearer Original Diagram
|
|
|
Irritable bowel syndrome [ICD-11: DD91.0]
Click to Show/Hide
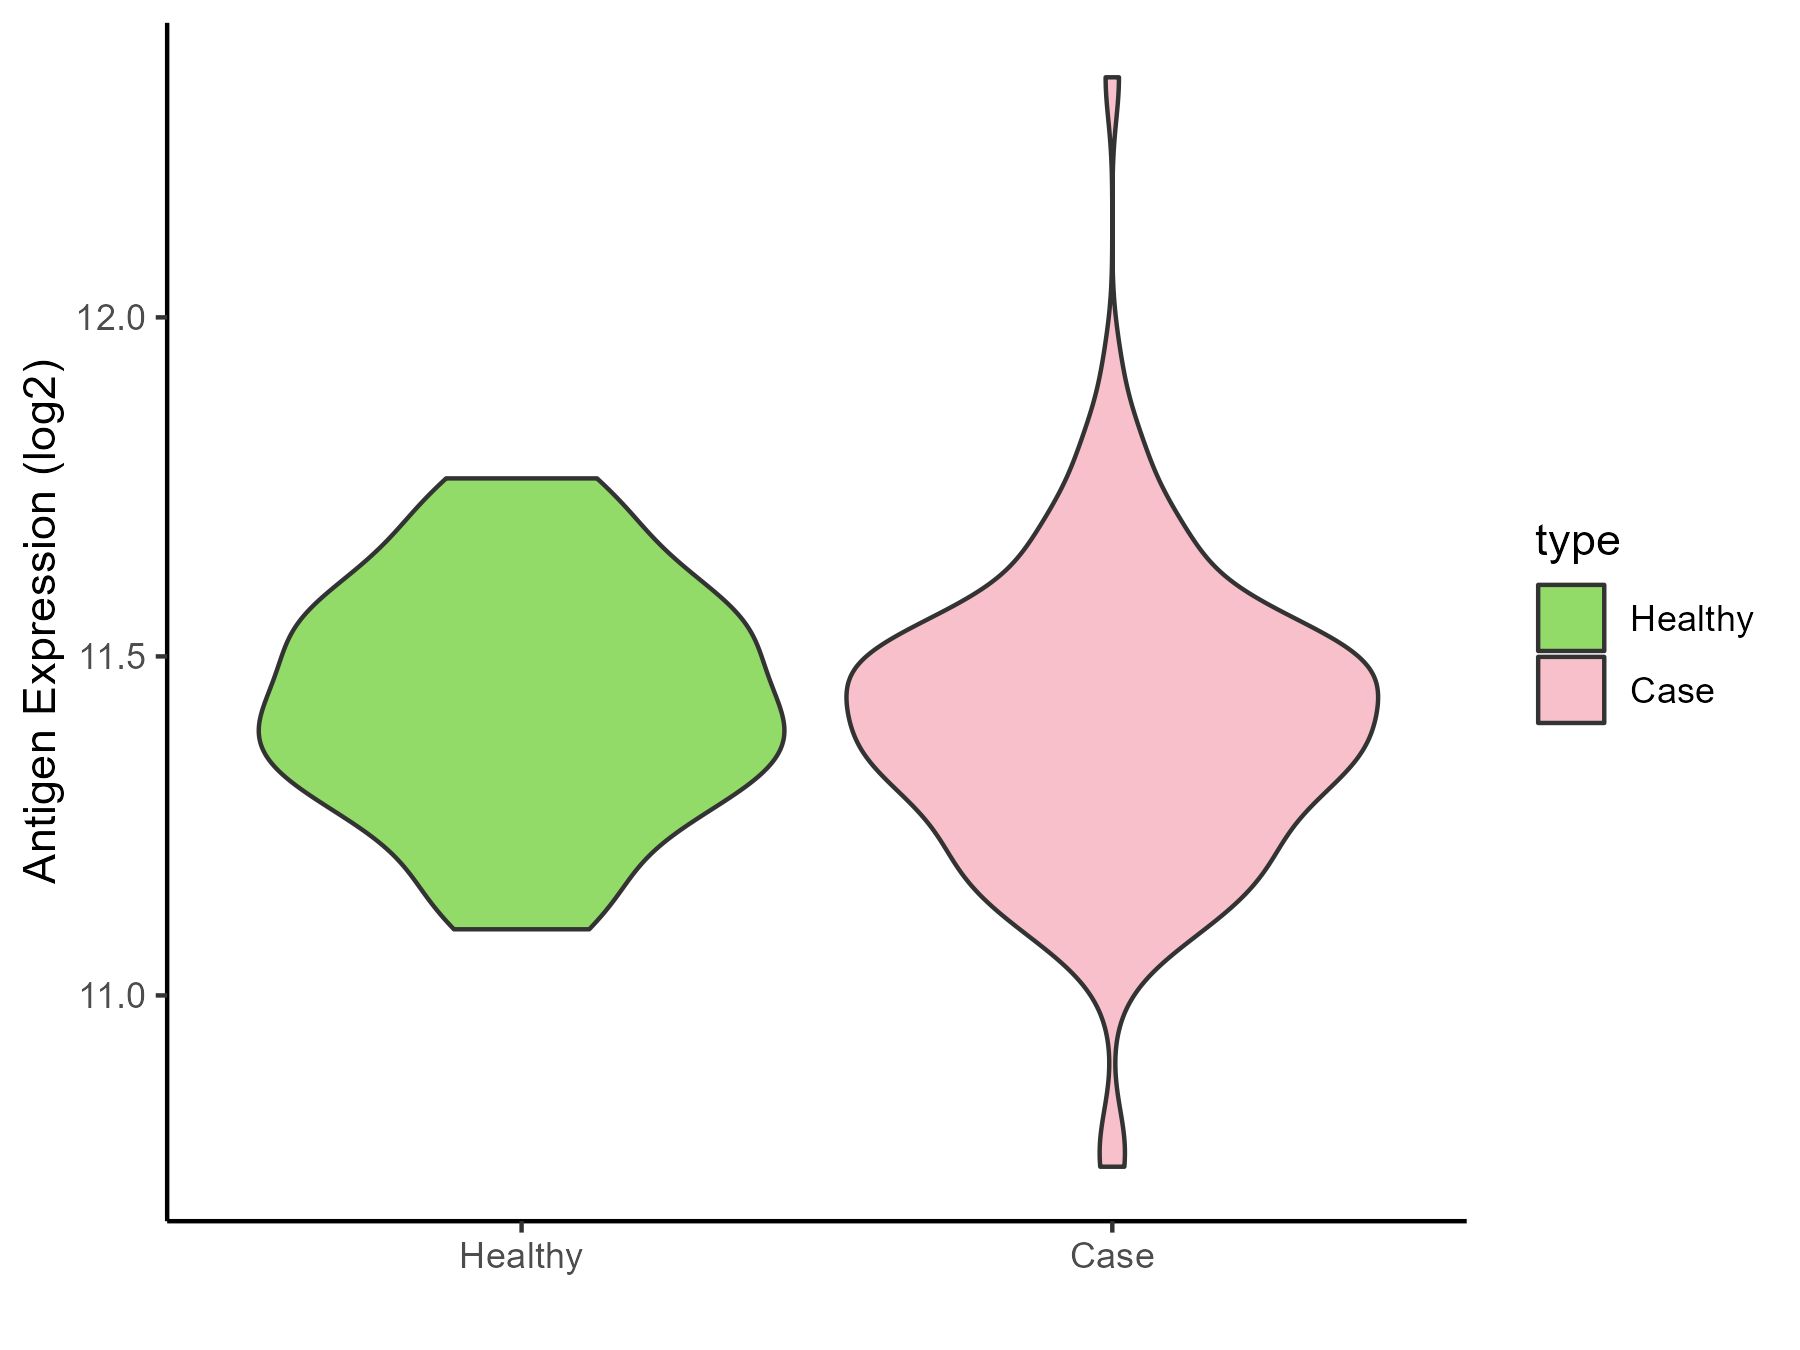
| Differential expression pattern of antigen in diseases |
| The Studied Tissue |
Rectal colon |
| The Specific Disease |
Irritable bowel syndrome |
| The Expression Level of Disease Section Compare with the Healthy Individual Tissue |
p-value: 0.225579201;
Fold-change: -0.03210857;
Z-score: -0.186994756
|
| Disease-specific Antigen Abundances |
|
Click to View the Clearer Original Diagram
|
|
|
ICD Disease Classification 14
Click to Show/Hide the 5 Disease of This Class
Atopic dermatitis [ICD-11: EA80]
Click to Show/Hide
| Differential expression pattern of antigen in diseases |
| The Studied Tissue |
Skin |
| The Specific Disease |
Atopic dermatitis |
| The Expression Level of Disease Section Compare with the Healthy Individual Tissue |
p-value: 0.000864939;
Fold-change: -0.317297893;
Z-score: -1.532394389
|
| Disease-specific Antigen Abundances |
|
Click to View the Clearer Original Diagram
|
|
|
Psoriasis [ICD-11: EA90]
Click to Show/Hide
| Differential expression pattern of antigen in diseases |
| The Studied Tissue |
Skin |
| The Specific Disease |
Psoriasis |
| The Expression Level of Disease Section Compare with the Healthy Individual Tissue |
p-value: 2.78E-11;
Fold-change: 0.210943746;
Z-score: 0.560956312
|
| The Expression Level of Disease Section Compare with the Adjacent Tissue |
p-value: 1.51E-12;
Fold-change: -0.611868406;
Z-score: -1.658981278
|
| Disease-specific Antigen Abundances |
|
Click to View the Clearer Original Diagram
|
|
|
Vitiligo [ICD-11: ED63.0]
Click to Show/Hide
| Differential expression pattern of antigen in diseases |
| The Studied Tissue |
Skin |
| The Specific Disease |
Vitiligo |
| The Expression Level of Disease Section Compare with the Healthy Individual Tissue |
p-value: 0.710015274;
Fold-change: -0.013474412;
Z-score: -0.138647742
|
| Disease-specific Antigen Abundances |
|
Click to View the Clearer Original Diagram
|
|
|
Alopecia [ICD-11: ED70]
Click to Show/Hide
| Differential expression pattern of antigen in diseases |
| The Studied Tissue |
Skin from scalp |
| The Specific Disease |
Alopecia |
| The Expression Level of Disease Section Compare with the Healthy Individual Tissue |
p-value: 1.07E-13;
Fold-change: -0.225284274;
Z-score: -2.679209472
|
| Disease-specific Antigen Abundances |
|
Click to View the Clearer Original Diagram
|
|
|
Sensitive skin [ICD-11: EK0Z]
Click to Show/Hide
| Differential expression pattern of antigen in diseases |
| The Studied Tissue |
Skin |
| The Specific Disease |
Sensitive skin |
| The Expression Level of Disease Section Compare with the Healthy Individual Tissue |
p-value: 0.543082526;
Fold-change: 0.02732144;
Z-score: 0.16550282
|
| Disease-specific Antigen Abundances |
|
Click to View the Clearer Original Diagram
|
|
|
ICD Disease Classification 15
Click to Show/Hide the 6 Disease of This Class
Osteoarthritis [ICD-11: FA00-FA0Z]
Click to Show/Hide
| Differential expression pattern of antigen in diseases |
| The Studied Tissue |
Synovial |
| The Specific Disease |
Osteoarthritis |
| The Expression Level of Disease Section Compare with the Healthy Individual Tissue |
p-value: 0.216713363;
Fold-change: 1.335094798;
Z-score: 0.825105174
|
| Disease-specific Antigen Abundances |
|
Click to View the Clearer Original Diagram
|
|
|
Arthropathy [ICD-11: FA00-FA5Z]
Click to Show/Hide
| Differential expression pattern of antigen in diseases |
| The Studied Tissue |
Peripheral blood |
| The Specific Disease |
Arthropathy |
| The Expression Level of Disease Section Compare with the Healthy Individual Tissue |
p-value: 0.550156734;
Fold-change: -0.0292284;
Z-score: -0.262655068
|
| Disease-specific Antigen Abundances |
|
Click to View the Clearer Original Diagram
|
|
|
Arthritis [ICD-11: FA20]
Click to Show/Hide
| Differential expression pattern of antigen in diseases |
| The Studied Tissue |
Peripheral blood |
| The Specific Disease |
Arthritis |
| The Expression Level of Disease Section Compare with the Healthy Individual Tissue |
p-value: 0.079644301;
Fold-change: 0.075093783;
Z-score: 0.194001007
|
| Disease-specific Antigen Abundances |
|
Click to View the Clearer Original Diagram
|
|
|
Rheumatoid arthritis [ICD-11: FA20]
Click to Show/Hide
| Differential expression pattern of antigen in diseases |
| The Studied Tissue |
Synovial |
| The Specific Disease |
Rheumatoid arthritis |
| The Expression Level of Disease Section Compare with the Healthy Individual Tissue |
p-value: 8.81E-10;
Fold-change: 2.432143409;
Z-score: 7.86198682
|
| Disease-specific Antigen Abundances |
|
Click to View the Clearer Original Diagram
|
|
|
Ankylosing spondylitis [ICD-11: FA92.0Z]
Click to Show/Hide
| Differential expression pattern of antigen in diseases |
| The Studied Tissue |
Pheripheral blood |
| The Specific Disease |
Ankylosing spondylitis |
| The Expression Level of Disease Section Compare with the Healthy Individual Tissue |
p-value: 0.978491895;
Fold-change: 0.122920786;
Z-score: 0.164591521
|
| Disease-specific Antigen Abundances |
|
Click to View the Clearer Original Diagram
|
|
|
Osteoporosis [ICD-11: FB83]
Click to Show/Hide
| Differential expression pattern of antigen in diseases |
| The Studied Tissue |
Bone marrow |
| The Specific Disease |
Osteoporosis |
| The Expression Level of Disease Section Compare with the Healthy Individual Tissue |
p-value: 0.770711463;
Fold-change: 0.009181999;
Z-score: 0.013249299
|
| Disease-specific Antigen Abundances |
|
Click to View the Clearer Original Diagram
|
|
|
ICD Disease Classification 16
Click to Show/Hide the 2 Disease of This Class
Endometriosis [ICD-11: GA10]
Click to Show/Hide
| Differential expression pattern of antigen in diseases |
| The Studied Tissue |
Endometrium |
| The Specific Disease |
Endometriosis |
| The Expression Level of Disease Section Compare with the Healthy Individual Tissue |
p-value: 0.063683376;
Fold-change: 0.665293267;
Z-score: 0.909711811
|
| Disease-specific Antigen Abundances |
|
Click to View the Clearer Original Diagram
|
|
|
Interstitial cystitis [ICD-11: GC00.3]
Click to Show/Hide
| Differential expression pattern of antigen in diseases |
| The Studied Tissue |
Bladder |
| The Specific Disease |
Interstitial cystitis |
| The Expression Level of Disease Section Compare with the Healthy Individual Tissue |
p-value: 0.000111059;
Fold-change: -1.421583505;
Z-score: -4.295830958
|
| Disease-specific Antigen Abundances |
|
Click to View the Clearer Original Diagram
|
|
|
ICD Disease Classification 19
Click to Show/Hide the 1 Disease of This Class
Preterm birth [ICD-11: KA21.4Z]
Click to Show/Hide
| Differential expression pattern of antigen in diseases |
| The Studied Tissue |
Myometrium |
| The Specific Disease |
Preterm birth |
| The Expression Level of Disease Section Compare with the Healthy Individual Tissue |
p-value: 0.636543199;
Fold-change: -0.281954127;
Z-score: -1.715073624
|
| Disease-specific Antigen Abundances |
|
Click to View the Clearer Original Diagram
|
|
|
ICD Disease Classification 2
Click to Show/Hide the 8 Disease of This Class
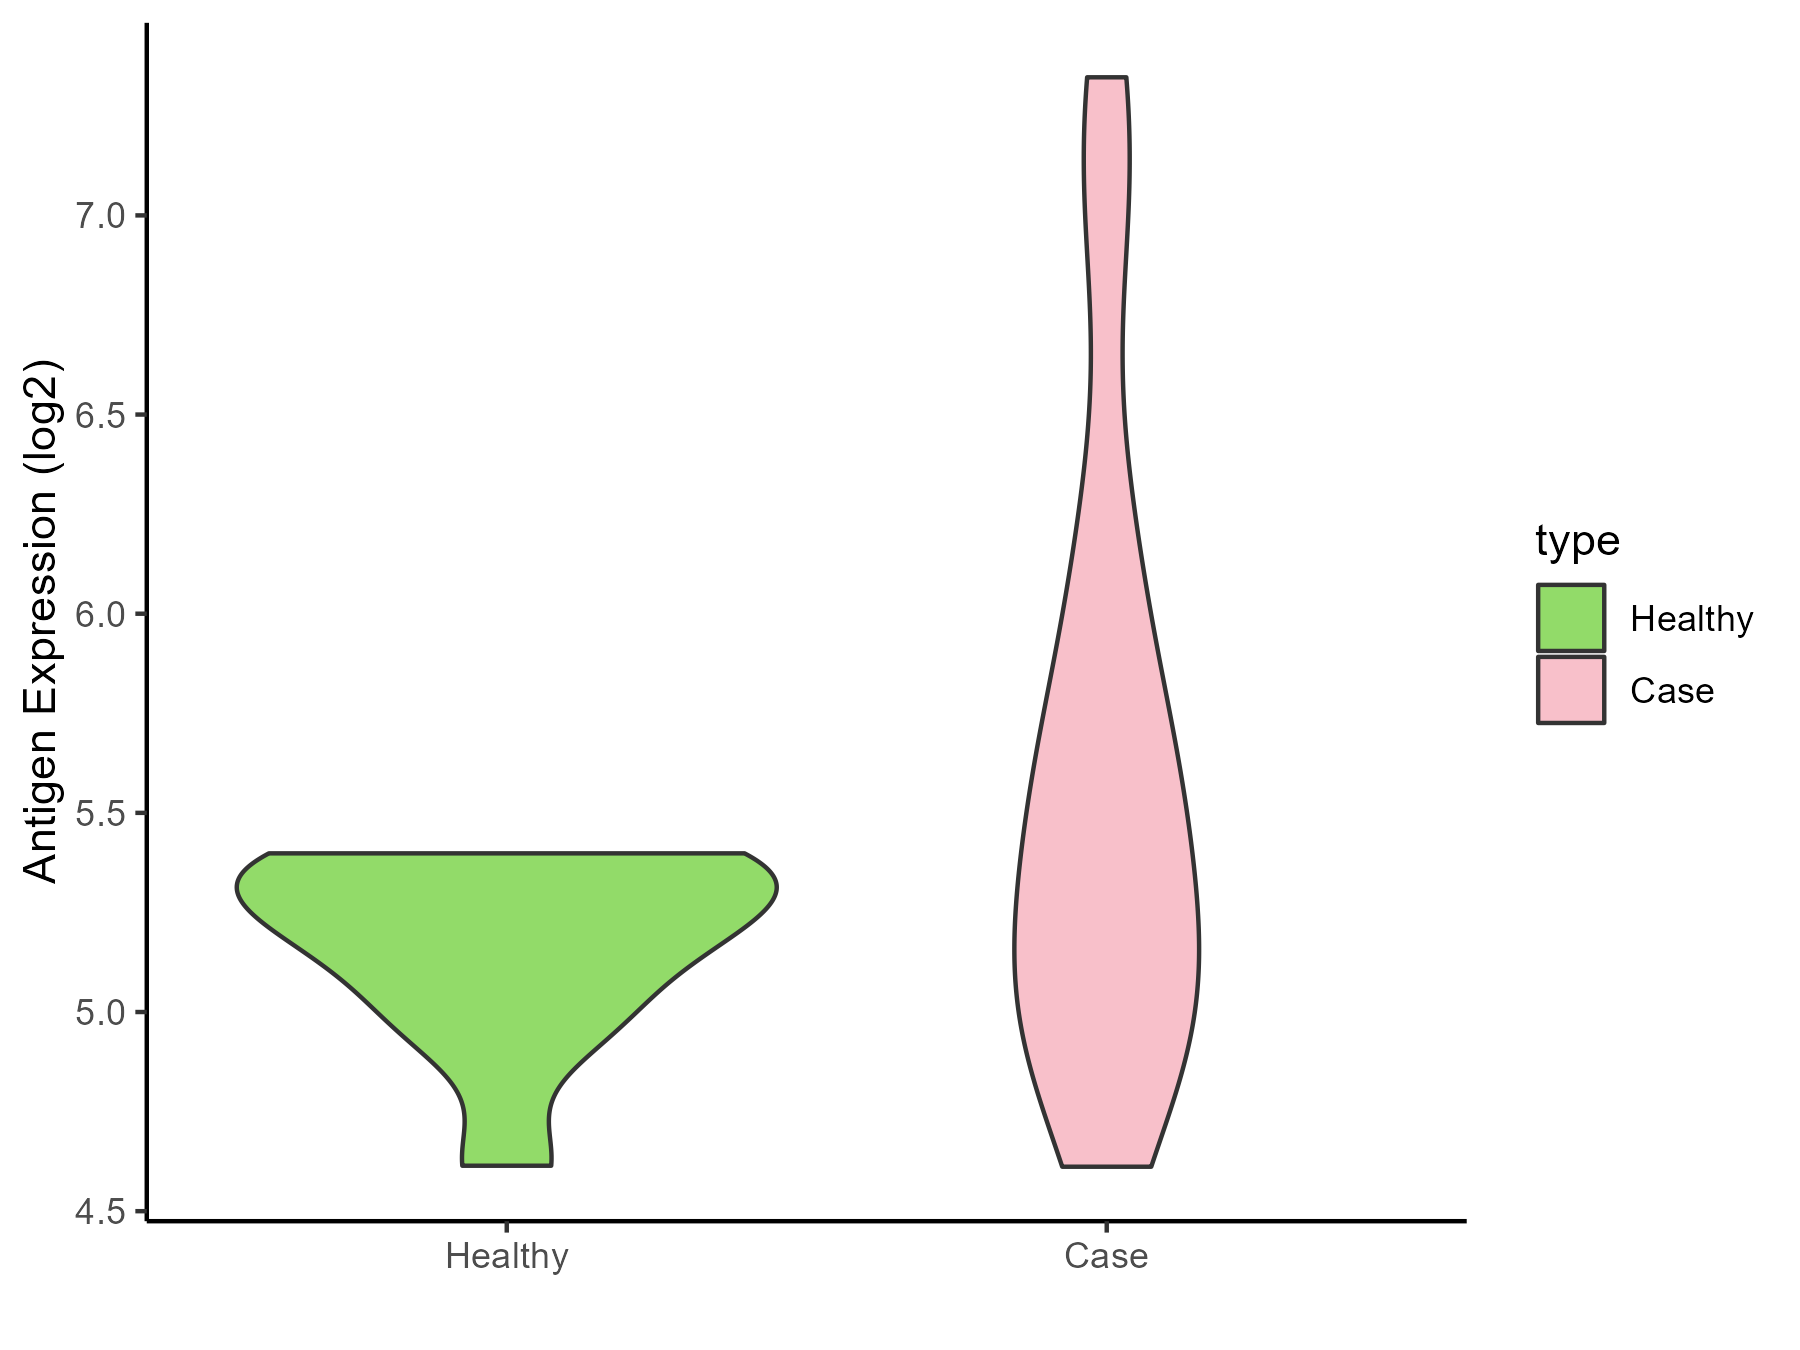
Acute myelocytic leukemia [ICD-11: 2A60]
Click to Show/Hide
| Differential expression pattern of antigen in diseases |
| The Studied Tissue |
Bone marrow |
| The Specific Disease |
Acute myelocytic leukemia |
| The Expression Level of Disease Section Compare with the Healthy Individual Tissue |
p-value: 1.57E-12;
Fold-change: -0.398182277;
Z-score: -0.664313561
|
| Disease-specific Antigen Abundances |
|
Click to View the Clearer Original Diagram
|
|
|
Myeloma [ICD-11: 2A83]
Click to Show/Hide
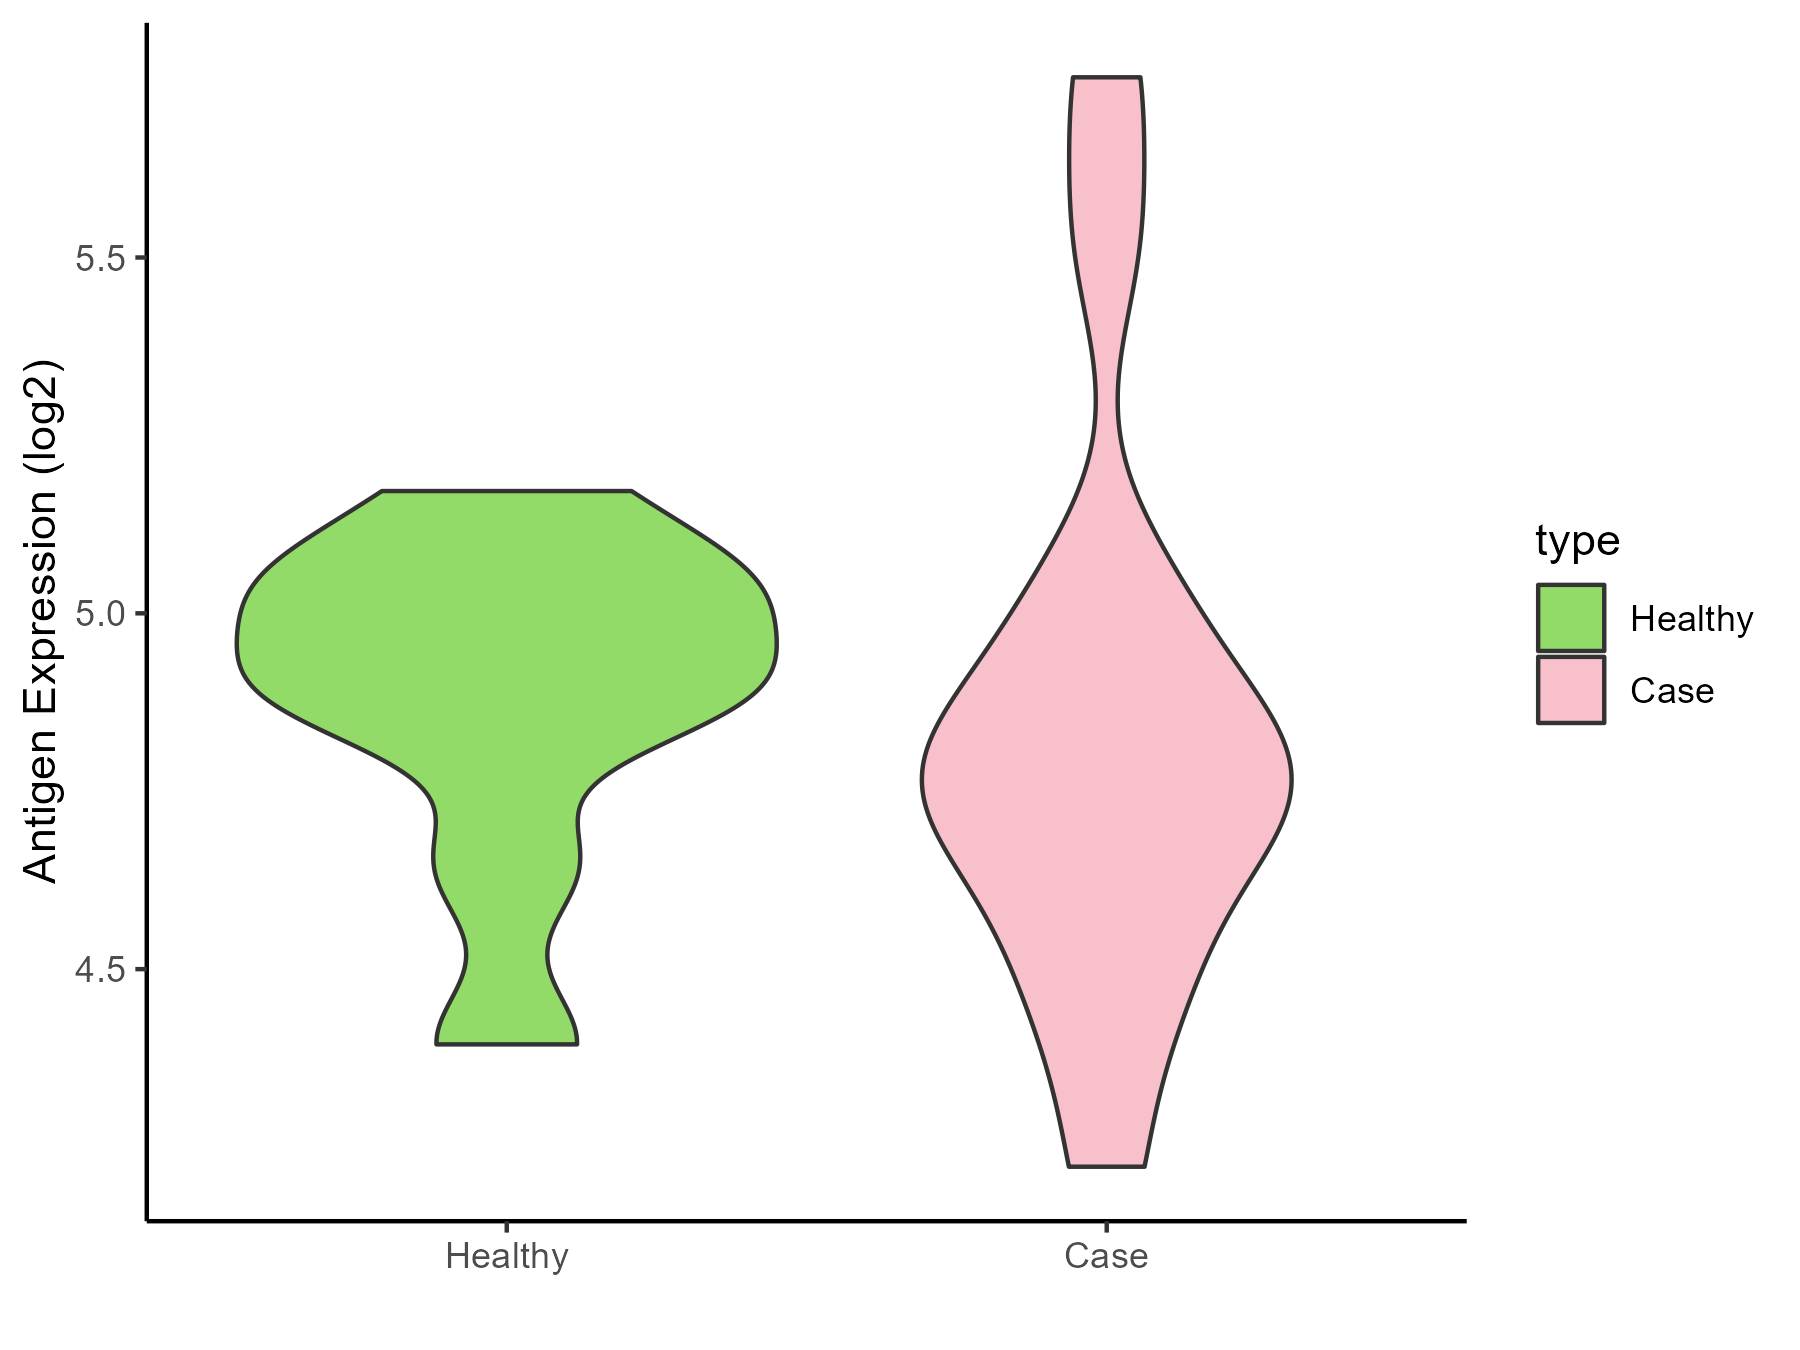
| Differential expression pattern of antigen in diseases |
| The Studied Tissue |
Peripheral blood |
| The Specific Disease |
Myeloma |
| The Expression Level of Disease Section Compare with the Healthy Individual Tissue |
p-value: 0.878278705;
Fold-change: 0.050250933;
Z-score: 0.308039511
|
| Disease-specific Antigen Abundances |
|
Click to View the Clearer Original Diagram
|
|
|
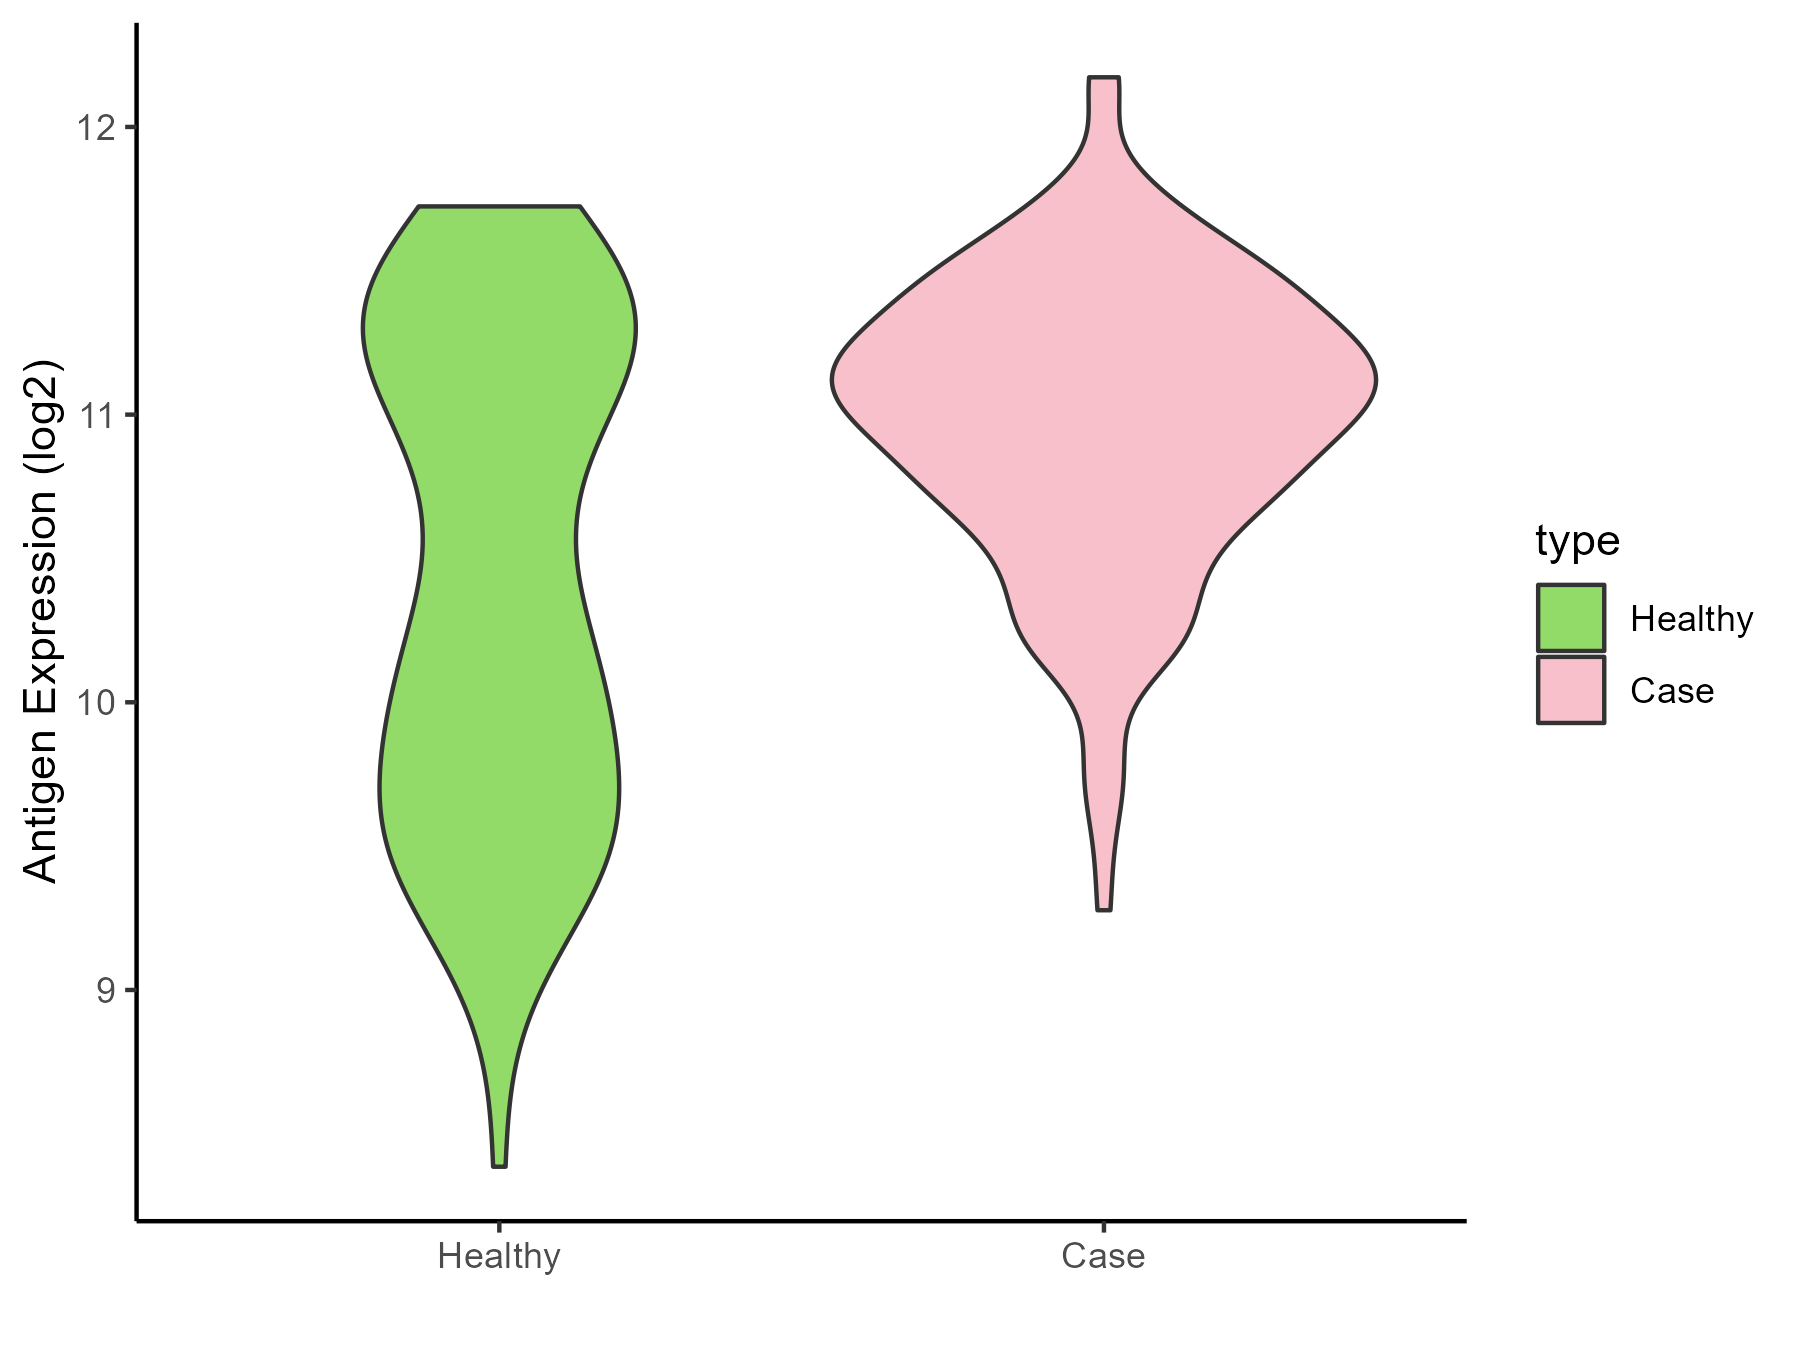
| The Studied Tissue |
Bone marrow |
| The Specific Disease |
Myeloma |
| The Expression Level of Disease Section Compare with the Healthy Individual Tissue |
p-value: 0.001622929;
Fold-change: 0.763818394;
Z-score: 2.174780832
|
| Disease-specific Antigen Abundances |
|
Click to View the Clearer Original Diagram
|
|
|
Oral cancer [ICD-11: 2B6E]
Click to Show/Hide
| Differential expression pattern of antigen in diseases |
| The Studied Tissue |
Oral |
| The Specific Disease |
Oral cancer |
| The Expression Level of Disease Section Compare with the Healthy Individual Tissue |
p-value: 0.018042326;
Fold-change: 0.450463966;
Z-score: 0.323660173
|
| The Expression Level of Disease Section Compare with the Adjacent Tissue |
p-value: 0.941401831;
Fold-change: -0.18161519;
Z-score: -0.134987399
|
| Disease-specific Antigen Abundances |
|
Click to View the Clearer Original Diagram
|
|
|
Esophagal cancer [ICD-11: 2B70]
Click to Show/Hide
| Differential expression pattern of antigen in diseases |
| The Studied Tissue |
Esophagus |
| The Specific Disease |
Esophagal cancer |
| The Expression Level of Disease Section Compare with the Adjacent Tissue |
p-value: 0.250481313;
Fold-change: -0.974714301;
Z-score: -1.021774348
|
| Disease-specific Antigen Abundances |
|
Click to View the Clearer Original Diagram
|
|
|
Rectal cancer [ICD-11: 2B92]
Click to Show/Hide
| Differential expression pattern of antigen in diseases |
| The Studied Tissue |
Rectal colon |
| The Specific Disease |
Rectal cancer |
| The Expression Level of Disease Section Compare with the Healthy Individual Tissue |
p-value: 0.338613993;
Fold-change: -0.035399855;
Z-score: -0.189048327
|
| The Expression Level of Disease Section Compare with the Adjacent Tissue |
p-value: 0.929666466;
Fold-change: 0.056120715;
Z-score: 0.201413812
|
| Disease-specific Antigen Abundances |
|
Click to View the Clearer Original Diagram
|
|
|
Skin cancer [ICD-11: 2C30-2C3Z]
Click to Show/Hide
| Differential expression pattern of antigen in diseases |
| The Studied Tissue |
Skin |
| The Specific Disease |
Skin cancer |
| The Expression Level of Disease Section Compare with the Healthy Individual Tissue |
p-value: 5.74E-66;
Fold-change: -1.973474937;
Z-score: -4.065499956
|
| The Expression Level of Disease Section Compare with the Adjacent Tissue |
p-value: 1.92E-76;
Fold-change: -2.408912784;
Z-score: -3.892348817
|
| Disease-specific Antigen Abundances |
|
Click to View the Clearer Original Diagram
|
|
|
Renal cancer [ICD-11: 2C90-2C91]
Click to Show/Hide
| Differential expression pattern of antigen in diseases |
| The Studied Tissue |
Kidney |
| The Specific Disease |
Renal cancer |
| The Expression Level of Disease Section Compare with the Healthy Individual Tissue |
p-value: 0.009066772;
Fold-change: -1.601716586;
Z-score: -1.422518177
|
| The Expression Level of Disease Section Compare with the Adjacent Tissue |
p-value: 3.37E-47;
Fold-change: -1.716930907;
Z-score: -3.335950333
|
| Disease-specific Antigen Abundances |
|
Click to View the Clearer Original Diagram
|
|
|
Ureter cancer [ICD-11: 2C92]
Click to Show/Hide
| Differential expression pattern of antigen in diseases |
| The Studied Tissue |
Urothelium |
| The Specific Disease |
Ureter cancer |
| The Expression Level of Disease Section Compare with the Healthy Individual Tissue |
p-value: 0.587405512;
Fold-change: 0.118142248;
Z-score: 0.129482681
|
| Disease-specific Antigen Abundances |
|
Click to View the Clearer Original Diagram
|
|
|
ICD Disease Classification 20
Click to Show/Hide the 2 Disease of This Class
Simpson golabi behmel syndrome [ICD-11: LD2C]
Click to Show/Hide
| Differential expression pattern of antigen in diseases |
| The Studied Tissue |
Adipose |
| The Specific Disease |
Simpson golabi behmel syndrome |
| The Expression Level of Disease Section Compare with the Healthy Individual Tissue |
p-value: 0.948799518;
Fold-change: 0.016553718;
Z-score: 0.085880034
|
| Disease-specific Antigen Abundances |
|
Click to View the Clearer Original Diagram
|
|
|
Tuberous sclerosis complex [ICD-11: LD2D.2]
Click to Show/Hide
| Differential expression pattern of antigen in diseases |
| The Studied Tissue |
Perituberal |
| The Specific Disease |
Tuberous sclerosis complex |
| The Expression Level of Disease Section Compare with the Healthy Individual Tissue |
p-value: 0.099459748;
Fold-change: 0.365896952;
Z-score: 3.001743359
|
| Disease-specific Antigen Abundances |
|
Click to View the Clearer Original Diagram
|
|
|
ICD Disease Classification 3
Click to Show/Hide the 3 Disease of This Class
Anemia [ICD-11: 3A00-3A9Z]
Click to Show/Hide
| Differential expression pattern of antigen in diseases |
| The Studied Tissue |
Bone marrow |
| The Specific Disease |
Anemia |
| The Expression Level of Disease Section Compare with the Healthy Individual Tissue |
p-value: 0.101724661;
Fold-change: 0.339444618;
Z-score: 0.88610707
|
| Disease-specific Antigen Abundances |
|
Click to View the Clearer Original Diagram
|
|
|
Sickle cell disease [ICD-11: 3A51.0-3A51.3]
Click to Show/Hide
| Differential expression pattern of antigen in diseases |
| The Studied Tissue |
Peripheral blood |
| The Specific Disease |
Sickle cell disease |
| The Expression Level of Disease Section Compare with the Healthy Individual Tissue |
p-value: 0.079369097;
Fold-change: 0.059563554;
Z-score: 0.478734256
|
| Disease-specific Antigen Abundances |
|
Click to View the Clearer Original Diagram
|
|
|
Thrombocythemia [ICD-11: 3B63]
Click to Show/Hide
| Differential expression pattern of antigen in diseases |
| The Studied Tissue |
Whole blood |
| The Specific Disease |
Thrombocythemia |
| The Expression Level of Disease Section Compare with the Healthy Individual Tissue |
p-value: 0.043815123;
Fold-change: 0.043028959;
Z-score: 0.30746291
|
| Disease-specific Antigen Abundances |
|
Click to View the Clearer Original Diagram
|
|
|
ICD Disease Classification 4
Click to Show/Hide the 4 Disease of This Class
Scleroderma [ICD-11: 4A42.Z]
Click to Show/Hide
| Differential expression pattern of antigen in diseases |
| The Studied Tissue |
Whole blood |
| The Specific Disease |
Scleroderma |
| The Expression Level of Disease Section Compare with the Healthy Individual Tissue |
p-value: 0.755440279;
Fold-change: 0.041342612;
Z-score: 0.211191323
|
| Disease-specific Antigen Abundances |
|
Click to View the Clearer Original Diagram
|
|
|
Sjogren syndrome [ICD-11: 4A43]
Click to Show/Hide
| Differential expression pattern of antigen in diseases |
| The Studied Tissue |
Salivary gland |
| The Specific Disease |
Sjogren syndrome |
| The Expression Level of Disease Section Compare with the Healthy Individual Tissue |
p-value: 0.257306783;
Fold-change: 0.49507485;
Z-score: 0.879758392
|
| The Expression Level of Disease Section Compare with the Adjacent Tissue |
p-value: 0.188443621;
Fold-change: -0.207983611;
Z-score: -1.268401476
|
| Disease-specific Antigen Abundances |
|
Click to View the Clearer Original Diagram
|
|
|
Behcet disease [ICD-11: 4A62]
Click to Show/Hide
| Differential expression pattern of antigen in diseases |
| The Studied Tissue |
Peripheral blood |
| The Specific Disease |
Behcet disease |
| The Expression Level of Disease Section Compare with the Healthy Individual Tissue |
p-value: 0.164066345;
Fold-change: 0.051515059;
Z-score: 0.375007926
|
| Disease-specific Antigen Abundances |
|
Click to View the Clearer Original Diagram
|
|
|
Autosomal dominant monocytopenia [ICD-11: 4B04]
Click to Show/Hide
| Differential expression pattern of antigen in diseases |
| The Studied Tissue |
Whole blood |
| The Specific Disease |
Autosomal dominant monocytopenia |
| The Expression Level of Disease Section Compare with the Healthy Individual Tissue |
p-value: 0.041008021;
Fold-change: 0.14583286;
Z-score: 2.092575274
|
| Disease-specific Antigen Abundances |
|
Click to View the Clearer Original Diagram
|
|
|
ICD Disease Classification 5
Click to Show/Hide the 5 Disease of This Class
Type 2 diabetes [ICD-11: 5A11]
Click to Show/Hide
| Differential expression pattern of antigen in diseases |
| The Studied Tissue |
Liver |
| The Specific Disease |
Type 2 diabetes |
| The Expression Level of Disease Section Compare with the Healthy Individual Tissue |
p-value: 0.39198187;
Fold-change: -0.11222421;
Z-score: -0.413392765
|
| Disease-specific Antigen Abundances |
|
Click to View the Clearer Original Diagram
|
|
|
Polycystic ovary syndrome [ICD-11: 5A80.1]
Click to Show/Hide
| Differential expression pattern of antigen in diseases |
| The Studied Tissue |
Vastus lateralis muscle |
| The Specific Disease |
Polycystic ovary syndrome |
| The Expression Level of Disease Section Compare with the Healthy Individual Tissue |
p-value: 0.785380875;
Fold-change: -0.025121912;
Z-score: -0.134764051
|
| Disease-specific Antigen Abundances |
|
Click to View the Clearer Original Diagram
|
|
|
Obesity [ICD-11: 5B81]
Click to Show/Hide
| Differential expression pattern of antigen in diseases |
| The Studied Tissue |
Subcutaneous Adipose |
| The Specific Disease |
Obesity |
| The Expression Level of Disease Section Compare with the Healthy Individual Tissue |
p-value: 0.992777754;
Fold-change: -0.033269701;
Z-score: -0.24471621
|
| Disease-specific Antigen Abundances |
|
Click to View the Clearer Original Diagram
|
|
|
Pompe disease [ICD-11: 5C51.3]
Click to Show/Hide
| Differential expression pattern of antigen in diseases |
| The Studied Tissue |
Biceps muscle |
| The Specific Disease |
Pompe disease |
| The Expression Level of Disease Section Compare with the Healthy Individual Tissue |
p-value: 0.268432425;
Fold-change: -0.121029522;
Z-score: -0.447271083
|
| Disease-specific Antigen Abundances |
|
Click to View the Clearer Original Diagram
|
|
|
Batten disease [ICD-11: 5C56.1]
Click to Show/Hide
| Differential expression pattern of antigen in diseases |
| The Studied Tissue |
Whole blood |
| The Specific Disease |
Batten disease |
| The Expression Level of Disease Section Compare with the Healthy Individual Tissue |
p-value: 0.142870975;
Fold-change: -0.073854997;
Z-score: -0.367048116
|
| Disease-specific Antigen Abundances |
|
Click to View the Clearer Original Diagram
|
|
|
ICD Disease Classification 6
Click to Show/Hide the 2 Disease of This Class
Autism [ICD-11: 6A02]
Click to Show/Hide
| Differential expression pattern of antigen in diseases |
| The Studied Tissue |
Whole blood |
| The Specific Disease |
Autism |
| The Expression Level of Disease Section Compare with the Healthy Individual Tissue |
p-value: 0.141991452;
Fold-change: -0.068856166;
Z-score: -0.252594892
|
| Disease-specific Antigen Abundances |
|
Click to View the Clearer Original Diagram
|
|
|
Anxiety disorder [ICD-11: 6B00-6B0Z]
Click to Show/Hide
| Differential expression pattern of antigen in diseases |
| The Studied Tissue |
Whole blood |
| The Specific Disease |
Anxiety disorder |
| The Expression Level of Disease Section Compare with the Healthy Individual Tissue |
p-value: 0.227296053;
Fold-change: 0.069562436;
Z-score: 0.24974894
|
| Disease-specific Antigen Abundances |
|
Click to View the Clearer Original Diagram
|
|
|
ICD Disease Classification 8
Click to Show/Hide the 7 Disease of This Class
Parkinson disease [ICD-11: 8A00]
Click to Show/Hide
| Differential expression pattern of antigen in diseases |
| The Studied Tissue |
Substantia nigra |
| The Specific Disease |
Parkinson disease |
| The Expression Level of Disease Section Compare with the Healthy Individual Tissue |
p-value: 0.024242127;
Fold-change: -0.776091928;
Z-score: -0.94333867
|
| Disease-specific Antigen Abundances |
|
Click to View the Clearer Original Diagram
|
|
|
Huntington disease [ICD-11: 8A01]
Click to Show/Hide
| Differential expression pattern of antigen in diseases |
| The Studied Tissue |
Whole blood |
| The Specific Disease |
Huntington disease |
| The Expression Level of Disease Section Compare with the Healthy Individual Tissue |
p-value: 0.717714507;
Fold-change: 0.100629233;
Z-score: 0.522359631
|
| Disease-specific Antigen Abundances |
|
Click to View the Clearer Original Diagram
|
|
|
Alzheimer disease [ICD-11: 8A20]
Click to Show/Hide
| Differential expression pattern of antigen in diseases |
| The Studied Tissue |
Entorhinal cortex |
| The Specific Disease |
Alzheimer disease |
| The Expression Level of Disease Section Compare with the Healthy Individual Tissue |
p-value: 2.22E-05;
Fold-change: -0.081386073;
Z-score: -0.401652766
|
| Disease-specific Antigen Abundances |
|
Click to View the Clearer Original Diagram
|
|
|
Seizure [ICD-11: 8A60-8A6Z]
Click to Show/Hide
| Differential expression pattern of antigen in diseases |
| The Studied Tissue |
Whole blood |
| The Specific Disease |
Seizure |
| The Expression Level of Disease Section Compare with the Healthy Individual Tissue |
p-value: 0.696710563;
Fold-change: 0.074791958;
Z-score: 0.327673036
|
| Disease-specific Antigen Abundances |
|
Click to View the Clearer Original Diagram
|
|
|
Lateral sclerosis [ICD-11: 8B60.4]
Click to Show/Hide
| Differential expression pattern of antigen in diseases |
| The Studied Tissue |
Skin |
| The Specific Disease |
Lateral sclerosis |
| The Expression Level of Disease Section Compare with the Healthy Individual Tissue |
p-value: 0.148631648;
Fold-change: 0.32691598;
Z-score: 0.791840477
|
| Disease-specific Antigen Abundances |
|
Click to View the Clearer Original Diagram
|
|
|
| The Studied Tissue |
Cervical spinal cord |
| The Specific Disease |
Lateral sclerosis |
| The Expression Level of Disease Section Compare with the Healthy Individual Tissue |
p-value: 0.400107064;
Fold-change: -0.065519602;
Z-score: -0.316735009
|
| Disease-specific Antigen Abundances |
|
Click to View the Clearer Original Diagram
|
|
|
Muscular atrophy [ICD-11: 8C70]
Click to Show/Hide
| Differential expression pattern of antigen in diseases |
| The Studied Tissue |
Muscle |
| The Specific Disease |
Muscular atrophy |
| The Expression Level of Disease Section Compare with the Healthy Individual Tissue |
p-value: 0.005499958;
Fold-change: -0.159953079;
Z-score: -1.075949476
|
| Disease-specific Antigen Abundances |
|
Click to View the Clearer Original Diagram
|
|
|
Myopathy [ICD-11: 8C70.6]
Click to Show/Hide
| Differential expression pattern of antigen in diseases |
| The Studied Tissue |
Muscle |
| The Specific Disease |
Myopathy |
| The Expression Level of Disease Section Compare with the Healthy Individual Tissue |
p-value: 0.001391721;
Fold-change: 0.34371134;
Z-score: 2.364789234
|
| Disease-specific Antigen Abundances |
|
Click to View the Clearer Original Diagram
|
|
|
