
Antigen Information
General Information of This Antigen
| Antigen ID | TAR0TBGEV |
|||||
|---|---|---|---|---|---|---|
| Antigen Name | Macrophage mannose receptor 1 (MRC1) |
|||||
| Gene Name | MRC1 |
|||||
| Gene ID | ||||||
| Synonym | CLEC13D; CLEC13DL; MRC1L1; C-type lectin domain family 13 member D;C-type lectin domain family 13 member D-like;Human mannose receptor;Macrophage mannose receptor 1-like protein 1;CD_antigen=CD206 |
|||||
| Sequence |
MRLPLLLVFASVIPGAVLLLDTRQFLIYNEDHKRCVDAVSPSAVQTAACNQDAESQKFRW
VSESQIMSVAFKLCLGVPSKTDWVAITLYACDSKSEFQKWECKNDTLLGIKGEDLFFNYG NRQEKNIMLYKGSGLWSRWKIYGTTDNLCSRGYEAMYTLLGNANGATCAFPFKFENKWYA DCTSAGRSDGWLWCGTTTDYDTDKLFGYCPLKFEGSESLWNKDPLTSVSYQINSKSALTW HQARKSCQQQNAELLSITEIHEQTYLTGLTSSLTSGLWIGLNSLSFNSGWQWSDRSPFRY LNWLPGSPSAEPGKSCVSLNPGKNAKWENLECVQKLGYICKKGNTTLNSFVIPSESDVPT HCPSQWWPYAGHCYKIHRDEKKIQRDALTTCRKEGGDLTSIHTIEELDFIISQLGYEPND ELWIGLNDIKIQMYFEWSDGTPVTFTKWLRGEPSHENNRQEDCVVMKGKDGYWADRGCEW PLGYICKMKSRSQGPEIVEVEKGCRKGWKKHHFYCYMIGHTLSTFAEANQTCNNENAYLT TIEDRYEQAFLTSFVGLRPEKYFWTGLSDIQTKGTFQWTIEEEVRFTHWNSDMPGRKPGC VAMRTGIAGGLWDVLKCDEKAKFVCKHWAEGVTHPPKPTTTPEPKCPEDWGASSRTSLCF KLYAKGKHEKKTWFESRDFCRALGGDLASINNKEEQQTIWRLITASGSYHKLFWLGLTYG SPSEGFTWSDGSPVSYENWAYGEPNNYQNVEYCGELKGDPTMSWNDINCEHLNNWICQIQ KGQTPKPEPTPAPQDNPPVTEDGWVIYKDYQYYFSKEKETMDNARAFCKRNFGDLVSIQS ESEKKFLWKYVNRNDAQSAYFIGLLISLDKKFAWMDGSKVDYVSWATGEPNFANEDENCV TMYSNSGFWNDINCGYPNAFICQRHNSSINATTVMPTMPSVPSGCKEGWNFYSNKCFKIF GFMEEERKNWQEARKACIGFGGNLVSIQNEKEQAFLTYHMKDSTFSAWTGLNDVNSEHTF LWTDGRGVHYTNWGKGYPGGRRSSLSYEDADCVVIIGGASNEAGKWMDDTCDSKRGYICQ TRSDPSLTNPPATIQTDGFVKYGKSSYSLMRQKFQWHEAETYCKLHNSLIASILDPYSNA FAWLQMETSNERVWIALNSNLTDNQYTWTDKWRVRYTNWAADEPKLKSACVYLDLDGYWK TAHCNESFYFLCKRSDEIPATEPPQLPGRCPESDHTAWIPFHGHCYYIESSYTRNWGQAS LECLRMGSSLVSIESAAESSFLSYRVEPLKSKTNFWIGLFRNVEGTWLWINNSPVSFVNW NTGDPSGERNDCVALHASSGFWSNIHCSSYKGYICKRPKIIDAKPTHELLTTKADTRKMD PSKPSSNVAGVVIIVILLILTGAGLAAYFFYKKRRVHLPQEGAFENTLYFNSQSSPGTSD MKDLVGNIEQNEHSVI Click to Show/Hide
|
|||||
| Function |
Mediates the endocytosis of glycoproteins by macrophages. Binds both sulfated and non-sulfated polysaccharide chains. Acts as phagocytic receptor for bacteria, fungi and other pathogens. Acts as a receptor for Dengue virus envelope protein E.
Click to Show/Hide
|
|||||
| Uniprot Entry | ||||||
| HGNC ID | ||||||
| KEGG ID | ||||||
Each Antibody-drug Conjuate AND It's Component Related to This Antigen
Full List of The ADC Related to This Antigen
Undisclosed
| ADC Info | ADC Name | Payload | Target | Linker | Ref |
|---|---|---|---|---|---|
CD206-NAMPT inhibitor-based antibody drug conjugate |
NAMPT toxophore |
Nicotinamide phosphoribosyltransferase (NAMPT) |
Undisclosed |
[1] |
Tissue/Disease specific Abundances of This Antigen
Tissue specific Abundances of This Antigen
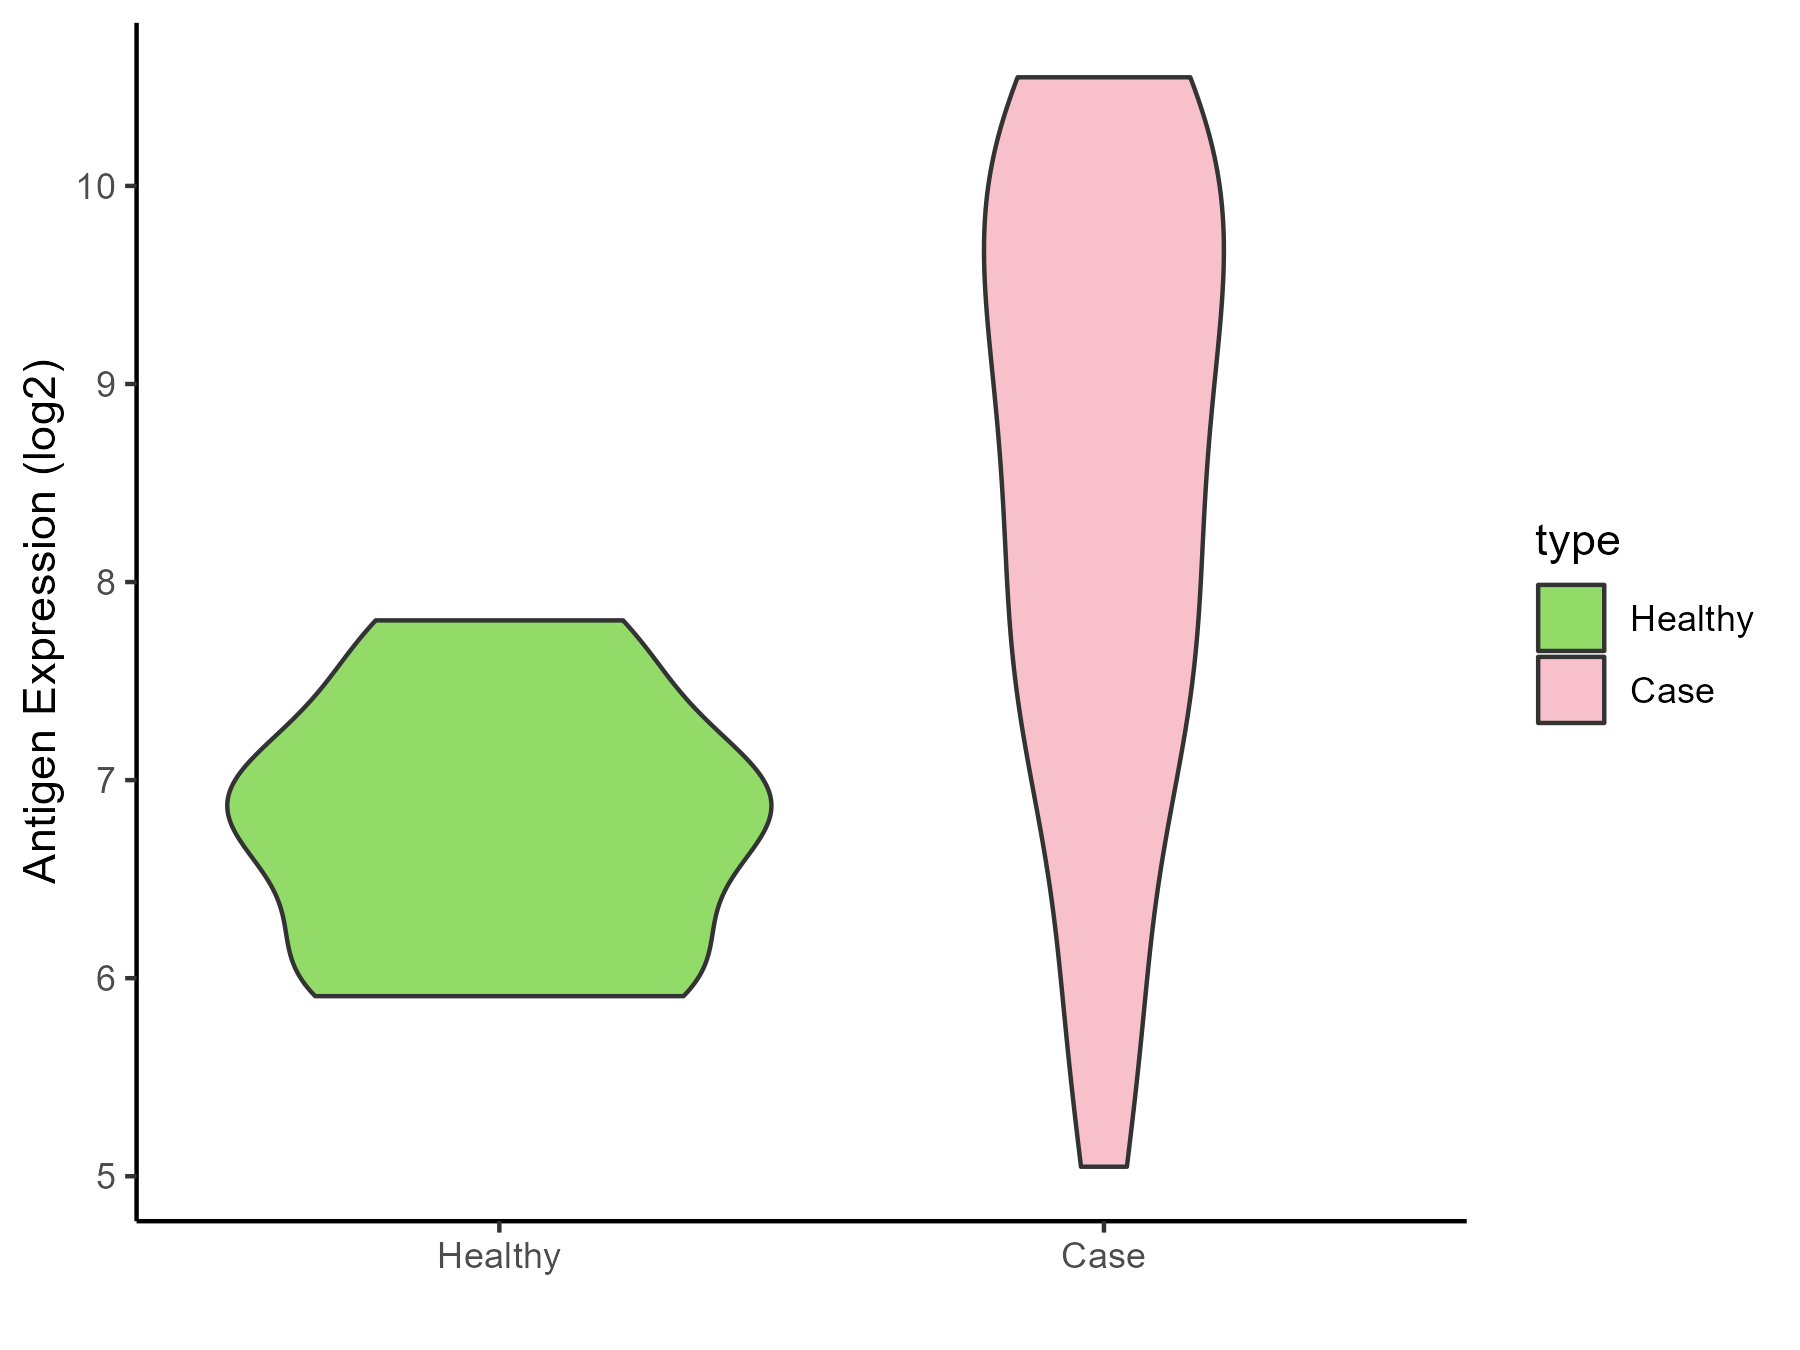
ICD Disease Classification 01
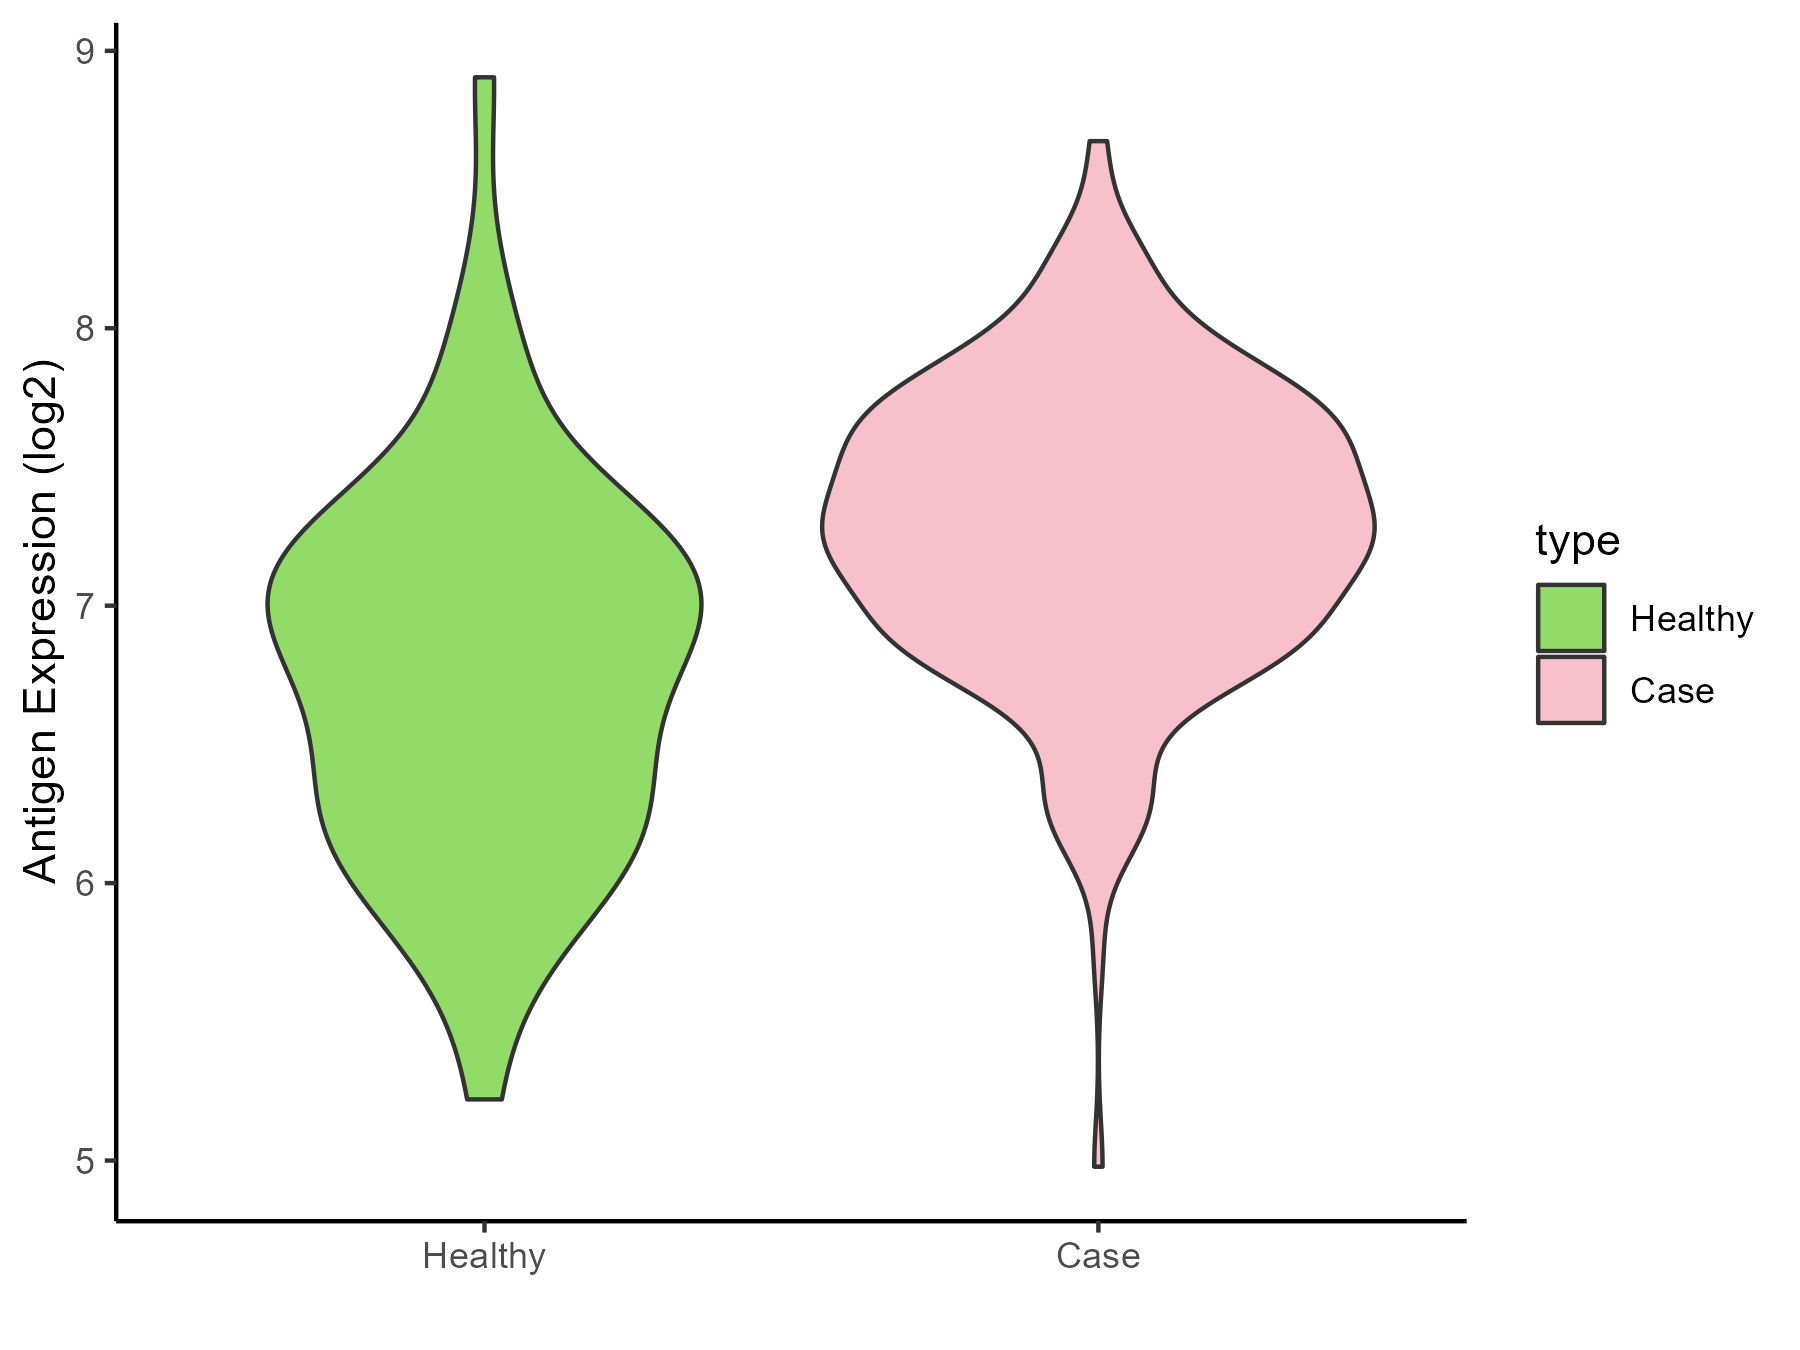
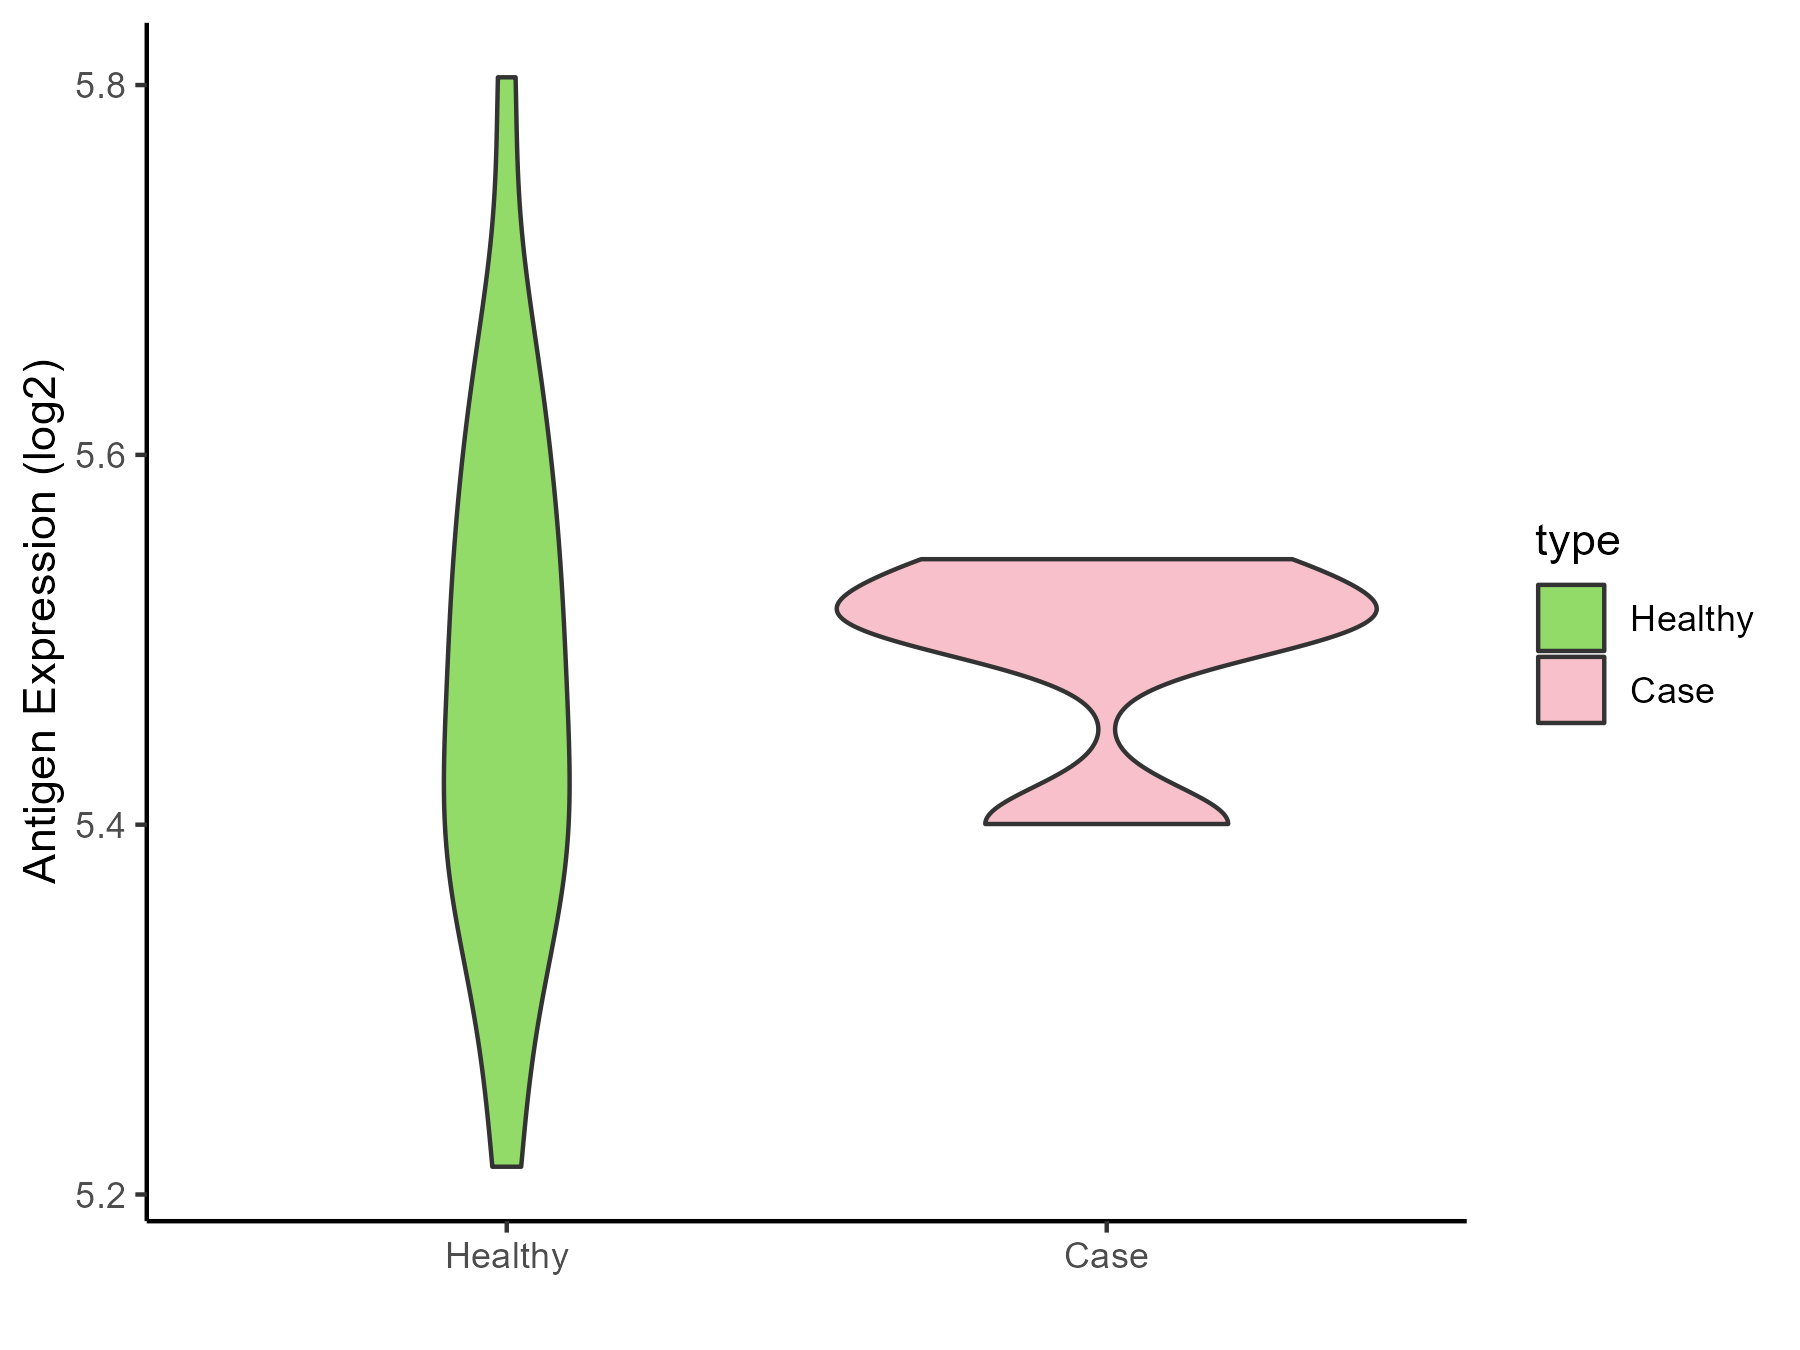
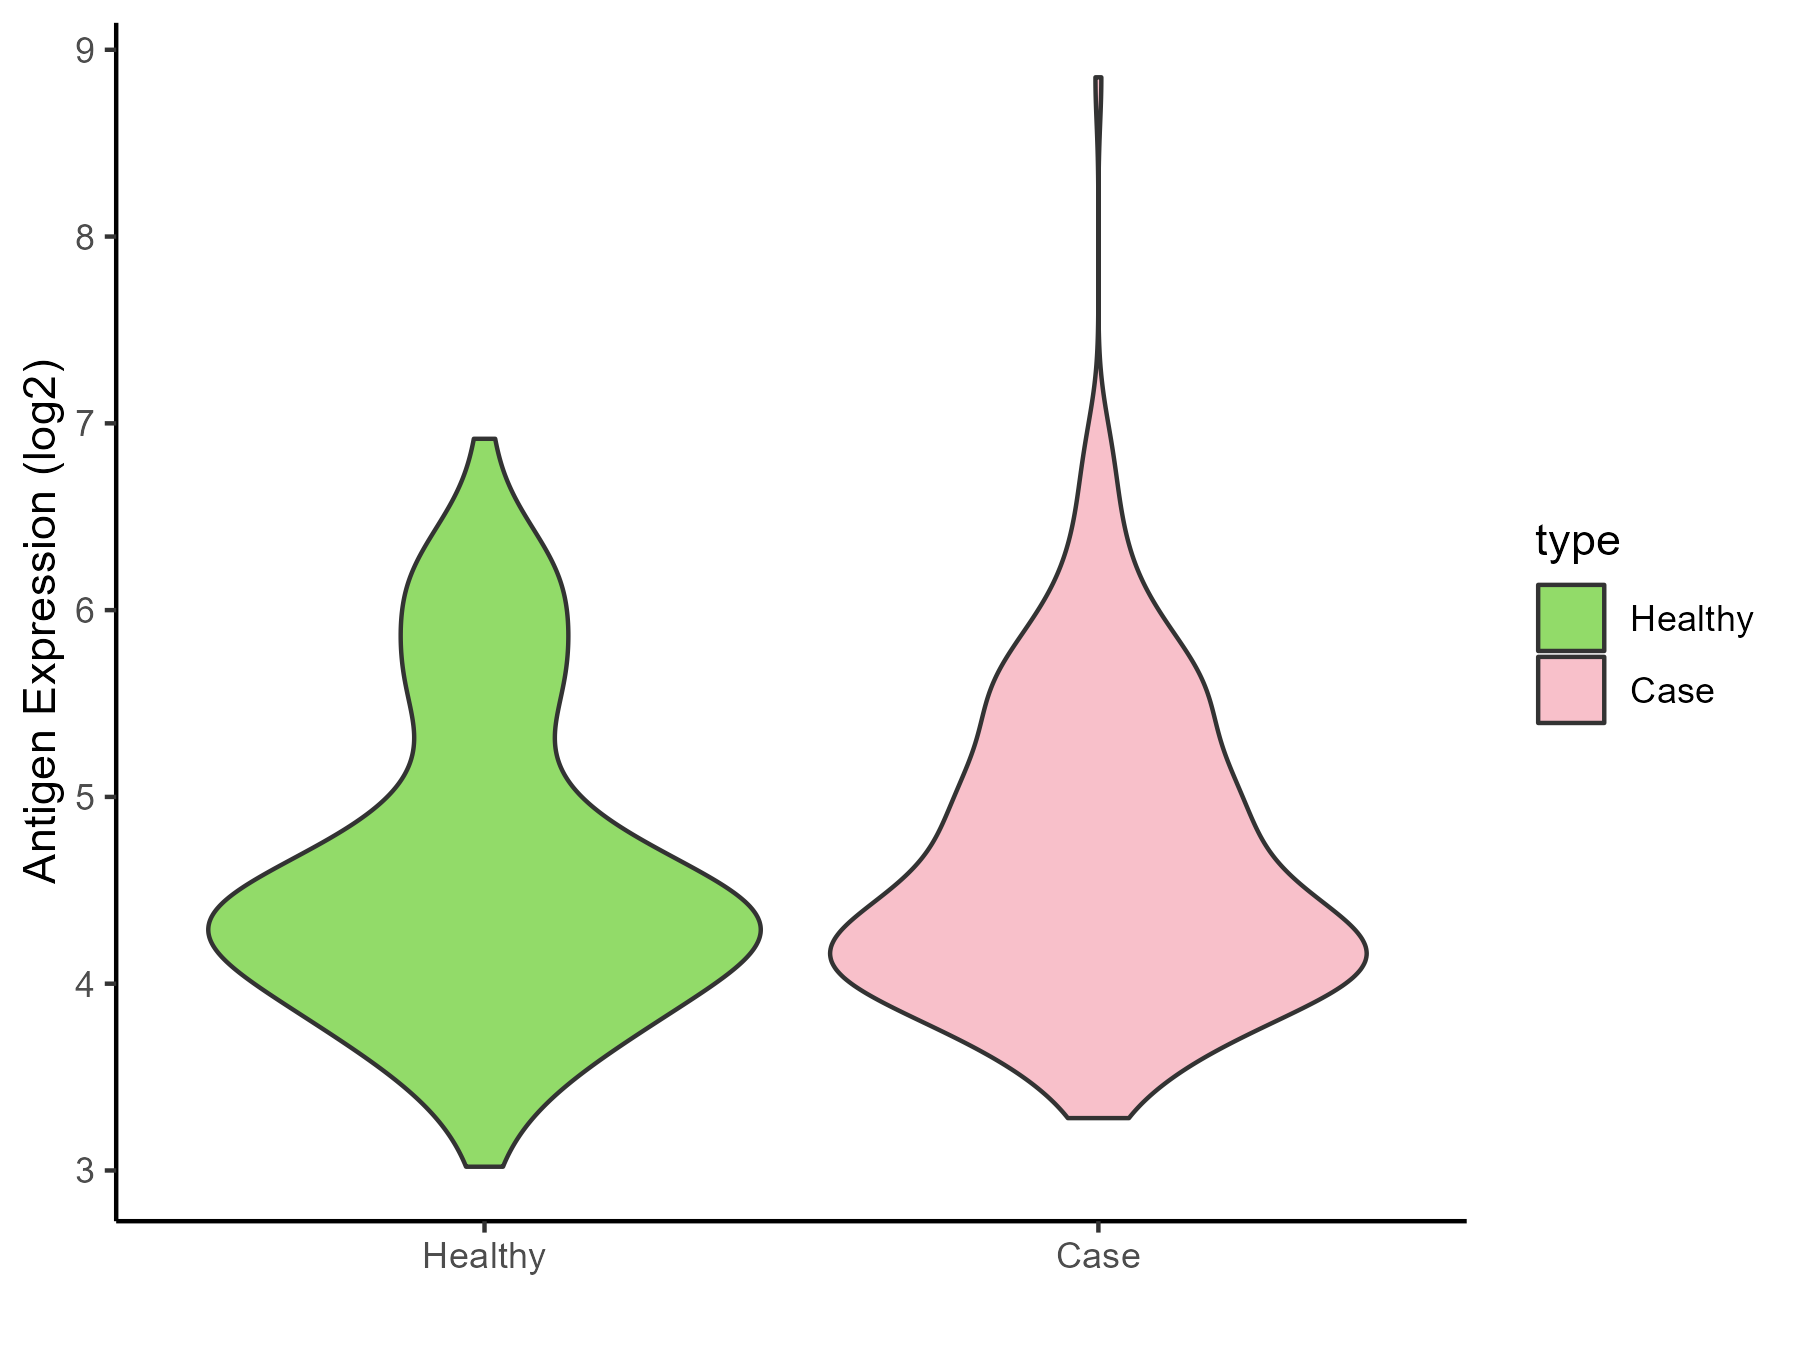
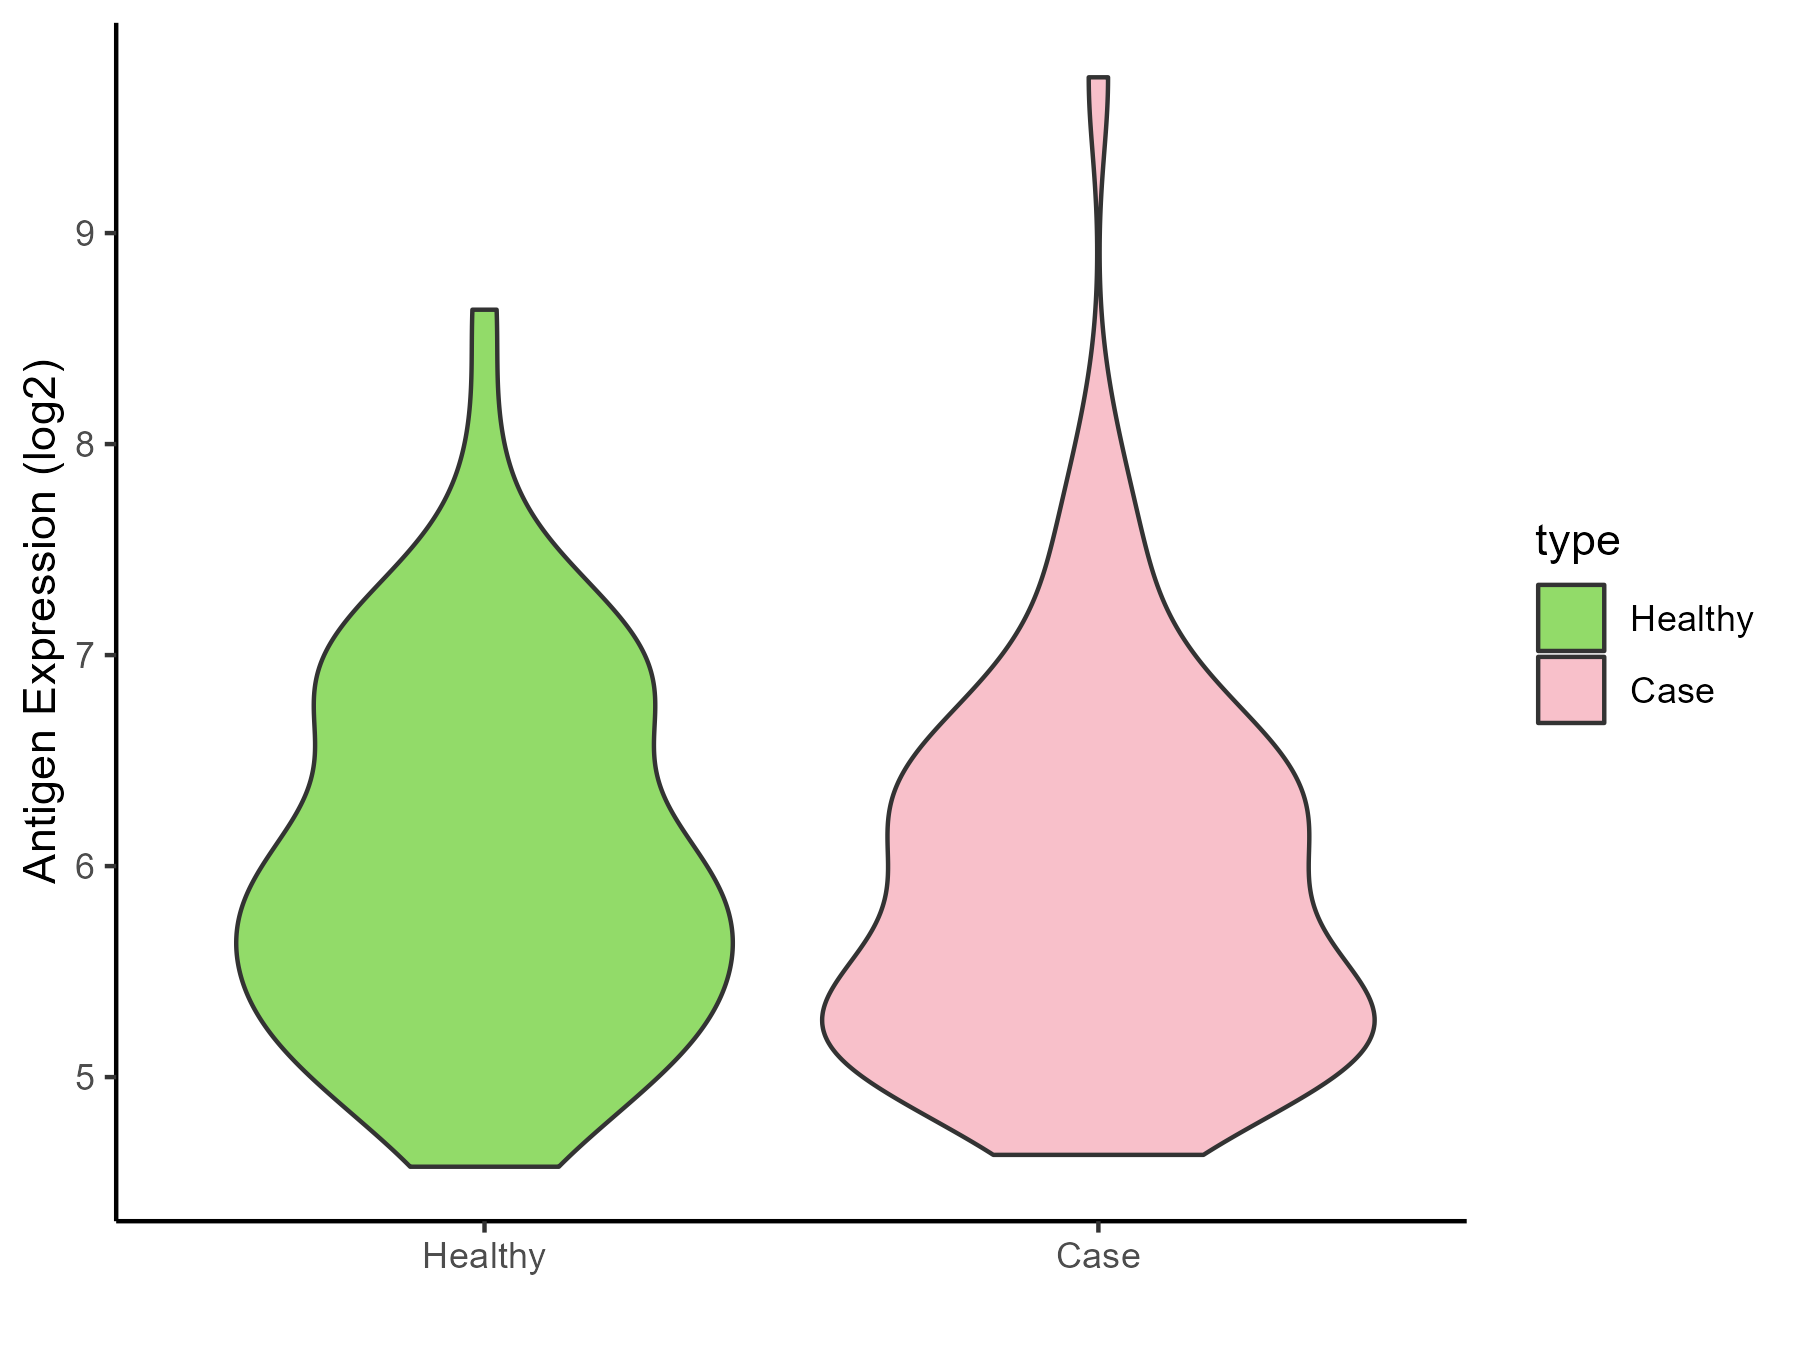
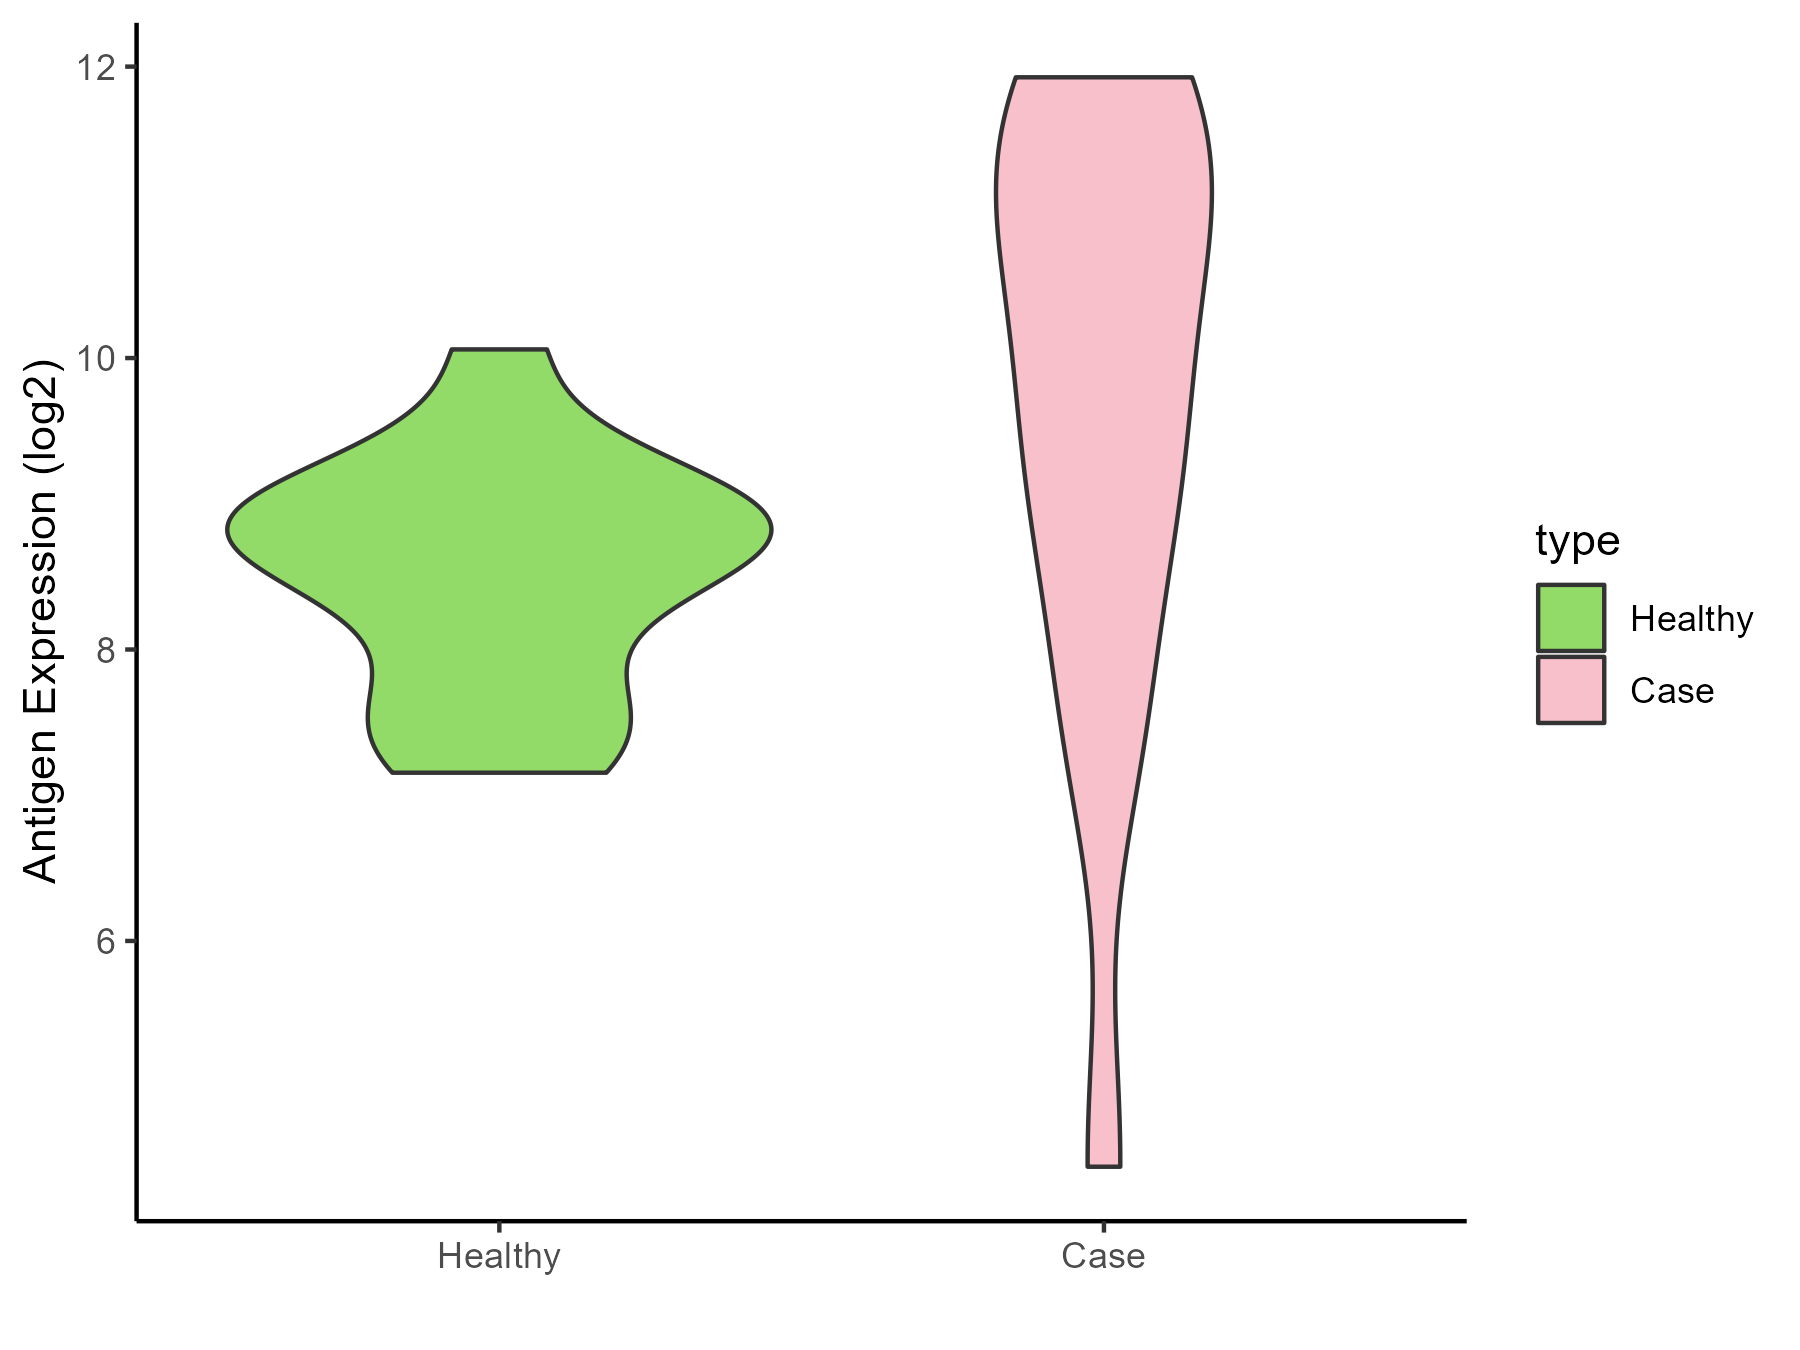
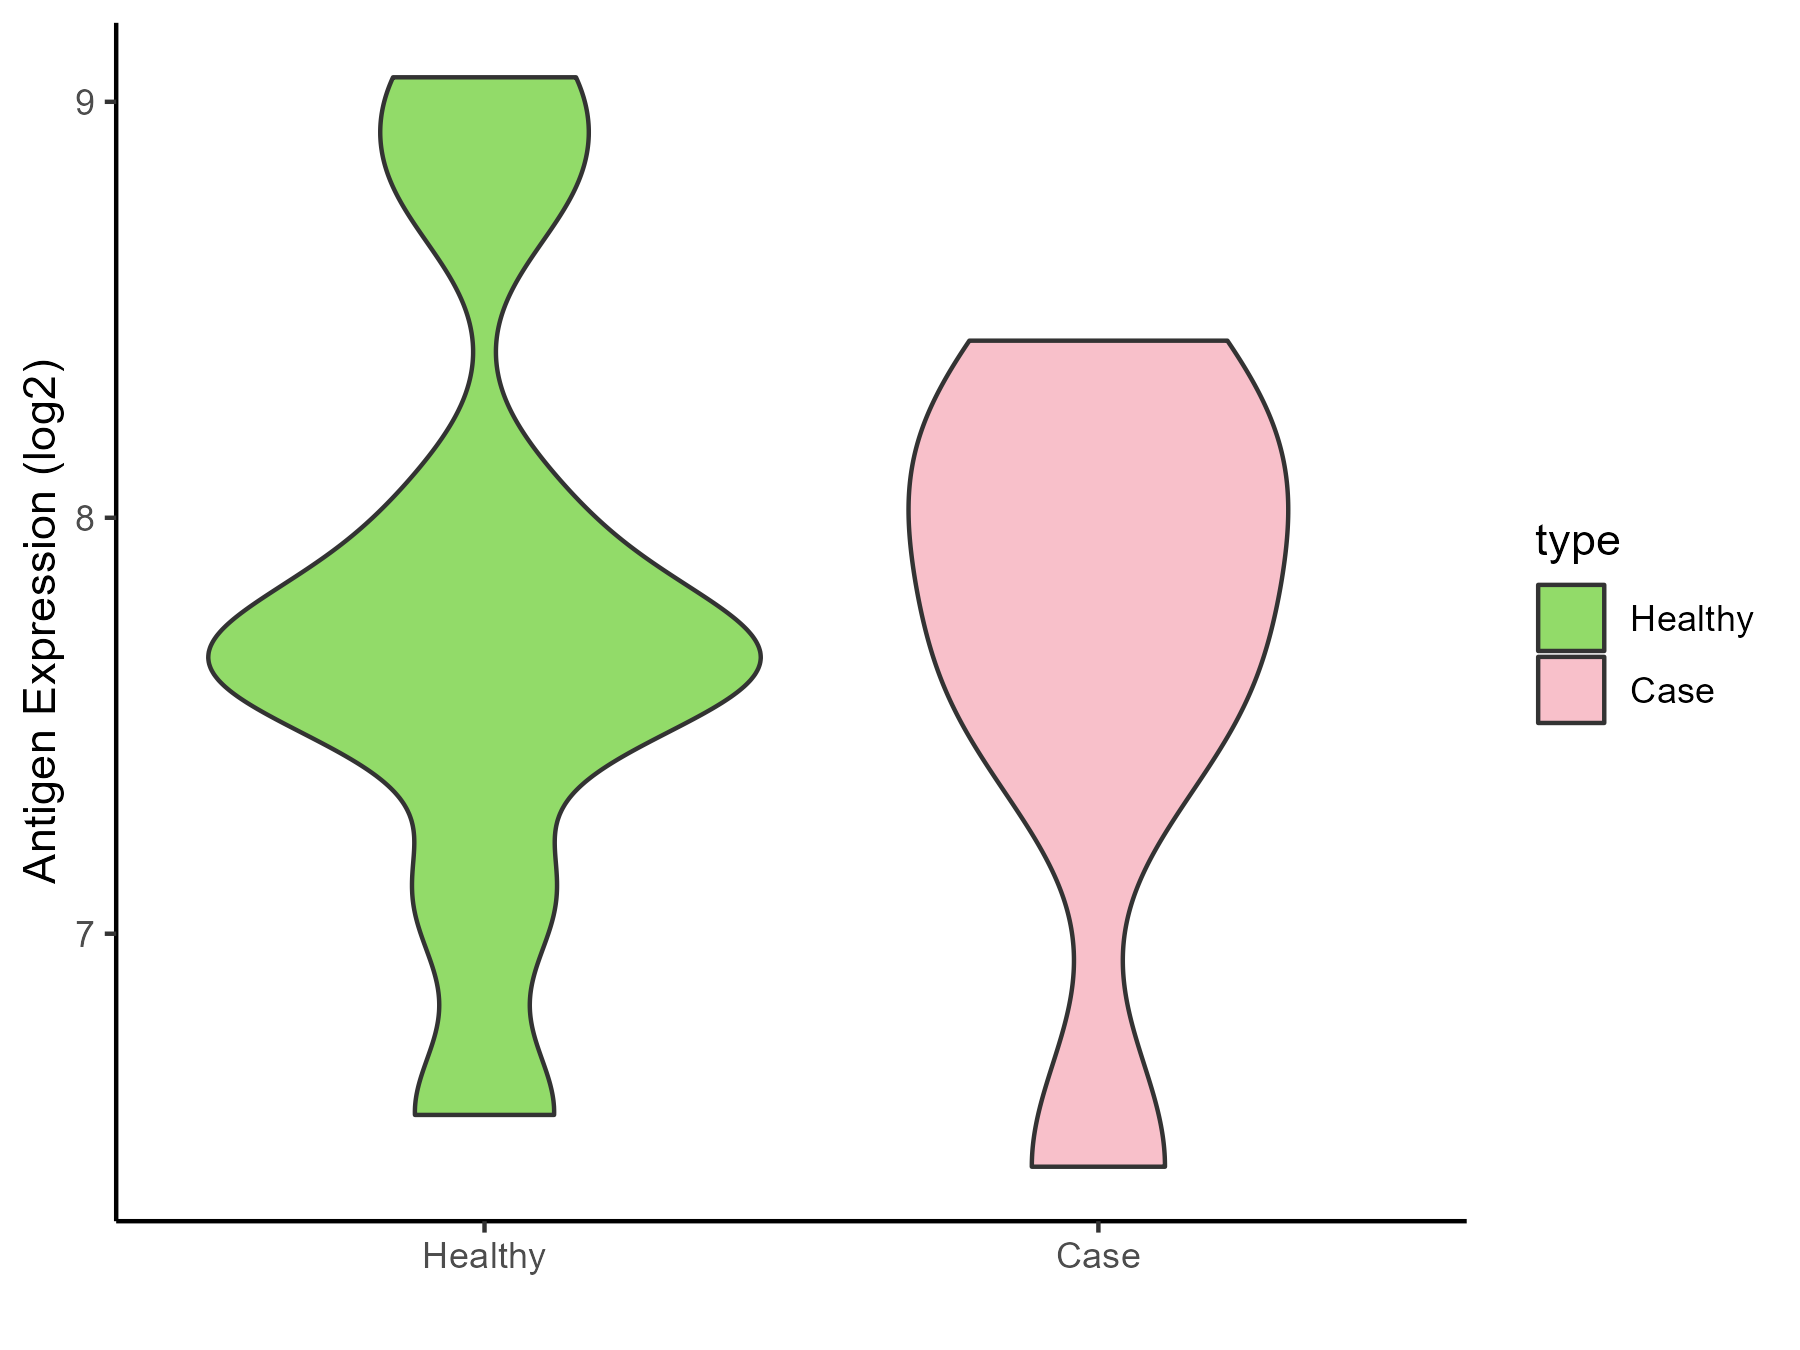
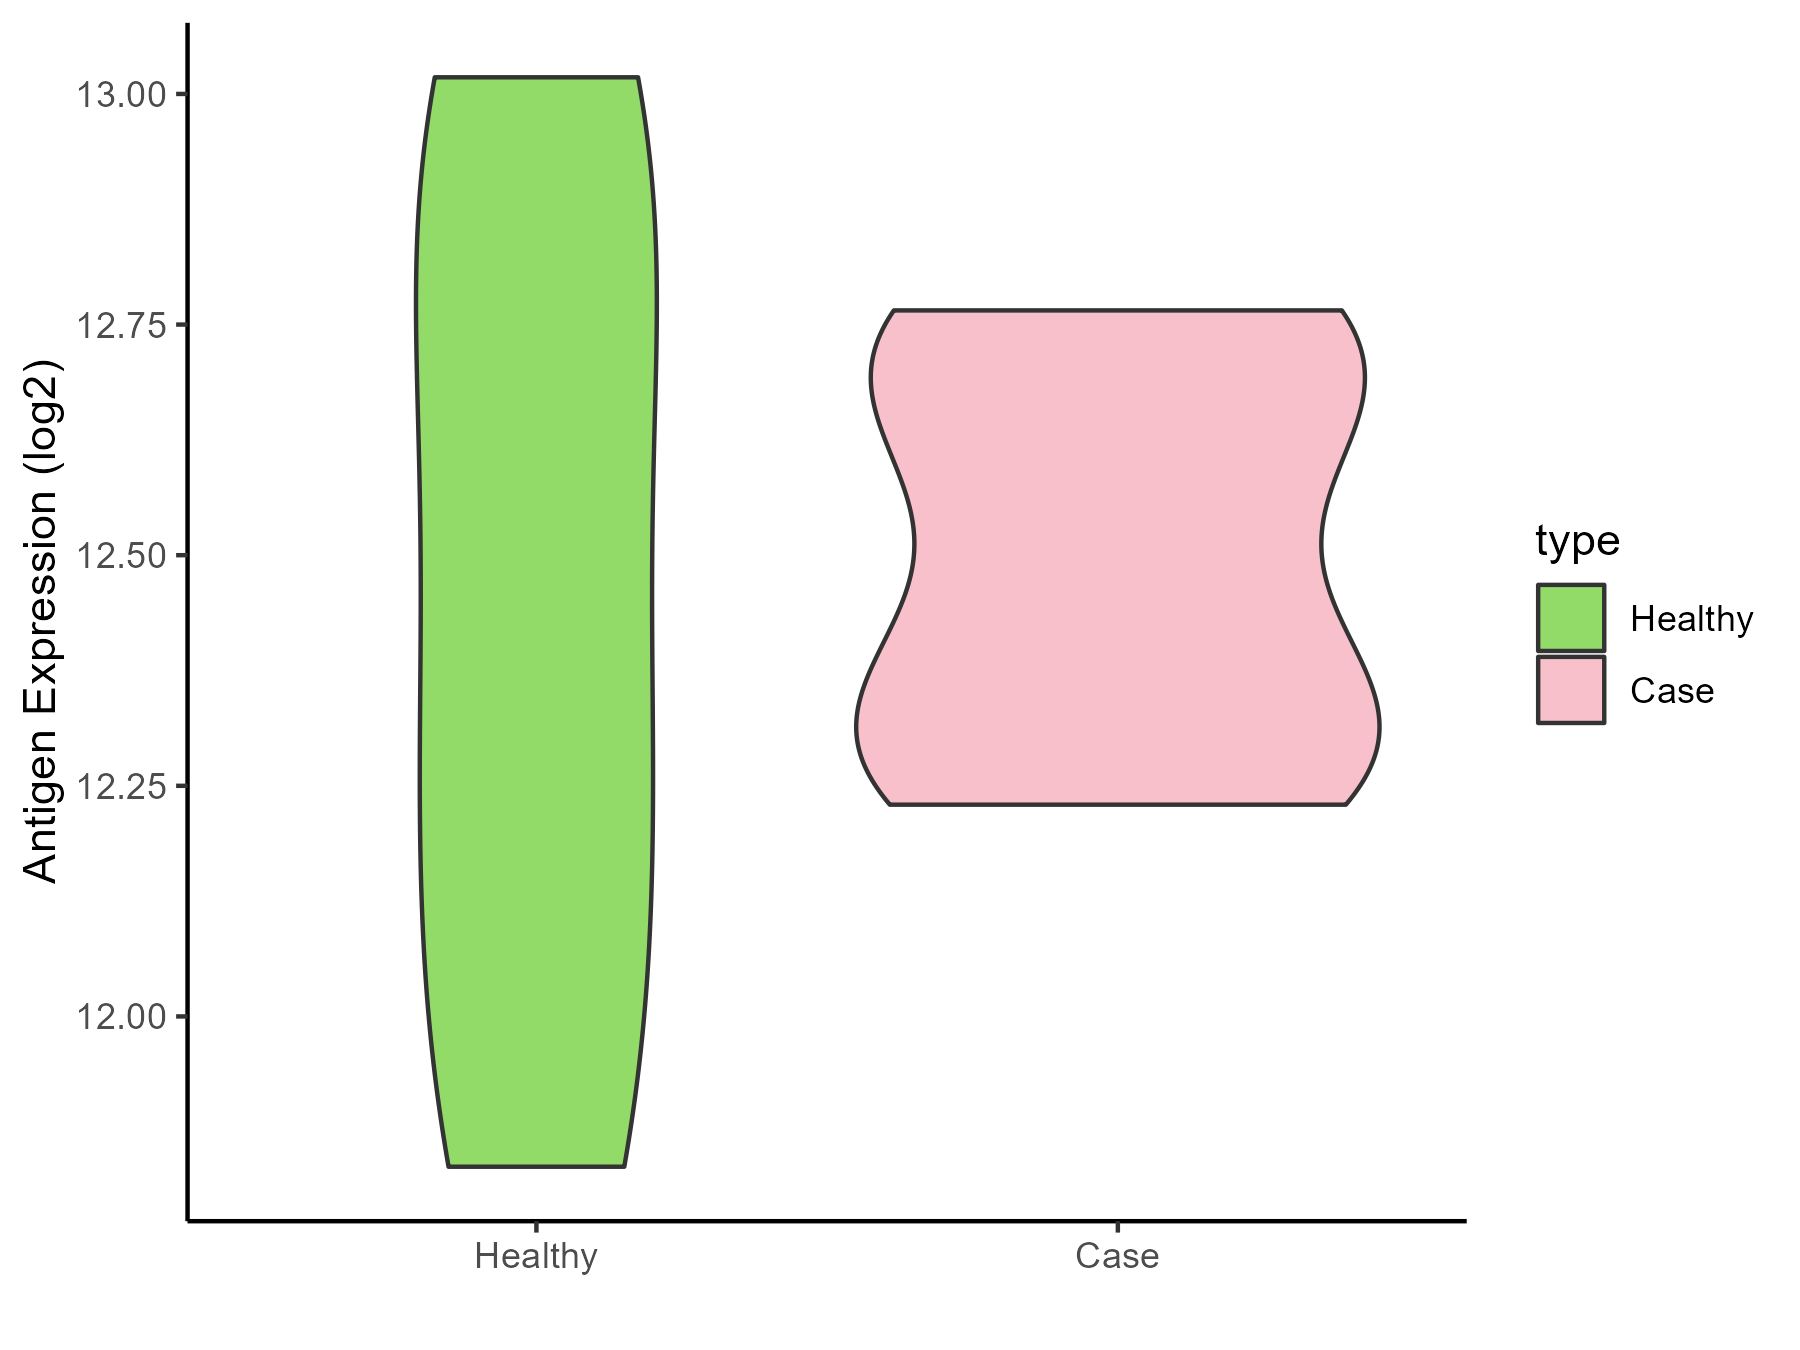
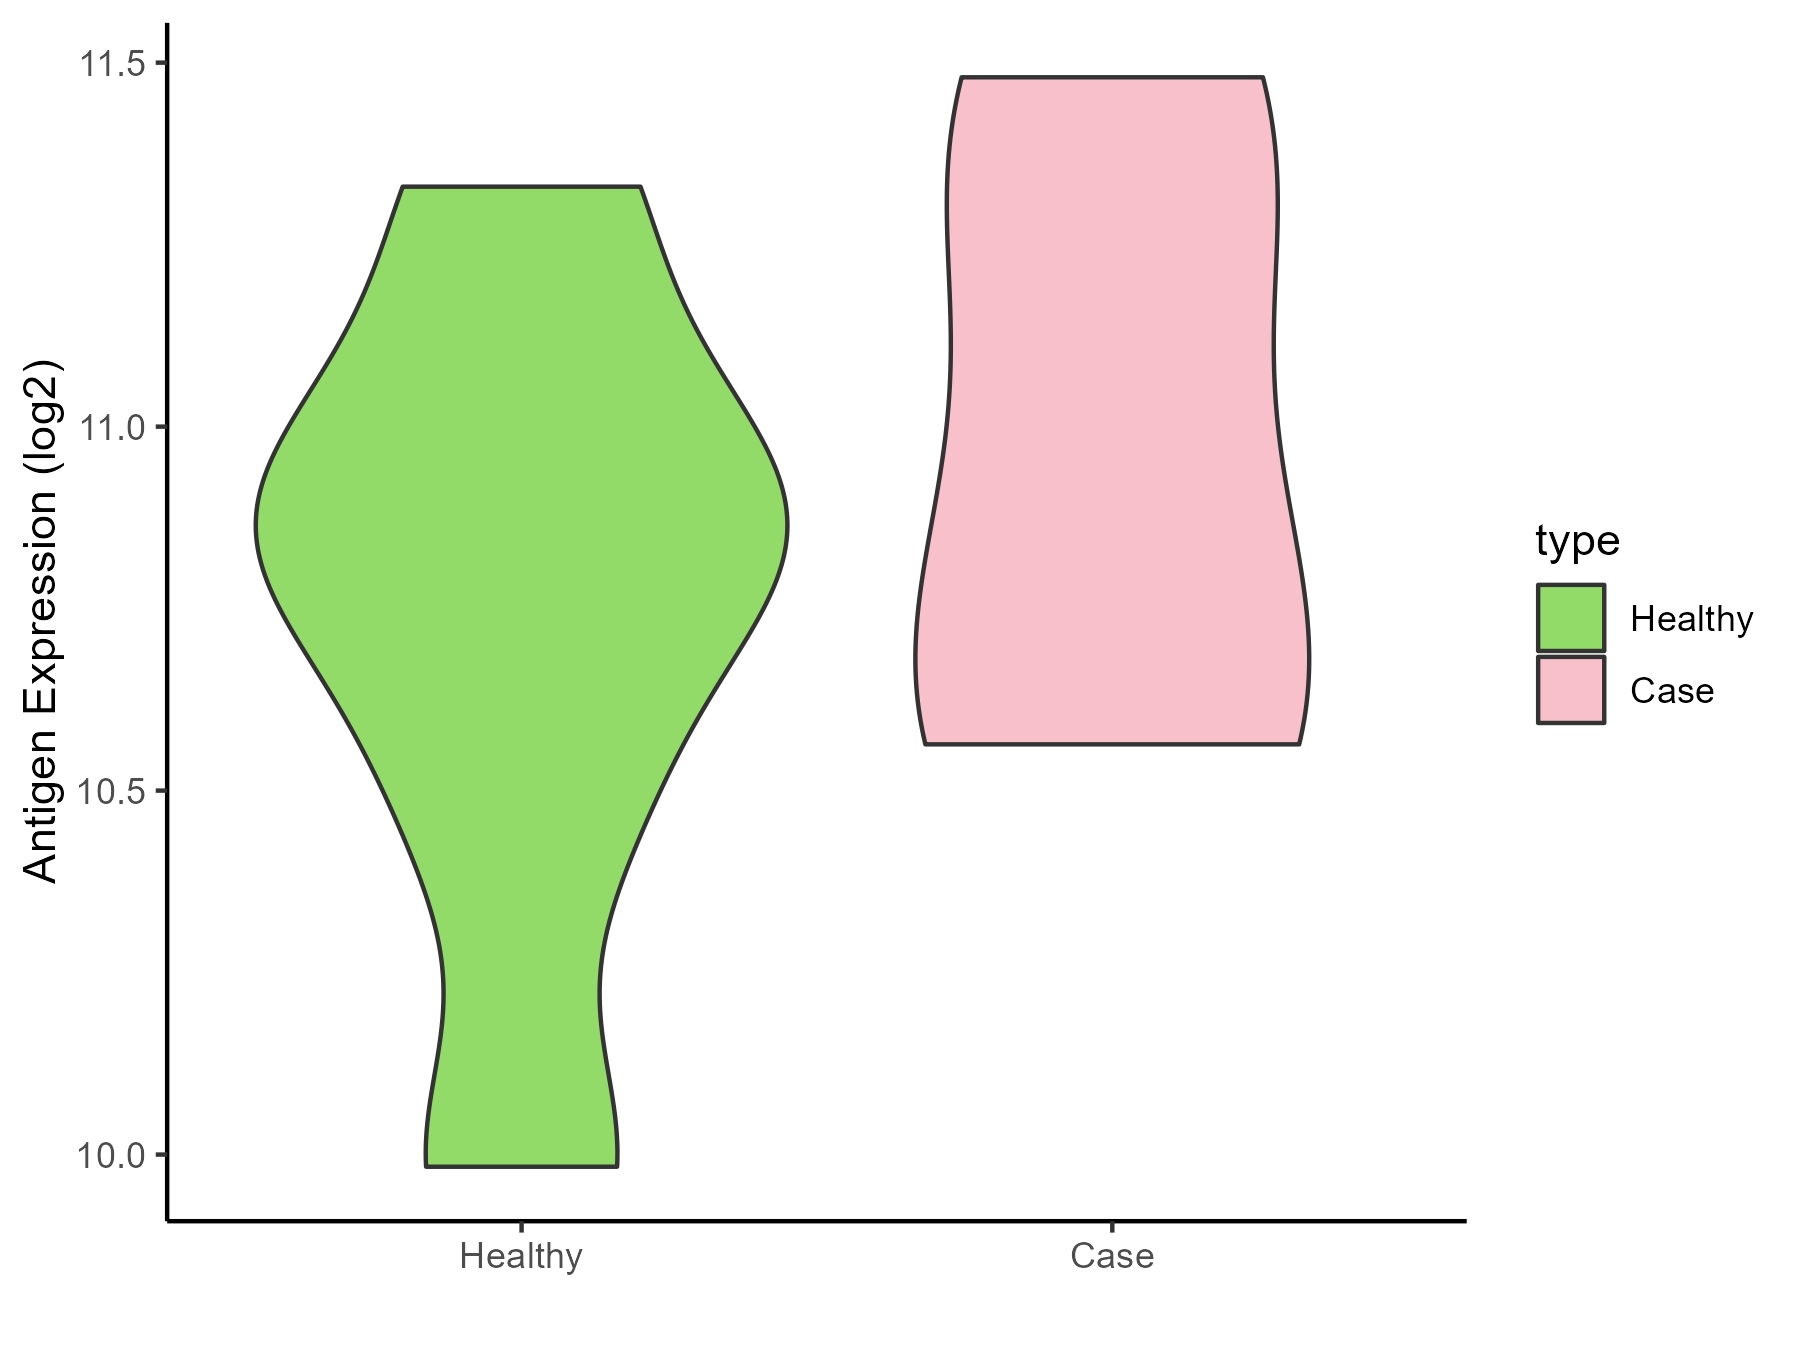
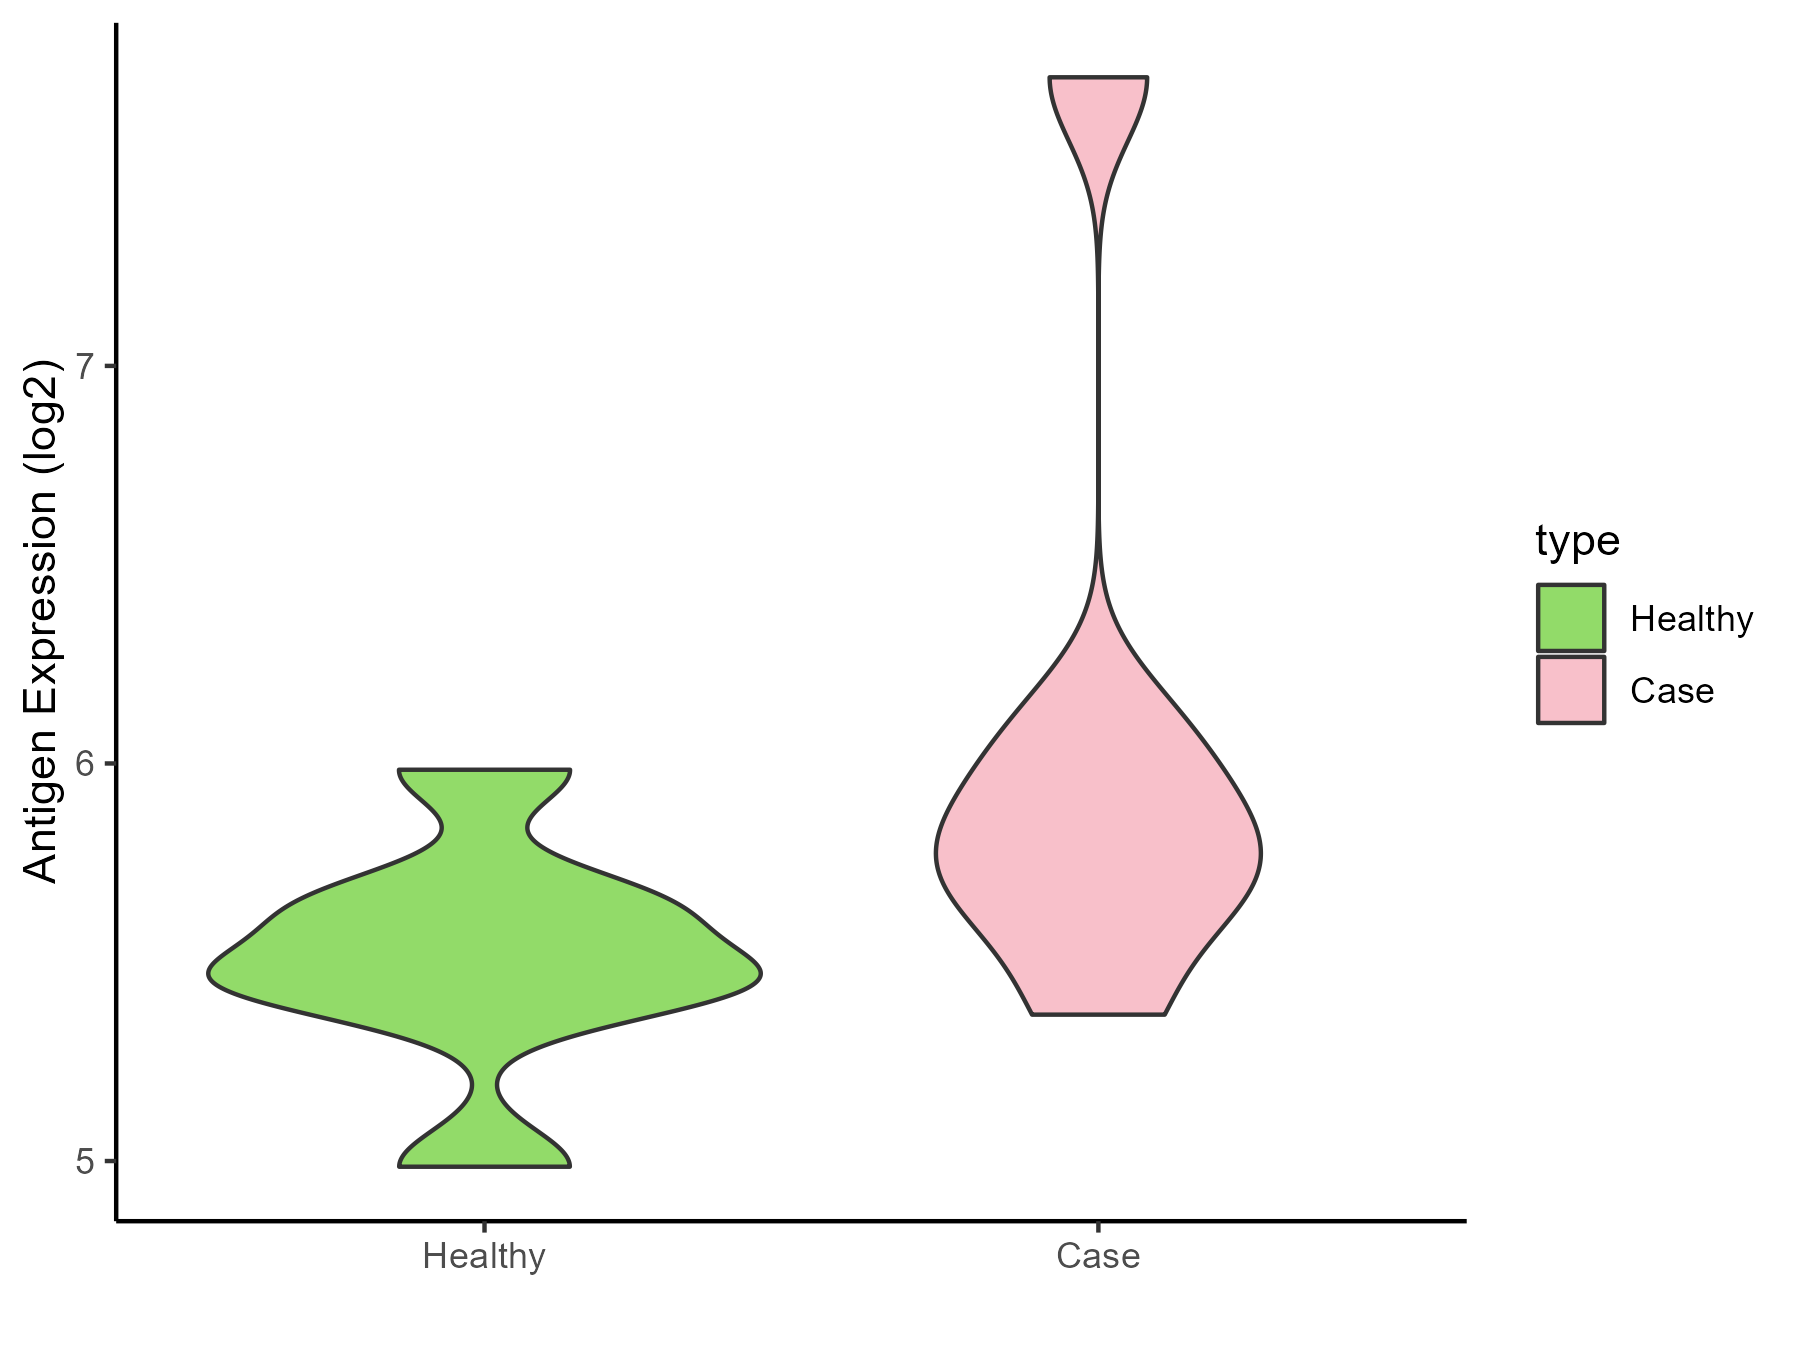
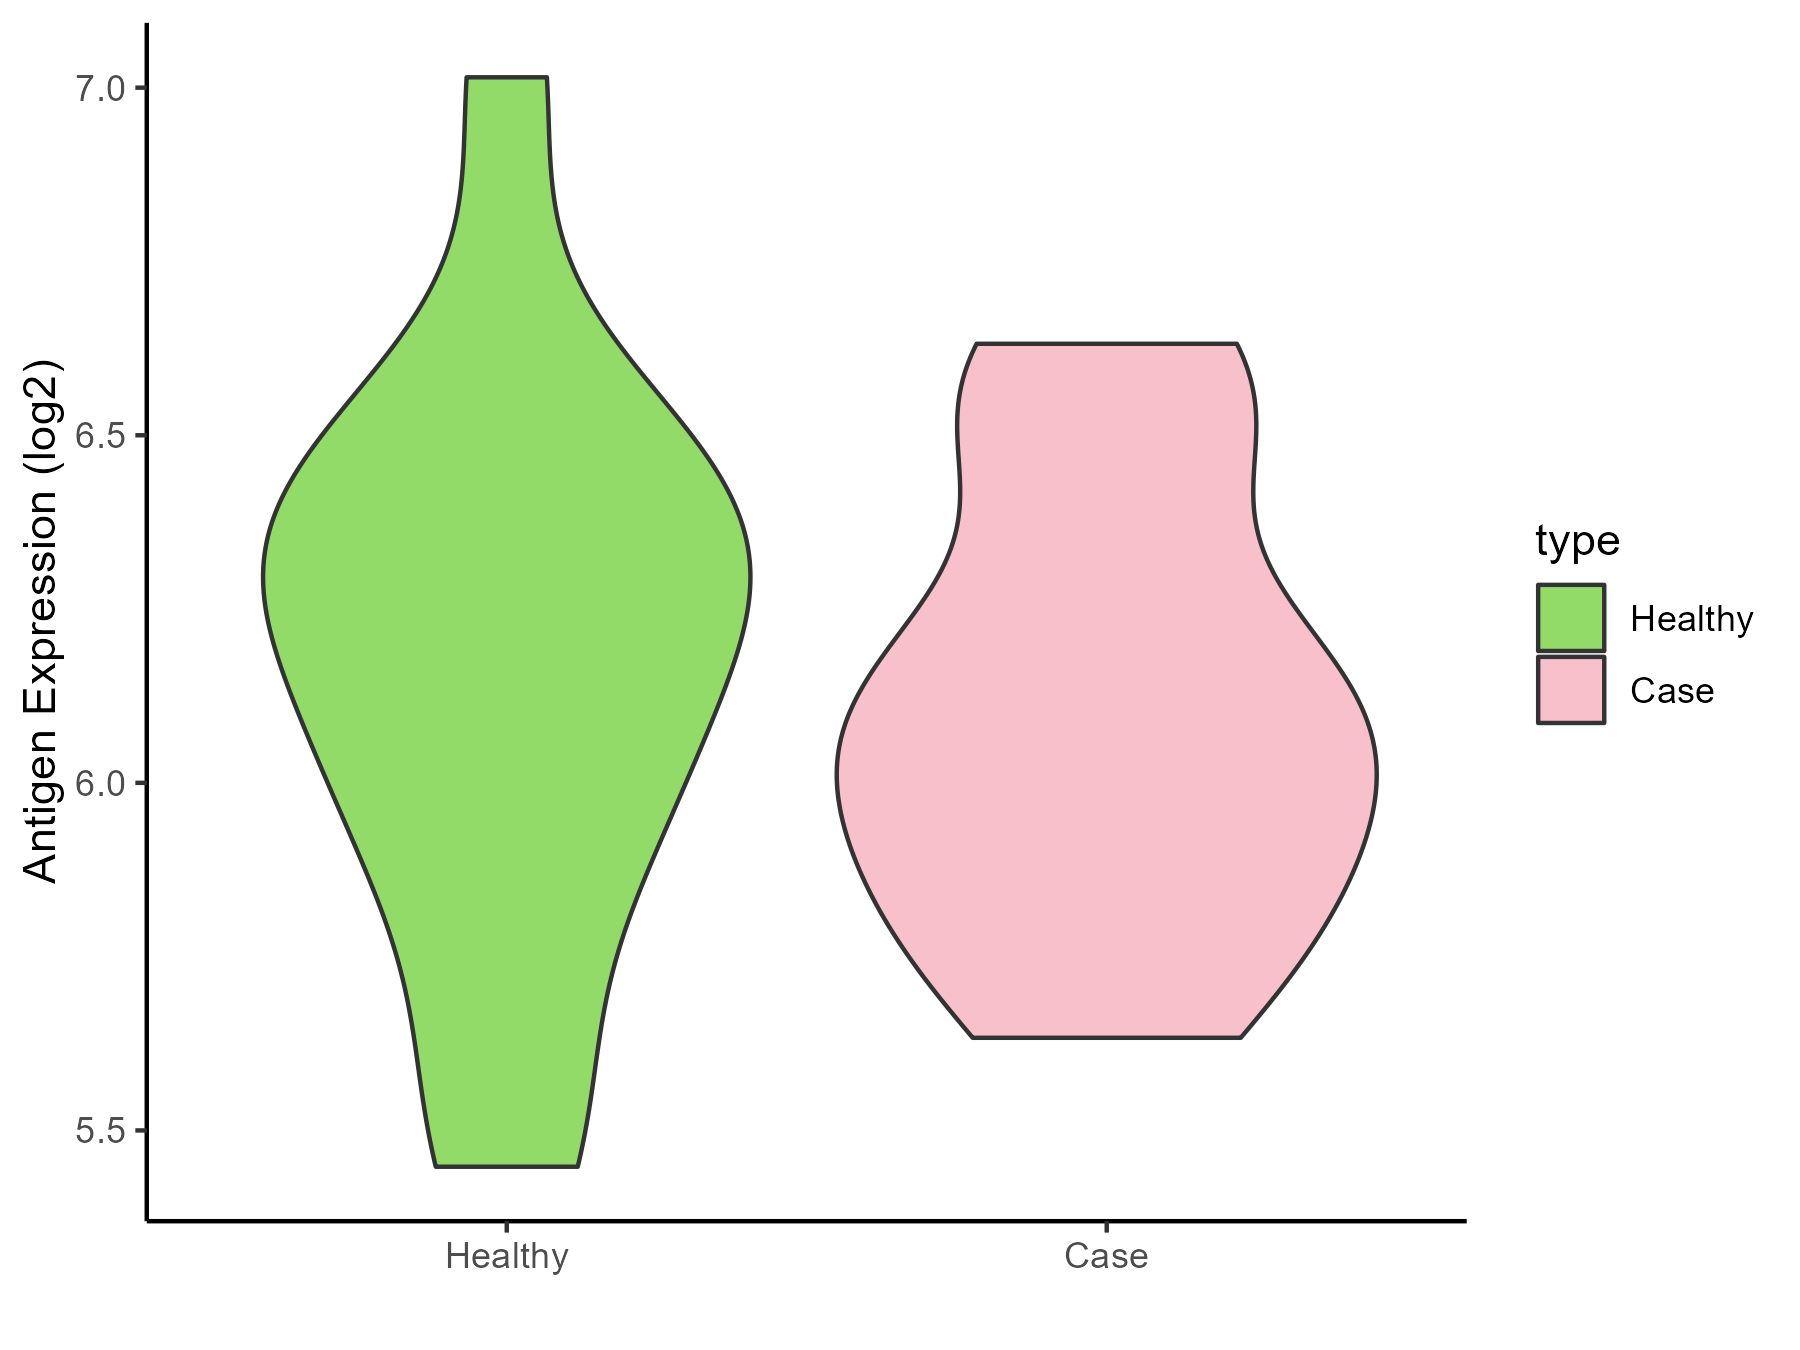
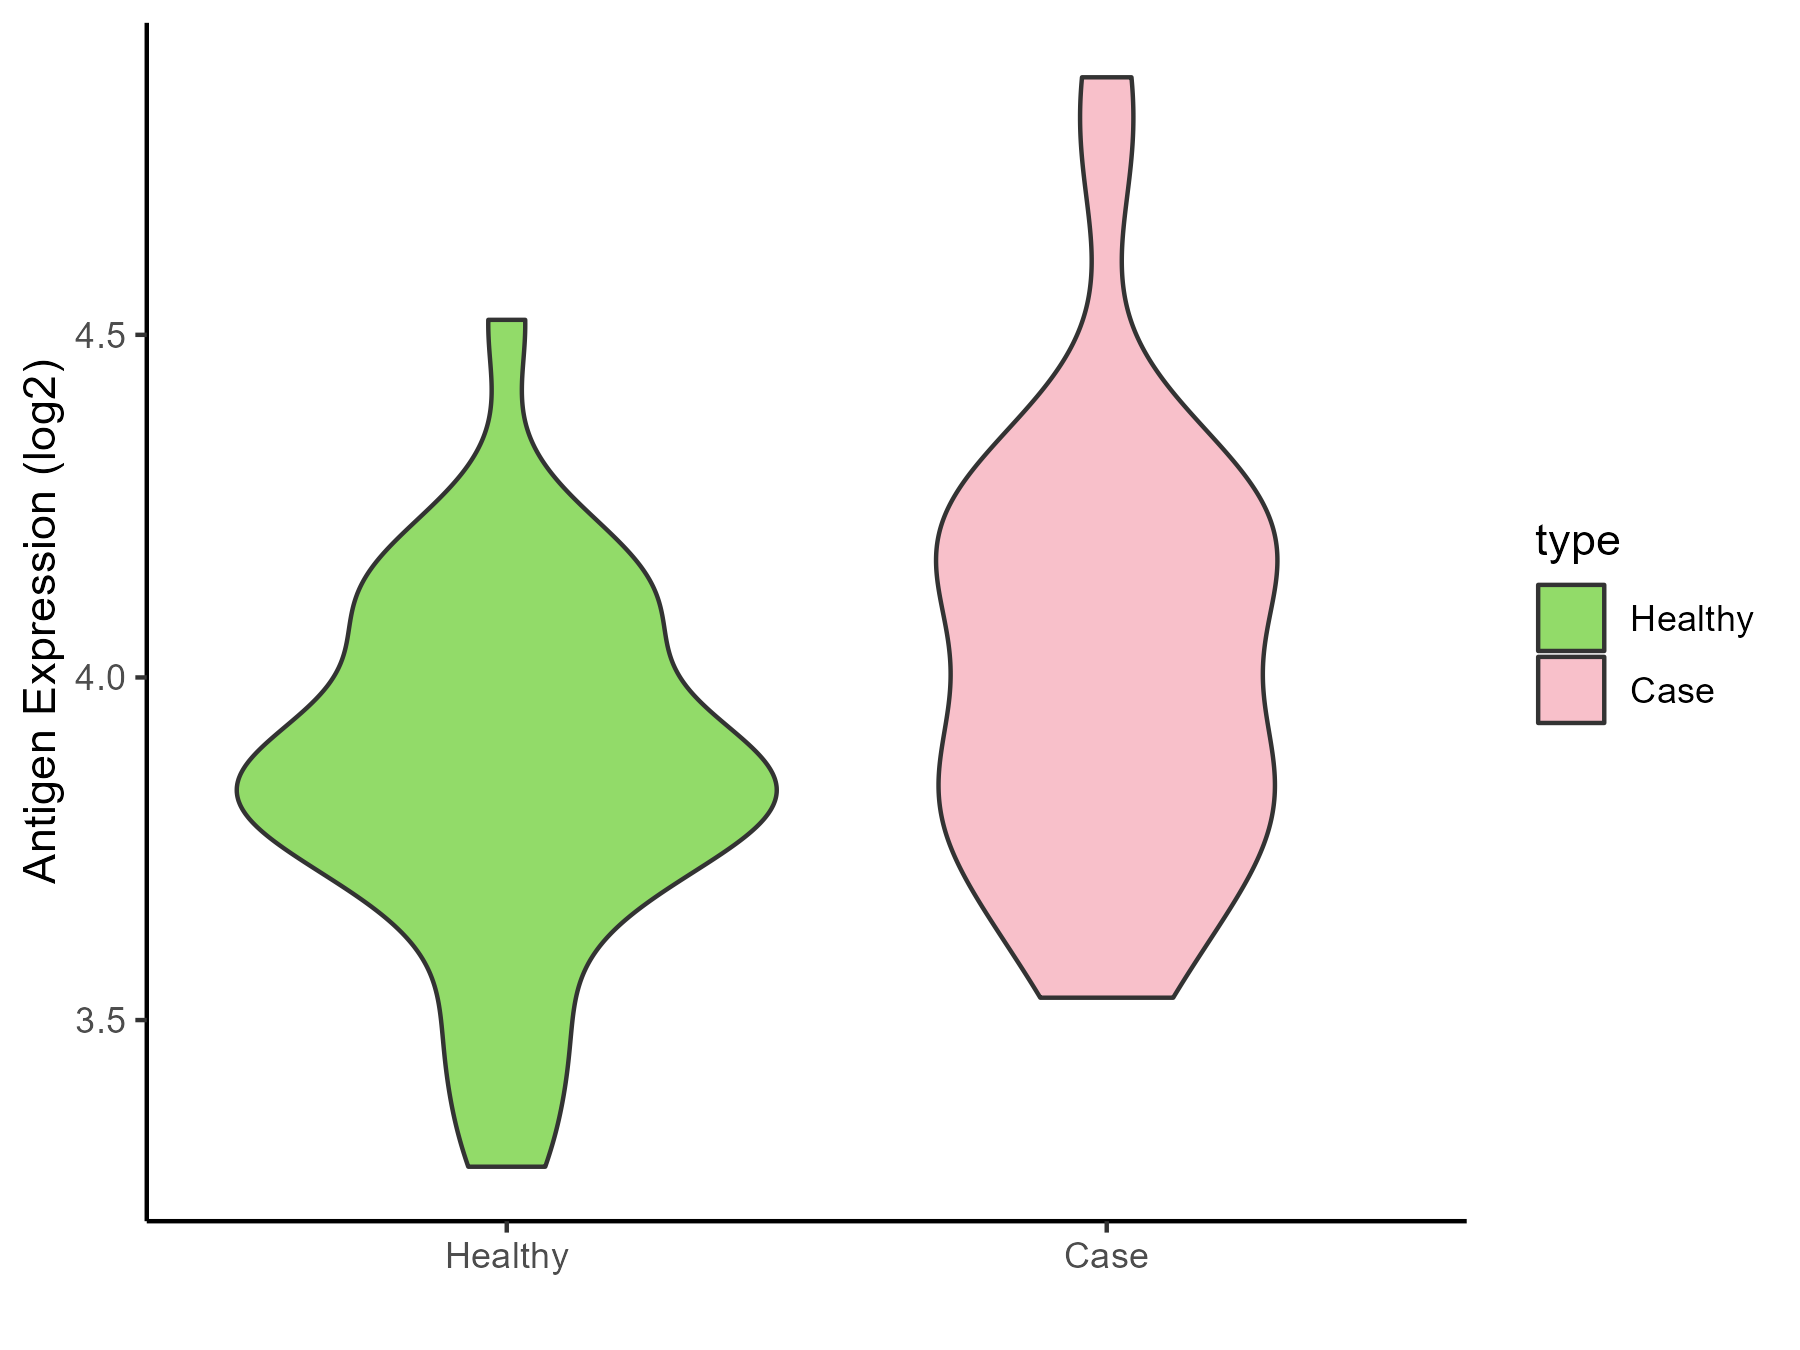
| Differential expression pattern of antigen in diseases | ||
| The Studied Tissue | Gingival | |
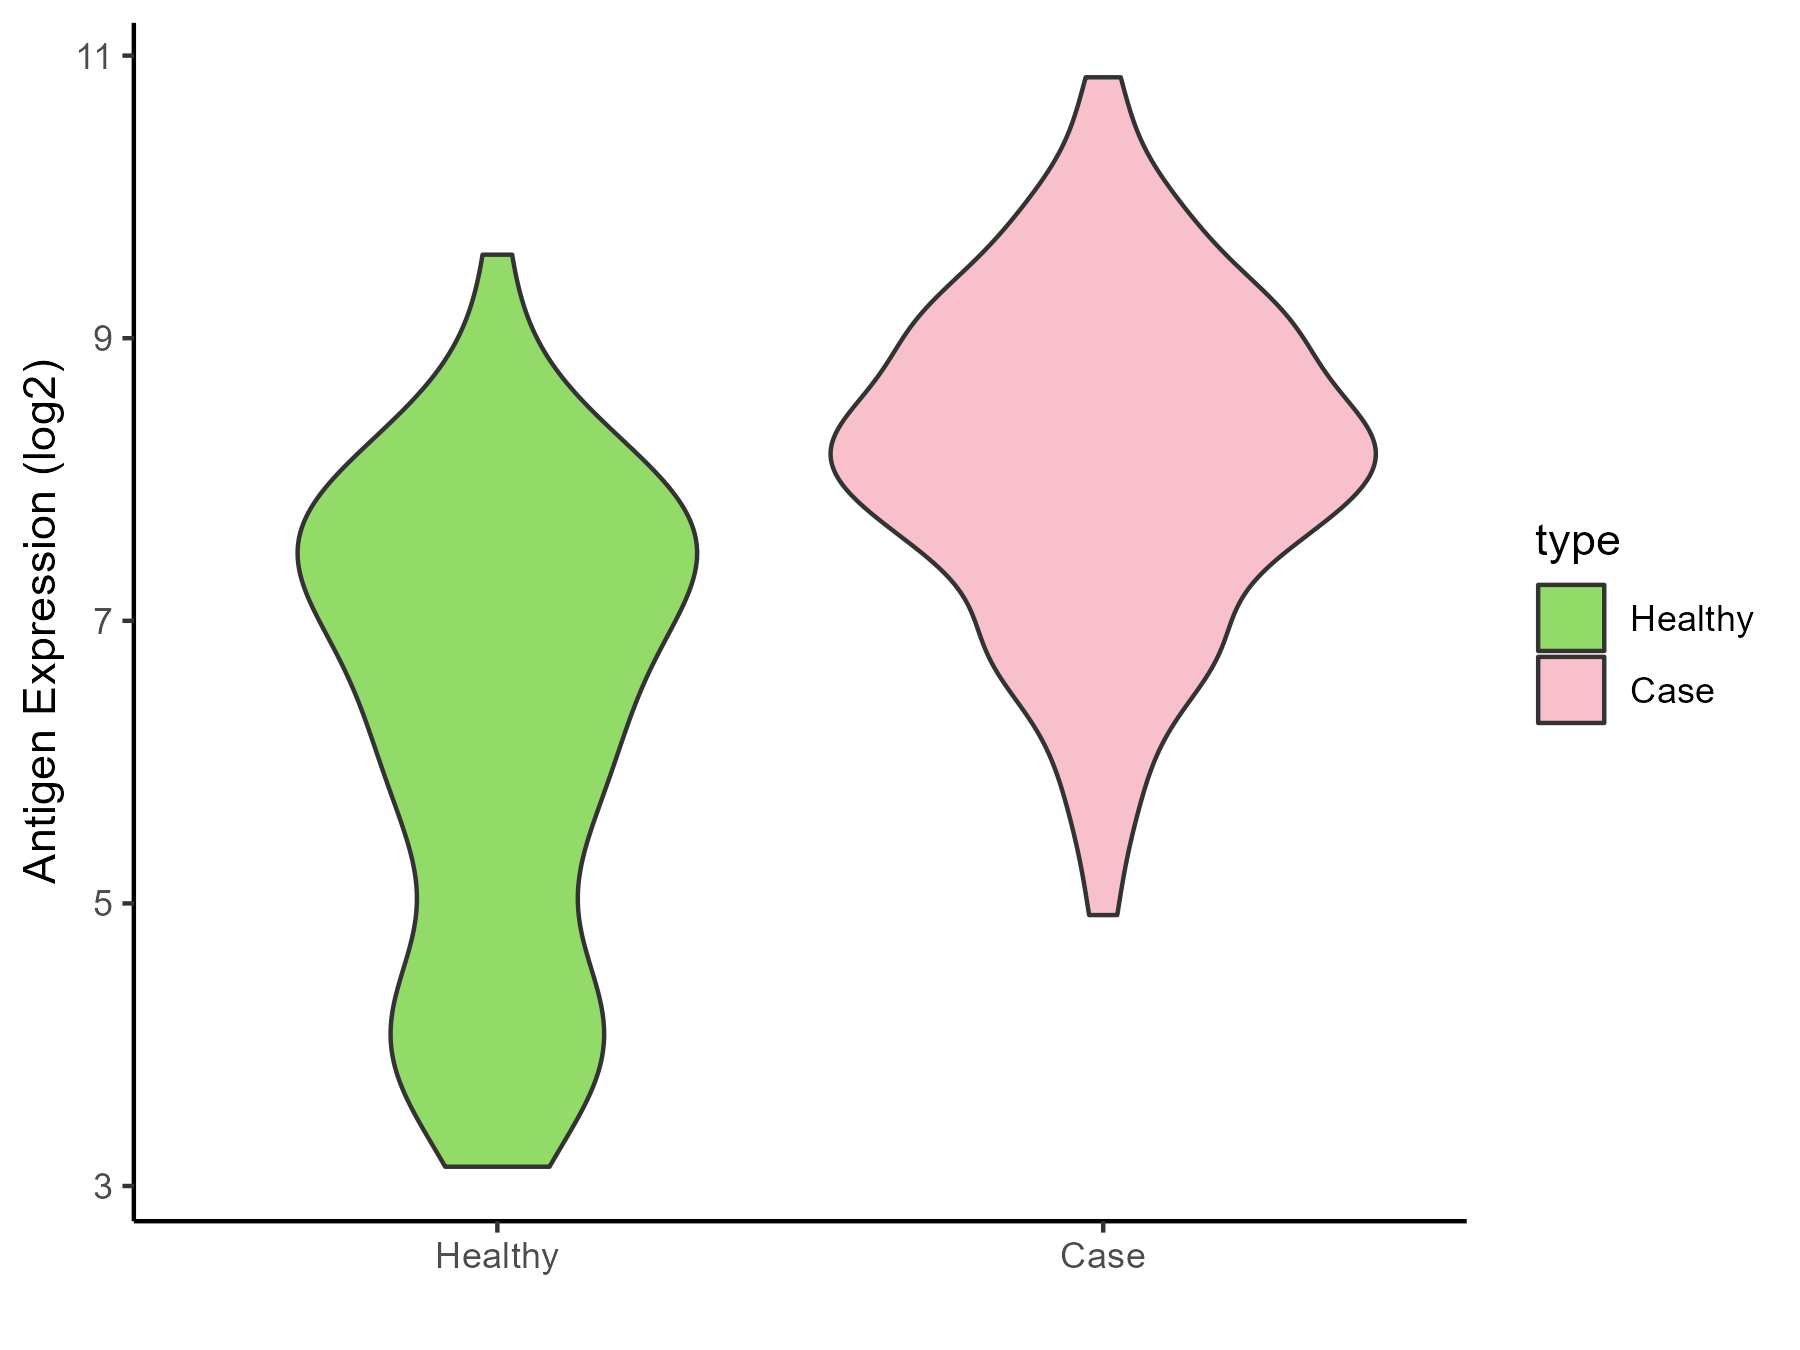
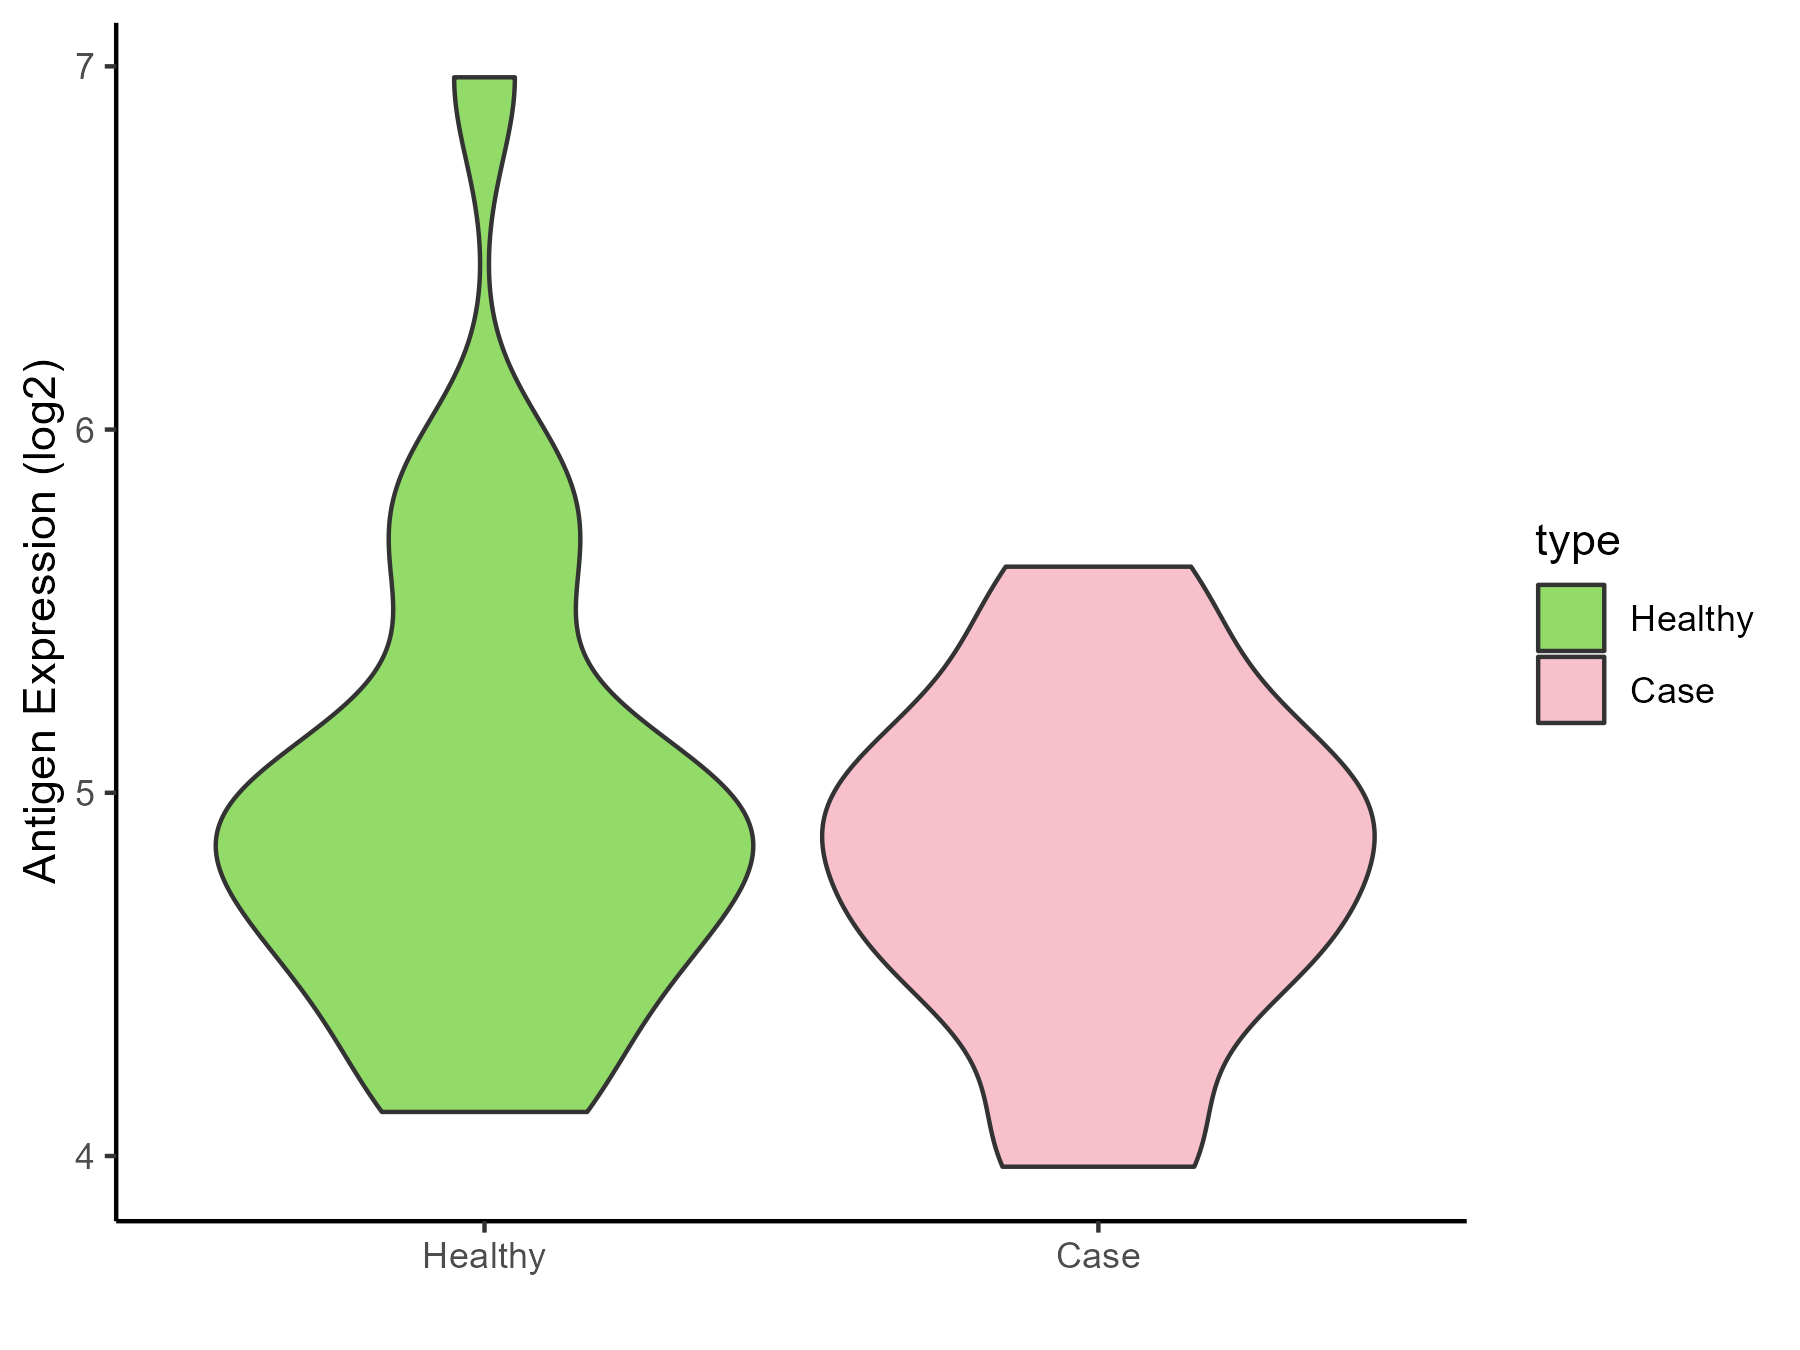
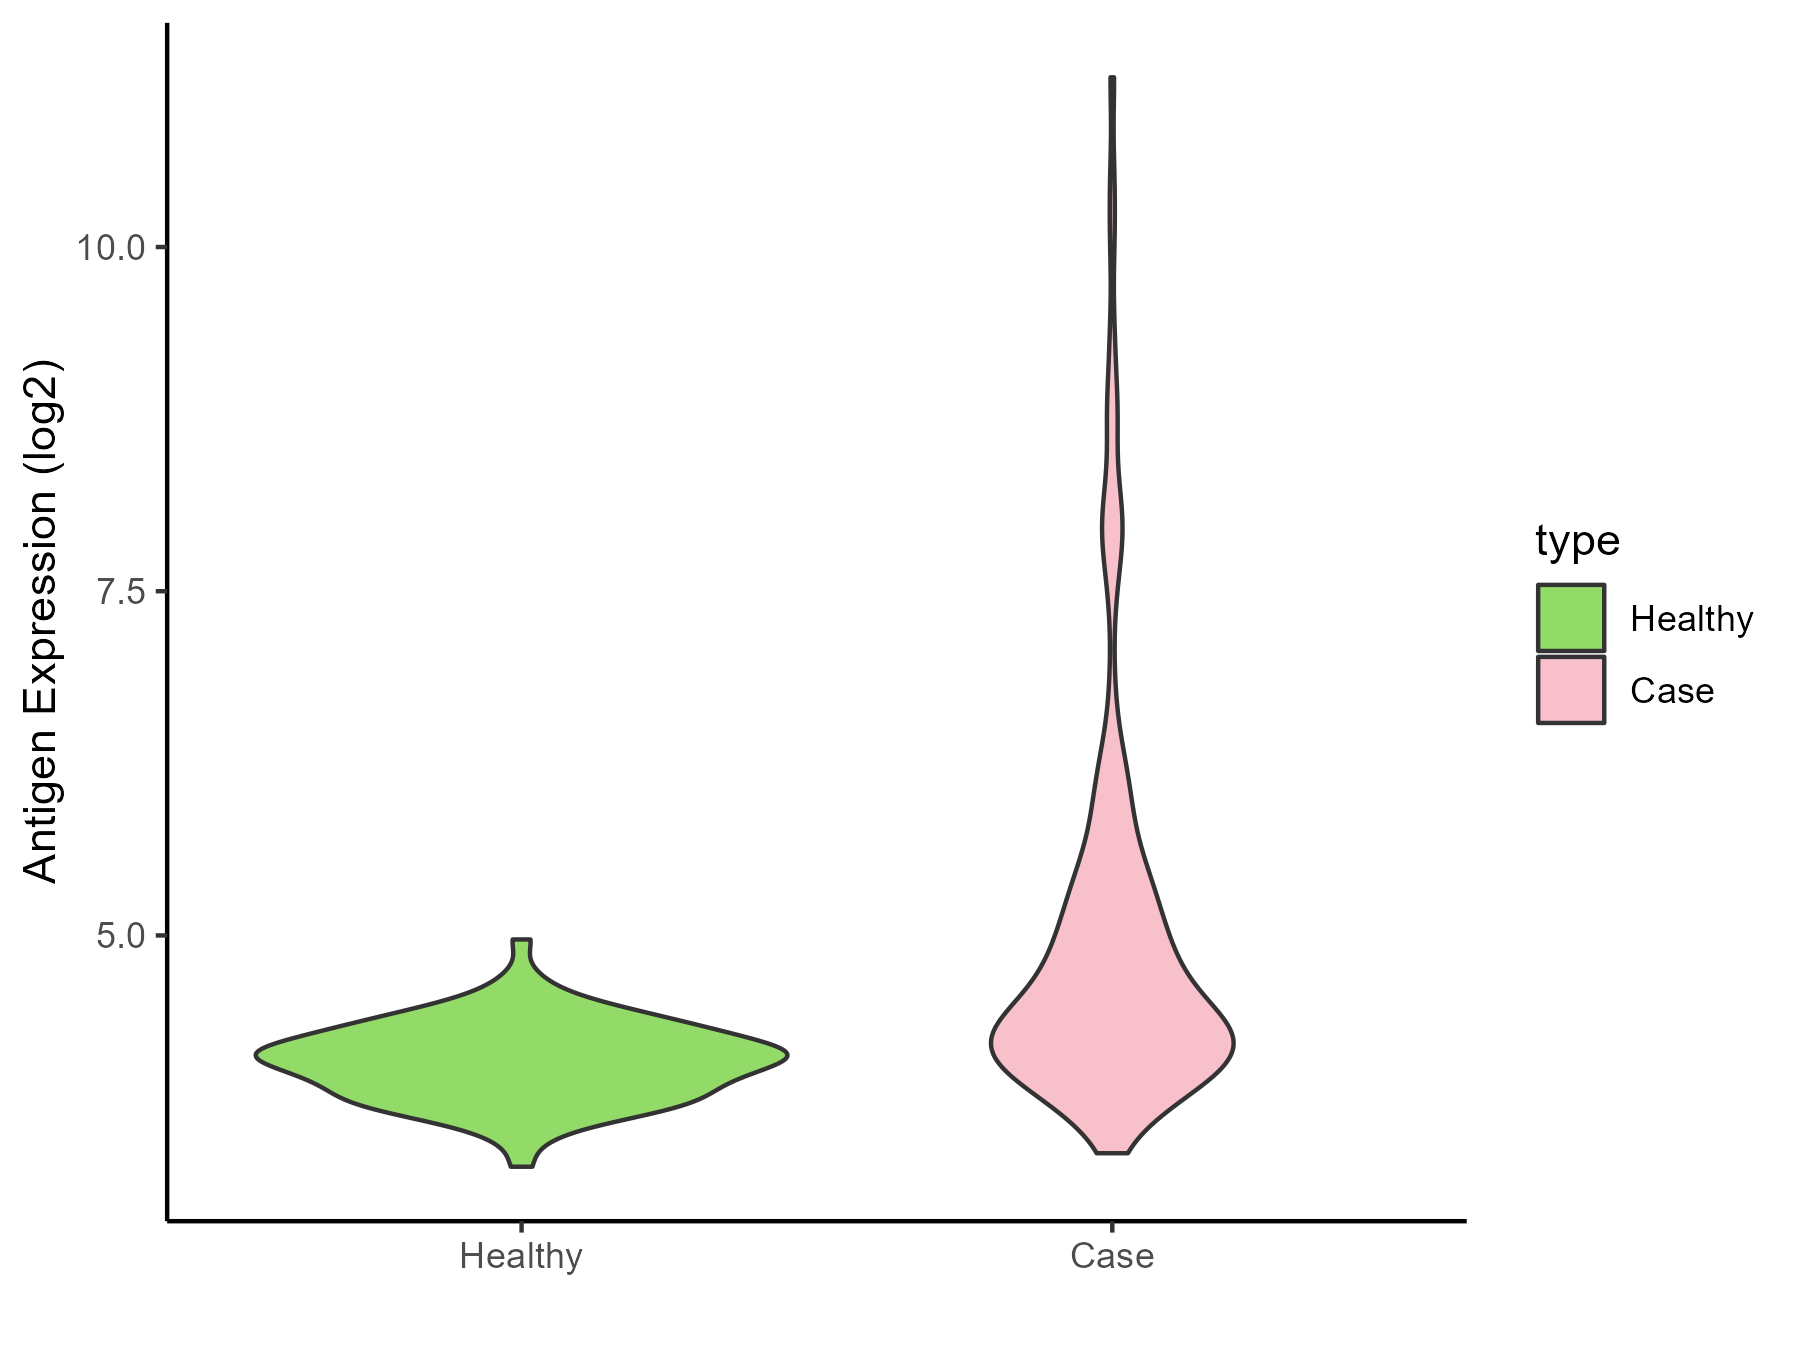
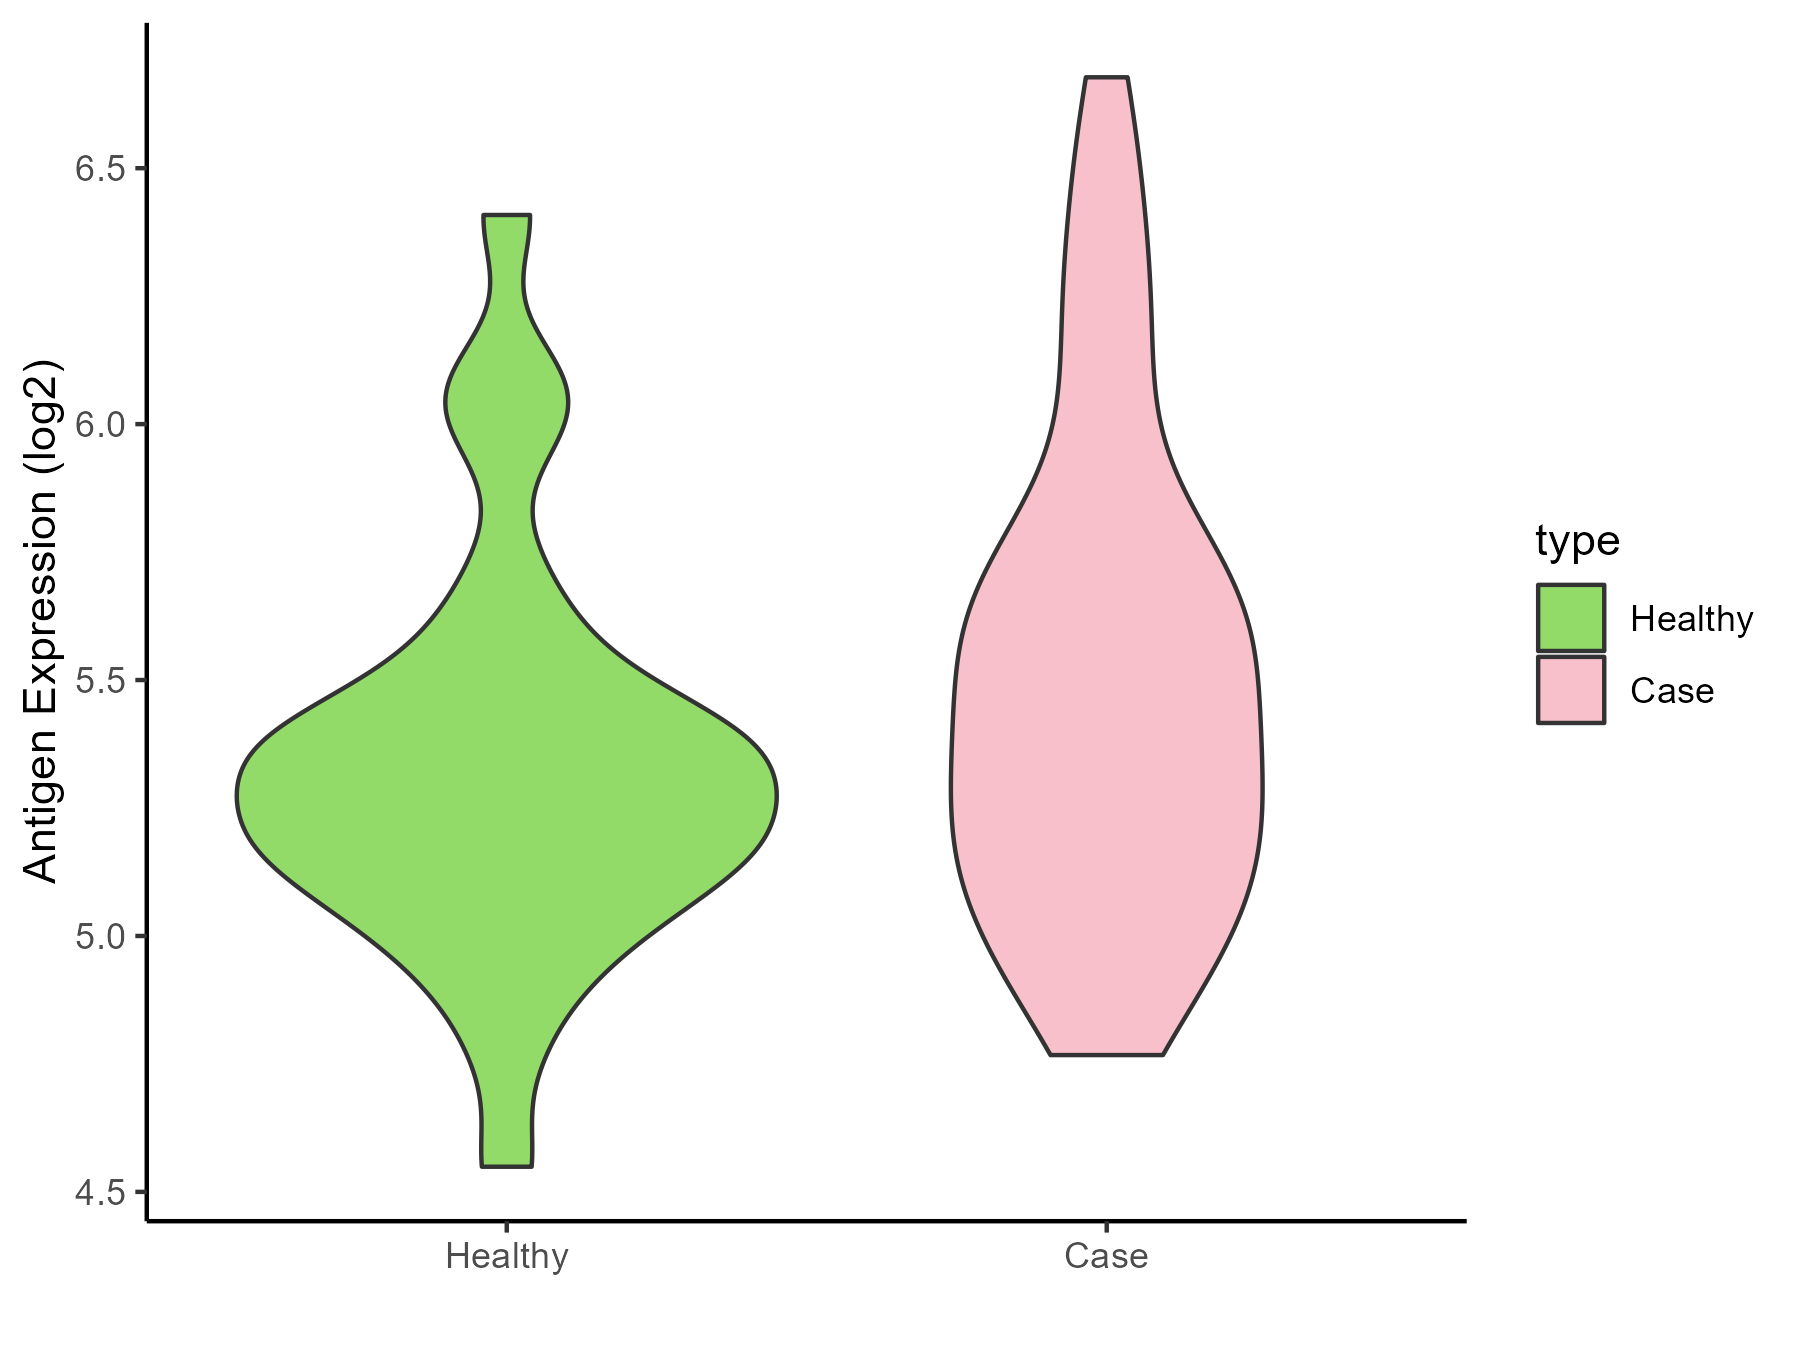
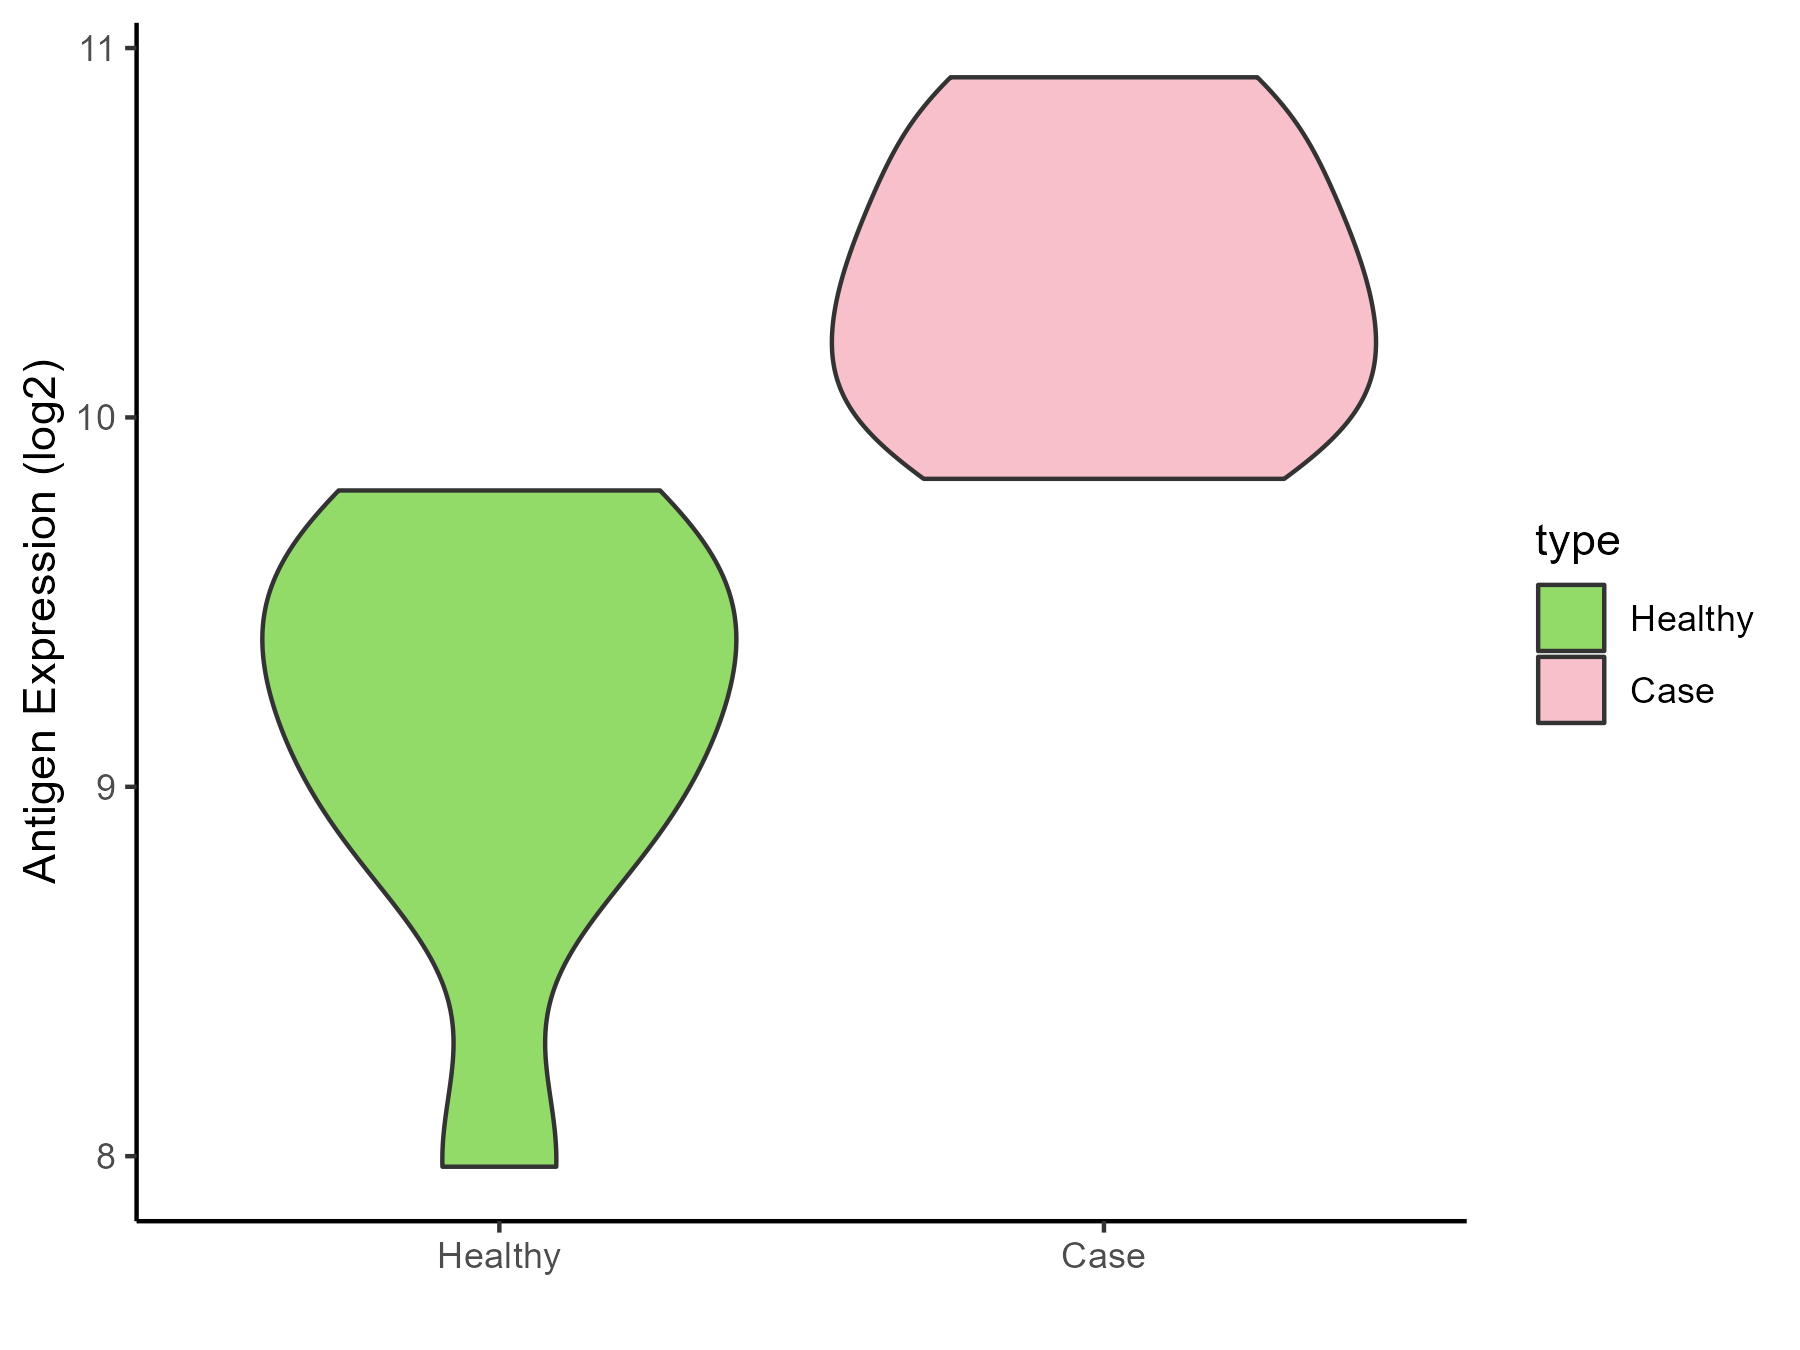
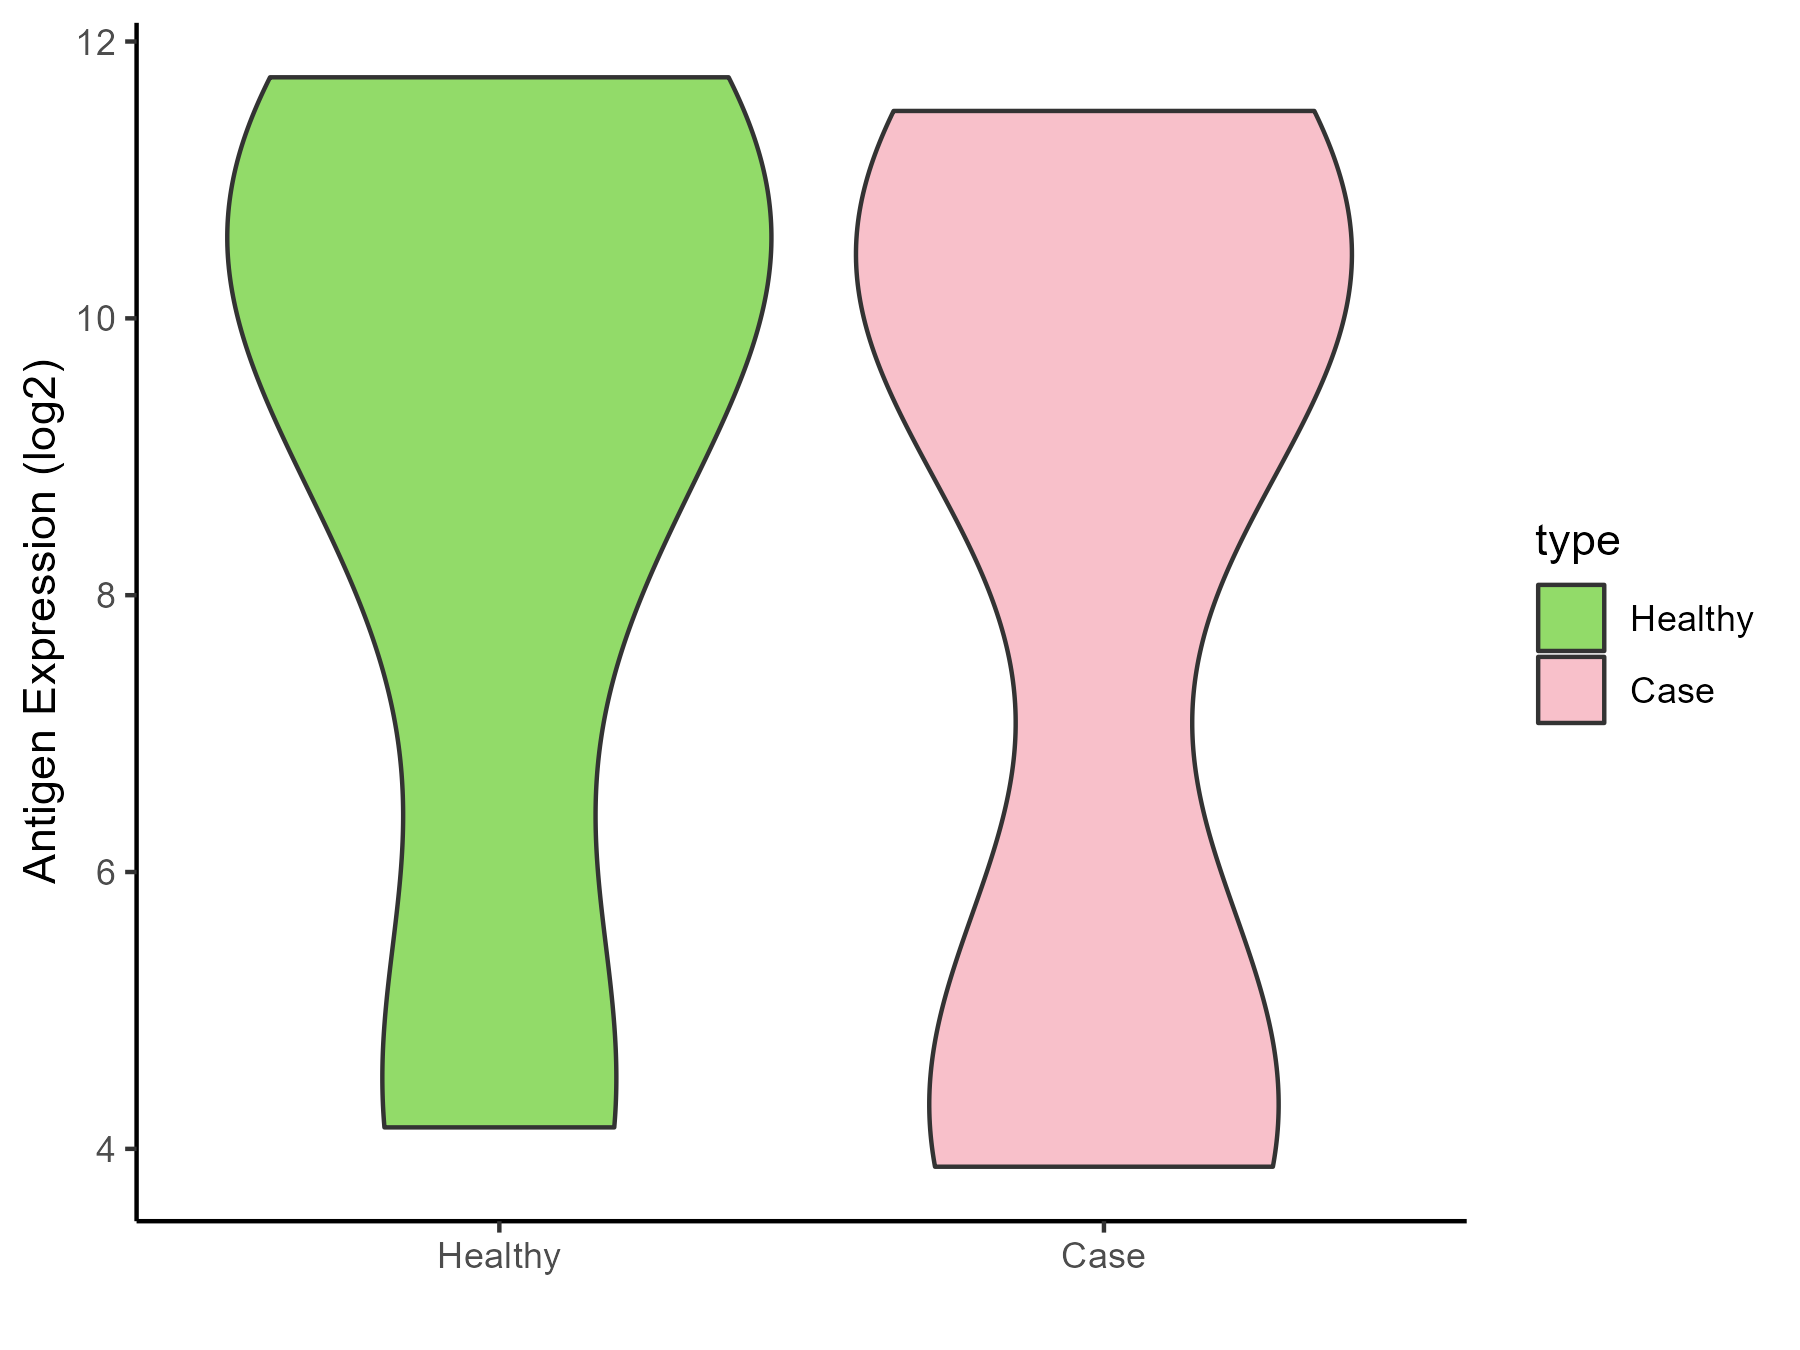
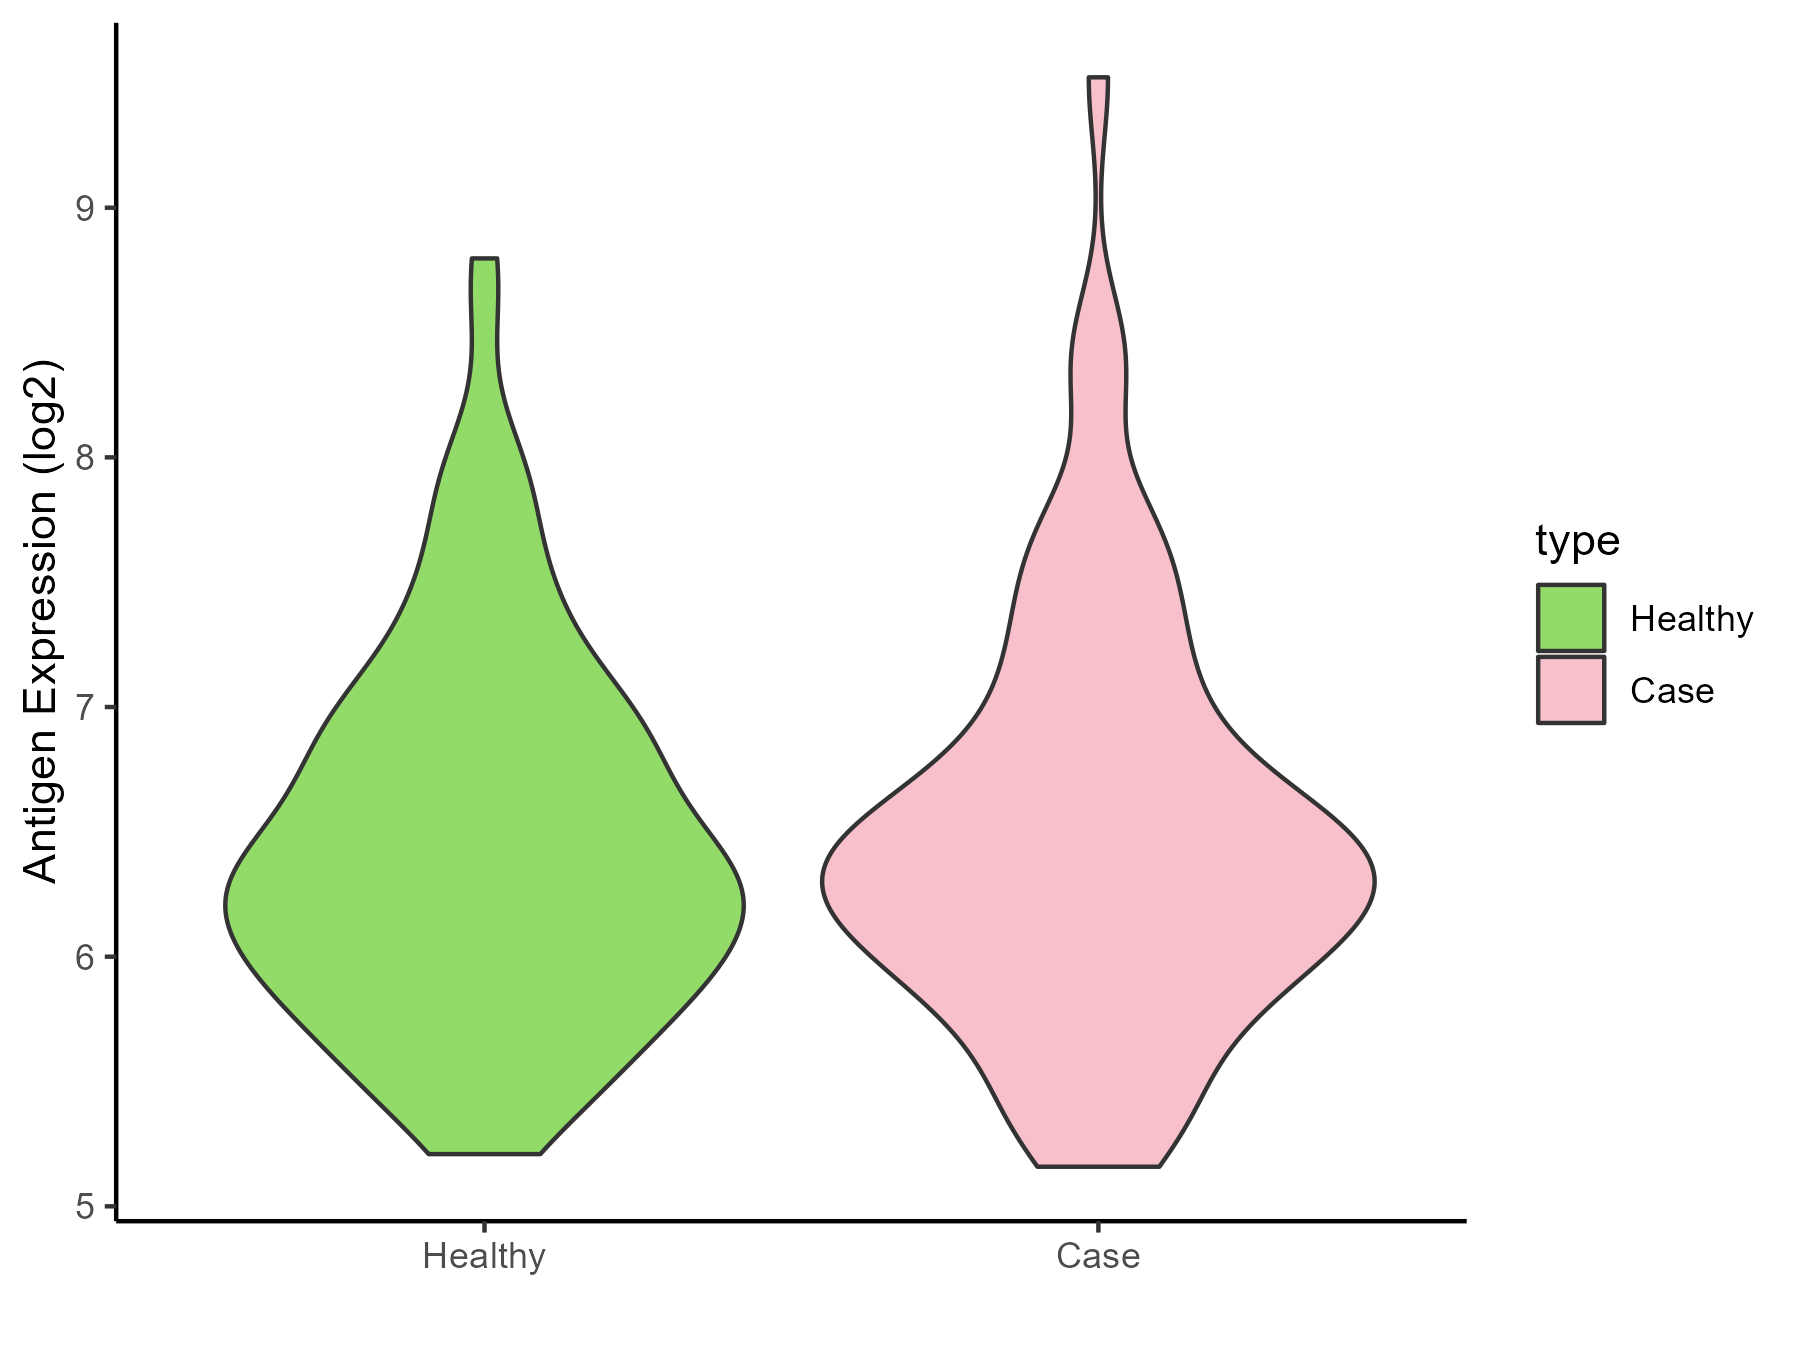
| The Specific Disease | Bacterial infection of gingival | |
| The Expression Level of Disease Section Compare with the Healthy Individual Tissue | p-value: 5.42E-07; Fold-change: 0.423325244; Z-score: 0.626842113 | |
| Disease-specific Antigen Abundances |
|
Click to View the Clearer Original Diagram |
ICD Disease Classification 02
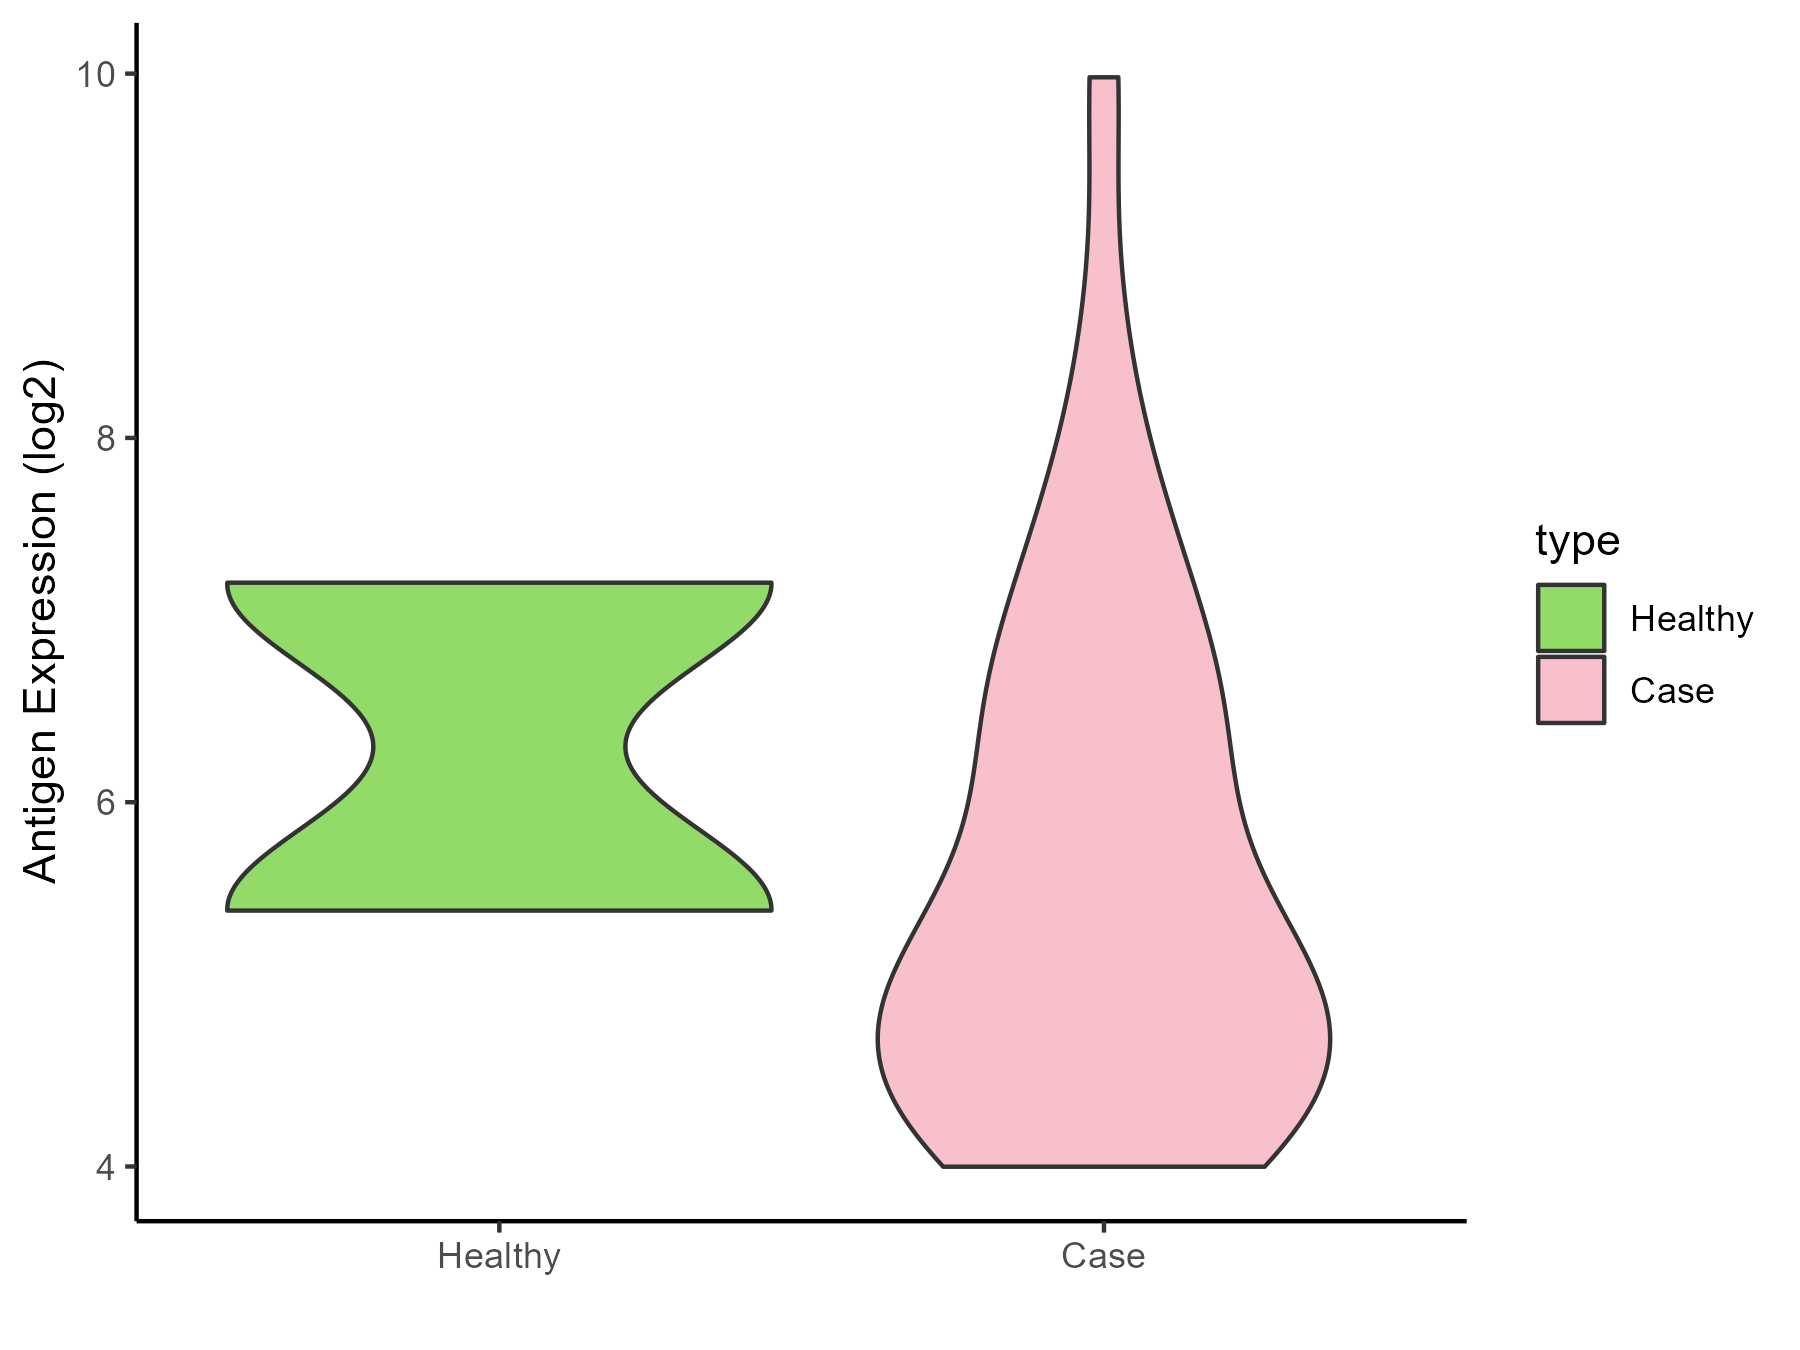
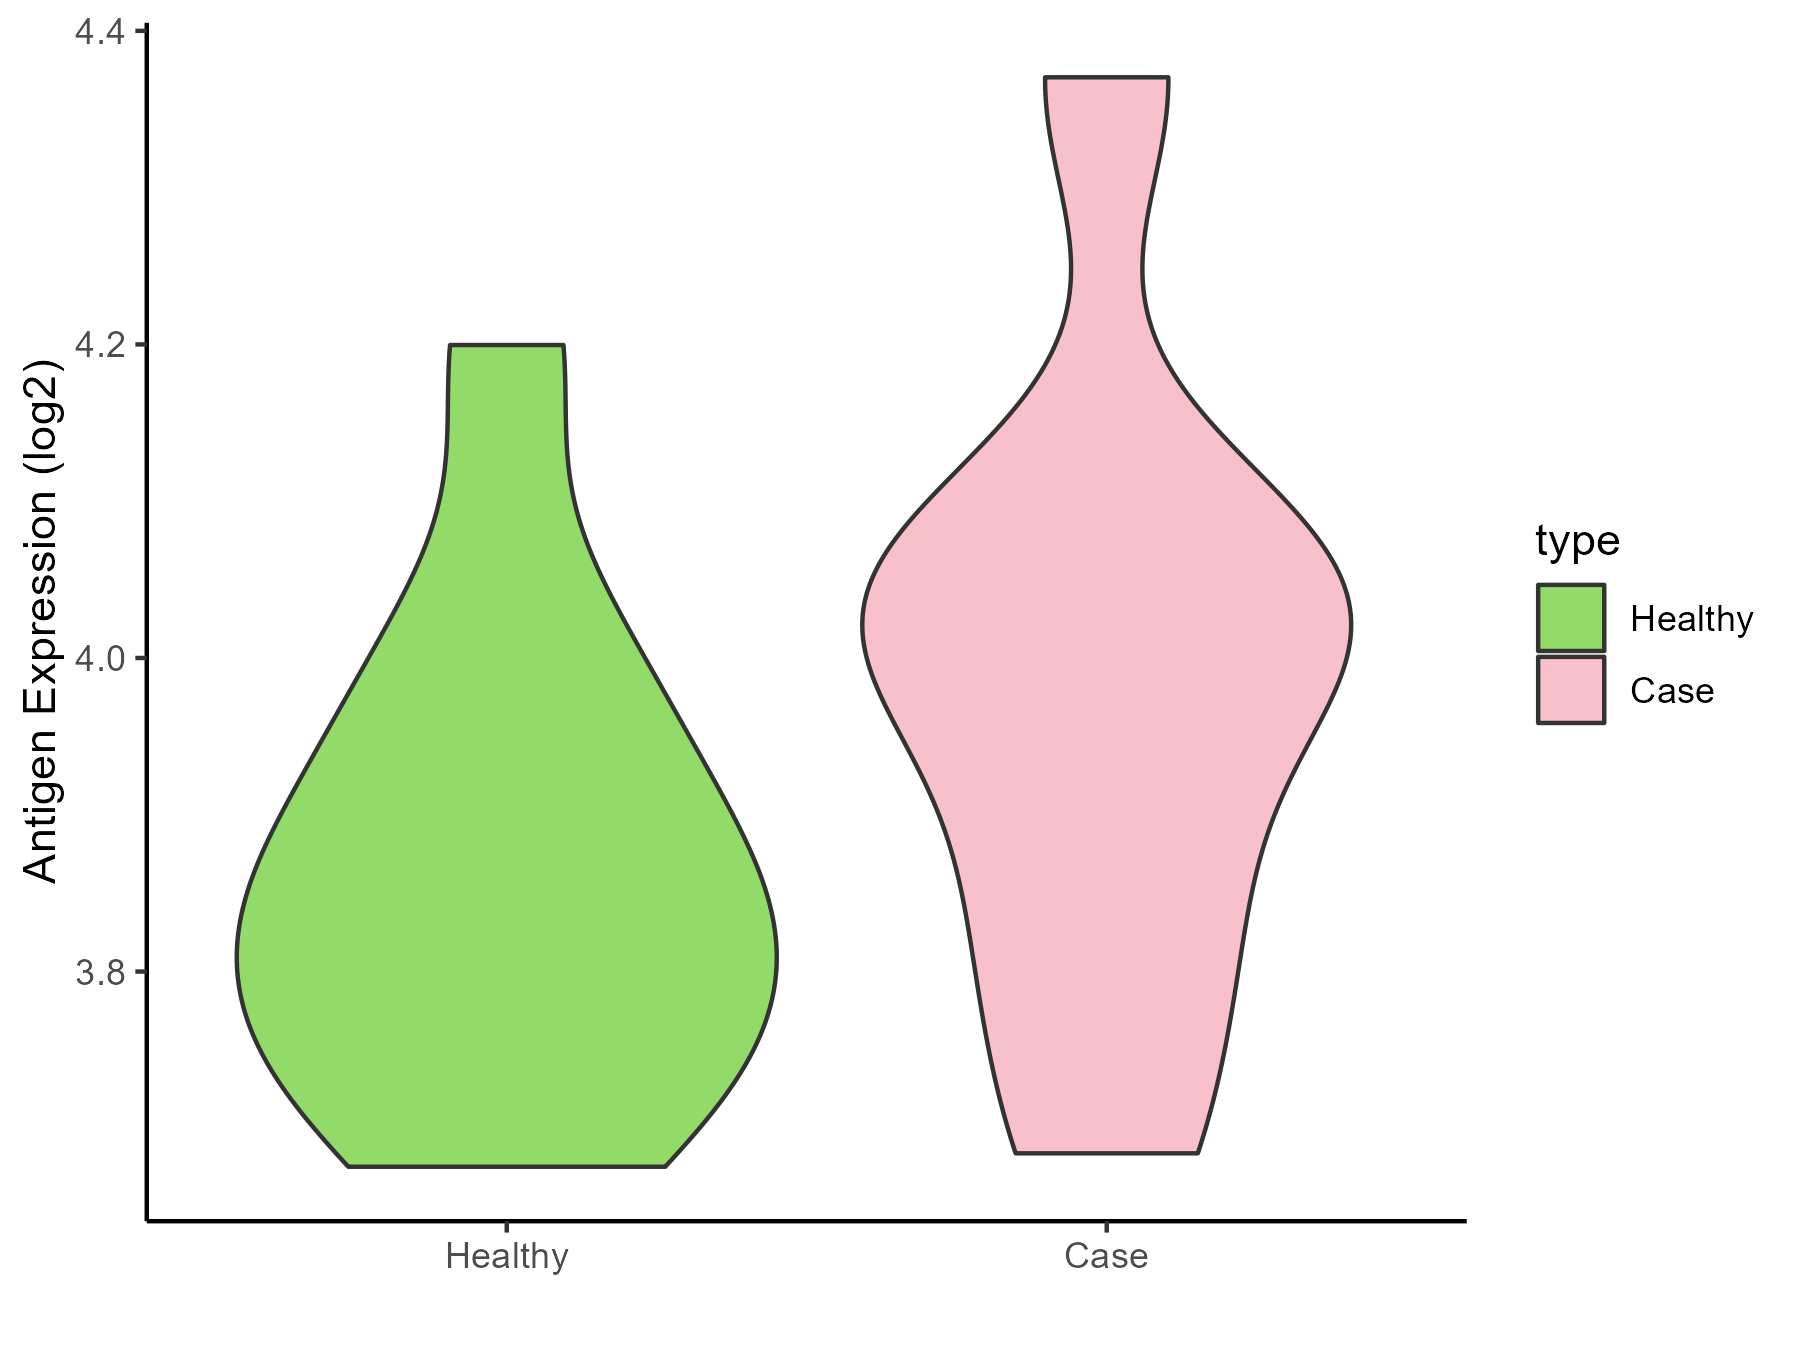
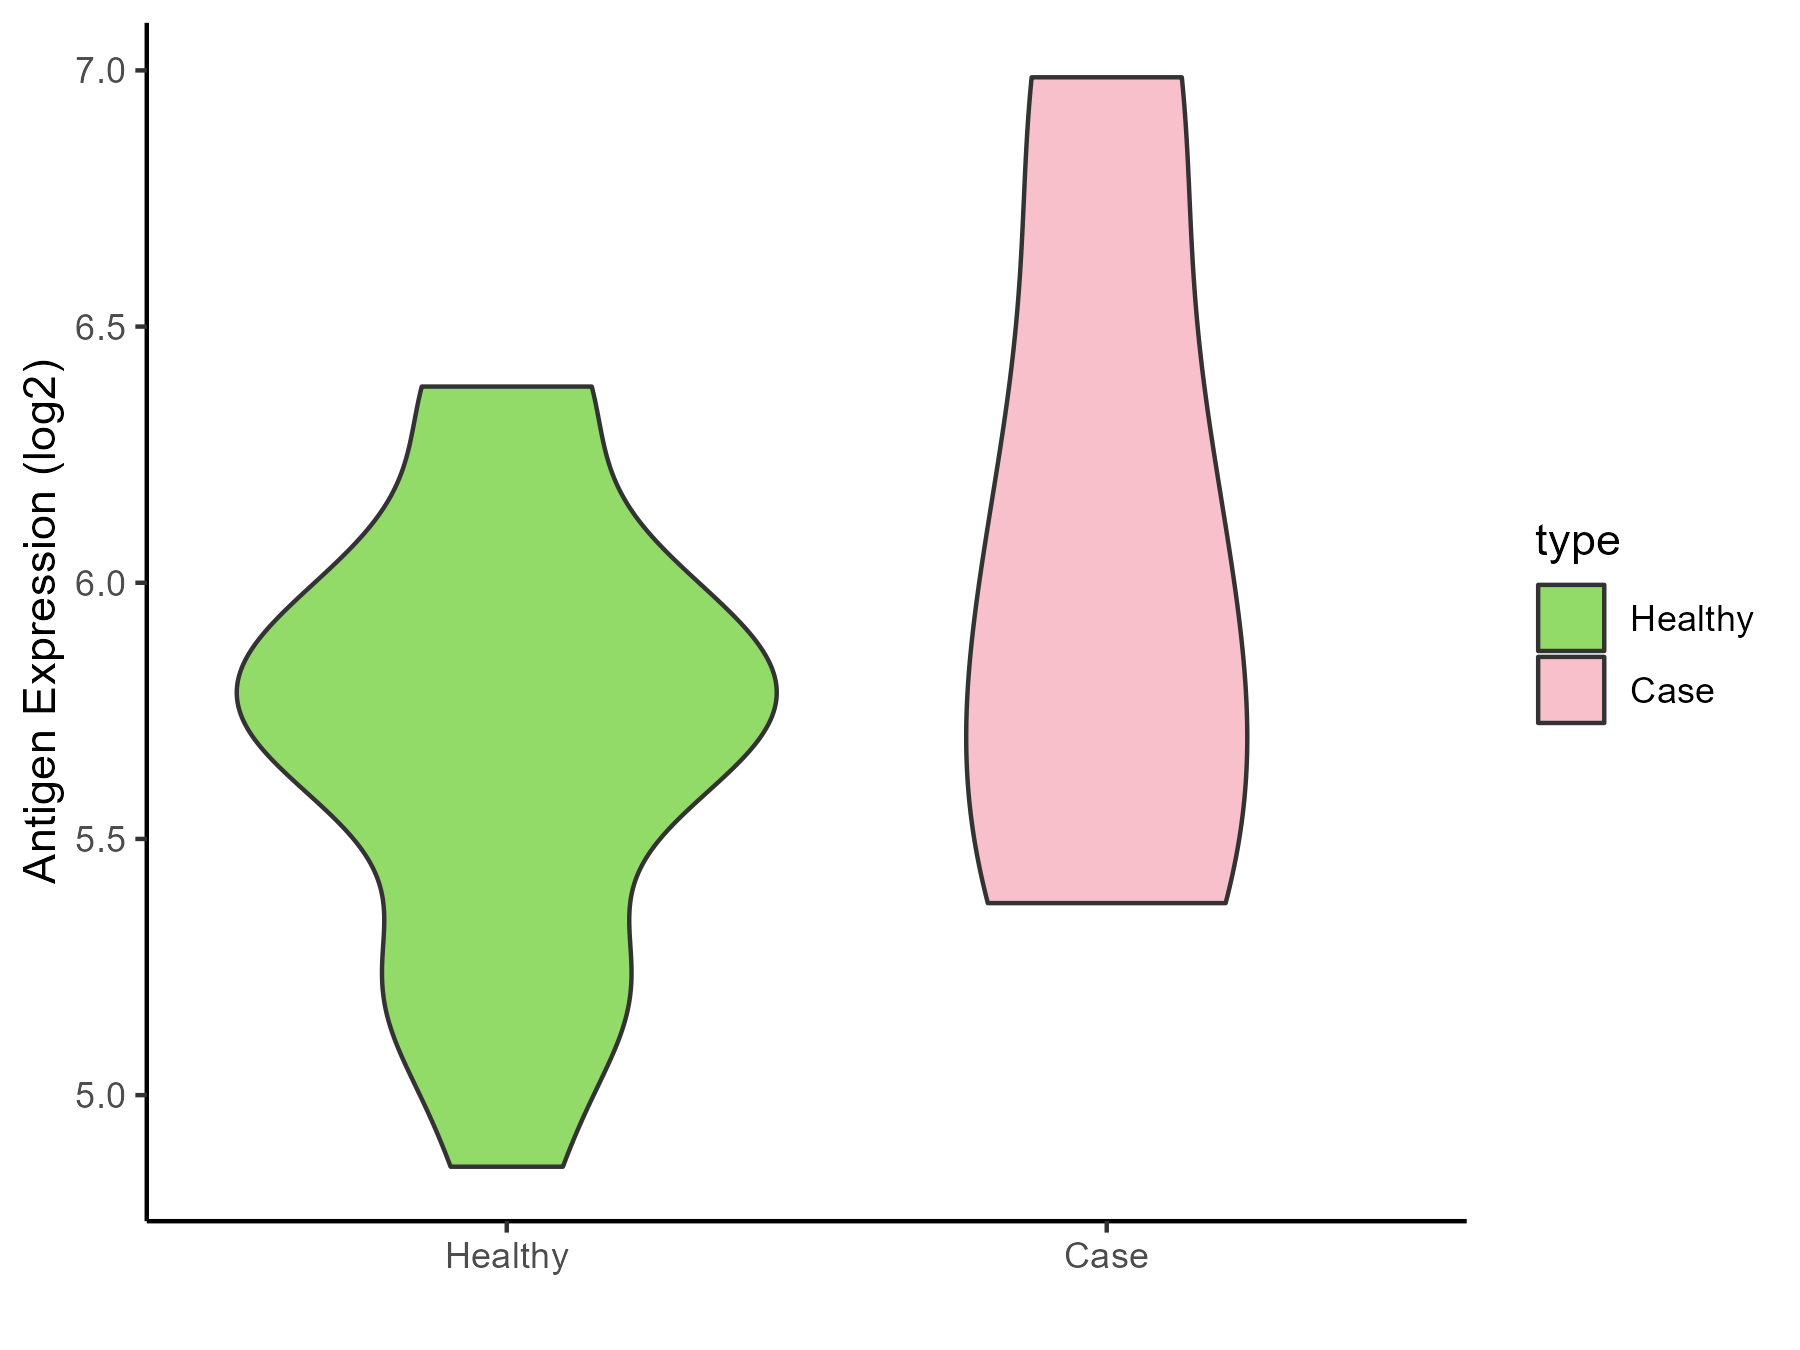
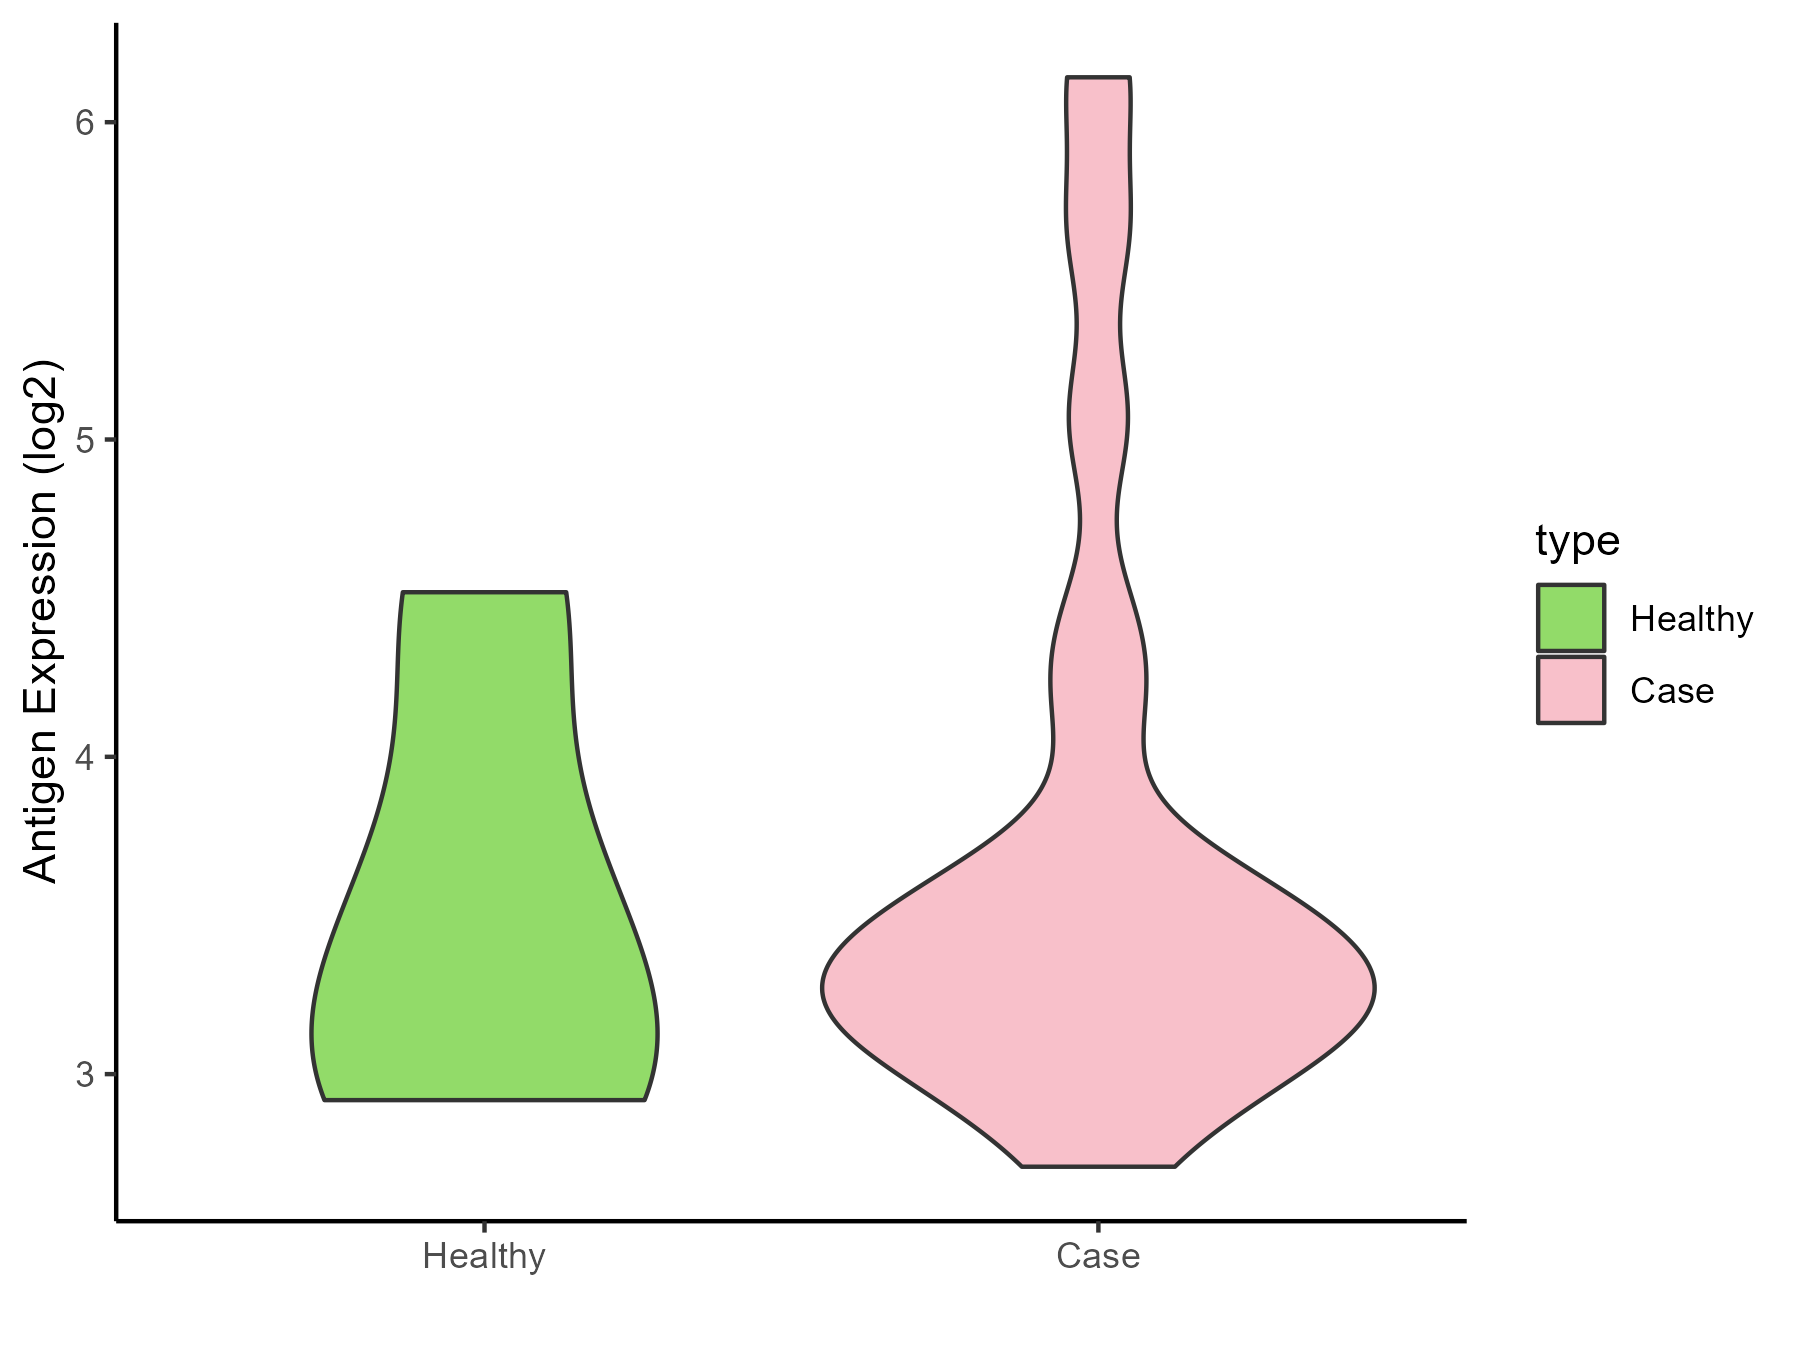
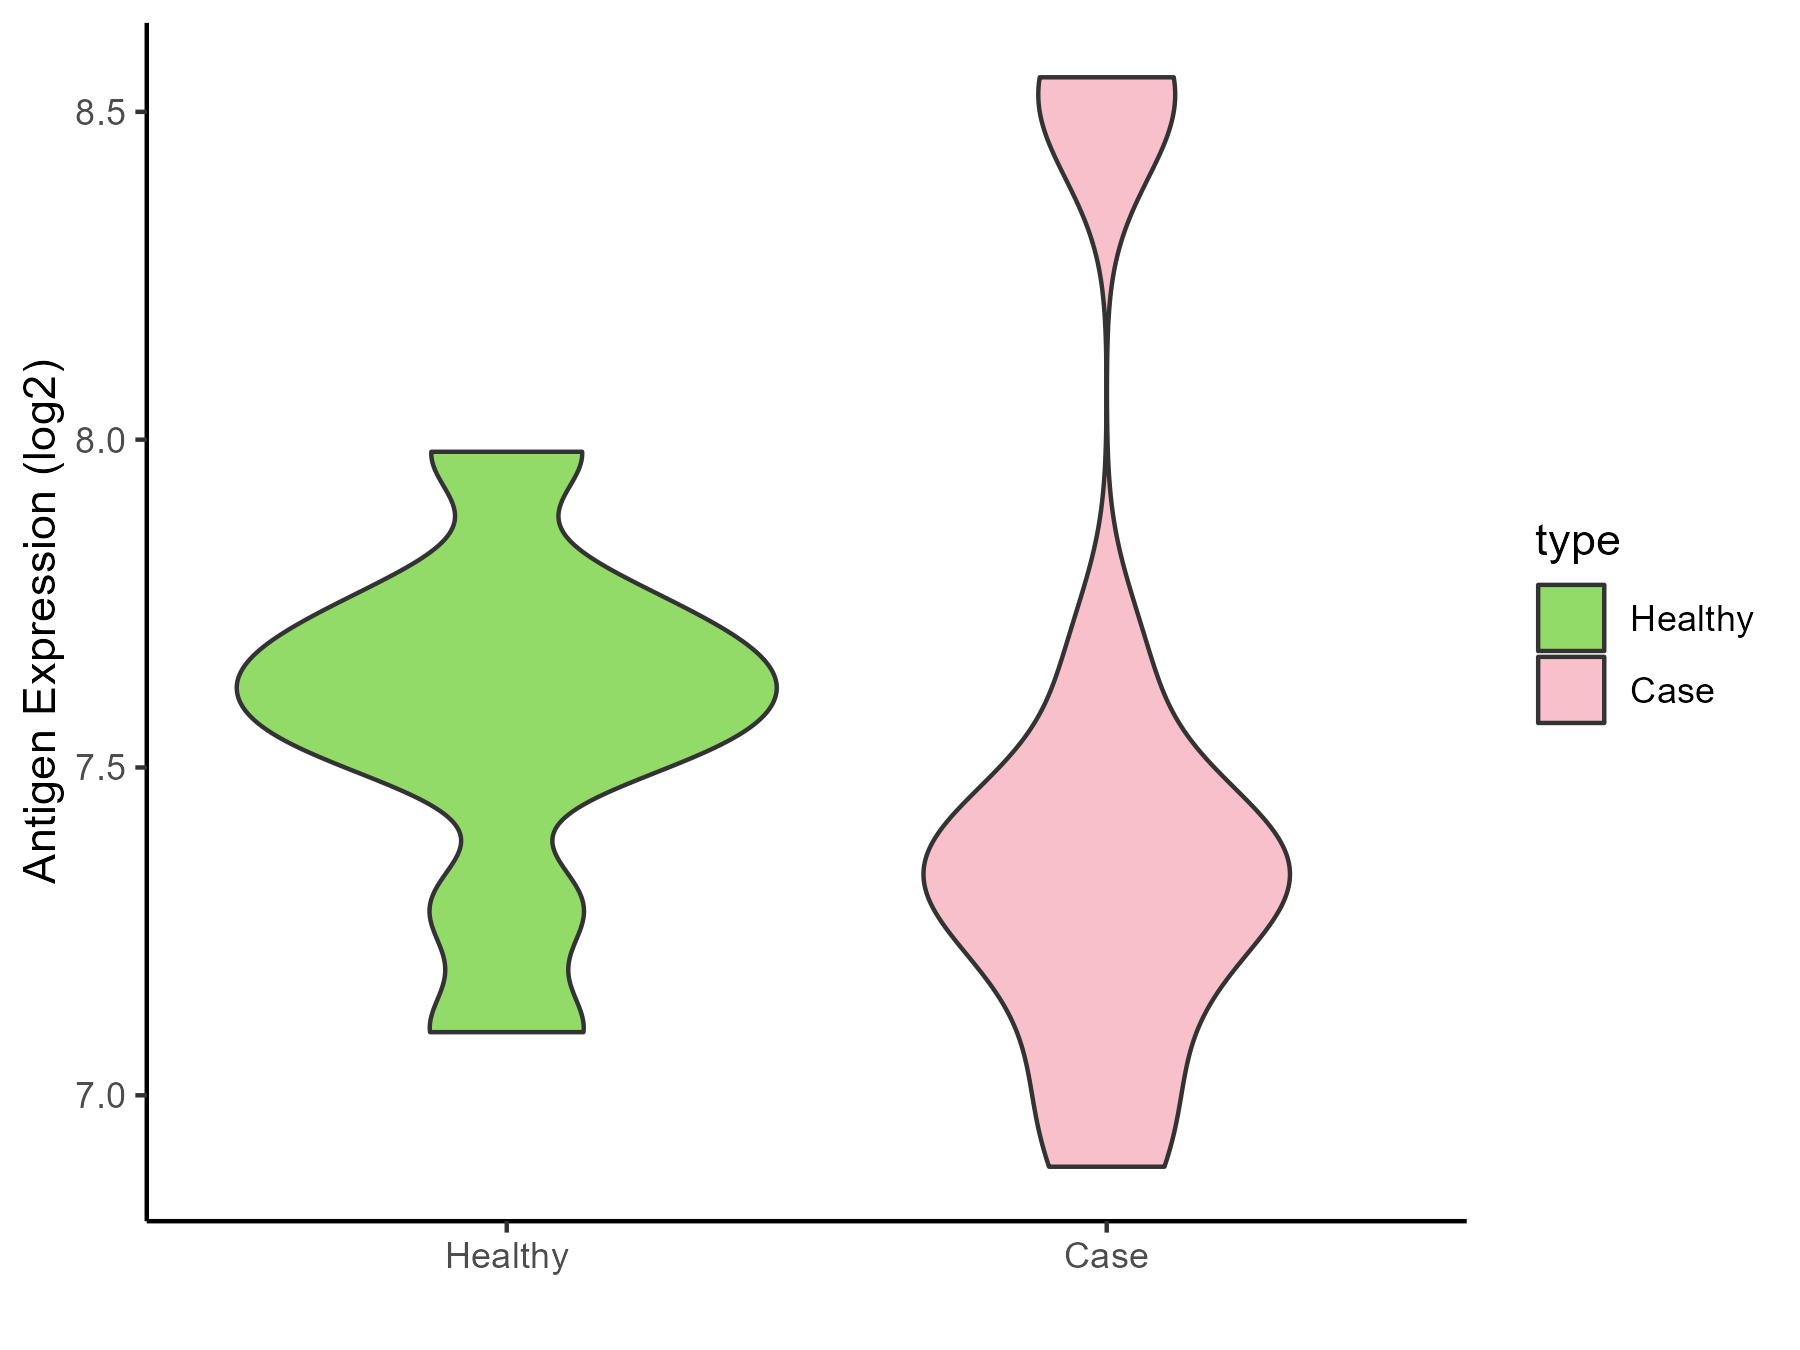
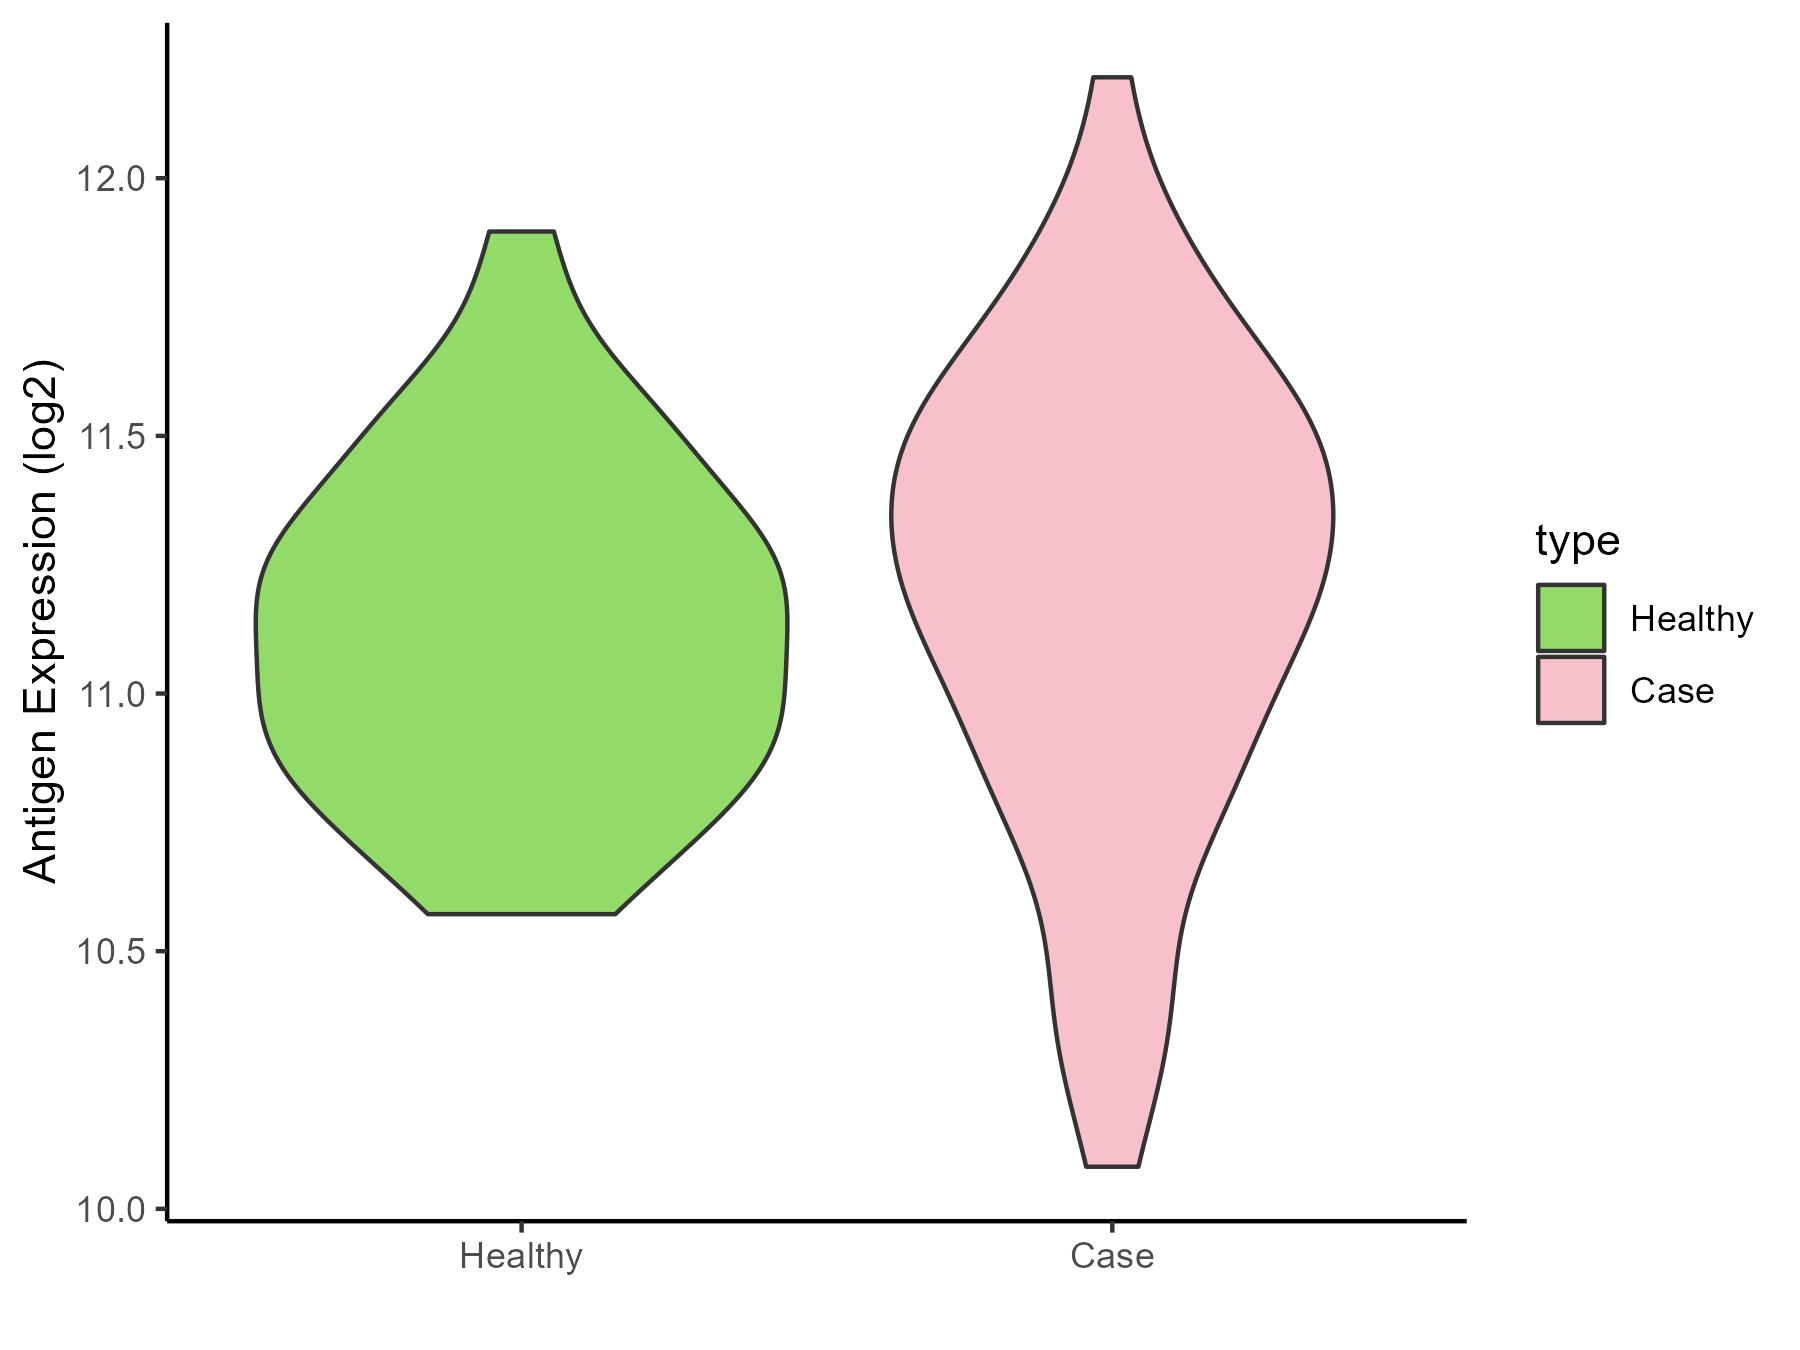
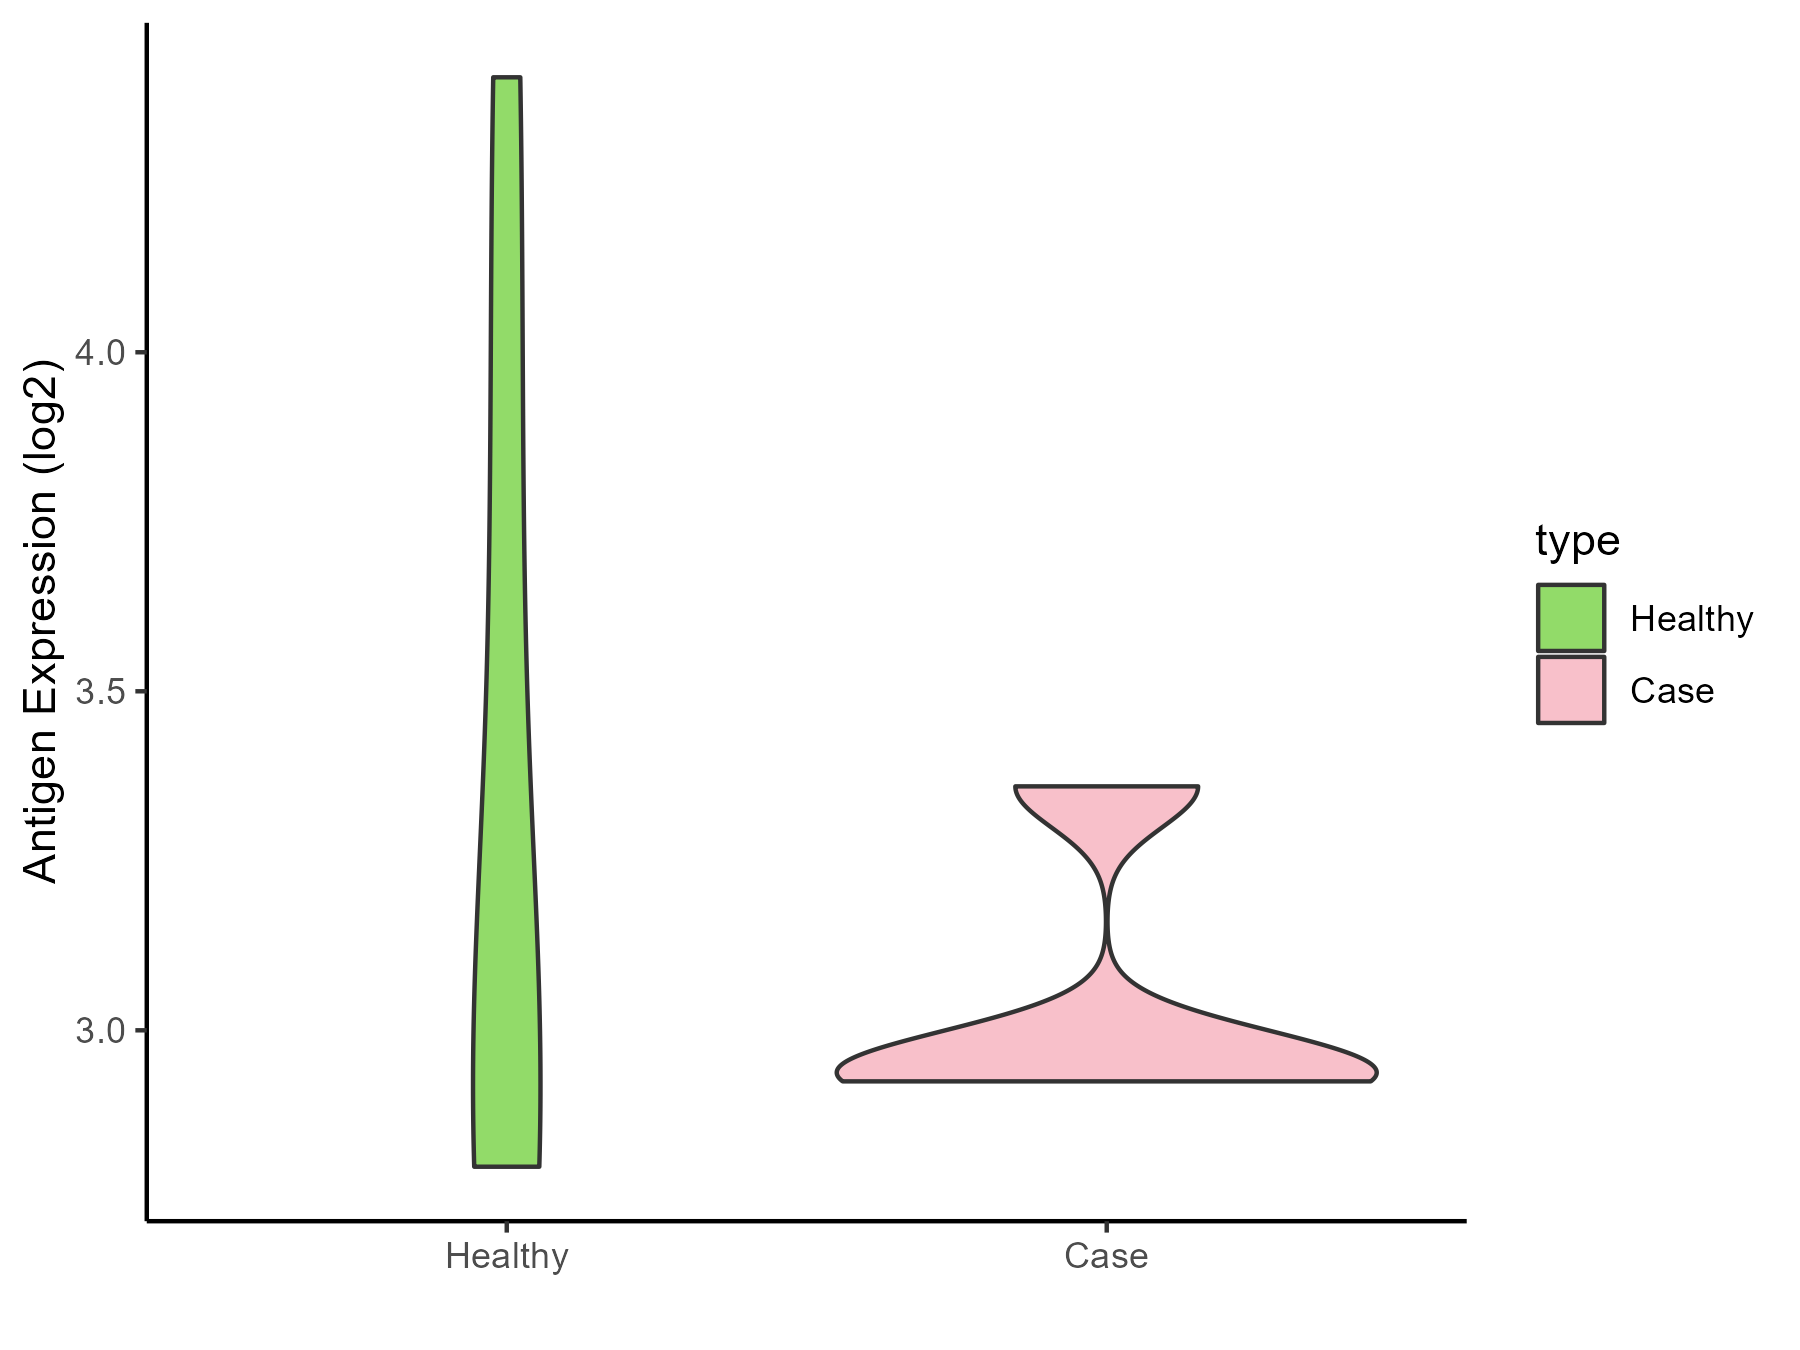
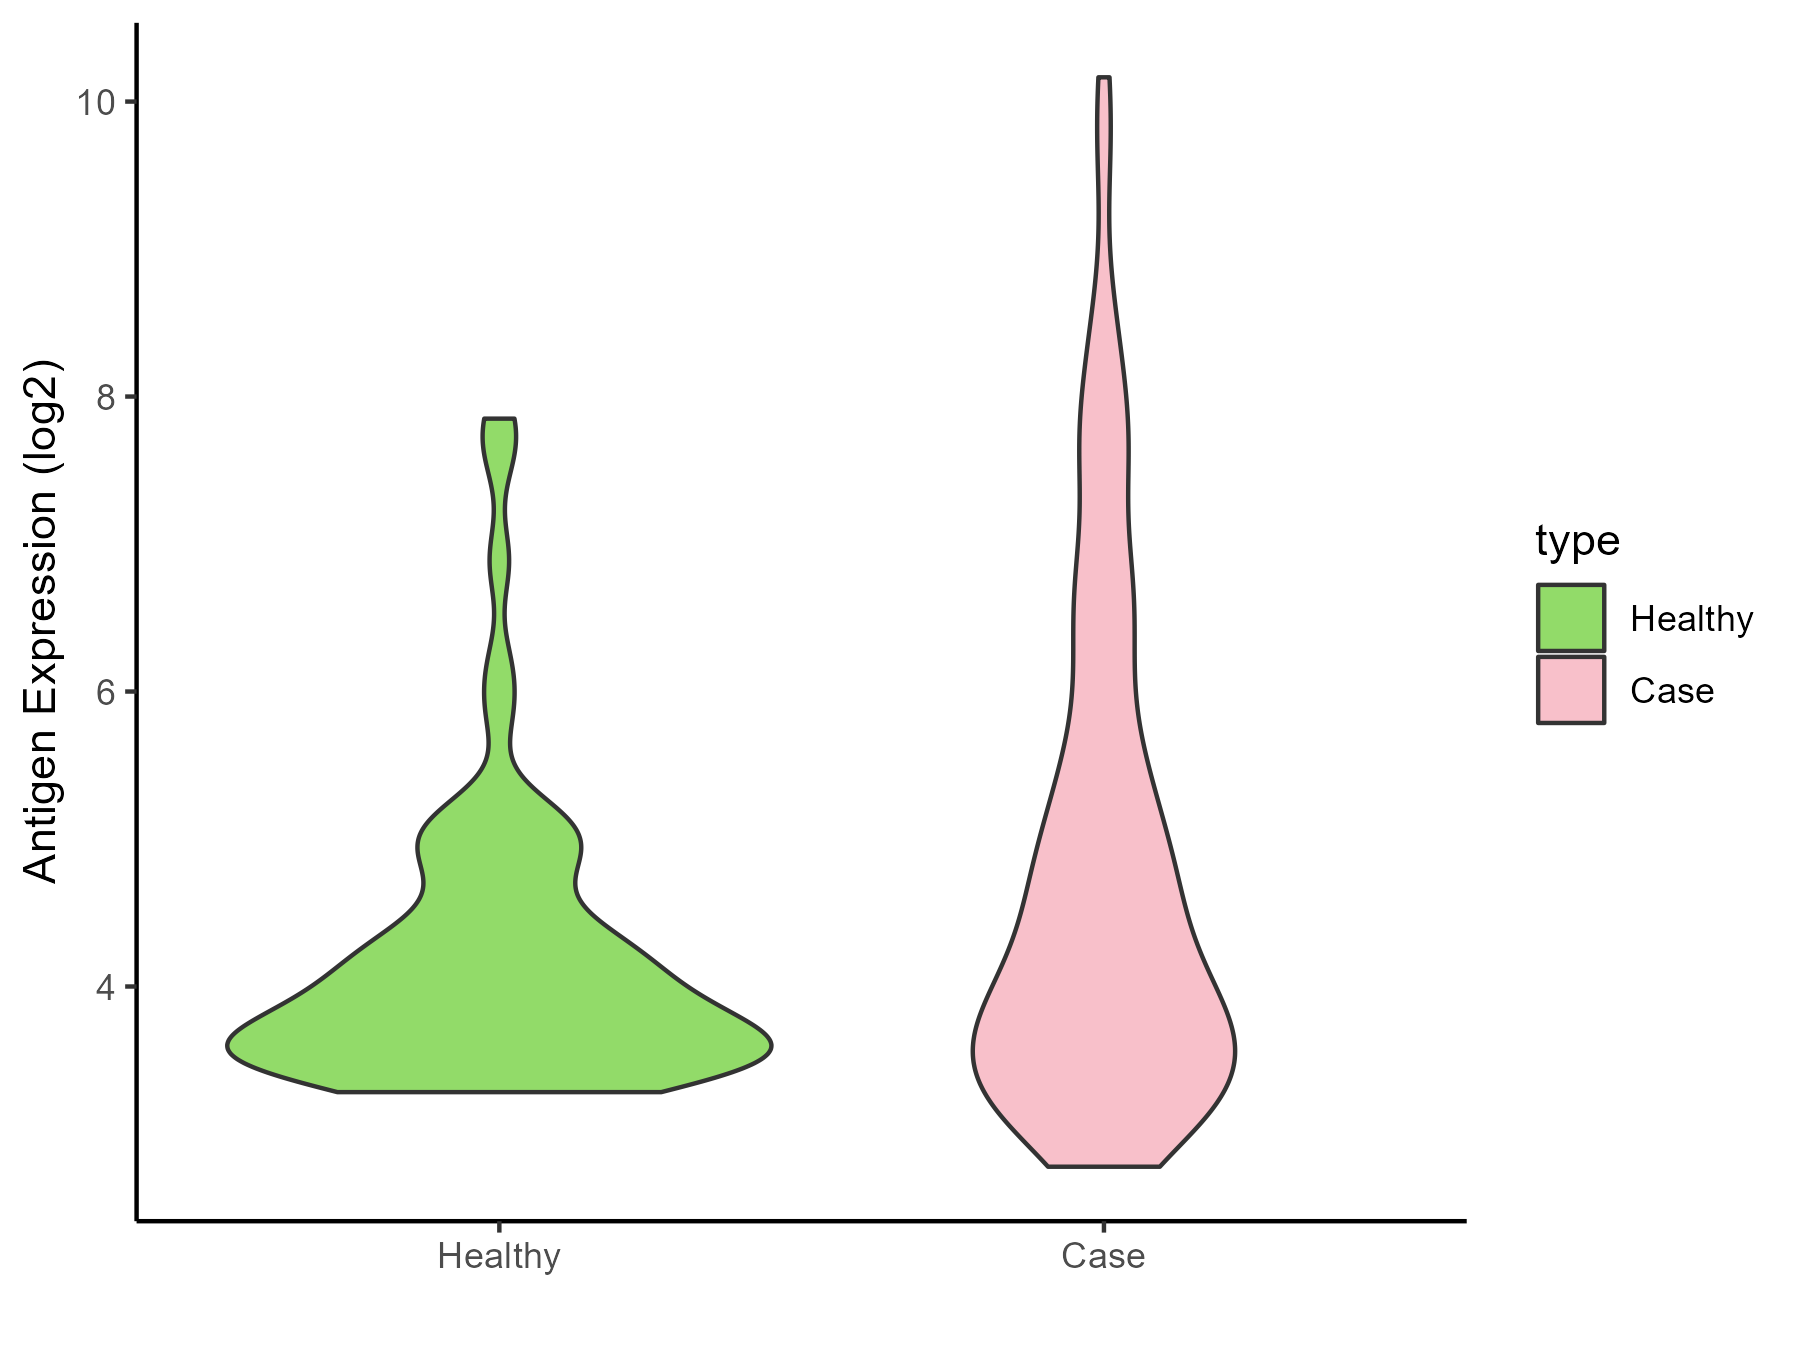
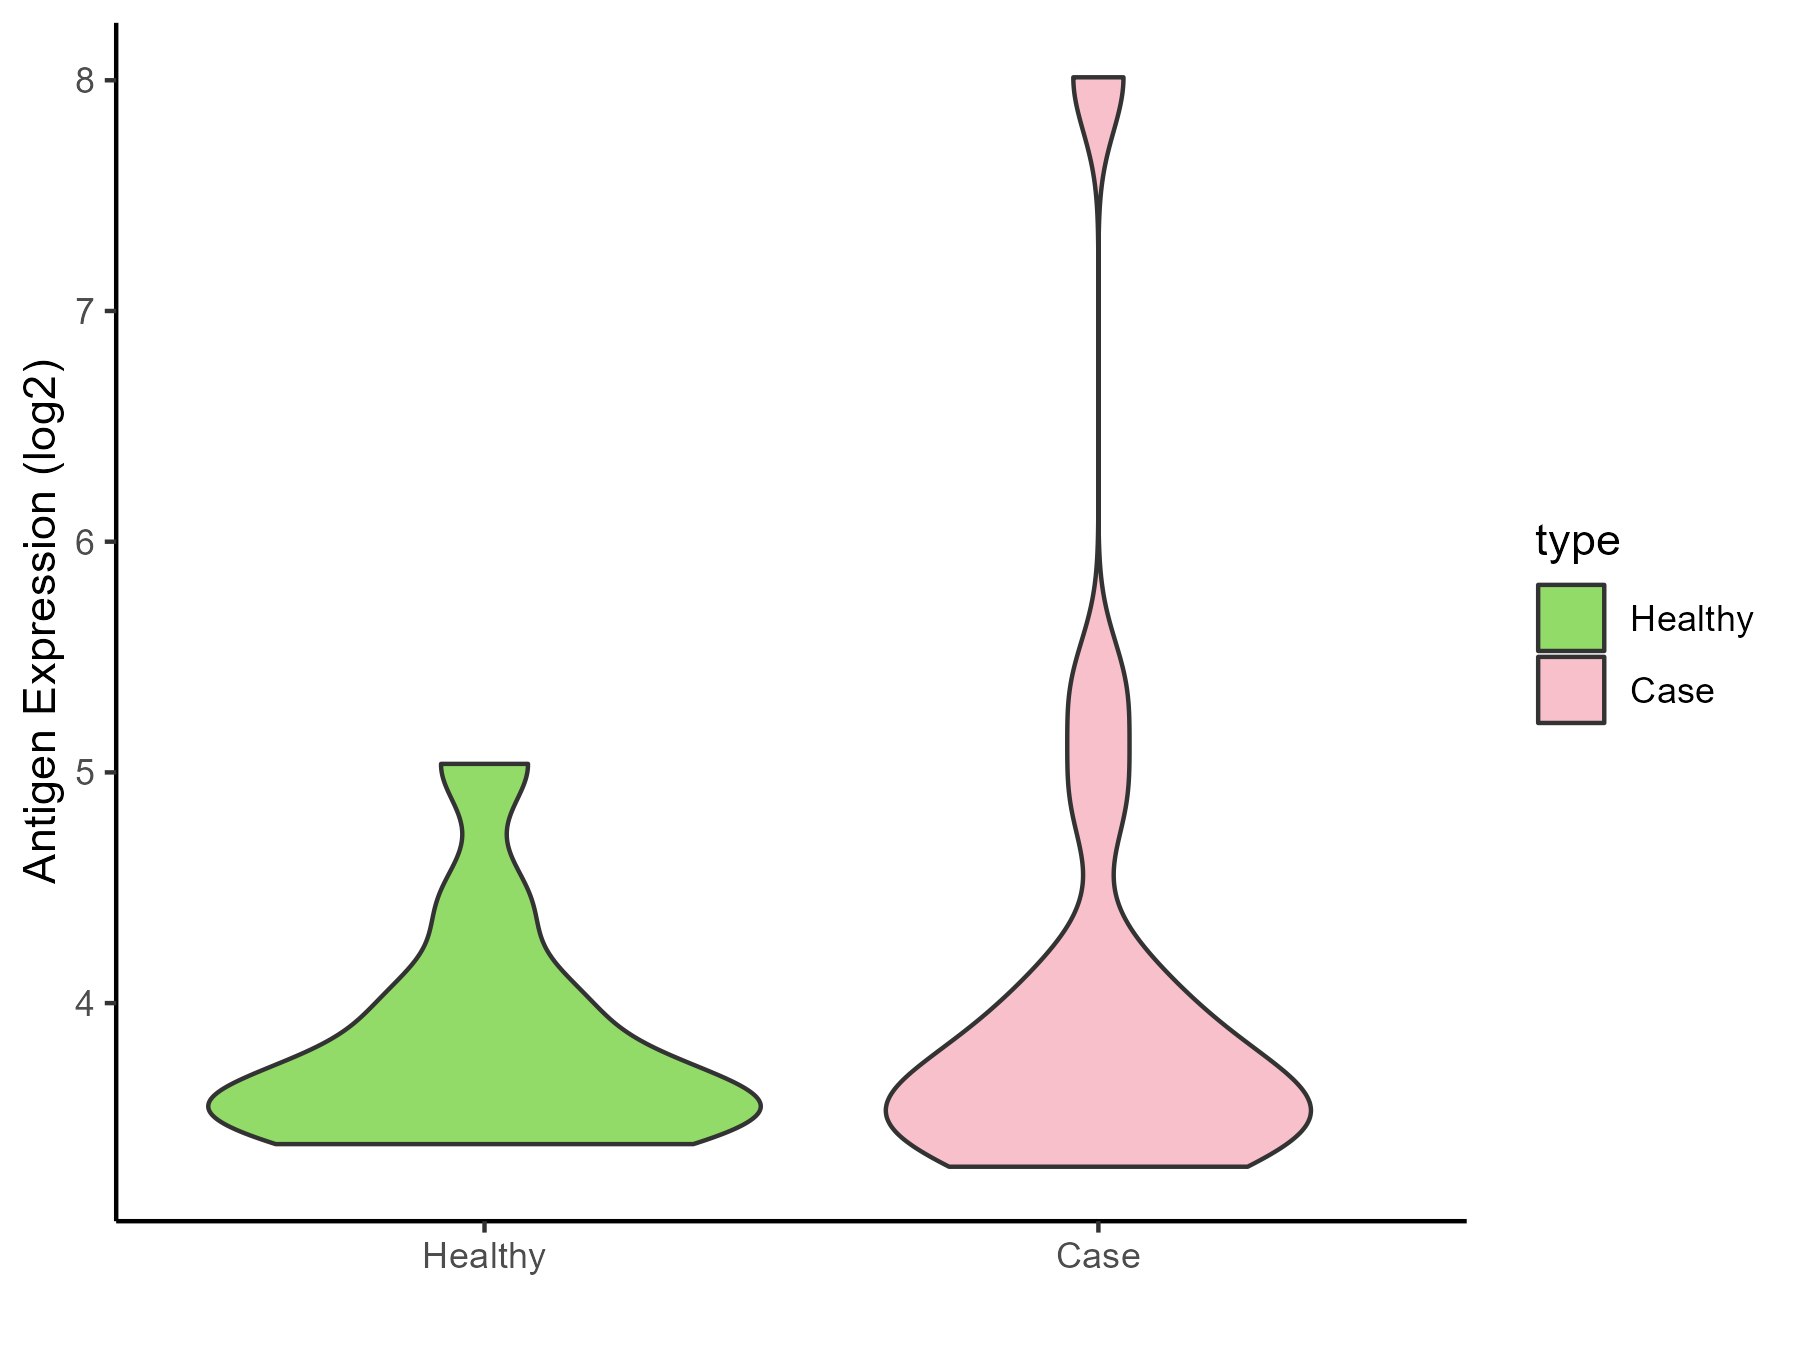
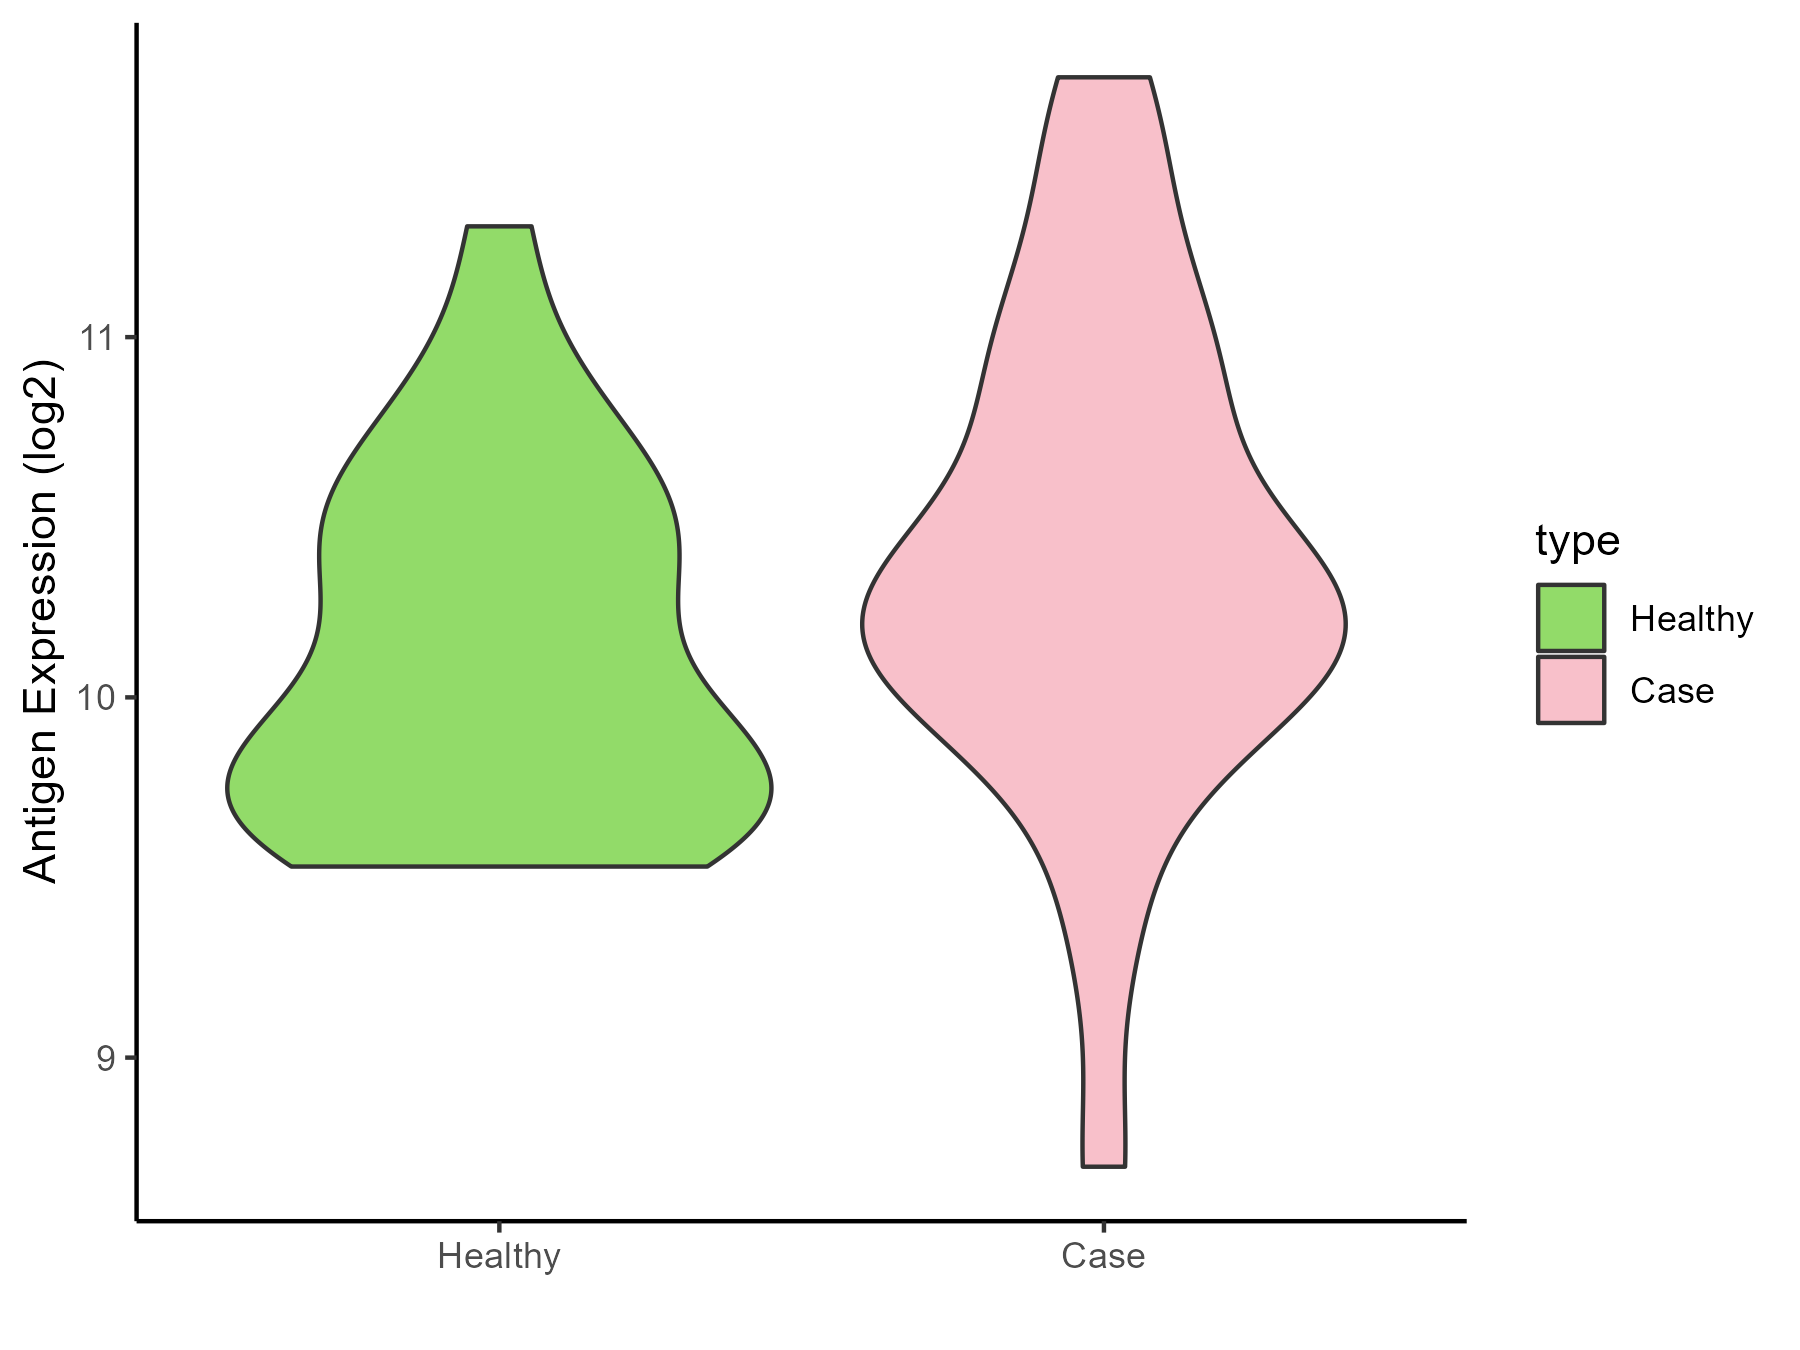
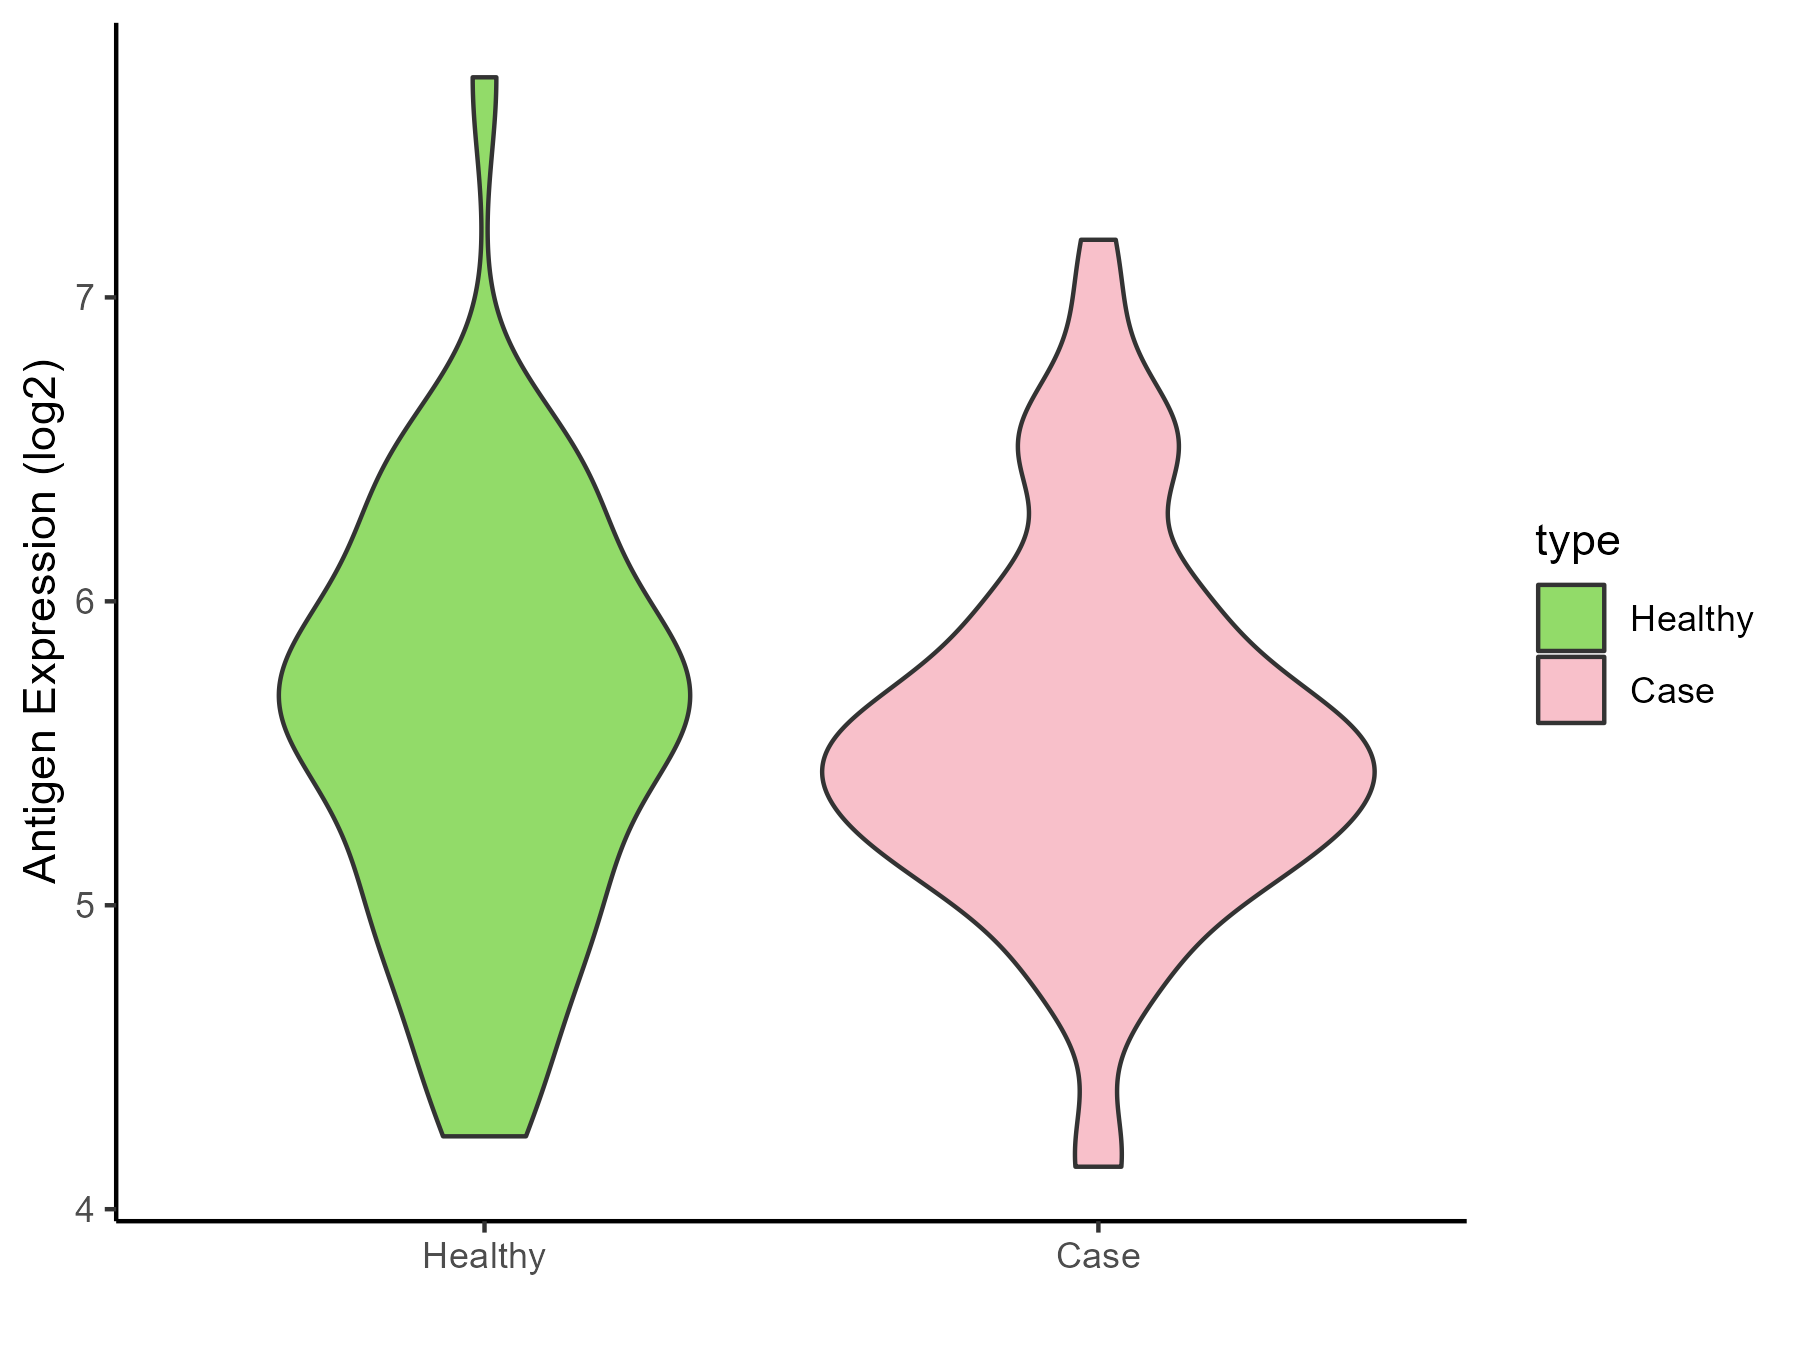
| Differential expression pattern of antigen in diseases | ||
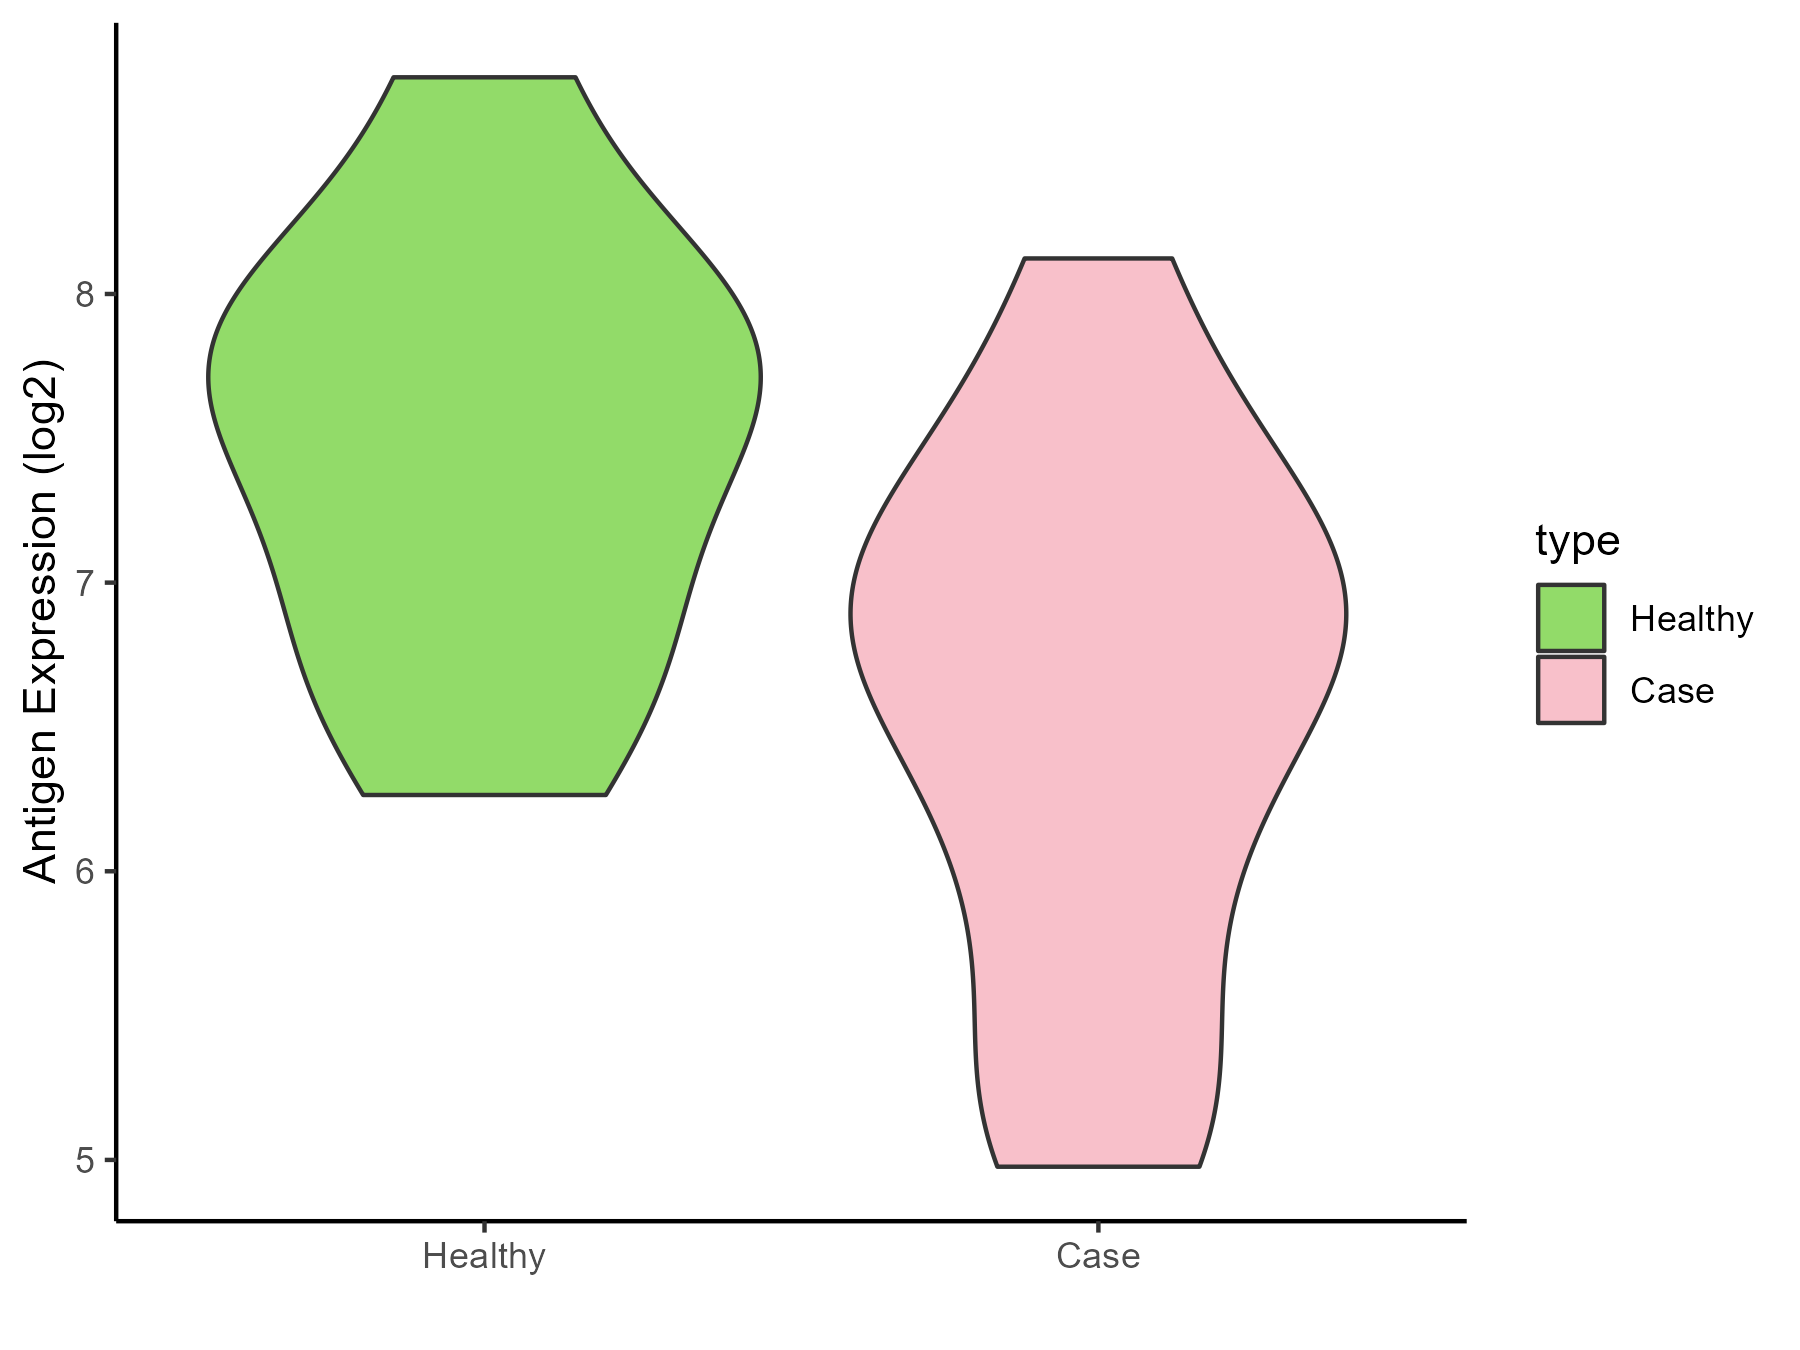
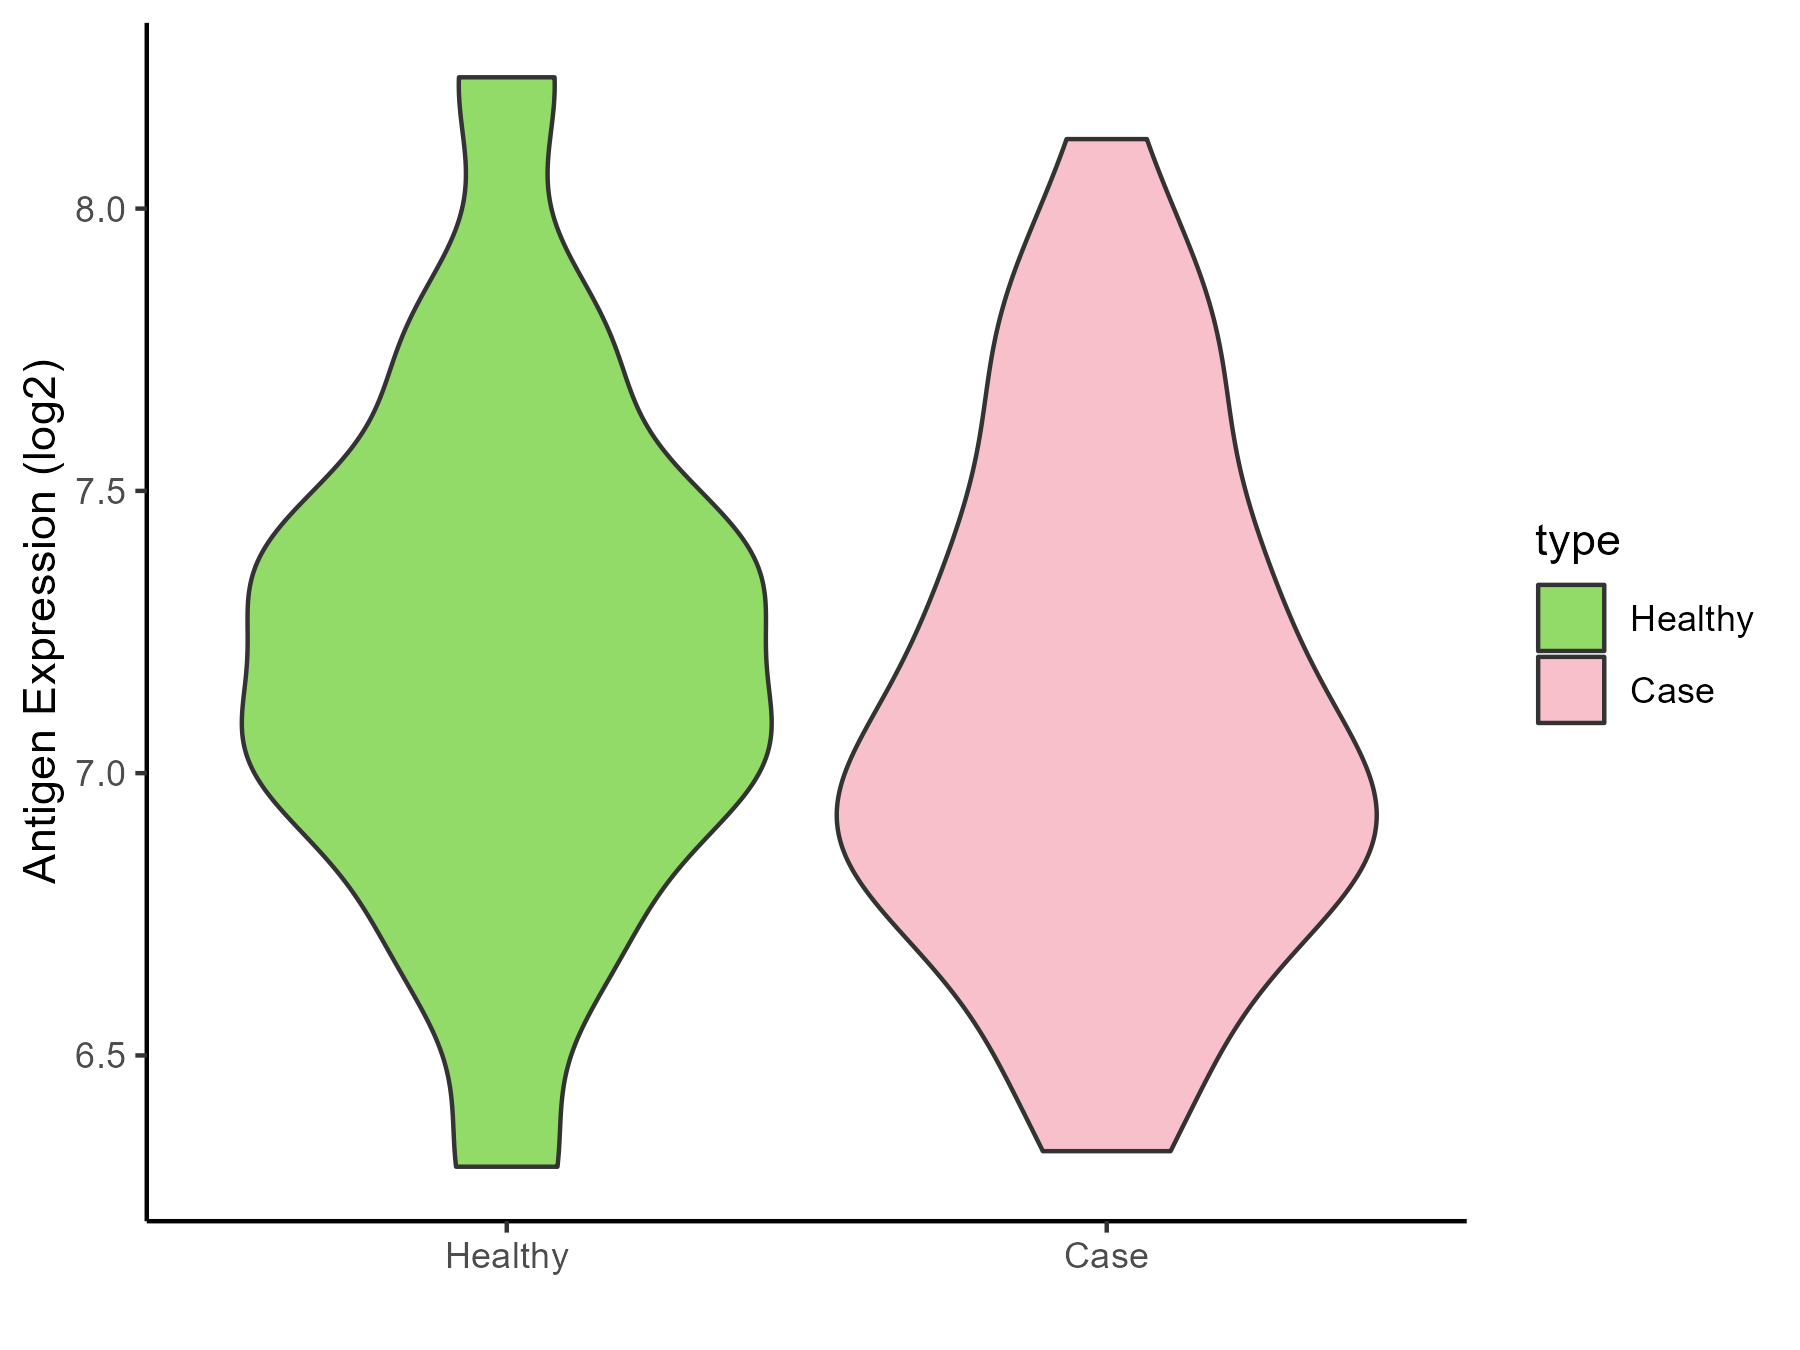
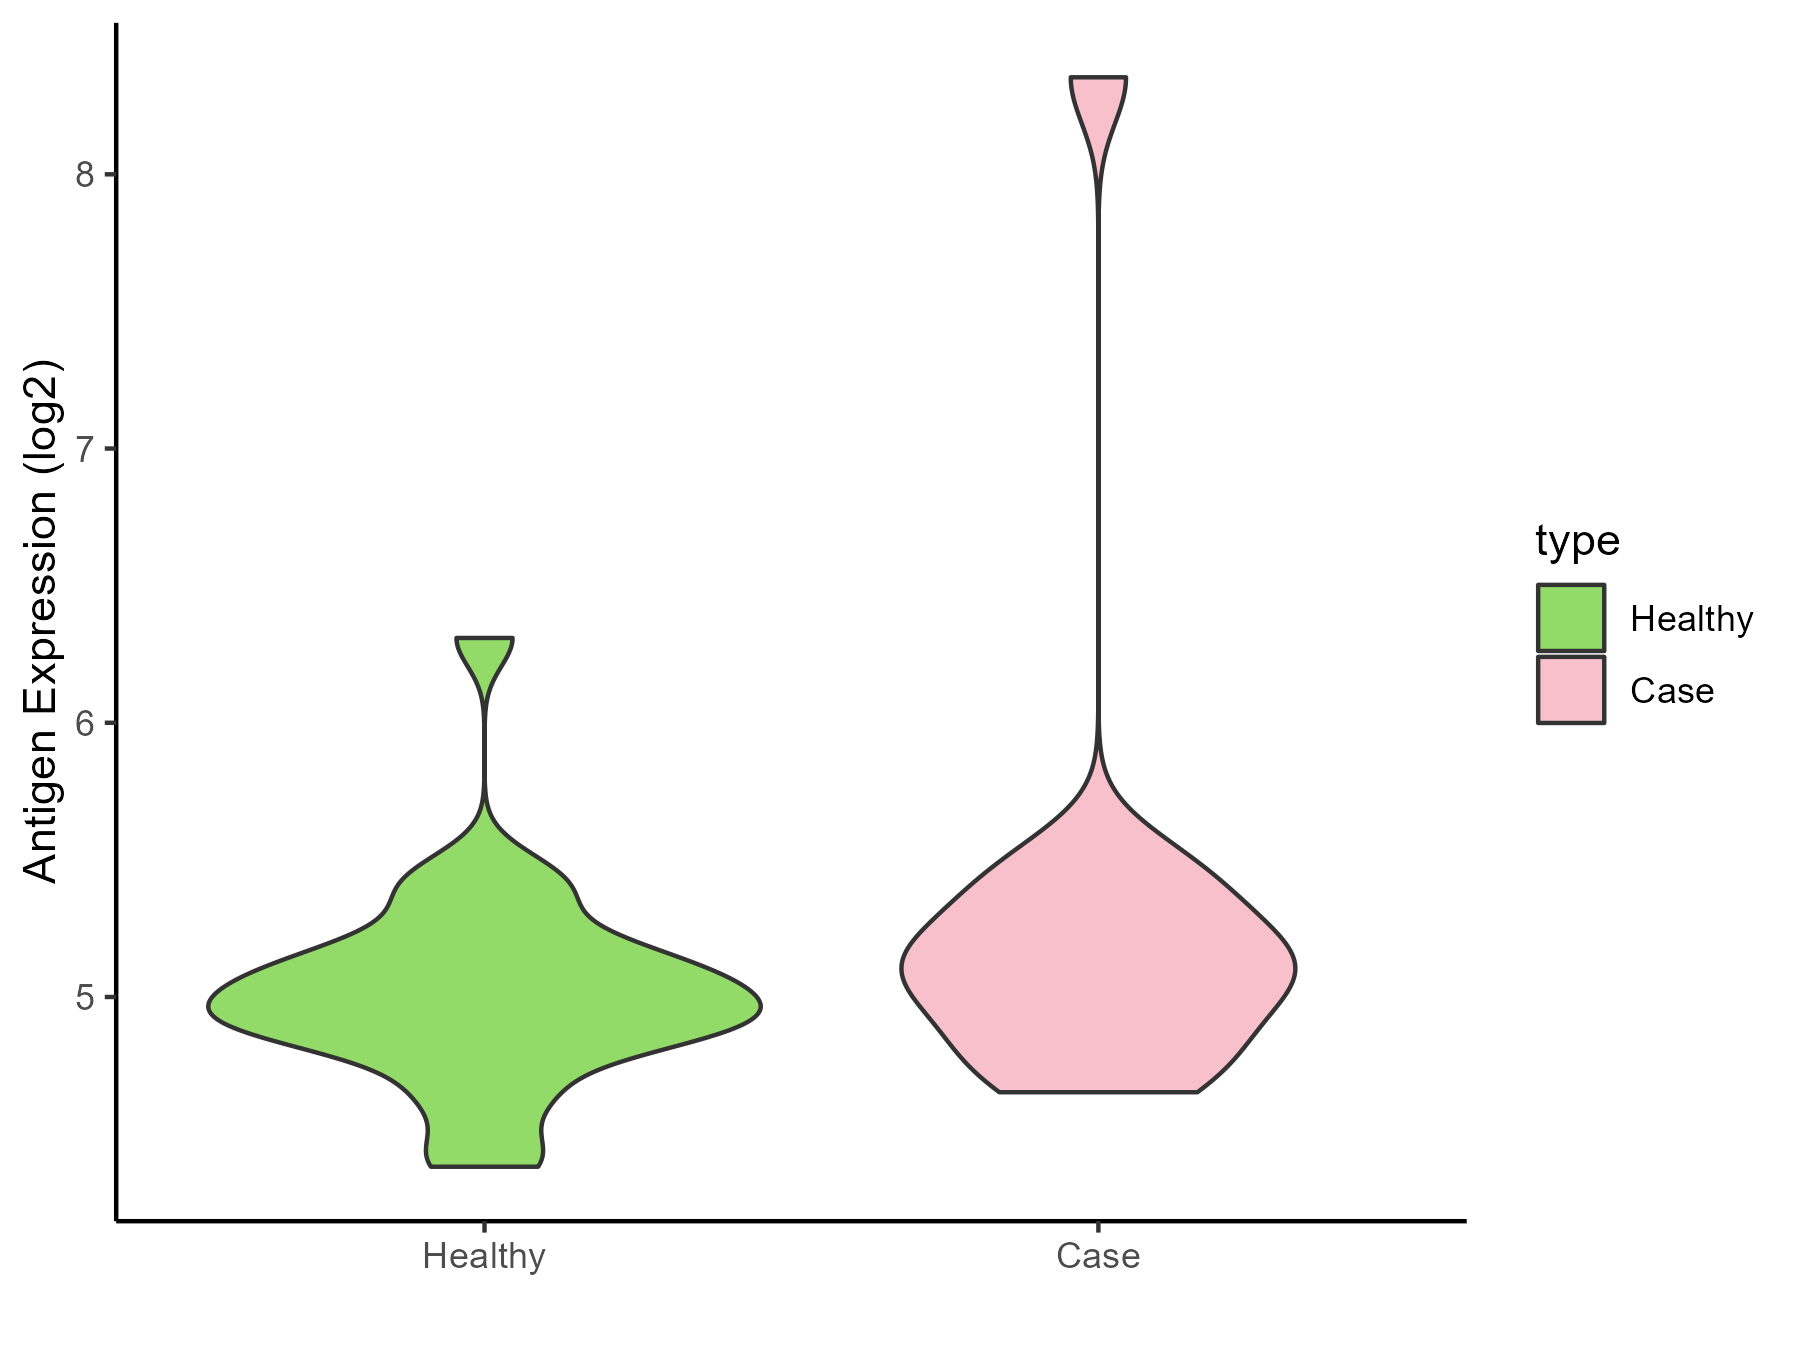
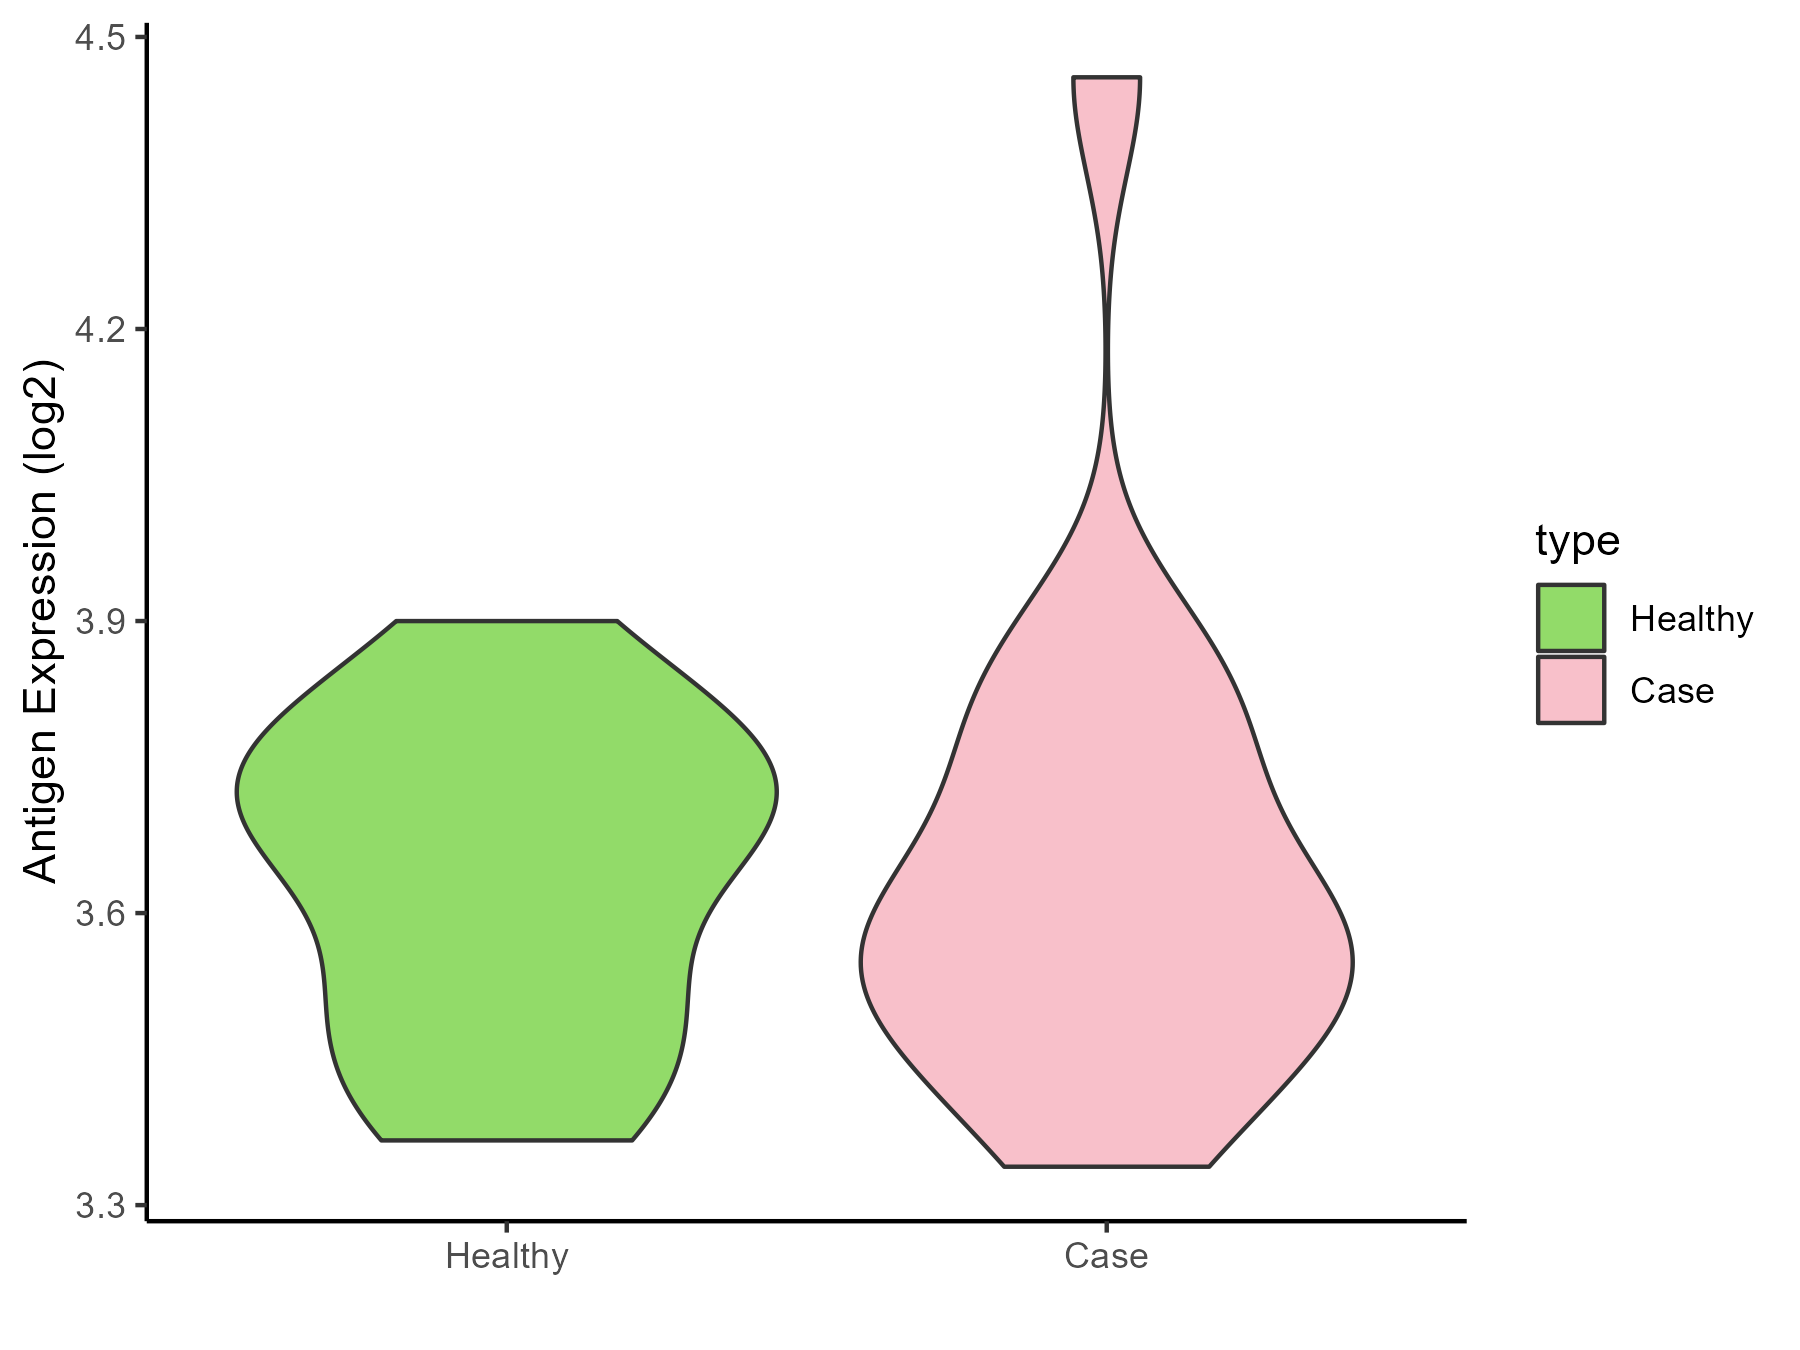
| The Studied Tissue | Brainstem | |
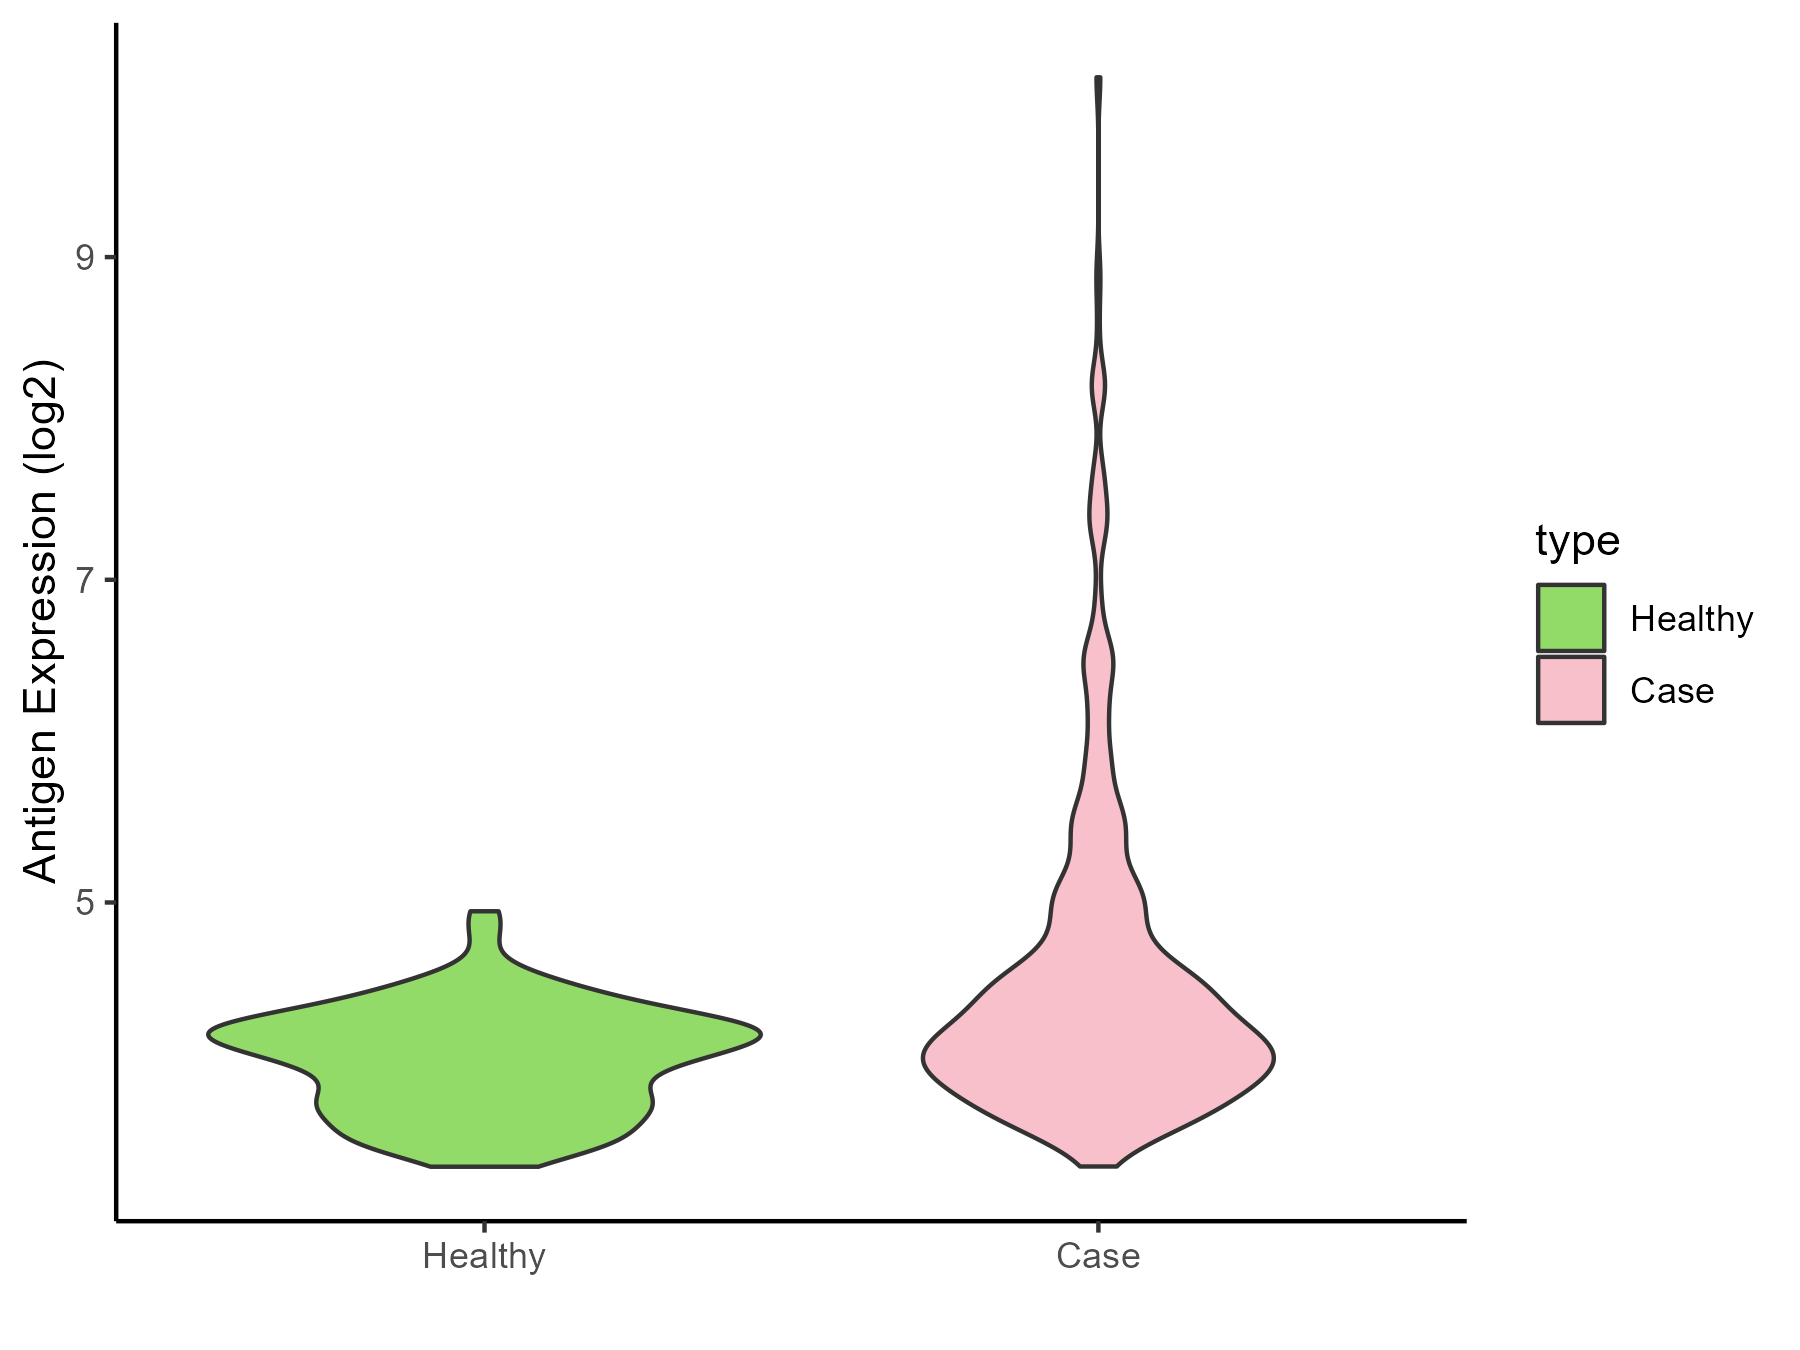
| The Specific Disease | Glioma | |
| The Expression Level of Disease Section Compare with the Healthy Individual Tissue | p-value: 0.576625641; Fold-change: -1.202695829; Z-score: -0.944857778 | |
| Disease-specific Antigen Abundances |
|
Click to View the Clearer Original Diagram |
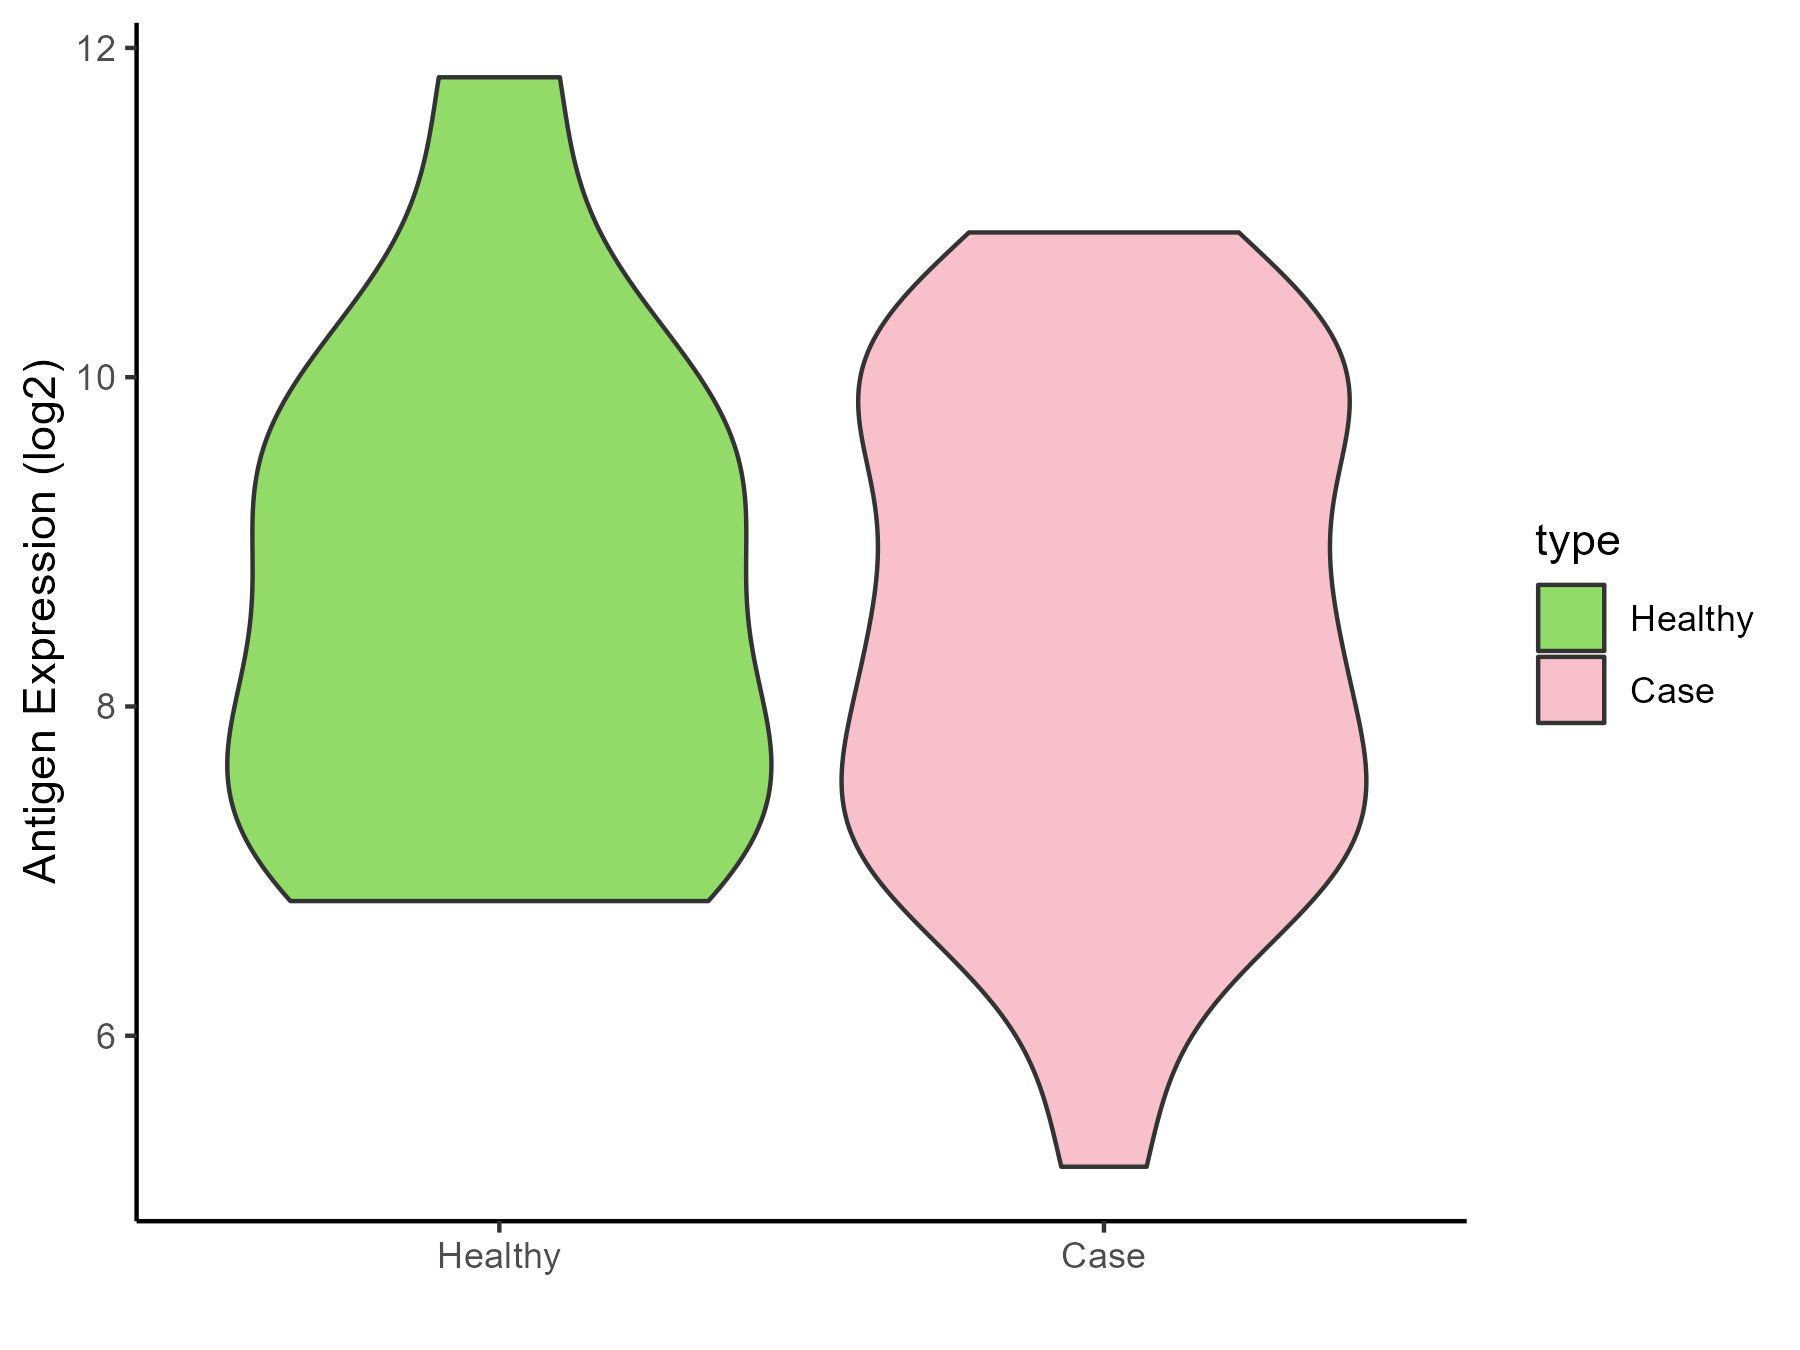
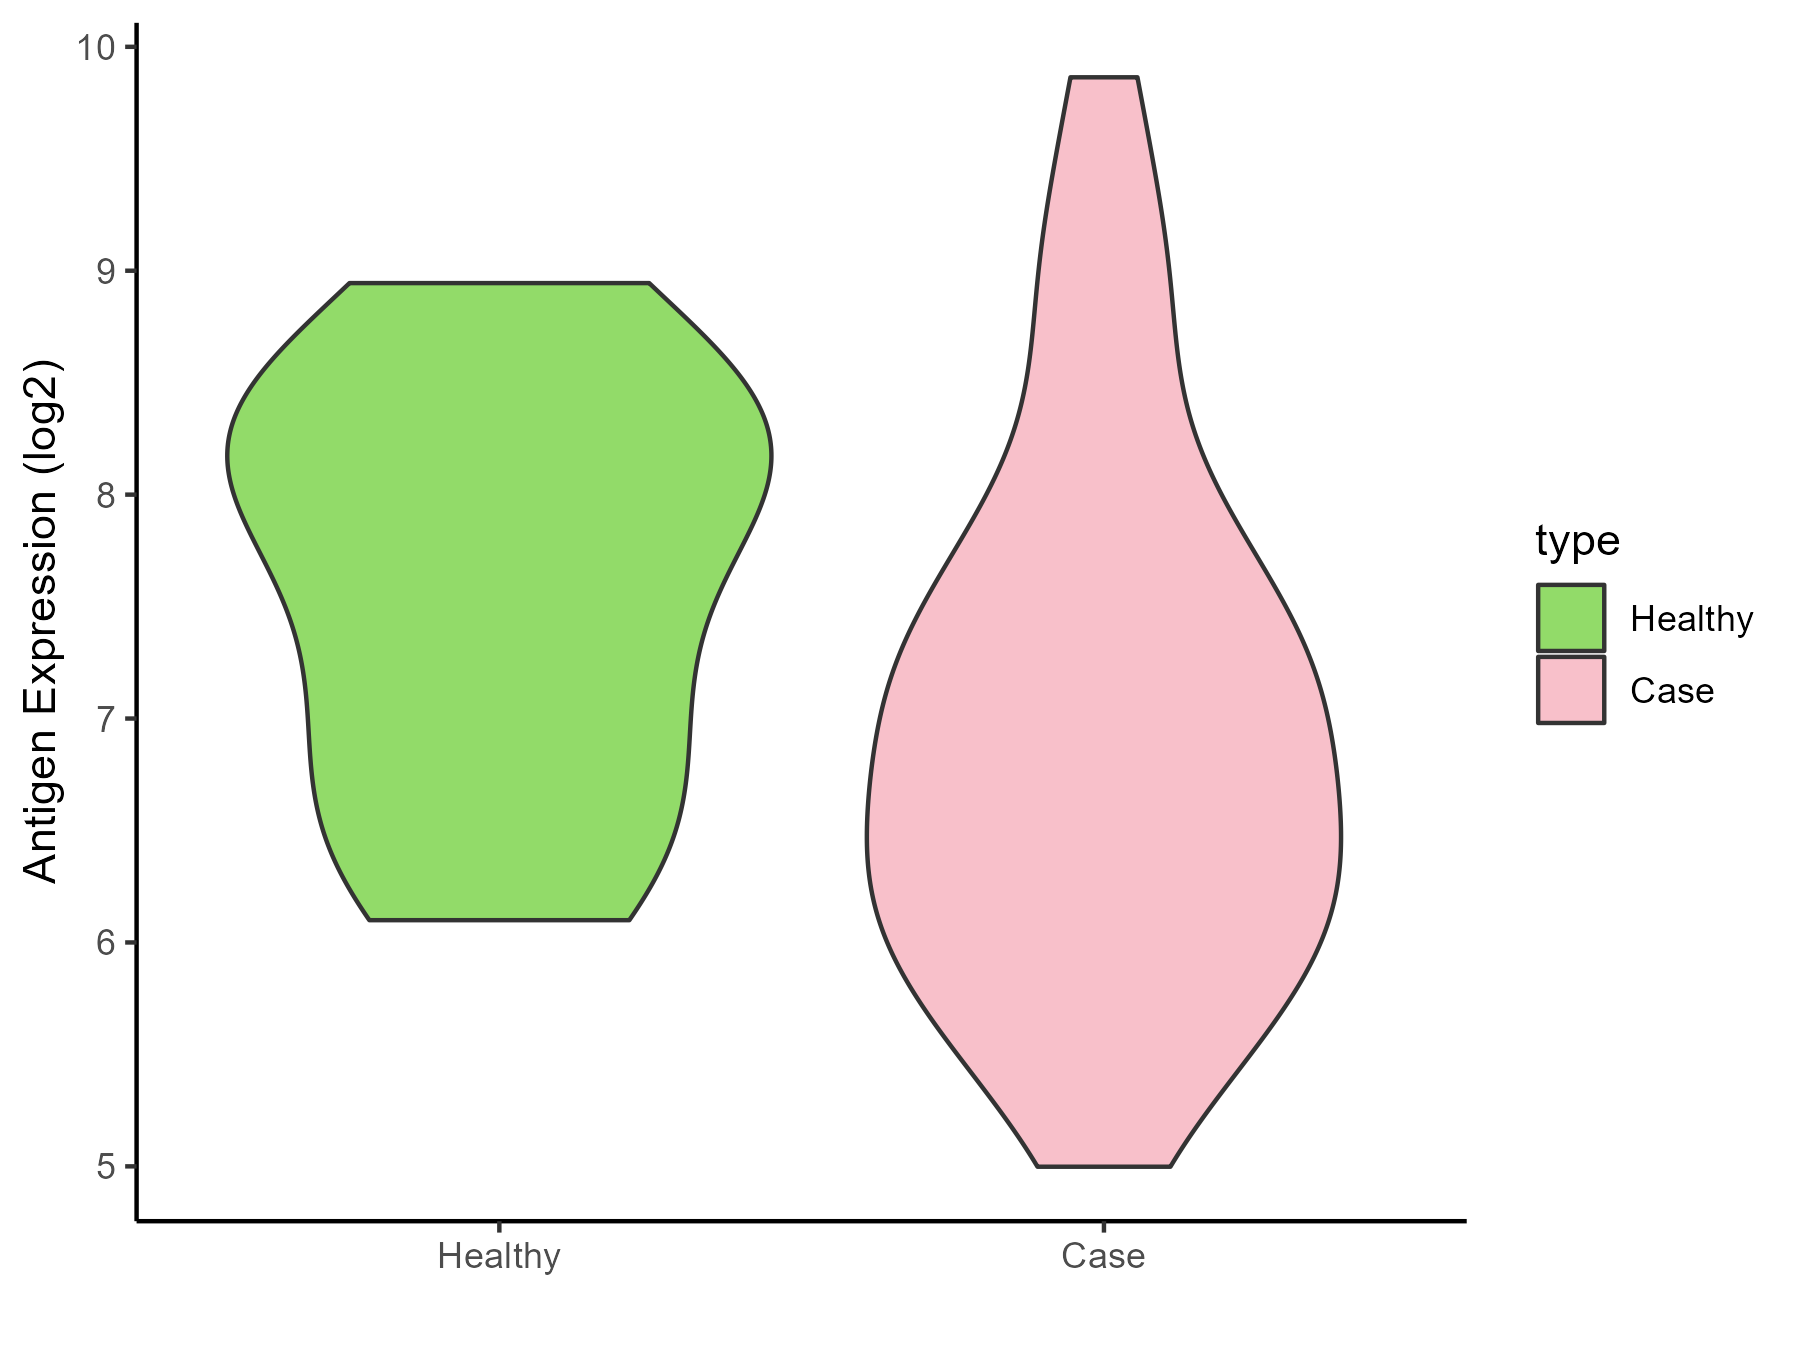
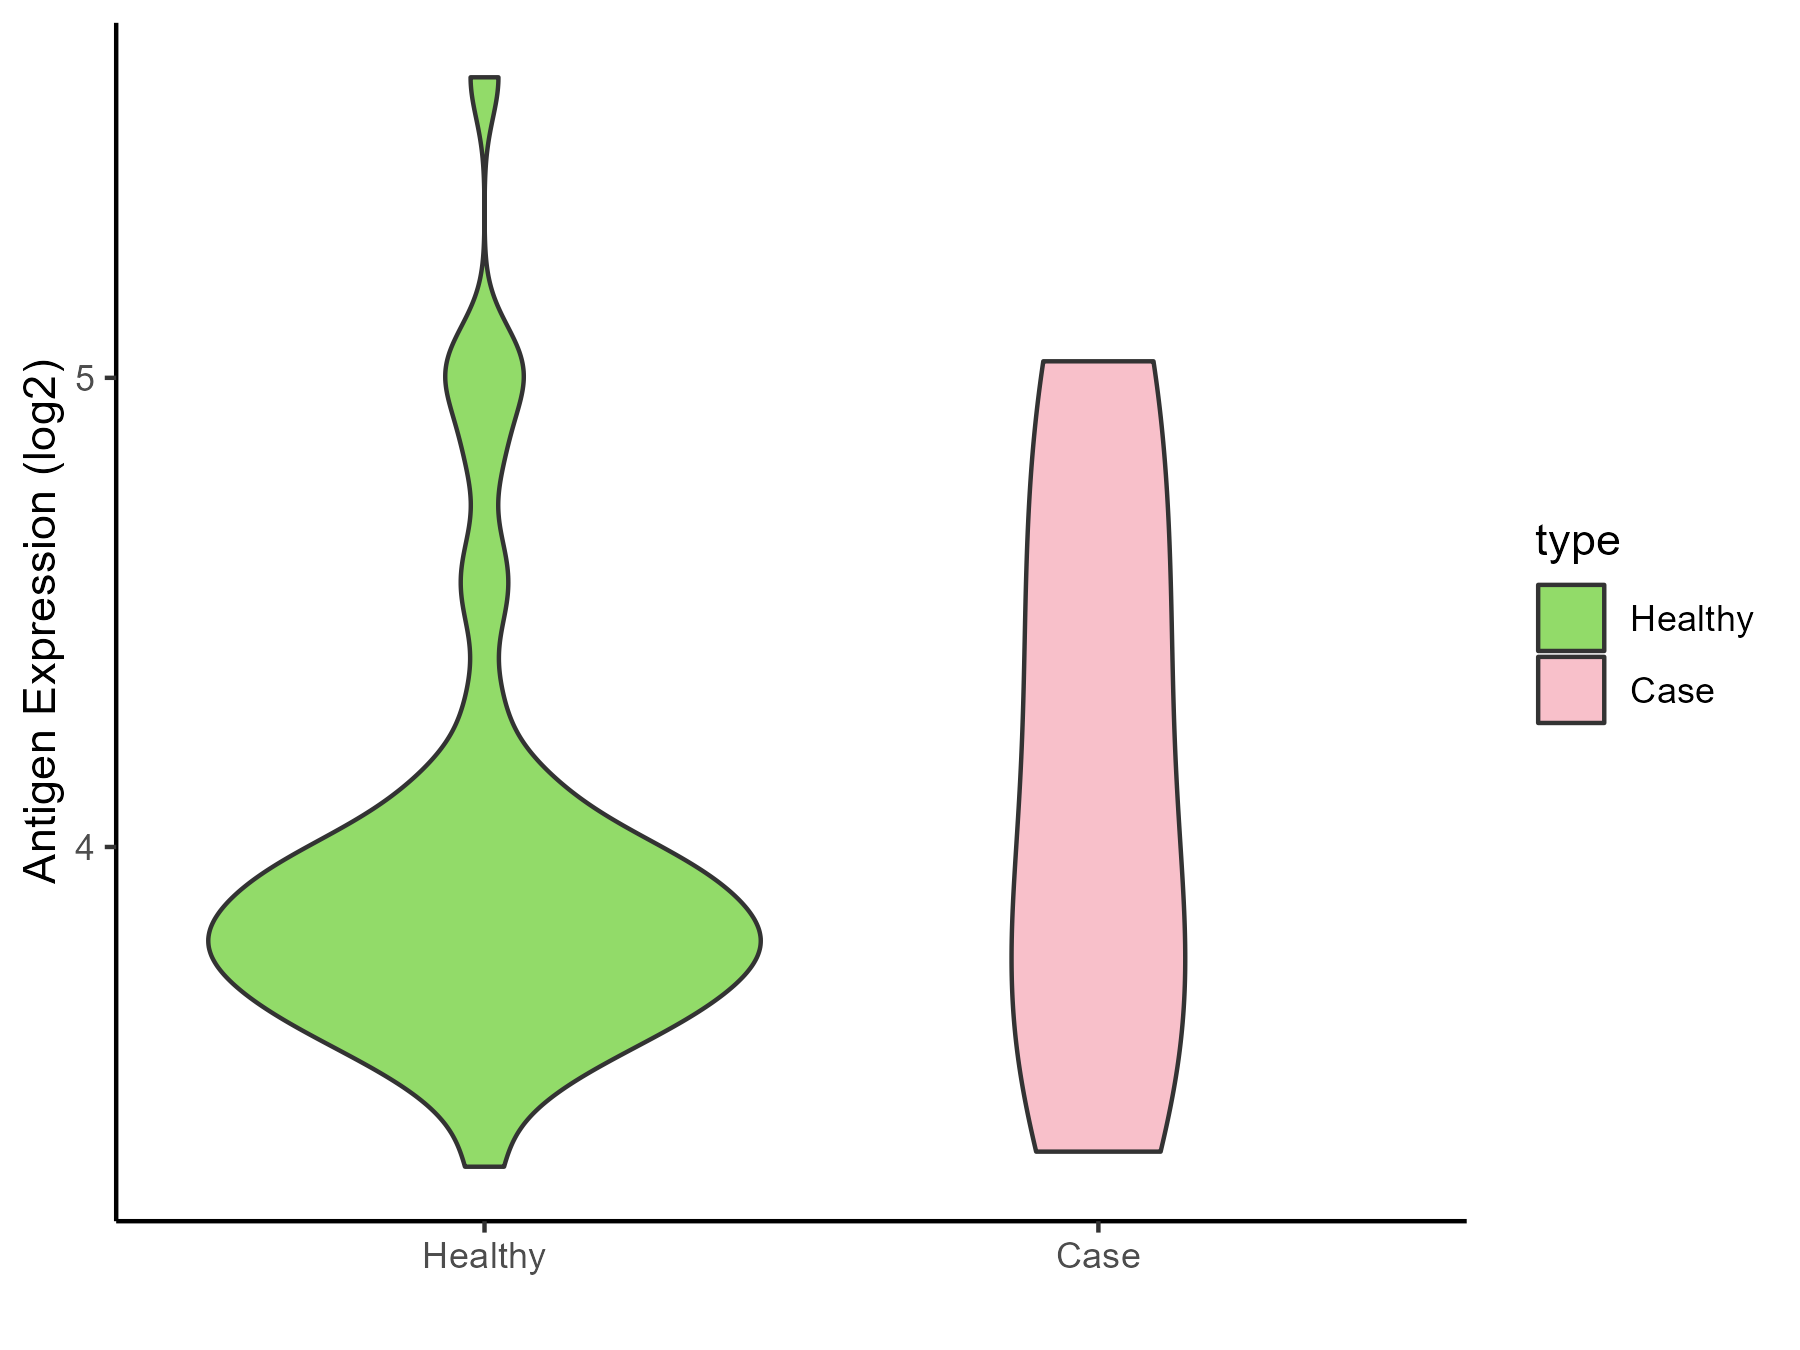
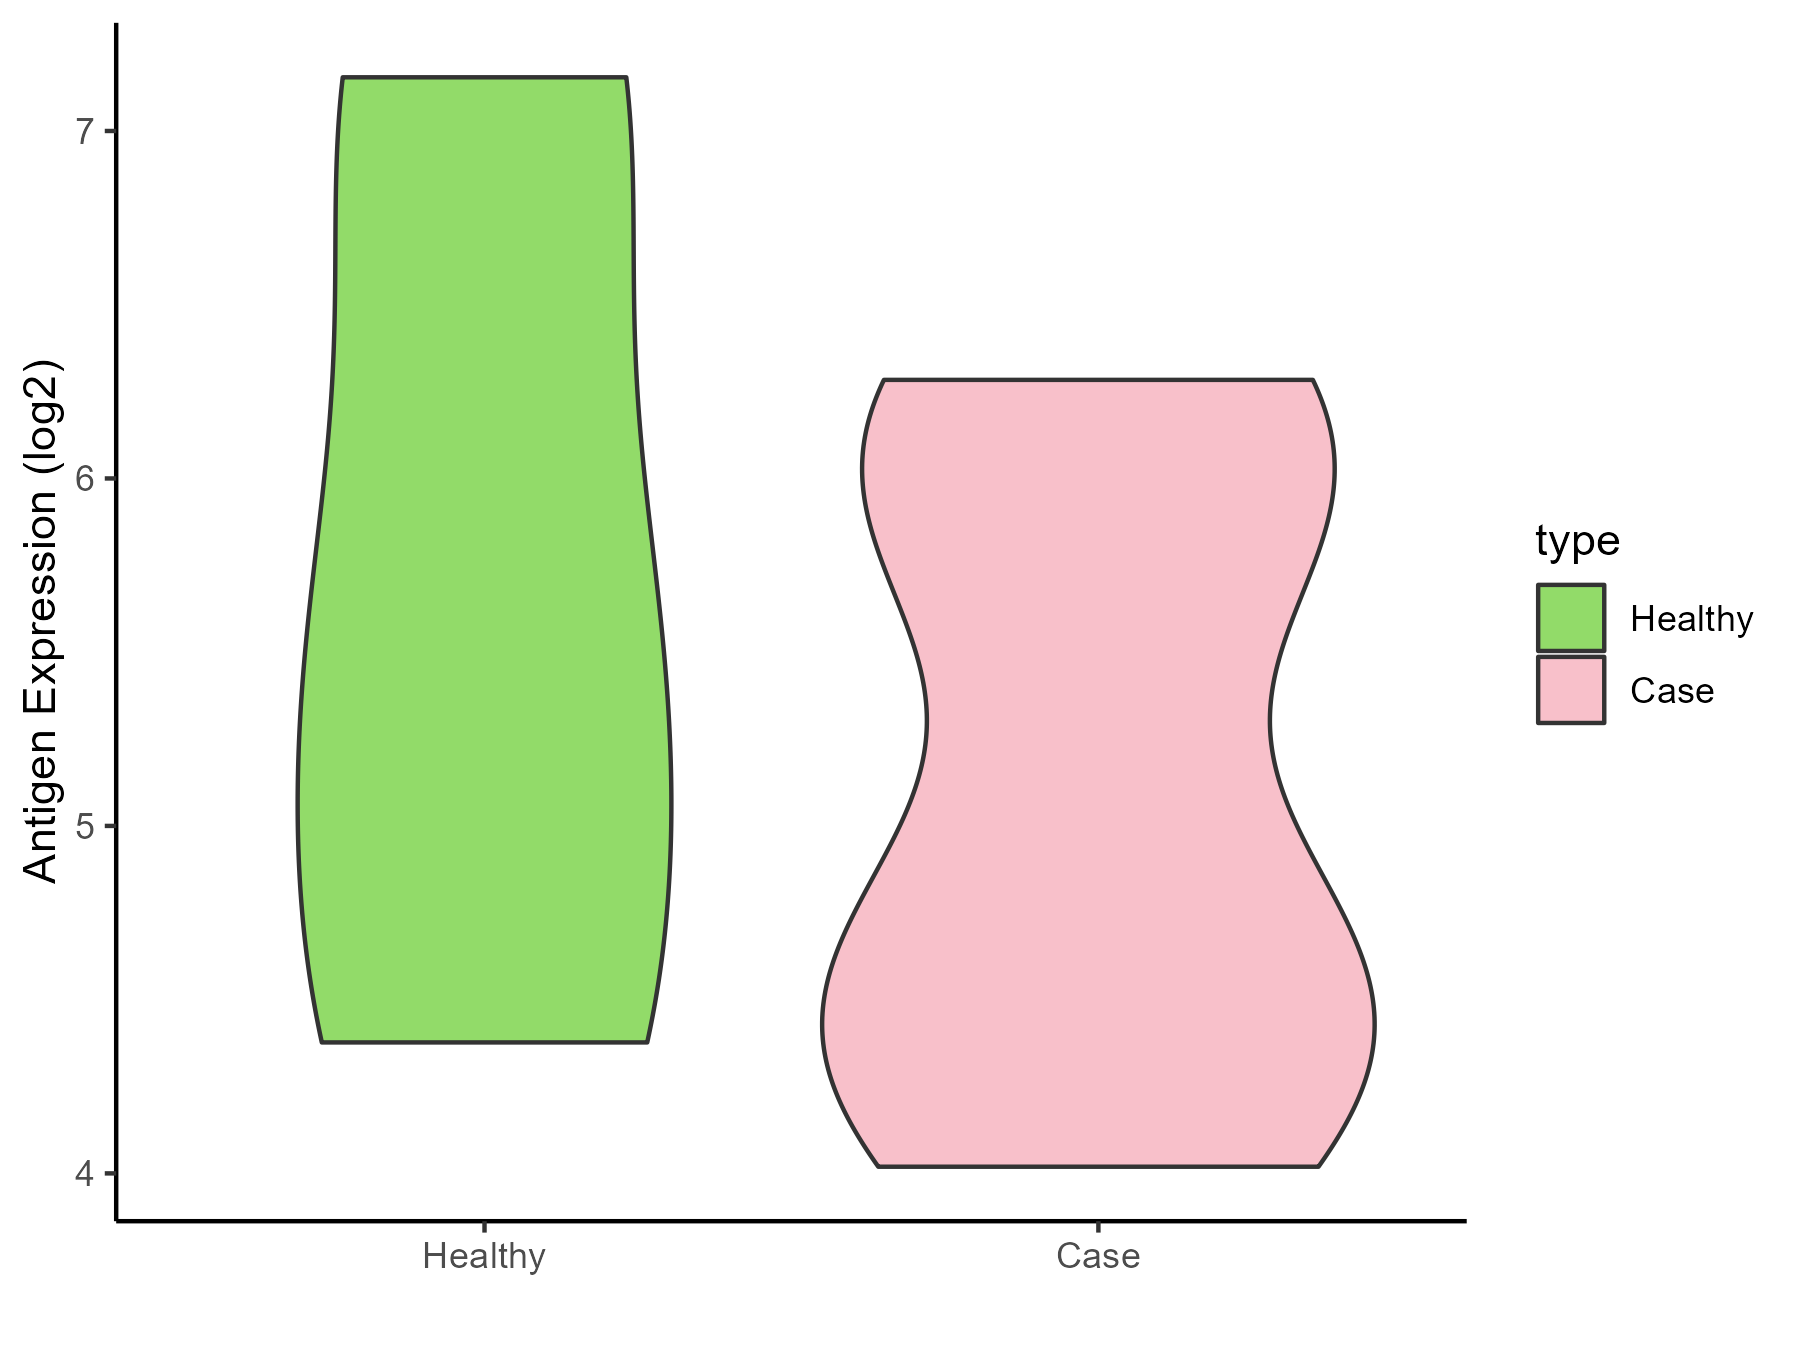
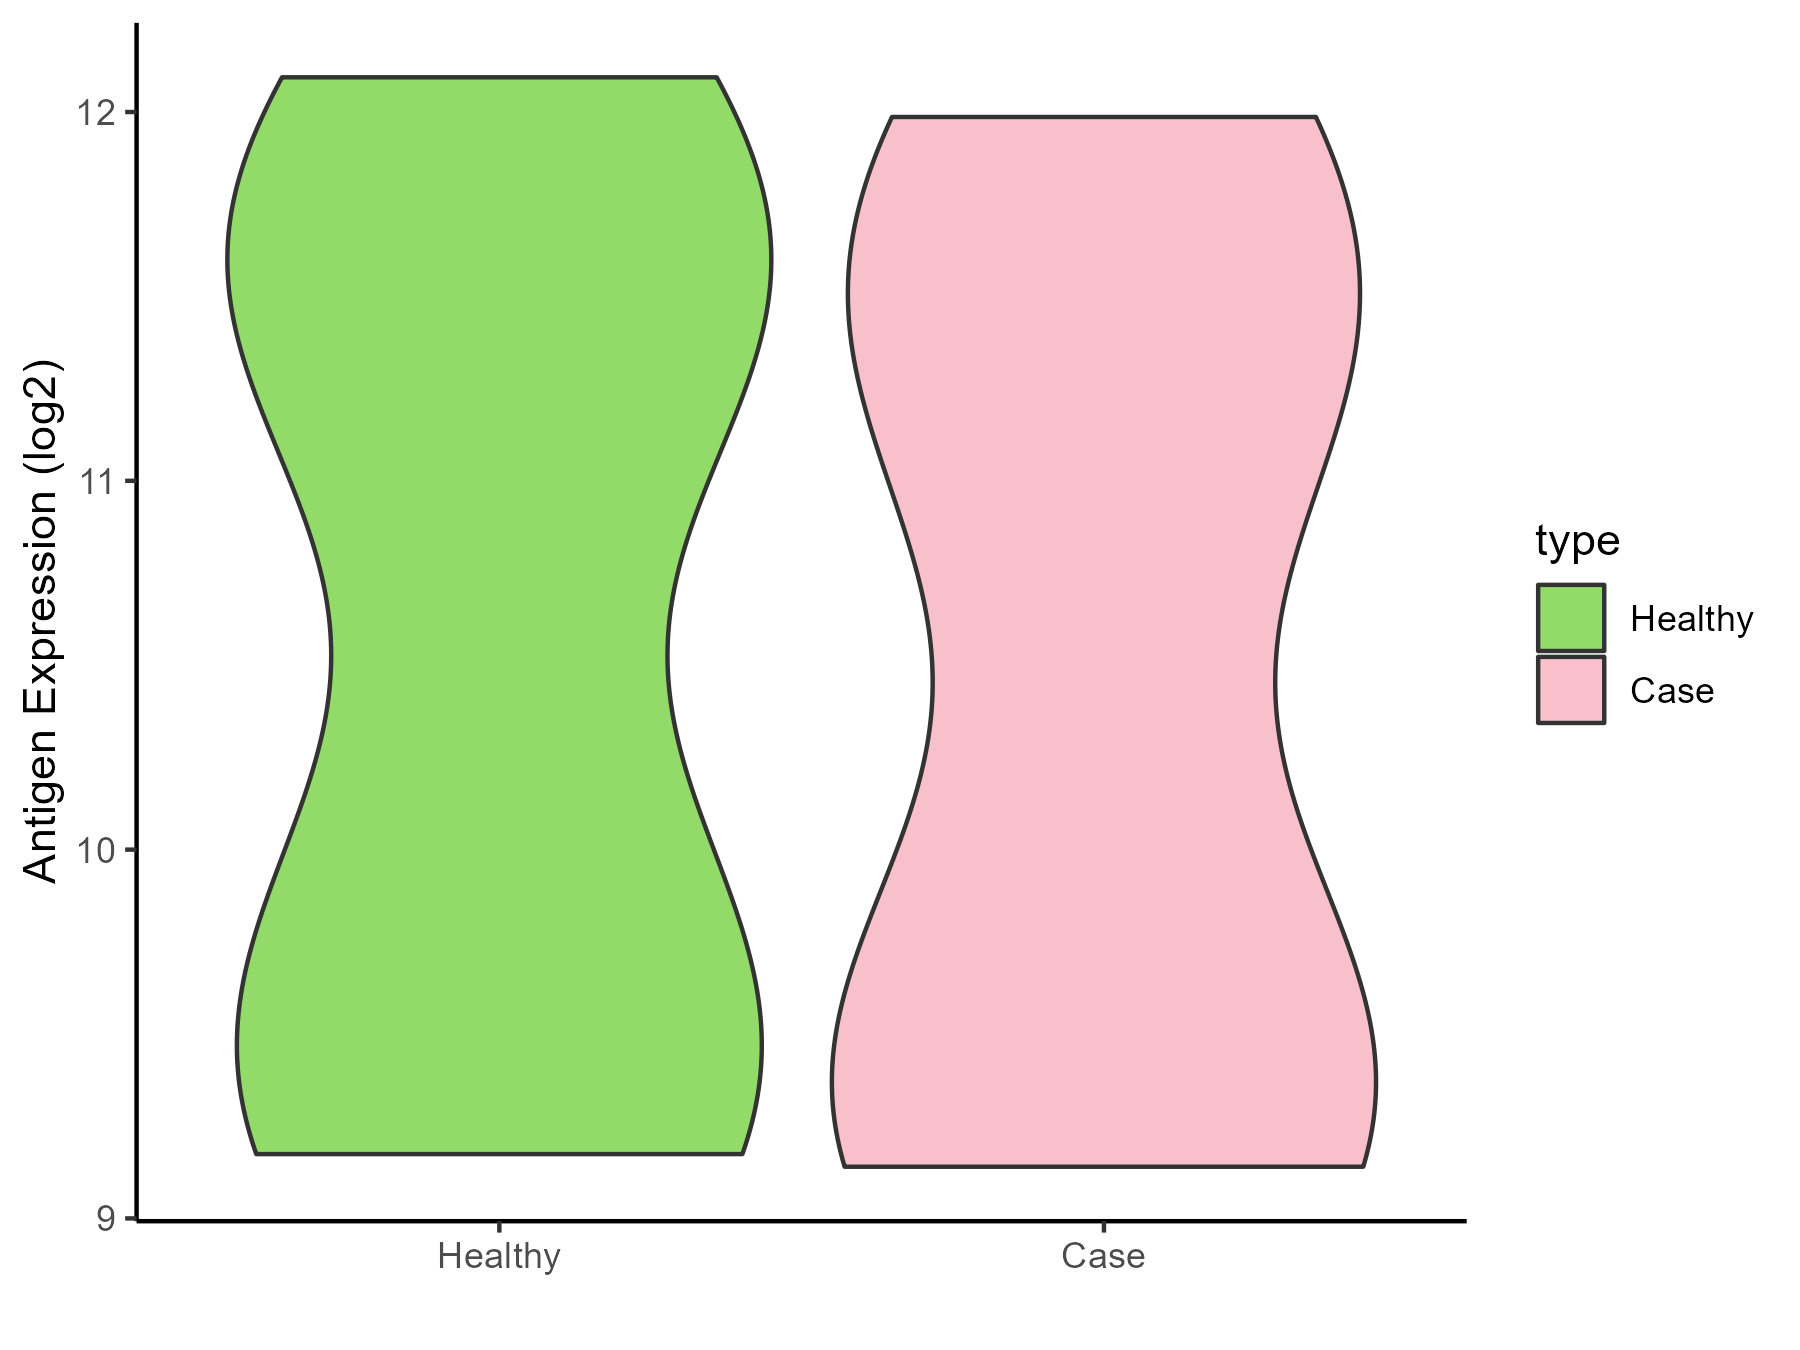
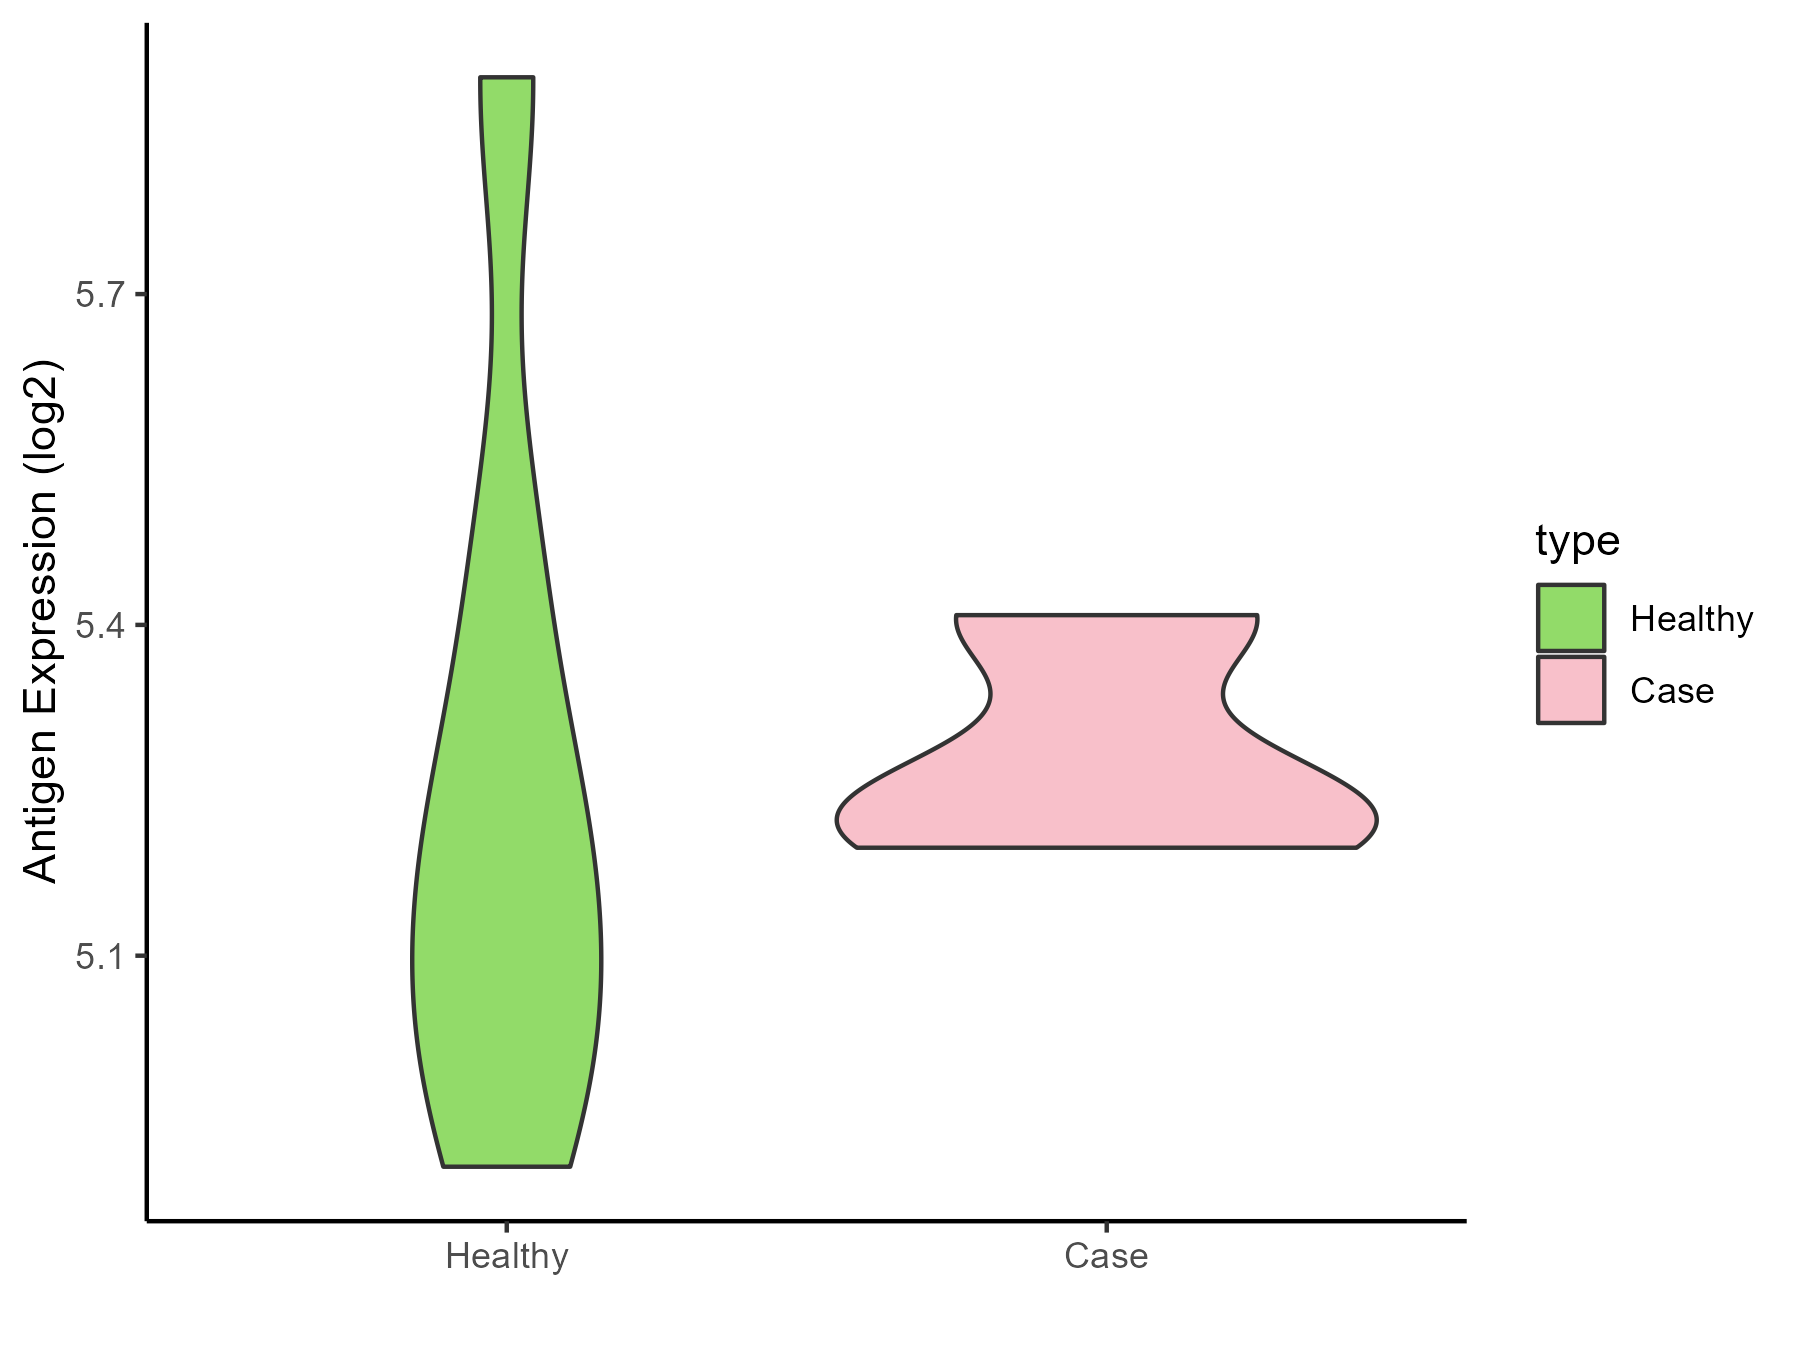
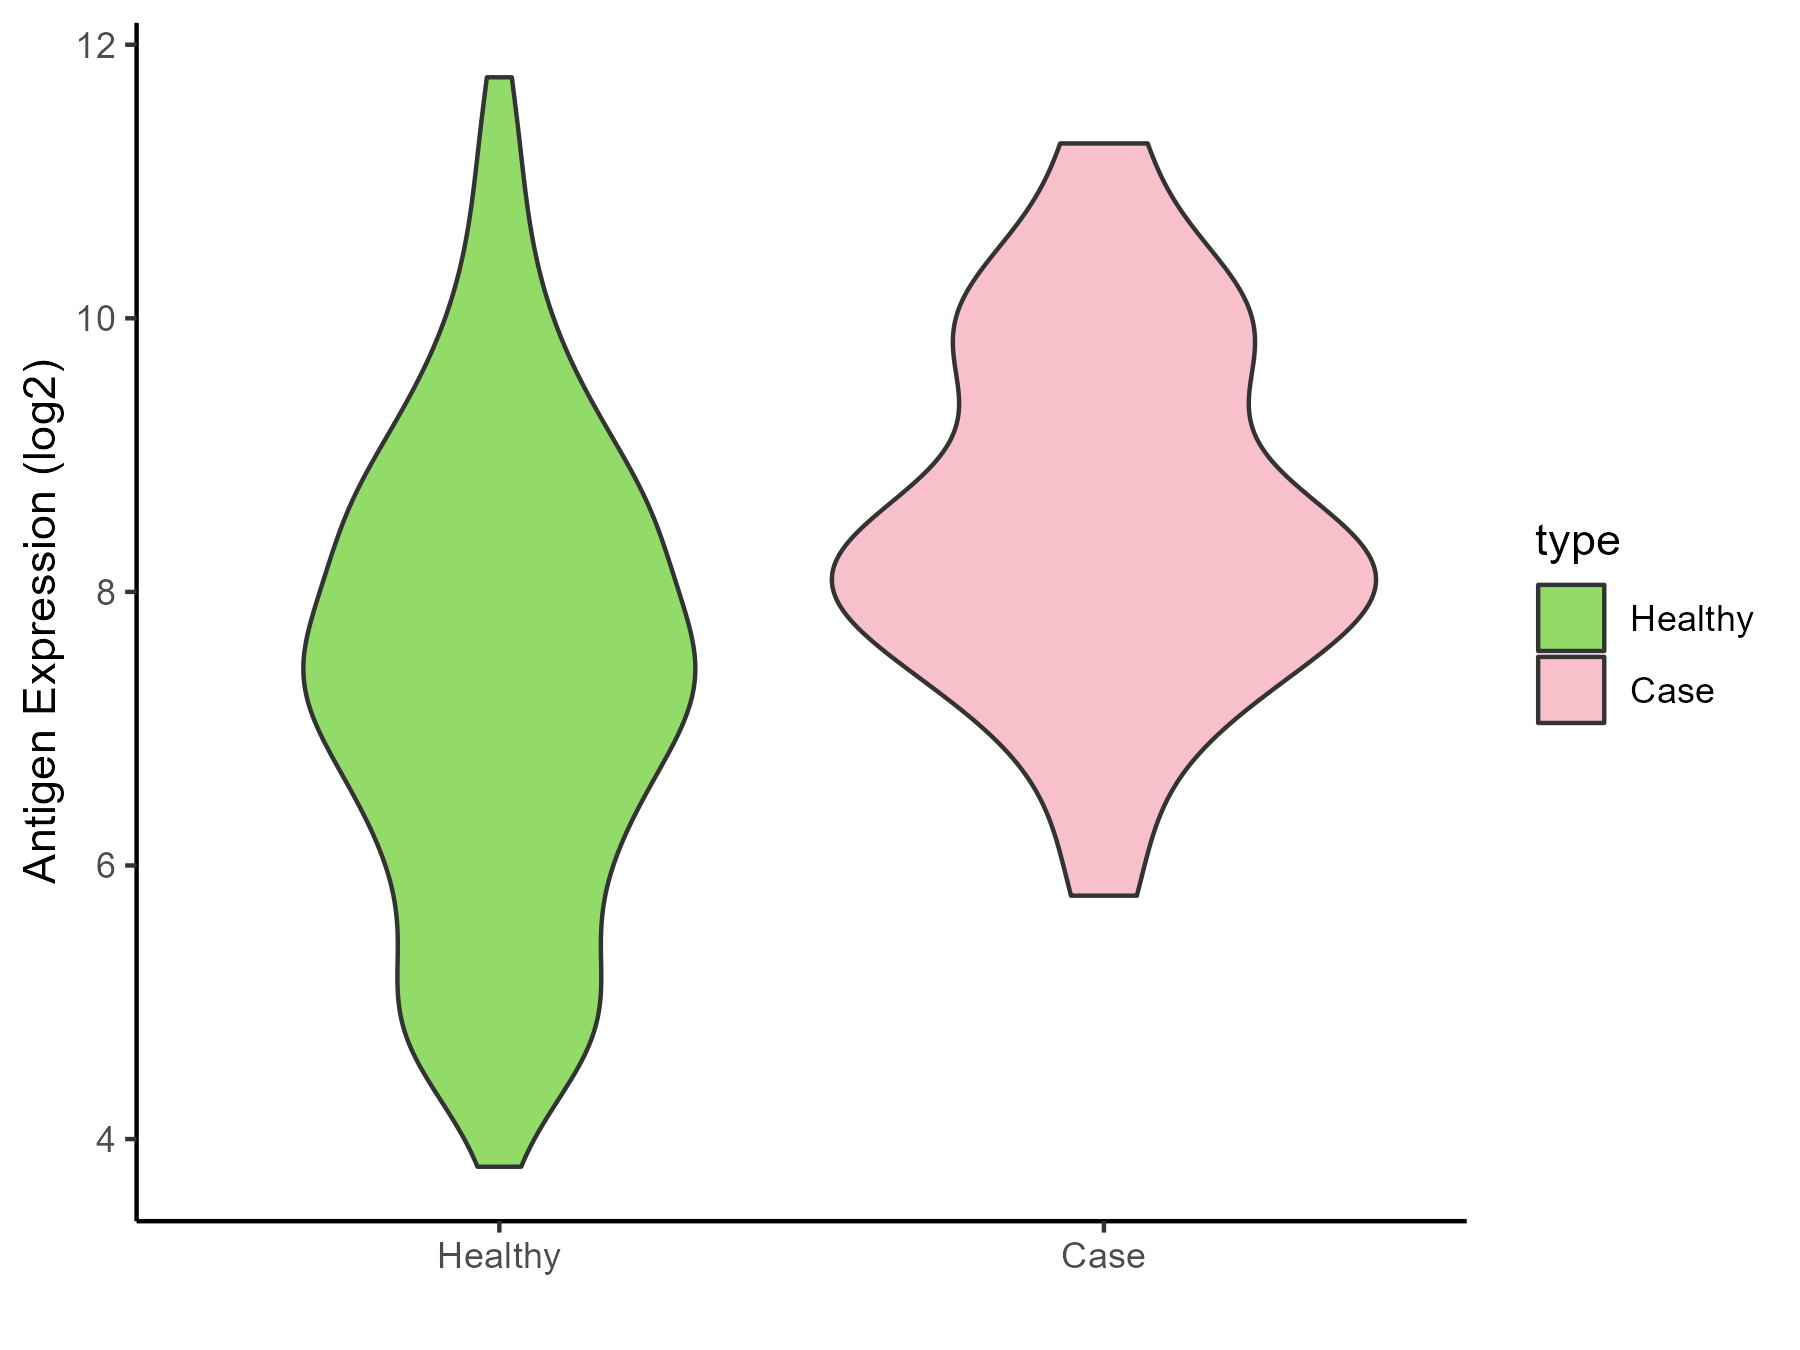
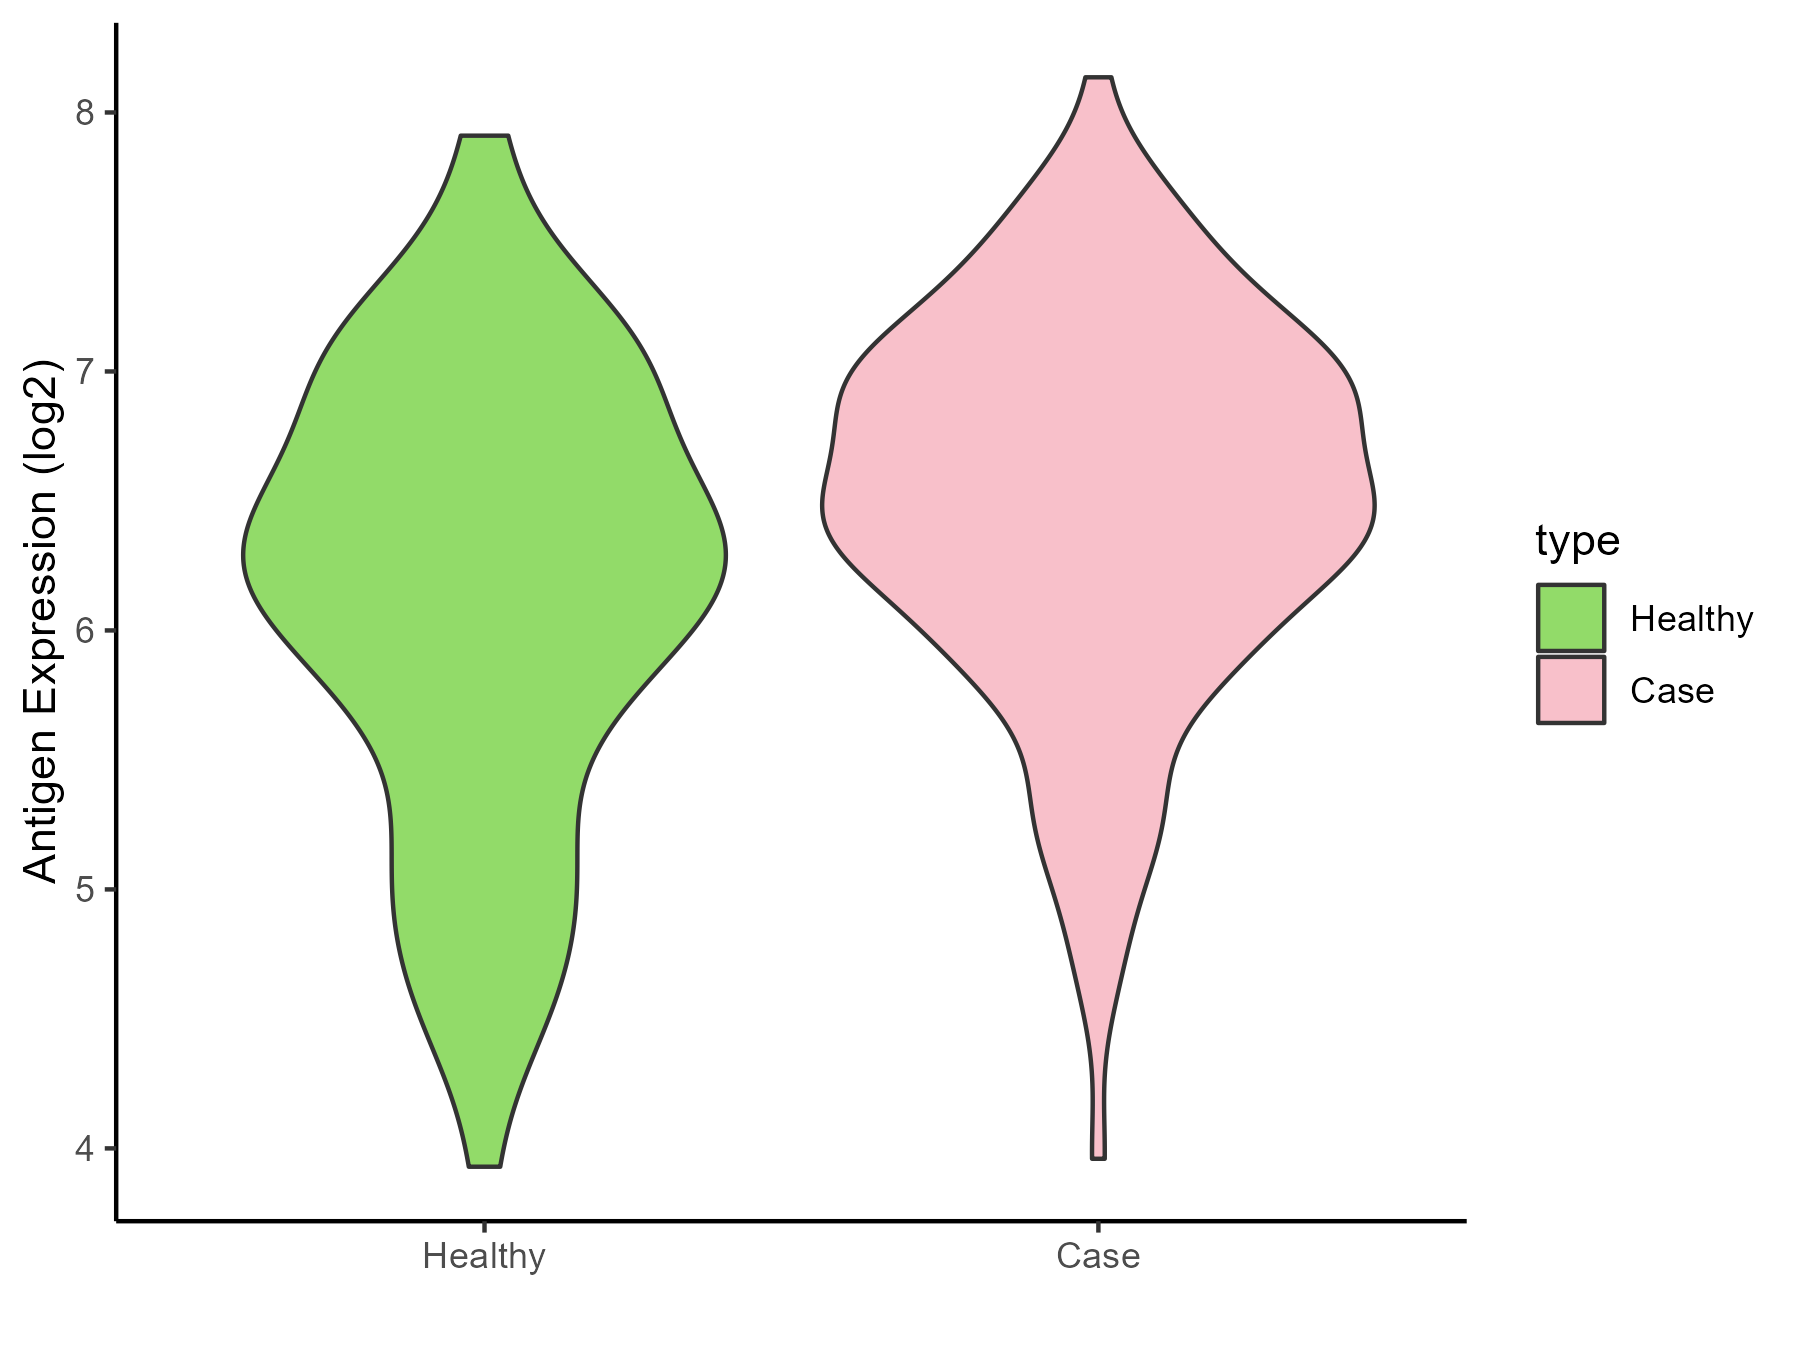
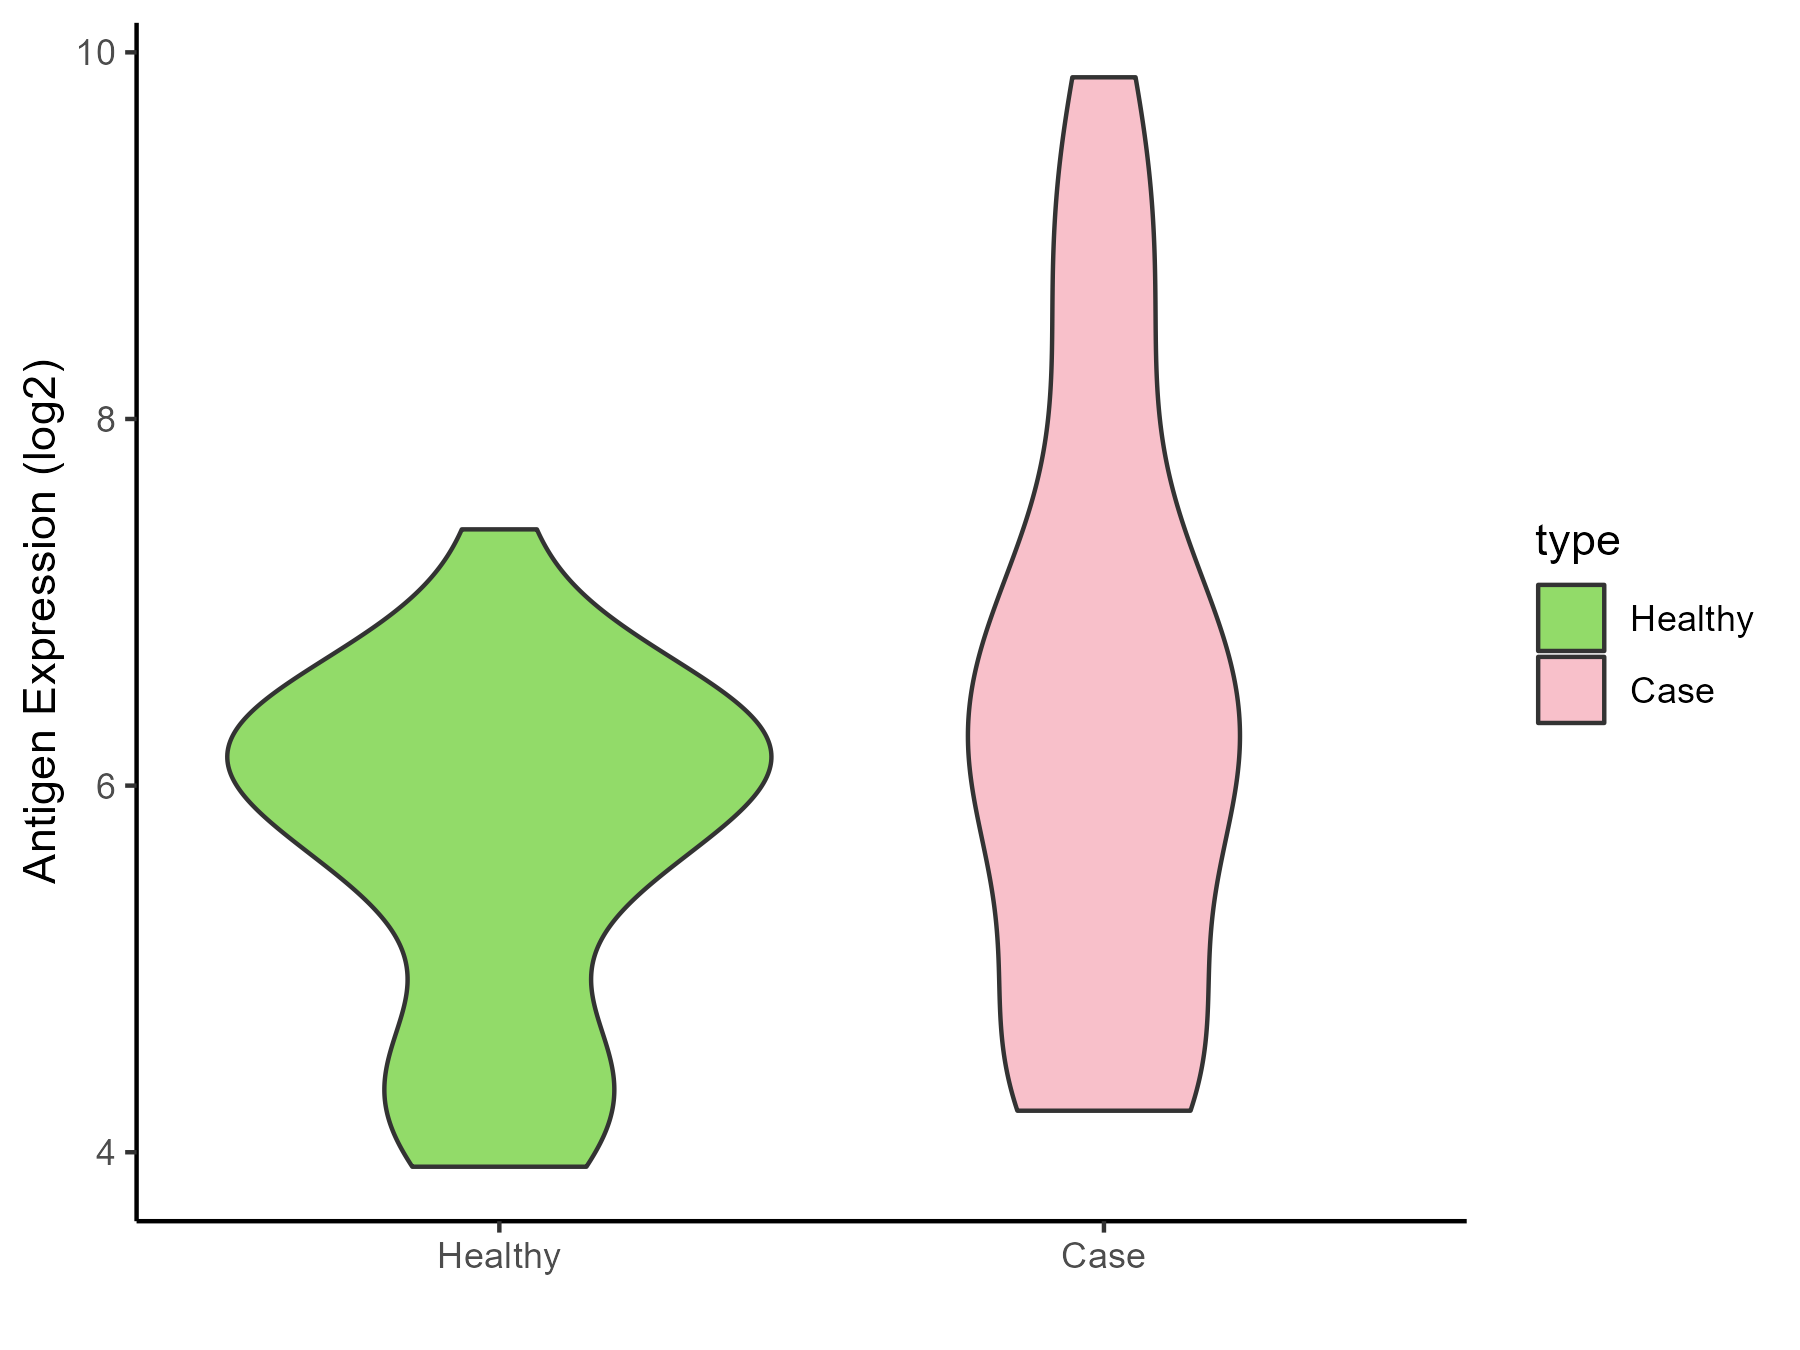
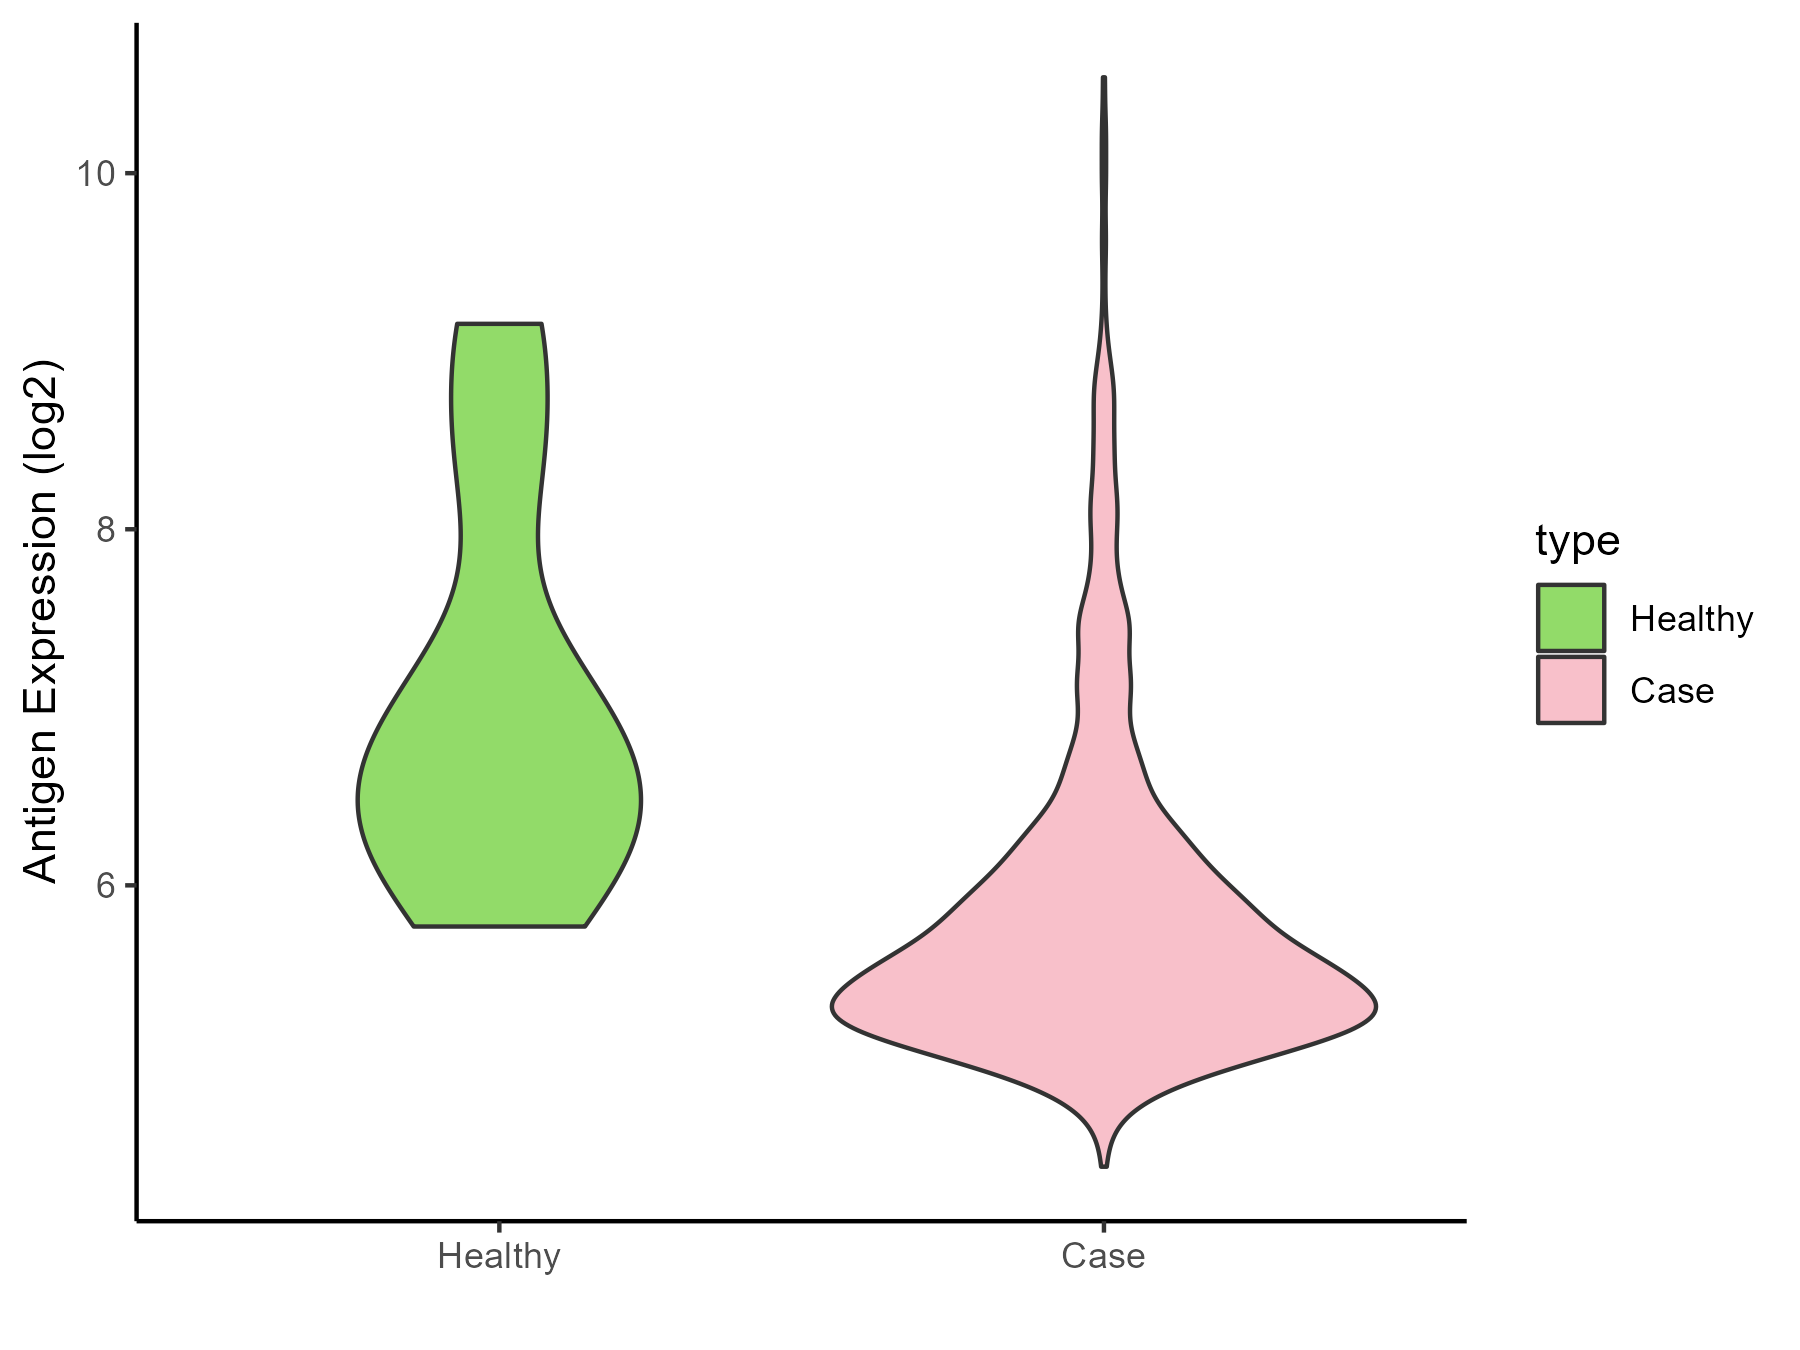
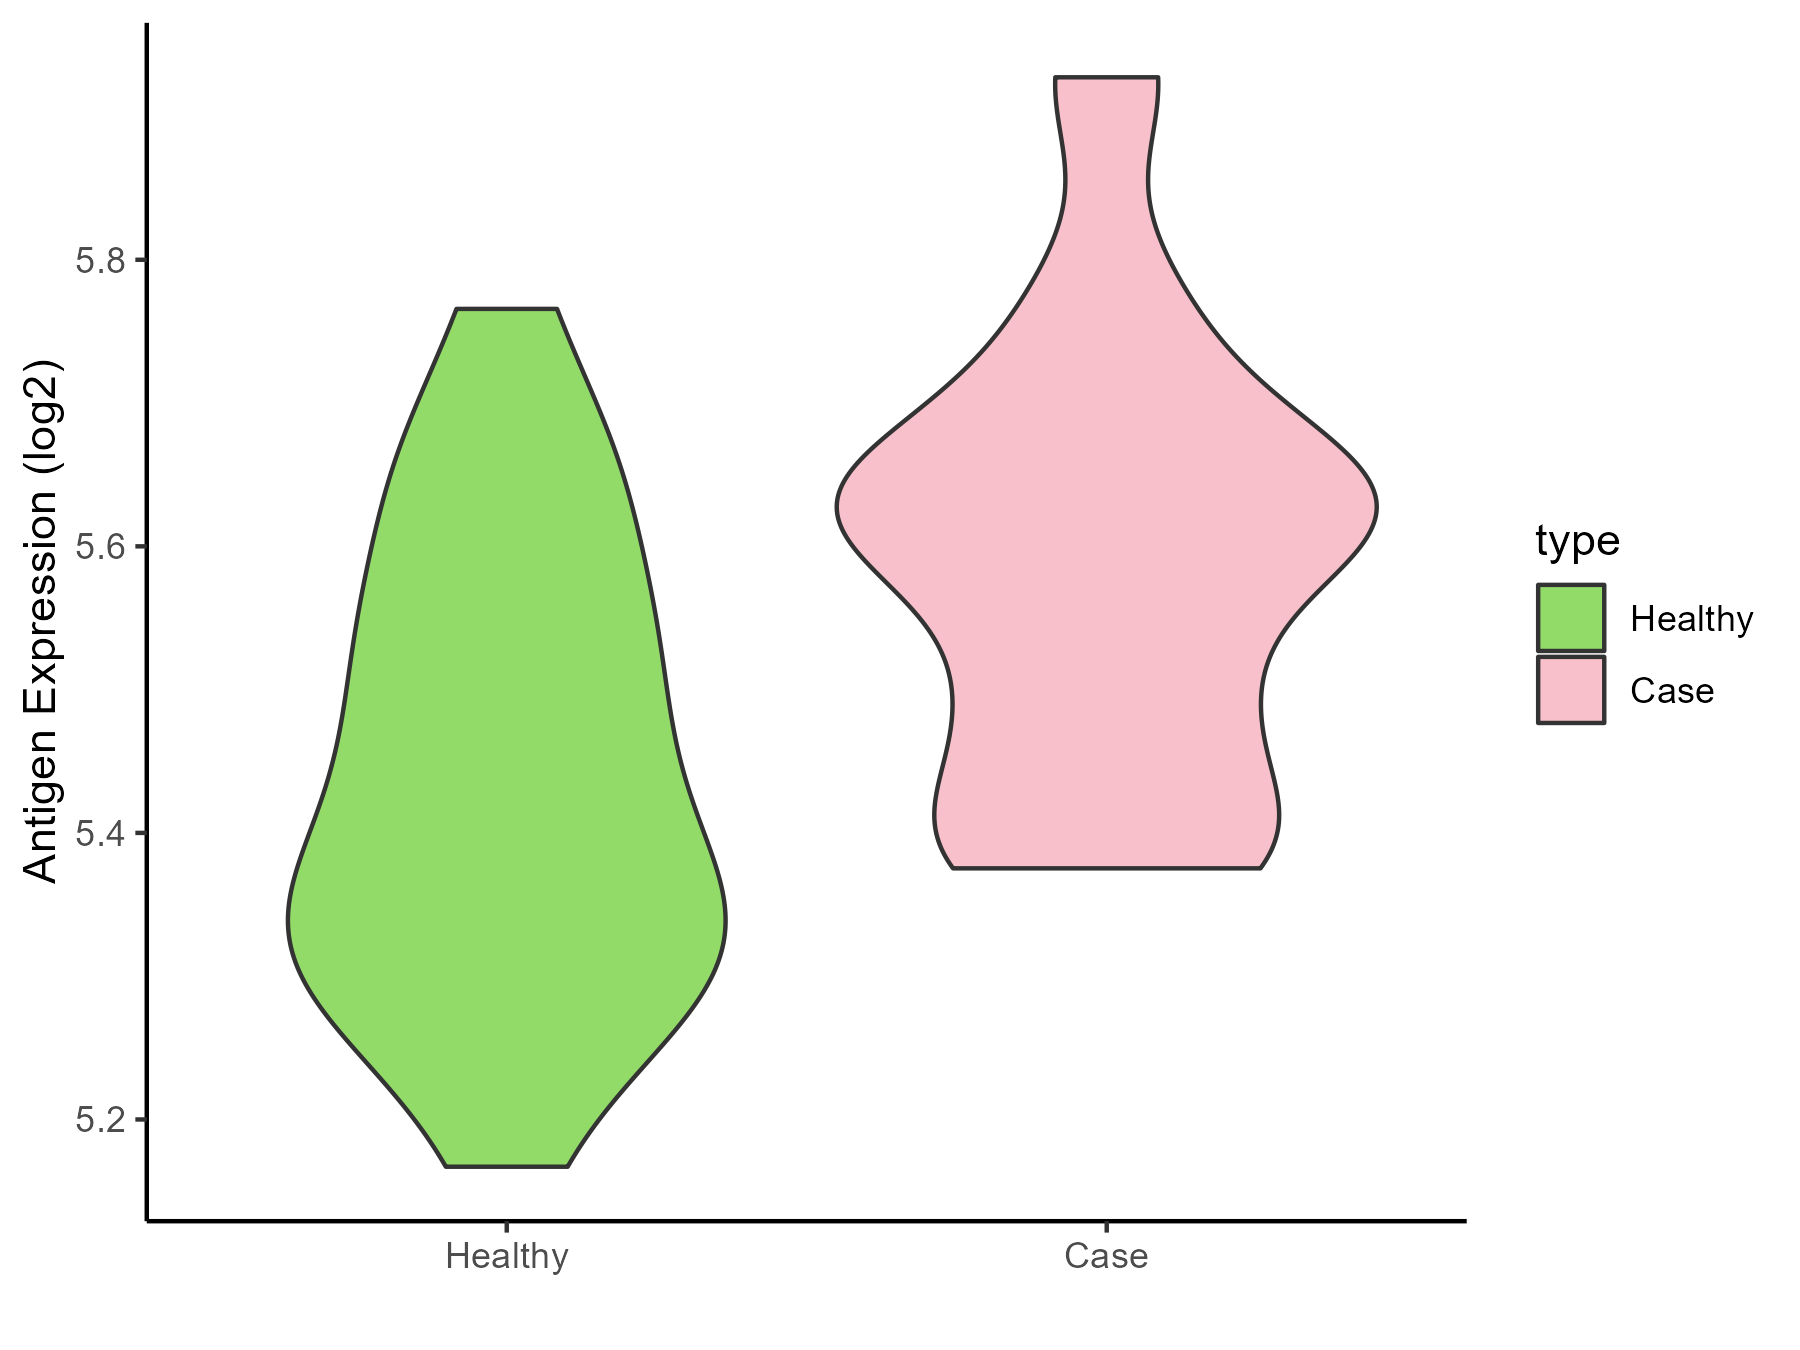
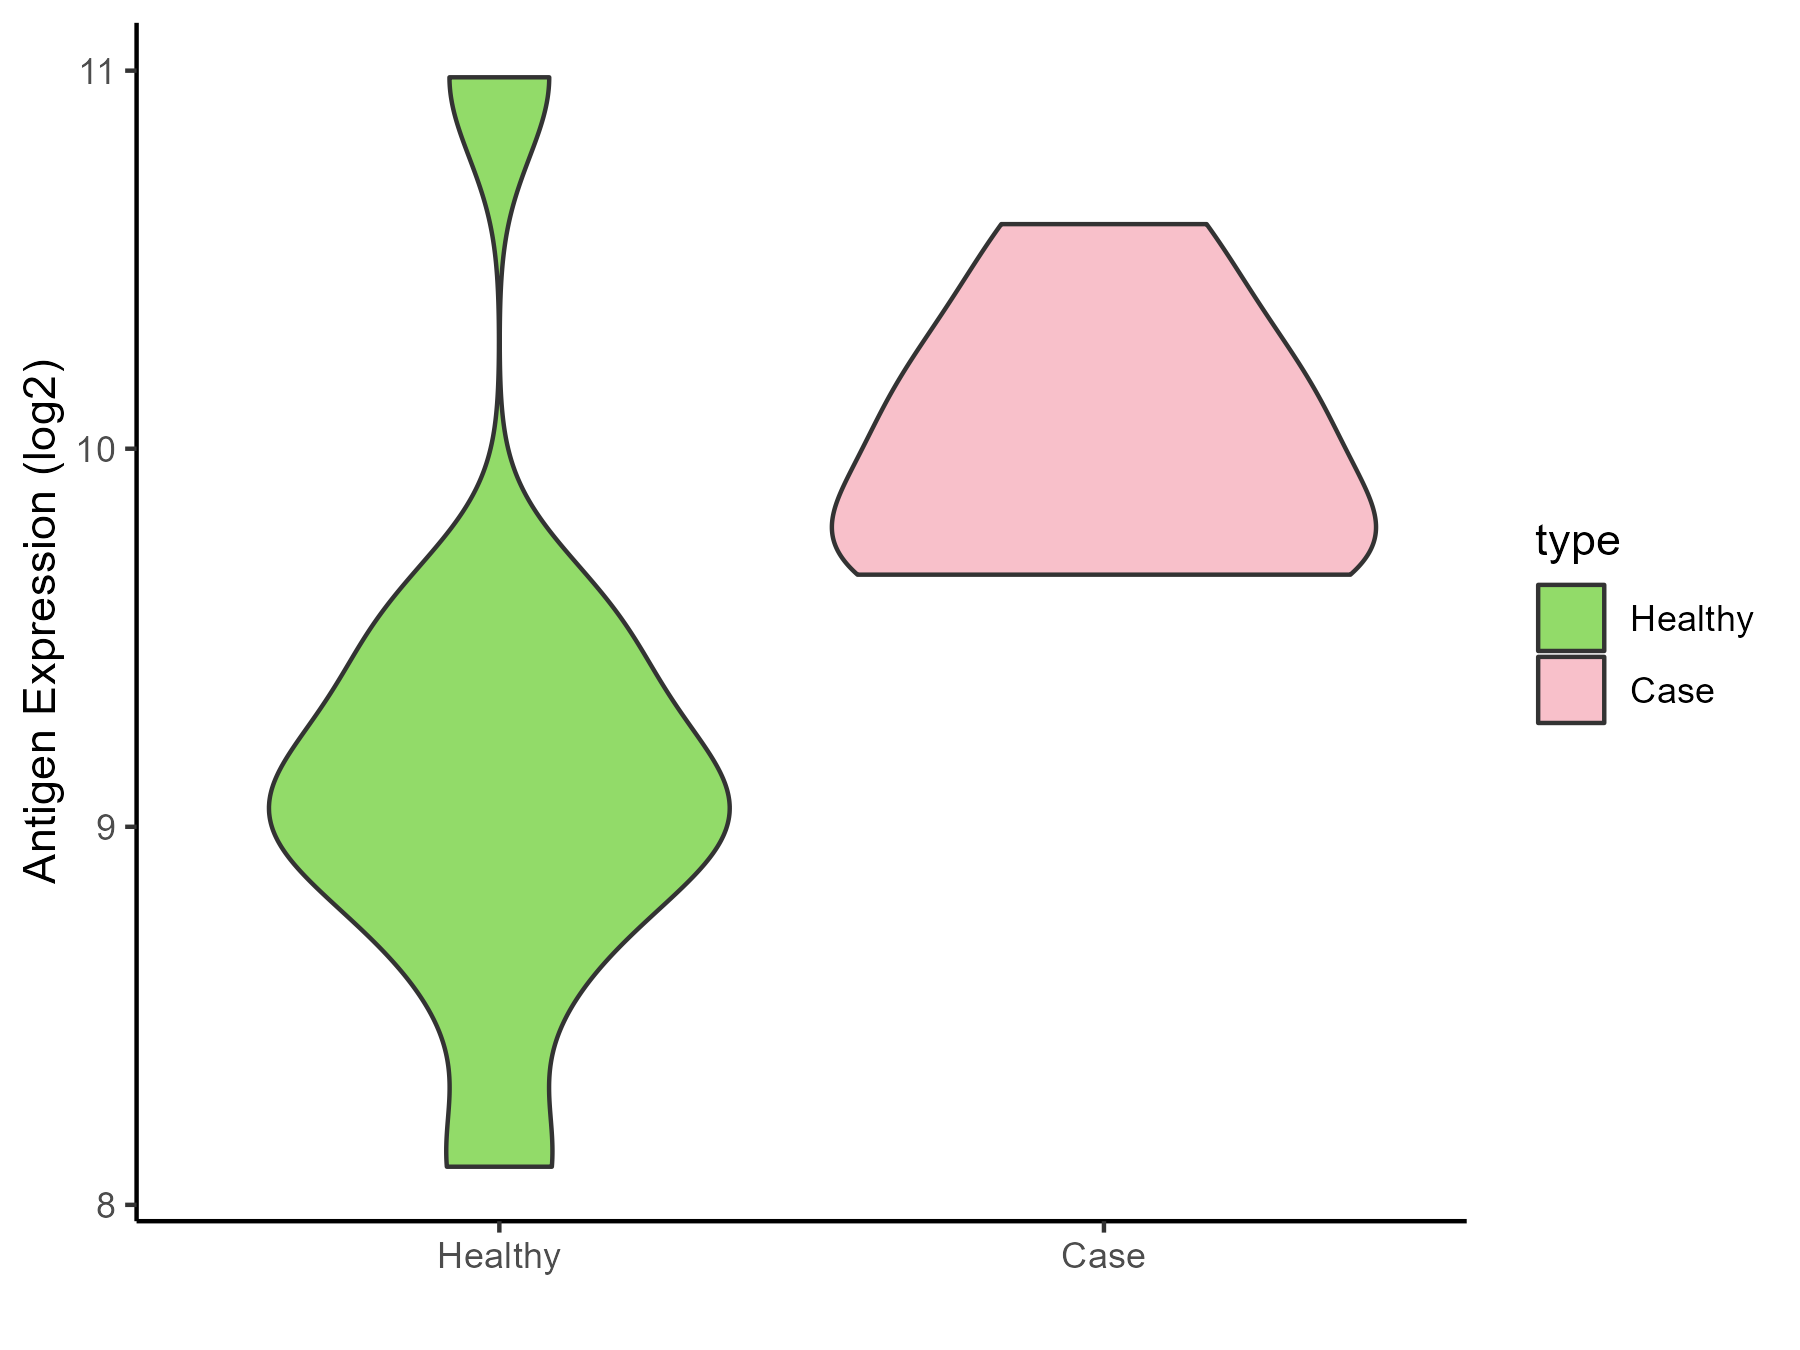
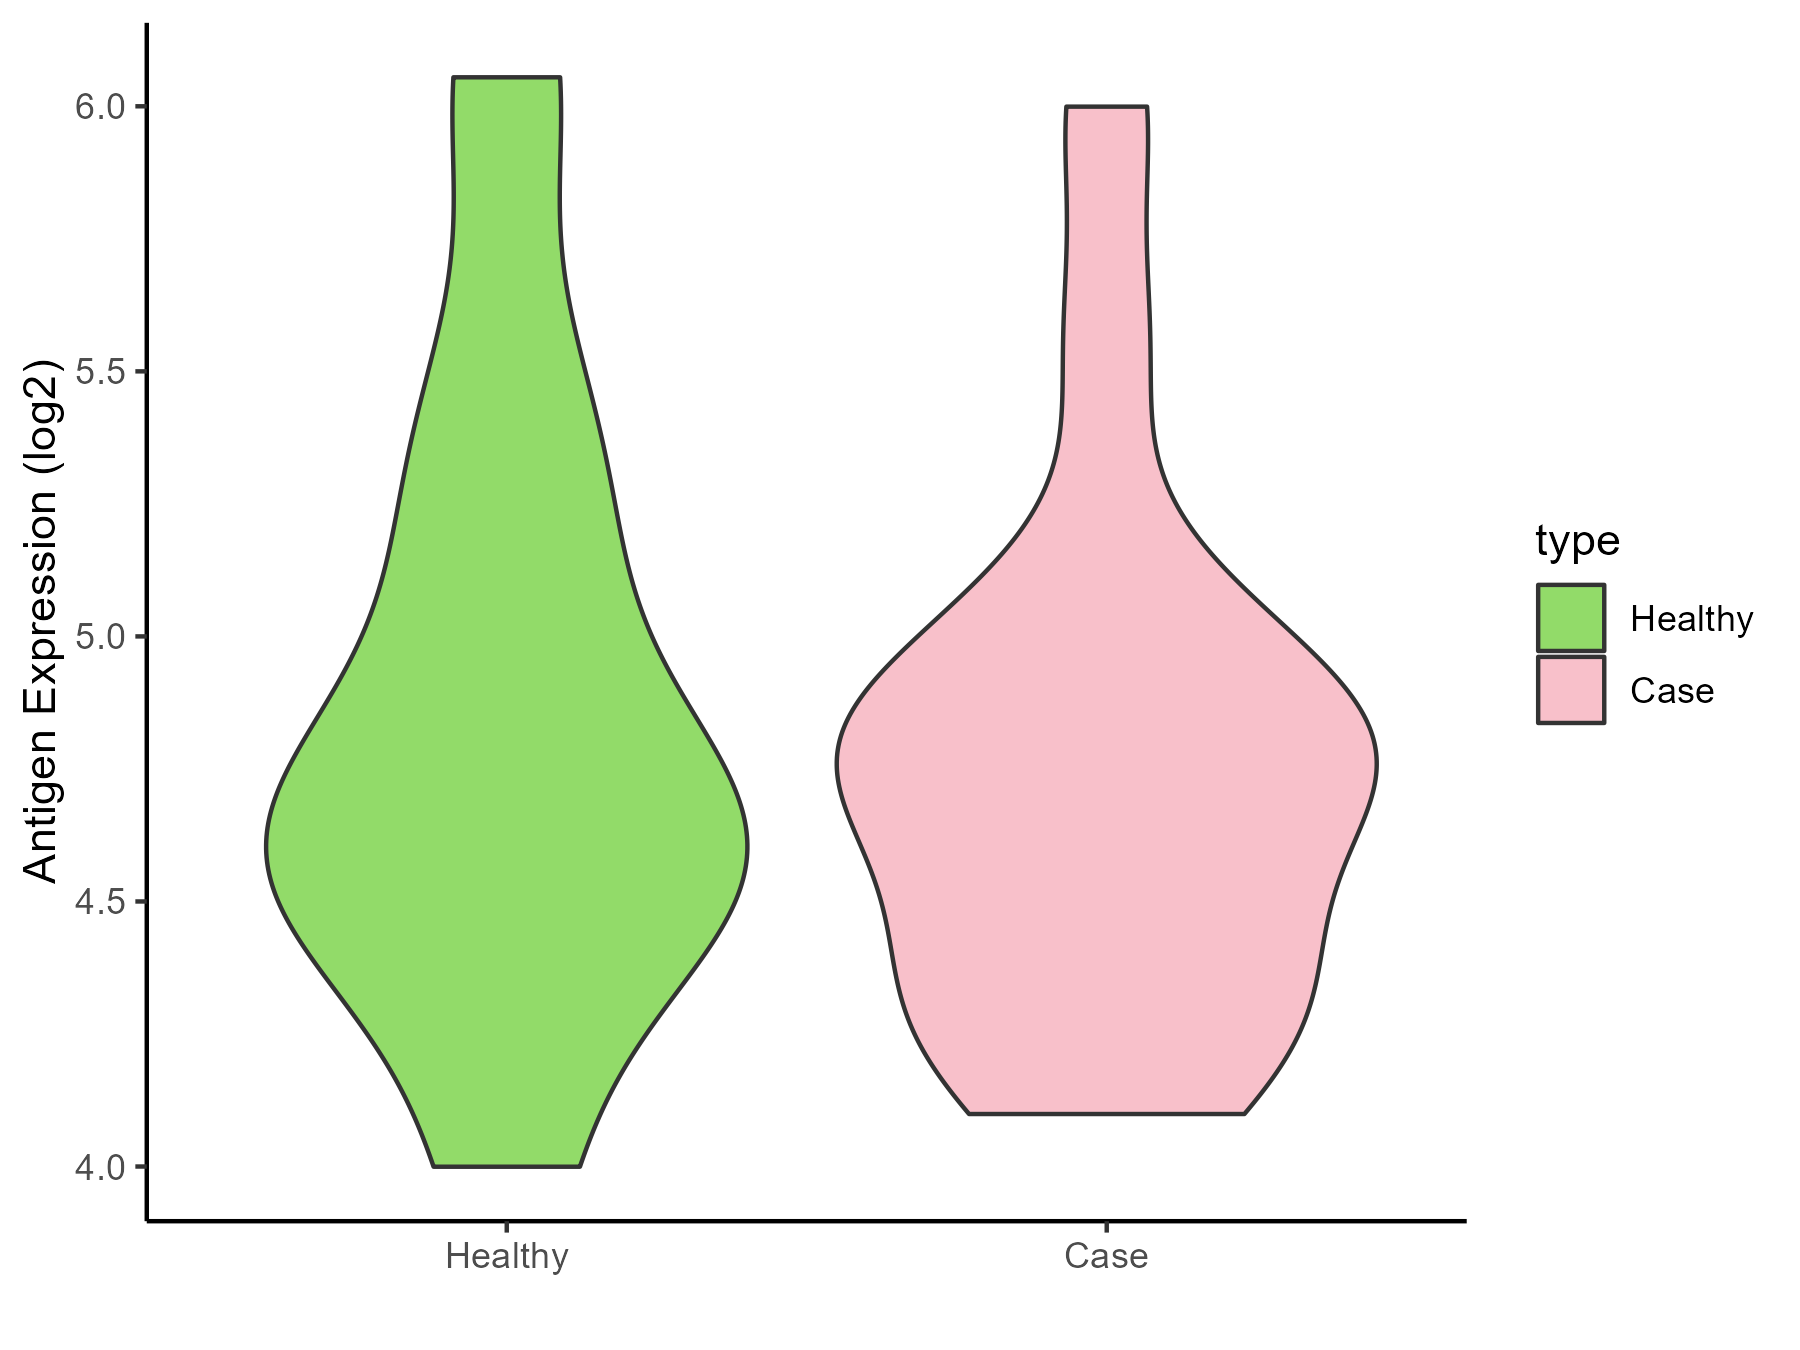
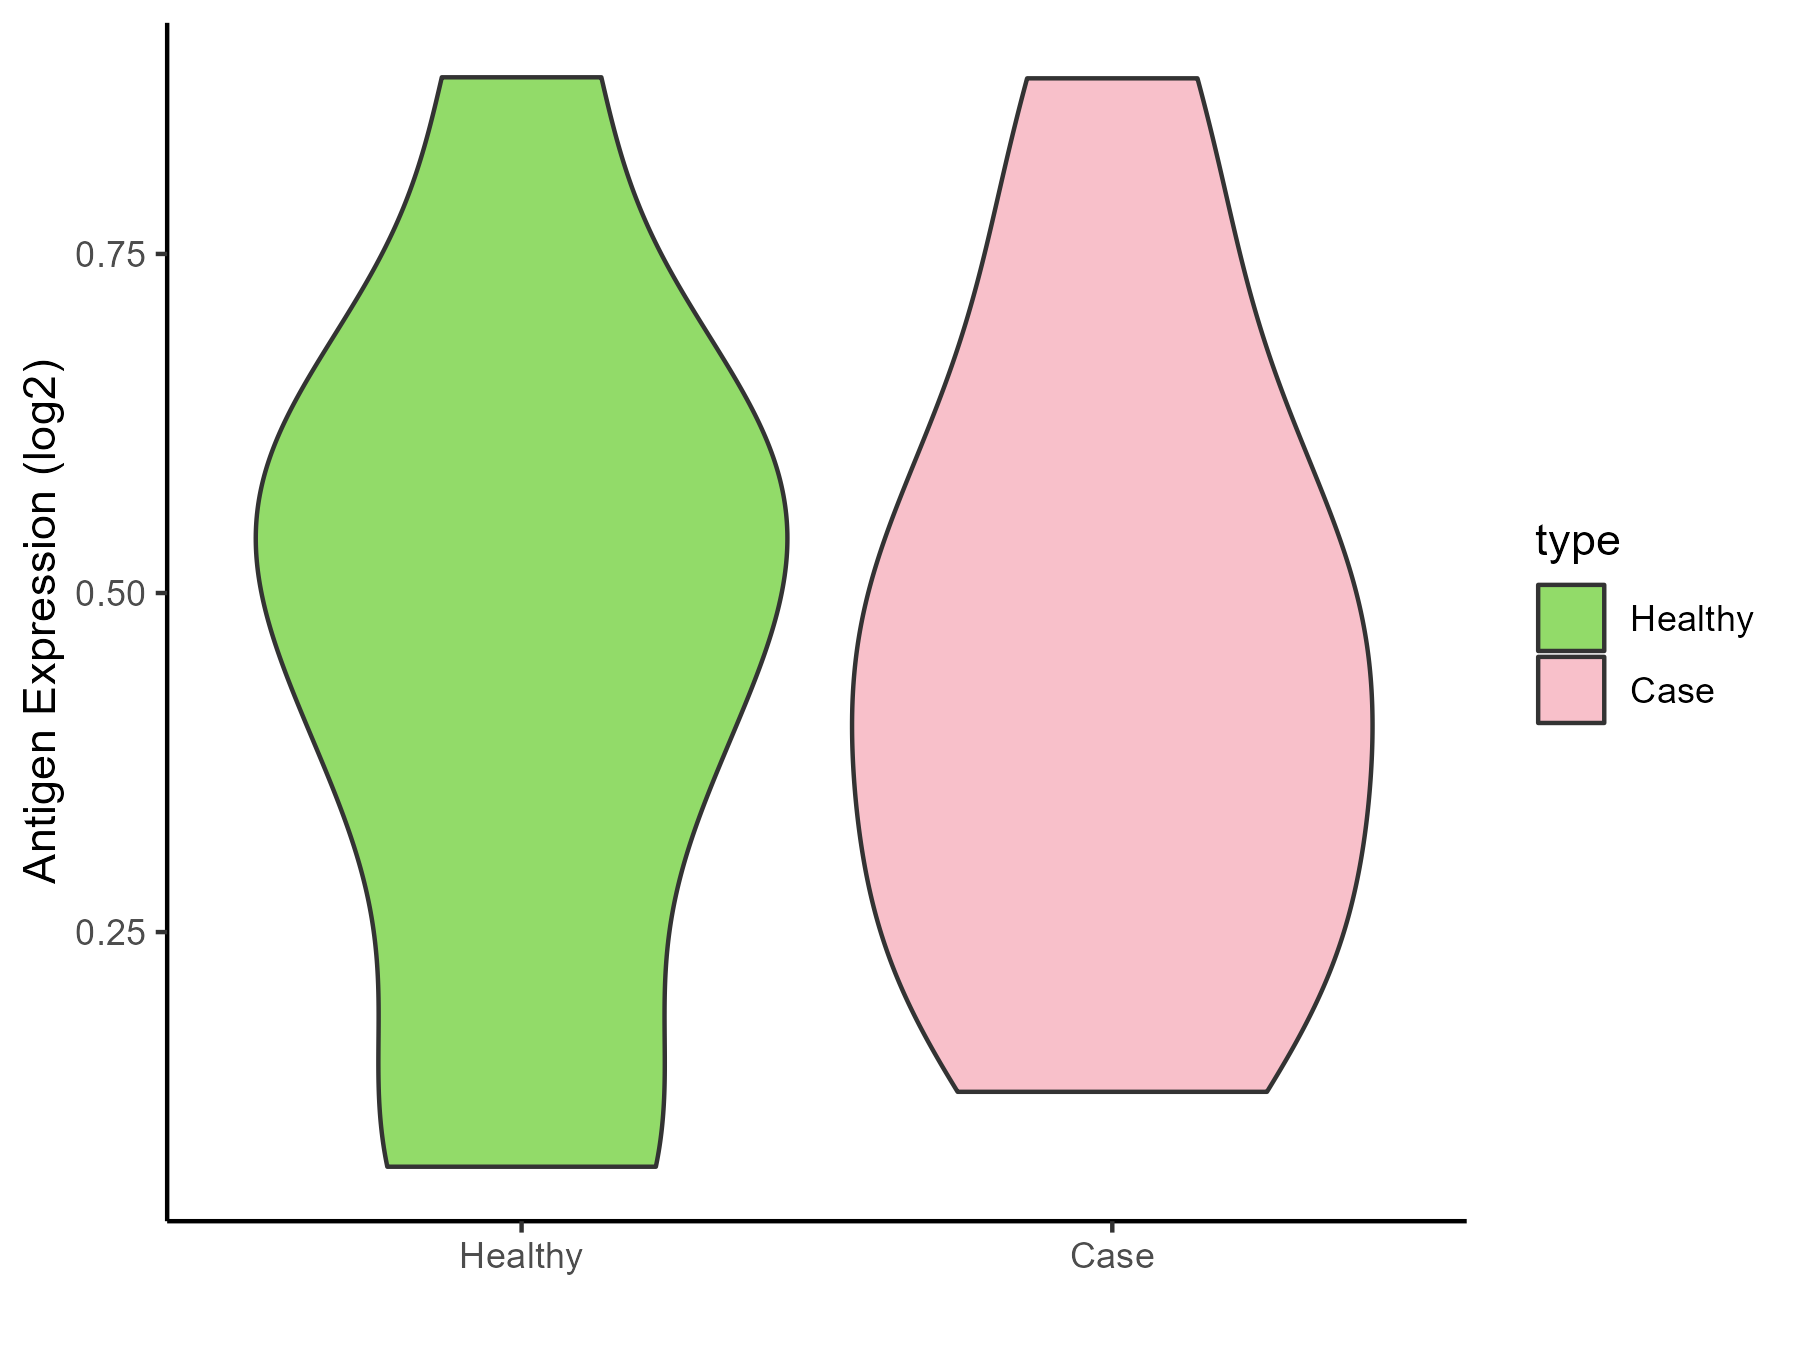
| The Studied Tissue | White matter | |
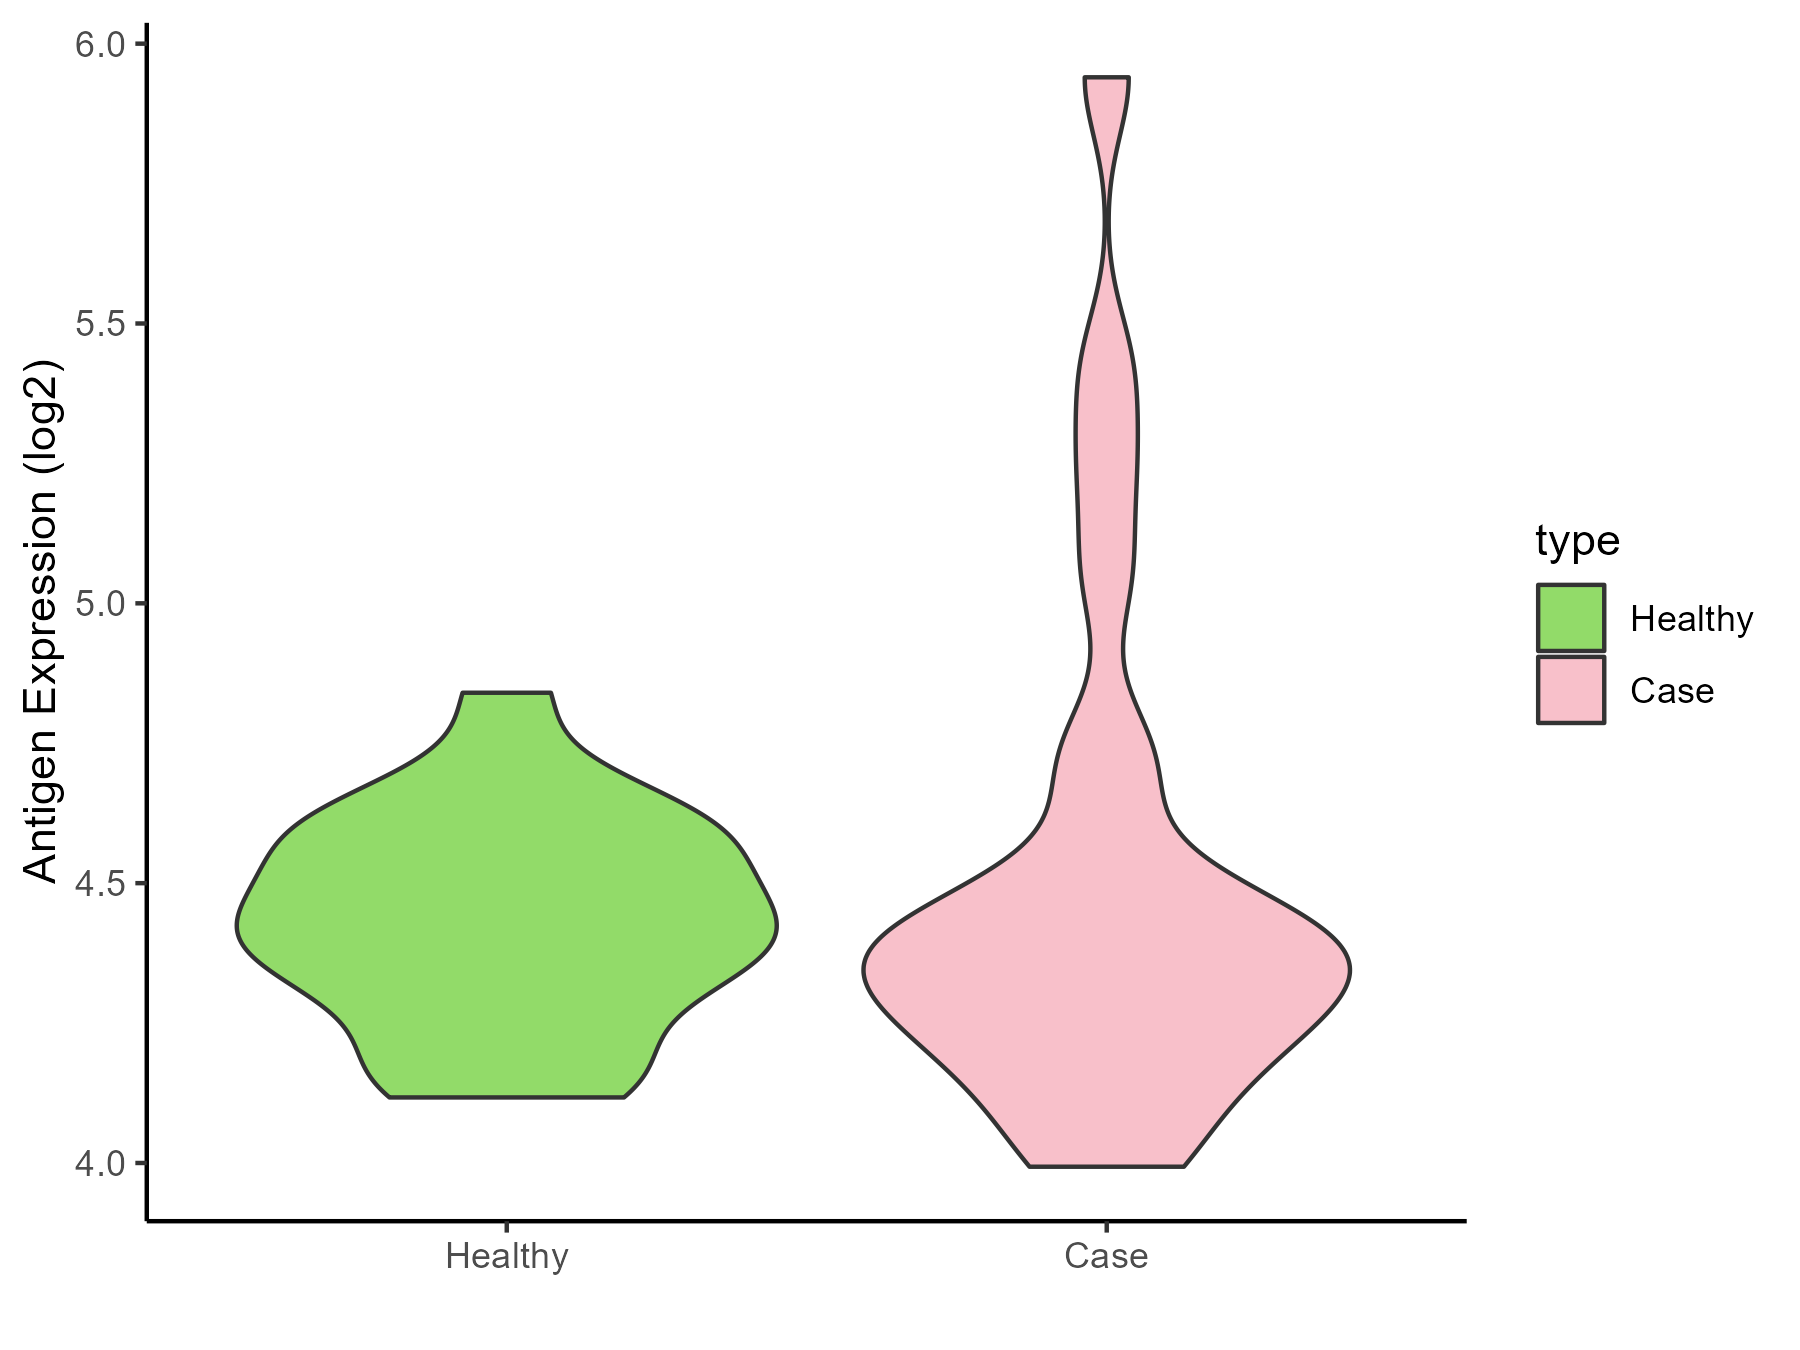
| The Specific Disease | Glioma | |
| The Expression Level of Disease Section Compare with the Healthy Individual Tissue | p-value: 0.678138038; Fold-change: -0.154705005; Z-score: -0.101665118 | |
| Disease-specific Antigen Abundances |
|
Click to View the Clearer Original Diagram |
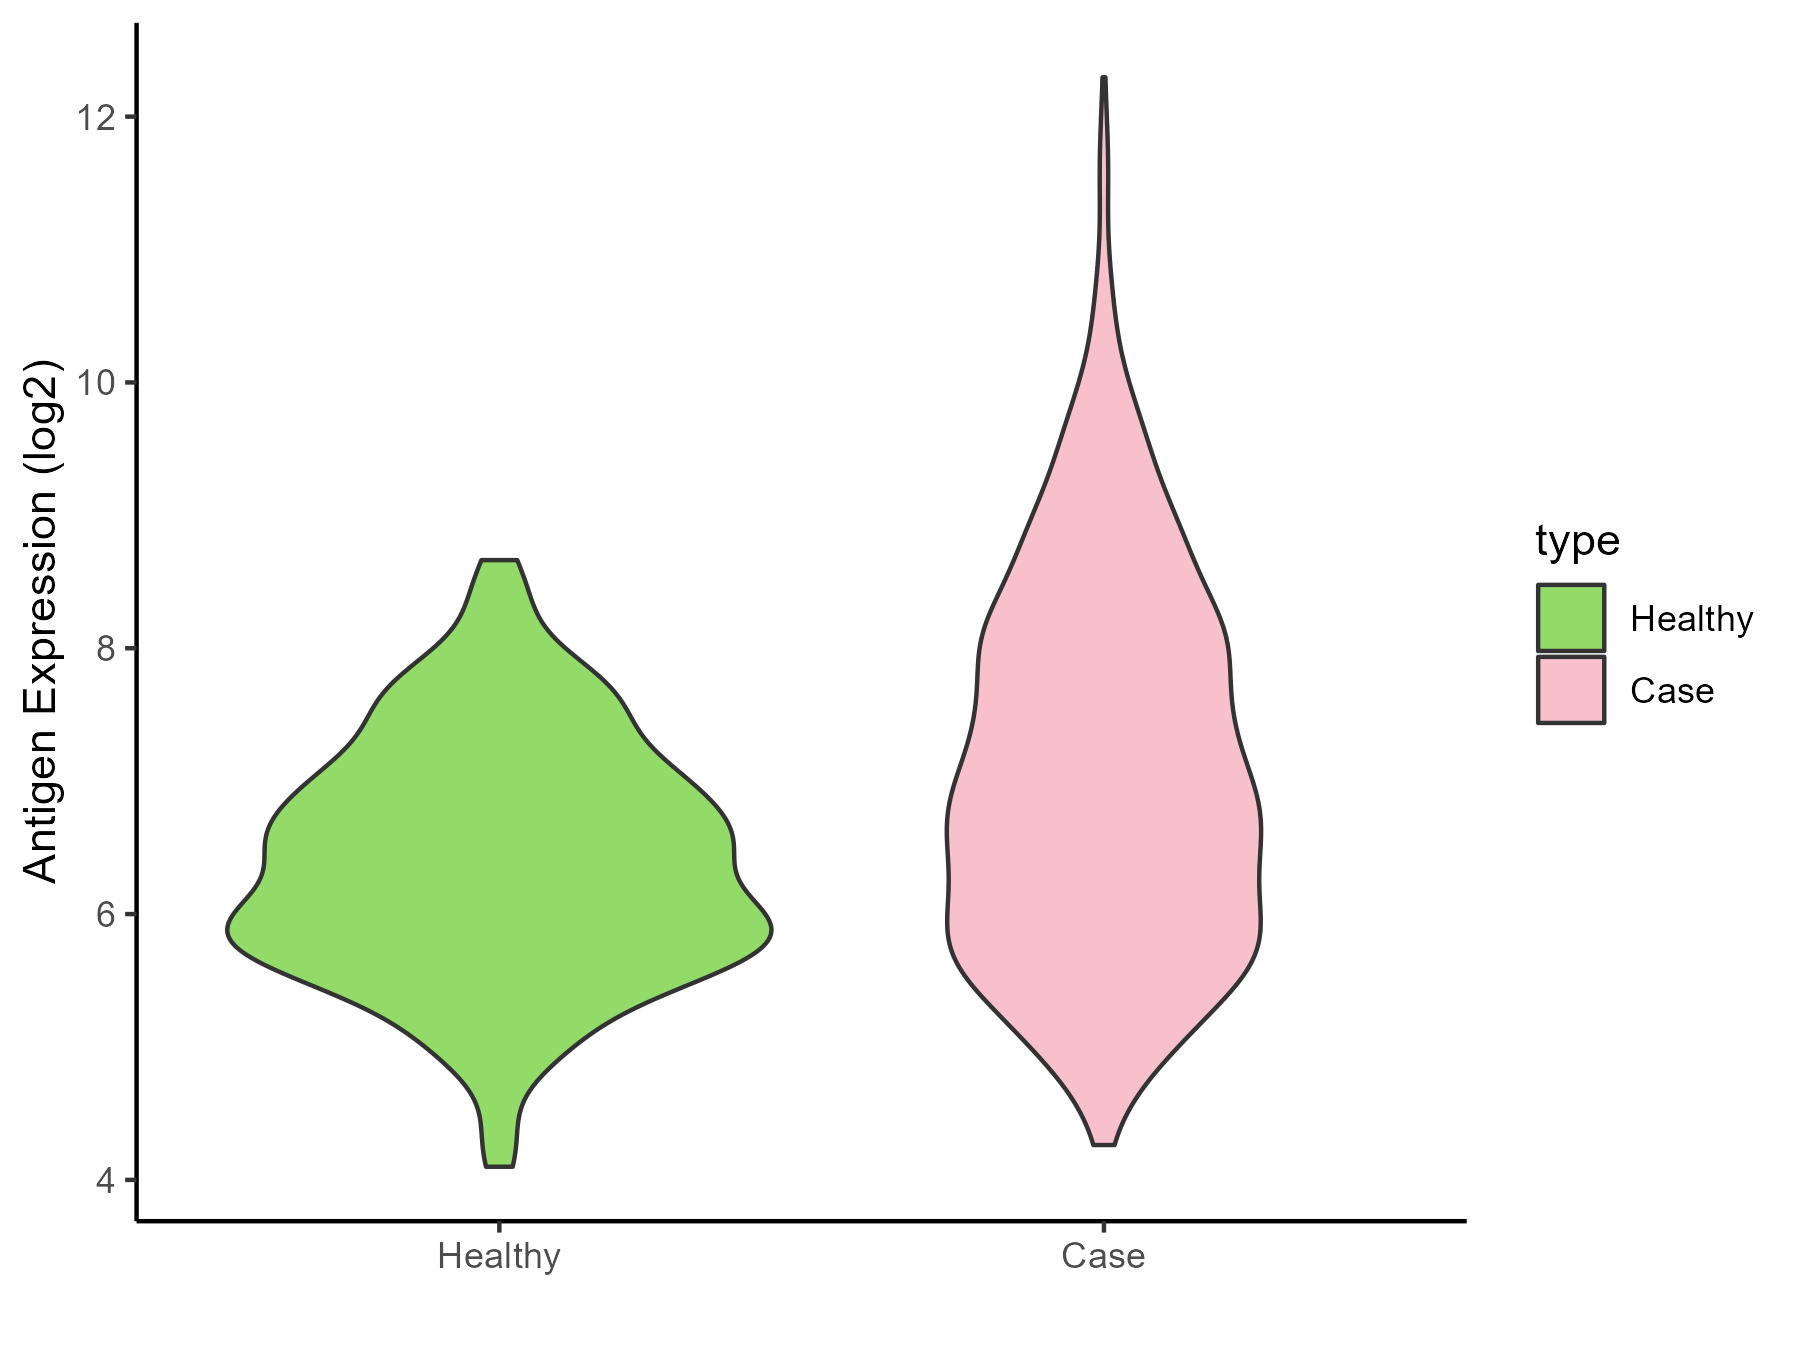
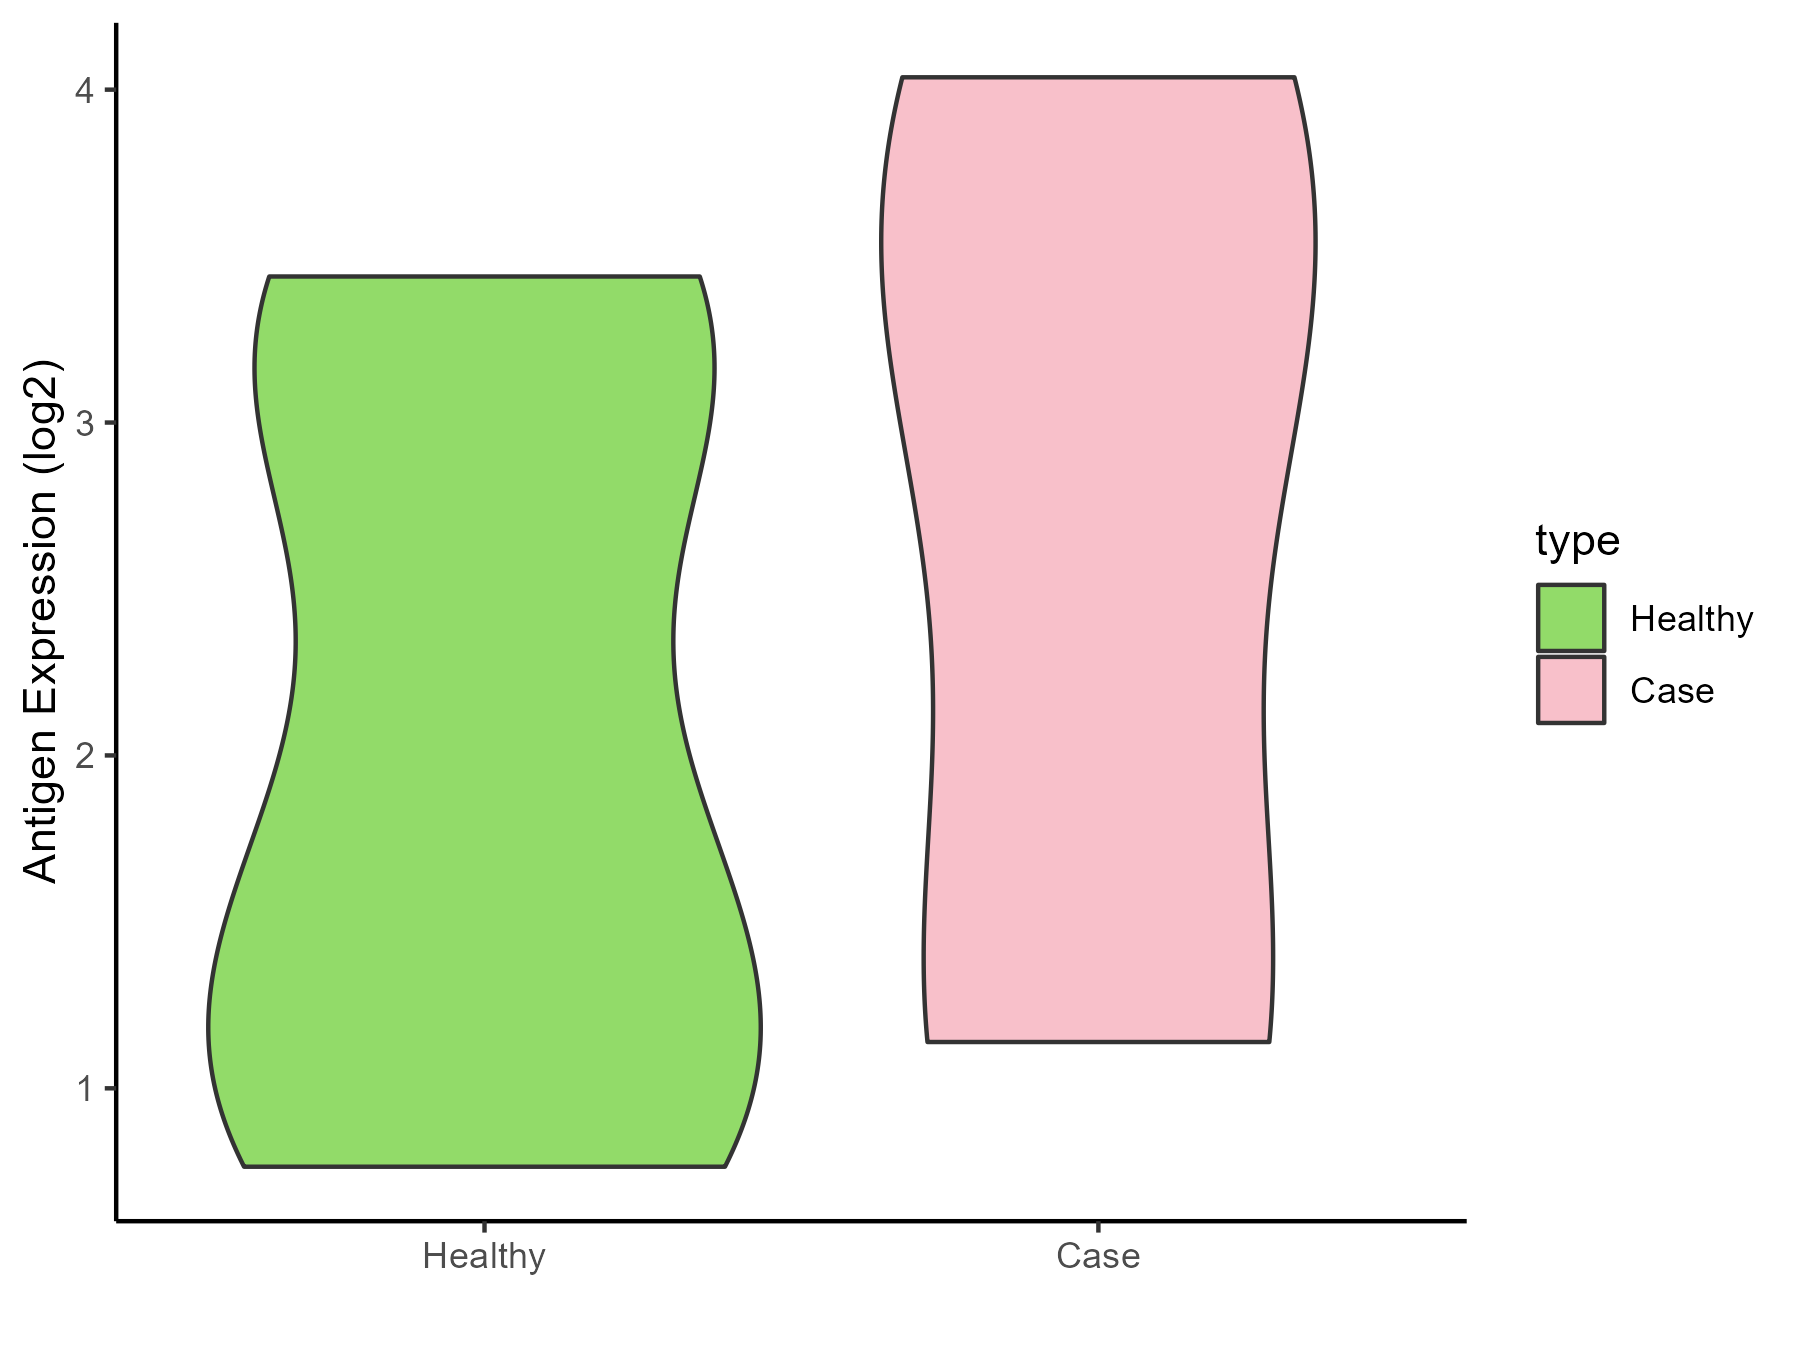
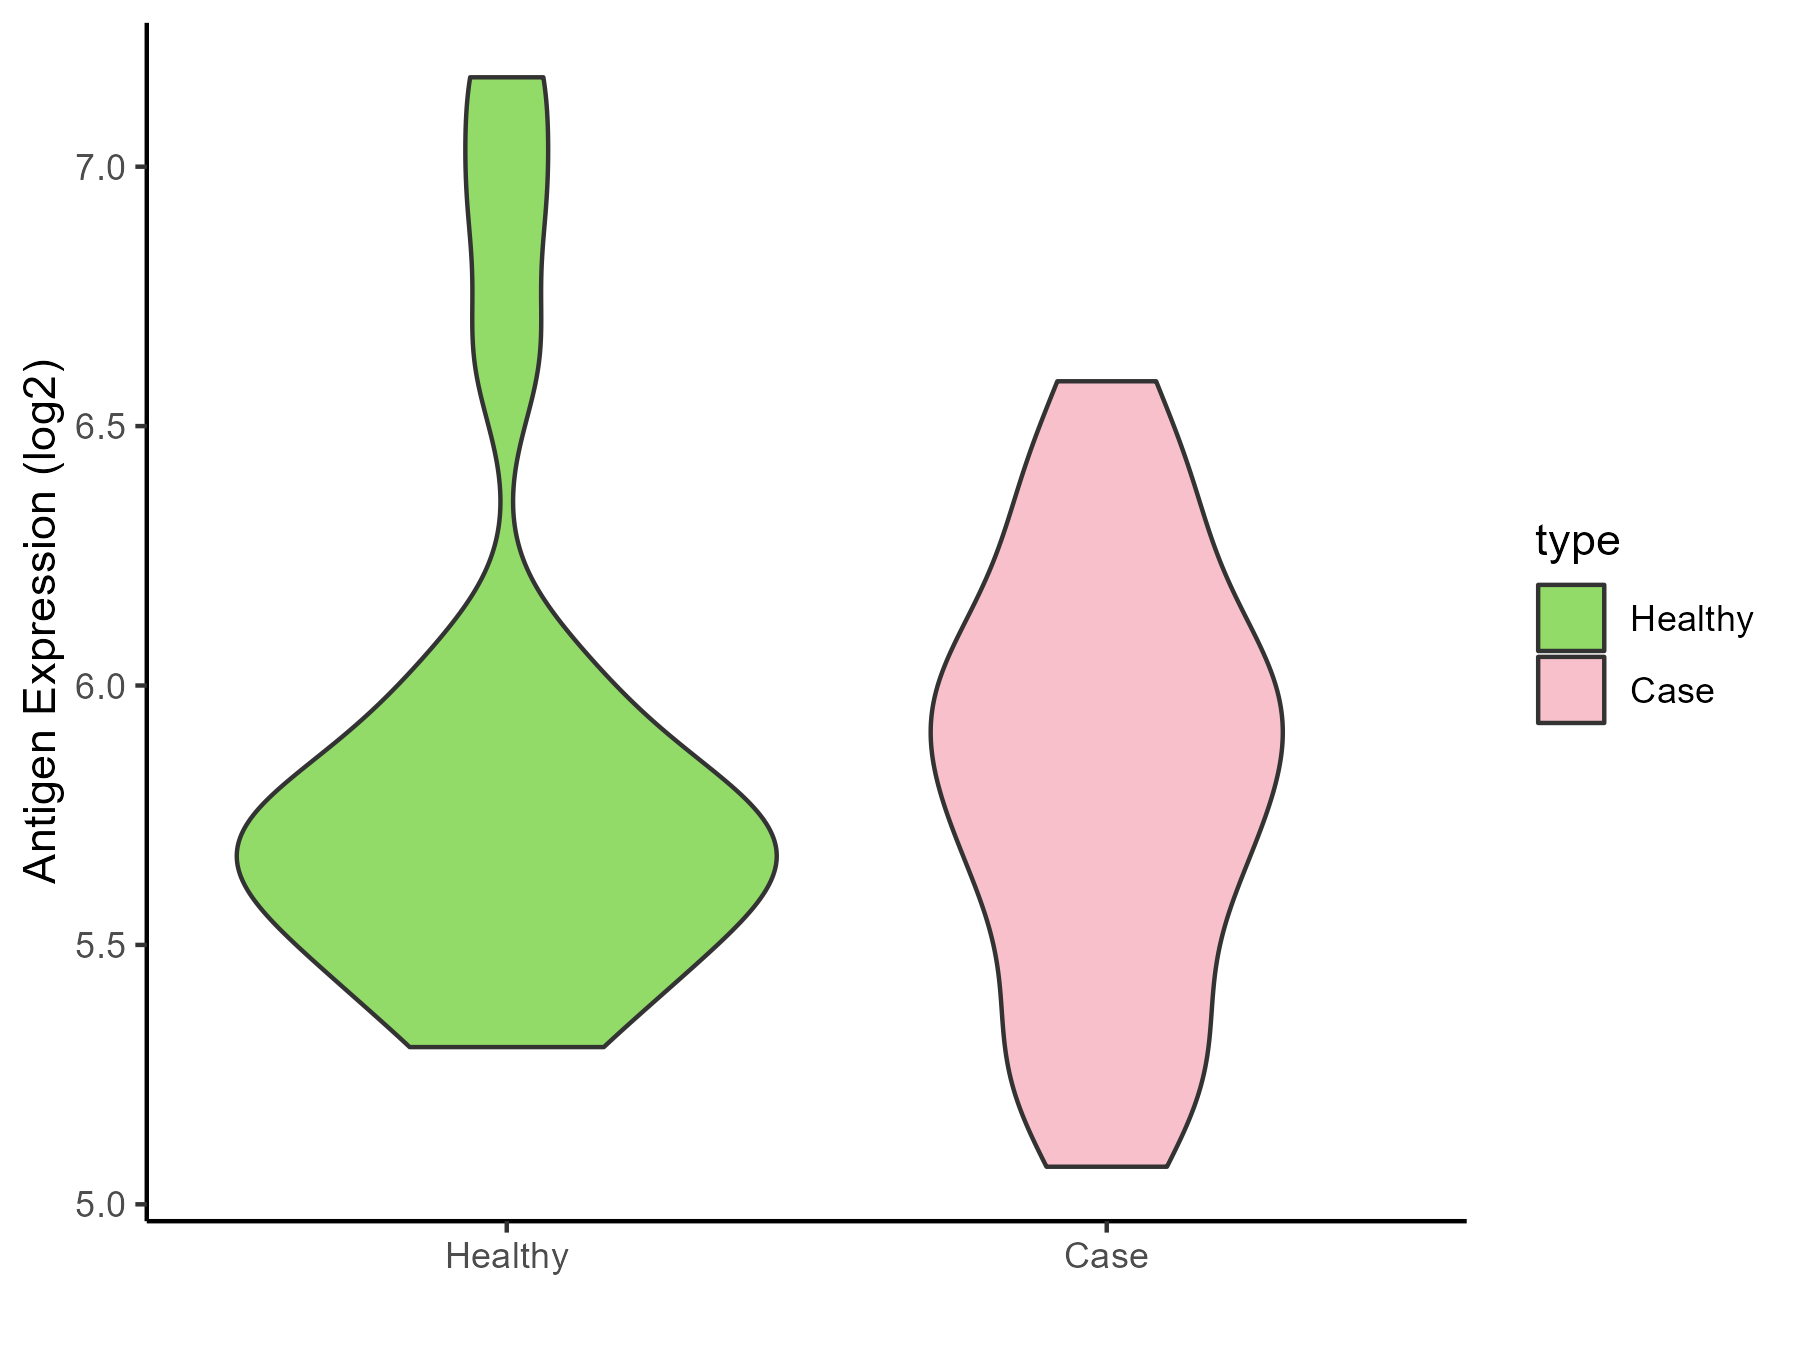
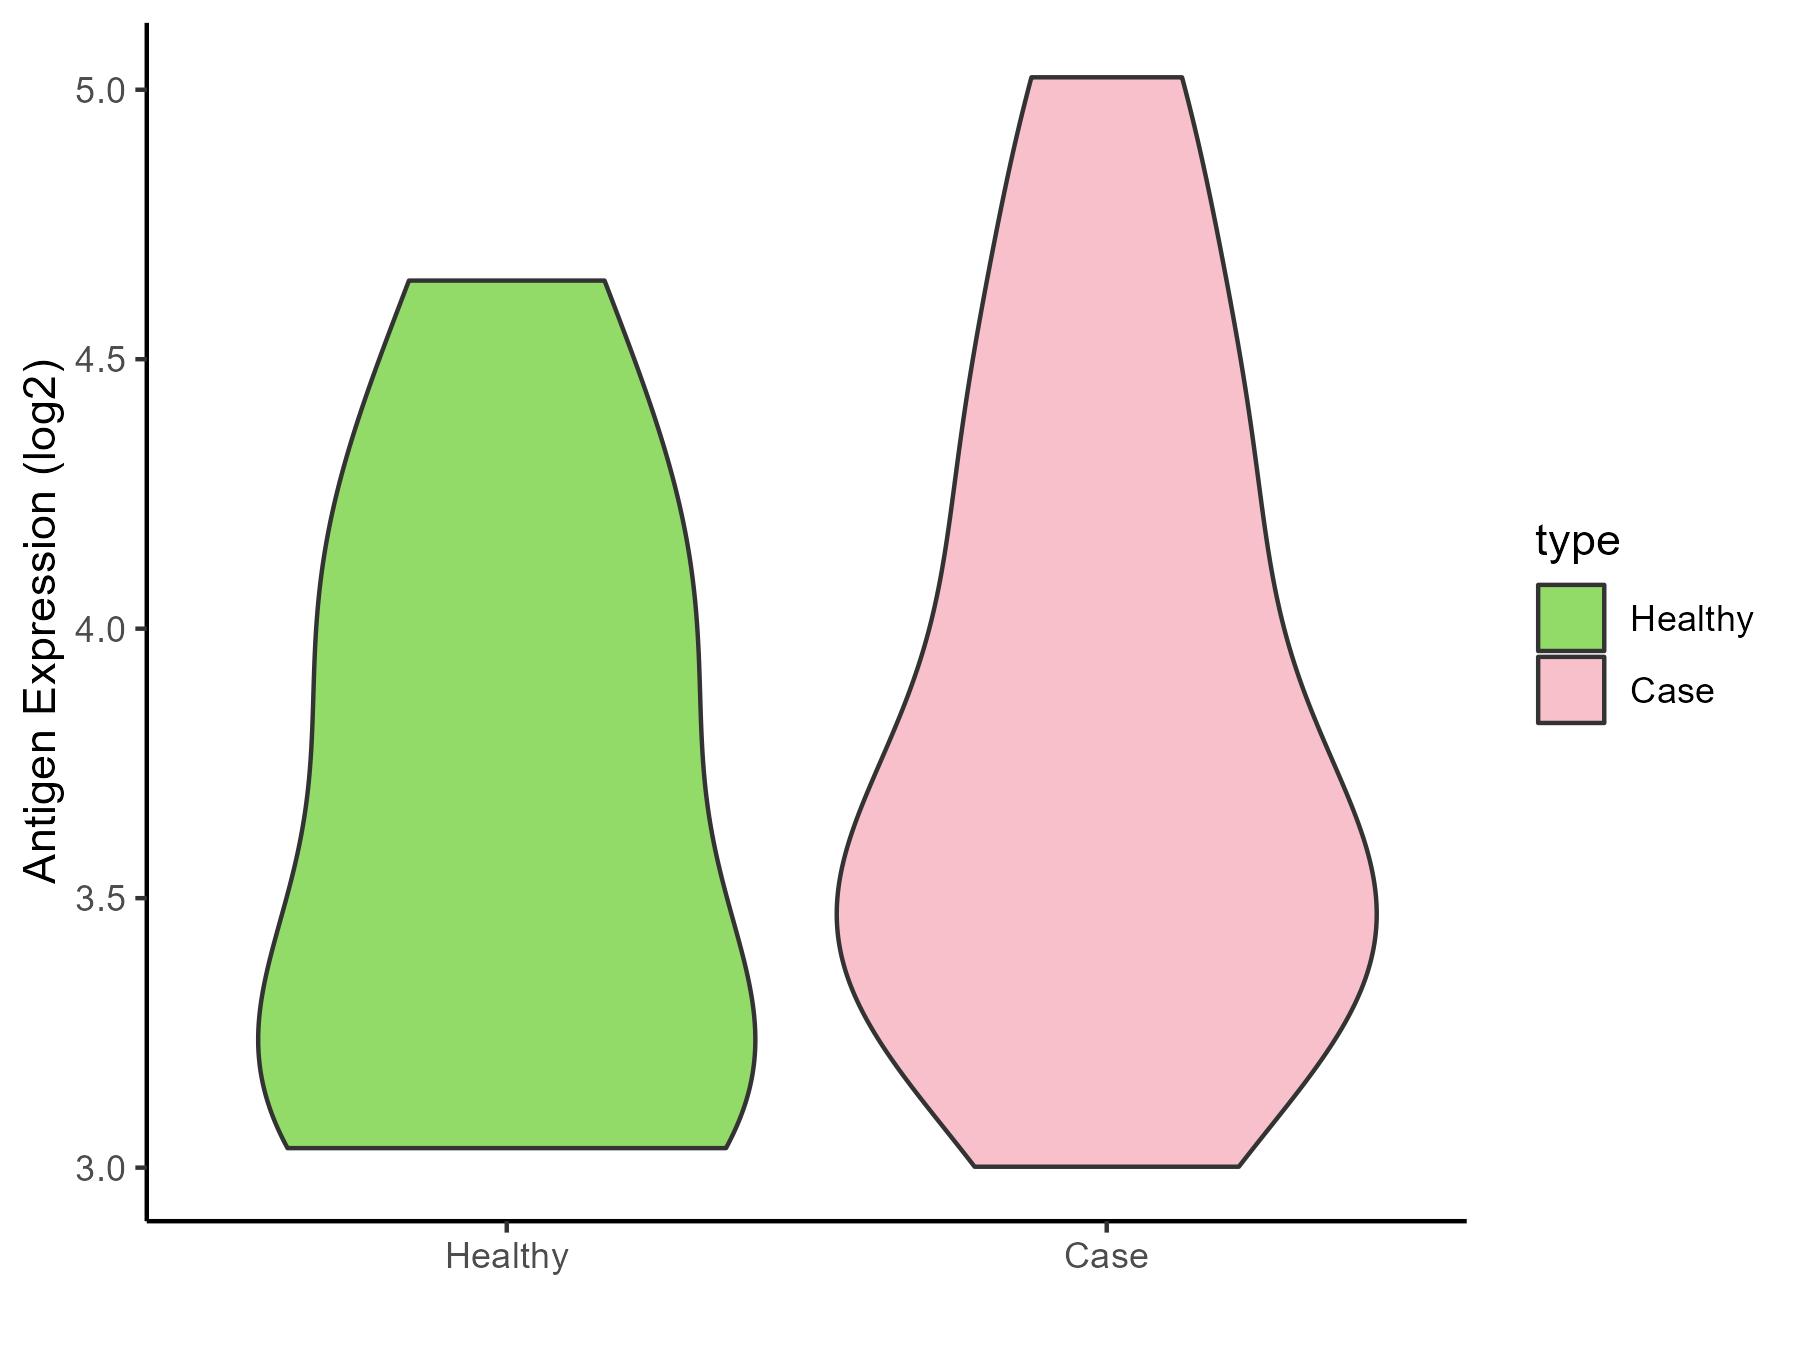
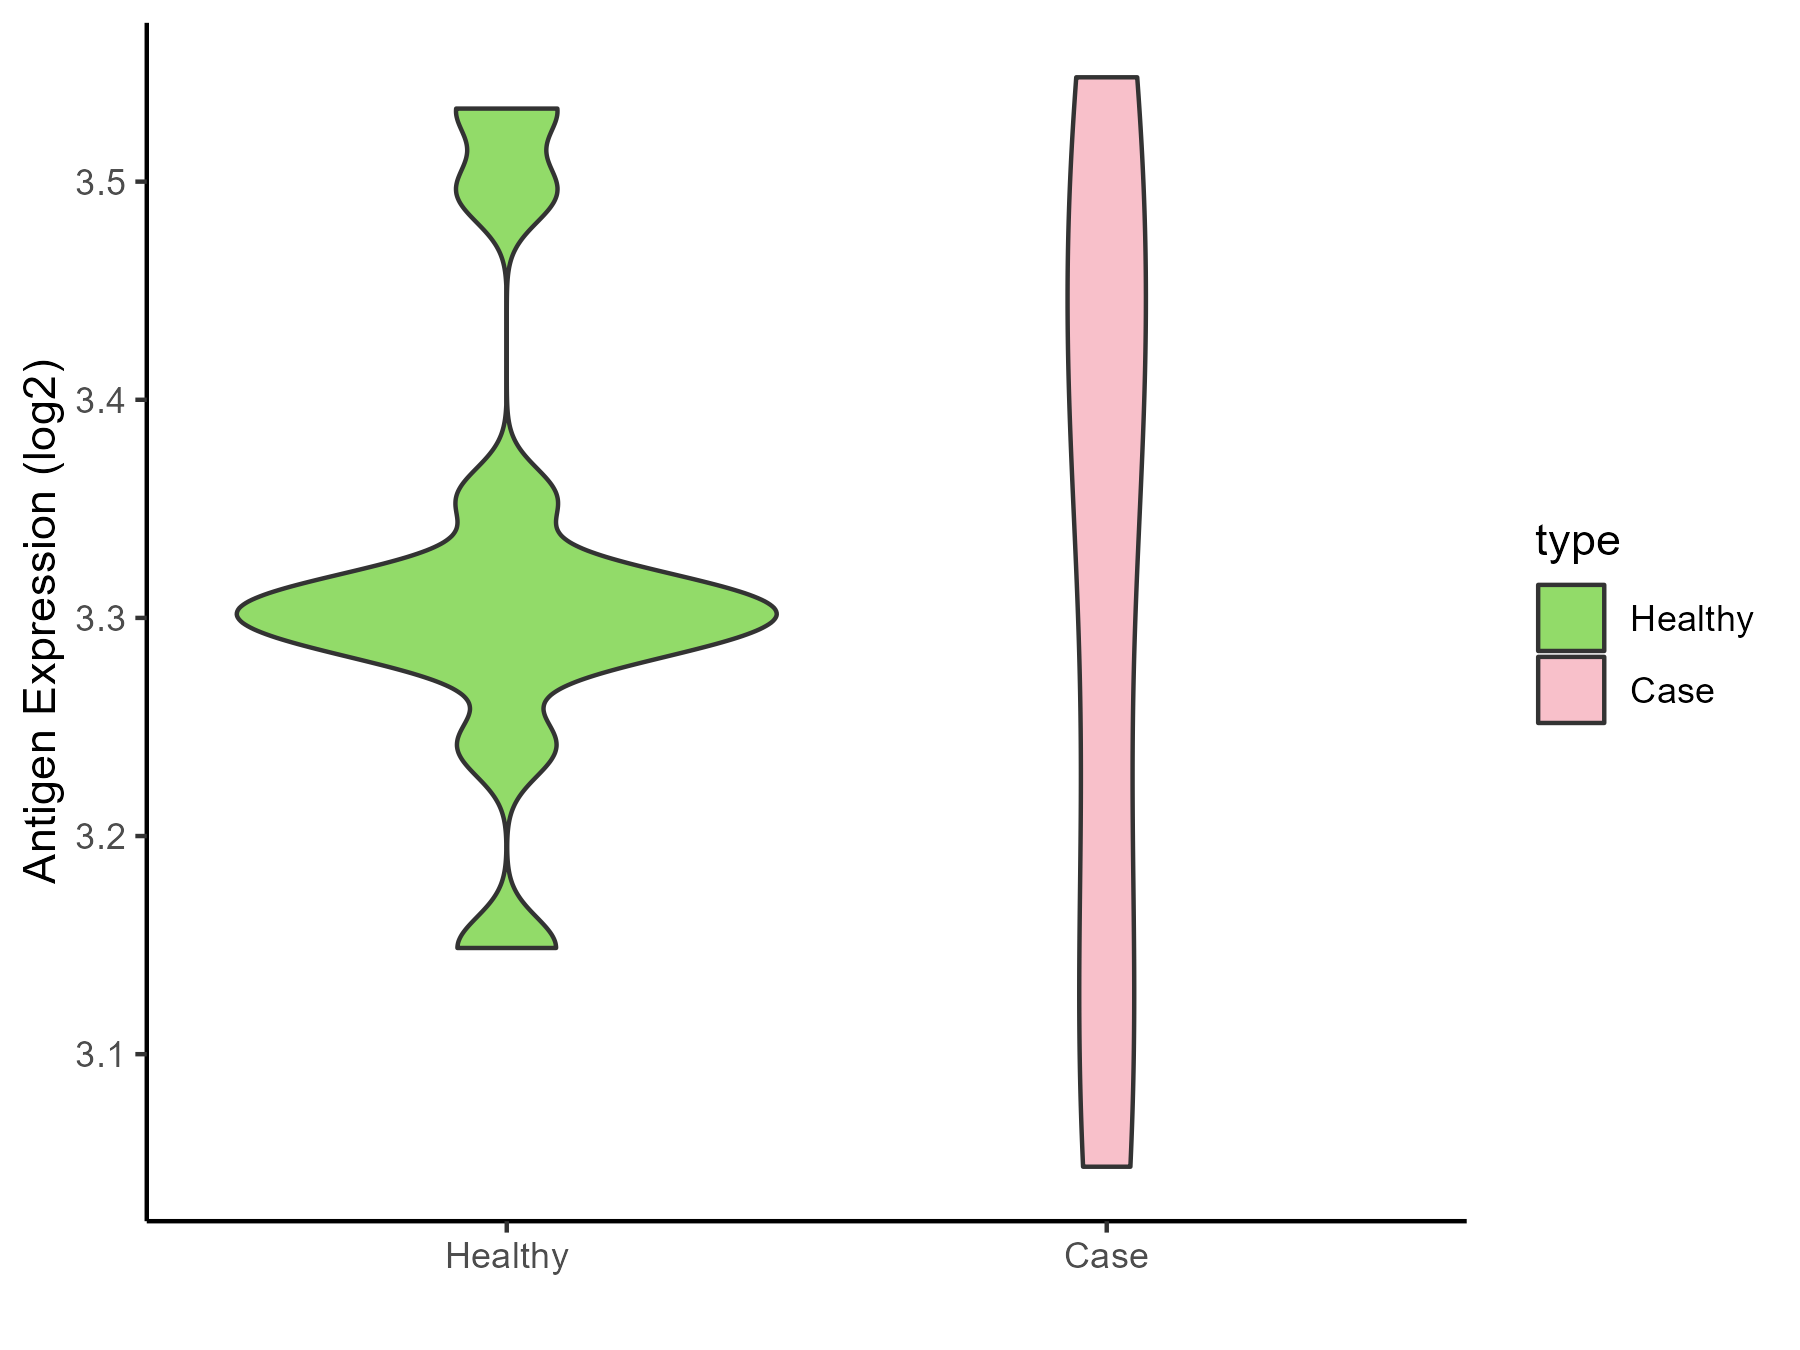
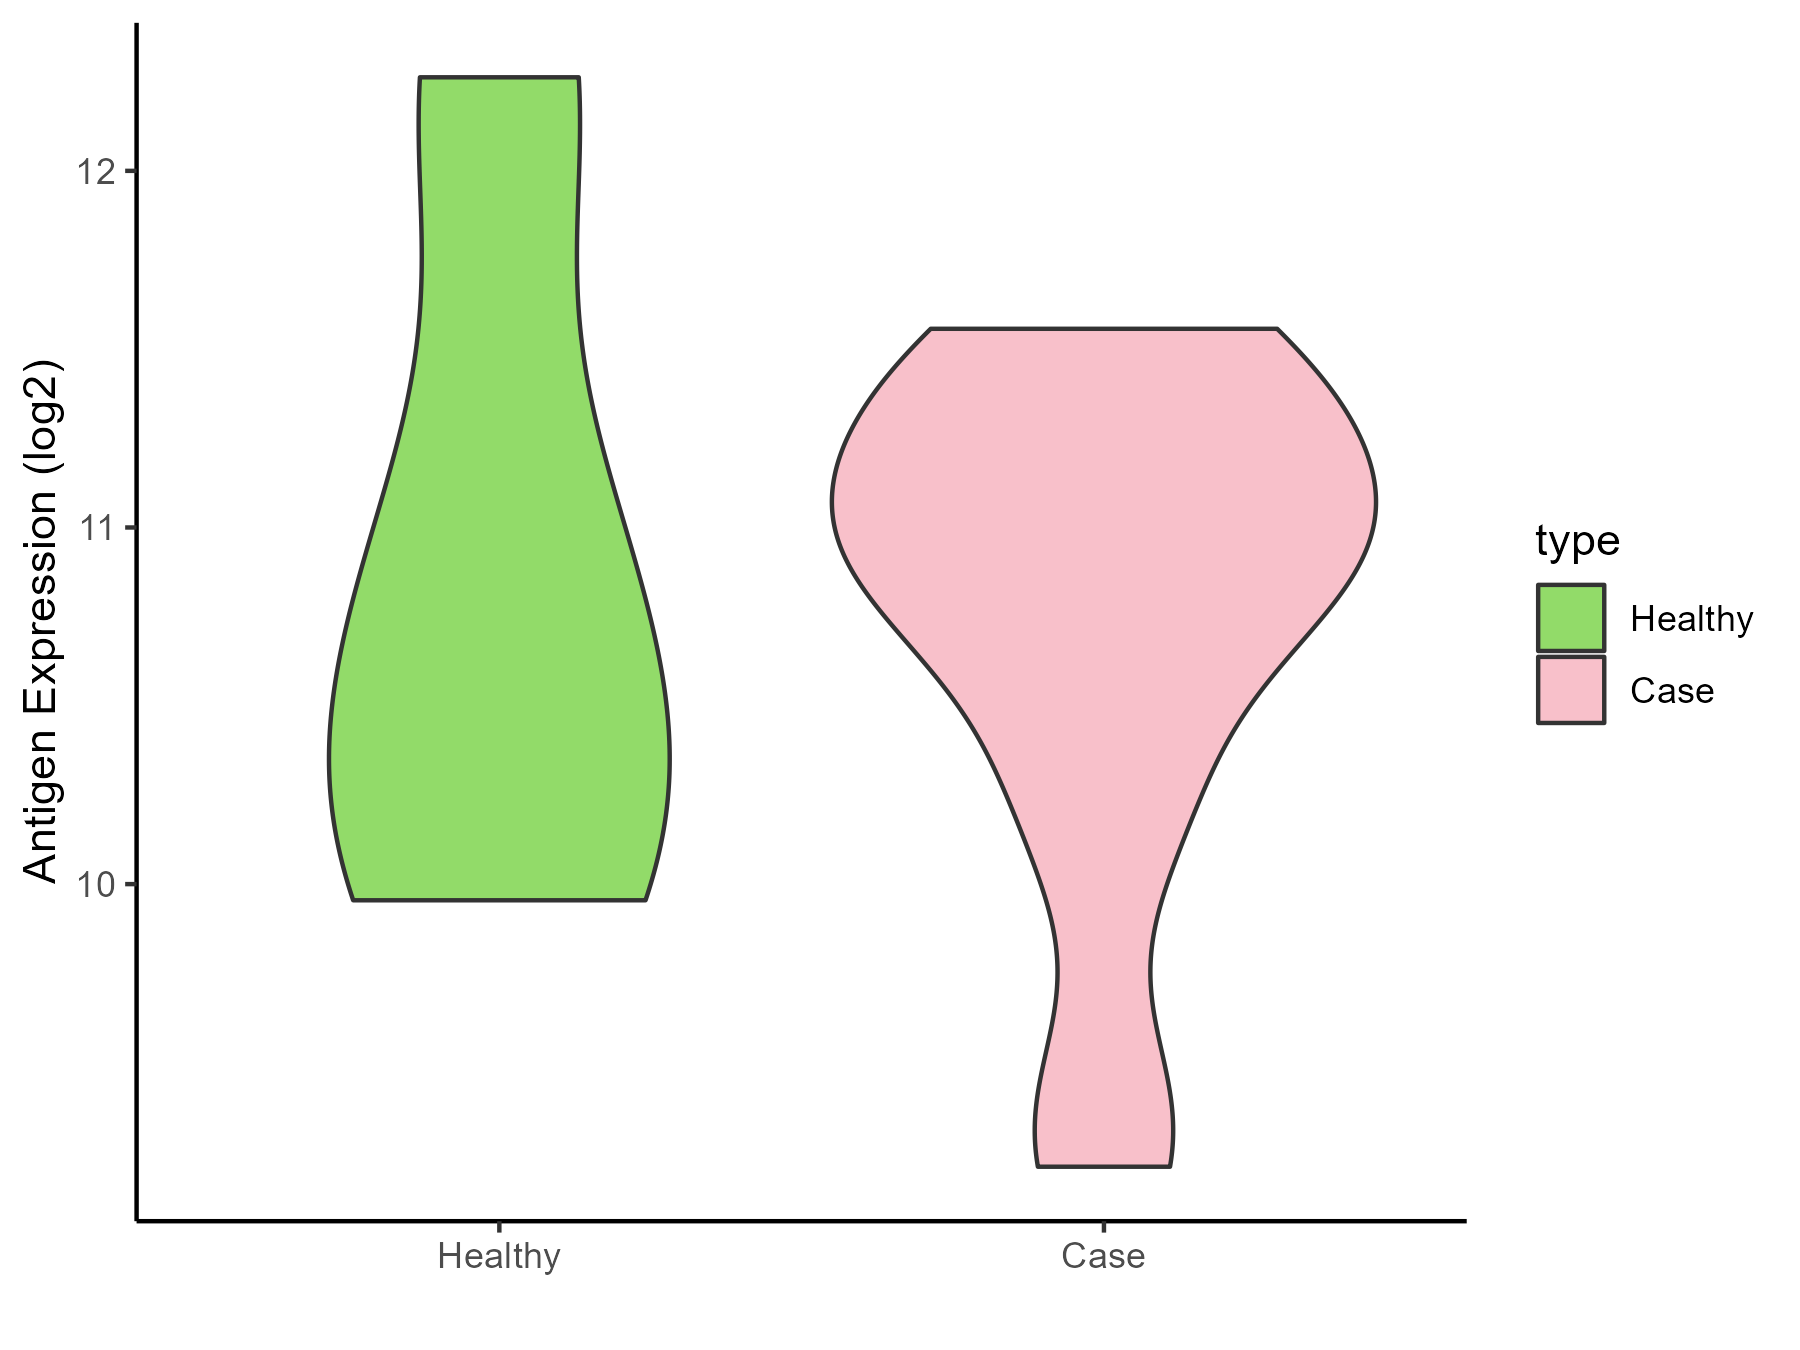
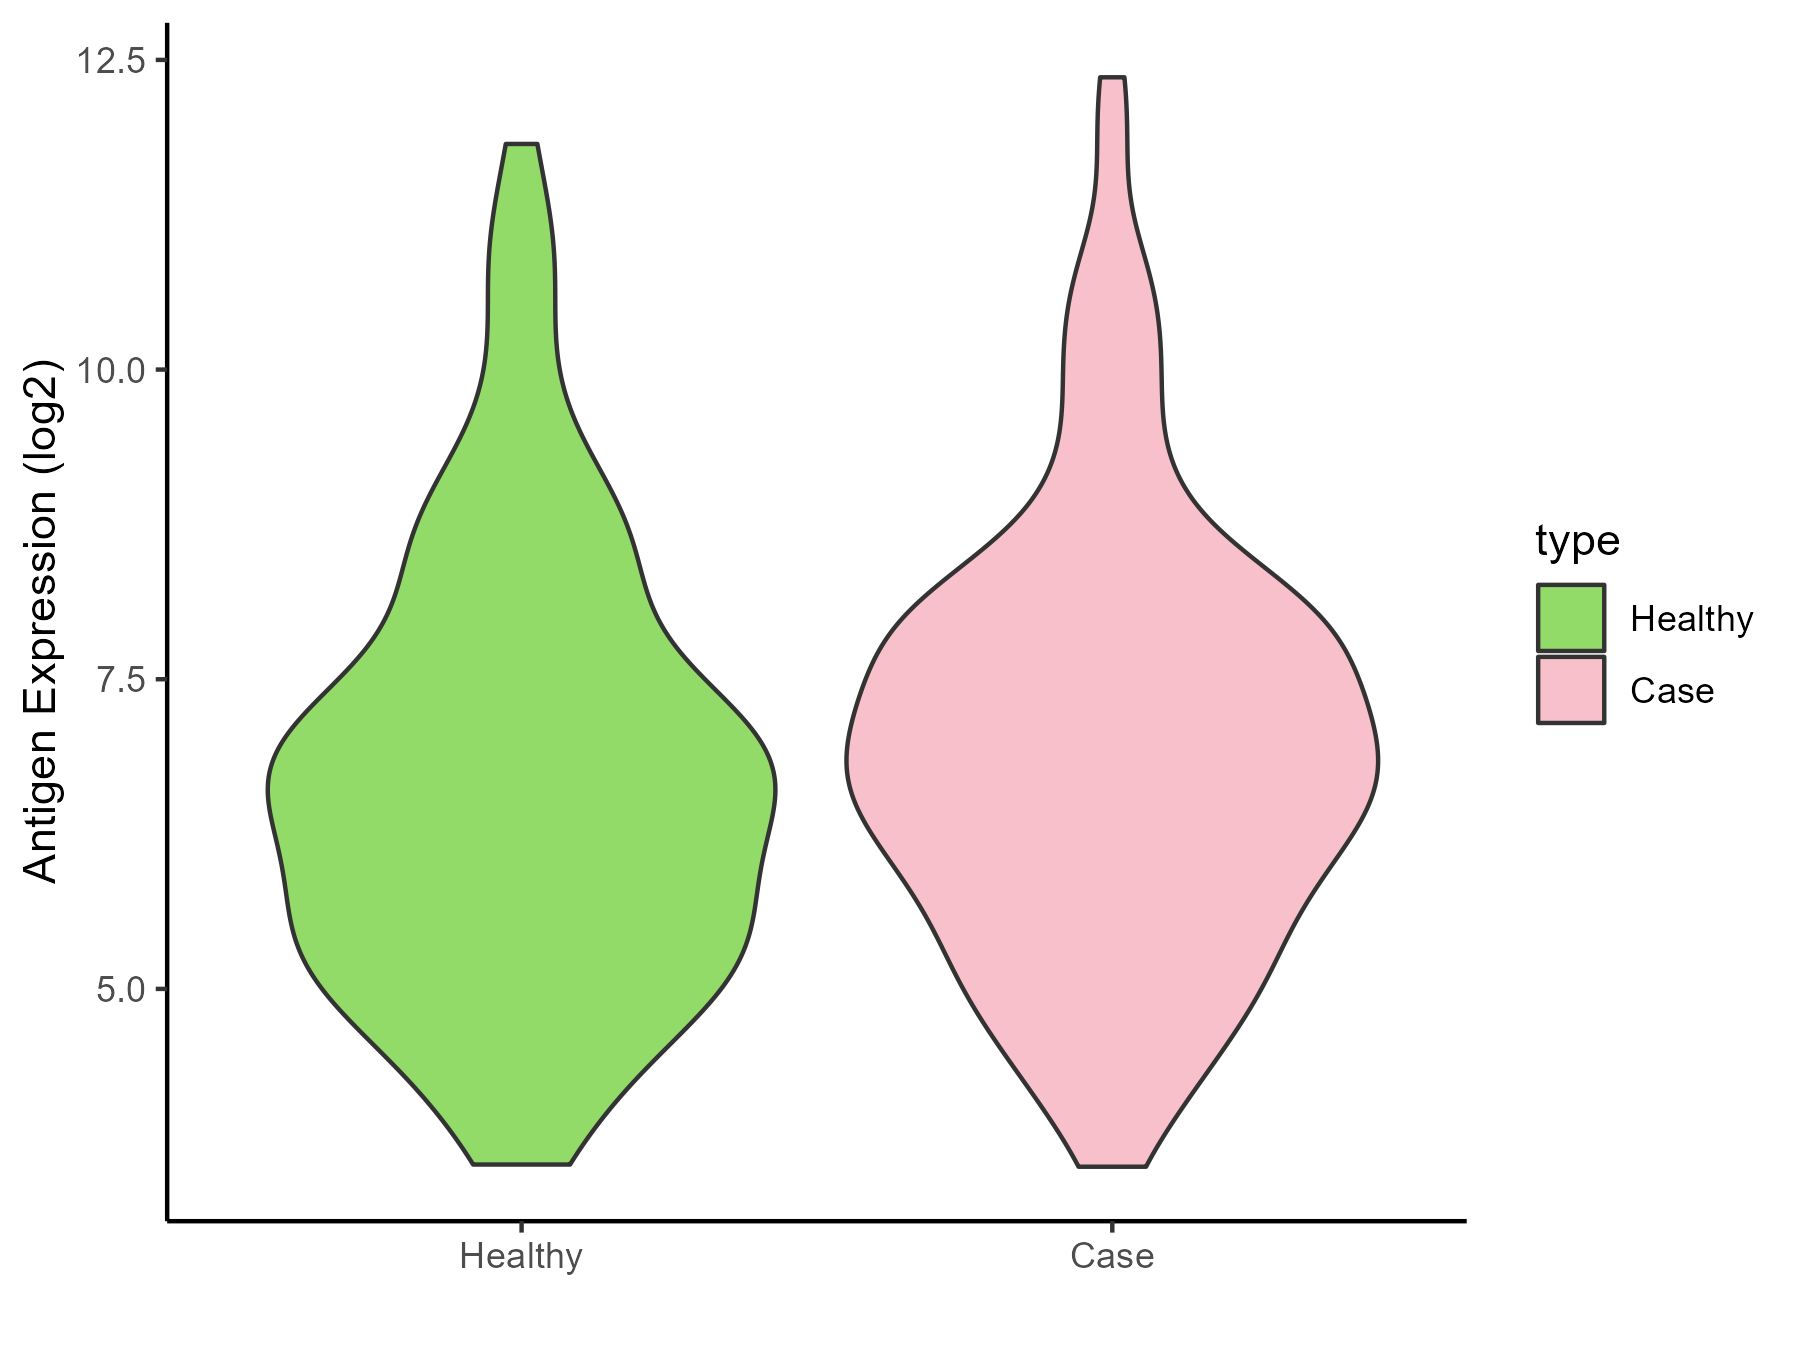
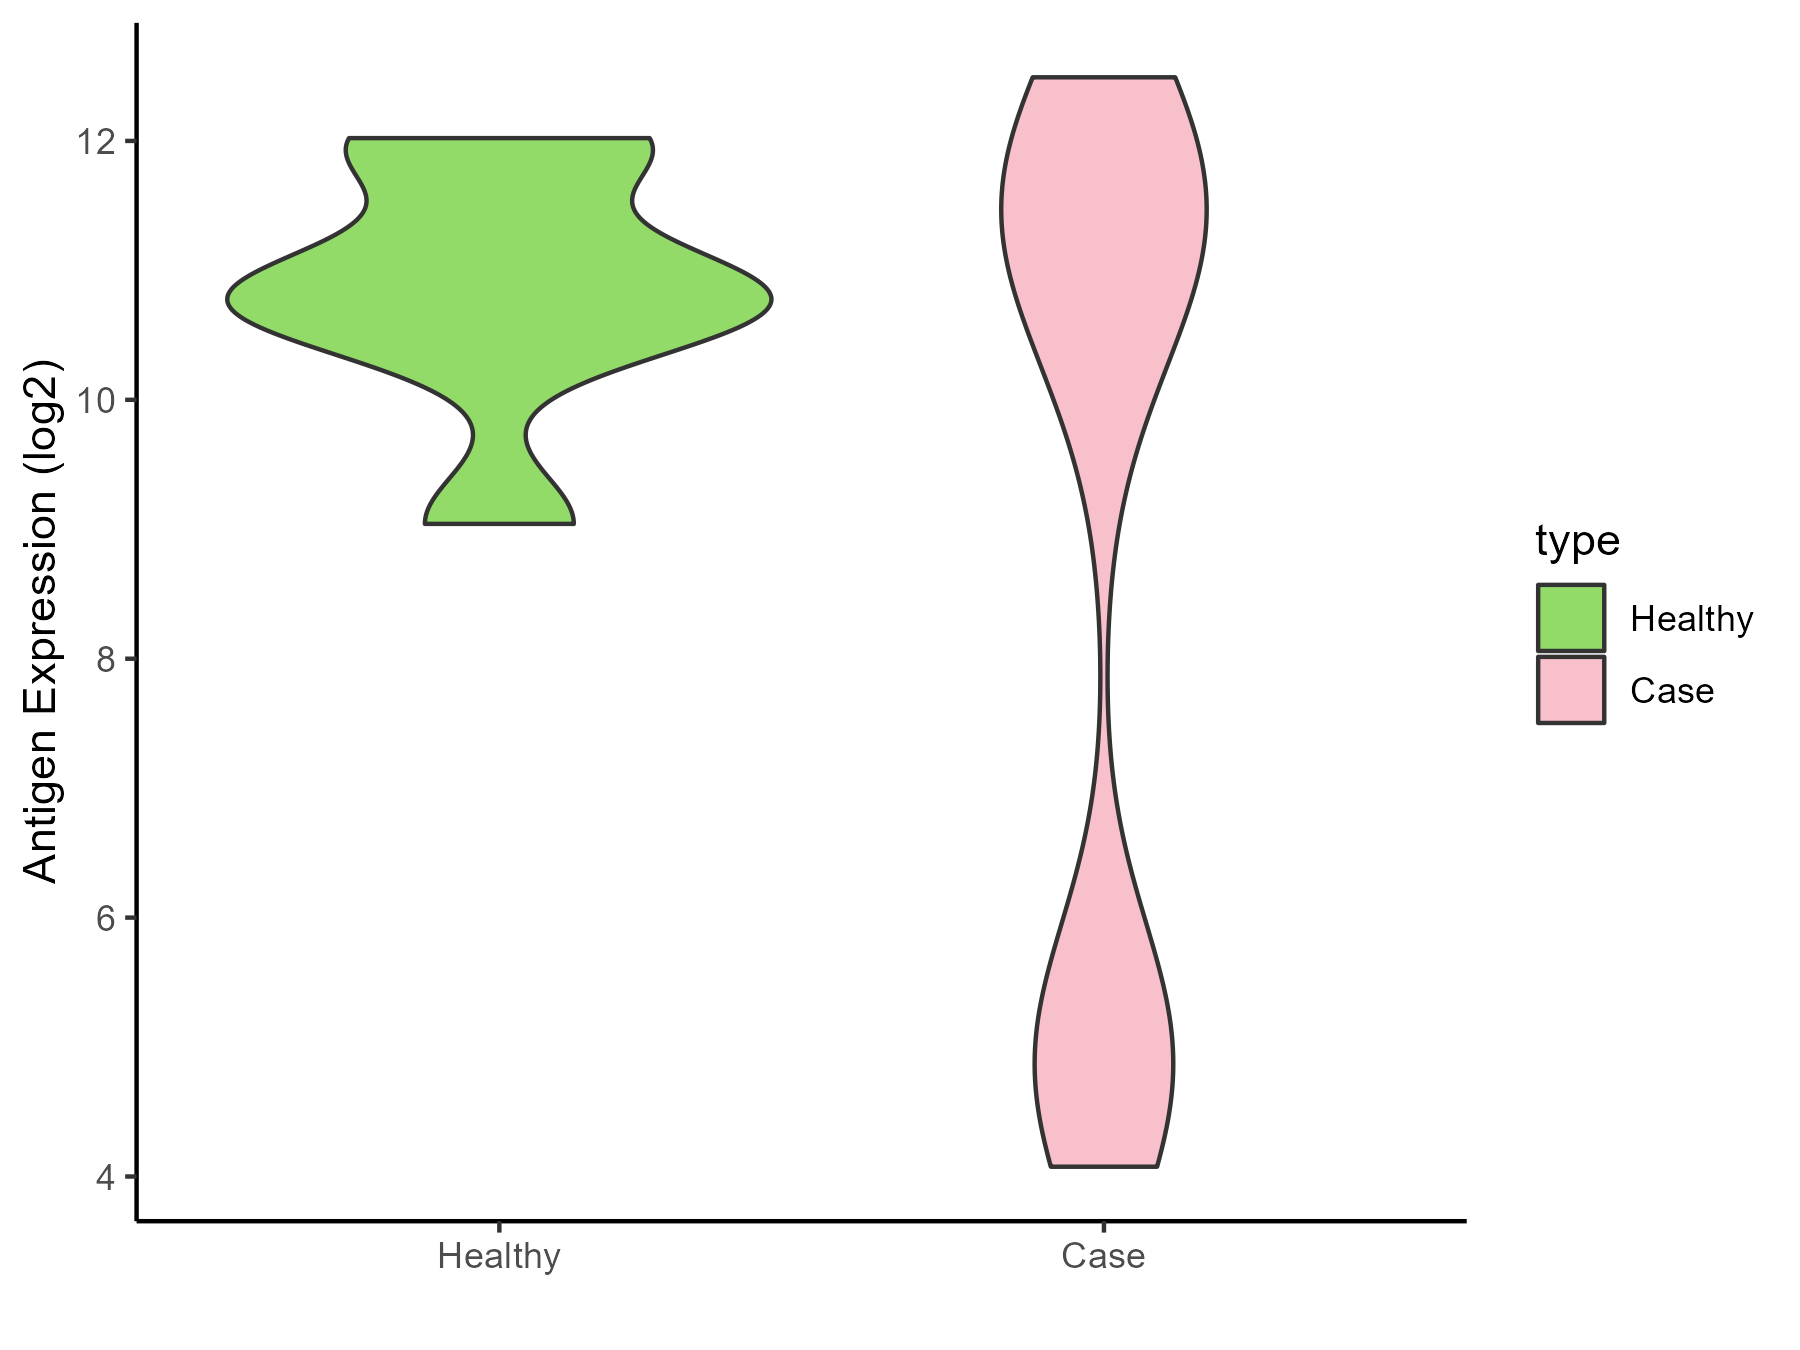
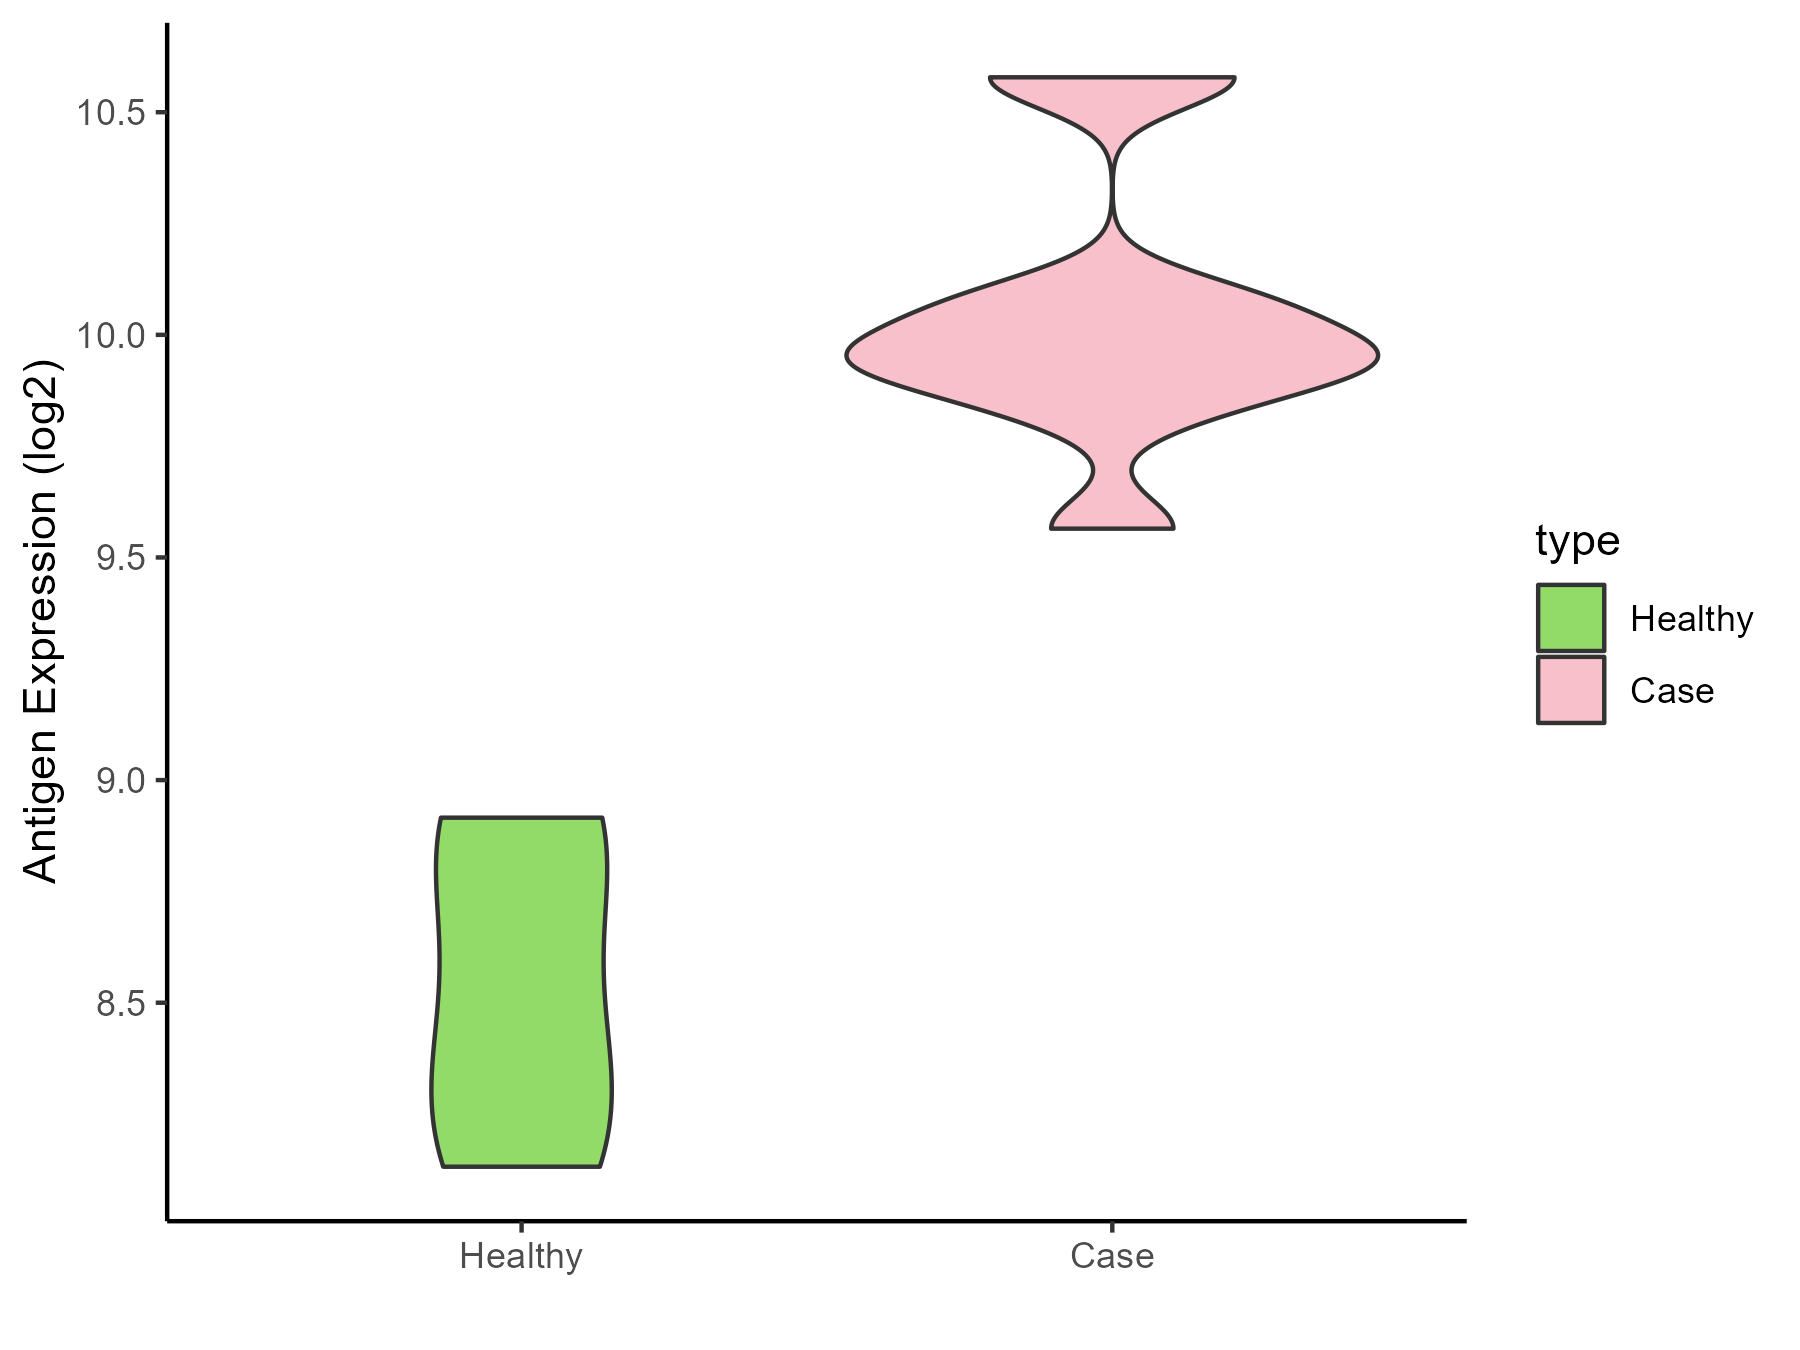
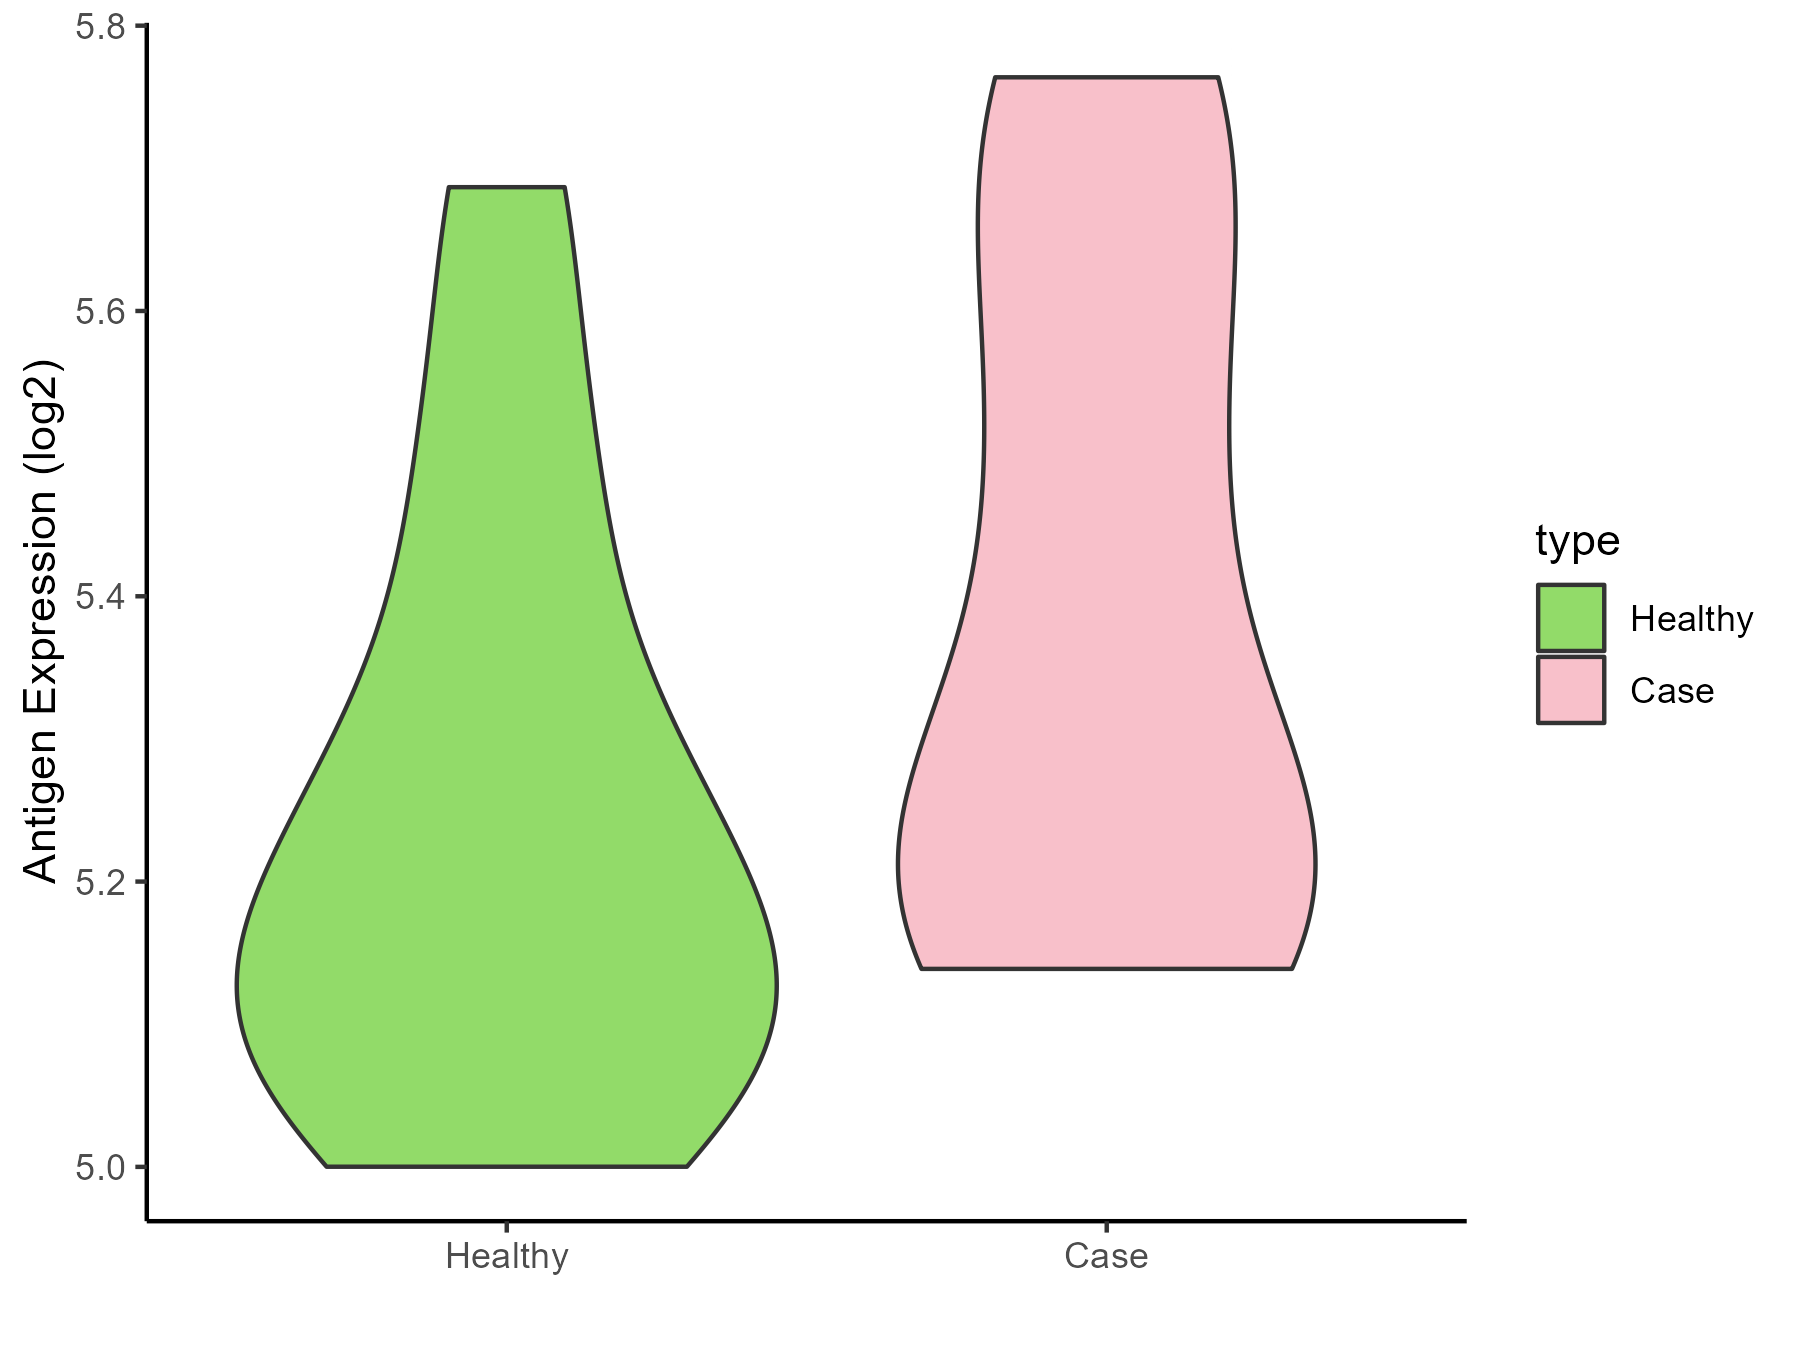
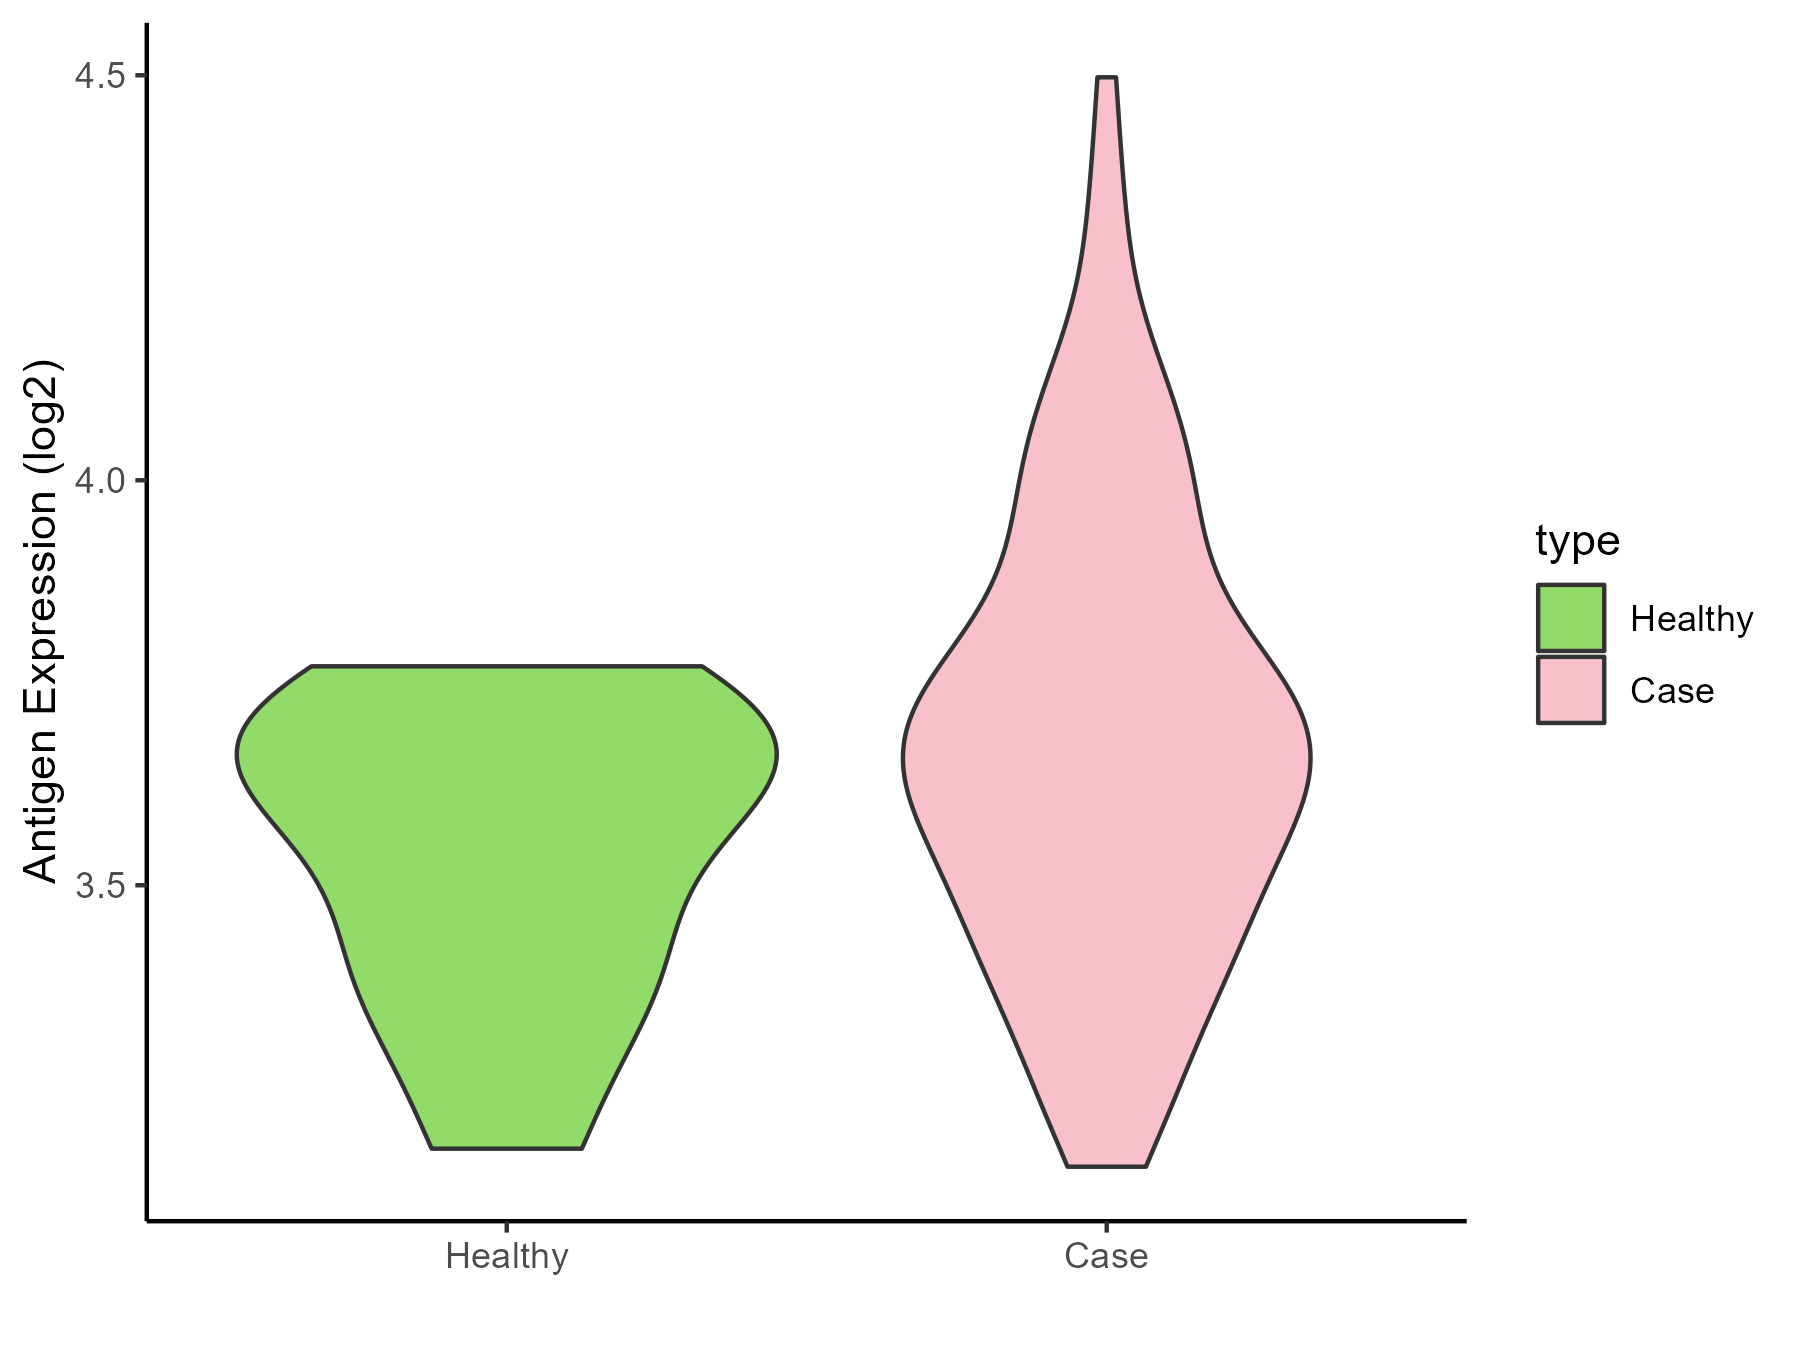
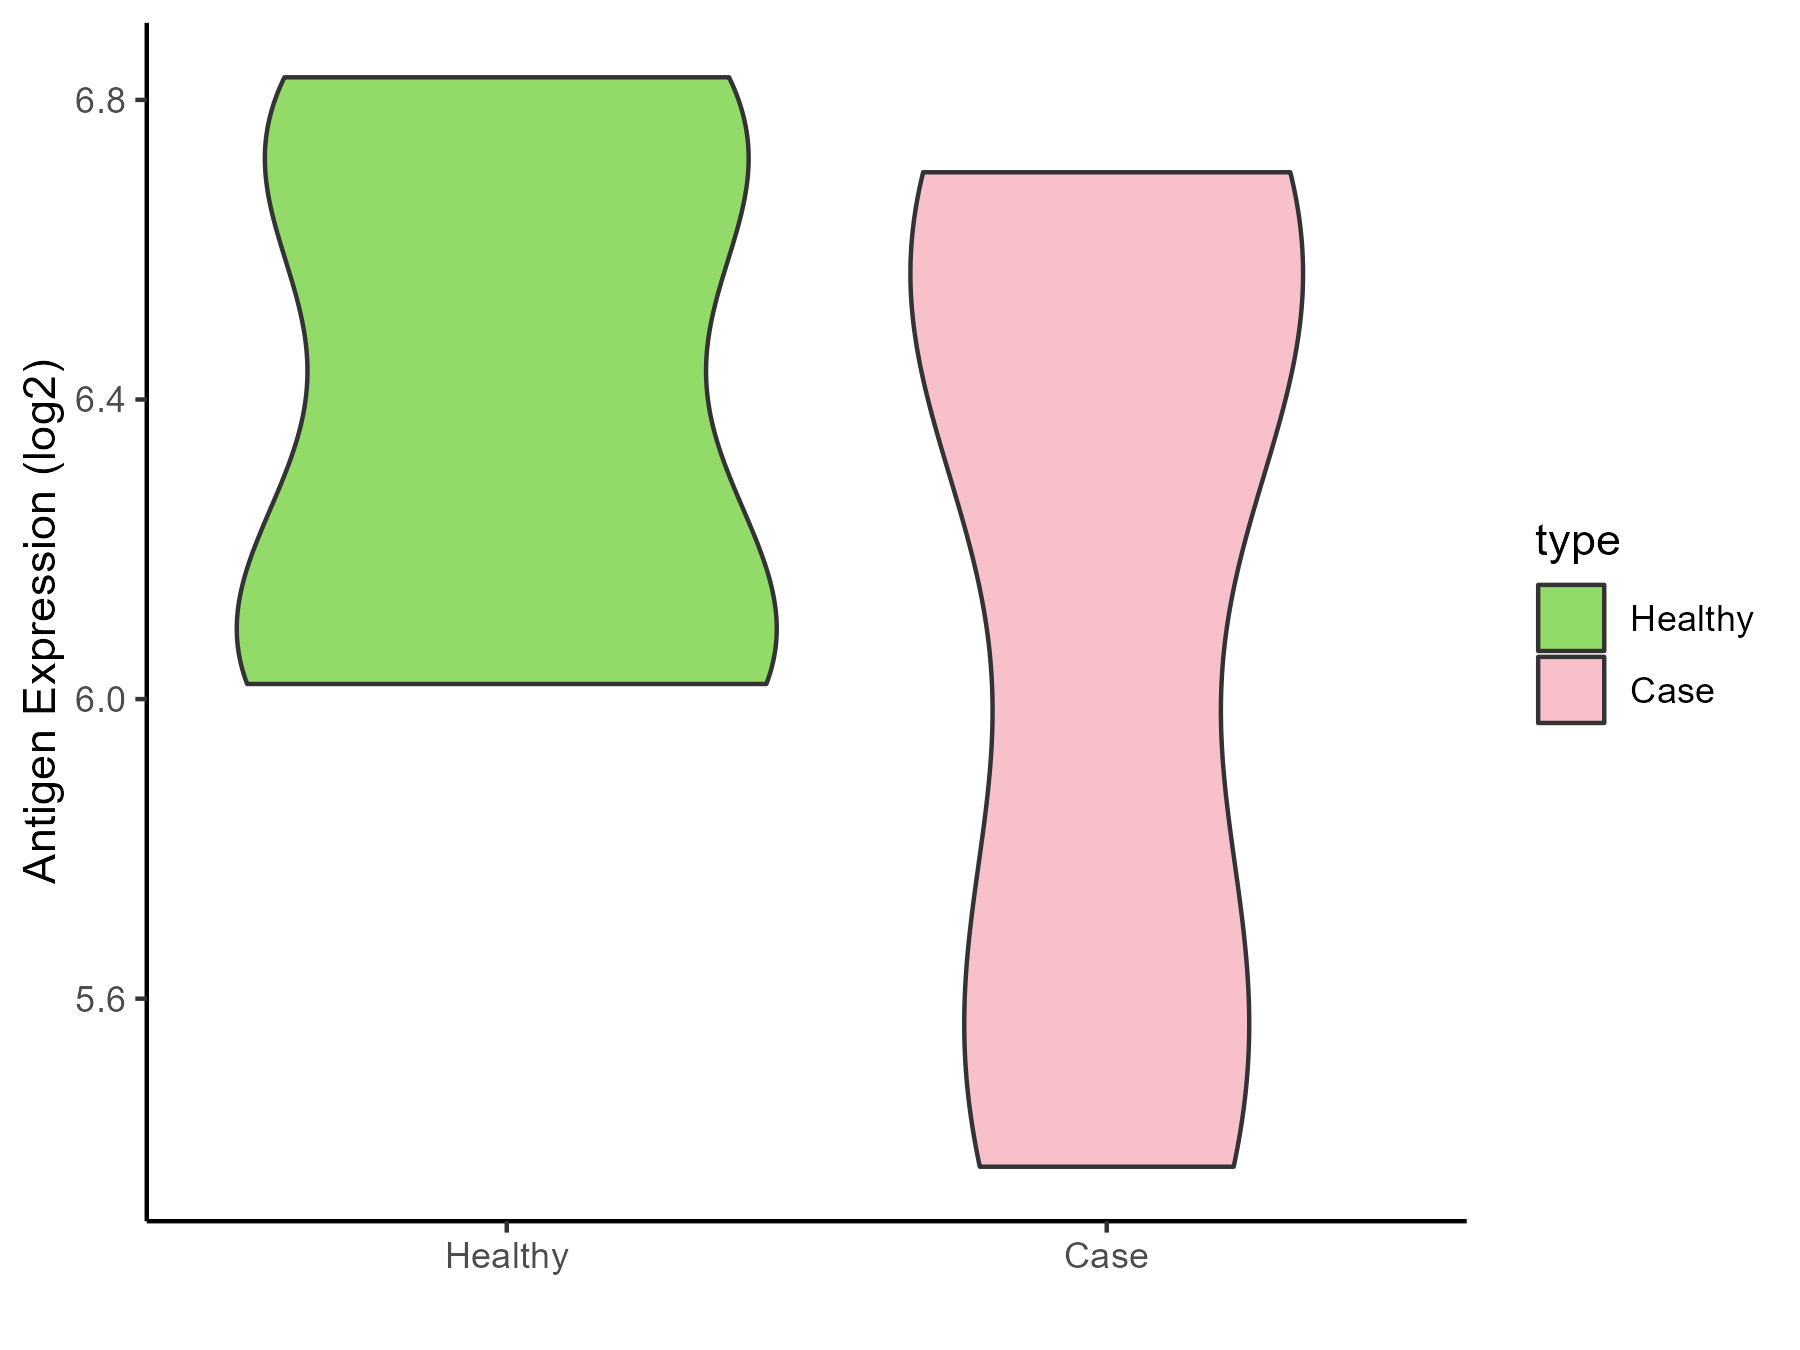
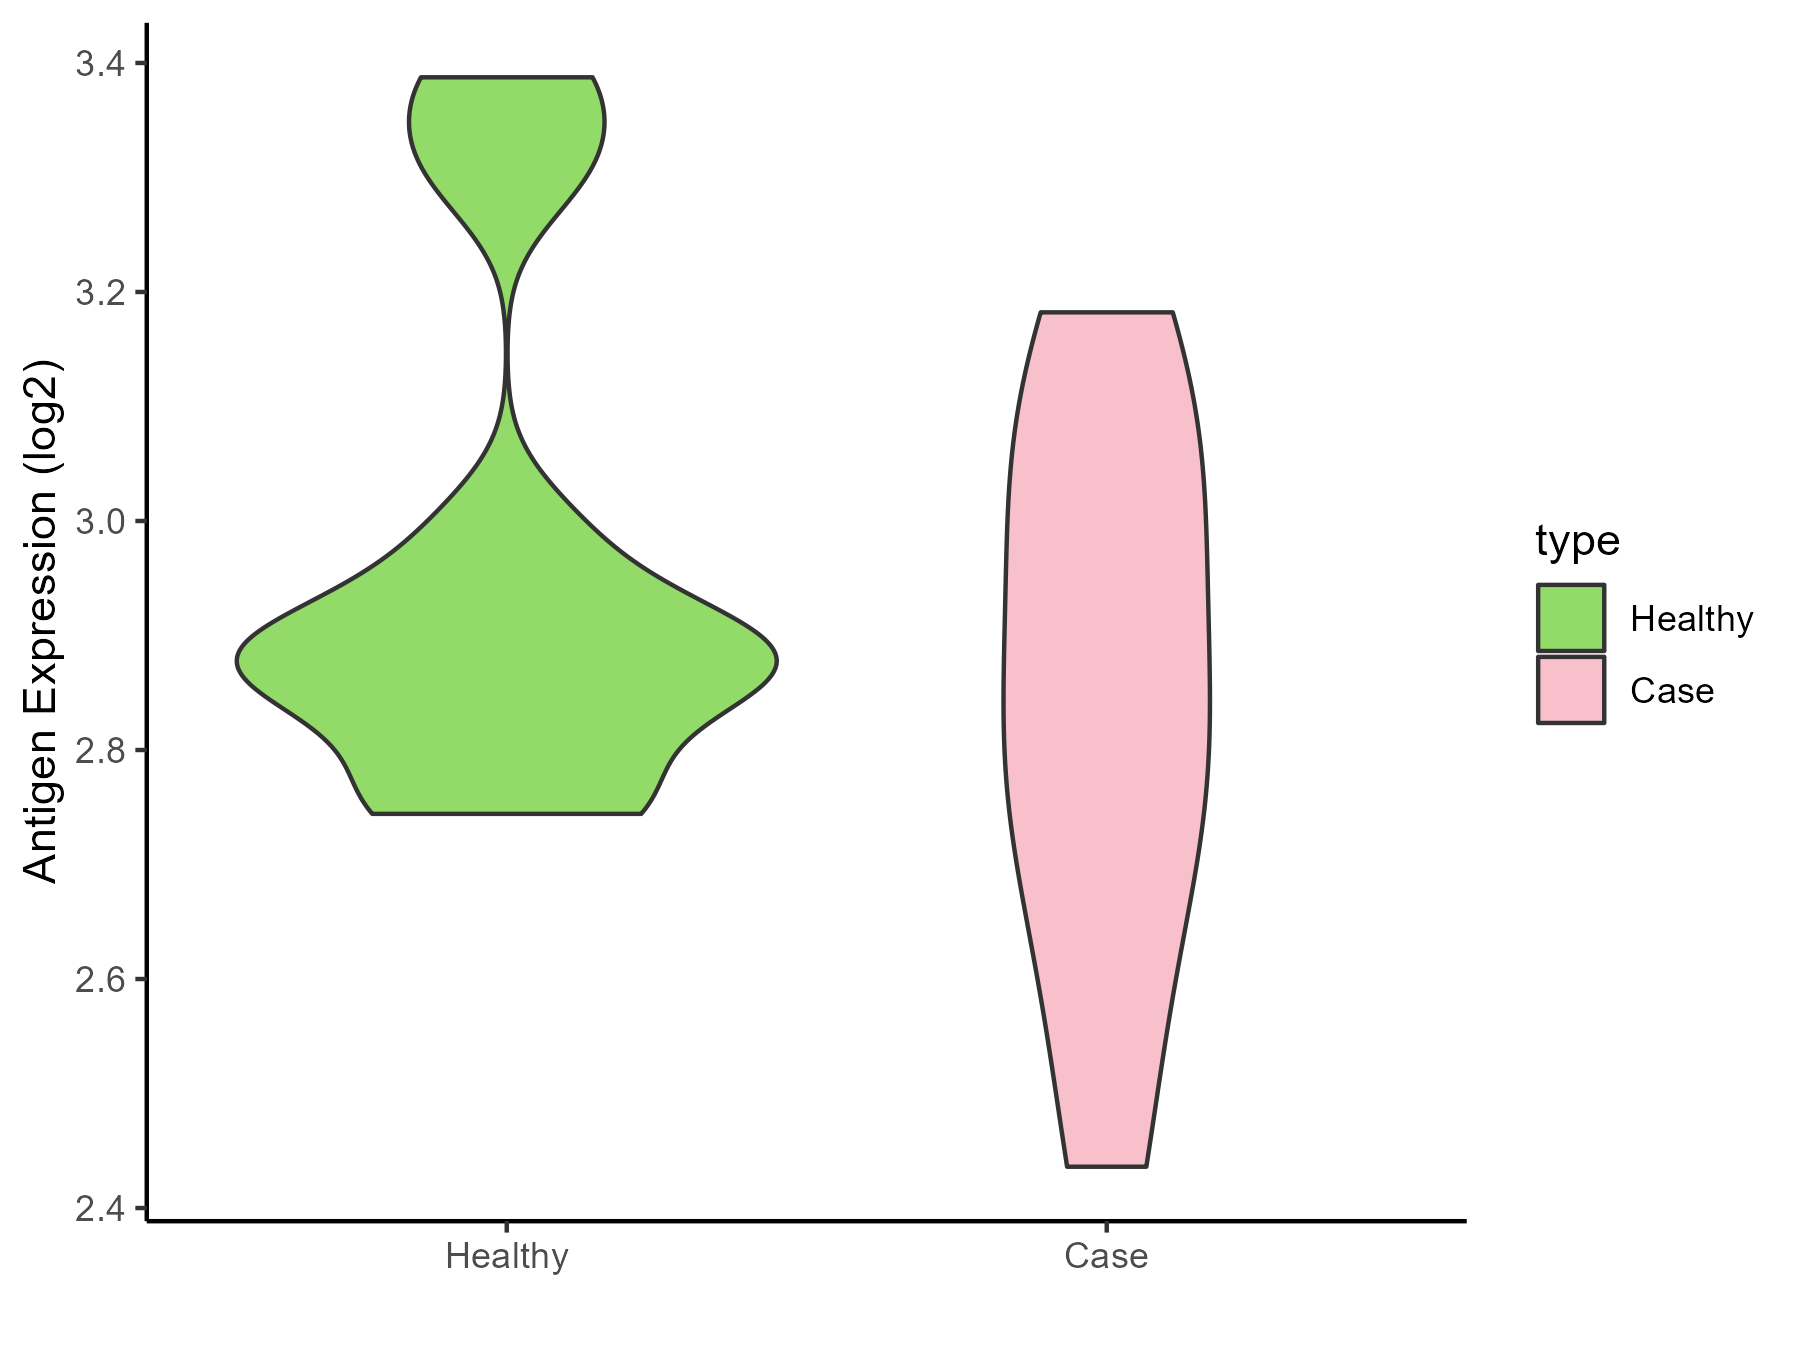
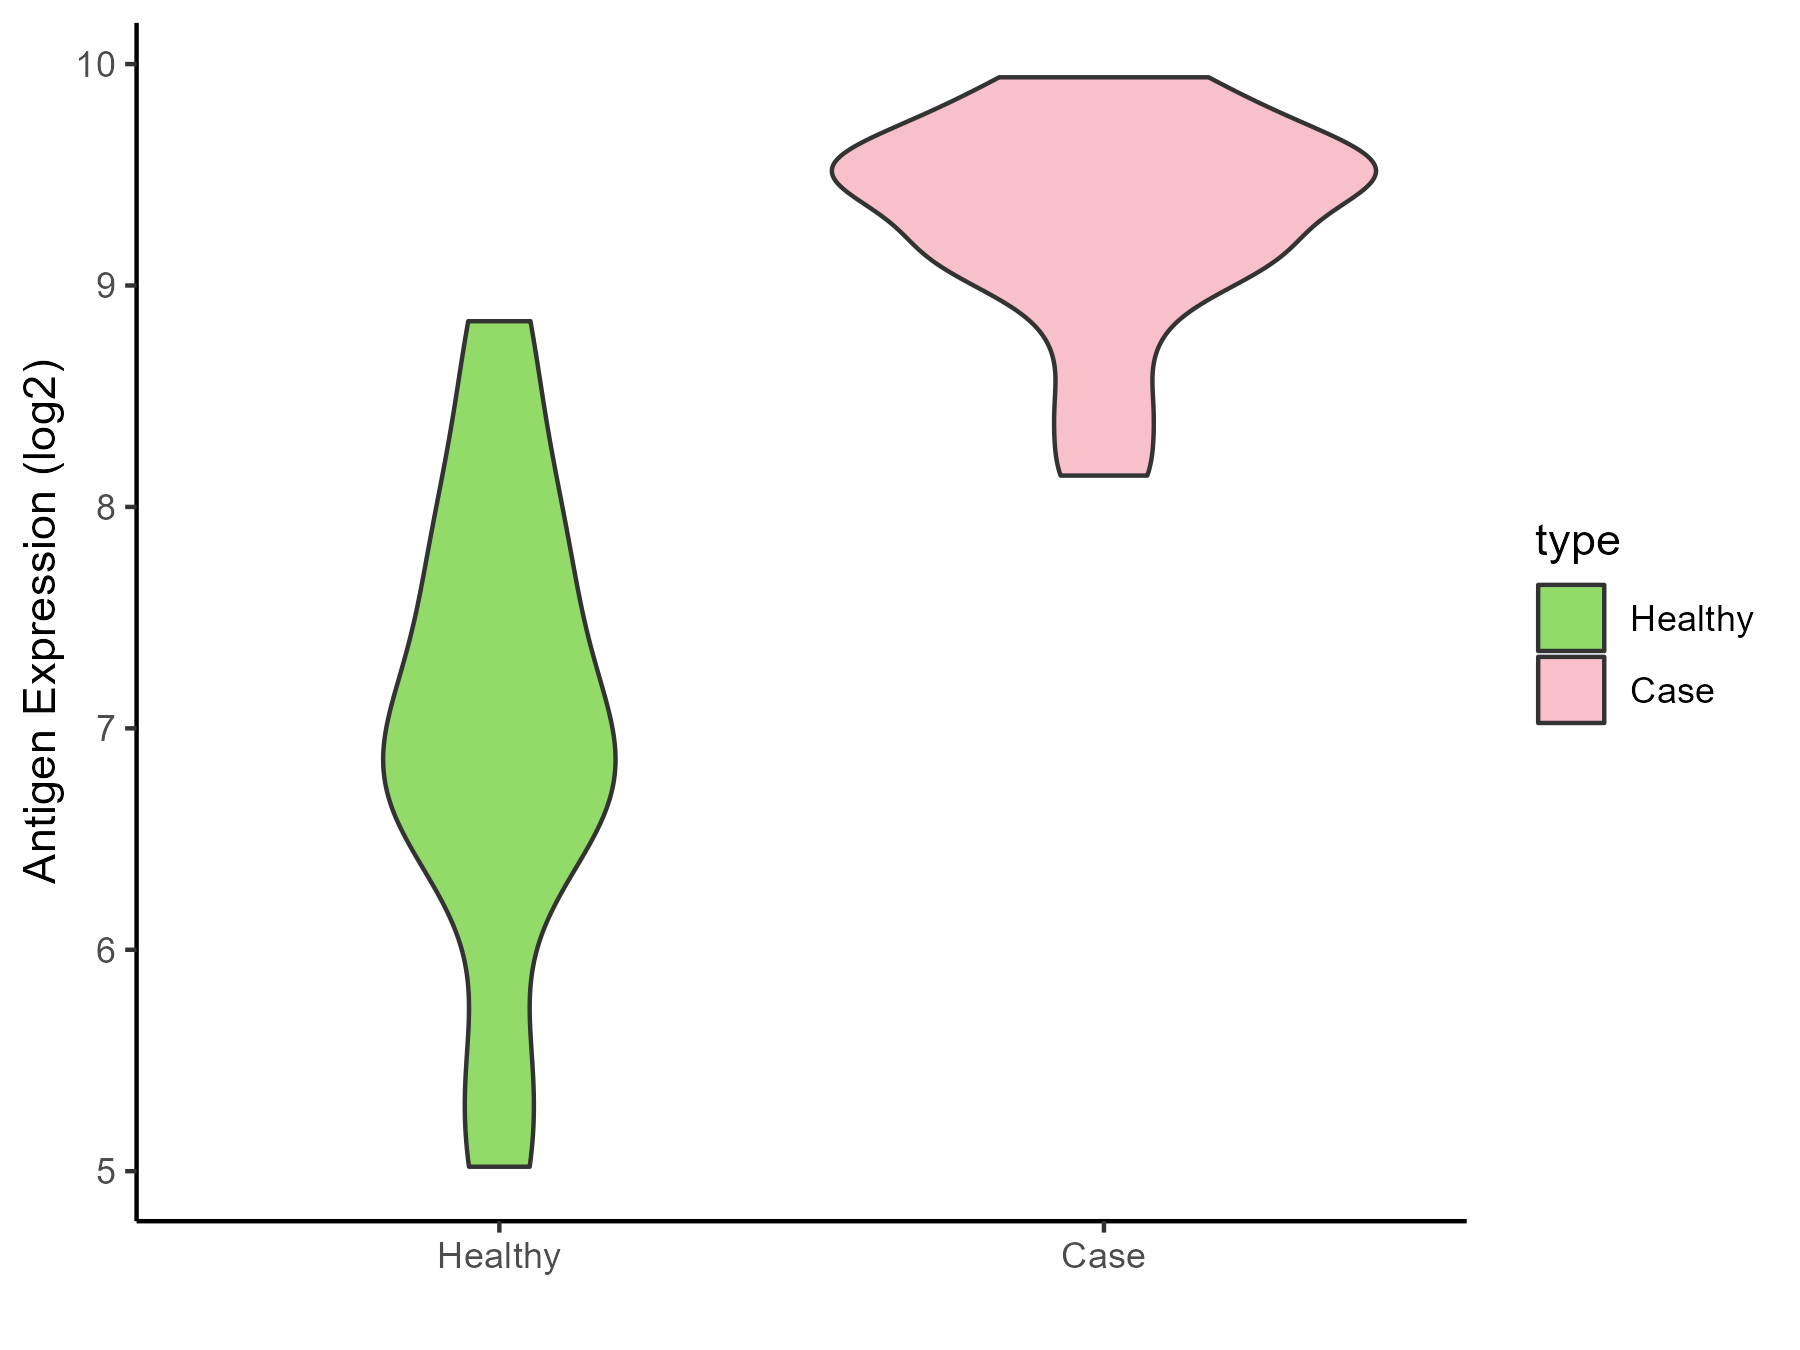
| The Studied Tissue | Brainstem | |
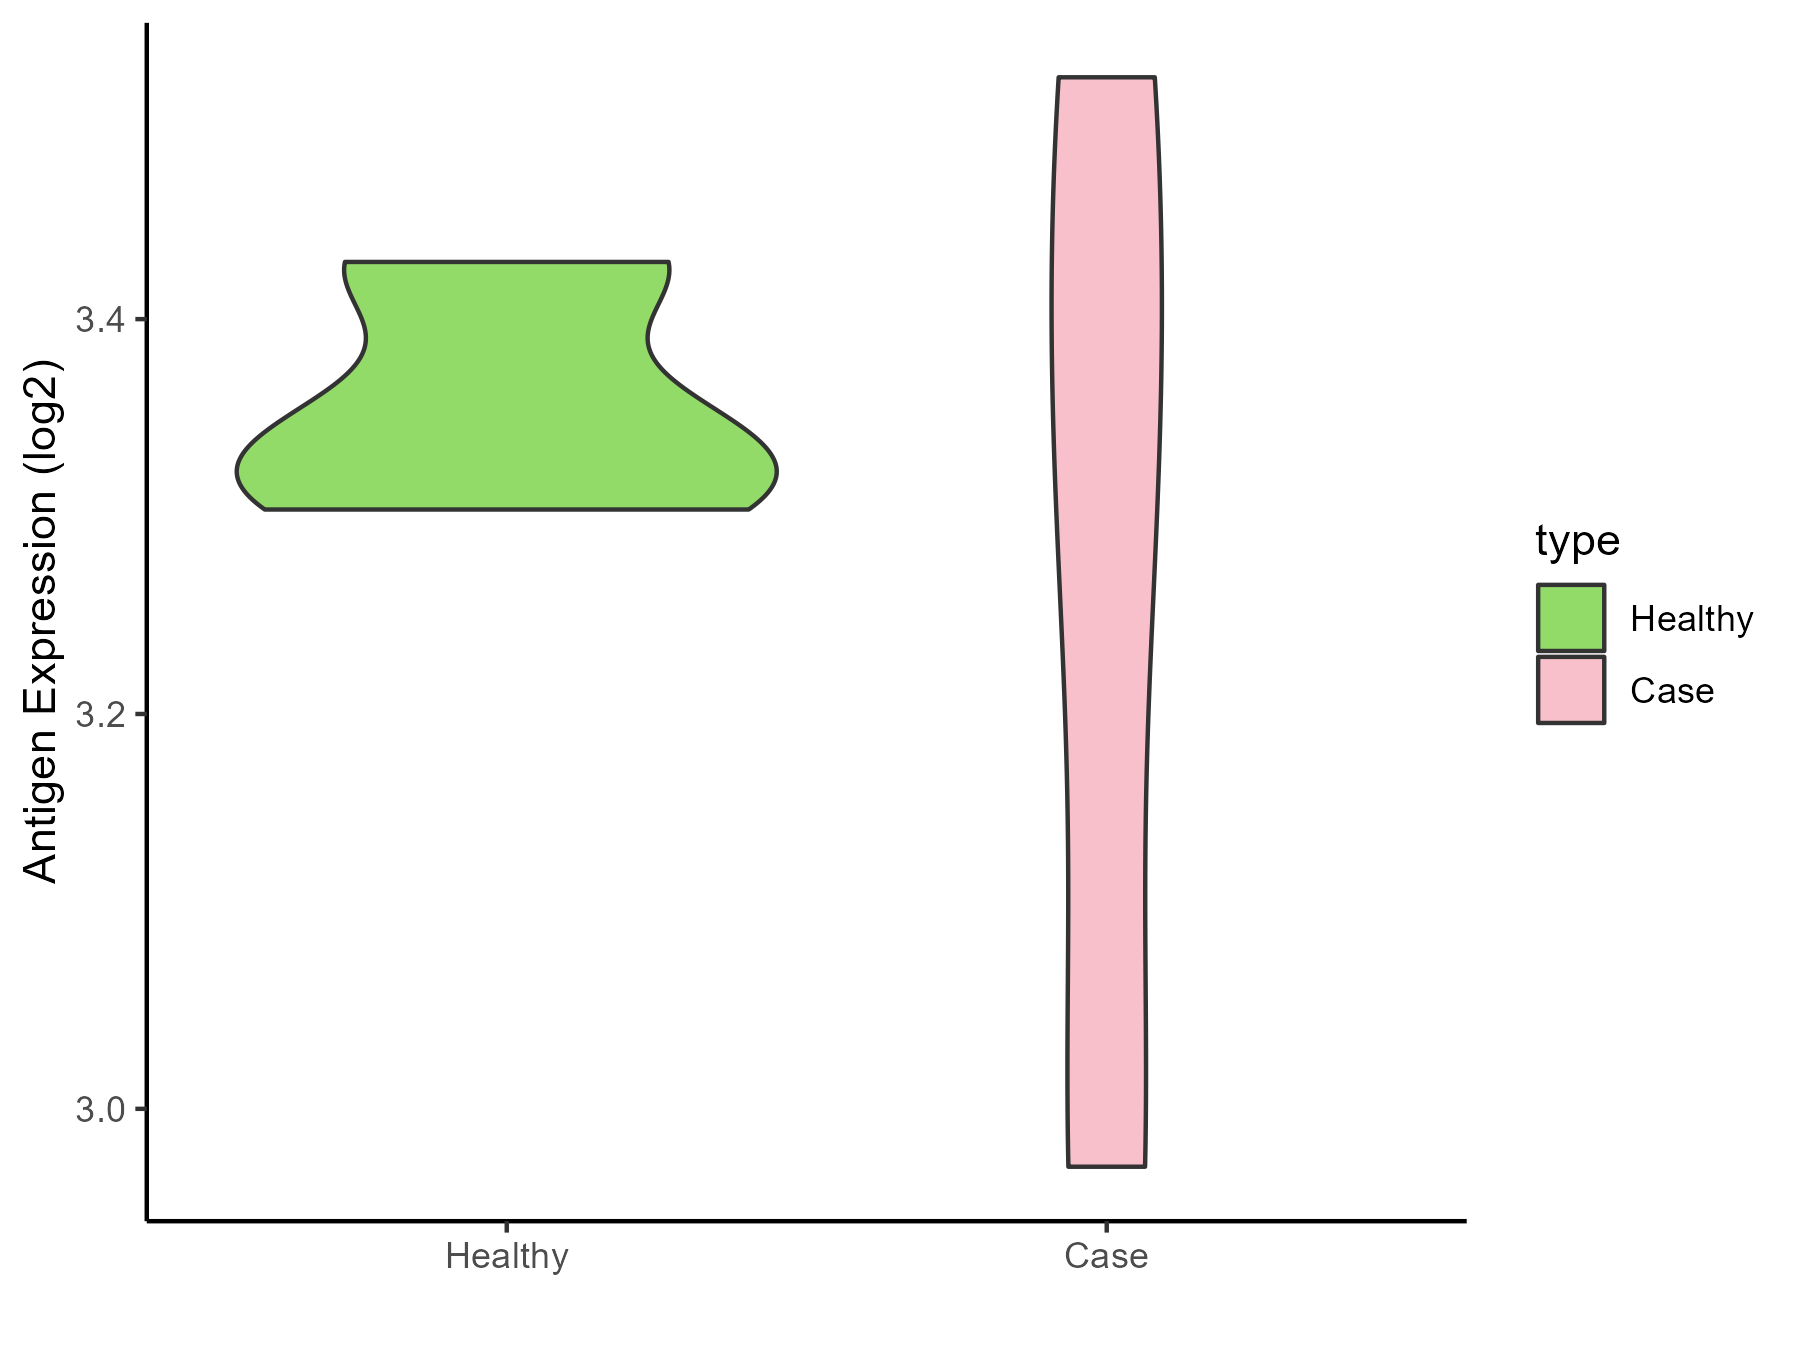
| The Specific Disease | Neuroectodermal tumor | |
| The Expression Level of Disease Section Compare with the Healthy Individual Tissue | p-value: 7.12E-05; Fold-change: 0.531265455; Z-score: 1.171266125 | |
| Disease-specific Antigen Abundances |

|
Click to View the Clearer Original Diagram |
| The Studied Tissue | Nervous | |
| The Specific Disease | Brain cancer | |
| The Expression Level of Disease Section Compare with the Healthy Individual Tissue | p-value: 1.40E-27; Fold-change: 0.590057057; Z-score: 0.668370871 | |
| Disease-specific Antigen Abundances |
|
Click to View the Clearer Original Diagram |
| Differential expression pattern of antigen in diseases | ||
| The Studied Tissue | Whole blood | |
| The Specific Disease | Polycythemia vera | |
| The Expression Level of Disease Section Compare with the Healthy Individual Tissue | p-value: 1.49E-08; Fold-change: 0.327395874; Z-score: 1.934631836 | |
| Disease-specific Antigen Abundances |
|
Click to View the Clearer Original Diagram |
| The Studied Tissue | Whole blood | |
| The Specific Disease | Myelofibrosis | |
| The Expression Level of Disease Section Compare with the Healthy Individual Tissue | p-value: 0.667610111; Fold-change: 0.047647503; Z-score: 0.338719471 | |
| Disease-specific Antigen Abundances |
|
Click to View the Clearer Original Diagram |
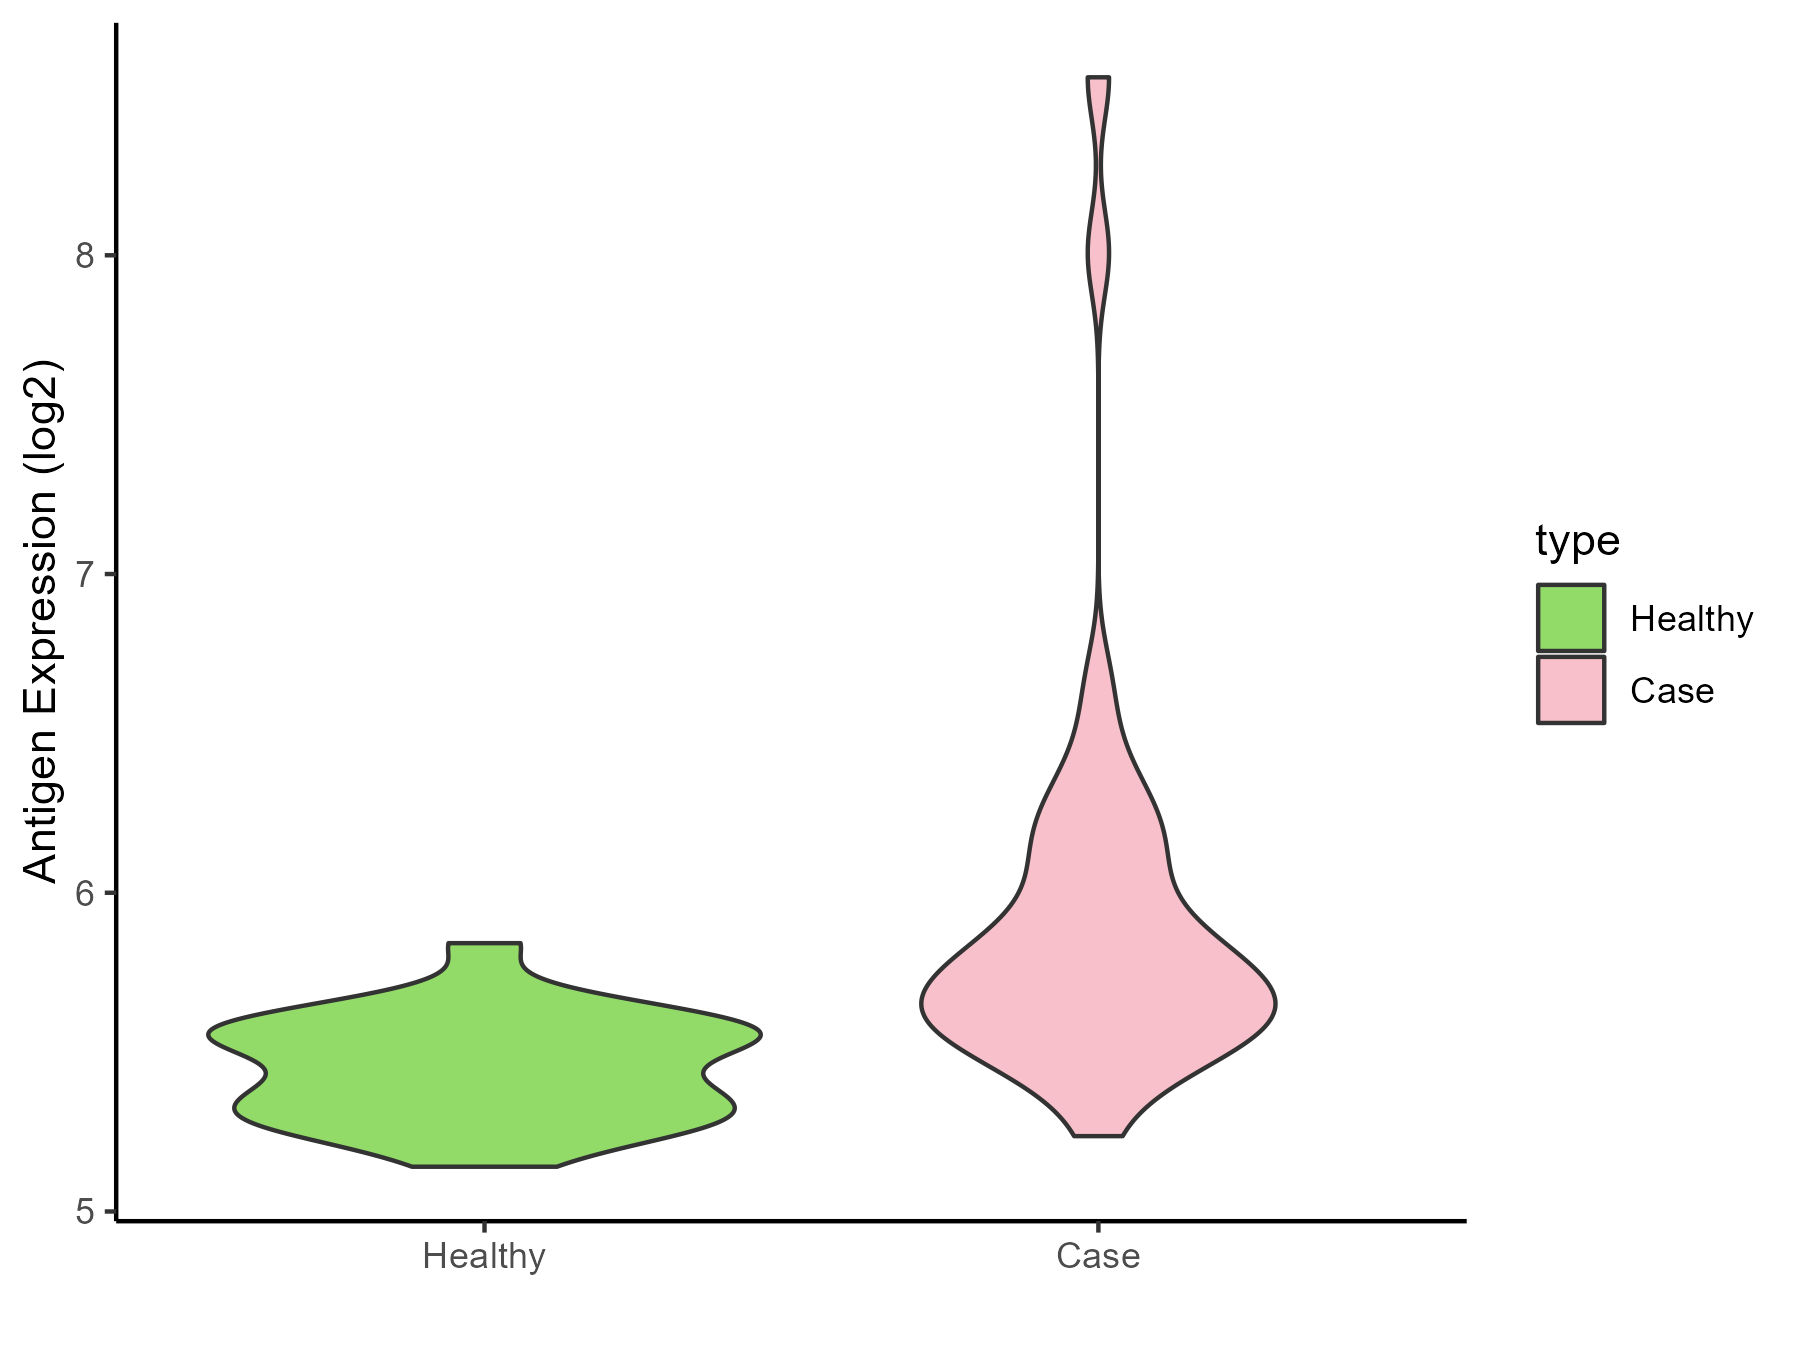
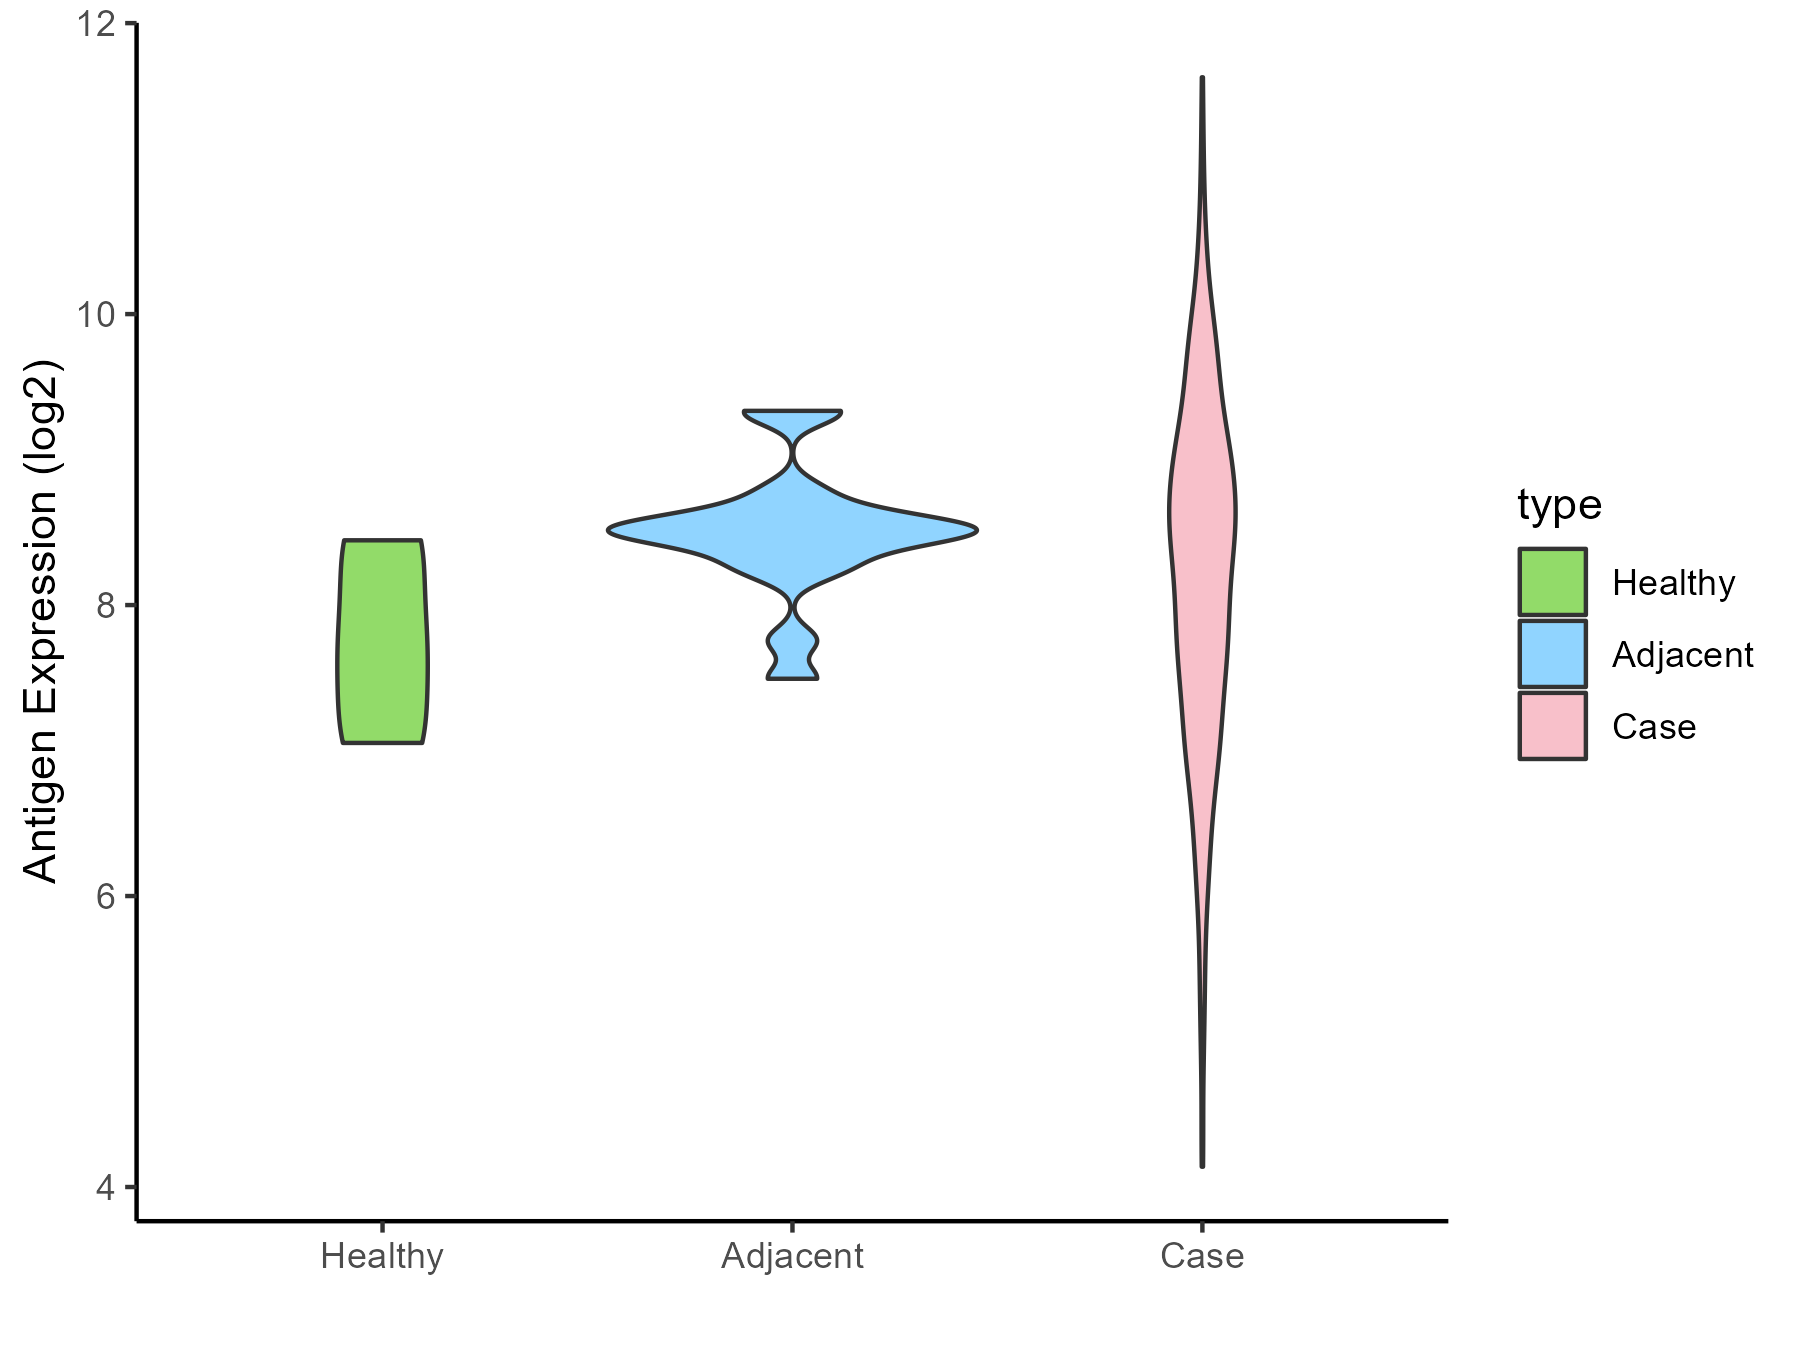
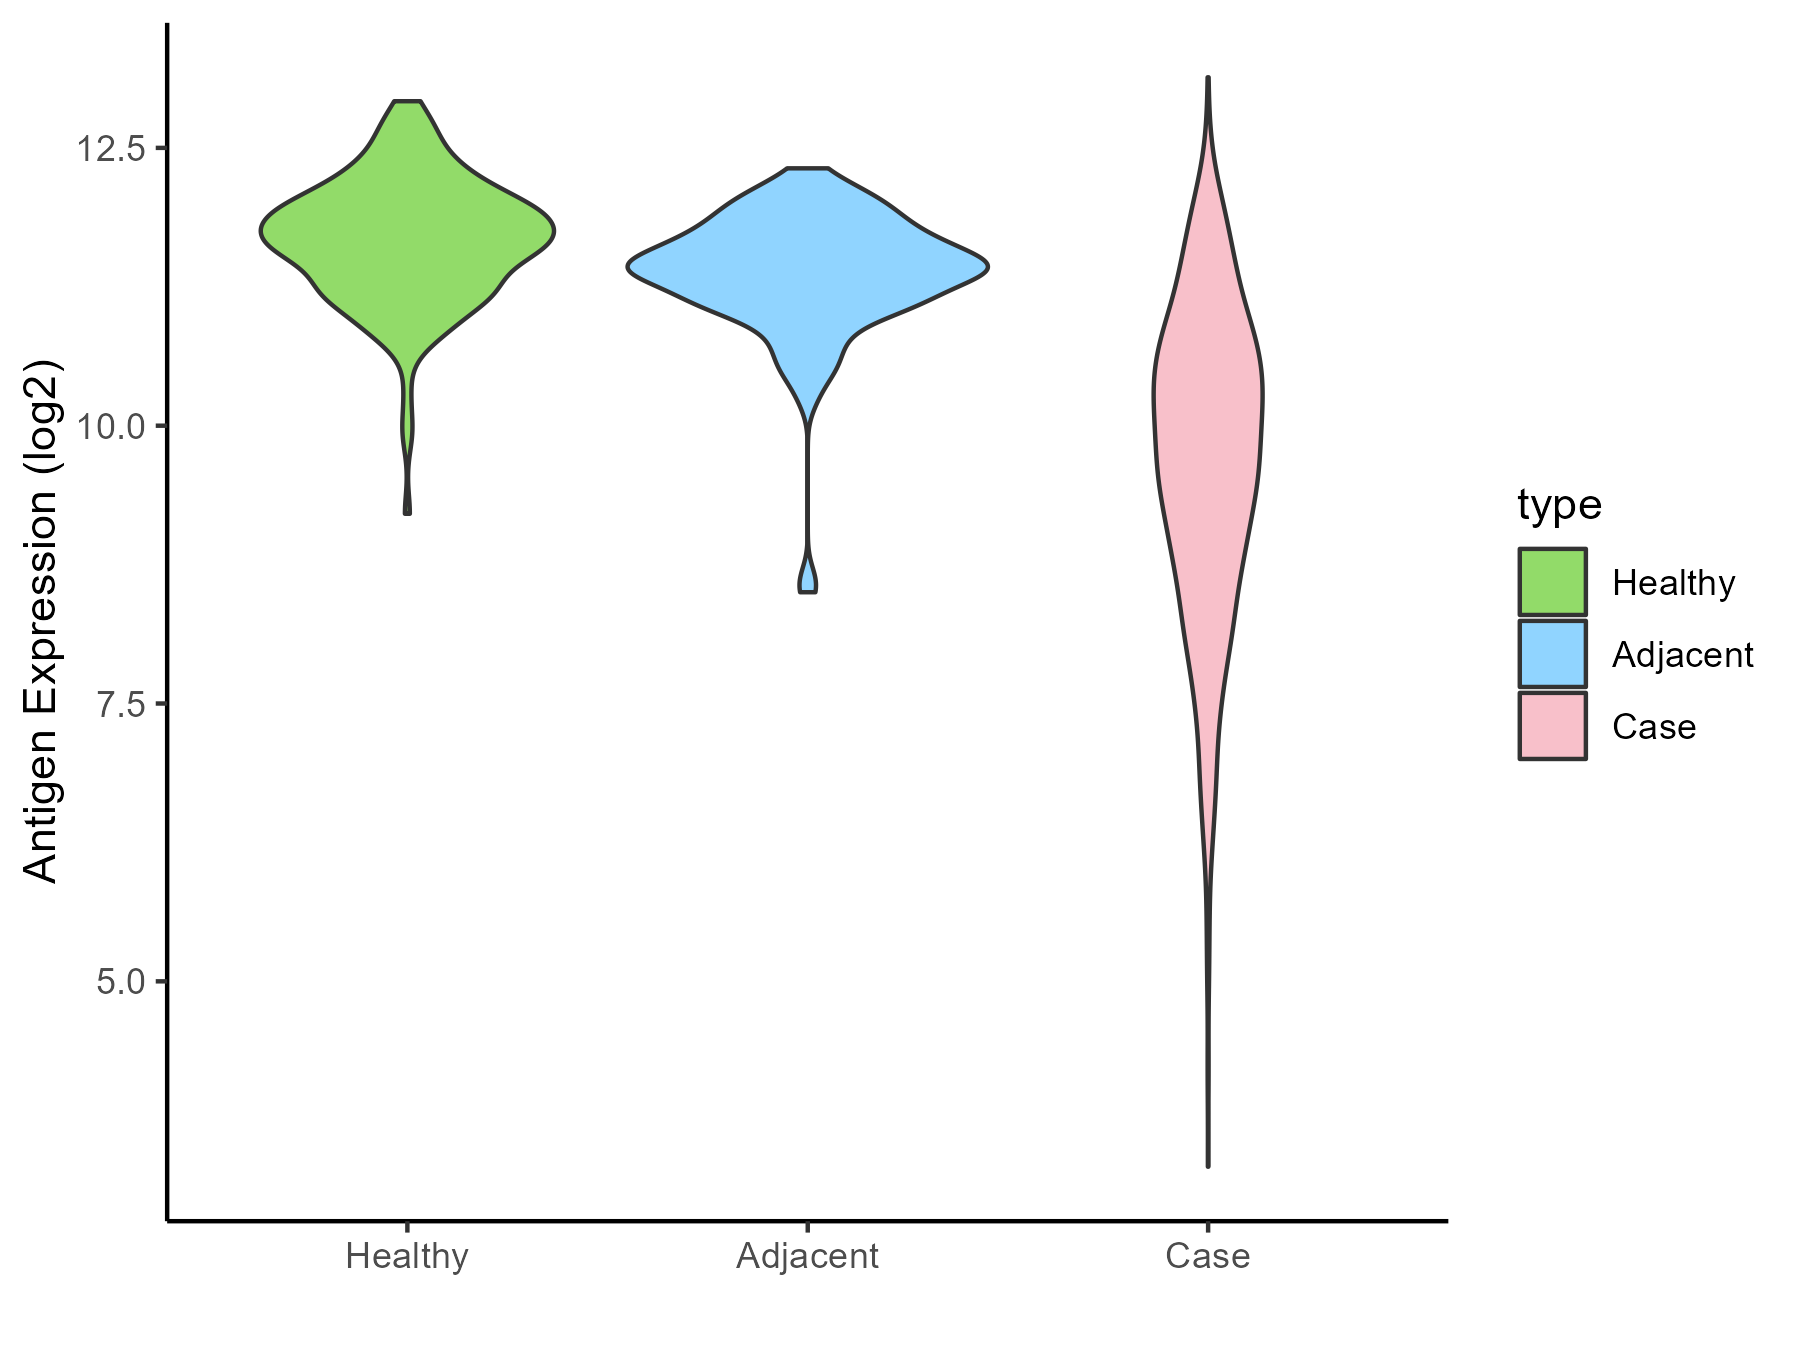
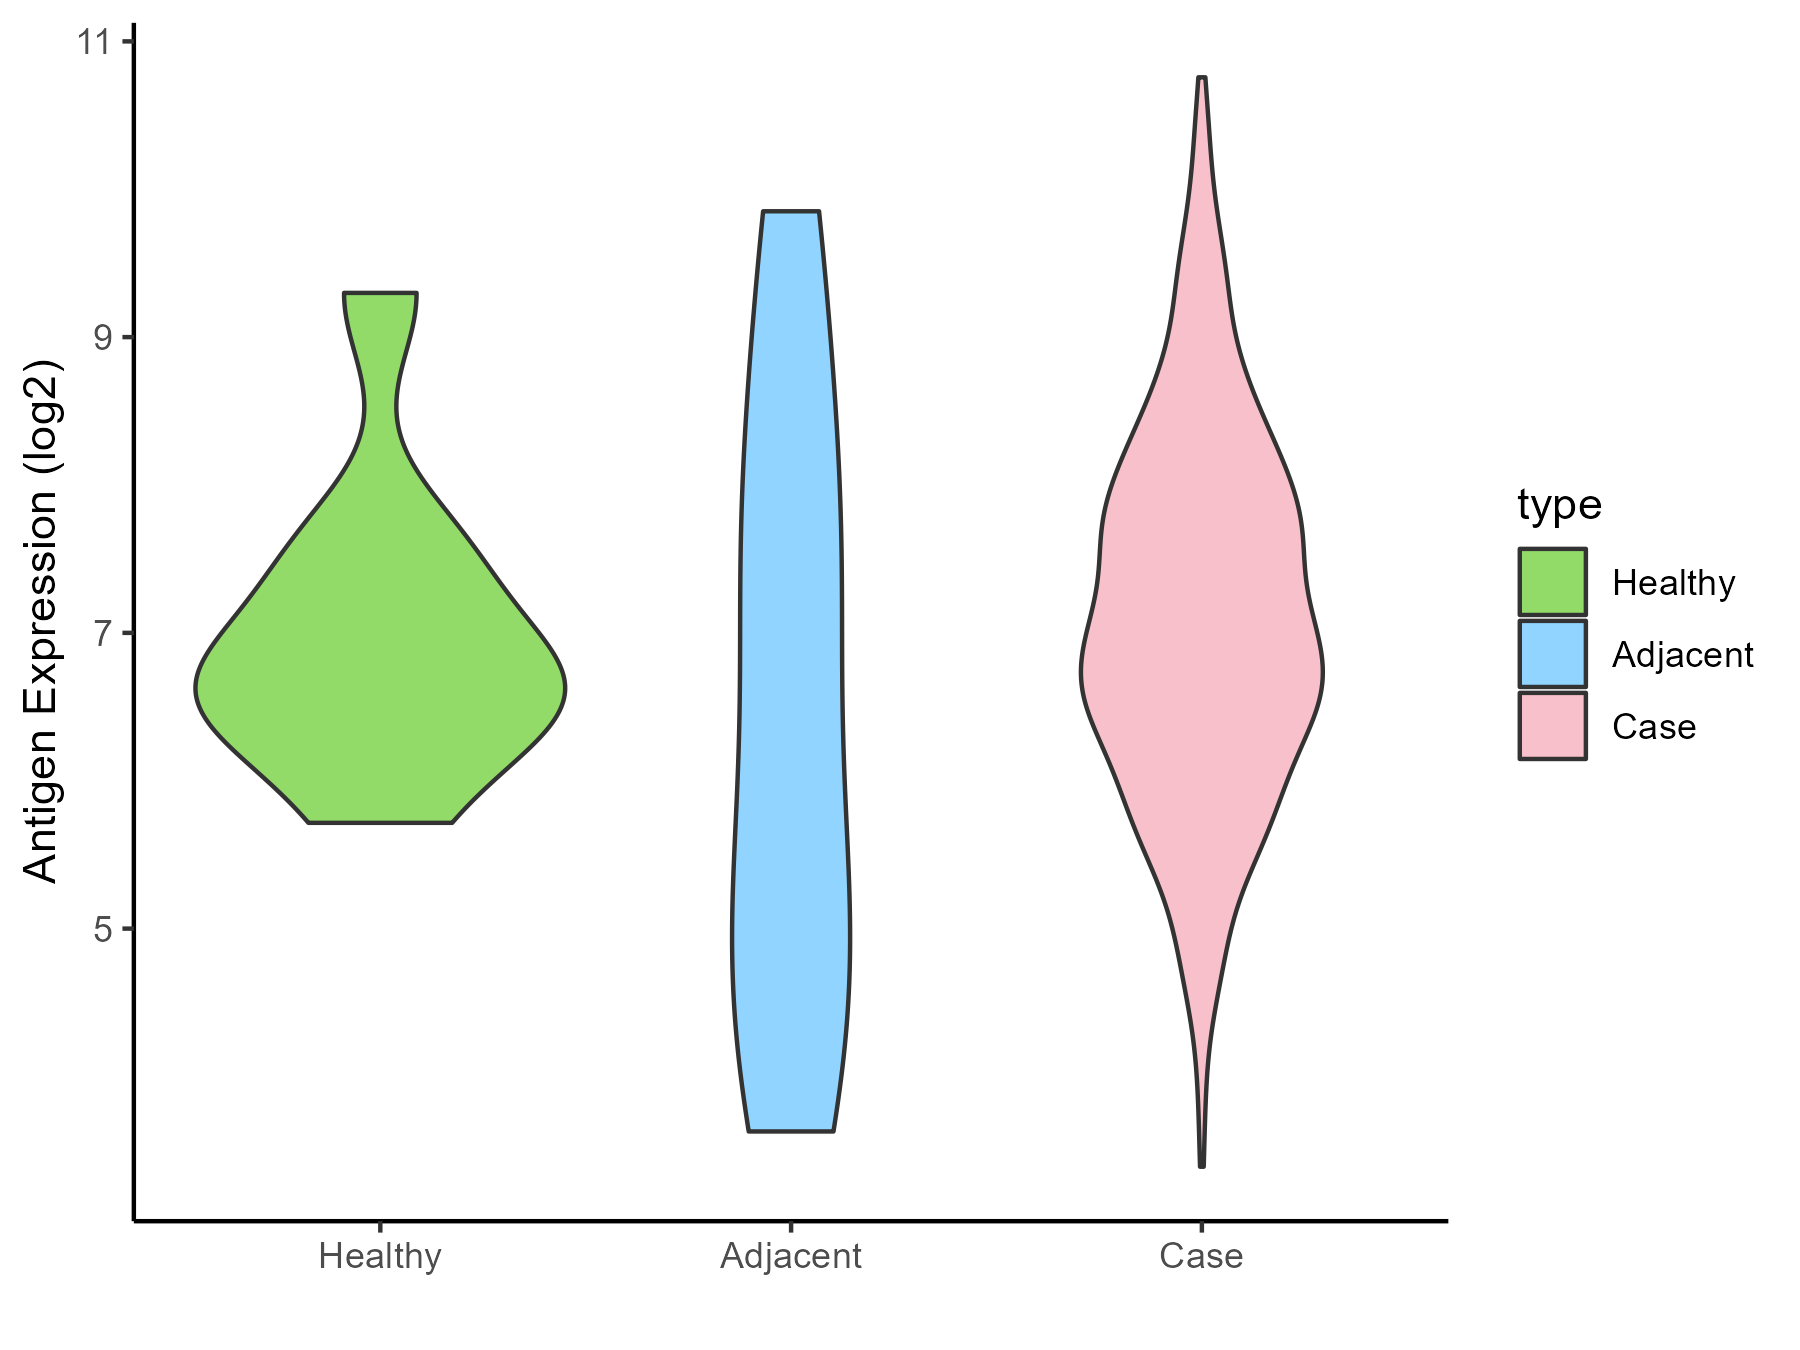
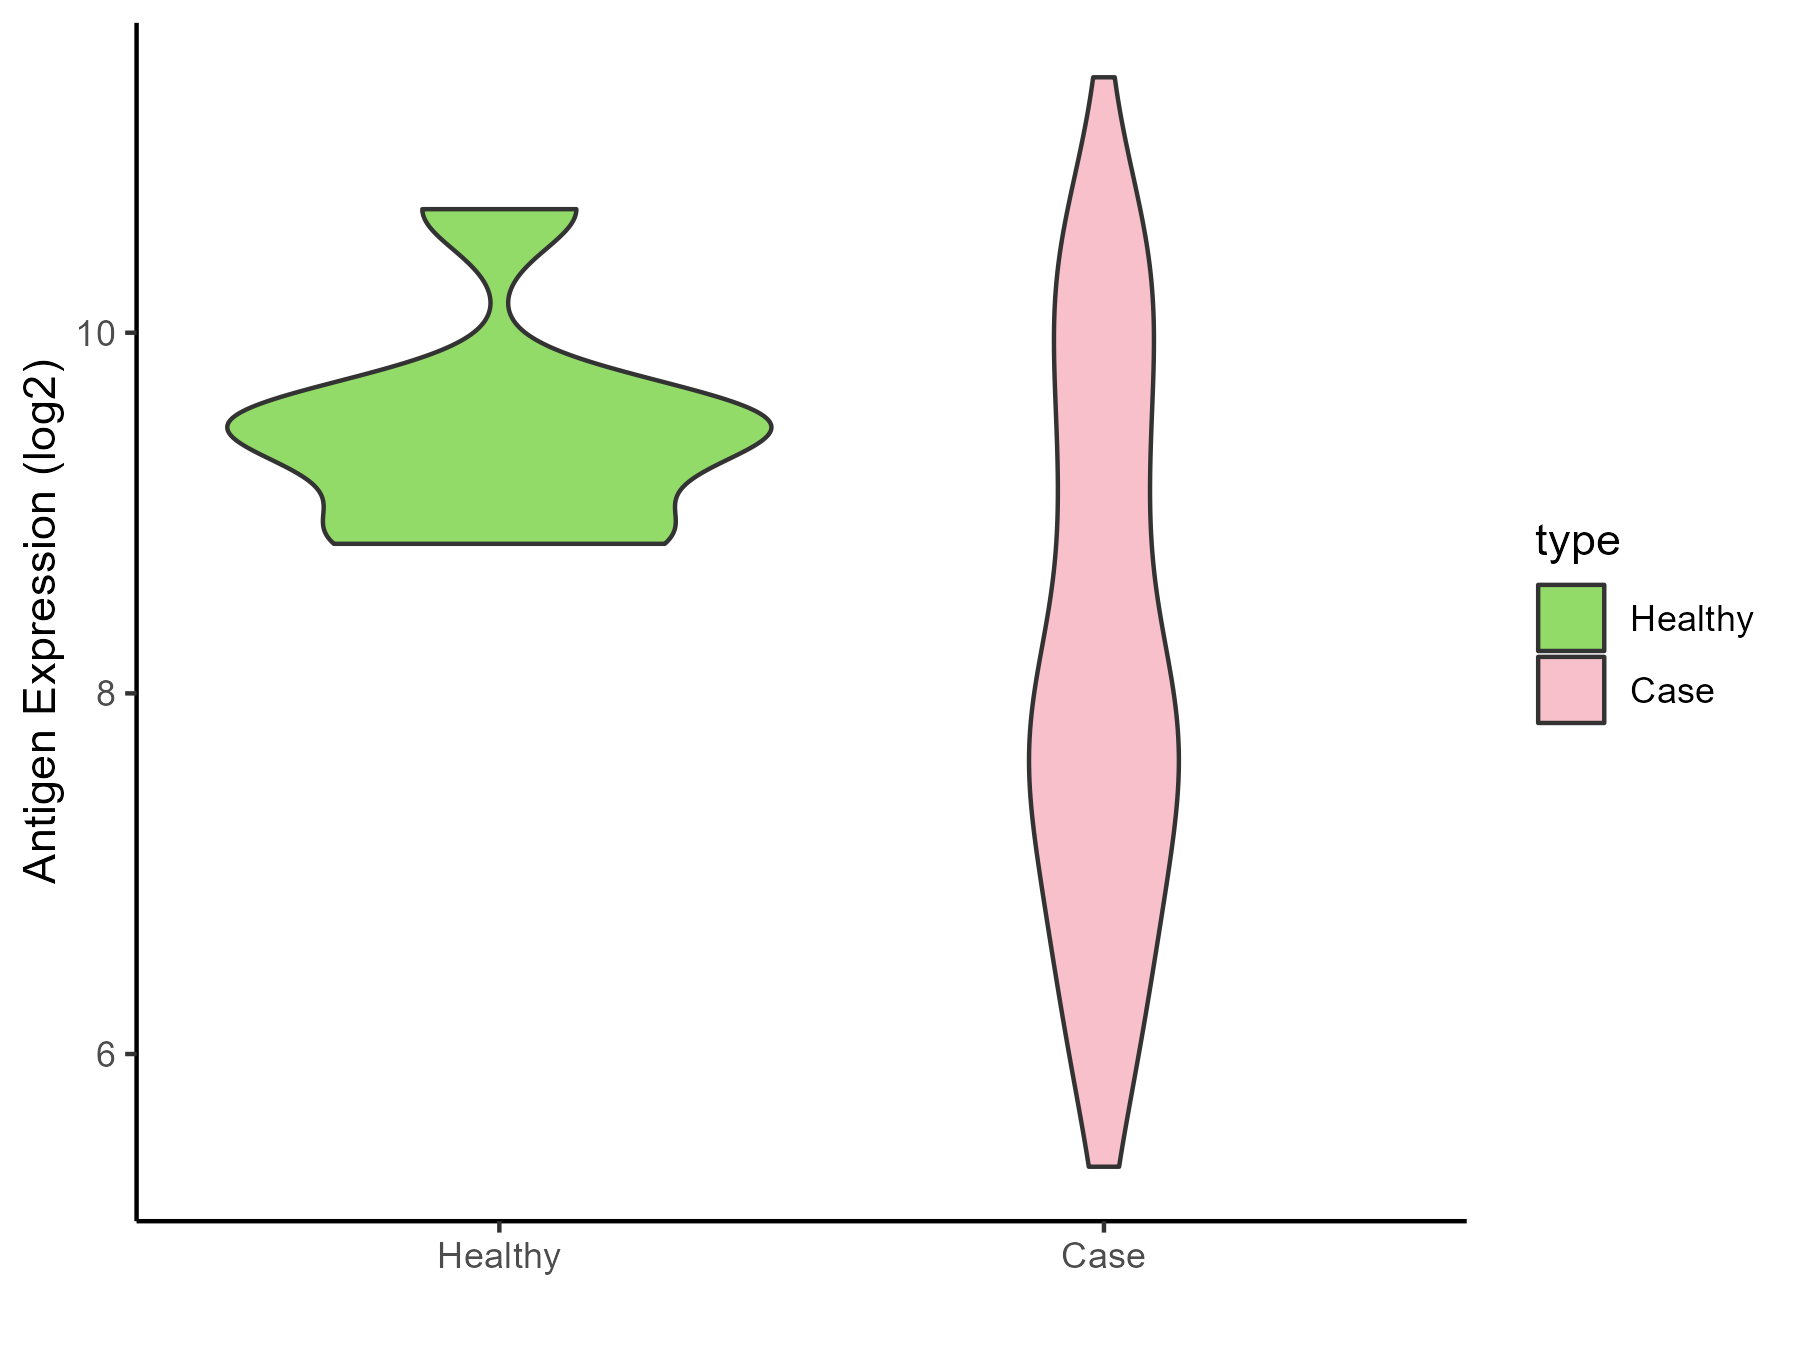
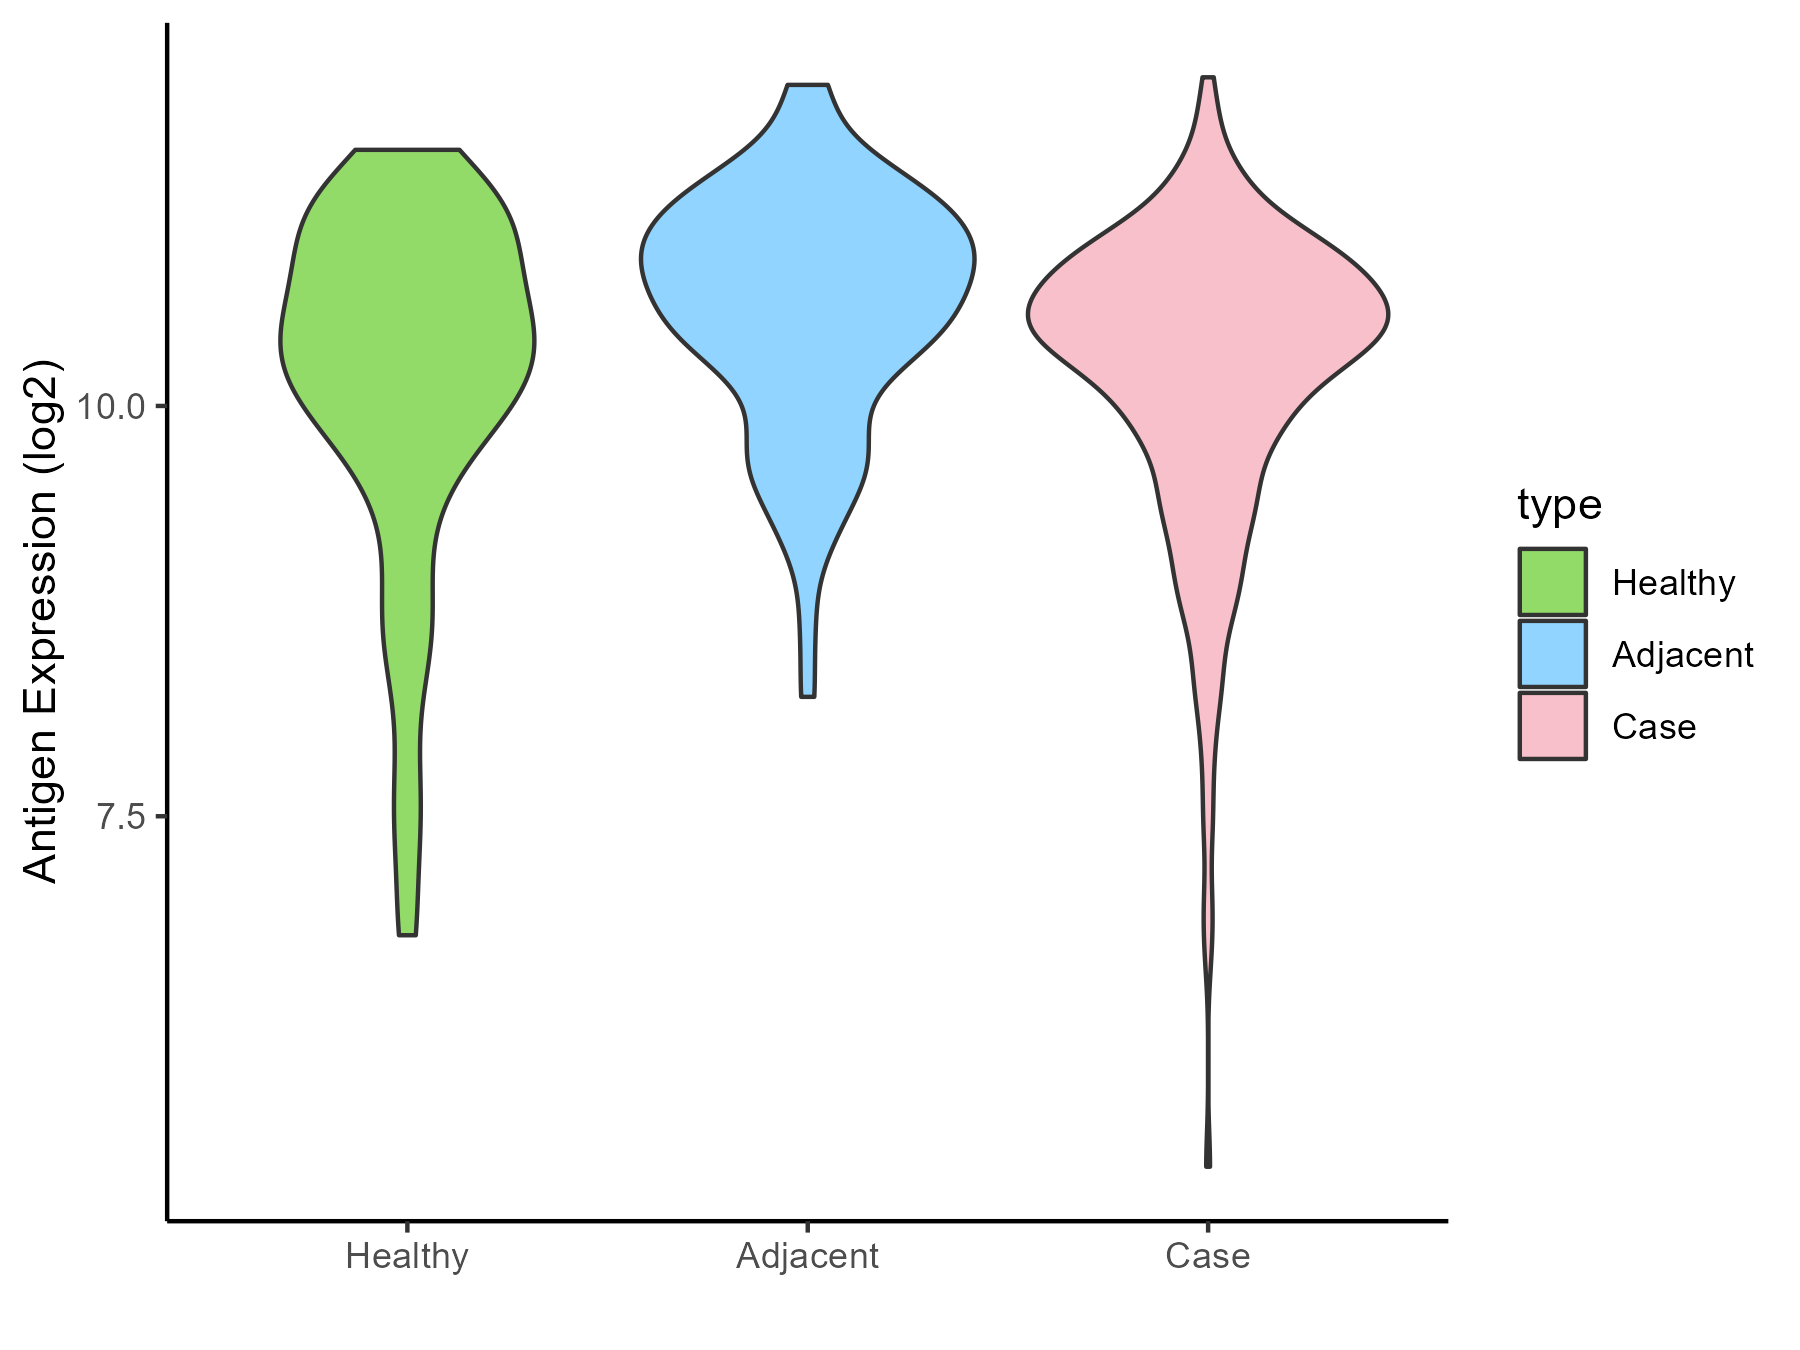
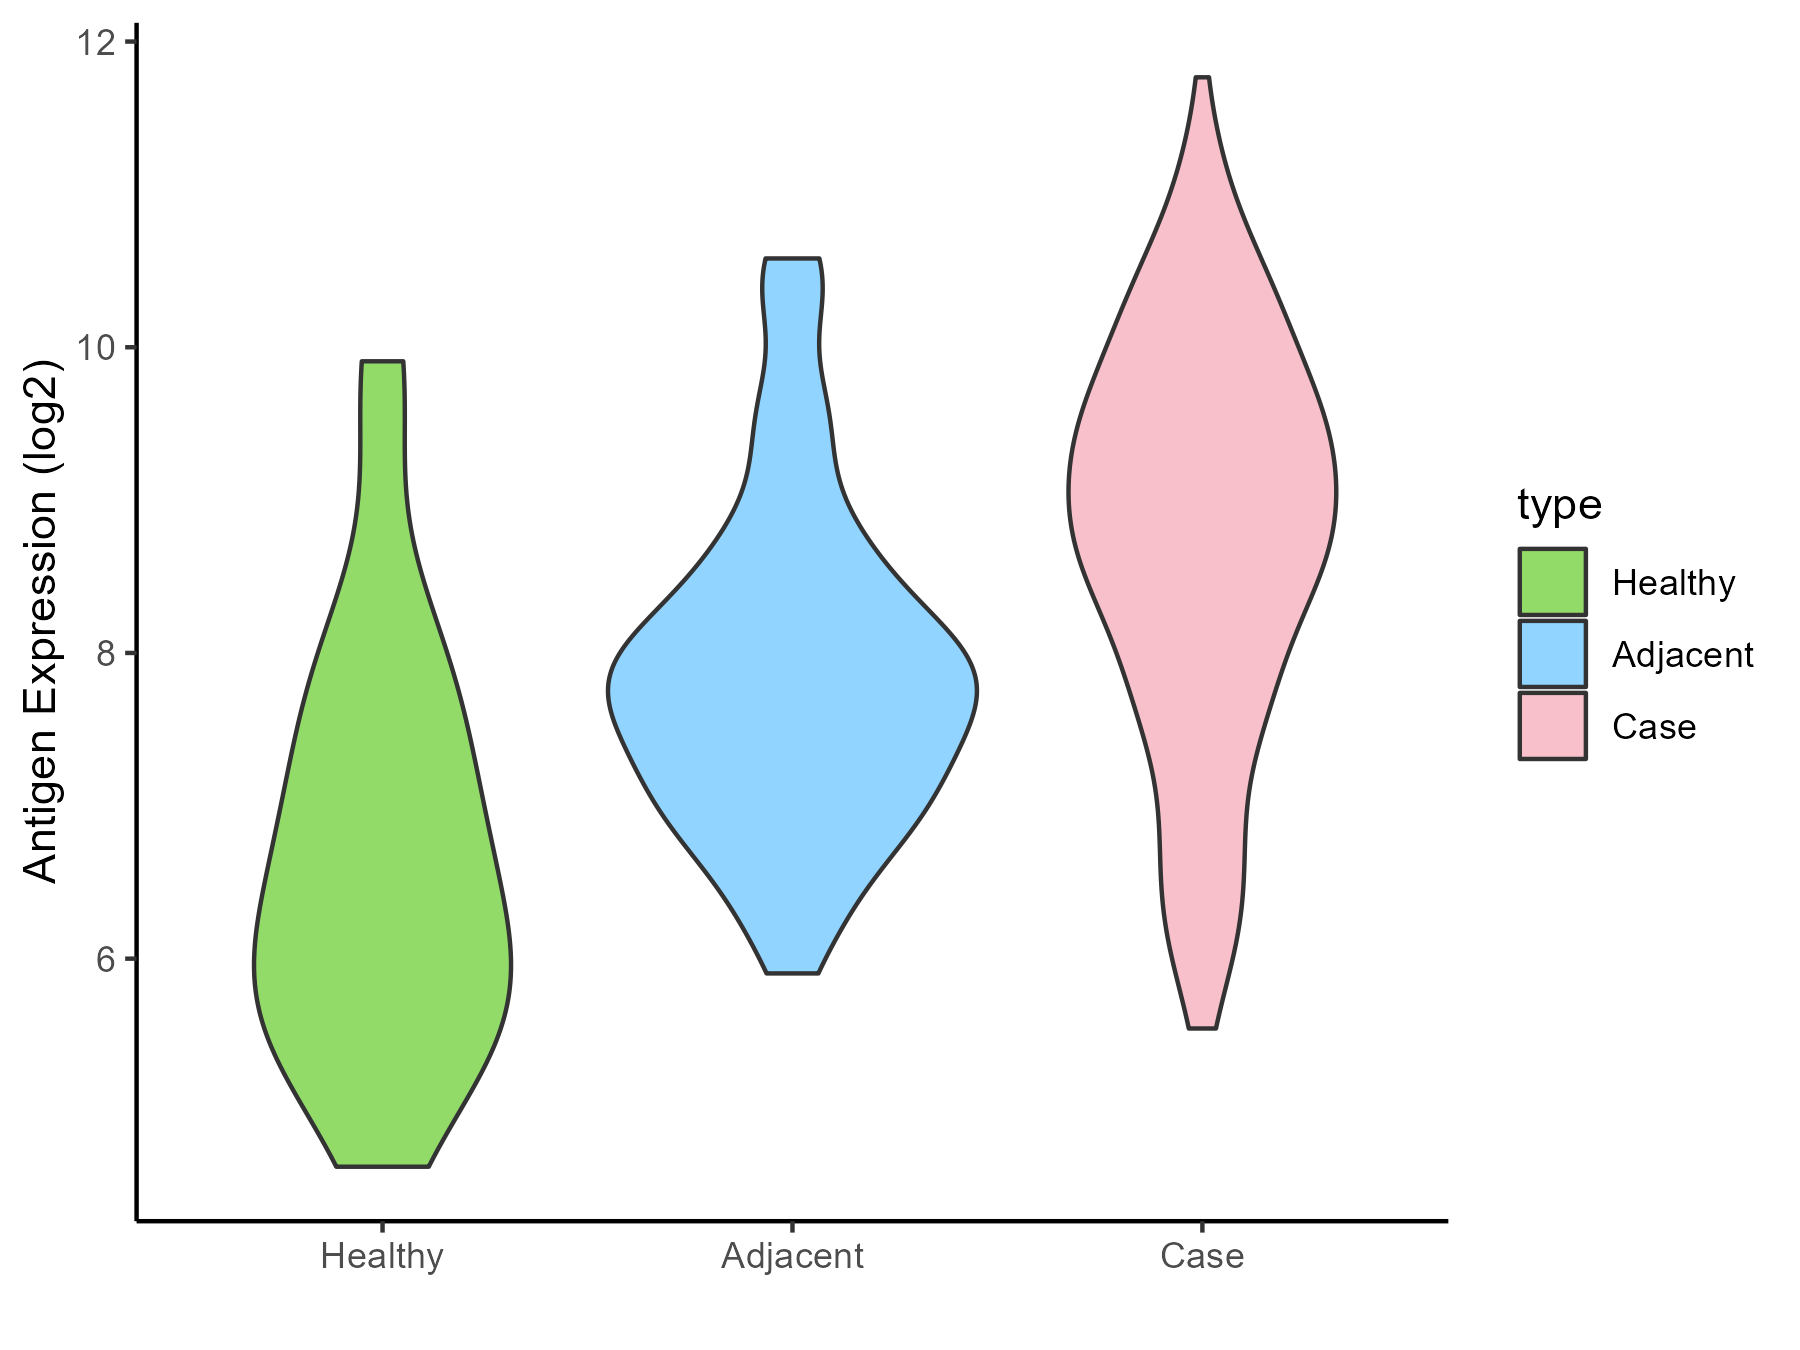
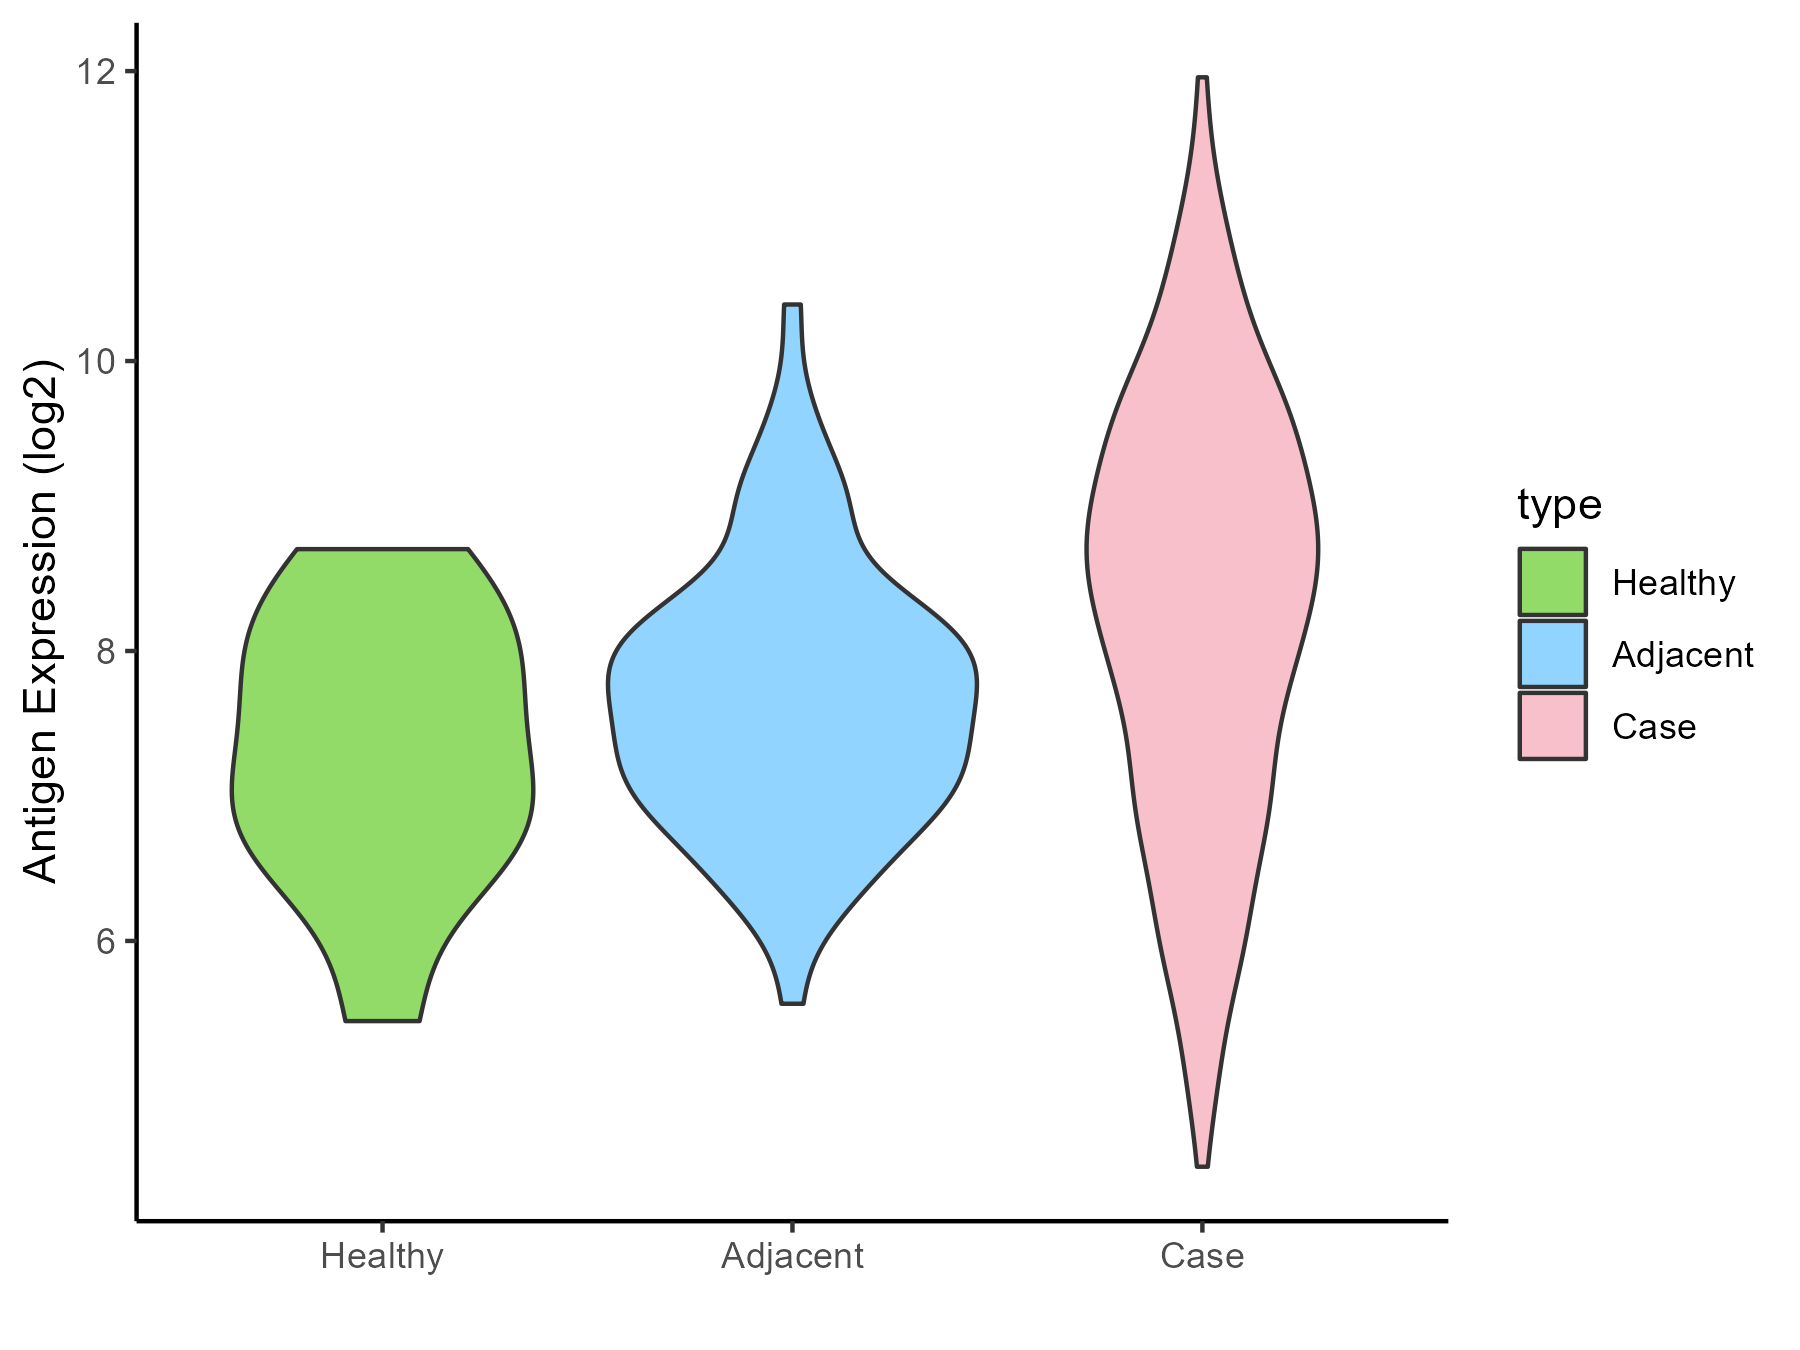
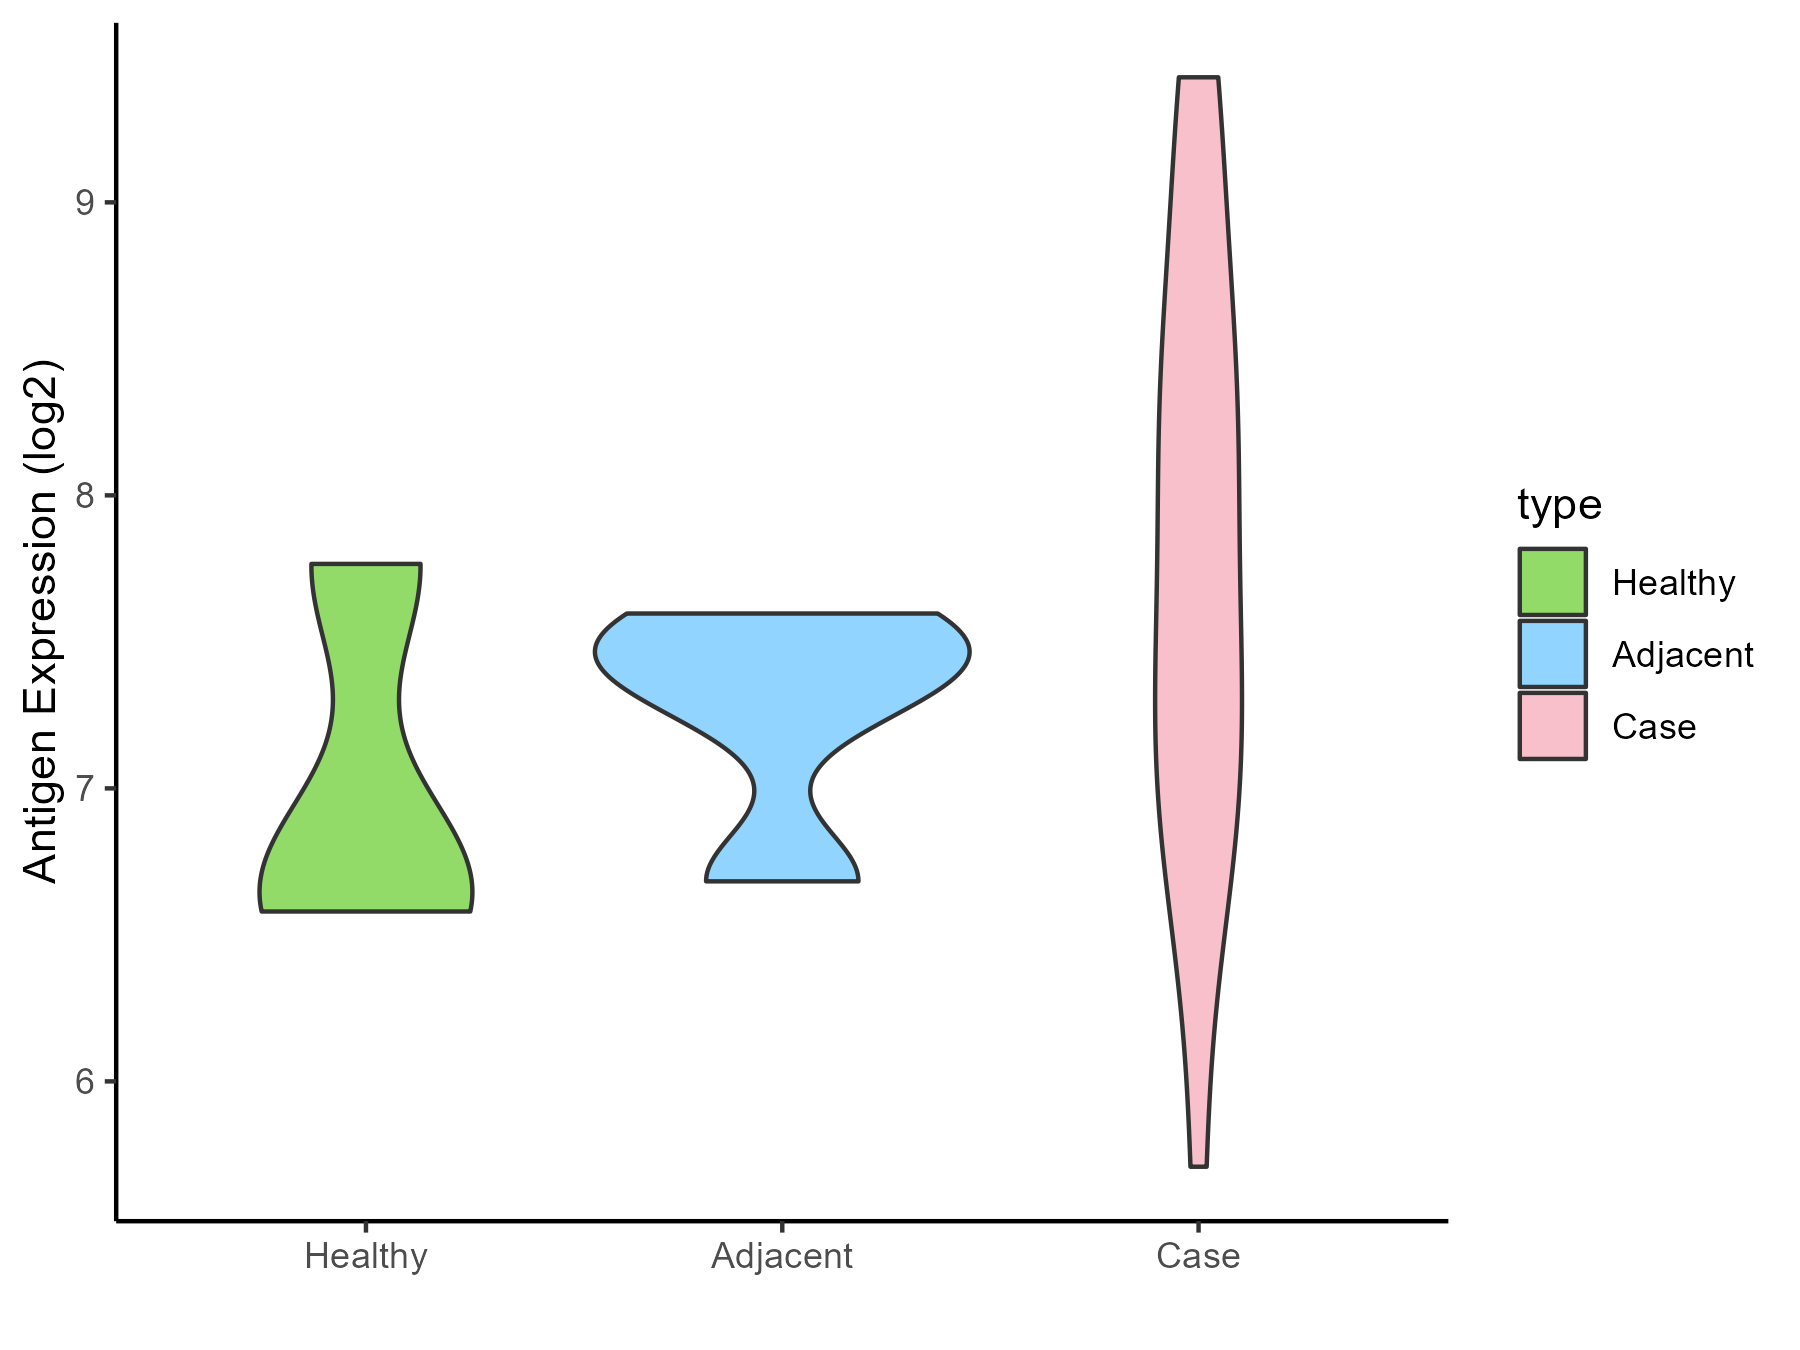
| Differential expression pattern of antigen in diseases | ||
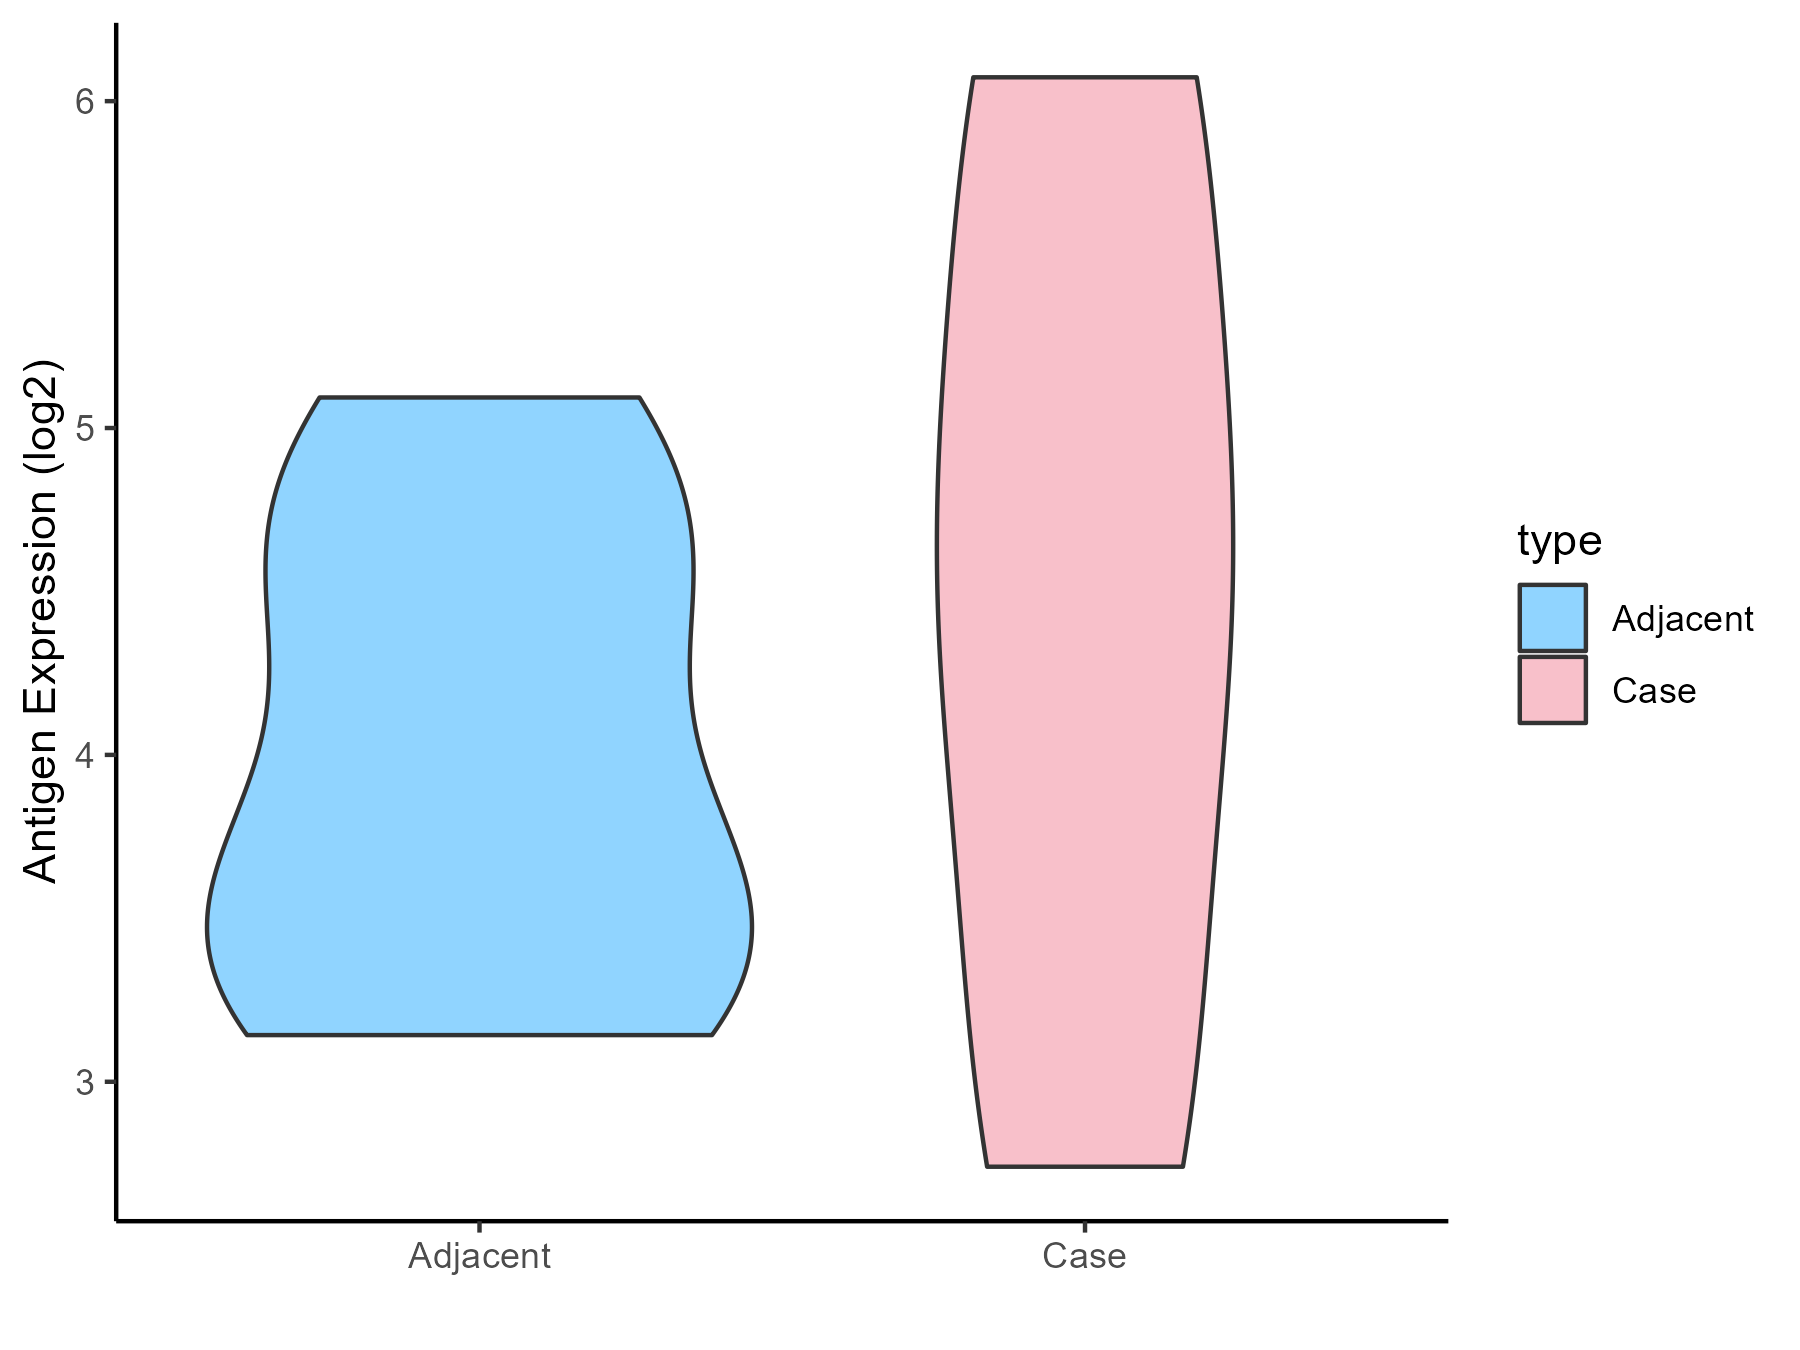
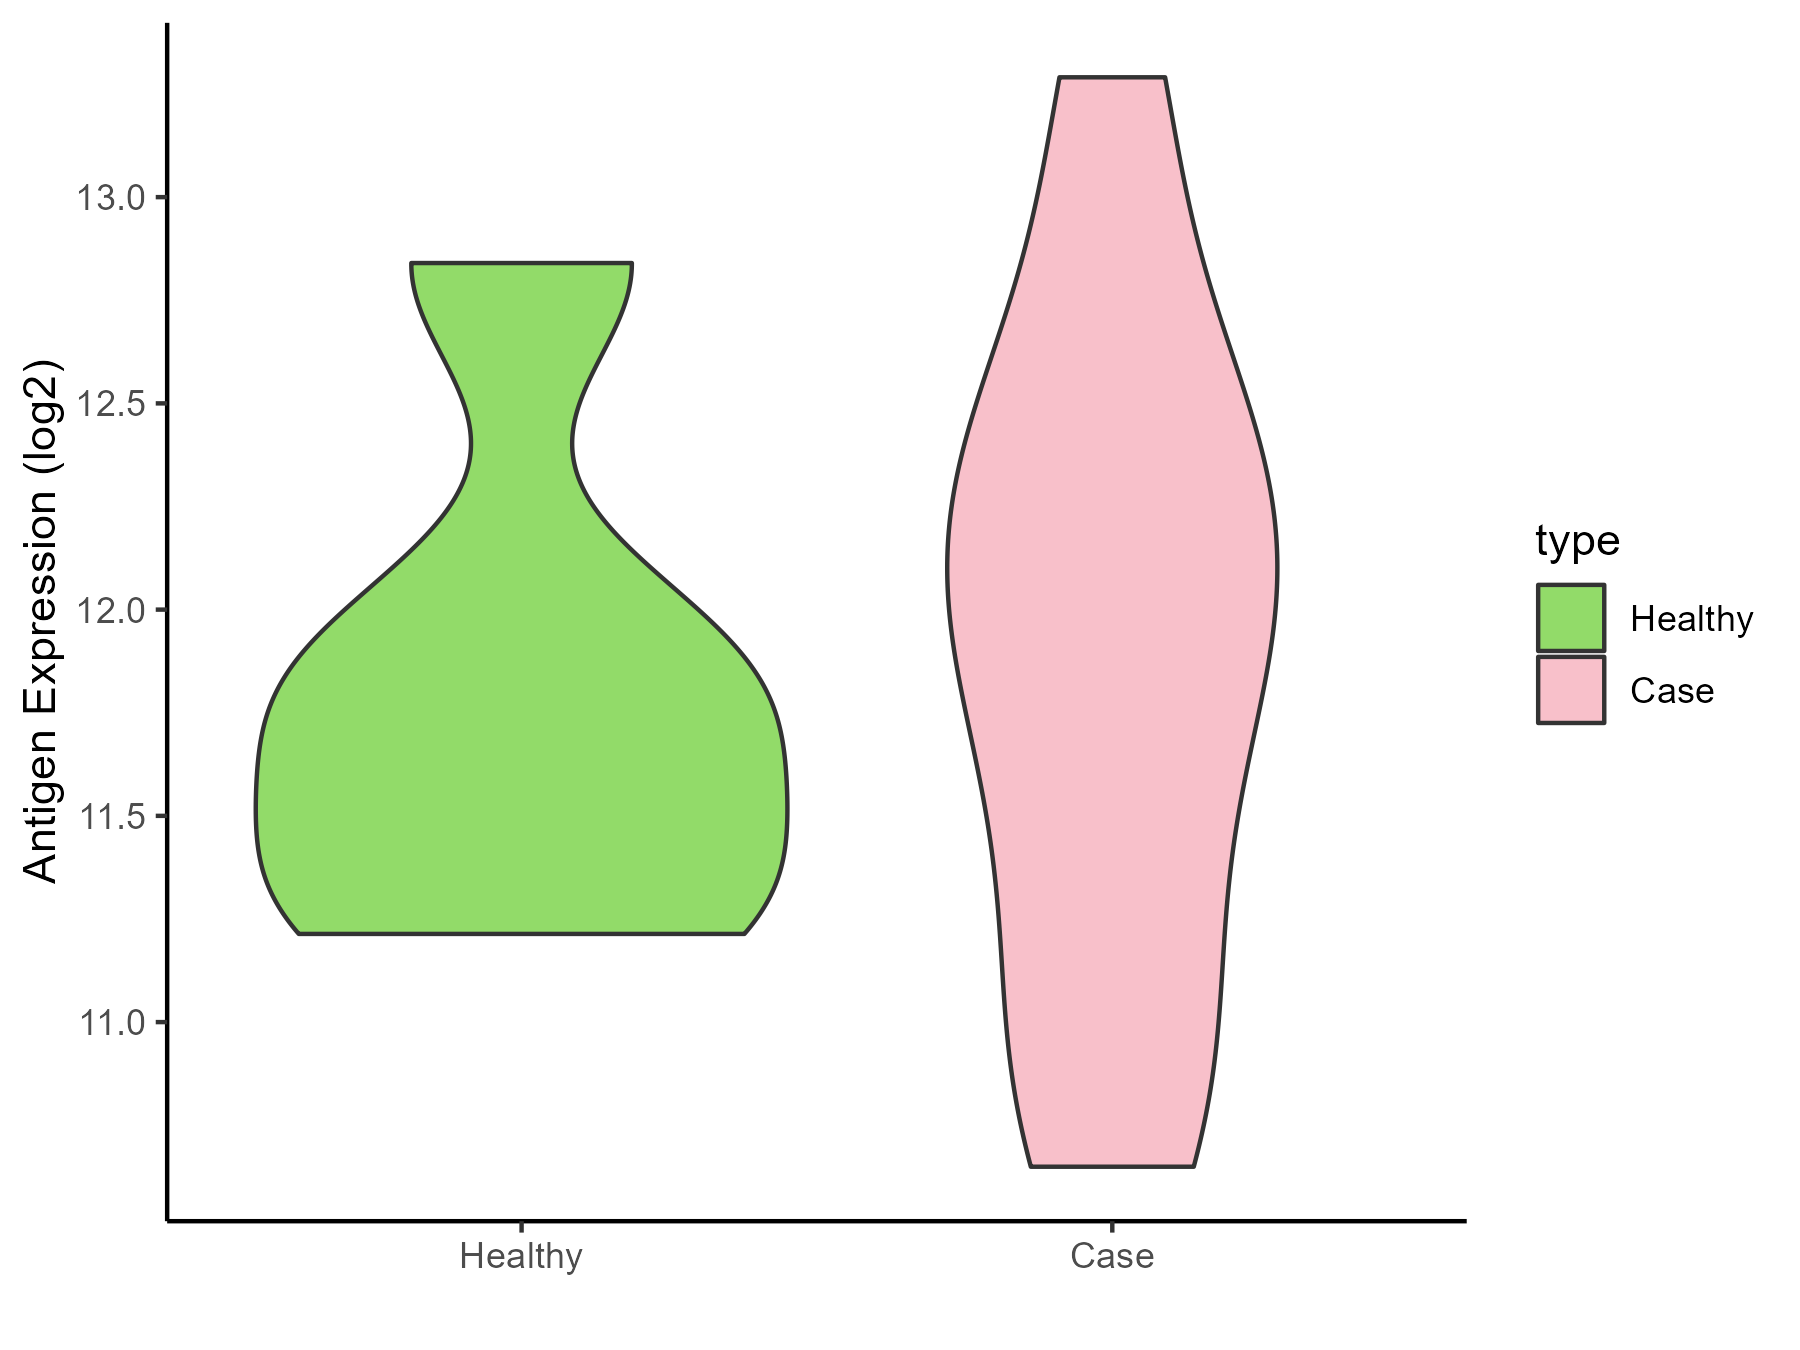
| The Studied Tissue | Bone marrow | |
| The Specific Disease | Myelodysplastic syndromes | |
| The Expression Level of Disease Section Compare with the Healthy Individual Tissue | p-value: 8.92E-05; Fold-change: 1.358702623; Z-score: 0.959703295 | |
| The Expression Level of Disease Section Compare with the Adjacent Tissue | p-value: 8.21E-06; Fold-change: 3.027351963; Z-score: 9.152786335 | |
| Disease-specific Antigen Abundances |
|
Click to View the Clearer Original Diagram |
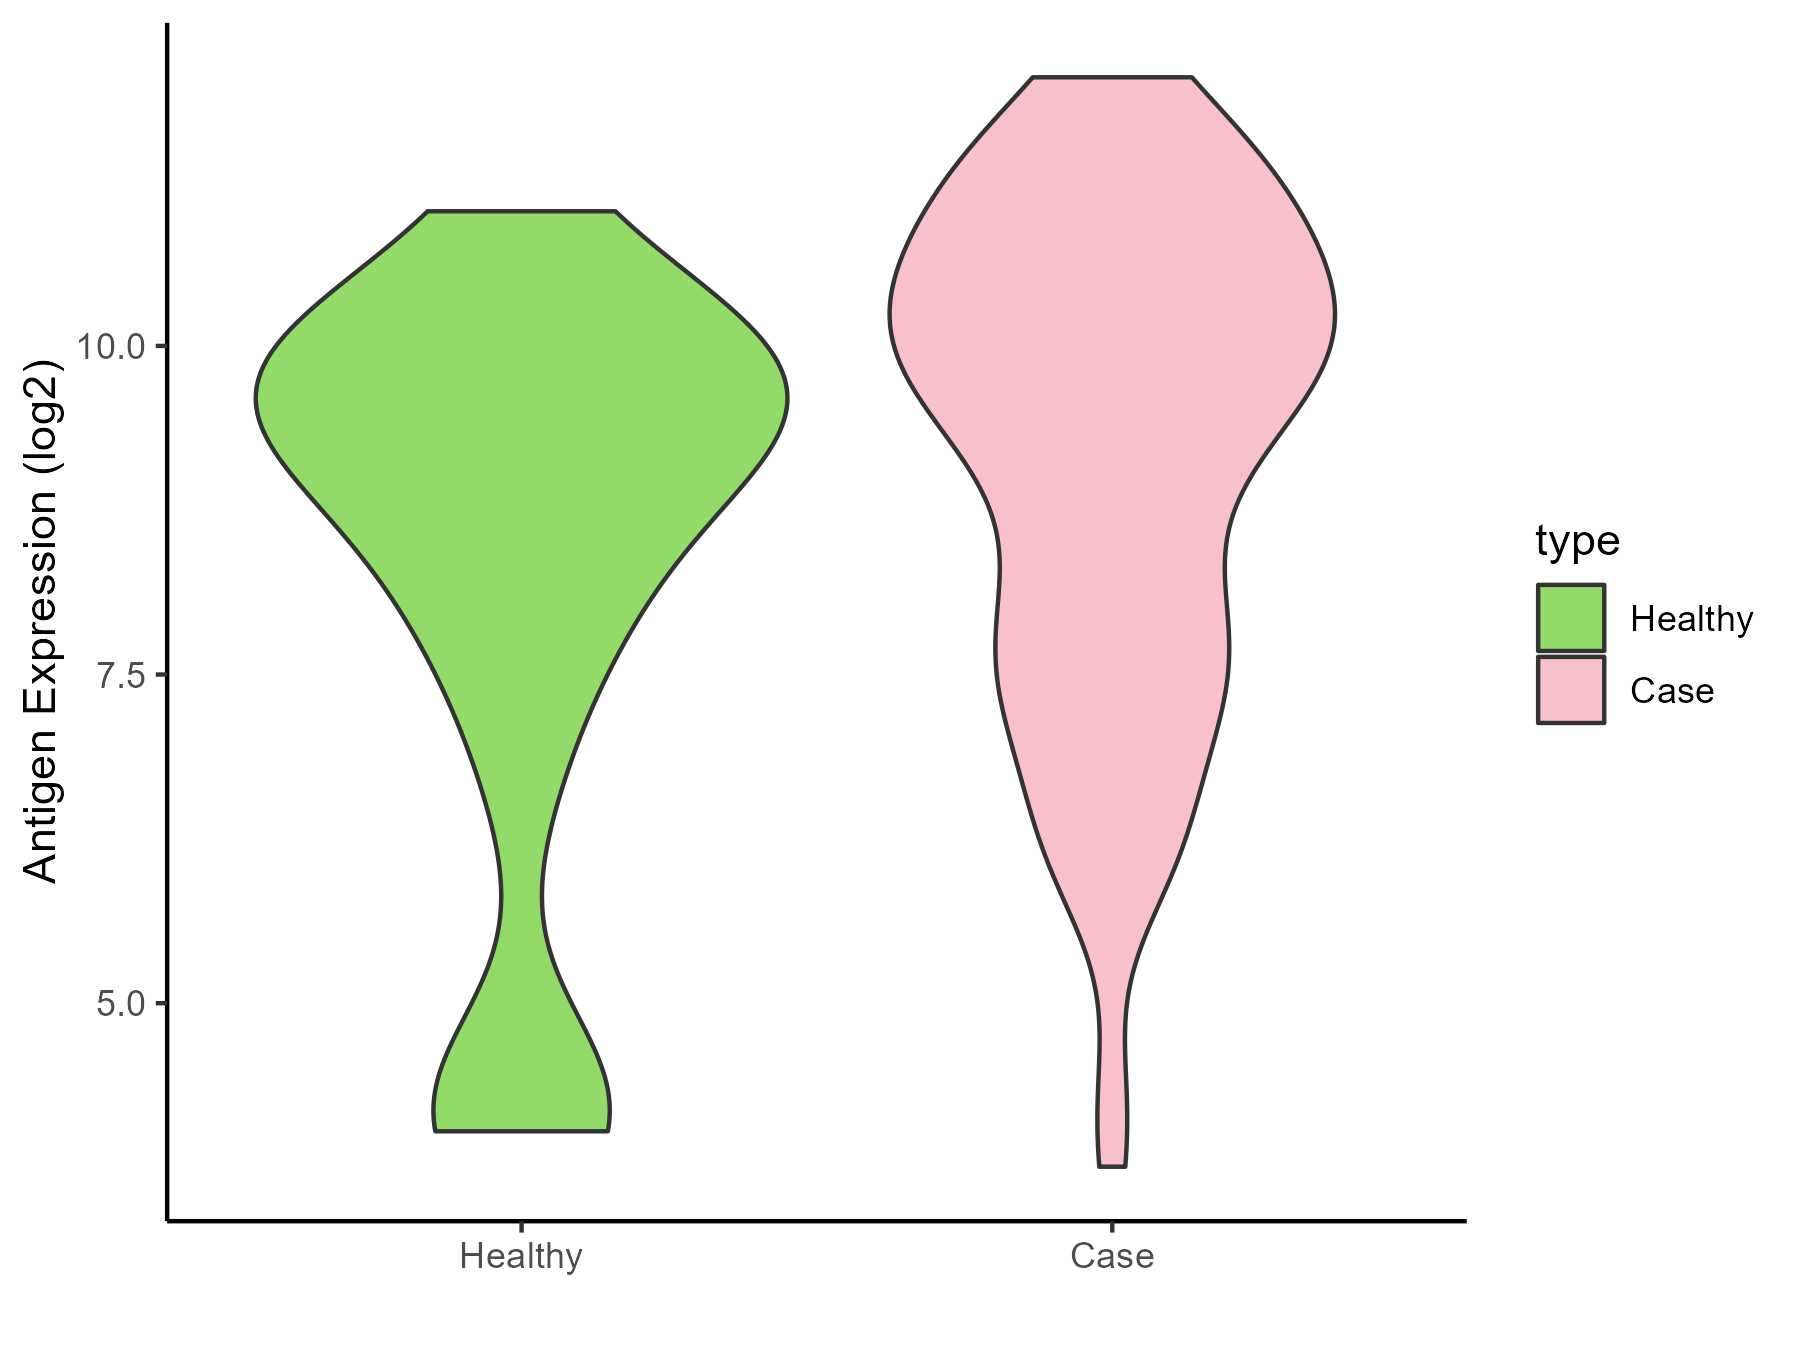
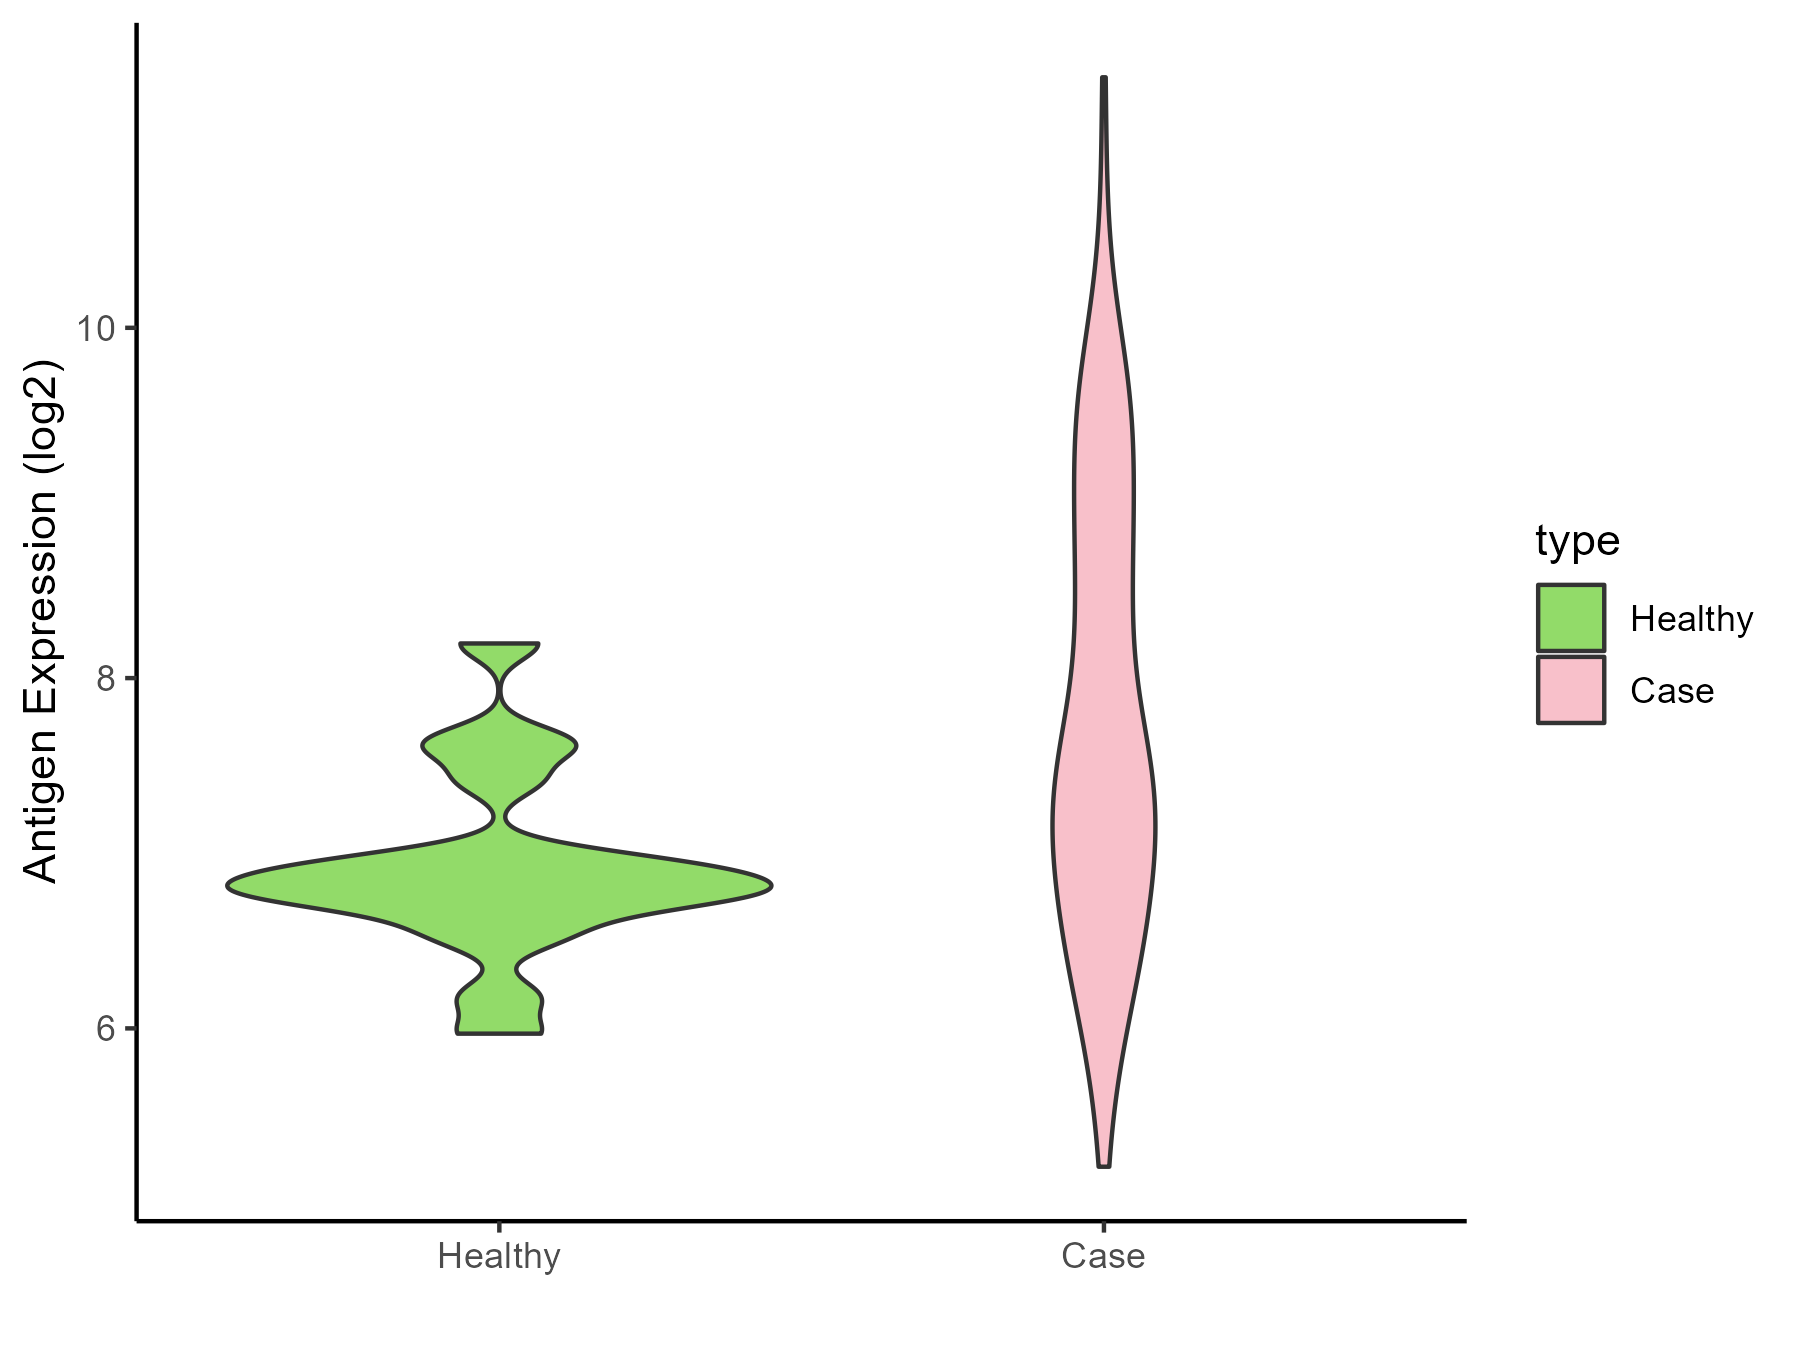
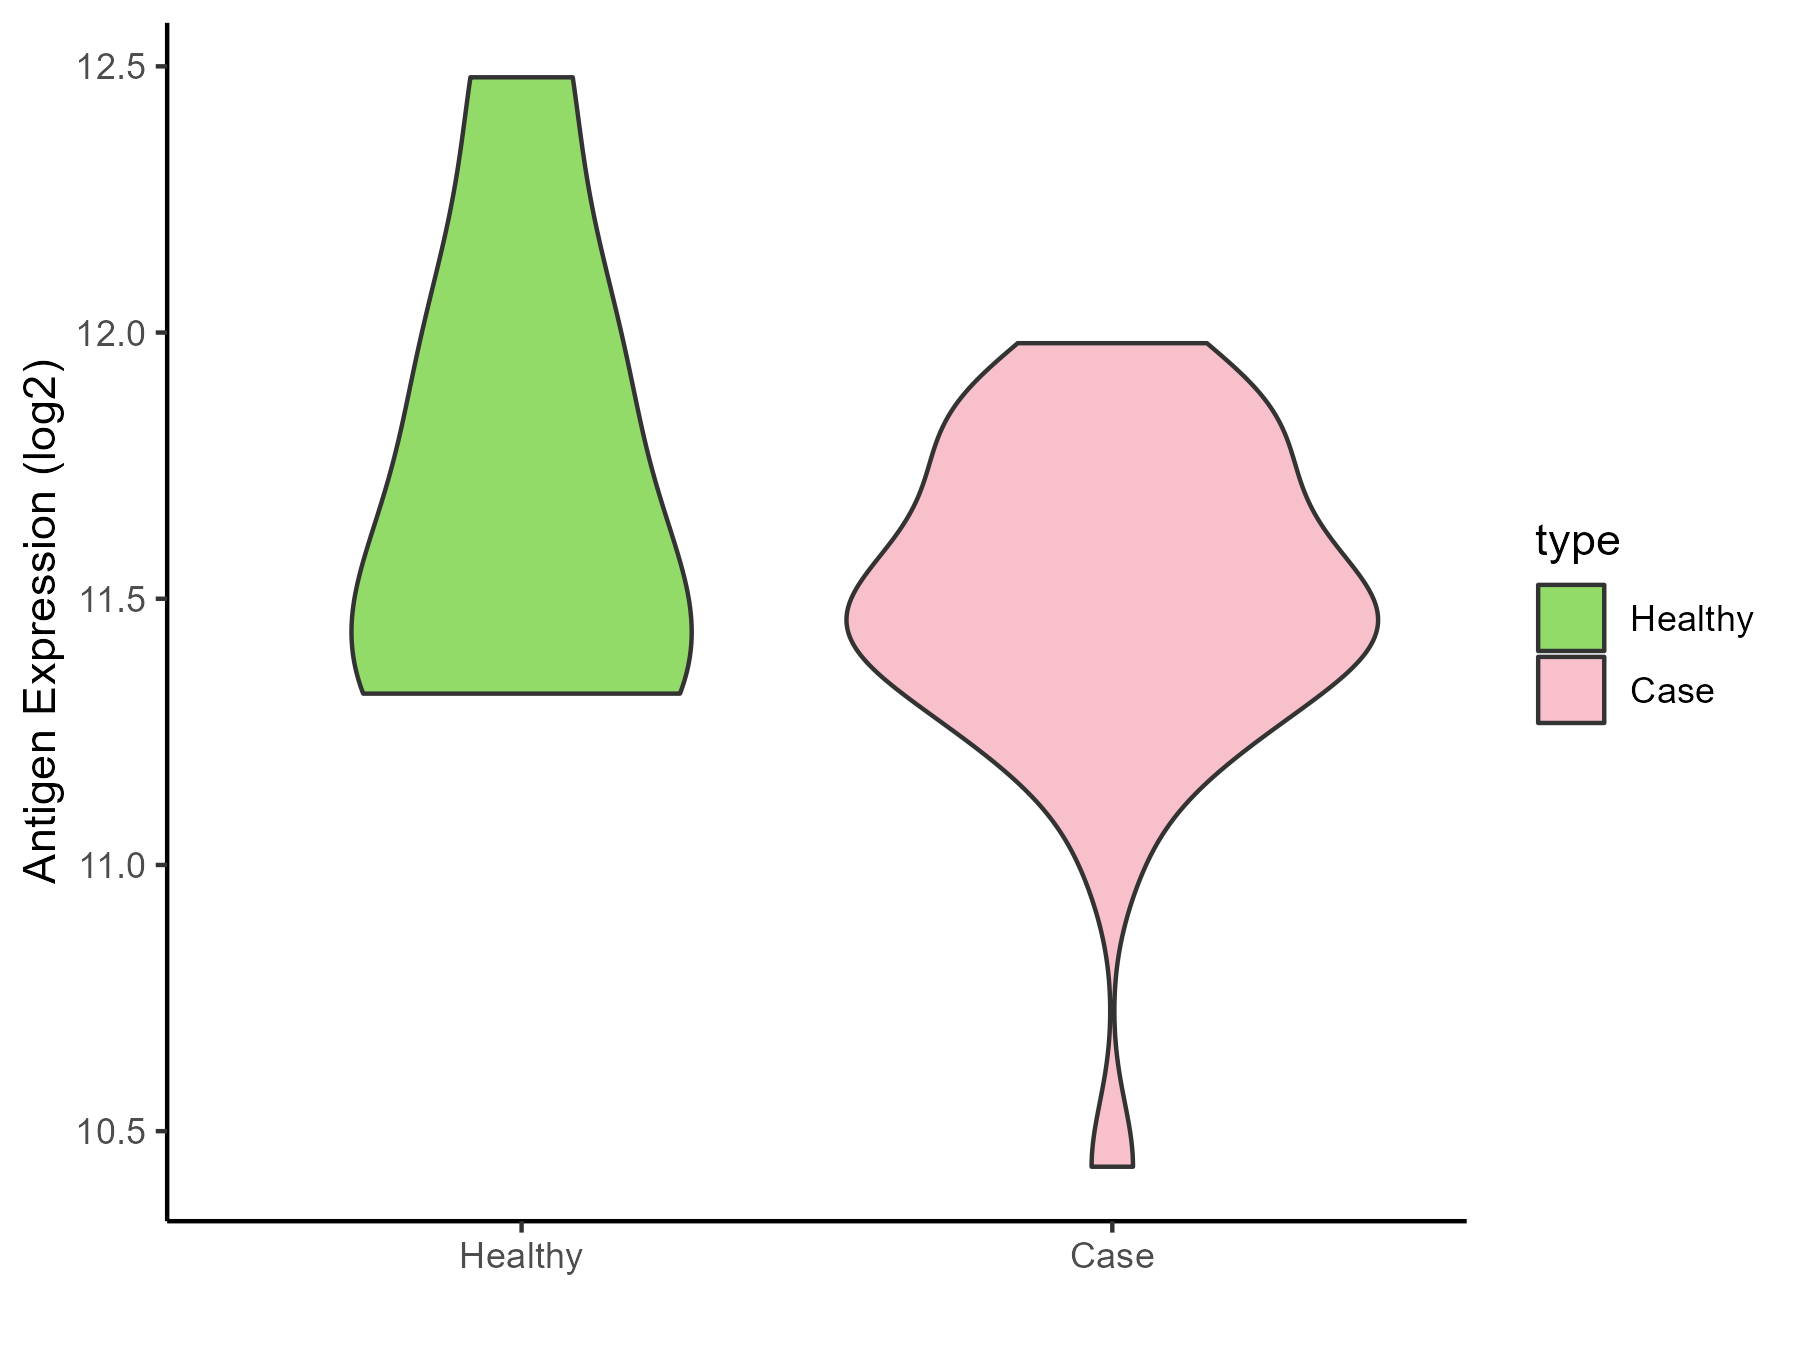
| Differential expression pattern of antigen in diseases | ||
| The Studied Tissue | Tonsil | |
| The Specific Disease | Lymphoma | |
| The Expression Level of Disease Section Compare with the Healthy Individual Tissue | p-value: 0.221424235; Fold-change: 0.159940221; Z-score: 1.026289172 | |
| Disease-specific Antigen Abundances |
|
Click to View the Clearer Original Diagram |
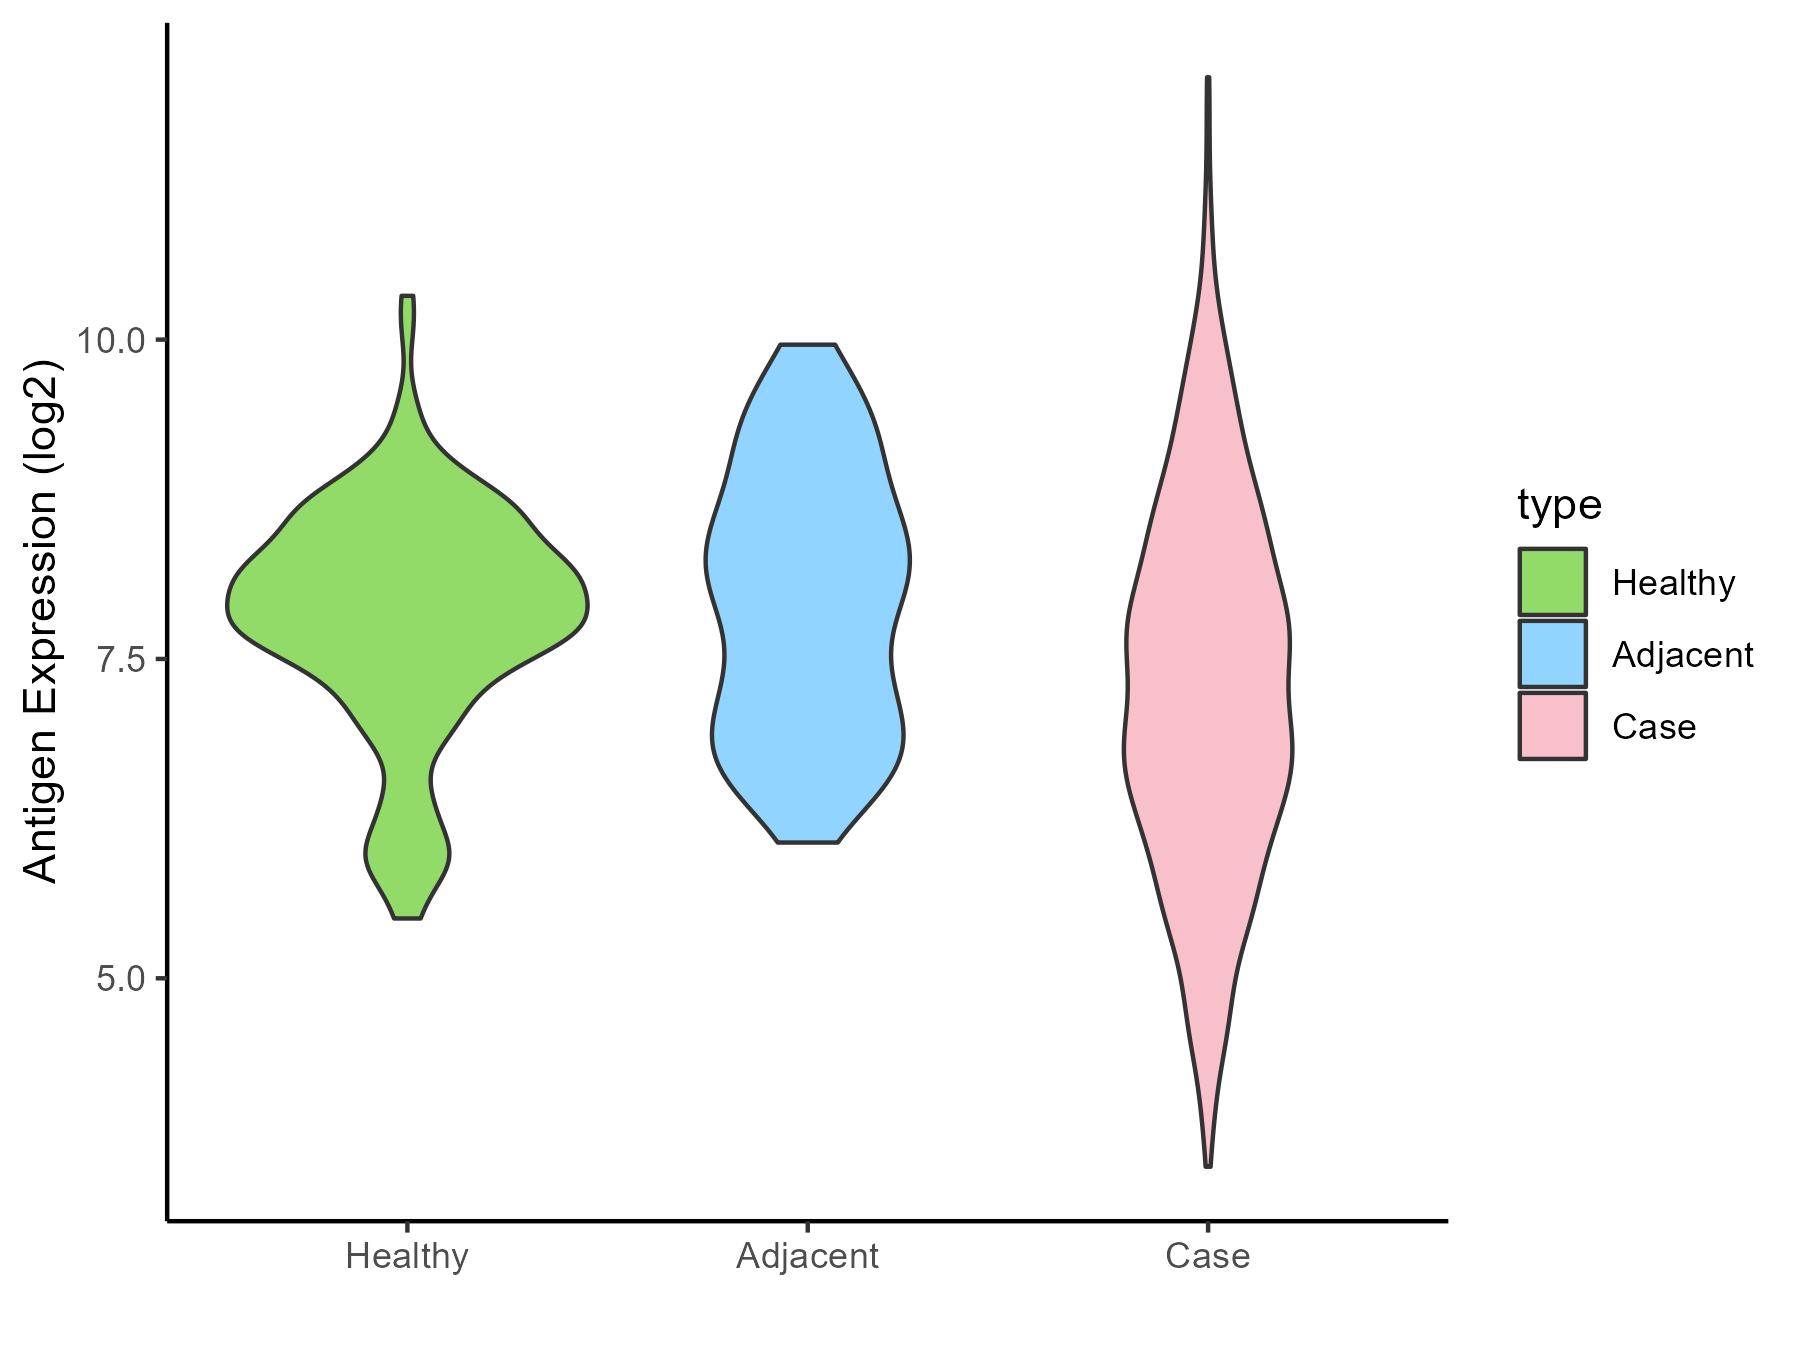
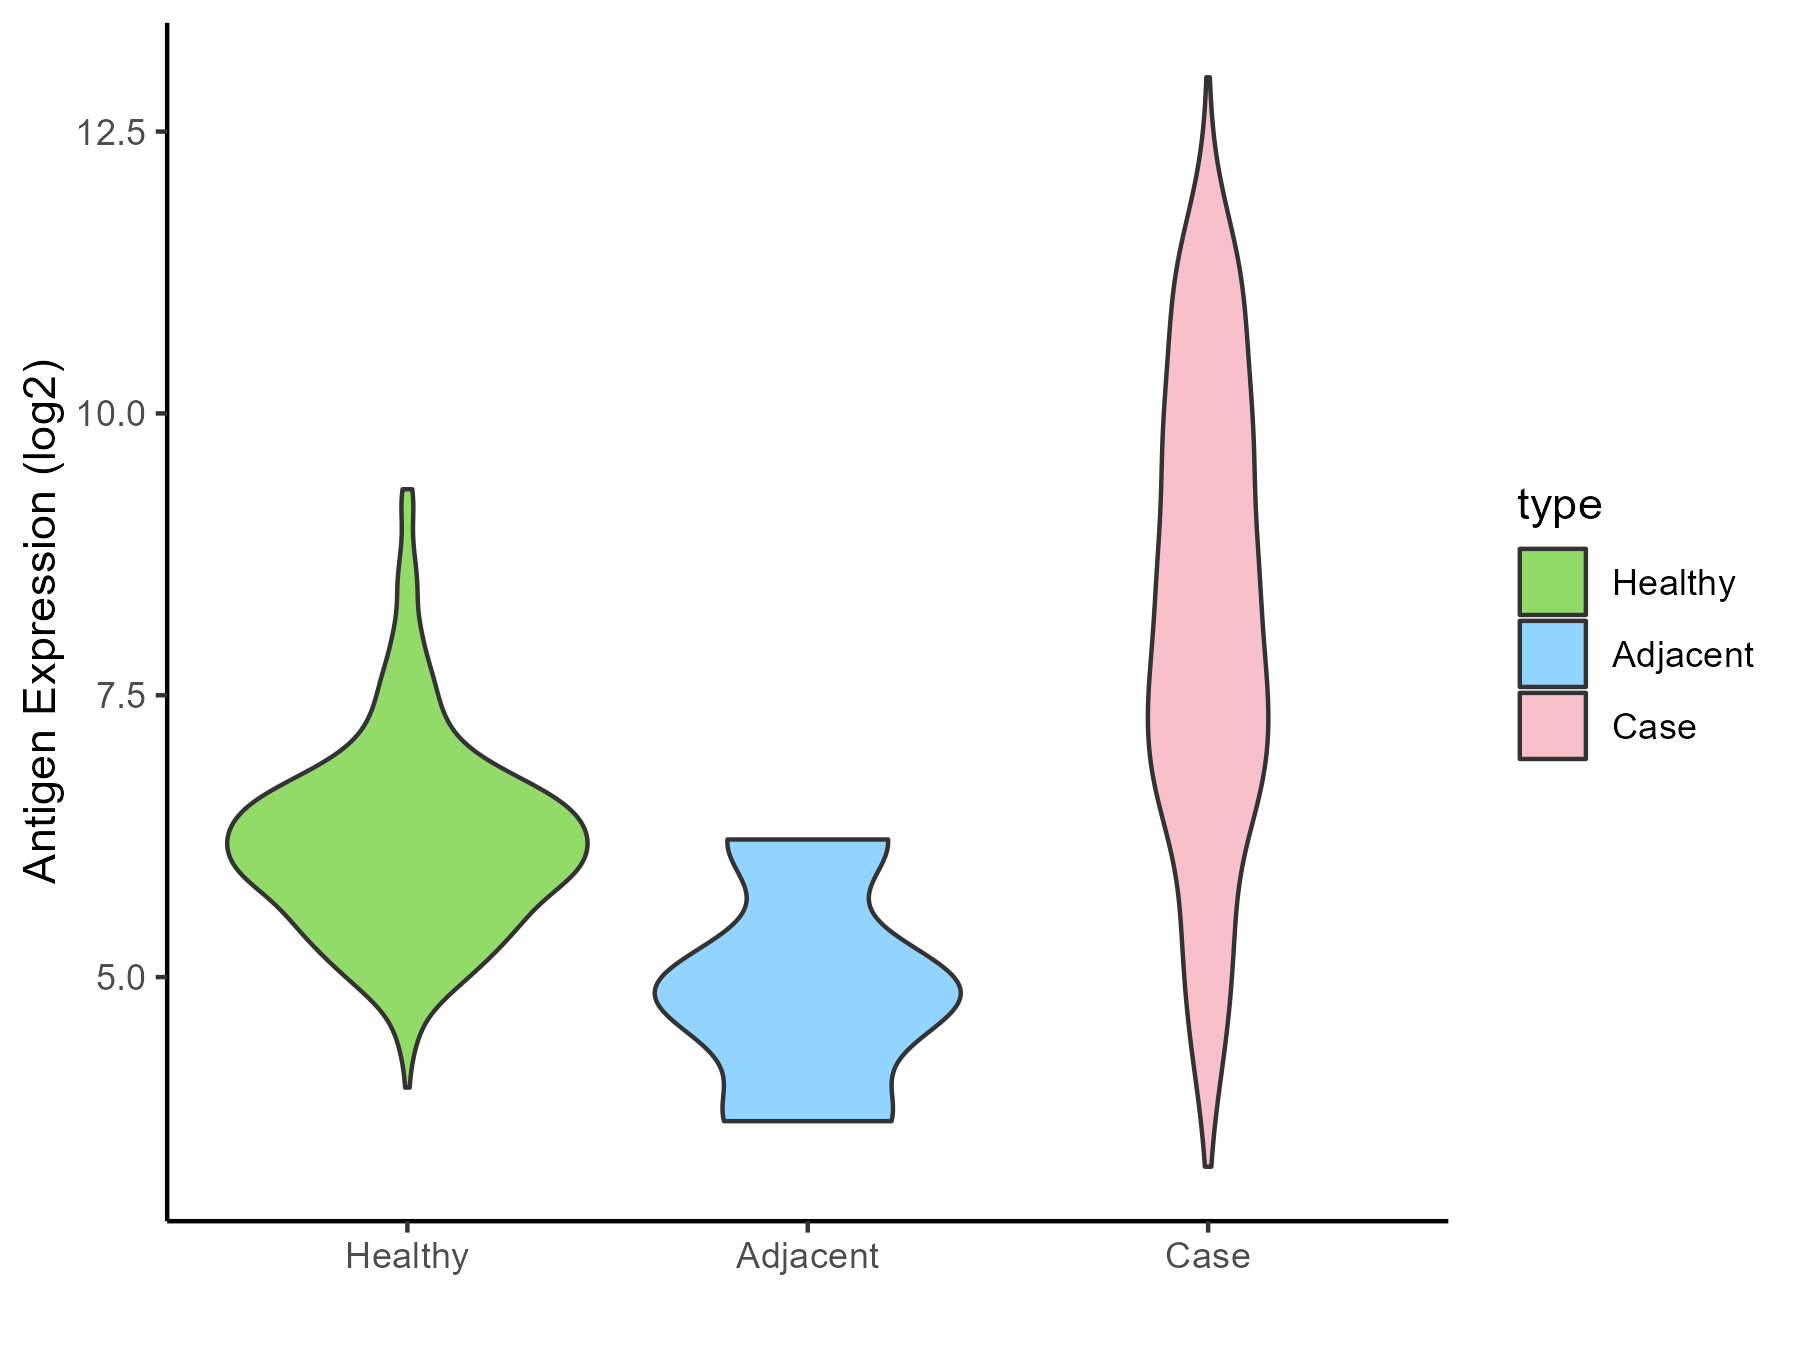
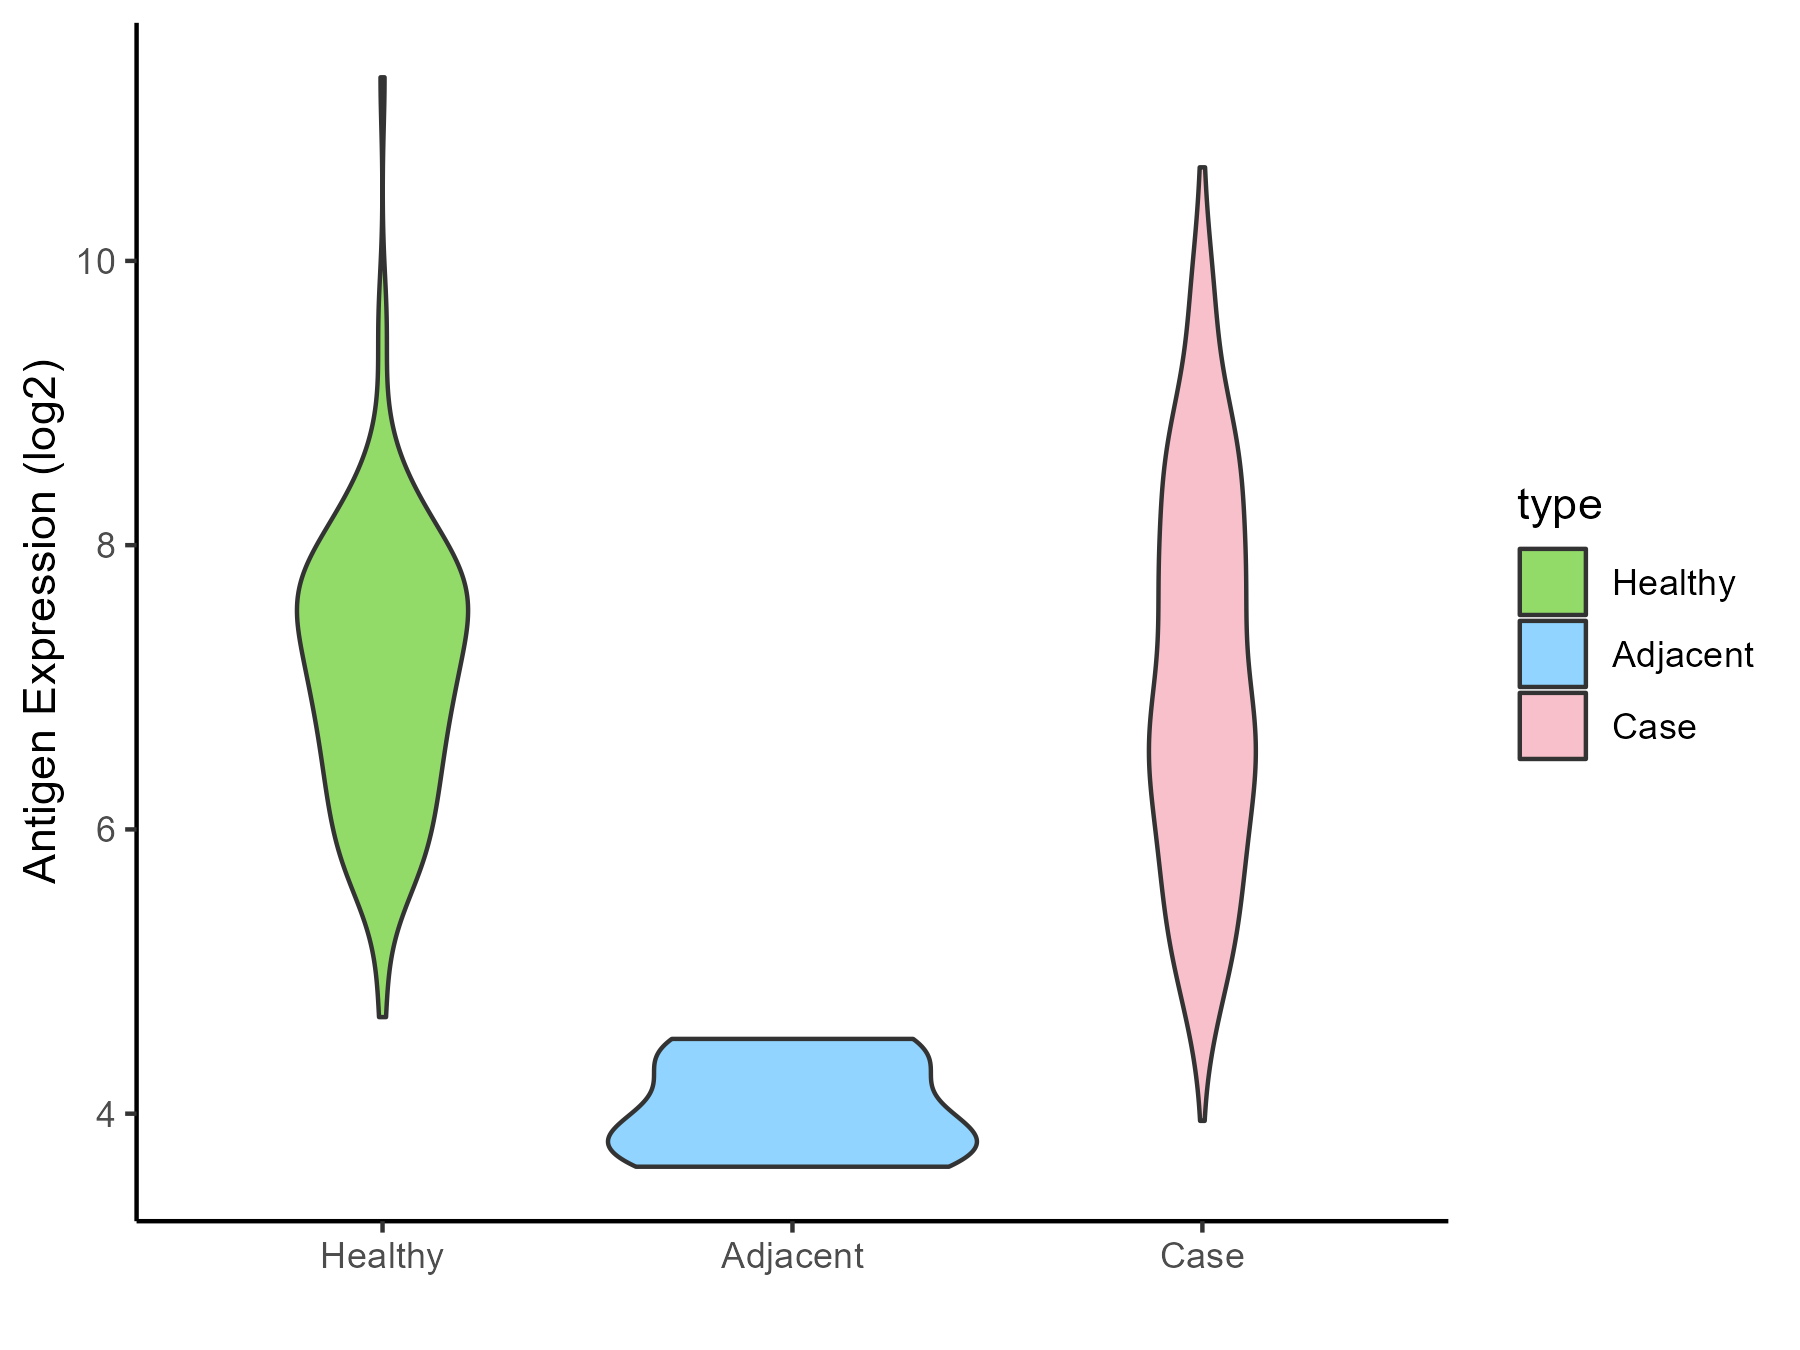
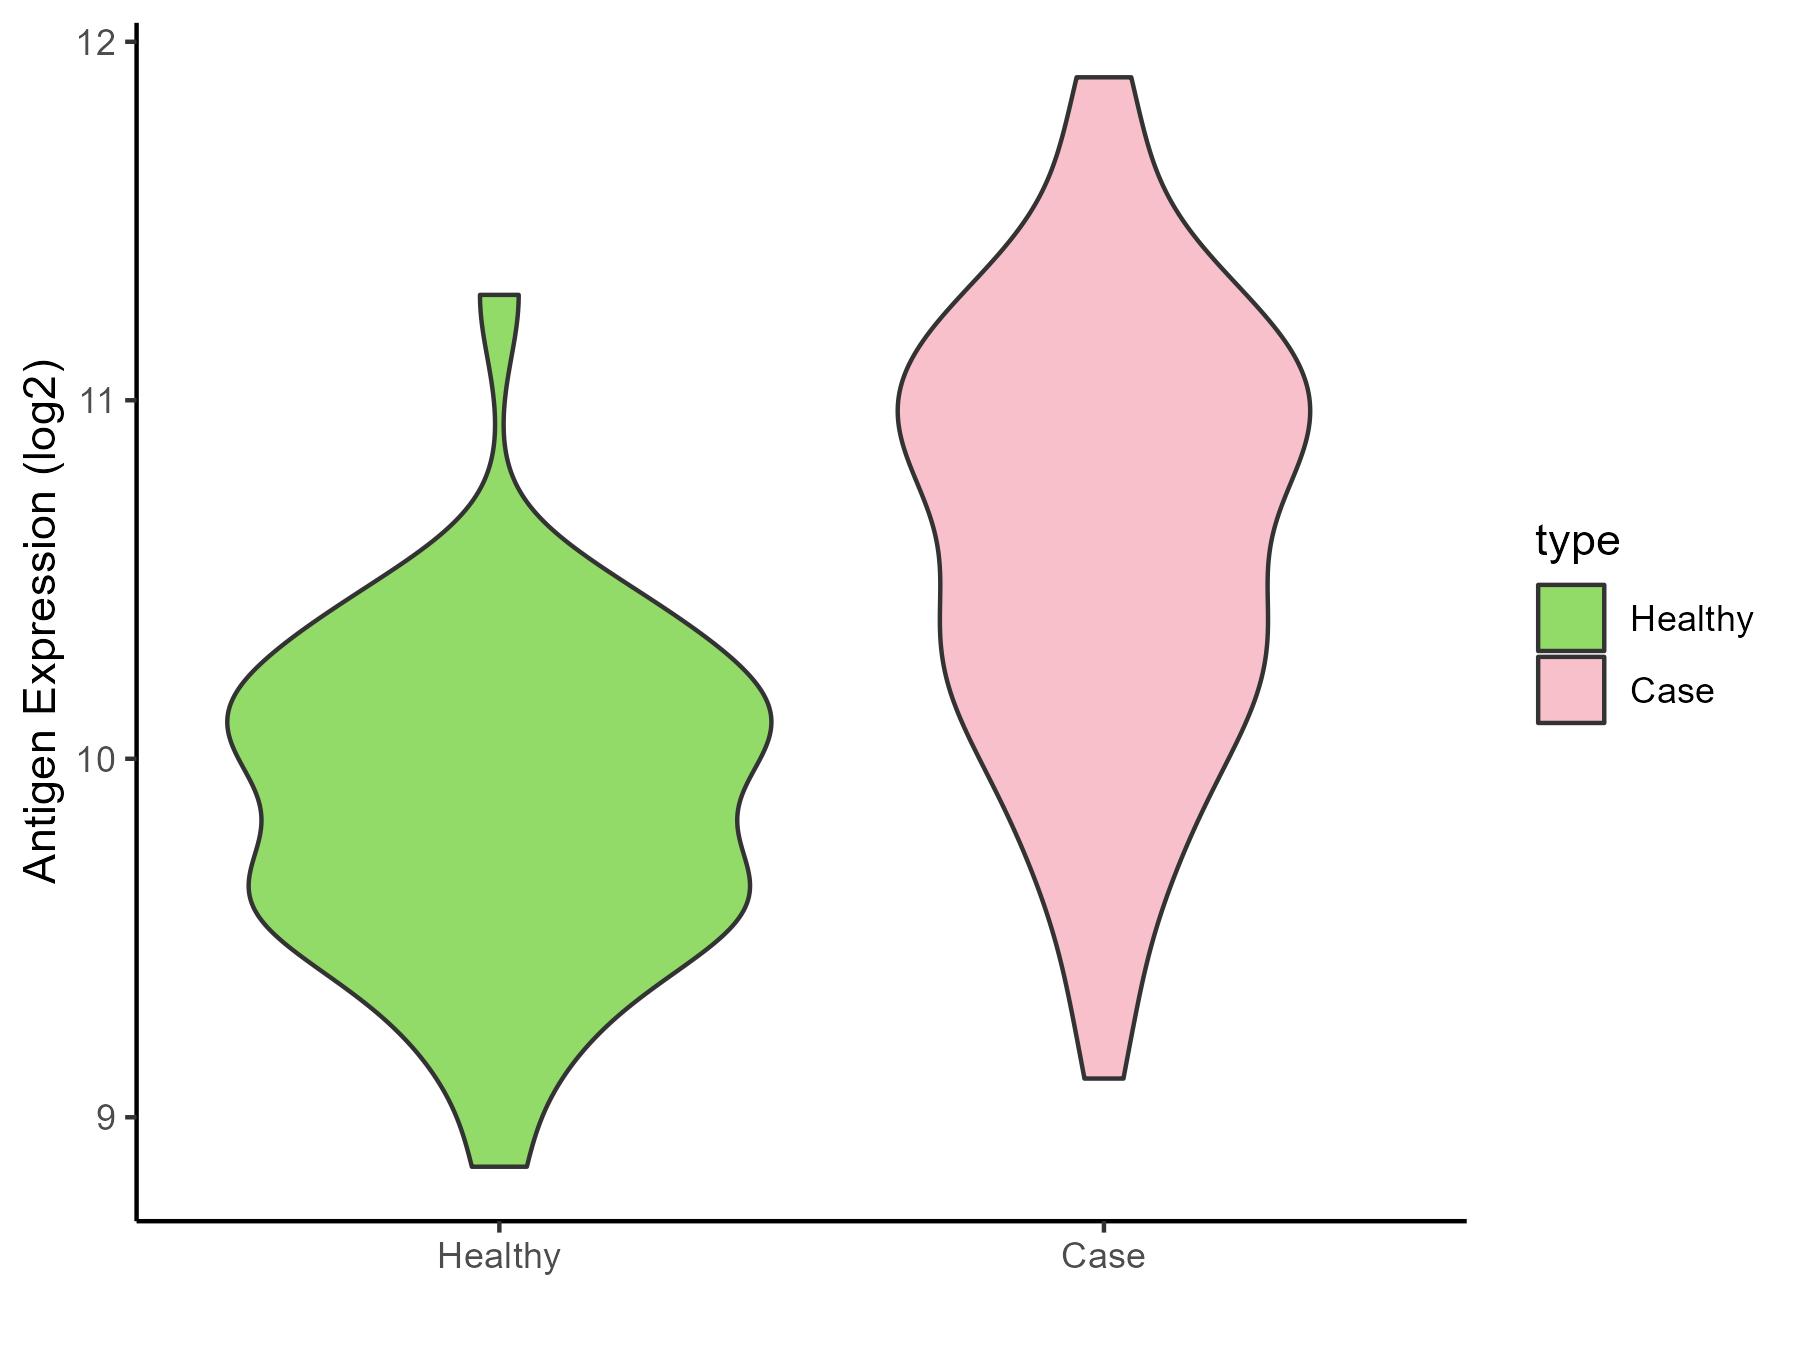
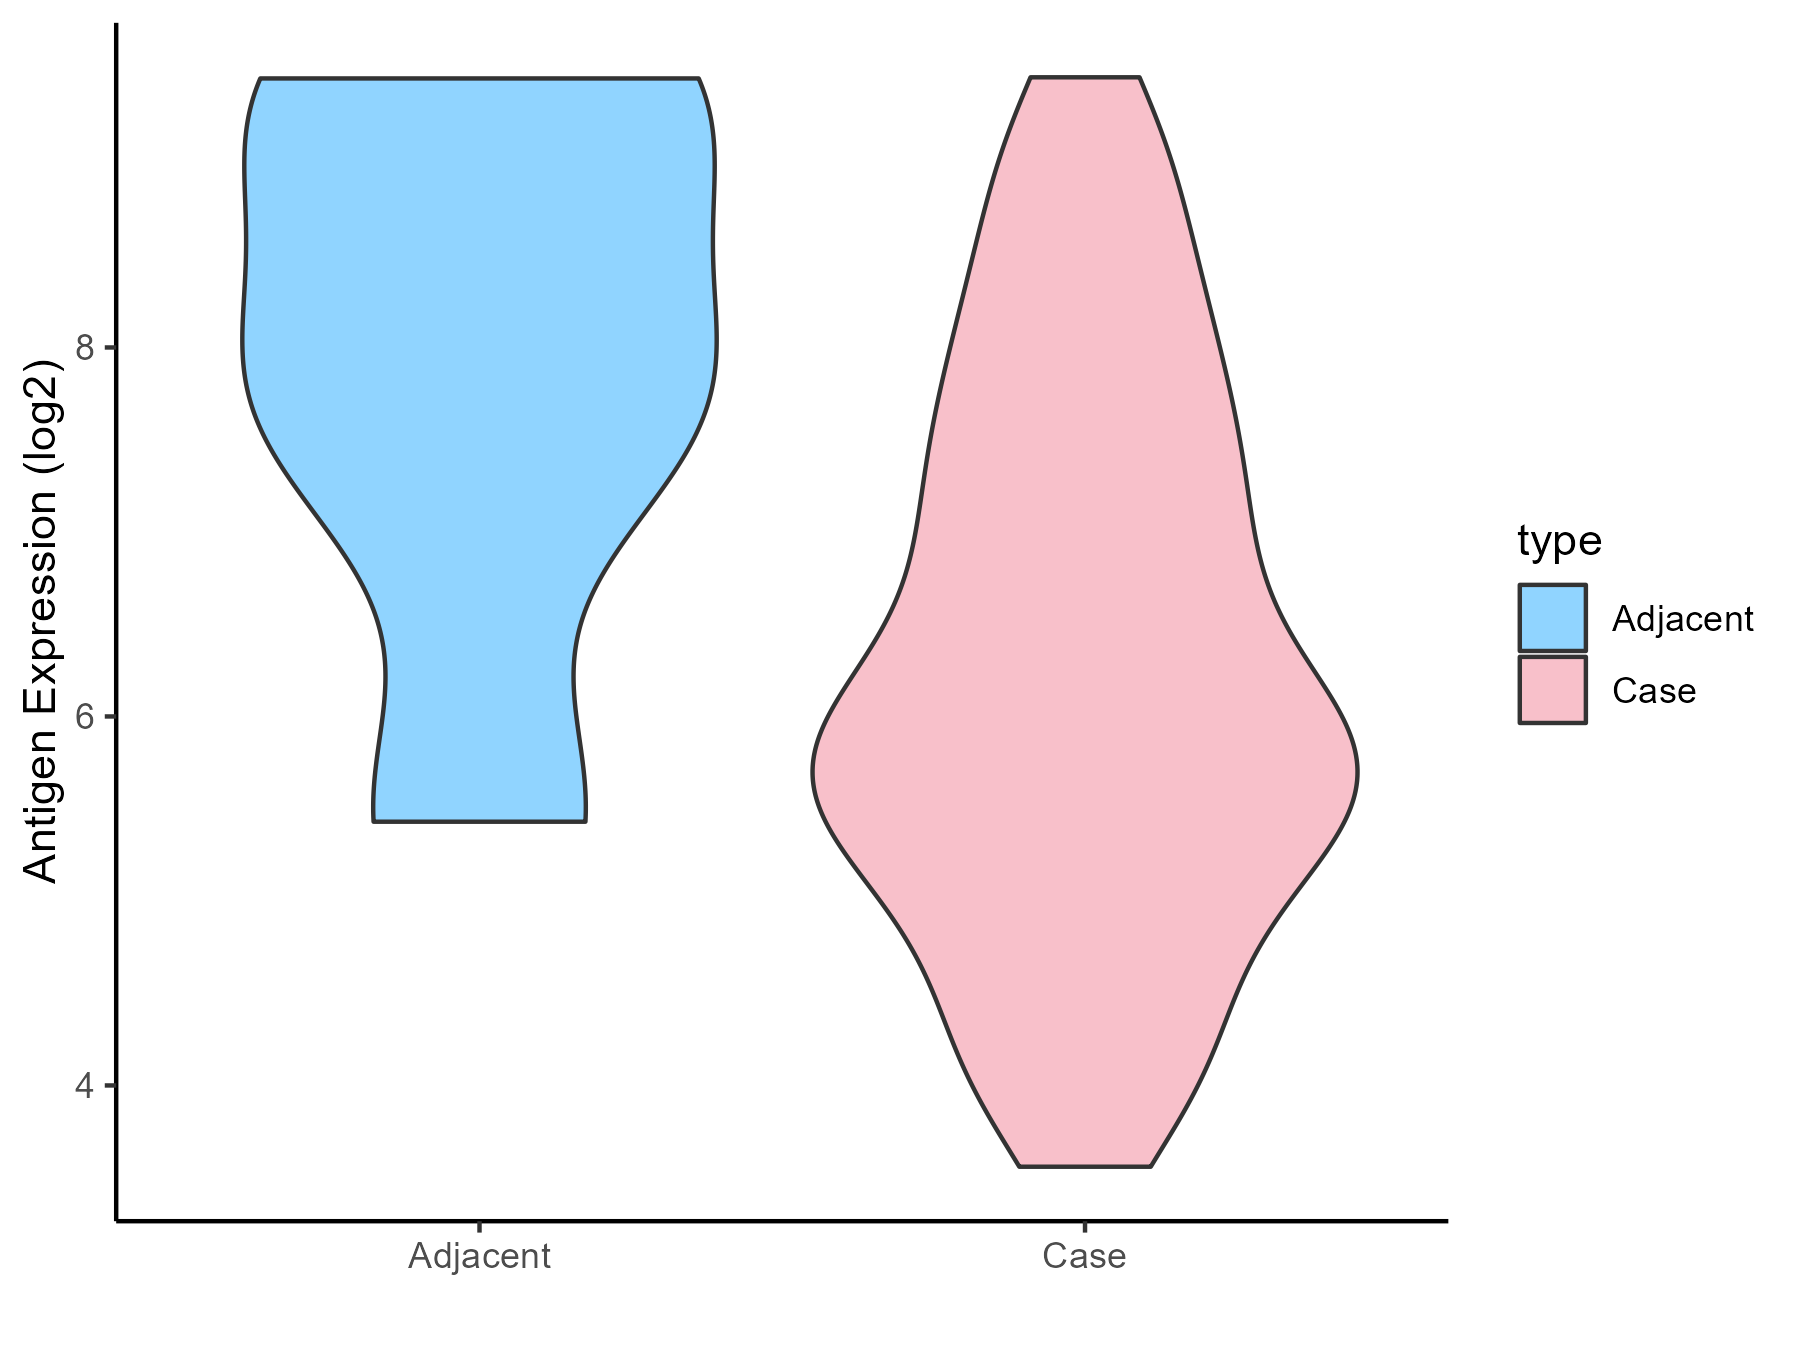
| Differential expression pattern of antigen in diseases | ||
| The Studied Tissue | Gastric | |
| The Specific Disease | Gastric cancer | |
| The Expression Level of Disease Section Compare with the Healthy Individual Tissue | p-value: 0.352242677; Fold-change: 0.624966263; Z-score: 0.897292584 | |
| The Expression Level of Disease Section Compare with the Adjacent Tissue | p-value: 0.031694848; Fold-change: -0.155543984; Z-score: -0.347275633 | |
| Disease-specific Antigen Abundances |
|
Click to View the Clearer Original Diagram |
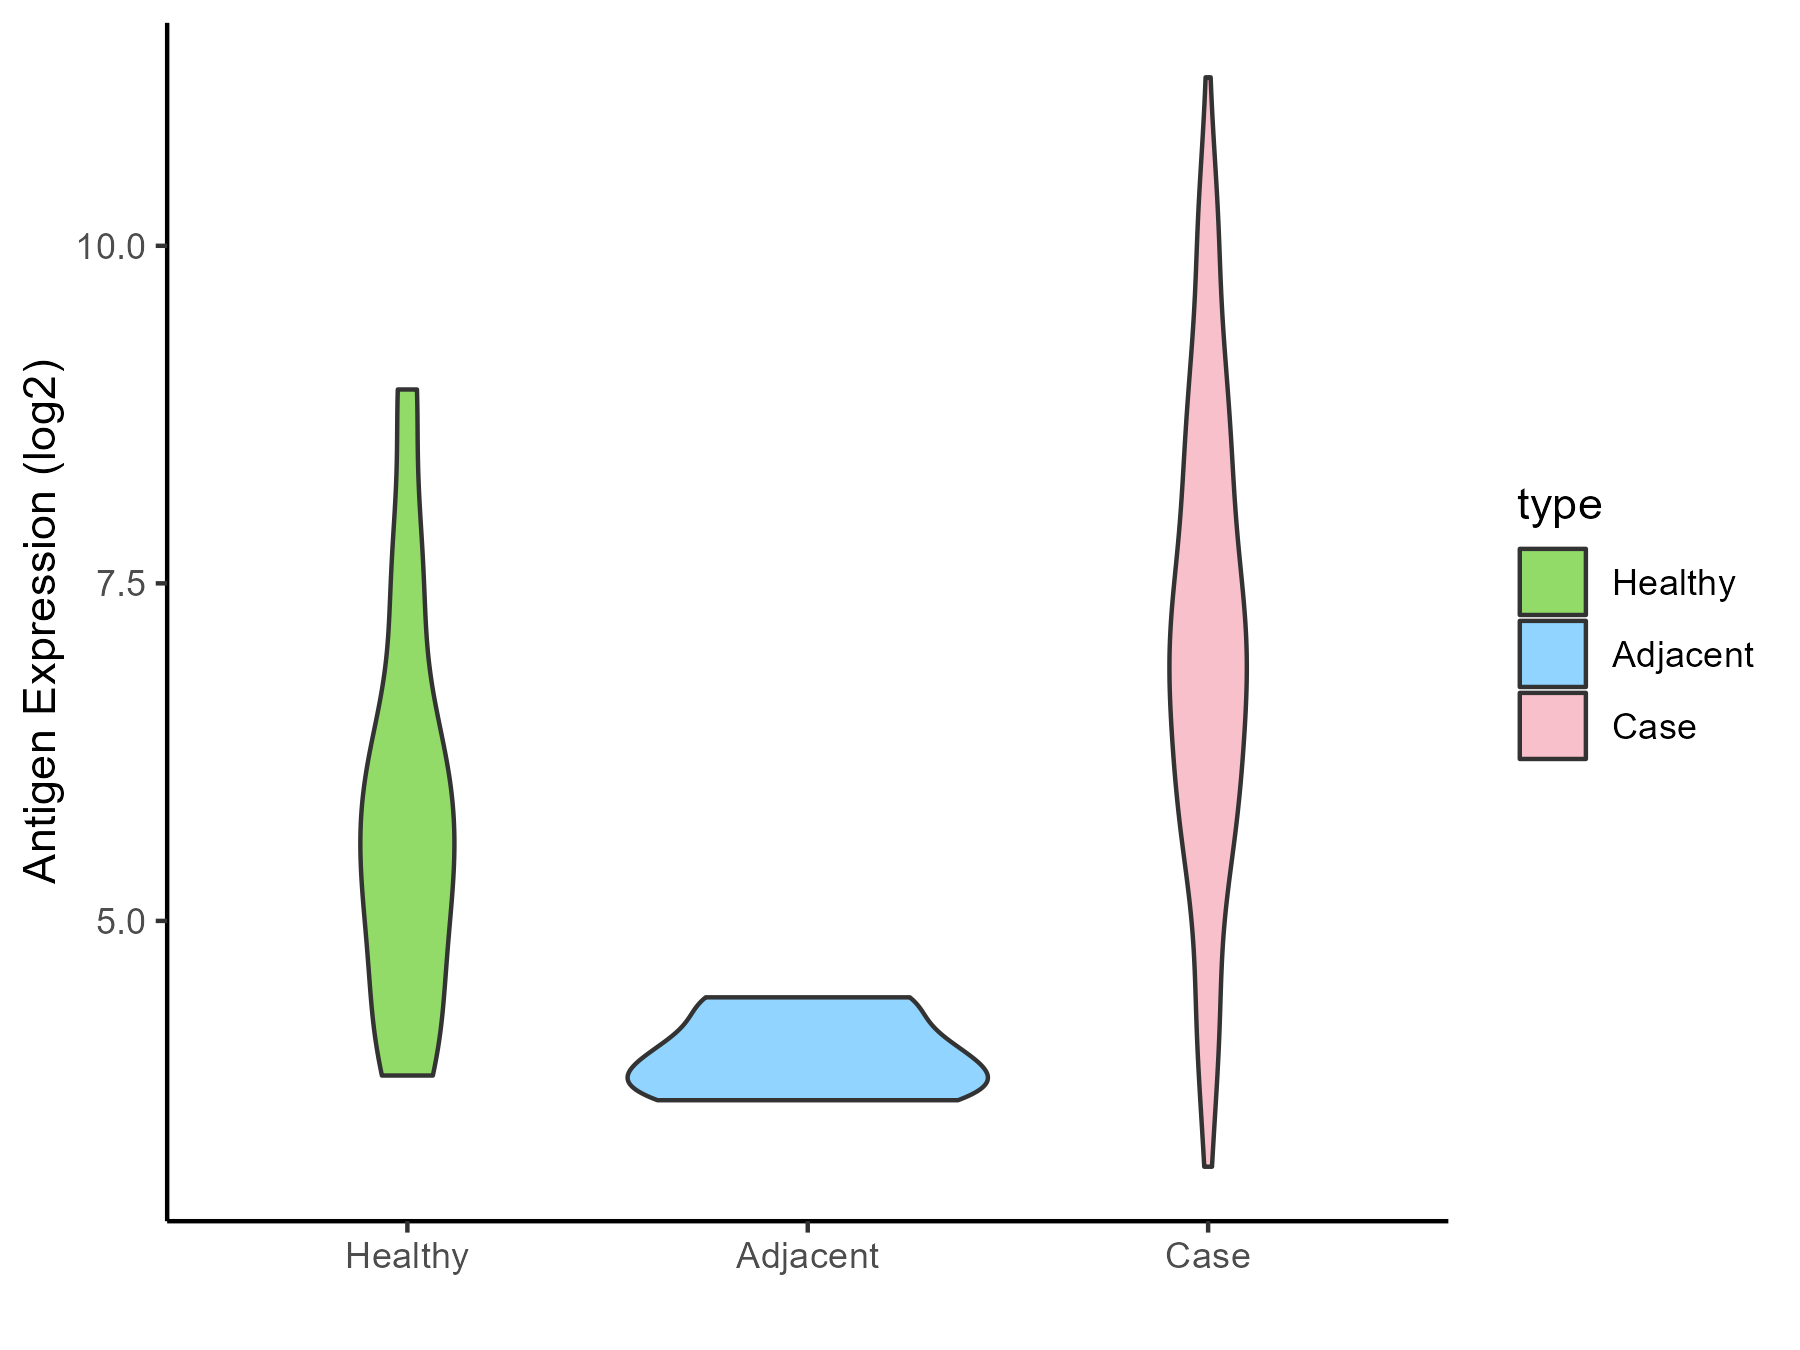
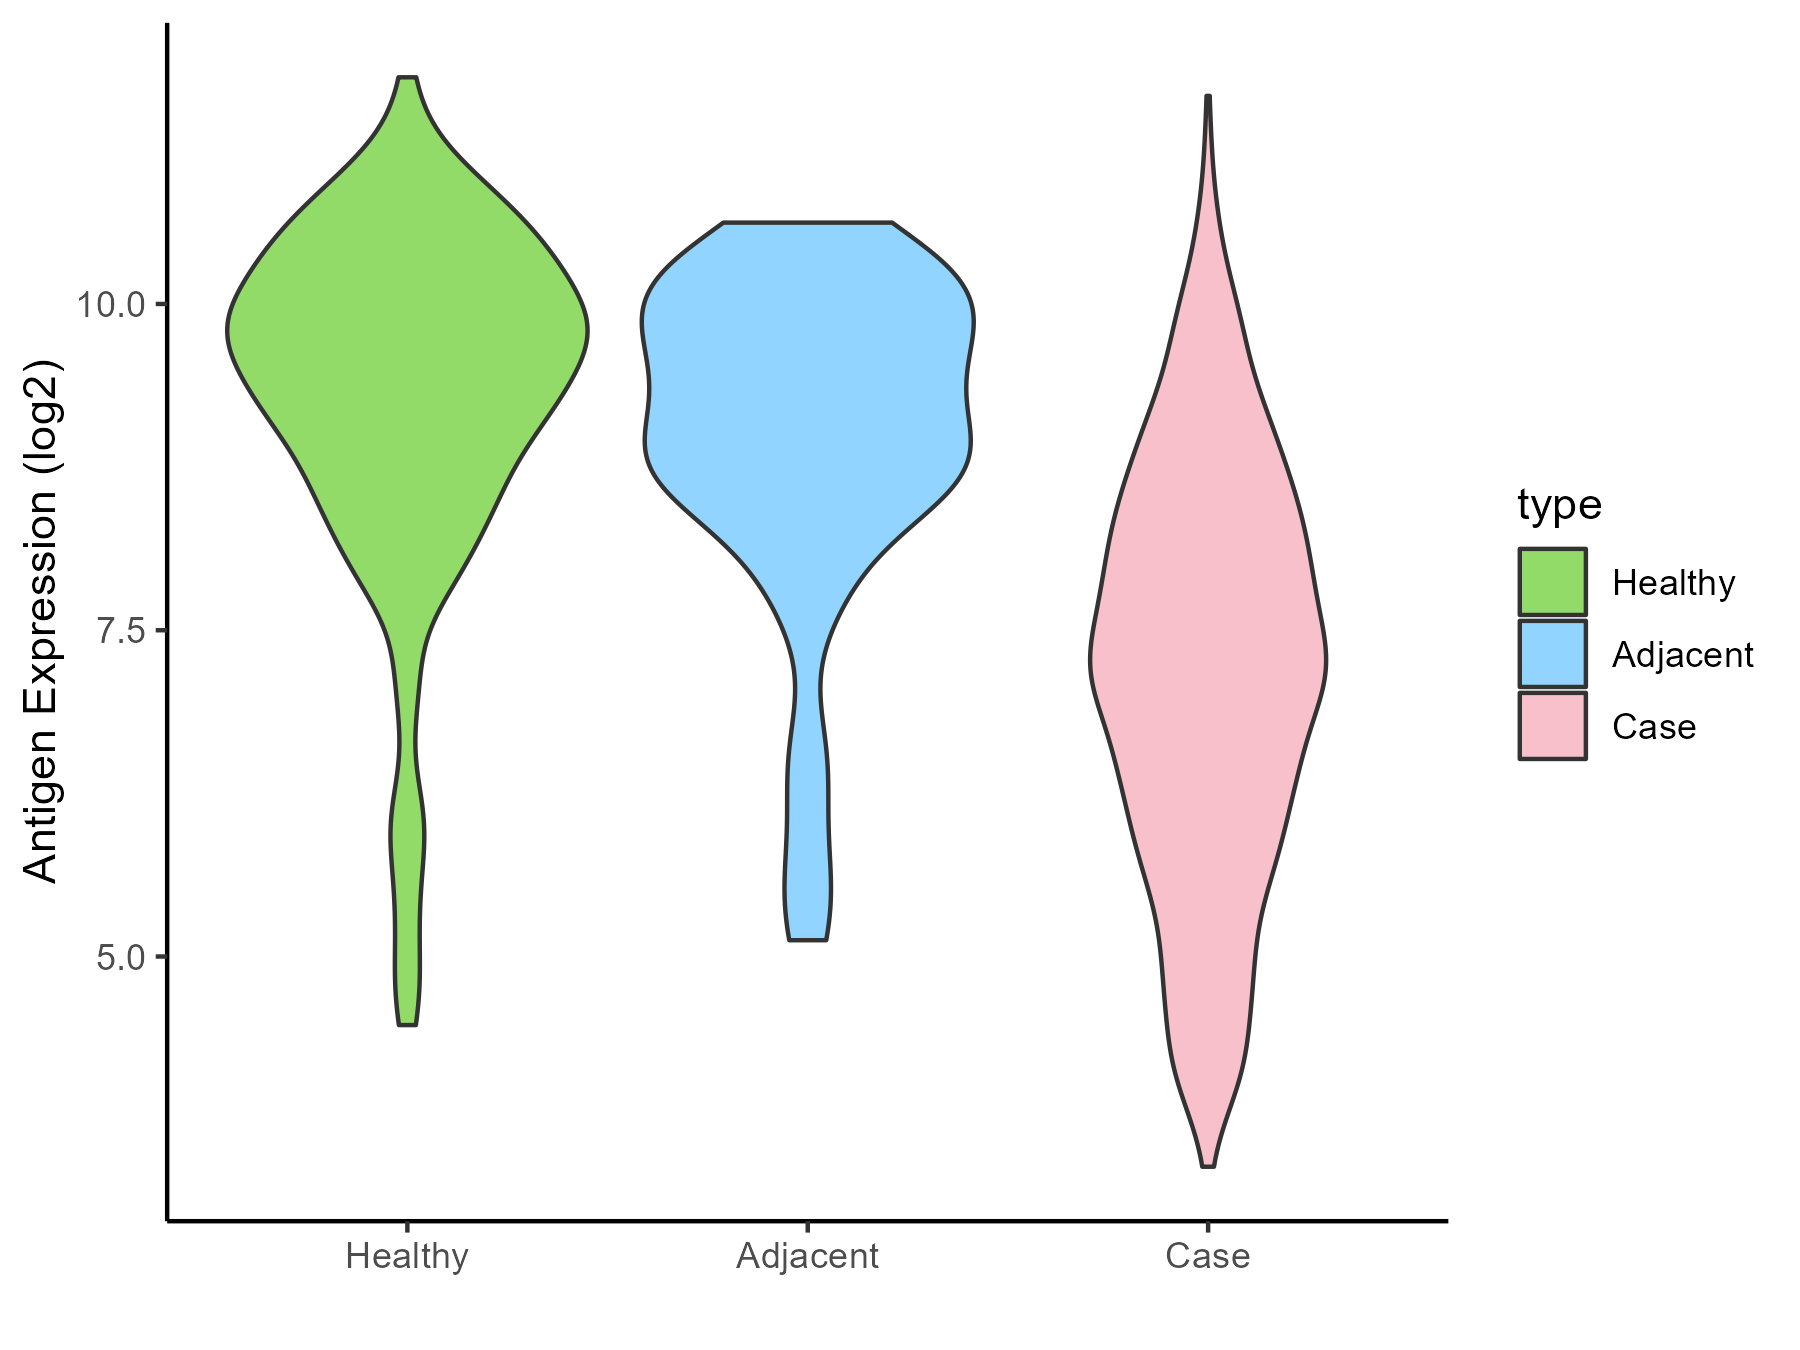
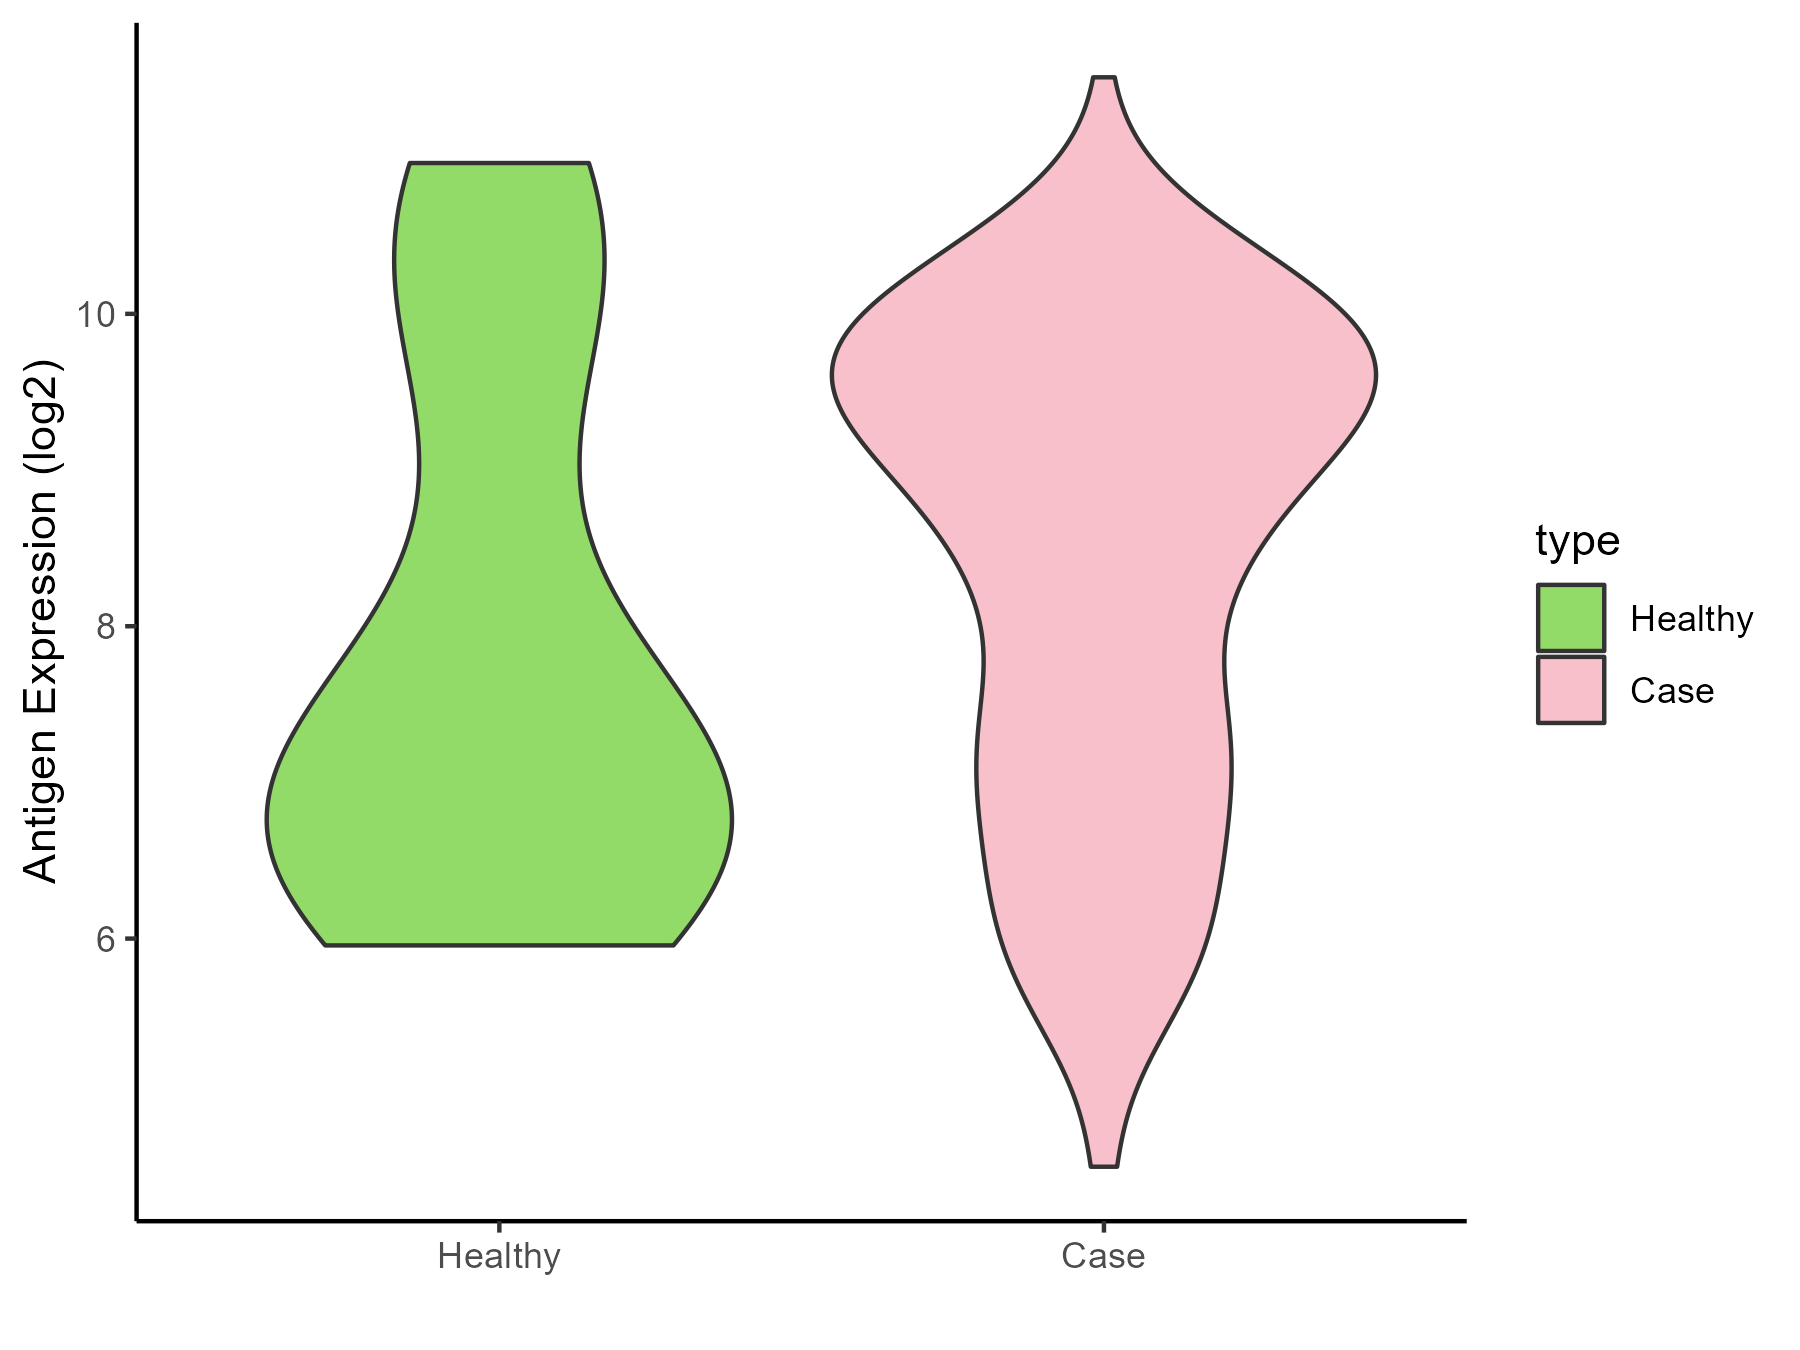
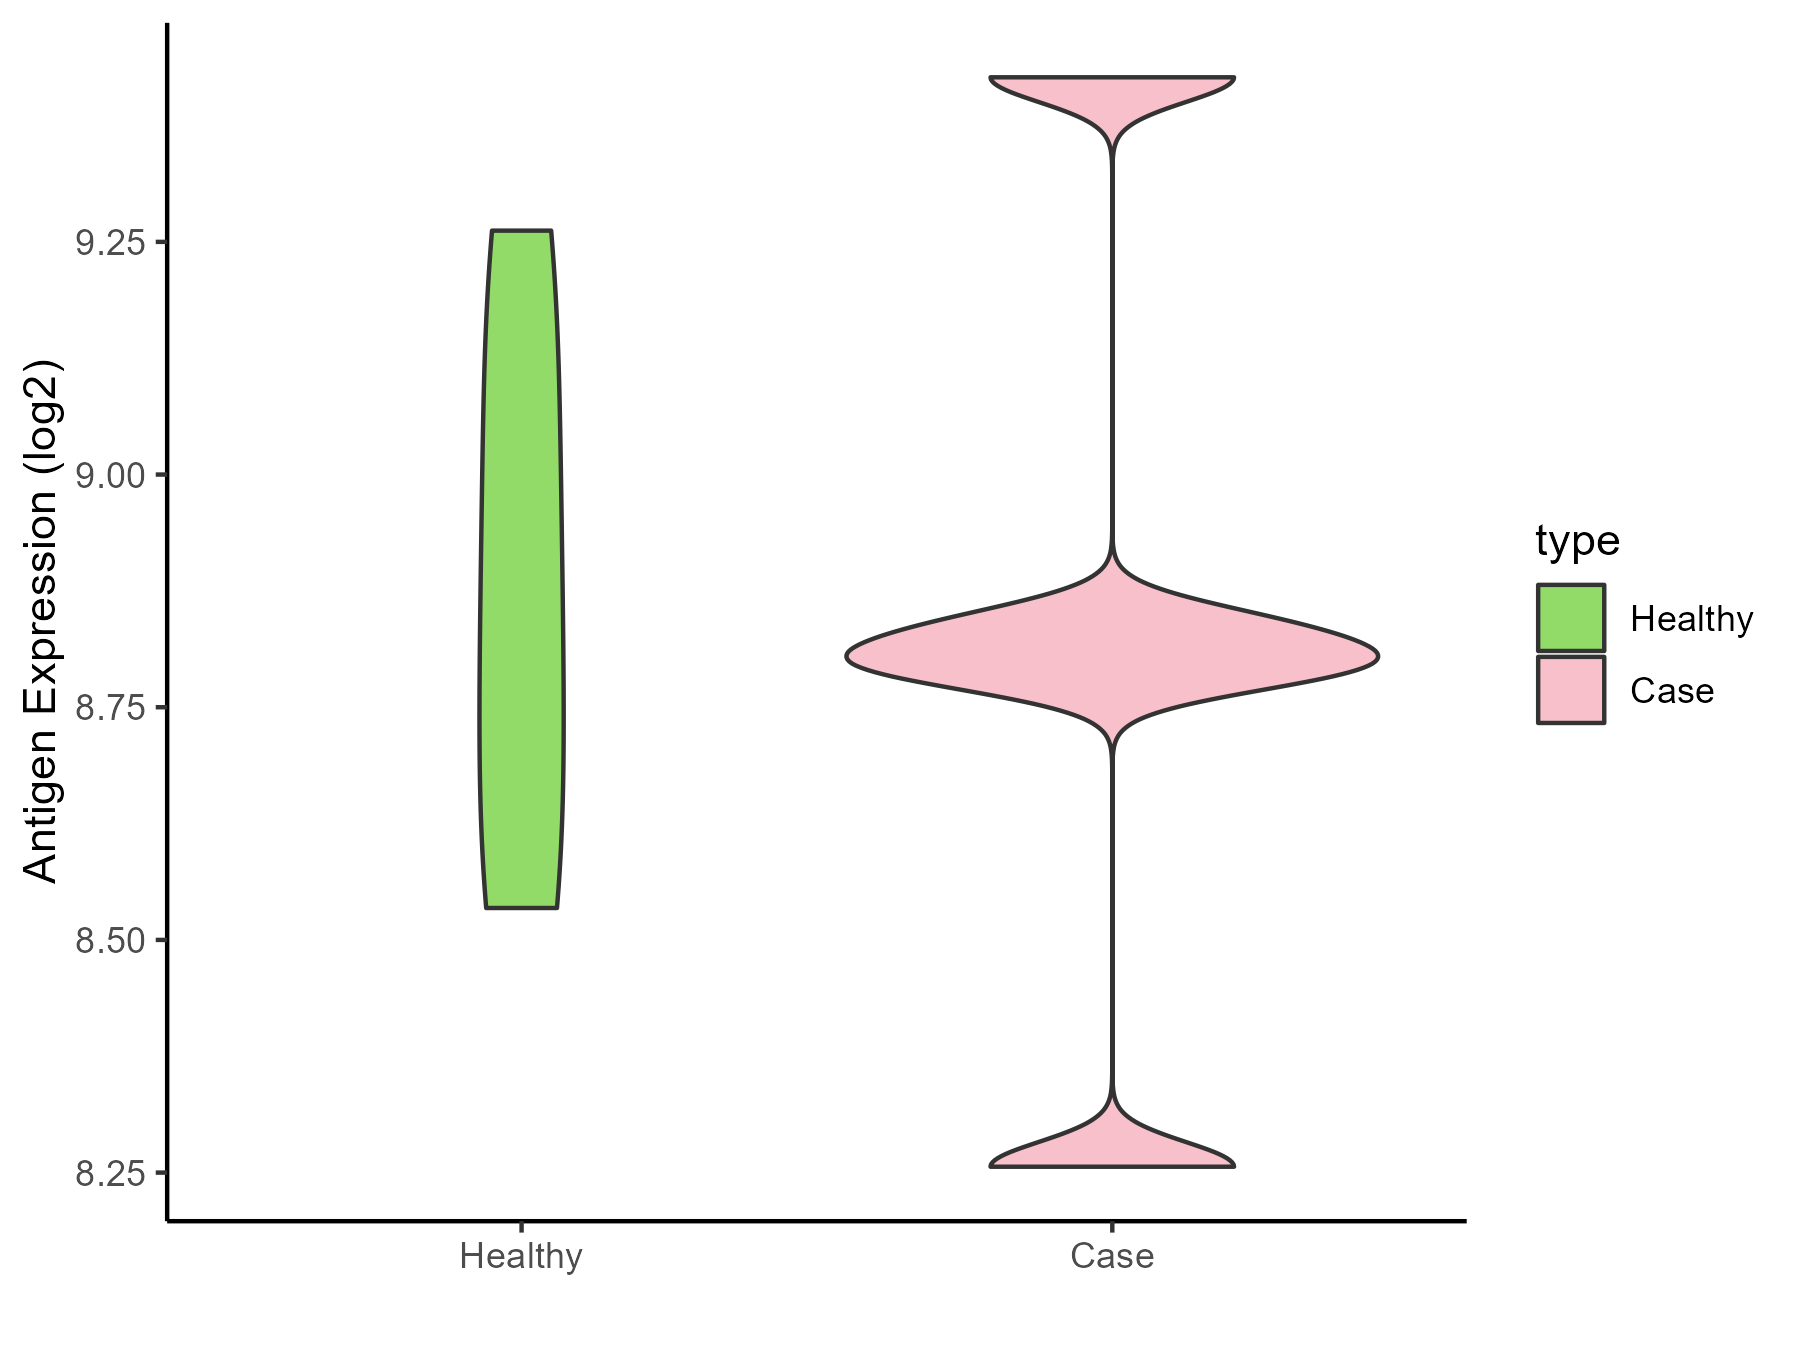
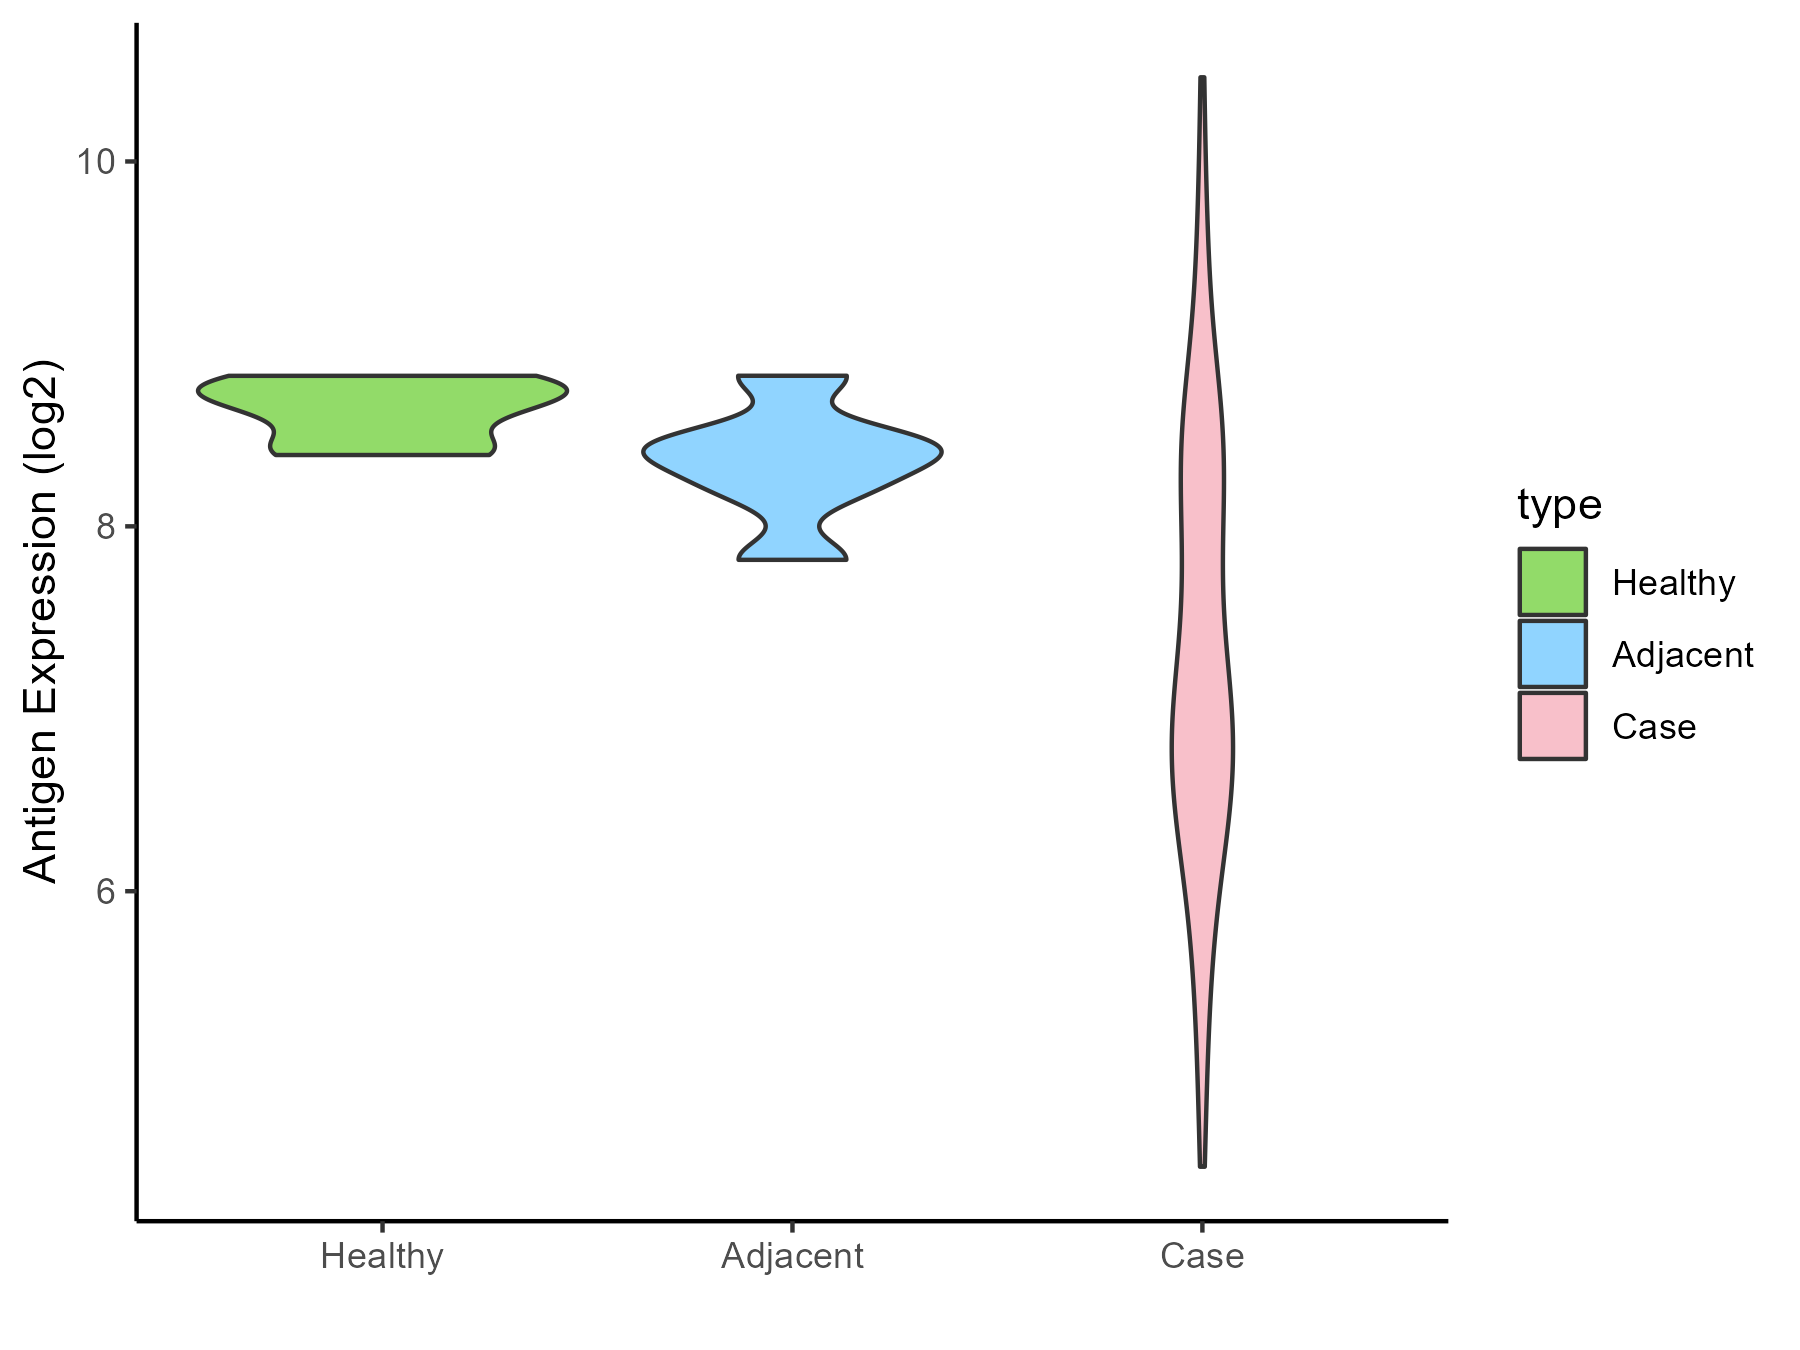
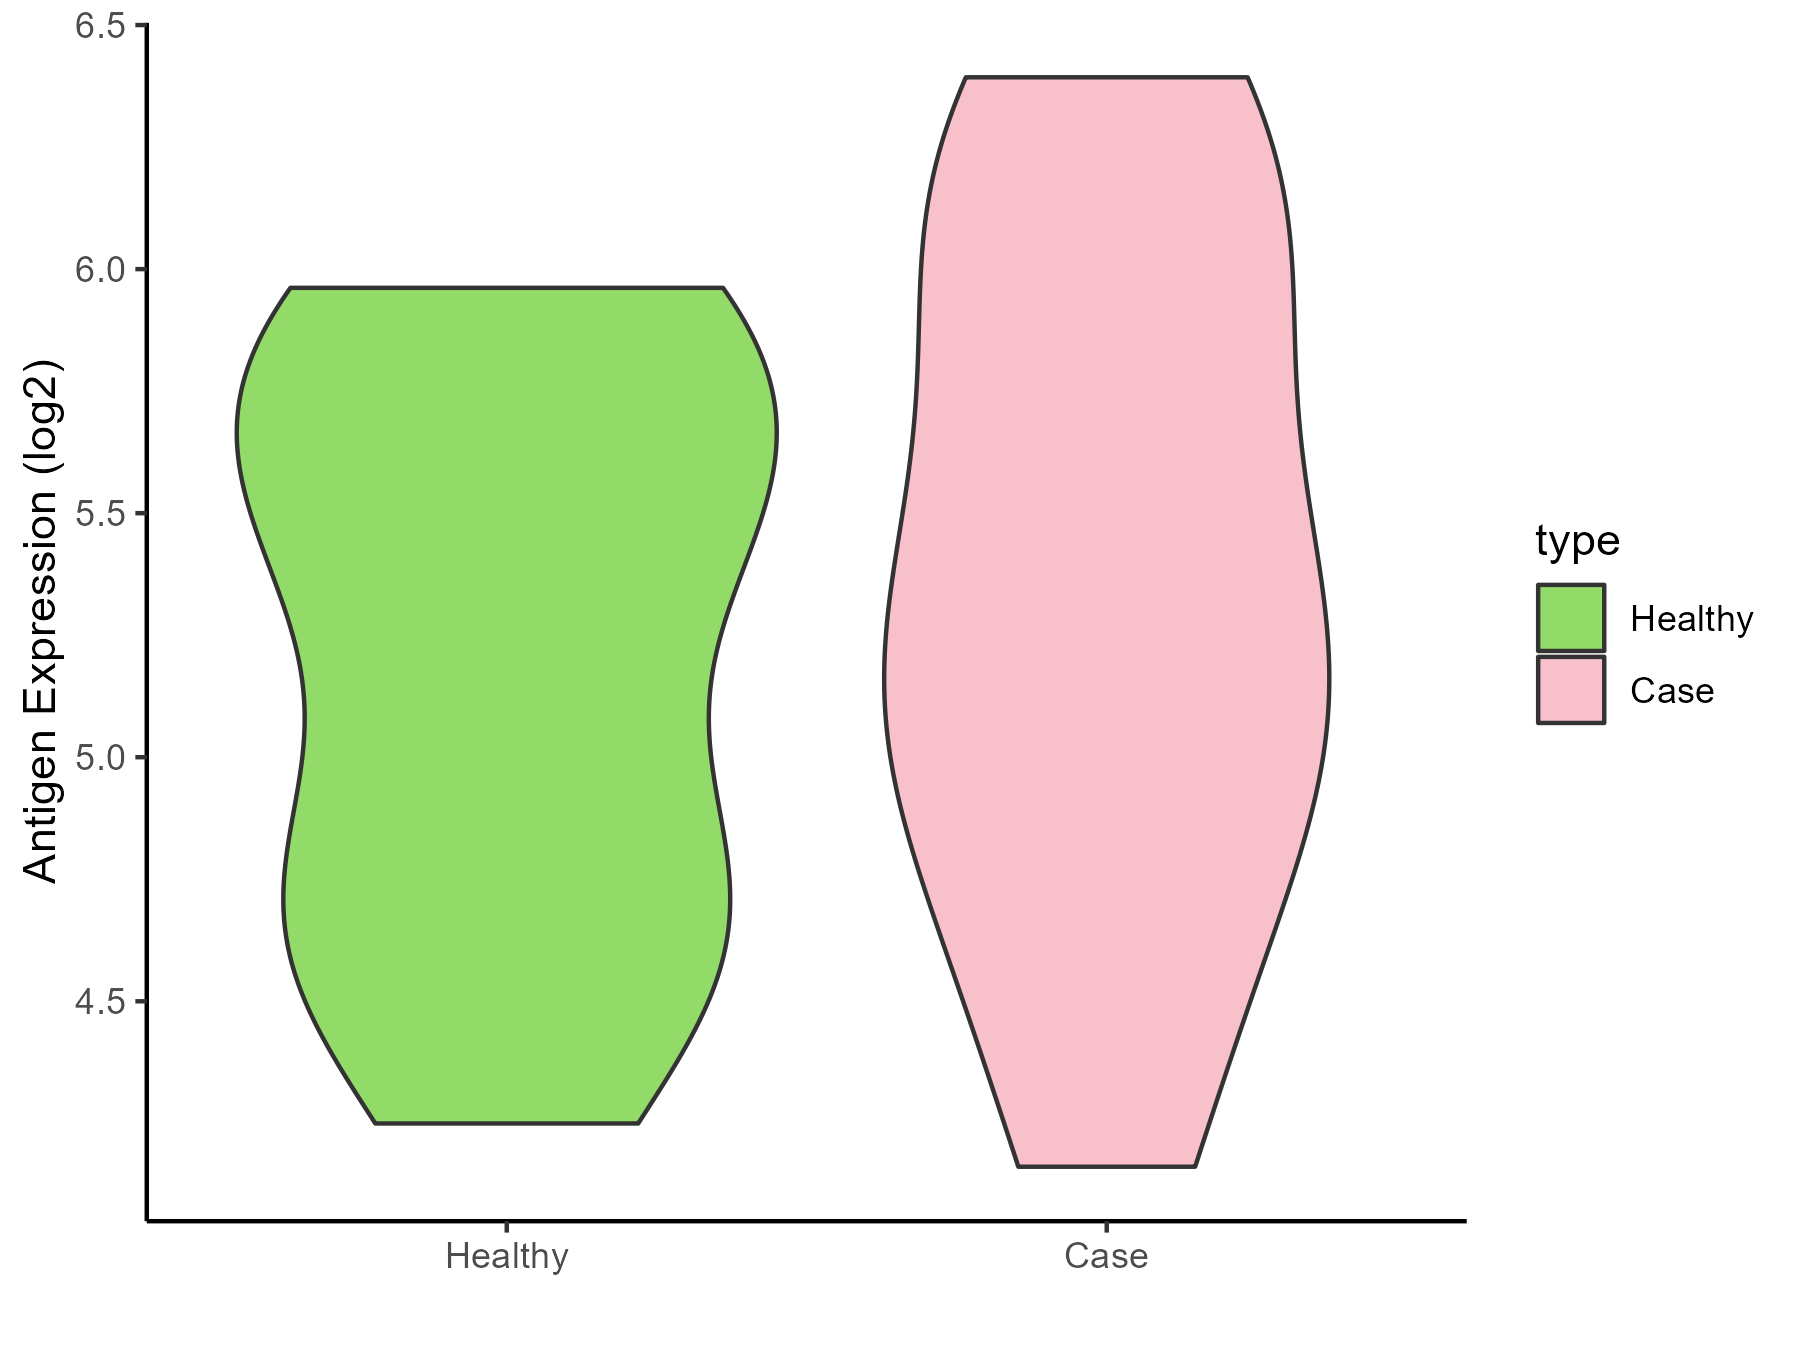
| Differential expression pattern of antigen in diseases | ||
| The Studied Tissue | Colon | |
| The Specific Disease | Colon cancer | |
| The Expression Level of Disease Section Compare with the Healthy Individual Tissue | p-value: 1.34E-10; Fold-change: -0.667367639; Z-score: -0.751128009 | |
| The Expression Level of Disease Section Compare with the Adjacent Tissue | p-value: 1.92E-10; Fold-change: -0.761815108; Z-score: -0.740038388 | |
| Disease-specific Antigen Abundances |
|
Click to View the Clearer Original Diagram |
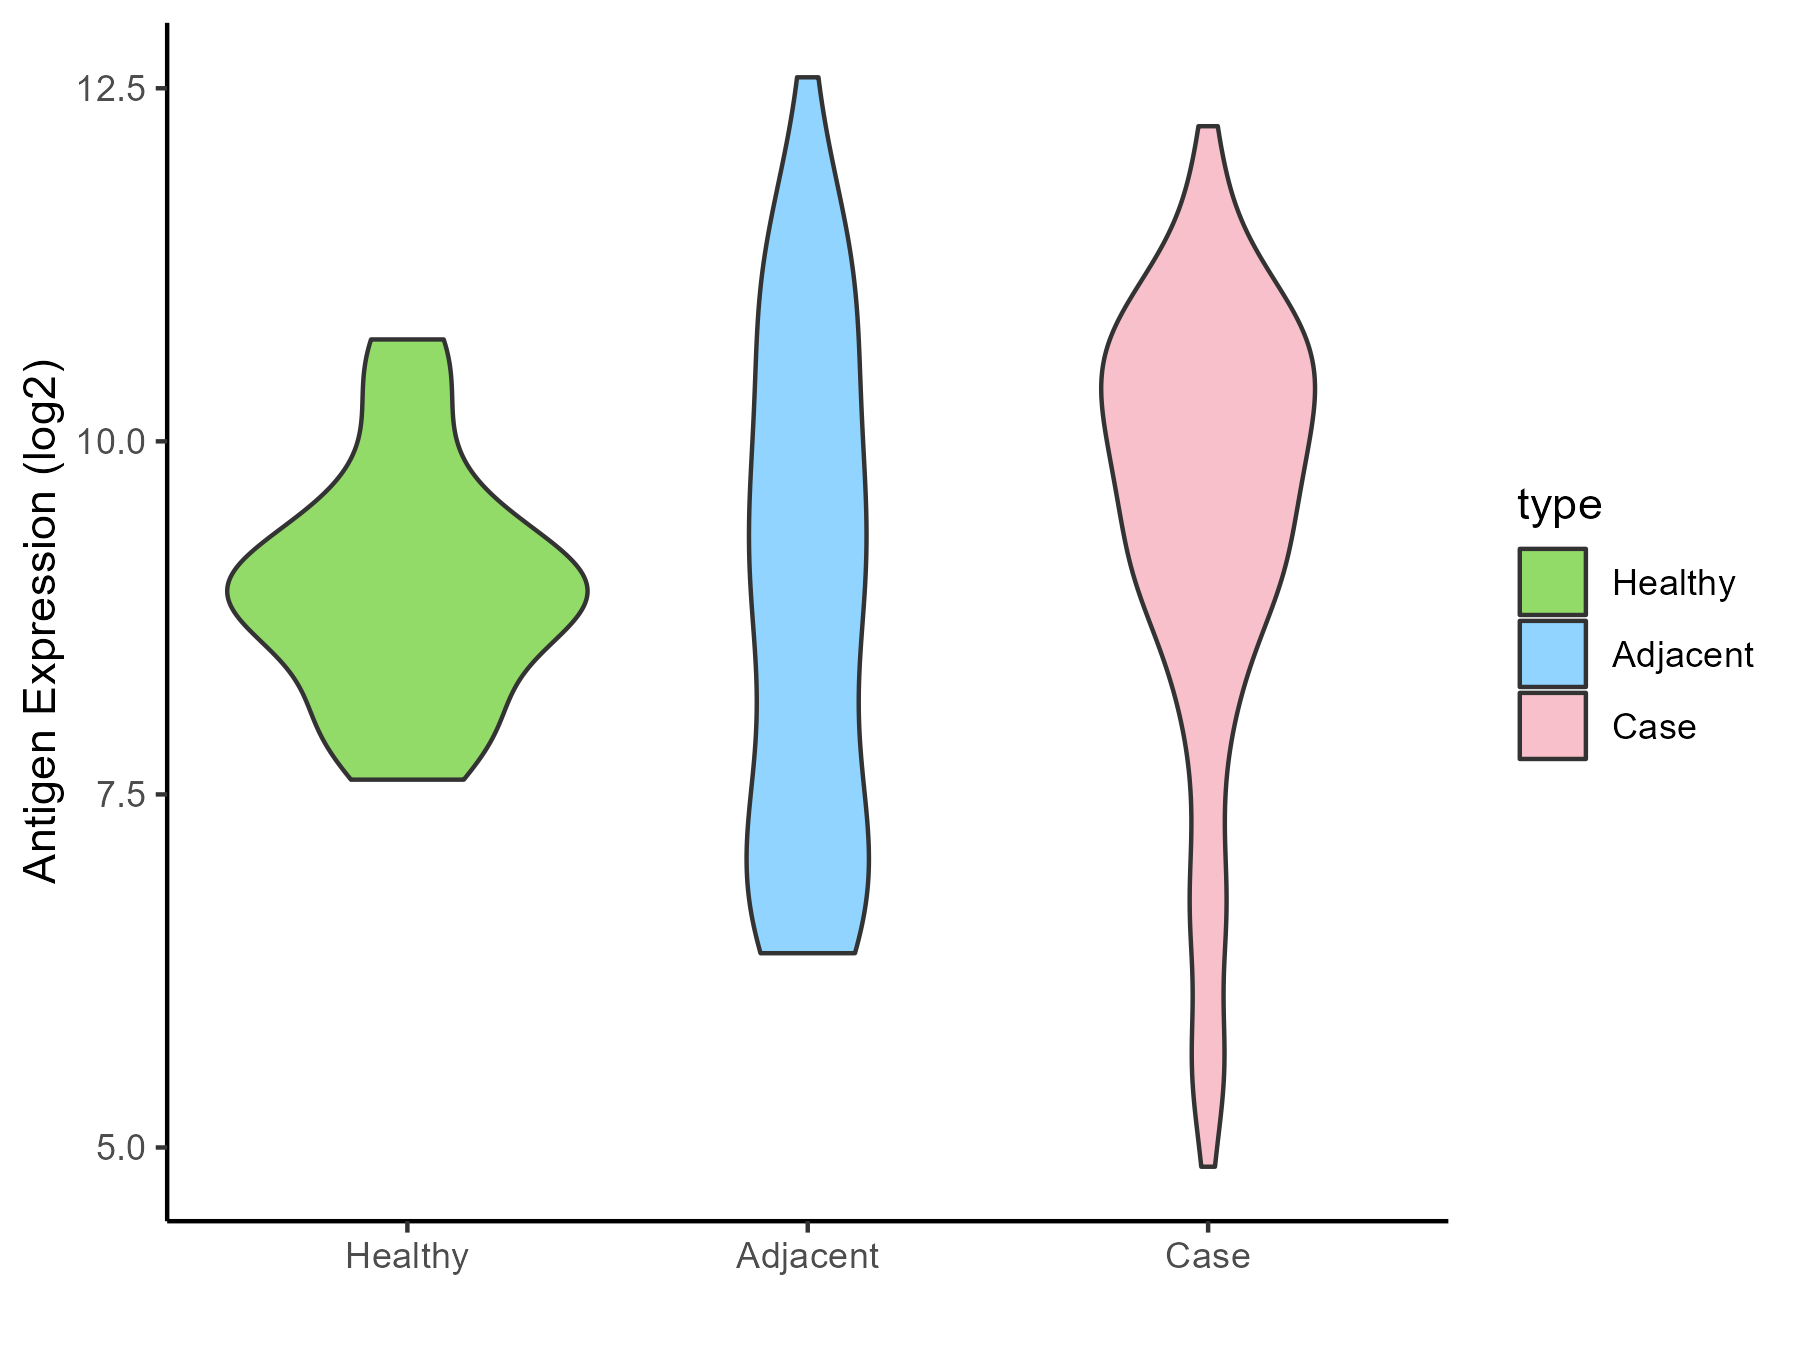
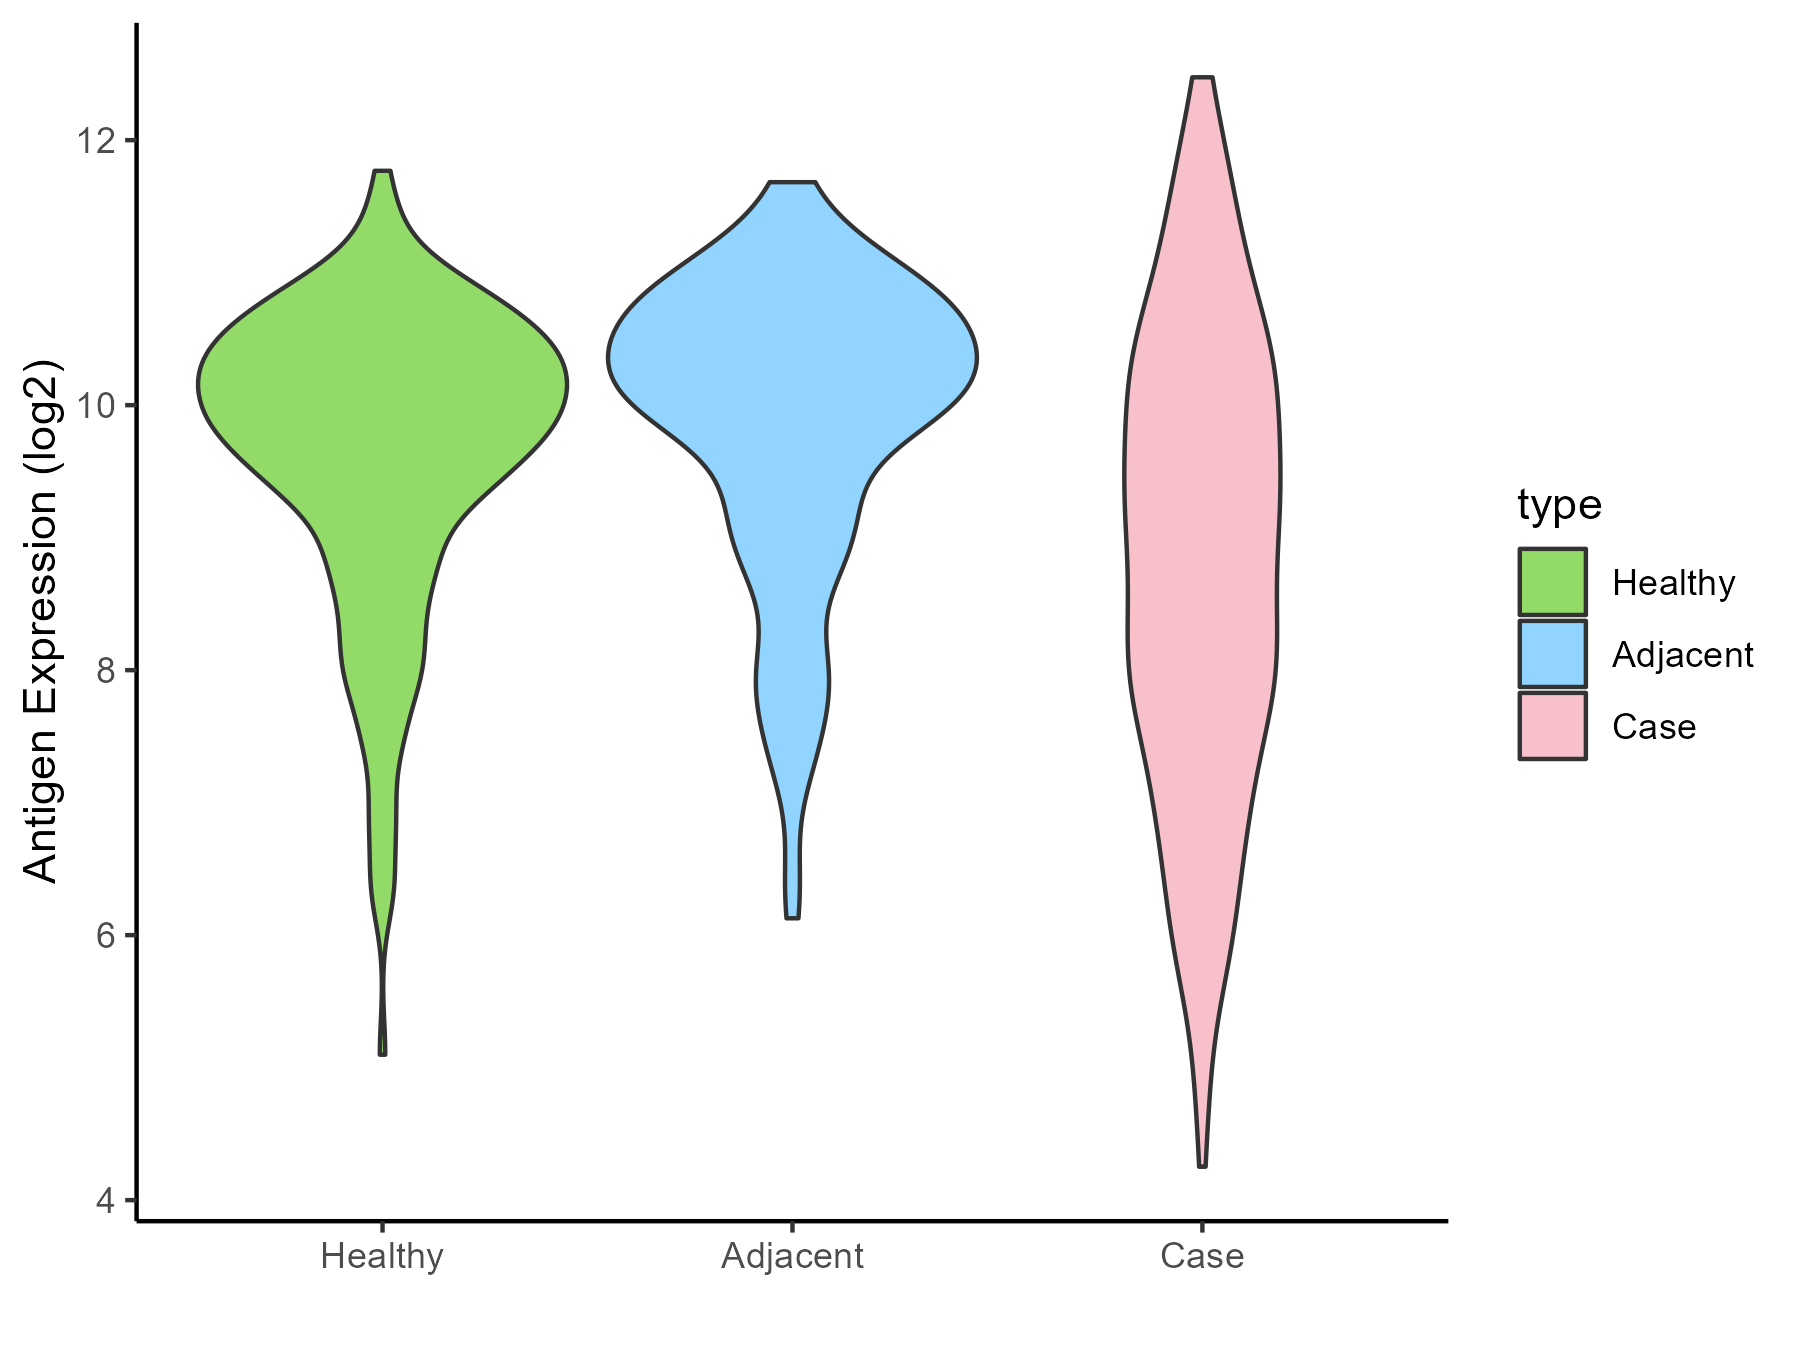
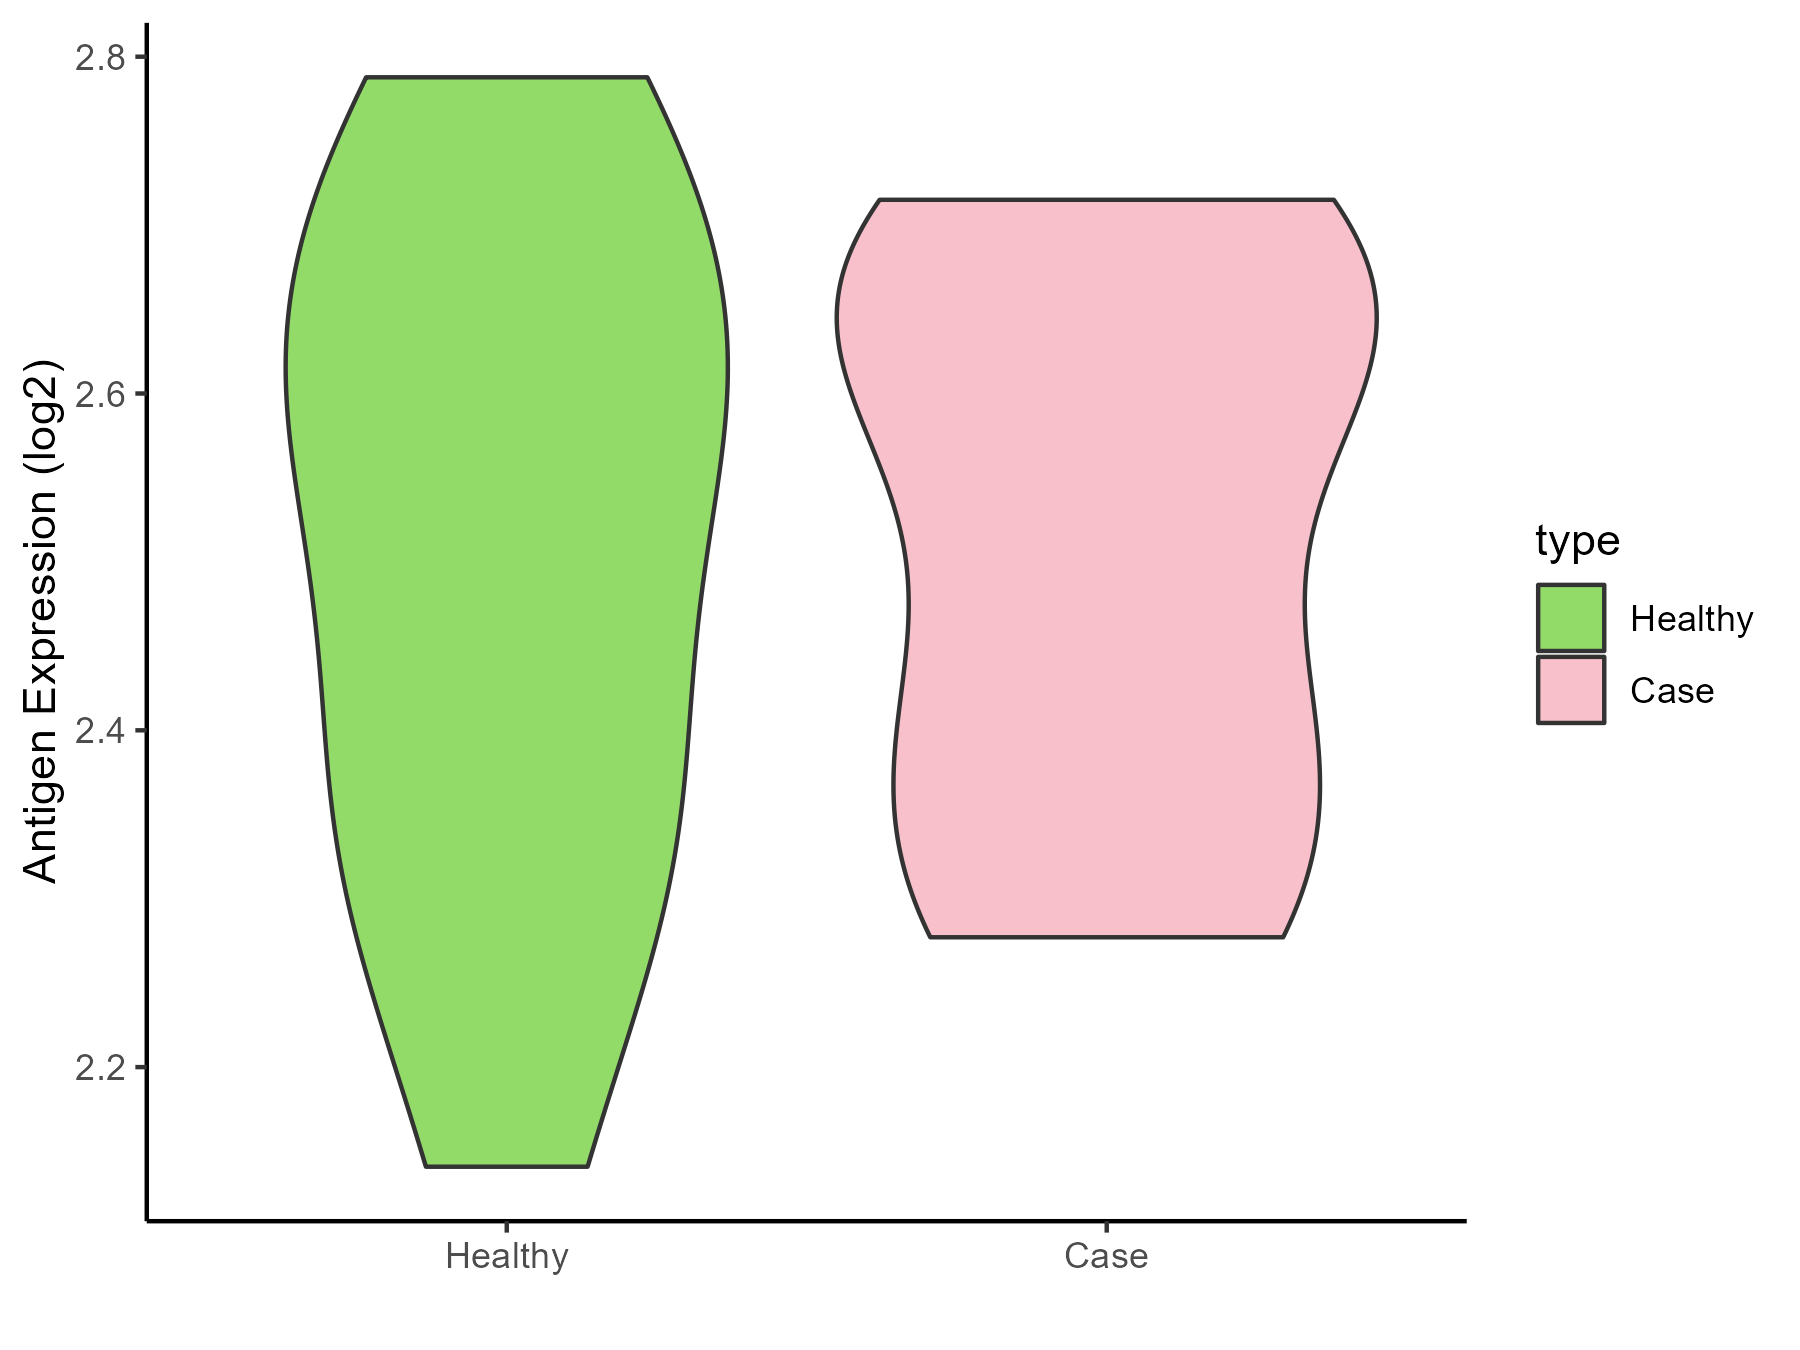
| Differential expression pattern of antigen in diseases | ||
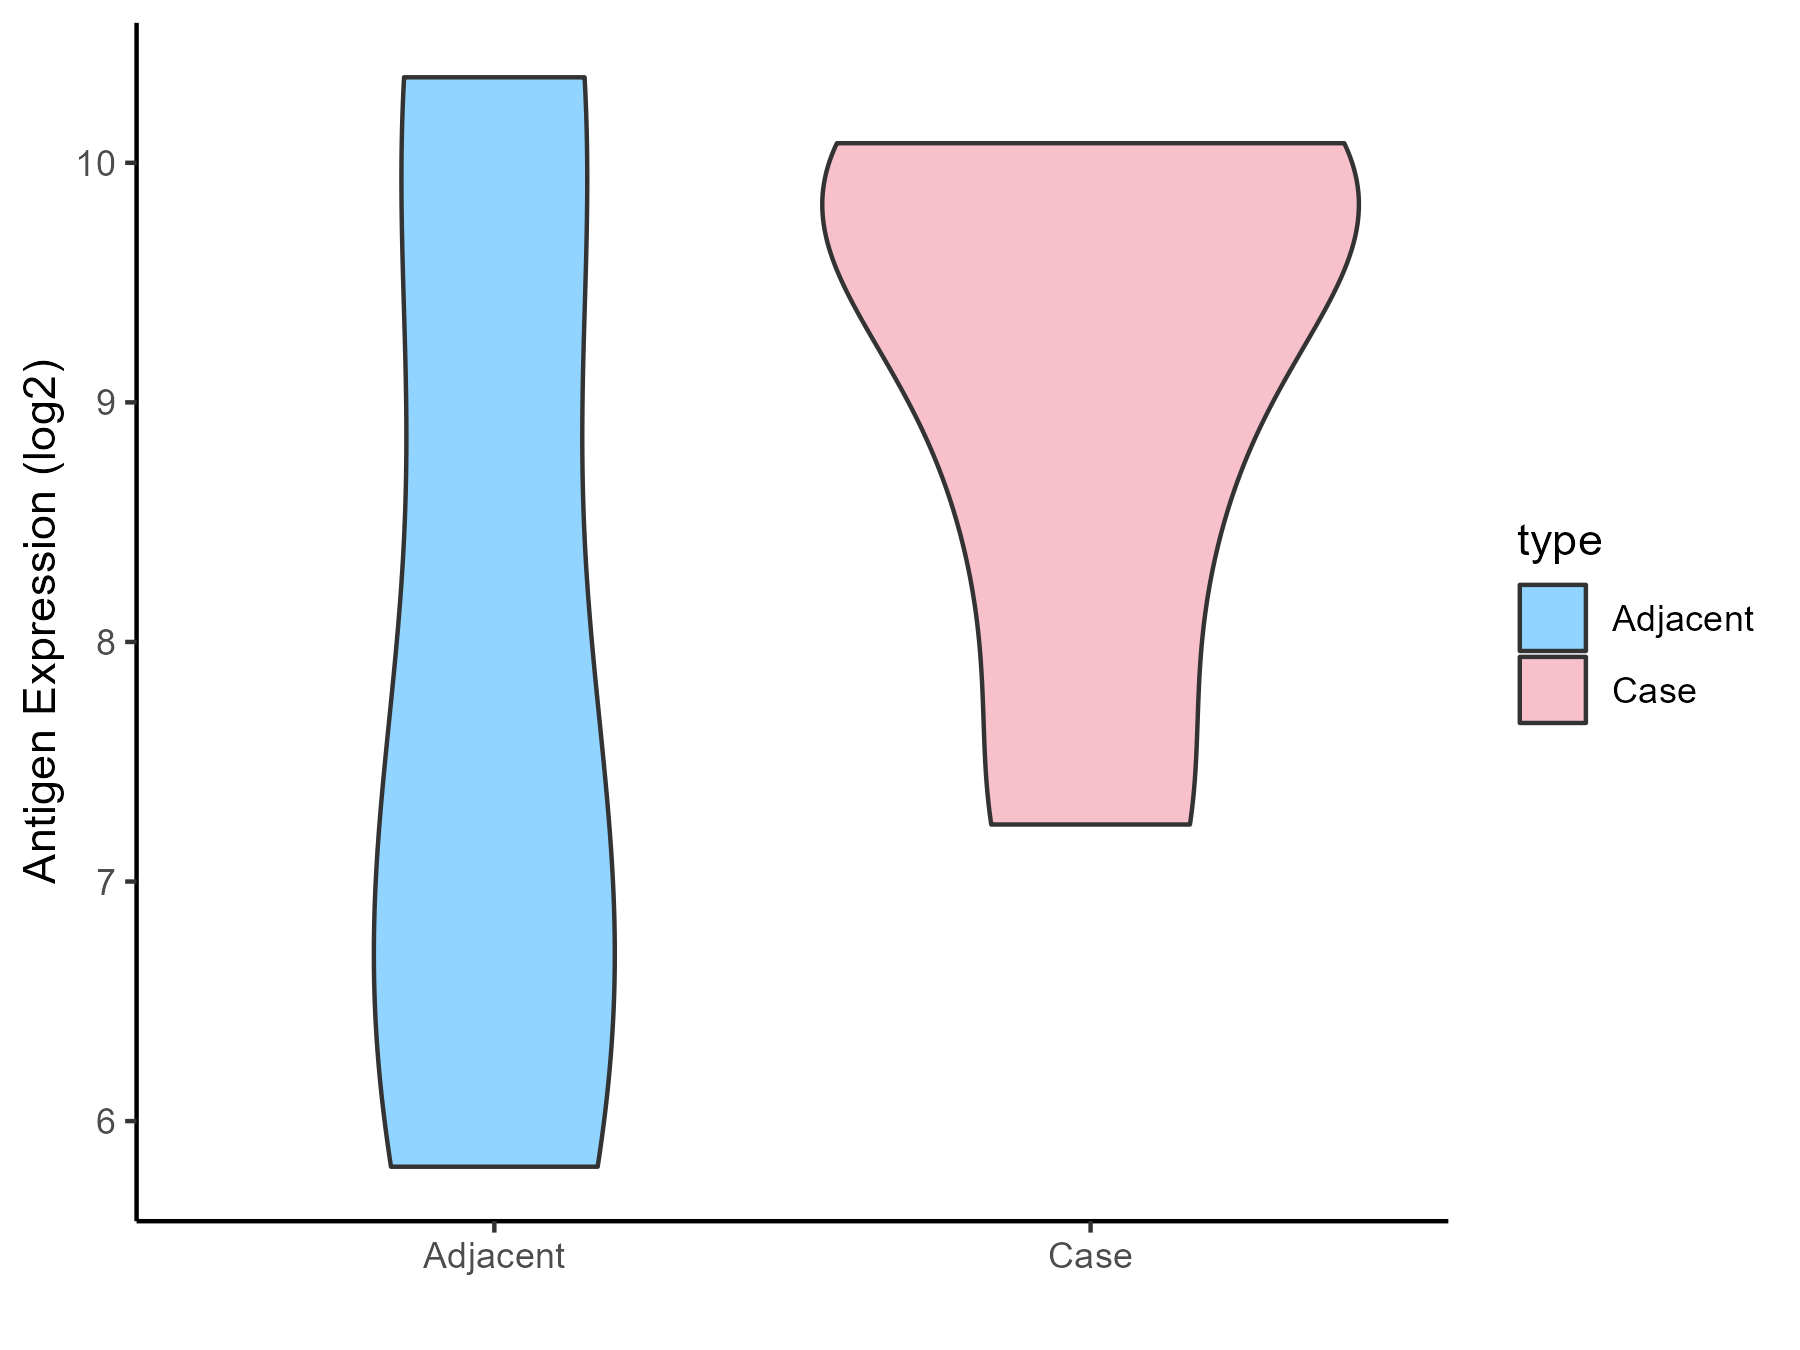
| The Studied Tissue | Pancreas | |
| The Specific Disease | Pancreatic cancer | |
| The Expression Level of Disease Section Compare with the Healthy Individual Tissue | p-value: 0.045485275; Fold-change: 0.874821827; Z-score: 1.051767051 | |
| The Expression Level of Disease Section Compare with the Adjacent Tissue | p-value: 0.035703449; Fold-change: 0.889278023; Z-score: 0.508091447 | |
| Disease-specific Antigen Abundances |
|
Click to View the Clearer Original Diagram |
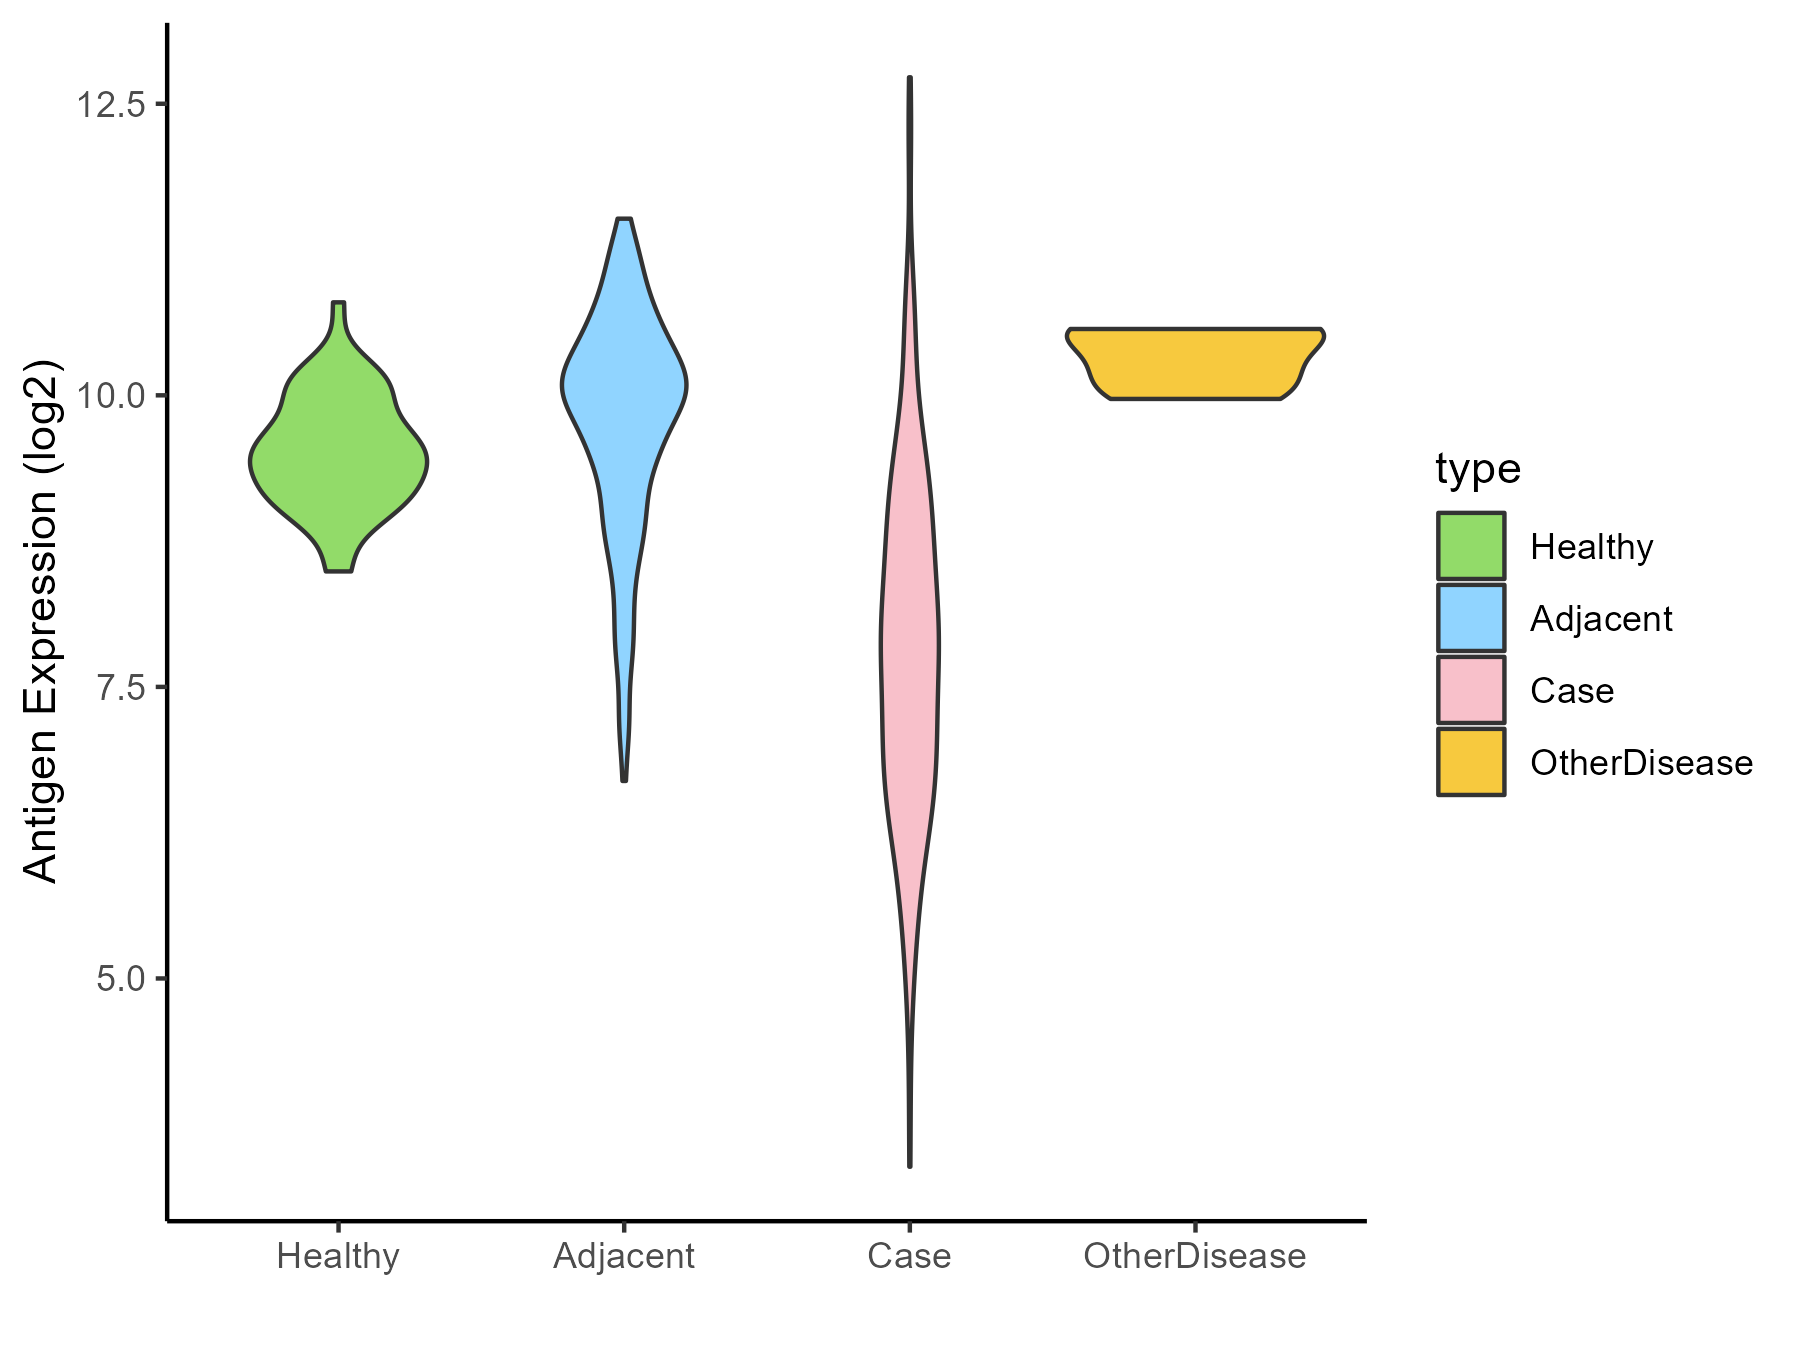
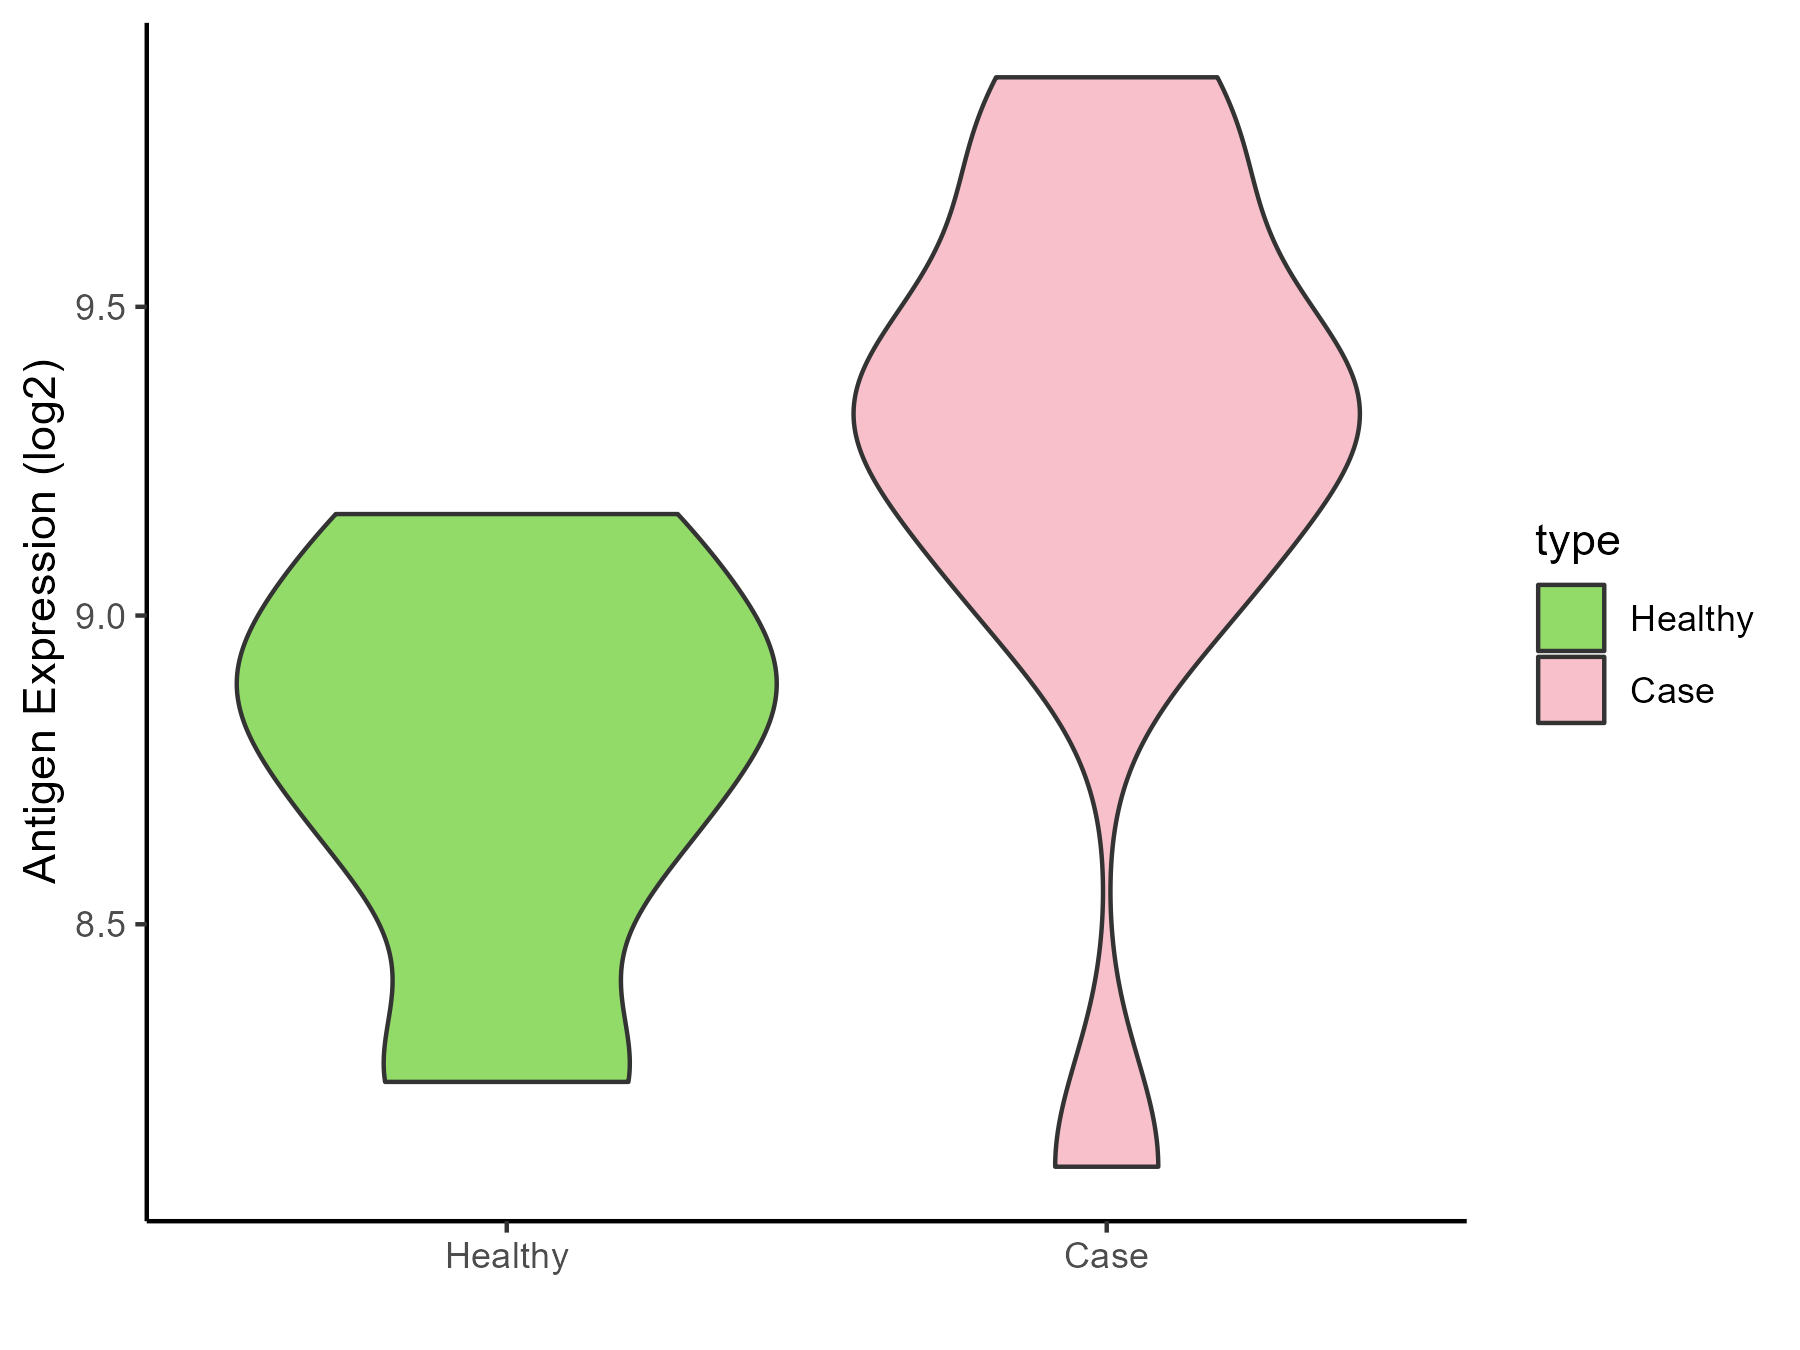
| Differential expression pattern of antigen in diseases | ||
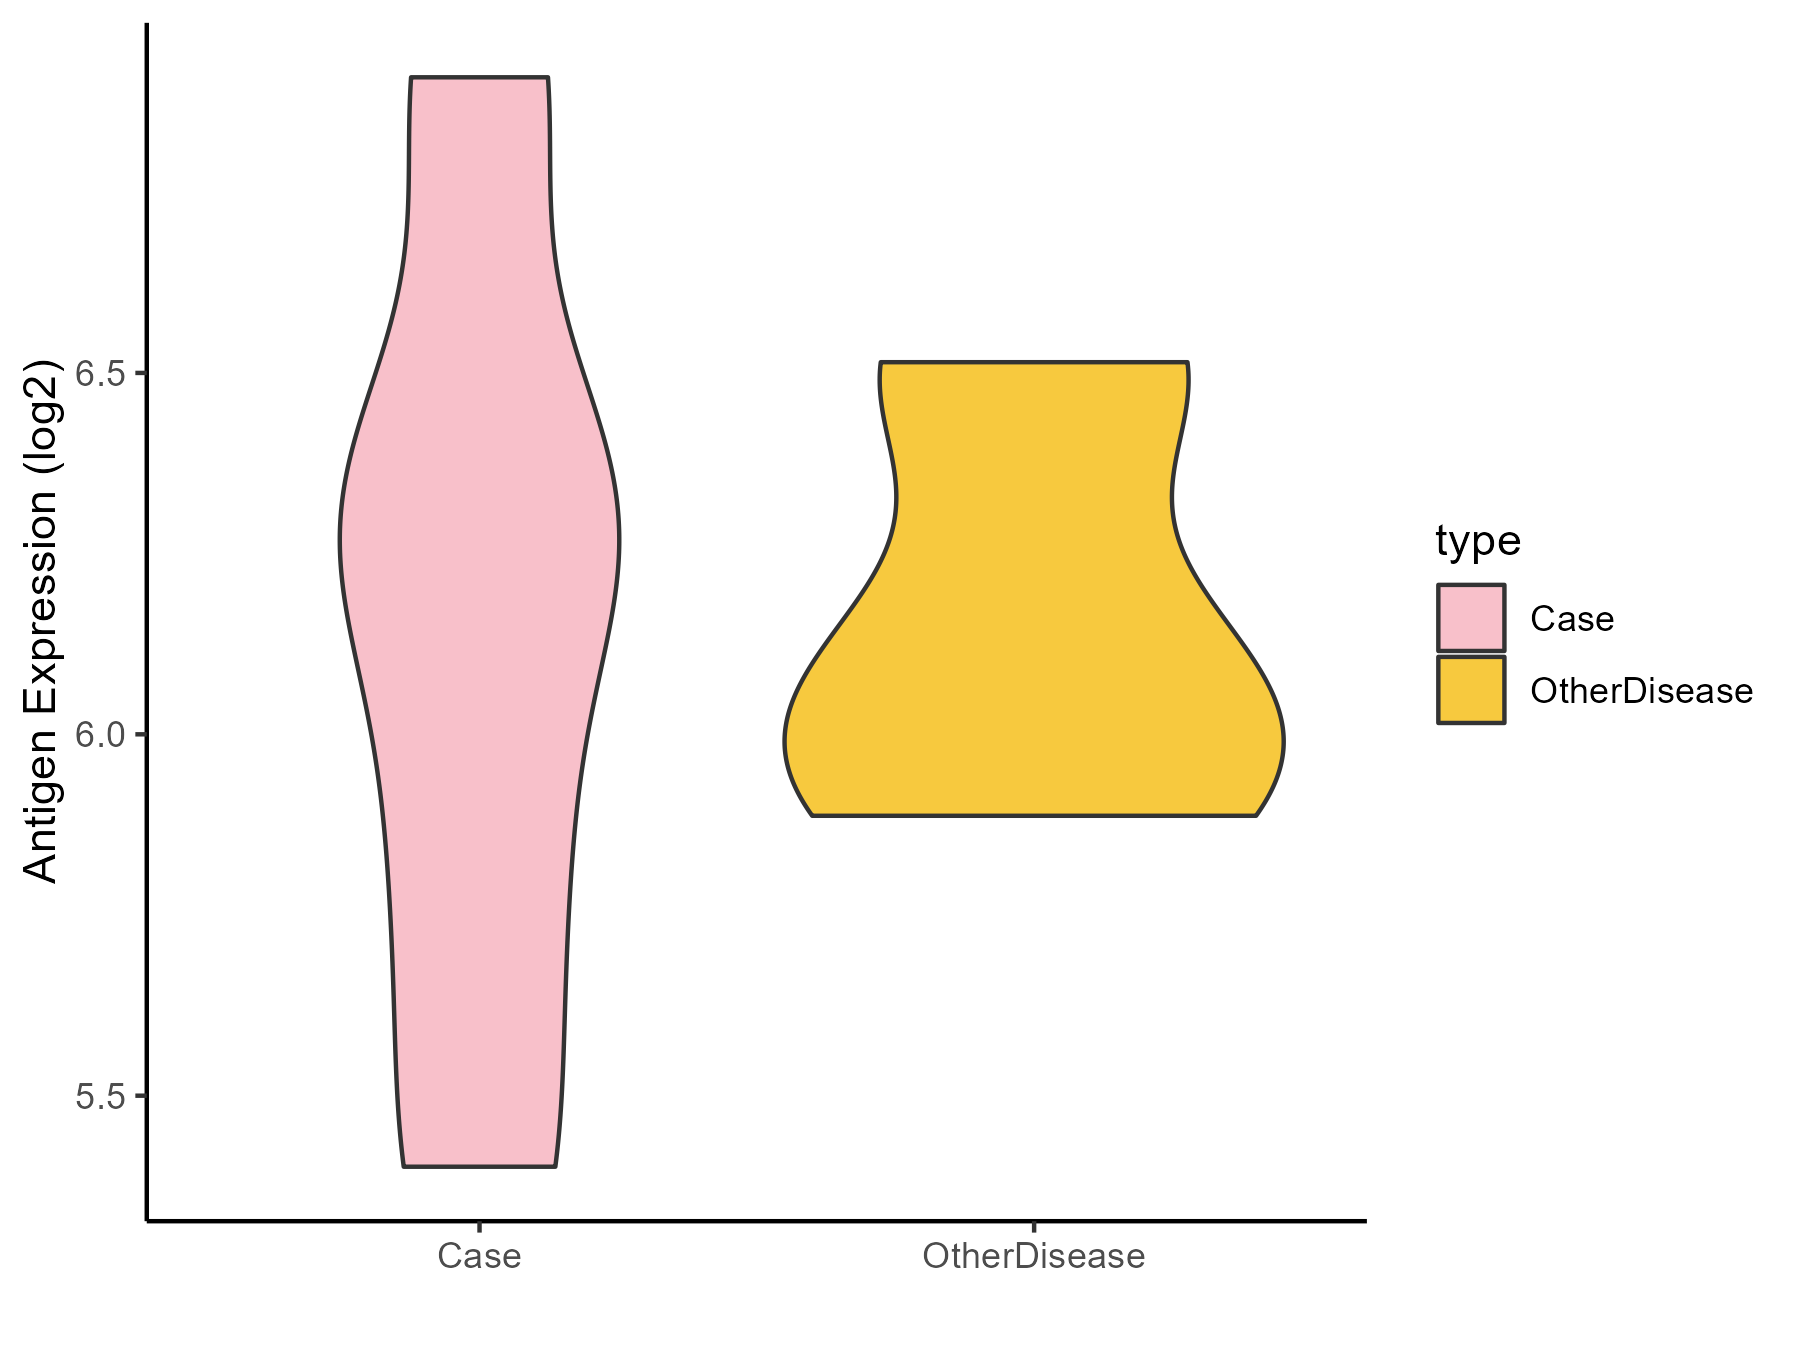
| The Studied Tissue | Liver | |
| The Specific Disease | Liver cancer | |
| The Expression Level of Disease Section Compare with the Healthy Individual Tissue | p-value: 7.10E-34; Fold-change: -1.665007574; Z-score: -3.42455483 | |
| The Expression Level of Disease Section Compare with the Adjacent Tissue | p-value: 1.45E-61; Fold-change: -2.16102461; Z-score: -2.258240708 | |
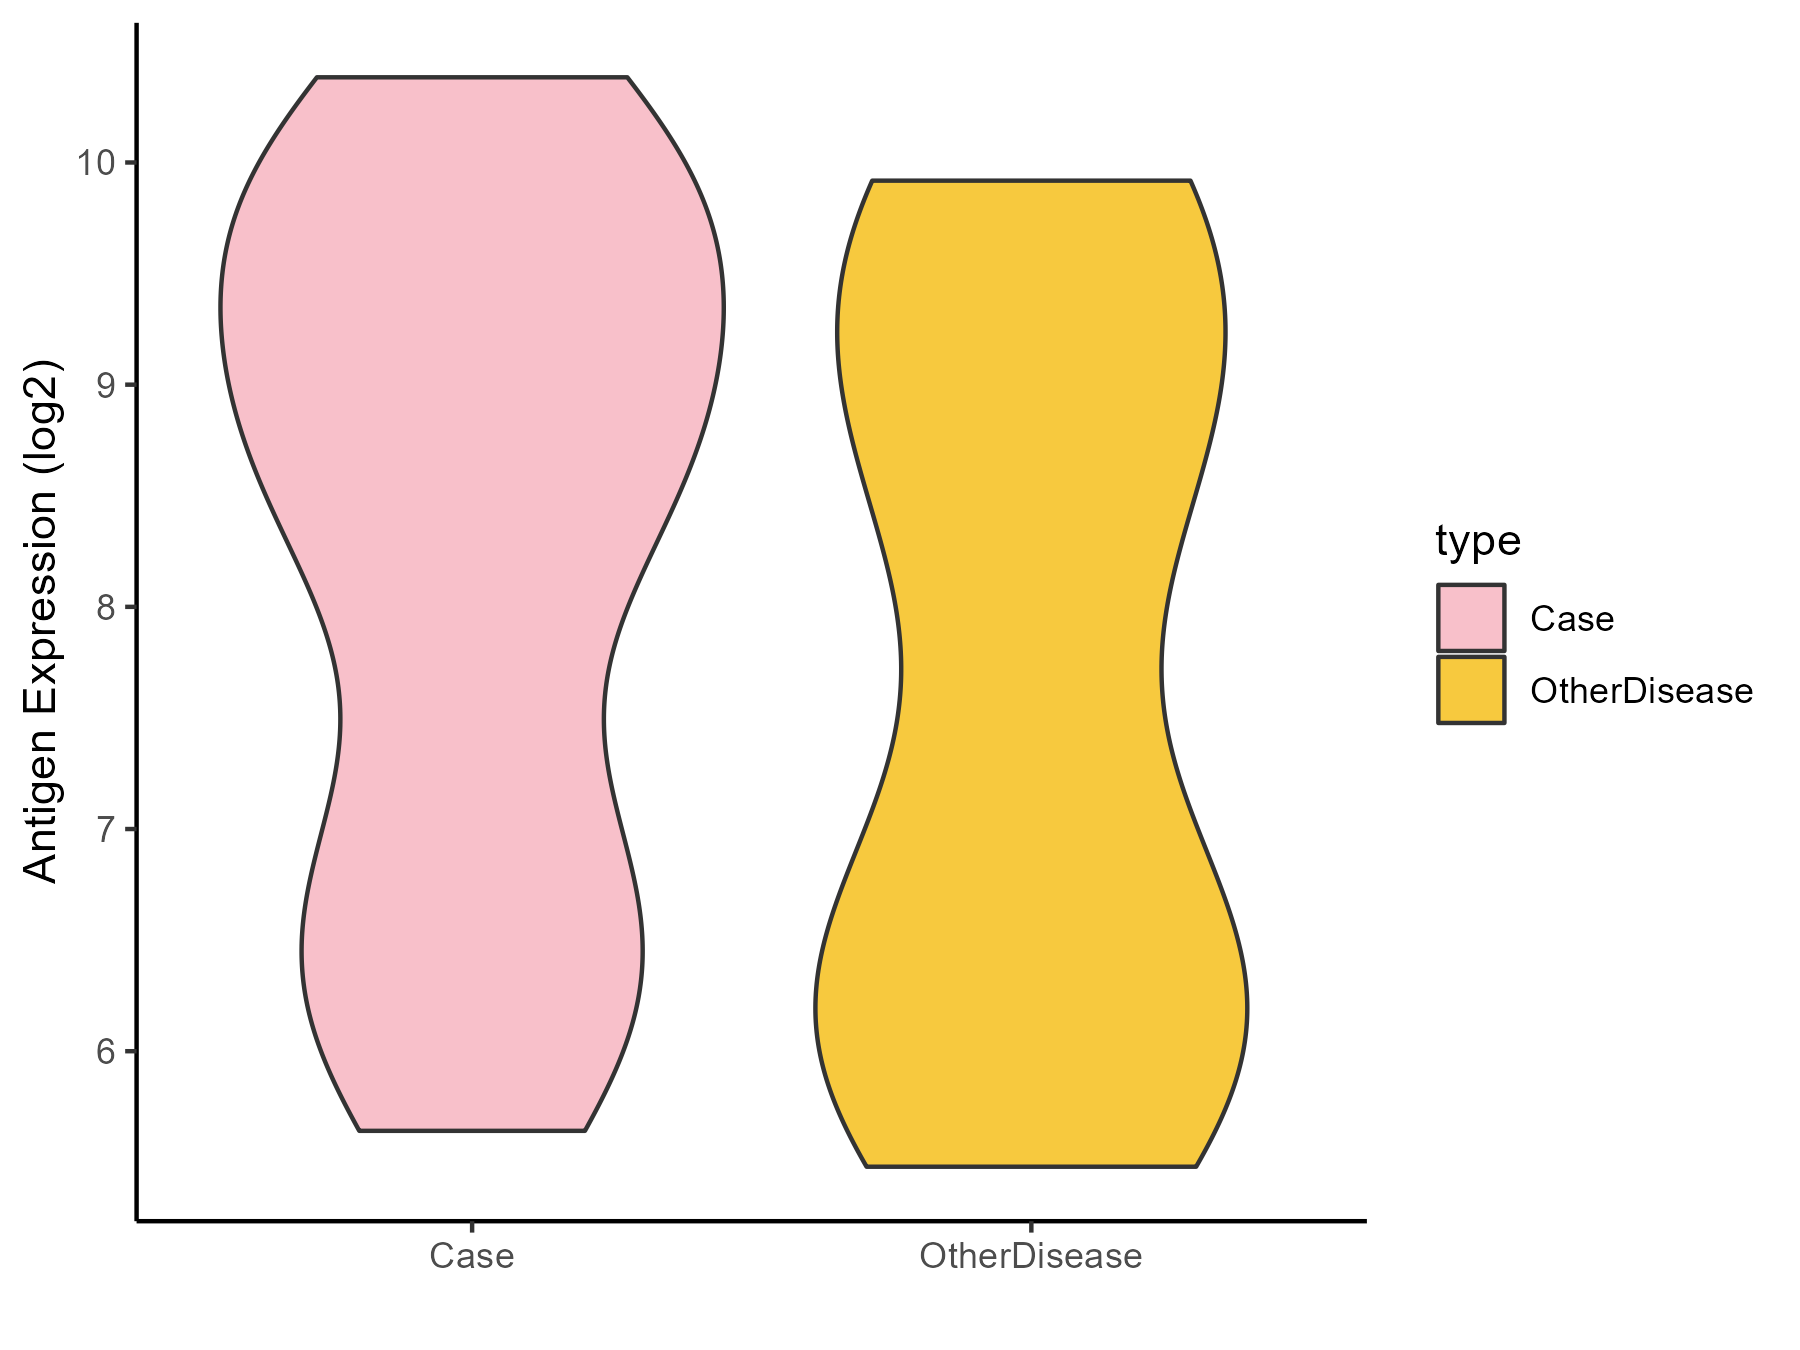
| The Expression Level of Disease Section Compare with the Other Disease Section | p-value: 3.38E-05; Fold-change: -2.566896384; Z-score: -8.776730617 | |
| Disease-specific Antigen Abundances |
|
Click to View the Clearer Original Diagram |
| Differential expression pattern of antigen in diseases | ||
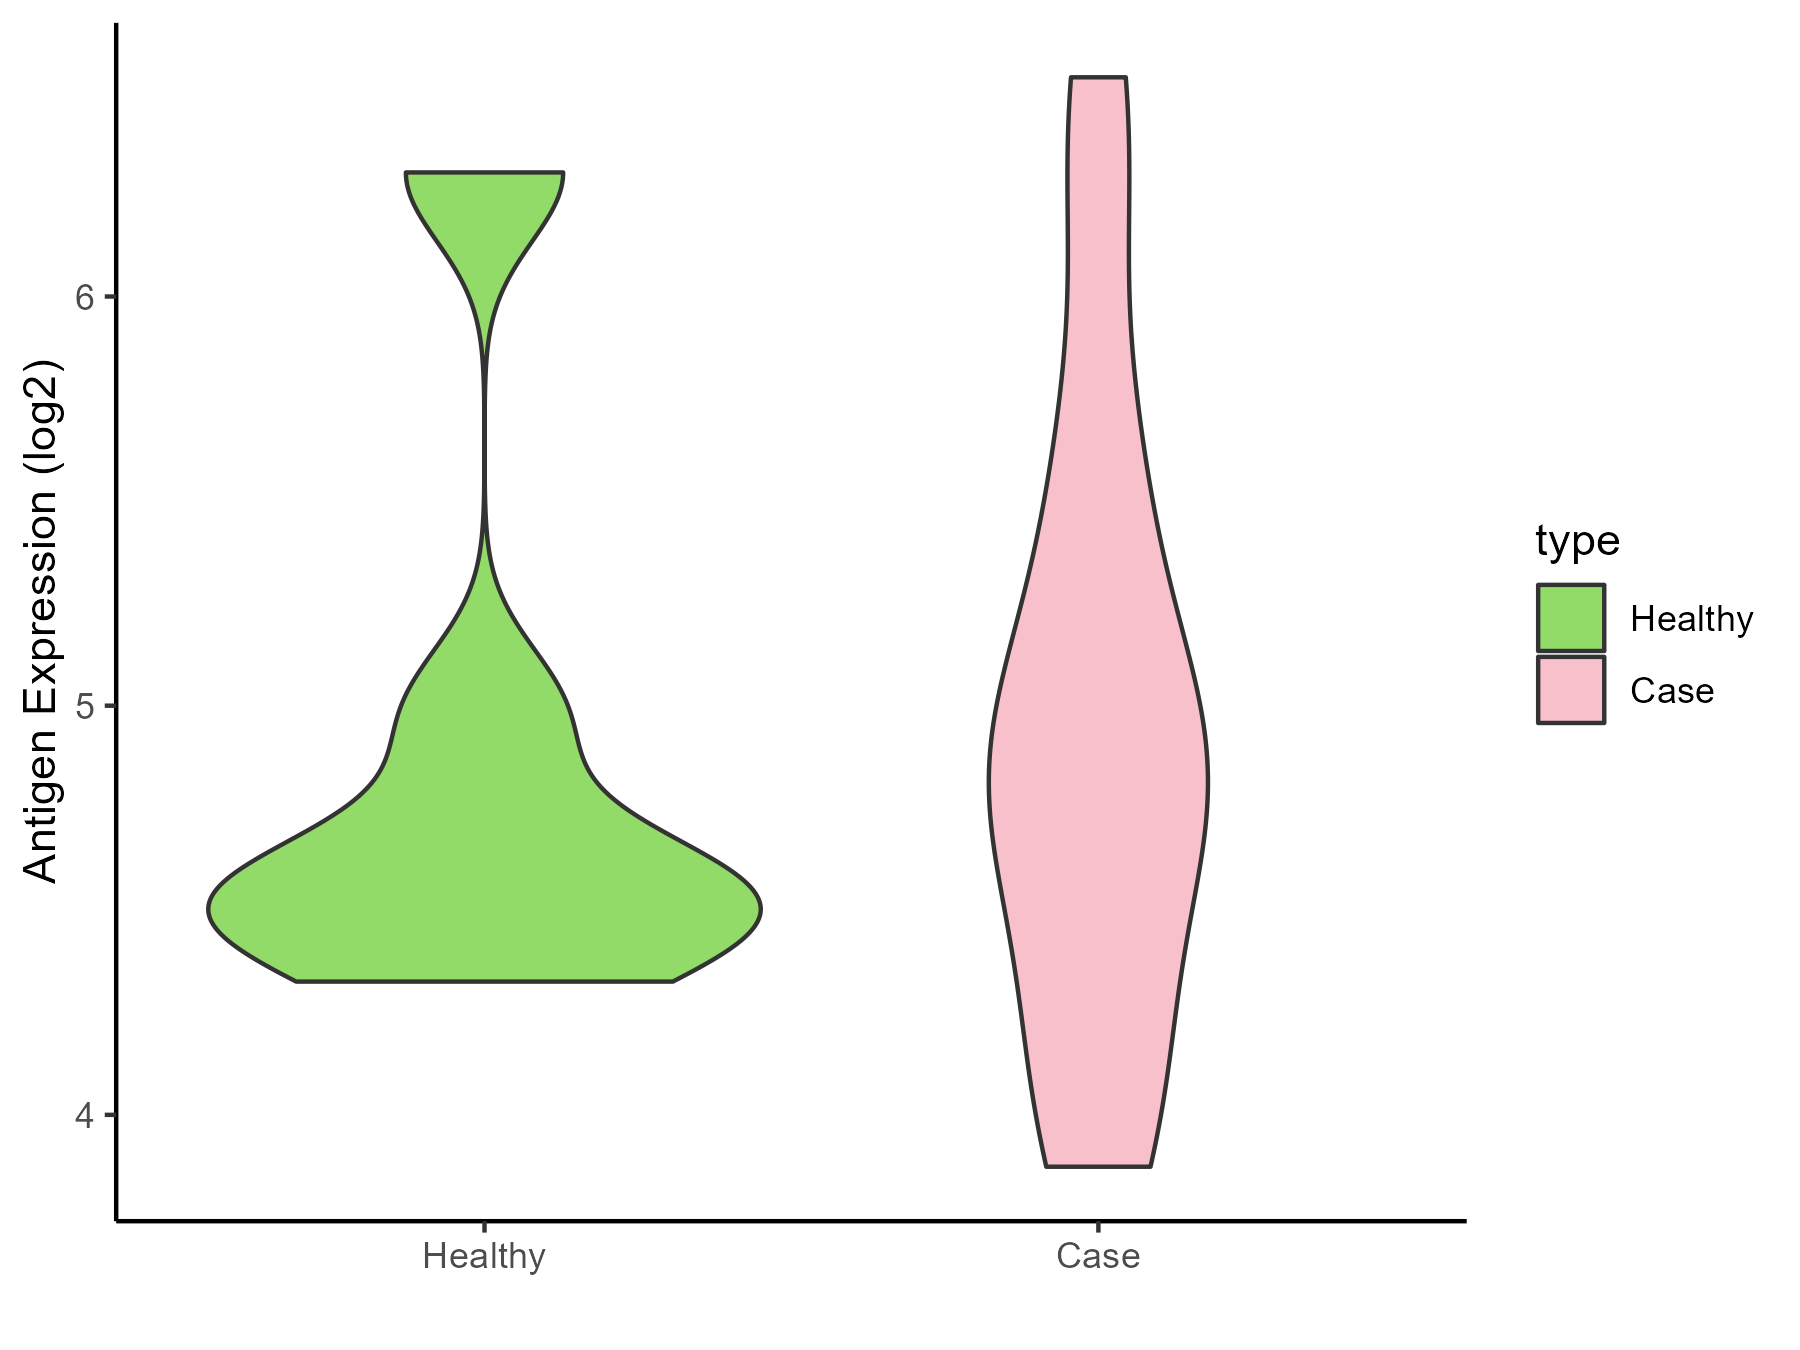
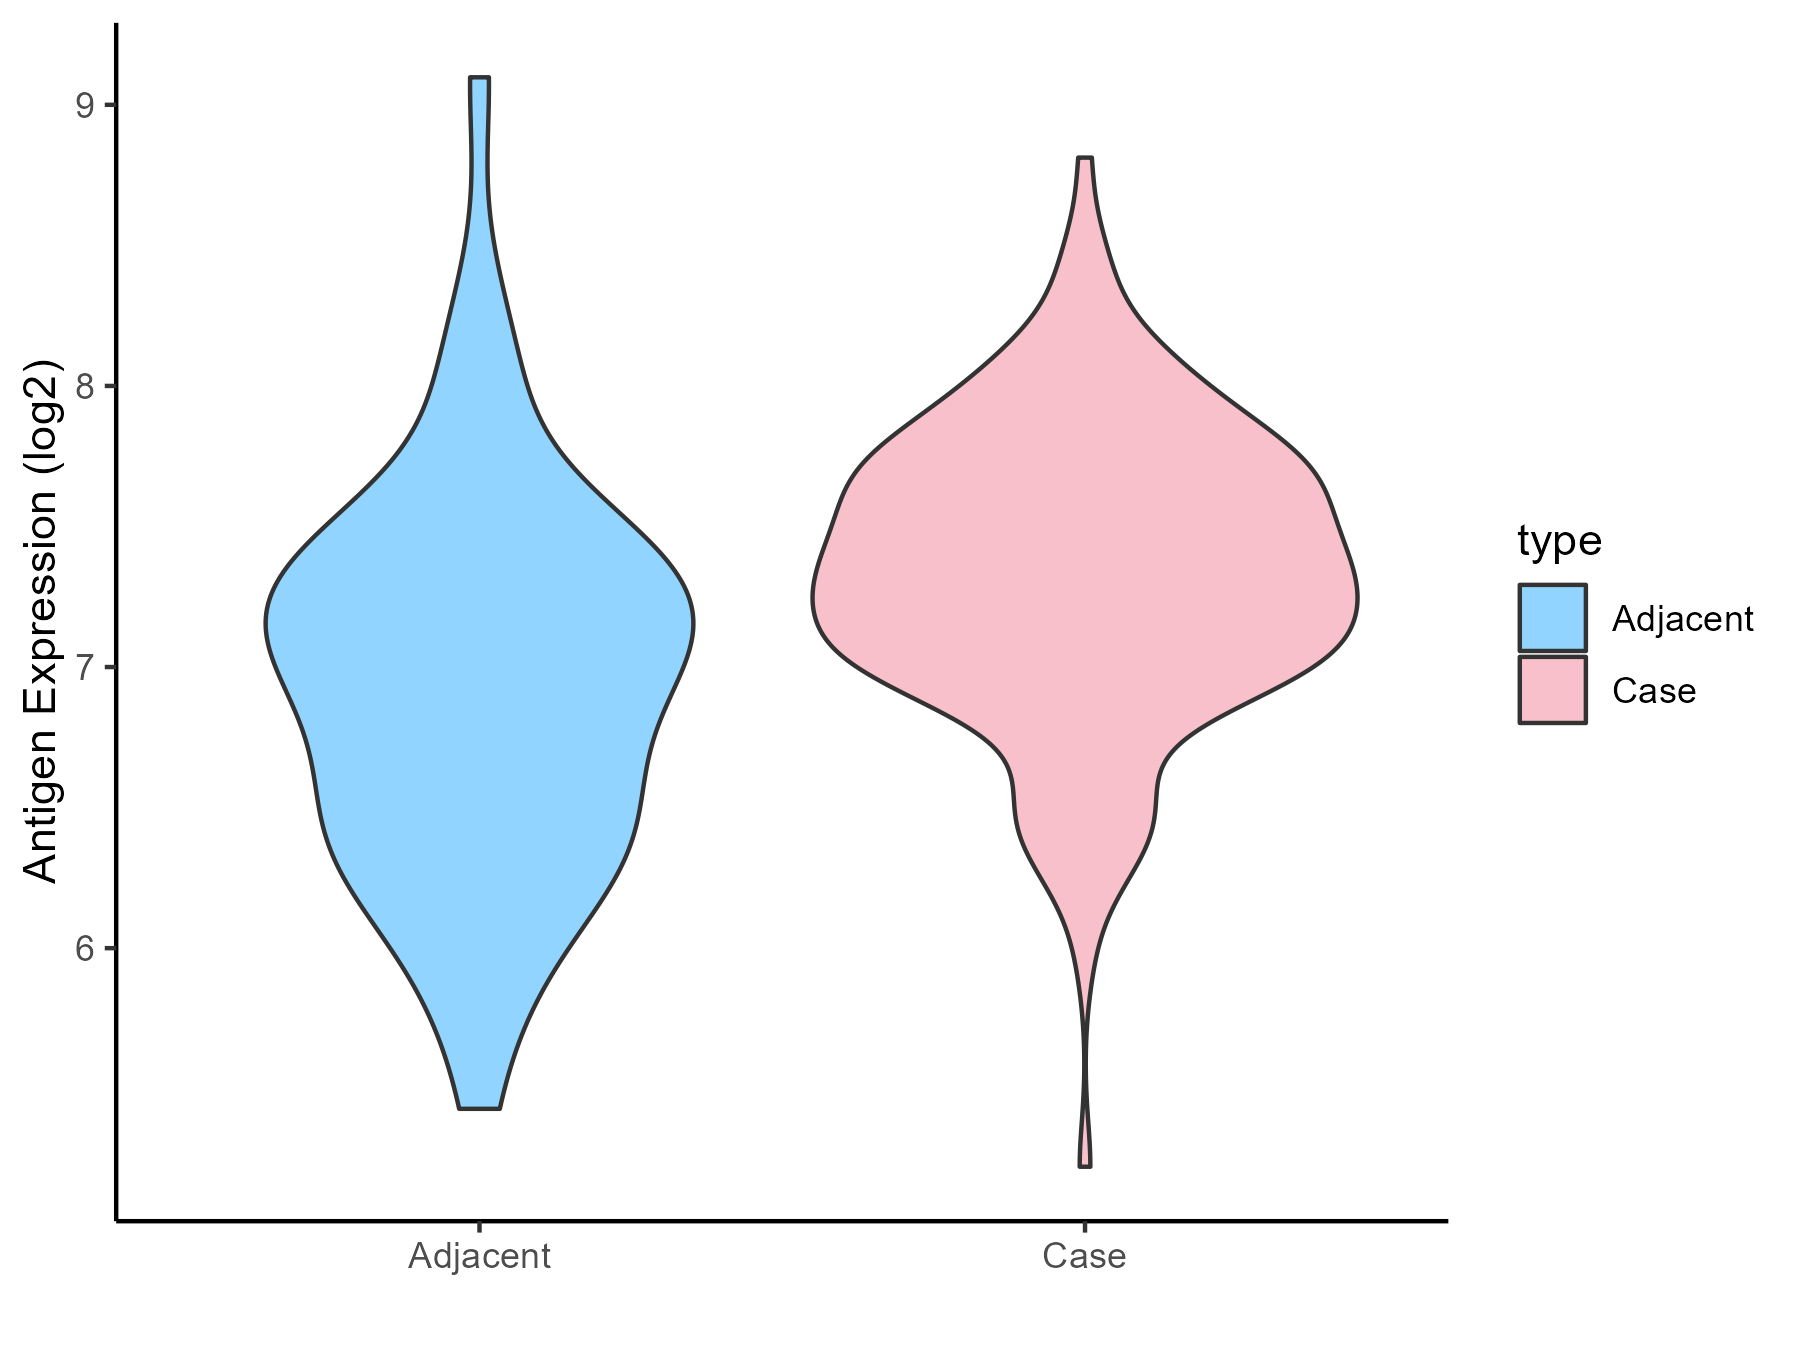
| The Studied Tissue | Lung | |
| The Specific Disease | Lung cancer | |
| The Expression Level of Disease Section Compare with the Healthy Individual Tissue | p-value: 1.89E-139; Fold-change: -1.857395143; Z-score: -3.325317042 | |
| The Expression Level of Disease Section Compare with the Adjacent Tissue | p-value: 6.96E-74; Fold-change: -1.56995776; Z-score: -2.766606344 | |
| Disease-specific Antigen Abundances |
|
Click to View the Clearer Original Diagram |
| Differential expression pattern of antigen in diseases | ||
| The Studied Tissue | Skin | |
| The Specific Disease | Melanoma | |
| The Expression Level of Disease Section Compare with the Healthy Individual Tissue | p-value: 0.077415103; Fold-change: 0.394142203; Z-score: 0.180471258 | |
| Disease-specific Antigen Abundances |
|
Click to View the Clearer Original Diagram |
| Differential expression pattern of antigen in diseases | ||
| The Studied Tissue | Muscle | |
| The Specific Disease | Sarcoma | |
| The Expression Level of Disease Section Compare with the Healthy Individual Tissue | p-value: 3.74E-79; Fold-change: 1.969335365; Z-score: 2.354004948 | |
| The Expression Level of Disease Section Compare with the Adjacent Tissue | p-value: 0.006997459; Fold-change: 3.251054092; Z-score: 3.16545221 | |
| Disease-specific Antigen Abundances |
|
Click to View the Clearer Original Diagram |
| Differential expression pattern of antigen in diseases | ||
| The Studied Tissue | Breast | |
| The Specific Disease | Breast cancer | |
| The Expression Level of Disease Section Compare with the Healthy Individual Tissue | p-value: 6.54E-74; Fold-change: -2.359493596; Z-score: -1.741575071 | |
| The Expression Level of Disease Section Compare with the Adjacent Tissue | p-value: 1.13E-13; Fold-change: -1.890960464; Z-score: -1.466530381 | |
| Disease-specific Antigen Abundances |
|
Click to View the Clearer Original Diagram |
| Differential expression pattern of antigen in diseases | ||
| The Studied Tissue | Ovarian | |
| The Specific Disease | Ovarian cancer | |
| The Expression Level of Disease Section Compare with the Healthy Individual Tissue | p-value: 0.785676174; Fold-change: 0.28497459; Z-score: 0.276568841 | |
| The Expression Level of Disease Section Compare with the Adjacent Tissue | p-value: 0.249360955; Fold-change: 0.752045863; Z-score: 0.361537157 | |
| Disease-specific Antigen Abundances |
|
Click to View the Clearer Original Diagram |
| Differential expression pattern of antigen in diseases | ||
| The Studied Tissue | Cervical | |
| The Specific Disease | Cervical cancer | |
| The Expression Level of Disease Section Compare with the Healthy Individual Tissue | p-value: 3.52E-06; Fold-change: 0.664028492; Z-score: 1.257529876 | |
| Disease-specific Antigen Abundances |
|
Click to View the Clearer Original Diagram |
| Differential expression pattern of antigen in diseases | ||
| The Studied Tissue | Endometrium | |
| The Specific Disease | Uterine cancer | |
| The Expression Level of Disease Section Compare with the Healthy Individual Tissue | p-value: 0.771903269; Fold-change: -0.238561555; Z-score: -0.243134039 | |
| The Expression Level of Disease Section Compare with the Adjacent Tissue | p-value: 4.83E-06; Fold-change: 3.009557184; Z-score: 7.883304503 | |
| Disease-specific Antigen Abundances |
|
Click to View the Clearer Original Diagram |
| Differential expression pattern of antigen in diseases | ||
| The Studied Tissue | Prostate | |
| The Specific Disease | Prostate cancer | |
| The Expression Level of Disease Section Compare with the Healthy Individual Tissue | p-value: 0.179519888; Fold-change: 1.755779035; Z-score: 1.000818114 | |
| Disease-specific Antigen Abundances |
|
Click to View the Clearer Original Diagram |
| Differential expression pattern of antigen in diseases | ||
| The Studied Tissue | Bladder | |
| The Specific Disease | Bladder cancer | |
| The Expression Level of Disease Section Compare with the Healthy Individual Tissue | p-value: 0.000914417; Fold-change: -1.575920507; Z-score: -2.548451628 | |
| Disease-specific Antigen Abundances |
|
Click to View the Clearer Original Diagram |
| Differential expression pattern of antigen in diseases | ||
| The Studied Tissue | Uvea | |
| The Specific Disease | Retinoblastoma tumor | |
| The Expression Level of Disease Section Compare with the Healthy Individual Tissue | p-value: 4.98E-09; Fold-change: 4.537174401; Z-score: 23.52918482 | |
| Disease-specific Antigen Abundances |
|
Click to View the Clearer Original Diagram |
| Differential expression pattern of antigen in diseases | ||
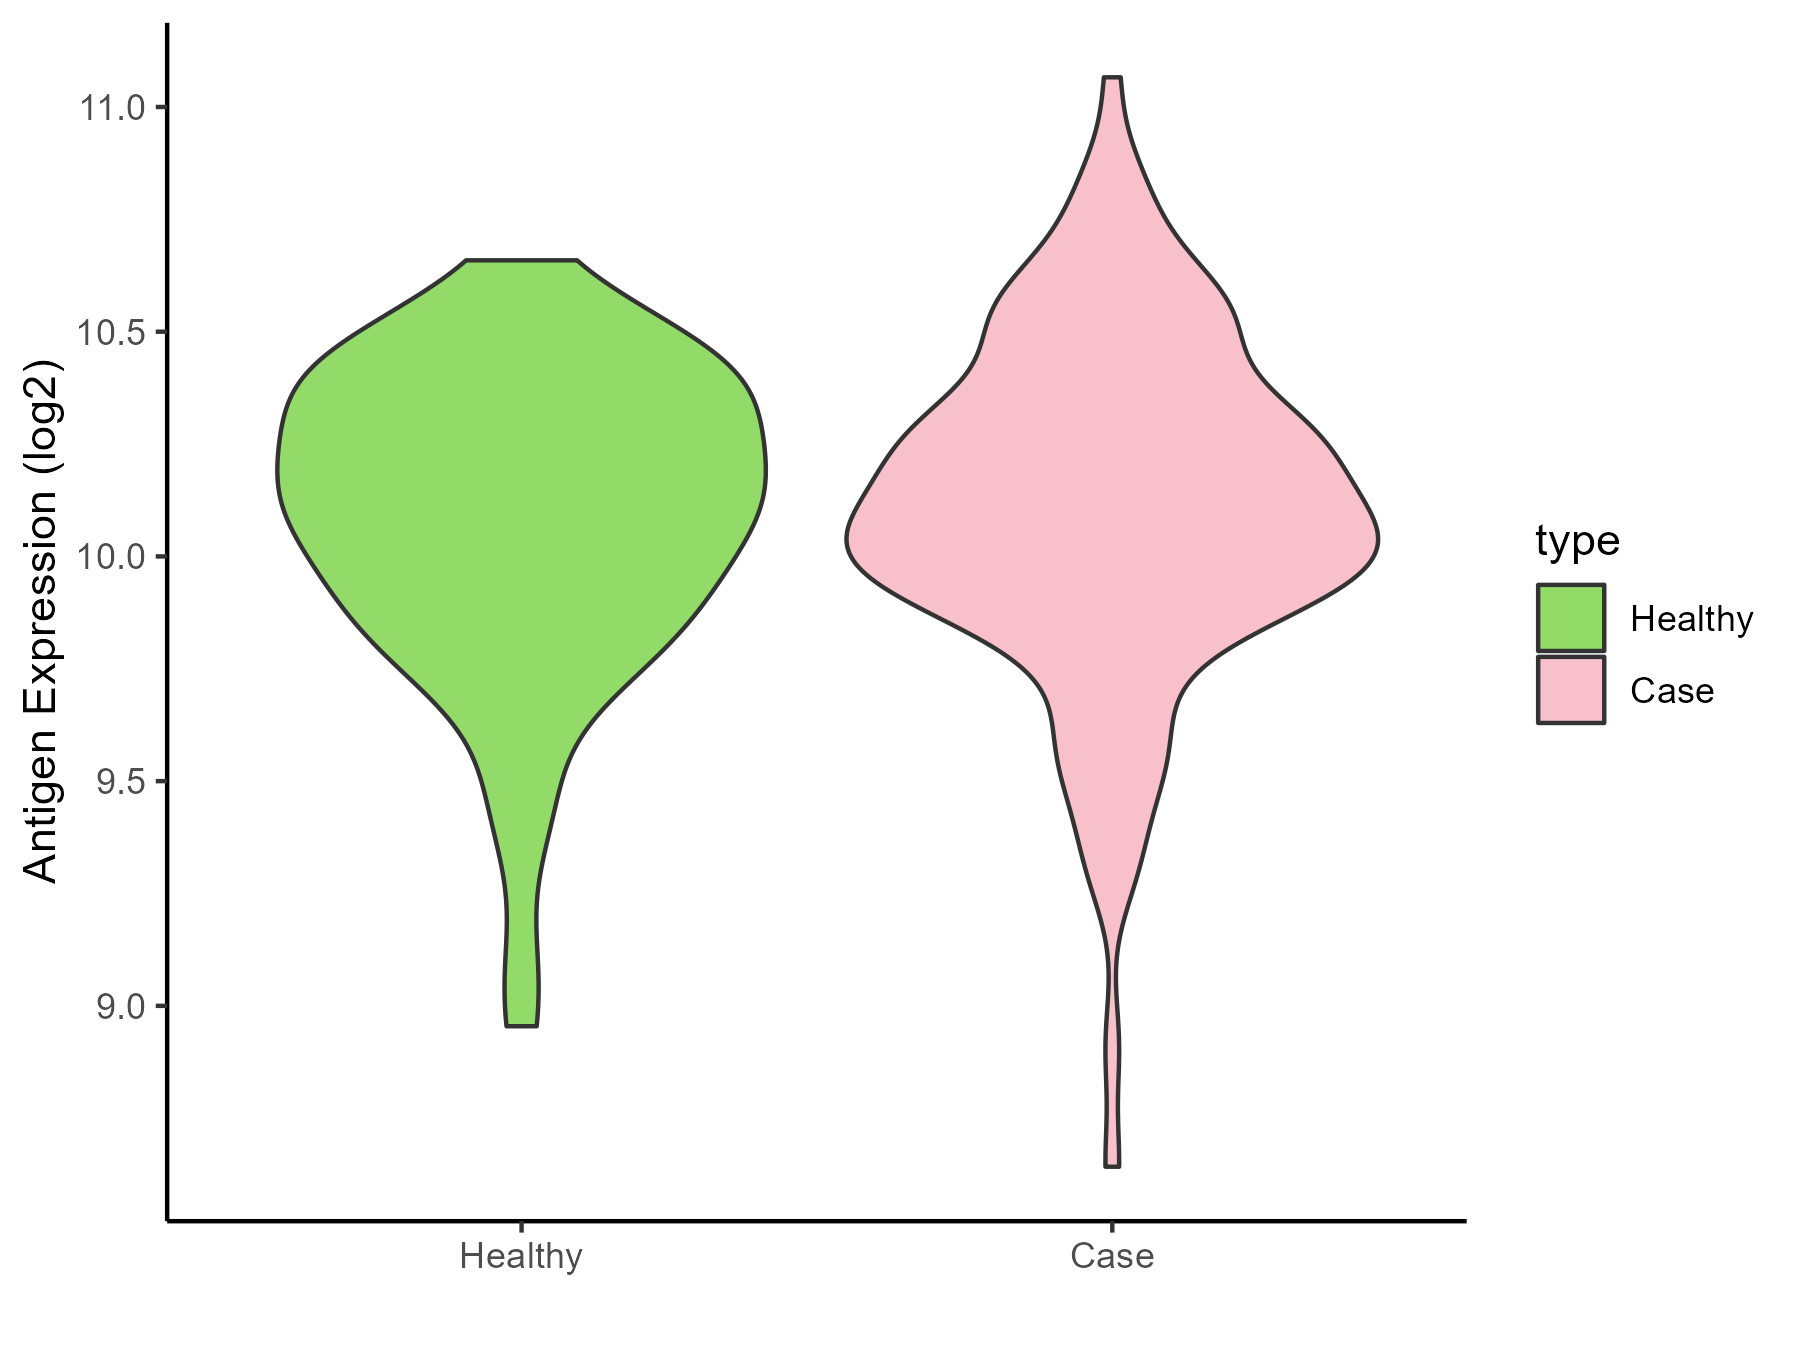
| The Studied Tissue | Thyroid | |
| The Specific Disease | Thyroid cancer | |
| The Expression Level of Disease Section Compare with the Healthy Individual Tissue | p-value: 1.32E-08; Fold-change: 0.596753366; Z-score: 1.276741817 | |
| The Expression Level of Disease Section Compare with the Adjacent Tissue | p-value: 0.014844088; Fold-change: 0.491276075; Z-score: 0.584075197 | |
| Disease-specific Antigen Abundances |
|
Click to View the Clearer Original Diagram |
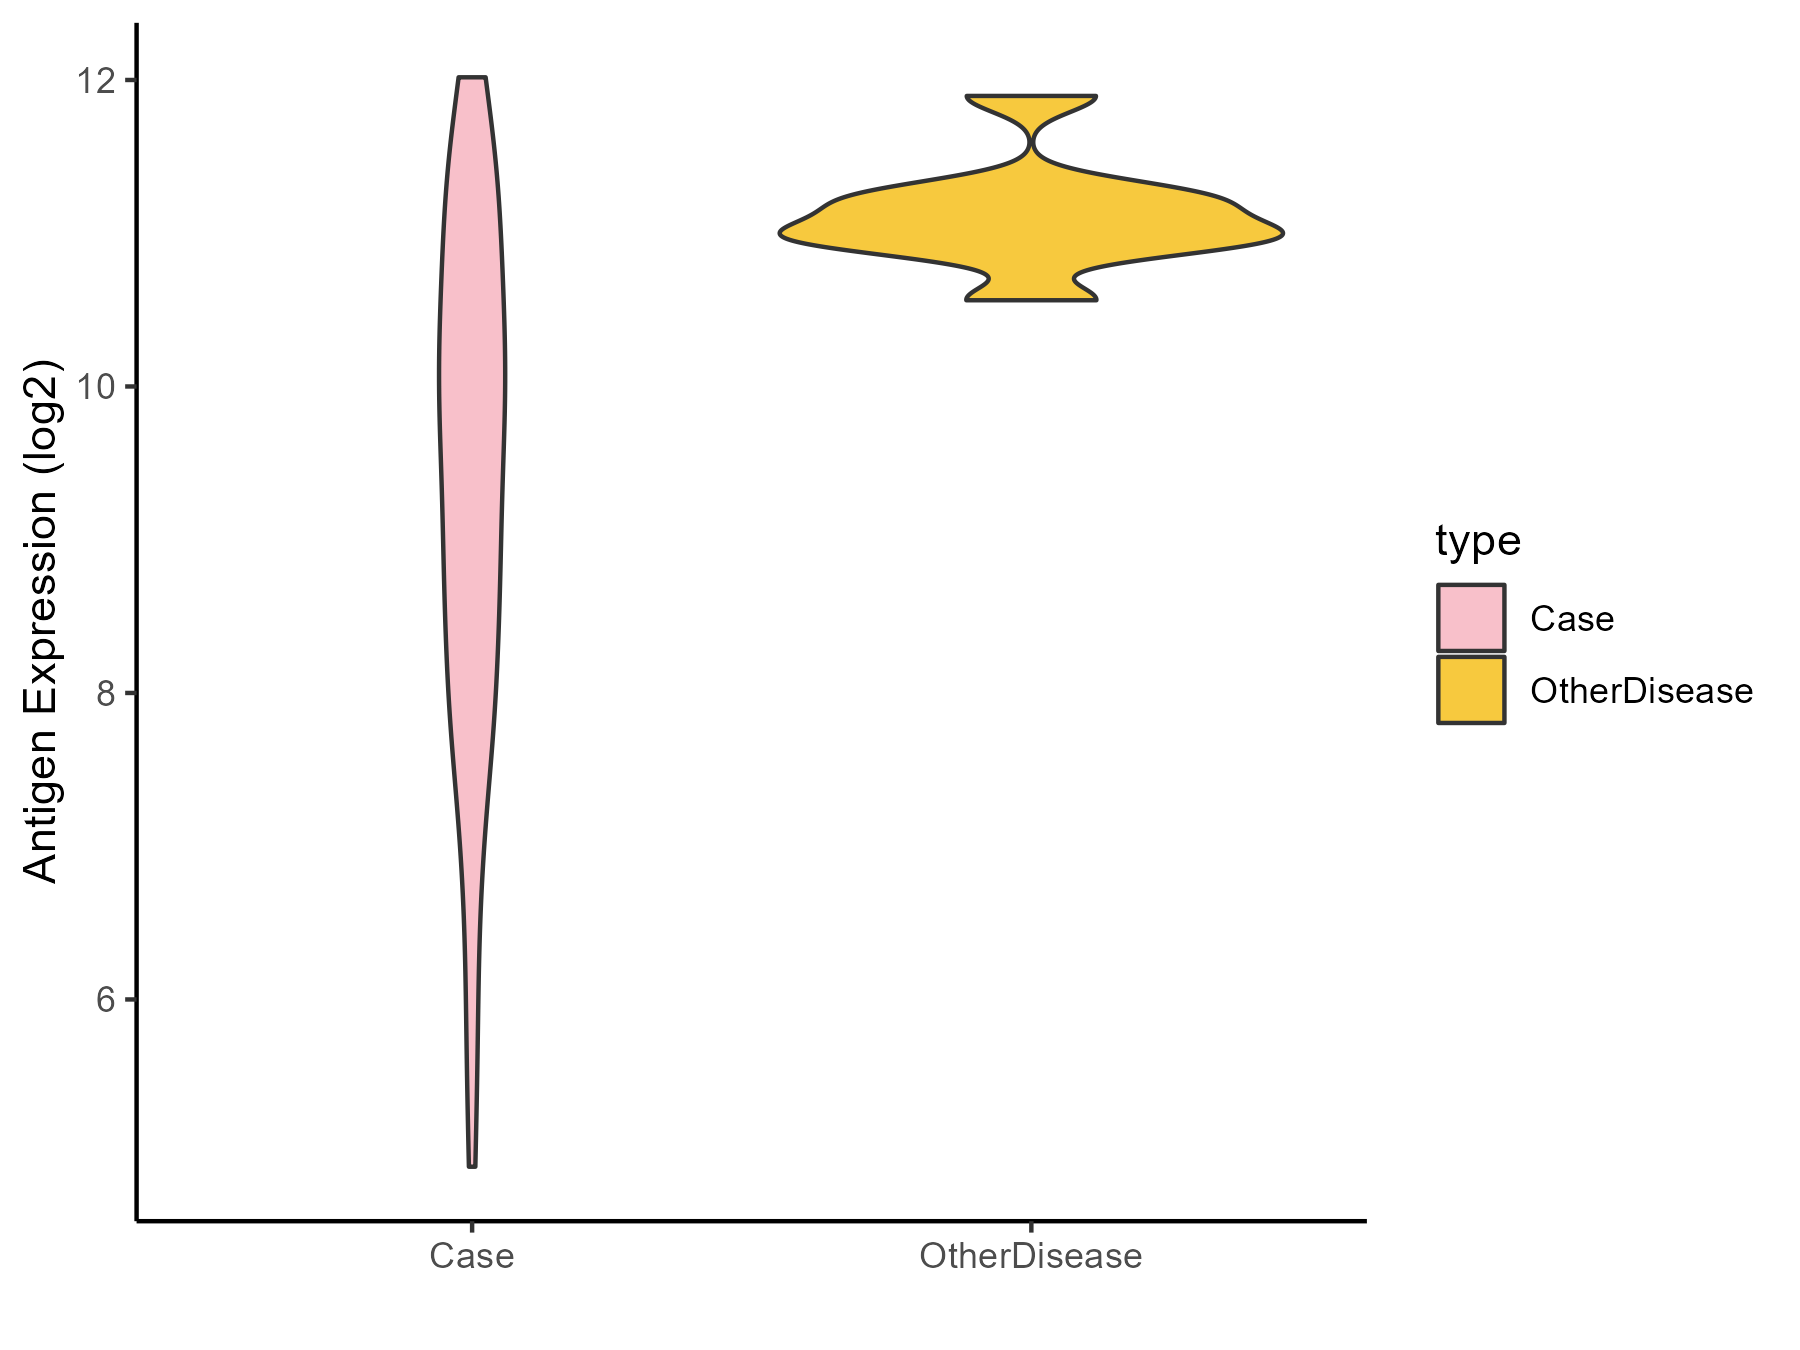
| Differential expression pattern of antigen in diseases | ||
| The Studied Tissue | Adrenal cortex | |
| The Specific Disease | Adrenocortical carcinoma | |
| The Expression Level of Disease Section Compare with the Other Disease Section | p-value: 2.69E-17; Fold-change: -1.293674115; Z-score: -3.676698628 | |
| Disease-specific Antigen Abundances |
|
Click to View the Clearer Original Diagram |
| Differential expression pattern of antigen in diseases | ||
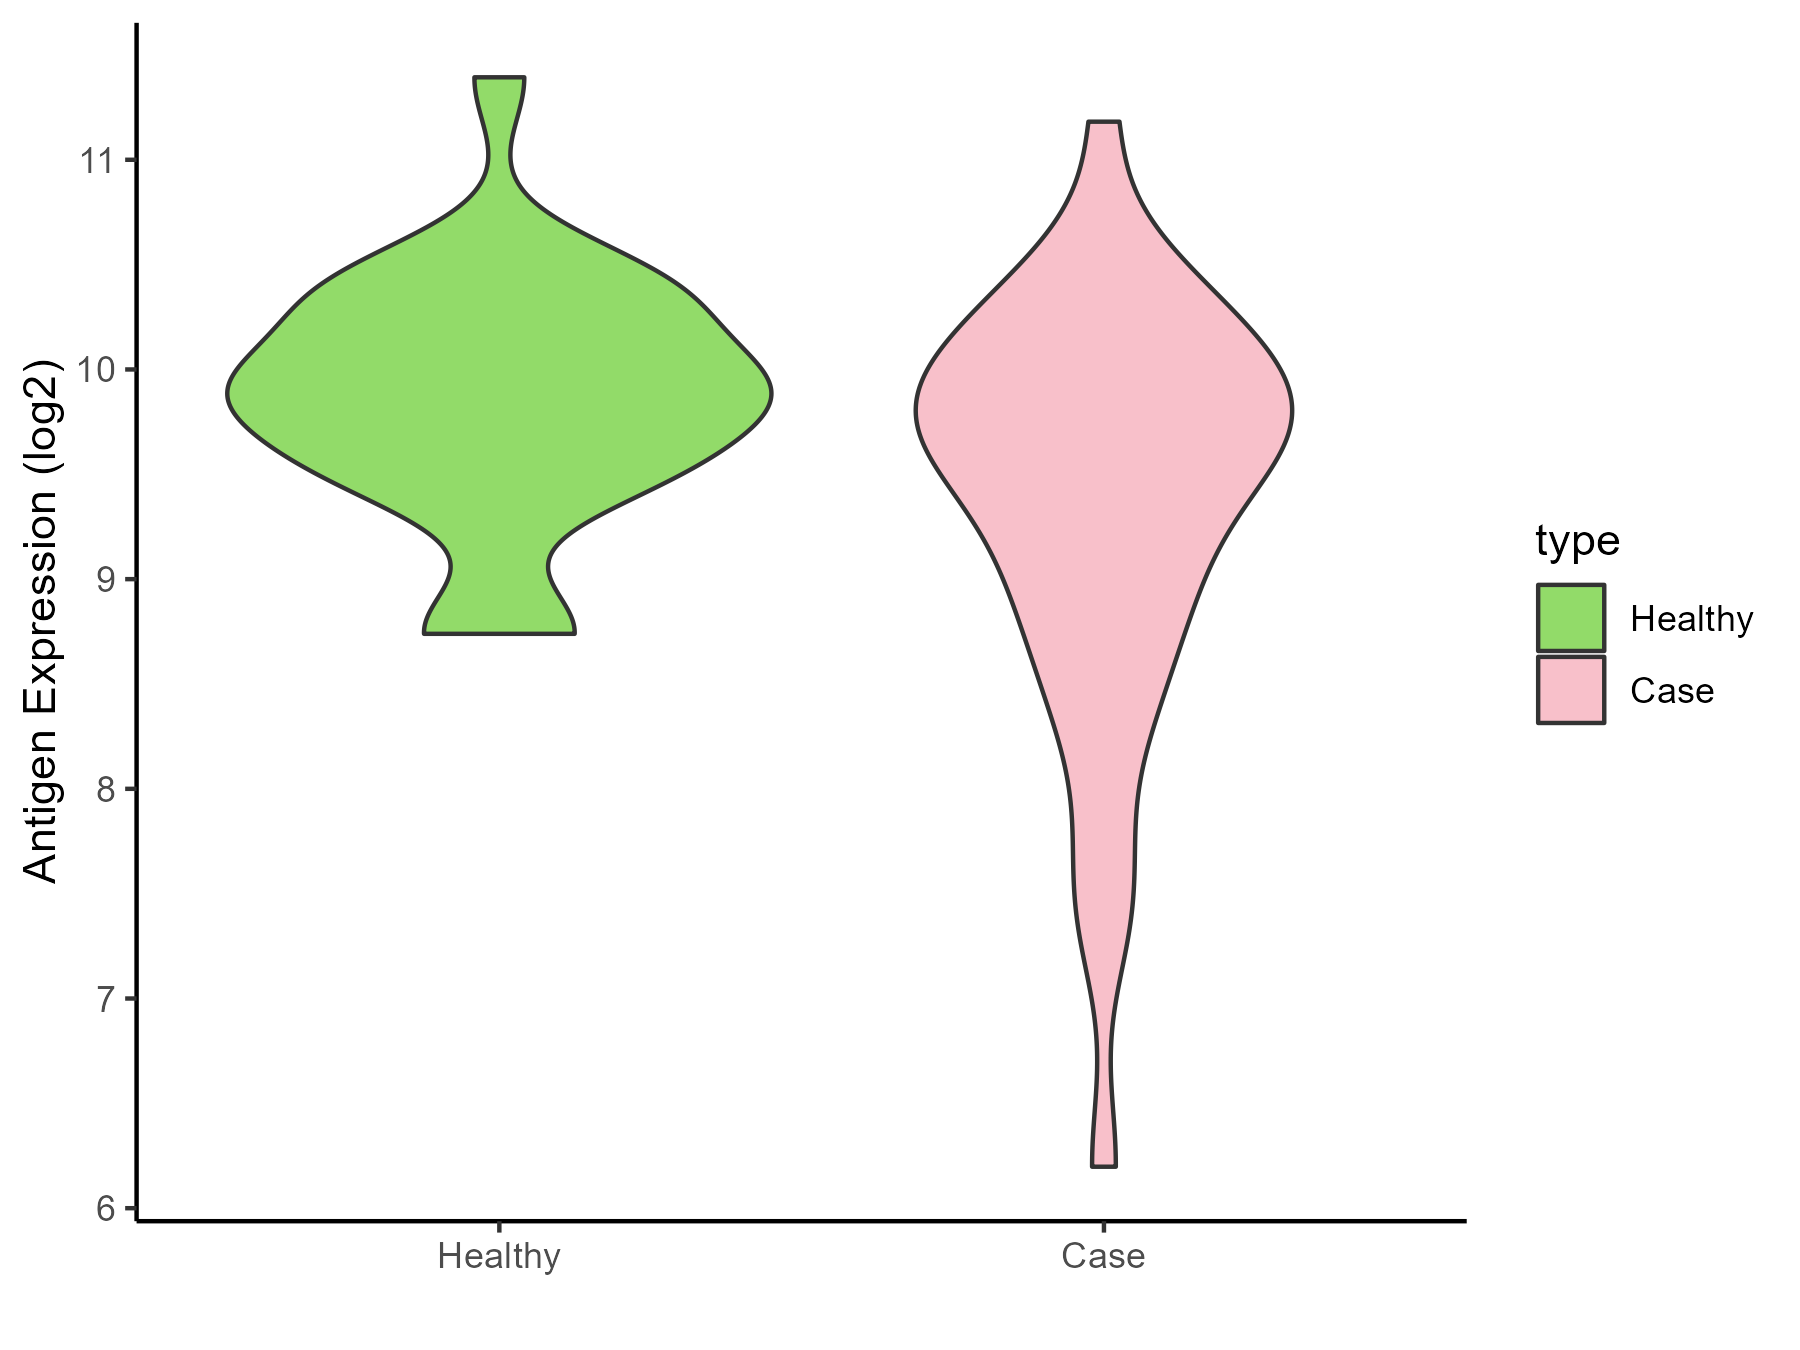
| The Studied Tissue | Head and neck | |
| The Specific Disease | Head and neck cancer | |
| The Expression Level of Disease Section Compare with the Healthy Individual Tissue | p-value: 3.80E-16; Fold-change: 1.593162373; Z-score: 0.985393532 | |
| Disease-specific Antigen Abundances |
|
Click to View the Clearer Original Diagram |
| Differential expression pattern of antigen in diseases | ||
| The Studied Tissue | Pituitary | |
| The Specific Disease | Pituitary gonadotrope tumor | |
| The Expression Level of Disease Section Compare with the Healthy Individual Tissue | p-value: 0.018327119; Fold-change: -0.799977768; Z-score: -1.049353496 | |
| Disease-specific Antigen Abundances |
|
Click to View the Clearer Original Diagram |
| The Studied Tissue | Pituitary | |
| The Specific Disease | Pituitary cancer | |
| The Expression Level of Disease Section Compare with the Healthy Individual Tissue | p-value: 0.085134234; Fold-change: -1.038471696; Z-score: -1.117416786 | |
| Disease-specific Antigen Abundances |
|
Click to View the Clearer Original Diagram |
ICD Disease Classification 03
| Differential expression pattern of antigen in diseases | ||
| The Studied Tissue | Whole blood | |
| The Specific Disease | Thrombocytopenia | |
| The Expression Level of Disease Section Compare with the Healthy Individual Tissue | p-value: 0.454401595; Fold-change: 1.146777816; Z-score: 1.039033938 | |
| Disease-specific Antigen Abundances |
|
Click to View the Clearer Original Diagram |
ICD Disease Classification 04
| Differential expression pattern of antigen in diseases | ||
| The Studied Tissue | Whole blood | |
| The Specific Disease | Lupus erythematosus | |
| The Expression Level of Disease Section Compare with the Healthy Individual Tissue | p-value: 0.60864789; Fold-change: 0.058581882; Z-score: 0.070148439 | |
| Disease-specific Antigen Abundances |
|
Click to View the Clearer Original Diagram |
| Differential expression pattern of antigen in diseases | ||
| The Studied Tissue | Peripheral monocyte | |
| The Specific Disease | Autoimmune uveitis | |
| The Expression Level of Disease Section Compare with the Healthy Individual Tissue | p-value: 0.379051325; Fold-change: 0.253438924; Z-score: 0.588480536 | |
| Disease-specific Antigen Abundances |
|
Click to View the Clearer Original Diagram |
ICD Disease Classification 05
| Differential expression pattern of antigen in diseases | ||
| The Studied Tissue | Whole blood | |
| The Specific Disease | Familial hypercholesterolemia | |
| The Expression Level of Disease Section Compare with the Healthy Individual Tissue | p-value: 0.331249366; Fold-change: 0.266655254; Z-score: 0.603449179 | |
| Disease-specific Antigen Abundances |
|
Click to View the Clearer Original Diagram |
ICD Disease Classification 06
| Differential expression pattern of antigen in diseases | ||
| The Studied Tissue | Superior temporal cortex | |
| The Specific Disease | Schizophrenia | |
| The Expression Level of Disease Section Compare with the Healthy Individual Tissue | p-value: 0.777274263; Fold-change: 0.19107332; Z-score: 0.373502621 | |
| Disease-specific Antigen Abundances |
|
Click to View the Clearer Original Diagram |
ICD Disease Classification 08
| Differential expression pattern of antigen in diseases | ||
| The Studied Tissue | Spinal cord | |
| The Specific Disease | Multiple sclerosis | |
| The Expression Level of Disease Section Compare with the Adjacent Tissue | p-value: 0.397362615; Fold-change: 0.81761569; Z-score: 1.080622307 | |
| Disease-specific Antigen Abundances |
|
Click to View the Clearer Original Diagram |
| The Studied Tissue | Plasmacytoid dendritic cells | |
| The Specific Disease | Multiple sclerosis | |
| The Expression Level of Disease Section Compare with the Healthy Individual Tissue | p-value: 0.827695671; Fold-change: 0.27430292; Z-score: 0.373290034 | |
| Disease-specific Antigen Abundances |
|
Click to View the Clearer Original Diagram |
| Differential expression pattern of antigen in diseases | ||
| The Studied Tissue | Peritumoral cortex | |
| The Specific Disease | Epilepsy | |
| The Expression Level of Disease Section Compare with the Other Disease Section | p-value: 0.967368737; Fold-change: 0.203437061; Z-score: 0.634048903 | |
| Disease-specific Antigen Abundances |
|
Click to View the Clearer Original Diagram |
| Differential expression pattern of antigen in diseases | ||
| The Studied Tissue | Whole blood | |
| The Specific Disease | Cardioembolic Stroke | |
| The Expression Level of Disease Section Compare with the Healthy Individual Tissue | p-value: 5.00E-05; Fold-change: 0.45552424; Z-score: 1.22786722 | |
| Disease-specific Antigen Abundances |
|
Click to View the Clearer Original Diagram |
| The Studied Tissue | Peripheral blood | |
| The Specific Disease | Ischemic stroke | |
| The Expression Level of Disease Section Compare with the Healthy Individual Tissue | p-value: 0.282925465; Fold-change: -0.029160658; Z-score: -0.042935472 | |
| Disease-specific Antigen Abundances |
|
Click to View the Clearer Original Diagram |
ICD Disease Classification 1
| Differential expression pattern of antigen in diseases | ||
| The Studied Tissue | White matter | |
| The Specific Disease | HIV | |
| The Expression Level of Disease Section Compare with the Healthy Individual Tissue | p-value: 0.504989793; Fold-change: -0.159069014; Z-score: -0.338387274 | |
| Disease-specific Antigen Abundances |
|
Click to View the Clearer Original Diagram |
| Differential expression pattern of antigen in diseases | ||
| The Studied Tissue | Whole blood | |
| The Specific Disease | Influenza | |
| The Expression Level of Disease Section Compare with the Healthy Individual Tissue | p-value: 0.561028898; Fold-change: -0.935073074; Z-score: -0.671337949 | |
| Disease-specific Antigen Abundances |
|
Click to View the Clearer Original Diagram |
| Differential expression pattern of antigen in diseases | ||
| The Studied Tissue | Whole blood | |
| The Specific Disease | Chronic hepatitis C | |
| The Expression Level of Disease Section Compare with the Healthy Individual Tissue | p-value: 0.42246418; Fold-change: 0.014827738; Z-score: 0.026229622 | |
| Disease-specific Antigen Abundances |
|
Click to View the Clearer Original Diagram |
| Differential expression pattern of antigen in diseases | ||
| The Studied Tissue | Whole blood | |
| The Specific Disease | Sepsis | |
| The Expression Level of Disease Section Compare with the Healthy Individual Tissue | p-value: 1.73E-13; Fold-change: 0.36204905; Z-score: 1.279779965 | |
| Disease-specific Antigen Abundances |
|
Click to View the Clearer Original Diagram |
| Differential expression pattern of antigen in diseases | ||
| The Studied Tissue | Whole blood | |
| The Specific Disease | Septic shock | |
| The Expression Level of Disease Section Compare with the Healthy Individual Tissue | p-value: 2.74E-26; Fold-change: 0.163088599; Z-score: 0.491745155 | |
| Disease-specific Antigen Abundances |
|
Click to View the Clearer Original Diagram |
| Differential expression pattern of antigen in diseases | ||
| The Studied Tissue | Peripheral blood | |
| The Specific Disease | Pediatric respiratory syncytial virus infection | |
| The Expression Level of Disease Section Compare with the Healthy Individual Tissue | p-value: 0.52842543; Fold-change: -0.06024097; Z-score: -0.310474409 | |
| Disease-specific Antigen Abundances |
|
Click to View the Clearer Original Diagram |
ICD Disease Classification 11
| Differential expression pattern of antigen in diseases | ||
| The Studied Tissue | Peripheral blood | |
| The Specific Disease | Essential hypertension | |
| The Expression Level of Disease Section Compare with the Healthy Individual Tissue | p-value: 0.631565094; Fold-change: -0.033628187; Z-score: -0.522171088 | |
| Disease-specific Antigen Abundances |
|
Click to View the Clearer Original Diagram |
| Differential expression pattern of antigen in diseases | ||
| The Studied Tissue | Peripheral blood | |
| The Specific Disease | Myocardial infarction | |
| The Expression Level of Disease Section Compare with the Healthy Individual Tissue | p-value: 0.452729025; Fold-change: -0.028751629; Z-score: -0.033209358 | |
| Disease-specific Antigen Abundances |
|
Click to View the Clearer Original Diagram |
| Differential expression pattern of antigen in diseases | ||
| The Studied Tissue | Peripheral blood | |
| The Specific Disease | Coronary artery disease | |
| The Expression Level of Disease Section Compare with the Healthy Individual Tissue | p-value: 0.693243996; Fold-change: 0.025097688; Z-score: 0.034516878 | |
| Disease-specific Antigen Abundances |
|
Click to View the Clearer Original Diagram |
| Differential expression pattern of antigen in diseases | ||
| The Studied Tissue | Calcified aortic valve | |
| The Specific Disease | Aortic stenosis | |
| The Expression Level of Disease Section Compare with the Healthy Individual Tissue | p-value: 0.825912297; Fold-change: -0.311158924; Z-score: -0.263516905 | |
| Disease-specific Antigen Abundances |
|
Click to View the Clearer Original Diagram |
| Differential expression pattern of antigen in diseases | ||
| The Studied Tissue | Peripheral blood | |
| The Specific Disease | Arteriosclerosis | |
| The Expression Level of Disease Section Compare with the Healthy Individual Tissue | p-value: 0.966994488; Fold-change: 0.074816121; Z-score: 0.728284709 | |
| Disease-specific Antigen Abundances |
|
Click to View the Clearer Original Diagram |
| Differential expression pattern of antigen in diseases | ||
| The Studied Tissue | Intracranial artery | |
| The Specific Disease | Aneurysm | |
| The Expression Level of Disease Section Compare with the Healthy Individual Tissue | p-value: 0.066068504; Fold-change: 1.430974012; Z-score: 1.733152474 | |
| Disease-specific Antigen Abundances |
|
Click to View the Clearer Original Diagram |
ICD Disease Classification 12
| Differential expression pattern of antigen in diseases | ||
| The Studied Tissue | Peripheral blood | |
| The Specific Disease | Immunodeficiency | |
| The Expression Level of Disease Section Compare with the Healthy Individual Tissue | p-value: 0.723214467; Fold-change: -0.272133395; Z-score: -1.048048444 | |
| Disease-specific Antigen Abundances |
|
Click to View the Clearer Original Diagram |
| Differential expression pattern of antigen in diseases | ||
| The Studied Tissue | Hyperplastic tonsil | |
| The Specific Disease | Apnea | |
| The Expression Level of Disease Section Compare with the Healthy Individual Tissue | p-value: 0.839018829; Fold-change: 0.030641137; Z-score: 0.091834889 | |
| Disease-specific Antigen Abundances |
|
Click to View the Clearer Original Diagram |
| Differential expression pattern of antigen in diseases | ||
| The Studied Tissue | Peripheral blood | |
| The Specific Disease | Olive pollen allergy | |
| The Expression Level of Disease Section Compare with the Healthy Individual Tissue | p-value: 0.838377512; Fold-change: 0.284521526; Z-score: 0.280825962 | |
| Disease-specific Antigen Abundances |
|
Click to View the Clearer Original Diagram |
| Differential expression pattern of antigen in diseases | ||
| The Studied Tissue | Sinus mucosa | |
| The Specific Disease | Chronic rhinosinusitis | |
| The Expression Level of Disease Section Compare with the Healthy Individual Tissue | p-value: 0.811960622; Fold-change: 0.155283407; Z-score: 0.201709 | |
| Disease-specific Antigen Abundances |
|
Click to View the Clearer Original Diagram |
| Differential expression pattern of antigen in diseases | ||
| The Studied Tissue | Lung | |
| The Specific Disease | Chronic obstructive pulmonary disease | |
| The Expression Level of Disease Section Compare with the Healthy Individual Tissue | p-value: 0.373316922; Fold-change: 0.119051857; Z-score: 0.371856512 | |
| Disease-specific Antigen Abundances |
|
Click to View the Clearer Original Diagram |
| The Studied Tissue | Small airway epithelium | |
| The Specific Disease | Chronic obstructive pulmonary disease | |
| The Expression Level of Disease Section Compare with the Healthy Individual Tissue | p-value: 5.09E-06; Fold-change: 0.868522773; Z-score: 0.518287988 | |
| Disease-specific Antigen Abundances |
|
Click to View the Clearer Original Diagram |
| Differential expression pattern of antigen in diseases | ||
| The Studied Tissue | Nasal and bronchial airway | |
| The Specific Disease | Asthma | |
| The Expression Level of Disease Section Compare with the Healthy Individual Tissue | p-value: 0.17577051; Fold-change: 0.342668646; Z-score: 0.196502141 | |
| Disease-specific Antigen Abundances |
|
Click to View the Clearer Original Diagram |
| Differential expression pattern of antigen in diseases | ||
| The Studied Tissue | Nasal Epithelium | |
| The Specific Disease | Human rhinovirus infection | |
| The Expression Level of Disease Section Compare with the Healthy Individual Tissue | p-value: 0.094246778; Fold-change: 0.131522677; Z-score: 0.339576912 | |
| Disease-specific Antigen Abundances |
|
Click to View the Clearer Original Diagram |
| Differential expression pattern of antigen in diseases | ||
| The Studied Tissue | Lung | |
| The Specific Disease | Idiopathic pulmonary fibrosis | |
| The Expression Level of Disease Section Compare with the Healthy Individual Tissue | p-value: 0.817790278; Fold-change: 0.208881754; Z-score: 0.327197624 | |
| Disease-specific Antigen Abundances |
|
Click to View the Clearer Original Diagram |
ICD Disease Classification 13
| Differential expression pattern of antigen in diseases | ||
| The Studied Tissue | Gingival | |
| The Specific Disease | Periodontal disease | |
| The Expression Level of Disease Section Compare with the Adjacent Tissue | p-value: 0.000163695; Fold-change: 0.314824784; Z-score: 0.464777382 | |
| Disease-specific Antigen Abundances |
|
Click to View the Clearer Original Diagram |
| Differential expression pattern of antigen in diseases | ||
| The Studied Tissue | Gastric antrum | |
| The Specific Disease | Eosinophilic gastritis | |
| The Expression Level of Disease Section Compare with the Adjacent Tissue | p-value: 0.357738588; Fold-change: 2.412153343; Z-score: 1.162663512 | |
| Disease-specific Antigen Abundances |
|
Click to View the Clearer Original Diagram |
| Differential expression pattern of antigen in diseases | ||
| The Studied Tissue | Liver | |
| The Specific Disease | Liver failure | |
| The Expression Level of Disease Section Compare with the Healthy Individual Tissue | p-value: 0.000374477; Fold-change: 1.069820525; Z-score: 1.838735795 | |
| Disease-specific Antigen Abundances |
|
Click to View the Clearer Original Diagram |
| Differential expression pattern of antigen in diseases | ||
| The Studied Tissue | Colon mucosal | |
| The Specific Disease | Ulcerative colitis | |
| The Expression Level of Disease Section Compare with the Adjacent Tissue | p-value: 0.202596659; Fold-change: 1.017135082; Z-score: 0.620745601 | |
| Disease-specific Antigen Abundances |
|
Click to View the Clearer Original Diagram |
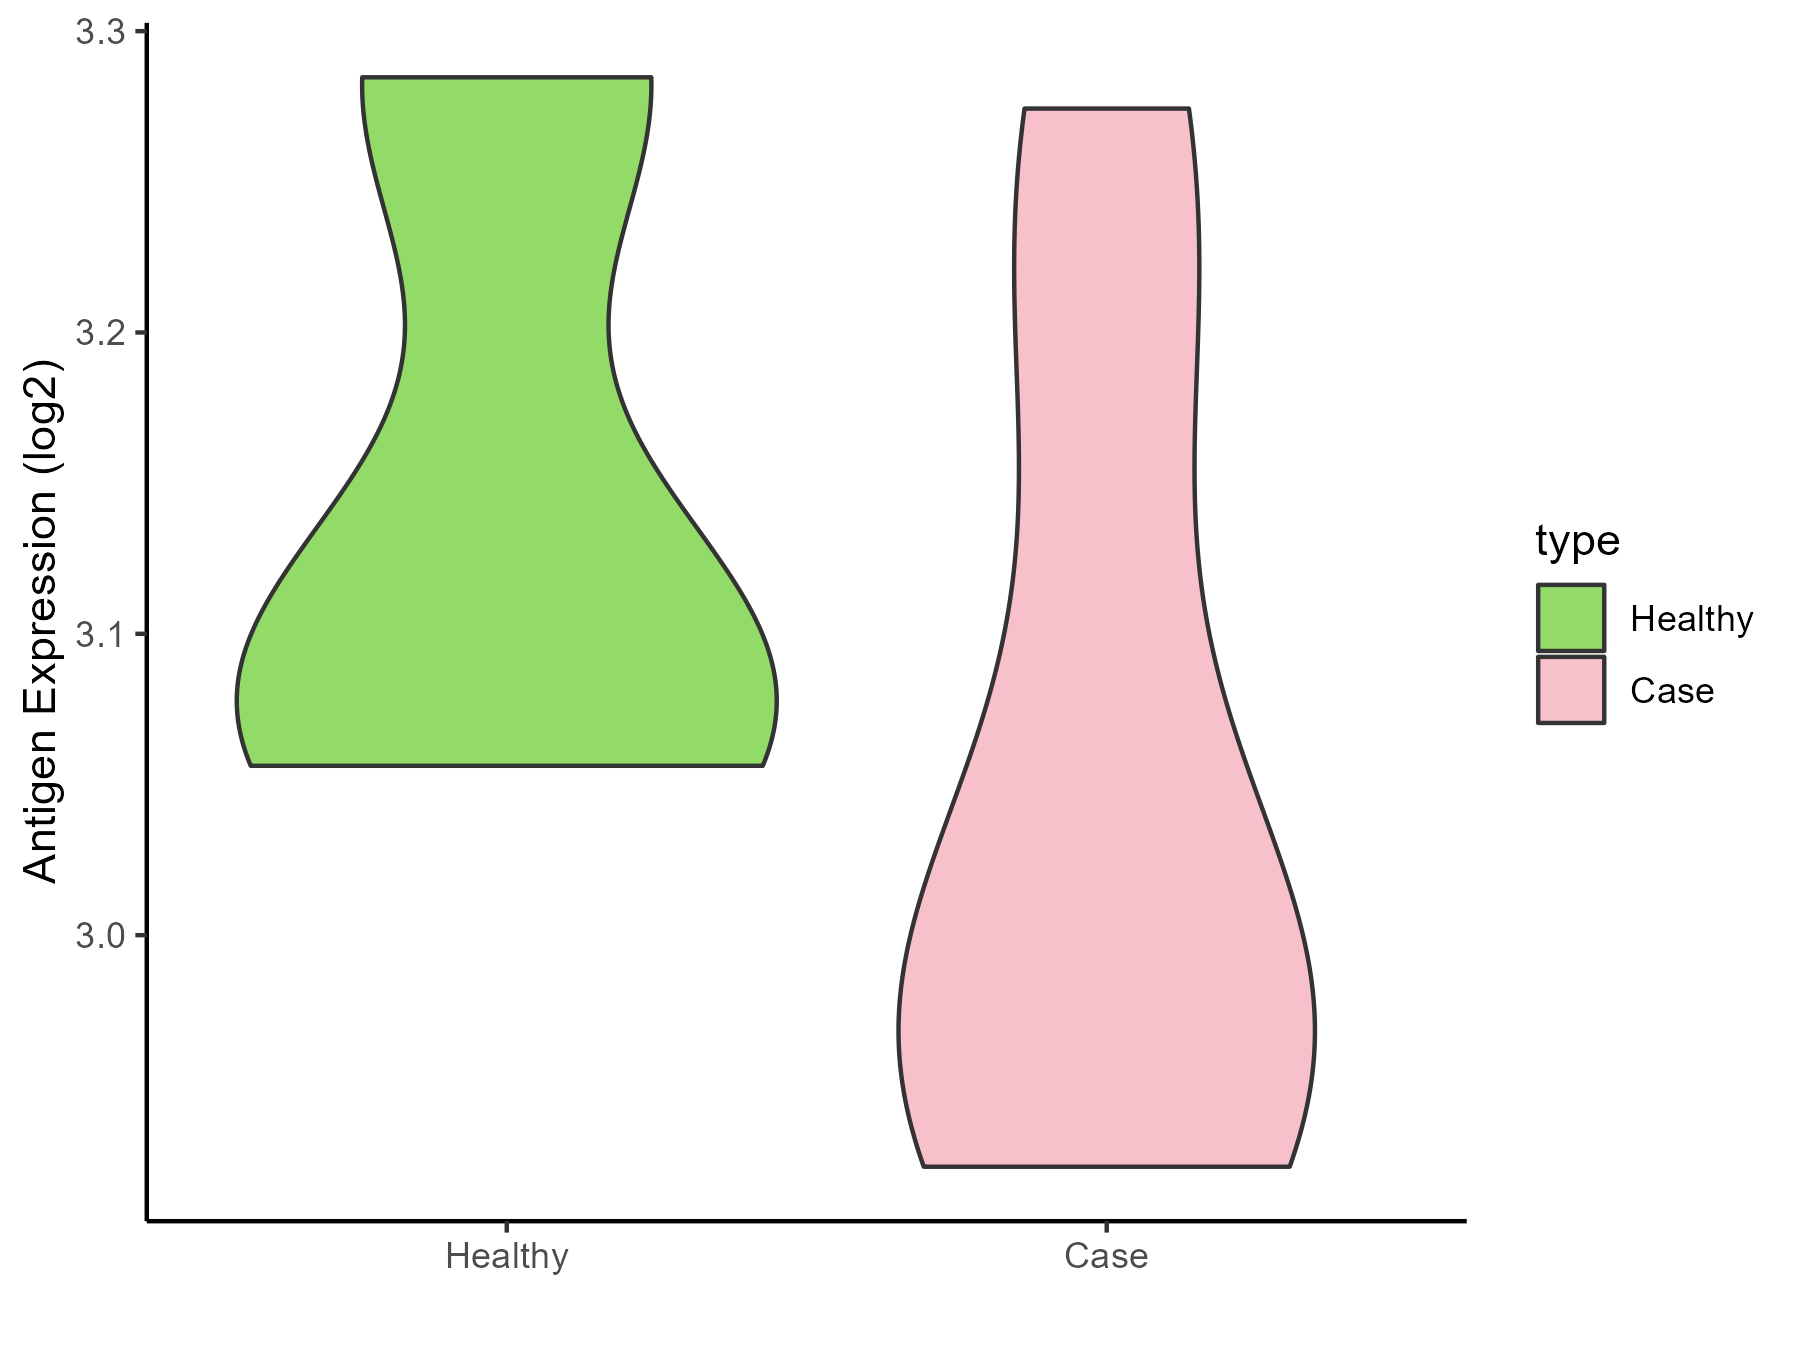
| Differential expression pattern of antigen in diseases | ||
| The Studied Tissue | Rectal colon | |
| The Specific Disease | Irritable bowel syndrome | |
| The Expression Level of Disease Section Compare with the Healthy Individual Tissue | p-value: 0.688766544; Fold-change: -0.026066202; Z-score: -0.076863715 | |
| Disease-specific Antigen Abundances |
|
Click to View the Clearer Original Diagram |
ICD Disease Classification 14
| Differential expression pattern of antigen in diseases | ||
| The Studied Tissue | Skin | |
| The Specific Disease | Atopic dermatitis | |
| The Expression Level of Disease Section Compare with the Healthy Individual Tissue | p-value: 0.01713363; Fold-change: -0.256055619; Z-score: -0.427139978 | |
| Disease-specific Antigen Abundances |
|
Click to View the Clearer Original Diagram |
| Differential expression pattern of antigen in diseases | ||
| The Studied Tissue | Skin | |
| The Specific Disease | Psoriasis | |
| The Expression Level of Disease Section Compare with the Healthy Individual Tissue | p-value: 0.771285303; Fold-change: 0.0647731; Z-score: 0.060677473 | |
| The Expression Level of Disease Section Compare with the Adjacent Tissue | p-value: 8.42E-05; Fold-change: -0.307125343; Z-score: -0.423685948 | |
| Disease-specific Antigen Abundances |
|
Click to View the Clearer Original Diagram |
| Differential expression pattern of antigen in diseases | ||
| The Studied Tissue | Skin | |
| The Specific Disease | Vitiligo | |
| The Expression Level of Disease Section Compare with the Healthy Individual Tissue | p-value: 0.280130824; Fold-change: -0.010330217; Z-score: -0.023934944 | |
| Disease-specific Antigen Abundances |
|
Click to View the Clearer Original Diagram |
| Differential expression pattern of antigen in diseases | ||
| The Studied Tissue | Skin from scalp | |
| The Specific Disease | Alopecia | |
| The Expression Level of Disease Section Compare with the Healthy Individual Tissue | p-value: 9.59E-11; Fold-change: 0.783221266; Z-score: 1.716105054 | |
| Disease-specific Antigen Abundances |
|
Click to View the Clearer Original Diagram |
| Differential expression pattern of antigen in diseases | ||
| The Studied Tissue | Skin | |
| The Specific Disease | Sensitive skin | |
| The Expression Level of Disease Section Compare with the Healthy Individual Tissue | p-value: 0.825610703; Fold-change: -0.05699595; Z-score: -0.193847247 | |
| Disease-specific Antigen Abundances |
|
Click to View the Clearer Original Diagram |
ICD Disease Classification 15
| Differential expression pattern of antigen in diseases | ||
| The Studied Tissue | Synovial | |
| The Specific Disease | Osteoarthritis | |
| The Expression Level of Disease Section Compare with the Healthy Individual Tissue | p-value: 0.533095208; Fold-change: -0.339836494; Z-score: -0.112837566 | |
| Disease-specific Antigen Abundances |
|
Click to View the Clearer Original Diagram |
| Differential expression pattern of antigen in diseases | ||
| The Studied Tissue | Peripheral blood | |
| The Specific Disease | Arthropathy | |
| The Expression Level of Disease Section Compare with the Healthy Individual Tissue | p-value: 0.28472692; Fold-change: 0.085460255; Z-score: 0.223388768 | |
| Disease-specific Antigen Abundances |
|
Click to View the Clearer Original Diagram |
| Differential expression pattern of antigen in diseases | ||
| The Studied Tissue | Peripheral blood | |
| The Specific Disease | Arthritis | |
| The Expression Level of Disease Section Compare with the Healthy Individual Tissue | p-value: 0.00315664; Fold-change: 0.270510708; Z-score: 0.312821293 | |
| Disease-specific Antigen Abundances |
|
Click to View the Clearer Original Diagram |
| Differential expression pattern of antigen in diseases | ||
| The Studied Tissue | Synovial | |
| The Specific Disease | Rheumatoid arthritis | |
| The Expression Level of Disease Section Compare with the Healthy Individual Tissue | p-value: 0.001001247; Fold-change: 0.092542891; Z-score: 0.093023528 | |
| Disease-specific Antigen Abundances |
|
Click to View the Clearer Original Diagram |
| Differential expression pattern of antigen in diseases | ||
| The Studied Tissue | Pheripheral blood | |
| The Specific Disease | Ankylosing spondylitis | |
| The Expression Level of Disease Section Compare with the Healthy Individual Tissue | p-value: 0.797376891; Fold-change: 0.043453076; Z-score: 0.095665372 | |
| Disease-specific Antigen Abundances |
|
Click to View the Clearer Original Diagram |
| Differential expression pattern of antigen in diseases | ||
| The Studied Tissue | Bone marrow | |
| The Specific Disease | Osteoporosis | |
| The Expression Level of Disease Section Compare with the Healthy Individual Tissue | p-value: 0.390543523; Fold-change: -0.006612419; Z-score: -0.00952288 | |
| Disease-specific Antigen Abundances |
|
Click to View the Clearer Original Diagram |
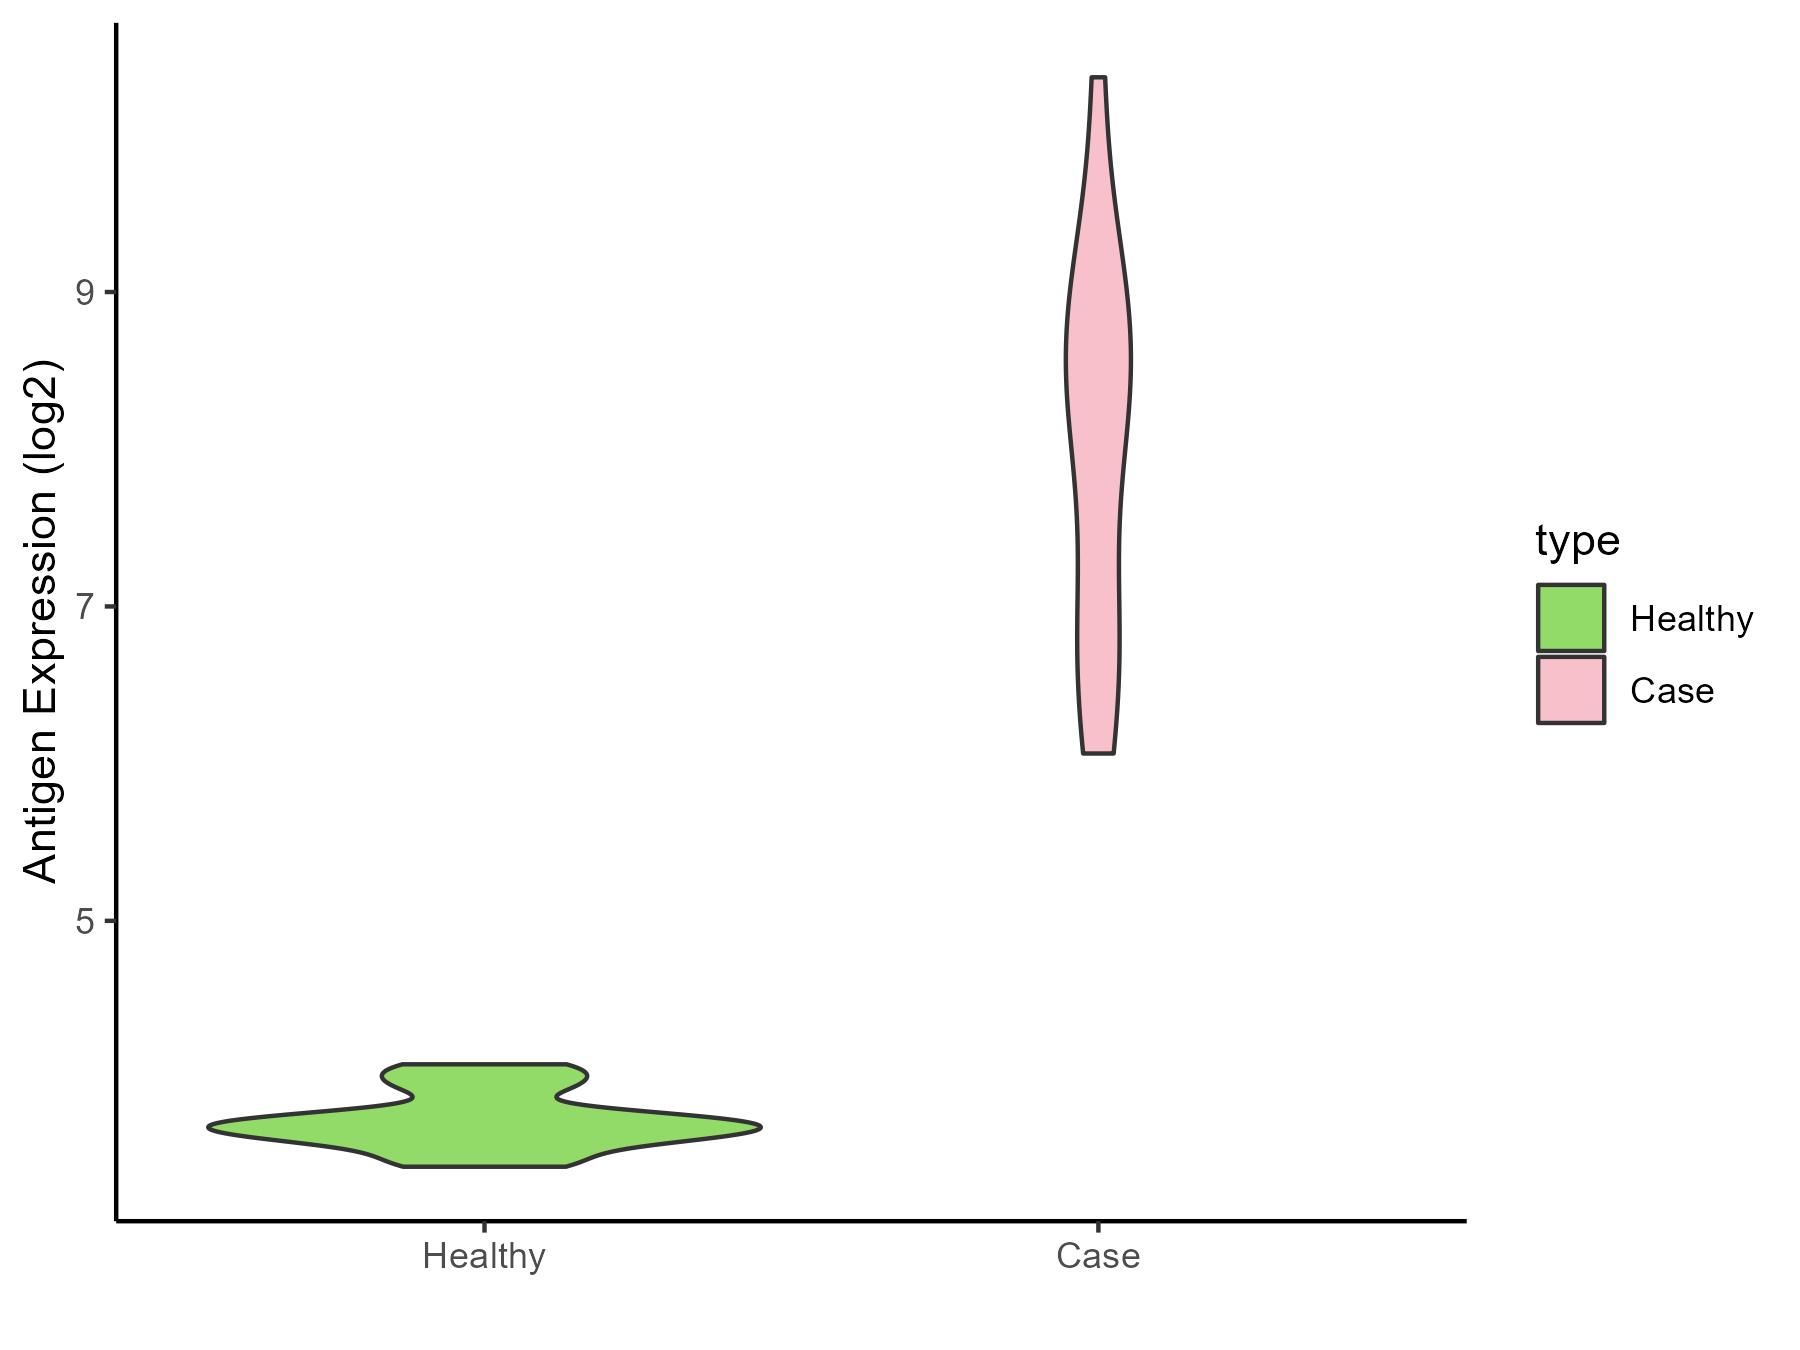
ICD Disease Classification 16
| Differential expression pattern of antigen in diseases | ||
| The Studied Tissue | Endometrium | |
| The Specific Disease | Endometriosis | |
| The Expression Level of Disease Section Compare with the Healthy Individual Tissue | p-value: 0.018072295; Fold-change: 0.118308998; Z-score: 0.126024864 | |
| Disease-specific Antigen Abundances |
|
Click to View the Clearer Original Diagram |
| Differential expression pattern of antigen in diseases | ||
| The Studied Tissue | Bladder | |
| The Specific Disease | Interstitial cystitis | |
| The Expression Level of Disease Section Compare with the Healthy Individual Tissue | p-value: 7.46E-05; Fold-change: 1.456443815; Z-score: 4.081615926 | |
| Disease-specific Antigen Abundances |
|
Click to View the Clearer Original Diagram |
ICD Disease Classification 19
| Differential expression pattern of antigen in diseases | ||
| The Studied Tissue | Myometrium | |
| The Specific Disease | Preterm birth | |
| The Expression Level of Disease Section Compare with the Healthy Individual Tissue | p-value: 0.415926014; Fold-change: 0.076996052; Z-score: 0.166222209 | |
| Disease-specific Antigen Abundances |
|
Click to View the Clearer Original Diagram |
ICD Disease Classification 2
| Differential expression pattern of antigen in diseases | ||
| The Studied Tissue | Bone marrow | |
| The Specific Disease | Acute myelocytic leukemia | |
| The Expression Level of Disease Section Compare with the Healthy Individual Tissue | p-value: 2.53E-06; Fold-change: 0.321439004; Z-score: 0.336104516 | |
| Disease-specific Antigen Abundances |
|
Click to View the Clearer Original Diagram |
| Differential expression pattern of antigen in diseases | ||
| The Studied Tissue | Bone marrow | |
| The Specific Disease | Myeloma | |
| The Expression Level of Disease Section Compare with the Healthy Individual Tissue | p-value: 0.021282459; Fold-change: -1.121562425; Z-score: -0.972230019 | |
| Disease-specific Antigen Abundances |
|
Click to View the Clearer Original Diagram |
| The Studied Tissue | Peripheral blood | |
| The Specific Disease | Myeloma | |
| The Expression Level of Disease Section Compare with the Healthy Individual Tissue | p-value: 0.08845747; Fold-change: 0.143273727; Z-score: 0.680383149 | |
| Disease-specific Antigen Abundances |
|
Click to View the Clearer Original Diagram |
| Differential expression pattern of antigen in diseases | ||
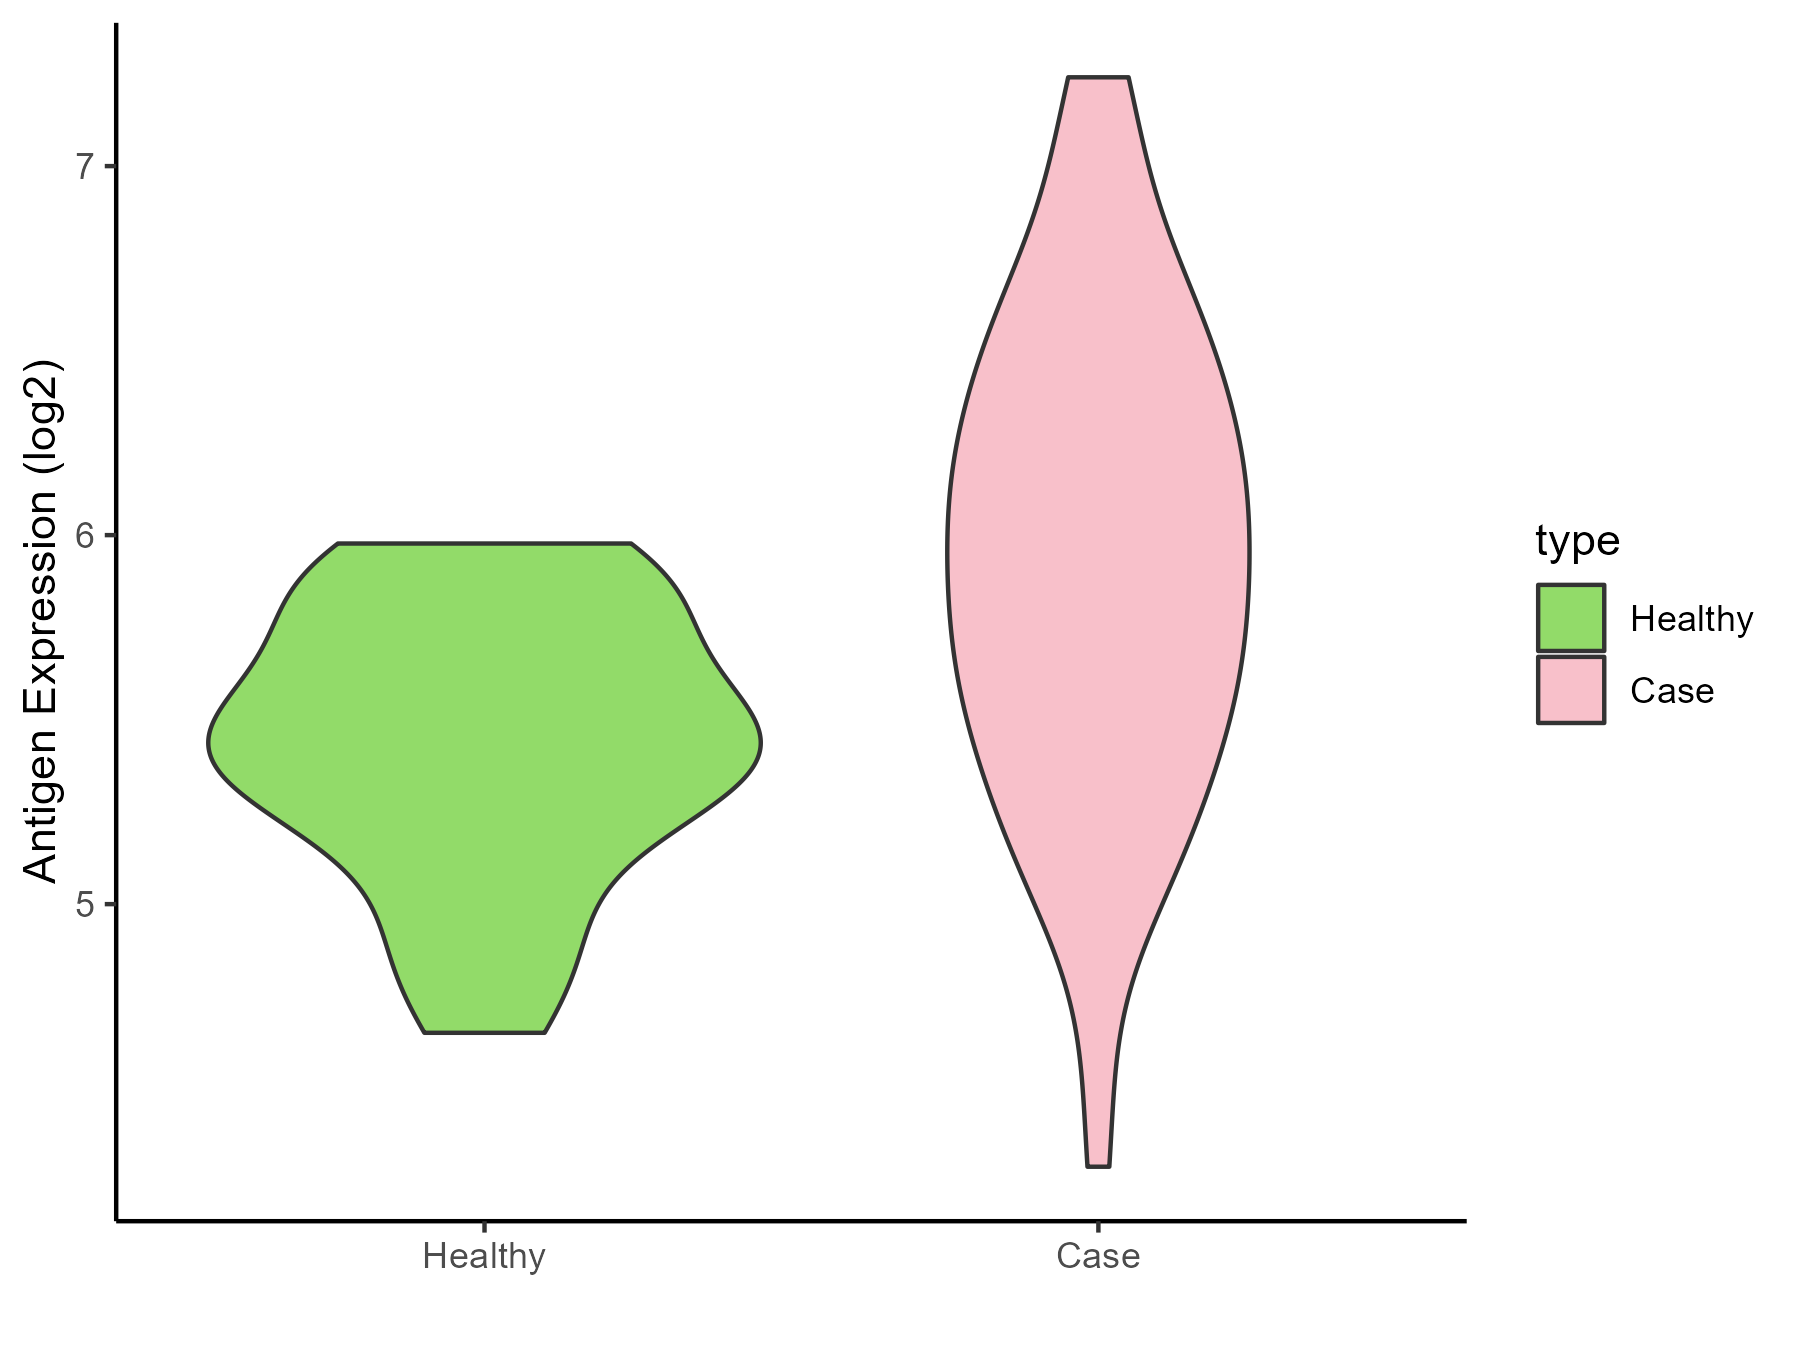
| The Studied Tissue | Oral | |
| The Specific Disease | Oral cancer | |
| The Expression Level of Disease Section Compare with the Healthy Individual Tissue | p-value: 9.09E-09; Fold-change: 2.507497766; Z-score: 1.887408415 | |
| The Expression Level of Disease Section Compare with the Adjacent Tissue | p-value: 7.23E-09; Fold-change: 1.164091817; Z-score: 1.102768074 | |
| Disease-specific Antigen Abundances |
|
Click to View the Clearer Original Diagram |
| Differential expression pattern of antigen in diseases | ||
| The Studied Tissue | Esophagus | |
| The Specific Disease | Esophagal cancer | |
| The Expression Level of Disease Section Compare with the Adjacent Tissue | p-value: 0.087628806; Fold-change: -1.703204578; Z-score: -1.052835276 | |
| Disease-specific Antigen Abundances |
|
Click to View the Clearer Original Diagram |
| Differential expression pattern of antigen in diseases | ||
| The Studied Tissue | Rectal colon | |
| The Specific Disease | Rectal cancer | |
| The Expression Level of Disease Section Compare with the Healthy Individual Tissue | p-value: 1.73E-12; Fold-change: -1.580065667; Z-score: -8.684024934 | |
| The Expression Level of Disease Section Compare with the Adjacent Tissue | p-value: 5.31E-05; Fold-change: -1.279626496; Z-score: -3.823214219 | |
| Disease-specific Antigen Abundances |
|
Click to View the Clearer Original Diagram |
| Differential expression pattern of antigen in diseases | ||
| The Studied Tissue | Skin | |
| The Specific Disease | Skin cancer | |
| The Expression Level of Disease Section Compare with the Healthy Individual Tissue | p-value: 6.18E-12; Fold-change: -0.957398918; Z-score: -0.859228527 | |
| The Expression Level of Disease Section Compare with the Adjacent Tissue | p-value: 1.68E-16; Fold-change: -1.19946836; Z-score: -1.07372056 | |
| Disease-specific Antigen Abundances |
|
Click to View the Clearer Original Diagram |
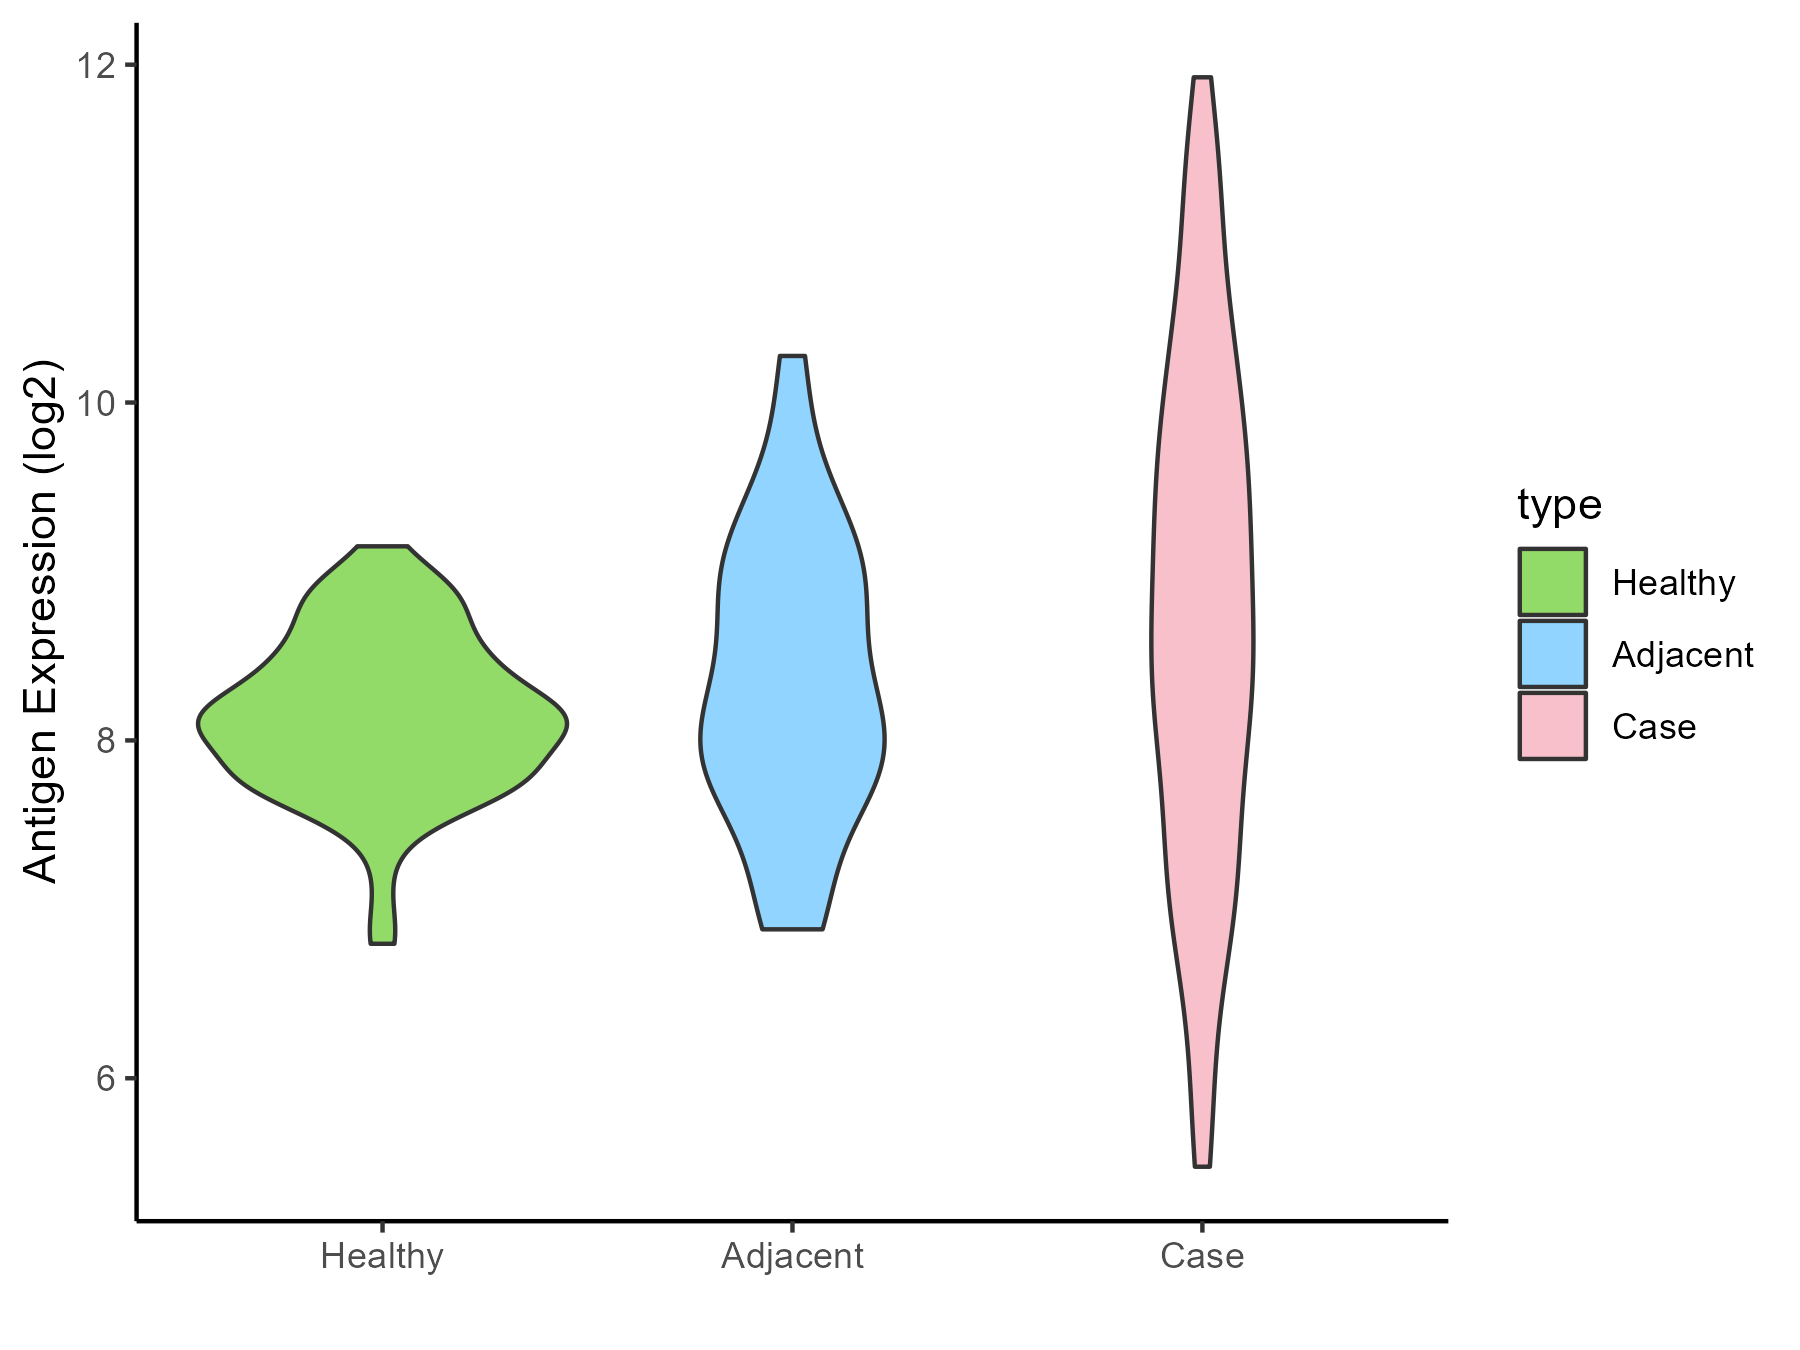
| Differential expression pattern of antigen in diseases | ||
| The Studied Tissue | Kidney | |
| The Specific Disease | Renal cancer | |
| The Expression Level of Disease Section Compare with the Healthy Individual Tissue | p-value: 0.007247933; Fold-change: 1.049801803; Z-score: 1.097927553 | |
| The Expression Level of Disease Section Compare with the Adjacent Tissue | p-value: 6.73E-06; Fold-change: 0.789078224; Z-score: 0.87139853 | |
| Disease-specific Antigen Abundances |
|
Click to View the Clearer Original Diagram |
| Differential expression pattern of antigen in diseases | ||
| The Studied Tissue | Urothelium | |
| The Specific Disease | Ureter cancer | |
| The Expression Level of Disease Section Compare with the Healthy Individual Tissue | p-value: 0.08148693; Fold-change: 0.022013759; Z-score: 0.145645484 | |
| Disease-specific Antigen Abundances |
|
Click to View the Clearer Original Diagram |
ICD Disease Classification 20
| Differential expression pattern of antigen in diseases | ||
| The Studied Tissue | Adipose | |
| The Specific Disease | Simpson golabi behmel syndrome | |
| The Expression Level of Disease Section Compare with the Healthy Individual Tissue | p-value: 0.319322058; Fold-change: -0.106167401; Z-score: -0.873360167 | |
| Disease-specific Antigen Abundances |
|
Click to View the Clearer Original Diagram |
| Differential expression pattern of antigen in diseases | ||
| The Studied Tissue | Perituberal | |
| The Specific Disease | Tuberous sclerosis complex | |
| The Expression Level of Disease Section Compare with the Healthy Individual Tissue | p-value: 0.068176818; Fold-change: -0.682336228; Z-score: -2.066632802 | |
| Disease-specific Antigen Abundances |
|
Click to View the Clearer Original Diagram |
ICD Disease Classification 3
| Differential expression pattern of antigen in diseases | ||
| The Studied Tissue | Bone marrow | |
| The Specific Disease | Anemia | |
| The Expression Level of Disease Section Compare with the Healthy Individual Tissue | p-value: 0.131974827; Fold-change: 0.343368387; Z-score: 1.13689578 | |
| Disease-specific Antigen Abundances |
|
Click to View the Clearer Original Diagram |
| Differential expression pattern of antigen in diseases | ||
| The Studied Tissue | Peripheral blood | |
| The Specific Disease | Sickle cell disease | |
| The Expression Level of Disease Section Compare with the Healthy Individual Tissue | p-value: 0.433988944; Fold-change: 0.038557761; Z-score: 0.076663241 | |
| Disease-specific Antigen Abundances |
|
Click to View the Clearer Original Diagram |
| Differential expression pattern of antigen in diseases | ||
| The Studied Tissue | Whole blood | |
| The Specific Disease | Thrombocythemia | |
| The Expression Level of Disease Section Compare with the Healthy Individual Tissue | p-value: 0.000362678; Fold-change: 0.201192984; Z-score: 1.26495778 | |
| Disease-specific Antigen Abundances |
|
Click to View the Clearer Original Diagram |
ICD Disease Classification 4
| Differential expression pattern of antigen in diseases | ||
| The Studied Tissue | Whole blood | |
| The Specific Disease | Scleroderma | |
| The Expression Level of Disease Section Compare with the Healthy Individual Tissue | p-value: 0.074343123; Fold-change: 0.015679321; Z-score: 0.0803788 | |
| Disease-specific Antigen Abundances |
|
Click to View the Clearer Original Diagram |
| Differential expression pattern of antigen in diseases | ||
| The Studied Tissue | Salivary gland | |
| The Specific Disease | Sjogren syndrome | |
| The Expression Level of Disease Section Compare with the Healthy Individual Tissue | p-value: 0.167213279; Fold-change: 0.839716155; Z-score: 1.290699911 | |
| The Expression Level of Disease Section Compare with the Adjacent Tissue | p-value: 0.126214509; Fold-change: 0.152318322; Z-score: 0.375241957 | |
| Disease-specific Antigen Abundances |
|
Click to View the Clearer Original Diagram |
| Differential expression pattern of antigen in diseases | ||
| The Studied Tissue | Peripheral blood | |
| The Specific Disease | Behcet disease | |
| The Expression Level of Disease Section Compare with the Healthy Individual Tissue | p-value: 0.576700124; Fold-change: -0.113031844; Z-score: -0.189945984 | |
| Disease-specific Antigen Abundances |
|
Click to View the Clearer Original Diagram |
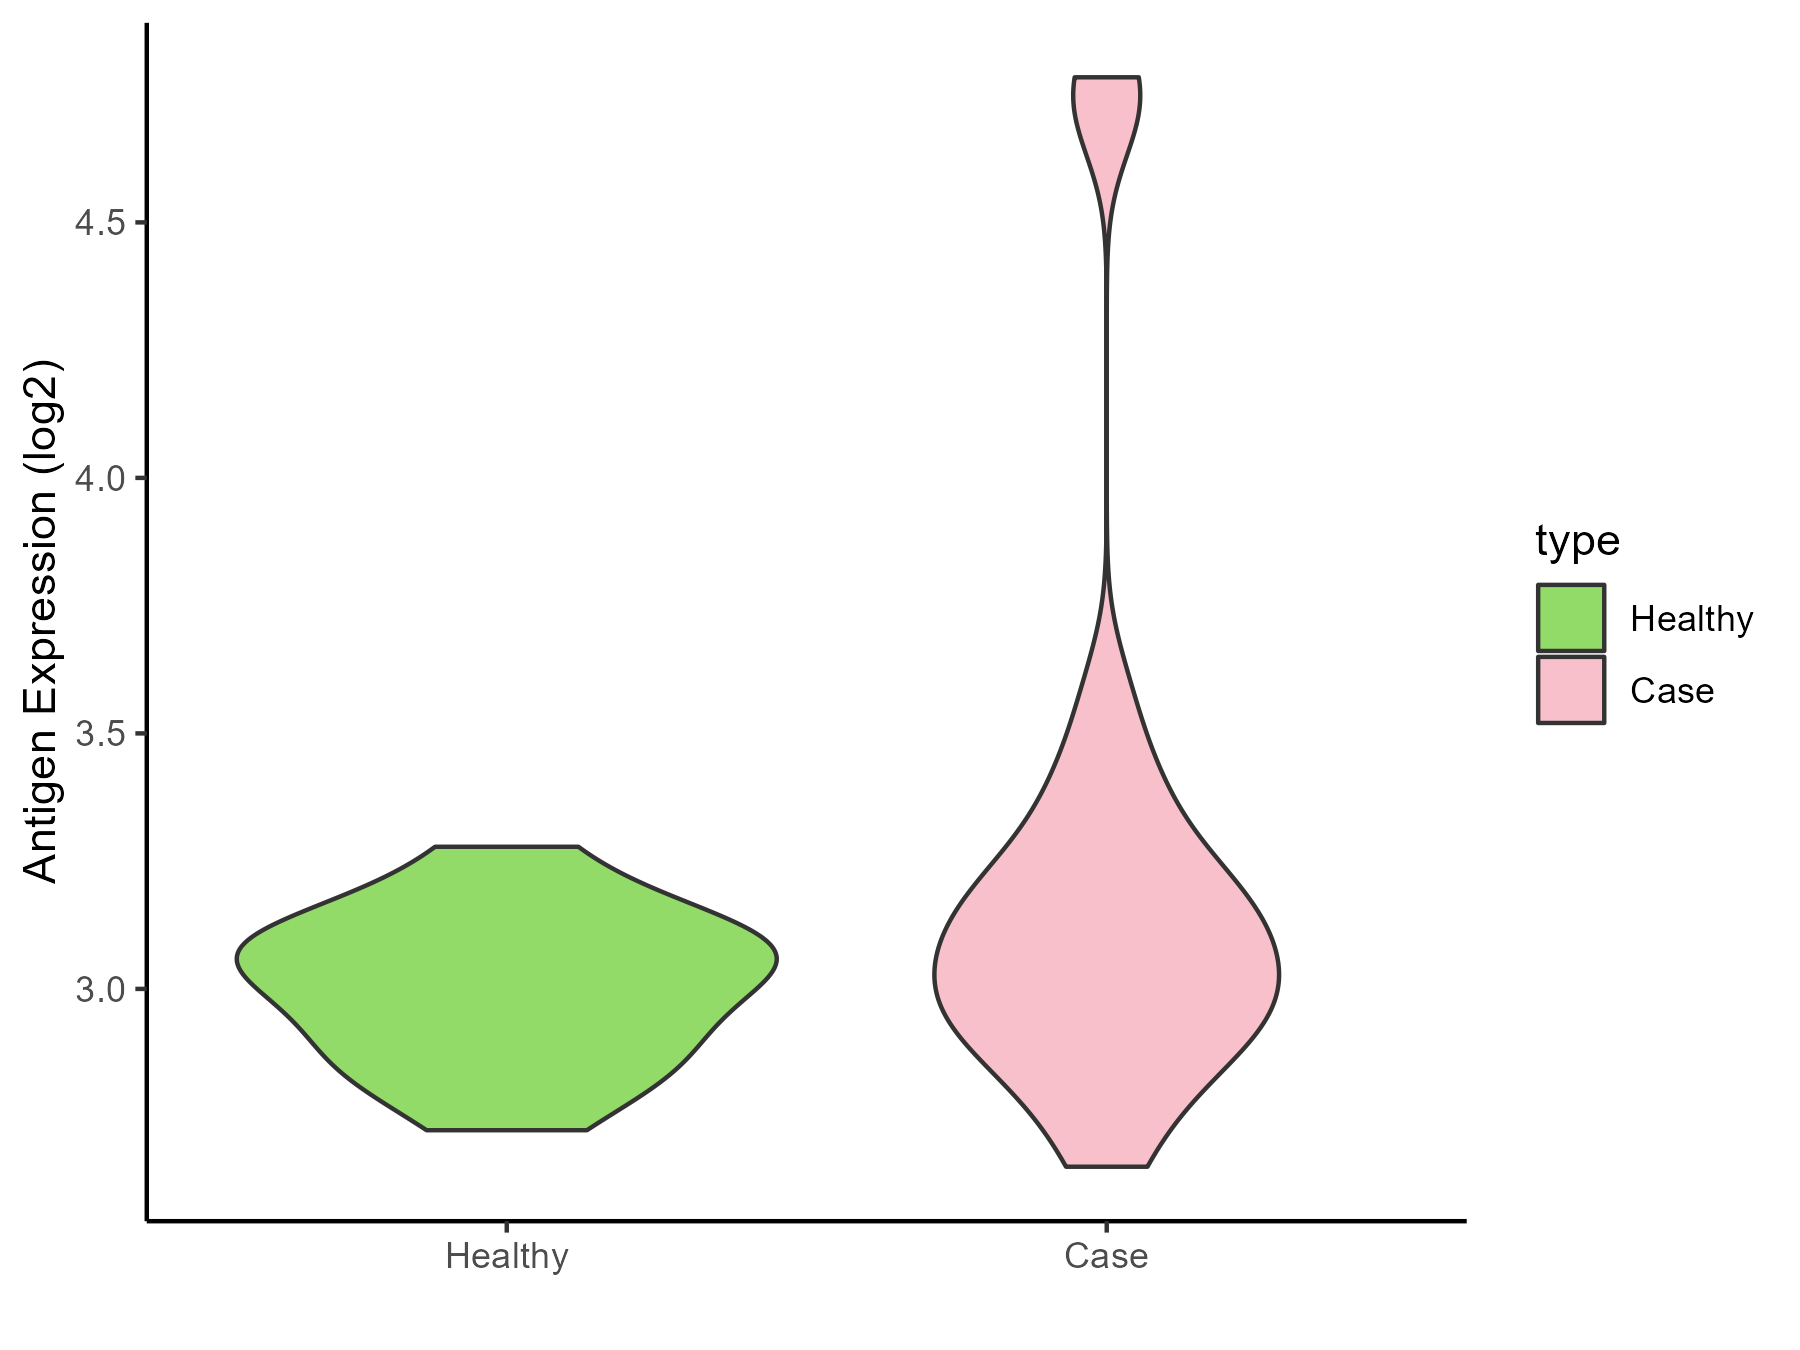
| Differential expression pattern of antigen in diseases | ||
| The Studied Tissue | Whole blood | |
| The Specific Disease | Autosomal dominant monocytopenia | |
| The Expression Level of Disease Section Compare with the Healthy Individual Tissue | p-value: 0.938046473; Fold-change: -0.019832988; Z-score: -0.096619536 | |
| Disease-specific Antigen Abundances |
|
Click to View the Clearer Original Diagram |
ICD Disease Classification 5
| Differential expression pattern of antigen in diseases | ||
| The Studied Tissue | Liver | |
| The Specific Disease | Type 2 diabetes | |
| The Expression Level of Disease Section Compare with the Healthy Individual Tissue | p-value: 0.03870402; Fold-change: 0.499374251; Z-score: 1.430178965 | |
| Disease-specific Antigen Abundances |
|
Click to View the Clearer Original Diagram |
| Differential expression pattern of antigen in diseases | ||
| The Studied Tissue | Vastus lateralis muscle | |
| The Specific Disease | Polycystic ovary syndrome | |
| The Expression Level of Disease Section Compare with the Healthy Individual Tissue | p-value: 0.597943181; Fold-change: -0.138375247; Z-score: -0.335544932 | |
| Disease-specific Antigen Abundances |
|
Click to View the Clearer Original Diagram |
| Differential expression pattern of antigen in diseases | ||
| The Studied Tissue | Subcutaneous Adipose | |
| The Specific Disease | Obesity | |
| The Expression Level of Disease Section Compare with the Healthy Individual Tissue | p-value: 0.108576972; Fold-change: 0.351247992; Z-score: 0.712789738 | |
| Disease-specific Antigen Abundances |
|
Click to View the Clearer Original Diagram |
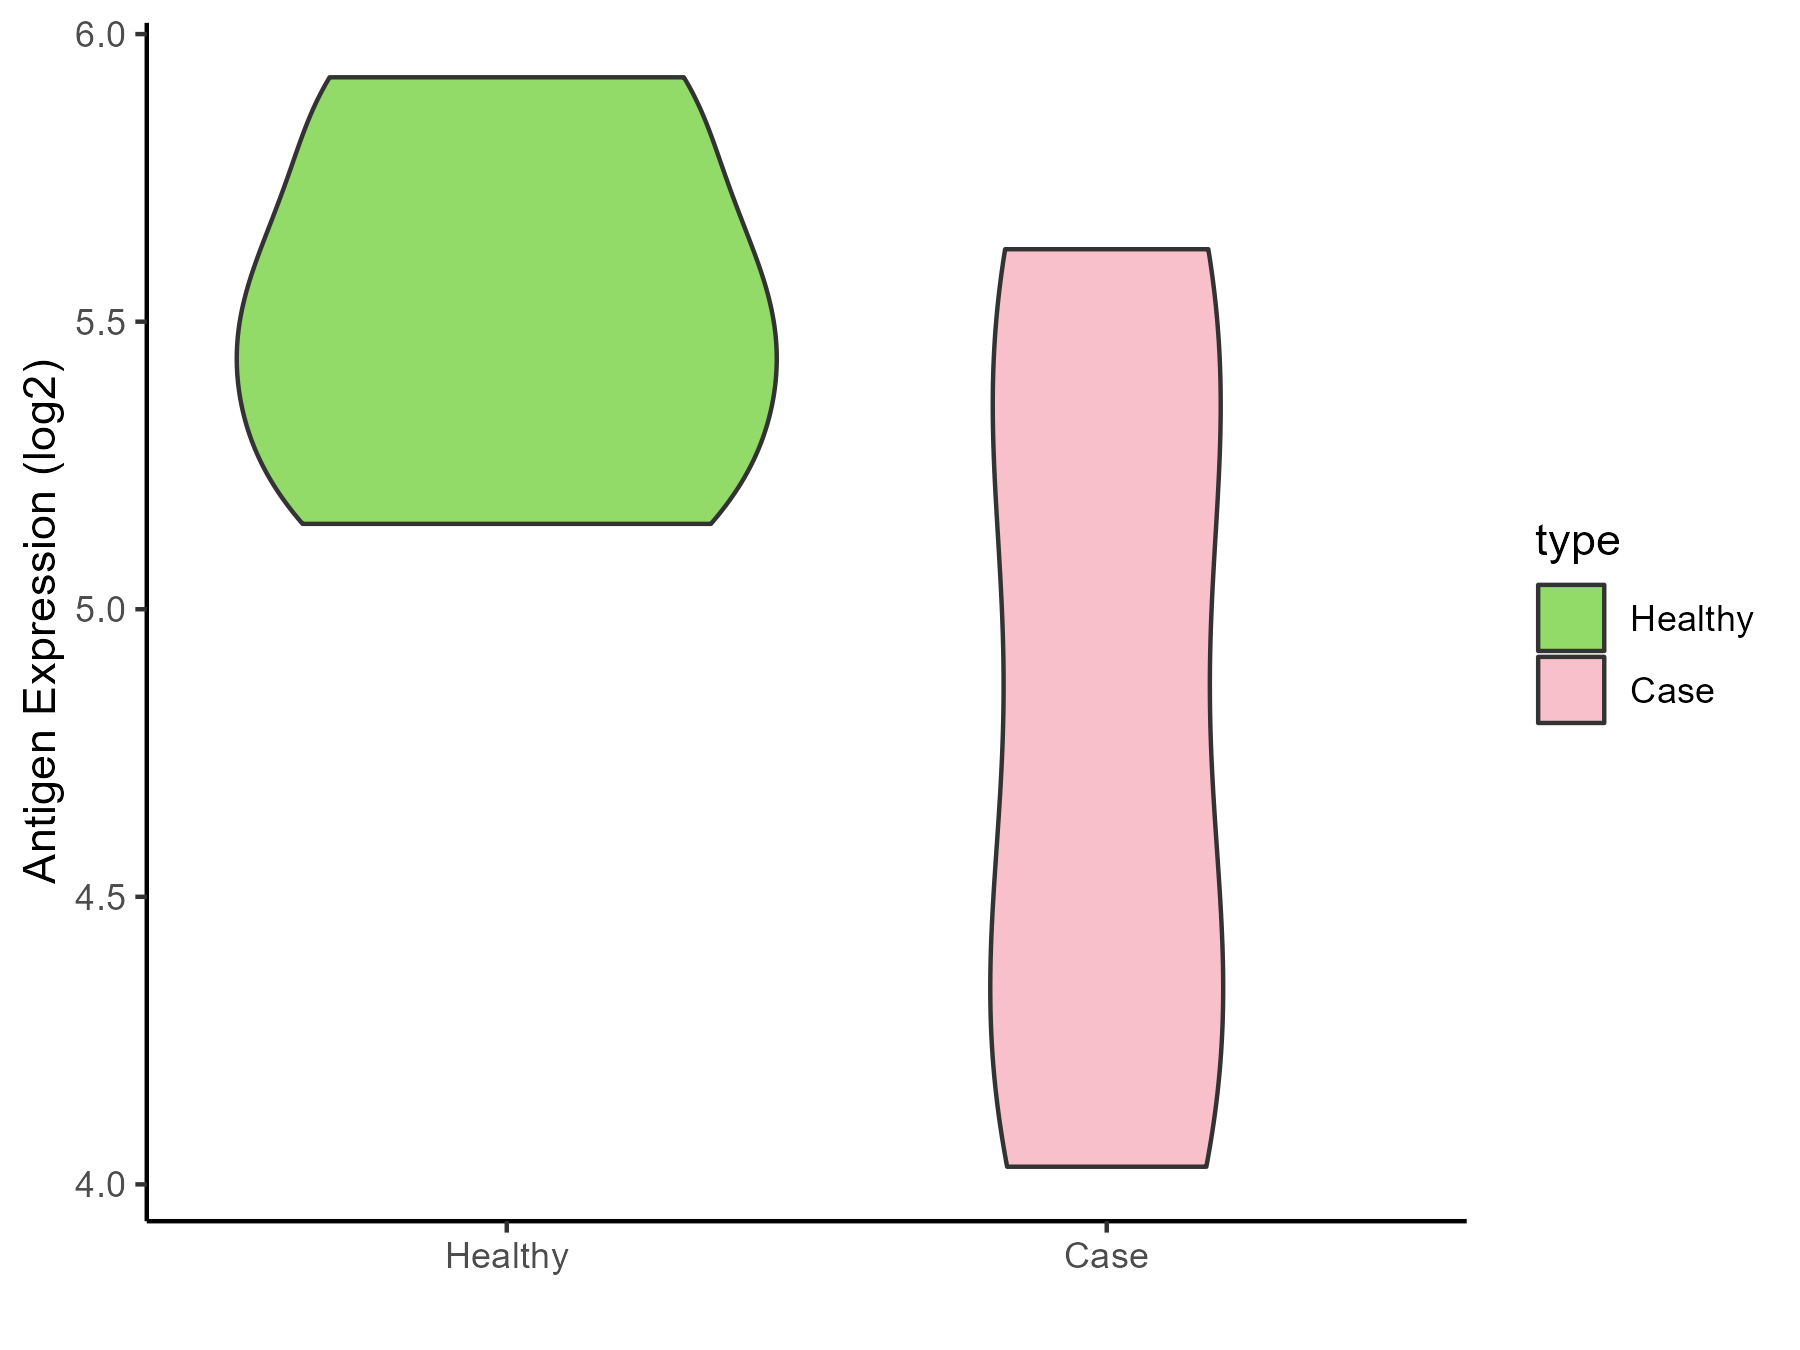
| Differential expression pattern of antigen in diseases | ||
| The Studied Tissue | Biceps muscle | |
| The Specific Disease | Pompe disease | |
| The Expression Level of Disease Section Compare with the Healthy Individual Tissue | p-value: 0.009535683; Fold-change: 0.884306462; Z-score: 1.171407209 | |
| Disease-specific Antigen Abundances |
|
Click to View the Clearer Original Diagram |
| Differential expression pattern of antigen in diseases | ||
| The Studied Tissue | Whole blood | |
| The Specific Disease | Batten disease | |
| The Expression Level of Disease Section Compare with the Healthy Individual Tissue | p-value: 0.339893208; Fold-change: 0.179595739; Z-score: 0.493772474 | |
| Disease-specific Antigen Abundances |
|
Click to View the Clearer Original Diagram |
ICD Disease Classification 6
| Differential expression pattern of antigen in diseases | ||
| The Studied Tissue | Whole blood | |
| The Specific Disease | Autism | |
| The Expression Level of Disease Section Compare with the Healthy Individual Tissue | p-value: 0.026321751; Fold-change: 0.164928337; Z-score: 0.635470304 | |
| Disease-specific Antigen Abundances |
|
Click to View the Clearer Original Diagram |
| Differential expression pattern of antigen in diseases | ||
| The Studied Tissue | Whole blood | |
| The Specific Disease | Anxiety disorder | |
| The Expression Level of Disease Section Compare with the Healthy Individual Tissue | p-value: 0.855315486; Fold-change: -0.139836369; Z-score: -0.202064123 | |
| Disease-specific Antigen Abundances |
|
Click to View the Clearer Original Diagram |
ICD Disease Classification 8
| Differential expression pattern of antigen in diseases | ||
| The Studied Tissue | Substantia nigra | |
| The Specific Disease | Parkinson disease | |
| The Expression Level of Disease Section Compare with the Healthy Individual Tissue | p-value: 0.655830962; Fold-change: 0.131725229; Z-score: 0.216645217 | |
| Disease-specific Antigen Abundances |
|
Click to View the Clearer Original Diagram |
| Differential expression pattern of antigen in diseases | ||
| The Studied Tissue | Whole blood | |
| The Specific Disease | Huntington disease | |
| The Expression Level of Disease Section Compare with the Healthy Individual Tissue | p-value: 0.289553125; Fold-change: -0.036804938; Z-score: -0.161339171 | |
| Disease-specific Antigen Abundances |
|
Click to View the Clearer Original Diagram |
| Differential expression pattern of antigen in diseases | ||
| The Studied Tissue | Entorhinal cortex | |
| The Specific Disease | Alzheimer disease | |
| The Expression Level of Disease Section Compare with the Healthy Individual Tissue | p-value: 0.756815283; Fold-change: 0.037968231; Z-score: 0.052074884 | |
| Disease-specific Antigen Abundances |
|
Click to View the Clearer Original Diagram |
| Differential expression pattern of antigen in diseases | ||
| The Studied Tissue | Whole blood | |
| The Specific Disease | Seizure | |
| The Expression Level of Disease Section Compare with the Healthy Individual Tissue | p-value: 0.772880229; Fold-change: -0.07629784; Z-score: -0.463346042 | |
| Disease-specific Antigen Abundances |
|
Click to View the Clearer Original Diagram |
| Differential expression pattern of antigen in diseases | ||
| The Studied Tissue | Skin | |
| The Specific Disease | Lateral sclerosis | |
| The Expression Level of Disease Section Compare with the Healthy Individual Tissue | p-value: 0.863245379; Fold-change: 0.003751273; Z-score: 0.018269728 | |
| Disease-specific Antigen Abundances |

|
Click to View the Clearer Original Diagram |
| The Studied Tissue | Cervical spinal cord | |
| The Specific Disease | Lateral sclerosis | |
| The Expression Level of Disease Section Compare with the Healthy Individual Tissue | p-value: 0.991817343; Fold-change: -0.034607664; Z-score: -0.13284748 | |
| Disease-specific Antigen Abundances |
|
Click to View the Clearer Original Diagram |
| Differential expression pattern of antigen in diseases | ||
| The Studied Tissue | Muscle | |
| The Specific Disease | Muscular atrophy | |
| The Expression Level of Disease Section Compare with the Healthy Individual Tissue | p-value: 2.20E-06; Fold-change: 2.625238448; Z-score: 2.489639326 | |
| Disease-specific Antigen Abundances |
|
Click to View the Clearer Original Diagram |
| Differential expression pattern of antigen in diseases | ||
| The Studied Tissue | Muscle | |
| The Specific Disease | Myopathy | |
| The Expression Level of Disease Section Compare with the Healthy Individual Tissue | p-value: 4.96E-05; Fold-change: 1.939154412; Z-score: 2.90859095 | |
| Disease-specific Antigen Abundances |
|
Click to View the Clearer Original Diagram |
References