Tissue specific Abundances of This Antigen
ICD Disease Classification 01
Click to Show/Hide the 1 Disease of This Class
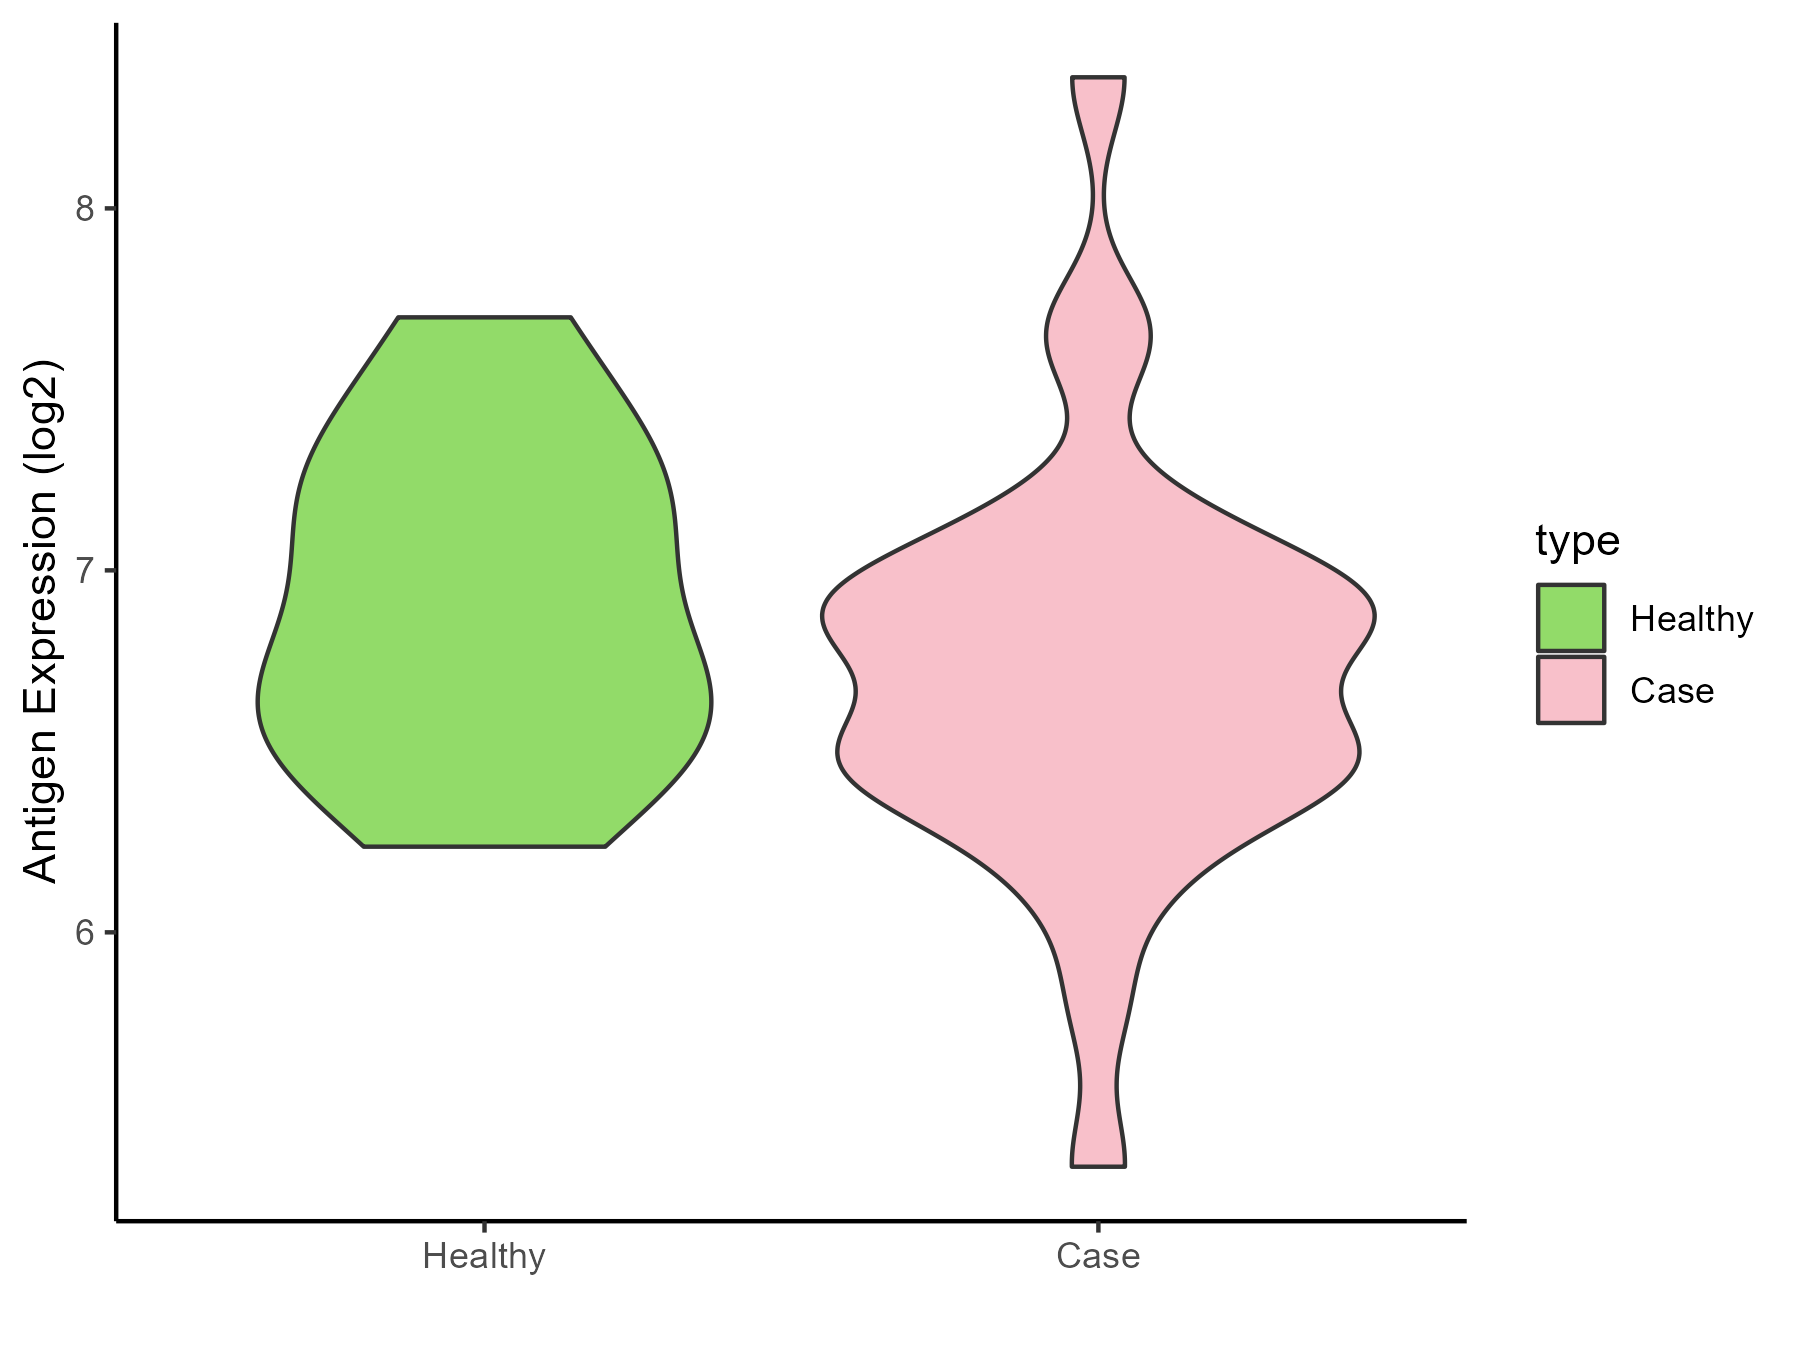
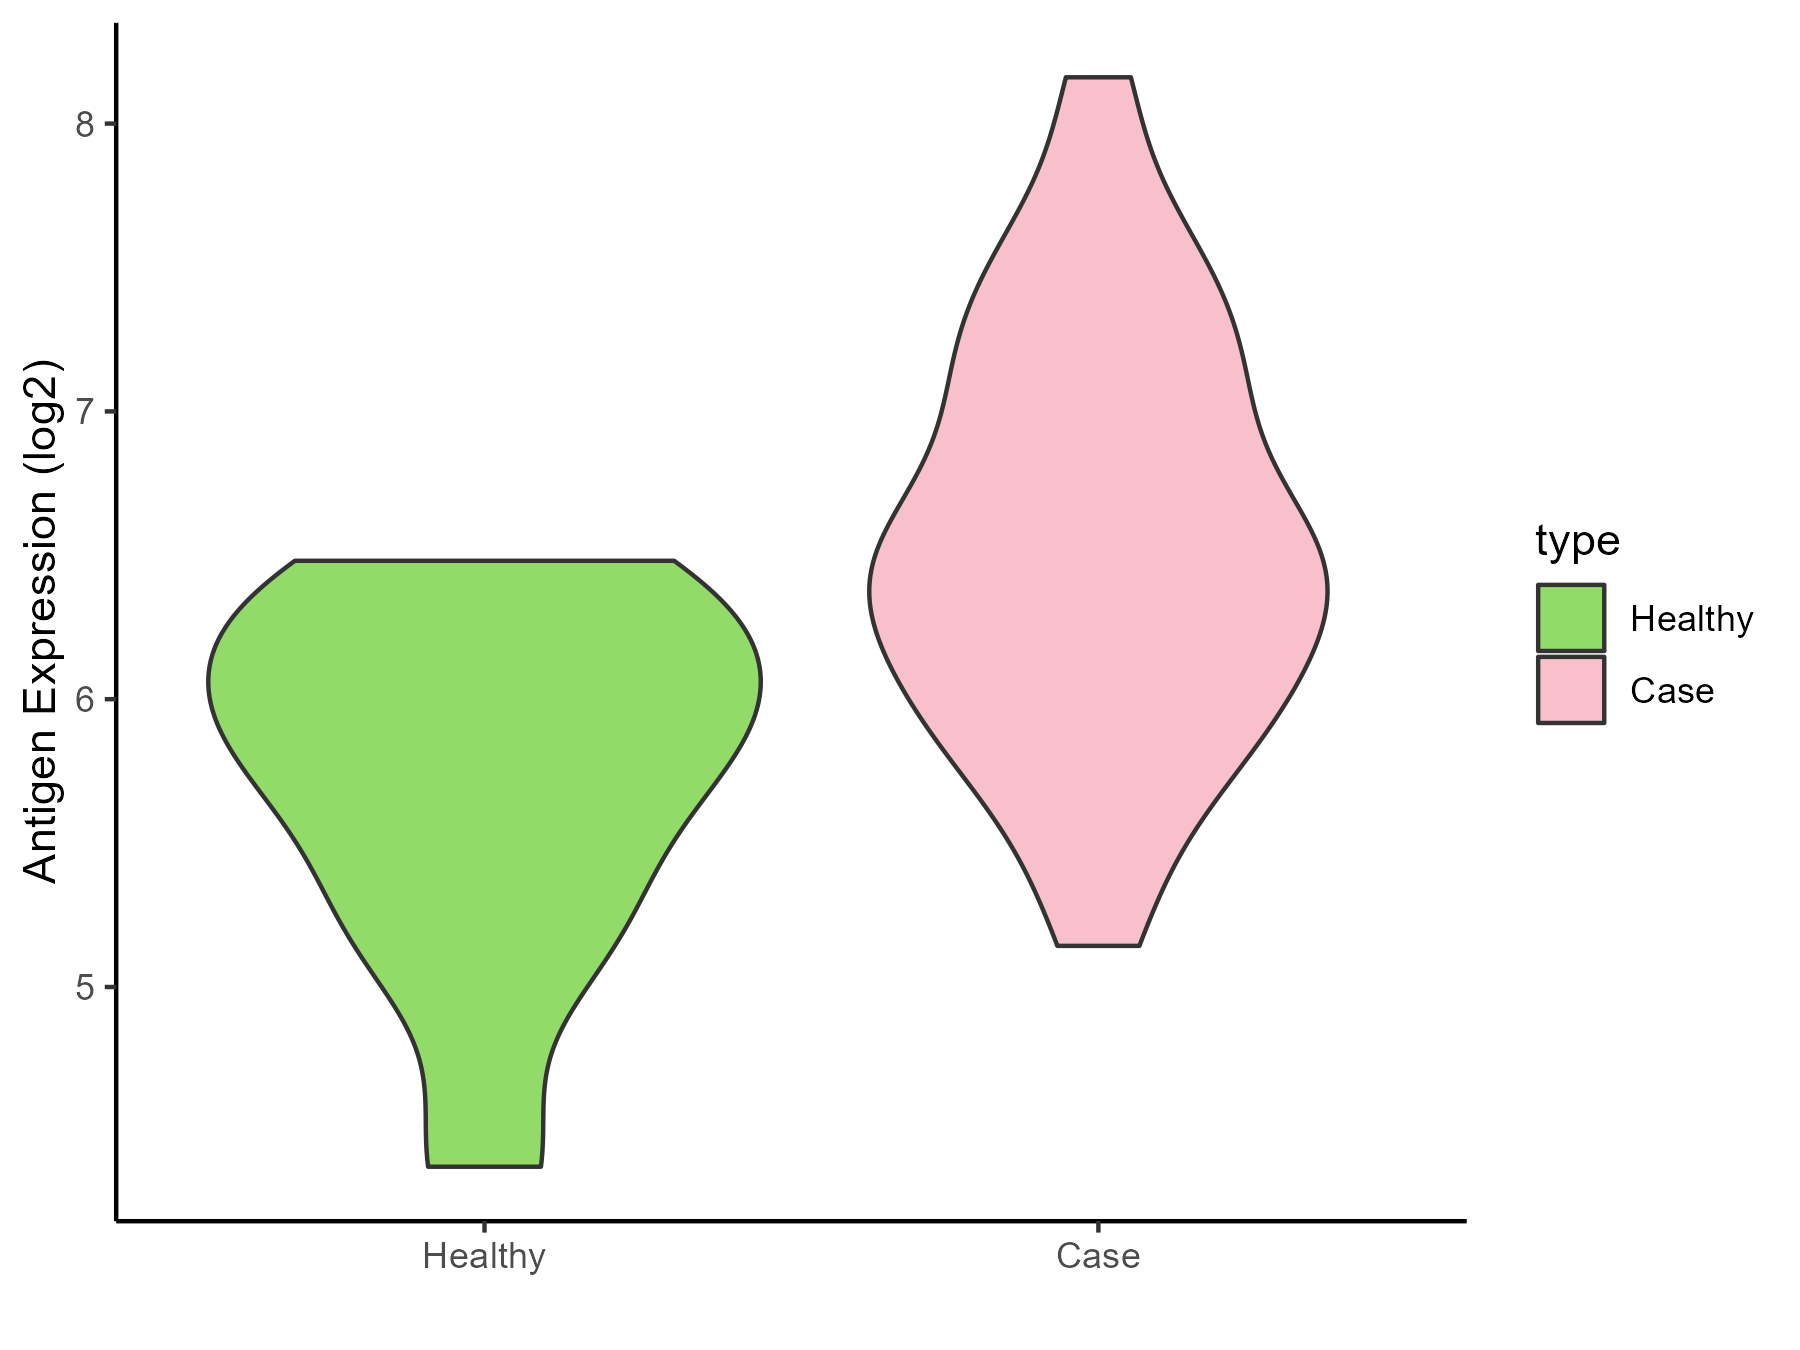
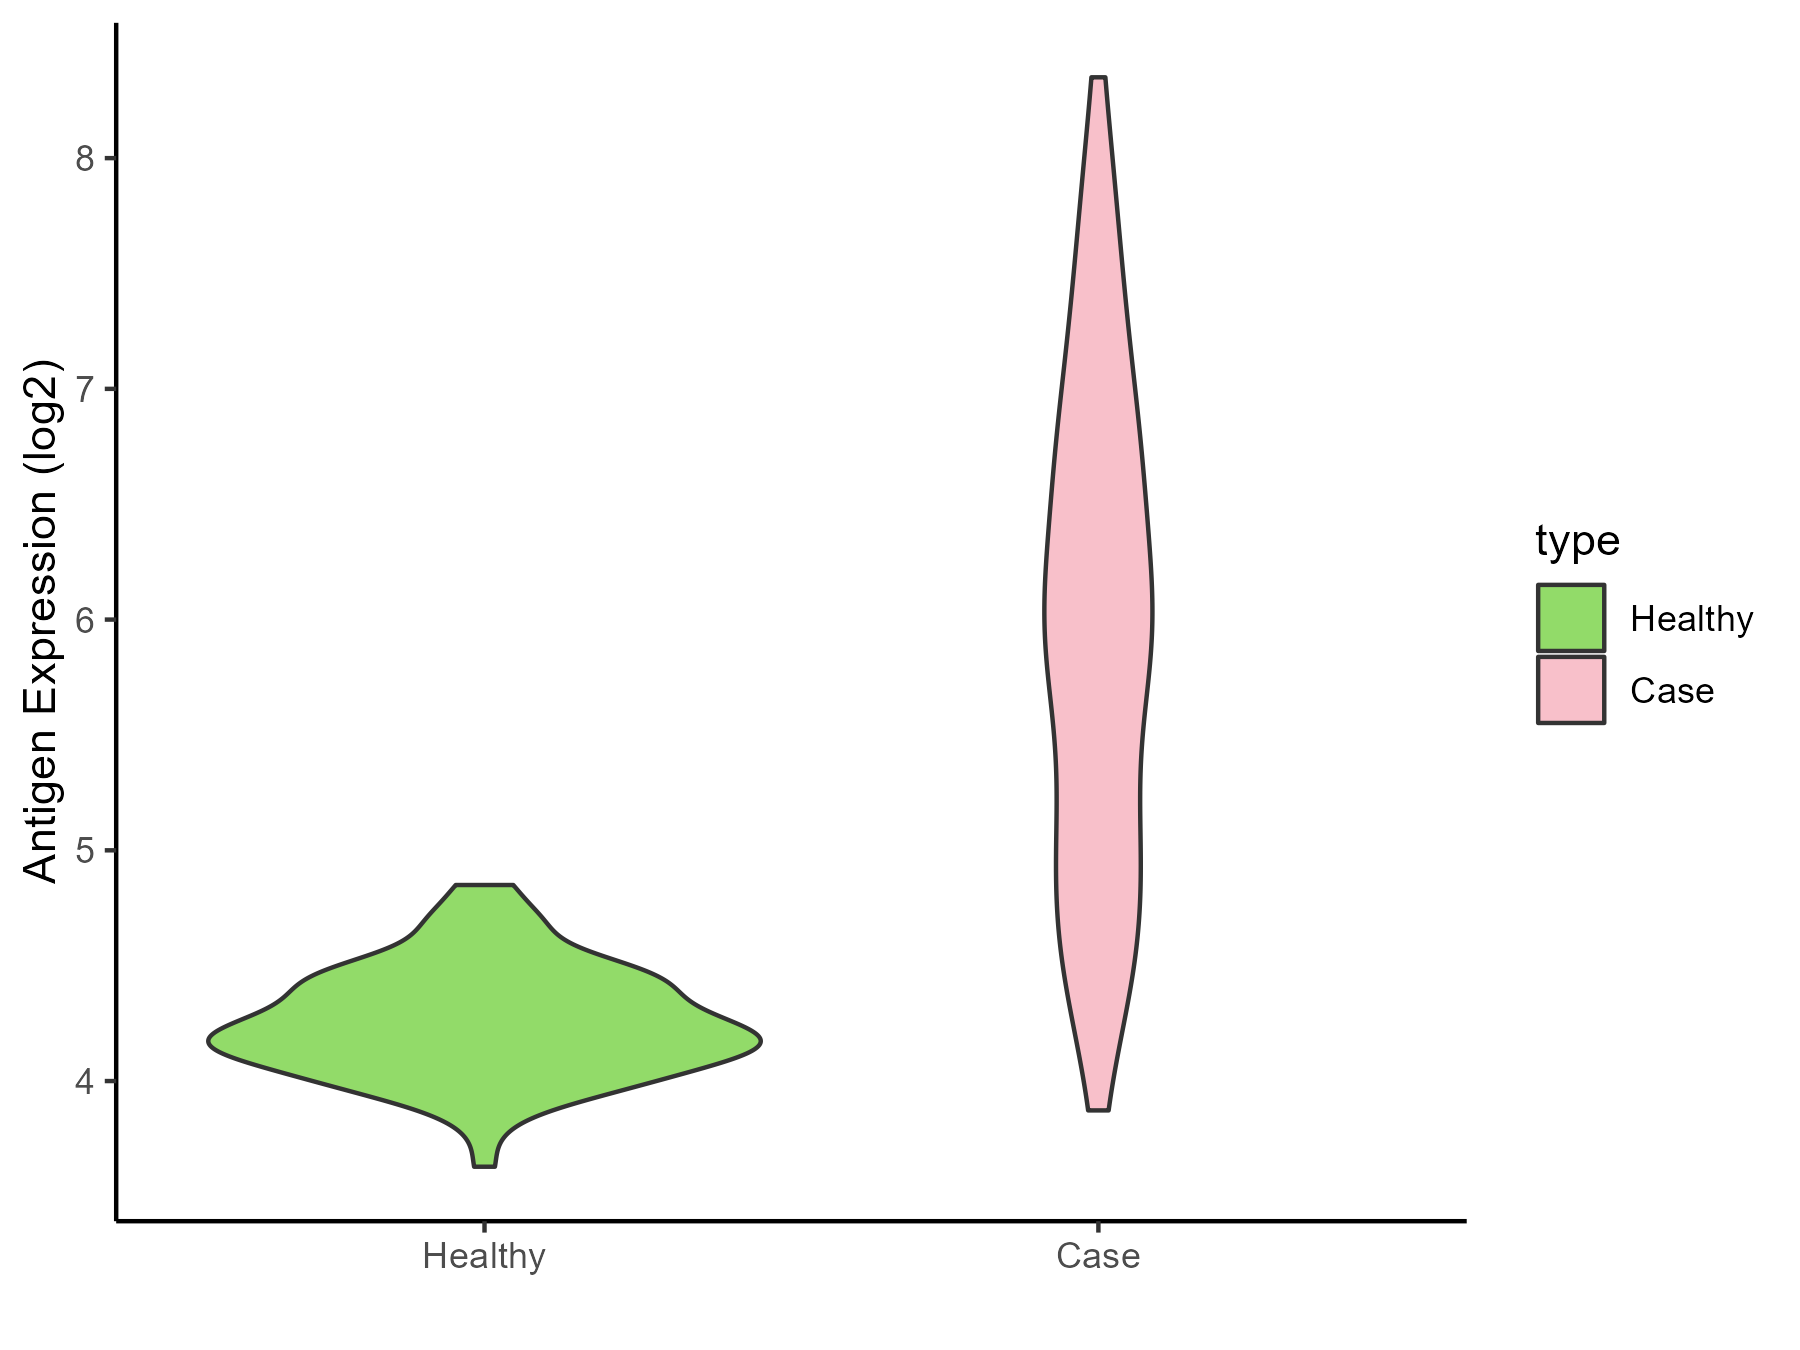
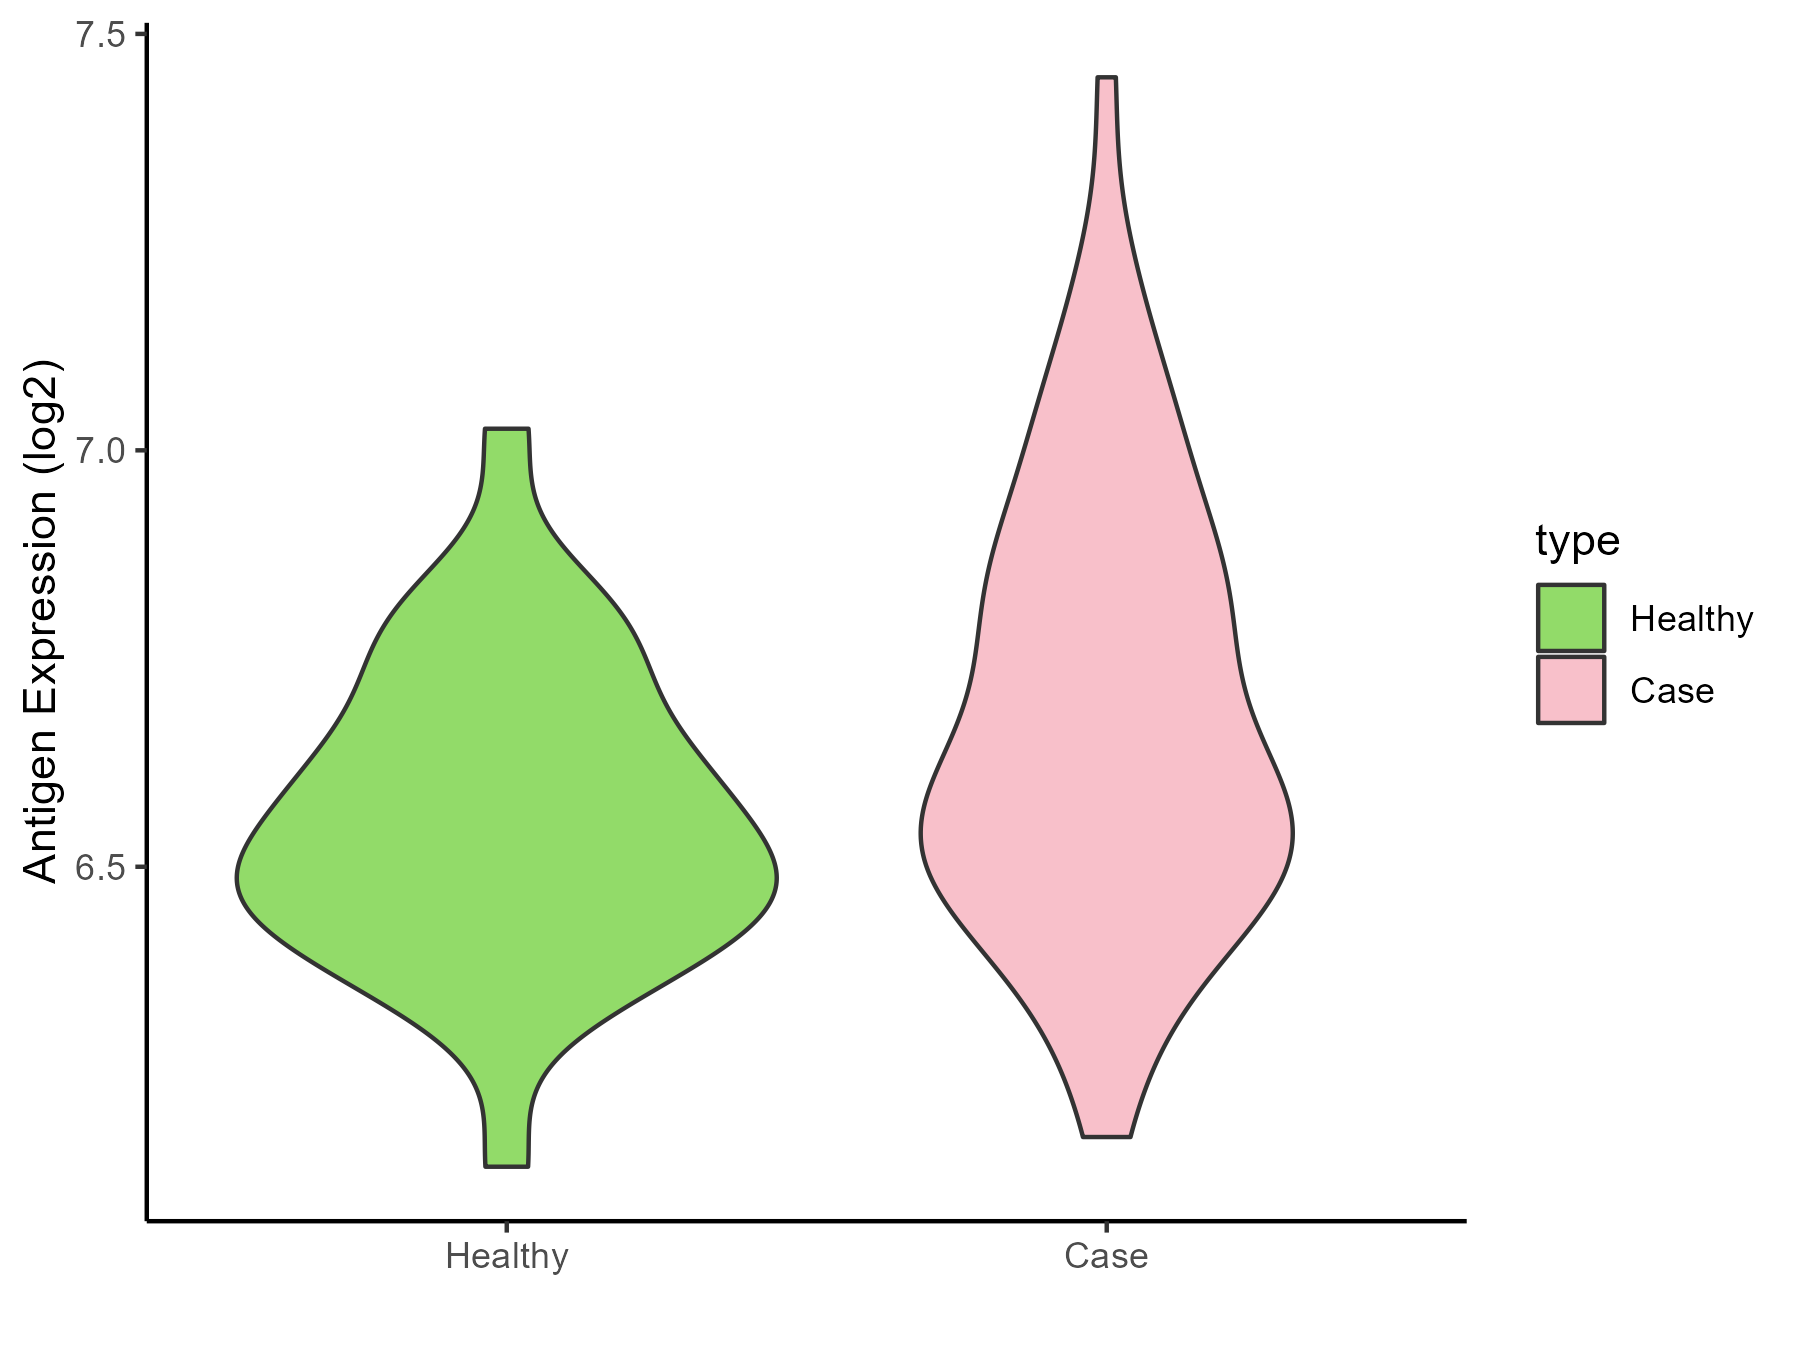
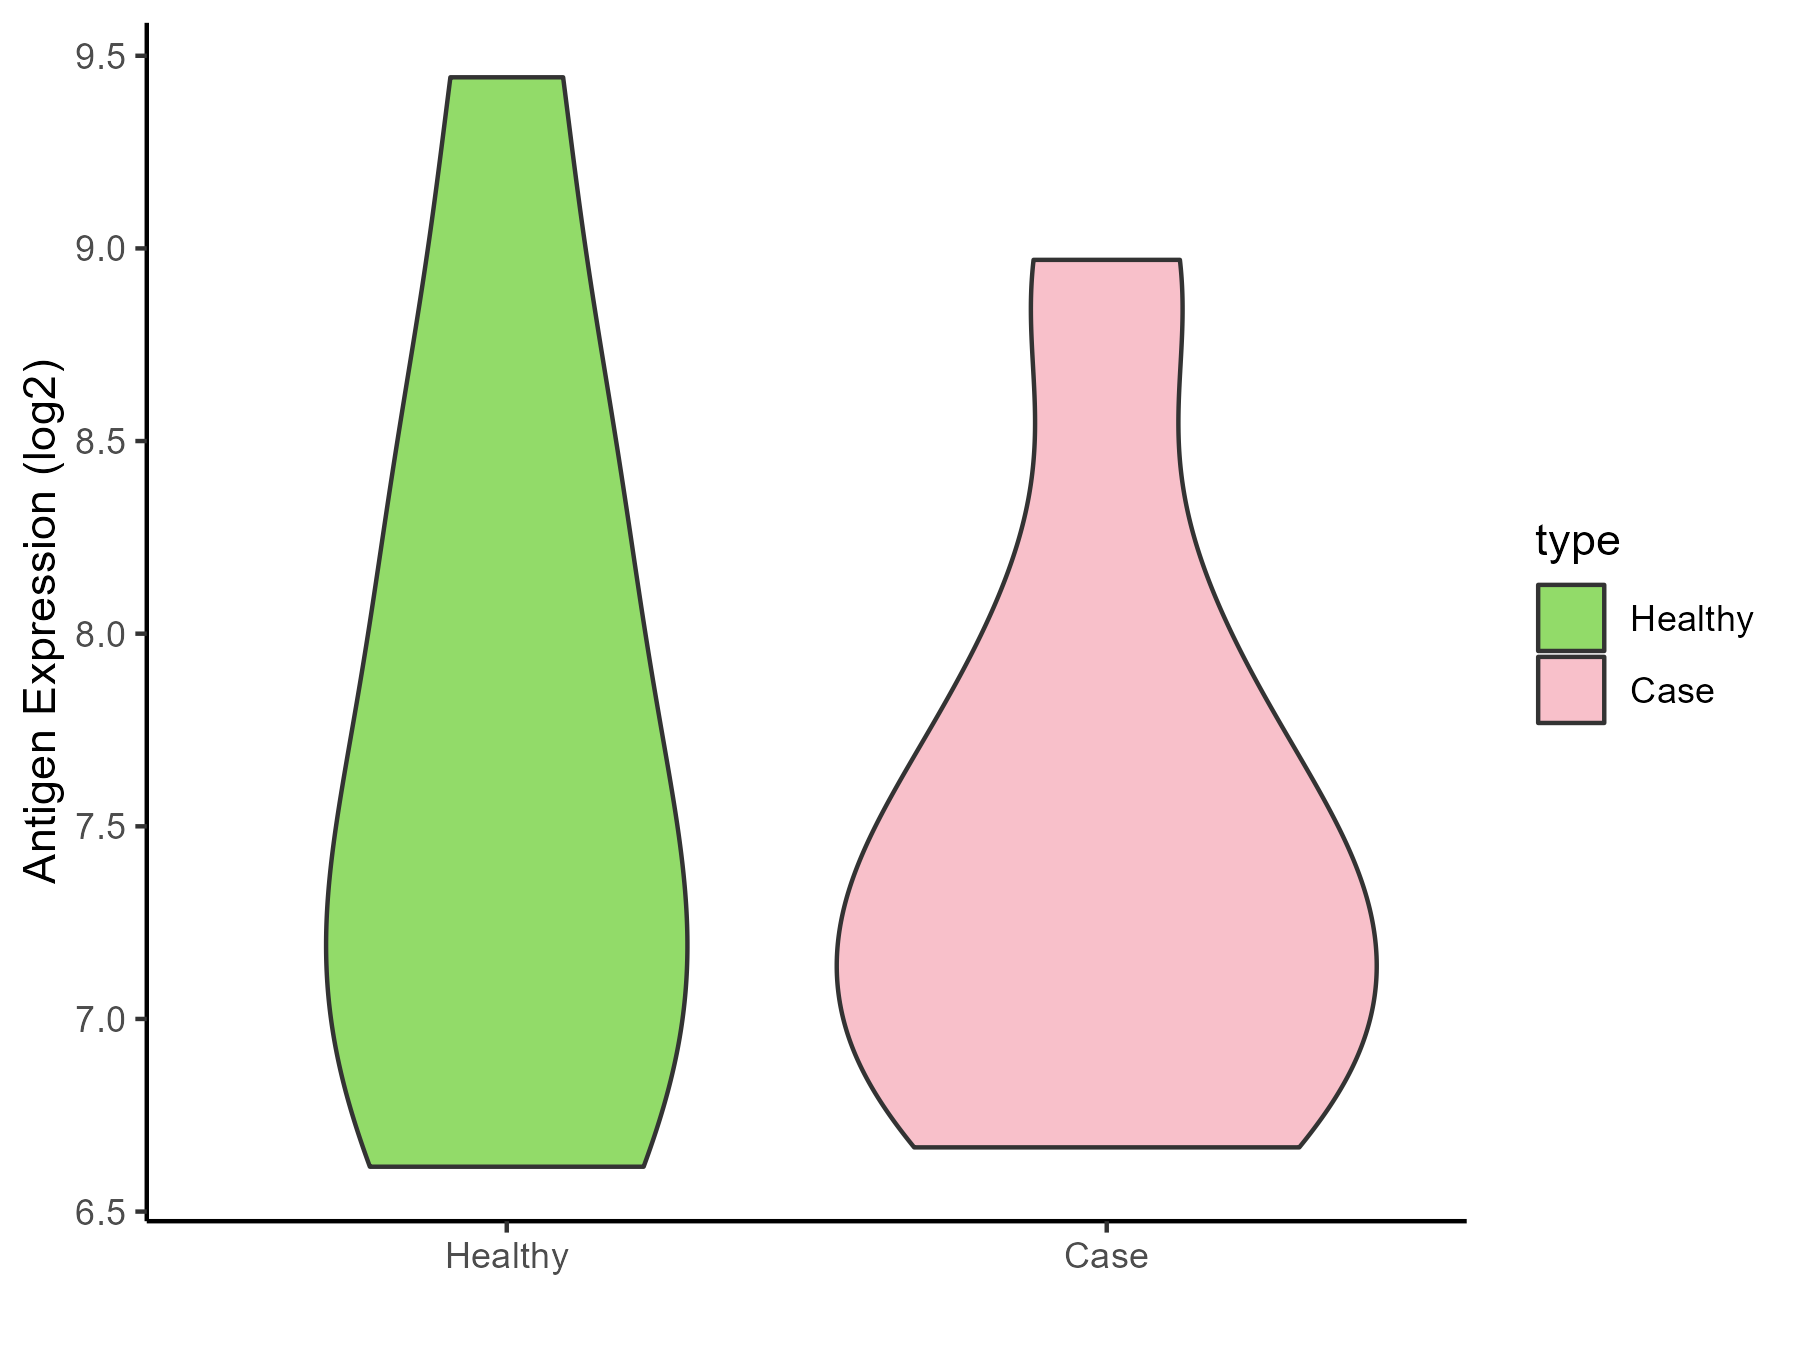
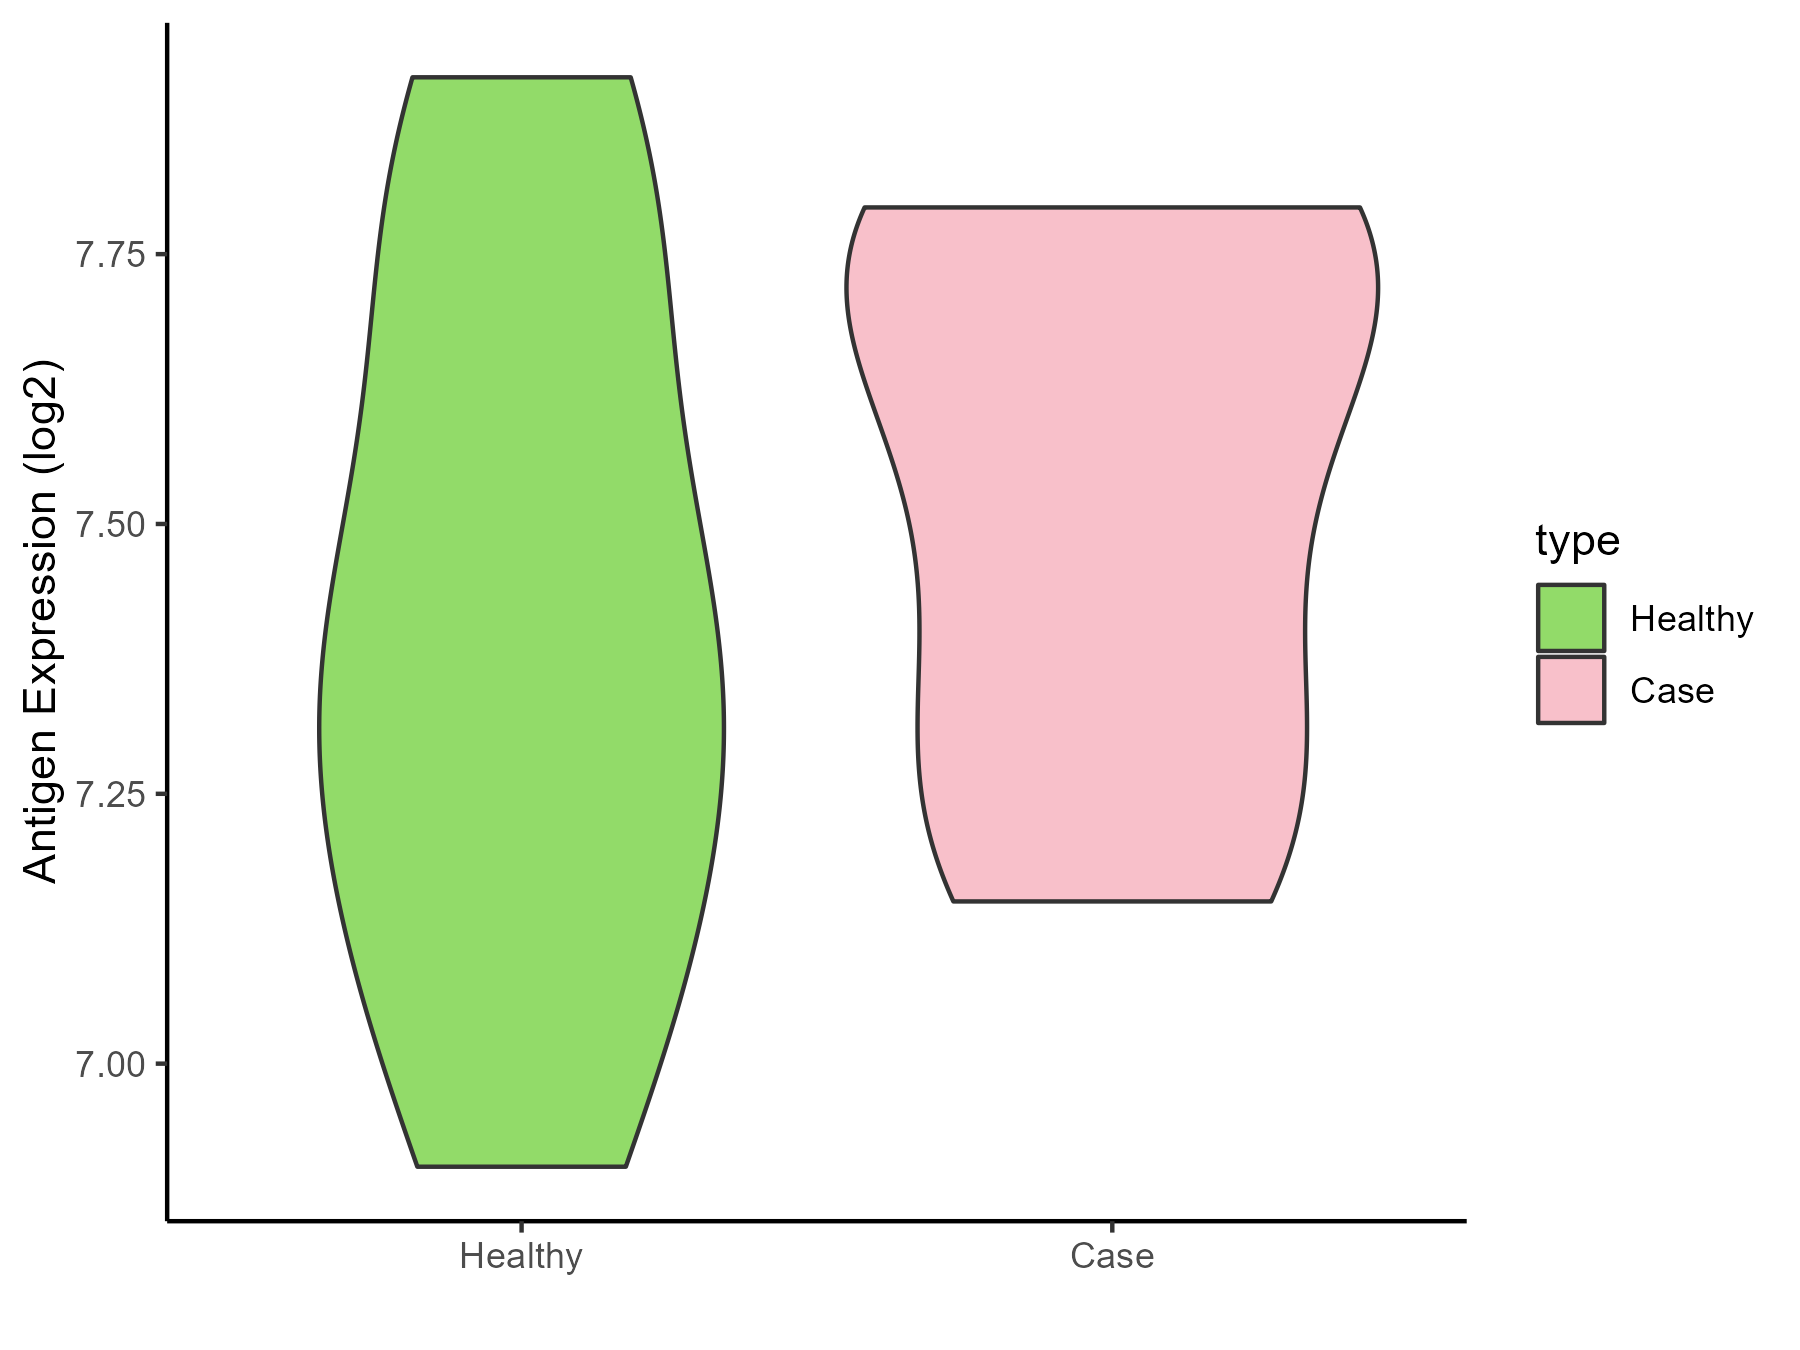
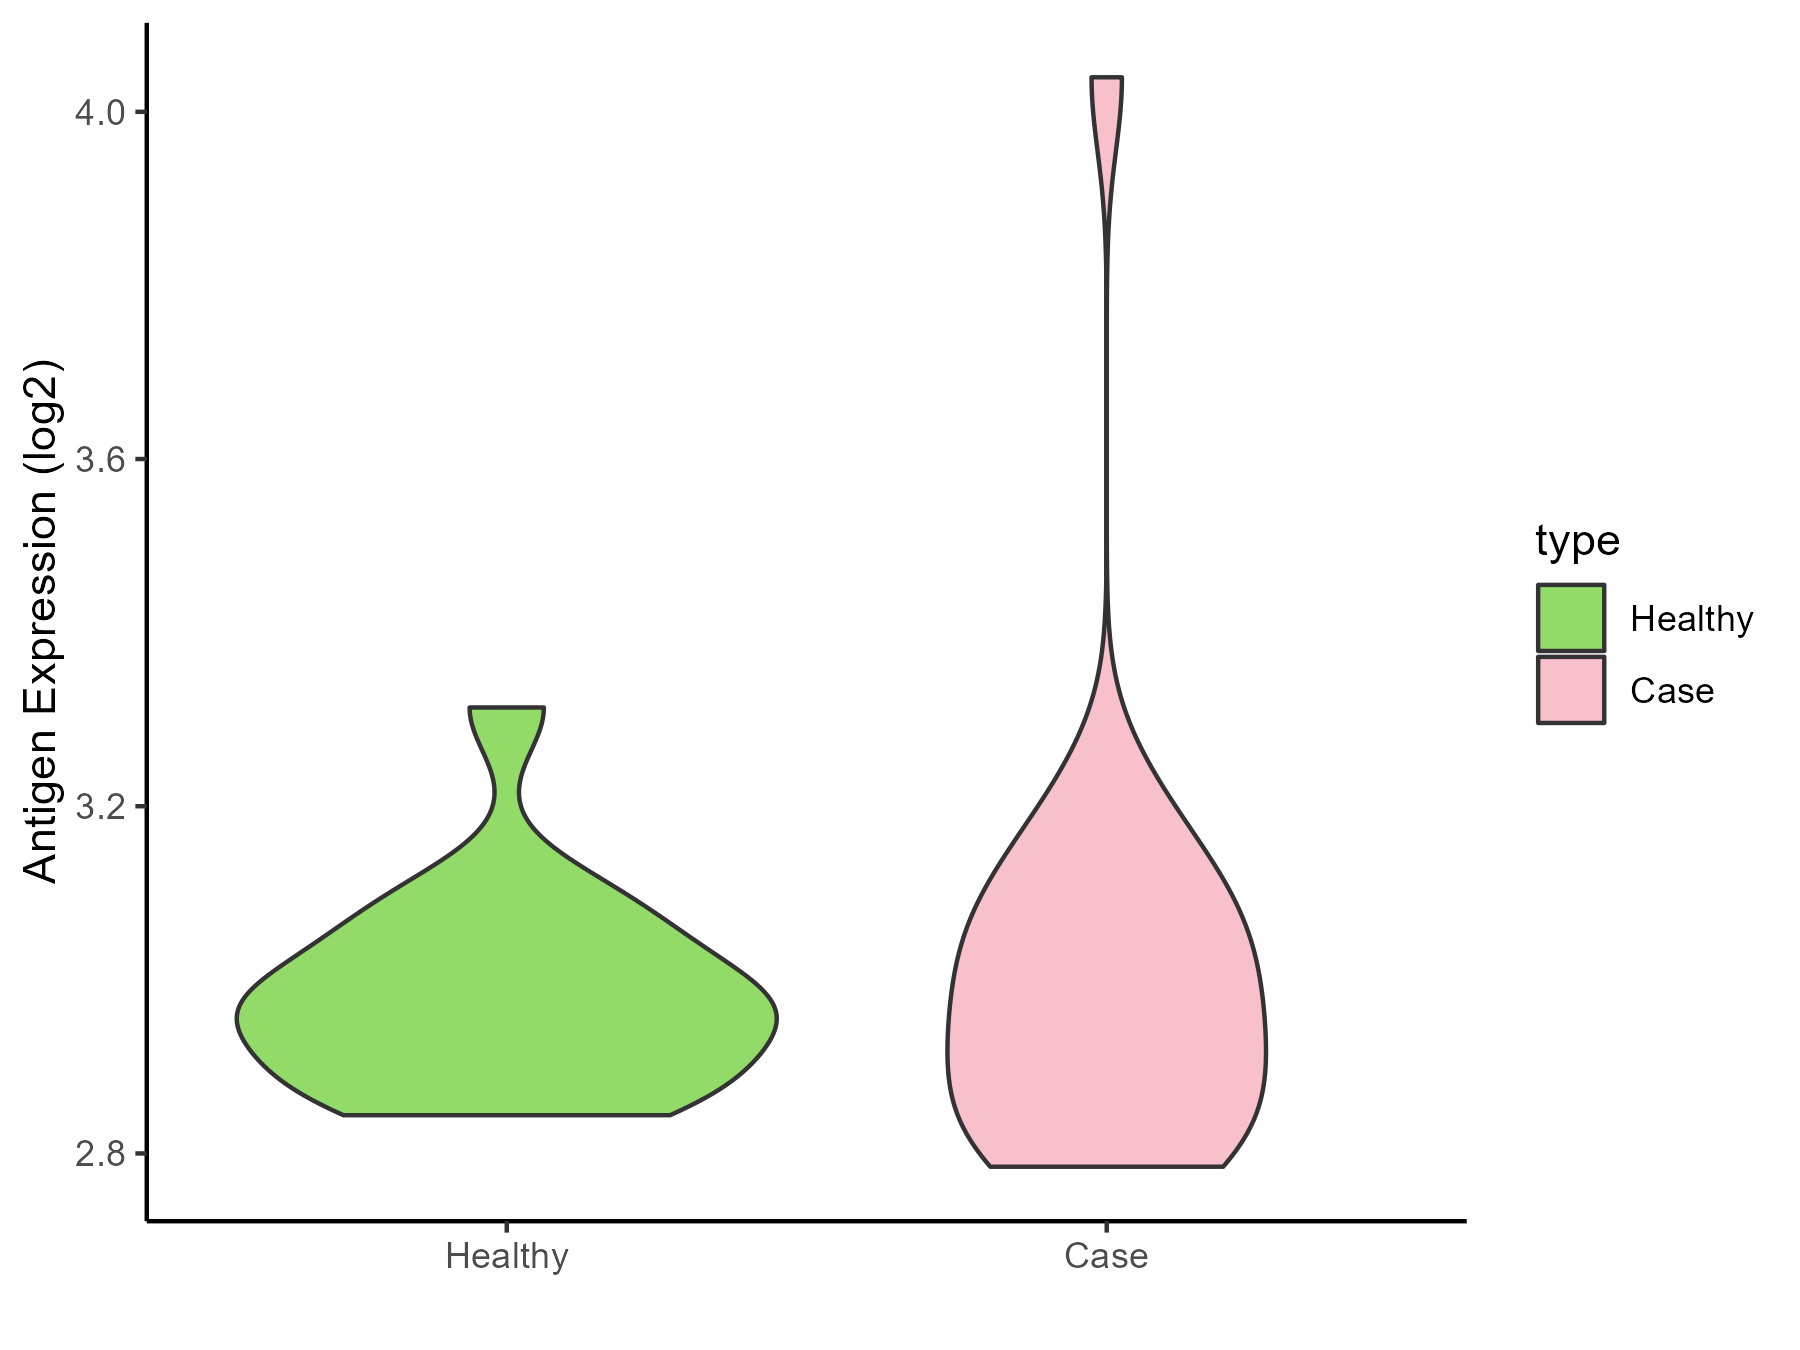
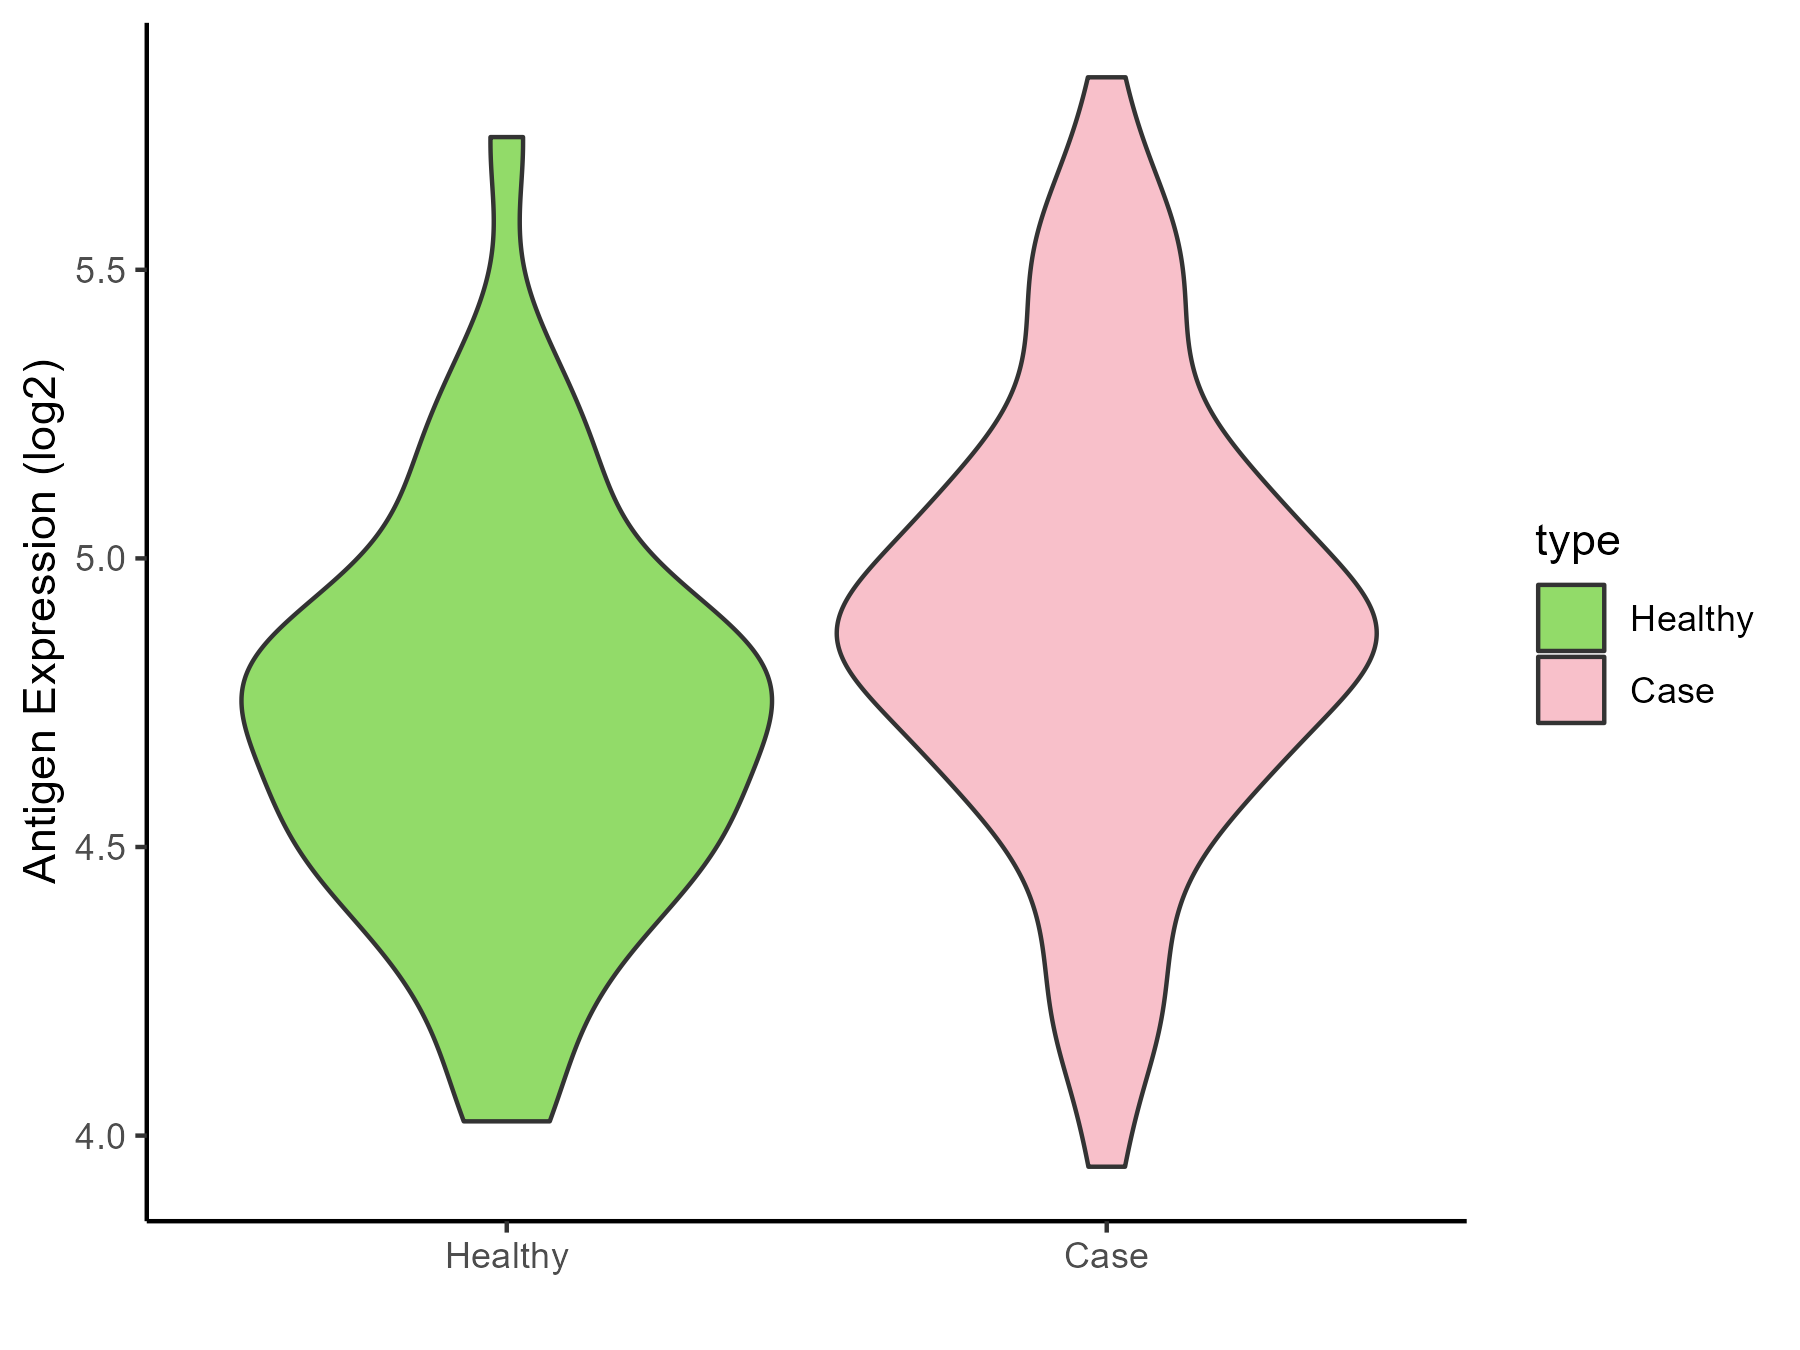
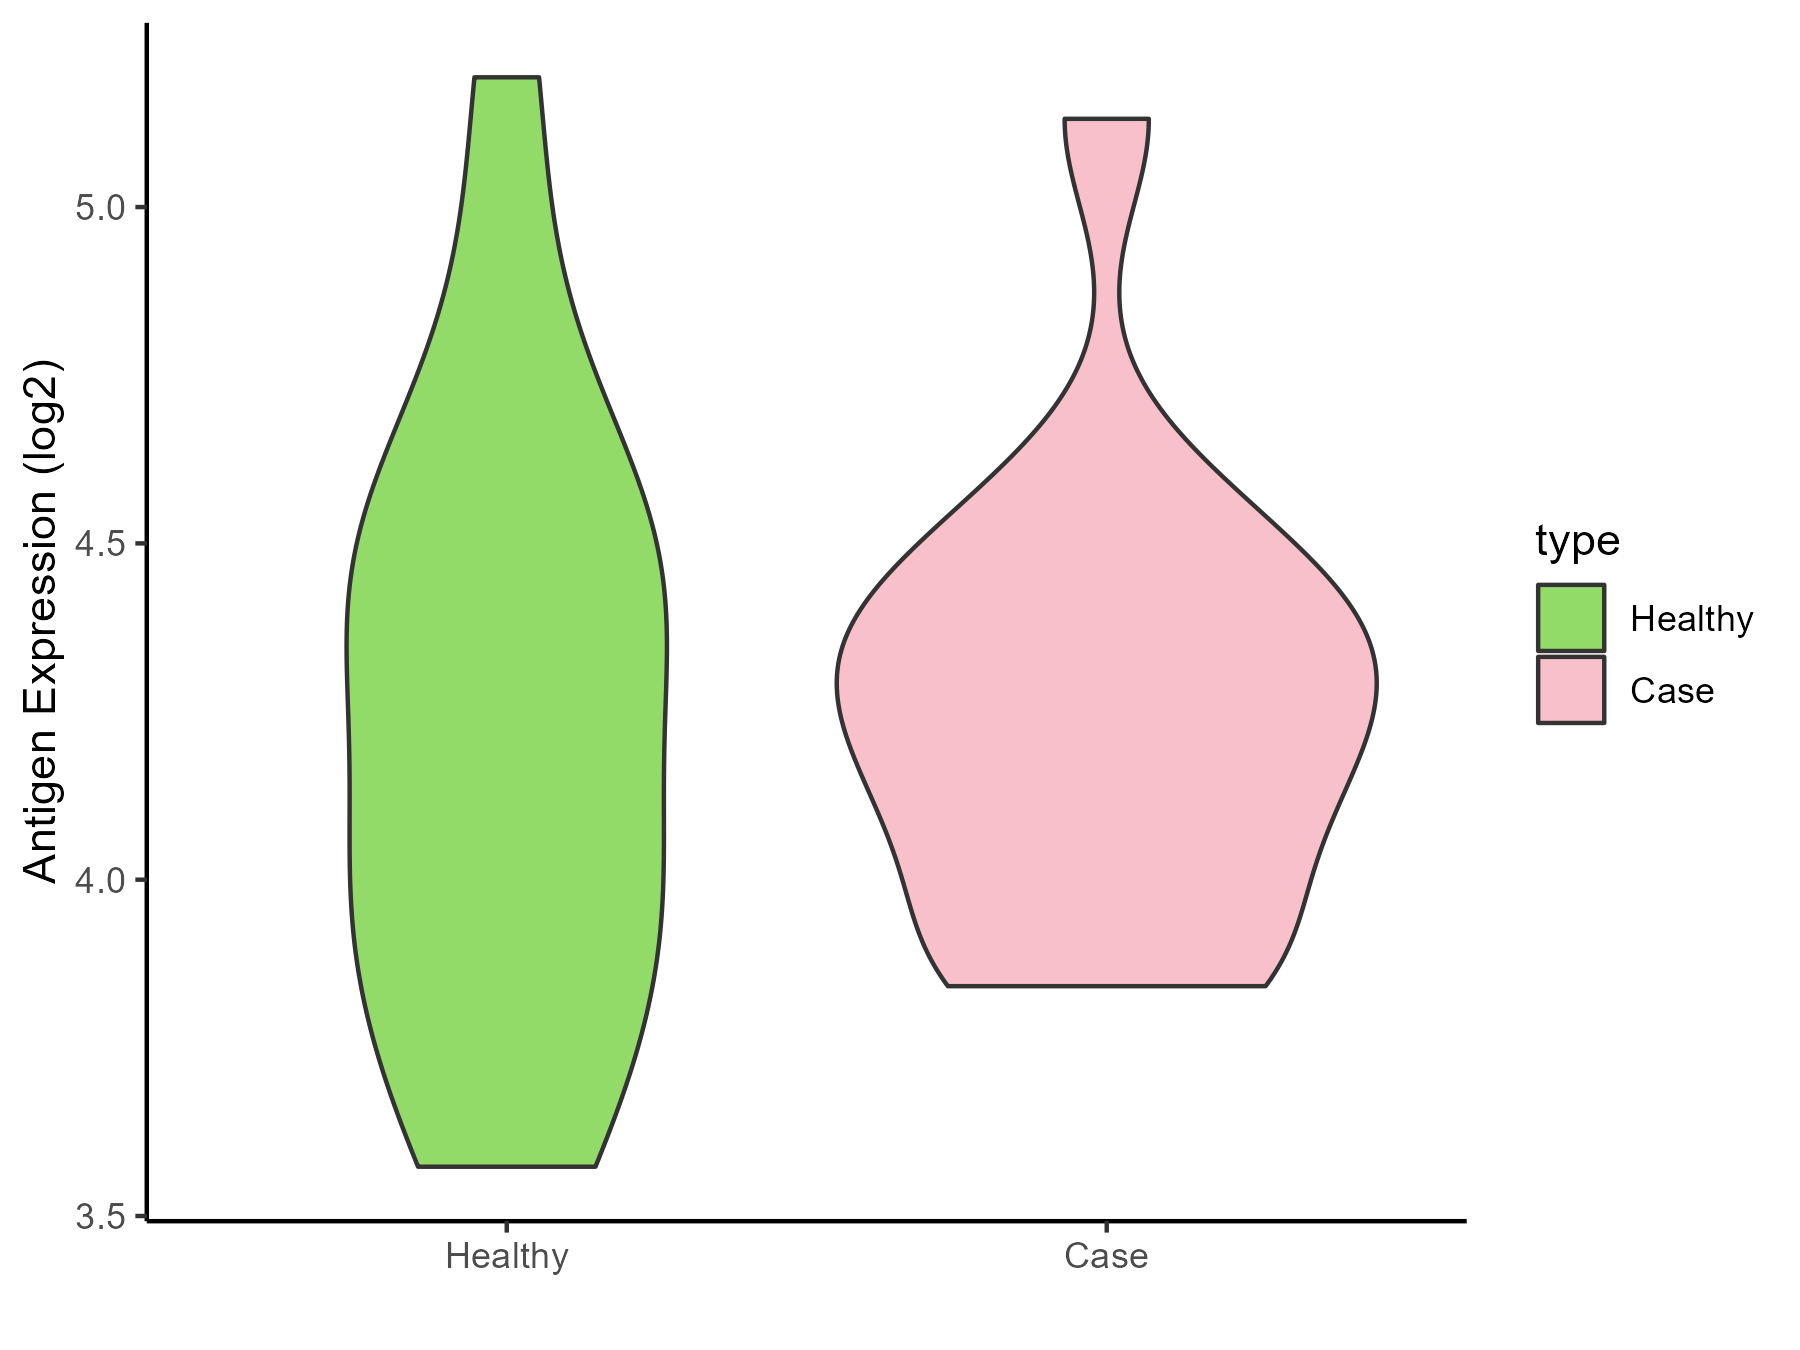
 Bacterial infection [ICD-11: 1A00-1C4Z]
Click to Show/Hide
| Differential expression pattern of antigen in diseases |
| The Studied Tissue |
Gingival |
| The Specific Disease |
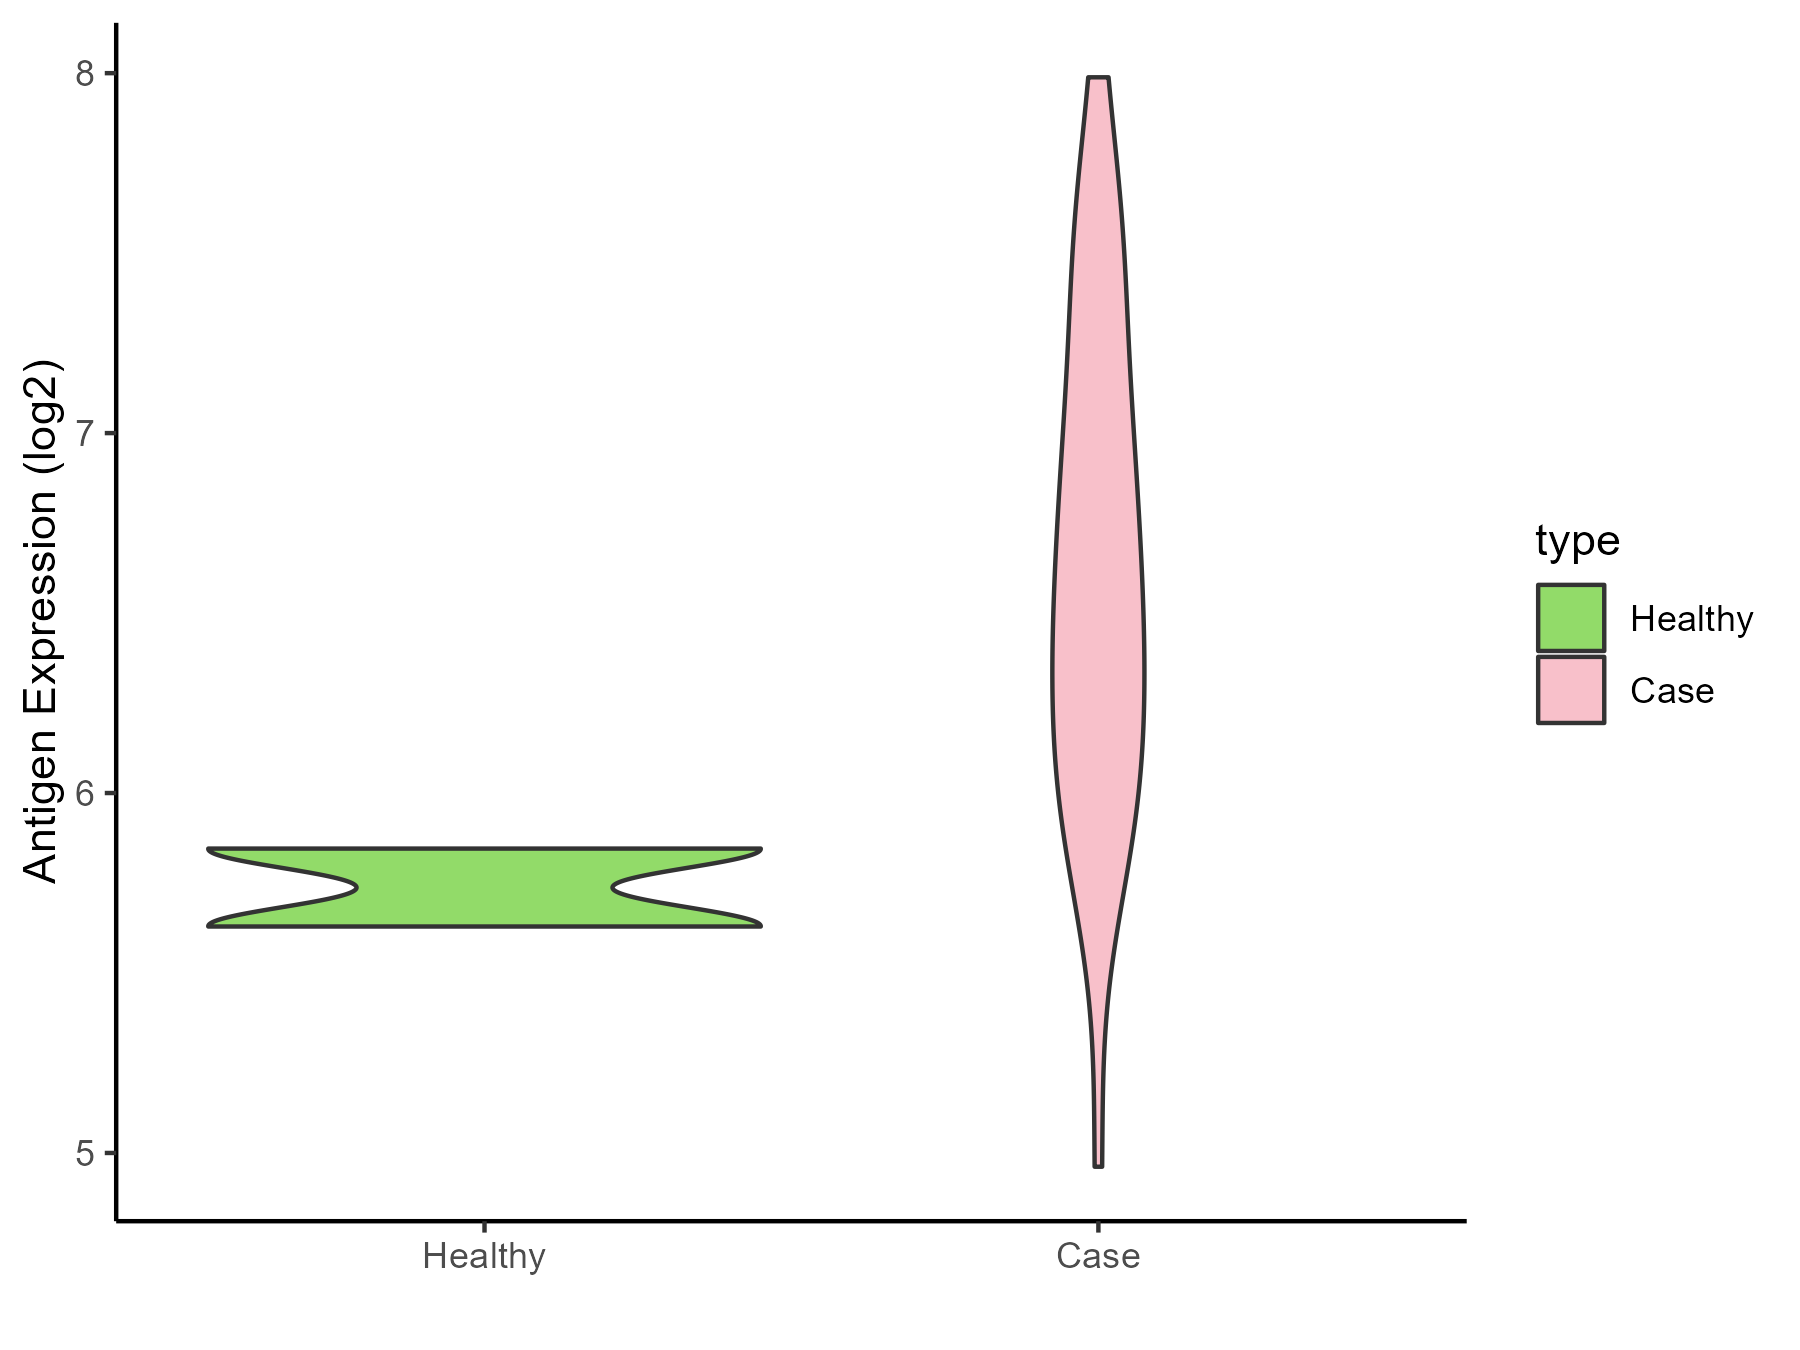
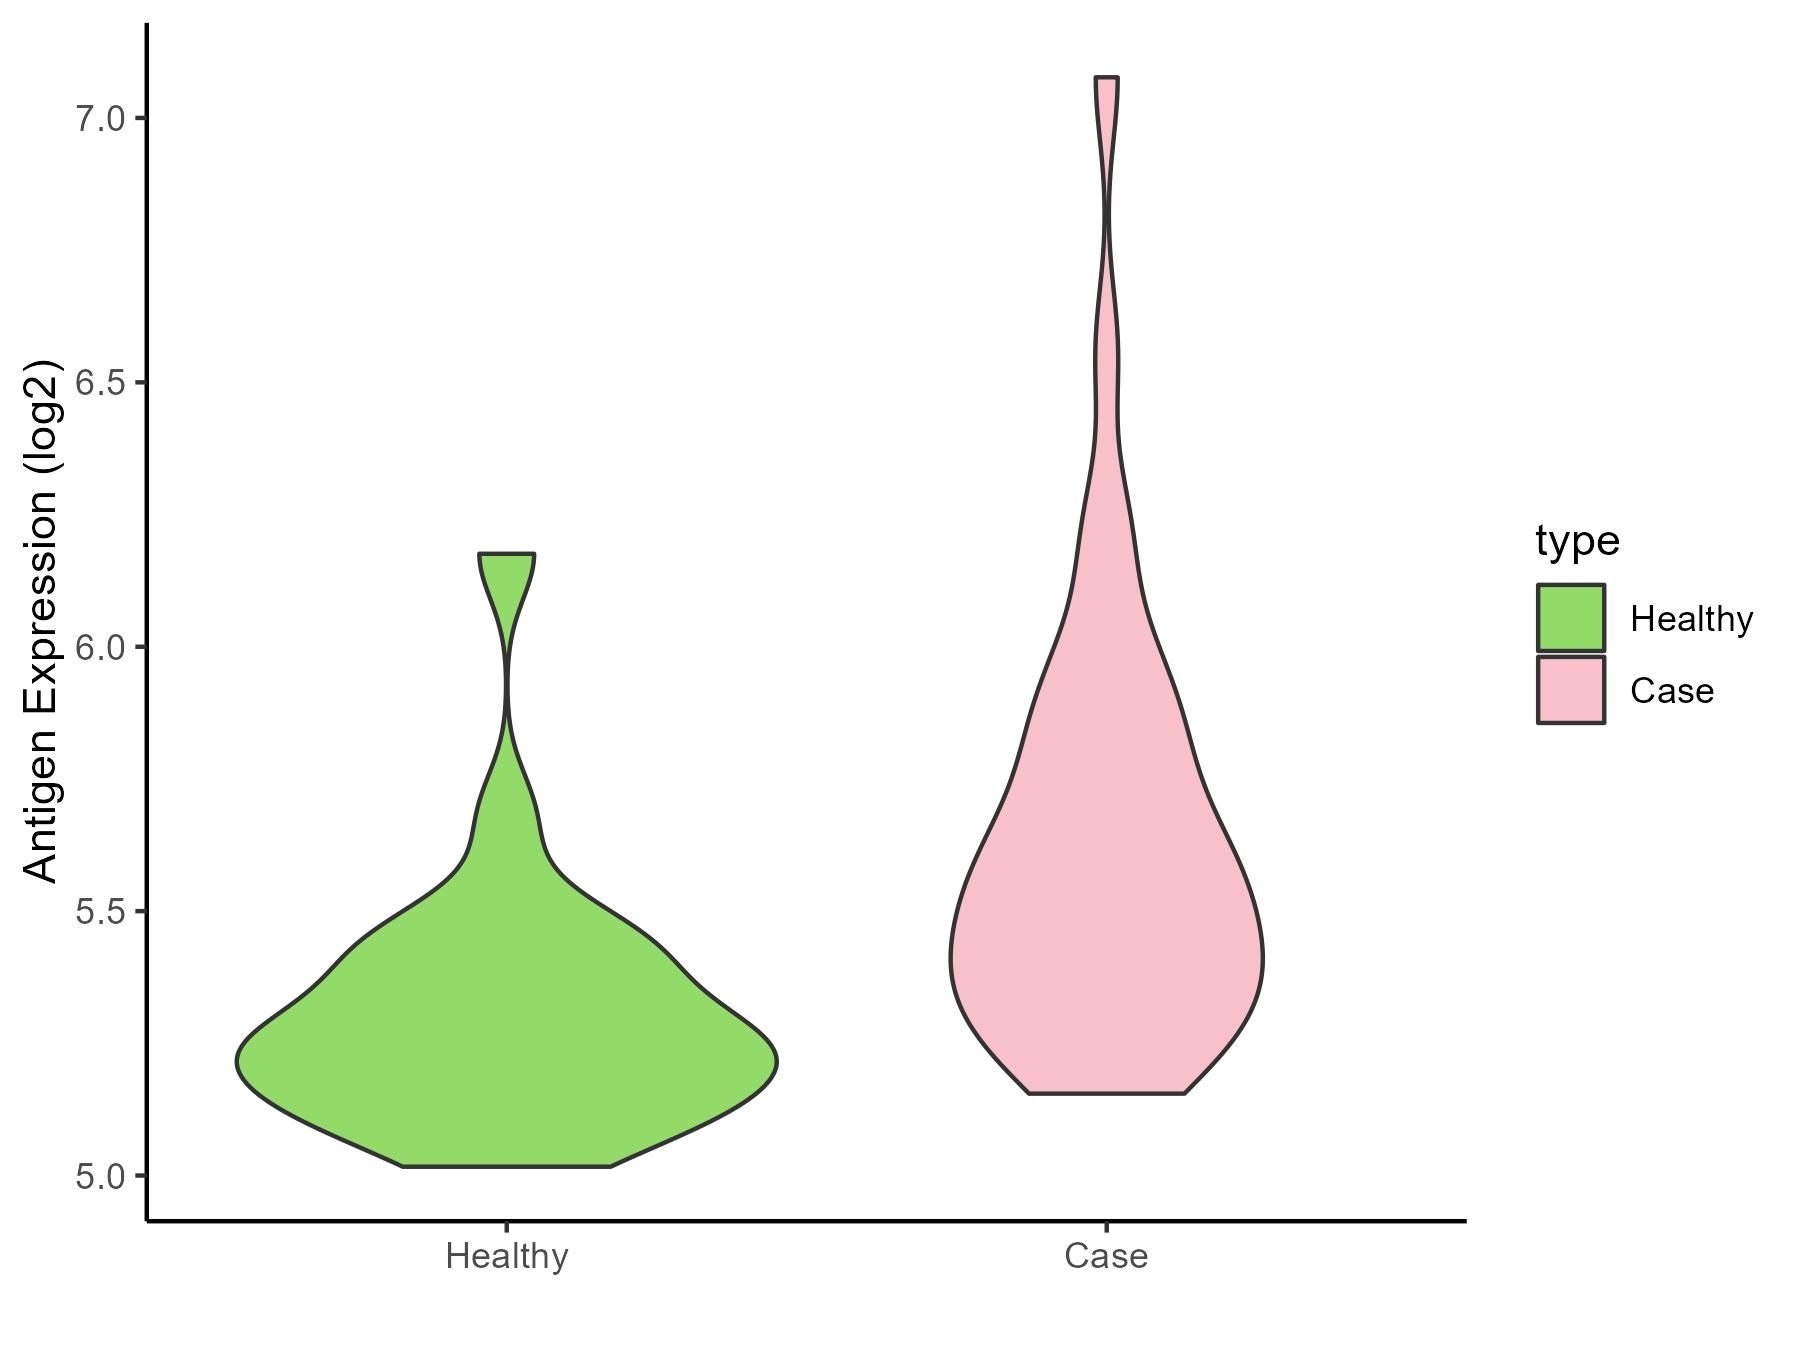
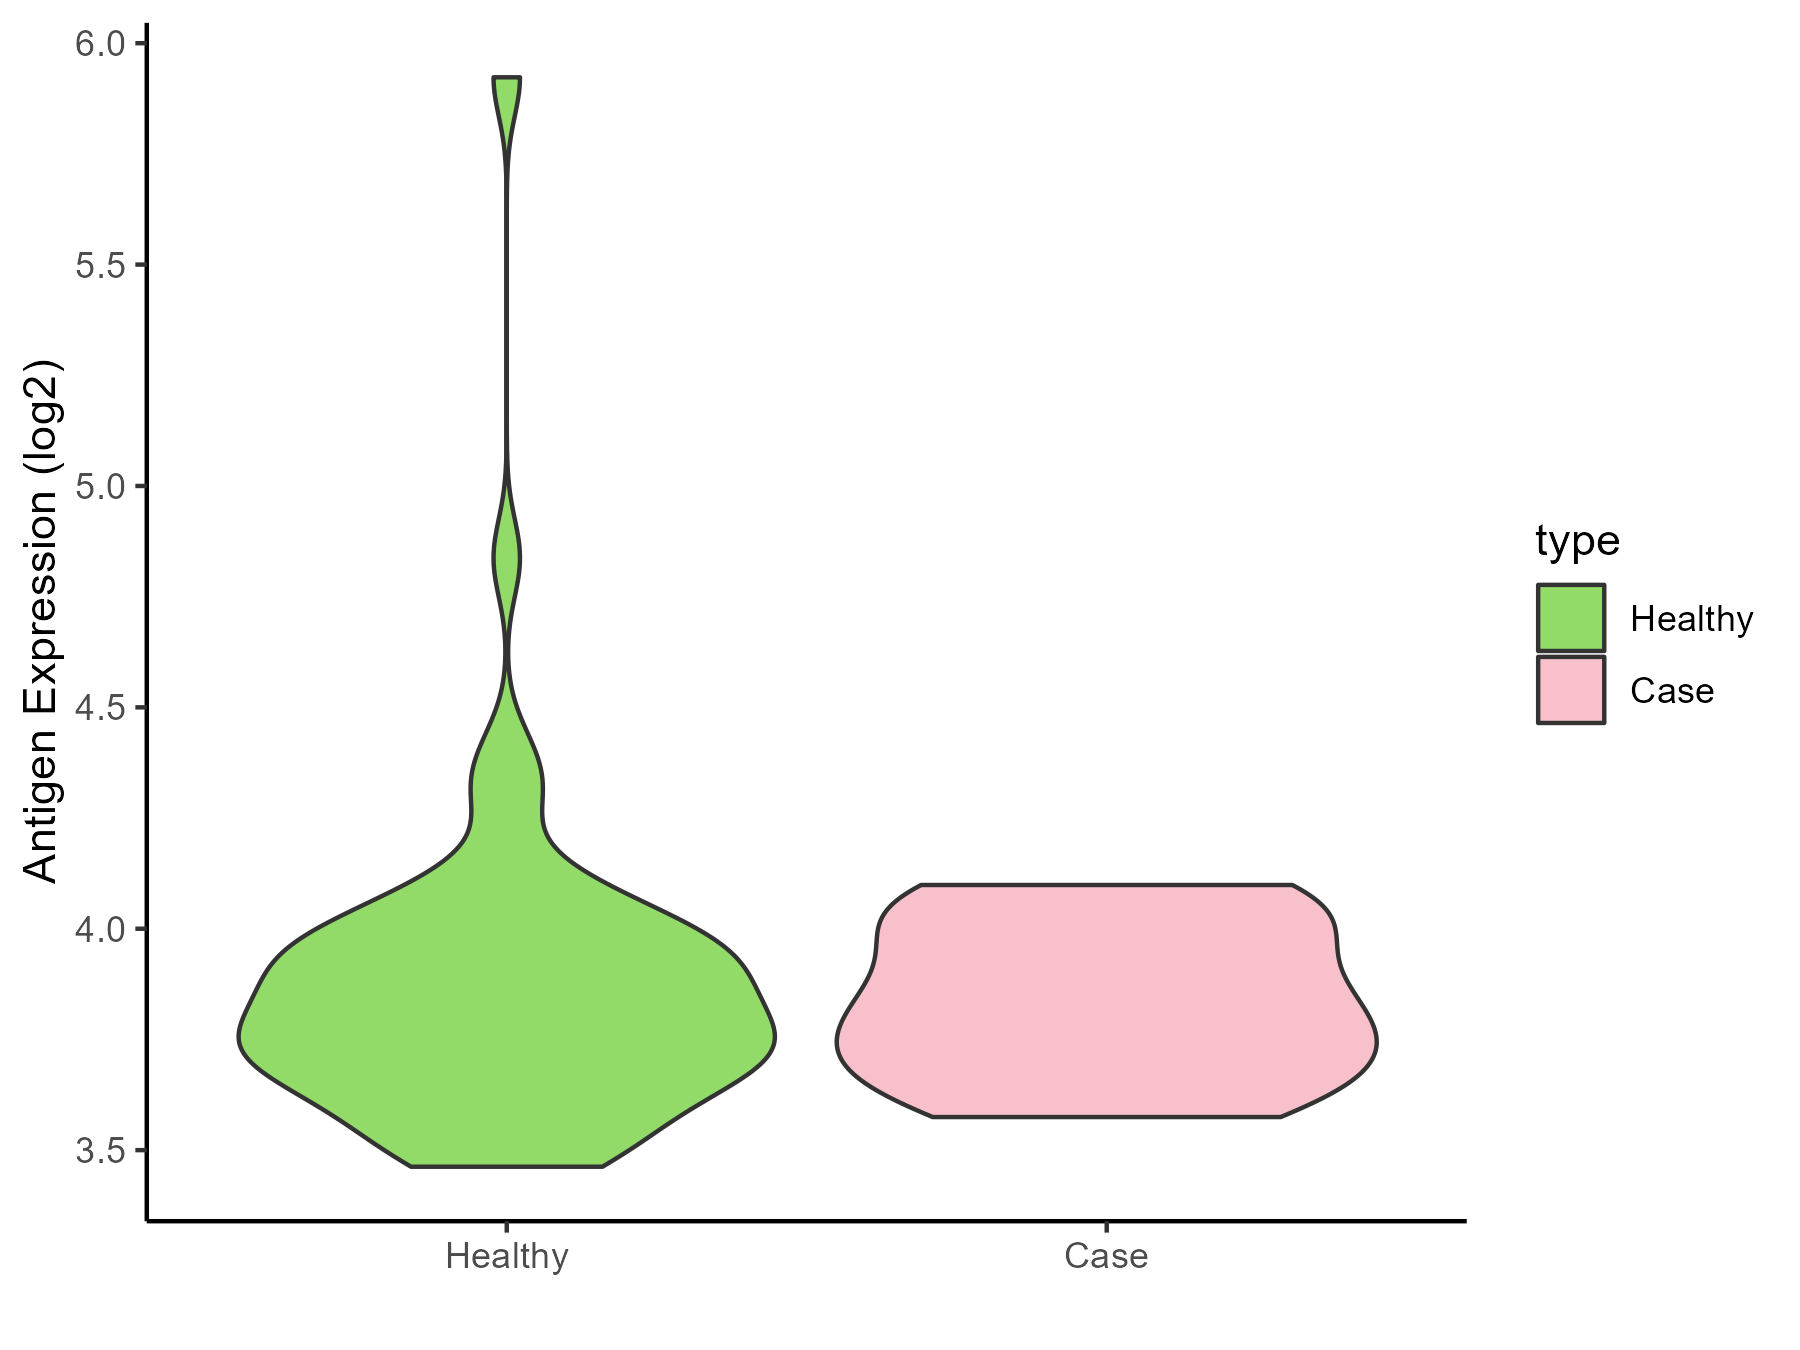
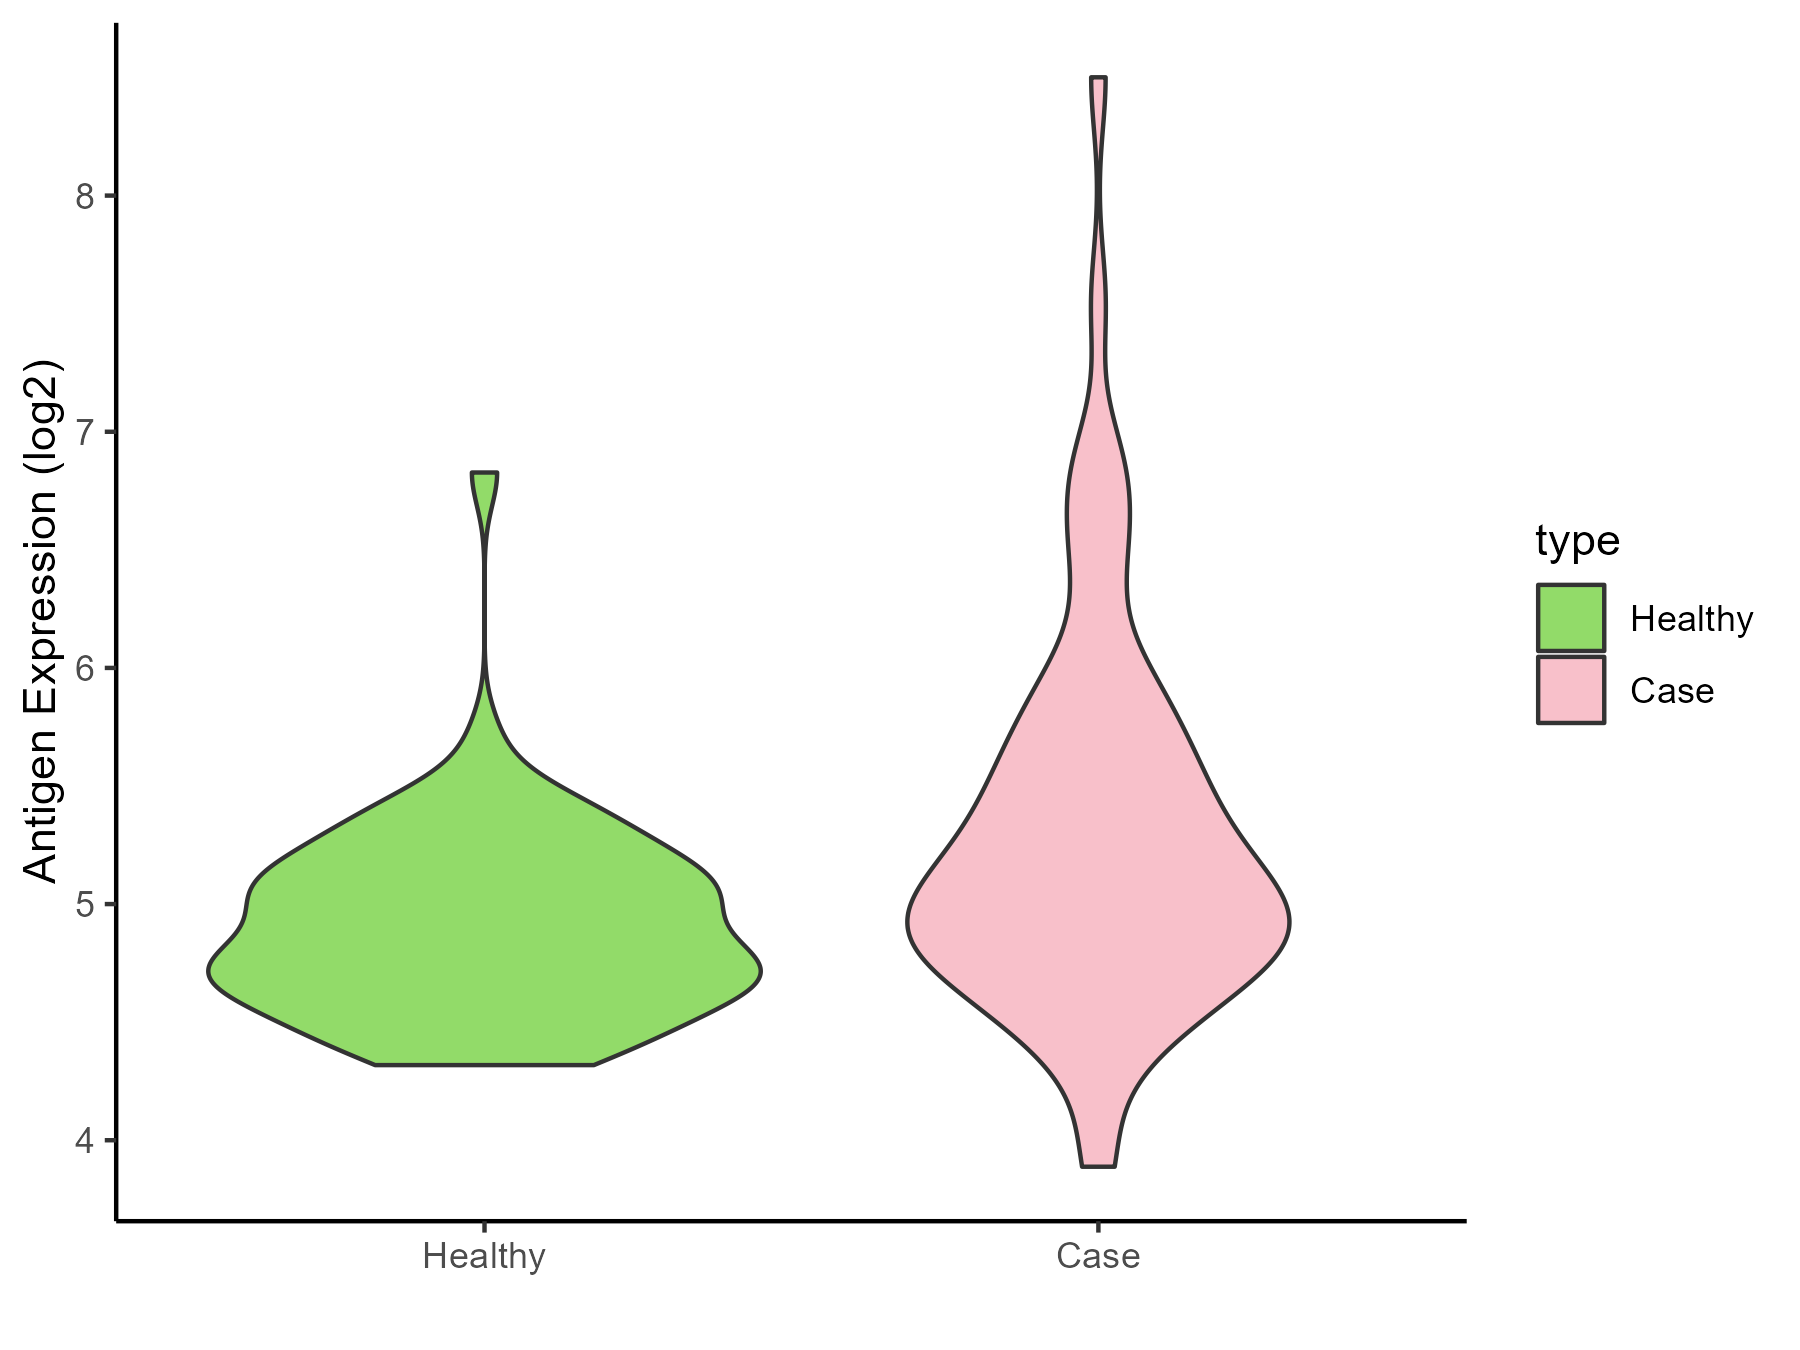
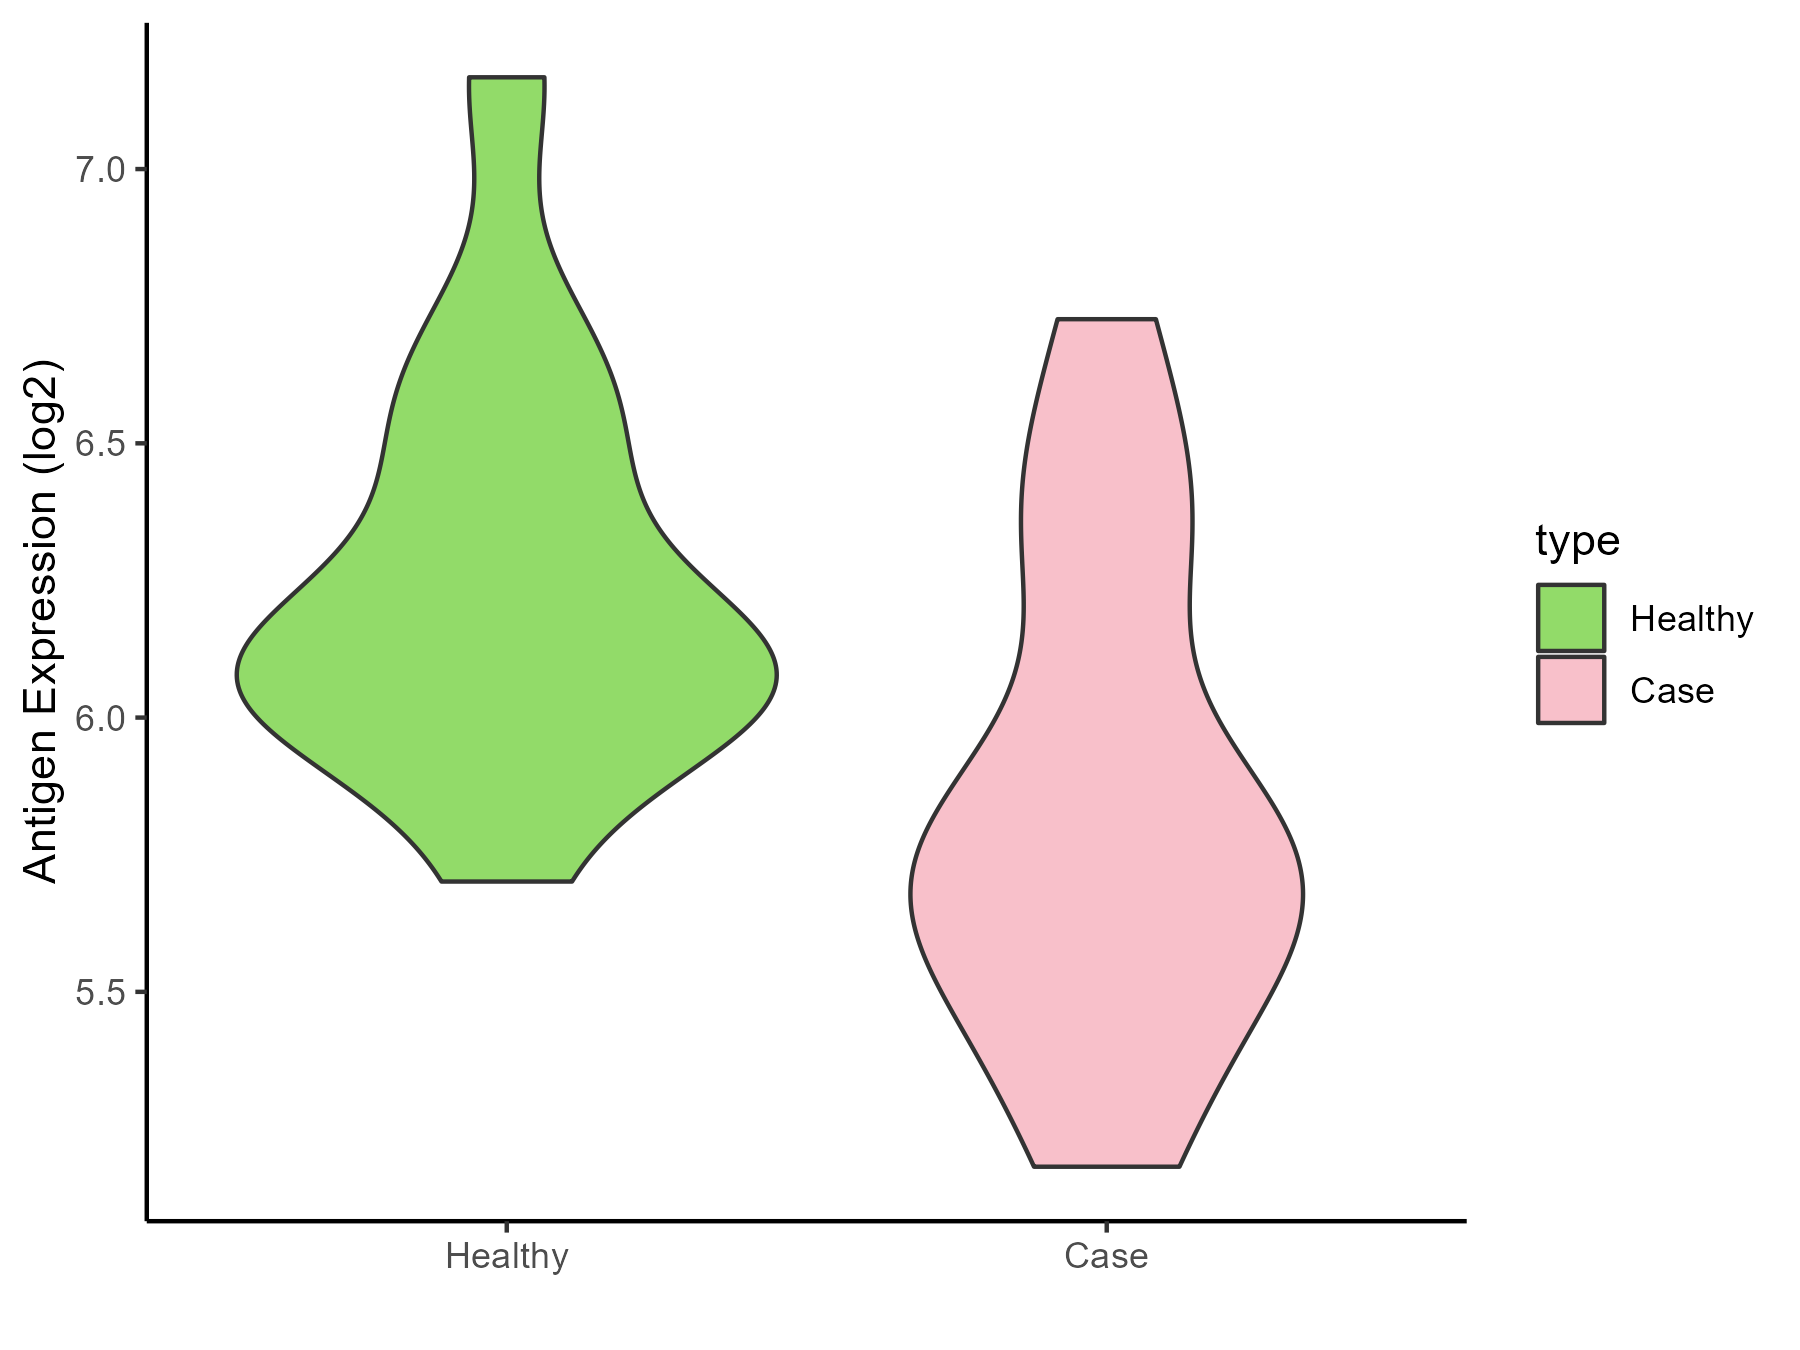
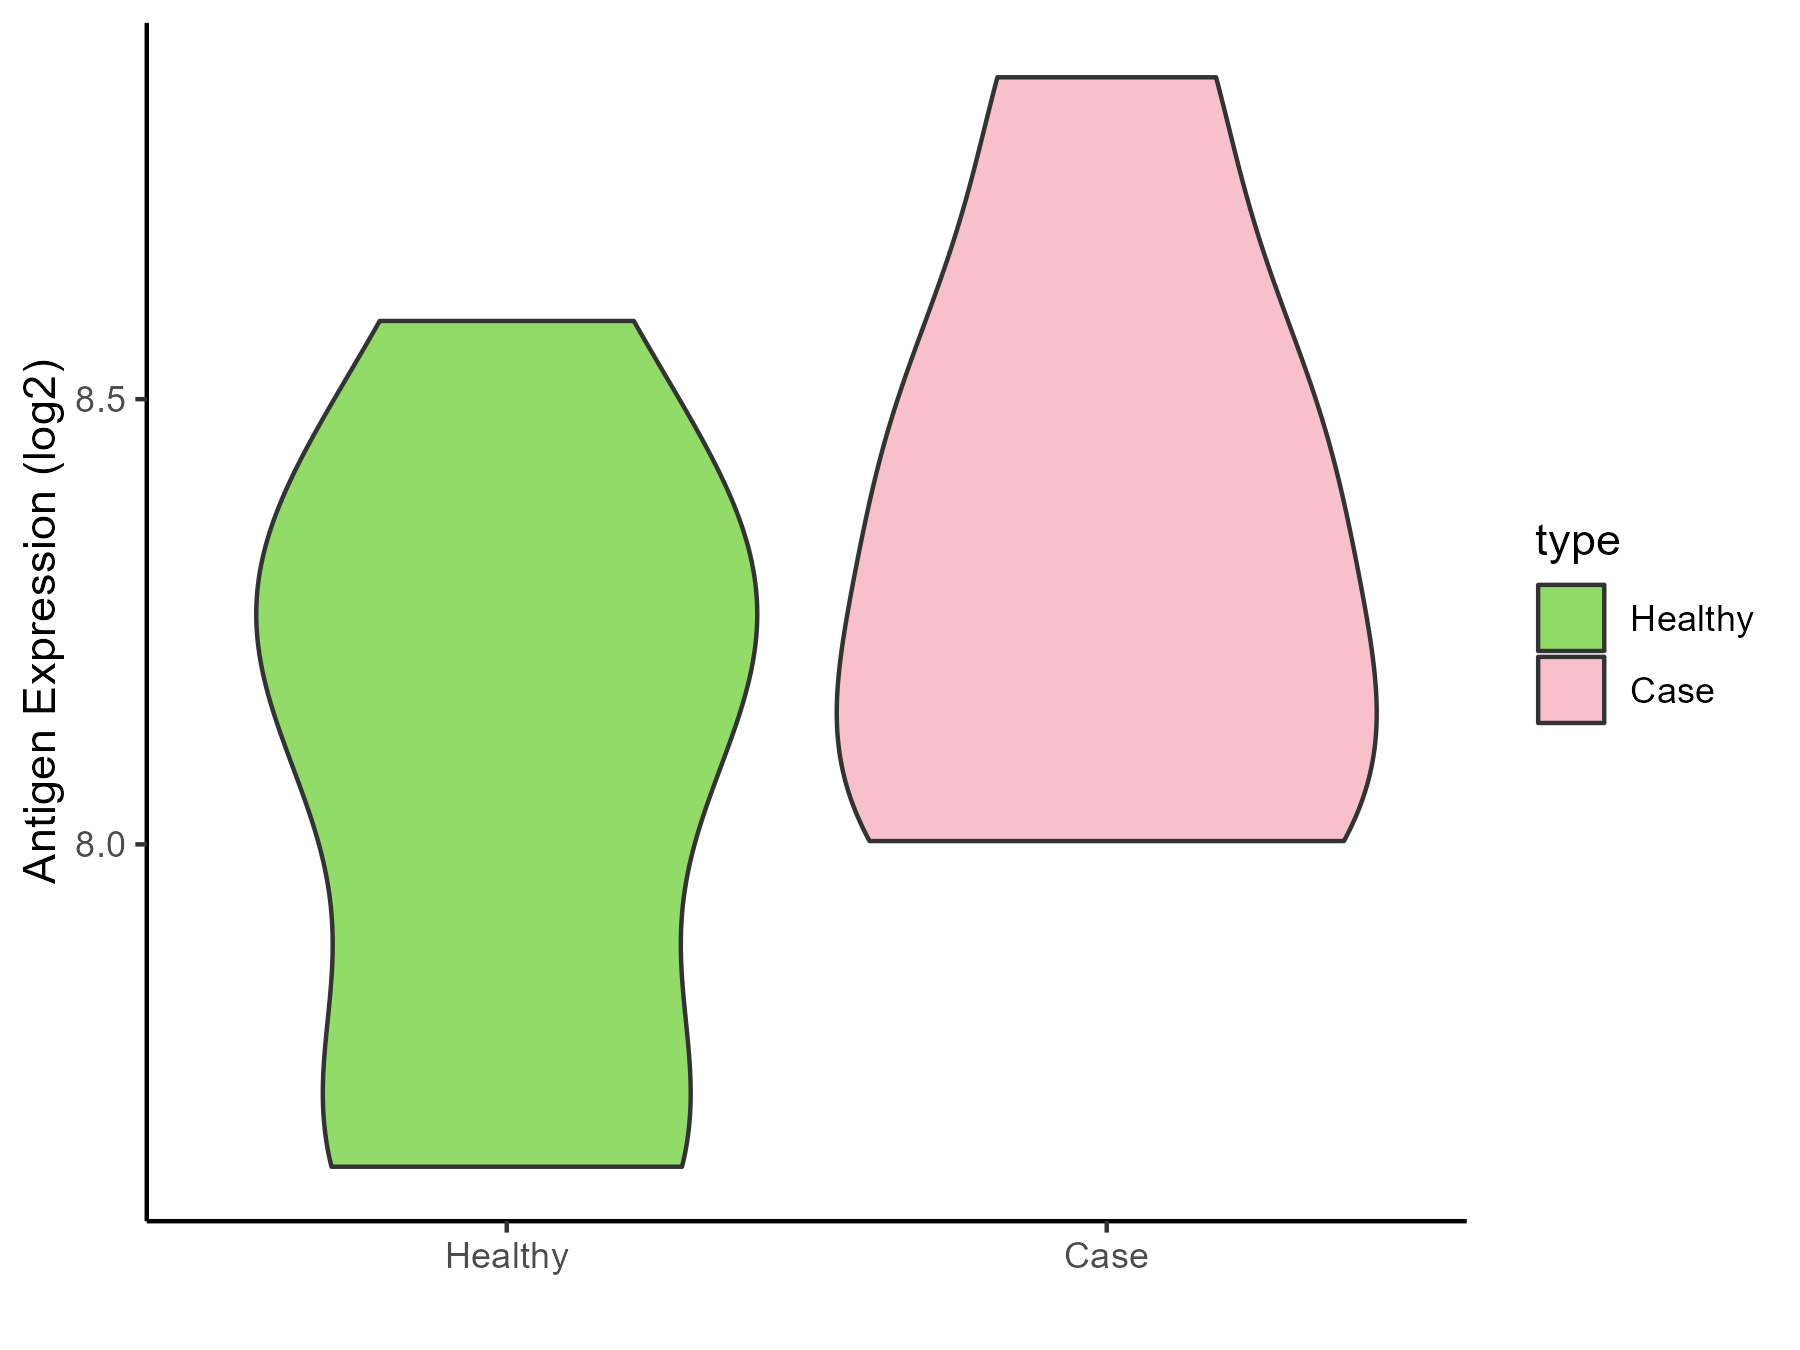
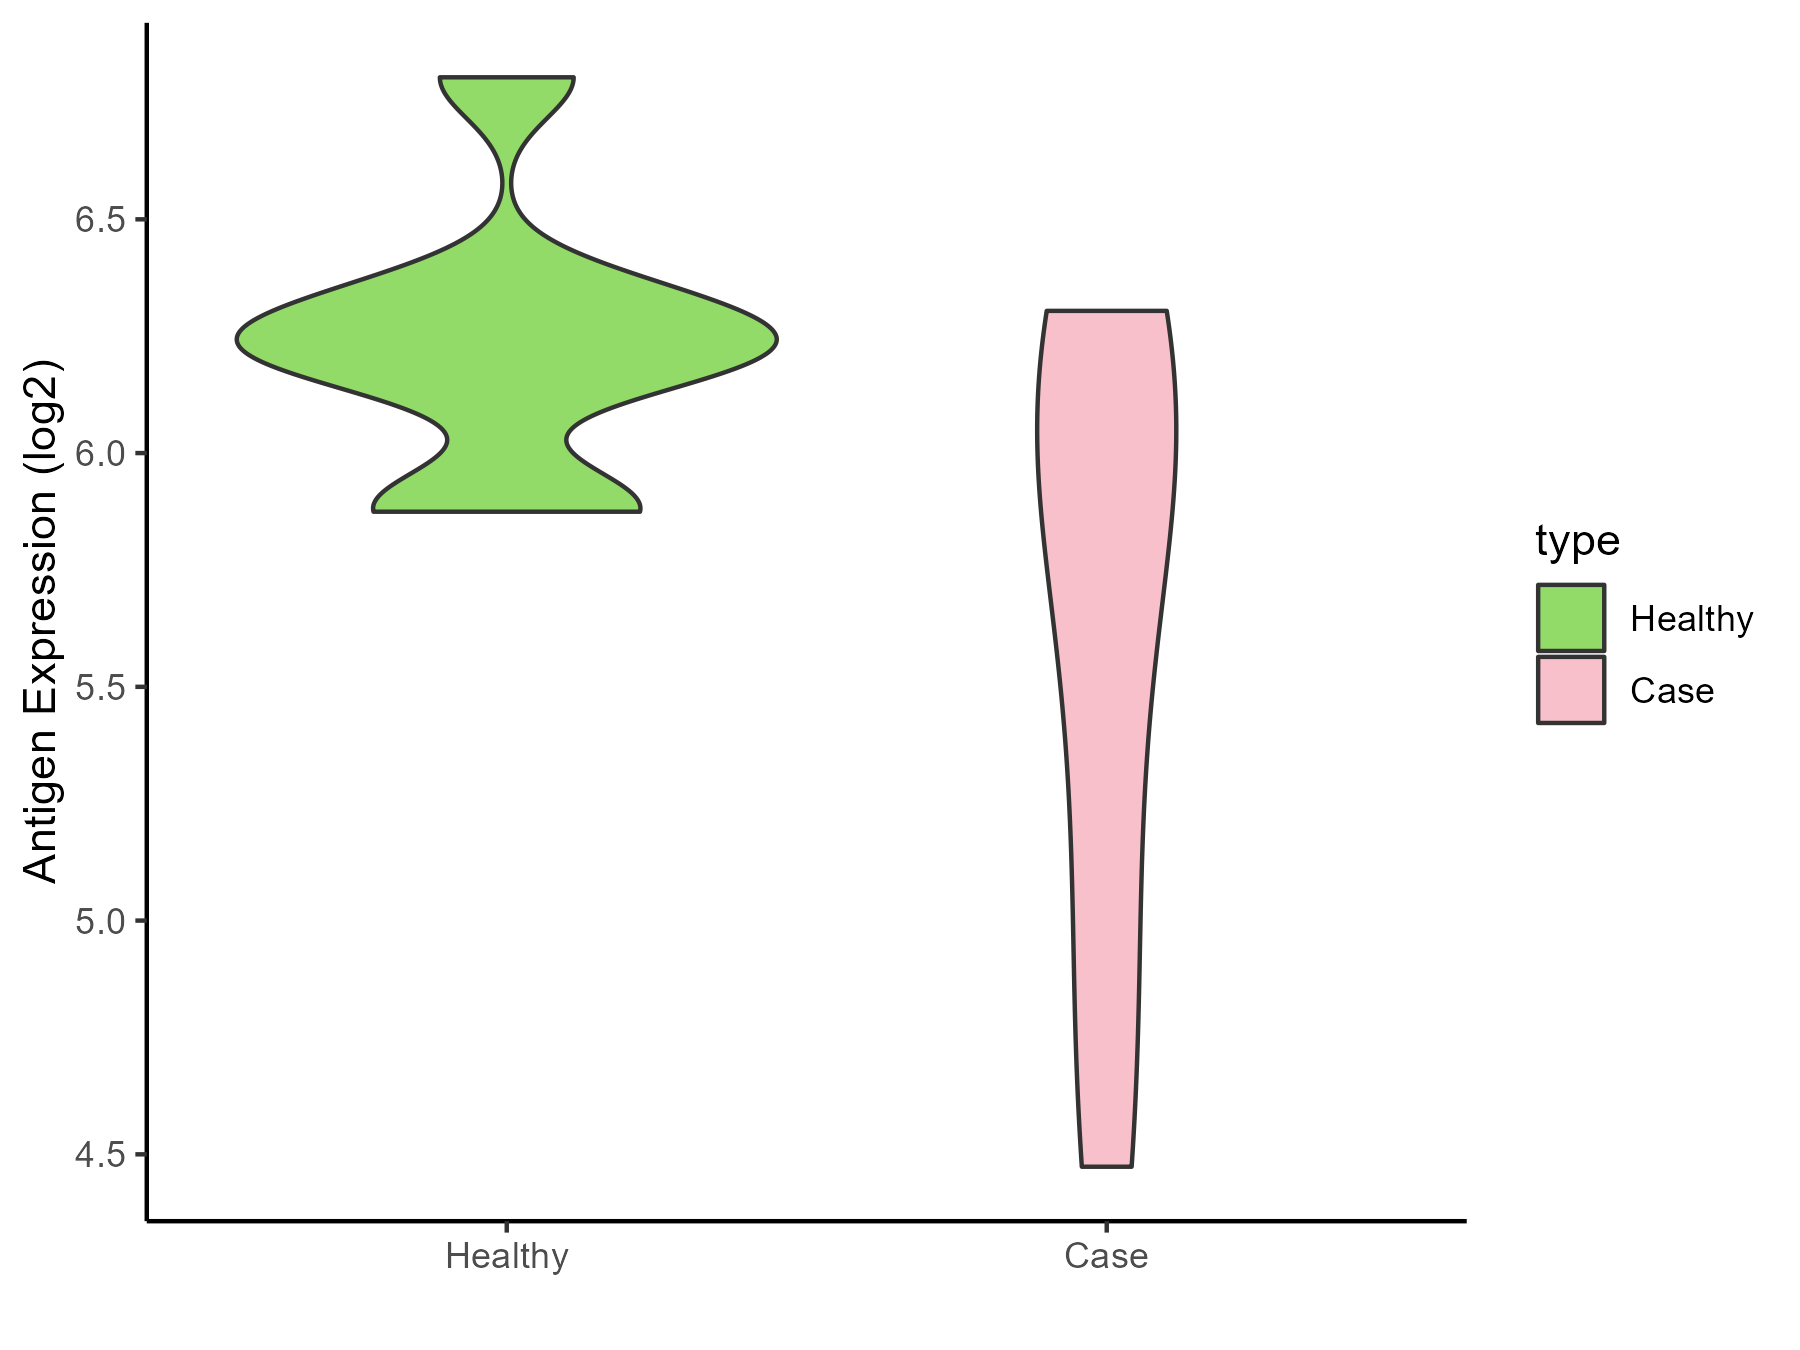
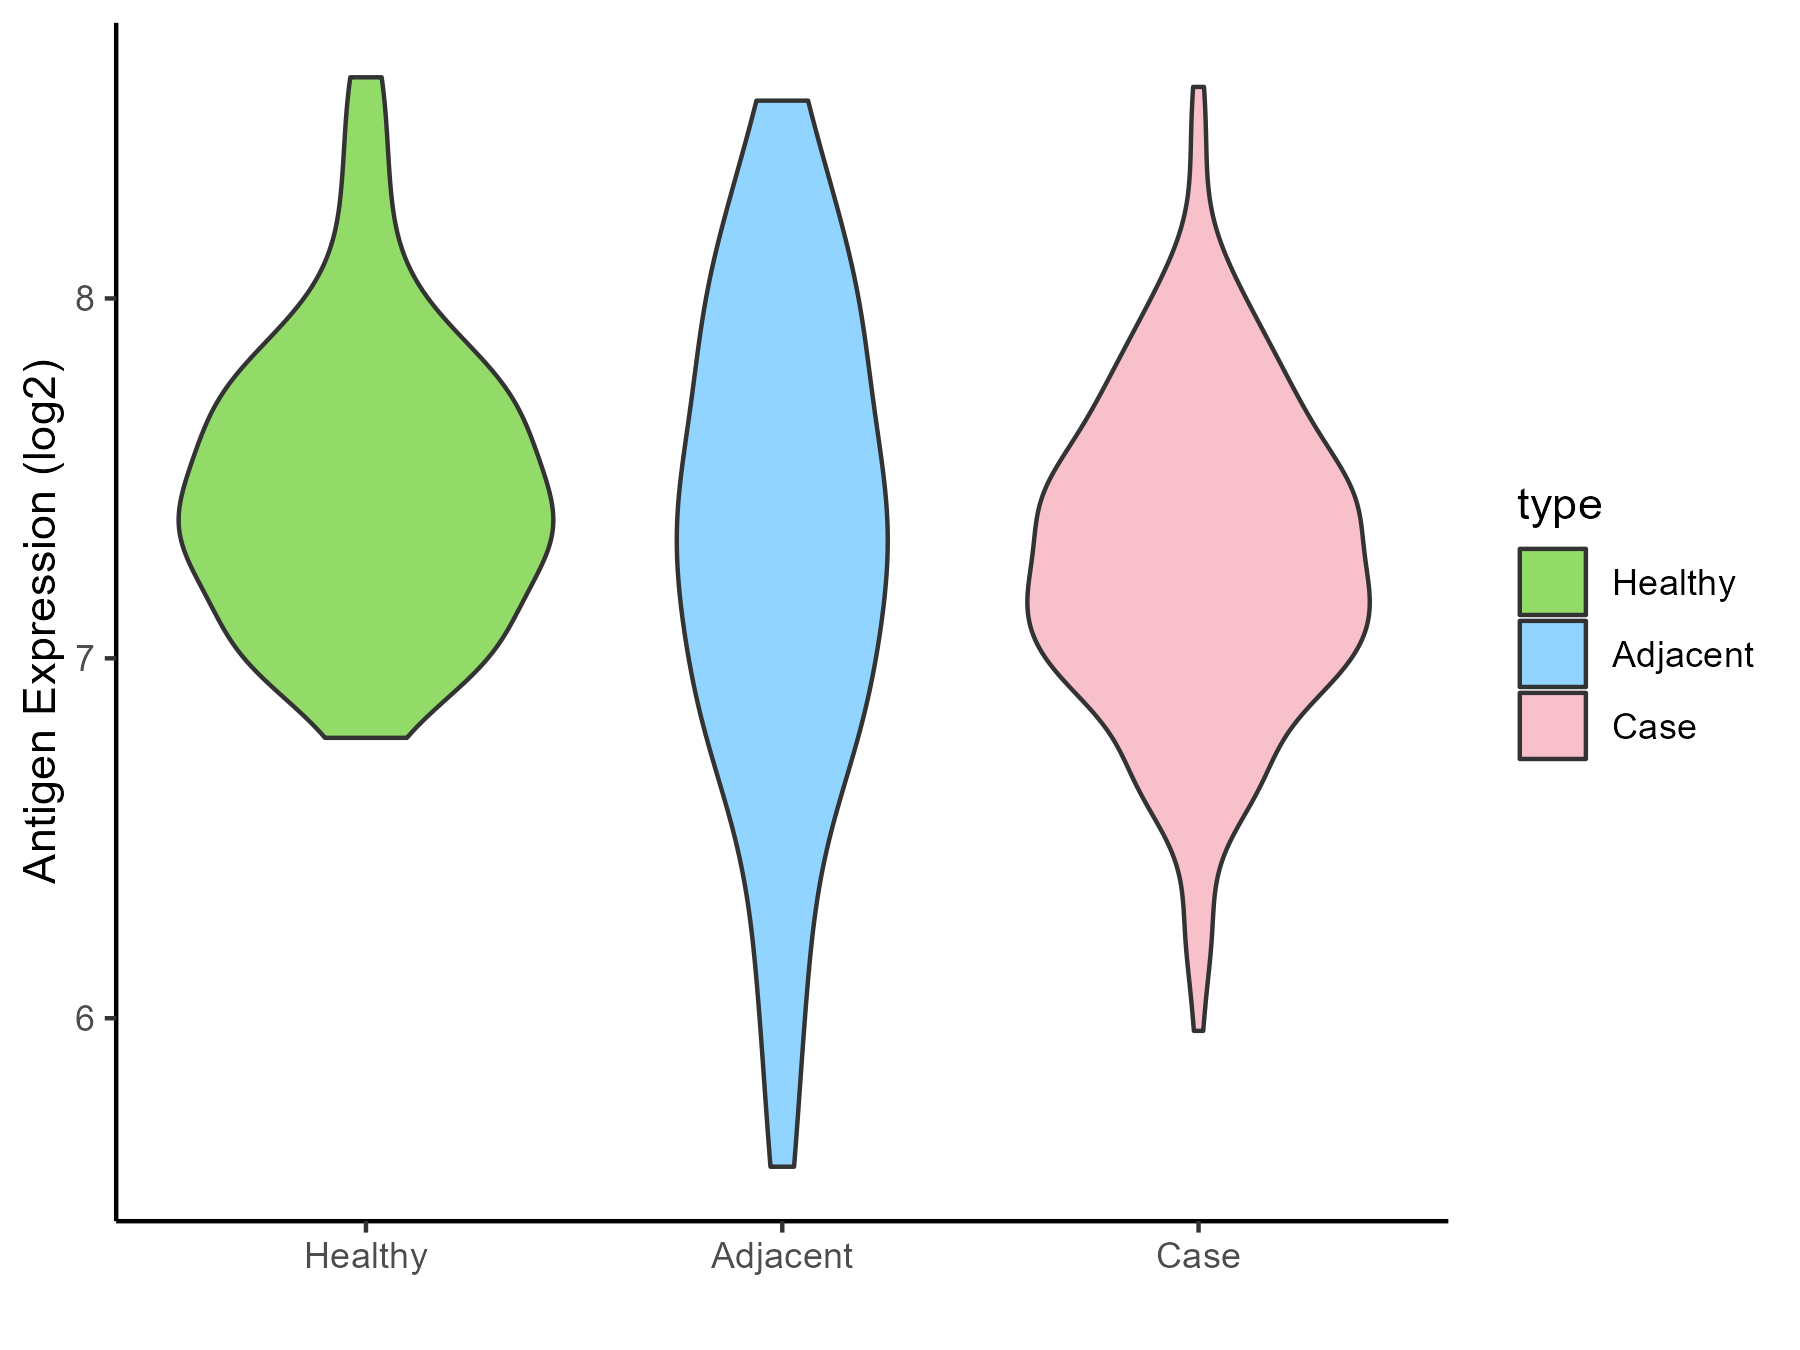
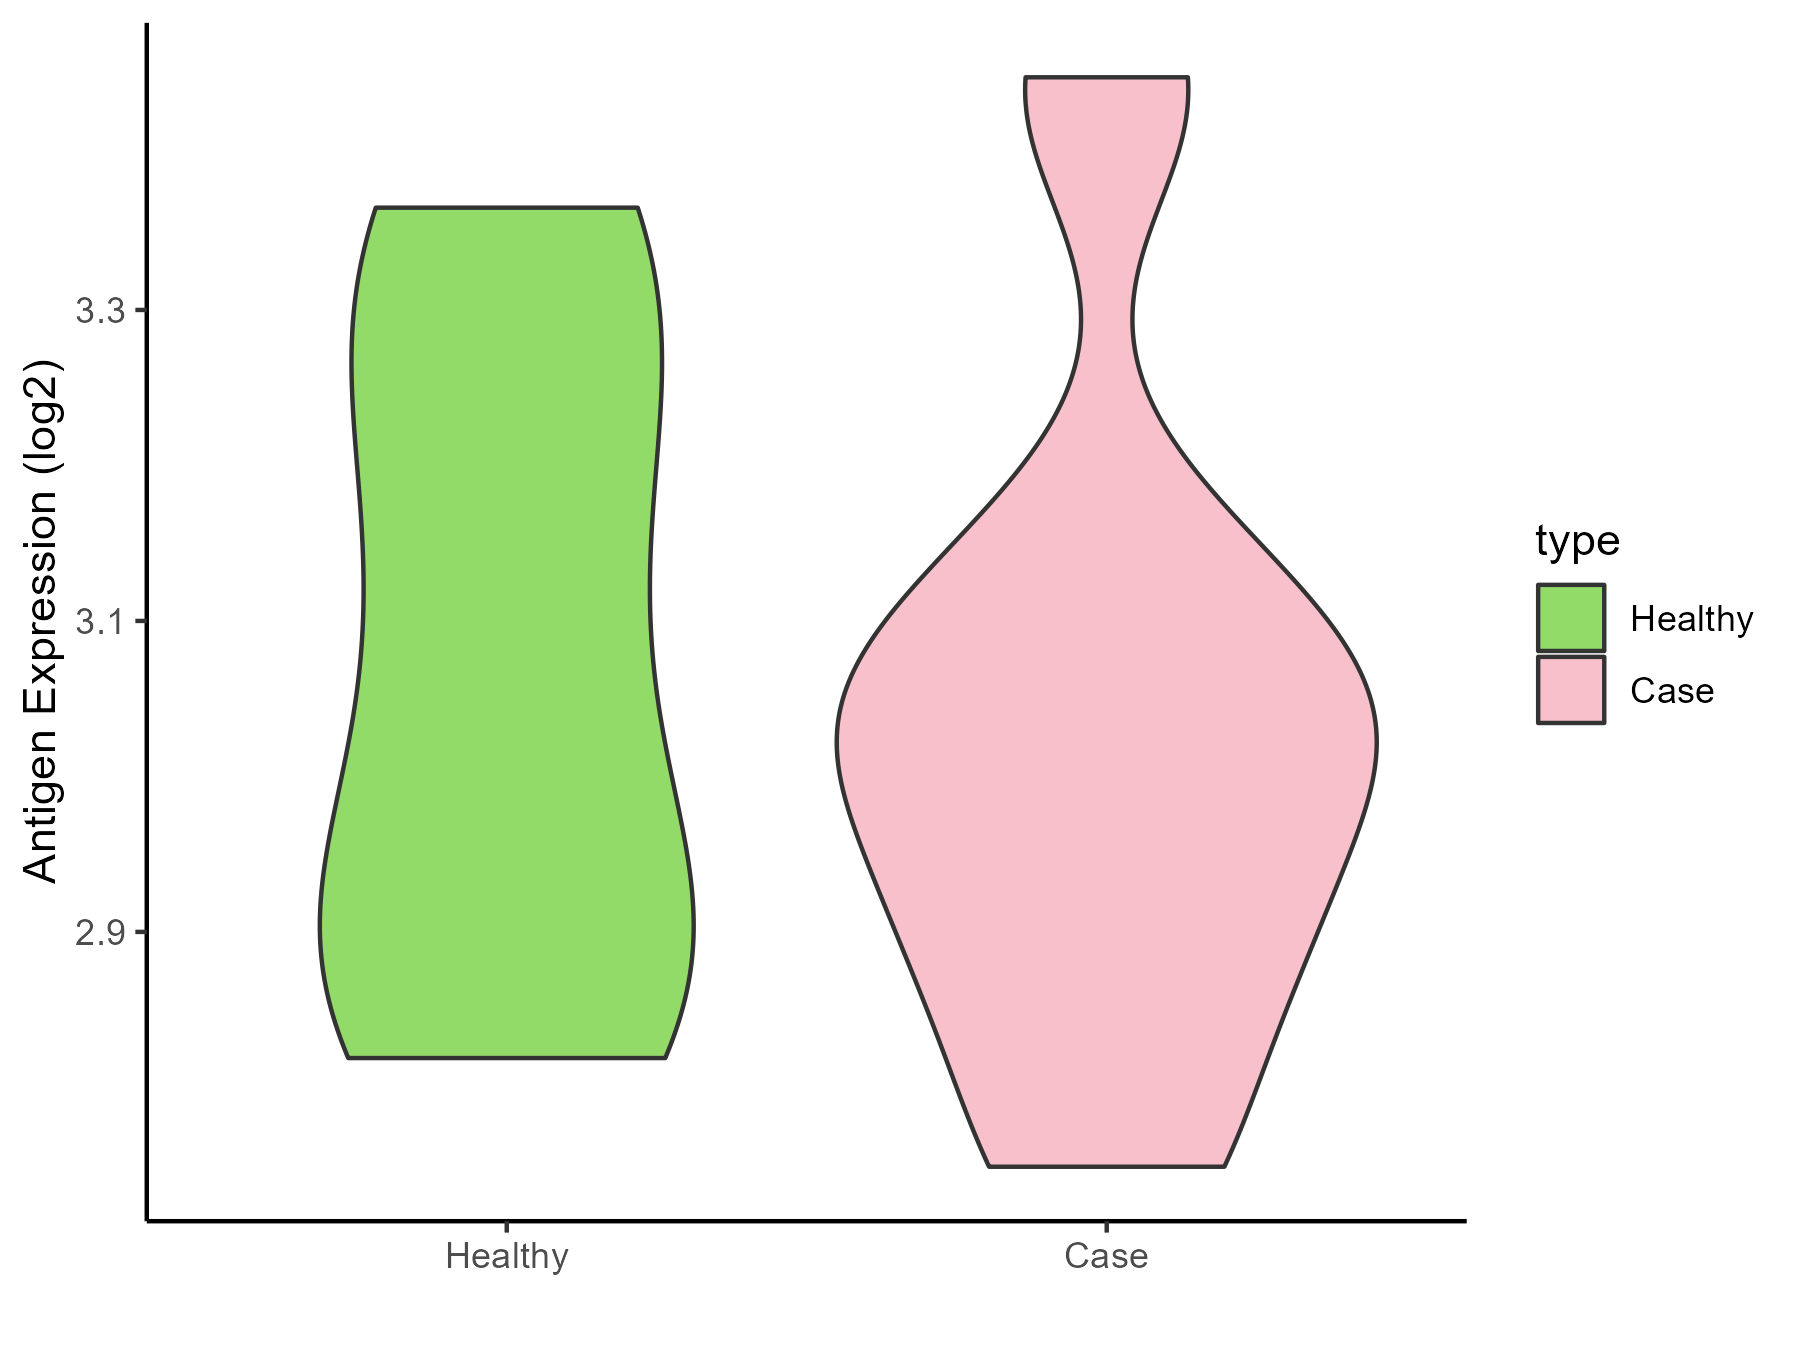
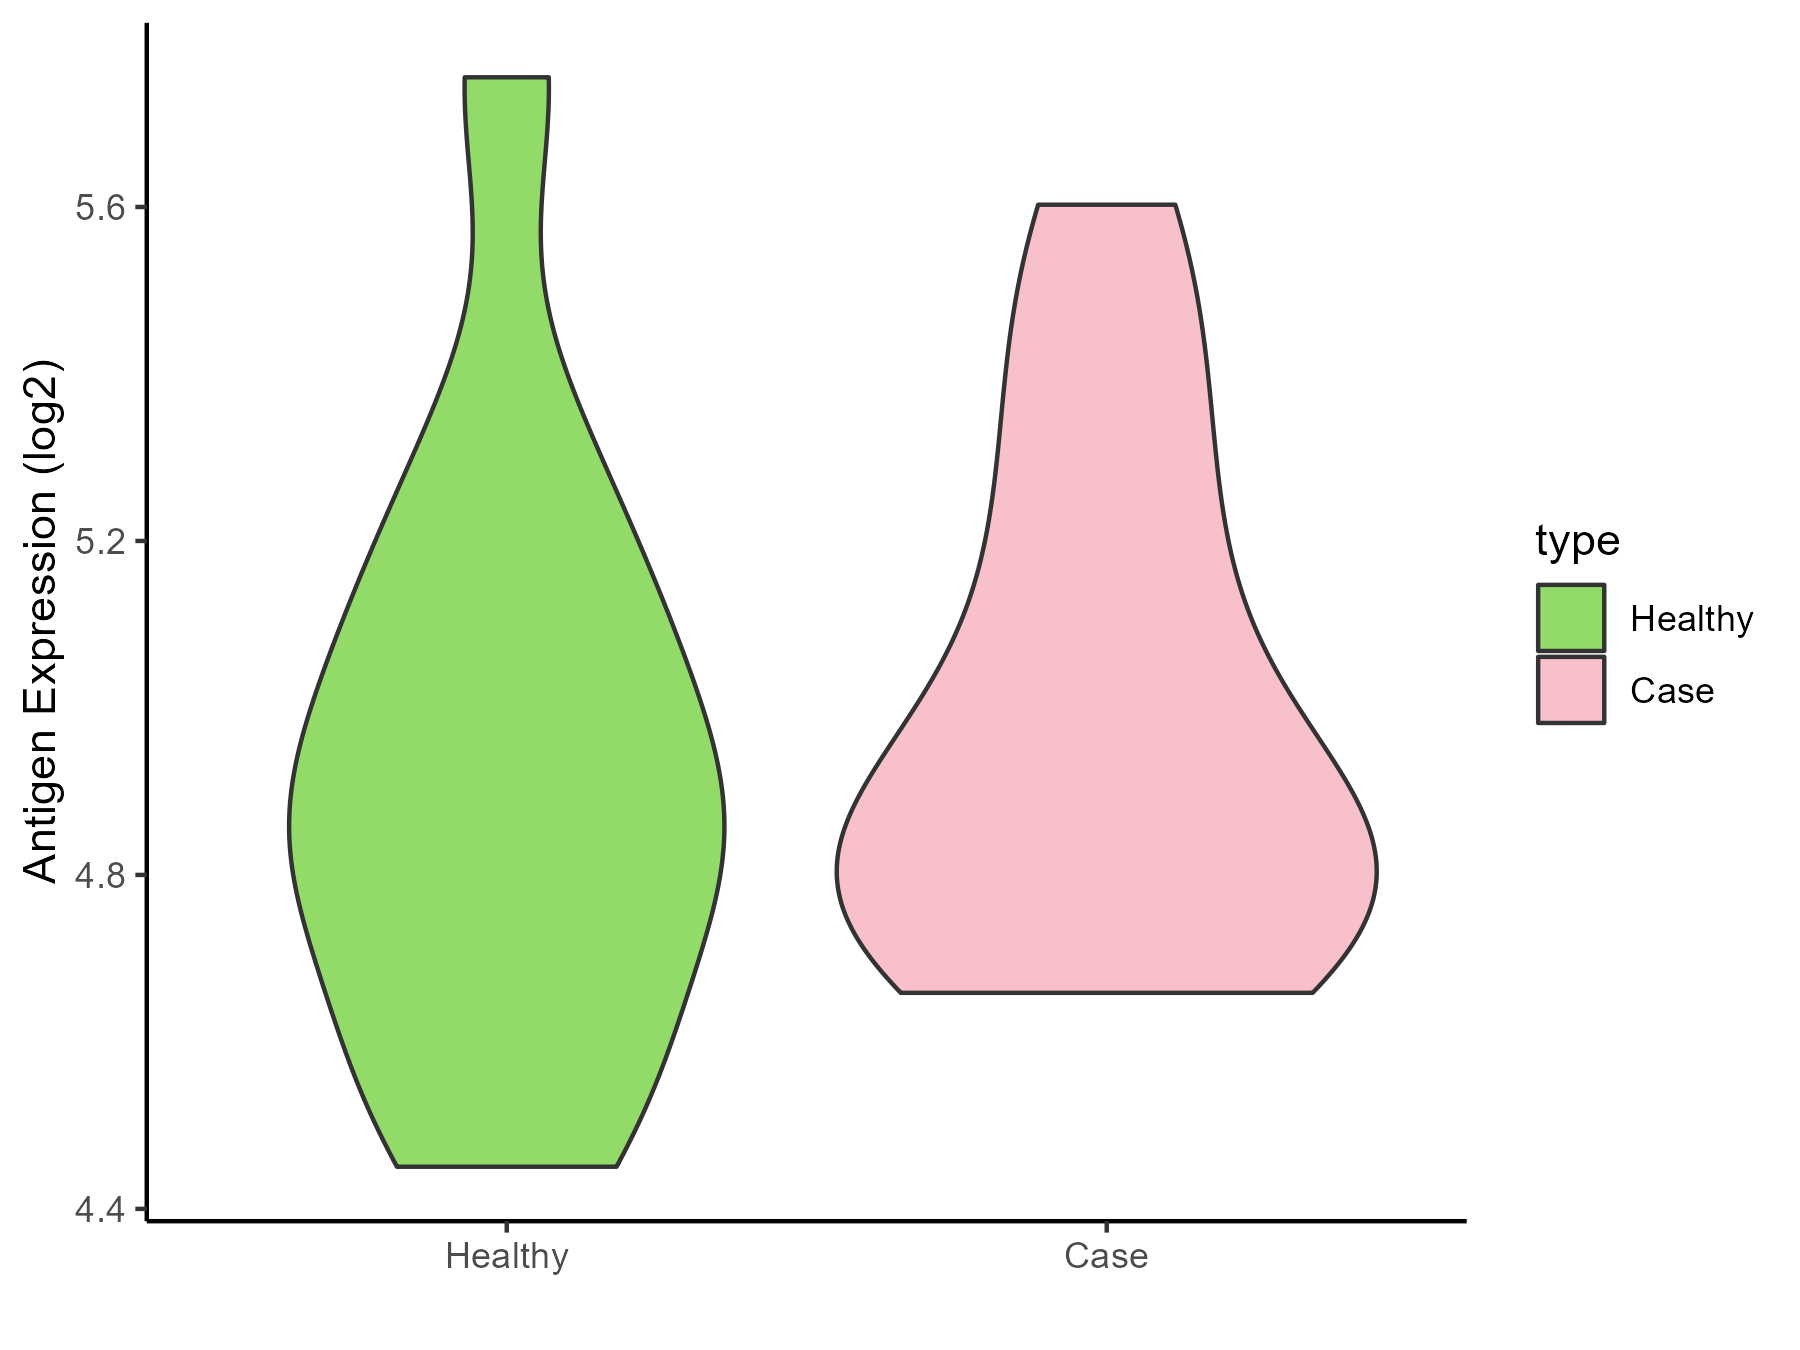
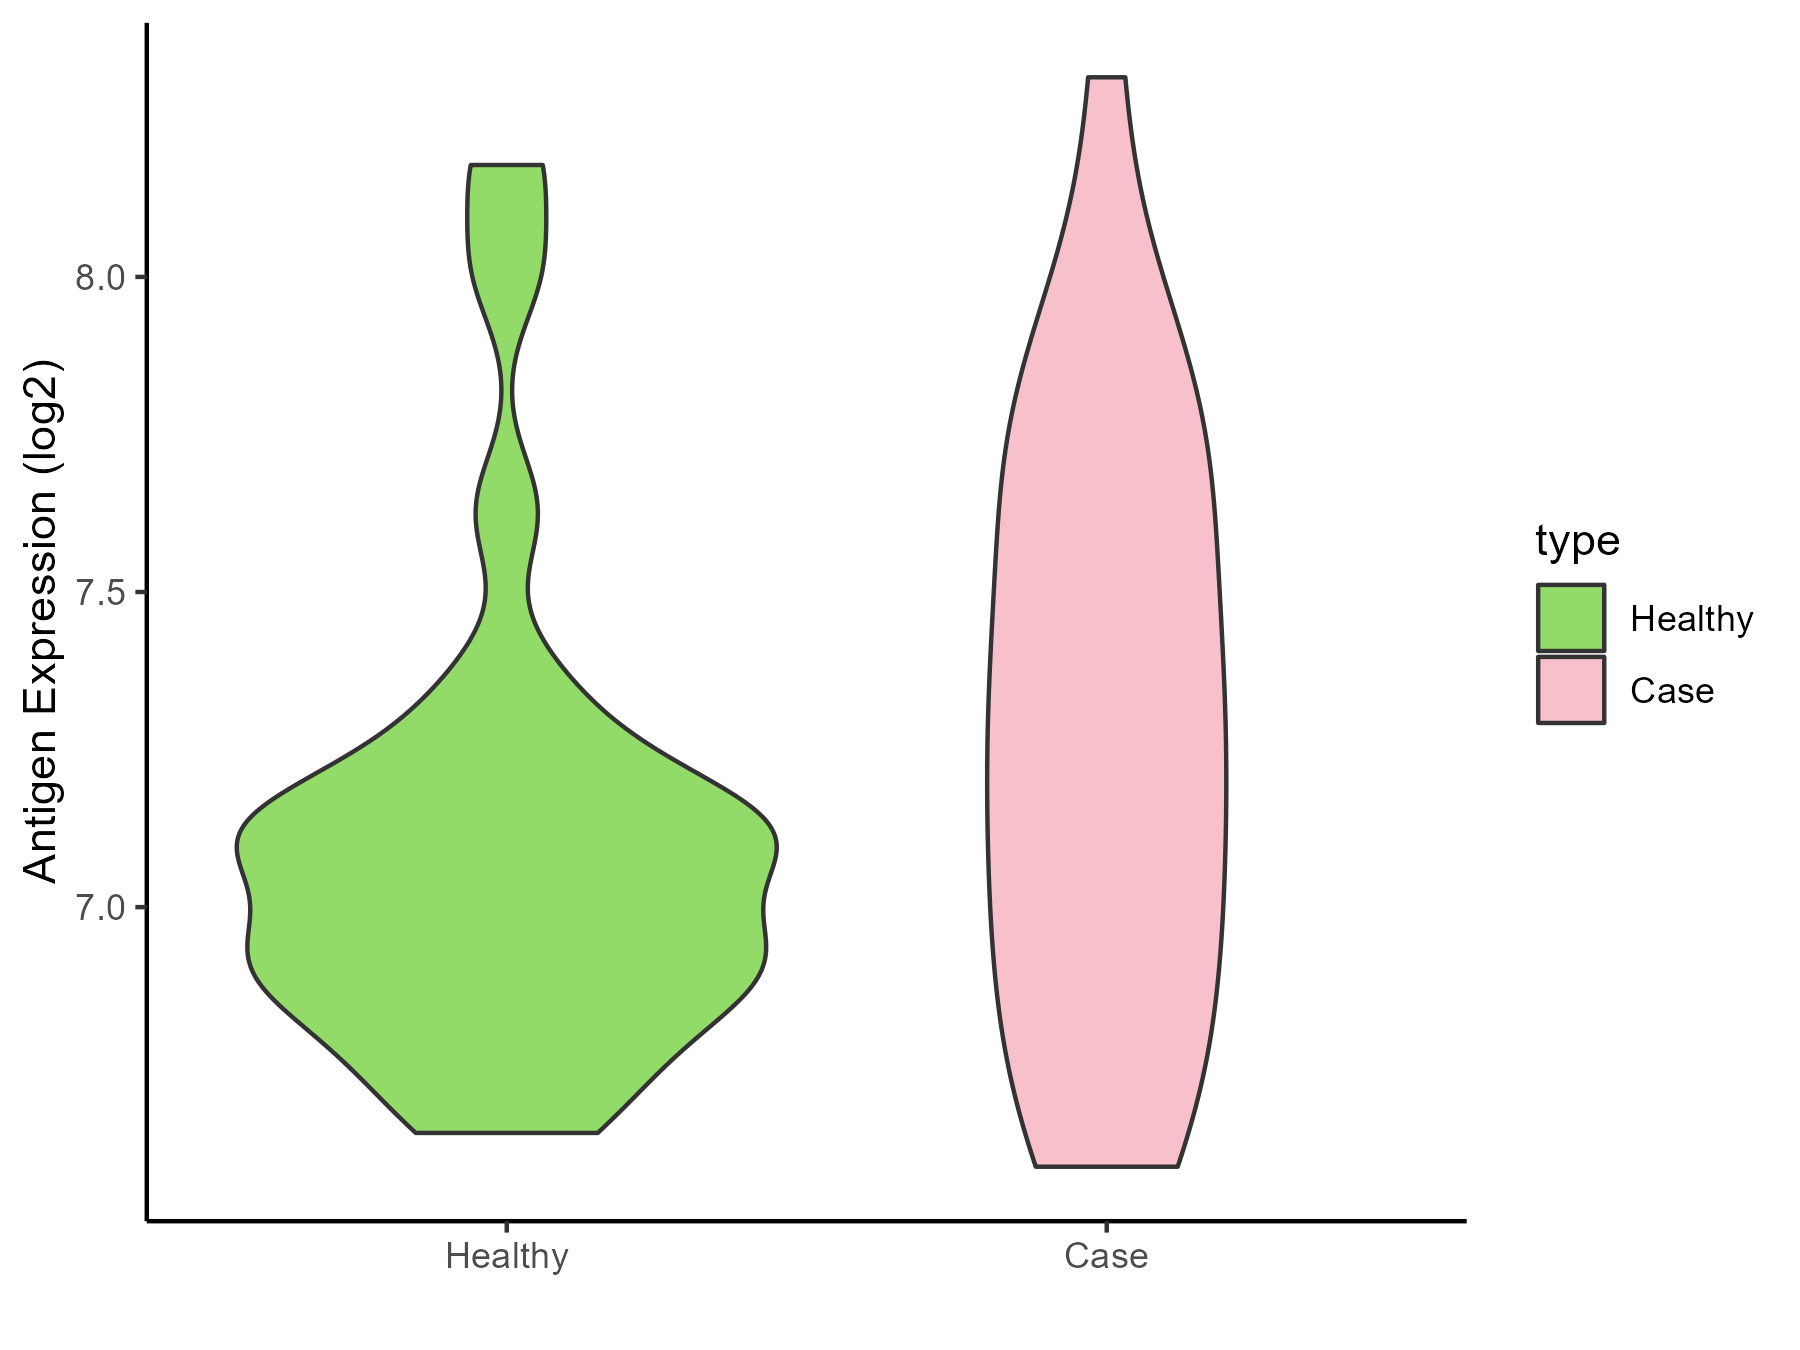
Bacterial infection of gingival |
| The Expression Level of Disease Section Compare with the Healthy Individual Tissue |
p-value: 0.007170411;
Fold-change: 0.10584427;
Z-score: 0.446922734
|
| Disease-specific Antigen Abundances |

|
Click to View the Clearer Original Diagram
|
|
|
ICD Disease Classification 02
Click to Show/Hide the 22 Disease of This Class
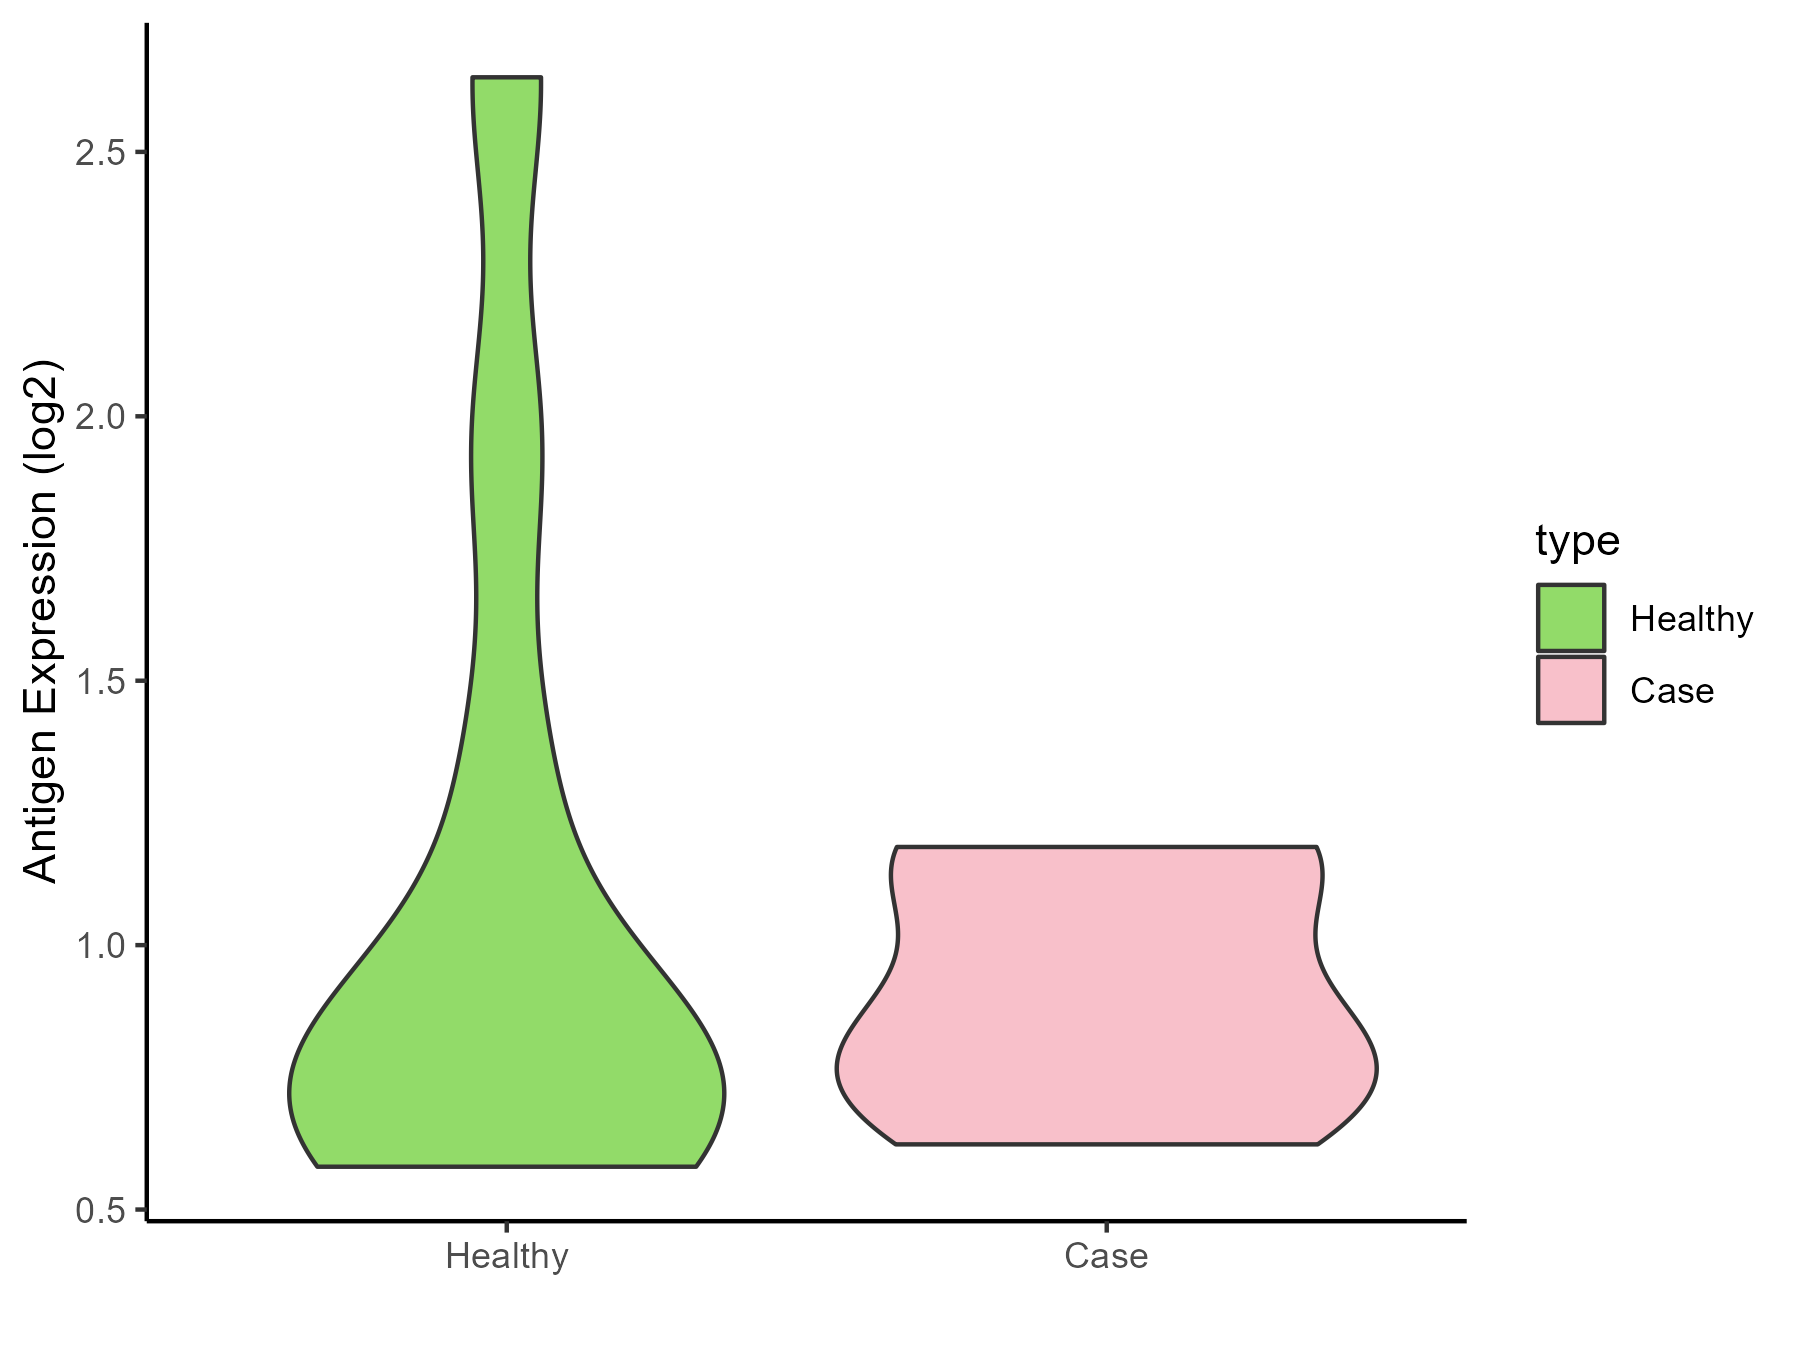
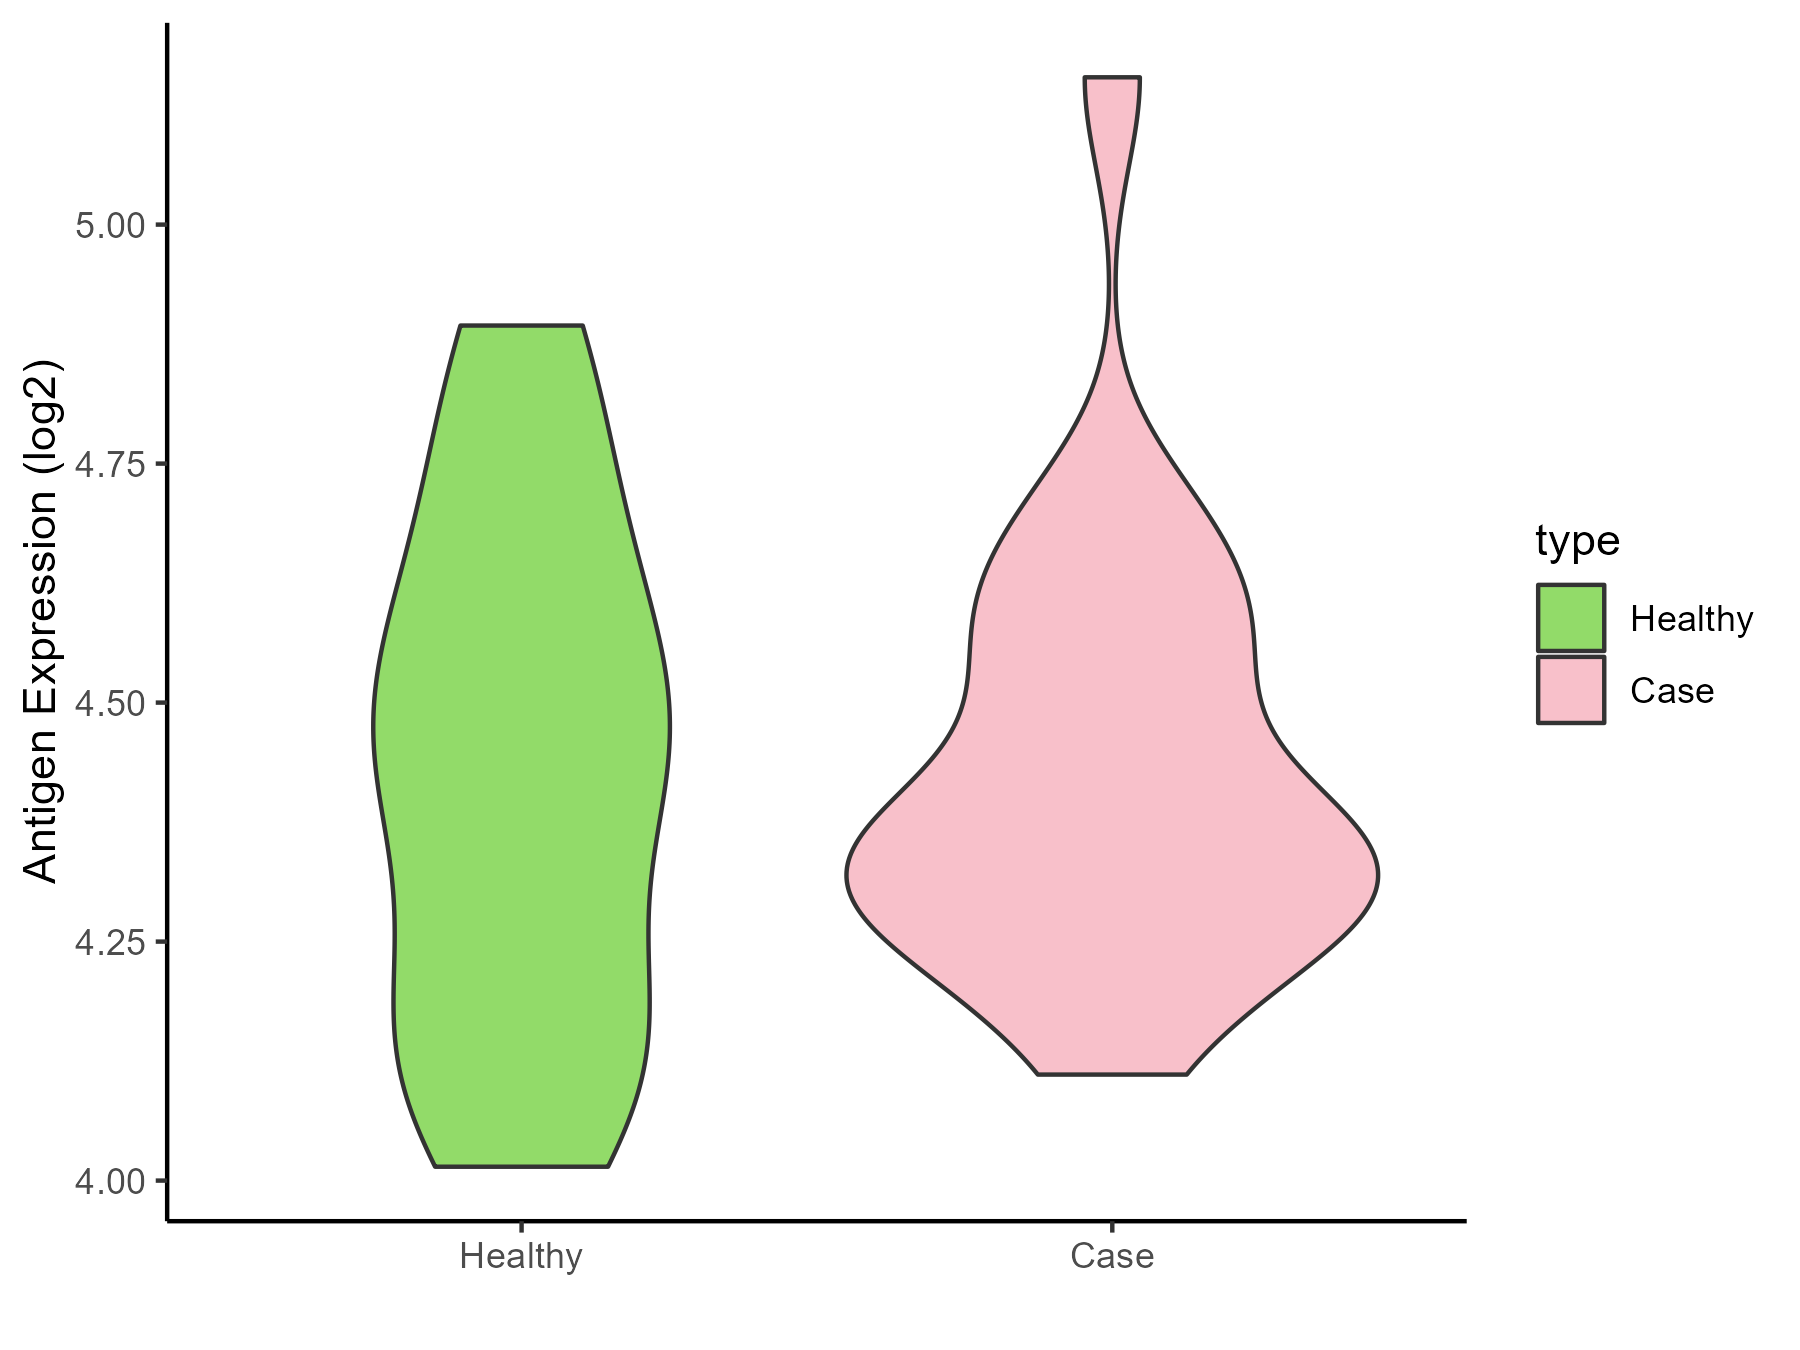
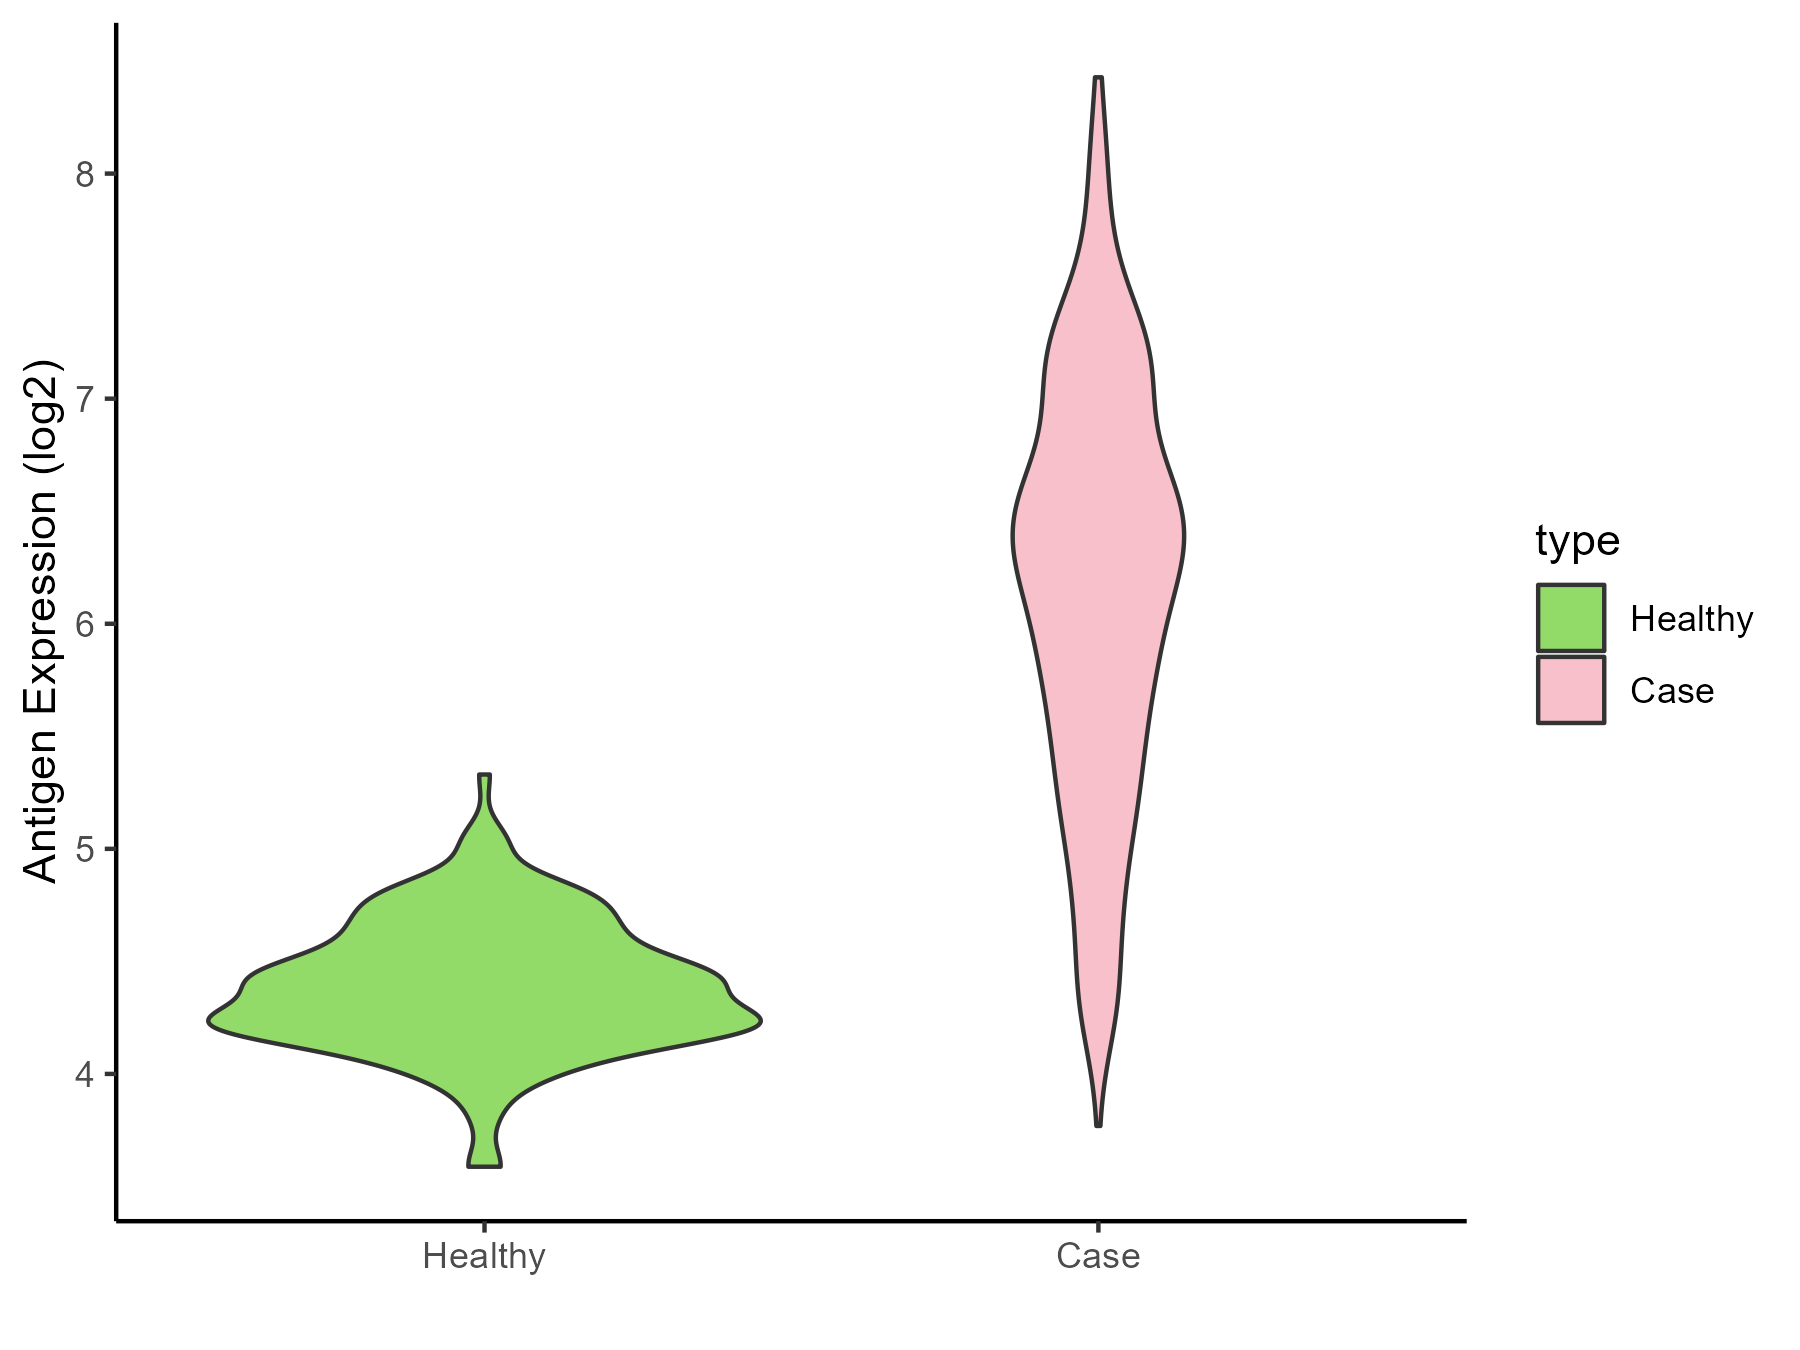
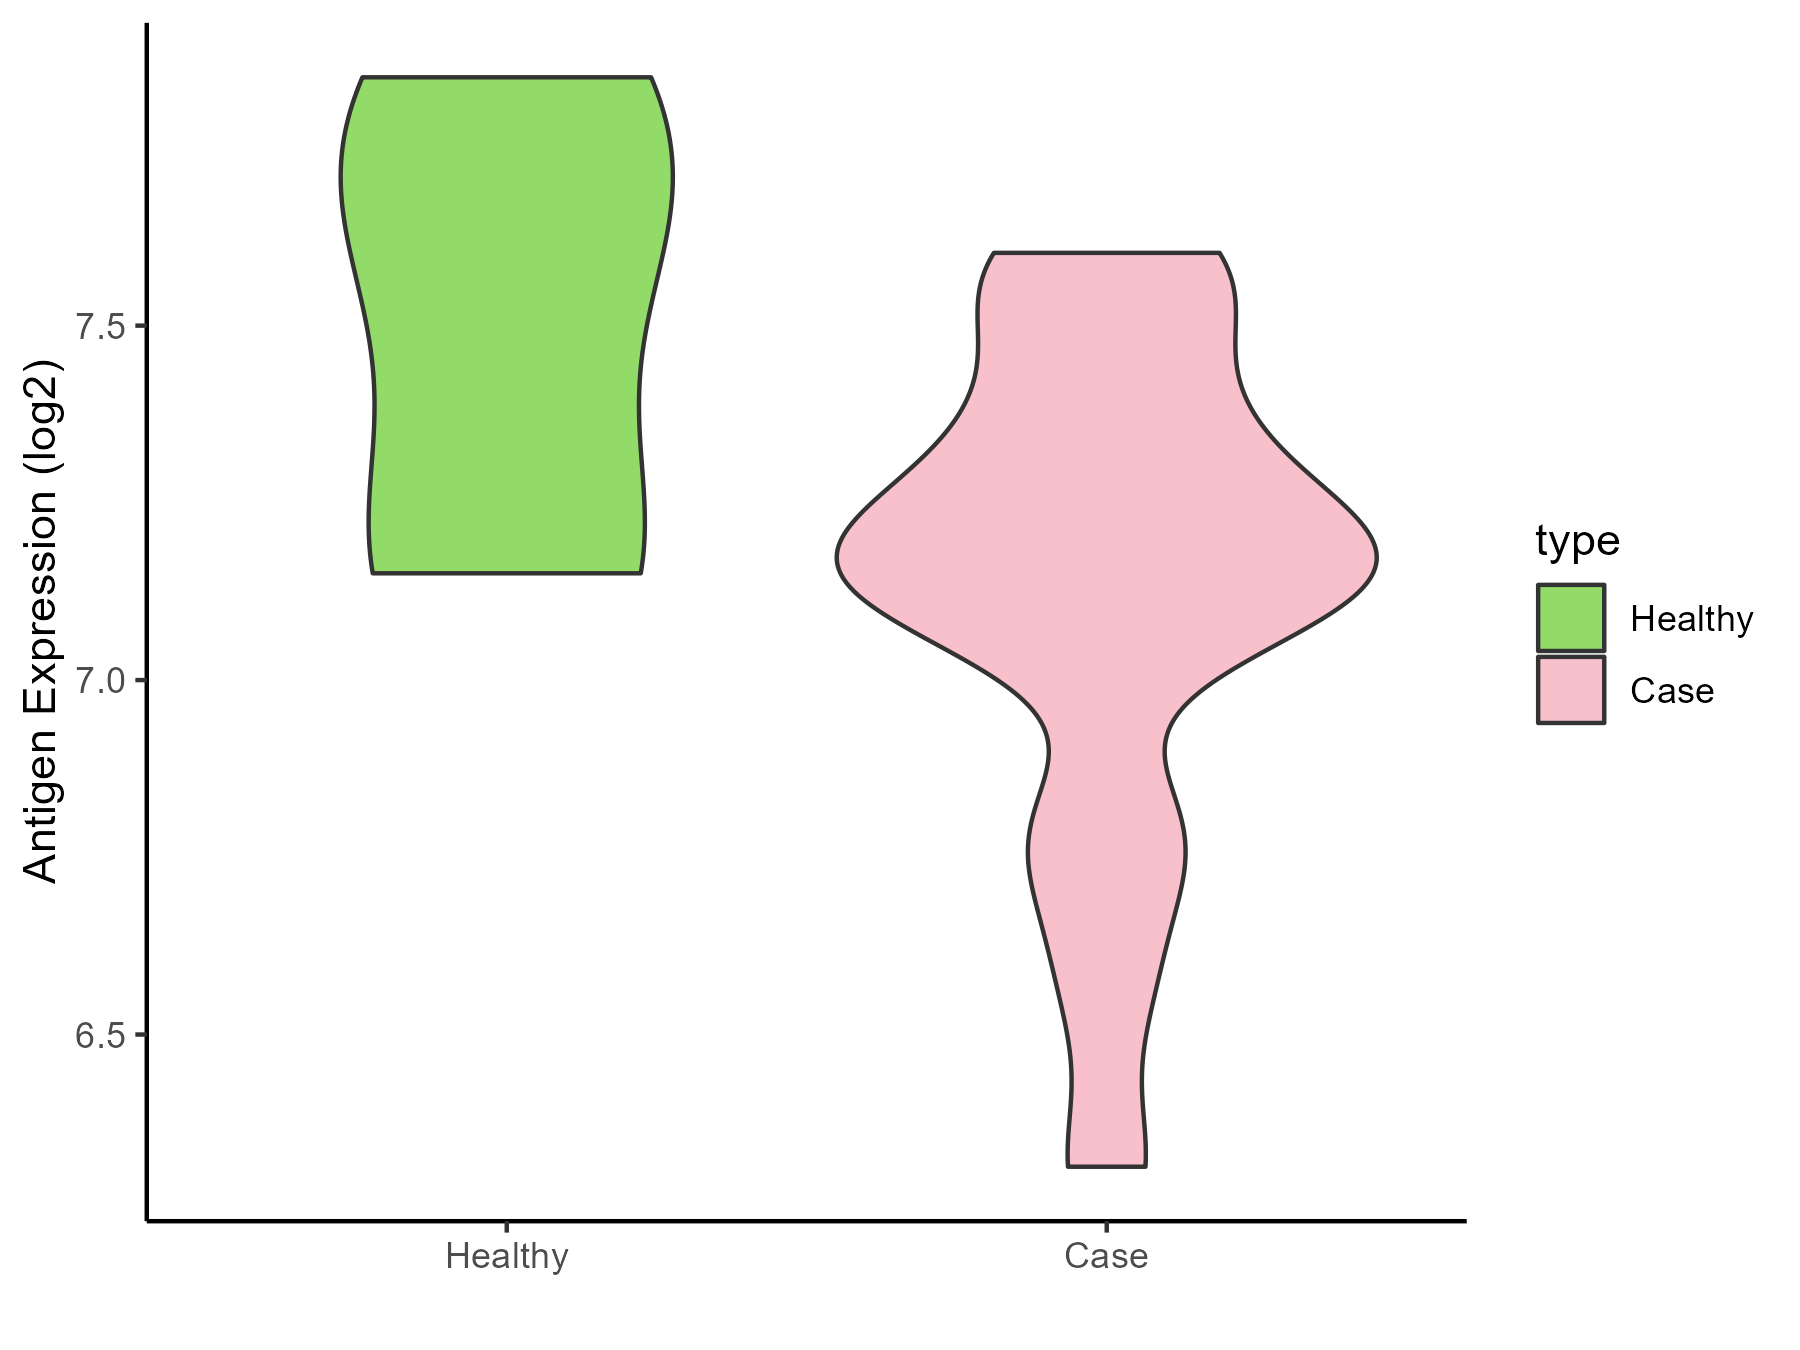
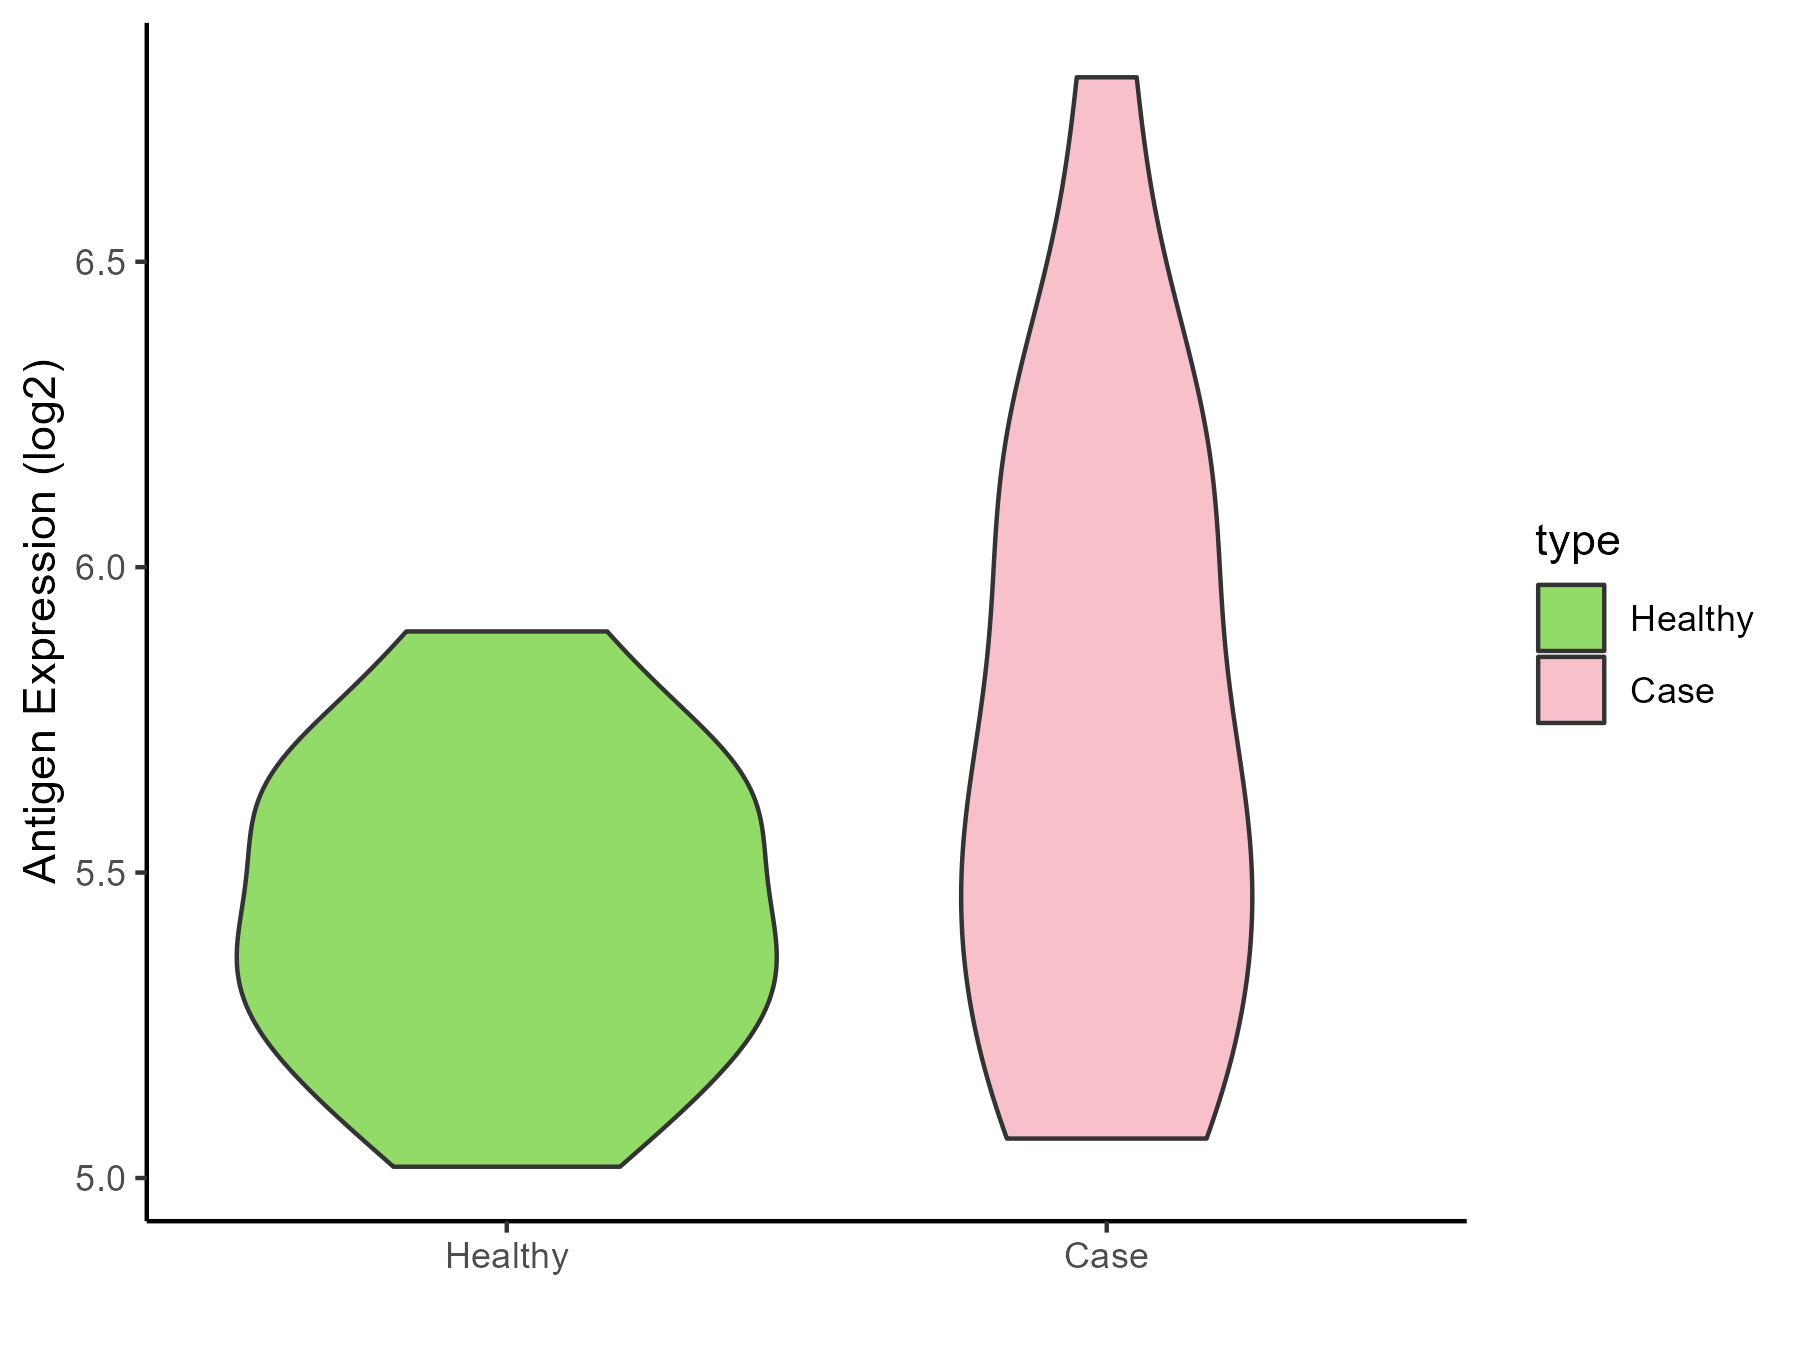
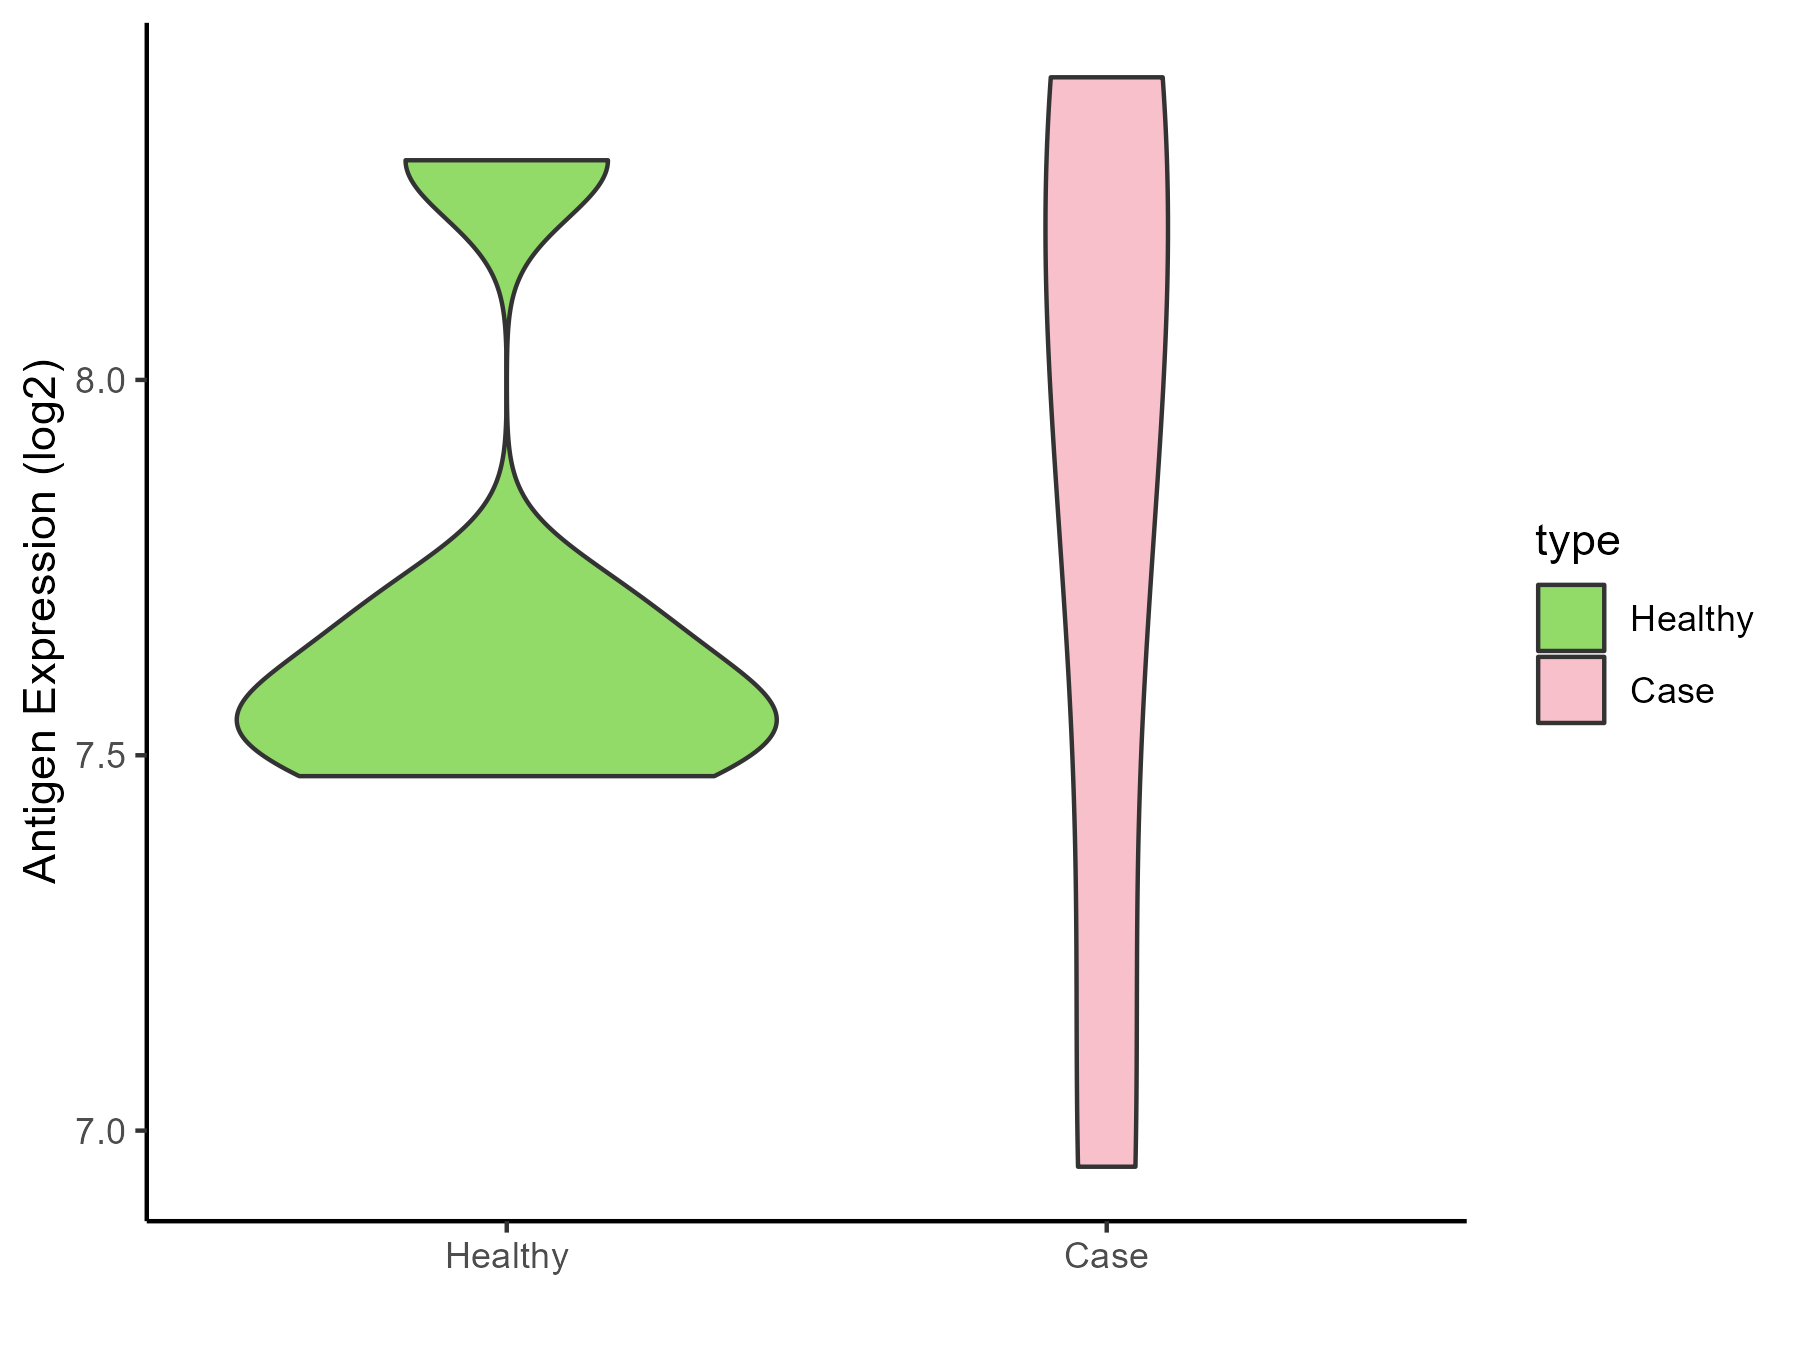
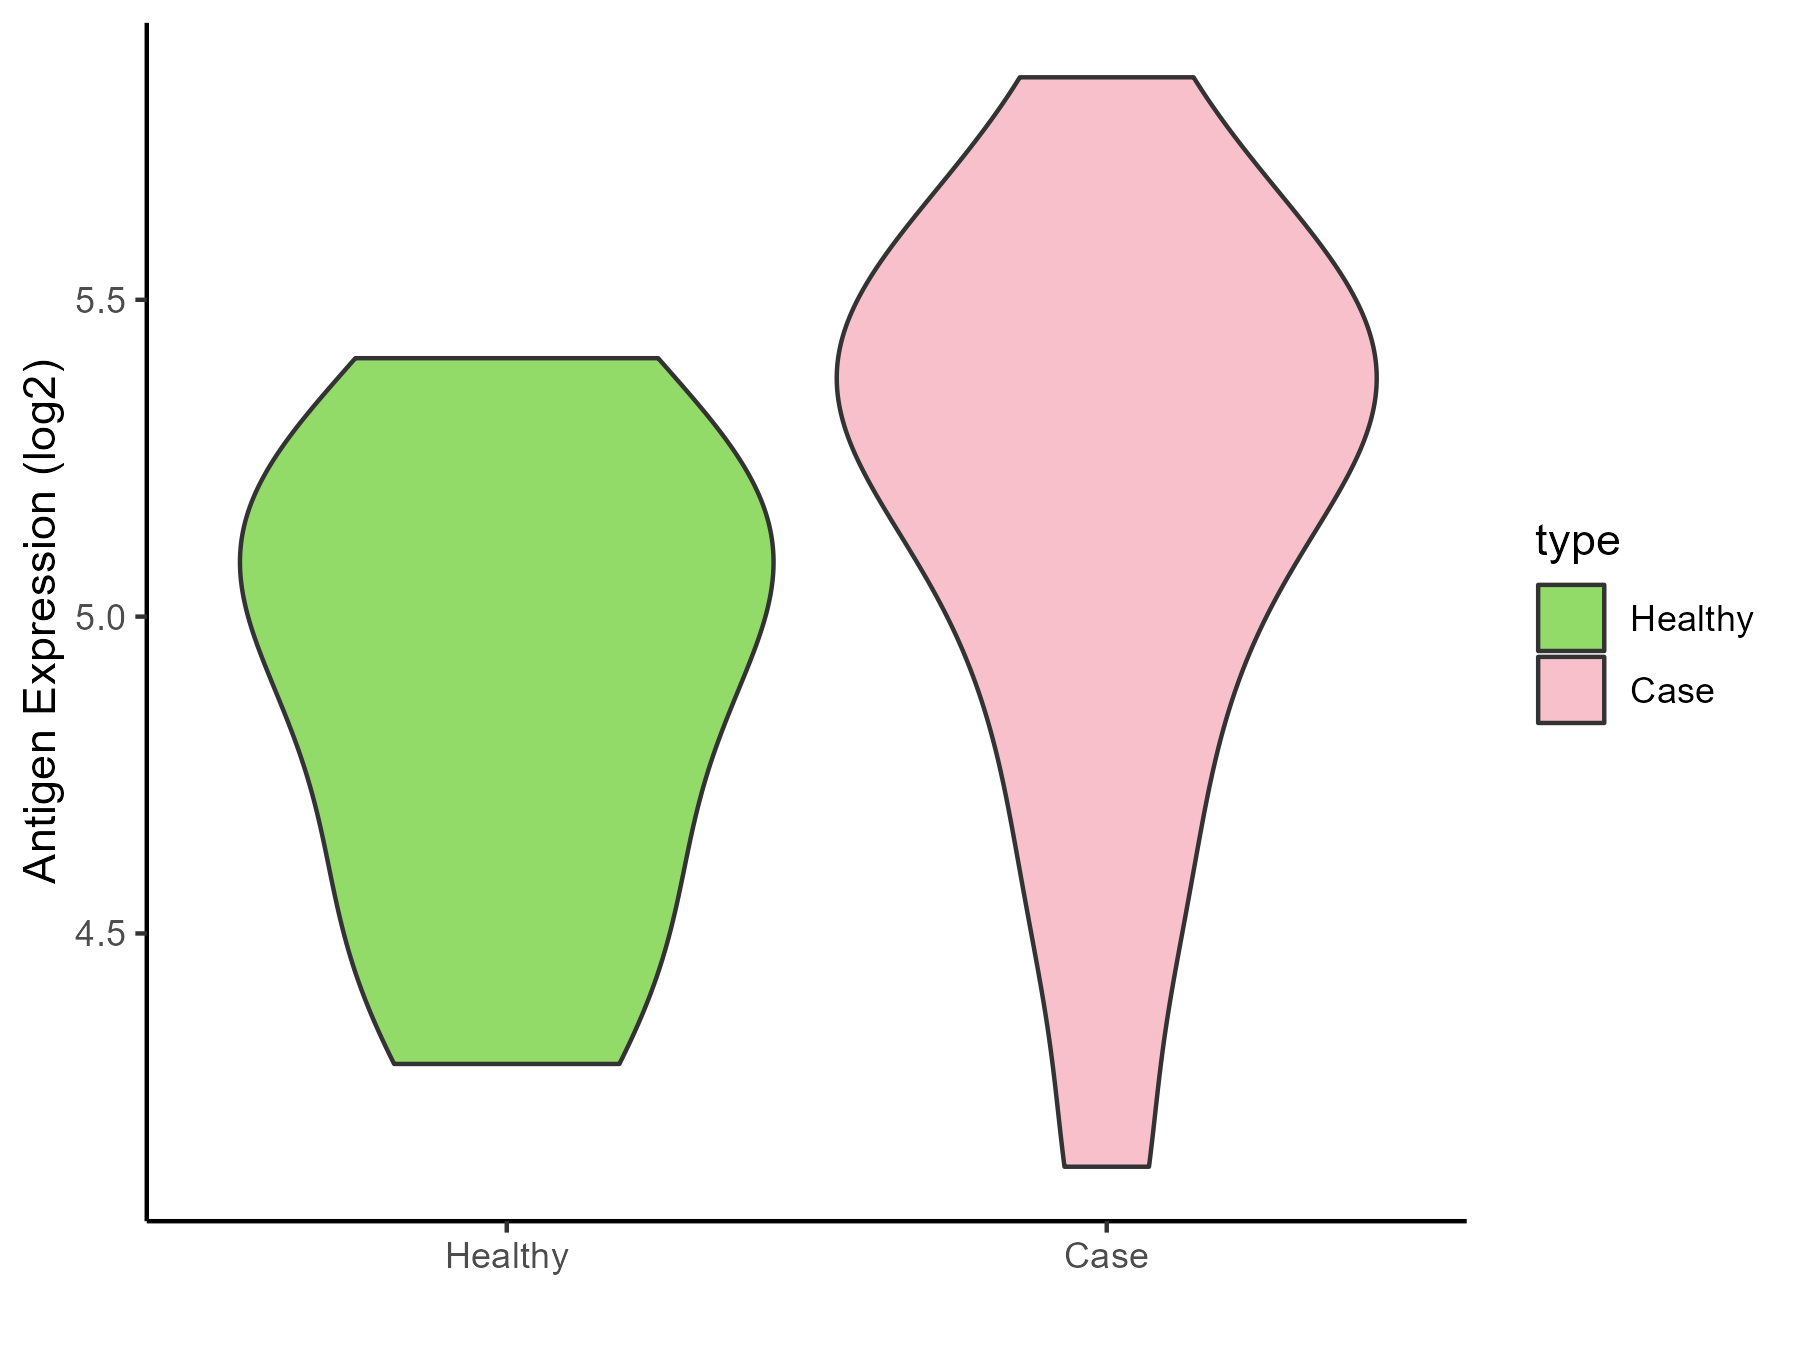
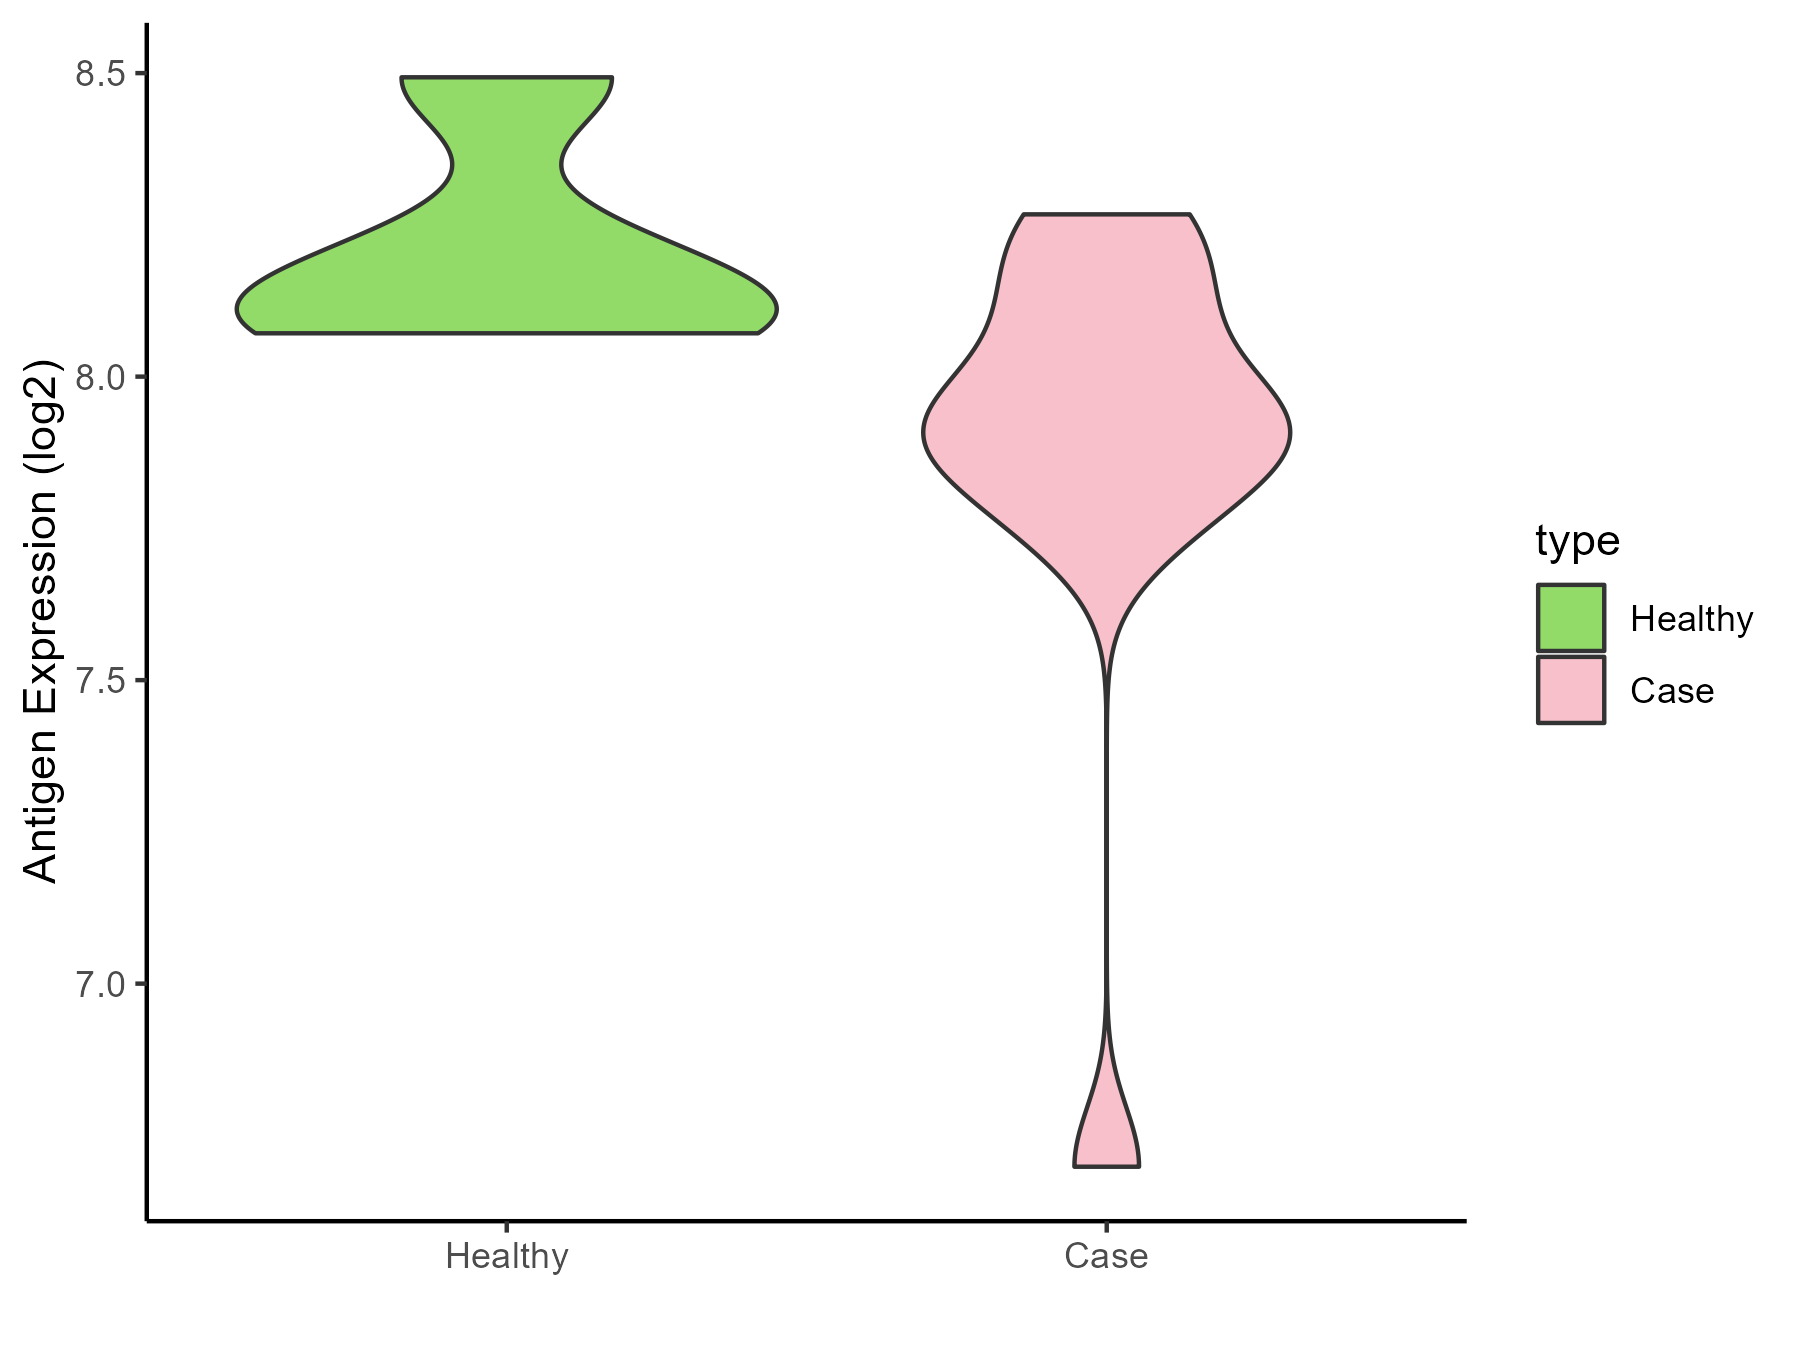
Brain cancer [ICD-11: 2A00]
Click to Show/Hide
| Differential expression pattern of antigen in diseases |
| The Studied Tissue |
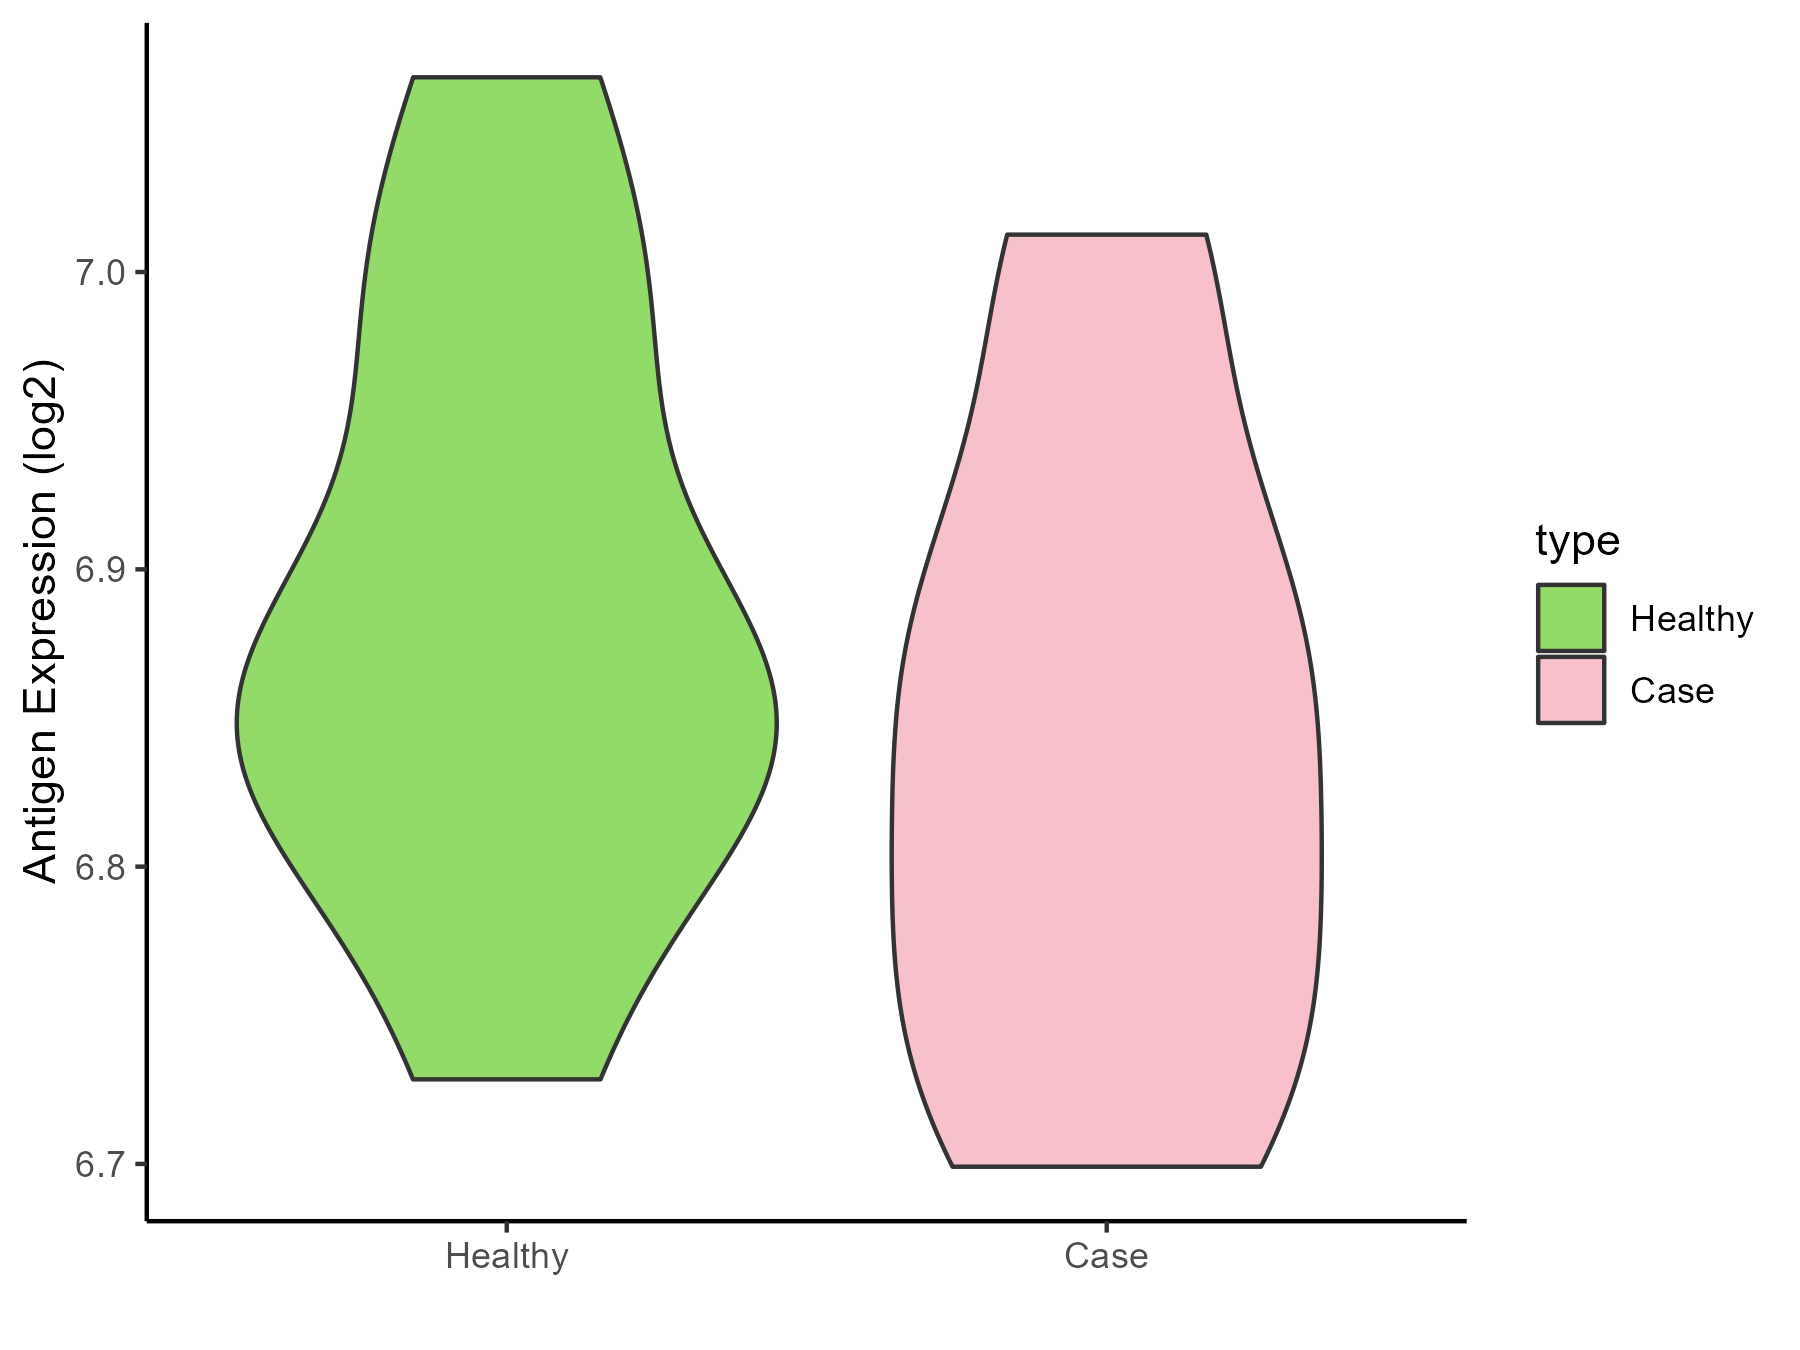
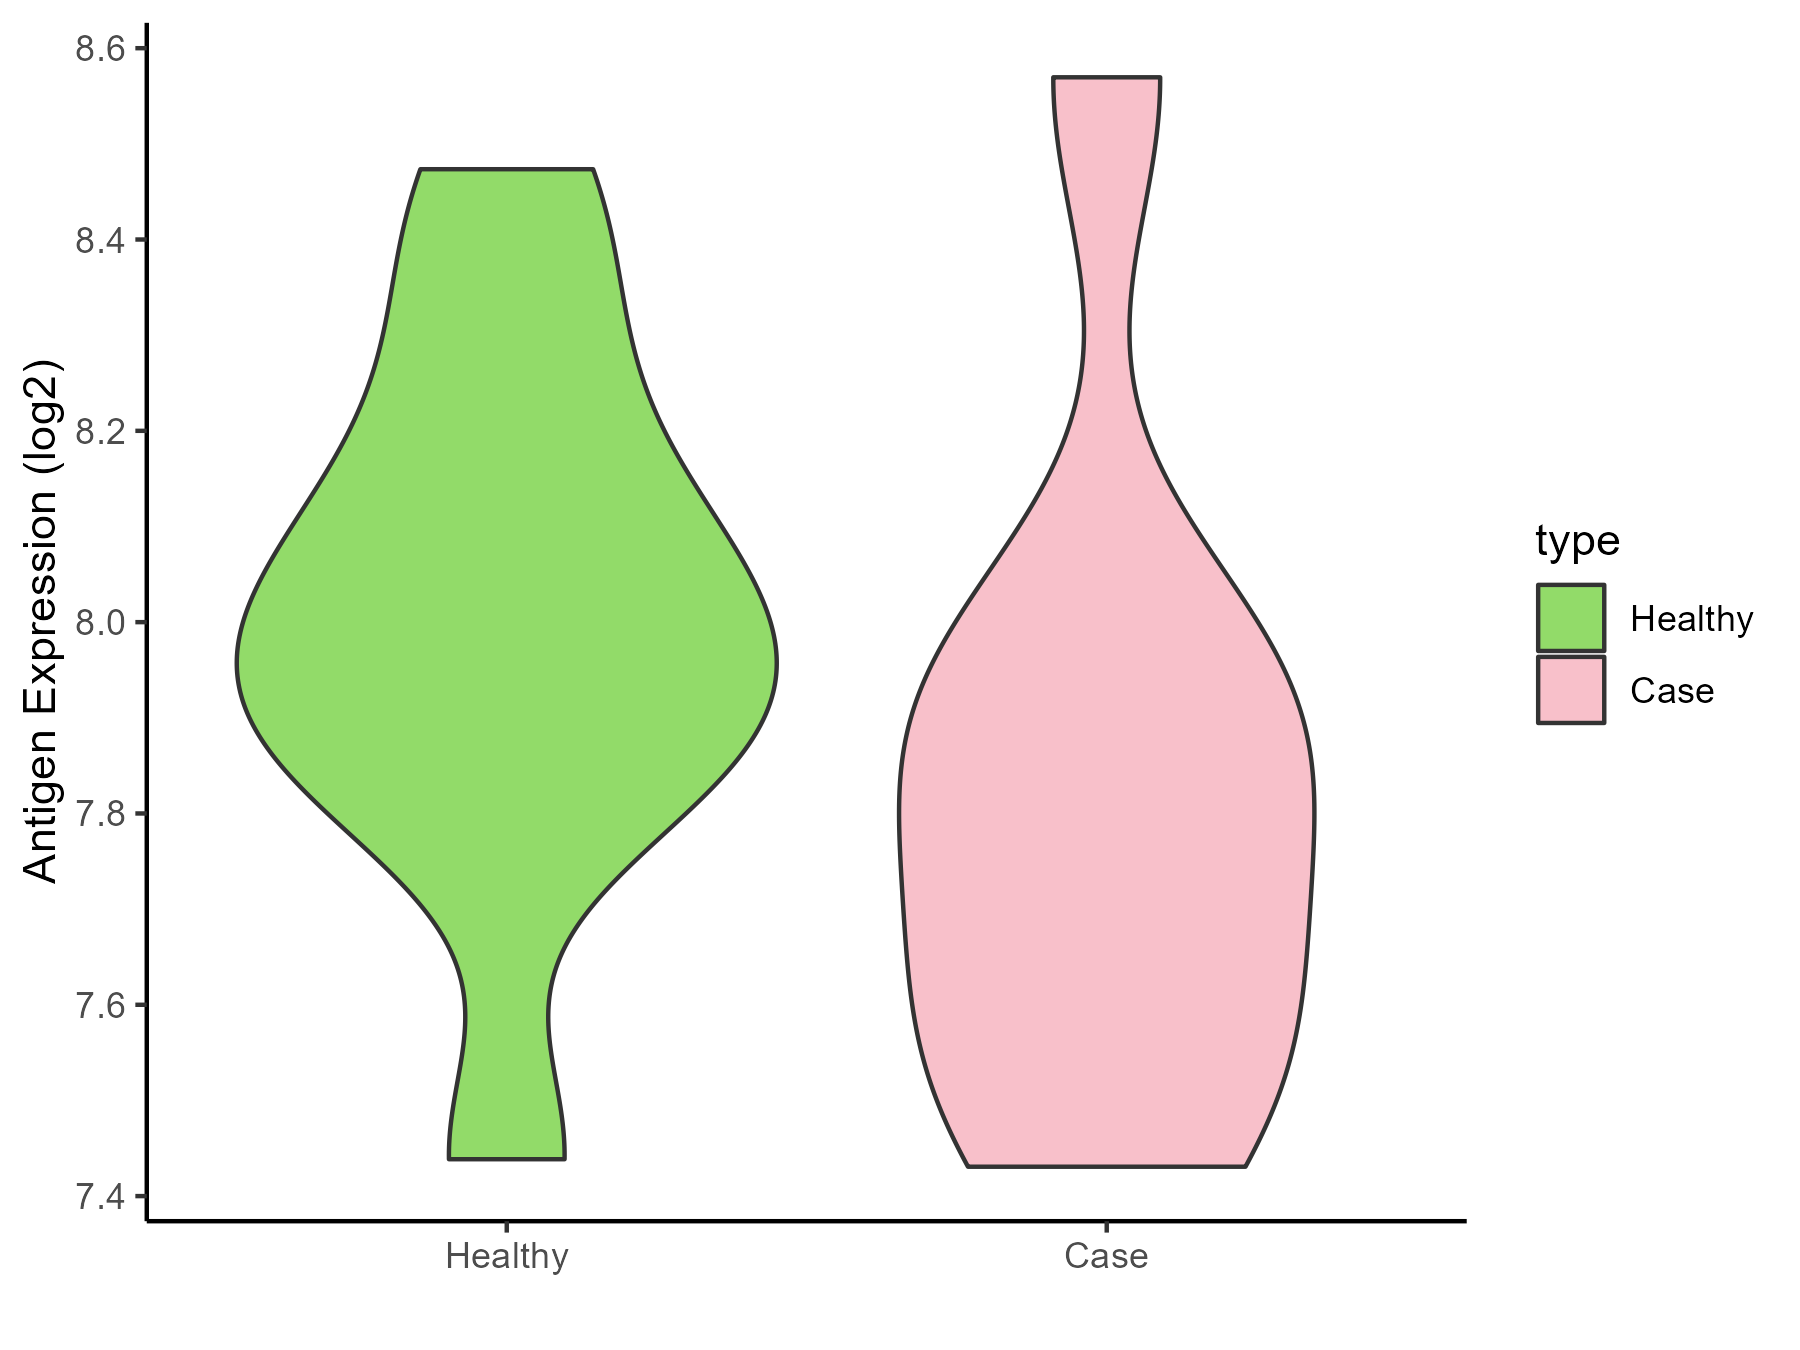
Brainstem |
| The Specific Disease |
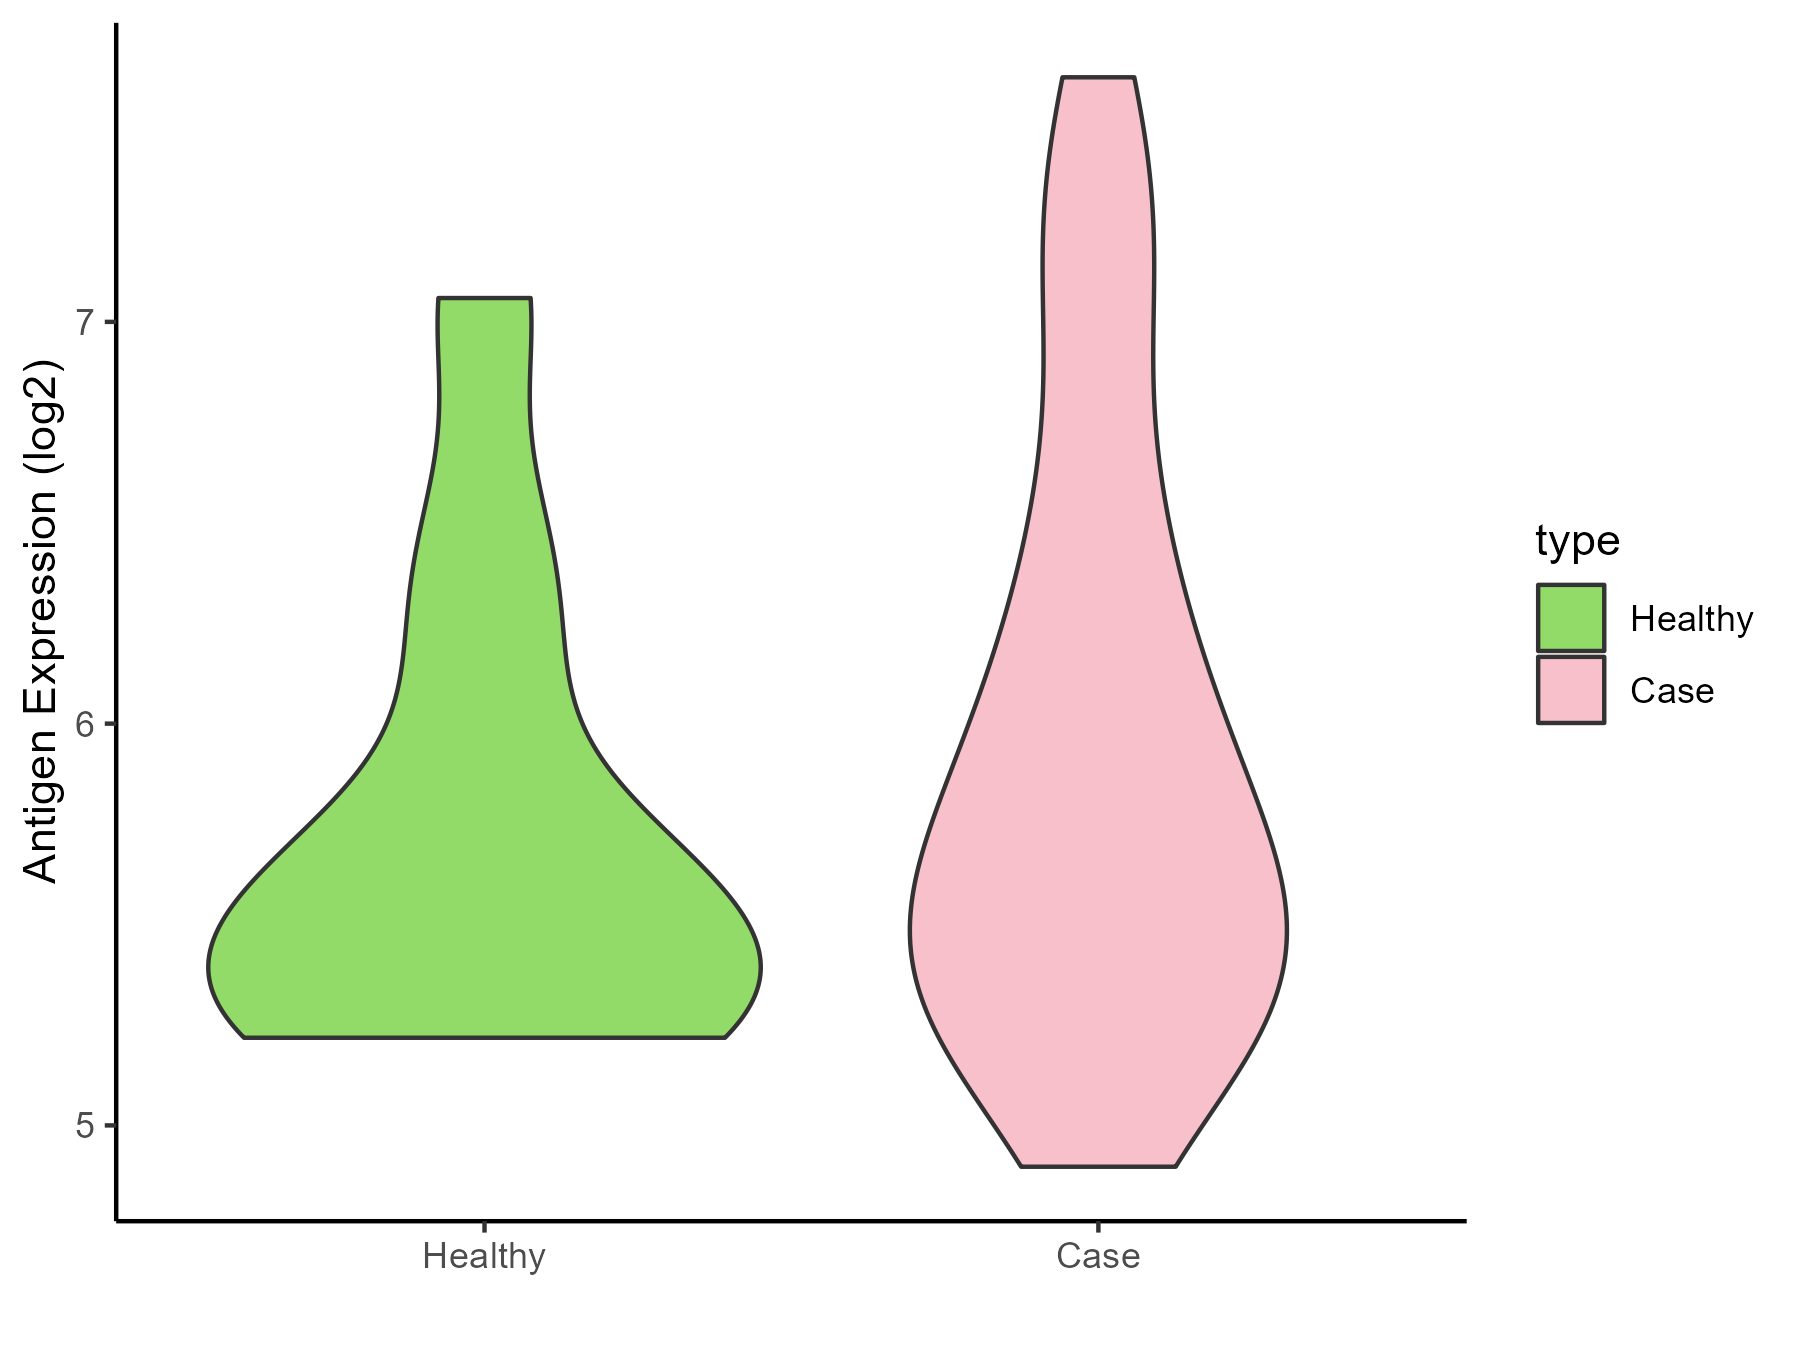
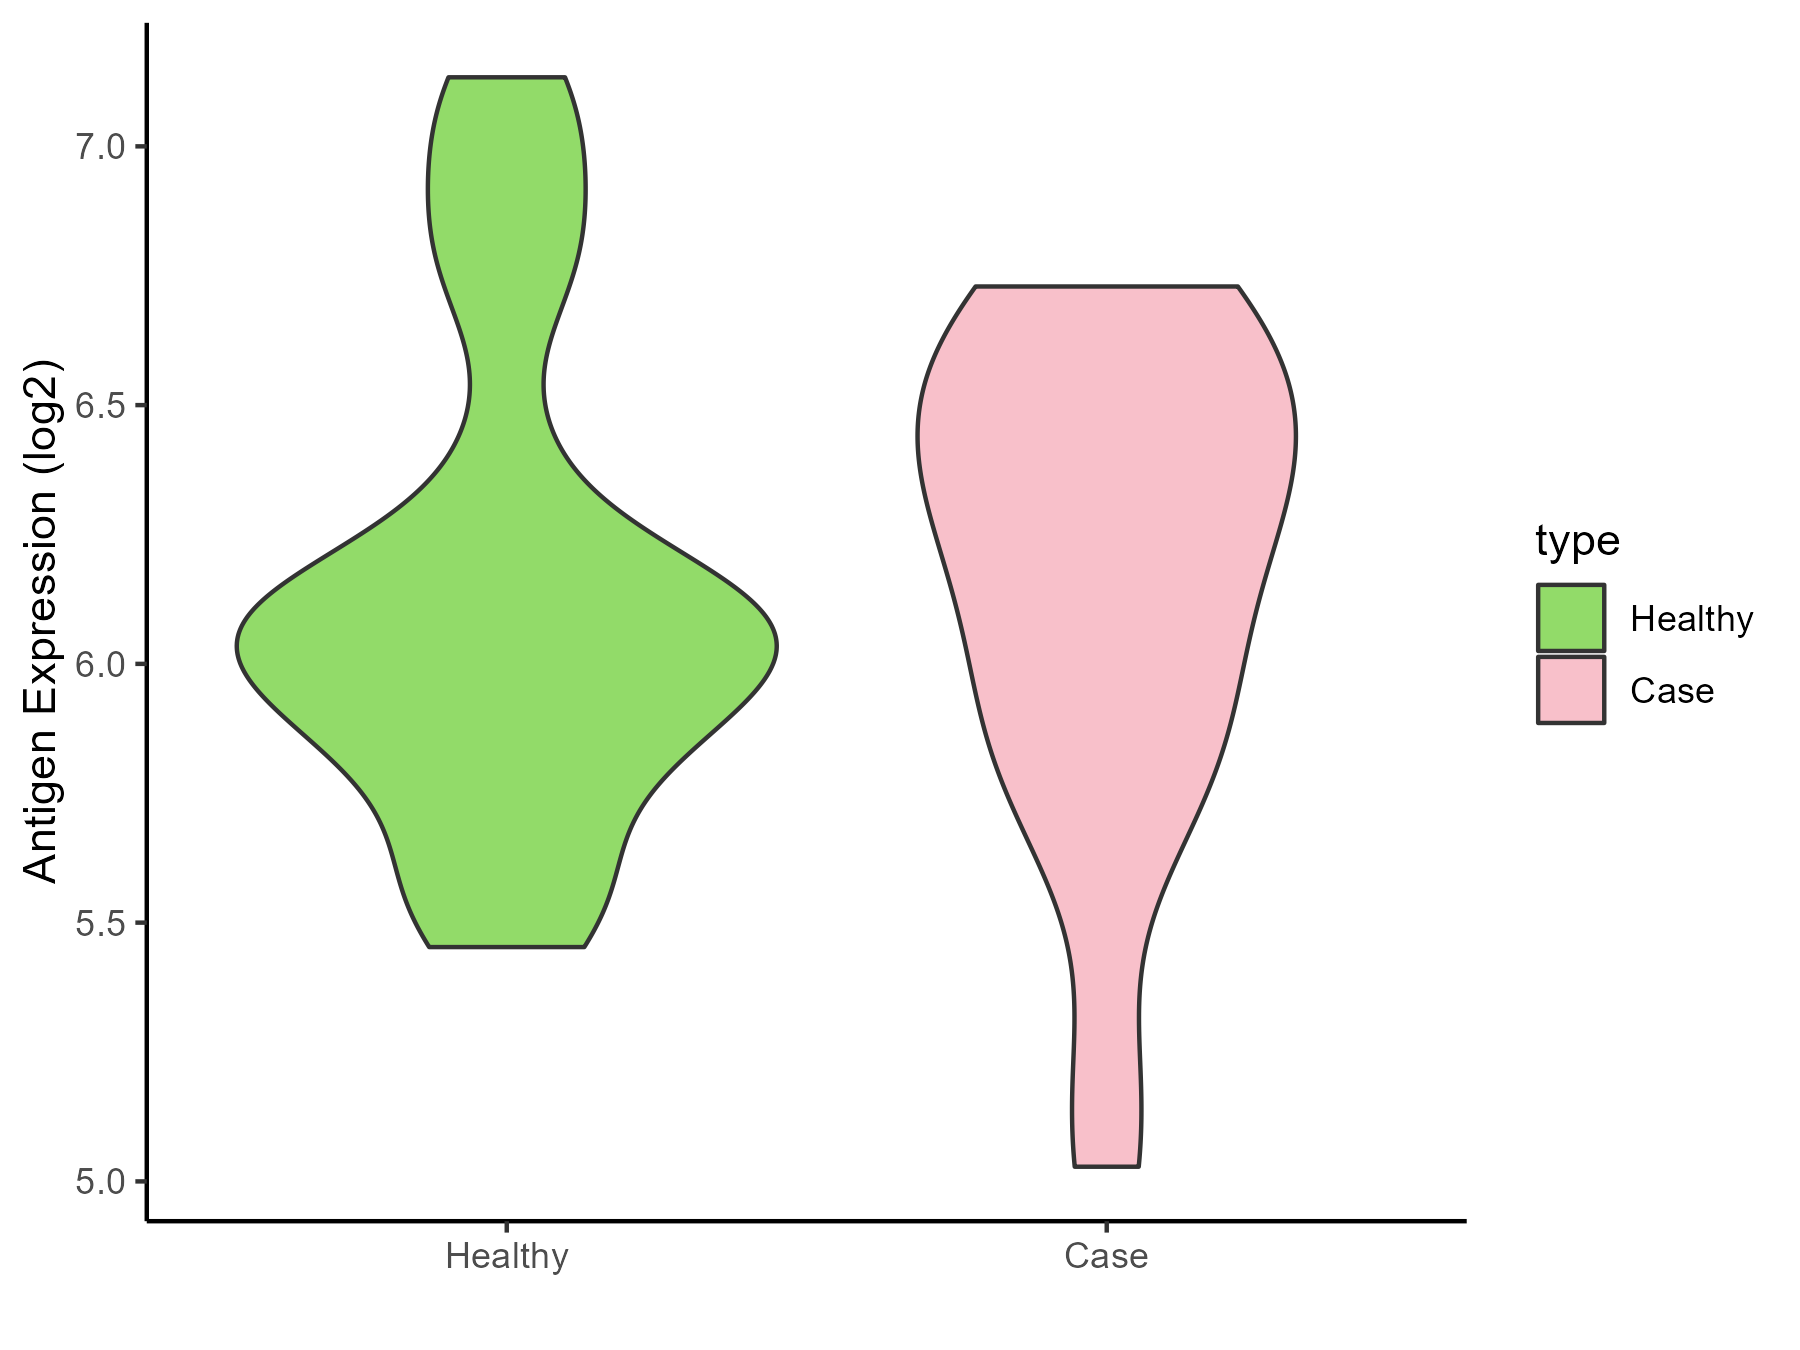
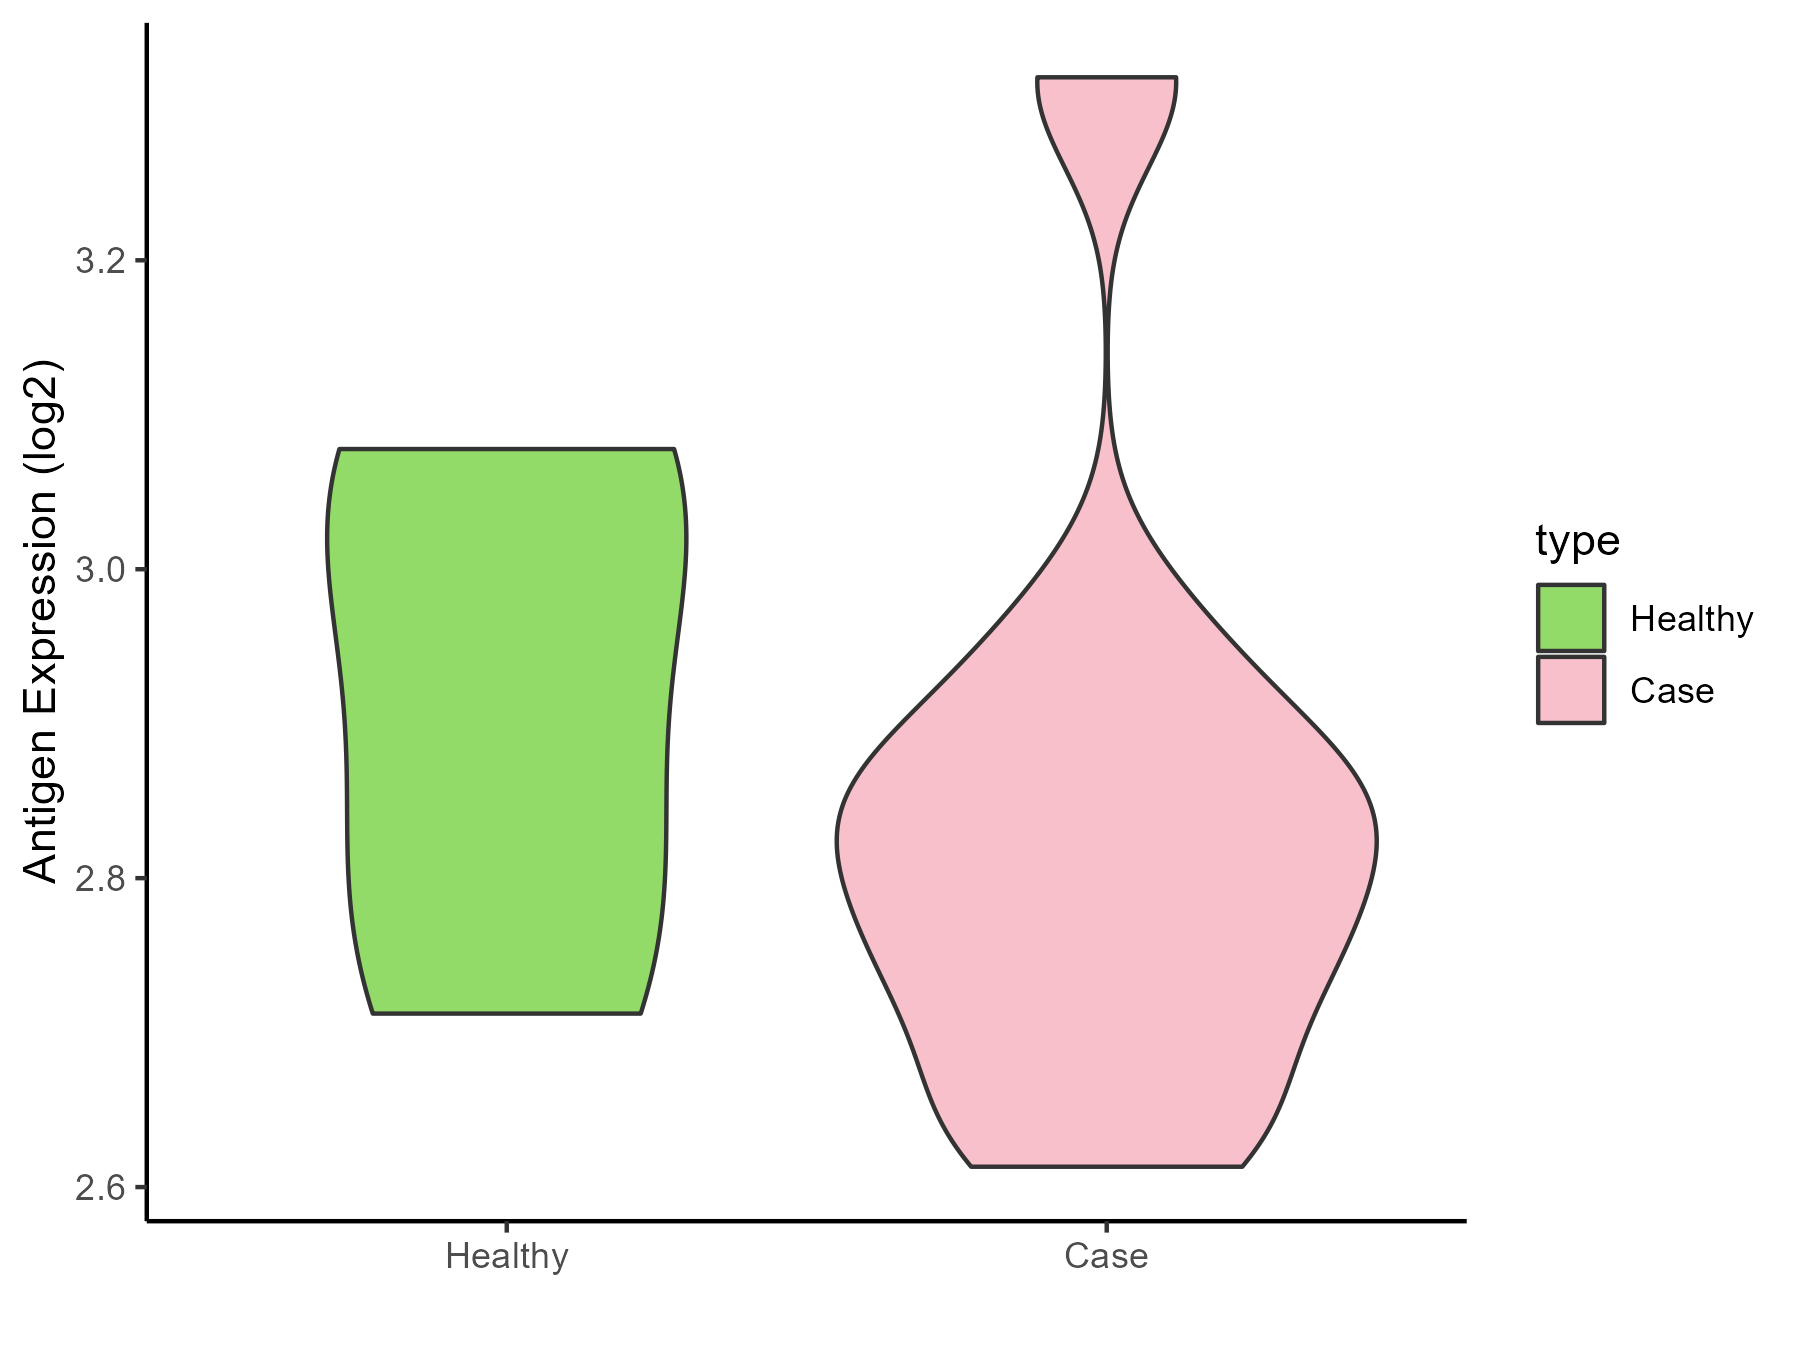
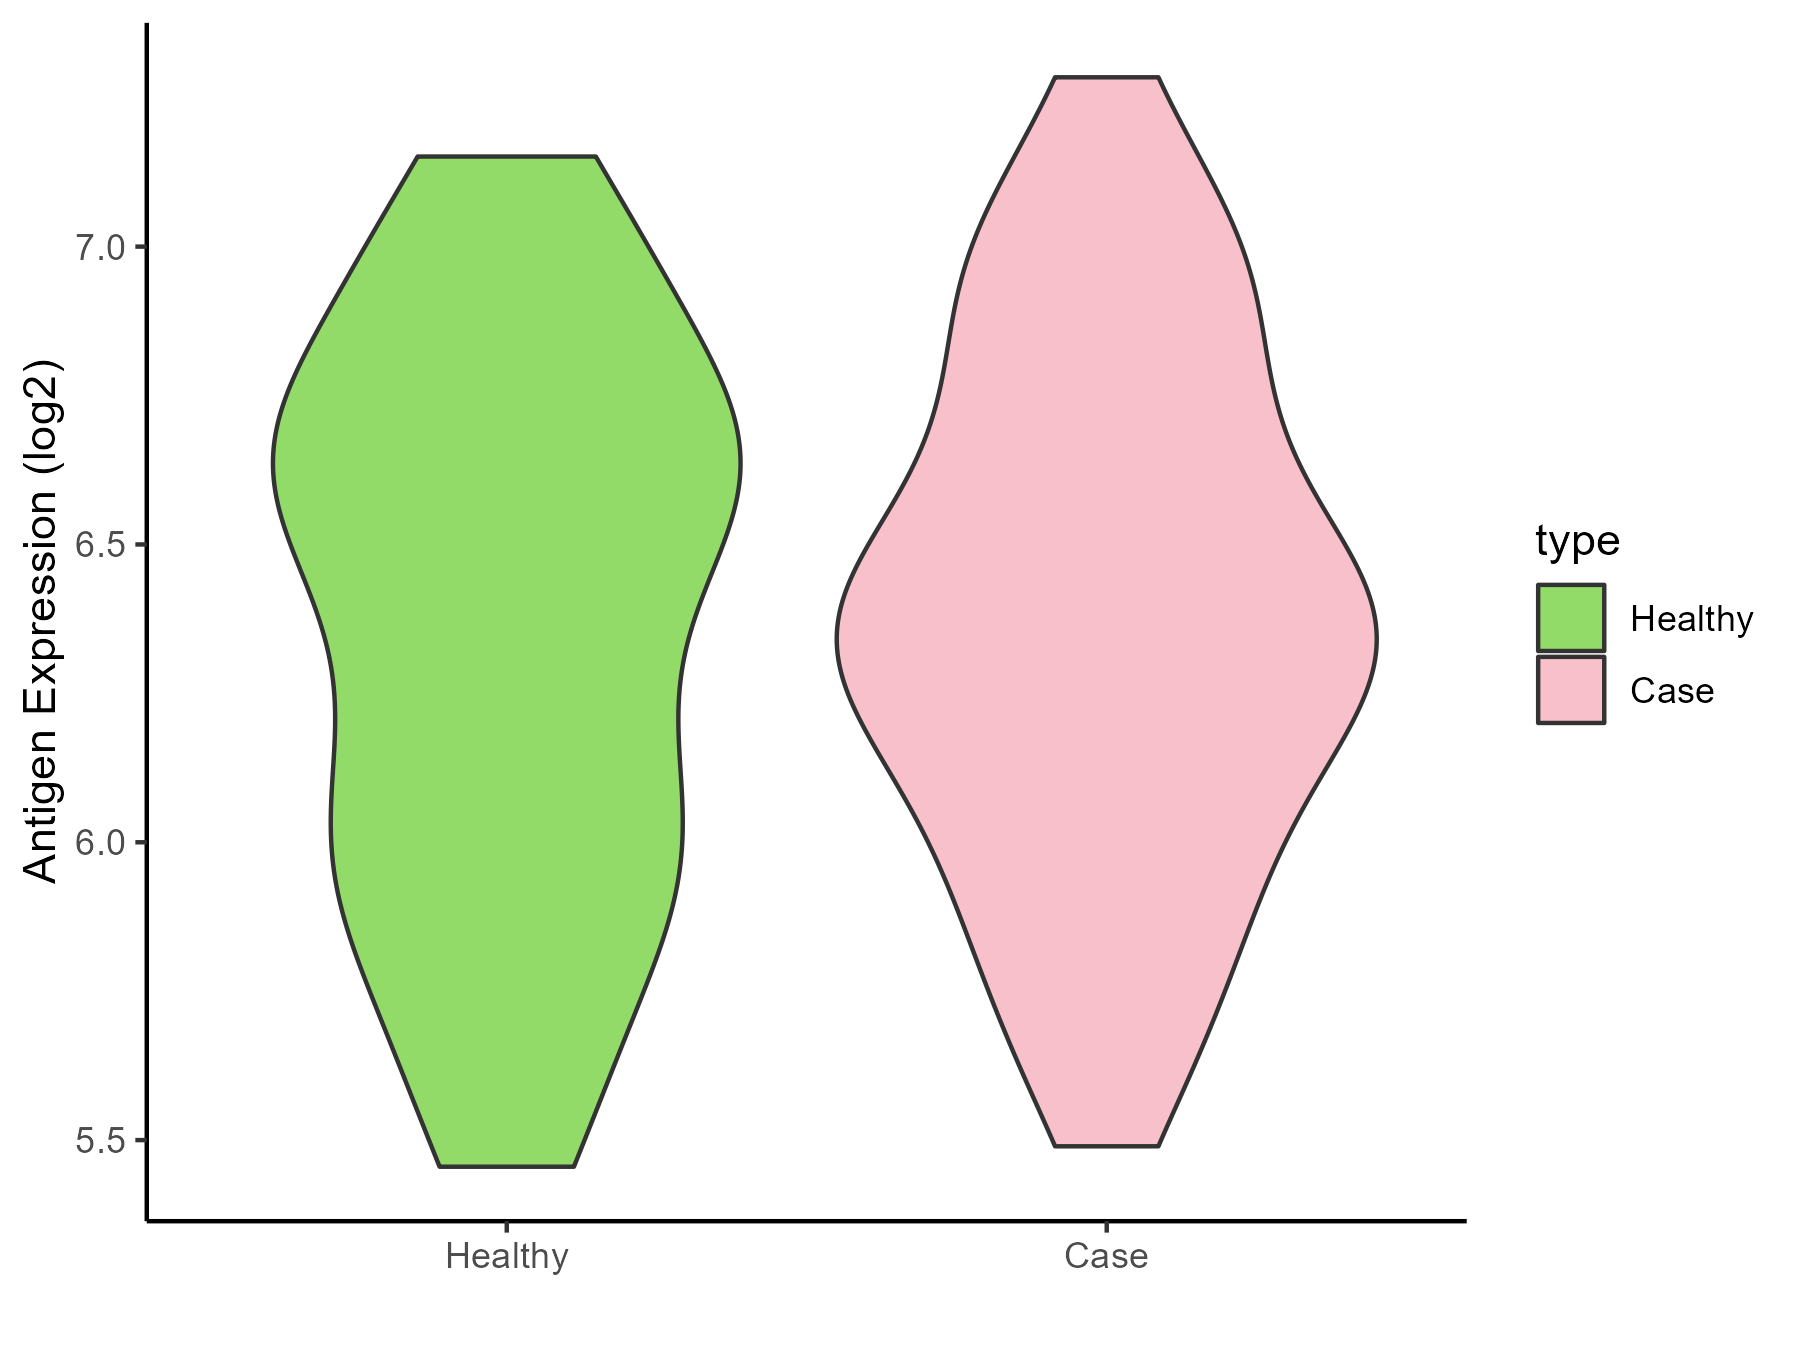
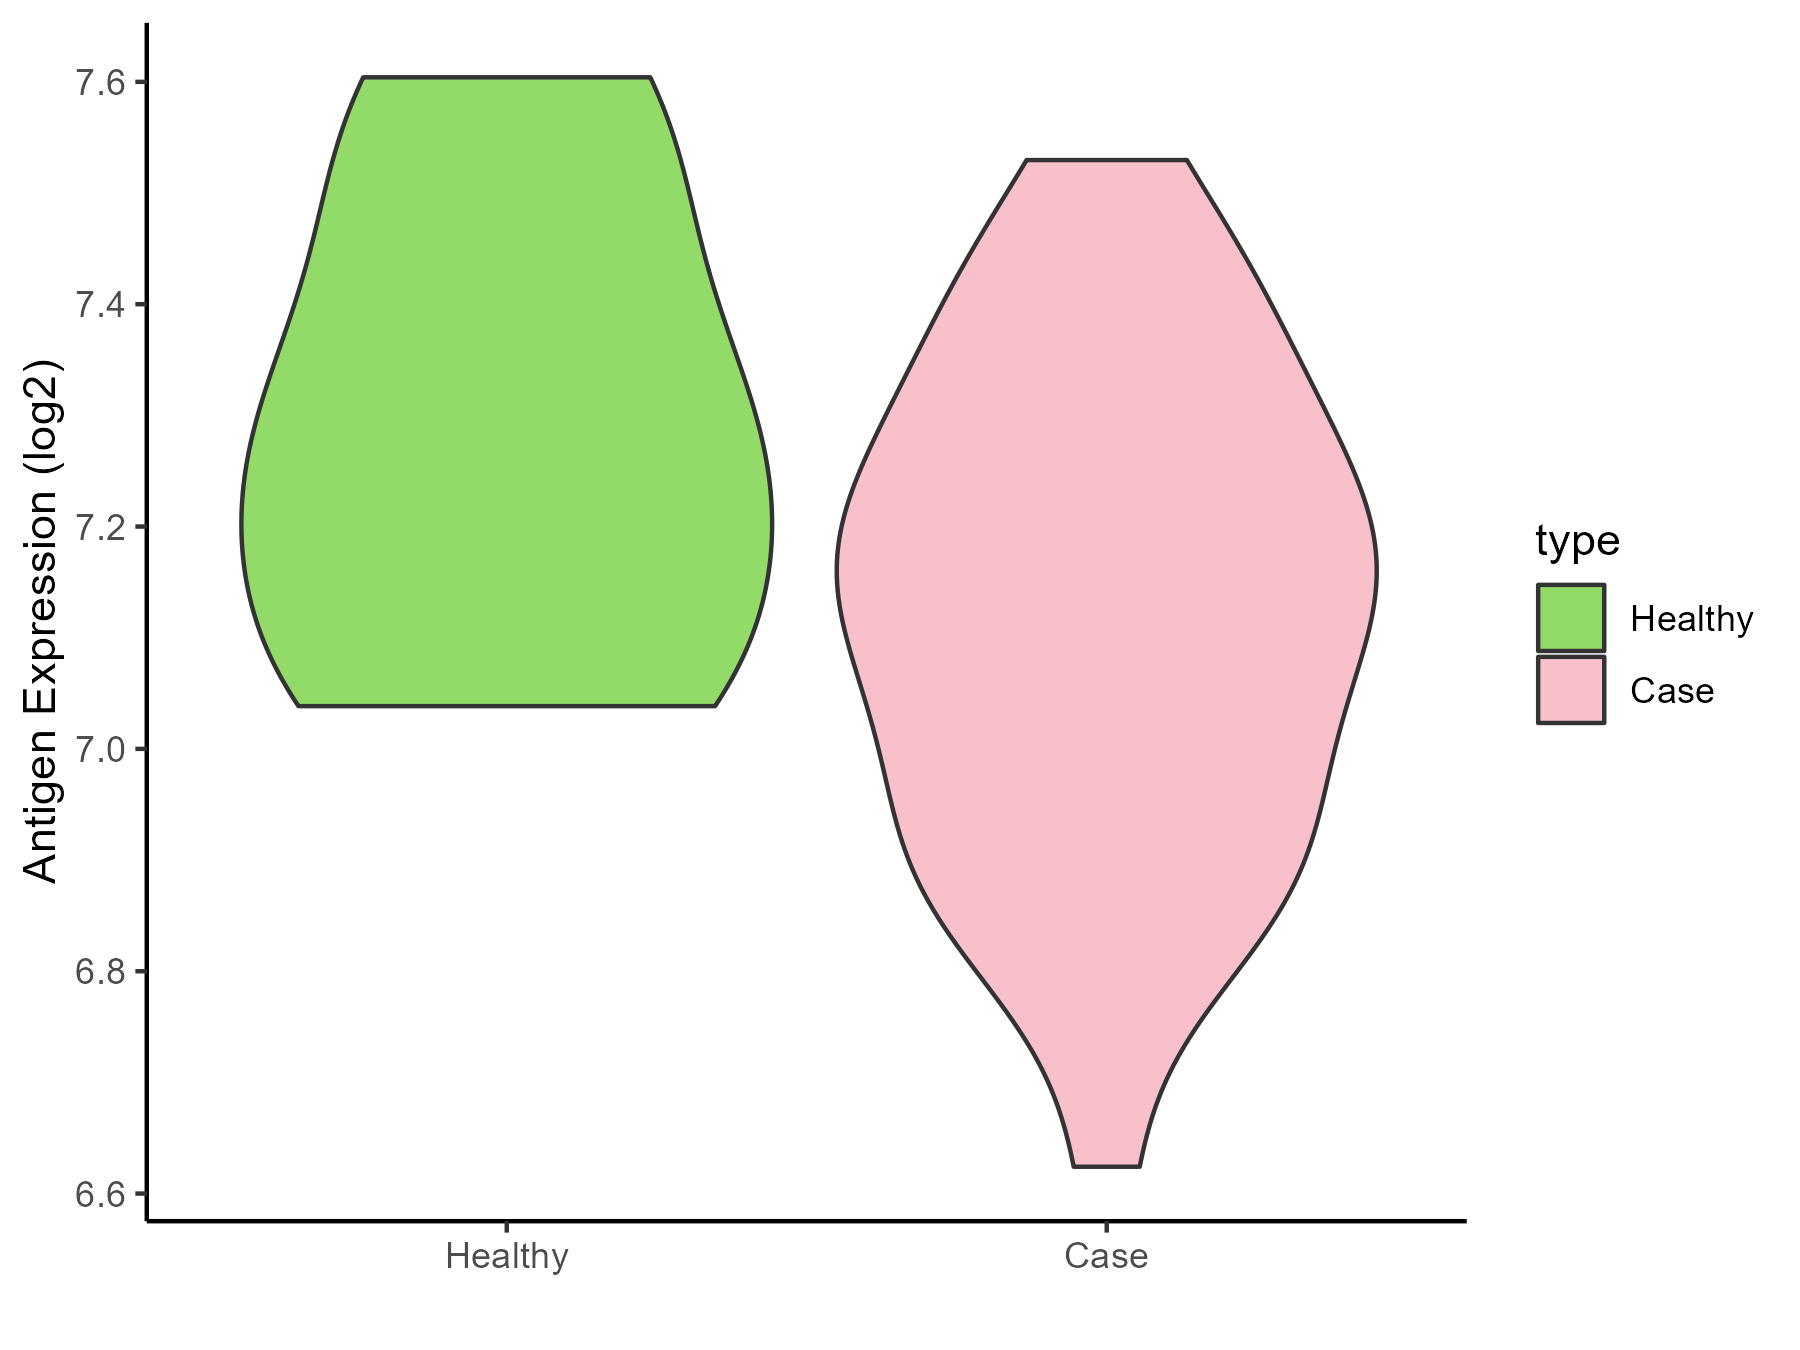
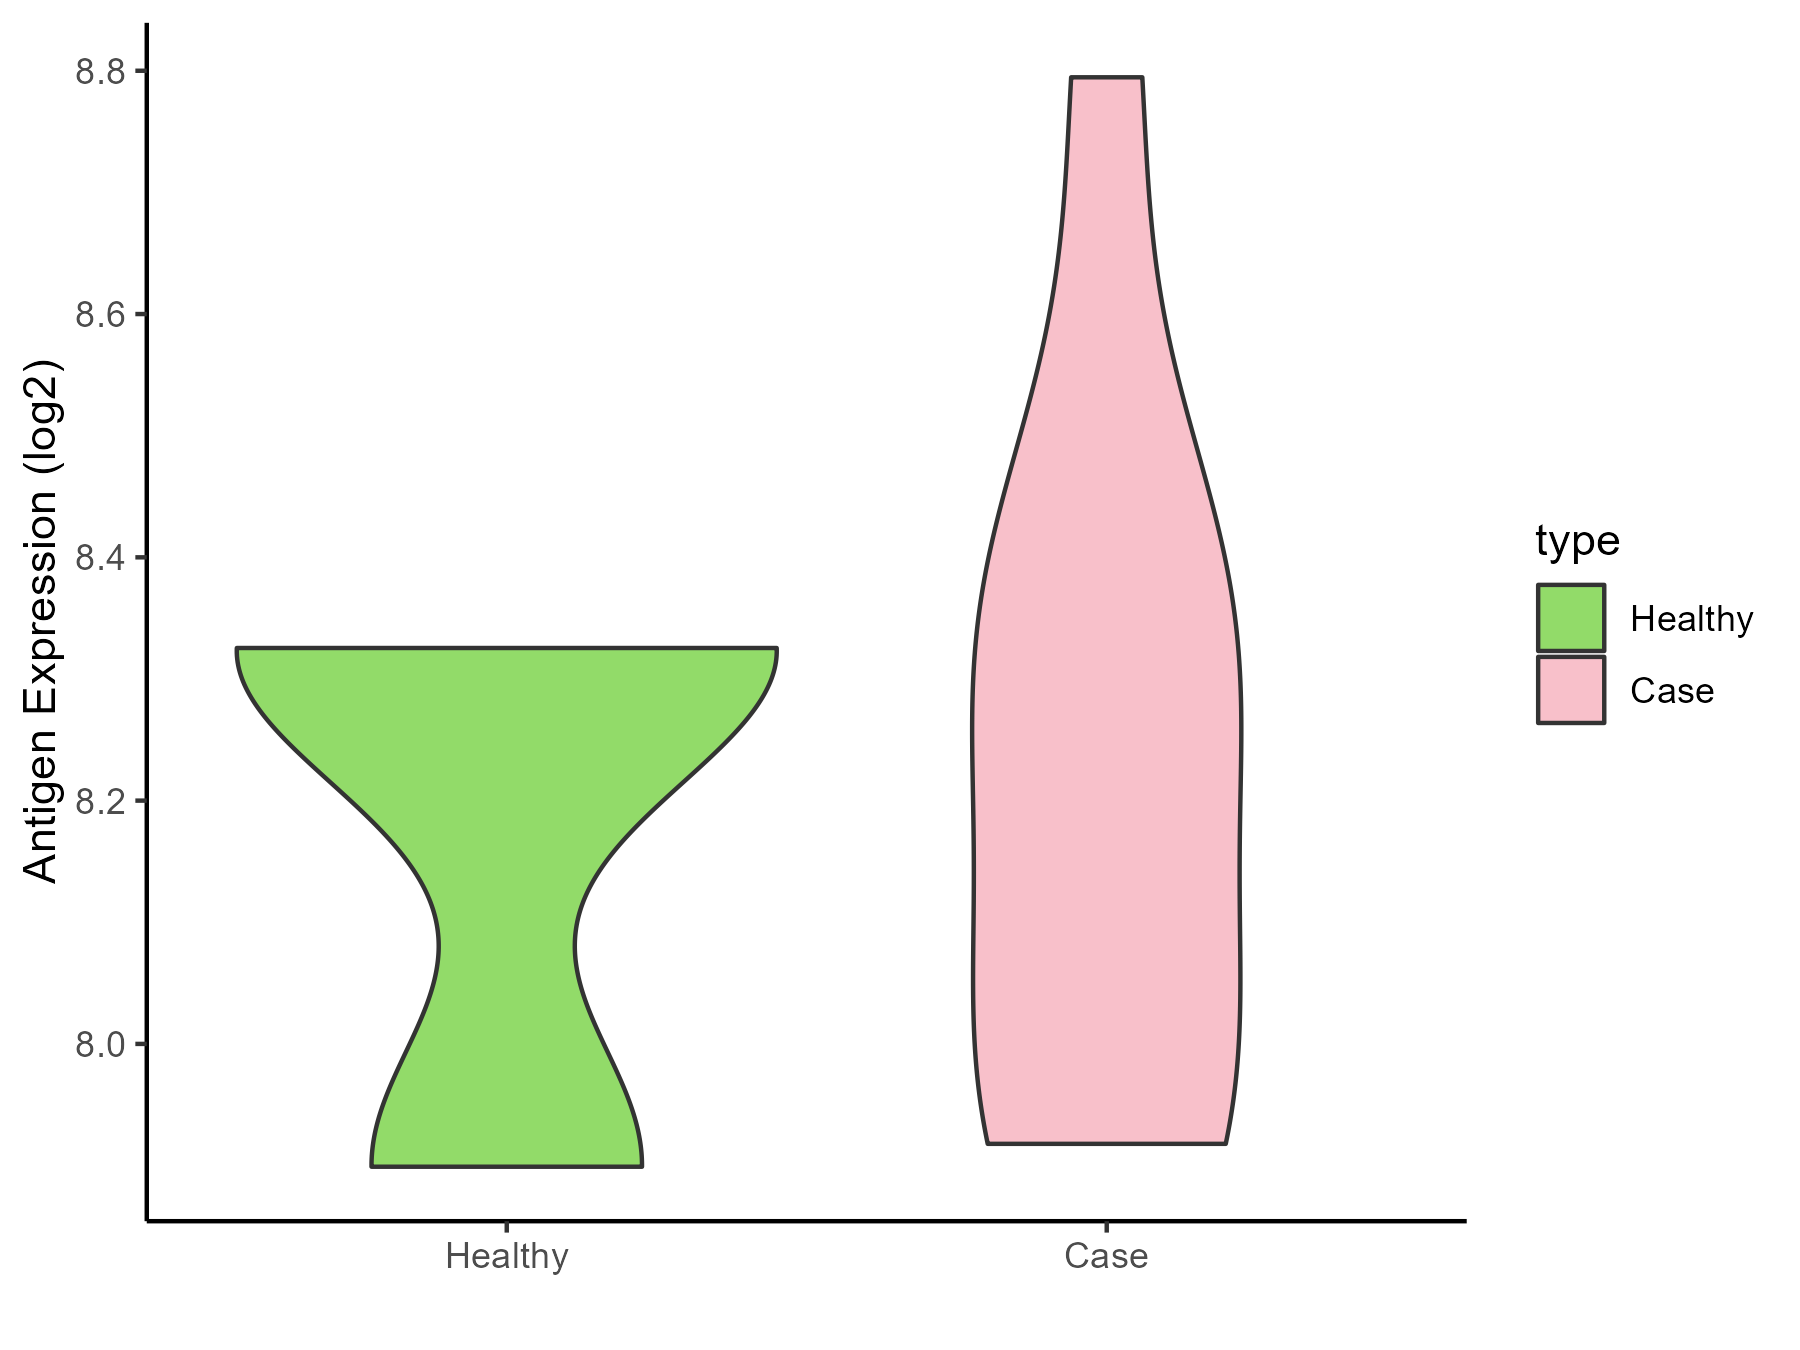
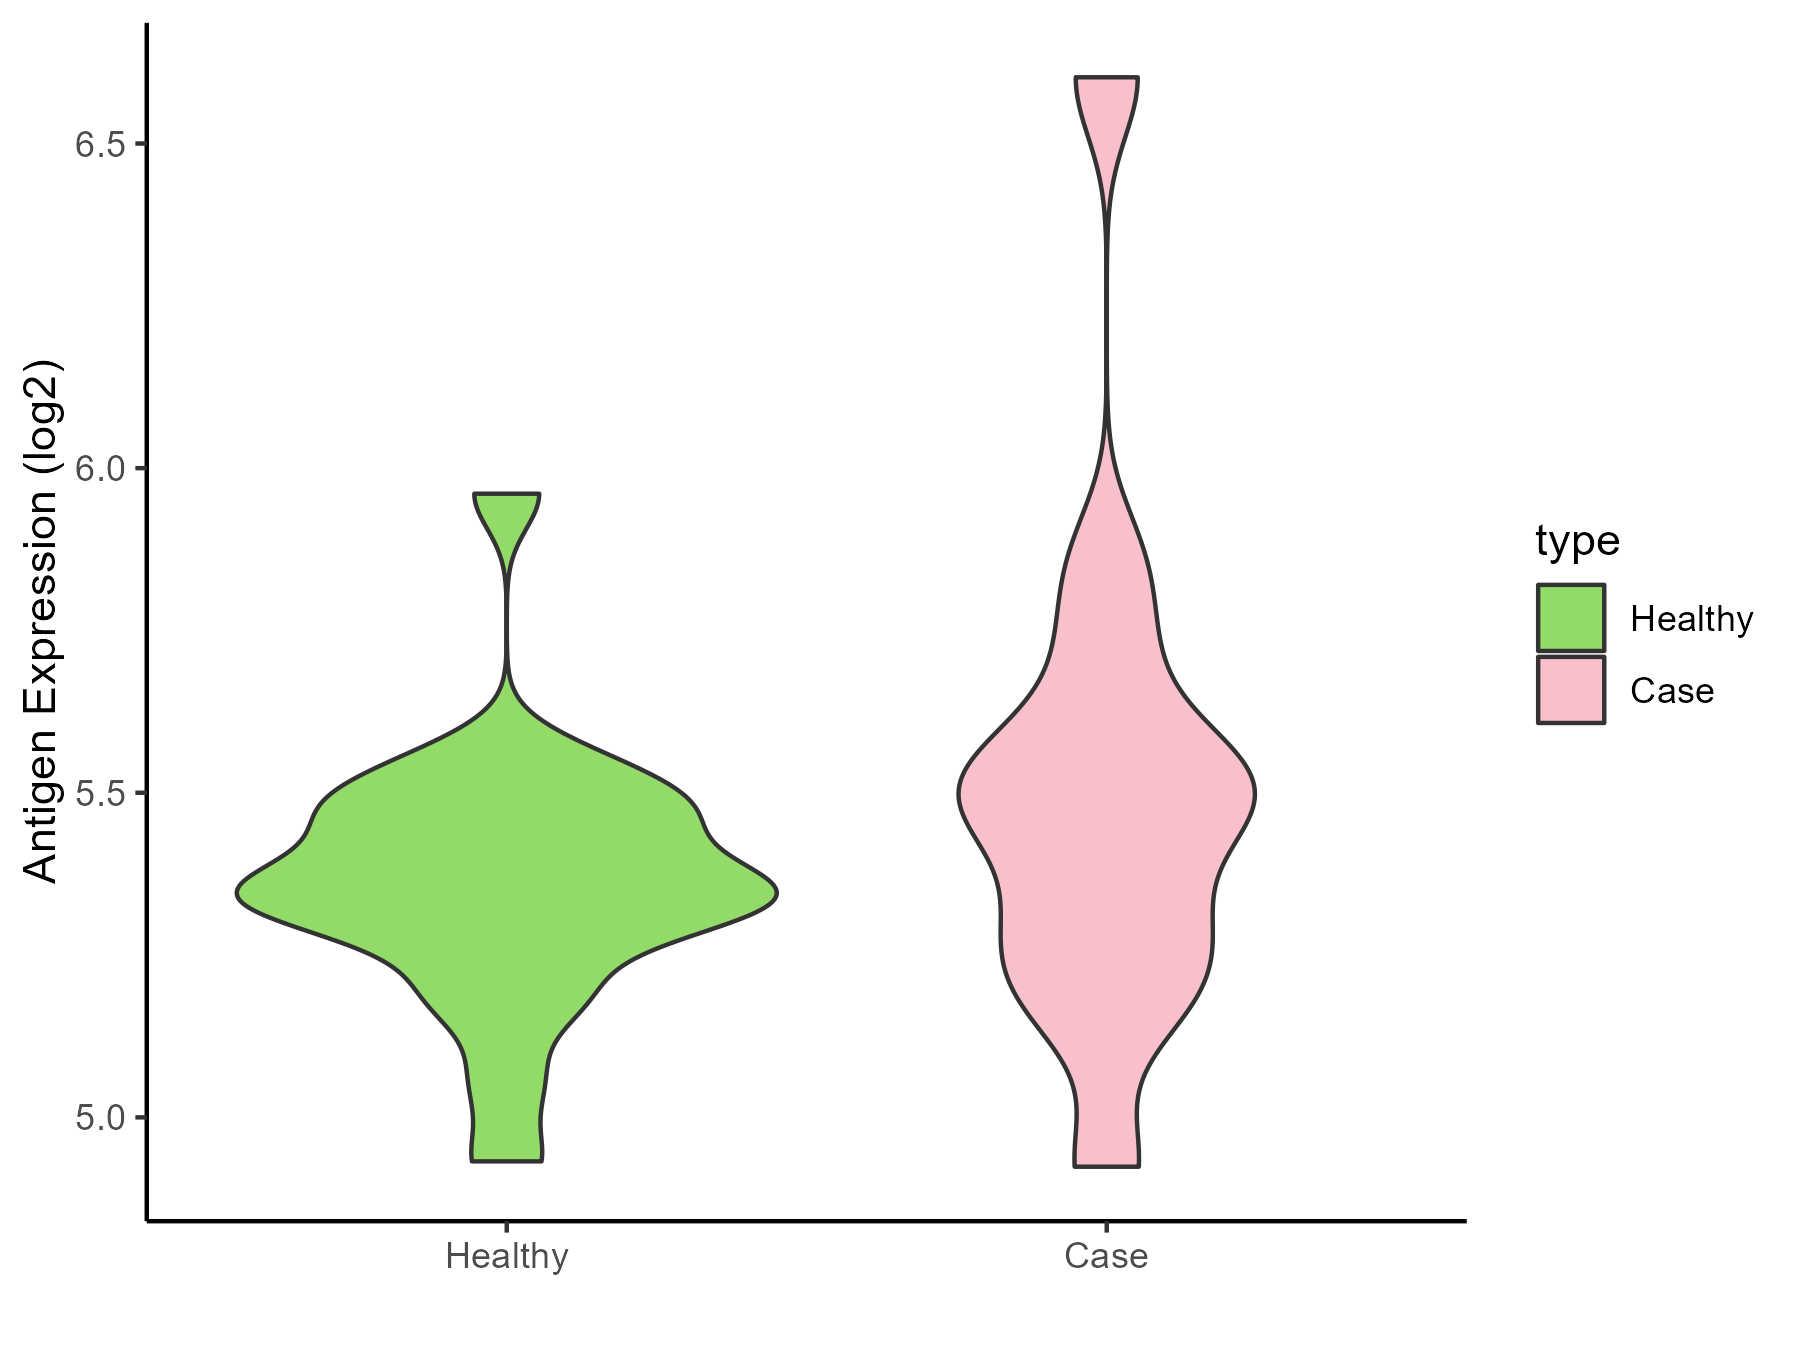
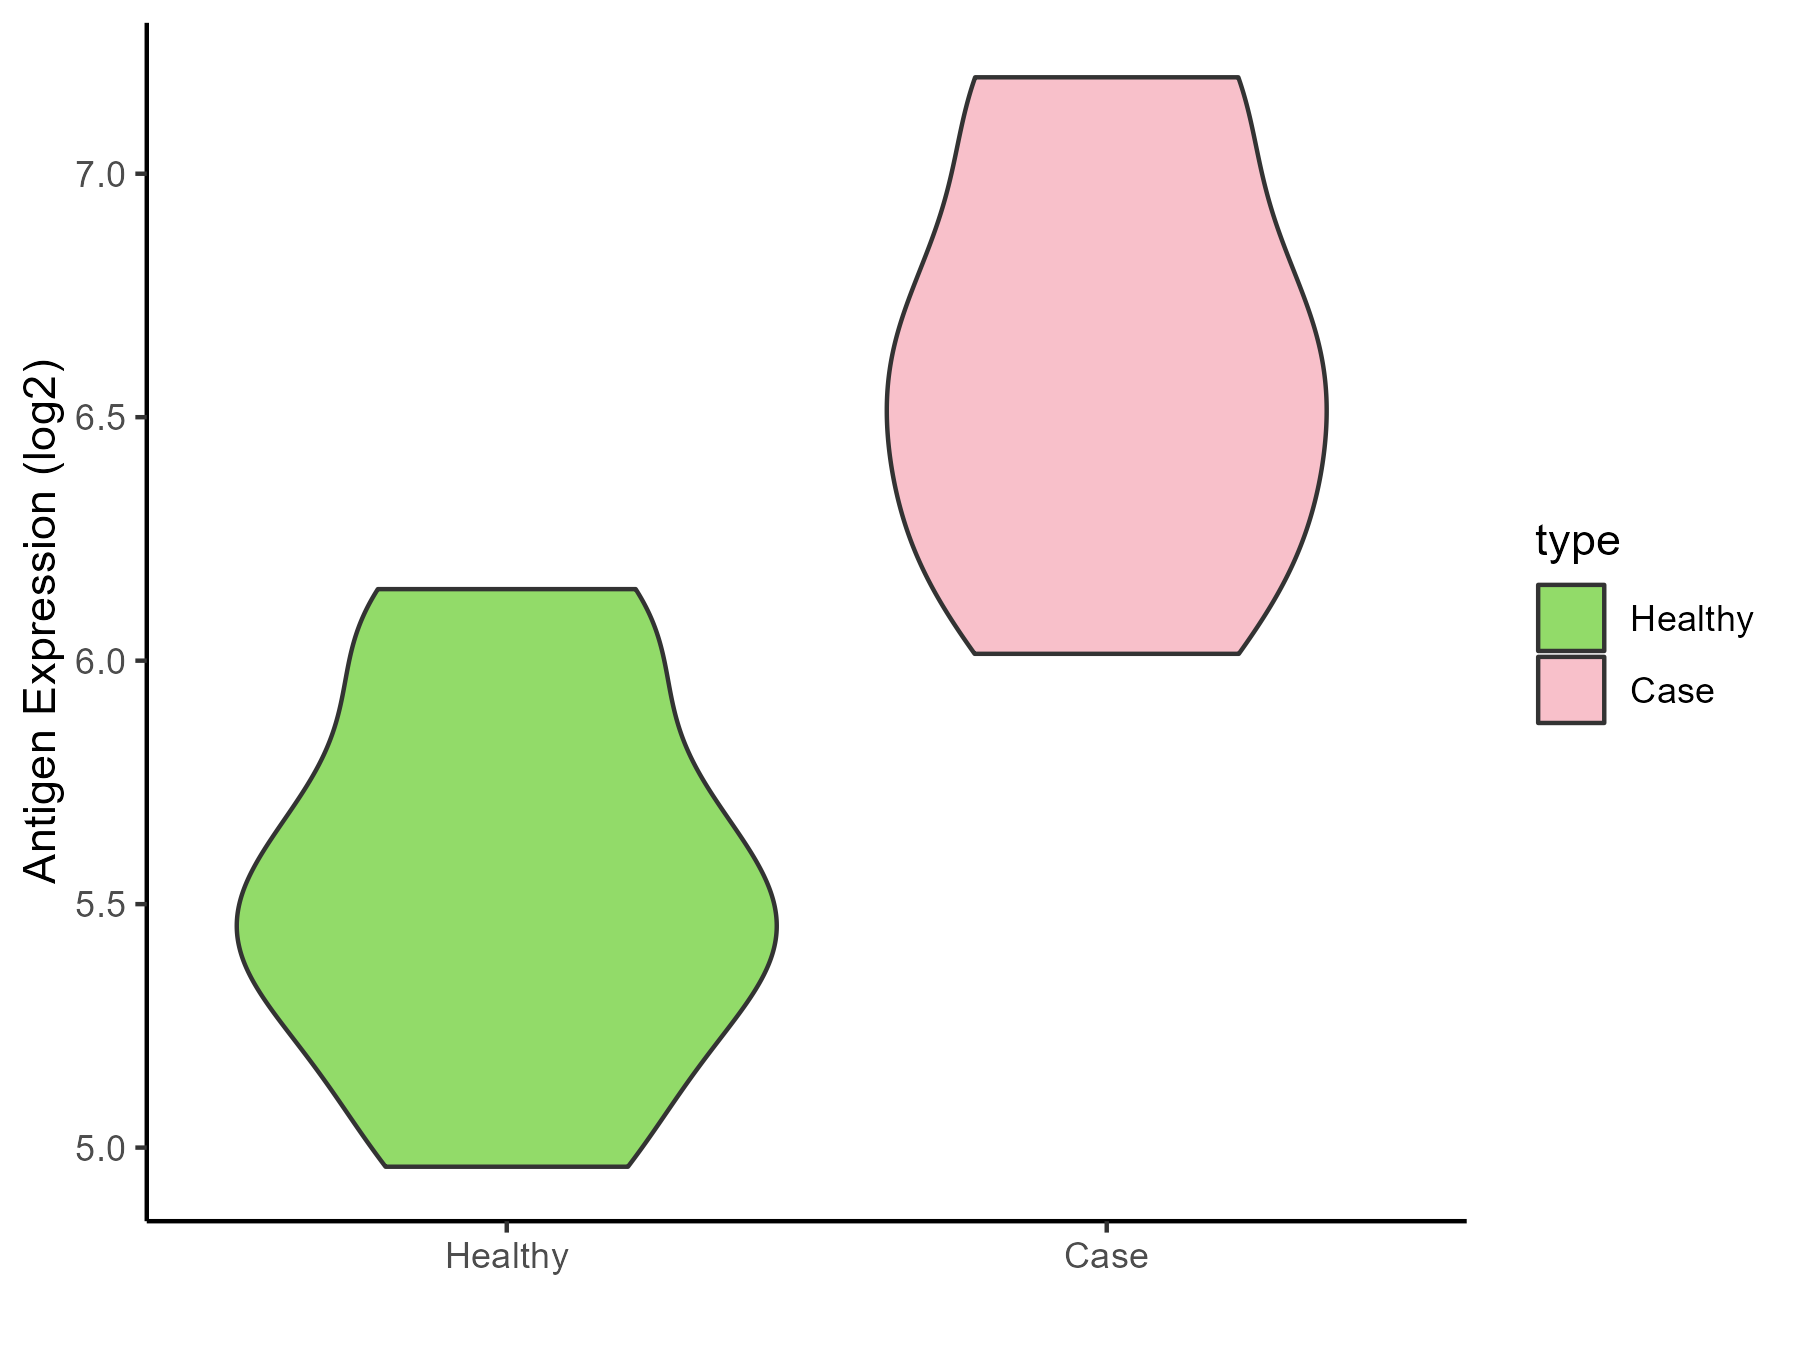
Glioma |
| The Expression Level of Disease Section Compare with the Healthy Individual Tissue |
p-value: 0.00381178;
Fold-change: 0.826584993;
Z-score: 5.399538208
|
| Disease-specific Antigen Abundances |
|
Click to View the Clearer Original Diagram
|
|
|
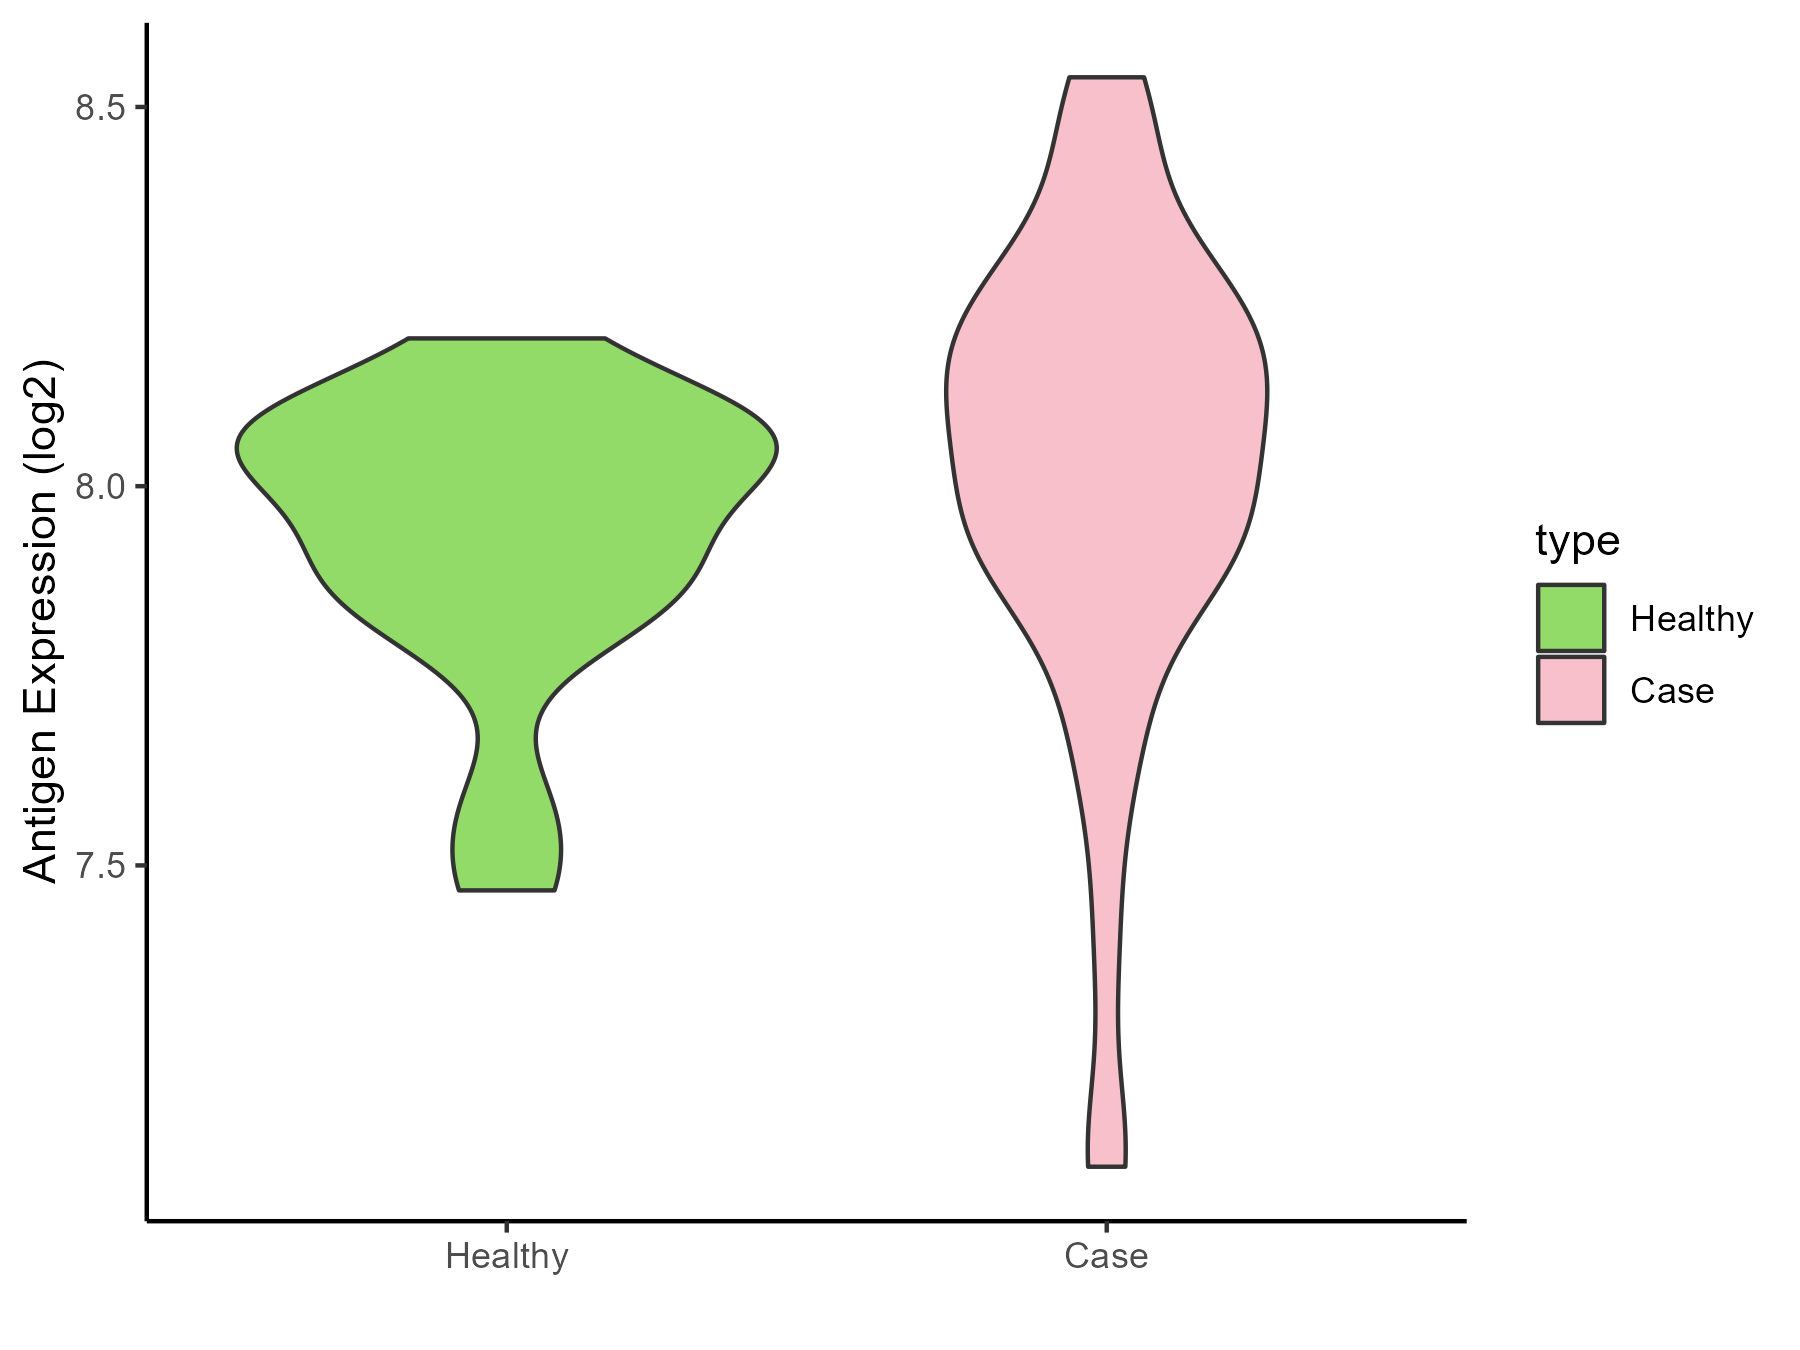
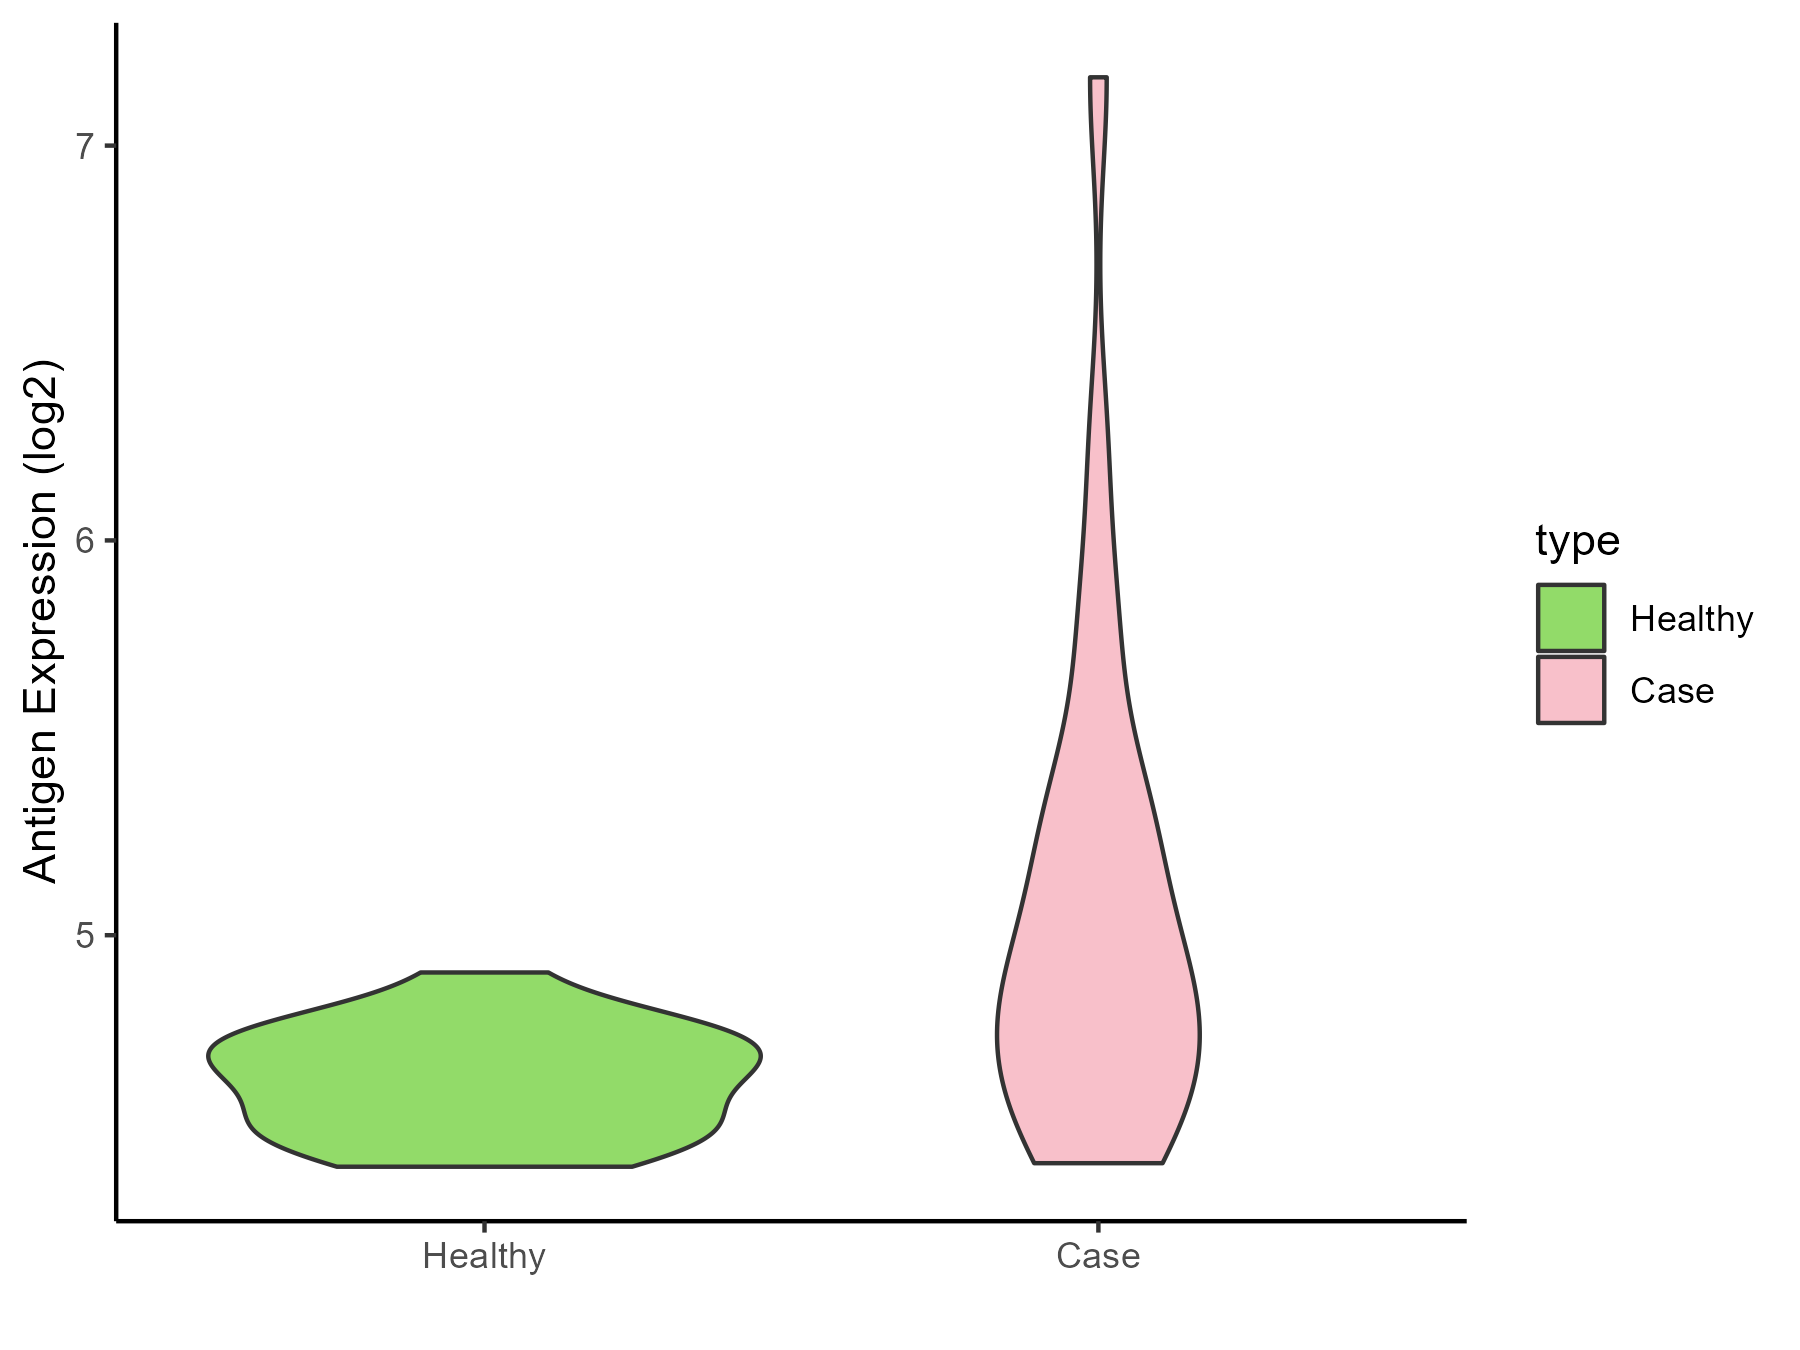
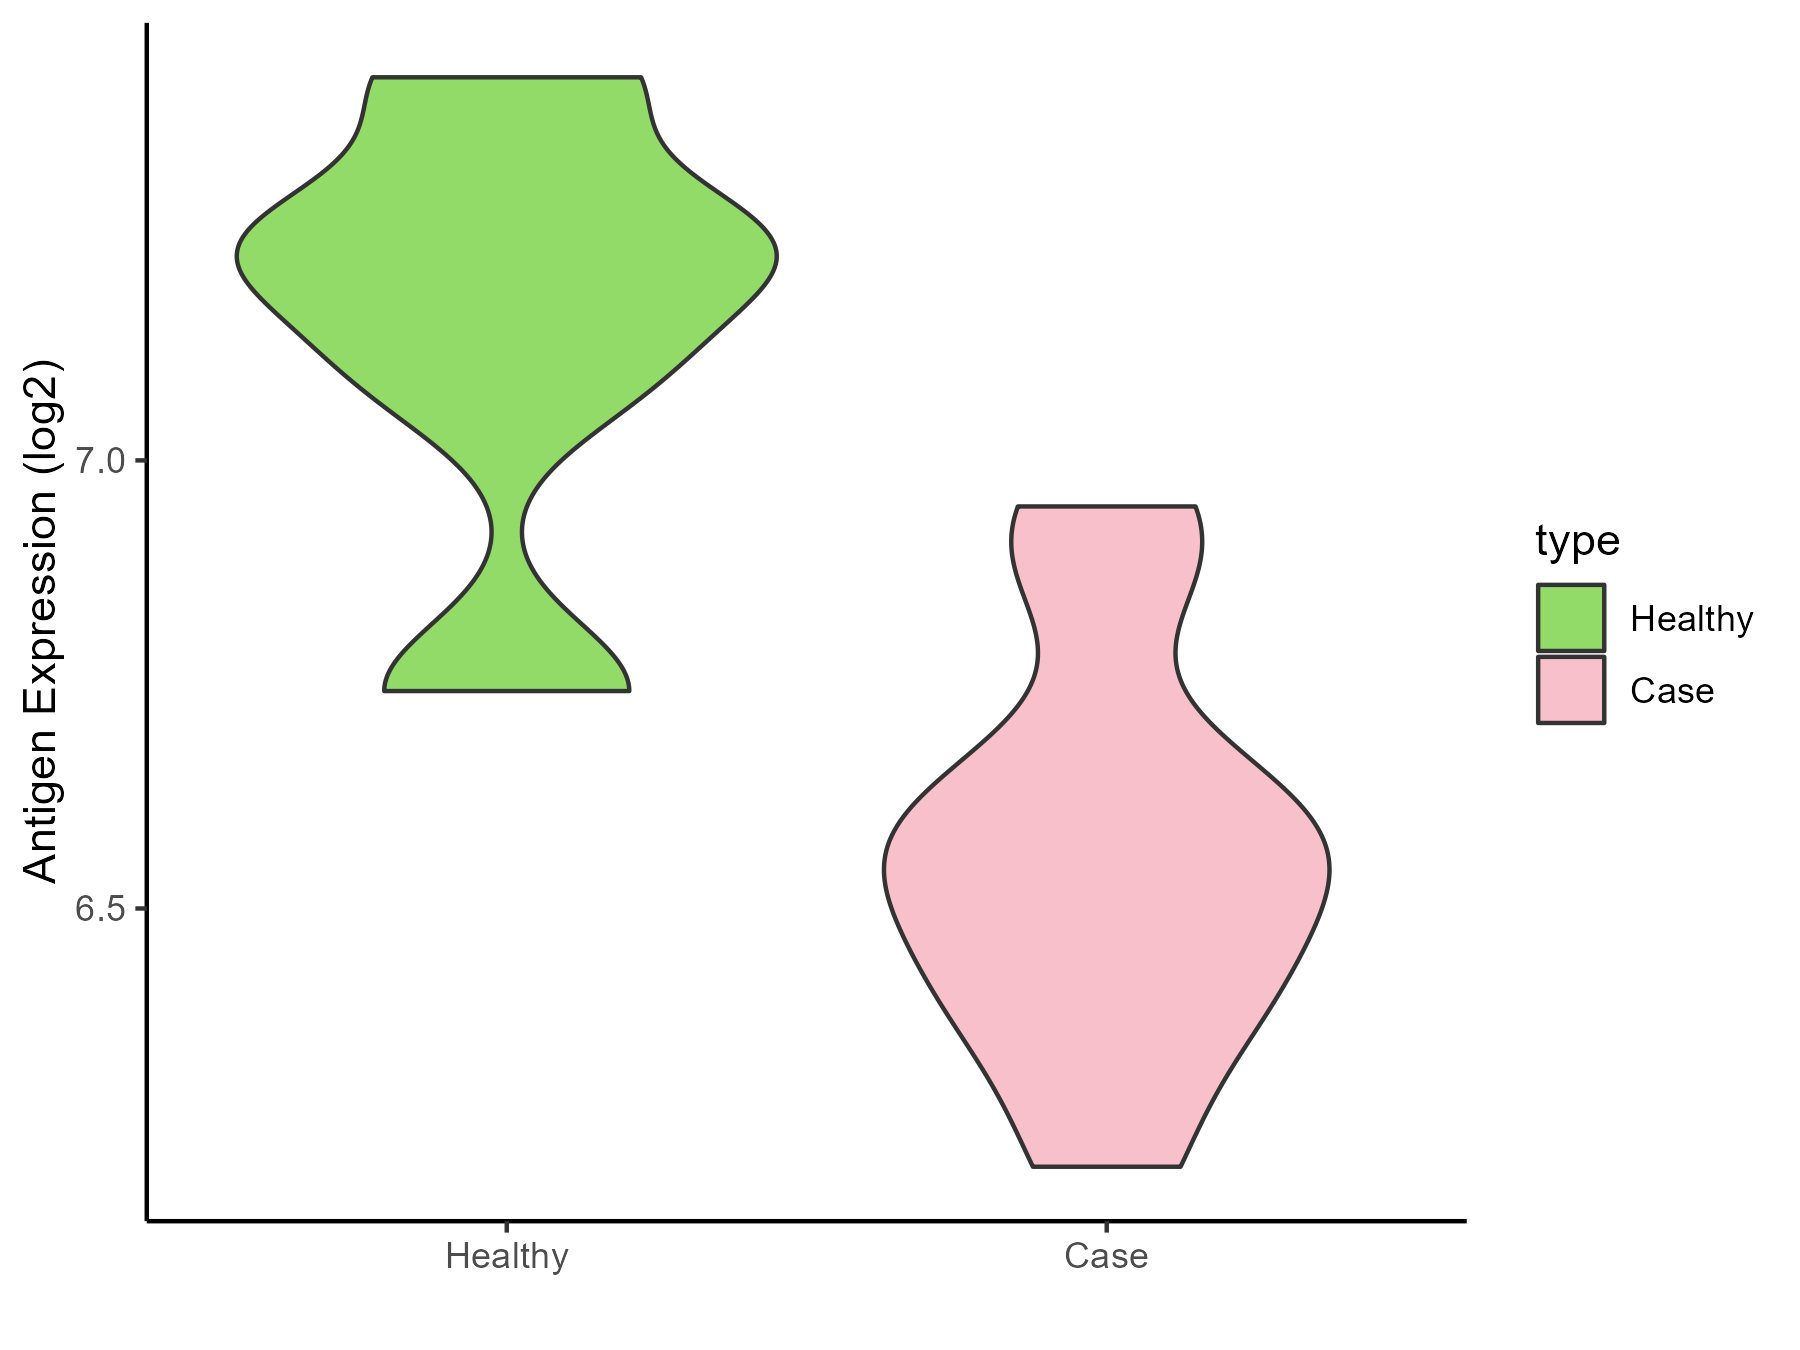
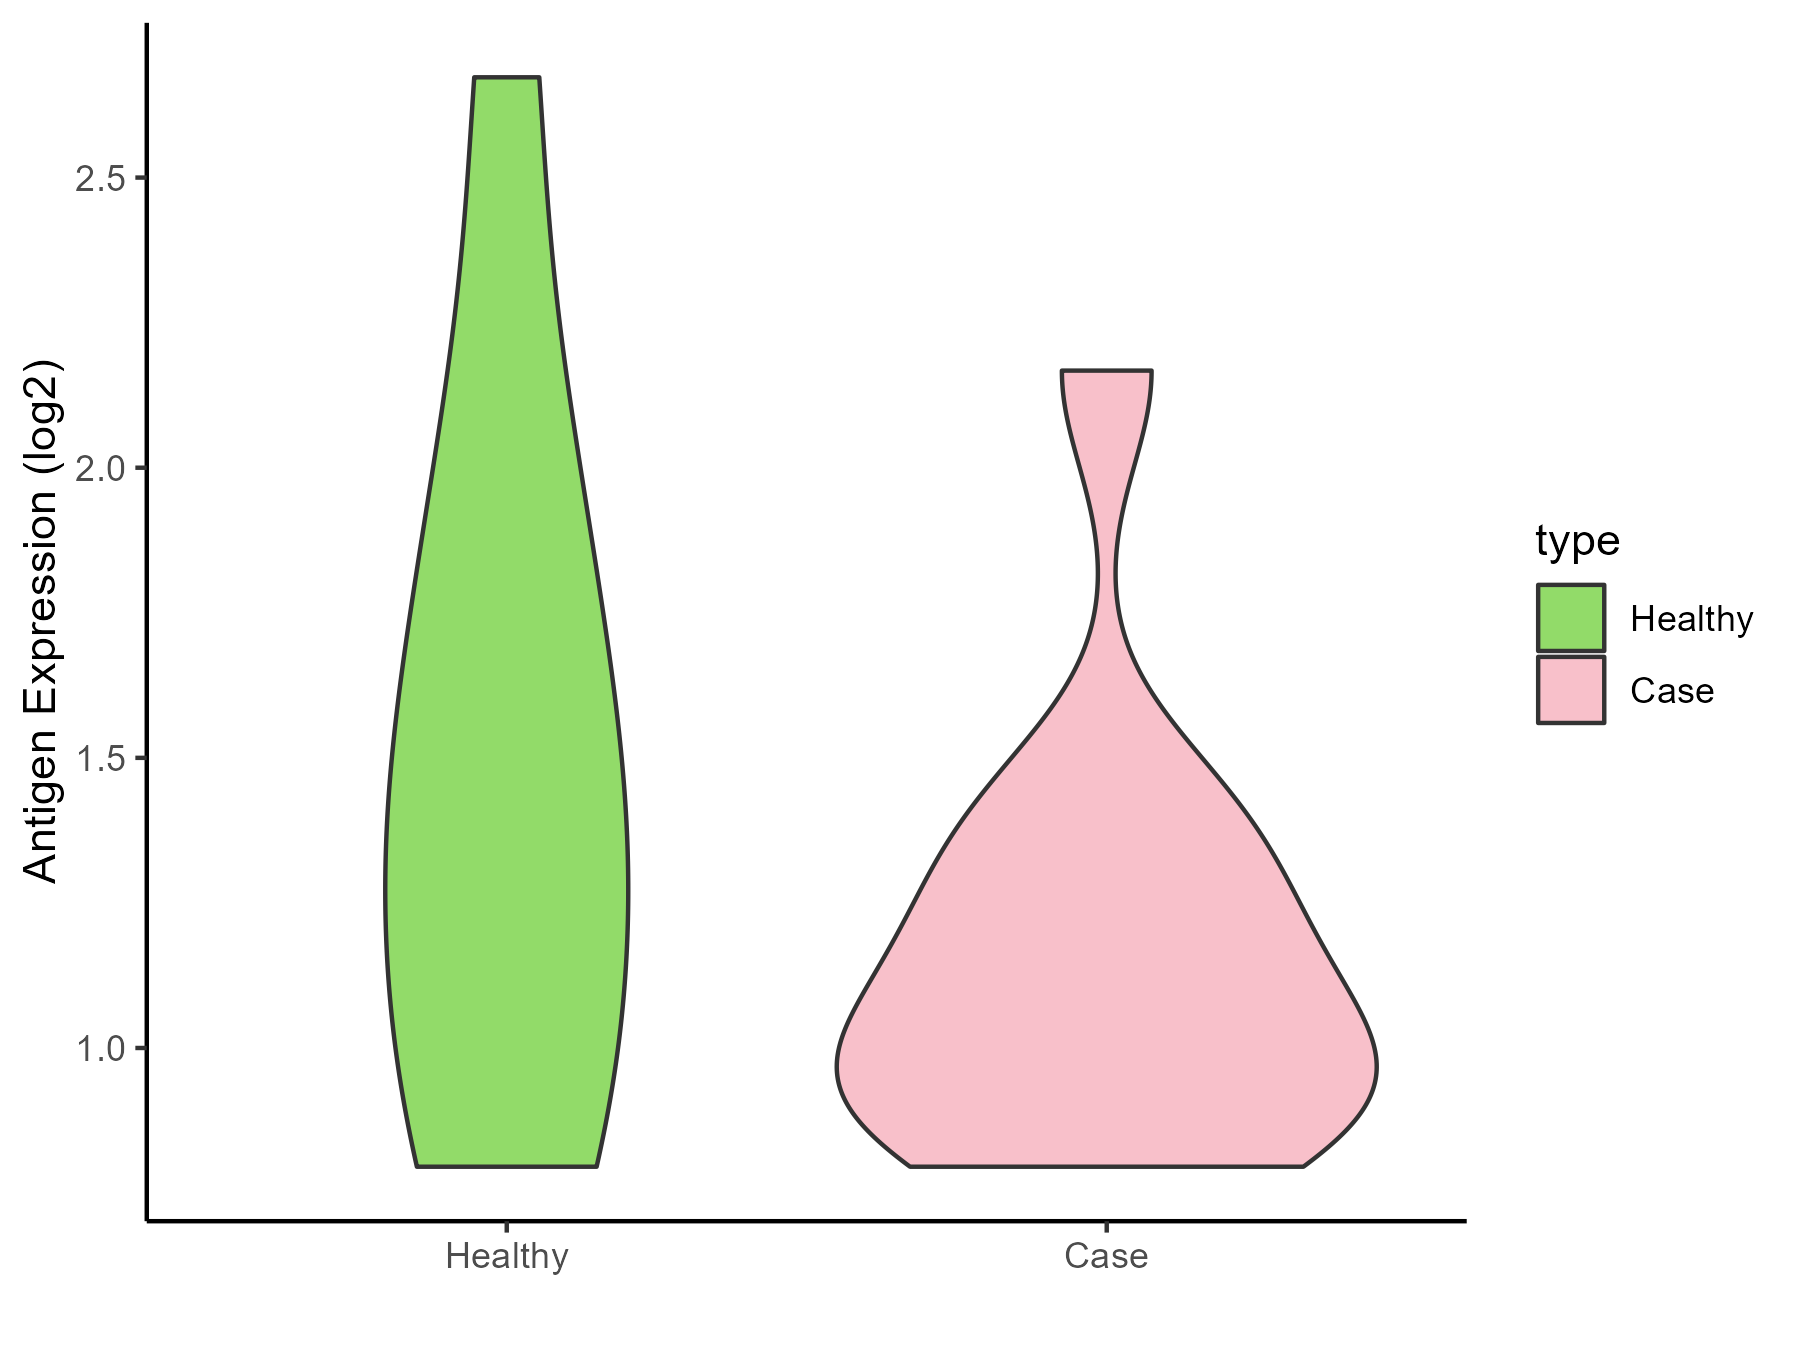
| The Studied Tissue |
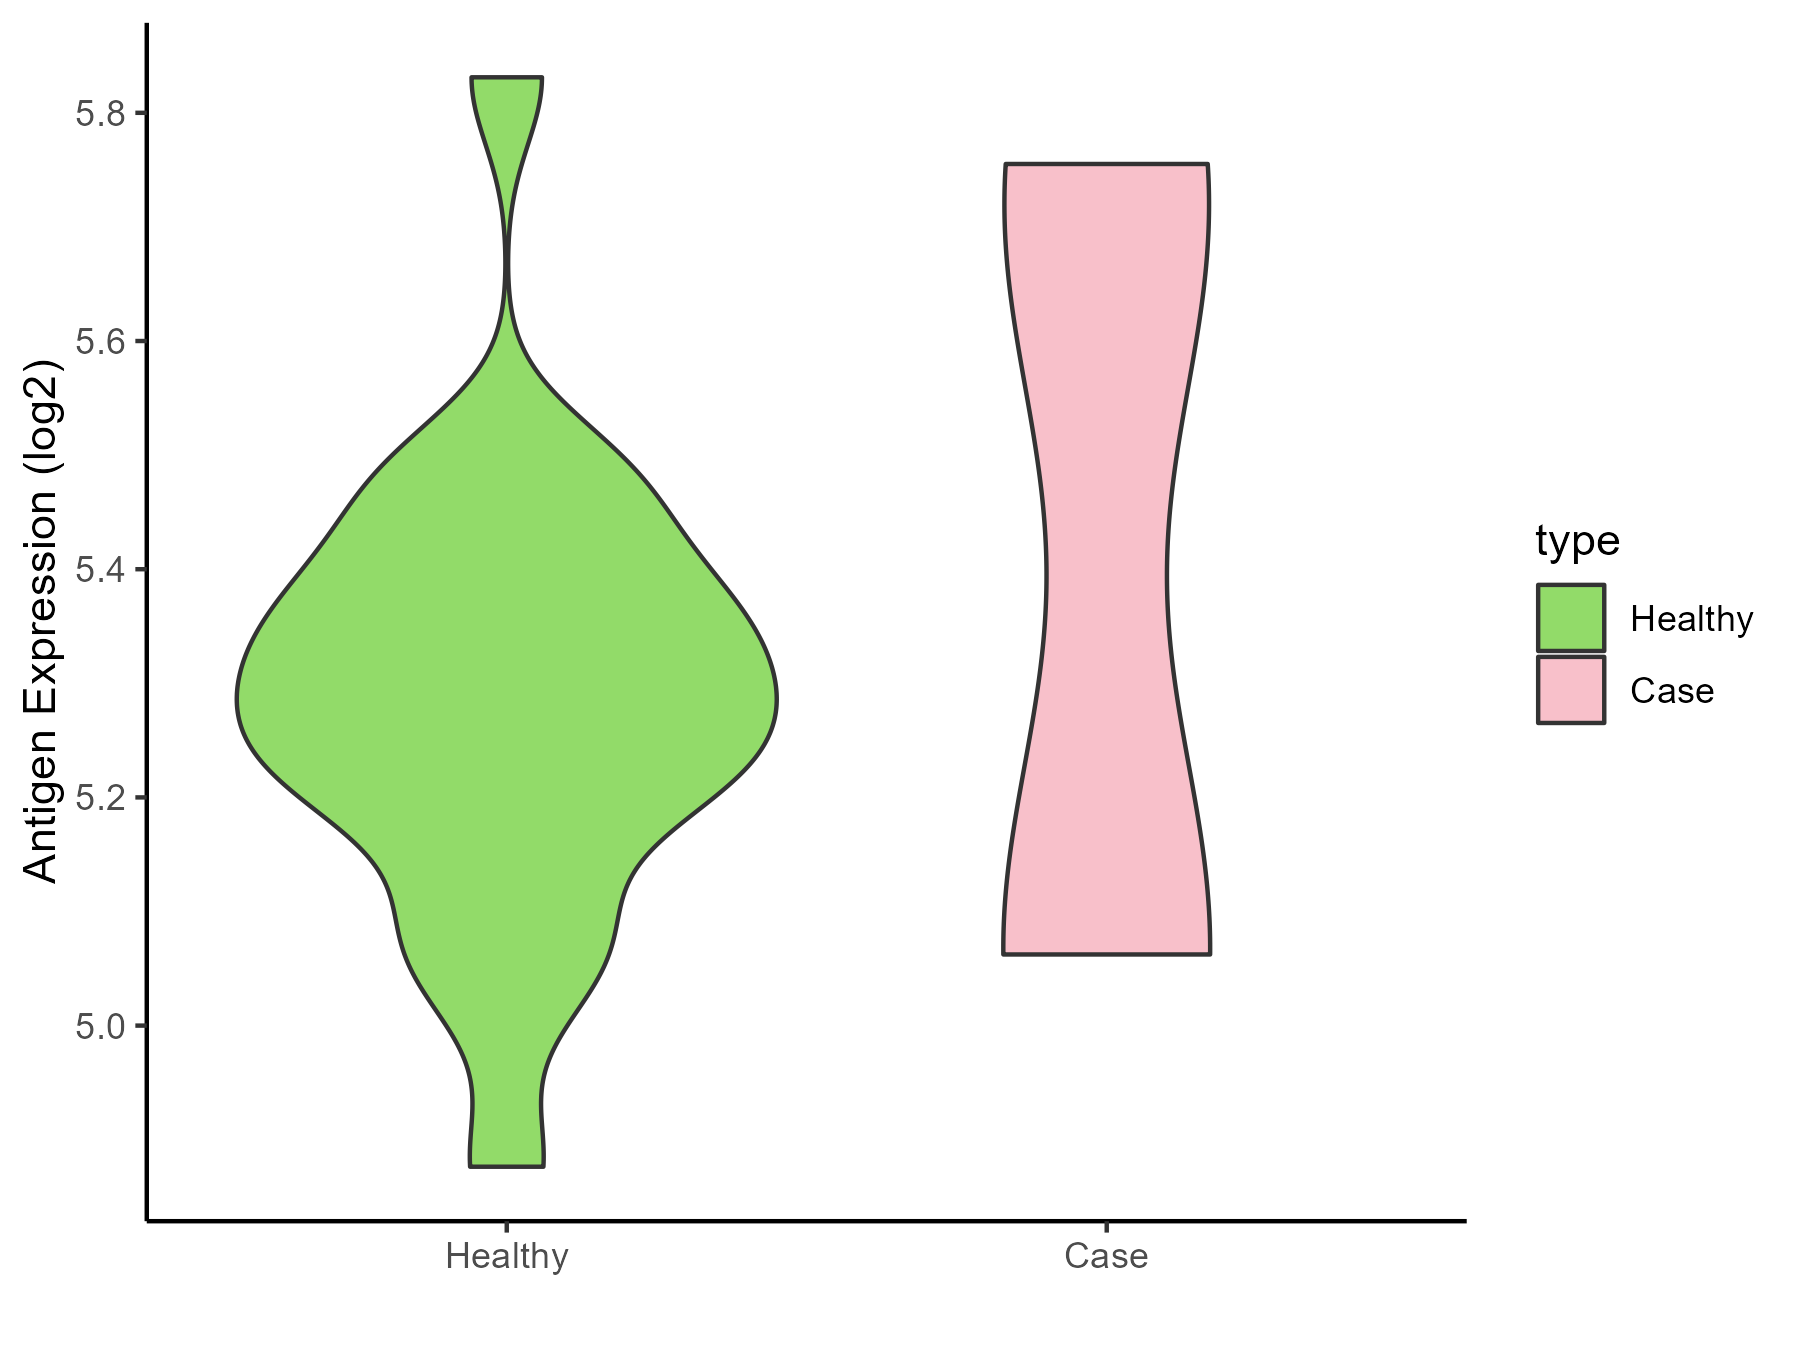
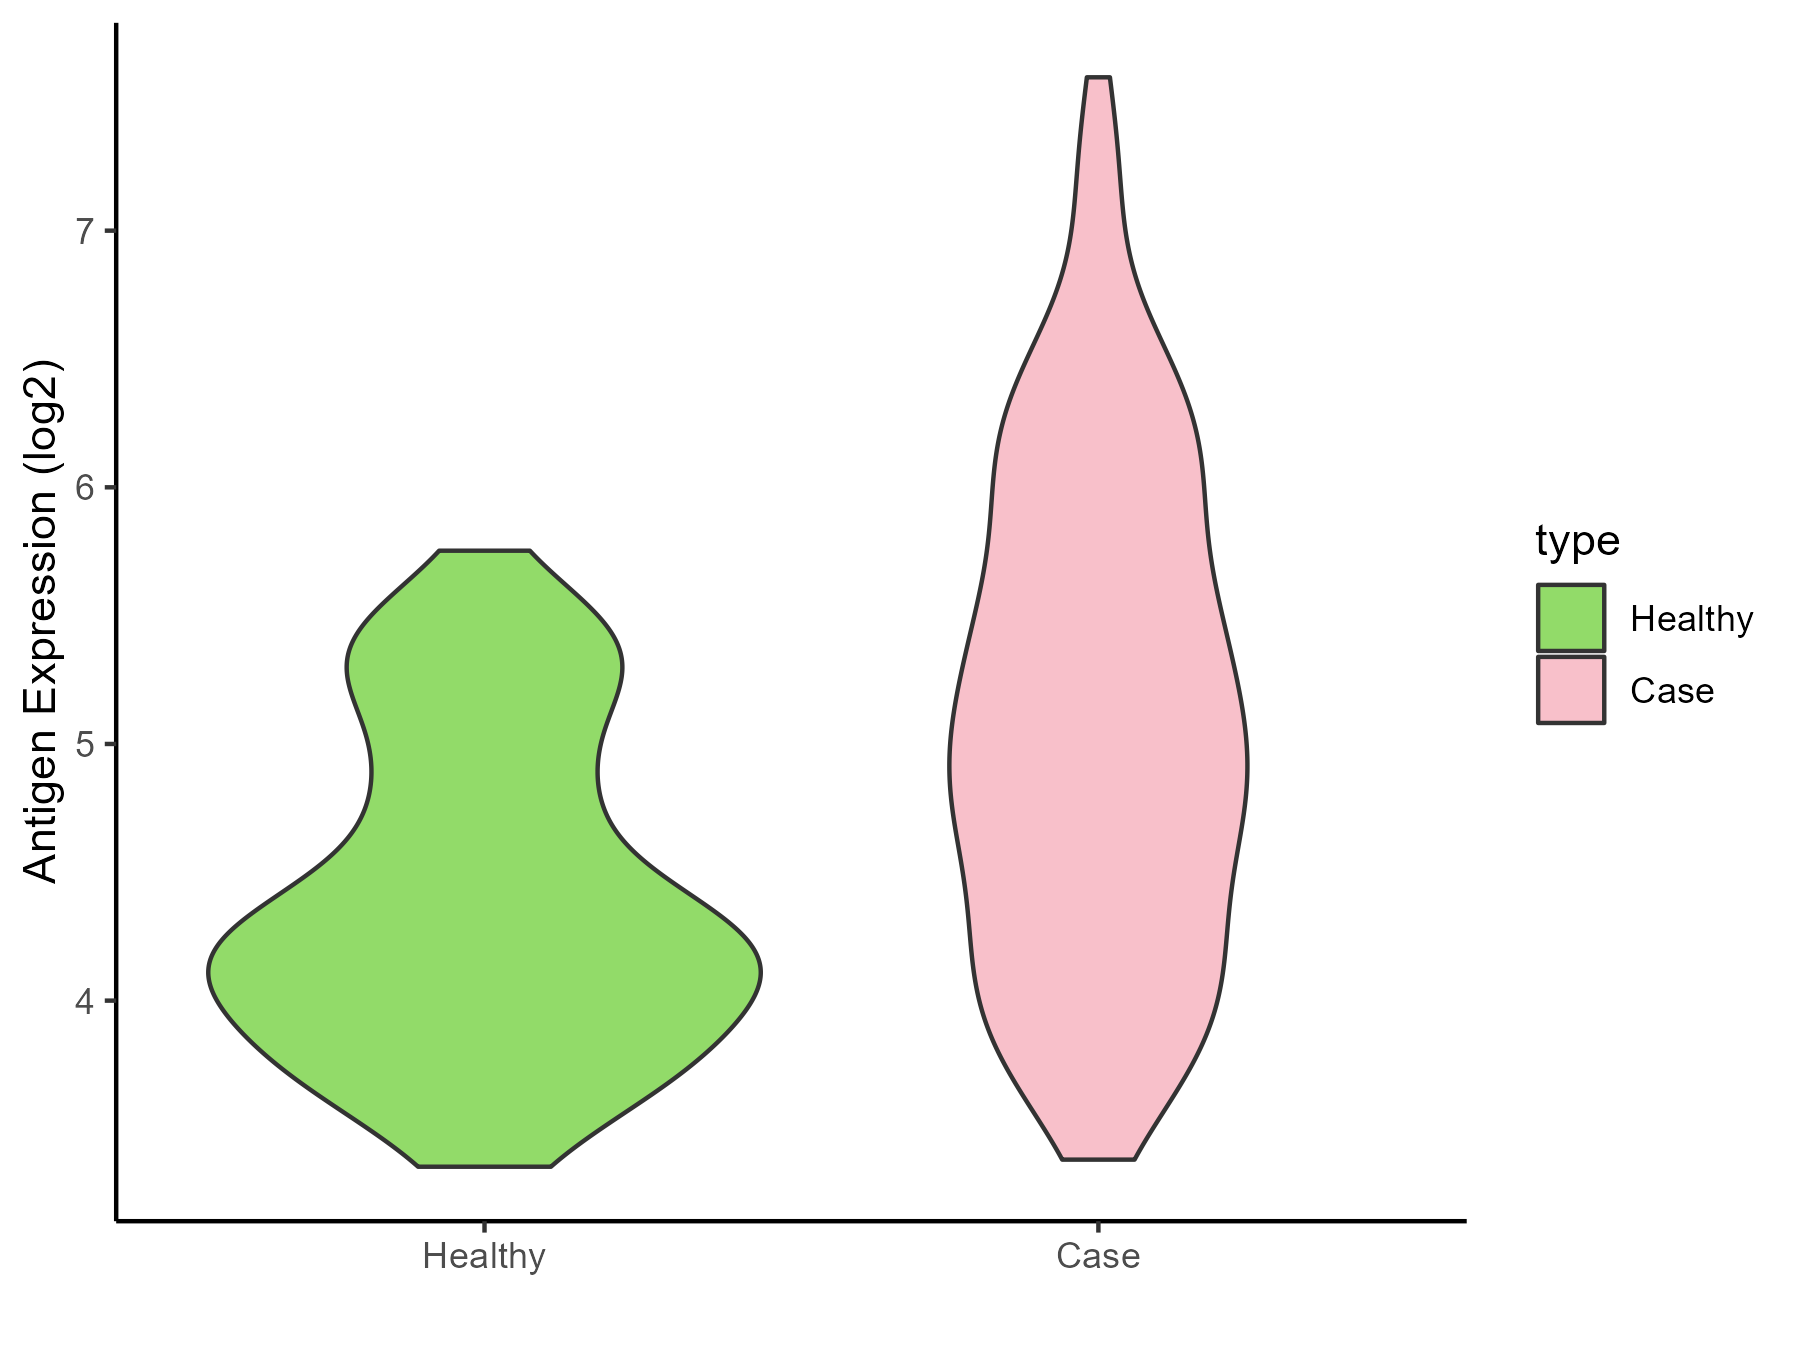
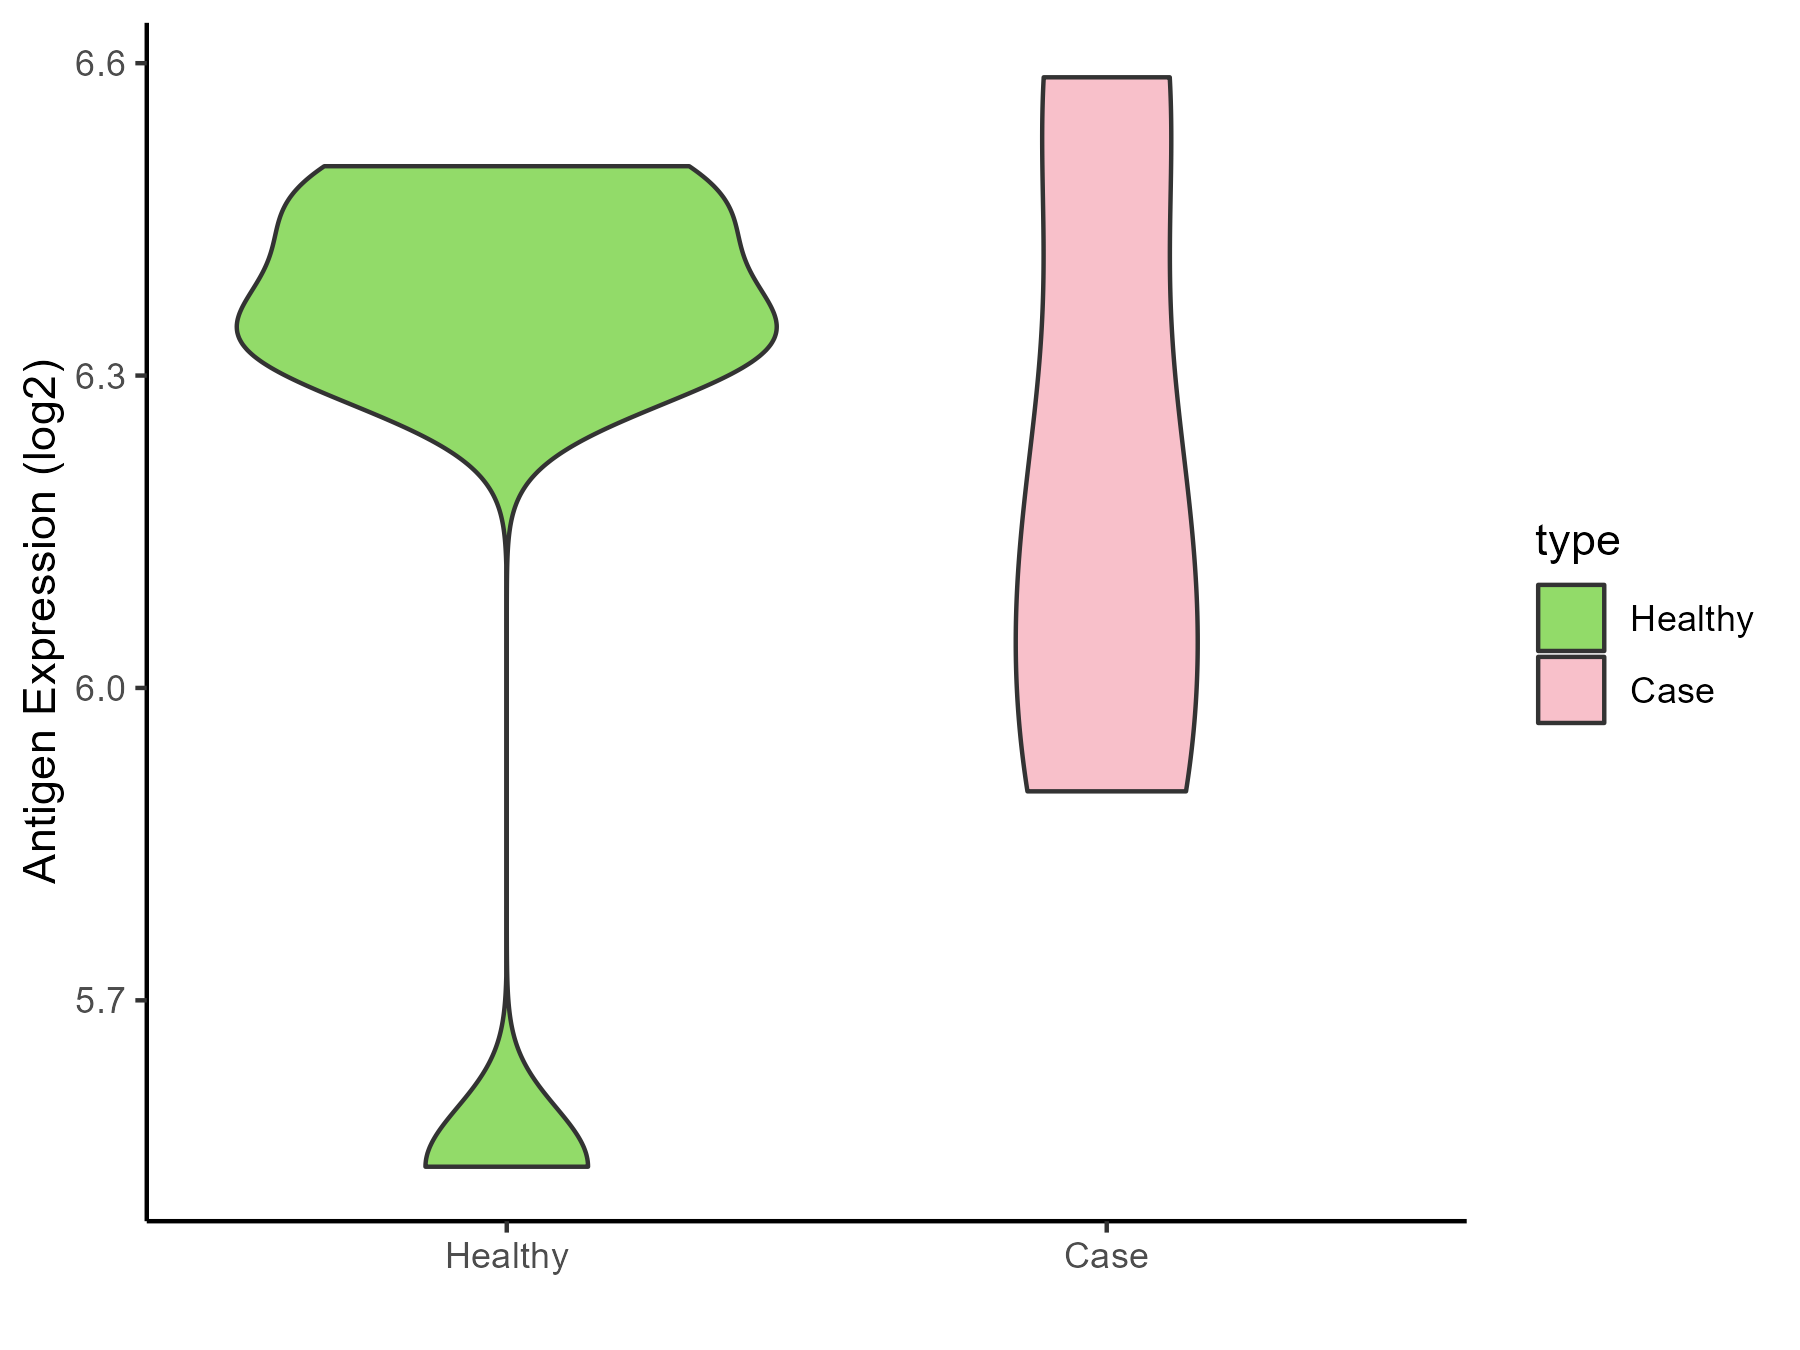
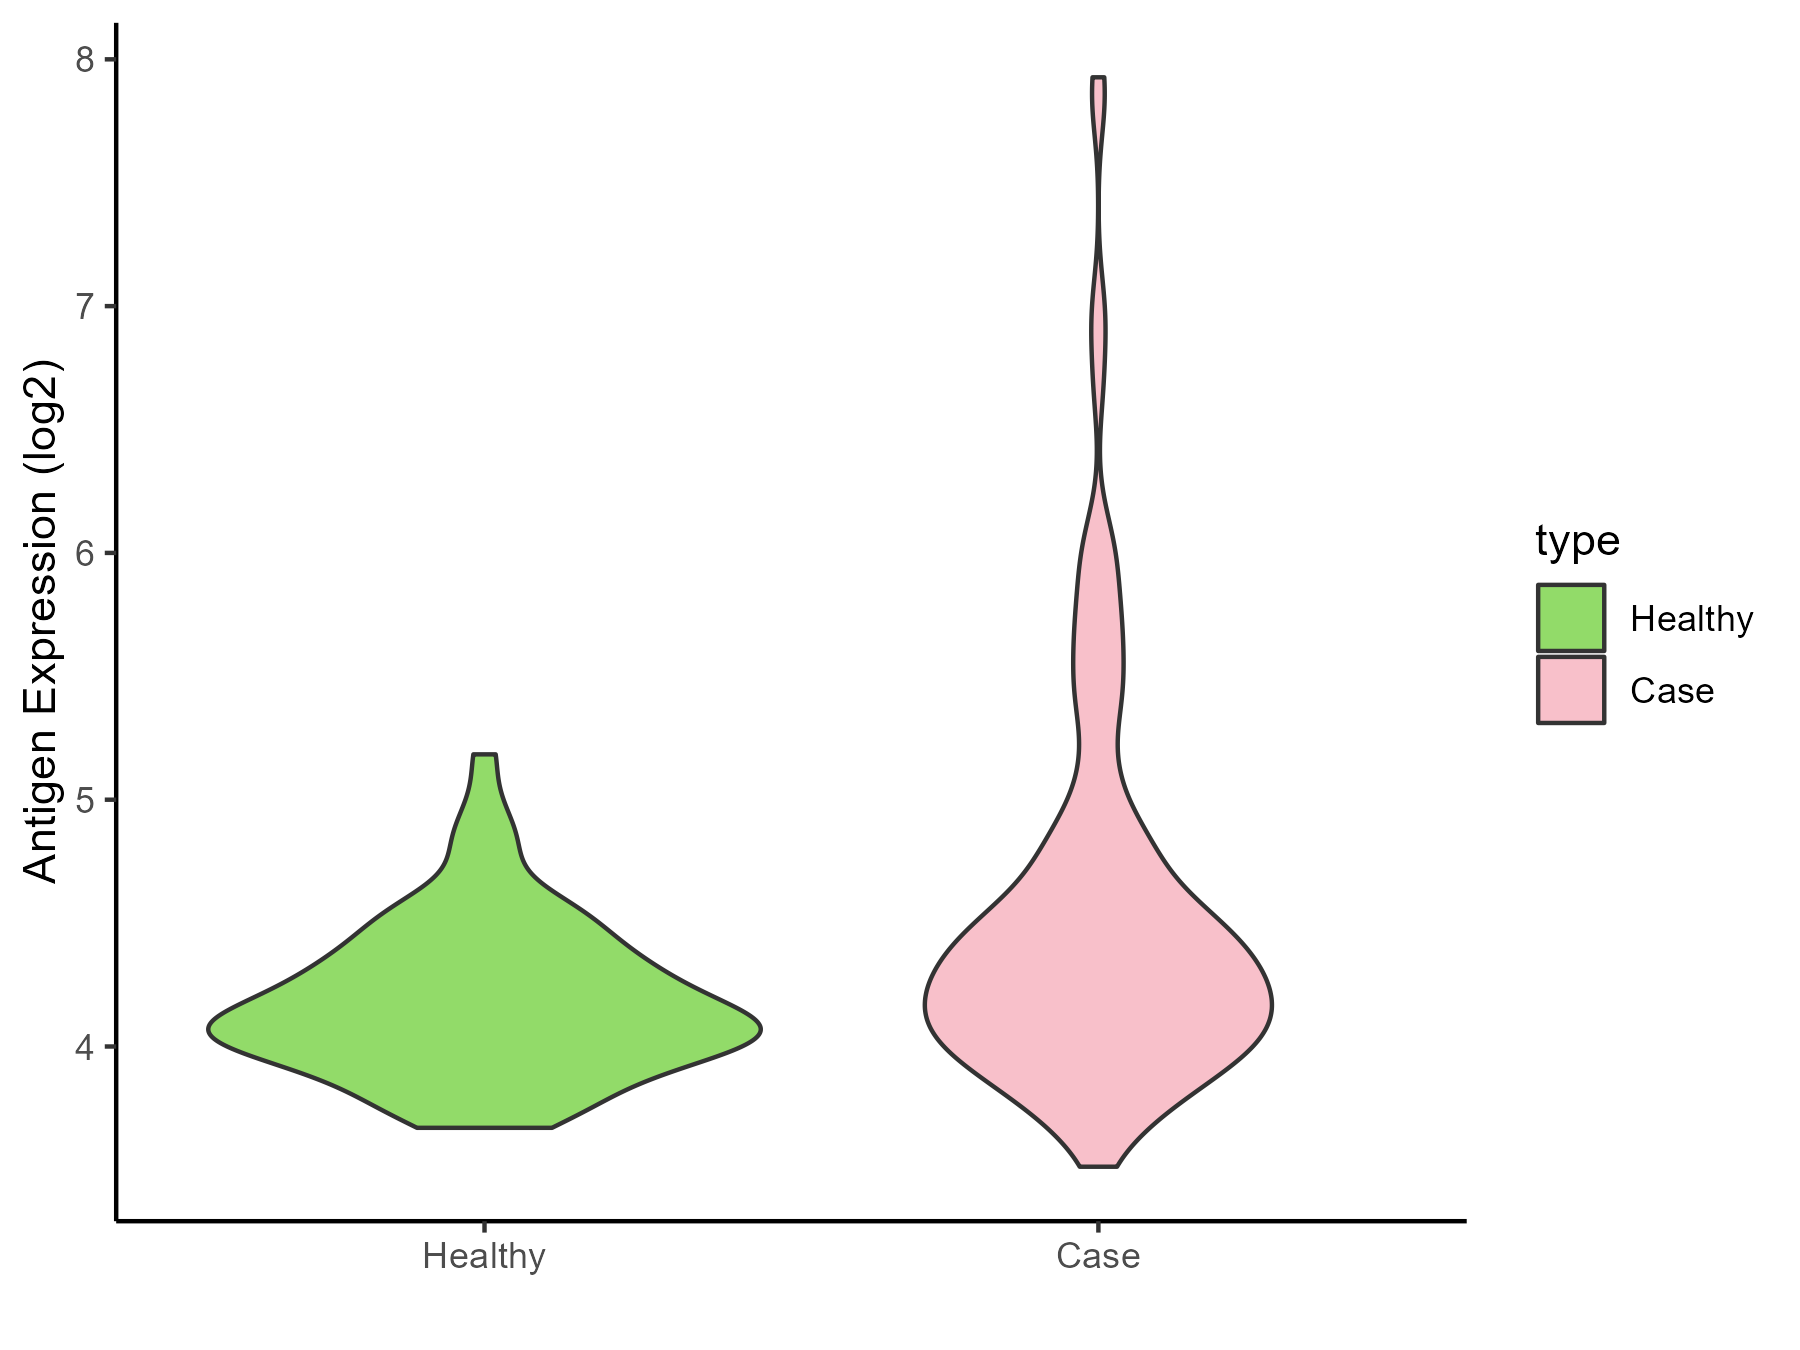
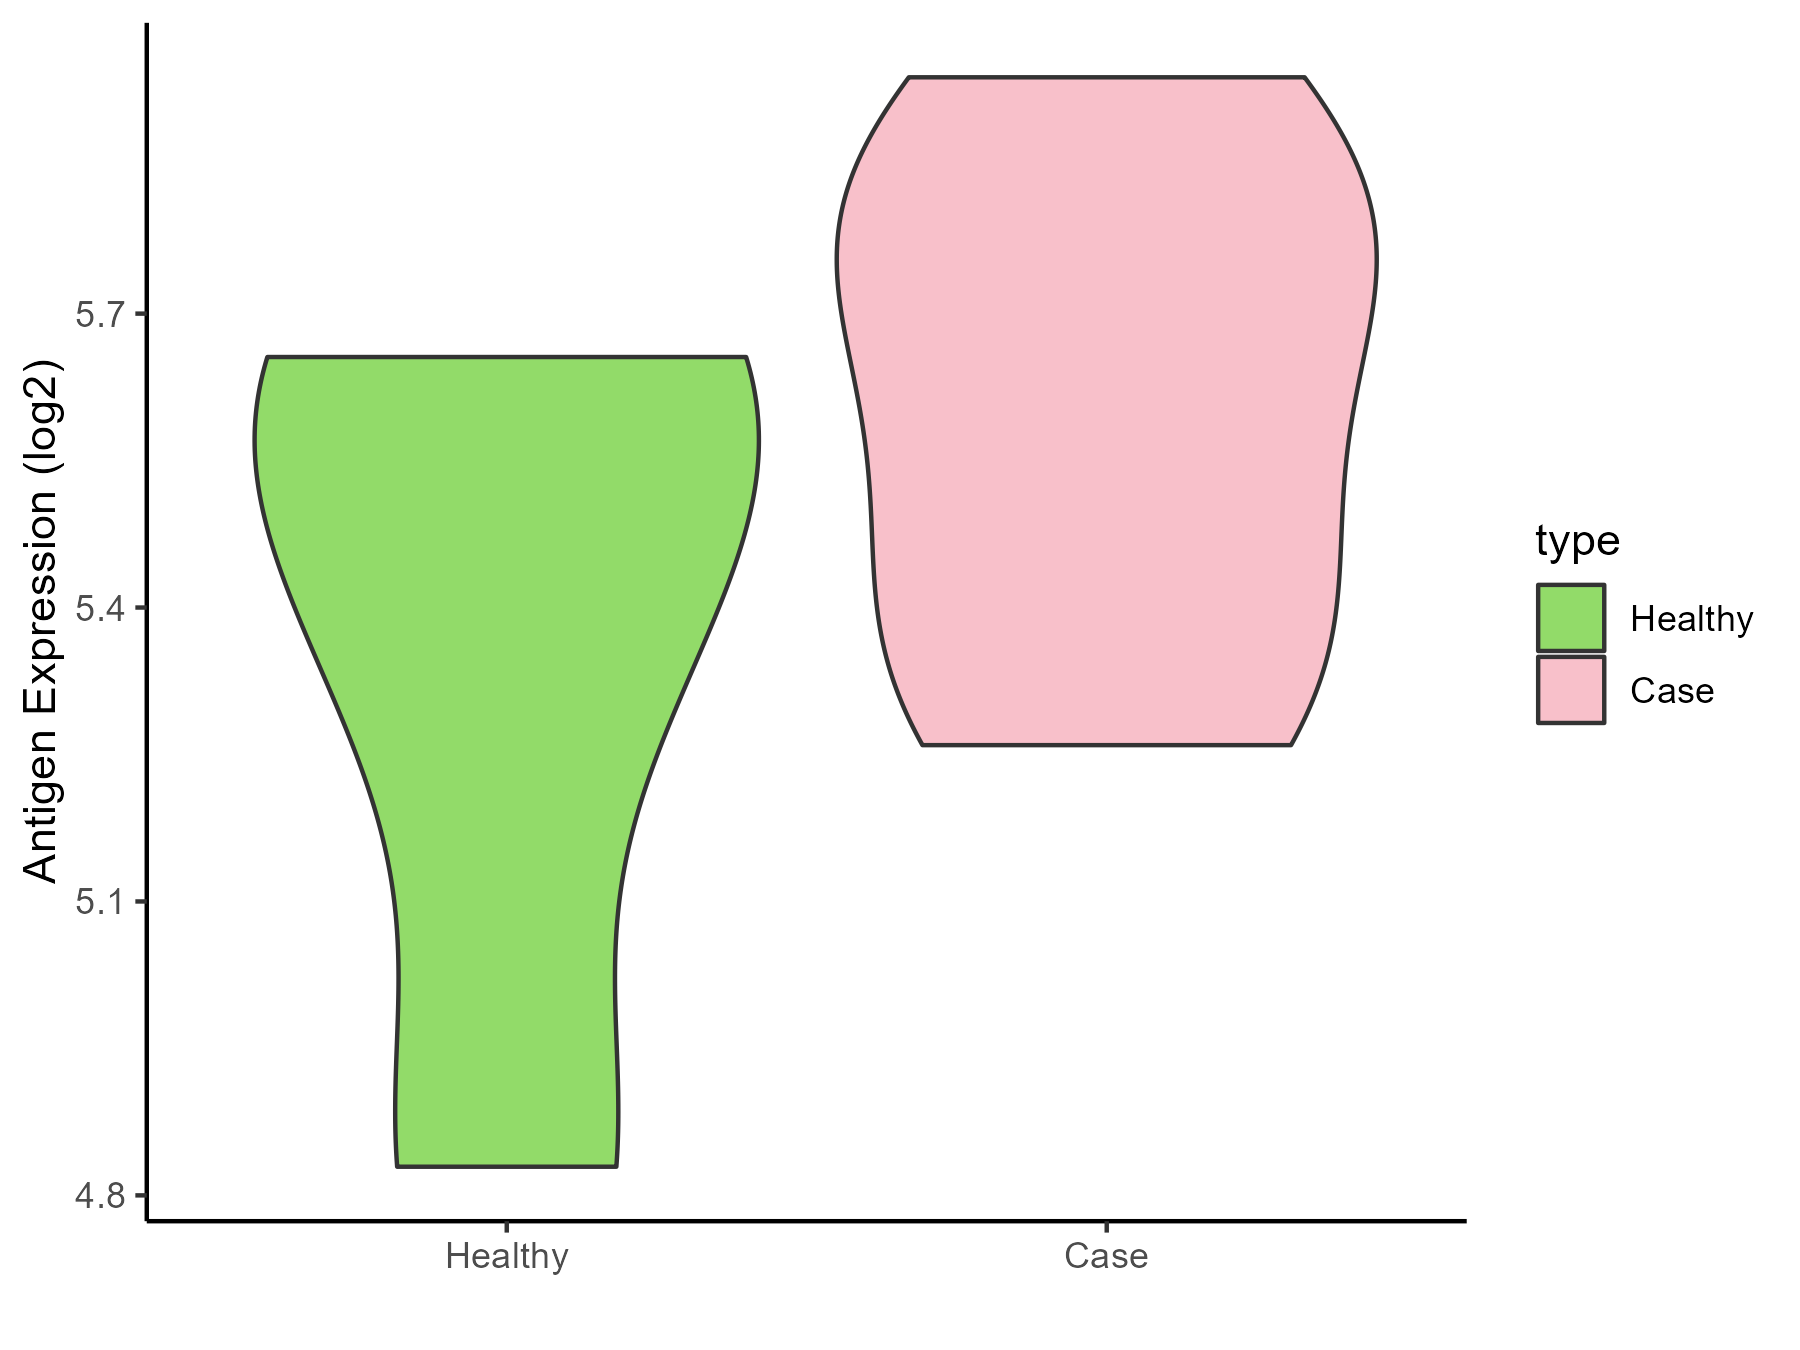
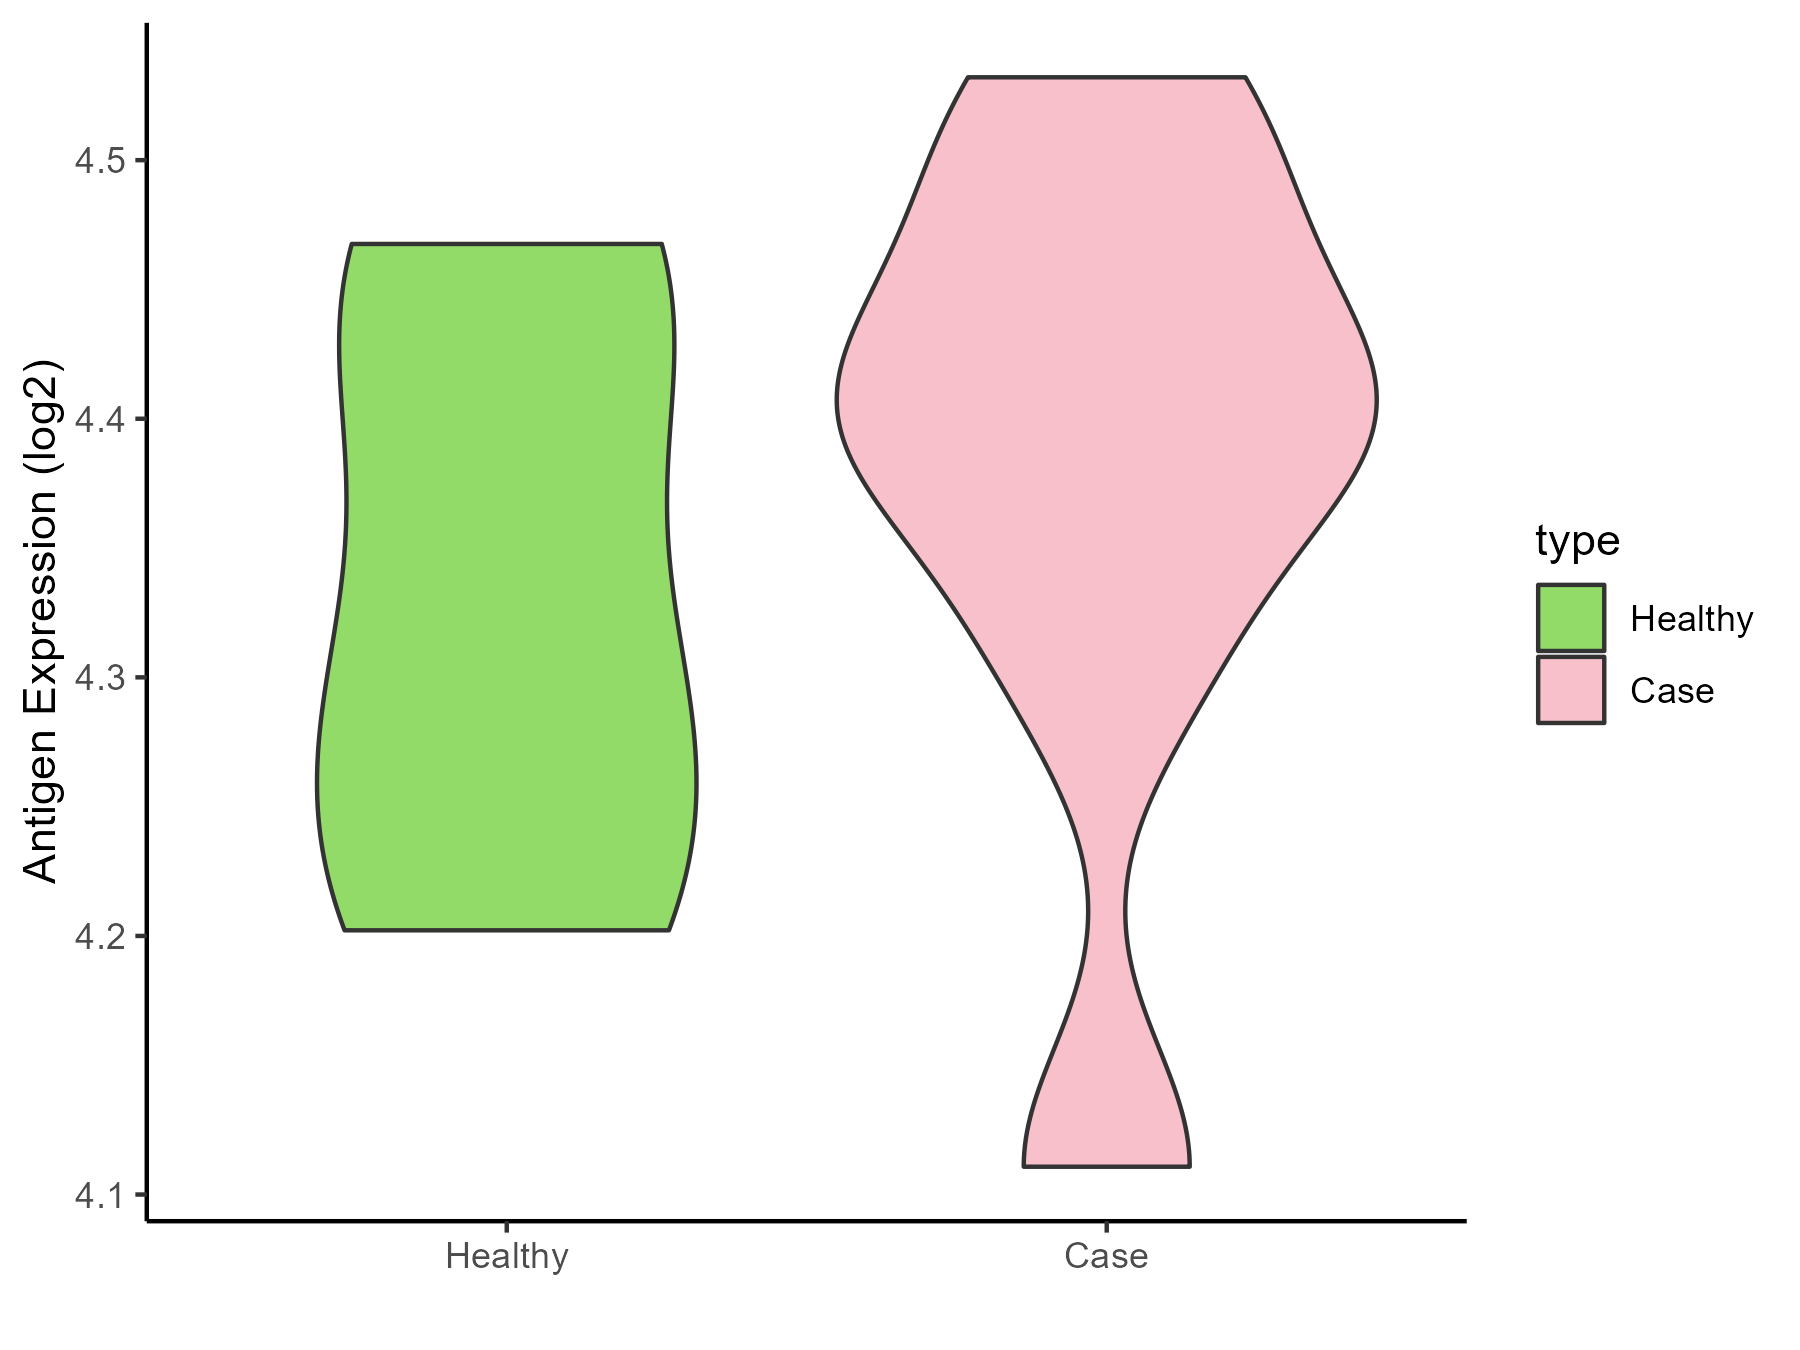
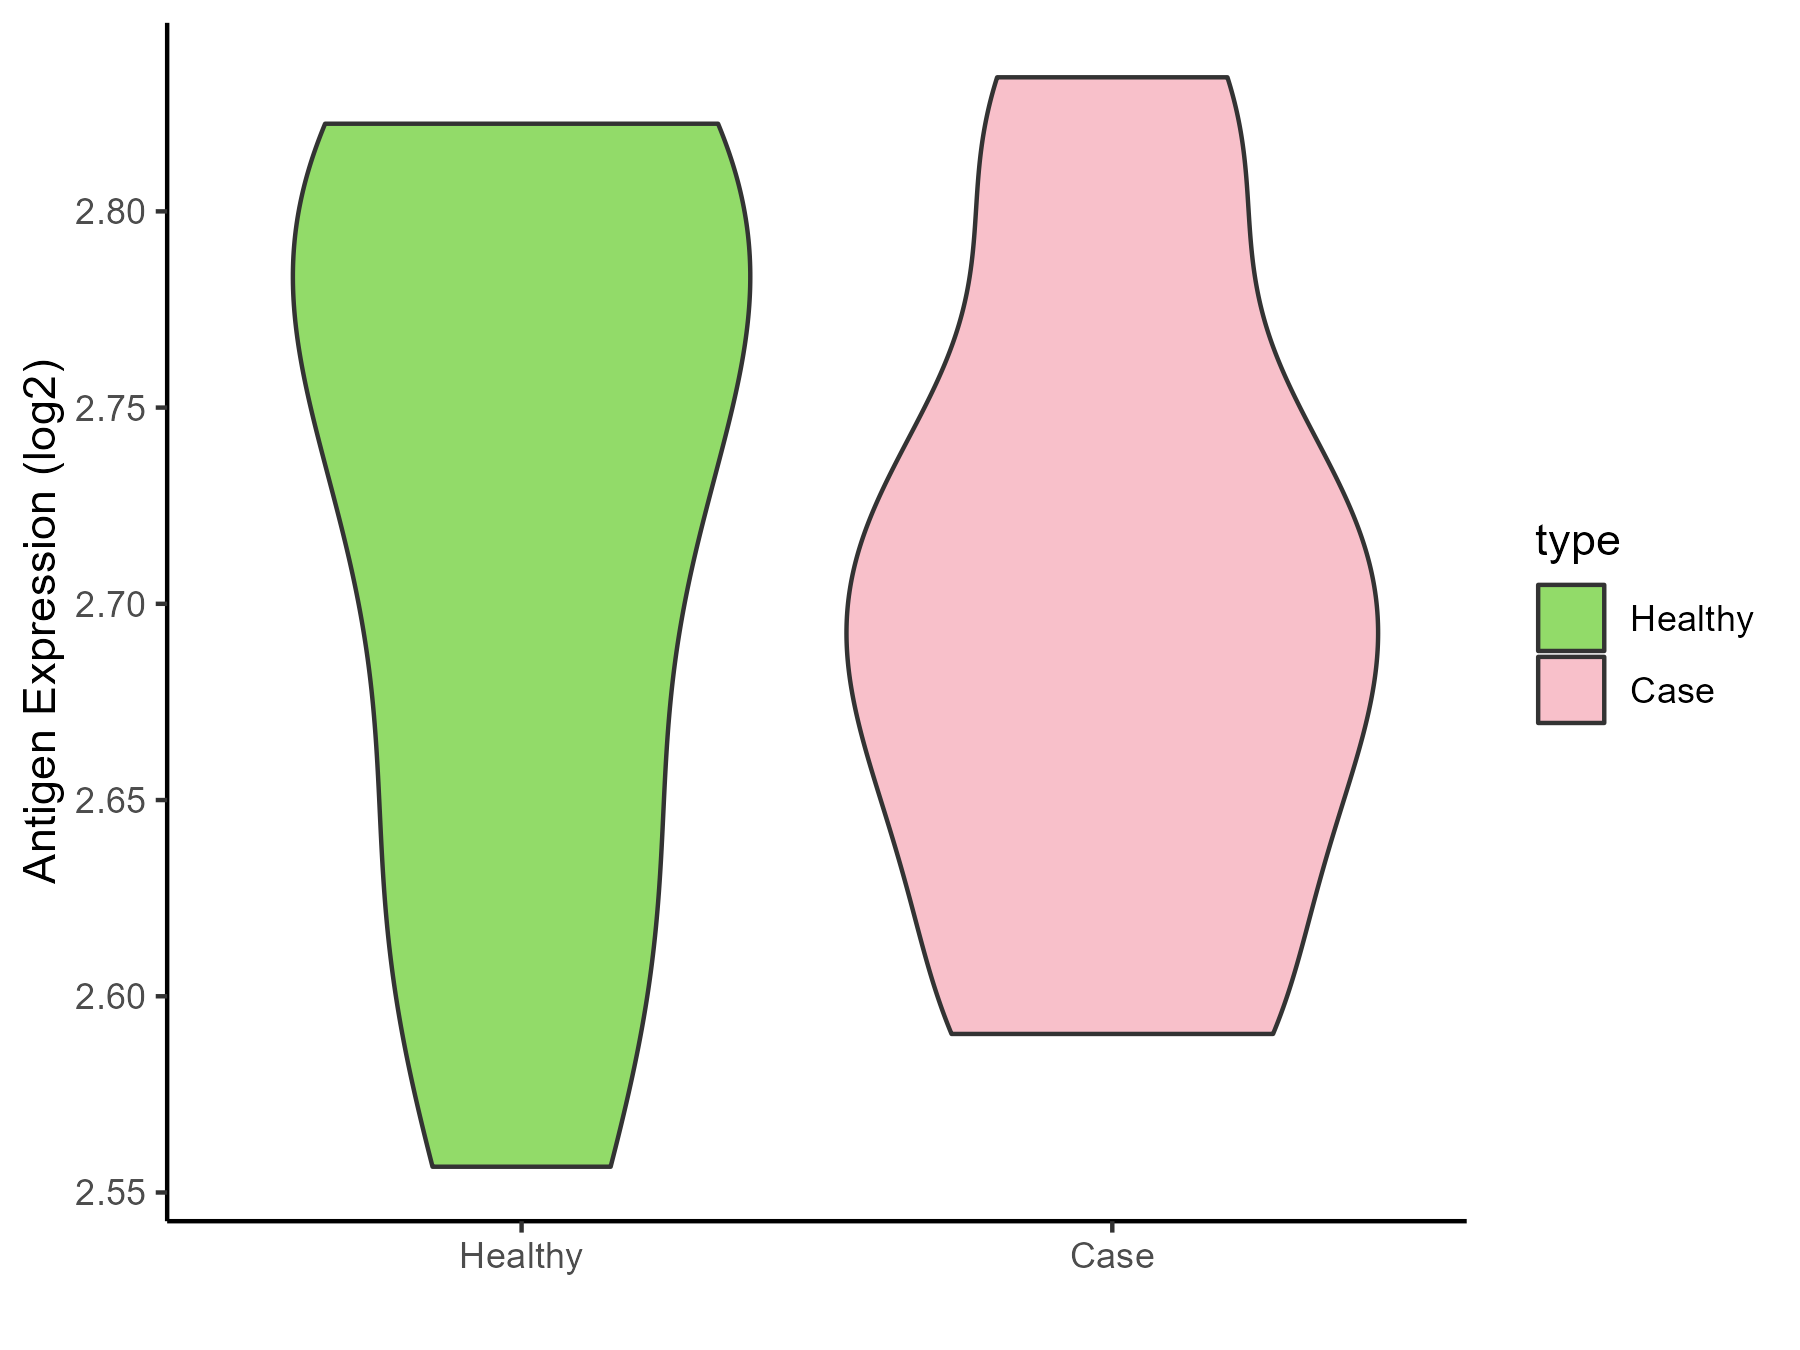
White matter |
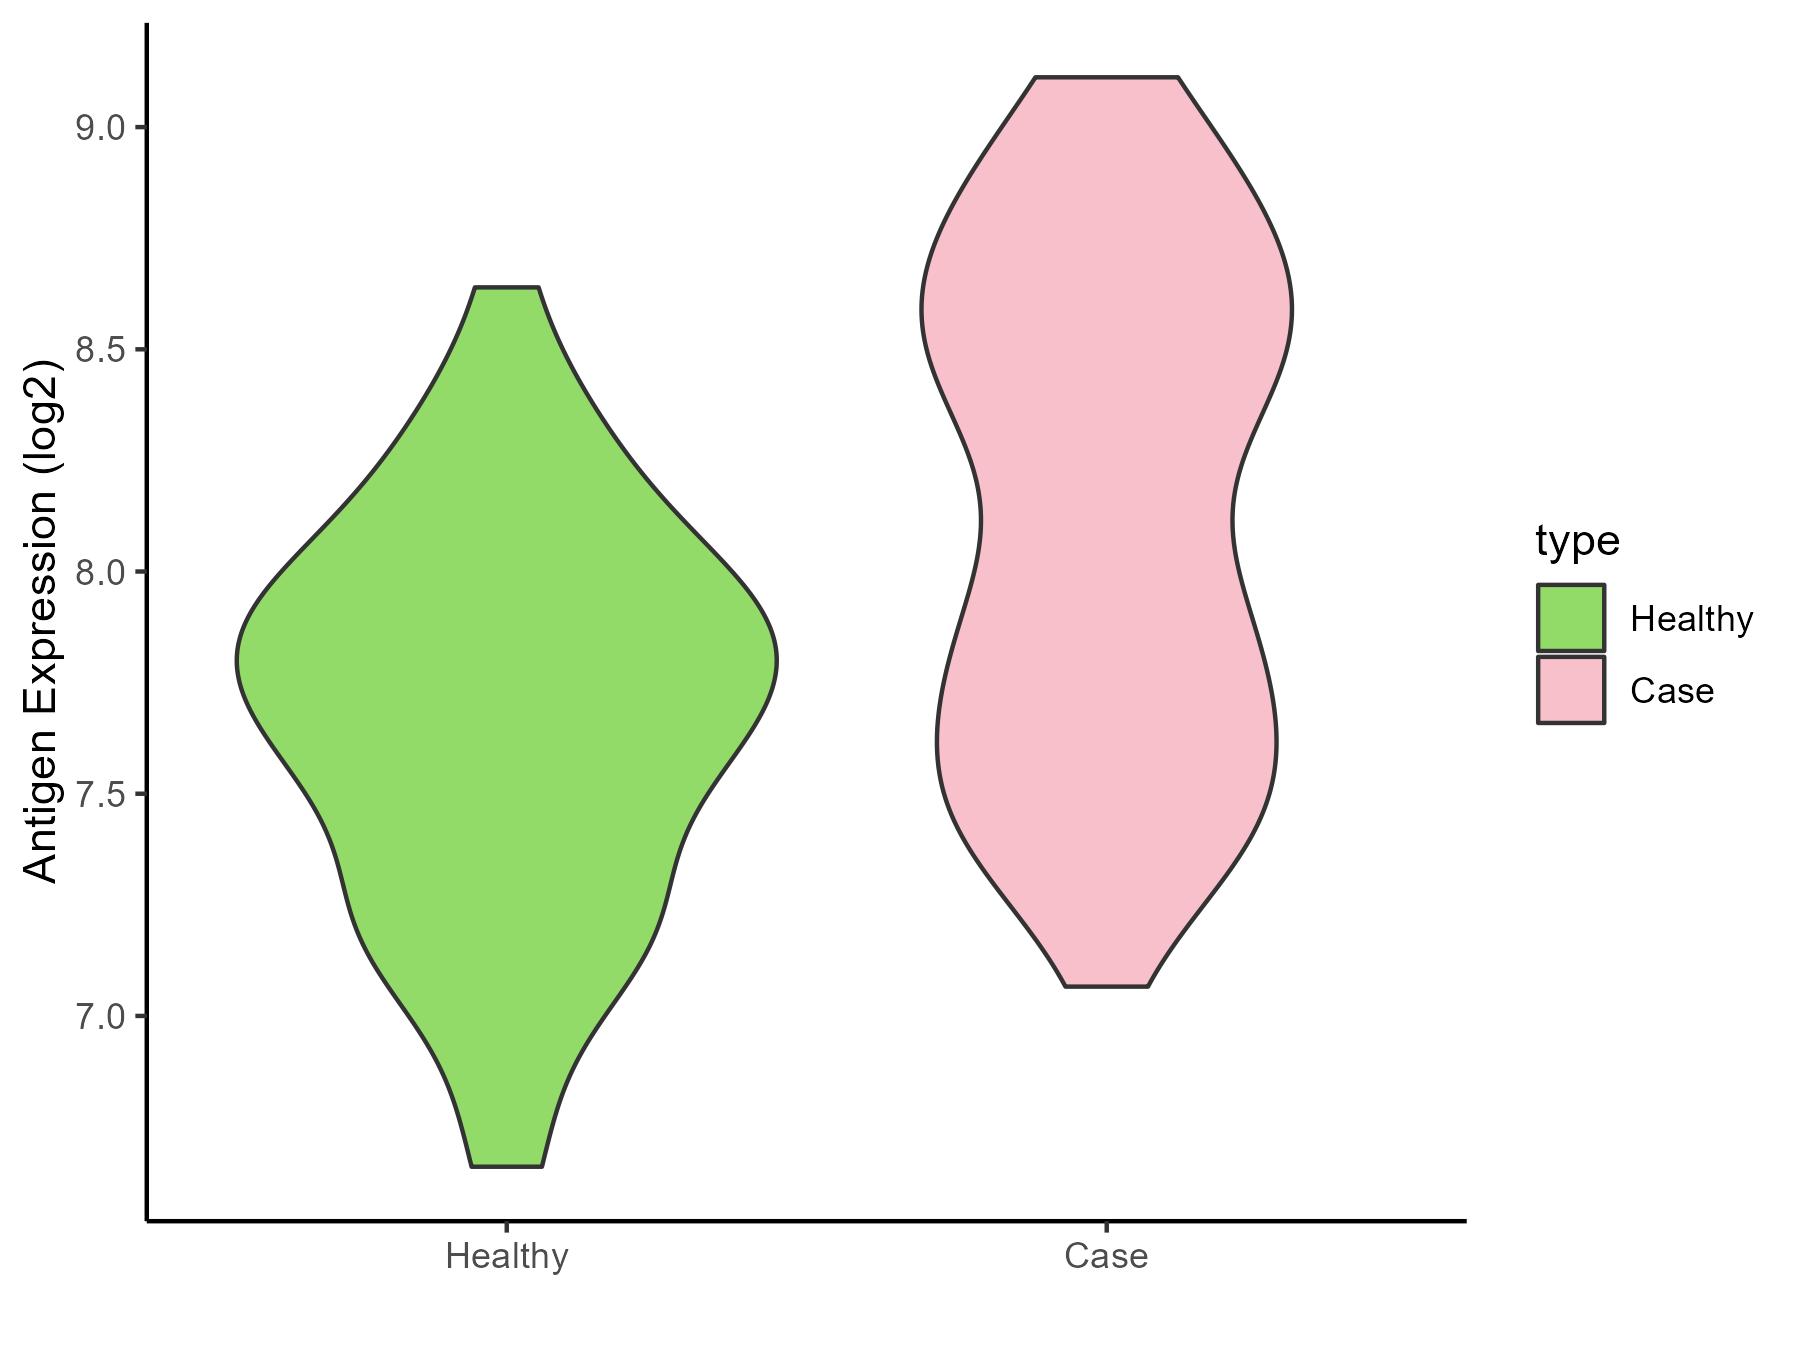
| The Specific Disease |
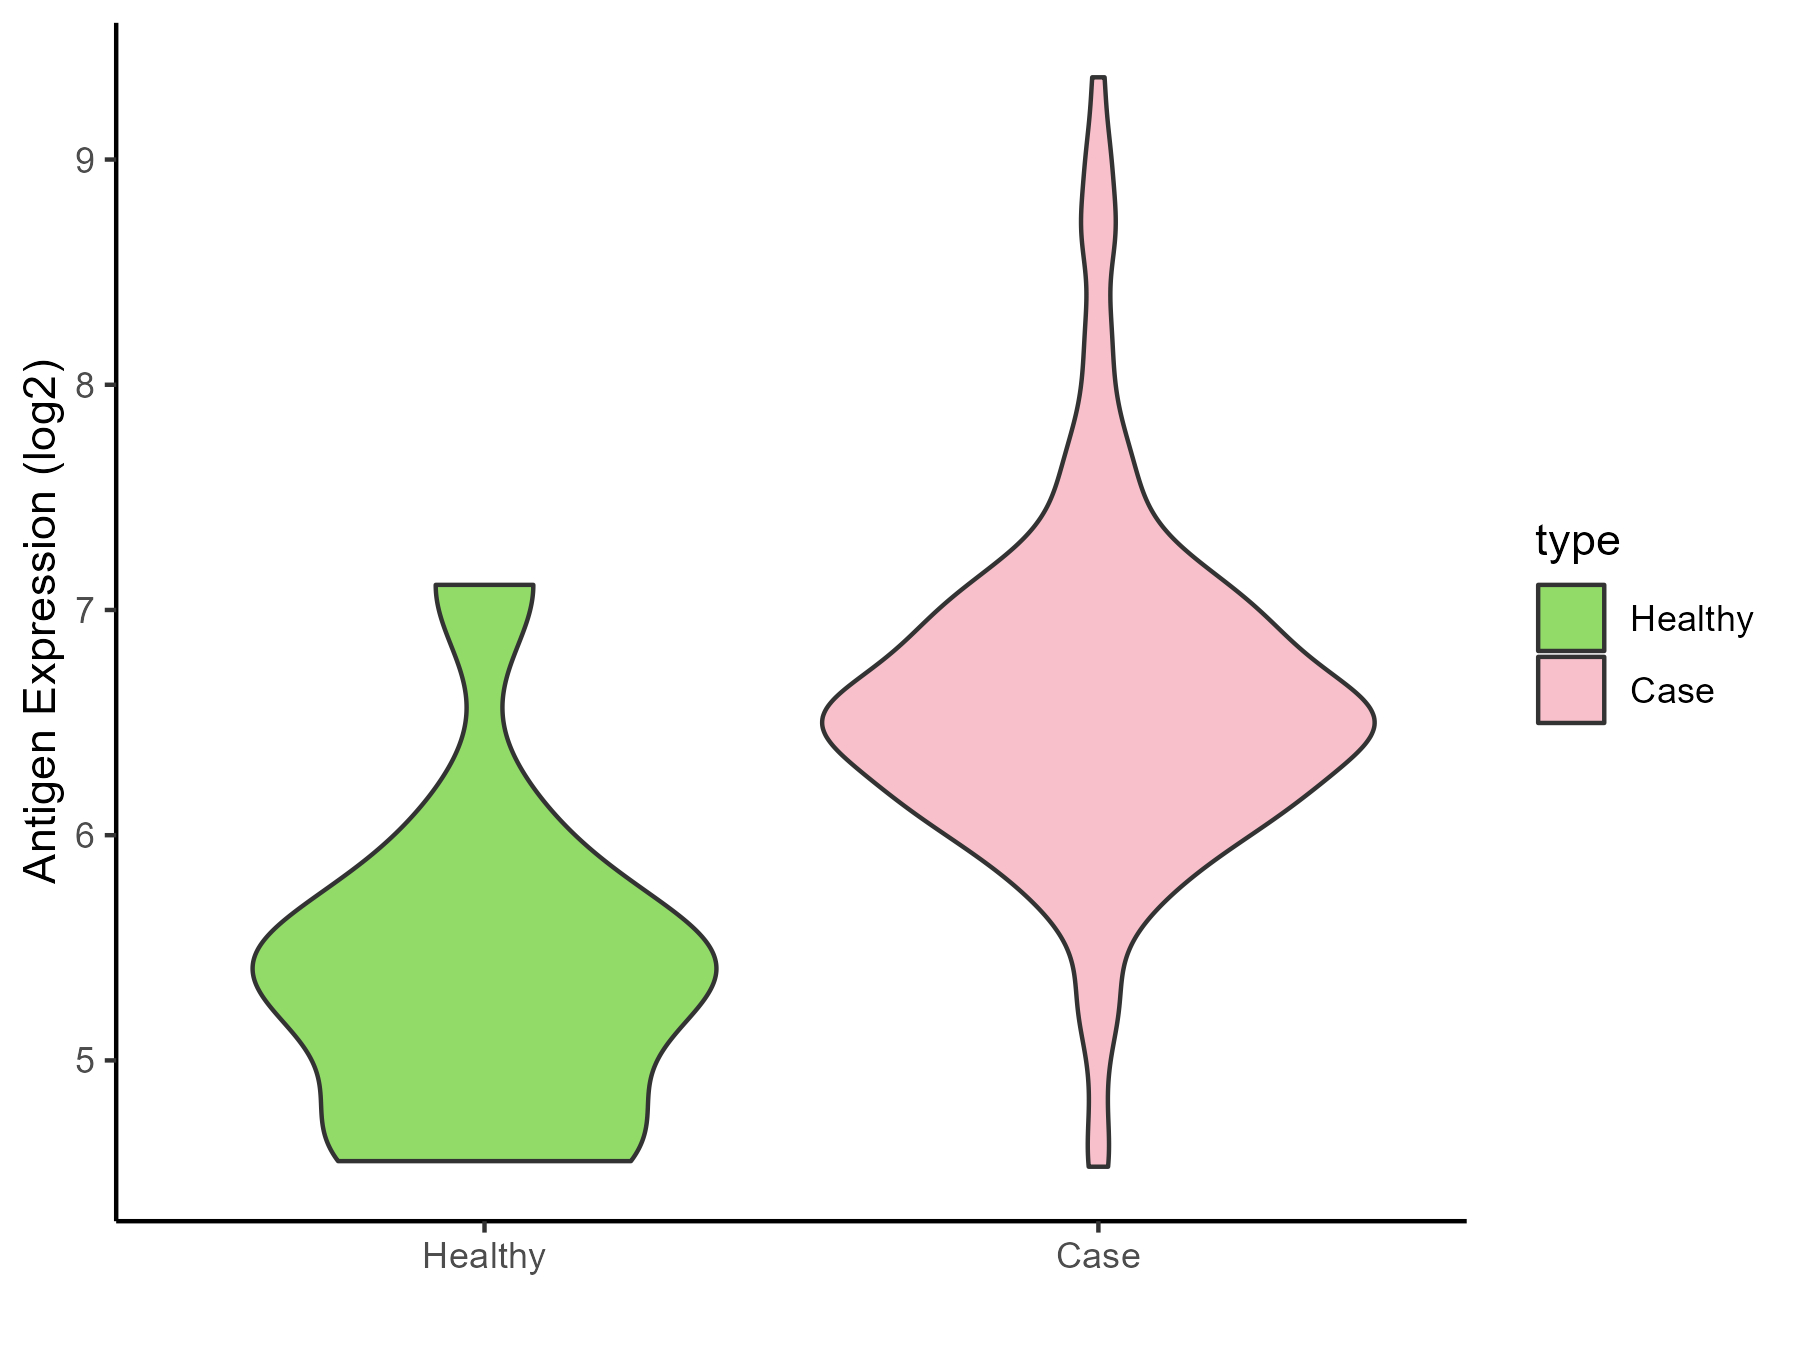
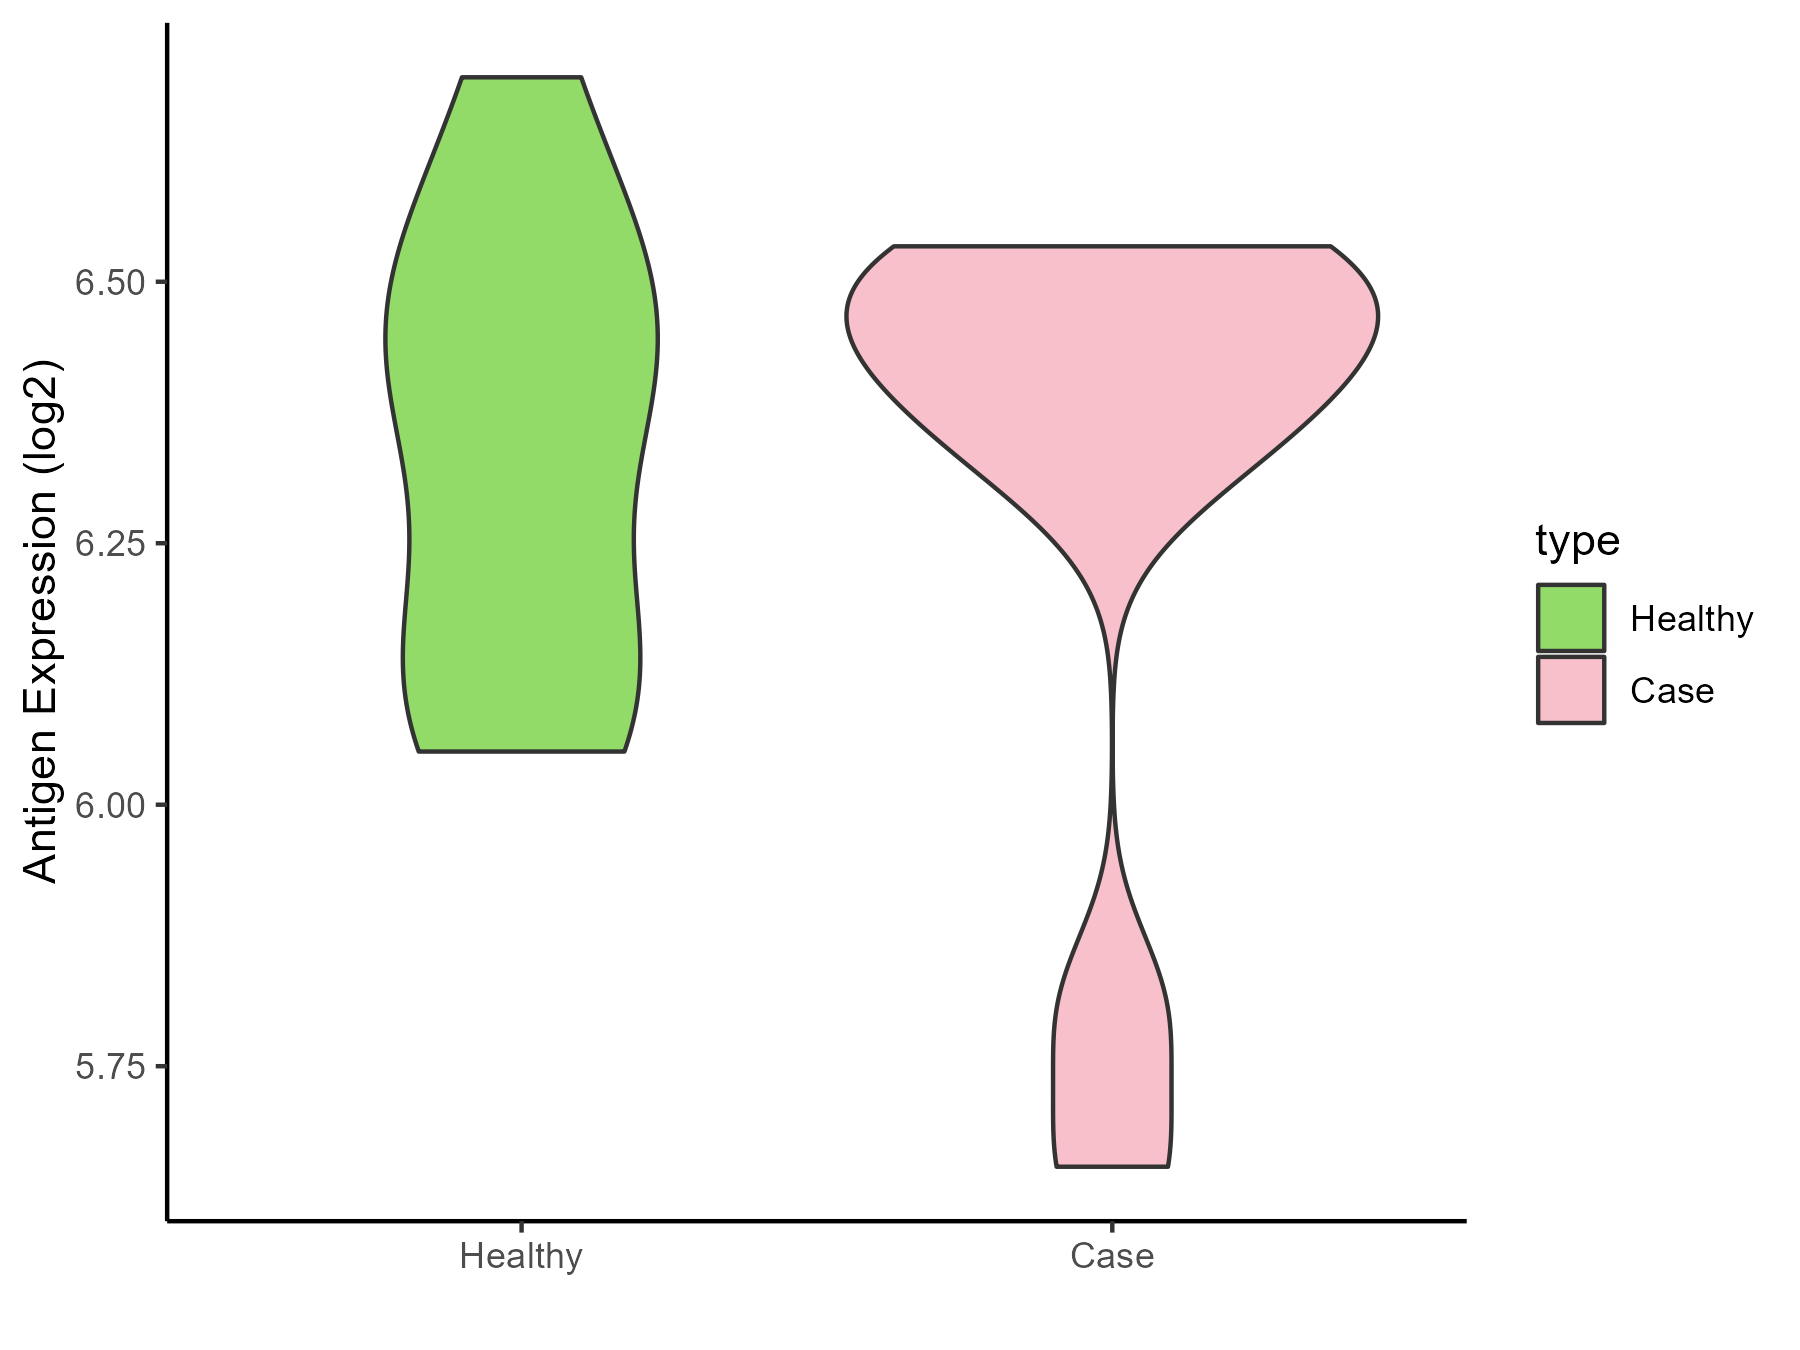
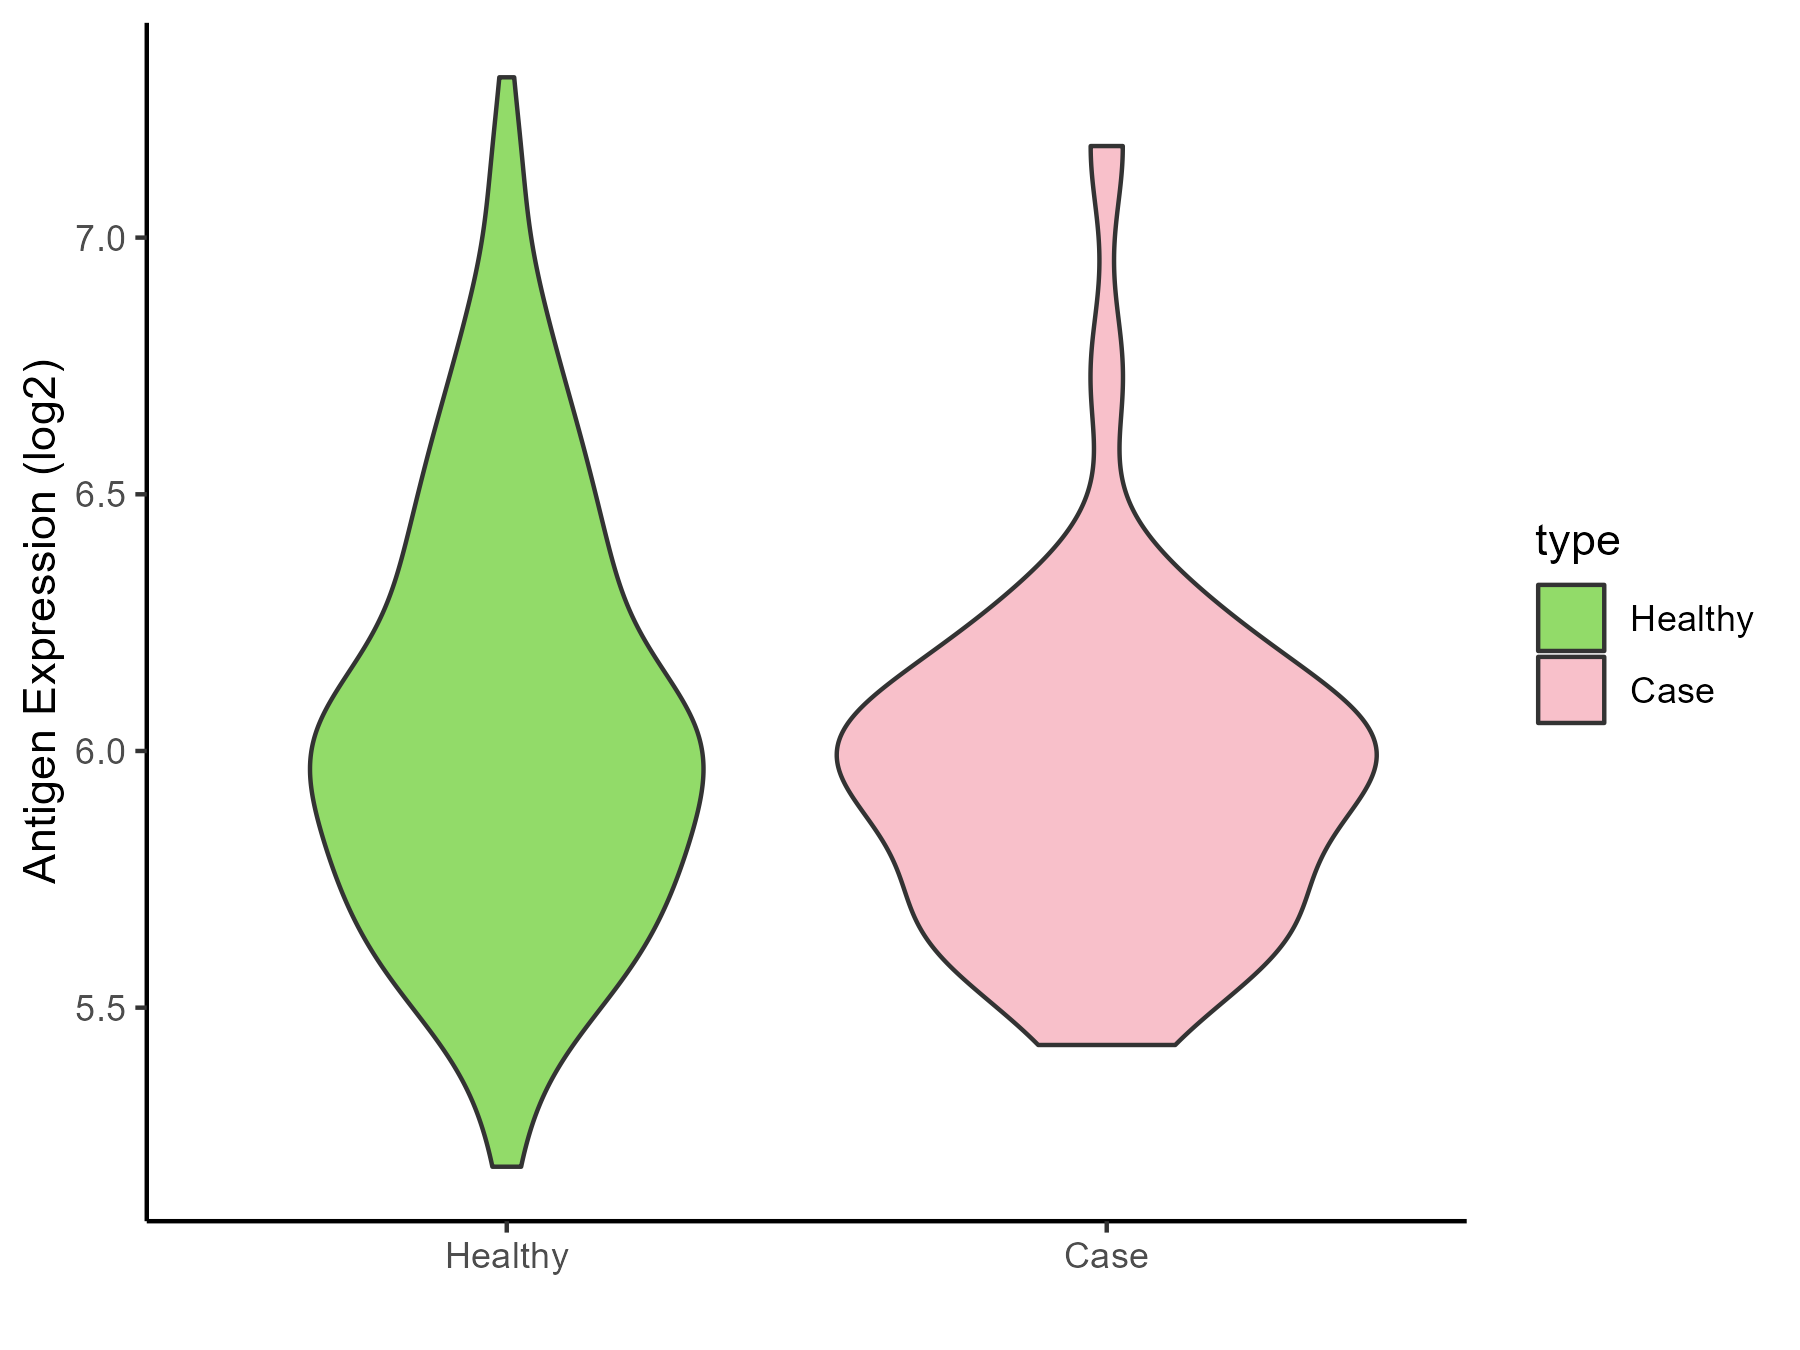
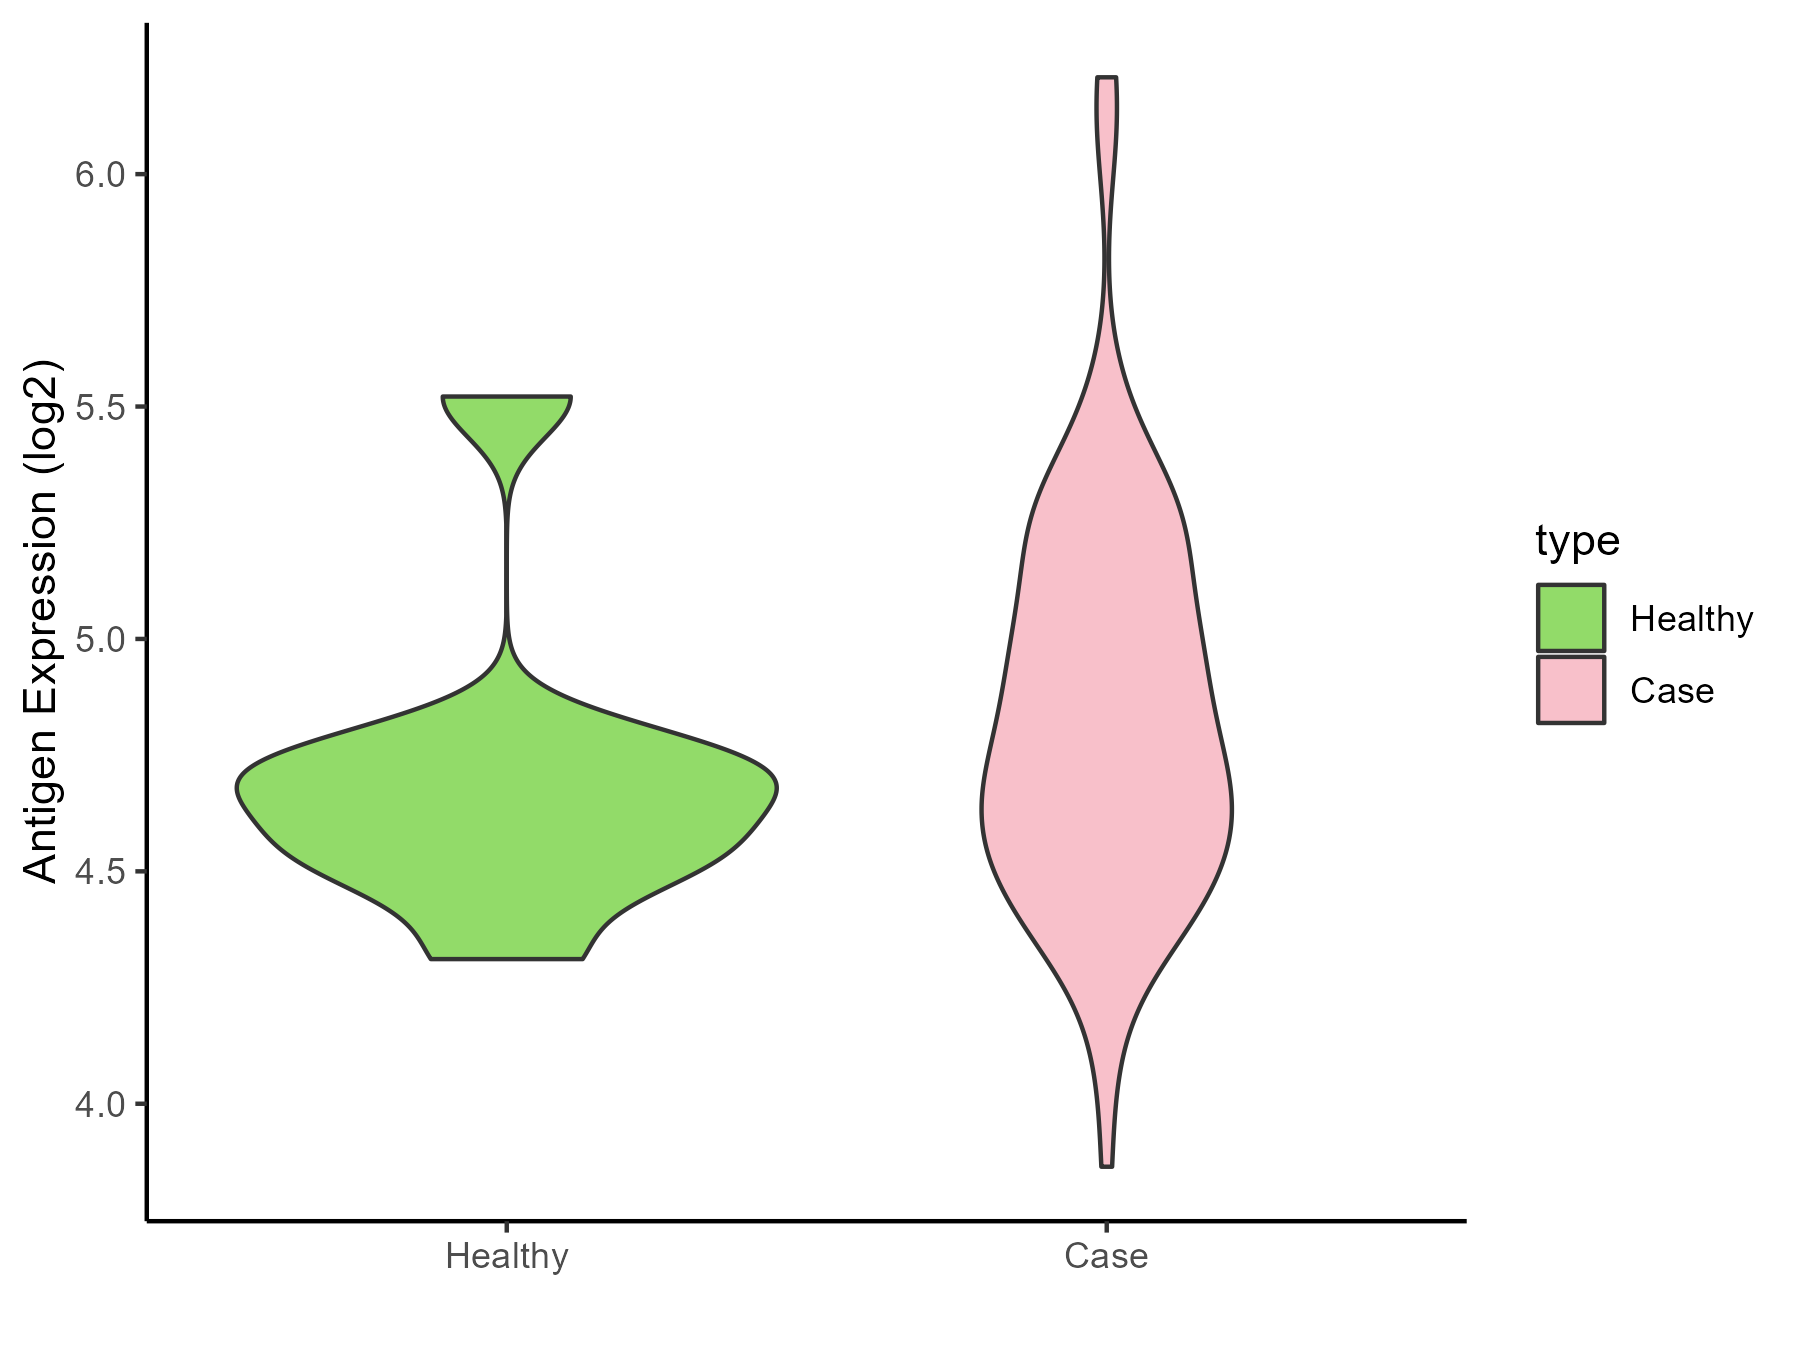
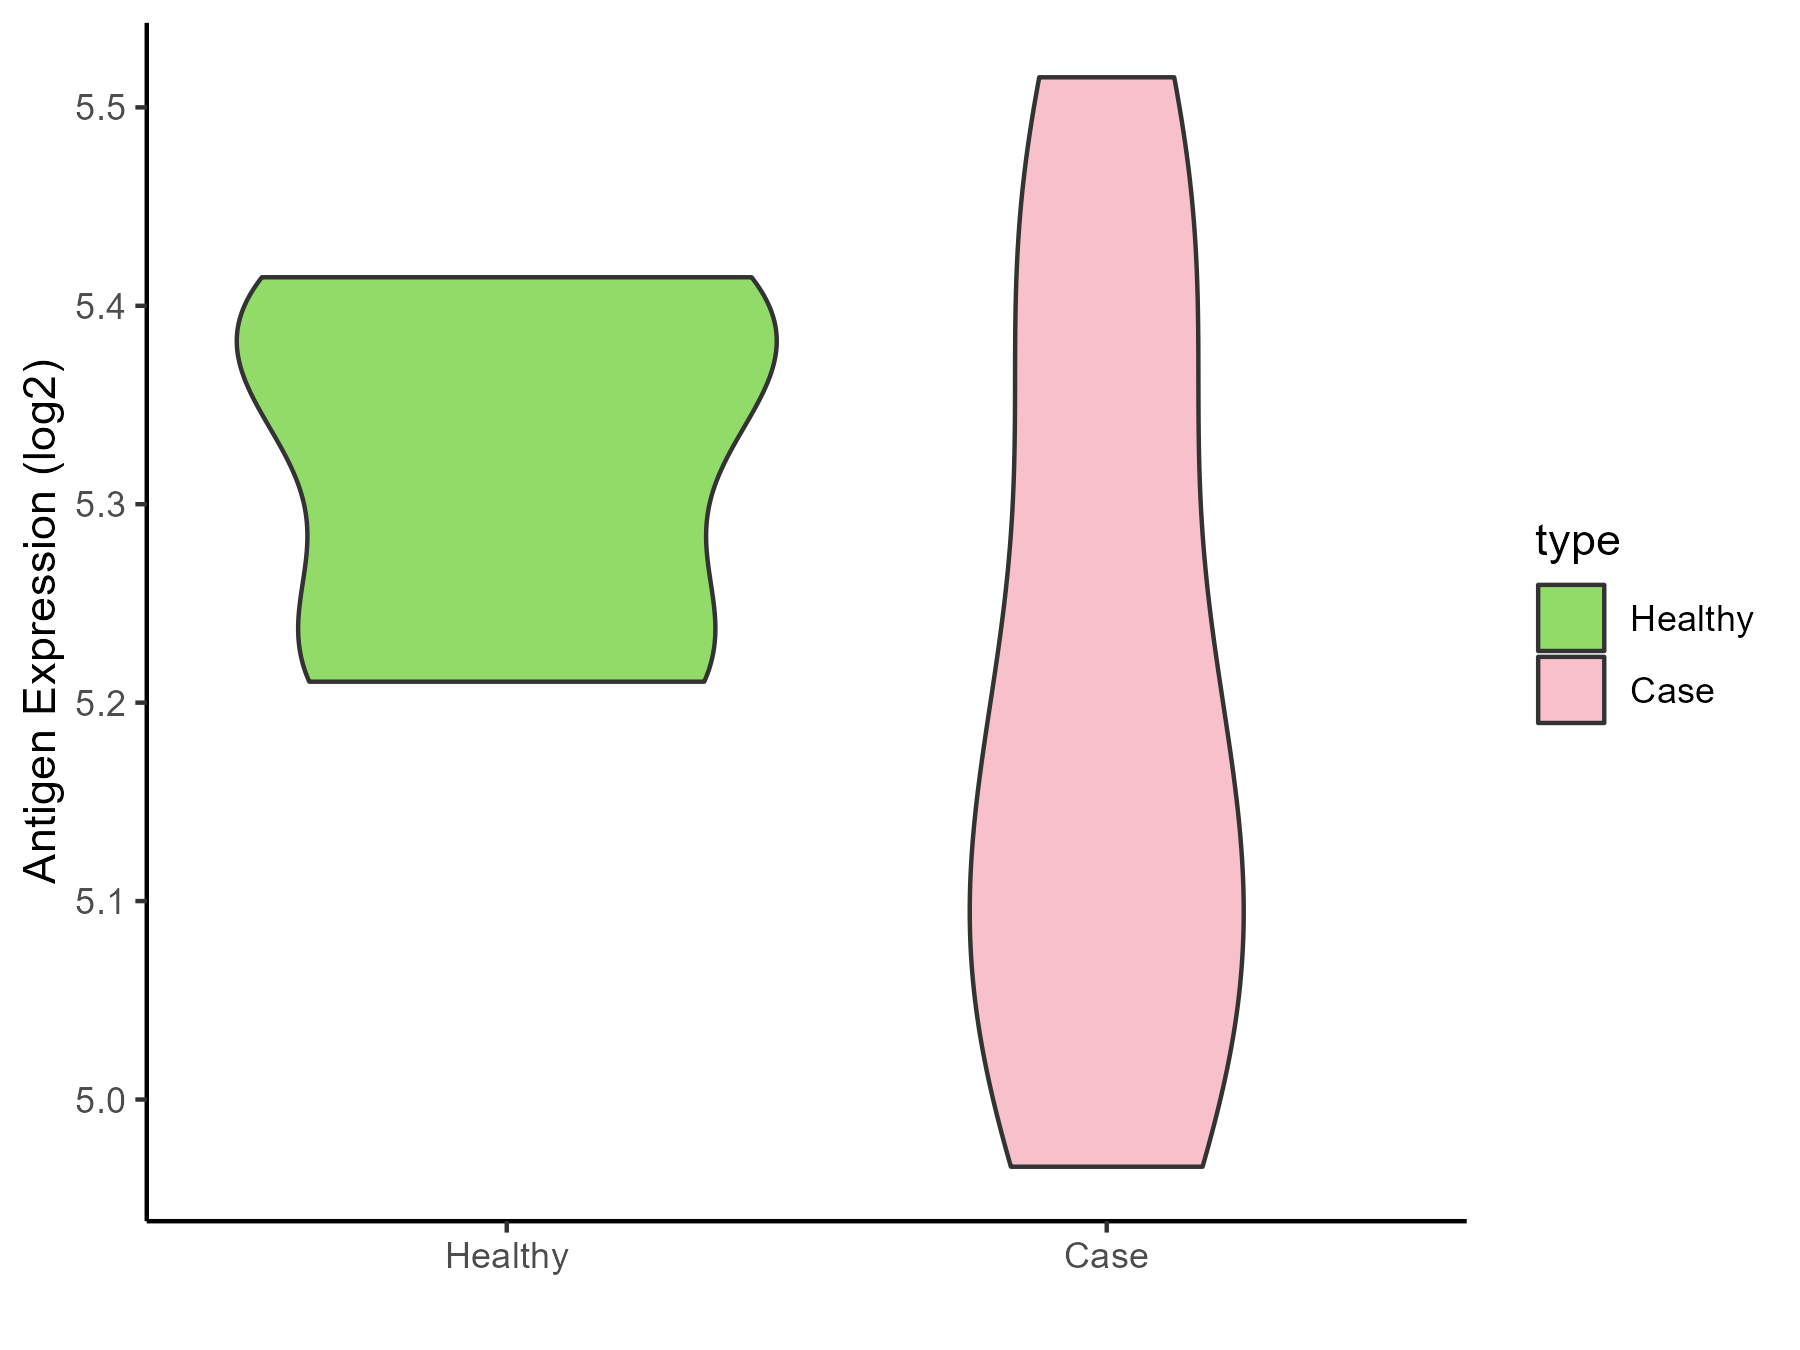
Glioma |
| The Expression Level of Disease Section Compare with the Healthy Individual Tissue |
p-value: 0.343973546;
Fold-change: 0.089401244;
Z-score: 0.150475915
|
| Disease-specific Antigen Abundances |
|
Click to View the Clearer Original Diagram
|
|
|
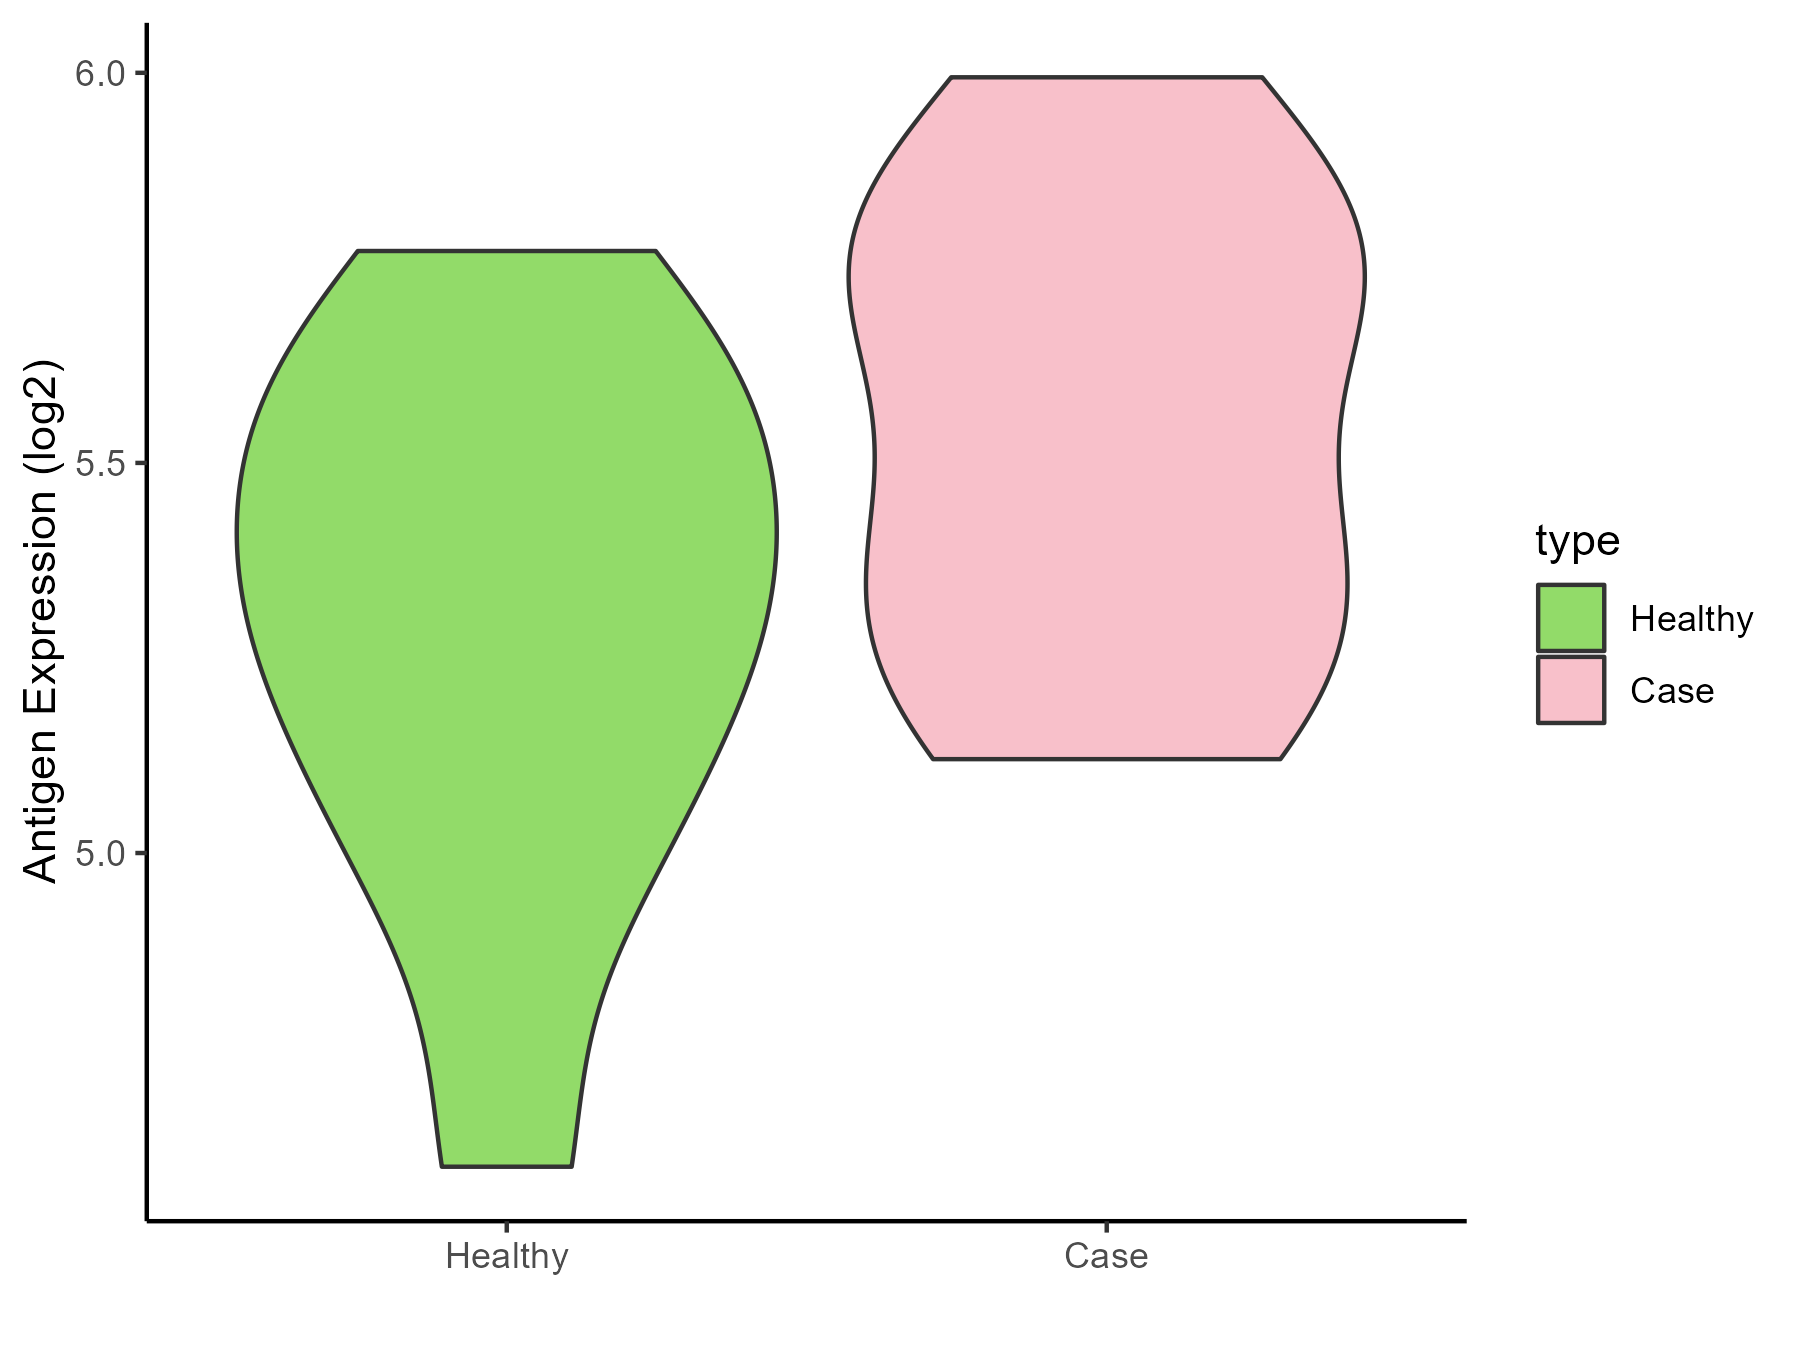
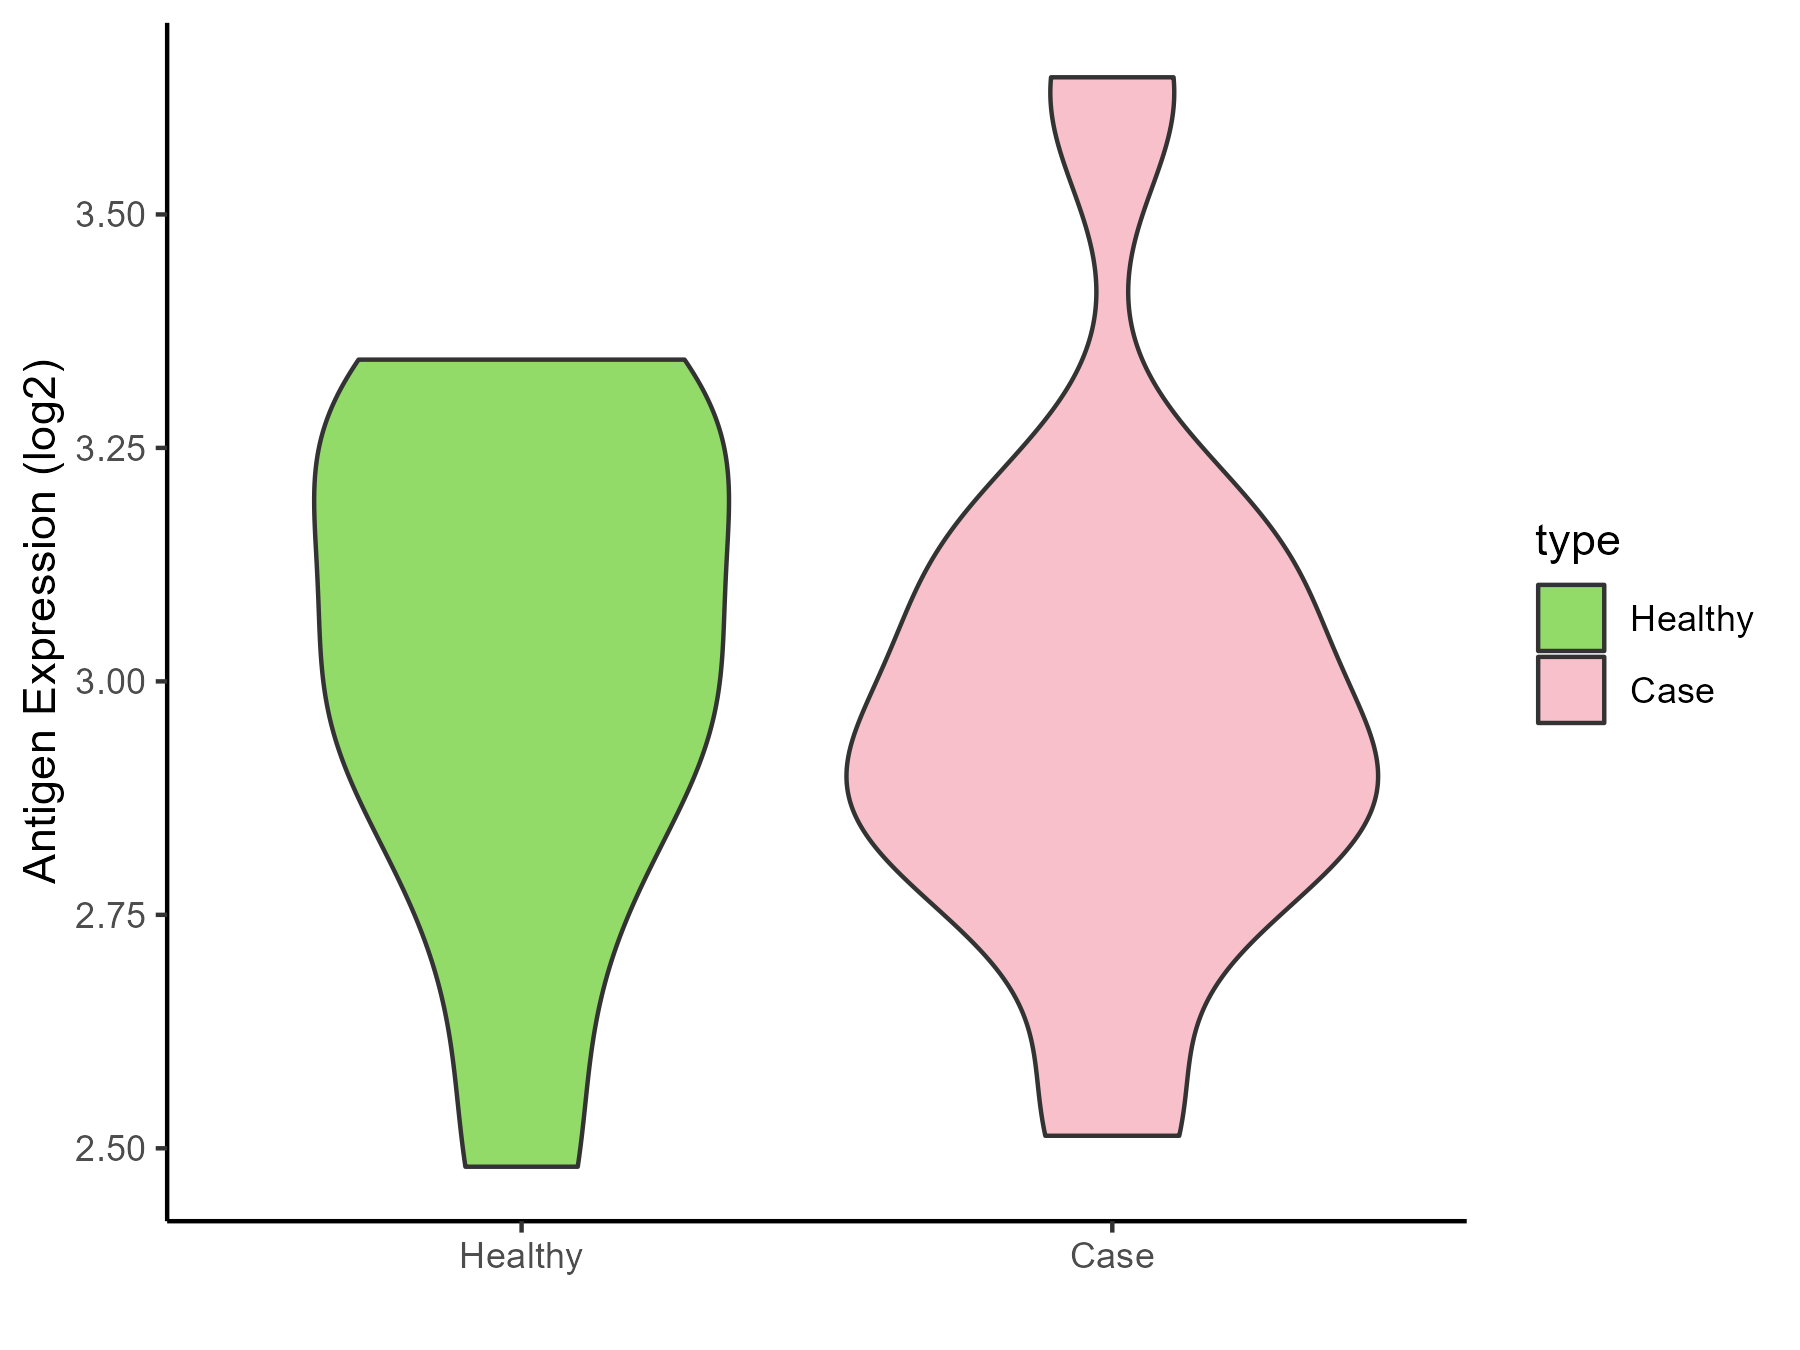
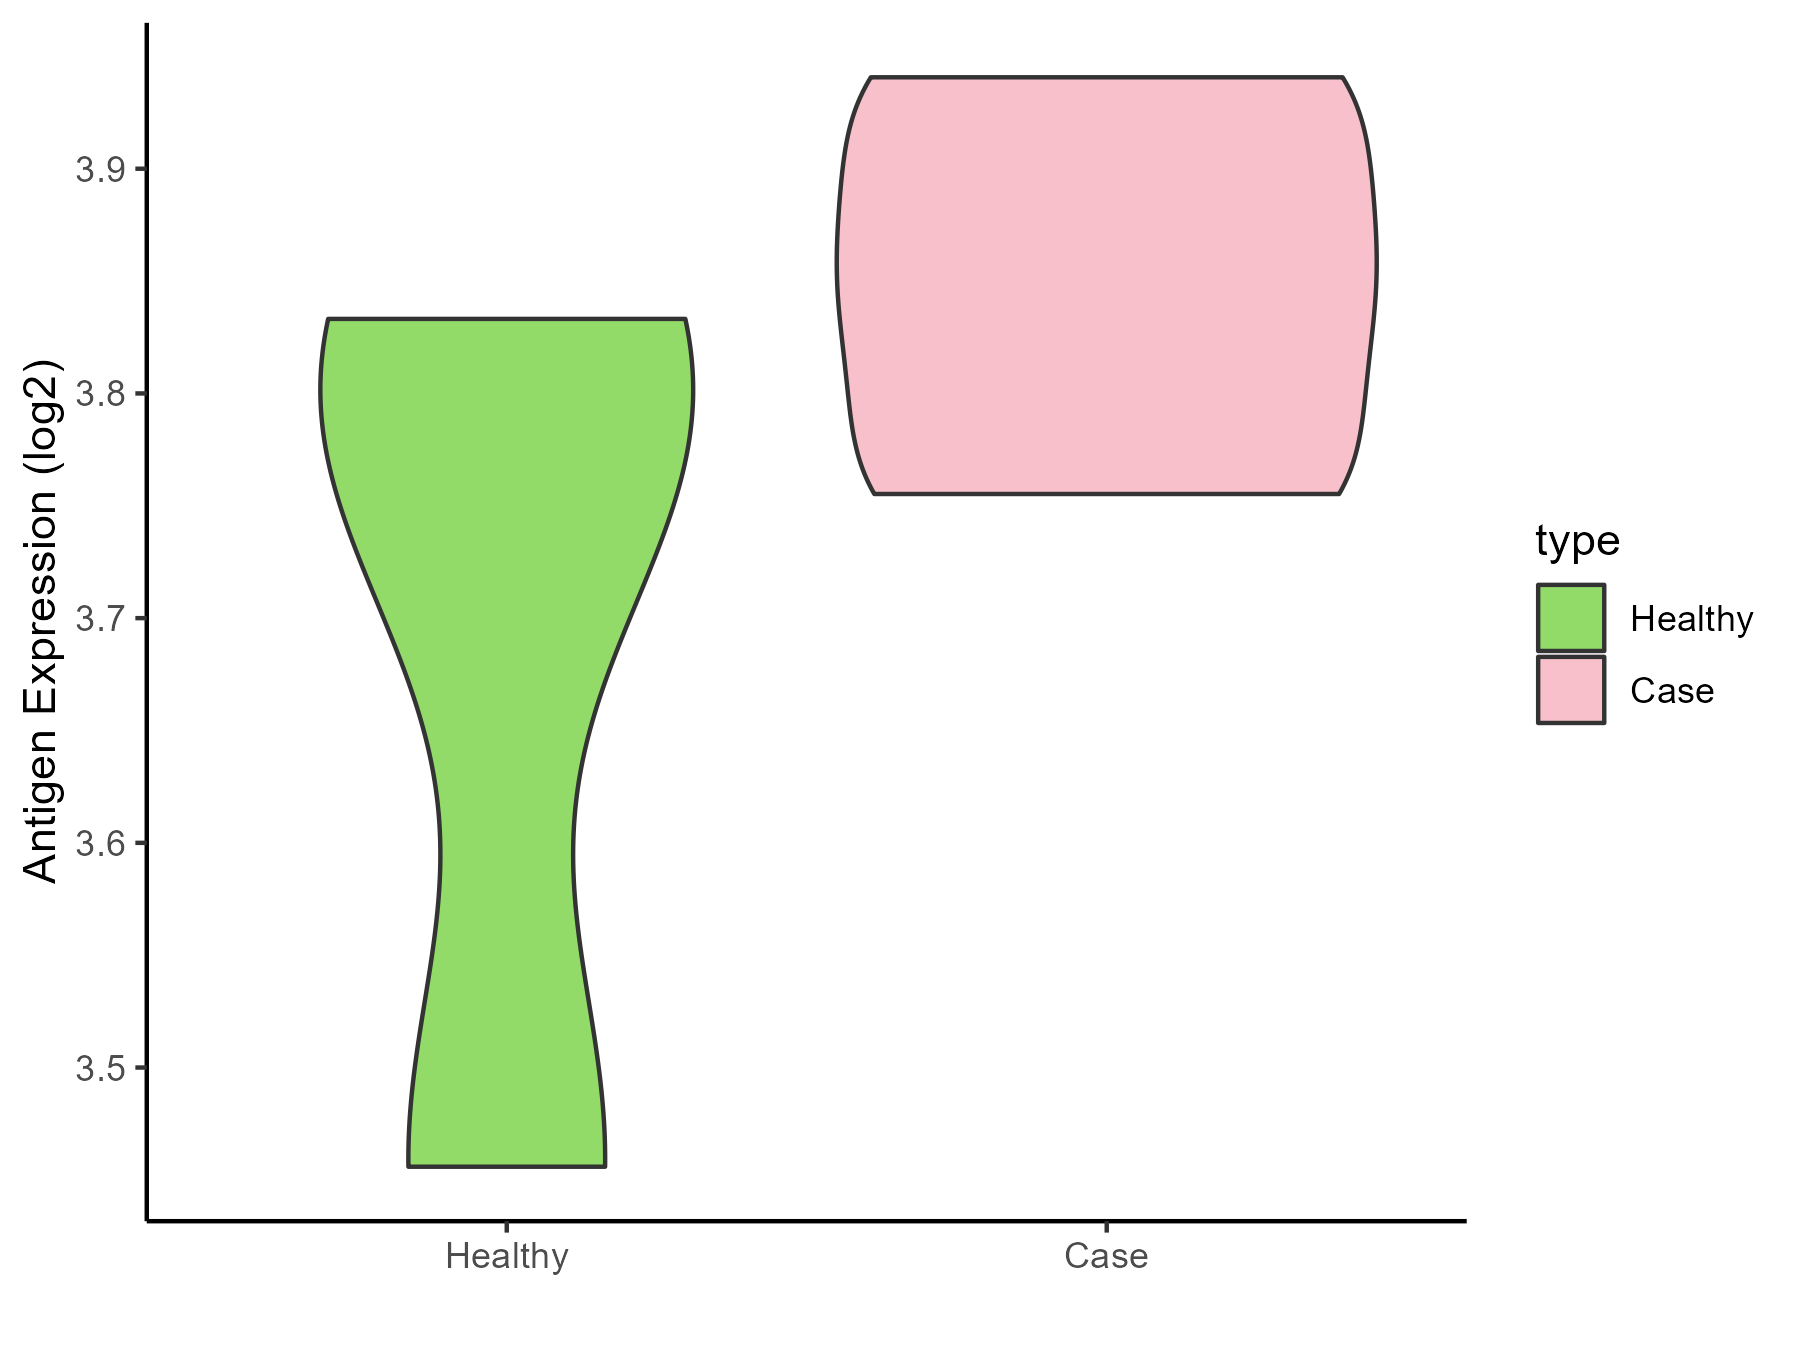
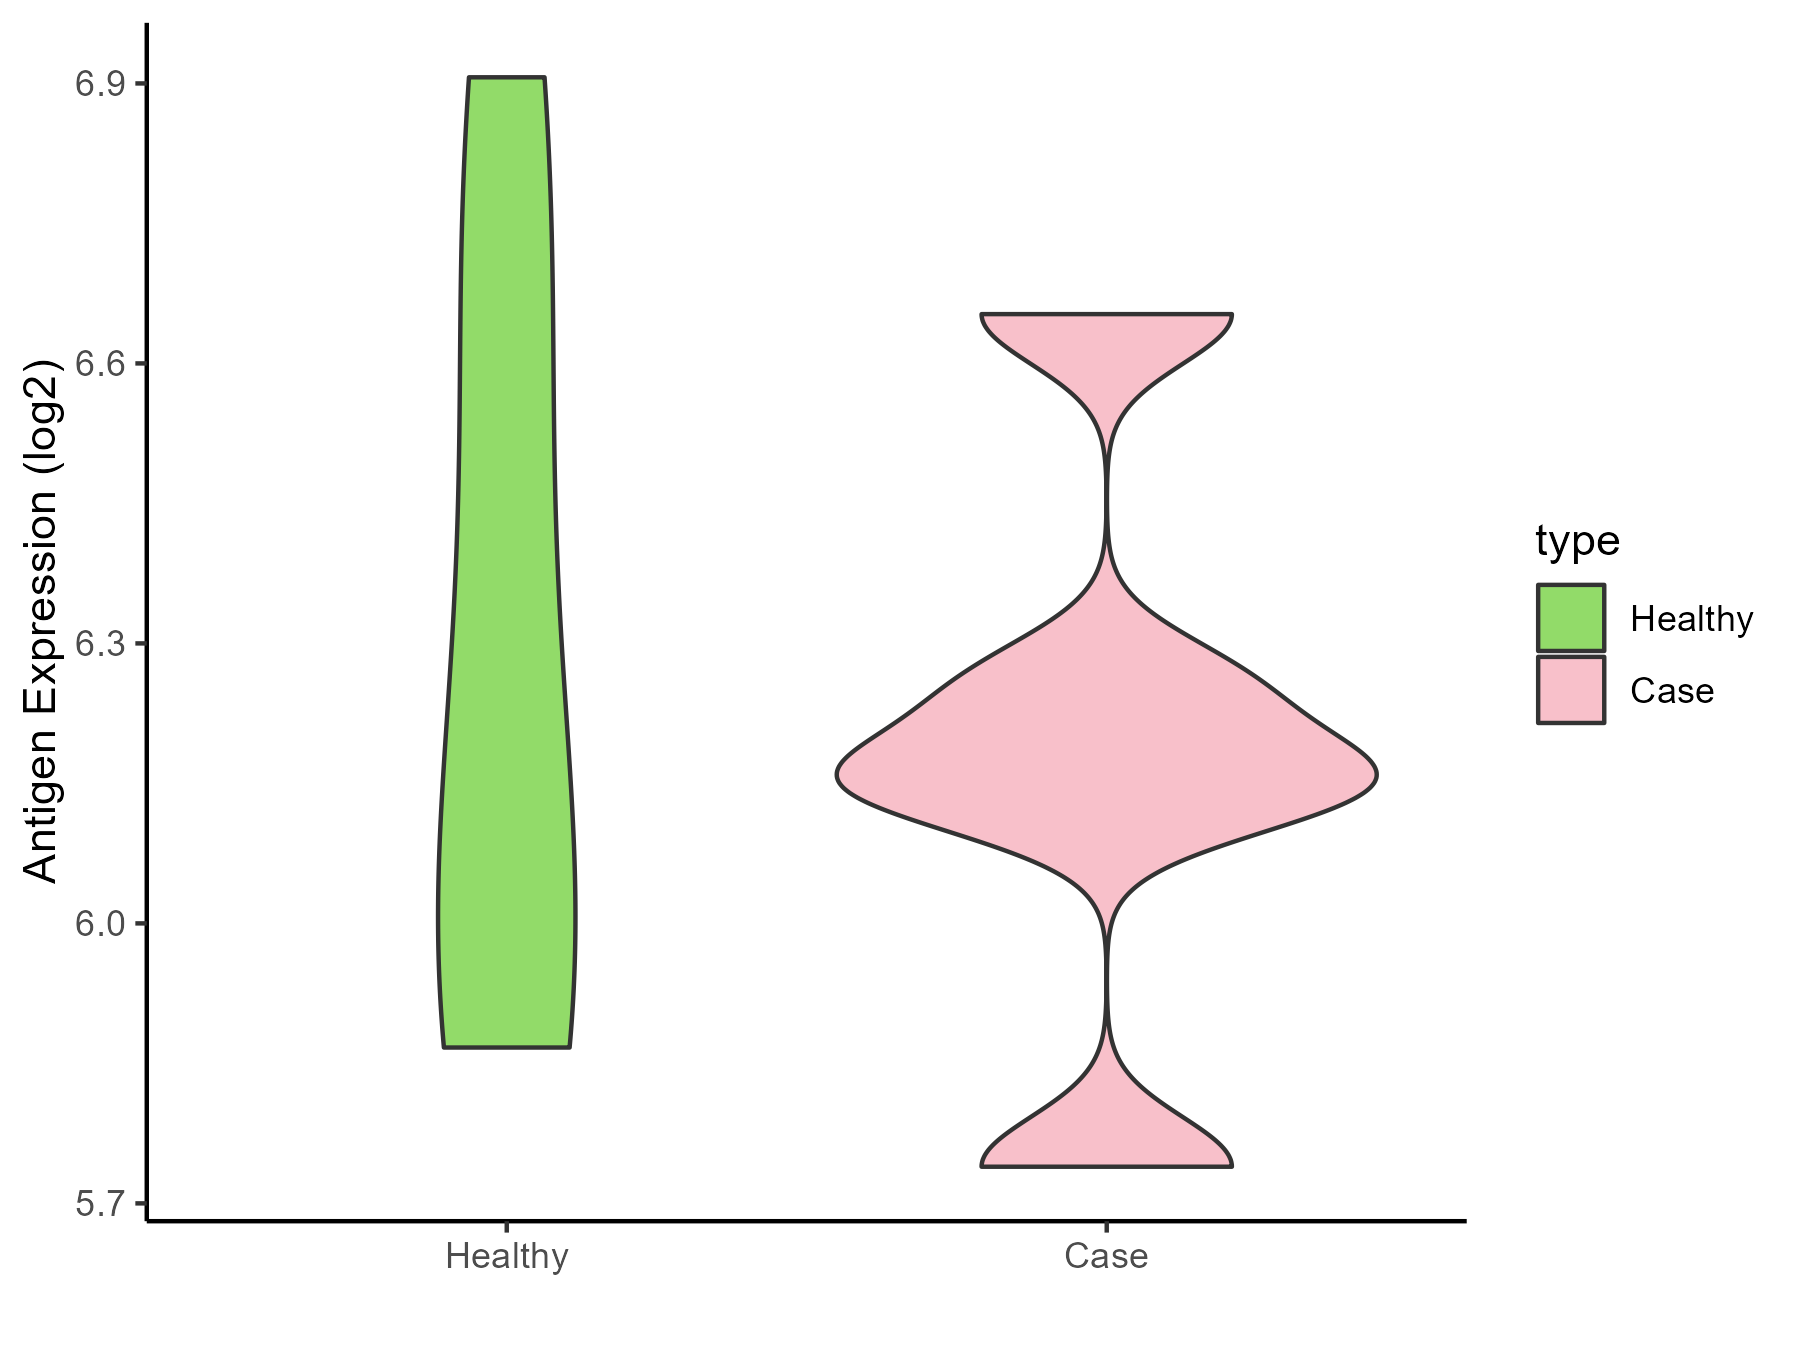
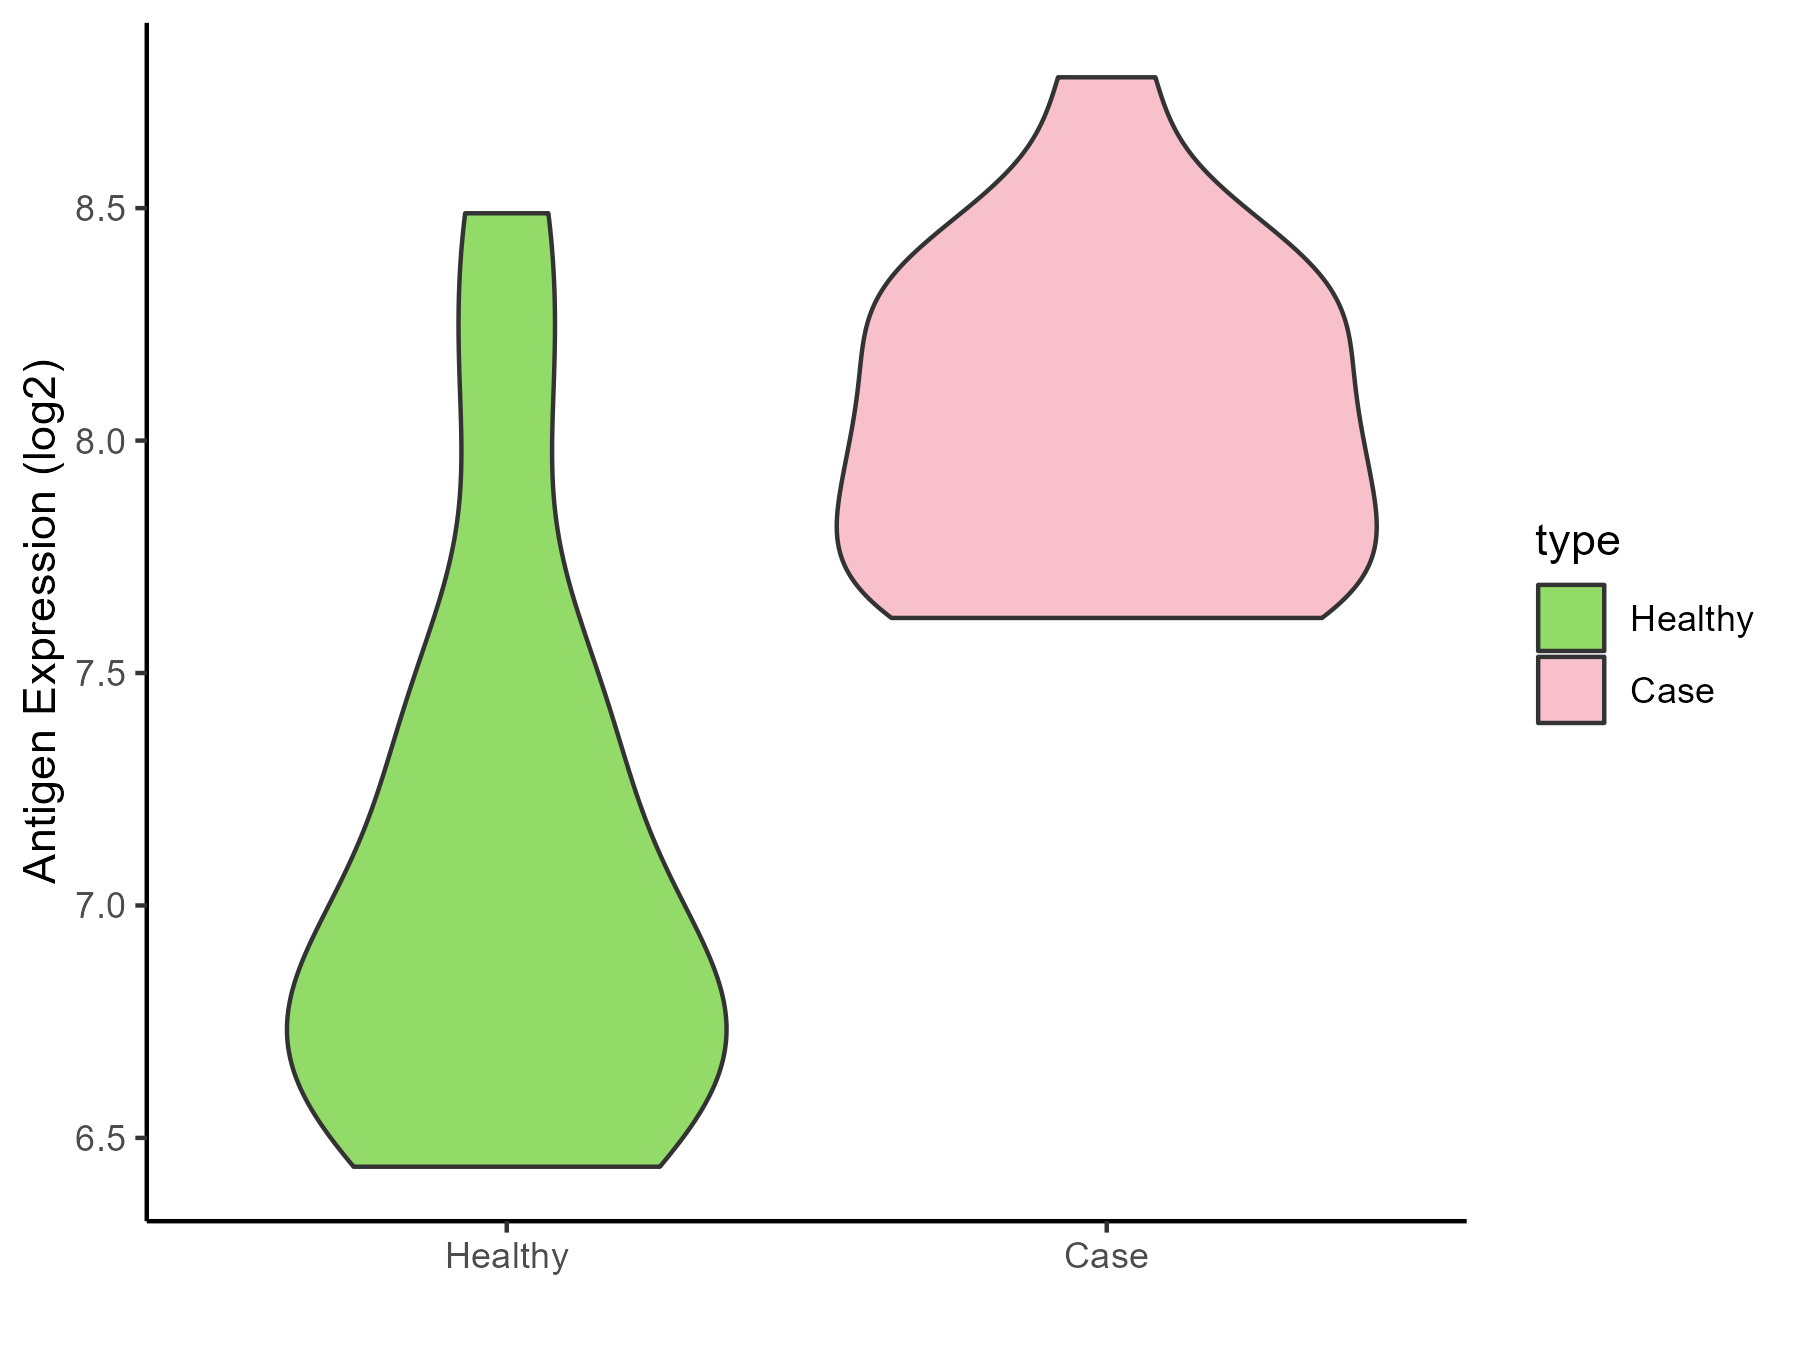
| The Studied Tissue |
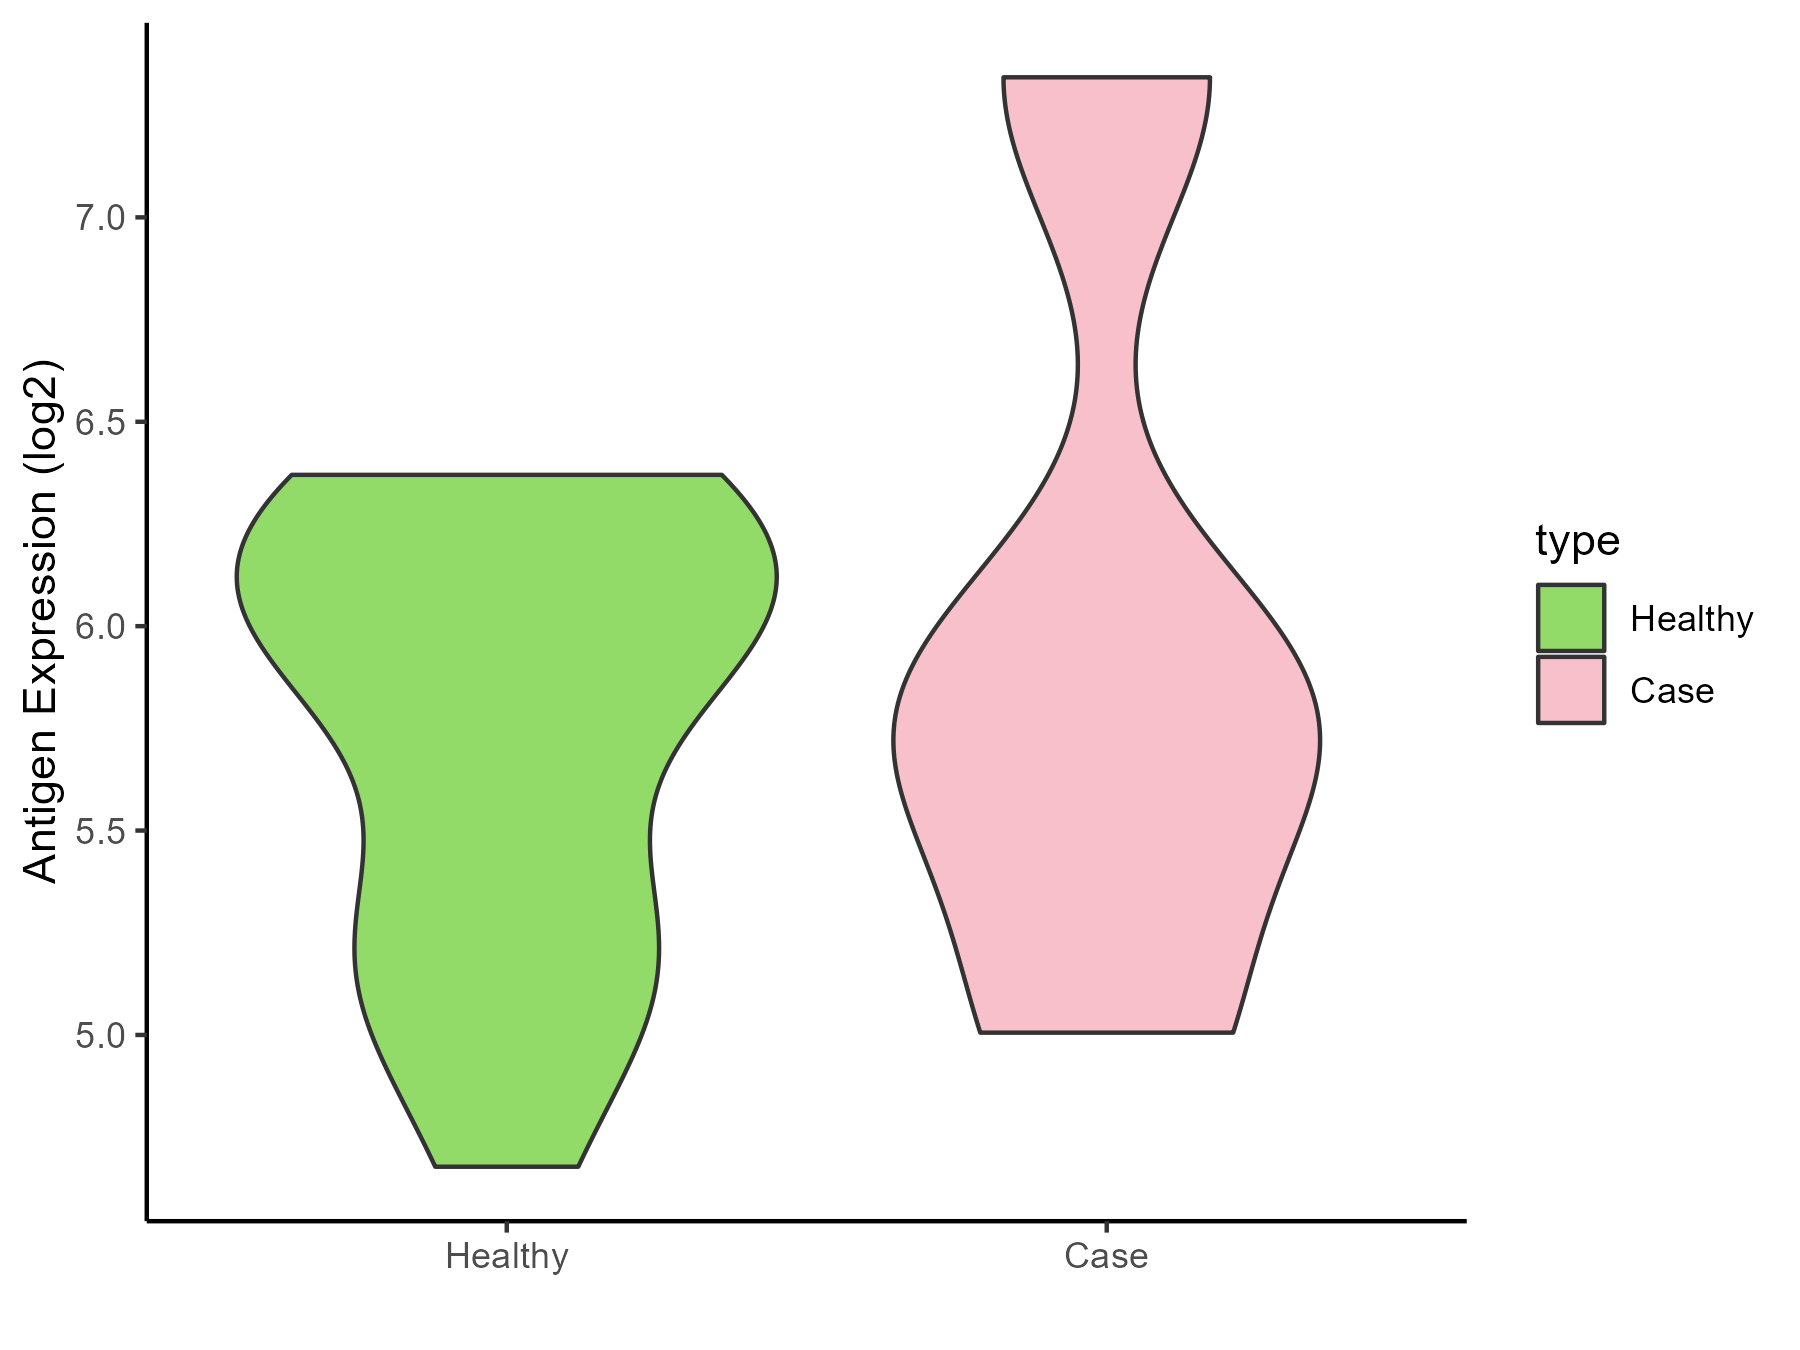
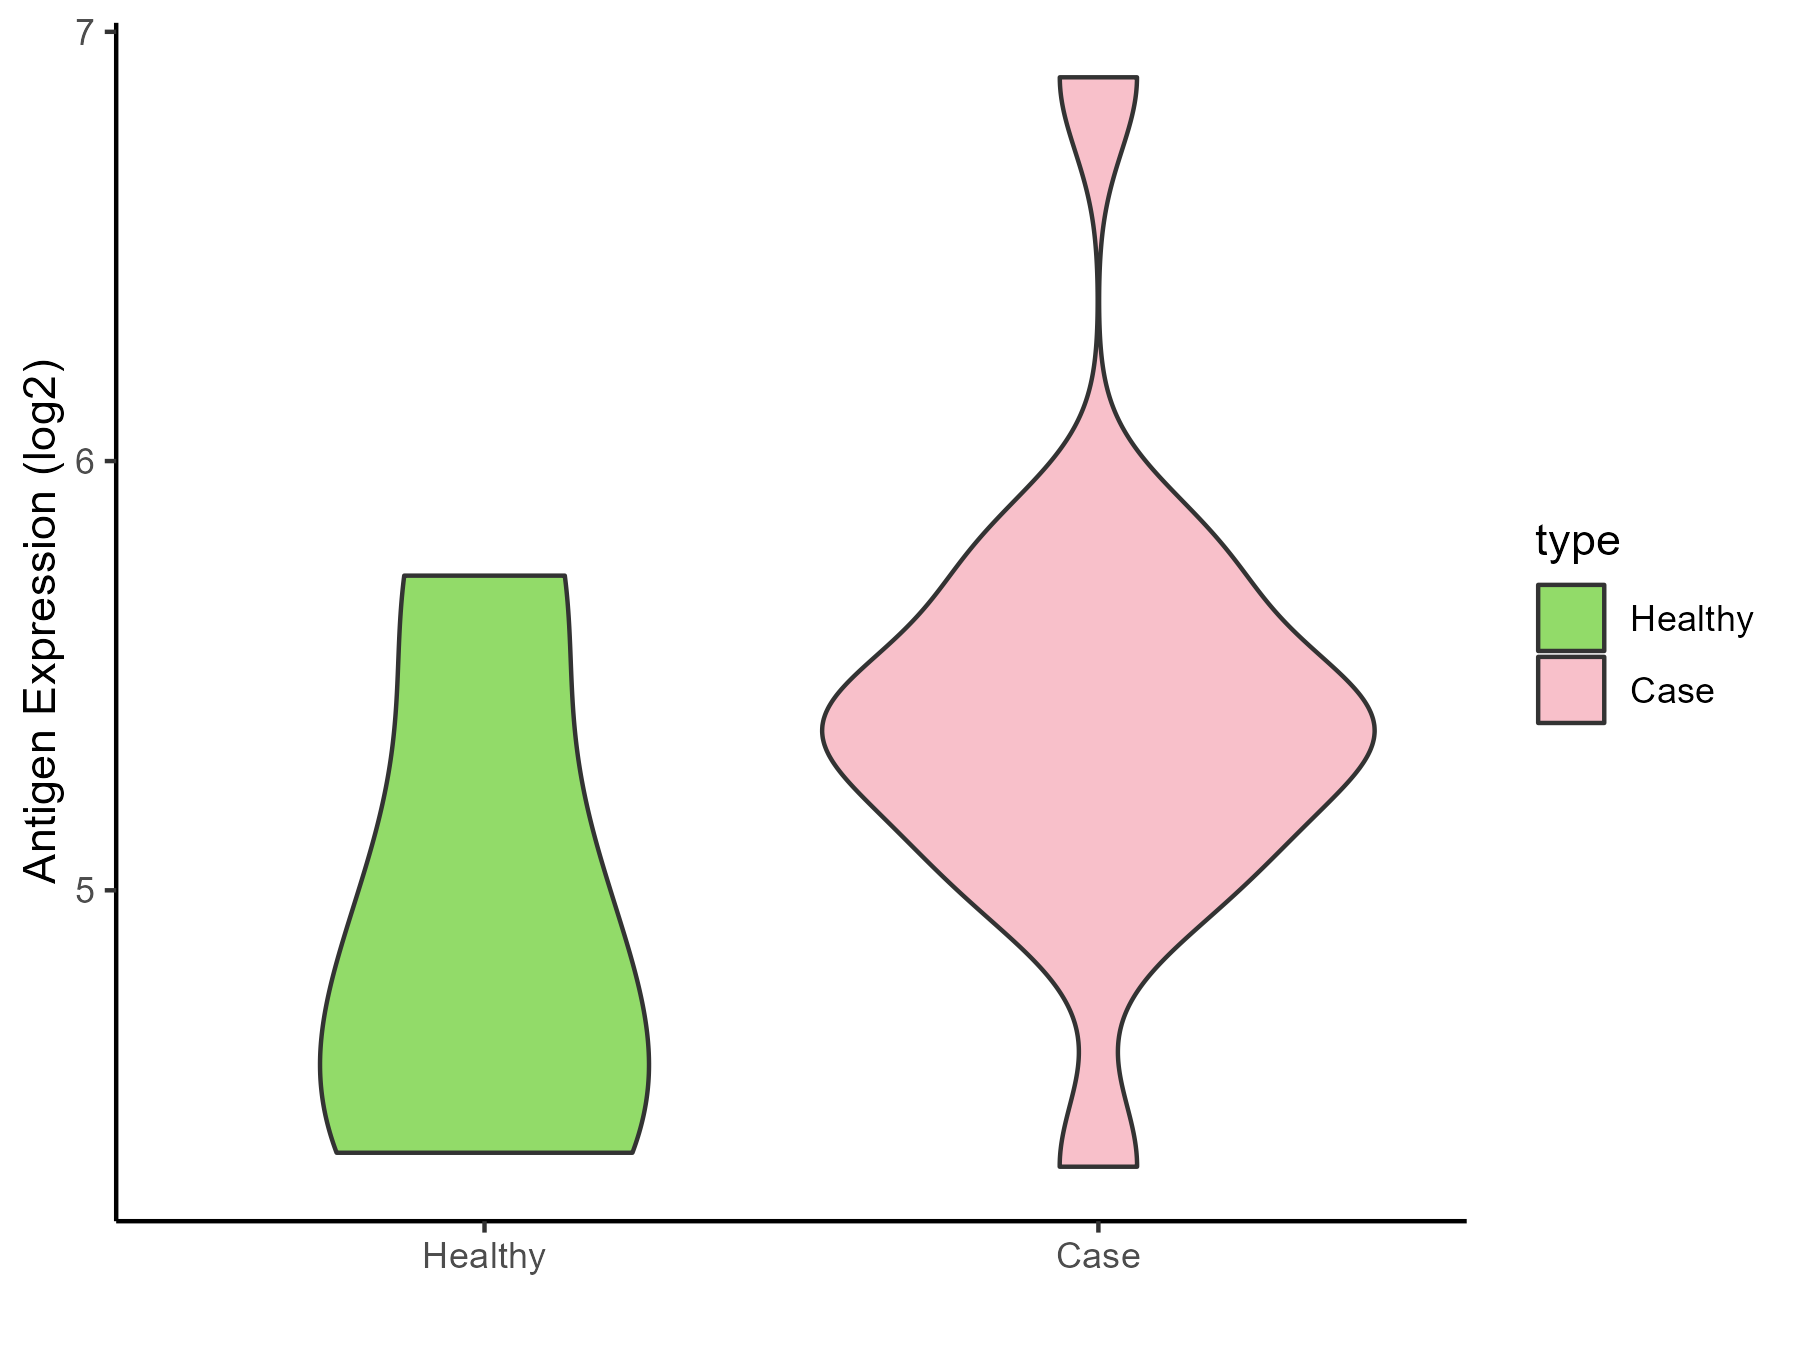
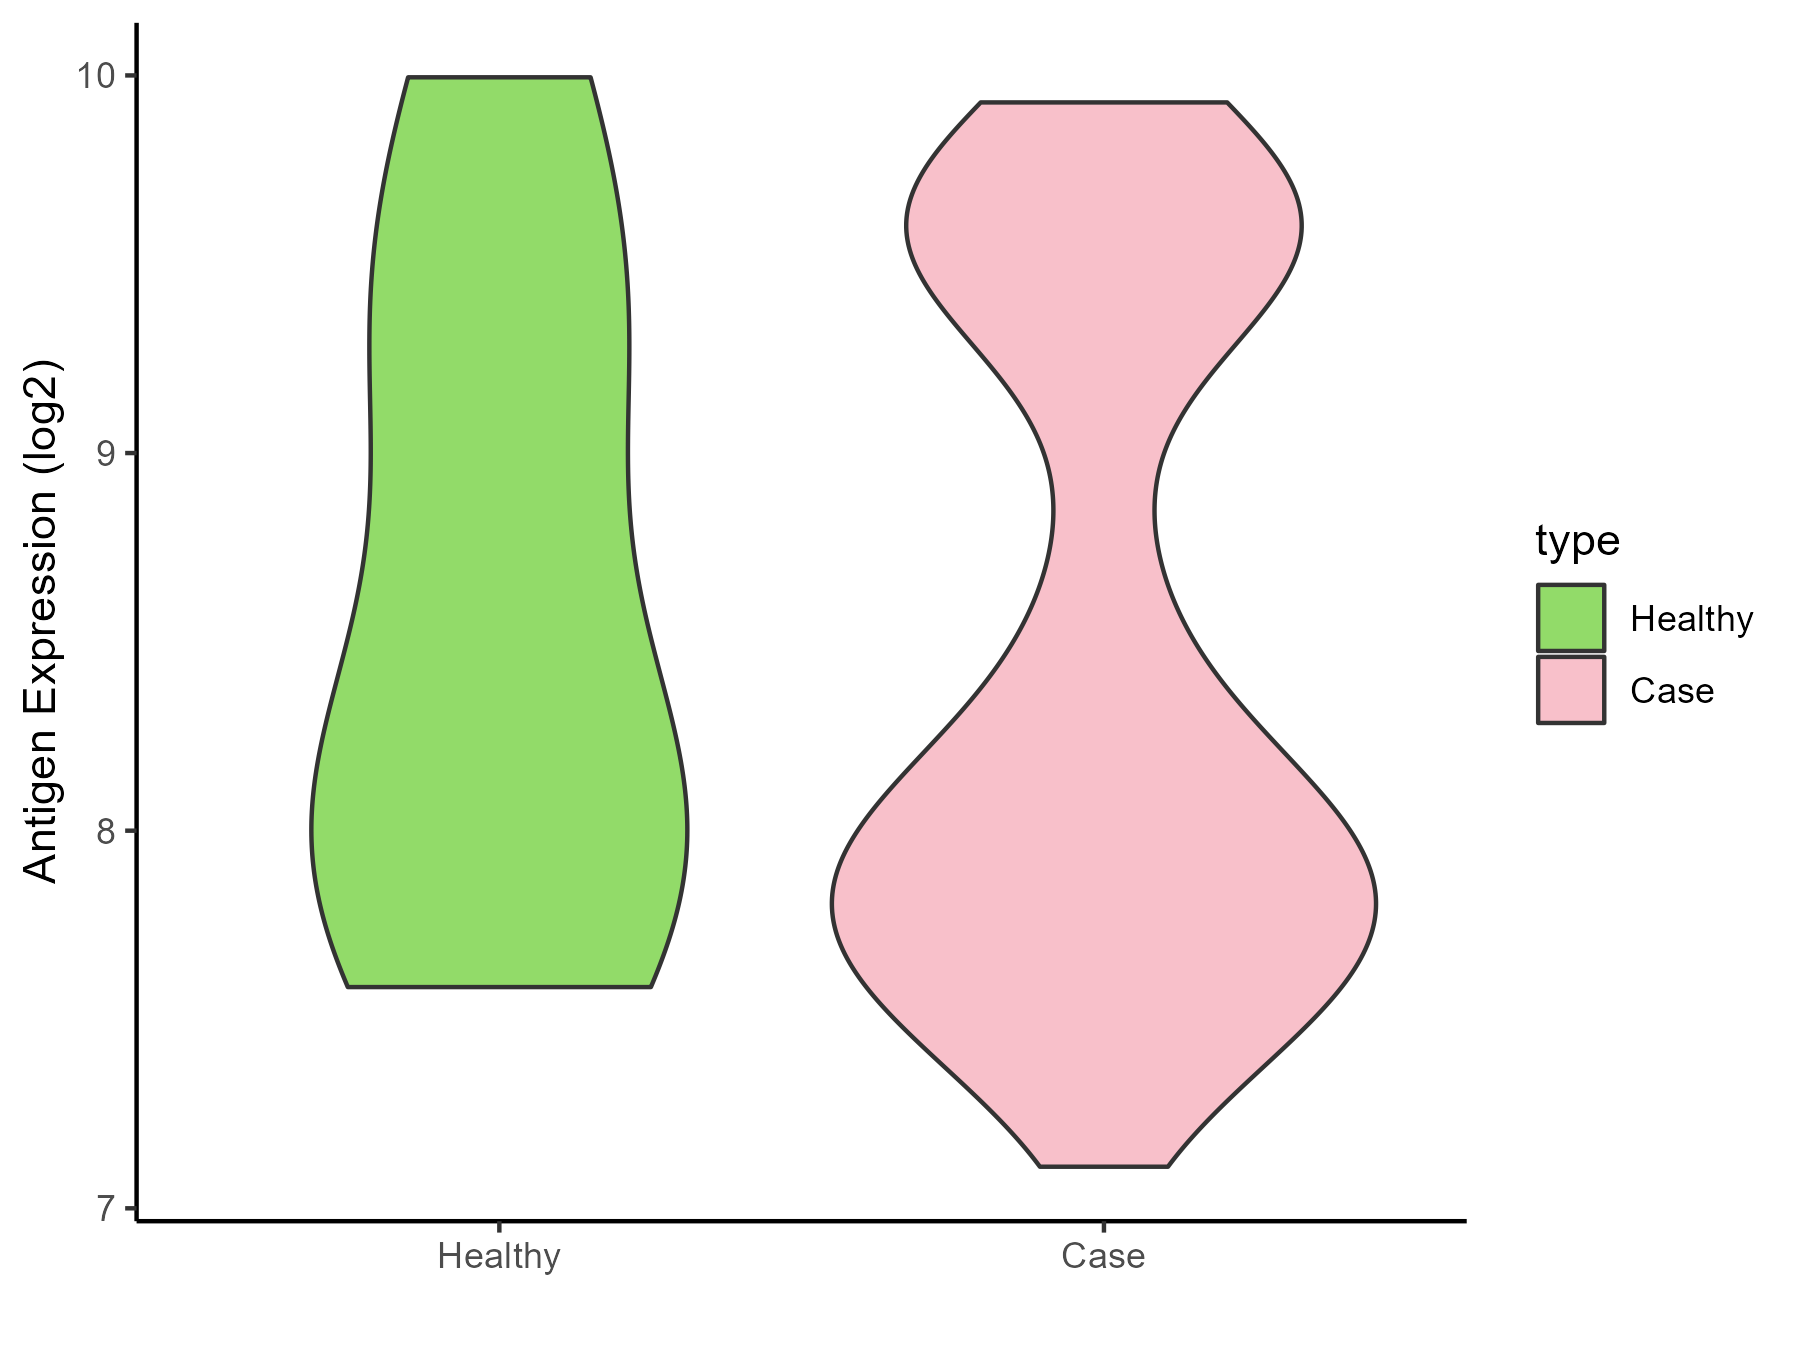
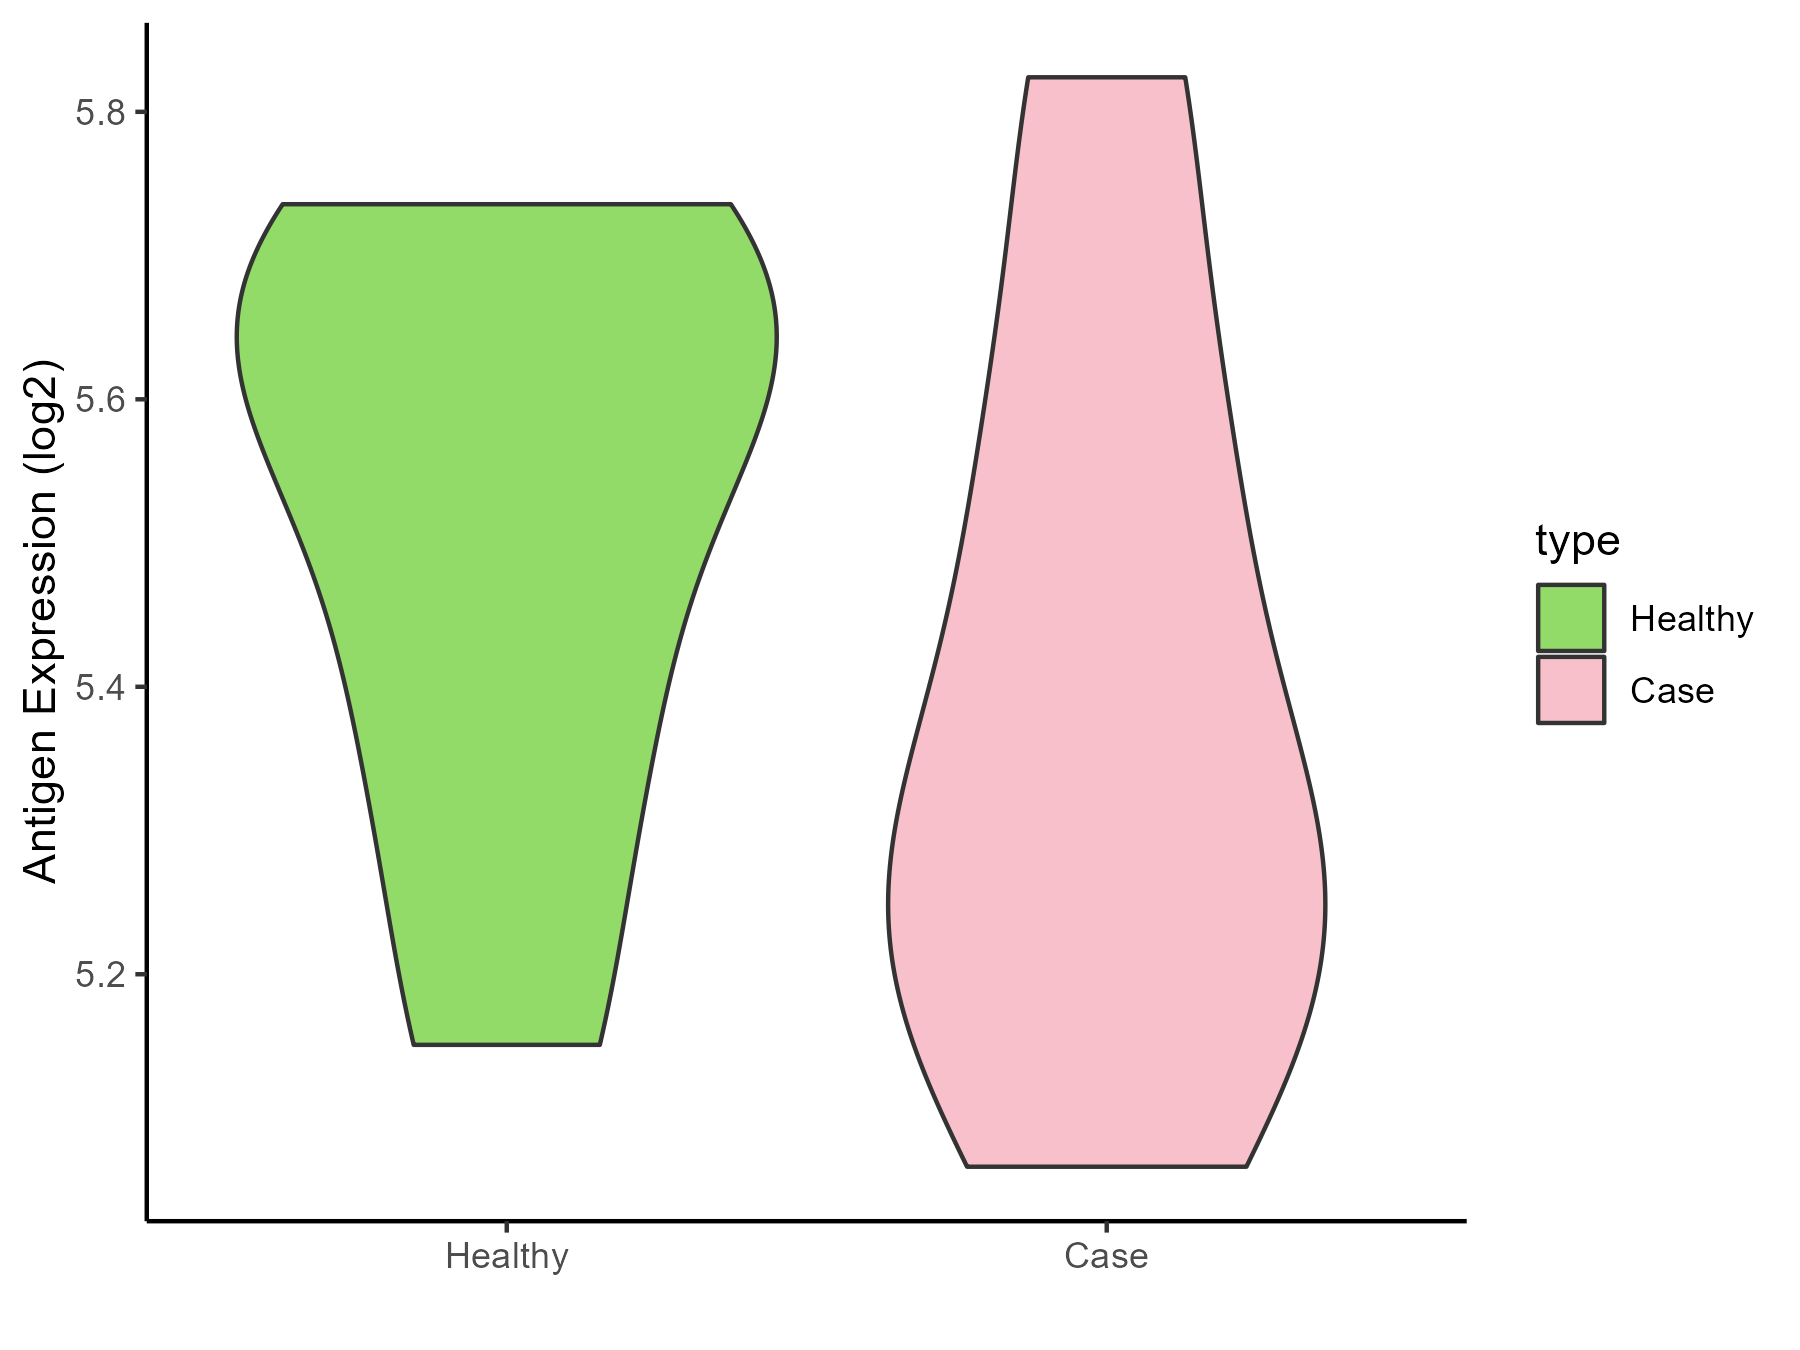
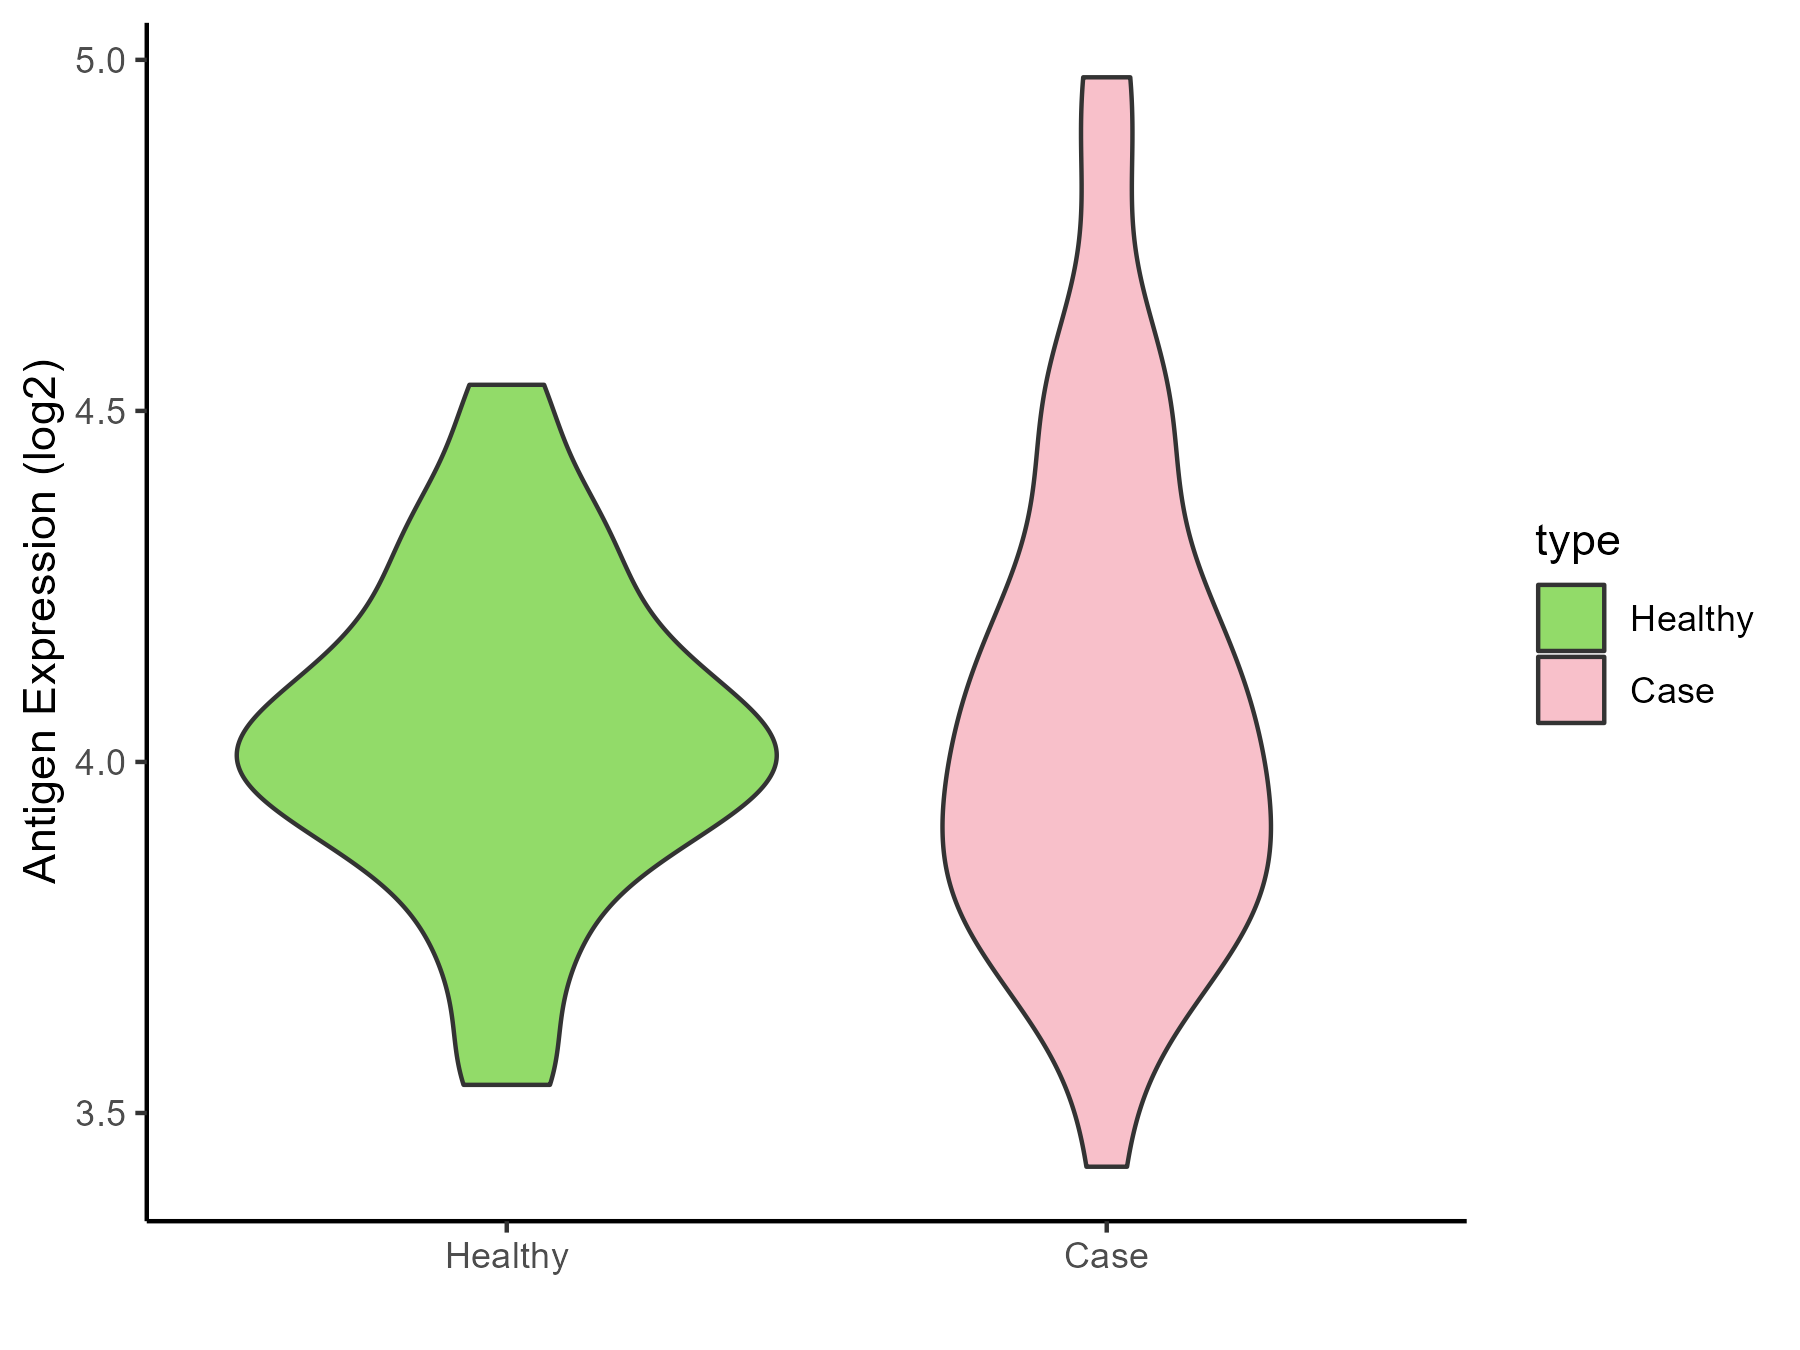
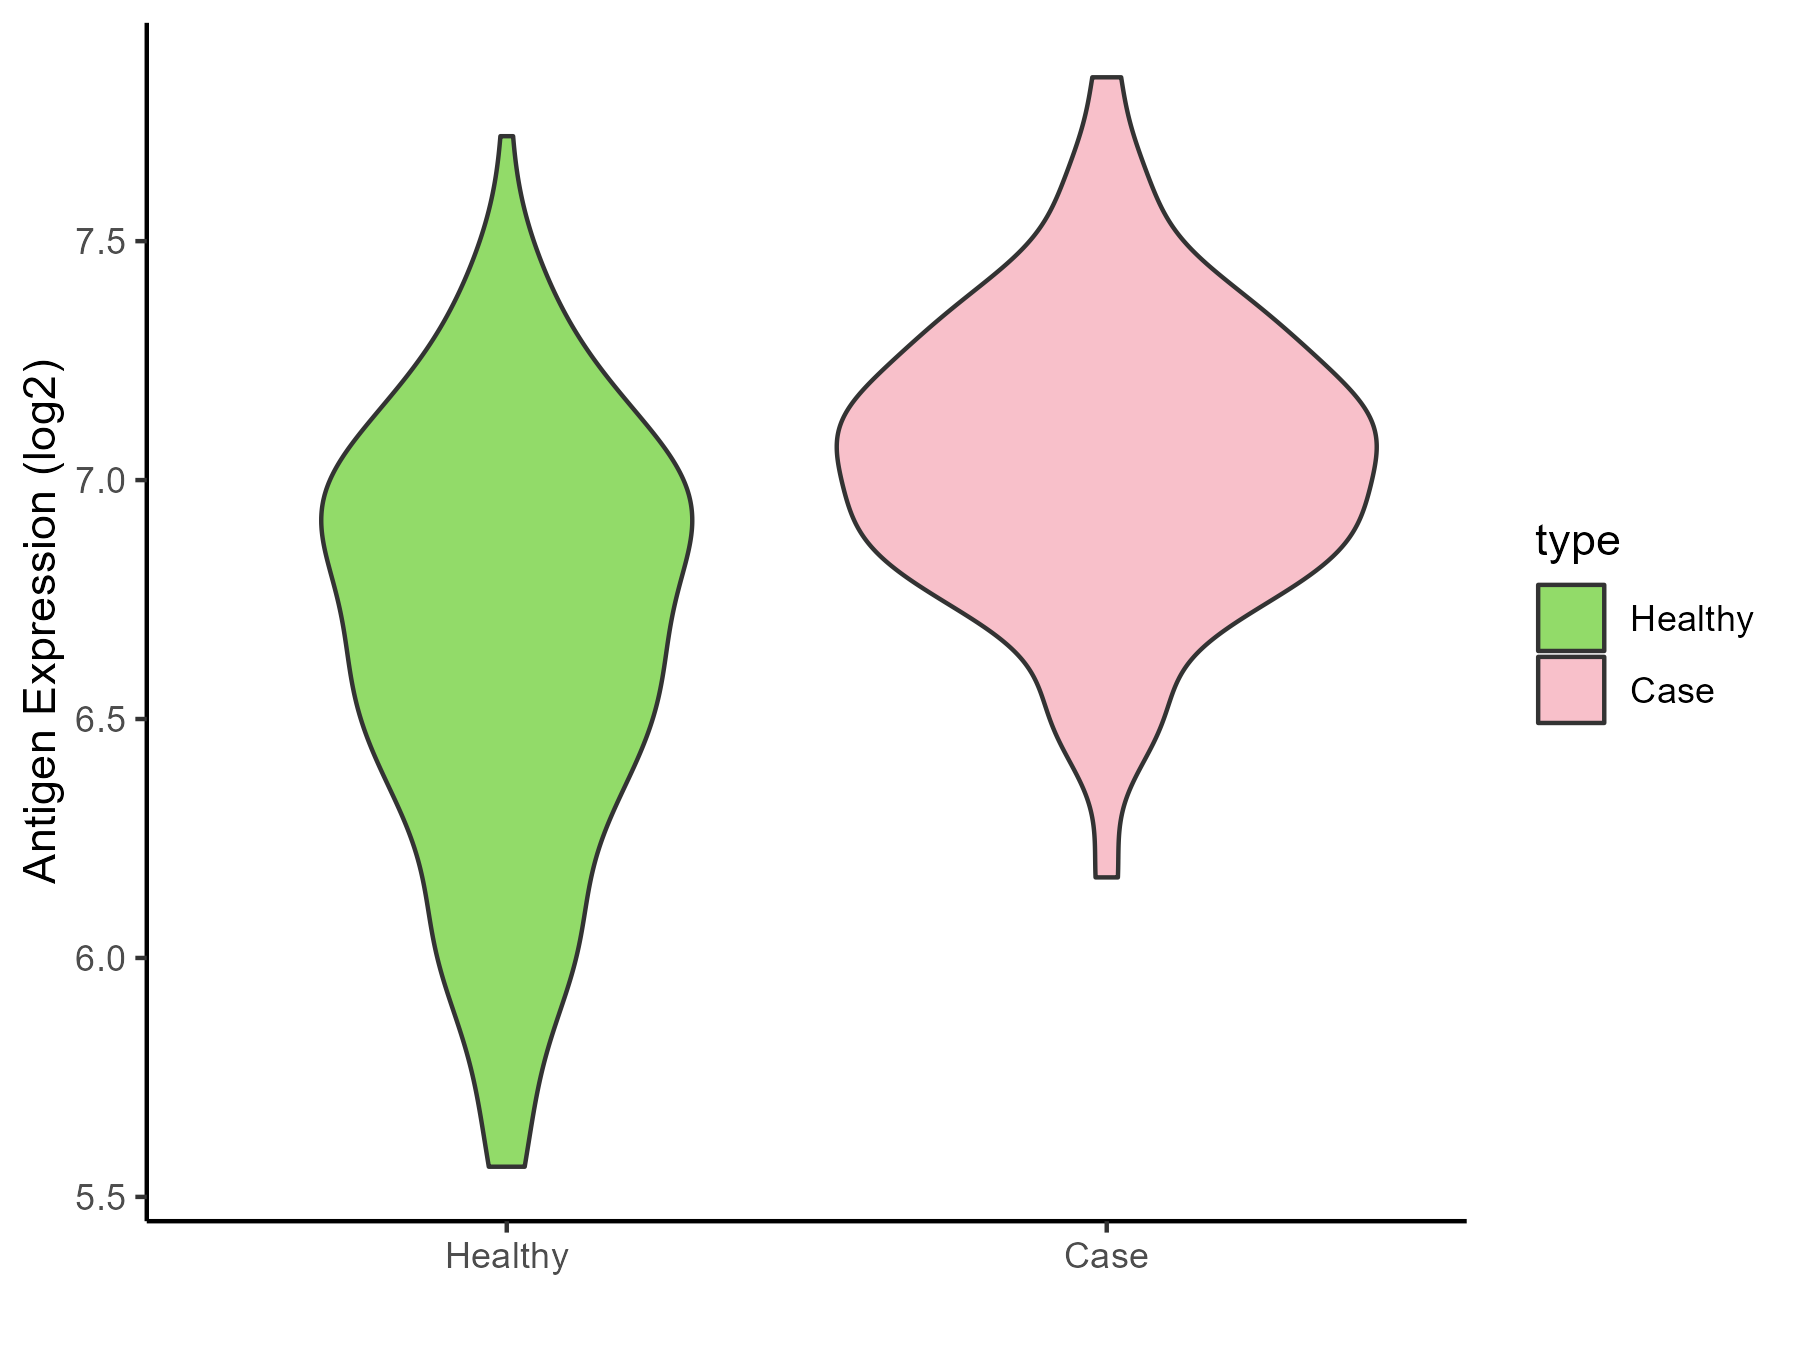
Brainstem |
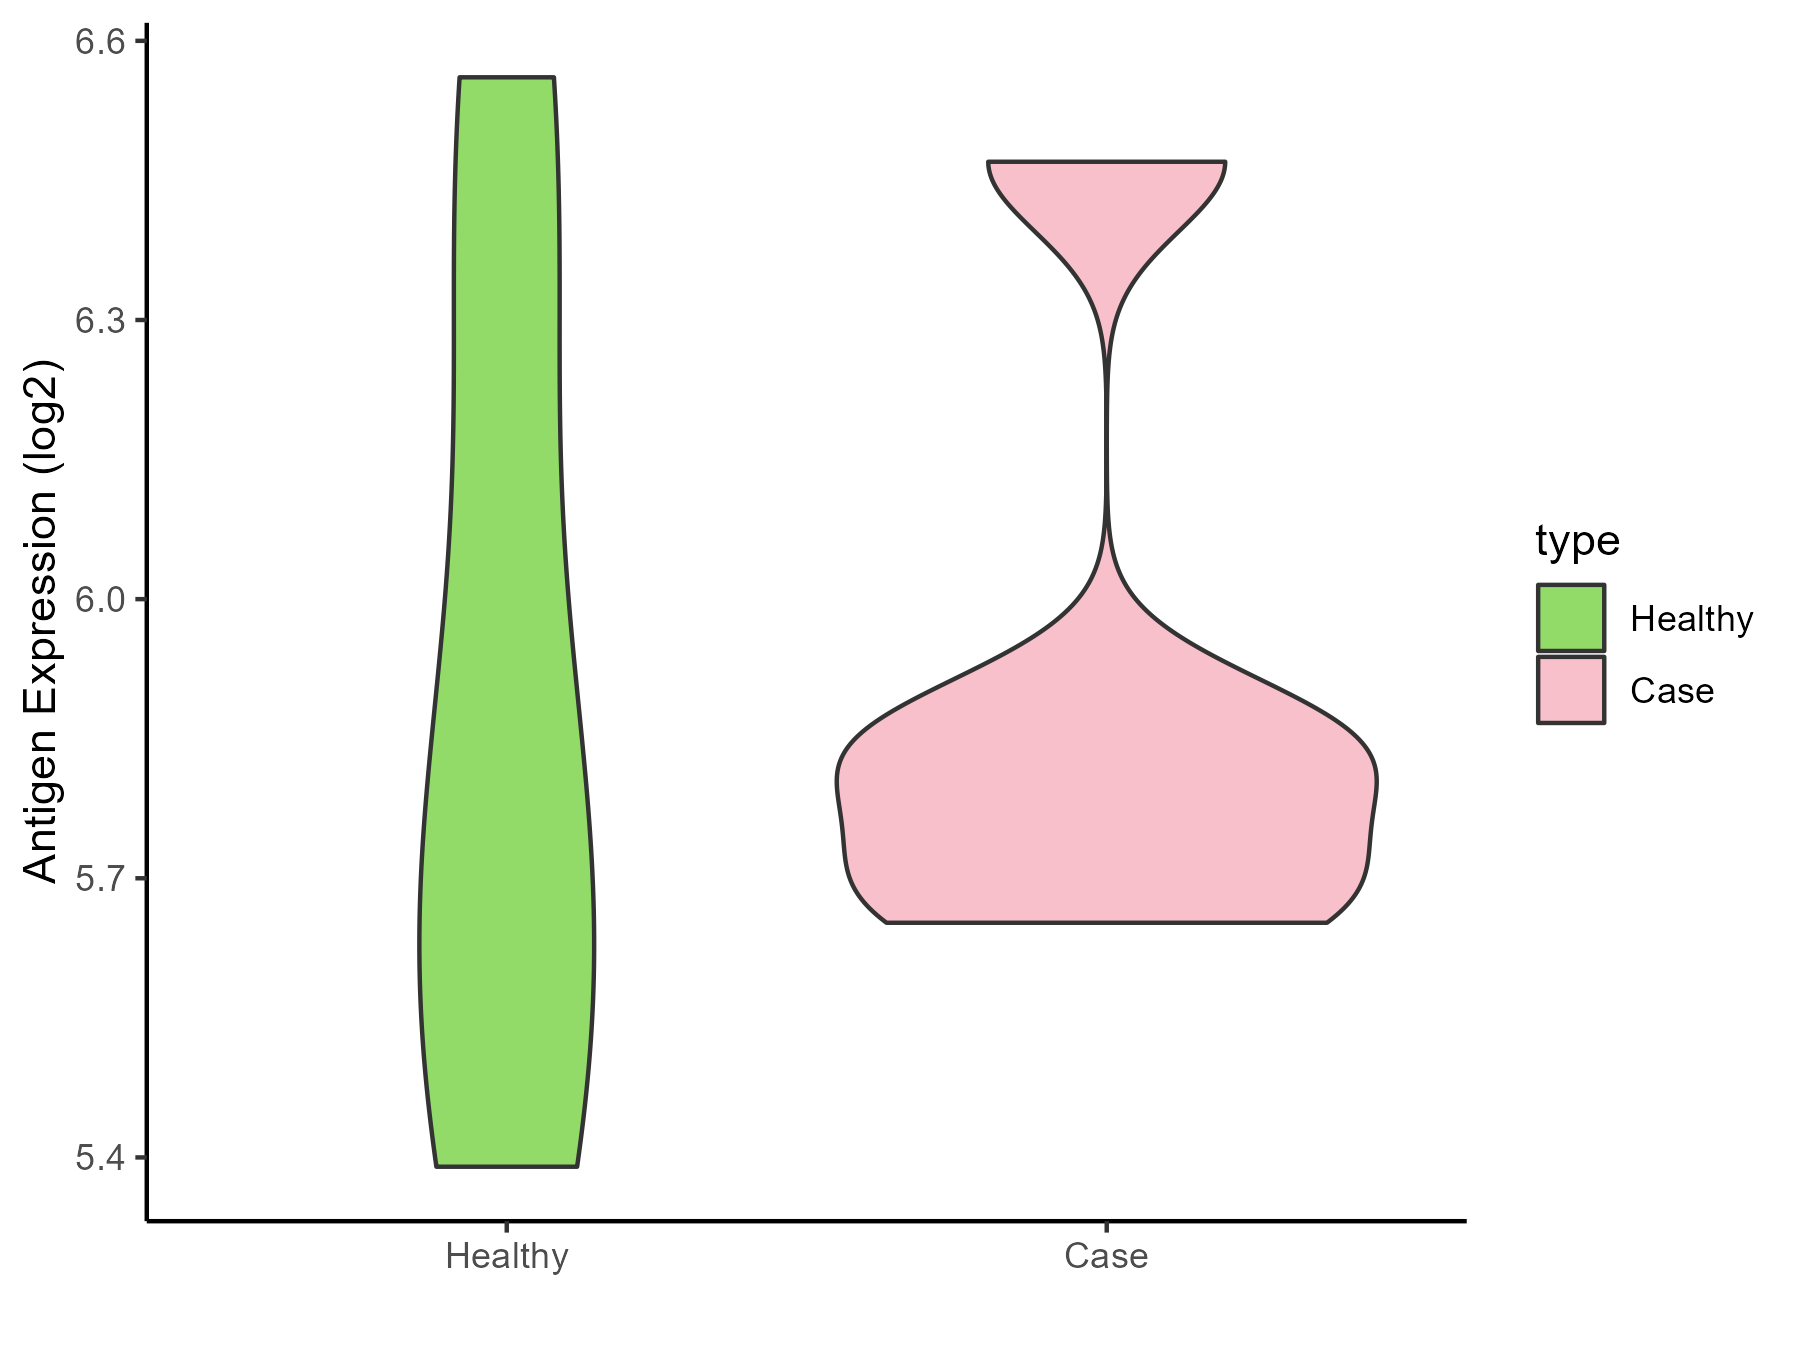
| The Specific Disease |
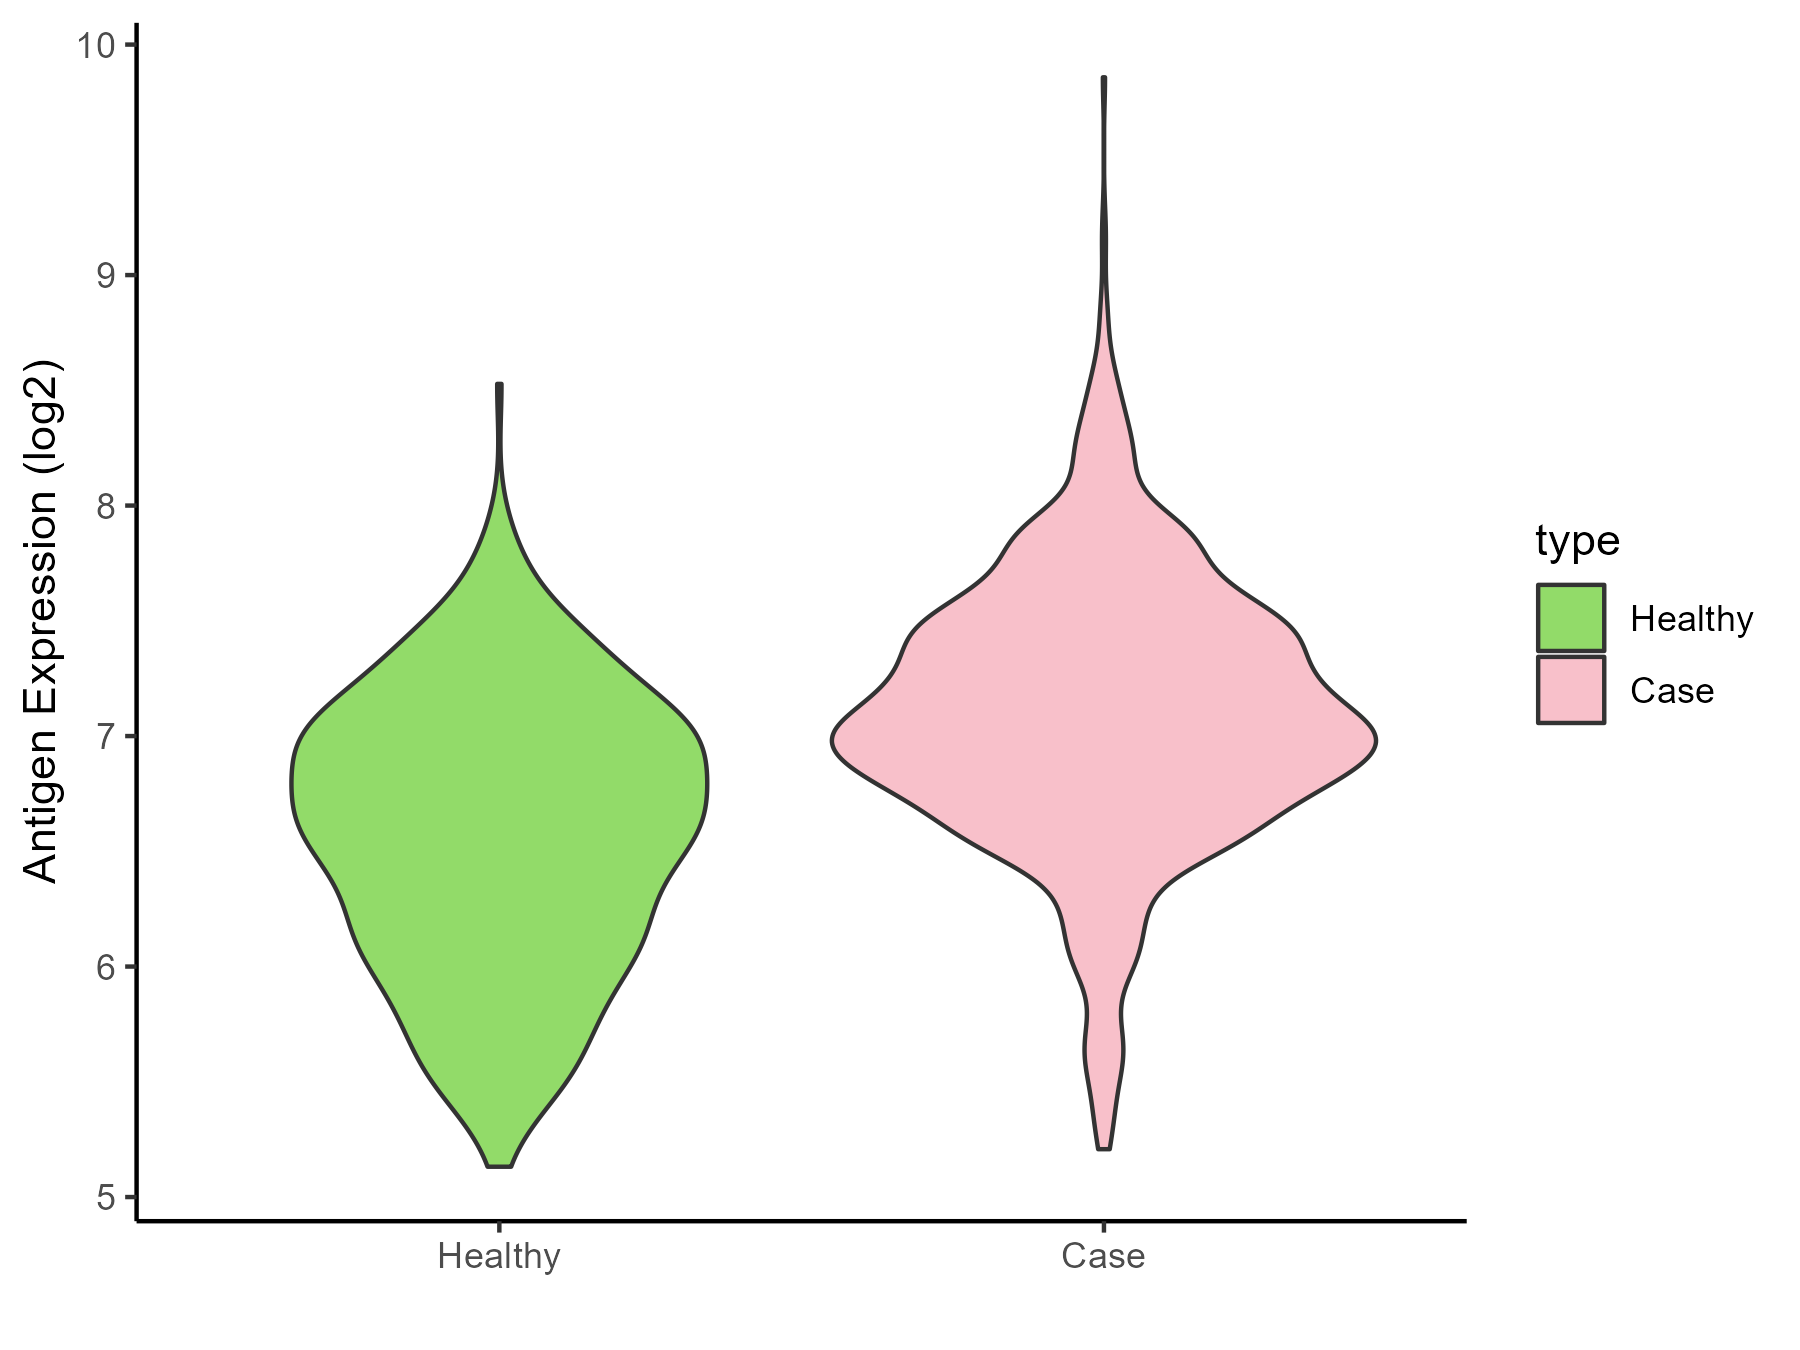
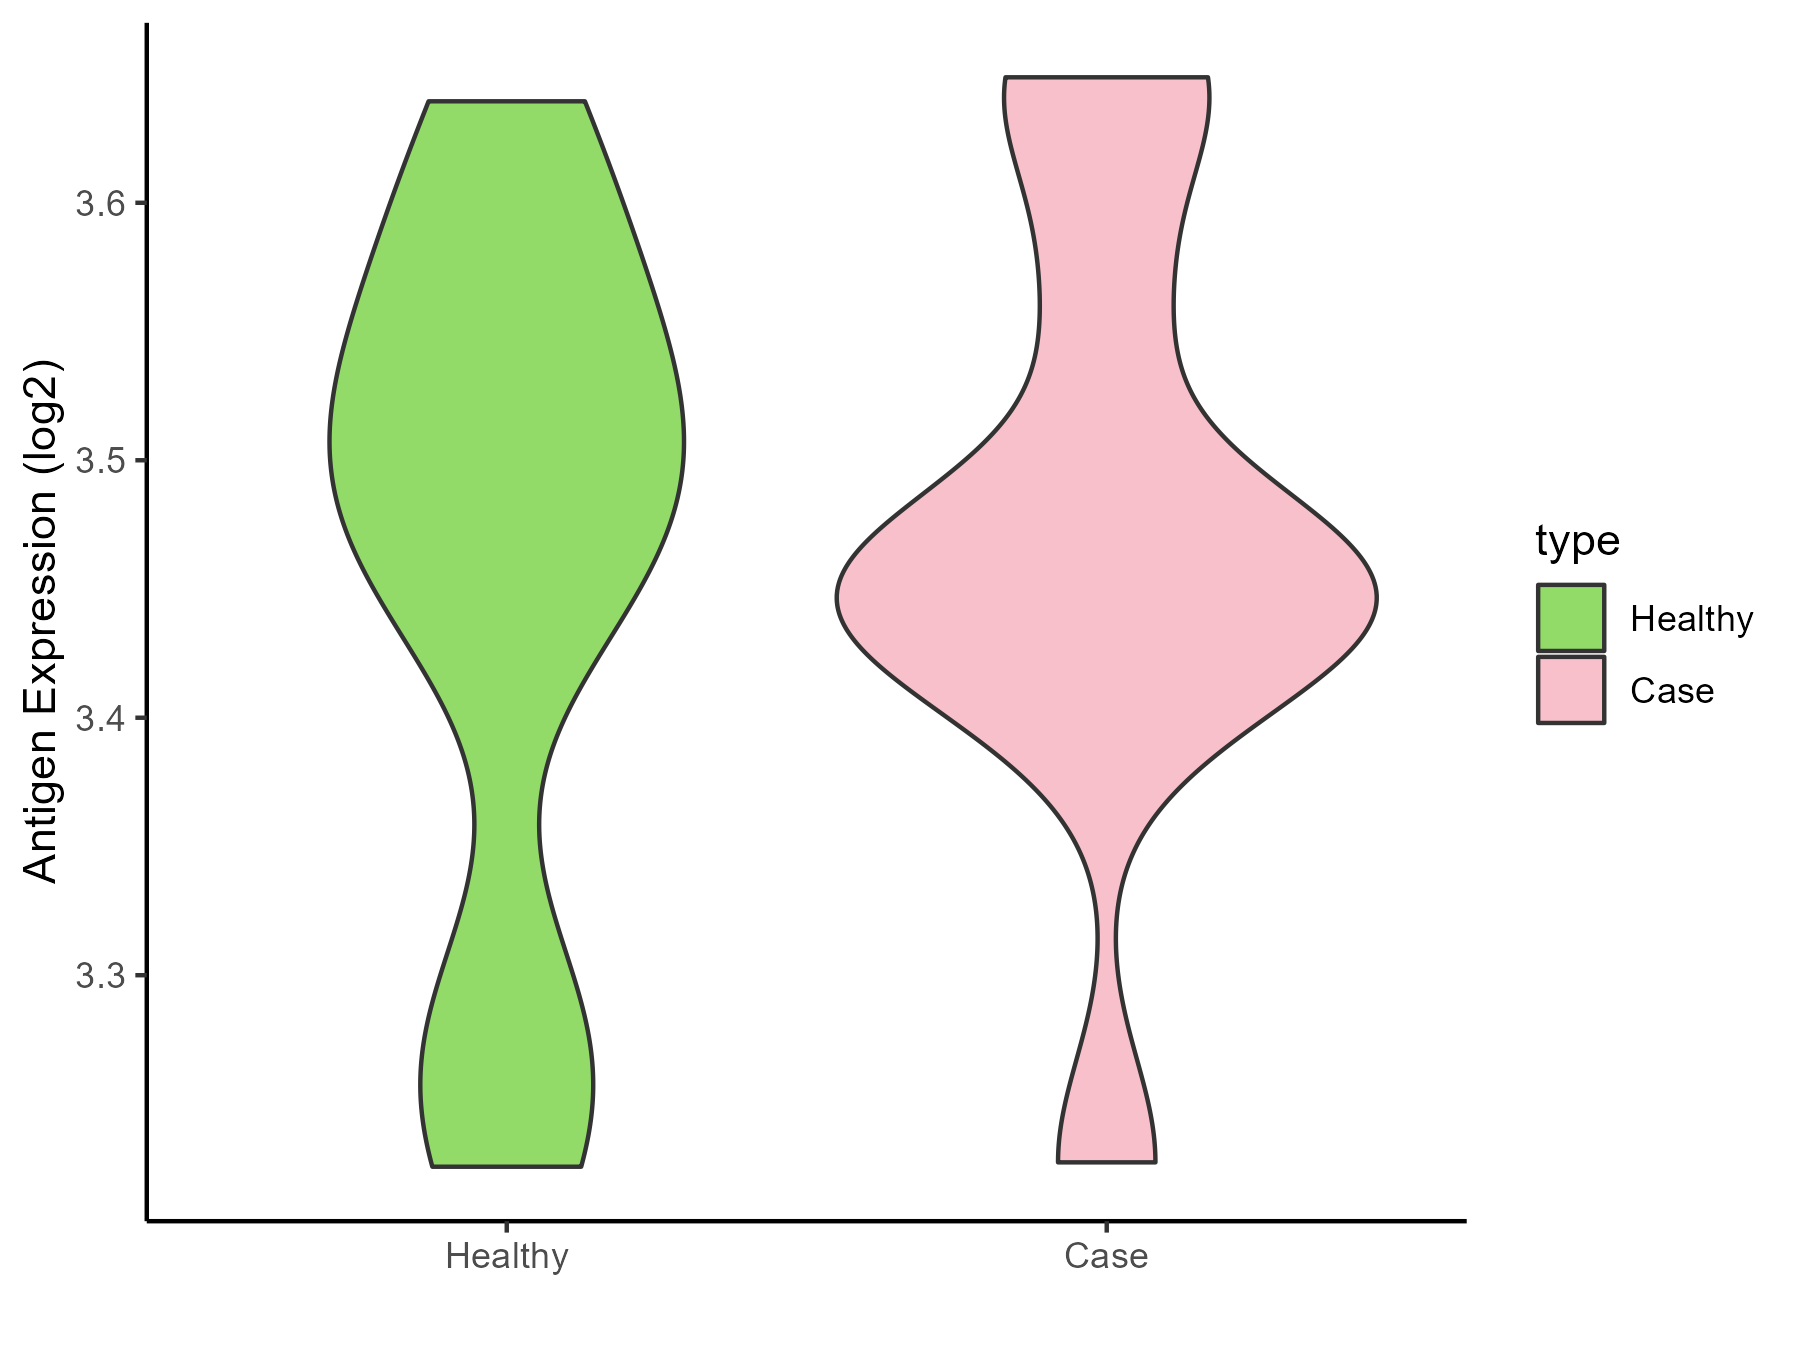
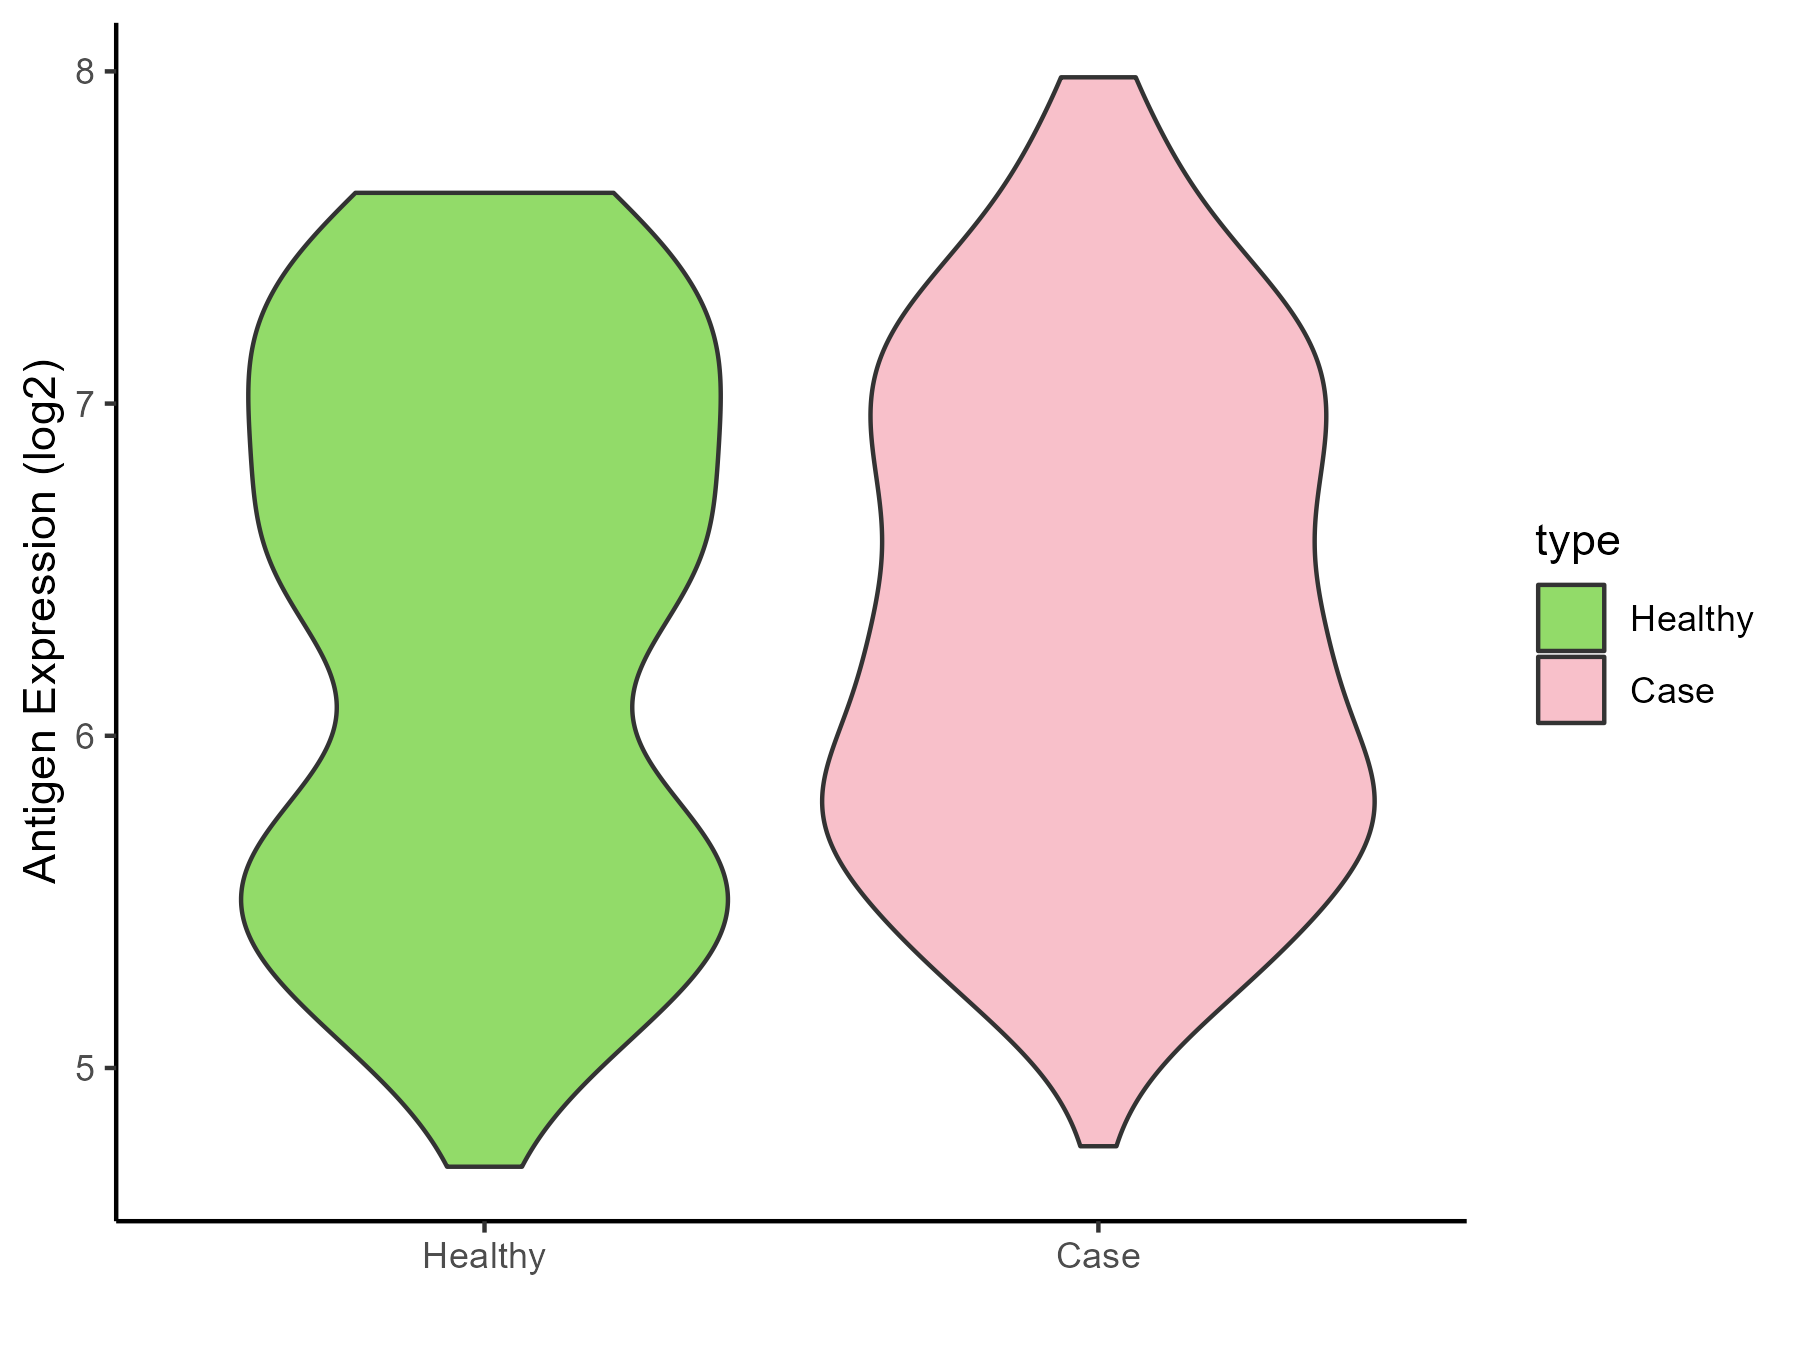
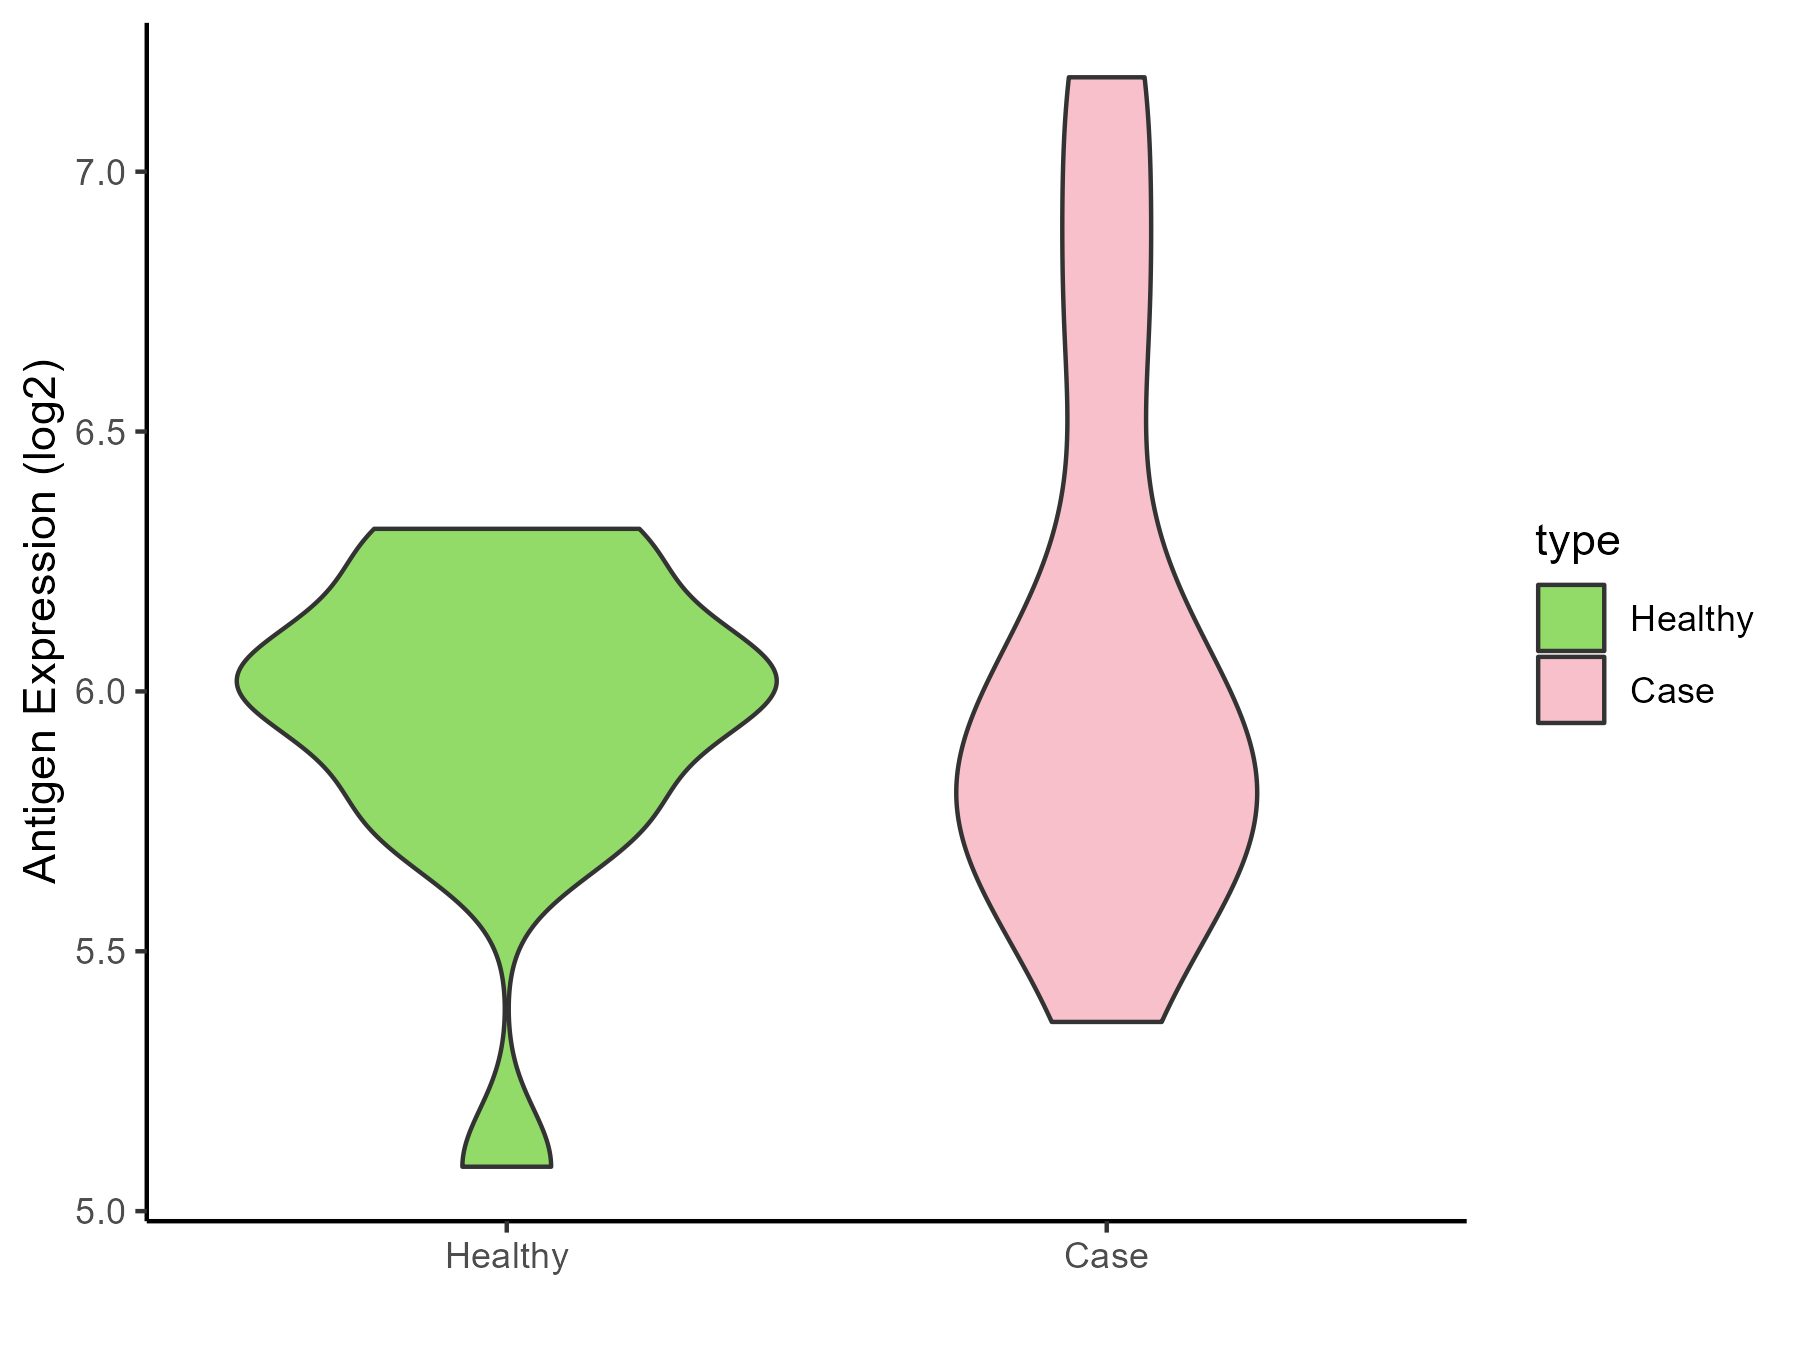
Neuroectodermal tumor |
| The Expression Level of Disease Section Compare with the Healthy Individual Tissue |
p-value: 0.000614713;
Fold-change: 1.144055071;
Z-score: 1.502939666
|
| Disease-specific Antigen Abundances |
|
Click to View the Clearer Original Diagram
|
|
|
| The Studied Tissue |
Nervous |
| The Specific Disease |
Brain cancer |
| The Expression Level of Disease Section Compare with the Healthy Individual Tissue |
p-value: 4.85E-42;
Fold-change: 0.439844183;
Z-score: 0.740921289
|
| Disease-specific Antigen Abundances |
|
Click to View the Clearer Original Diagram
|
|
|
Chronic myeloid leukemia [ICD-11: 2A20]
Click to Show/Hide
| Differential expression pattern of antigen in diseases |
| The Studied Tissue |
Whole blood |
| The Specific Disease |
Polycythemia vera |
| The Expression Level of Disease Section Compare with the Healthy Individual Tissue |
p-value: 7.17E-07;
Fold-change: 0.274826585;
Z-score: 1.098979756
|
| Disease-specific Antigen Abundances |
|
Click to View the Clearer Original Diagram
|
|
|
| The Studied Tissue |
Whole blood |
| The Specific Disease |
Myelofibrosis |
| The Expression Level of Disease Section Compare with the Healthy Individual Tissue |
p-value: 0.451887953;
Fold-change: 0.084321788;
Z-score: 0.430871055
|
| Disease-specific Antigen Abundances |
|
Click to View the Clearer Original Diagram
|
|
|
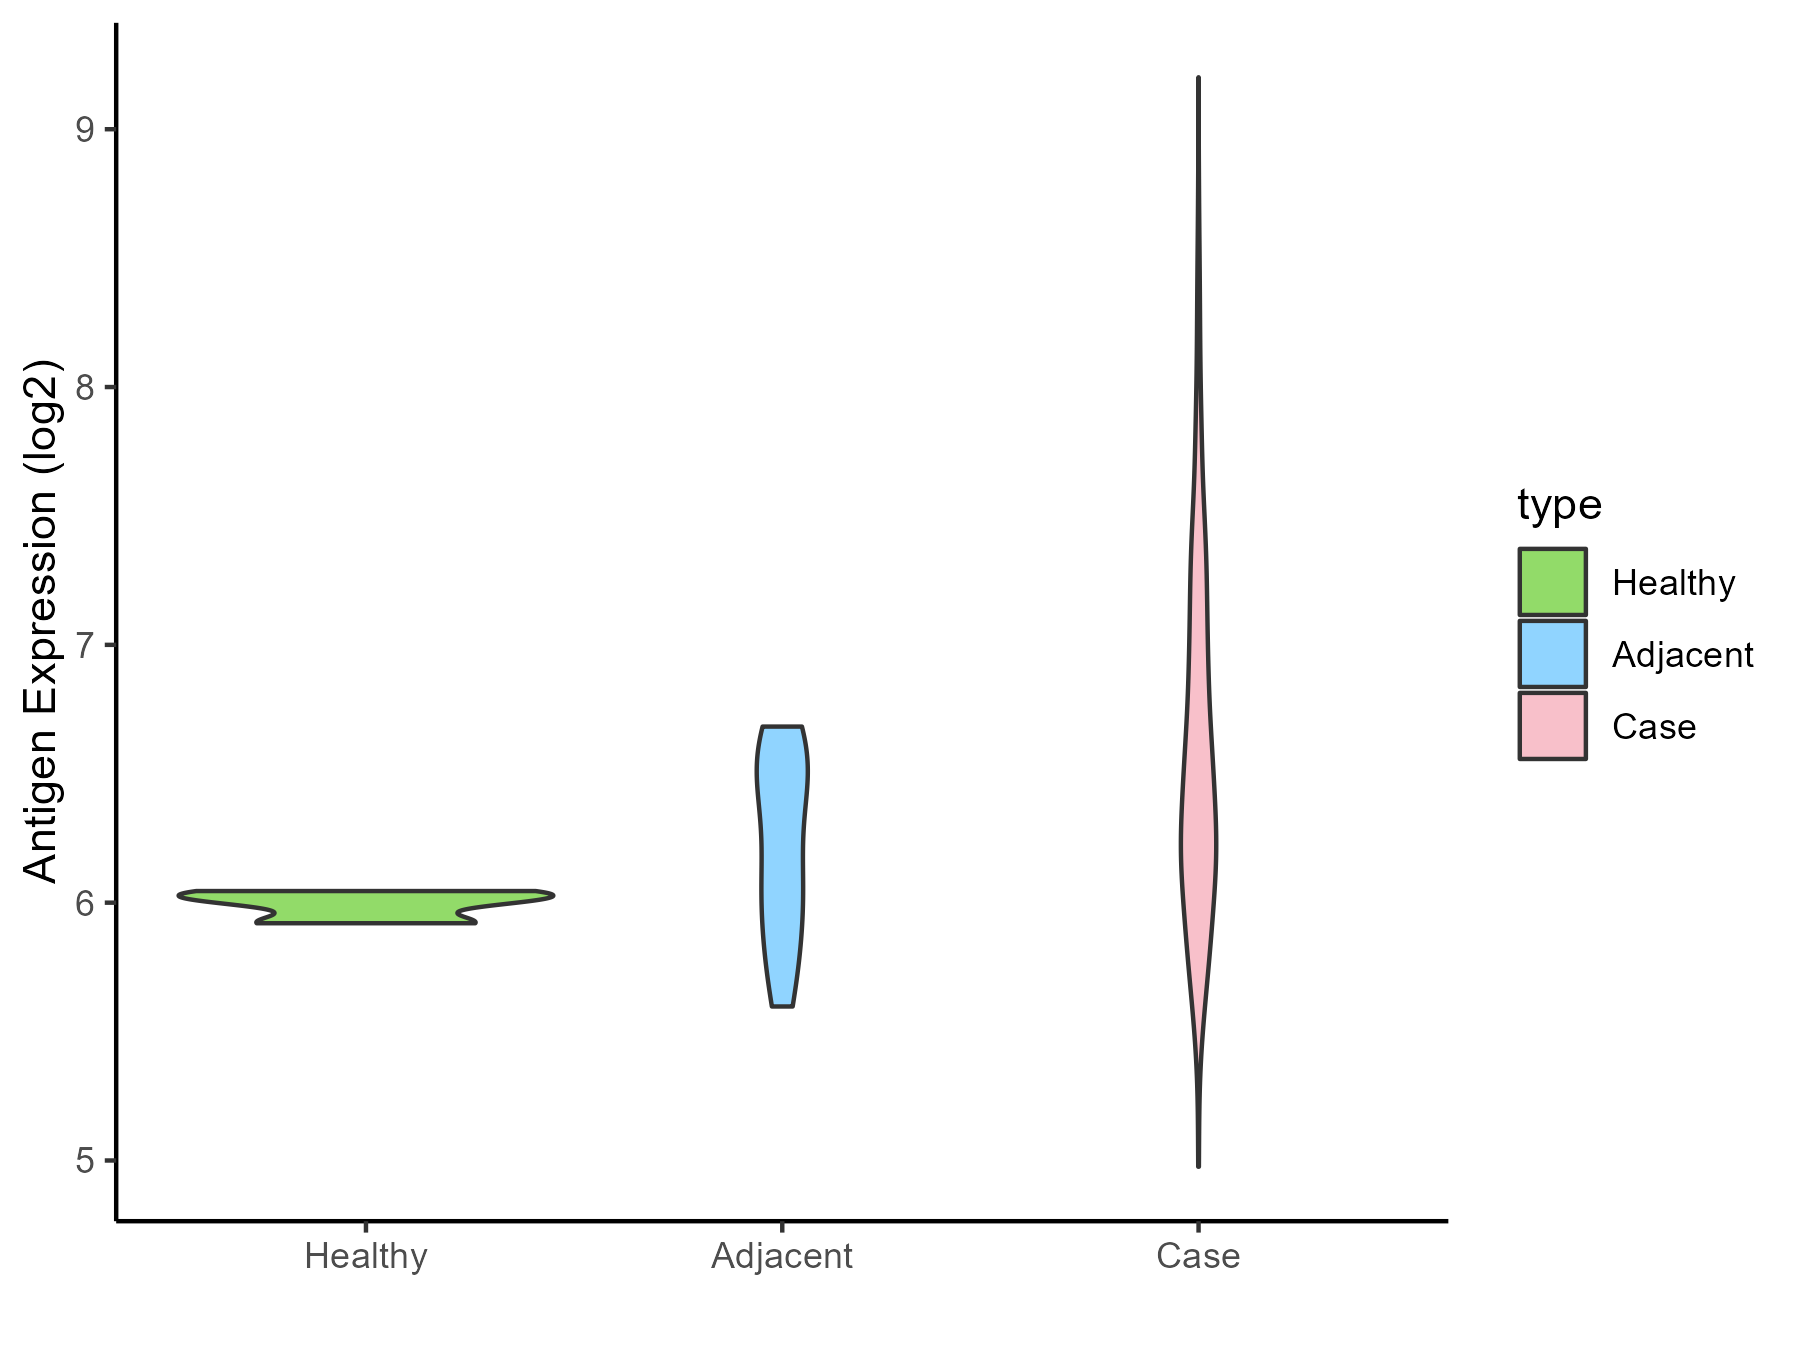
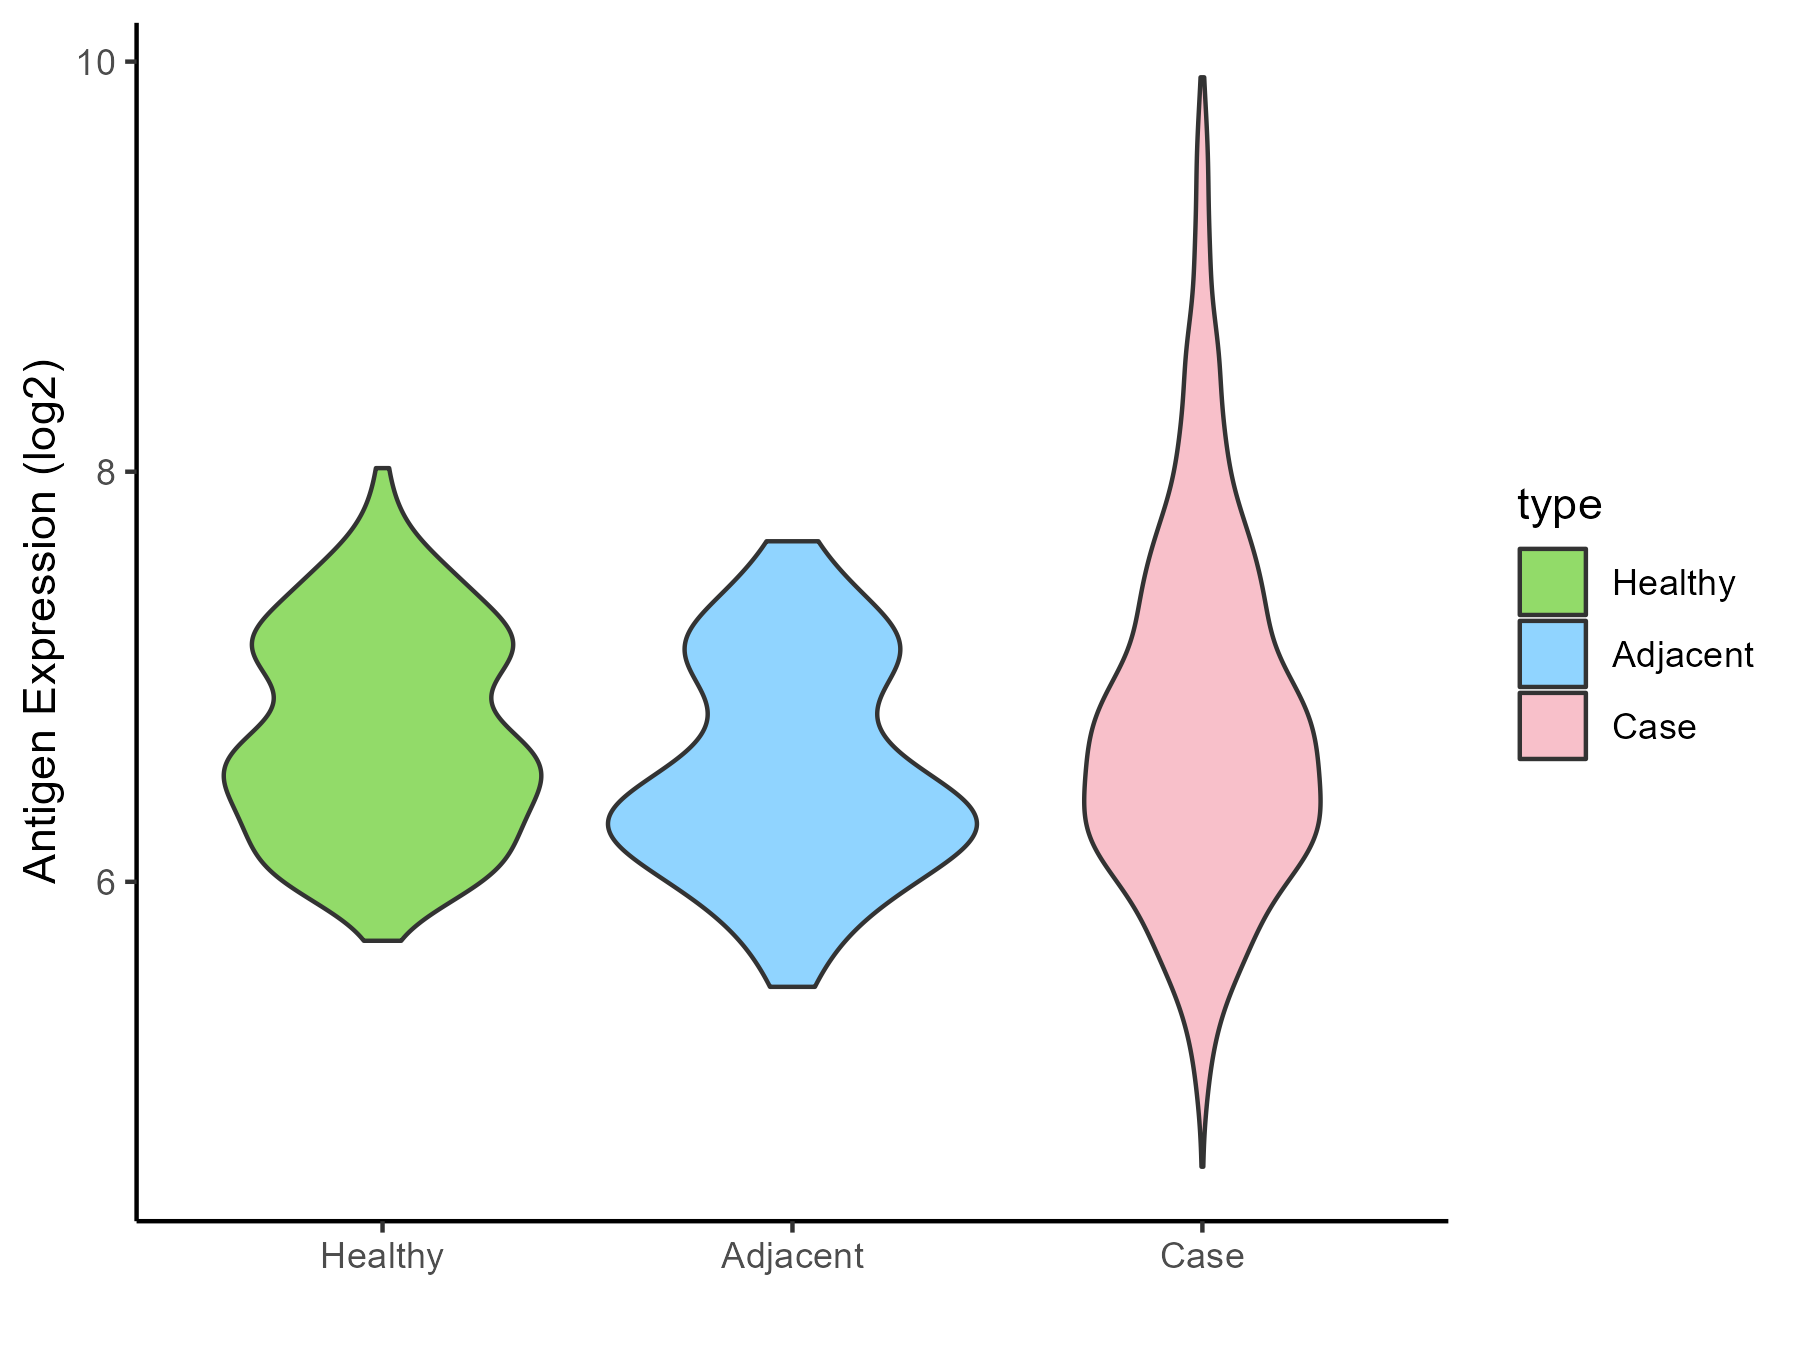
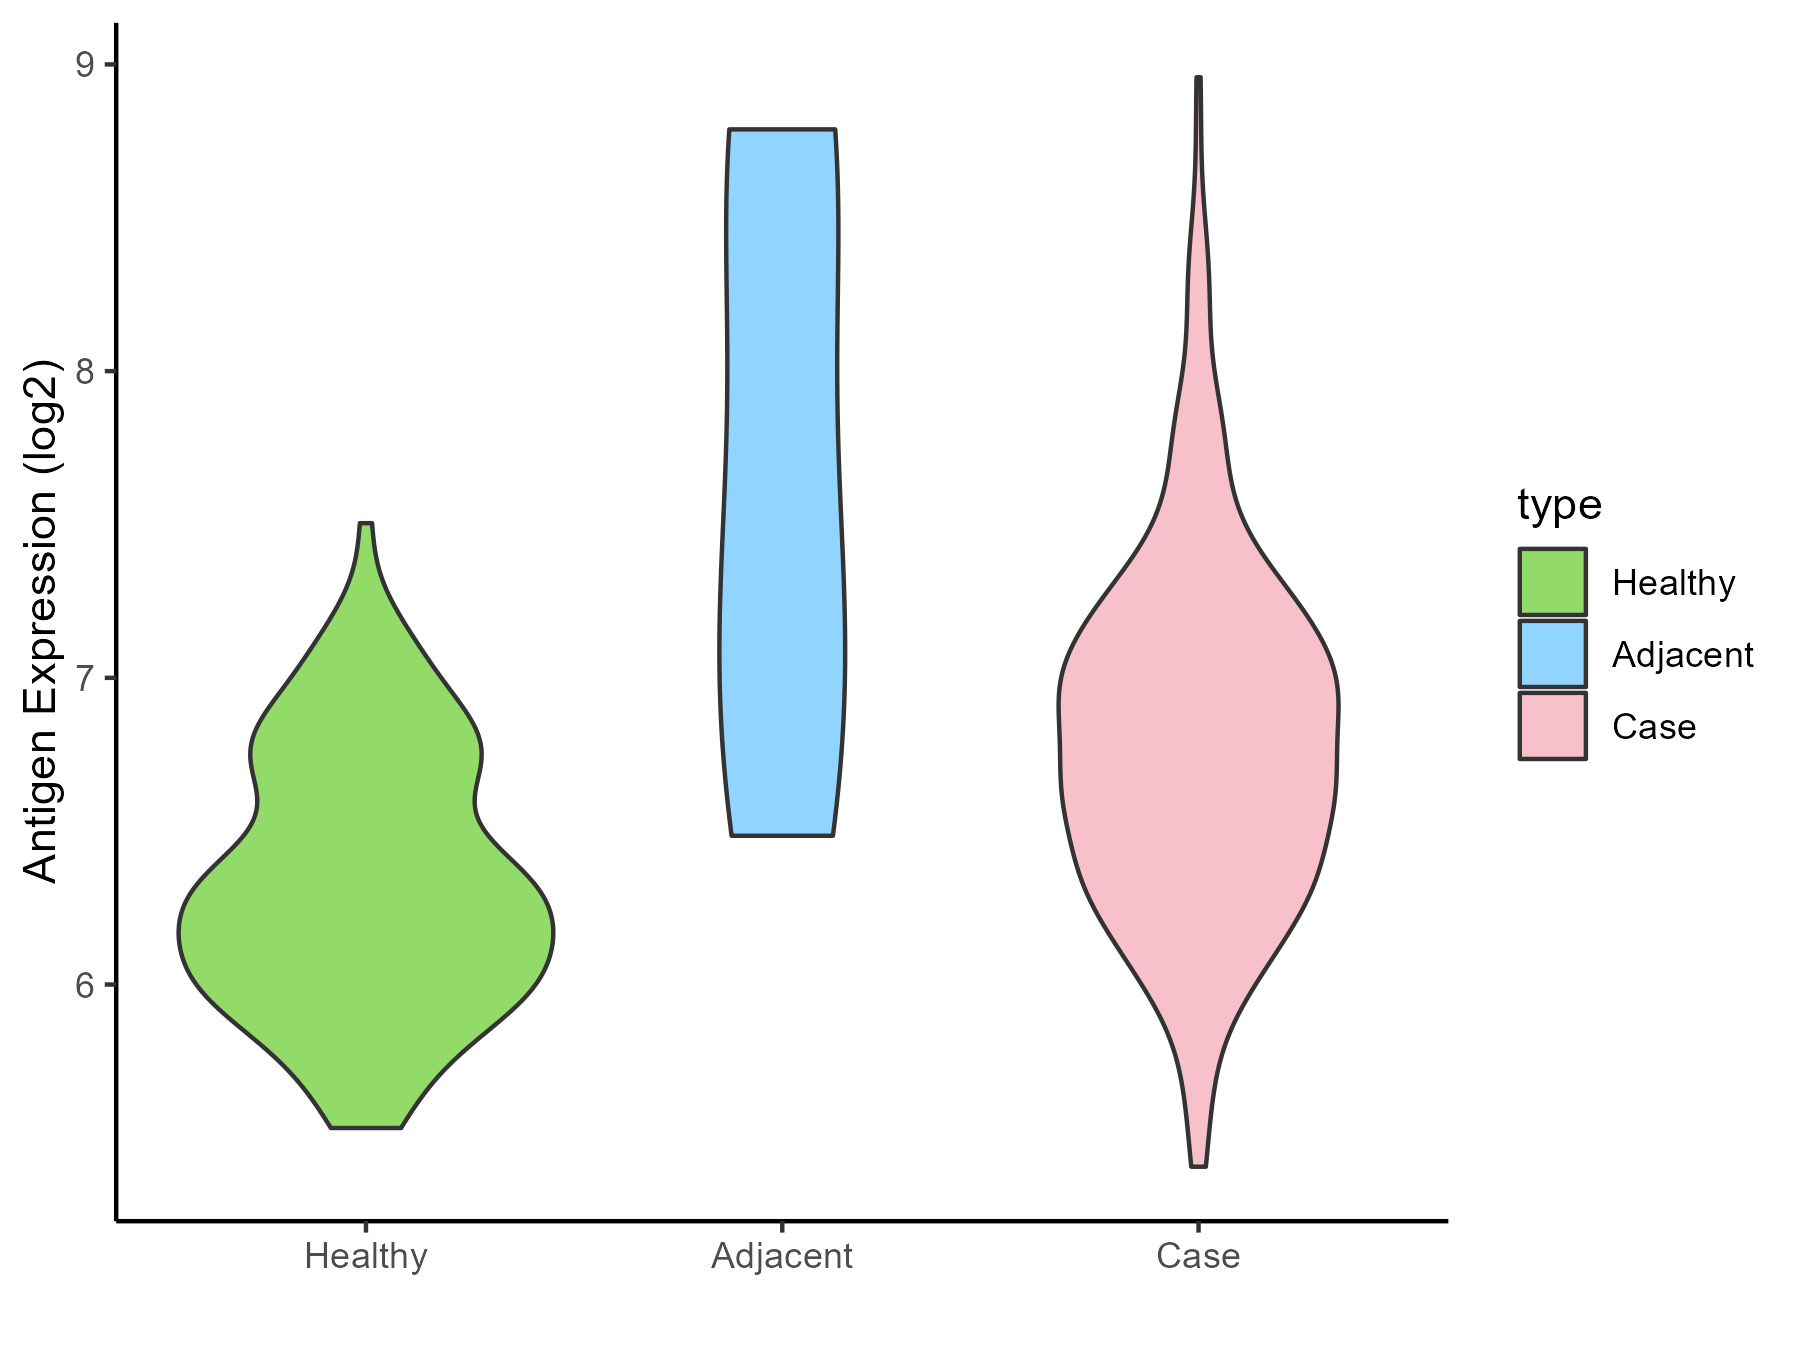
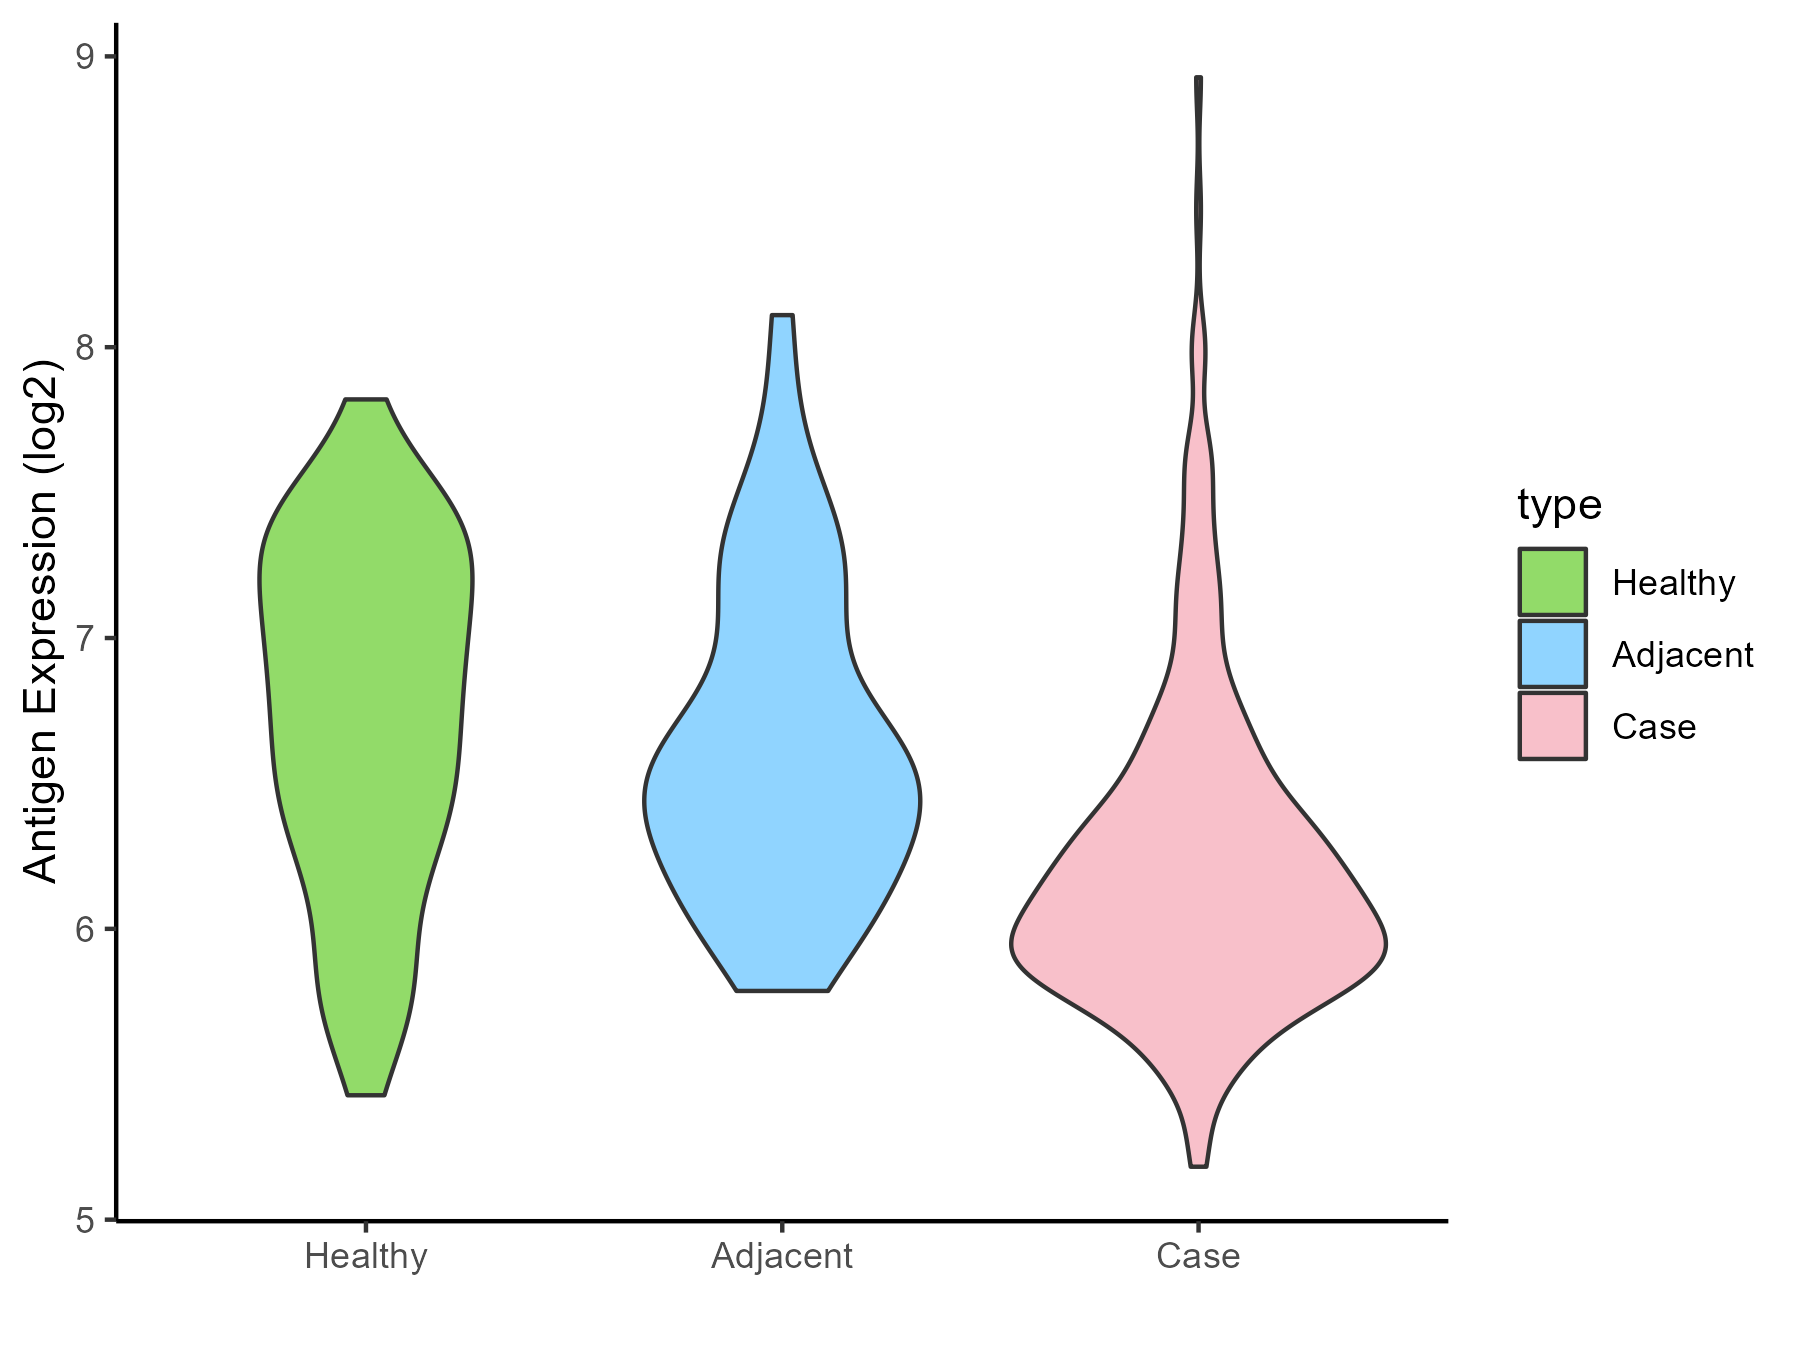
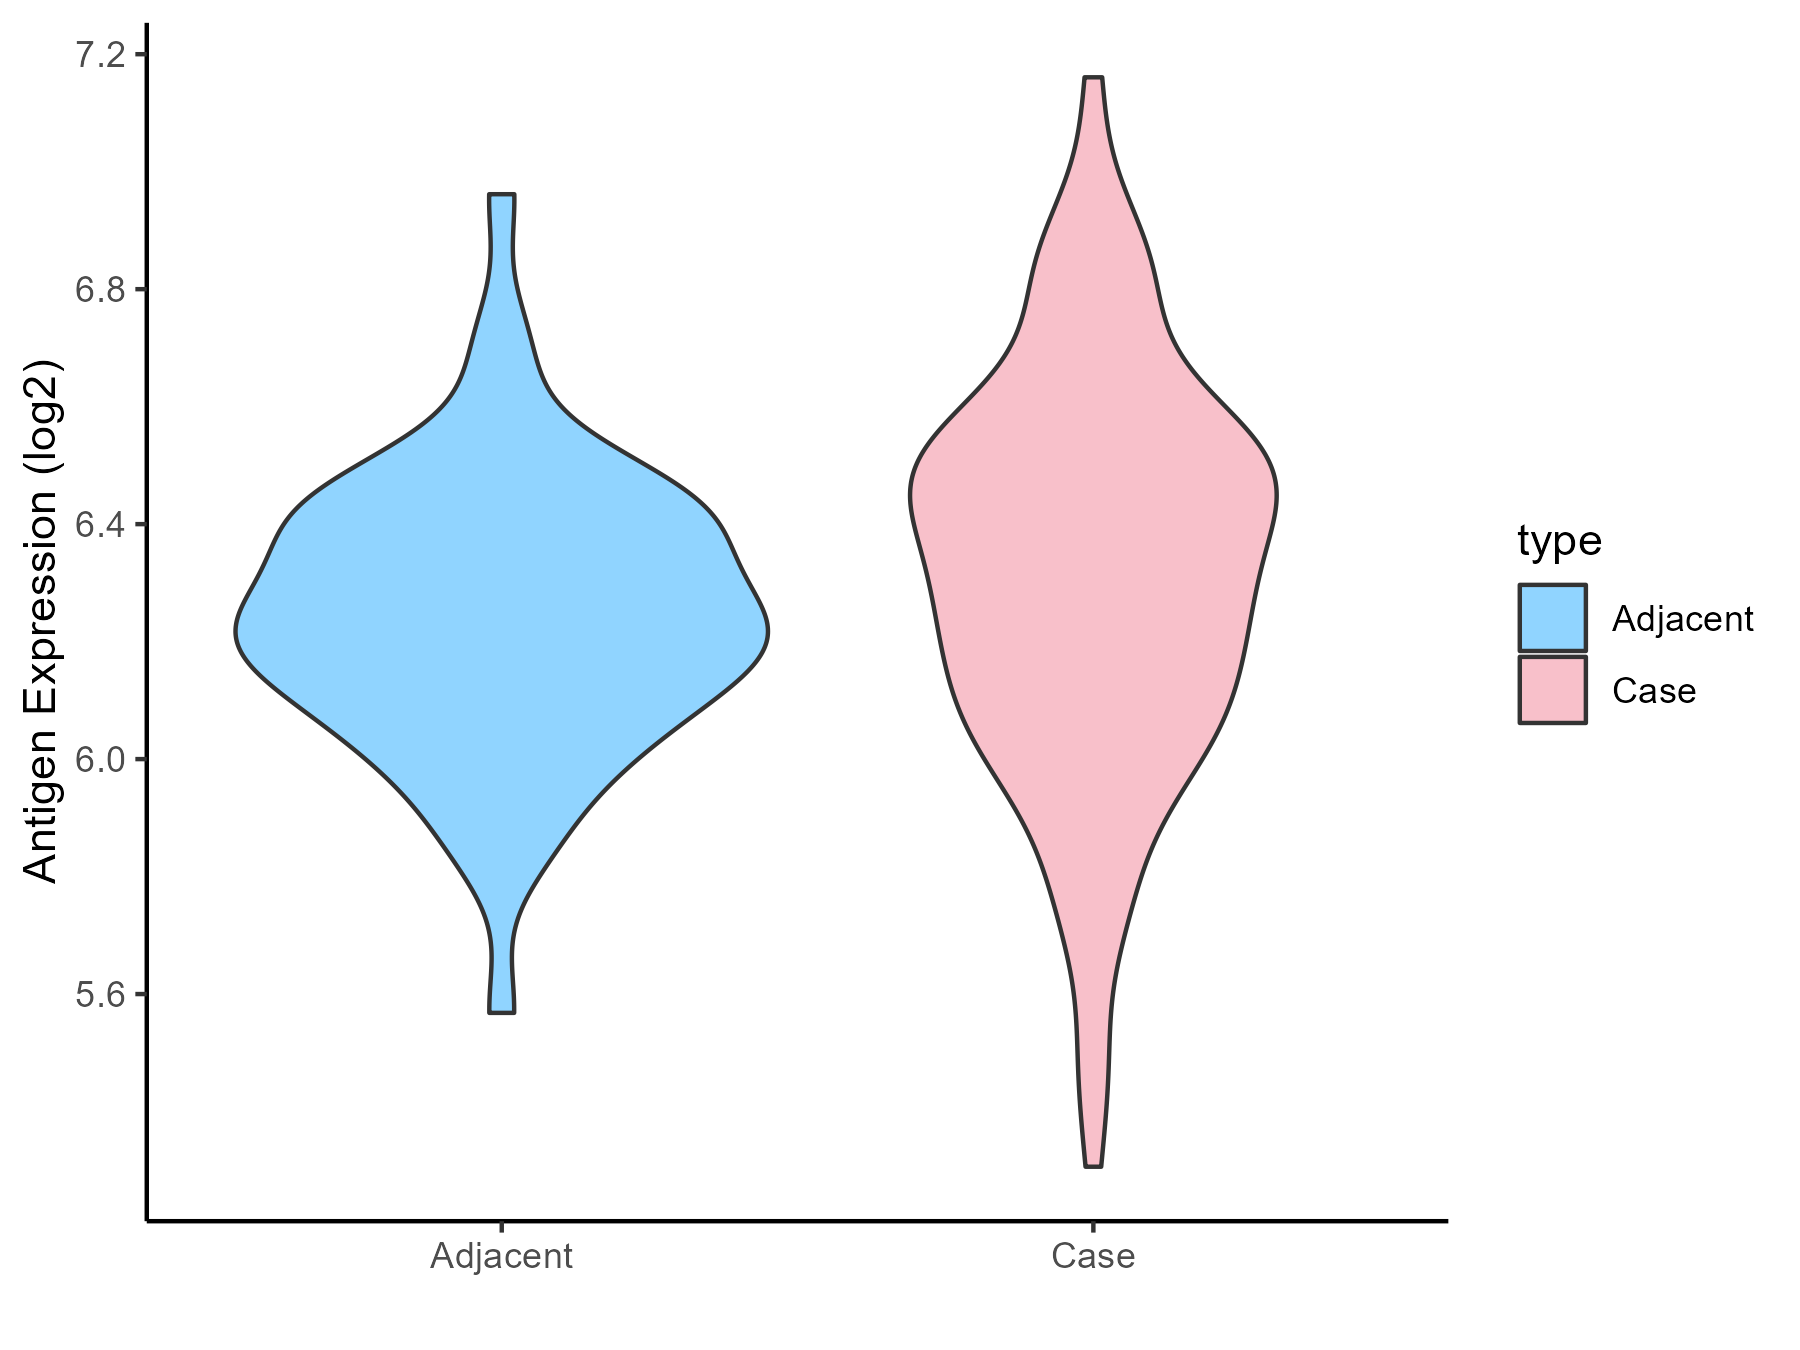
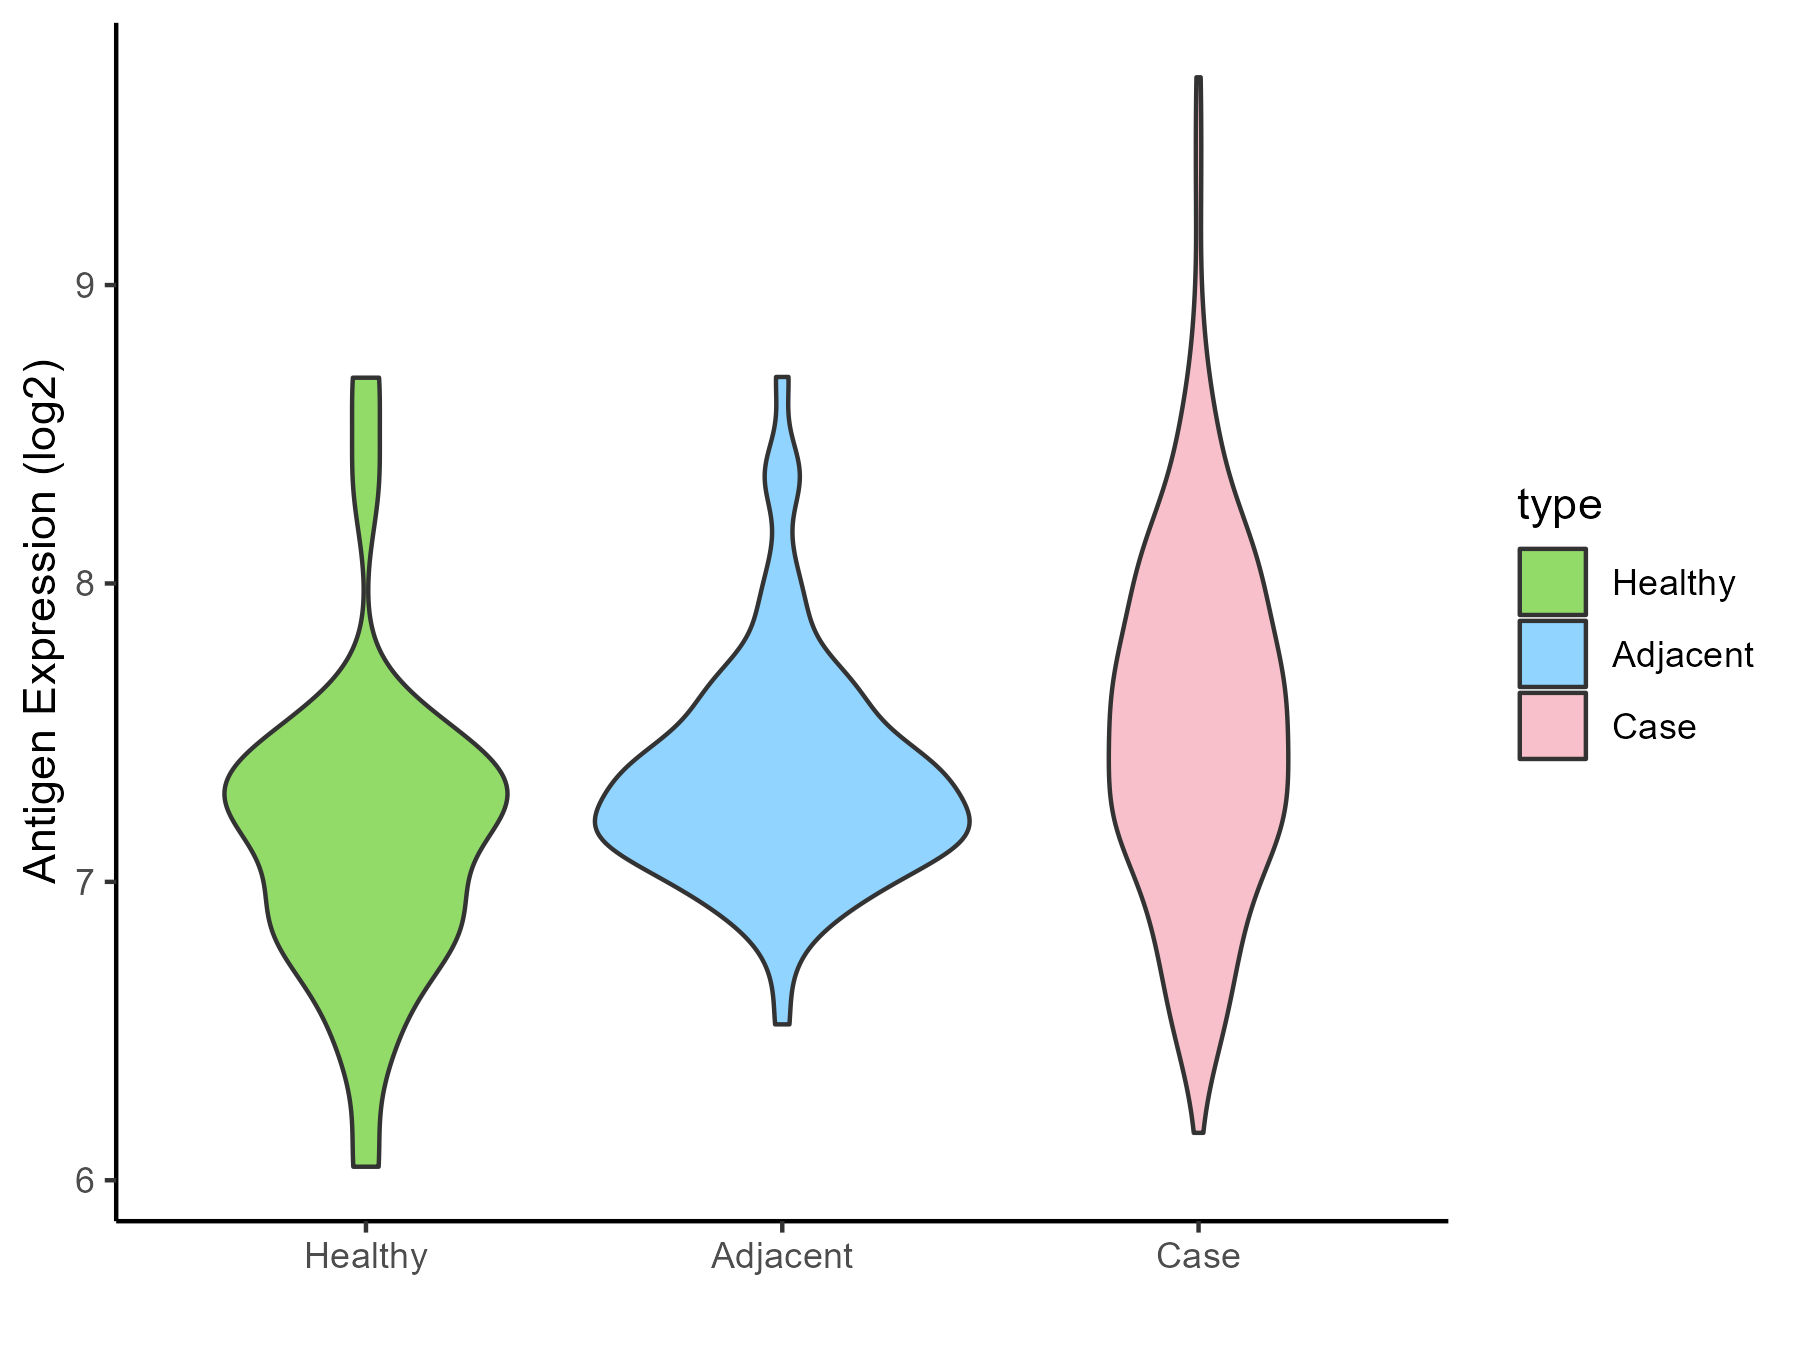
MyeloDysplastic syndromes [ICD-11: 2A37]
Click to Show/Hide
| Differential expression pattern of antigen in diseases |
| The Studied Tissue |
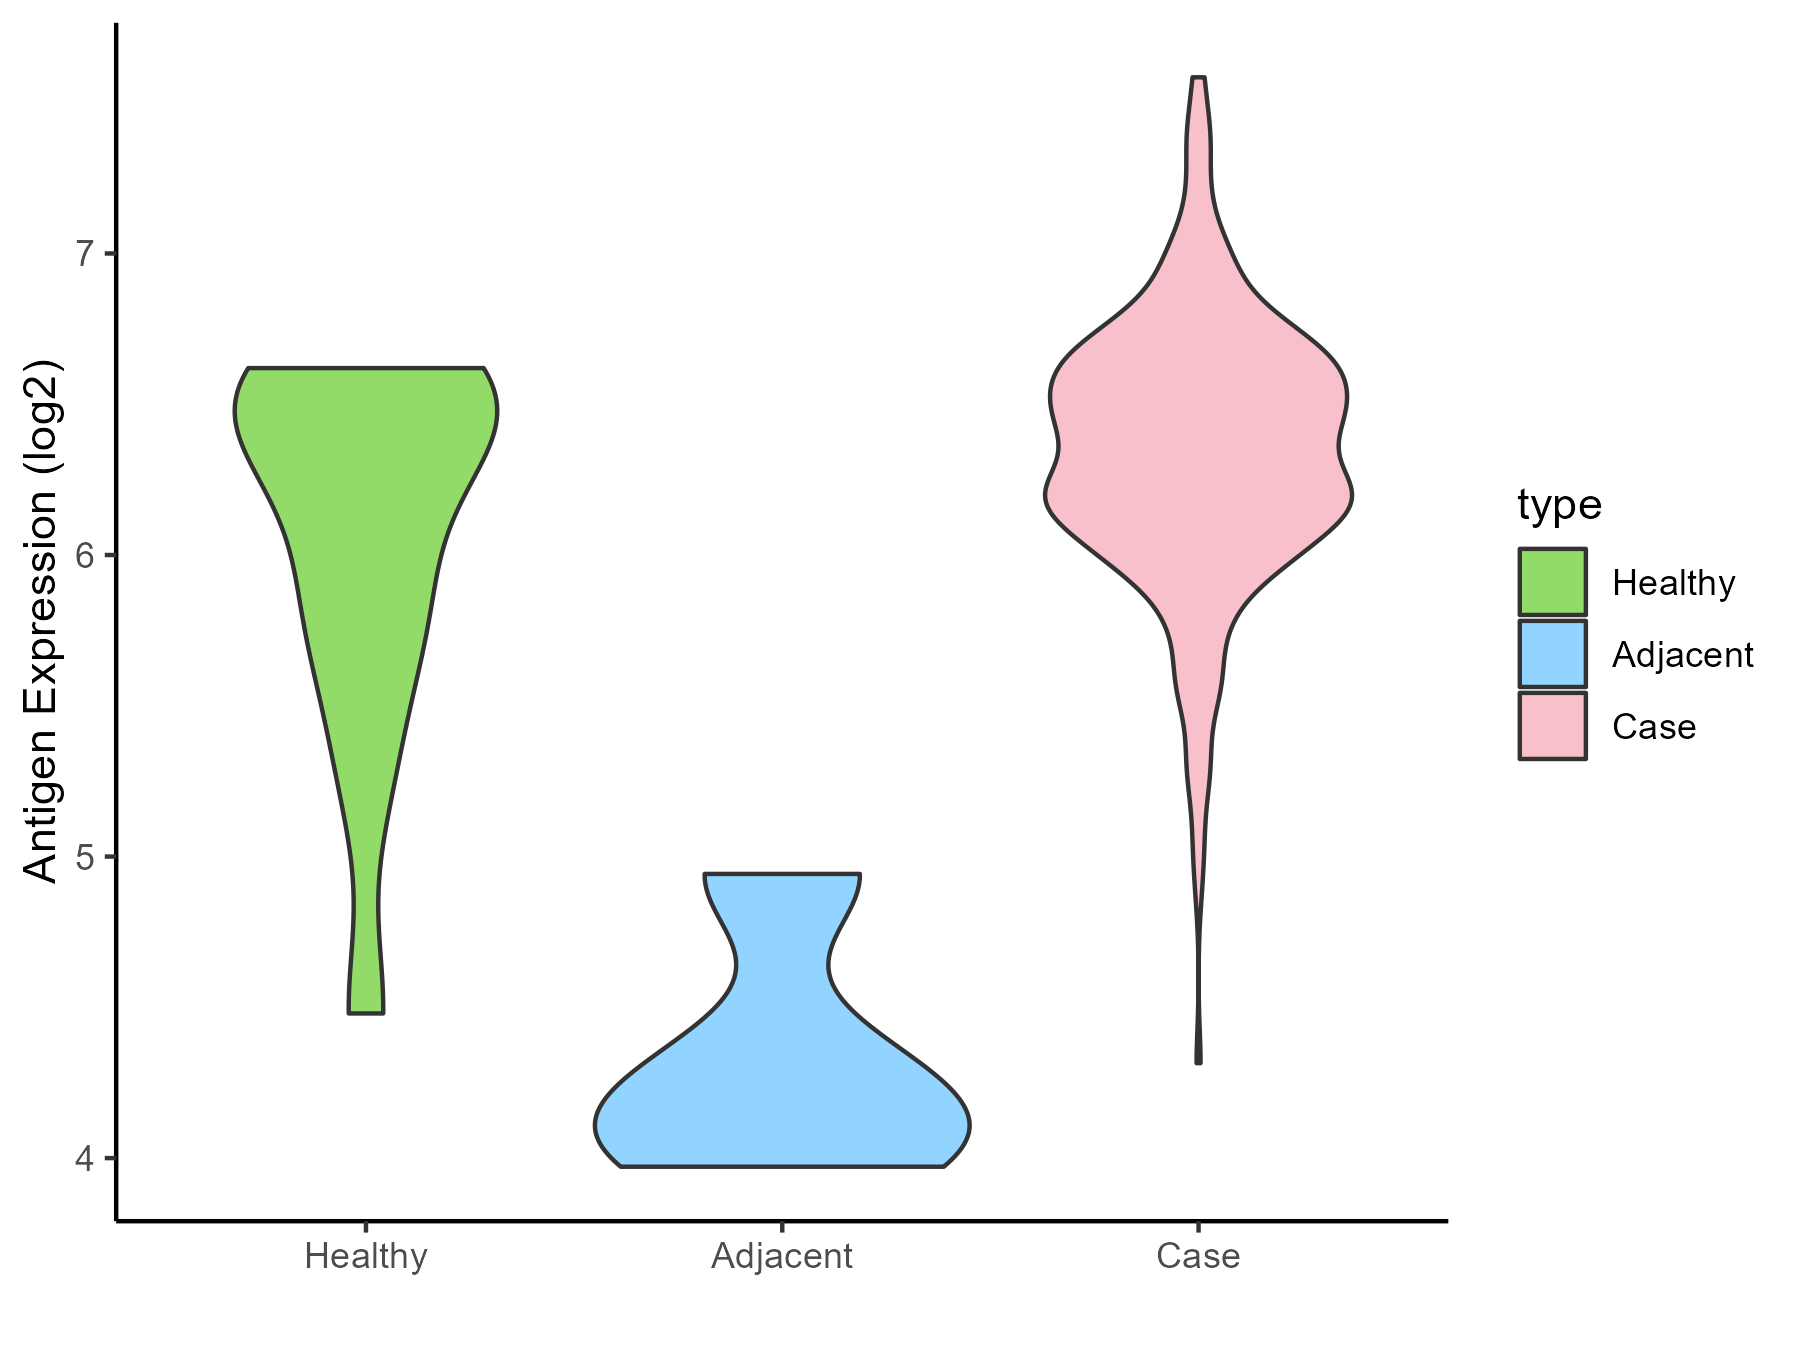
Bone marrow |
| The Specific Disease |
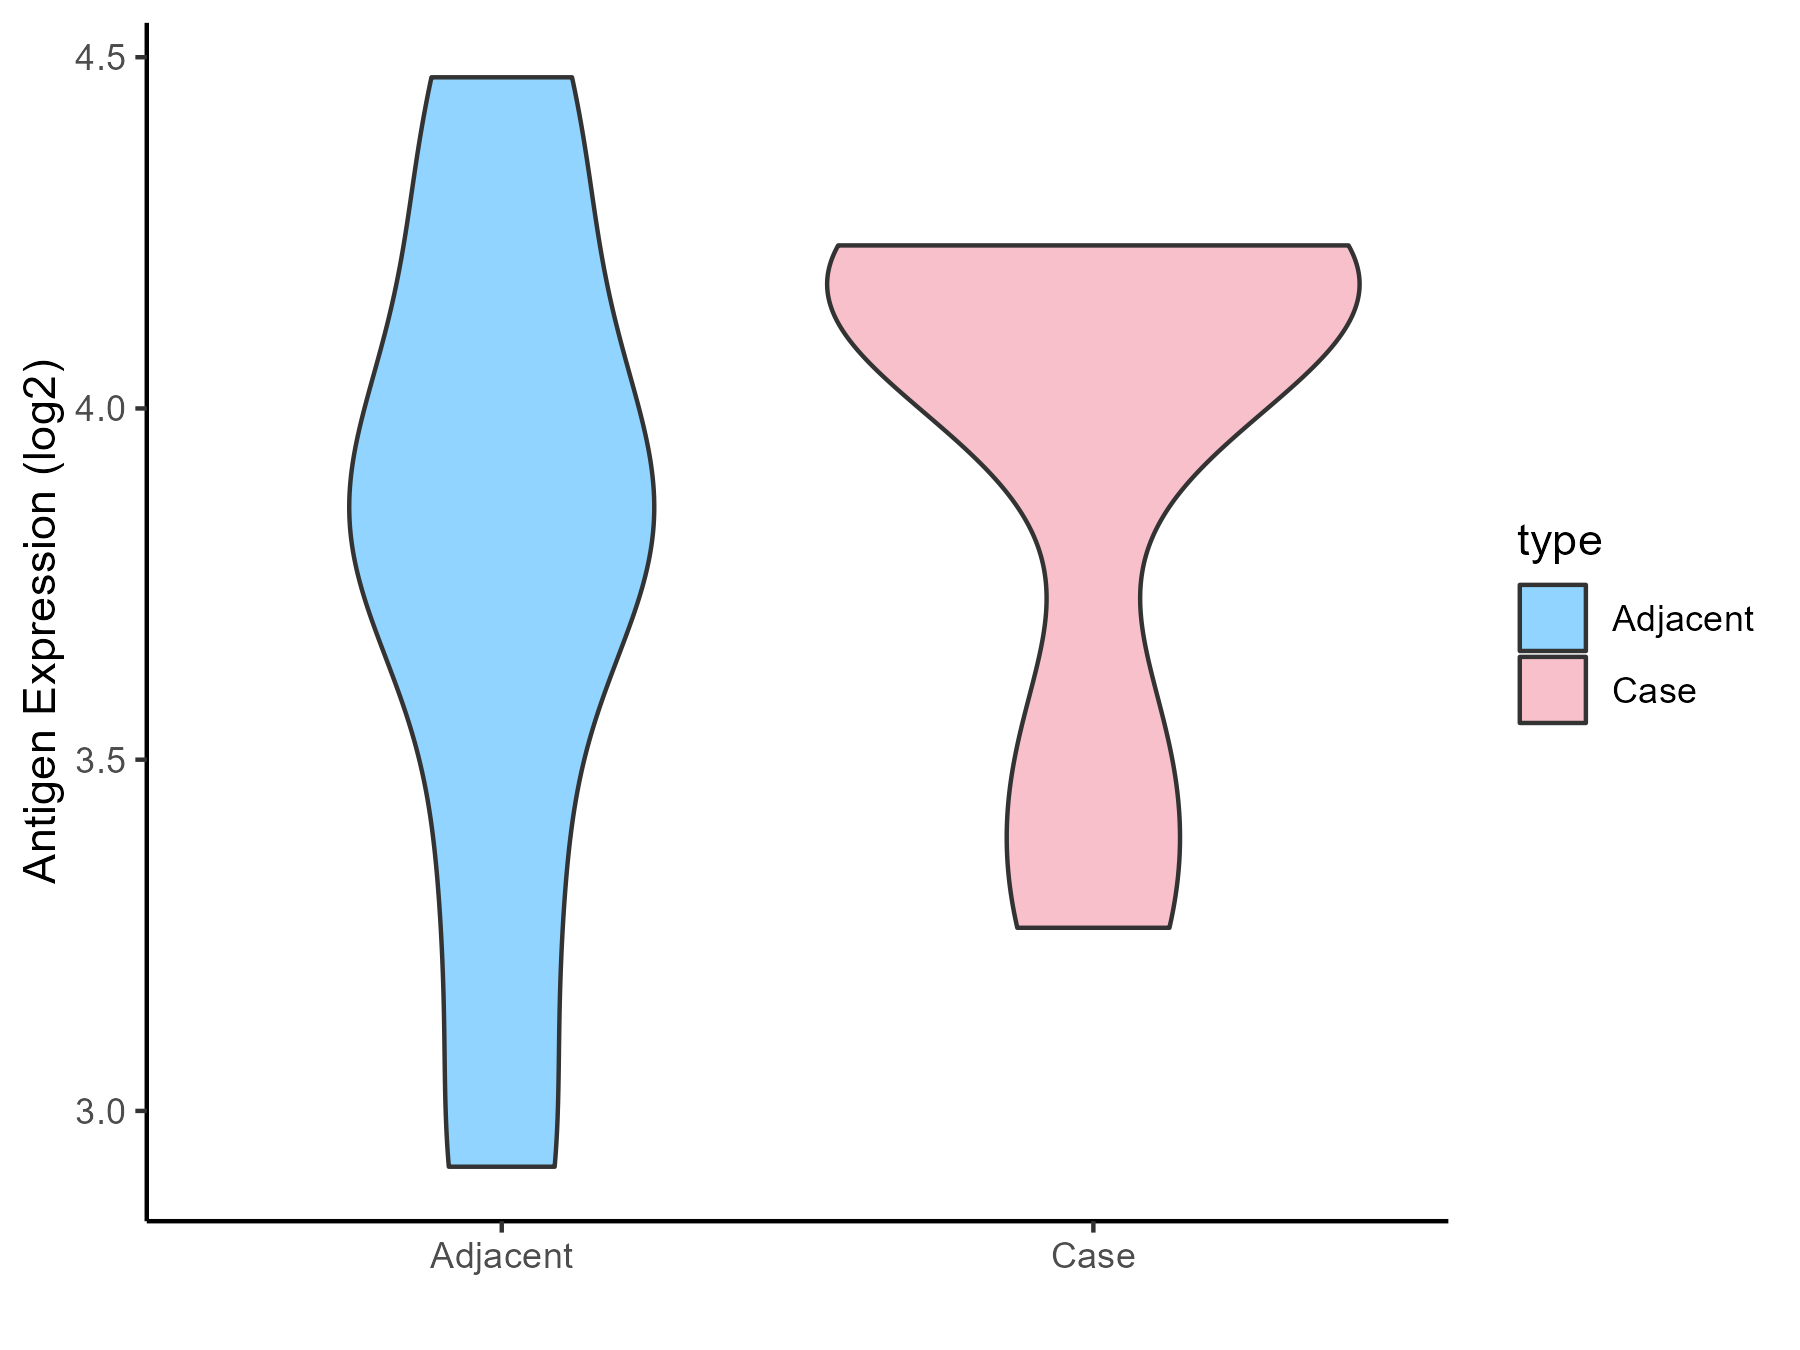
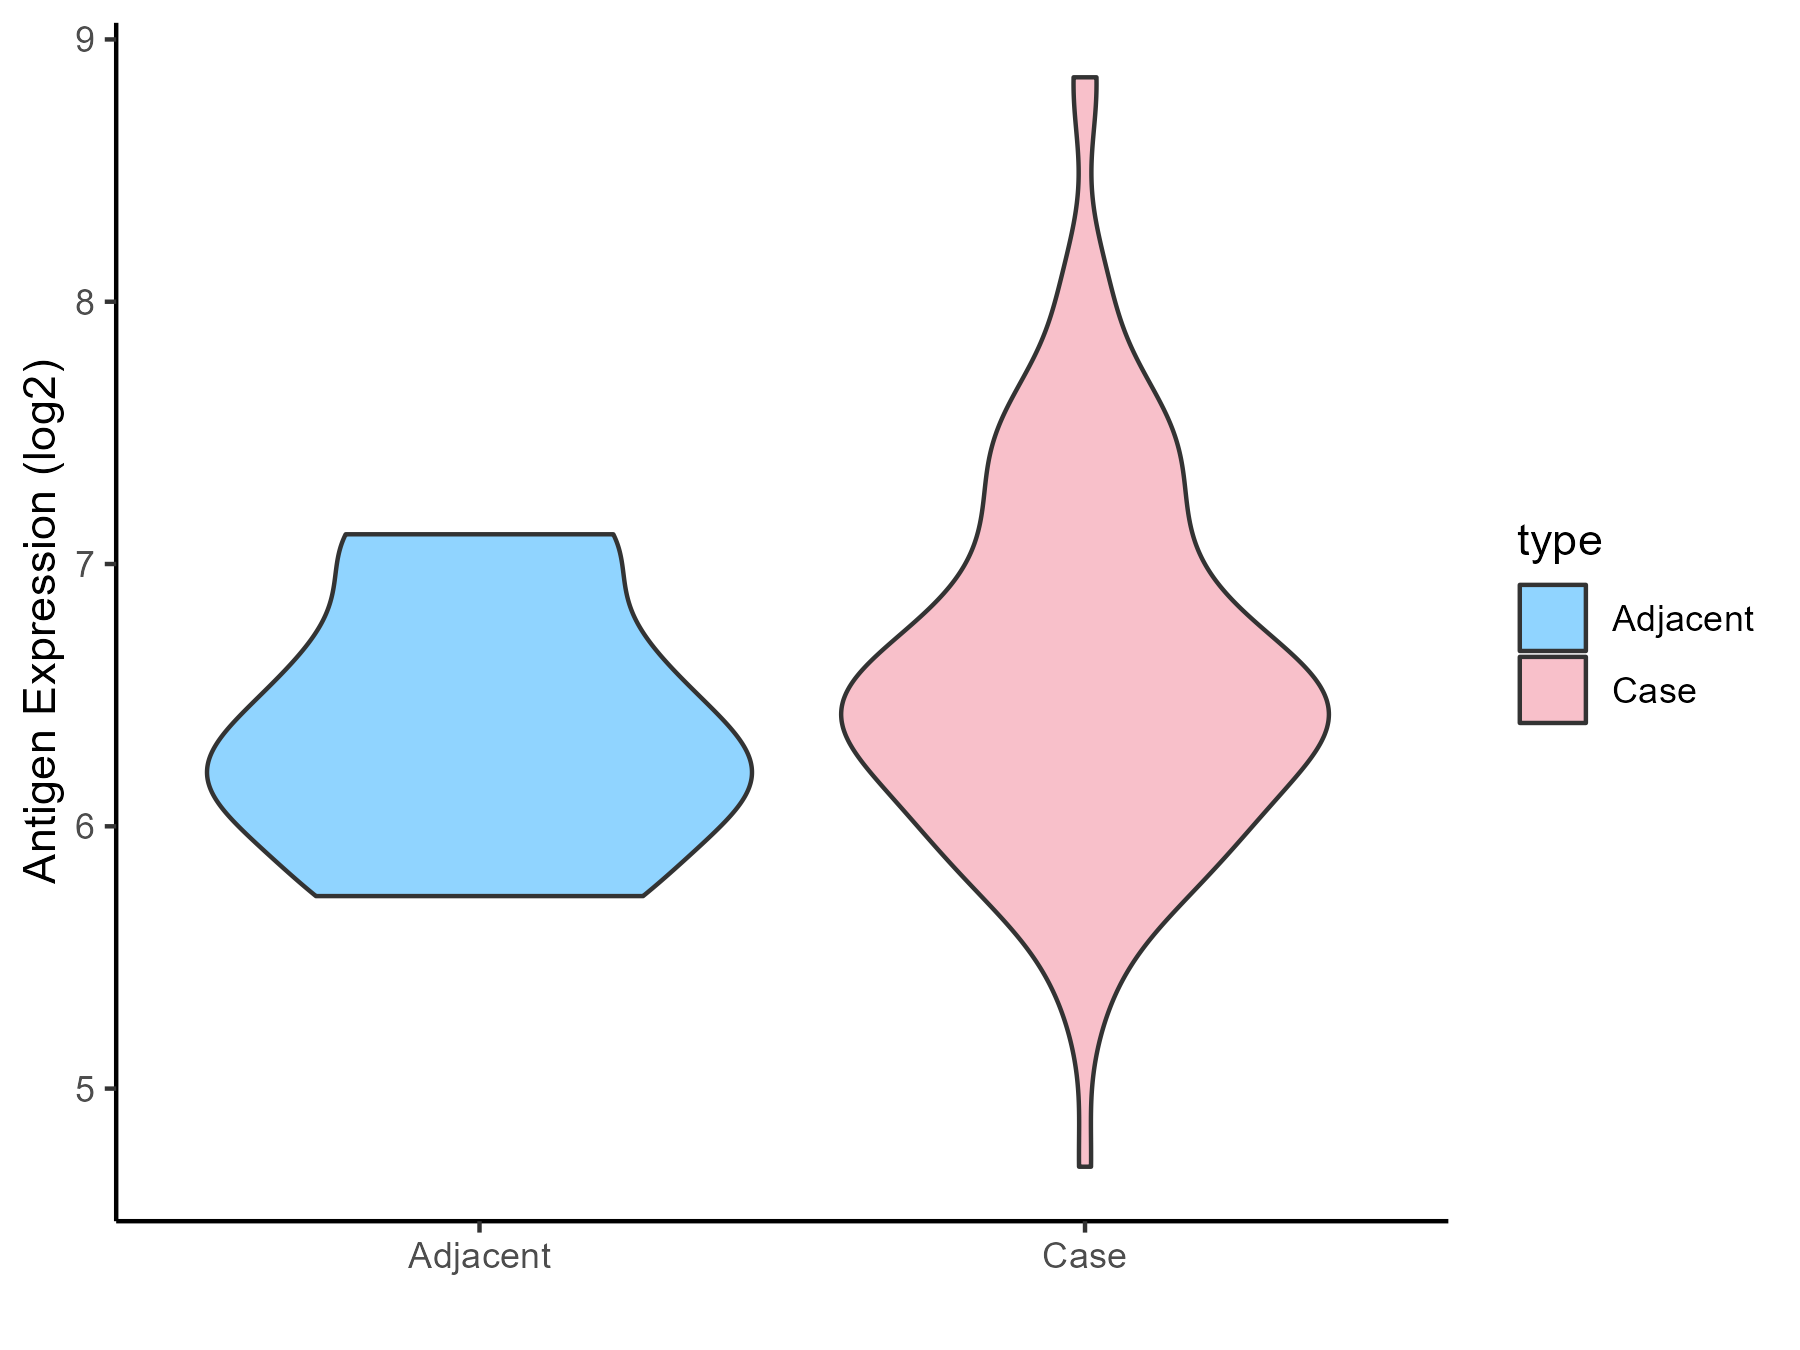
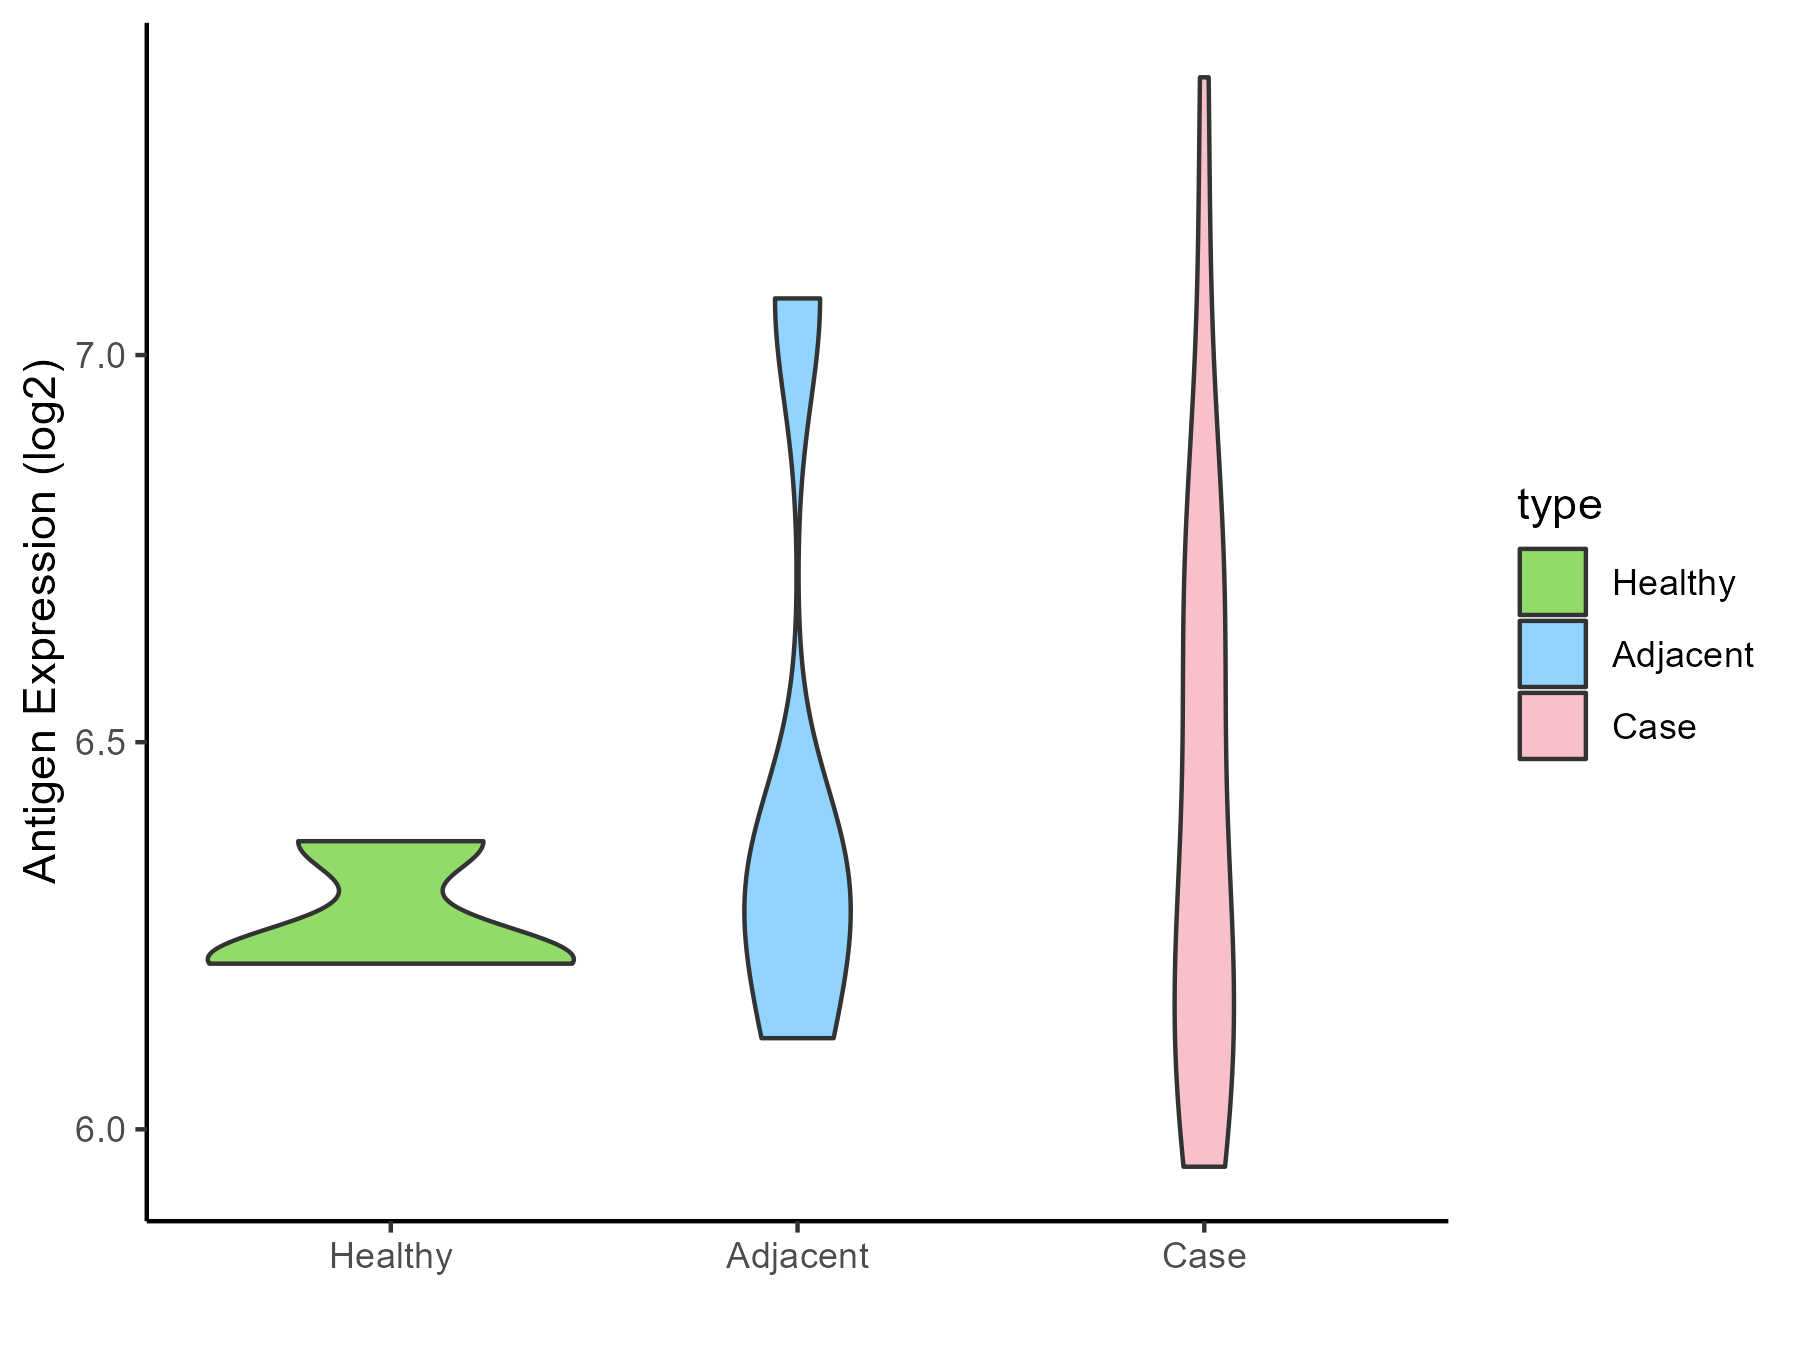
Myelodysplastic syndromes |
| The Expression Level of Disease Section Compare with the Healthy Individual Tissue |
p-value: 0.02794561;
Fold-change: 0.06697299;
Z-score: 0.108535676
|
| The Expression Level of Disease Section Compare with the Adjacent Tissue |
p-value: 0.002365746;
Fold-change: 2.185698954;
Z-score: 5.060238245
|
| Disease-specific Antigen Abundances |
|
Click to View the Clearer Original Diagram
|
|
|
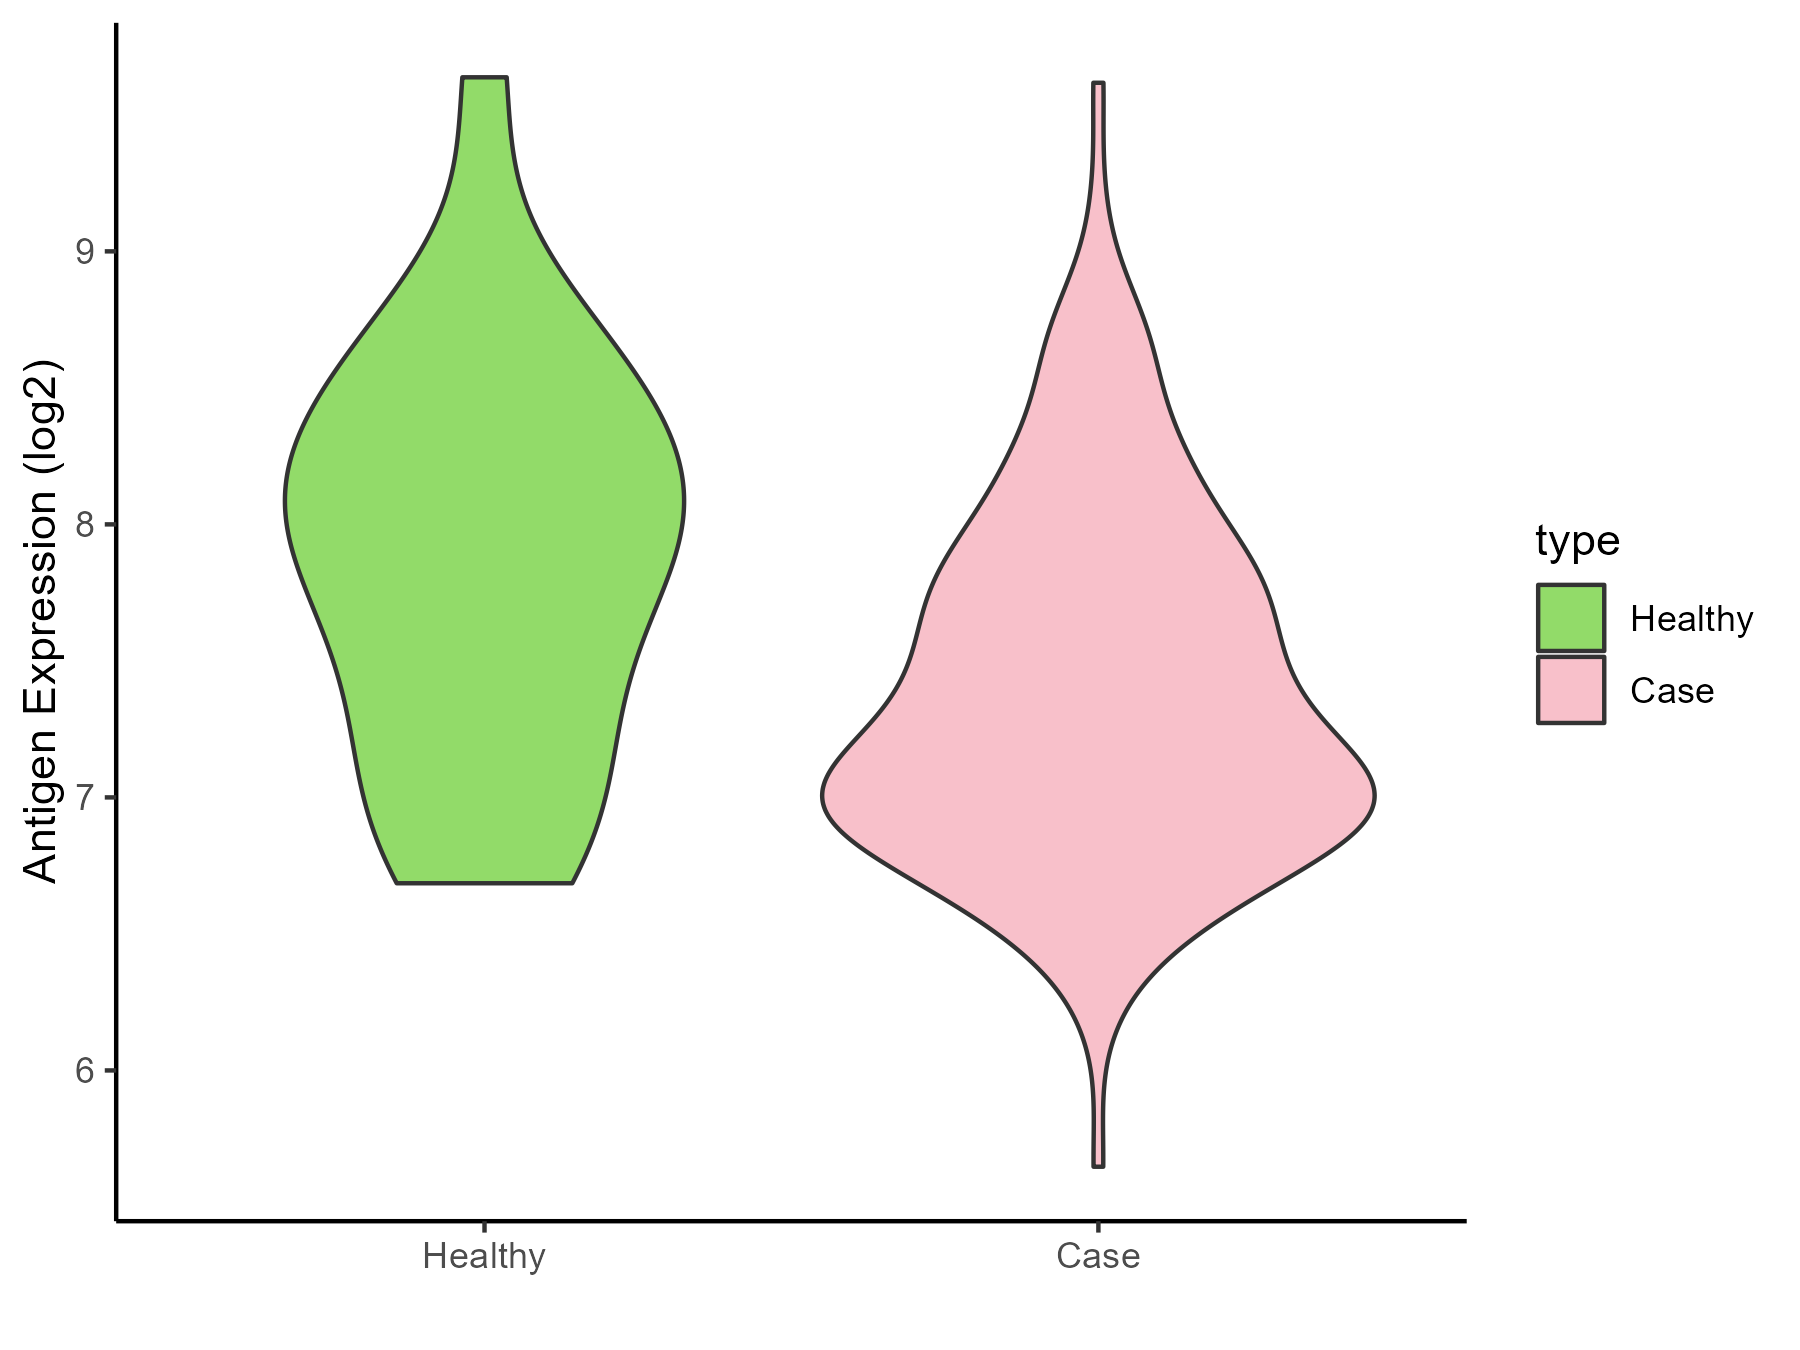
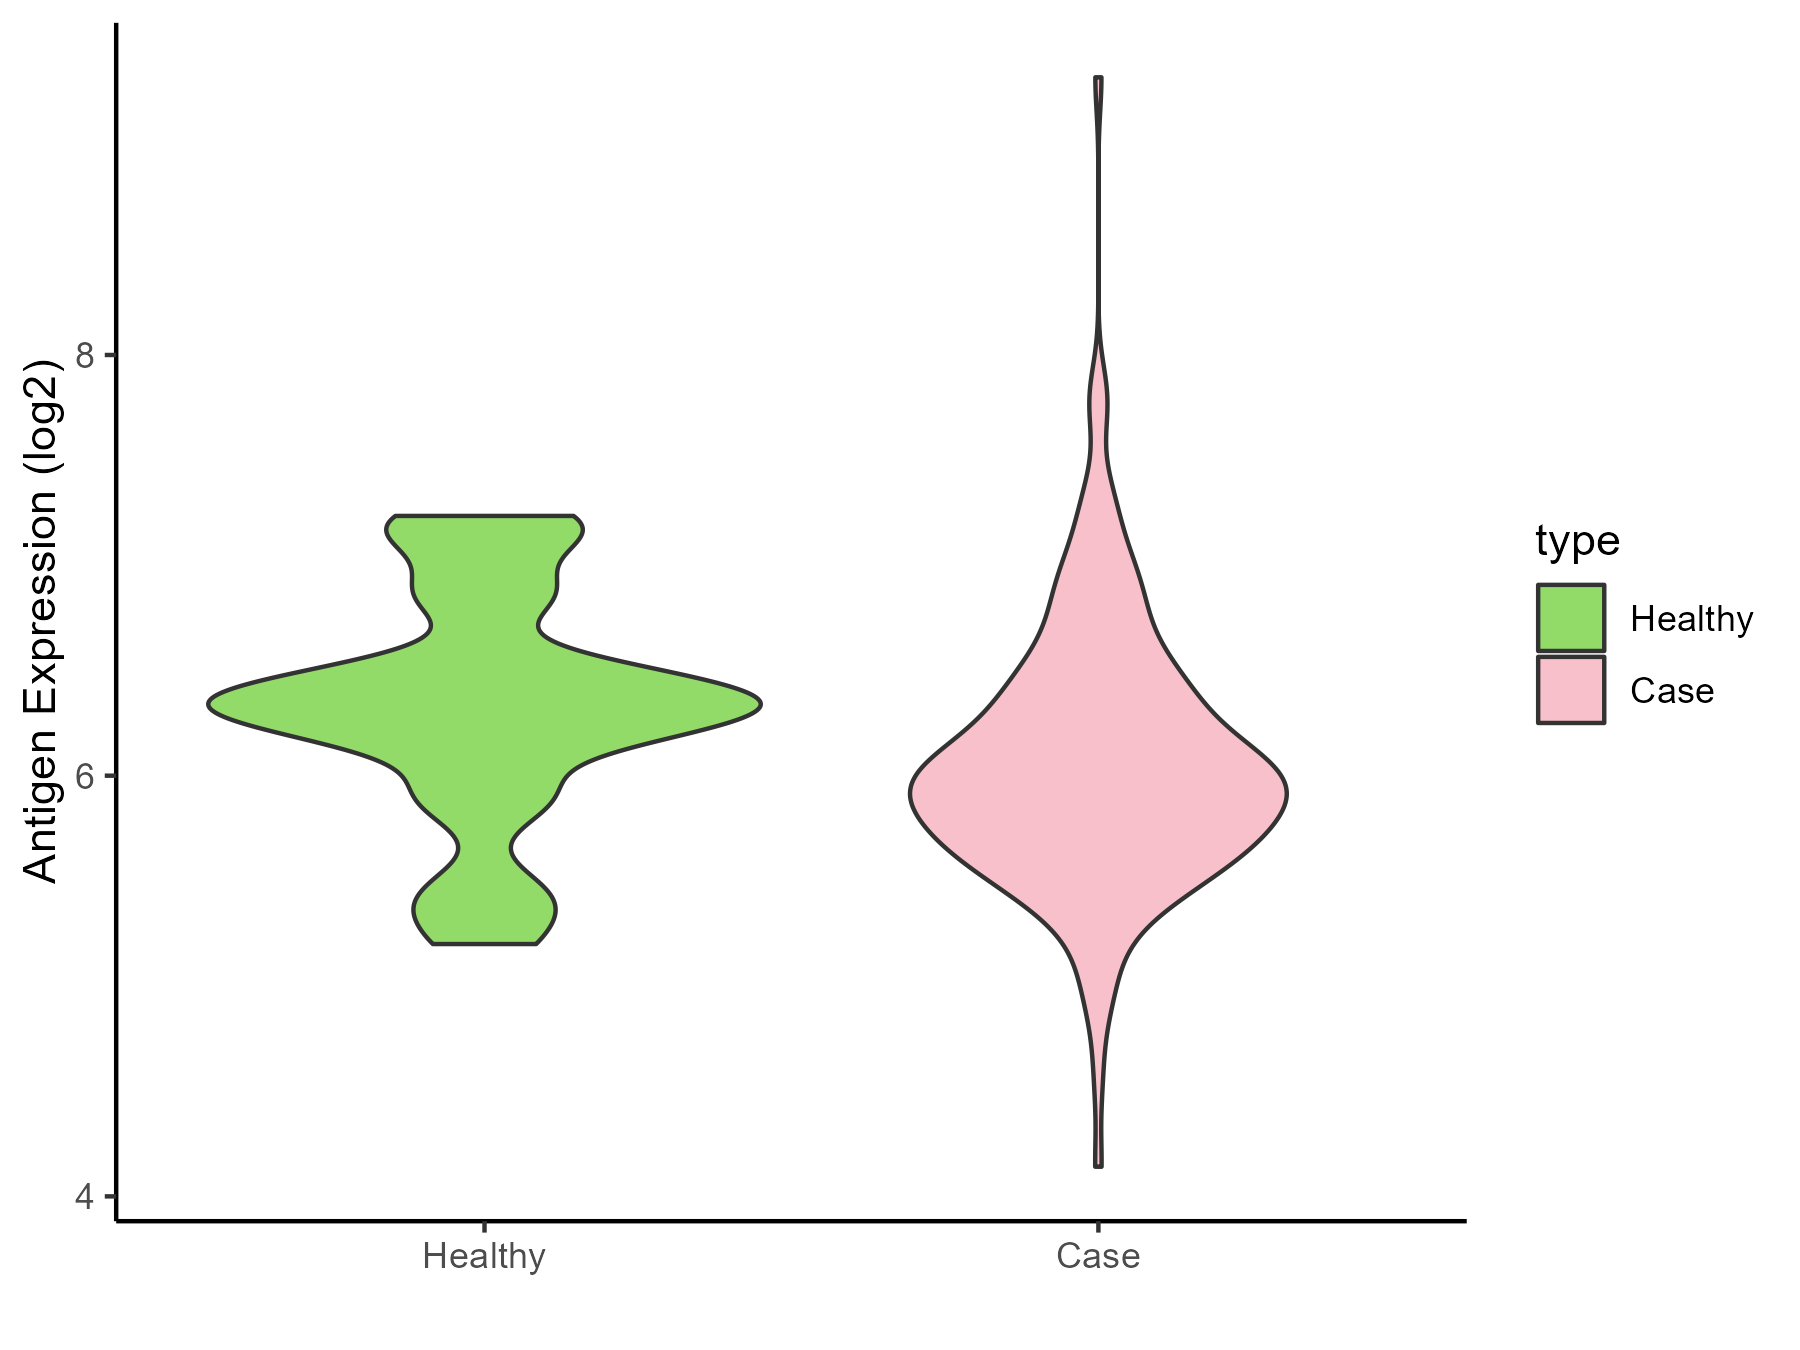
Lymphoma [ICD-11: 2A90- 2A85]
Click to Show/Hide
| Differential expression pattern of antigen in diseases |
| The Studied Tissue |
Tonsil |
| The Specific Disease |
Lymphoma |
| The Expression Level of Disease Section Compare with the Healthy Individual Tissue |
p-value: 0.124749913;
Fold-change: 0.256170594;
Z-score: 0.732535993
|
| Disease-specific Antigen Abundances |
|
Click to View the Clearer Original Diagram
|
|
|
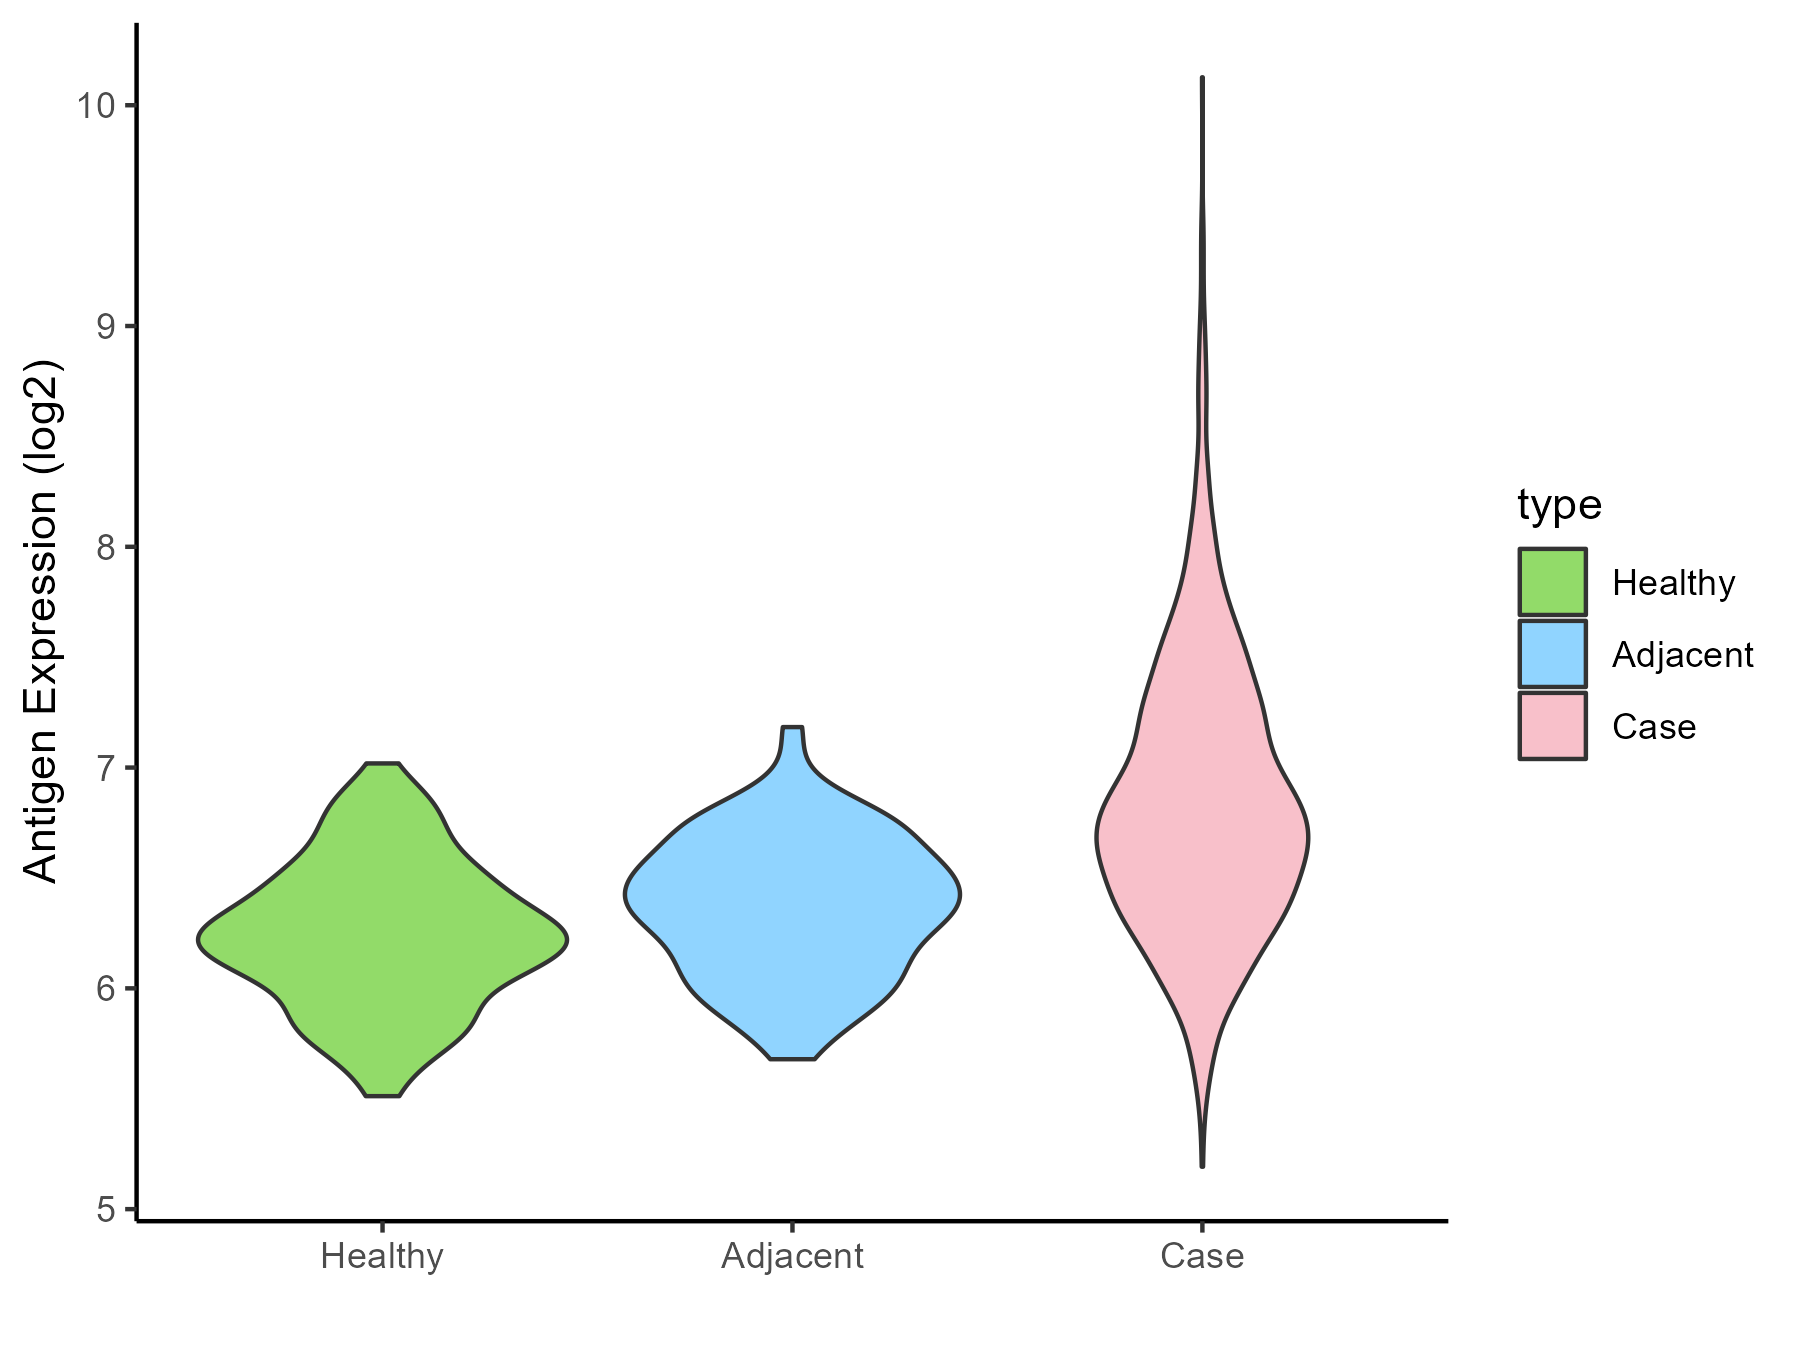
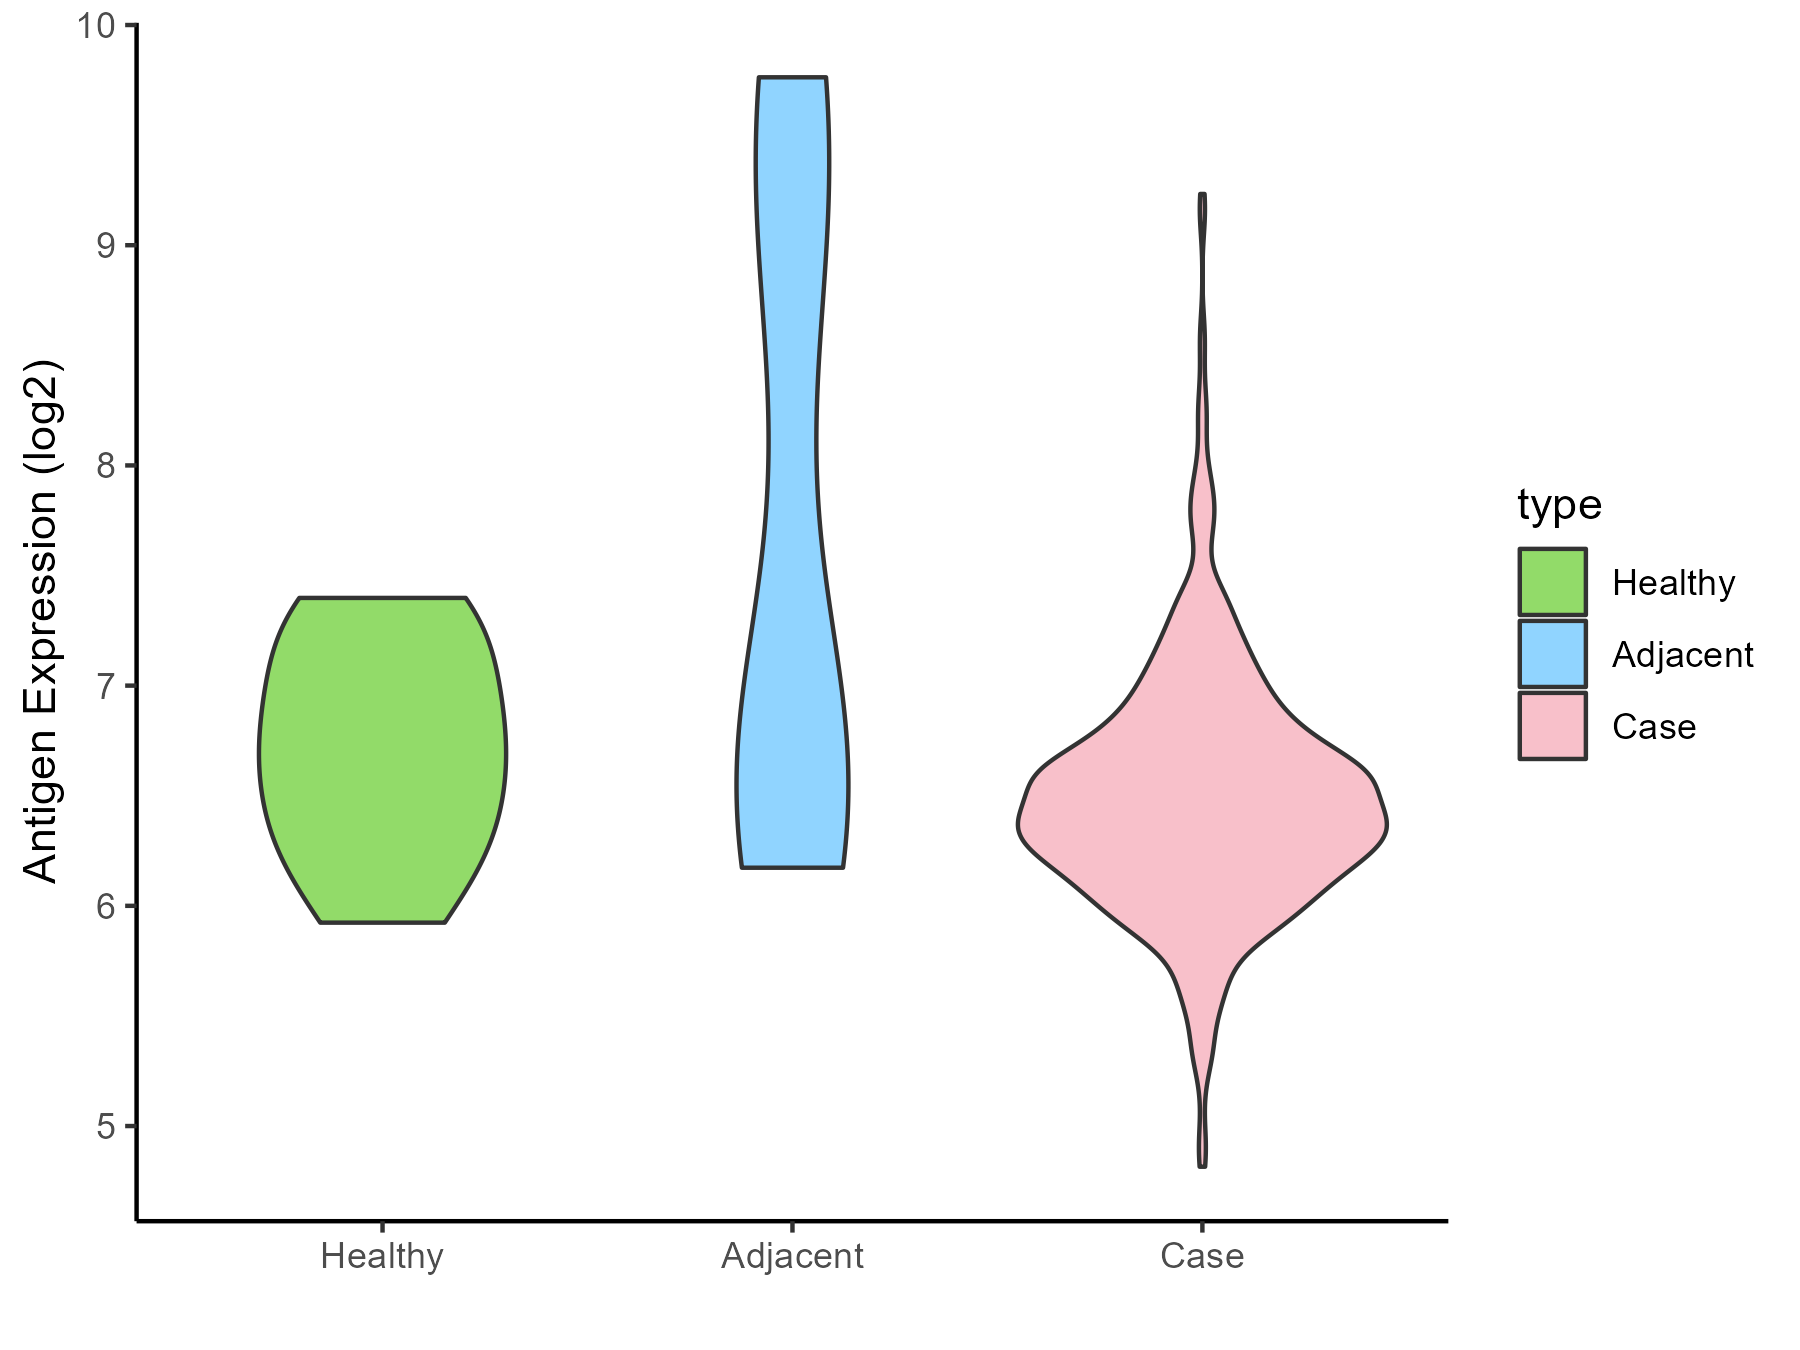
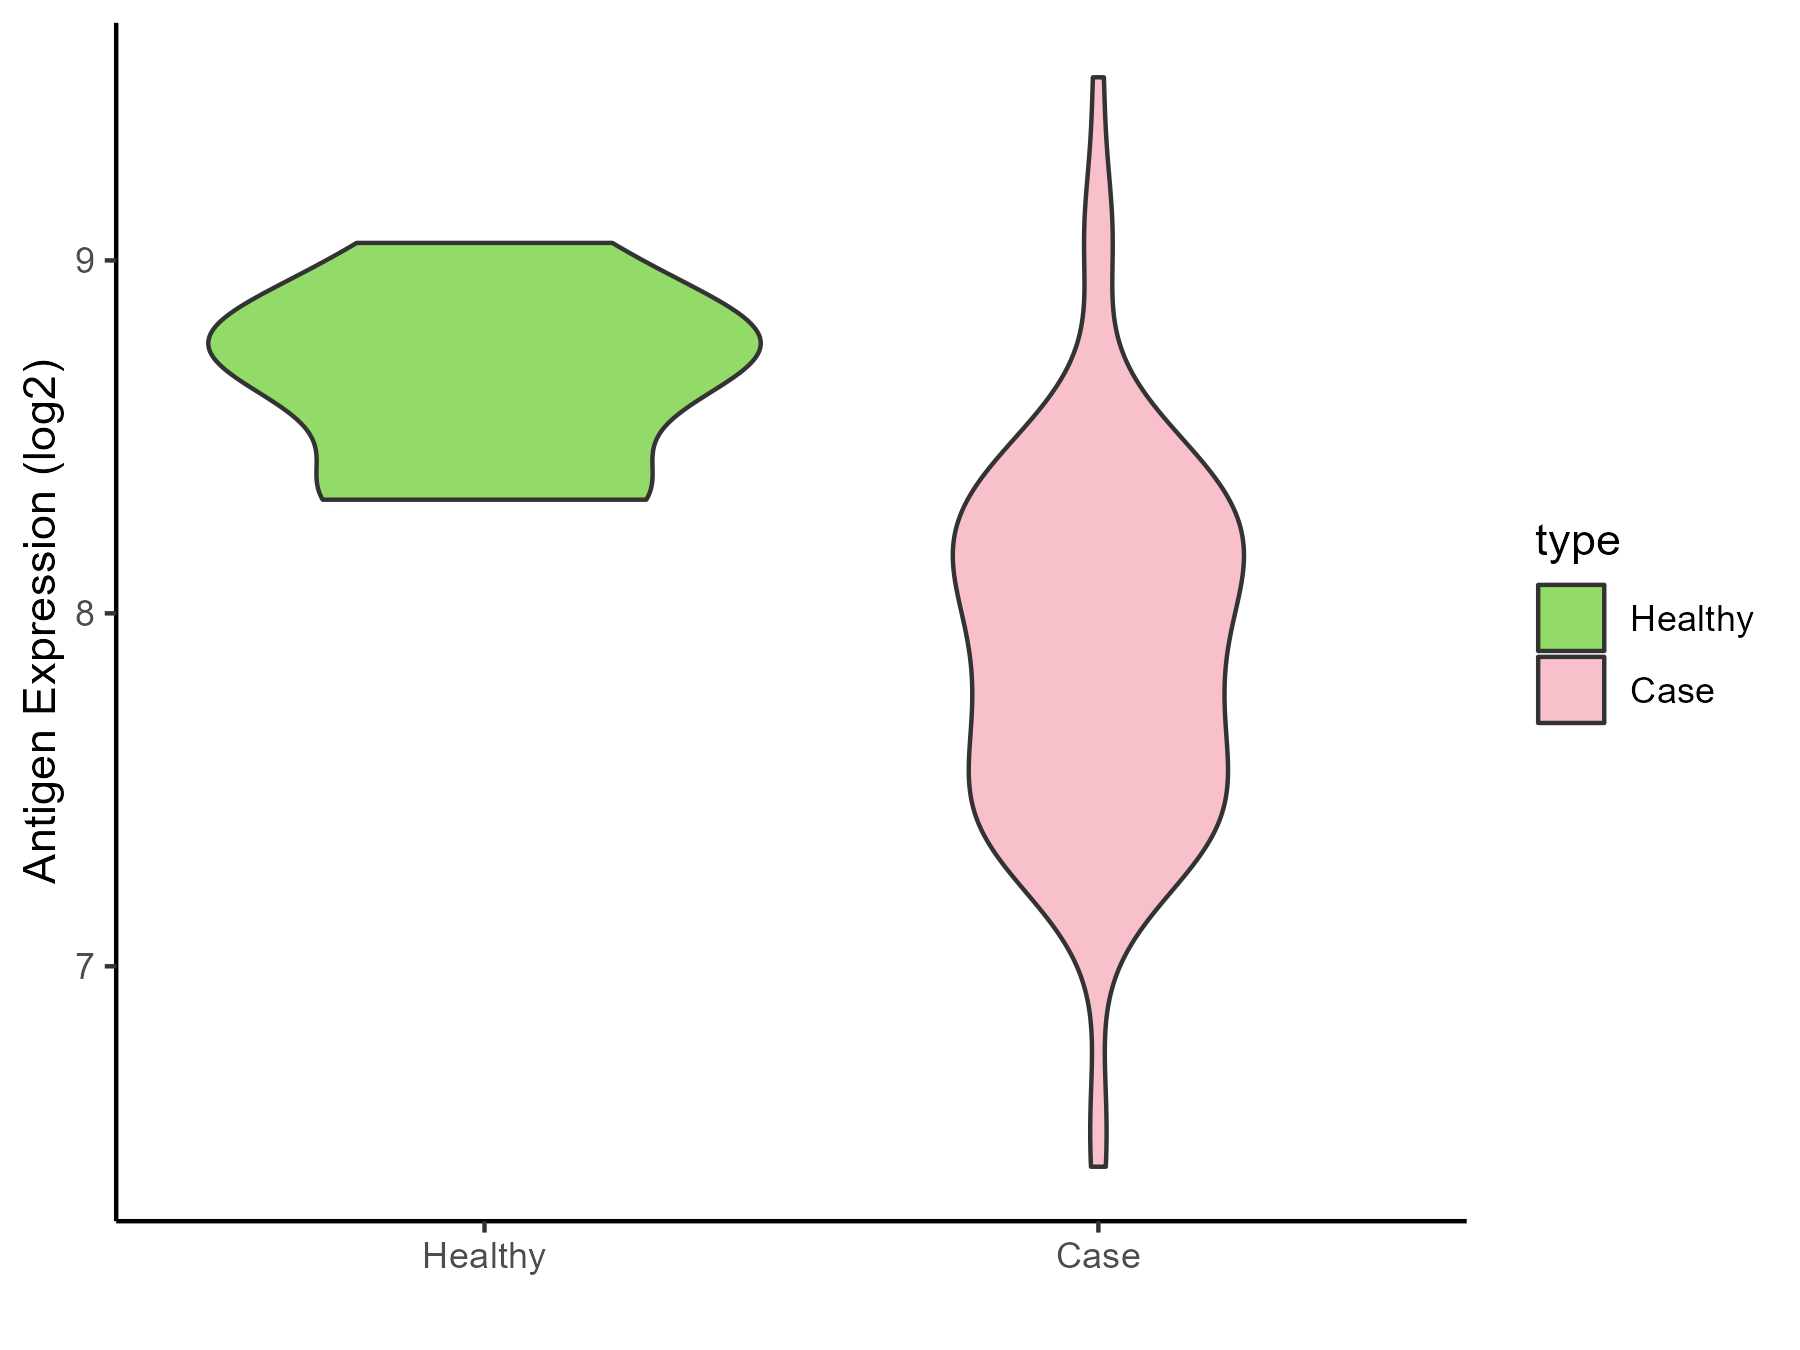
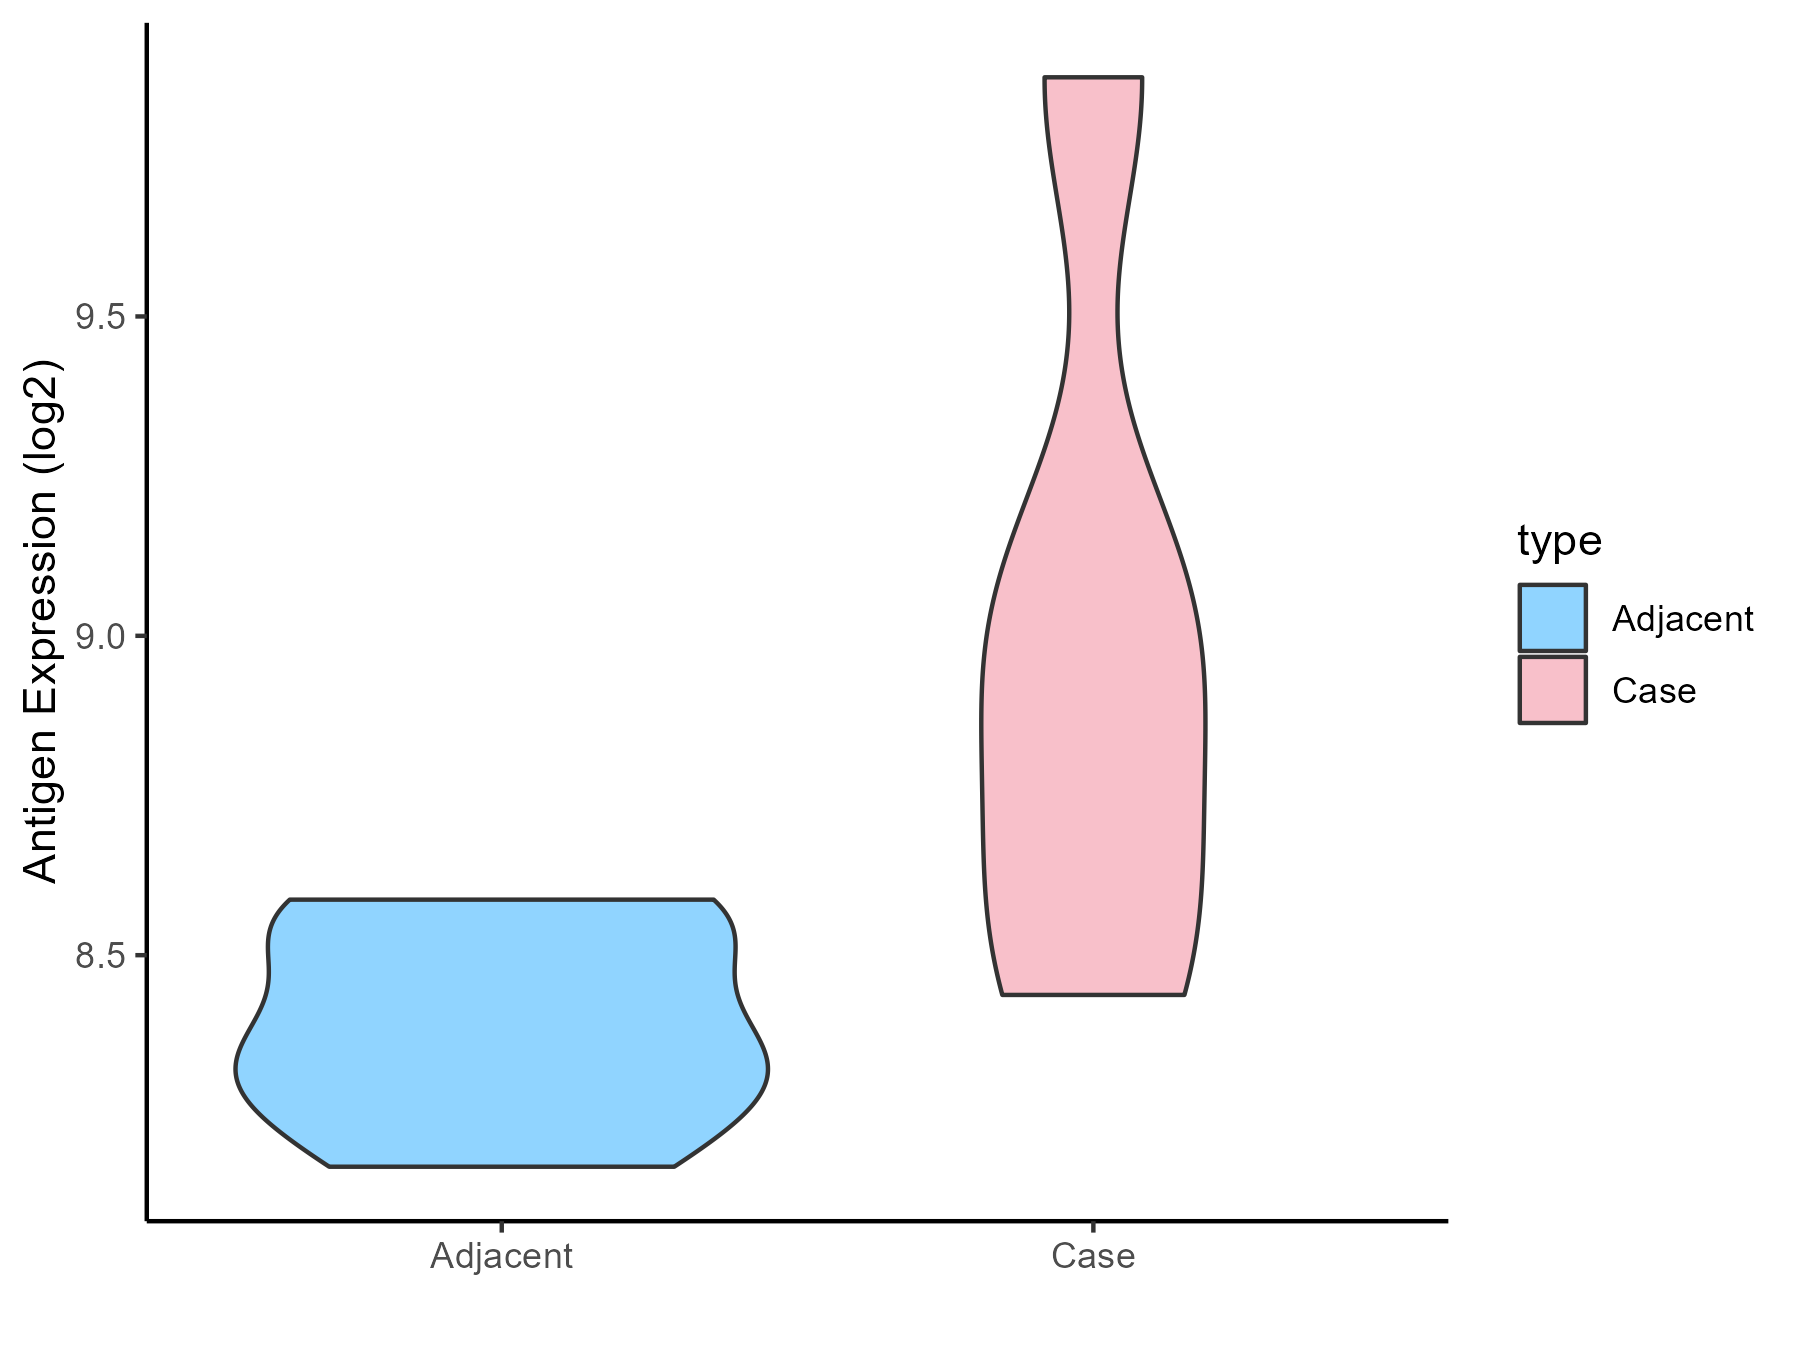
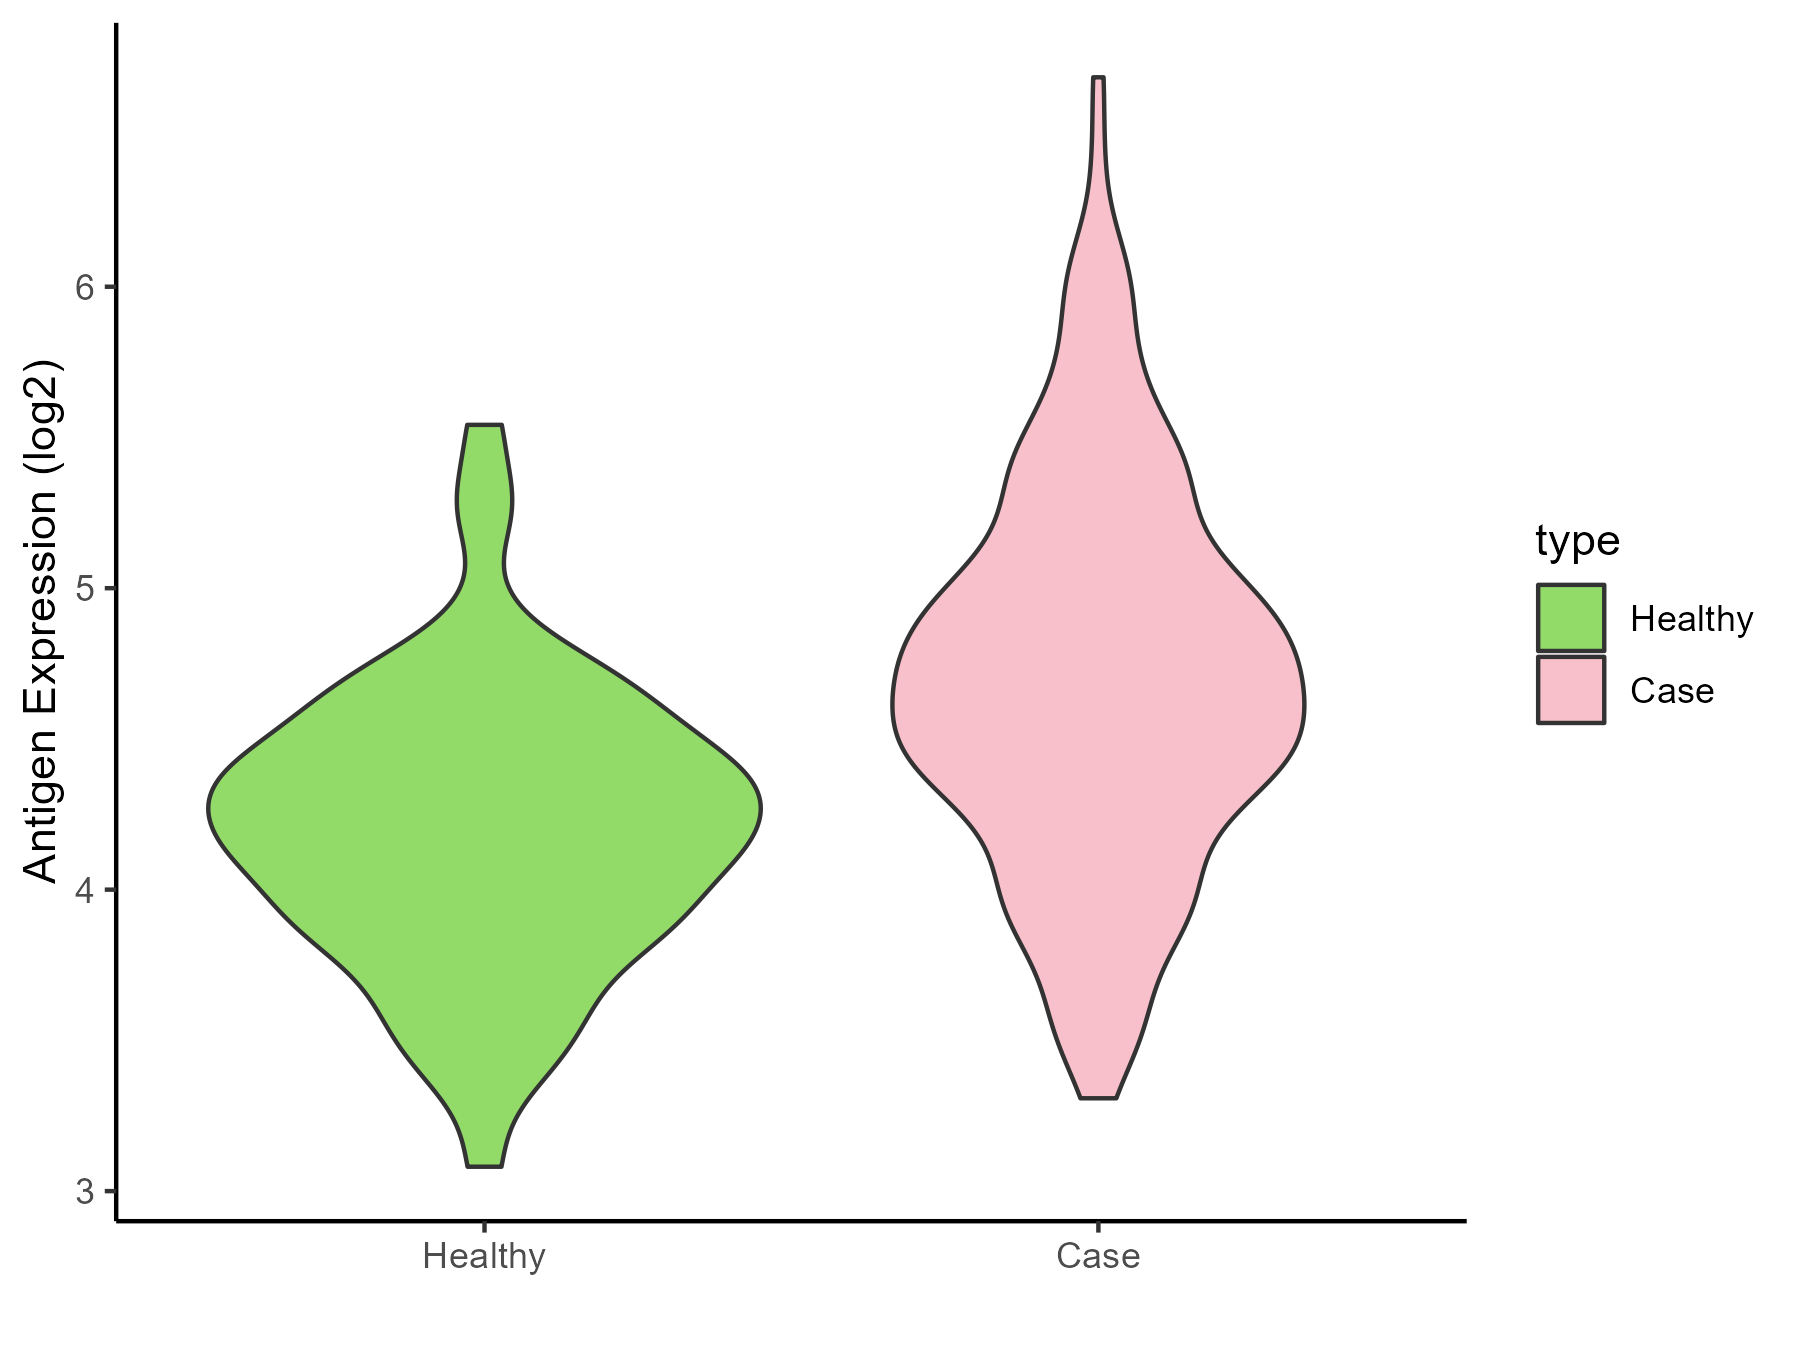
Gastric cancer [ICD-11: 2B72]
Click to Show/Hide
| Differential expression pattern of antigen in diseases |
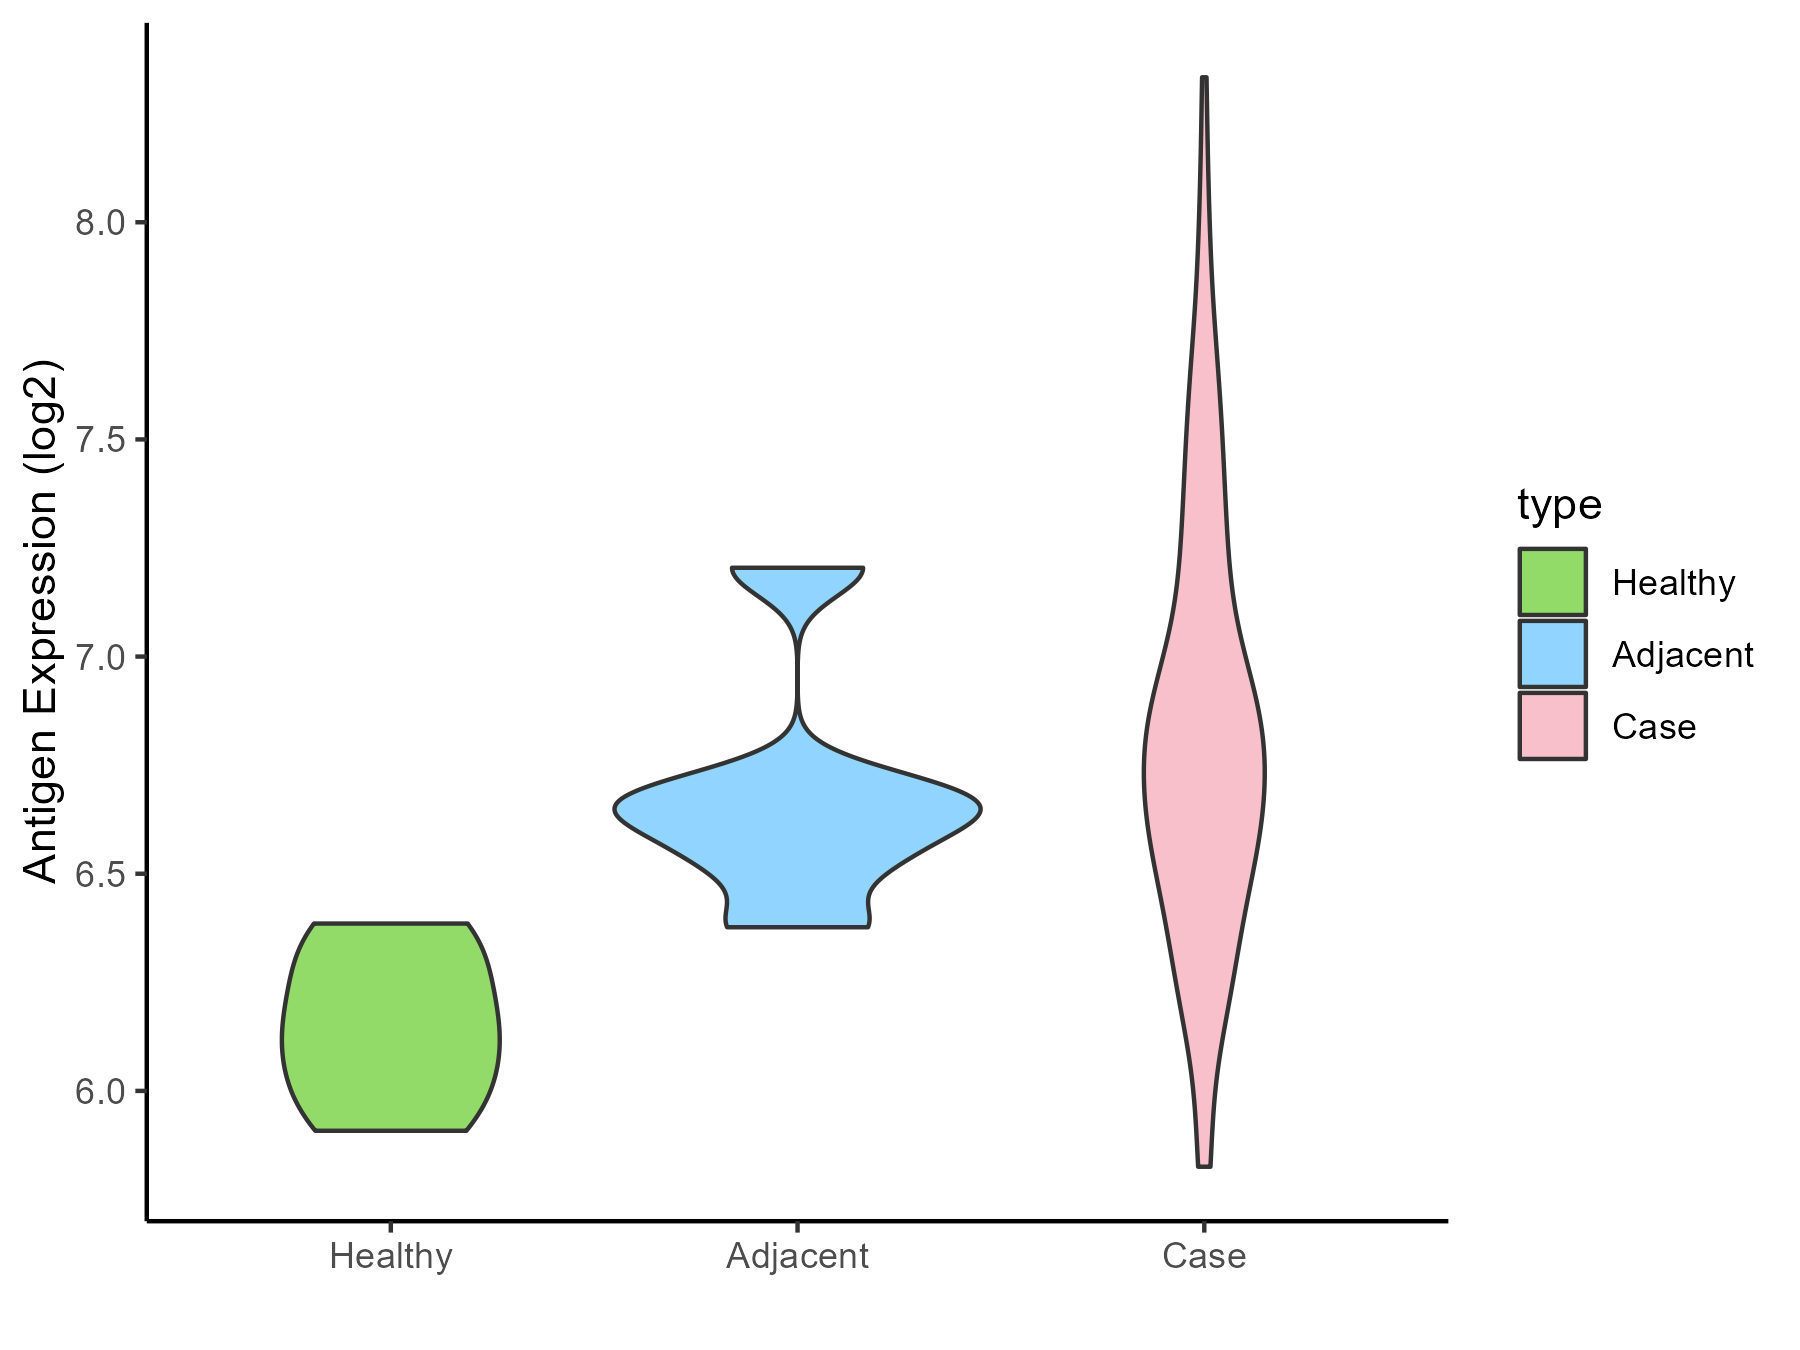
| The Studied Tissue |
Gastric |
| The Specific Disease |
Gastric cancer |
| The Expression Level of Disease Section Compare with the Healthy Individual Tissue |
p-value: 0.000215386;
Fold-change: 0.440307224;
Z-score: 6.825964078
|
| The Expression Level of Disease Section Compare with the Adjacent Tissue |
p-value: 0.000812651;
Fold-change: 0.249179686;
Z-score: 0.704653236
|
| Disease-specific Antigen Abundances |
|
Click to View the Clearer Original Diagram
|
|
|
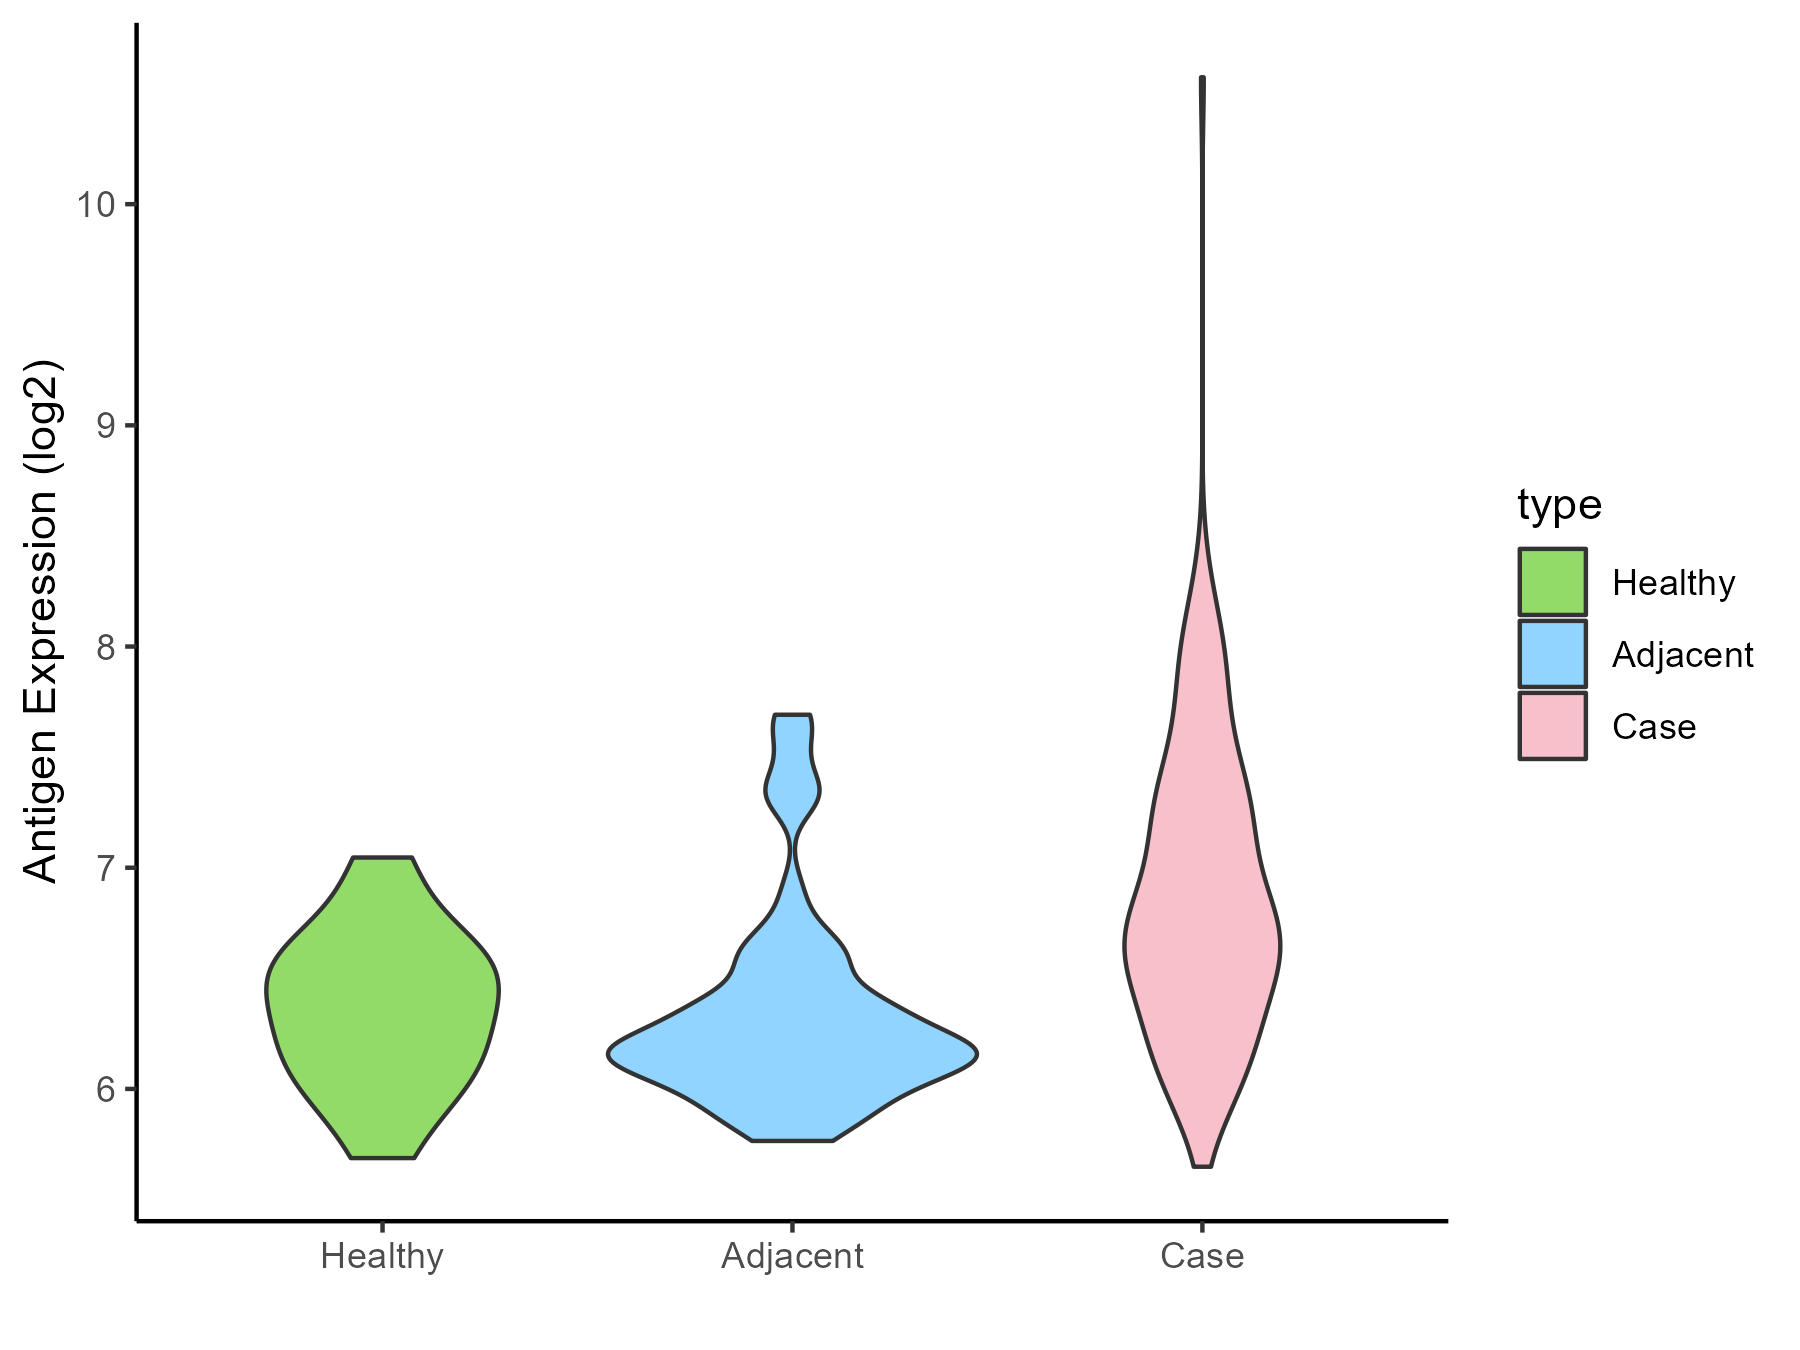
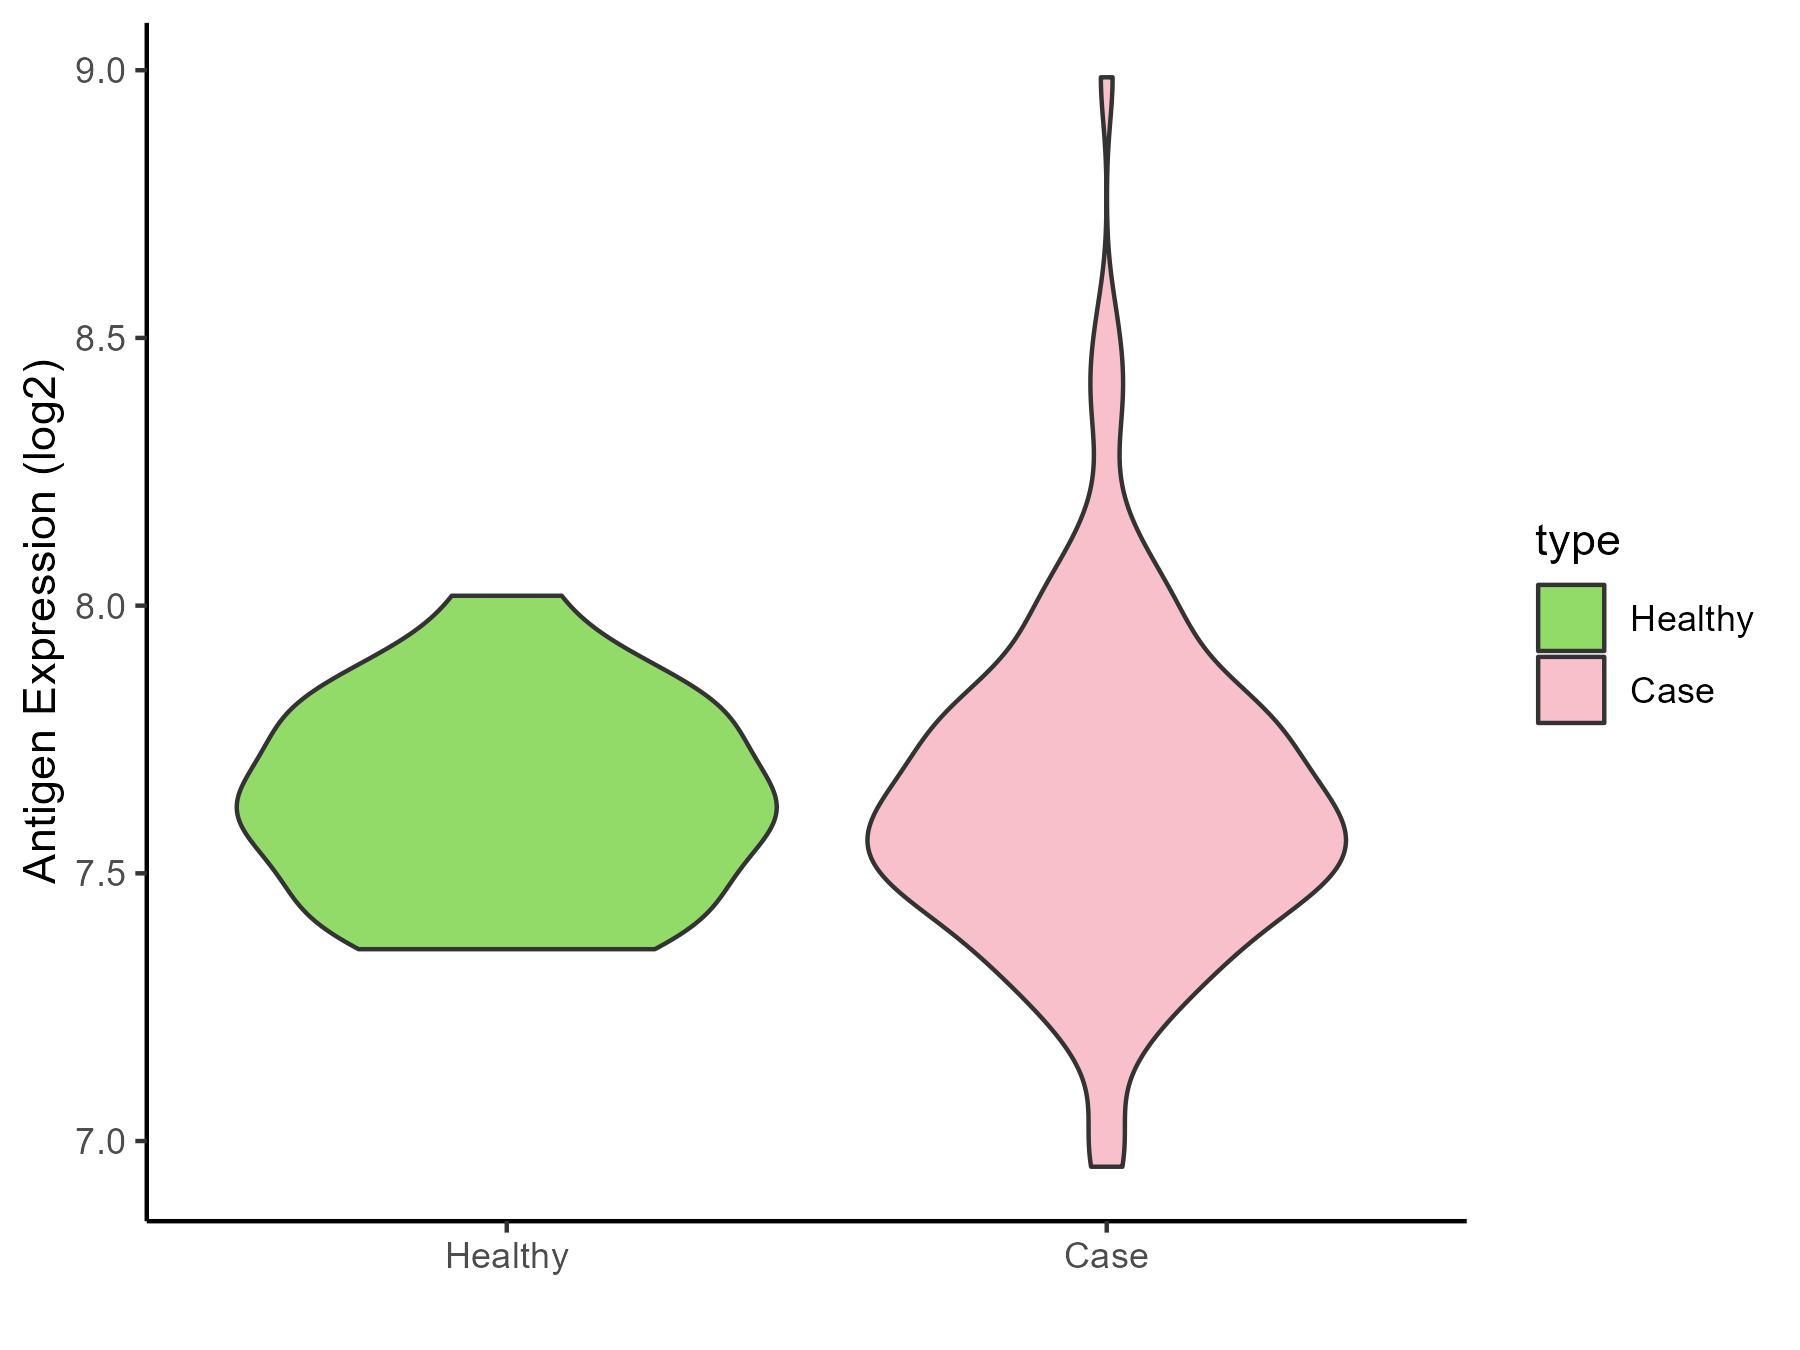
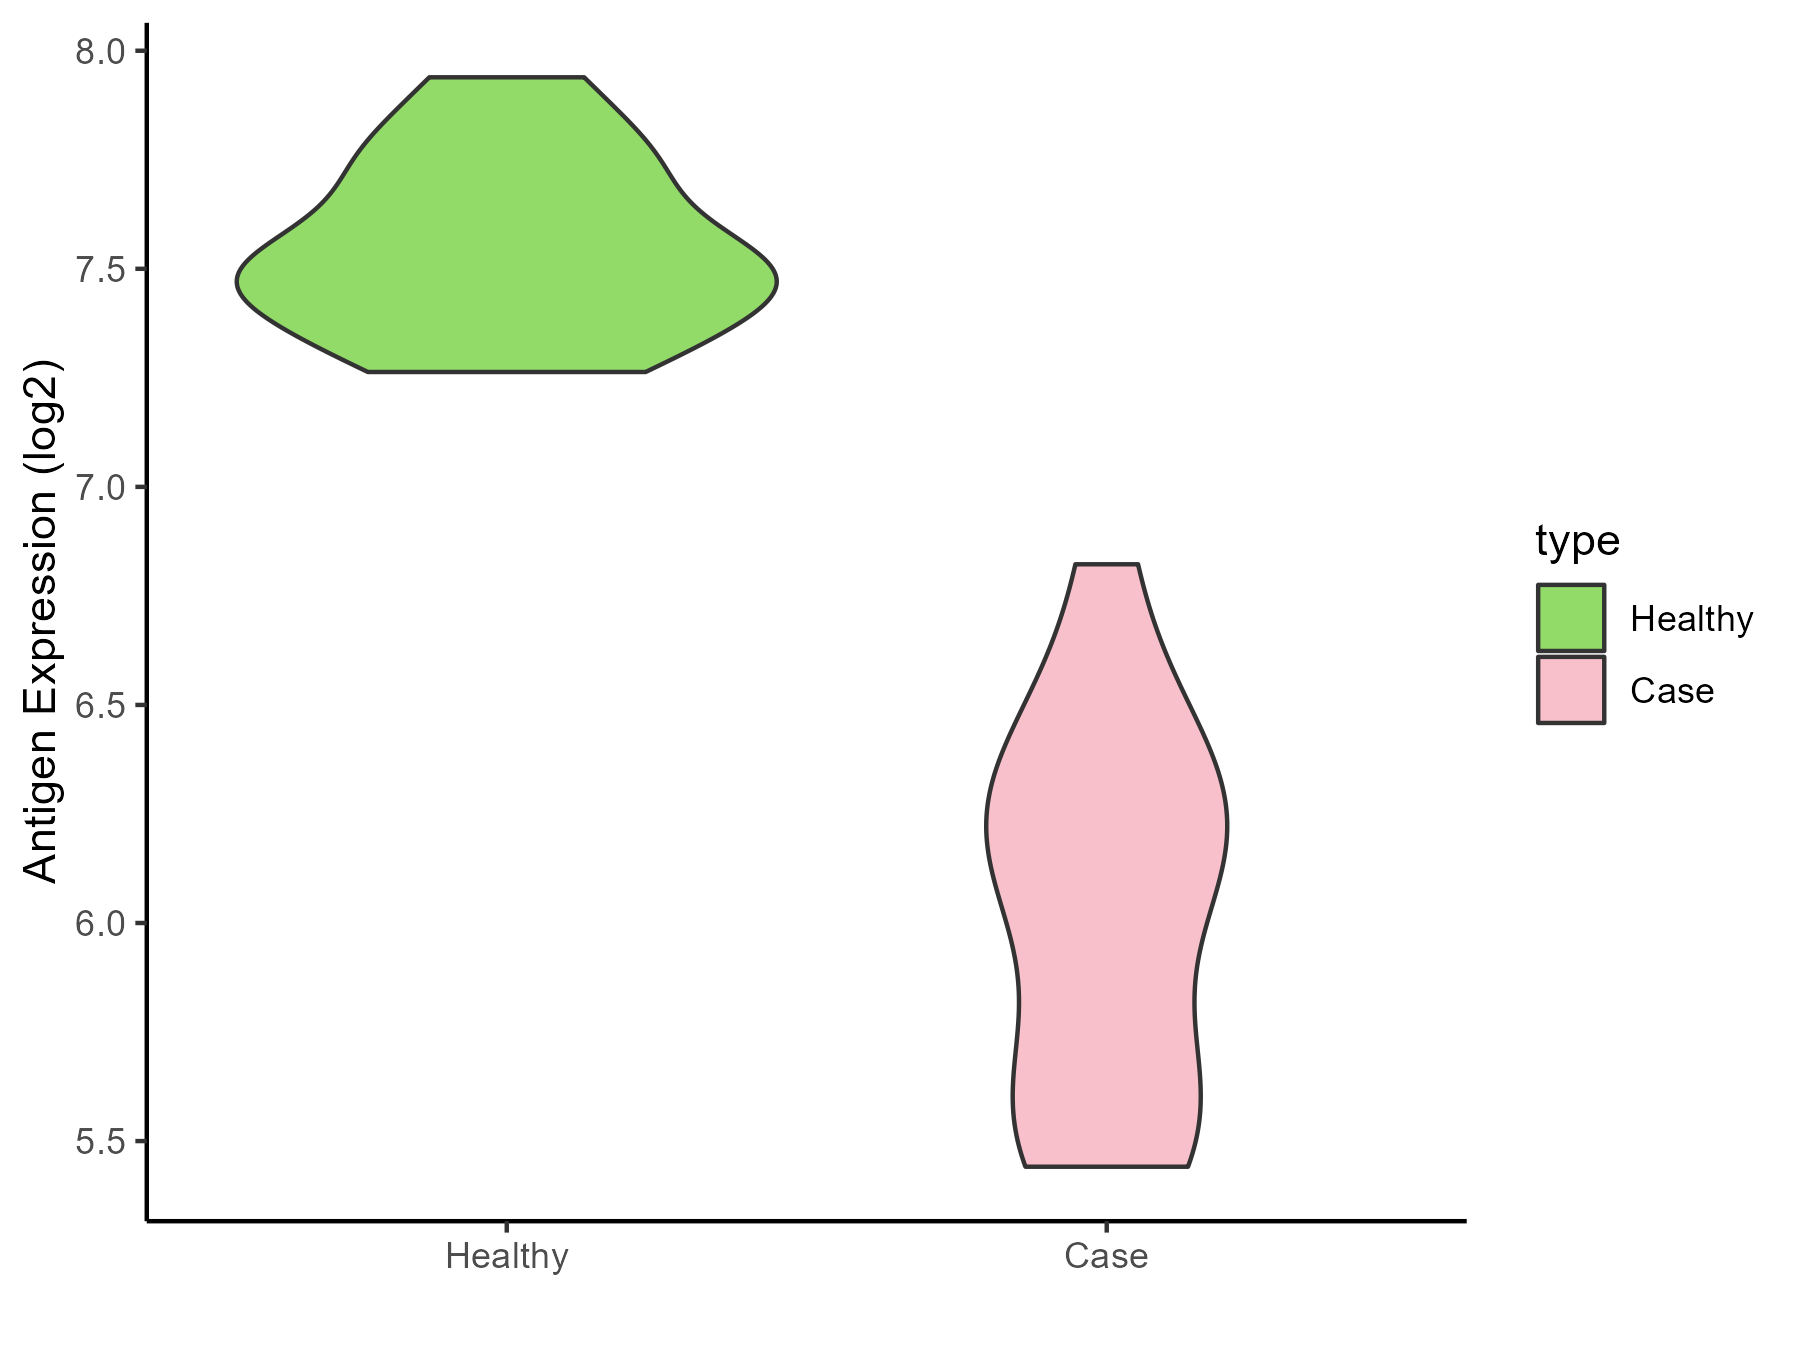
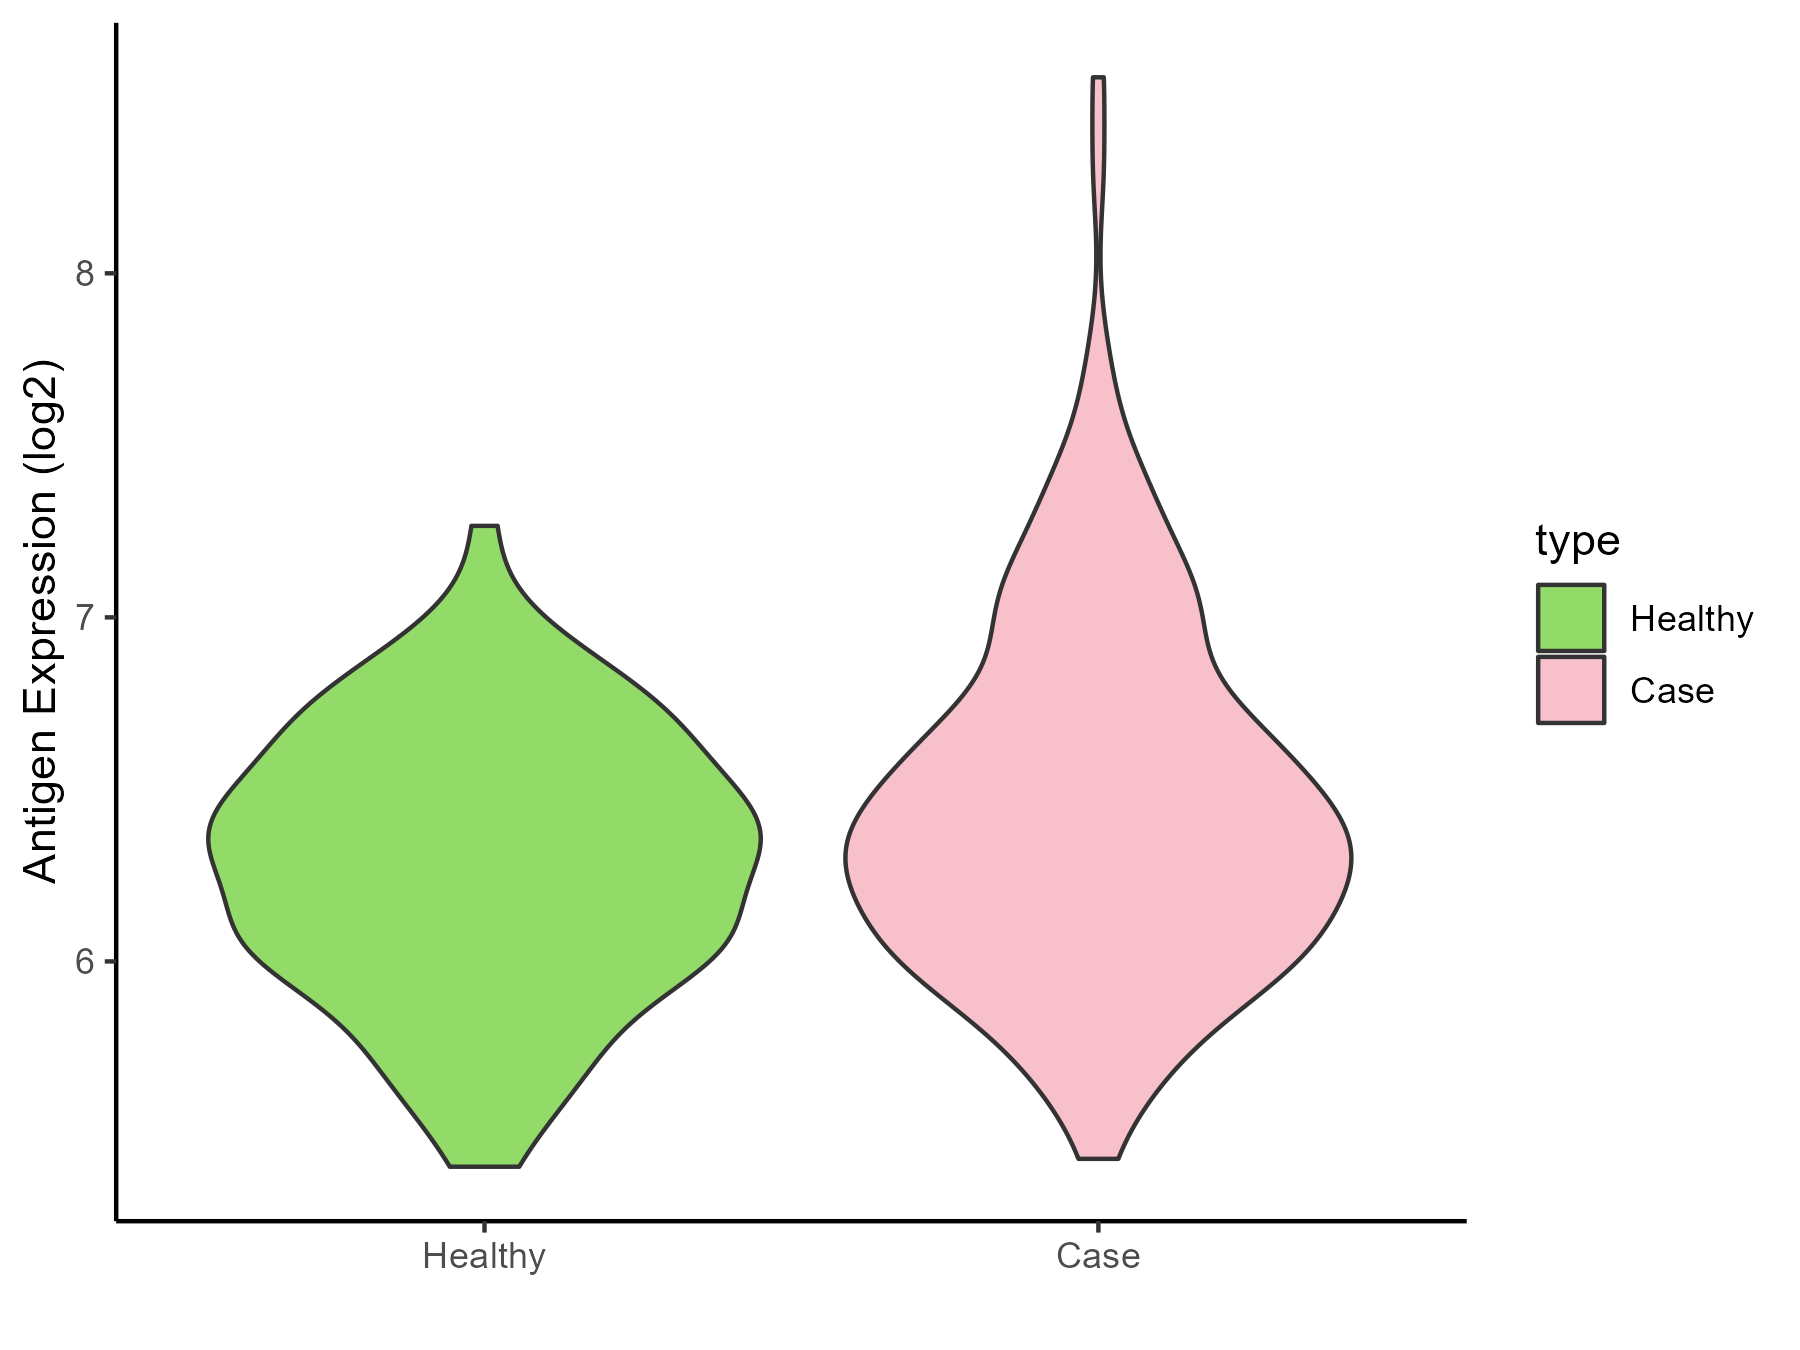
Colon cancer [ICD-11: 2B90]
Click to Show/Hide
| Differential expression pattern of antigen in diseases |
| The Studied Tissue |
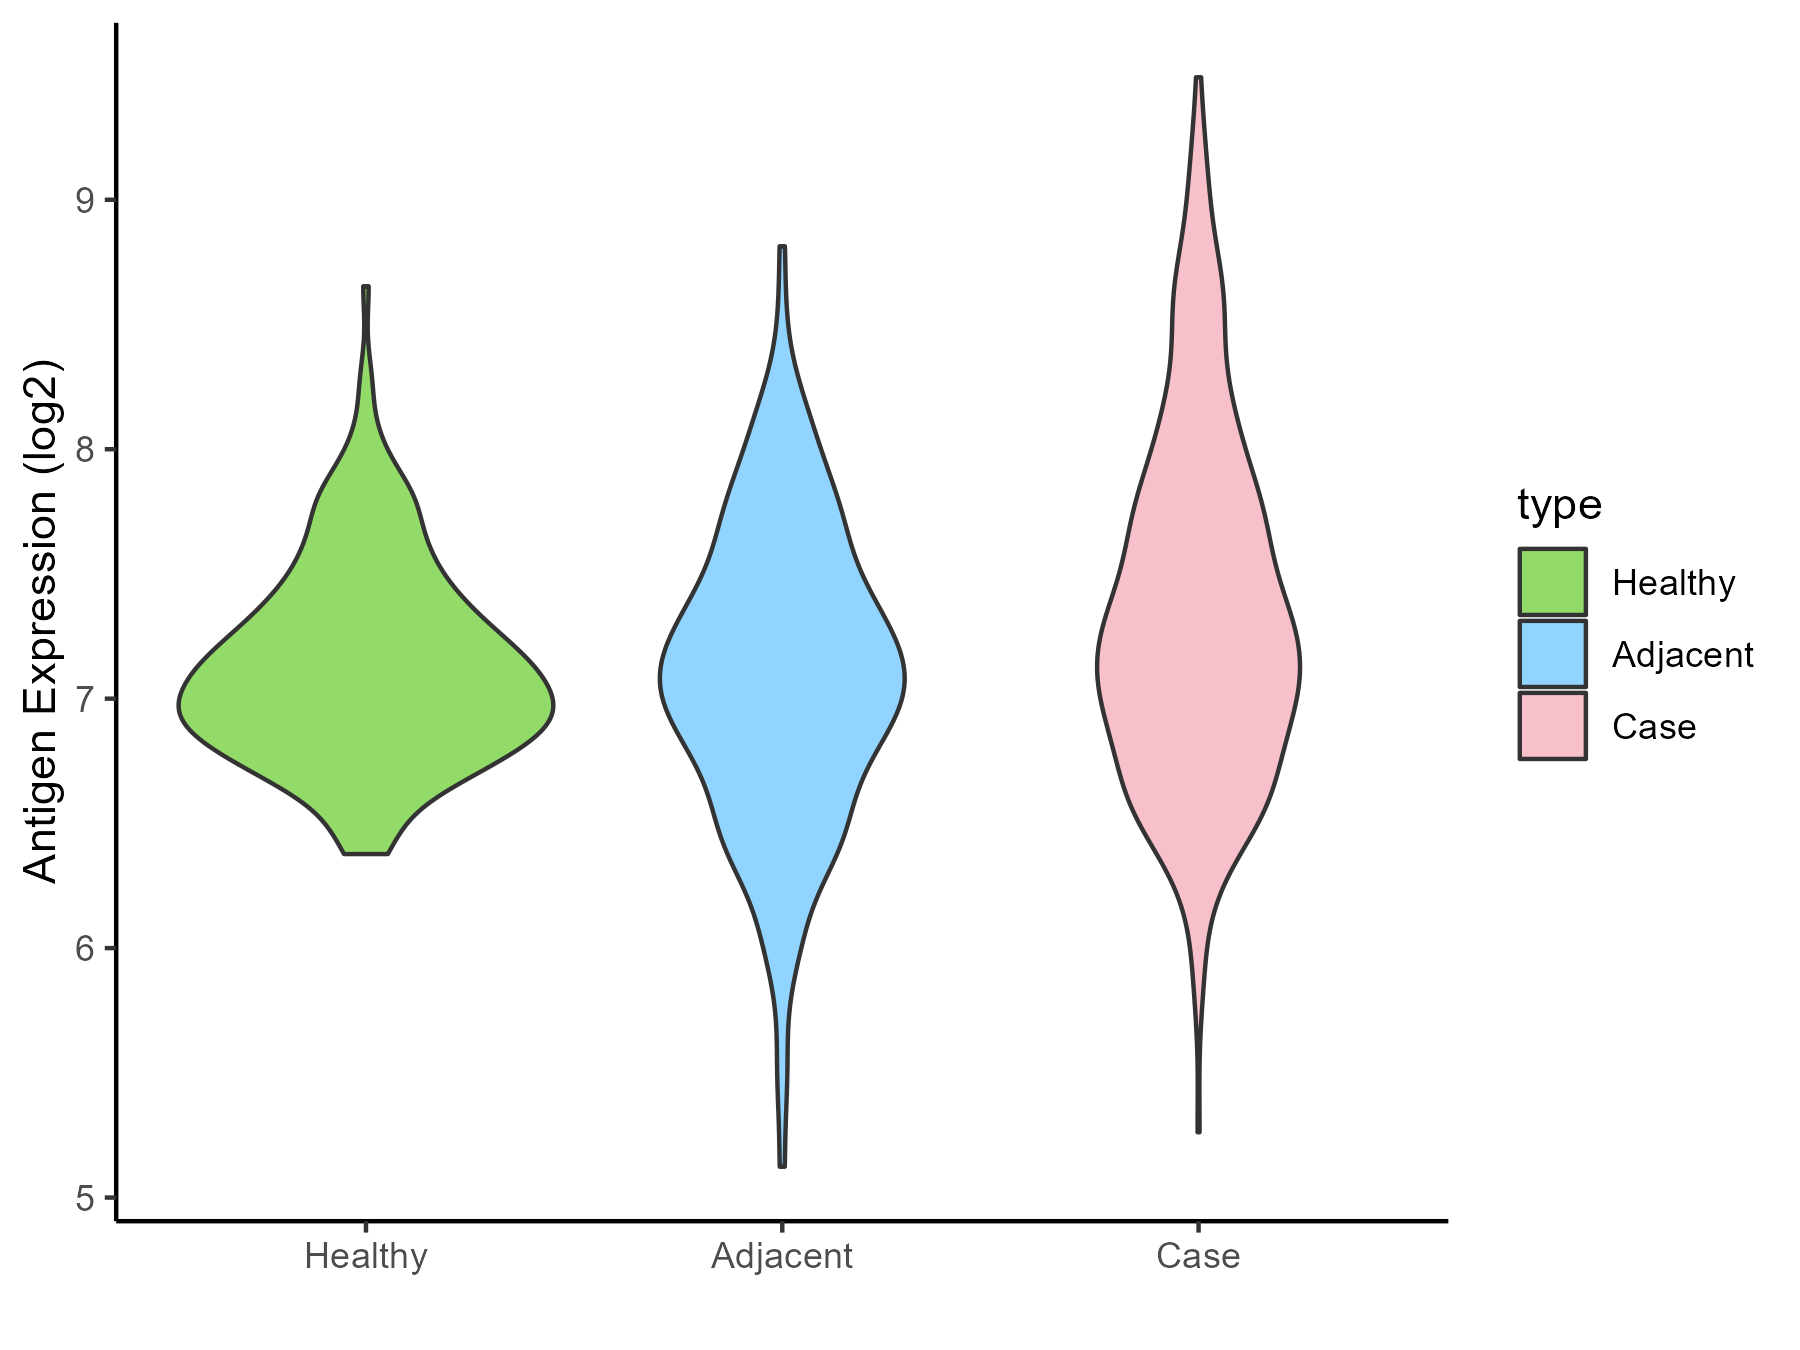
Colon |
| The Specific Disease |
Colon cancer |
| The Expression Level of Disease Section Compare with the Healthy Individual Tissue |
p-value: 1.64E-53;
Fold-change: 0.536830011;
Z-score: 1.642824413
|
| The Expression Level of Disease Section Compare with the Adjacent Tissue |
p-value: 1.25E-33;
Fold-change: 0.378312927;
Z-score: 1.198216806
|
| Disease-specific Antigen Abundances |
|
Click to View the Clearer Original Diagram
|
|
|
Pancreatic cancer [ICD-11: 2C10]
Click to Show/Hide
| Differential expression pattern of antigen in diseases |
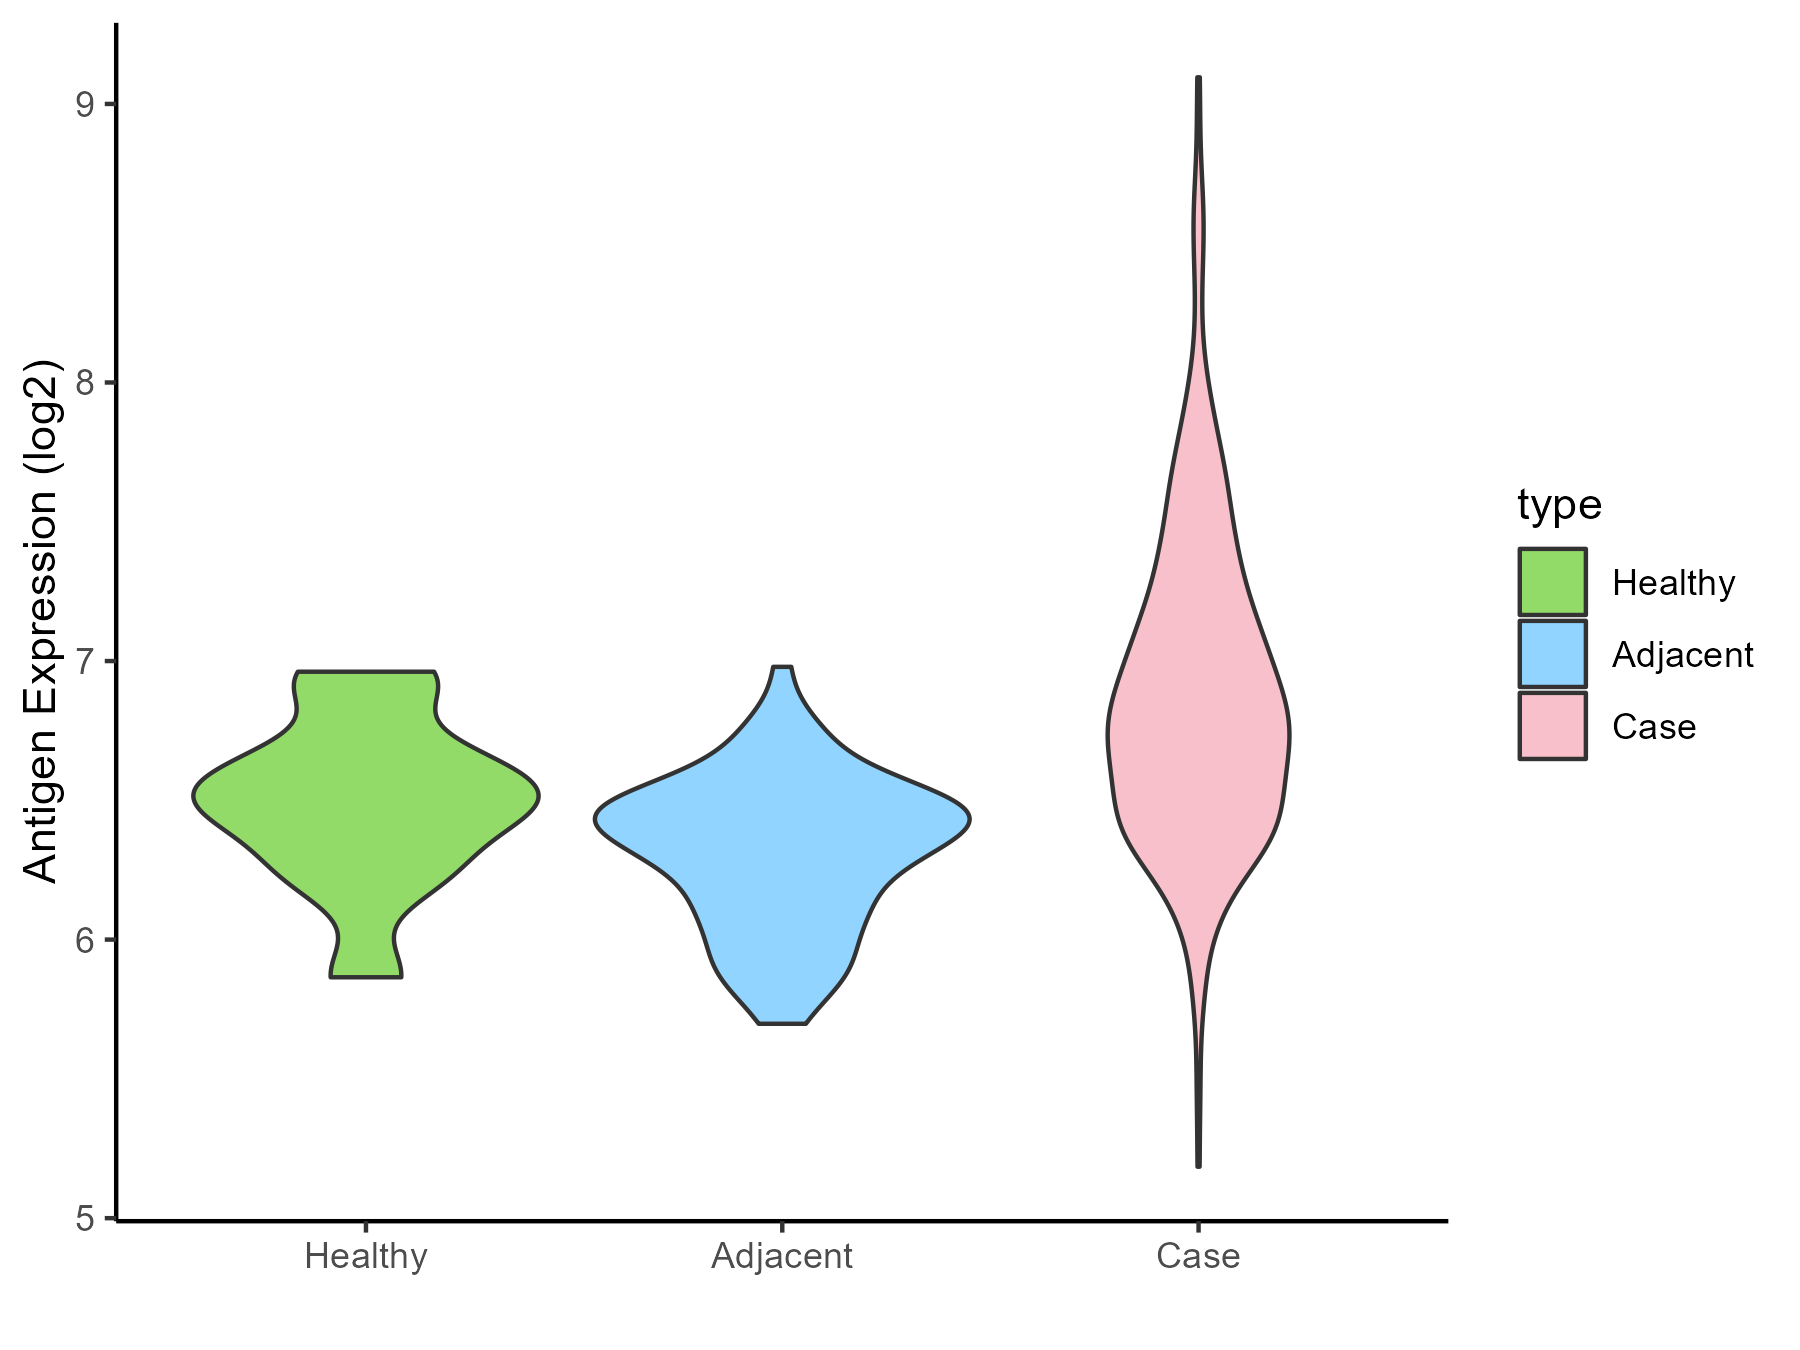
| The Studied Tissue |
Pancreas |
| The Specific Disease |
Pancreatic cancer |
| The Expression Level of Disease Section Compare with the Healthy Individual Tissue |
p-value: 2.72E-05;
Fold-change: 0.392619507;
Z-score: 1.092178997
|
| The Expression Level of Disease Section Compare with the Adjacent Tissue |
p-value: 3.65E-10;
Fold-change: 0.557520005;
Z-score: 1.21533177
|
| Disease-specific Antigen Abundances |
|
Click to View the Clearer Original Diagram
|
|
|
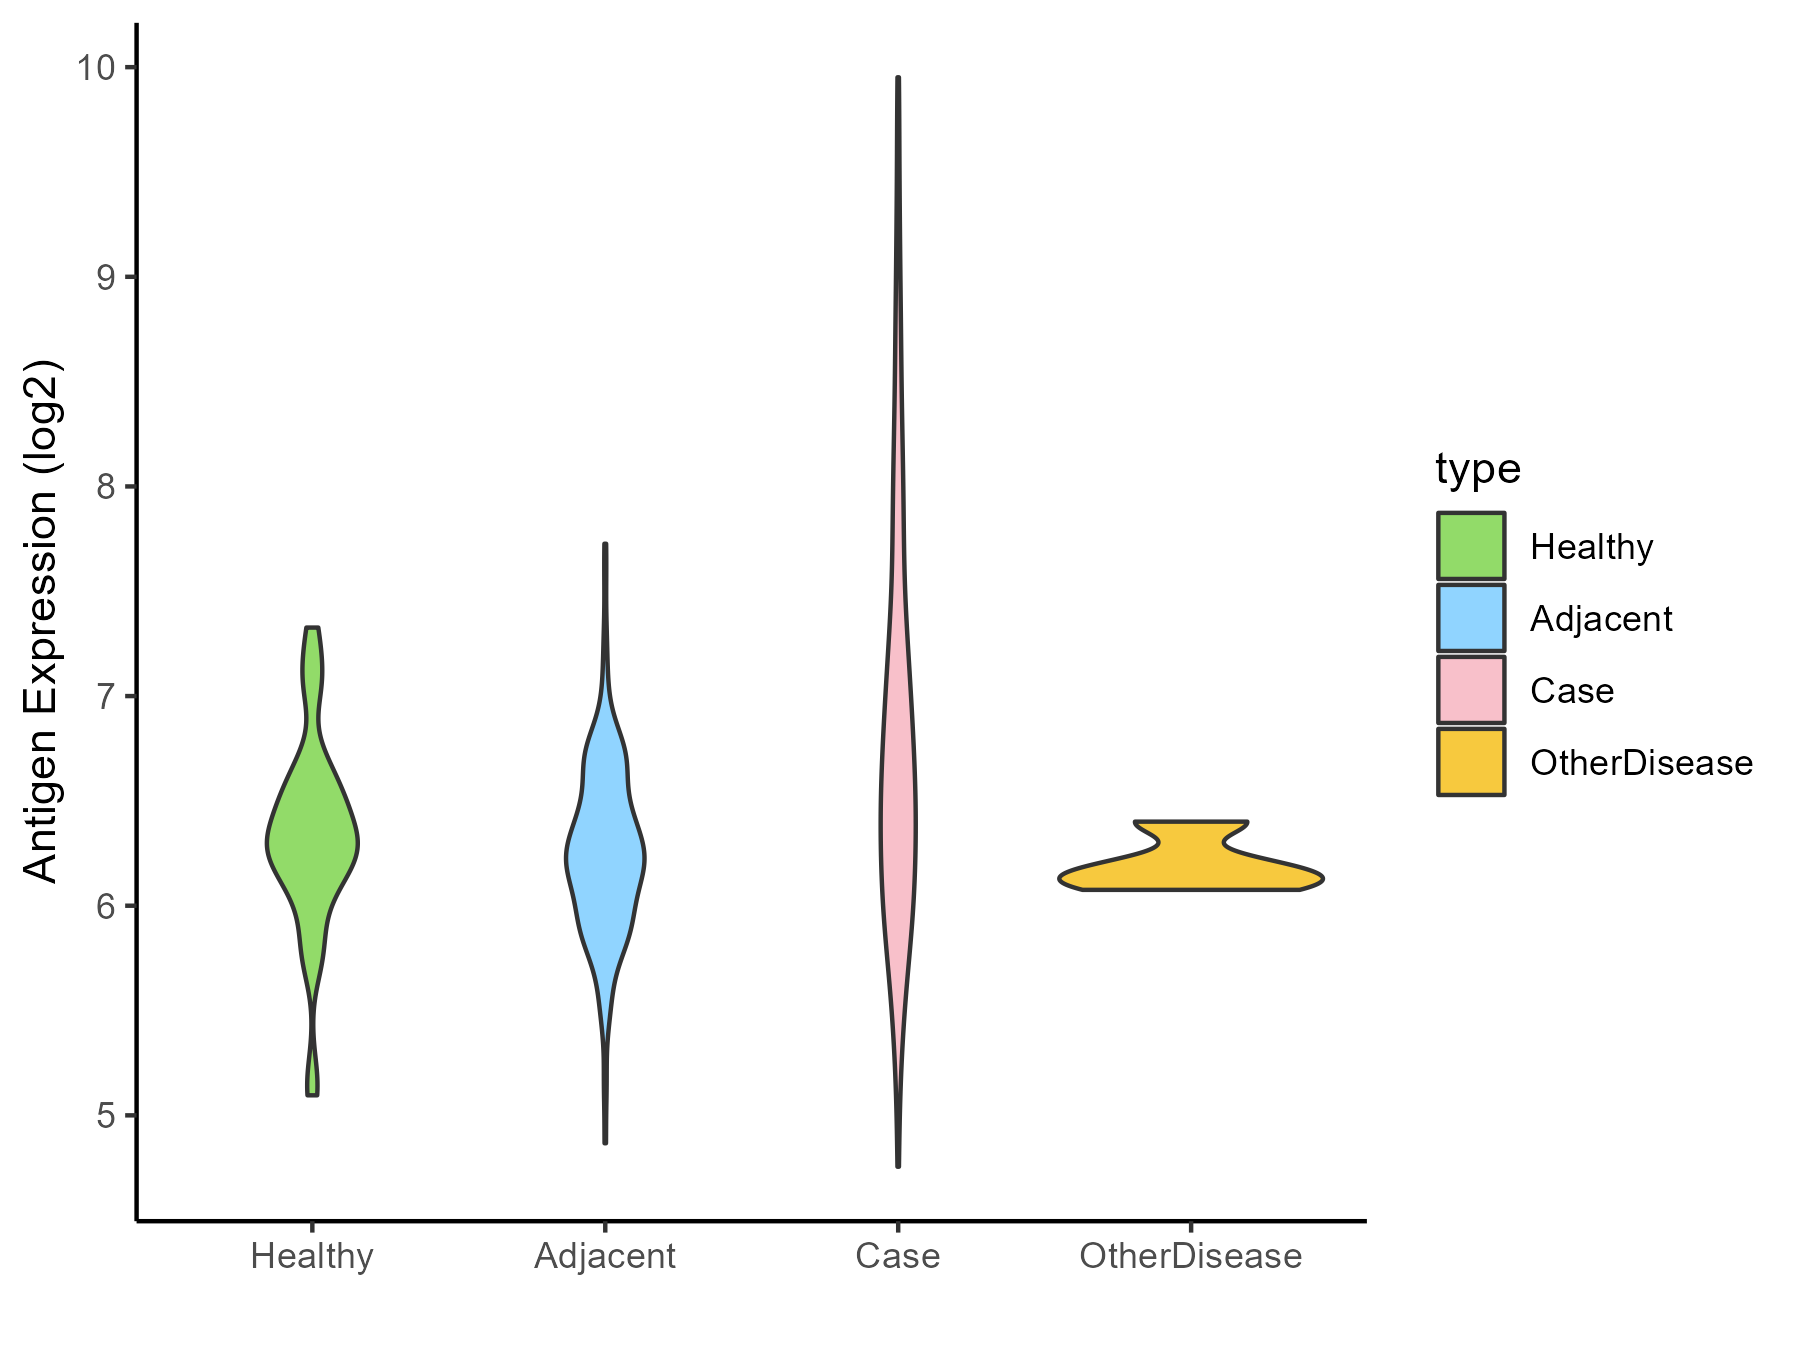
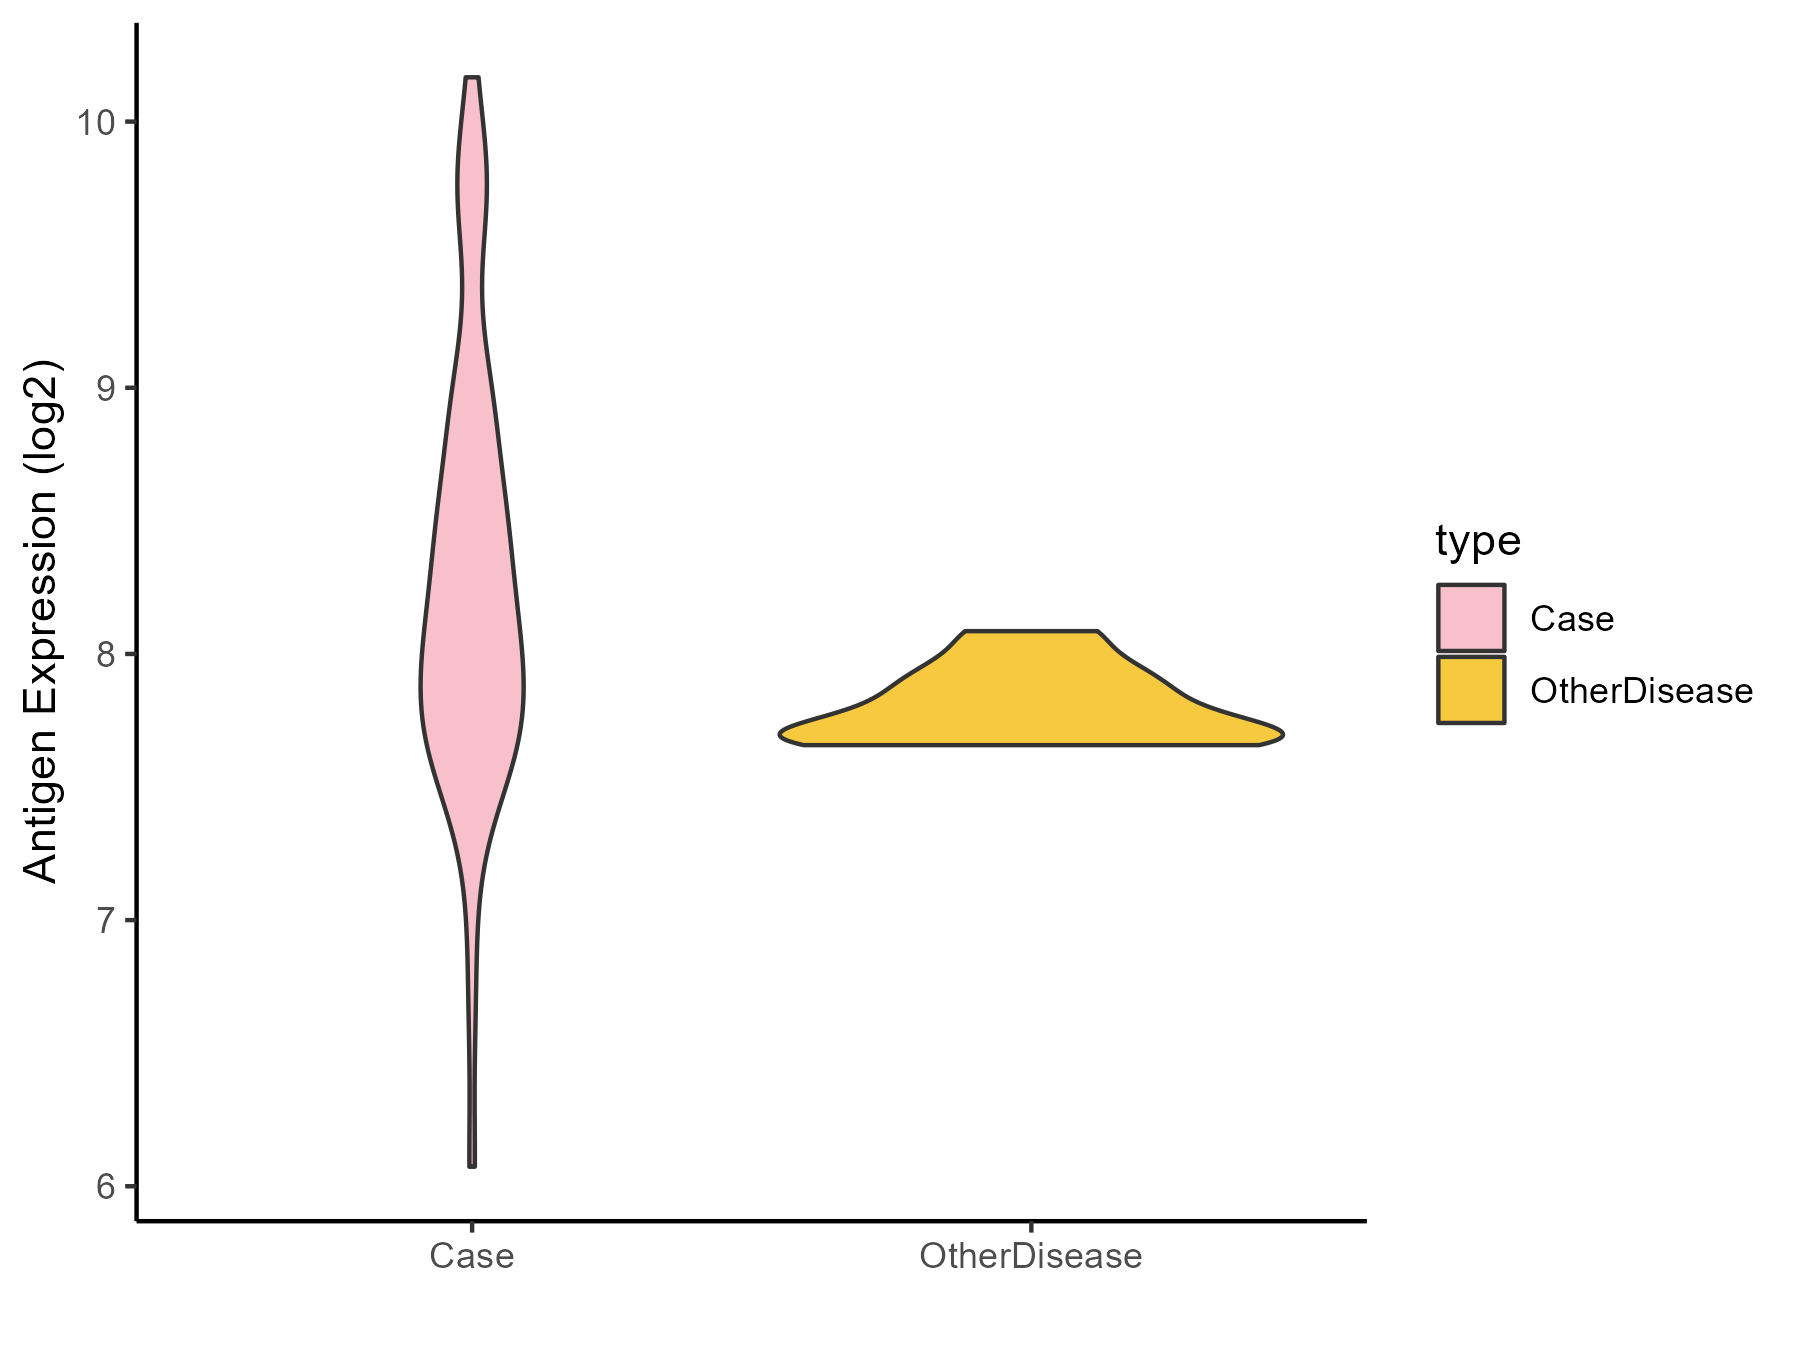
Liver cancer [ICD-11: 2C12]
Click to Show/Hide
| Differential expression pattern of antigen in diseases |
| The Studied Tissue |
Liver |
| The Specific Disease |
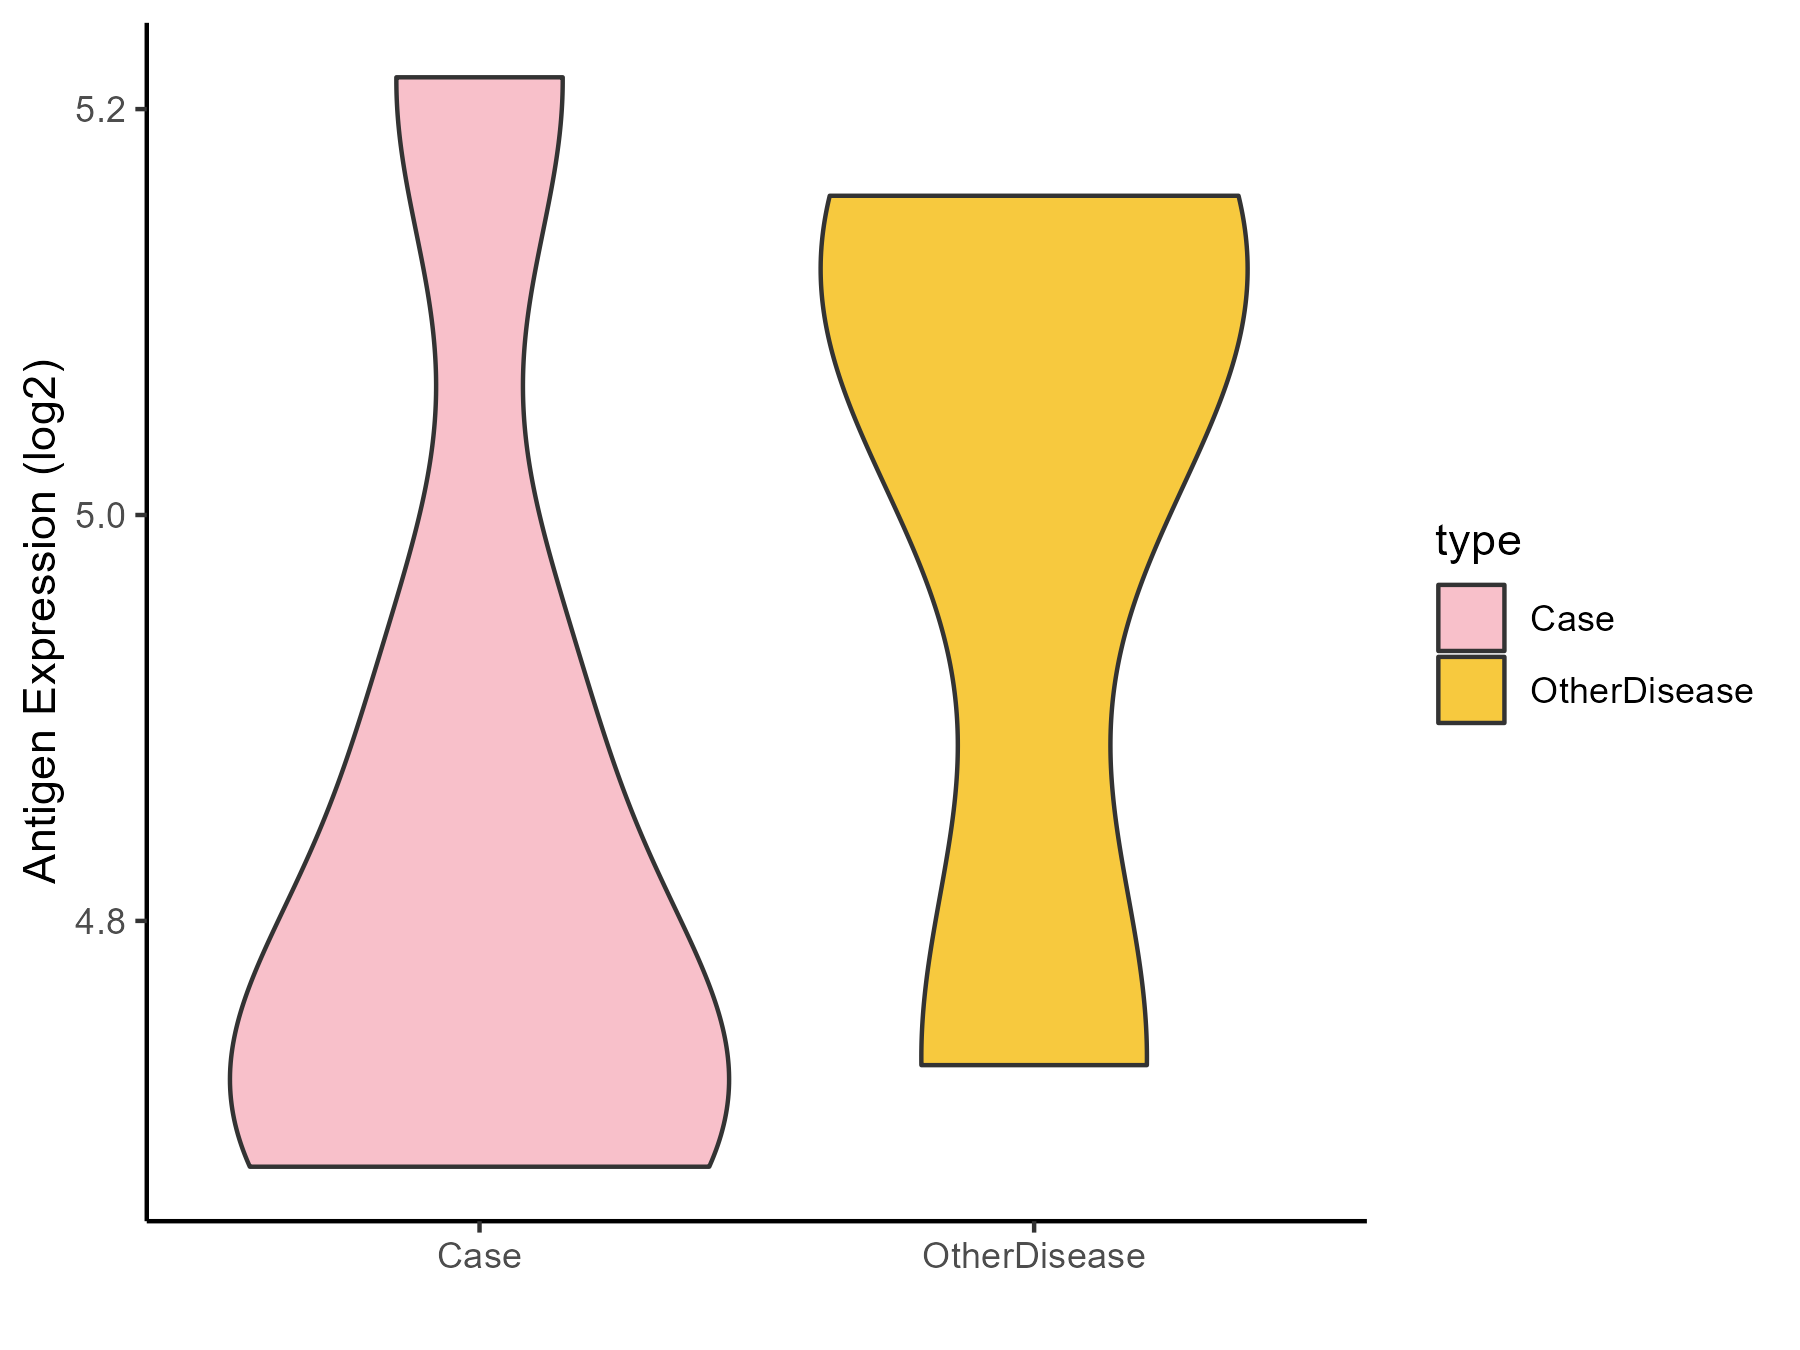
Liver cancer |
| The Expression Level of Disease Section Compare with the Healthy Individual Tissue |
p-value: 3.06E-07;
Fold-change: 0.295332055;
Z-score: 0.64556431
|
| The Expression Level of Disease Section Compare with the Adjacent Tissue |
p-value: 4.60E-20;
Fold-change: 0.35868948;
Z-score: 0.866692094
|
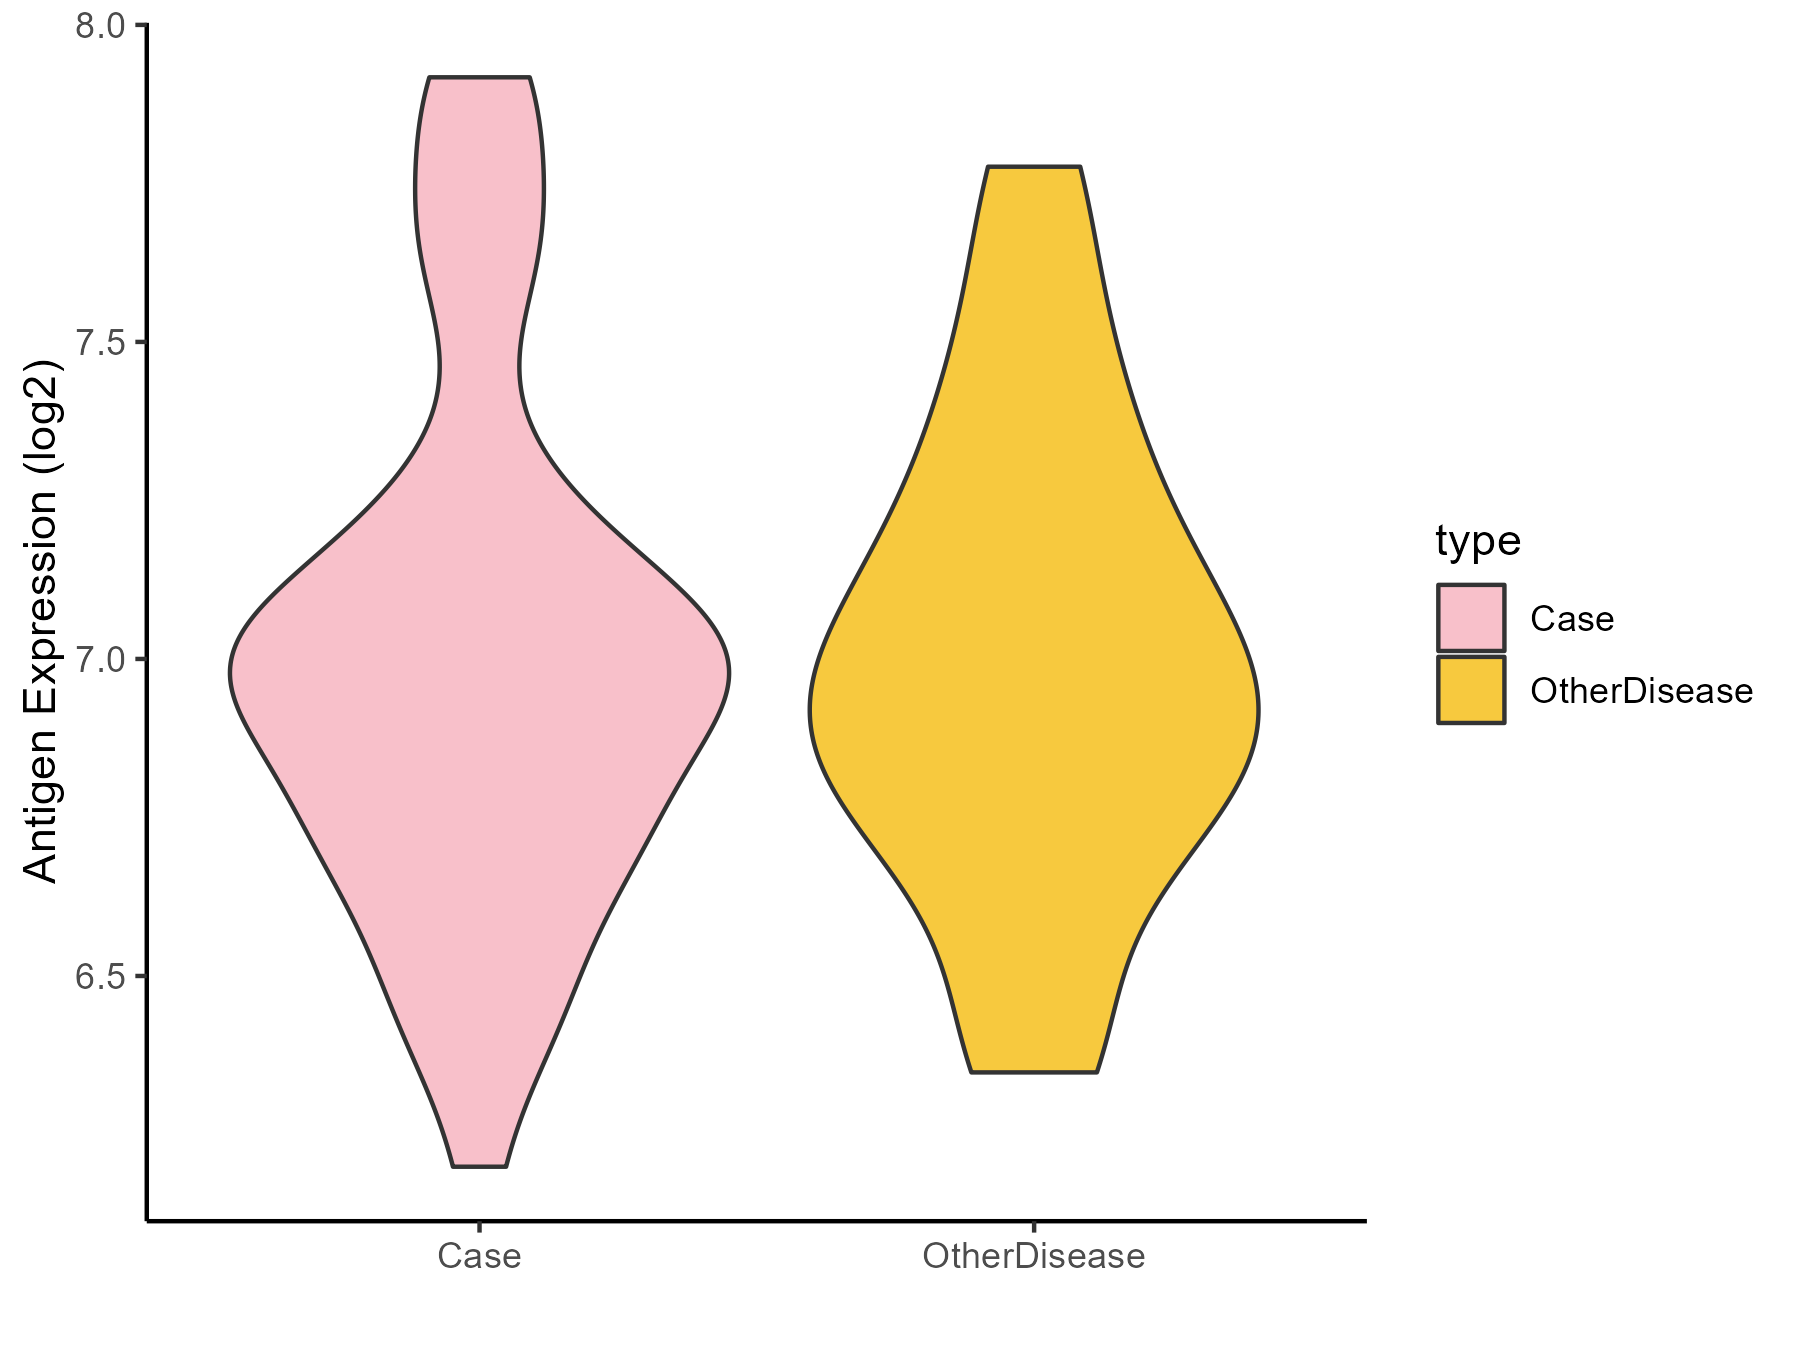
| The Expression Level of Disease Section Compare with the Other Disease Section |
p-value: 0.00028028;
Fold-change: 0.435930809;
Z-score: 3.051946073
|
| Disease-specific Antigen Abundances |
|
Click to View the Clearer Original Diagram
|
|
|
Lung cancer [ICD-11: 2C25]
Click to Show/Hide
| Differential expression pattern of antigen in diseases |
| The Studied Tissue |
Lung |
| The Specific Disease |
Lung cancer |
| The Expression Level of Disease Section Compare with the Healthy Individual Tissue |
p-value: 0.072362916;
Fold-change: 0.008696443;
Z-score: 0.017321475
|
| The Expression Level of Disease Section Compare with the Adjacent Tissue |
p-value: 4.88E-06;
Fold-change: 0.24334333;
Z-score: 0.46509899
|
| Disease-specific Antigen Abundances |
|
Click to View the Clearer Original Diagram
|
|
|
Melanoma [ICD-11: 2C30]
Click to Show/Hide
| Differential expression pattern of antigen in diseases |
| The Studied Tissue |
Skin |
| The Specific Disease |
Melanoma |
| The Expression Level of Disease Section Compare with the Healthy Individual Tissue |
p-value: 0.006177339;
Fold-change: -0.707877963;
Z-score: -0.950864296
|
| Disease-specific Antigen Abundances |
|
Click to View the Clearer Original Diagram
|
|
|
Sarcoma [ICD-11: 2C35]
Click to Show/Hide
| Differential expression pattern of antigen in diseases |
| The Studied Tissue |
Muscle |
| The Specific Disease |
Sarcoma |
| The Expression Level of Disease Section Compare with the Healthy Individual Tissue |
p-value: 0.482196107;
Fold-change: -0.1076993;
Z-score: -0.16788575
|
| The Expression Level of Disease Section Compare with the Adjacent Tissue |
p-value: 0.904557257;
Fold-change: -0.017148963;
Z-score: -0.039774633
|
| Disease-specific Antigen Abundances |

|
Click to View the Clearer Original Diagram
|
|
|
Breast cancer [ICD-11: 2C60]
Click to Show/Hide
| Differential expression pattern of antigen in diseases |
| The Studied Tissue |
Breast |
| The Specific Disease |
Breast cancer |
| The Expression Level of Disease Section Compare with the Healthy Individual Tissue |
p-value: 0.004170666;
Fold-change: -0.051883239;
Z-score: -0.065382282
|
| The Expression Level of Disease Section Compare with the Adjacent Tissue |
p-value: 0.087405731;
Fold-change: 0.024290842;
Z-score: 0.052789978
|
| Disease-specific Antigen Abundances |

|
Click to View the Clearer Original Diagram
|
|
|
Ovarian cancer [ICD-11: 2C73]
Click to Show/Hide
| Differential expression pattern of antigen in diseases |
| The Studied Tissue |
Ovarian |
| The Specific Disease |
Ovarian cancer |
| The Expression Level of Disease Section Compare with the Healthy Individual Tissue |
p-value: 0.229320733;
Fold-change: -0.354413839;
Z-score: -0.710322442
|
| The Expression Level of Disease Section Compare with the Adjacent Tissue |
p-value: 0.008425169;
Fold-change: -0.372980532;
Z-score: -0.253963106
|
| Disease-specific Antigen Abundances |
|
Click to View the Clearer Original Diagram
|
|
|
Cervical cancer [ICD-11: 2C77]
Click to Show/Hide
| Differential expression pattern of antigen in diseases |
| The Studied Tissue |
Cervical |
| The Specific Disease |
Cervical cancer |
| The Expression Level of Disease Section Compare with the Healthy Individual Tissue |
p-value: 0.924424658;
Fold-change: -0.011607925;
Z-score: -0.063128539
|
| Disease-specific Antigen Abundances |
|
Click to View the Clearer Original Diagram
|
|
|
Uterine cancer [ICD-11: 2C78]
Click to Show/Hide
| Differential expression pattern of antigen in diseases |
| The Studied Tissue |
Endometrium |
| The Specific Disease |
Uterine cancer |
| The Expression Level of Disease Section Compare with the Healthy Individual Tissue |
p-value: 5.45E-18;
Fold-change: 0.478332536;
Z-score: 1.129889413
|
| The Expression Level of Disease Section Compare with the Adjacent Tissue |
p-value: 0.122713376;
Fold-change: -0.74578067;
Z-score: -0.733818812
|
| Disease-specific Antigen Abundances |
|
Click to View the Clearer Original Diagram
|
|
|
Prostate cancer [ICD-11: 2C82]
Click to Show/Hide
| Differential expression pattern of antigen in diseases |
| The Studied Tissue |
Prostate |
| The Specific Disease |
Prostate cancer |
| The Expression Level of Disease Section Compare with the Healthy Individual Tissue |
p-value: 0.052694332;
Fold-change: -0.357625942;
Z-score: -0.641205238
|
| Disease-specific Antigen Abundances |
|
Click to View the Clearer Original Diagram
|
|
|
Bladder cancer [ICD-11: 2C94]
Click to Show/Hide
| Differential expression pattern of antigen in diseases |
| The Studied Tissue |
Bladder |
| The Specific Disease |
Bladder cancer |
| The Expression Level of Disease Section Compare with the Healthy Individual Tissue |
p-value: 6.51E-05;
Fold-change: -0.813976369;
Z-score: -3.039796382
|
| Disease-specific Antigen Abundances |
|
Click to View the Clearer Original Diagram
|
|
|
Retina cancer [ICD-11: 2D02]
Click to Show/Hide
| Differential expression pattern of antigen in diseases |
| The Studied Tissue |
Uvea |
| The Specific Disease |
Retinoblastoma tumor |
| The Expression Level of Disease Section Compare with the Healthy Individual Tissue |
p-value: 2.75E-10;
Fold-change: -1.357302628;
Z-score: -6.638194678
|
| Disease-specific Antigen Abundances |
|
Click to View the Clearer Original Diagram
|
|
|
Thyroid cancer [ICD-11: 2D10]
Click to Show/Hide
| Differential expression pattern of antigen in diseases |
| The Studied Tissue |
Thyroid |
| The Specific Disease |
Thyroid cancer |
| The Expression Level of Disease Section Compare with the Healthy Individual Tissue |
p-value: 1.18E-12;
Fold-change: -0.67546089;
Z-score: -1.150514833
|
| The Expression Level of Disease Section Compare with the Adjacent Tissue |
p-value: 3.84E-05;
Fold-change: -0.434888936;
Z-score: -0.799655471
|
| Disease-specific Antigen Abundances |
|
Click to View the Clearer Original Diagram
|
|
|
Adrenal cancer [ICD-11: 2D11]
Click to Show/Hide
| Differential expression pattern of antigen in diseases |
| The Studied Tissue |
Adrenal cortex |
| The Specific Disease |
Adrenocortical carcinoma |
| The Expression Level of Disease Section Compare with the Other Disease Section |
p-value: 1.34E-07;
Fold-change: 0.37565843;
Z-score: 2.586973921
|
| Disease-specific Antigen Abundances |
|
Click to View the Clearer Original Diagram
|
|
|
Head and neck cancer [ICD-11: 2D42]
Click to Show/Hide
| Differential expression pattern of antigen in diseases |
| The Studied Tissue |
Head and neck |
| The Specific Disease |
Head and neck cancer |
| The Expression Level of Disease Section Compare with the Healthy Individual Tissue |
p-value: 0.003020304;
Fold-change: 0.043414814;
Z-score: 0.112781948
|
| Disease-specific Antigen Abundances |
|
Click to View the Clearer Original Diagram
|
|
|
Pituitary cancer [ICD-11: 2F37]
Click to Show/Hide
| Differential expression pattern of antigen in diseases |
| The Studied Tissue |
Pituitary |
| The Specific Disease |
Pituitary gonadotrope tumor |
| The Expression Level of Disease Section Compare with the Healthy Individual Tissue |
p-value: 0.522842211;
Fold-change: -0.037848204;
Z-score: -0.099026837
|
| Disease-specific Antigen Abundances |
|
Click to View the Clearer Original Diagram
|
|
|
| The Studied Tissue |
Pituitary |
| The Specific Disease |
Pituitary cancer |
| The Expression Level of Disease Section Compare with the Healthy Individual Tissue |
p-value: 0.28494902;
Fold-change: -0.065486426;
Z-score: -0.144894168
|
| Disease-specific Antigen Abundances |
|
Click to View the Clearer Original Diagram
|
|
|
ICD Disease Classification 03
Click to Show/Hide the 1 Disease of This Class
Thrombocytopenia [ICD-11: 3B64]
Click to Show/Hide
| Differential expression pattern of antigen in diseases |
| The Studied Tissue |
Whole blood |
| The Specific Disease |
Thrombocytopenia |
| The Expression Level of Disease Section Compare with the Healthy Individual Tissue |
p-value: 0.465286314;
Fold-change: 0.03660963;
Z-score: 0.053507407
|
| Disease-specific Antigen Abundances |
|
Click to View the Clearer Original Diagram
|
|
|
ICD Disease Classification 04
Click to Show/Hide the 2 Disease of This Class
Lupus erythematosus [ICD-11: 4A40]
Click to Show/Hide
| Differential expression pattern of antigen in diseases |
| The Studied Tissue |
Whole blood |
| The Specific Disease |
Lupus erythematosus |
| The Expression Level of Disease Section Compare with the Healthy Individual Tissue |
p-value: 3.81E-16;
Fold-change: 0.806801696;
Z-score: 1.290413167
|
| Disease-specific Antigen Abundances |
|
Click to View the Clearer Original Diagram
|
|
|
Autoimmune disease [ICD-11: 4A4Z]
Click to Show/Hide
| Differential expression pattern of antigen in diseases |
| The Studied Tissue |
Peripheral monocyte |
| The Specific Disease |
Autoimmune uveitis |
| The Expression Level of Disease Section Compare with the Healthy Individual Tissue |
p-value: 0.693126022;
Fold-change: -0.198248279;
Z-score: -0.357172742
|
| Disease-specific Antigen Abundances |
|
Click to View the Clearer Original Diagram
|
|
|
ICD Disease Classification 05
Click to Show/Hide the 1 Disease of This Class
Hyperlipoproteinaemia [ICD-11: 5C80]
Click to Show/Hide
| Differential expression pattern of antigen in diseases |
| The Studied Tissue |
Whole blood |
| The Specific Disease |
Familial hypercholesterolemia |
| The Expression Level of Disease Section Compare with the Healthy Individual Tissue |
p-value: 0.650083879;
Fold-change: 0.012542479;
Z-score: 0.03322607
|
| Disease-specific Antigen Abundances |
|
Click to View the Clearer Original Diagram
|
|
|
ICD Disease Classification 06
Click to Show/Hide the 1 Disease of This Class
Schizophrenia [ICD-11: 6A20]
Click to Show/Hide
| Differential expression pattern of antigen in diseases |
| The Studied Tissue |
Superior temporal cortex |
| The Specific Disease |
Schizophrenia |
| The Expression Level of Disease Section Compare with the Healthy Individual Tissue |
p-value: 0.861276825;
Fold-change: 0.208033399;
Z-score: 0.437980499
|
| Disease-specific Antigen Abundances |
|
Click to View the Clearer Original Diagram
|
|
|
ICD Disease Classification 08
Click to Show/Hide the 3 Disease of This Class
Multiple sclerosis [ICD-11: 8A40]
Click to Show/Hide
| Differential expression pattern of antigen in diseases |
| The Studied Tissue |
Spinal cord |
| The Specific Disease |
Multiple sclerosis |
| The Expression Level of Disease Section Compare with the Adjacent Tissue |
p-value: 0.495716846;
Fold-change: 0.347232589;
Z-score: 0.673608786
|
| Disease-specific Antigen Abundances |
|
Click to View the Clearer Original Diagram
|
|
|
| The Studied Tissue |
Plasmacytoid dendritic cells |
| The Specific Disease |
Multiple sclerosis |
| The Expression Level of Disease Section Compare with the Healthy Individual Tissue |
p-value: 0.661597894;
Fold-change: 0.012890925;
Z-score: 0.057556462
|
| Disease-specific Antigen Abundances |

|
Click to View the Clearer Original Diagram
|
|
|
Epilepsy [ICD-11: 8A60]
Click to Show/Hide
| Differential expression pattern of antigen in diseases |
| The Studied Tissue |
Peritumoral cortex |
| The Specific Disease |
Epilepsy |
| The Expression Level of Disease Section Compare with the Other Disease Section |
p-value: 0.446653926;
Fold-change: -0.345703112;
Z-score: -1.505514032
|
| Disease-specific Antigen Abundances |
|
Click to View the Clearer Original Diagram
|
|
|
Cerebral ischaemic stroke [ICD-11: 8B11]
Click to Show/Hide
| Differential expression pattern of antigen in diseases |
| The Studied Tissue |
Whole blood |
| The Specific Disease |
Cardioembolic Stroke |
| The Expression Level of Disease Section Compare with the Healthy Individual Tissue |
p-value: 9.85E-06;
Fold-change: 0.624953019;
Z-score: 1.010556035
|
| Disease-specific Antigen Abundances |
|
Click to View the Clearer Original Diagram
|
|
|
| The Studied Tissue |
Peripheral blood |
| The Specific Disease |
Ischemic stroke |
| The Expression Level of Disease Section Compare with the Healthy Individual Tissue |
p-value: 0.897439624;
Fold-change: -0.07922838;
Z-score: -0.294716133
|
| Disease-specific Antigen Abundances |
|
Click to View the Clearer Original Diagram
|
|
|
ICD Disease Classification 1
Click to Show/Hide the 6 Disease of This Class
HIV [ICD-11: 1C60-1C62]
Click to Show/Hide
| Differential expression pattern of antigen in diseases |
| The Studied Tissue |
White matter |
| The Specific Disease |
HIV |
| The Expression Level of Disease Section Compare with the Healthy Individual Tissue |
p-value: 0.21056448;
Fold-change: 0.079600819;
Z-score: 0.408678697
|
| Disease-specific Antigen Abundances |
|
Click to View the Clearer Original Diagram
|
|
|
Influenza [ICD-11: 1E30]
Click to Show/Hide
| Differential expression pattern of antigen in diseases |
| The Studied Tissue |
Whole blood |
| The Specific Disease |
Influenza |
| The Expression Level of Disease Section Compare with the Healthy Individual Tissue |
p-value: 0.01745352;
Fold-change: -0.402967612;
Z-score: -2.460000863
|
| Disease-specific Antigen Abundances |

|
Click to View the Clearer Original Diagram
|
|
|
Chronic hepatitis C [ICD-11: 1E51.1]
Click to Show/Hide
| Differential expression pattern of antigen in diseases |
| The Studied Tissue |
Whole blood |
| The Specific Disease |
Chronic hepatitis C |
| The Expression Level of Disease Section Compare with the Healthy Individual Tissue |
p-value: 0.752495226;
Fold-change: -0.101279985;
Z-score: -0.369656642
|
| Disease-specific Antigen Abundances |
|
Click to View the Clearer Original Diagram
|
|
|
Sepsis [ICD-11: 1G40-1G41]
Click to Show/Hide
| Differential expression pattern of antigen in diseases |
| The Studied Tissue |
Whole blood |
| The Specific Disease |
Sepsis |
| The Expression Level of Disease Section Compare with the Healthy Individual Tissue |
p-value: 1.38E-47;
Fold-change: 1.716834382;
Z-score: 7.19938912
|
| Disease-specific Antigen Abundances |
|
Click to View the Clearer Original Diagram
|
|
|
Septic shock [ICD-11: 1G41]
Click to Show/Hide
| Differential expression pattern of antigen in diseases |
| The Studied Tissue |
Whole blood |
| The Specific Disease |
Septic shock |
| The Expression Level of Disease Section Compare with the Healthy Individual Tissue |
p-value: 2.04E-196;
Fold-change: 1.879123114;
Z-score: 6.560855373
|
| Disease-specific Antigen Abundances |
|
Click to View the Clearer Original Diagram
|
|
|
Pediatric respiratory syncytial virus infection [ICD-11: CA40.11]
Click to Show/Hide
| Differential expression pattern of antigen in diseases |
| The Studied Tissue |
Peripheral blood |
| The Specific Disease |
Pediatric respiratory syncytial virus infection |
| The Expression Level of Disease Section Compare with the Healthy Individual Tissue |
p-value: 0.00228556;
Fold-change: 0.244706942;
Z-score: 1.745804924
|
| Disease-specific Antigen Abundances |
|
Click to View the Clearer Original Diagram
|
|
|
ICD Disease Classification 11
Click to Show/Hide the 6 Disease of This Class
Essential hypertension [ICD-11: BA00]
Click to Show/Hide
| Differential expression pattern of antigen in diseases |
| The Studied Tissue |
Peripheral blood |
| The Specific Disease |
Essential hypertension |
| The Expression Level of Disease Section Compare with the Healthy Individual Tissue |
p-value: 0.303070214;
Fold-change: 0.077954802;
Z-score: 0.385230215
|
| Disease-specific Antigen Abundances |
|
Click to View the Clearer Original Diagram
|
|
|
Myocardial infarction [ICD-11: BA41]
Click to Show/Hide
| Differential expression pattern of antigen in diseases |
| The Studied Tissue |
Peripheral blood |
| The Specific Disease |
Myocardial infarction |
| The Expression Level of Disease Section Compare with the Healthy Individual Tissue |
p-value: 0.000627878;
Fold-change: 0.338860783;
Z-score: 0.821561352
|
| Disease-specific Antigen Abundances |
|
Click to View the Clearer Original Diagram
|
|
|
Coronary artery disease [ICD-11: BA8Z]
Click to Show/Hide
| Differential expression pattern of antigen in diseases |
| The Studied Tissue |
Peripheral blood |
| The Specific Disease |
Coronary artery disease |
| The Expression Level of Disease Section Compare with the Healthy Individual Tissue |
p-value: 0.481216073;
Fold-change: -0.113709884;
Z-score: -0.664875299
|
| Disease-specific Antigen Abundances |
|
Click to View the Clearer Original Diagram
|
|
|
Aortic stenosis [ICD-11: BB70]
Click to Show/Hide
| Differential expression pattern of antigen in diseases |
| The Studied Tissue |
Calcified aortic valve |
| The Specific Disease |
Aortic stenosis |
| The Expression Level of Disease Section Compare with the Healthy Individual Tissue |
p-value: 0.77924331;
Fold-change: 0.047621781;
Z-score: 0.216498862
|
| Disease-specific Antigen Abundances |
|
Click to View the Clearer Original Diagram
|
|
|
Arteriosclerosis [ICD-11: BD40]
Click to Show/Hide
| Differential expression pattern of antigen in diseases |
| The Studied Tissue |
Peripheral blood |
| The Specific Disease |
Arteriosclerosis |
| The Expression Level of Disease Section Compare with the Healthy Individual Tissue |
p-value: 0.808038467;
Fold-change: -0.034756148;
Z-score: -0.256119322
|
| Disease-specific Antigen Abundances |
|
Click to View the Clearer Original Diagram
|
|
|
Aneurysm [ICD-11: BD50]
Click to Show/Hide
| Differential expression pattern of antigen in diseases |
| The Studied Tissue |
Intracranial artery |
| The Specific Disease |
Aneurysm |
| The Expression Level of Disease Section Compare with the Healthy Individual Tissue |
p-value: 0.015359433;
Fold-change: -0.362323531;
Z-score: -0.947398084
|
| Disease-specific Antigen Abundances |
|
Click to View the Clearer Original Diagram
|
|
|
ICD Disease Classification 12
Click to Show/Hide the 8 Disease of This Class
Immunodeficiency [ICD-11: 4A00-4A20]
Click to Show/Hide
| Differential expression pattern of antigen in diseases |
| The Studied Tissue |
Peripheral blood |
| The Specific Disease |
Immunodeficiency |
| The Expression Level of Disease Section Compare with the Healthy Individual Tissue |
p-value: 0.305130661;
Fold-change: -0.045286796;
Z-score: -0.436264871
|
| Disease-specific Antigen Abundances |
|
Click to View the Clearer Original Diagram
|
|
|
Apnea [ICD-11: 7A40]
Click to Show/Hide
| Differential expression pattern of antigen in diseases |
| The Studied Tissue |
Hyperplastic tonsil |
| The Specific Disease |
Apnea |
| The Expression Level of Disease Section Compare with the Healthy Individual Tissue |
p-value: 0.828138936;
Fold-change: -0.177303108;
Z-score: -0.53524012
|
| Disease-specific Antigen Abundances |
|
Click to View the Clearer Original Diagram
|
|
|
Olive pollen allergy [ICD-11: CA08.00]
Click to Show/Hide
| Differential expression pattern of antigen in diseases |
| The Studied Tissue |
Peripheral blood |
| The Specific Disease |
Olive pollen allergy |
| The Expression Level of Disease Section Compare with the Healthy Individual Tissue |
p-value: 0.204599346;
Fold-change: 0.58090577;
Z-score: 0.966787708
|
| Disease-specific Antigen Abundances |
|
Click to View the Clearer Original Diagram
|
|
|
Chronic rhinosinusitis [ICD-11: CA0A]
Click to Show/Hide
| Differential expression pattern of antigen in diseases |
| The Studied Tissue |
Sinus mucosa |
| The Specific Disease |
Chronic rhinosinusitis |
| The Expression Level of Disease Section Compare with the Healthy Individual Tissue |
p-value: 0.169072615;
Fold-change: 0.115222616;
Z-score: 0.333275053
|
| Disease-specific Antigen Abundances |
|
Click to View the Clearer Original Diagram
|
|
|
Chronic obstructive pulmonary disease [ICD-11: CA22]
Click to Show/Hide
| Differential expression pattern of antigen in diseases |
| The Studied Tissue |
Lung |
| The Specific Disease |
Chronic obstructive pulmonary disease |
| The Expression Level of Disease Section Compare with the Healthy Individual Tissue |
p-value: 0.824683113;
Fold-change: -0.080505919;
Z-score: -0.170530653
|
| Disease-specific Antigen Abundances |
|
Click to View the Clearer Original Diagram
|
|
|
| The Studied Tissue |
Small airway epithelium |
| The Specific Disease |
Chronic obstructive pulmonary disease |
| The Expression Level of Disease Section Compare with the Healthy Individual Tissue |
p-value: 0.094636547;
Fold-change: -0.070735663;
Z-score: -0.169579543
|
| Disease-specific Antigen Abundances |
|
Click to View the Clearer Original Diagram
|
|
|
Asthma [ICD-11: CA23]
Click to Show/Hide
| Differential expression pattern of antigen in diseases |
| The Studied Tissue |
Nasal and bronchial airway |
| The Specific Disease |
Asthma |
| The Expression Level of Disease Section Compare with the Healthy Individual Tissue |
p-value: 0.806311748;
Fold-change: -0.11823991;
Z-score: -0.145281539
|
| Disease-specific Antigen Abundances |
|
Click to View the Clearer Original Diagram
|
|
|
Human rhinovirus infection [ICD-11: CA42]
Click to Show/Hide
| Differential expression pattern of antigen in diseases |
| The Studied Tissue |
Nasal Epithelium |
| The Specific Disease |
Human rhinovirus infection |
| The Expression Level of Disease Section Compare with the Healthy Individual Tissue |
p-value: 0.008628277;
Fold-change: 0.089205196;
Z-score: 0.493381292
|
| Disease-specific Antigen Abundances |
|
Click to View the Clearer Original Diagram
|
|
|
Idiopathic pulmonary fibrosis [ICD-11: CB03.4]
Click to Show/Hide
| Differential expression pattern of antigen in diseases |
| The Studied Tissue |
Lung |
| The Specific Disease |
Idiopathic pulmonary fibrosis |
| The Expression Level of Disease Section Compare with the Healthy Individual Tissue |
p-value: 0.066053814;
Fold-change: -0.411279758;
Z-score: -1.267576995
|
| Disease-specific Antigen Abundances |
|
Click to View the Clearer Original Diagram
|
|
|
ICD Disease Classification 13
Click to Show/Hide the 5 Disease of This Class
Periodontal disease [ICD-11: DA0C]
Click to Show/Hide
| Differential expression pattern of antigen in diseases |
| The Studied Tissue |
Gingival |
| The Specific Disease |
Periodontal disease |
| The Expression Level of Disease Section Compare with the Adjacent Tissue |
p-value: 0.089023422;
Fold-change: 0.095266979;
Z-score: 0.404576483
|
| Disease-specific Antigen Abundances |
|
Click to View the Clearer Original Diagram
|
|
|
Eosinophilic gastritis [ICD-11: DA42.2]
Click to Show/Hide
| Differential expression pattern of antigen in diseases |
| The Studied Tissue |
Gastric antrum |
| The Specific Disease |
Eosinophilic gastritis |
| The Expression Level of Disease Section Compare with the Adjacent Tissue |
p-value: 0.073445766;
Fold-change: 0.604244311;
Z-score: 3.542758433
|
| Disease-specific Antigen Abundances |
|
Click to View the Clearer Original Diagram
|
|
|
Liver failure [ICD-11: DB99.7-DB99.8]
Click to Show/Hide
| Differential expression pattern of antigen in diseases |
| The Studied Tissue |
Liver |
| The Specific Disease |
Liver failure |
| The Expression Level of Disease Section Compare with the Healthy Individual Tissue |
p-value: 0.04594988;
Fold-change: -0.325497334;
Z-score: -1.118841098
|
| Disease-specific Antigen Abundances |
|
Click to View the Clearer Original Diagram
|
|
|
Ulcerative colitis [ICD-11: DD71]
Click to Show/Hide
| Differential expression pattern of antigen in diseases |
| The Studied Tissue |
Colon mucosal |
| The Specific Disease |
Ulcerative colitis |
| The Expression Level of Disease Section Compare with the Adjacent Tissue |
p-value: 0.998121123;
Fold-change: 0.00577581;
Z-score: 0.015339521
|
| Disease-specific Antigen Abundances |
|
Click to View the Clearer Original Diagram
|
|
|
Irritable bowel syndrome [ICD-11: DD91.0]
Click to Show/Hide
| Differential expression pattern of antigen in diseases |
| The Studied Tissue |
Rectal colon |
| The Specific Disease |
Irritable bowel syndrome |
| The Expression Level of Disease Section Compare with the Healthy Individual Tissue |
p-value: 0.152691596;
Fold-change: 0.0804166;
Z-score: 0.307760155
|
| Disease-specific Antigen Abundances |
|
Click to View the Clearer Original Diagram
|
|
|
ICD Disease Classification 14
Click to Show/Hide the 5 Disease of This Class
Atopic dermatitis [ICD-11: EA80]
Click to Show/Hide
| Differential expression pattern of antigen in diseases |
| The Studied Tissue |
Skin |
| The Specific Disease |
Atopic dermatitis |
| The Expression Level of Disease Section Compare with the Healthy Individual Tissue |
p-value: 0.637931166;
Fold-change: 0.082267061;
Z-score: 0.444525957
|
| Disease-specific Antigen Abundances |
|
Click to View the Clearer Original Diagram
|
|
|
Psoriasis [ICD-11: EA90]
Click to Show/Hide
| Differential expression pattern of antigen in diseases |
| The Studied Tissue |
Skin |
| The Specific Disease |
Psoriasis |
| The Expression Level of Disease Section Compare with the Healthy Individual Tissue |
p-value: 4.44E-05;
Fold-change: -0.183803518;
Z-score: -0.46737024
|
| The Expression Level of Disease Section Compare with the Adjacent Tissue |
p-value: 0.752102698;
Fold-change: -0.092581006;
Z-score: -0.136048911
|
| Disease-specific Antigen Abundances |
|
Click to View the Clearer Original Diagram
|
|
|
Vitiligo [ICD-11: ED63.0]
Click to Show/Hide
| Differential expression pattern of antigen in diseases |
| The Studied Tissue |
Skin |
| The Specific Disease |
Vitiligo |
| The Expression Level of Disease Section Compare with the Healthy Individual Tissue |
p-value: 0.101580562;
Fold-change: -0.147357478;
Z-score: -0.689088568
|
| Disease-specific Antigen Abundances |
|
Click to View the Clearer Original Diagram
|
|
|
Alopecia [ICD-11: ED70]
Click to Show/Hide
| Differential expression pattern of antigen in diseases |
| The Studied Tissue |
Skin from scalp |
| The Specific Disease |
Alopecia |
| The Expression Level of Disease Section Compare with the Healthy Individual Tissue |
p-value: 2.91E-06;
Fold-change: 0.464163265;
Z-score: 1.045727294
|
| Disease-specific Antigen Abundances |
|
Click to View the Clearer Original Diagram
|
|
|
Sensitive skin [ICD-11: EK0Z]
Click to Show/Hide
| Differential expression pattern of antigen in diseases |
| The Studied Tissue |
Skin |
| The Specific Disease |
Sensitive skin |
| The Expression Level of Disease Section Compare with the Healthy Individual Tissue |
p-value: 0.98342229;
Fold-change: 0.06032165;
Z-score: 0.128761024
|
| Disease-specific Antigen Abundances |
|
Click to View the Clearer Original Diagram
|
|
|
ICD Disease Classification 15
Click to Show/Hide the 6 Disease of This Class
Osteoarthritis [ICD-11: FA00-FA0Z]
Click to Show/Hide
| Differential expression pattern of antigen in diseases |
| The Studied Tissue |
Synovial |
| The Specific Disease |
Osteoarthritis |
| The Expression Level of Disease Section Compare with the Healthy Individual Tissue |
p-value: 0.581867812;
Fold-change: -0.148208316;
Z-score: -0.154692742
|
| Disease-specific Antigen Abundances |
|
Click to View the Clearer Original Diagram
|
|
|
Arthropathy [ICD-11: FA00-FA5Z]
Click to Show/Hide
| Differential expression pattern of antigen in diseases |
| The Studied Tissue |
Peripheral blood |
| The Specific Disease |
Arthropathy |
| The Expression Level of Disease Section Compare with the Healthy Individual Tissue |
p-value: 0.063073139;
Fold-change: 0.178140672;
Z-score: 0.707721911
|
| Disease-specific Antigen Abundances |
|
Click to View the Clearer Original Diagram
|
|
|
Arthritis [ICD-11: FA20]
Click to Show/Hide
| Differential expression pattern of antigen in diseases |
| The Studied Tissue |
Peripheral blood |
| The Specific Disease |
Arthritis |
| The Expression Level of Disease Section Compare with the Healthy Individual Tissue |
p-value: 7.97E-06;
Fold-change: 0.189026064;
Z-score: 0.612489163
|
| Disease-specific Antigen Abundances |
|
Click to View the Clearer Original Diagram
|
|
|
Rheumatoid arthritis [ICD-11: FA20]
Click to Show/Hide
| Differential expression pattern of antigen in diseases |
| The Studied Tissue |
Synovial |
| The Specific Disease |
Rheumatoid arthritis |
| The Expression Level of Disease Section Compare with the Healthy Individual Tissue |
p-value: 0.716948807;
Fold-change: -0.034871854;
Z-score: -0.038849978
|
| Disease-specific Antigen Abundances |
|
Click to View the Clearer Original Diagram
|
|
|
Ankylosing spondylitis [ICD-11: FA92.0Z]
Click to Show/Hide
| Differential expression pattern of antigen in diseases |
| The Studied Tissue |
Pheripheral blood |
| The Specific Disease |
Ankylosing spondylitis |
| The Expression Level of Disease Section Compare with the Healthy Individual Tissue |
p-value: 0.421019871;
Fold-change: 0.19744066;
Z-score: 0.588779324
|
| Disease-specific Antigen Abundances |
|
Click to View the Clearer Original Diagram
|
|
|
Osteoporosis [ICD-11: FB83]
Click to Show/Hide
| Differential expression pattern of antigen in diseases |
| The Studied Tissue |
Bone marrow |
| The Specific Disease |
Osteoporosis |
| The Expression Level of Disease Section Compare with the Healthy Individual Tissue |
p-value: 0.746524114;
Fold-change: 0.423196246;
Z-score: 1.274697787
|
| Disease-specific Antigen Abundances |
|
Click to View the Clearer Original Diagram
|
|
|
ICD Disease Classification 16
Click to Show/Hide the 2 Disease of This Class
Endometriosis [ICD-11: GA10]
Click to Show/Hide
| Differential expression pattern of antigen in diseases |
| The Studied Tissue |
Endometrium |
| The Specific Disease |
Endometriosis |
| The Expression Level of Disease Section Compare with the Healthy Individual Tissue |
p-value: 0.66977147;
Fold-change: 0.042358018;
Z-score: 0.053569972
|
| Disease-specific Antigen Abundances |

|
Click to View the Clearer Original Diagram
|
|
|
Interstitial cystitis [ICD-11: GC00.3]
Click to Show/Hide
| Differential expression pattern of antigen in diseases |
| The Studied Tissue |
Bladder |
| The Specific Disease |
Interstitial cystitis |
| The Expression Level of Disease Section Compare with the Healthy Individual Tissue |
p-value: 0.003075637;
Fold-change: -0.668135352;
Z-score: -2.609494956
|
| Disease-specific Antigen Abundances |
|
Click to View the Clearer Original Diagram
|
|
|
ICD Disease Classification 19
Click to Show/Hide the 1 Disease of This Class
Preterm birth [ICD-11: KA21.4Z]
Click to Show/Hide
| Differential expression pattern of antigen in diseases |
| The Studied Tissue |
Myometrium |
| The Specific Disease |
Preterm birth |
| The Expression Level of Disease Section Compare with the Healthy Individual Tissue |
p-value: 0.668625554;
Fold-change: -0.026129118;
Z-score: -0.060686869
|
| Disease-specific Antigen Abundances |
|
Click to View the Clearer Original Diagram
|
|
|
ICD Disease Classification 2
Click to Show/Hide the 8 Disease of This Class
Acute myelocytic leukemia [ICD-11: 2A60]
Click to Show/Hide
| Differential expression pattern of antigen in diseases |
| The Studied Tissue |
Bone marrow |
| The Specific Disease |
Acute myelocytic leukemia |
| The Expression Level of Disease Section Compare with the Healthy Individual Tissue |
p-value: 4.45E-19;
Fold-change: 0.505675134;
Z-score: 1.095625611
|
| Disease-specific Antigen Abundances |
|
Click to View the Clearer Original Diagram
|
|
|
Myeloma [ICD-11: 2A83]
Click to Show/Hide
| Differential expression pattern of antigen in diseases |
| The Studied Tissue |
Bone marrow |
| The Specific Disease |
Myeloma |
| The Expression Level of Disease Section Compare with the Healthy Individual Tissue |
p-value: 0.805799909;
Fold-change: 0.070667337;
Z-score: 0.352380118
|
| Disease-specific Antigen Abundances |
|
Click to View the Clearer Original Diagram
|
|
|
| The Studied Tissue |
Peripheral blood |
| The Specific Disease |
Myeloma |
| The Expression Level of Disease Section Compare with the Healthy Individual Tissue |
p-value: 0.02130431;
Fold-change: -0.124167148;
Z-score: -1.579735471
|
| Disease-specific Antigen Abundances |
|
Click to View the Clearer Original Diagram
|
|
|
Oral cancer [ICD-11: 2B6E]
Click to Show/Hide
| Differential expression pattern of antigen in diseases |
| The Studied Tissue |
Oral |
| The Specific Disease |
Oral cancer |
| The Expression Level of Disease Section Compare with the Healthy Individual Tissue |
p-value: 0.002267842;
Fold-change: 0.246887919;
Z-score: 0.468403507
|
| The Expression Level of Disease Section Compare with the Adjacent Tissue |
p-value: 0.002464814;
Fold-change: 0.189048303;
Z-score: 0.506814129
|
| Disease-specific Antigen Abundances |
|
Click to View the Clearer Original Diagram
|
|
|
Esophagal cancer [ICD-11: 2B70]
Click to Show/Hide
| Differential expression pattern of antigen in diseases |
| The Studied Tissue |
Esophagus |
| The Specific Disease |
Esophagal cancer |
| The Expression Level of Disease Section Compare with the Adjacent Tissue |
p-value: 0.386591743;
Fold-change: 0.231289061;
Z-score: 0.442264652
|
| Disease-specific Antigen Abundances |
|
Click to View the Clearer Original Diagram
|
|
|
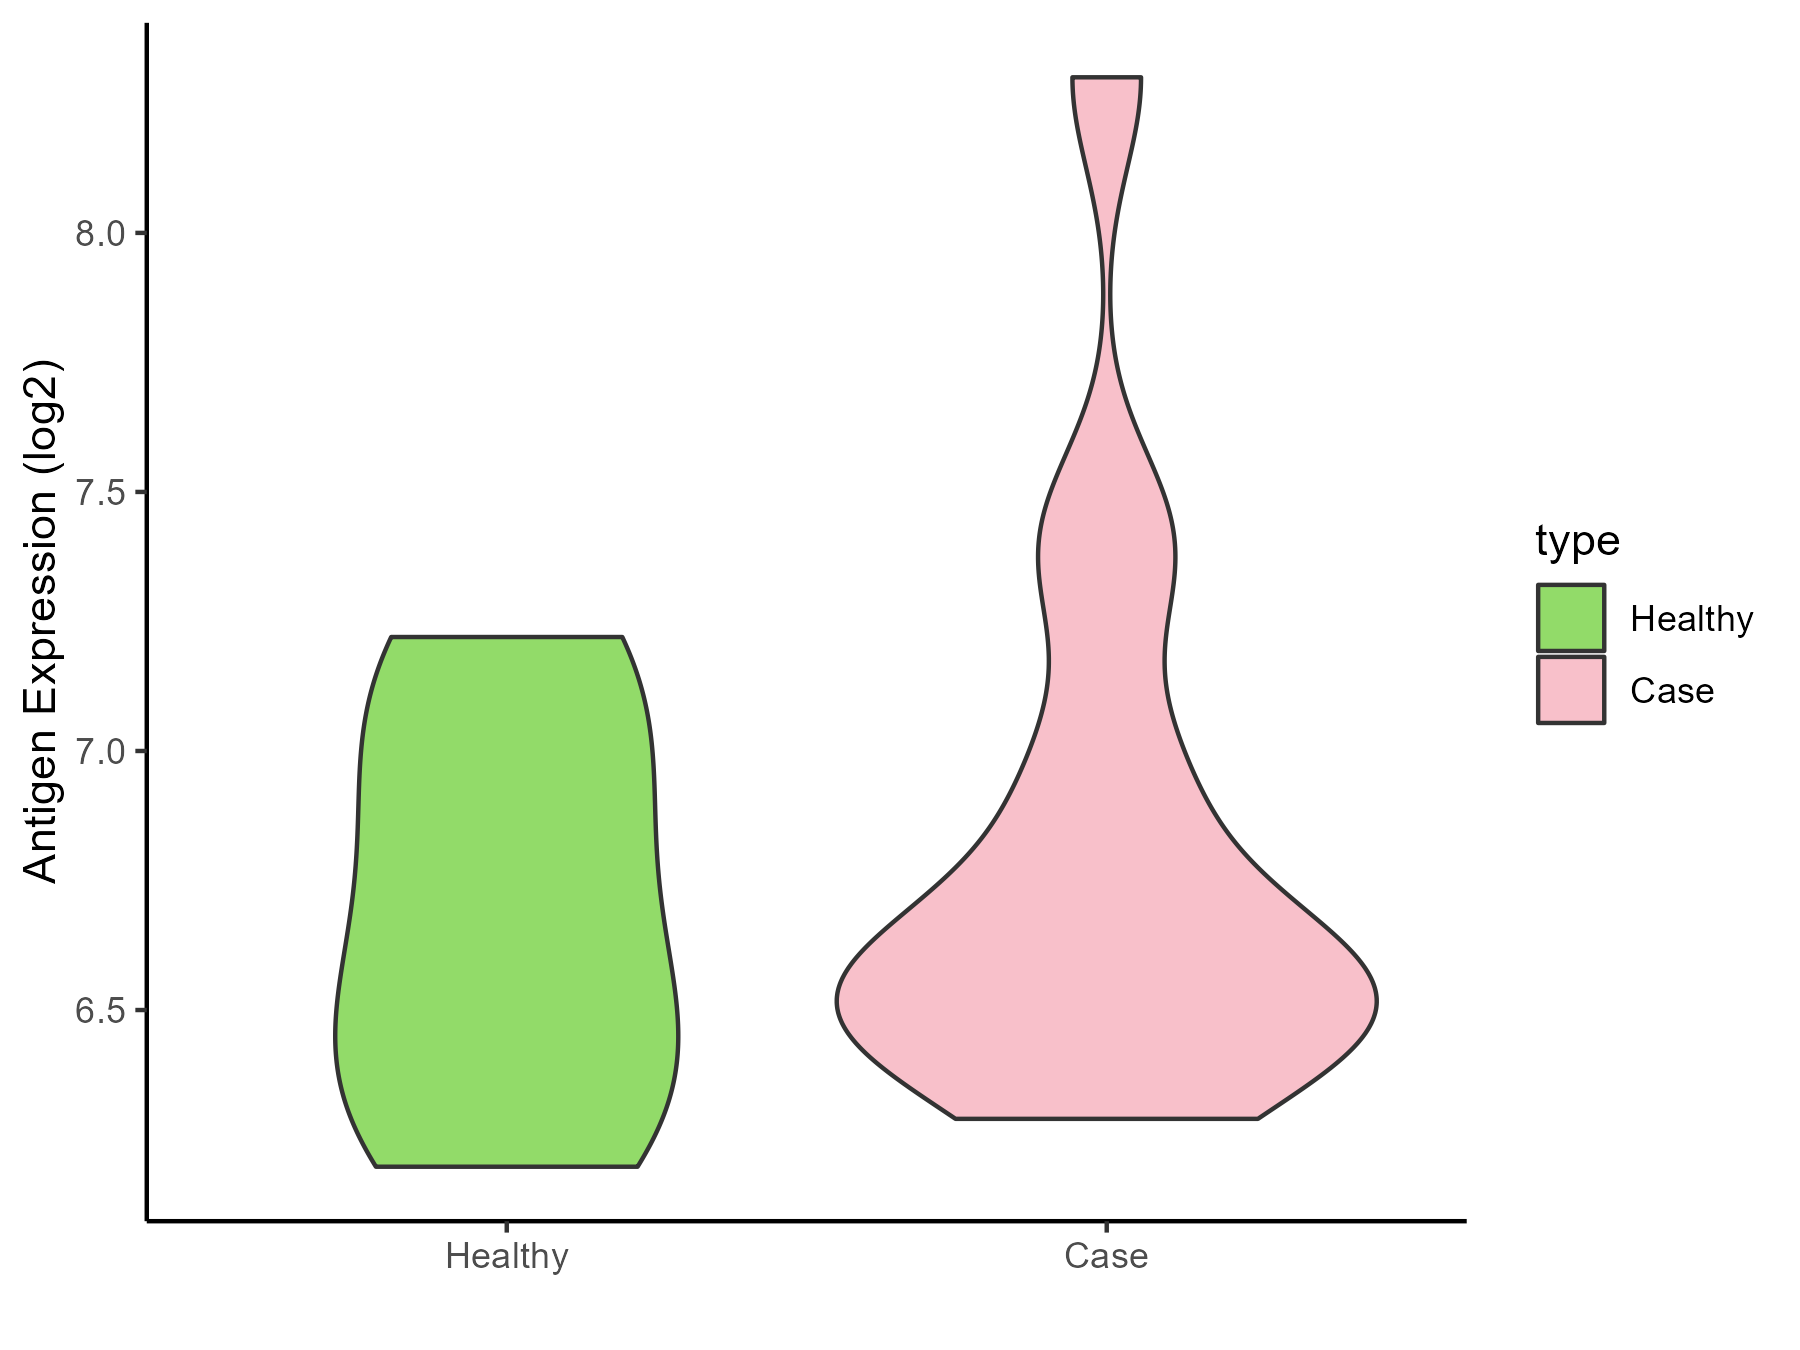
Rectal cancer [ICD-11: 2B92]
Click to Show/Hide
| Differential expression pattern of antigen in diseases |
| The Studied Tissue |
Rectal colon |
| The Specific Disease |
Rectal cancer |
| The Expression Level of Disease Section Compare with the Healthy Individual Tissue |
p-value: 2.31E-05;
Fold-change: 0.632536386;
Z-score: 3.454768866
|
| The Expression Level of Disease Section Compare with the Adjacent Tissue |
p-value: 0.269029655;
Fold-change: 0.136422028;
Z-score: 0.484965785
|
| Disease-specific Antigen Abundances |
|
Click to View the Clearer Original Diagram
|
|
|
Skin cancer [ICD-11: 2C30-2C3Z]
Click to Show/Hide
| Differential expression pattern of antigen in diseases |
| The Studied Tissue |
Skin |
| The Specific Disease |
Skin cancer |
| The Expression Level of Disease Section Compare with the Healthy Individual Tissue |
p-value: 1.44E-06;
Fold-change: 0.166508622;
Z-score: 0.424781035
|
| The Expression Level of Disease Section Compare with the Adjacent Tissue |
p-value: 5.15E-06;
Fold-change: 0.155520098;
Z-score: 0.26196959
|
| Disease-specific Antigen Abundances |
|
Click to View the Clearer Original Diagram
|
|
|
Renal cancer [ICD-11: 2C90-2C91]
Click to Show/Hide
| Differential expression pattern of antigen in diseases |
| The Studied Tissue |
Kidney |
| The Specific Disease |
Renal cancer |
| The Expression Level of Disease Section Compare with the Healthy Individual Tissue |
p-value: 0.001777083;
Fold-change: 0.314592766;
Z-score: 1.012466733
|
| The Expression Level of Disease Section Compare with the Adjacent Tissue |
p-value: 1.03E-28;
Fold-change: 0.431075886;
Z-score: 1.585762172
|
| Disease-specific Antigen Abundances |
|
Click to View the Clearer Original Diagram
|
|
|
Ureter cancer [ICD-11: 2C92]
Click to Show/Hide
| Differential expression pattern of antigen in diseases |
| The Studied Tissue |
Urothelium |
| The Specific Disease |
Ureter cancer |
| The Expression Level of Disease Section Compare with the Healthy Individual Tissue |
p-value: 0.661320394;
Fold-change: 0.007275806;
Z-score: 0.060601416
|
| Disease-specific Antigen Abundances |
|
Click to View the Clearer Original Diagram
|
|
|
ICD Disease Classification 20
Click to Show/Hide the 2 Disease of This Class
Simpson golabi behmel syndrome [ICD-11: LD2C]
Click to Show/Hide
| Differential expression pattern of antigen in diseases |
| The Studied Tissue |
Adipose |
| The Specific Disease |
Simpson golabi behmel syndrome |
| The Expression Level of Disease Section Compare with the Healthy Individual Tissue |
p-value: 0.807352643;
Fold-change: -0.047582818;
Z-score: -0.194225932
|
| Disease-specific Antigen Abundances |
|
Click to View the Clearer Original Diagram
|
|
|
Tuberous sclerosis complex [ICD-11: LD2D.2]
Click to Show/Hide
| Differential expression pattern of antigen in diseases |
| The Studied Tissue |
Perituberal |
| The Specific Disease |
Tuberous sclerosis complex |
| The Expression Level of Disease Section Compare with the Healthy Individual Tissue |
p-value: 0.31518735;
Fold-change: 0.162062965;
Z-score: 0.422882034
|
| Disease-specific Antigen Abundances |
|
Click to View the Clearer Original Diagram
|
|
|
ICD Disease Classification 3
Click to Show/Hide the 3 Disease of This Class
Anemia [ICD-11: 3A00-3A9Z]
Click to Show/Hide
| Differential expression pattern of antigen in diseases |
| The Studied Tissue |
Bone marrow |
| The Specific Disease |
Anemia |
| The Expression Level of Disease Section Compare with the Healthy Individual Tissue |
p-value: 0.325049961;
Fold-change: -0.326054529;
Z-score: -1.532033724
|
| Disease-specific Antigen Abundances |
|
Click to View the Clearer Original Diagram
|
|
|
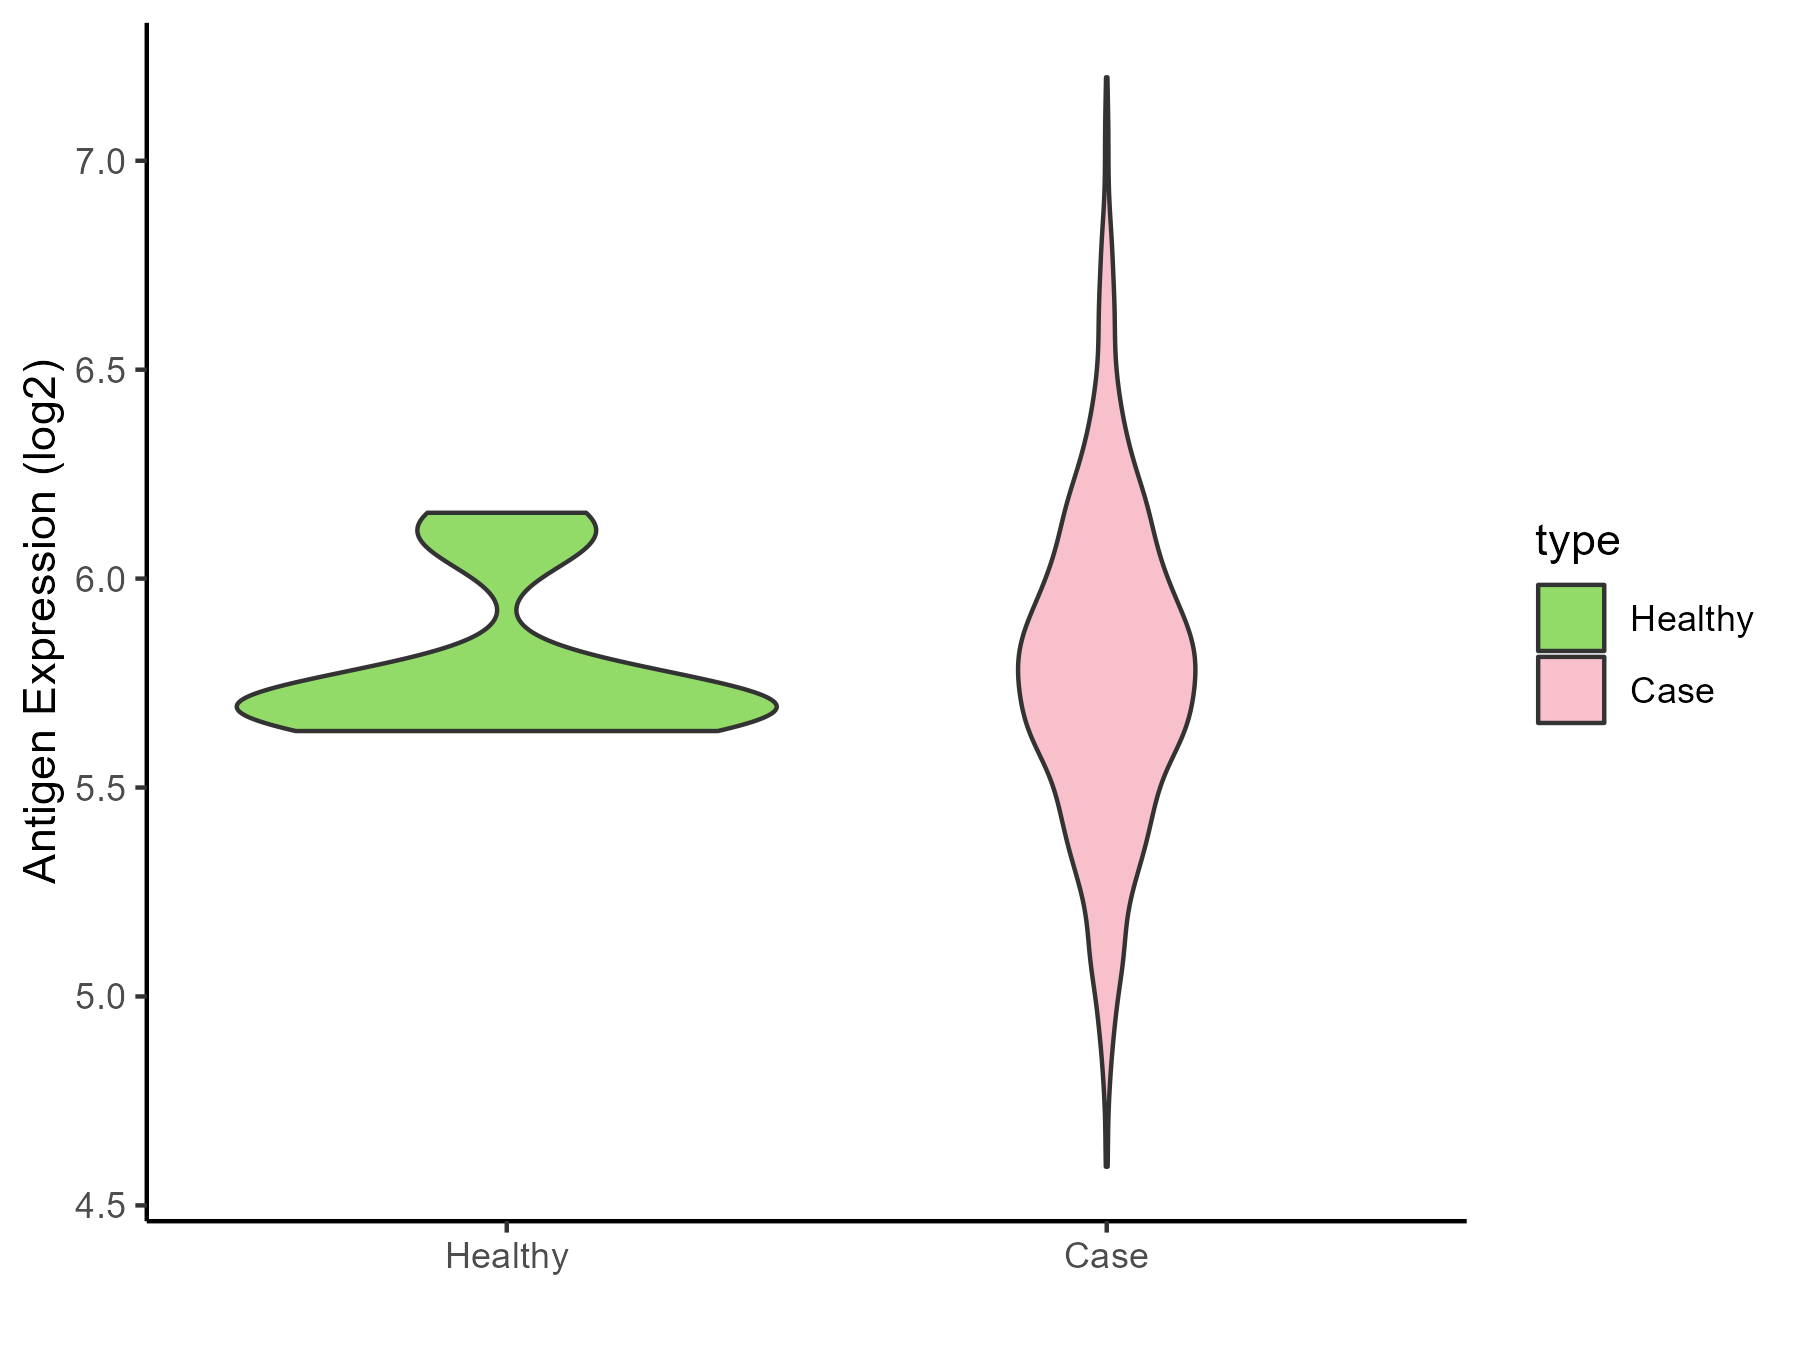
Sickle cell disease [ICD-11: 3A51.0-3A51.3]
Click to Show/Hide
| Differential expression pattern of antigen in diseases |
| The Studied Tissue |
Peripheral blood |
| The Specific Disease |
Sickle cell disease |
| The Expression Level of Disease Section Compare with the Healthy Individual Tissue |
p-value: 0.556355952;
Fold-change: -0.080032793;
Z-score: -0.379875357
|
| Disease-specific Antigen Abundances |
|
Click to View the Clearer Original Diagram
|
|
|
Thrombocythemia [ICD-11: 3B63]
Click to Show/Hide
| Differential expression pattern of antigen in diseases |
| The Studied Tissue |
Whole blood |
| The Specific Disease |
Thrombocythemia |
| The Expression Level of Disease Section Compare with the Healthy Individual Tissue |
p-value: 0.103217031;
Fold-change: 0.127355505;
Z-score: 0.629470404
|
| Disease-specific Antigen Abundances |
|
Click to View the Clearer Original Diagram
|
|
|
ICD Disease Classification 4
Click to Show/Hide the 4 Disease of This Class
Scleroderma [ICD-11: 4A42.Z]
Click to Show/Hide
| Differential expression pattern of antigen in diseases |
| The Studied Tissue |
Whole blood |
| The Specific Disease |
Scleroderma |
| The Expression Level of Disease Section Compare with the Healthy Individual Tissue |
p-value: 0.250222623;
Fold-change: 0.135301367;
Z-score: 0.398604376
|
| Disease-specific Antigen Abundances |
|
Click to View the Clearer Original Diagram
|
|
|
Sjogren syndrome [ICD-11: 4A43]
Click to Show/Hide
| Differential expression pattern of antigen in diseases |
| The Studied Tissue |
Salivary gland |
| The Specific Disease |
Sjogren syndrome |
| The Expression Level of Disease Section Compare with the Healthy Individual Tissue |
p-value: 0.131983395;
Fold-change: 0.052936266;
Z-score: 0.599273983
|
| The Expression Level of Disease Section Compare with the Adjacent Tissue |
p-value: 0.917995103;
Fold-change: -0.043544789;
Z-score: -0.103426227
|
| Disease-specific Antigen Abundances |
|
Click to View the Clearer Original Diagram
|
|
|
Behcet disease [ICD-11: 4A62]
Click to Show/Hide
| Differential expression pattern of antigen in diseases |
| The Studied Tissue |
Peripheral blood |
| The Specific Disease |
Behcet disease |
| The Expression Level of Disease Section Compare with the Healthy Individual Tissue |
p-value: 0.705013686;
Fold-change: -0.002031538;
Z-score: -0.005583071
|
| Disease-specific Antigen Abundances |
|
Click to View the Clearer Original Diagram
|
|
|
Autosomal dominant monocytopenia [ICD-11: 4B04]
Click to Show/Hide
| Differential expression pattern of antigen in diseases |
| The Studied Tissue |
Whole blood |
| The Specific Disease |
Autosomal dominant monocytopenia |
| The Expression Level of Disease Section Compare with the Healthy Individual Tissue |
p-value: 6.14E-05;
Fold-change: 1.146669137;
Z-score: 3.004191255
|
| Disease-specific Antigen Abundances |
|
Click to View the Clearer Original Diagram
|
|
|
ICD Disease Classification 5
Click to Show/Hide the 5 Disease of This Class
Type 2 diabetes [ICD-11: 5A11]
Click to Show/Hide
| Differential expression pattern of antigen in diseases |
| The Studied Tissue |
Liver |
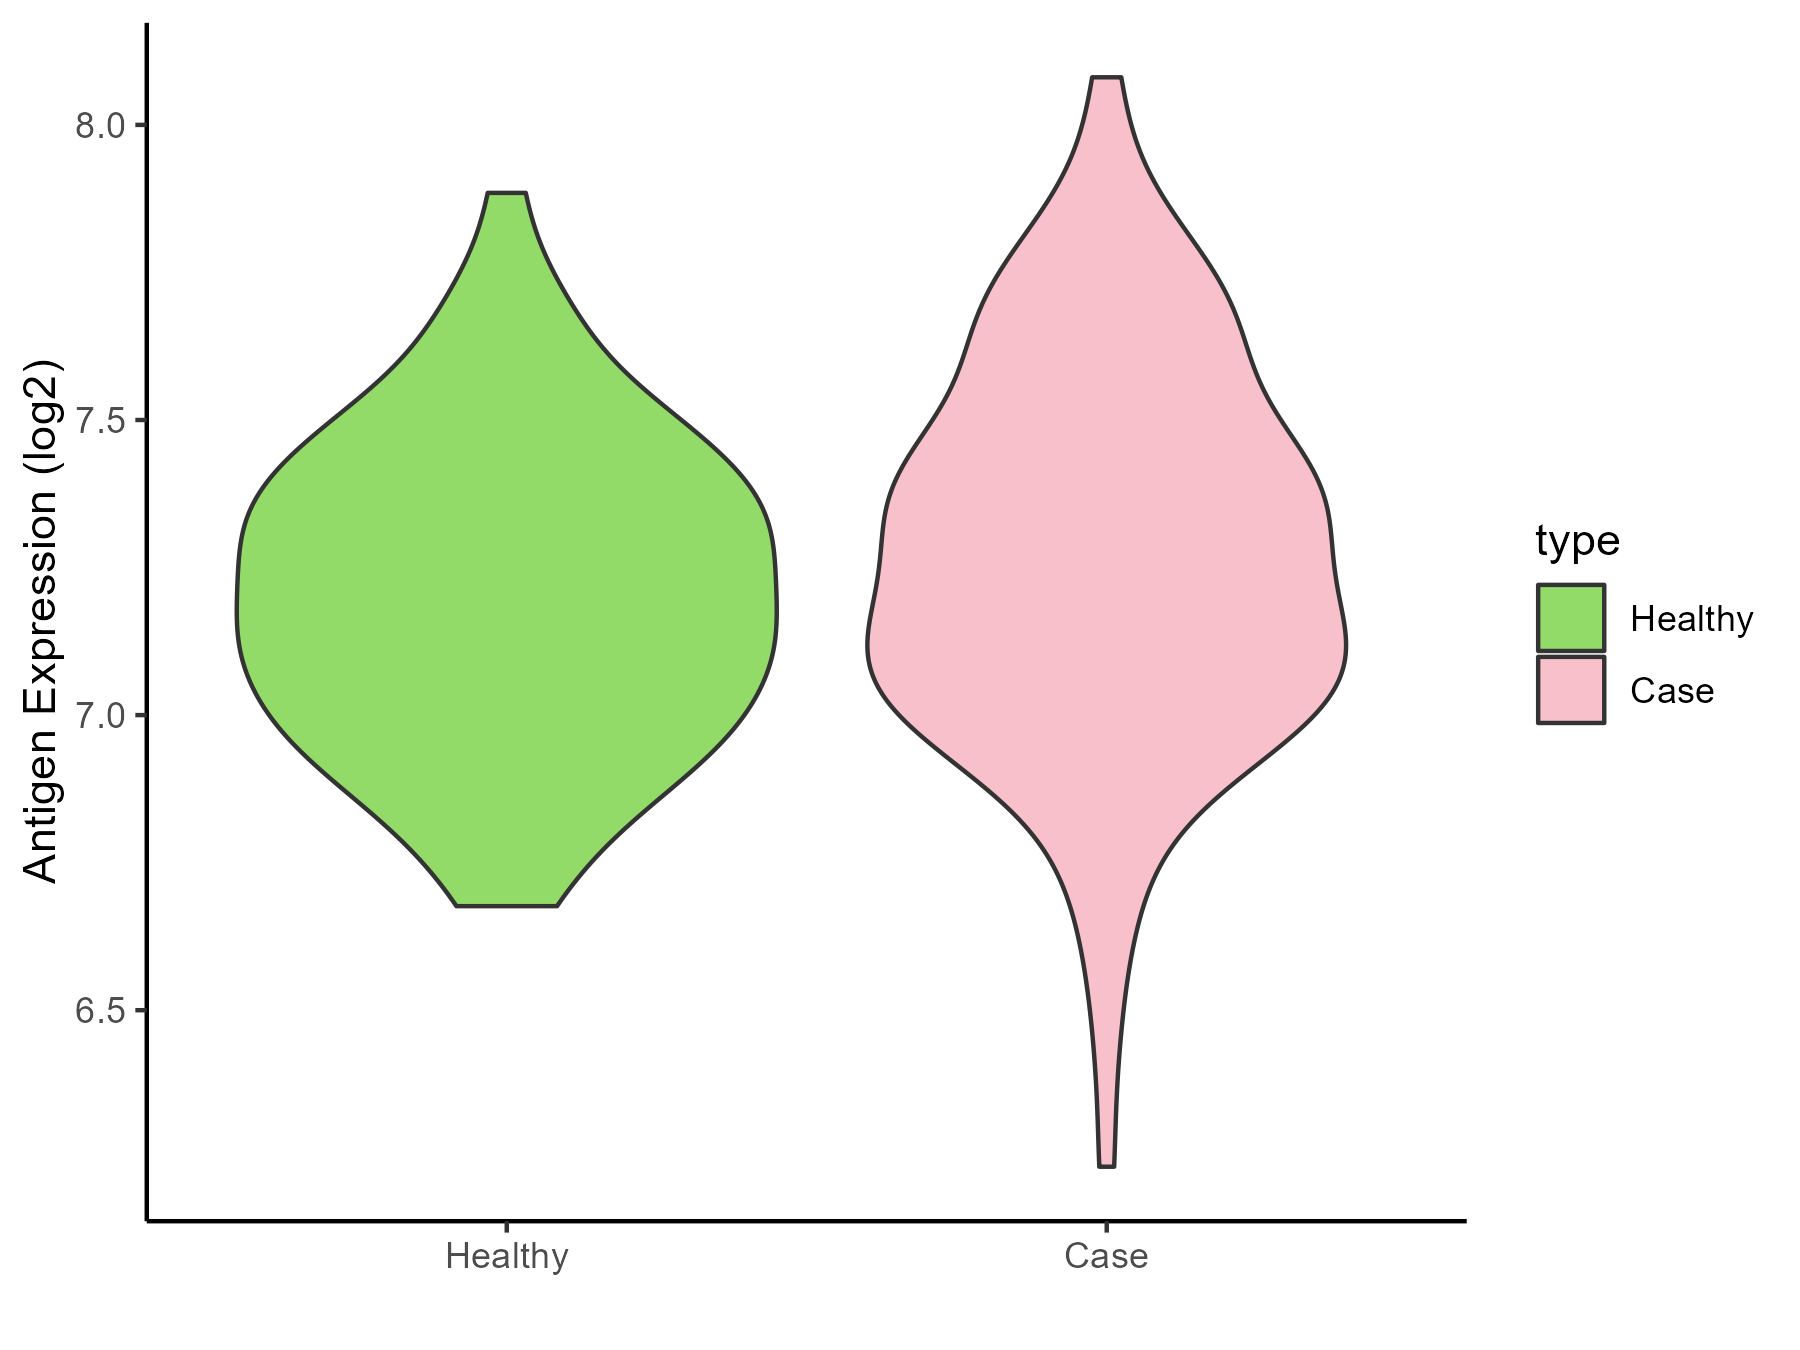
| The Specific Disease |
Type 2 diabetes |
| The Expression Level of Disease Section Compare with the Healthy Individual Tissue |
p-value: 0.156681178;
Fold-change: -0.190123078;
Z-score: -2.035634918
|
| Disease-specific Antigen Abundances |
|
Click to View the Clearer Original Diagram
|
|
|
Polycystic ovary syndrome [ICD-11: 5A80.1]
Click to Show/Hide
| Differential expression pattern of antigen in diseases |
| The Studied Tissue |
Vastus lateralis muscle |
| The Specific Disease |
Polycystic ovary syndrome |
| The Expression Level of Disease Section Compare with the Healthy Individual Tissue |
p-value: 0.379403539;
Fold-change: -0.121342946;
Z-score: -0.378098461
|
| Disease-specific Antigen Abundances |
|
Click to View the Clearer Original Diagram
|
|
|
Obesity [ICD-11: 5B81]
Click to Show/Hide
| Differential expression pattern of antigen in diseases |
| The Studied Tissue |
Subcutaneous Adipose |
| The Specific Disease |
Obesity |
| The Expression Level of Disease Section Compare with the Healthy Individual Tissue |
p-value: 0.107855746;
Fold-change: 0.241946309;
Z-score: 0.661123816
|
| Disease-specific Antigen Abundances |
|
Click to View the Clearer Original Diagram
|
|
|
Pompe disease [ICD-11: 5C51.3]
Click to Show/Hide
| Differential expression pattern of antigen in diseases |
| The Studied Tissue |
Biceps muscle |
| The Specific Disease |
Pompe disease |
| The Expression Level of Disease Section Compare with the Healthy Individual Tissue |
p-value: 0.265648837;
Fold-change: -0.204420335;
Z-score: -0.708698939
|
| Disease-specific Antigen Abundances |
|
Click to View the Clearer Original Diagram
|
|
|
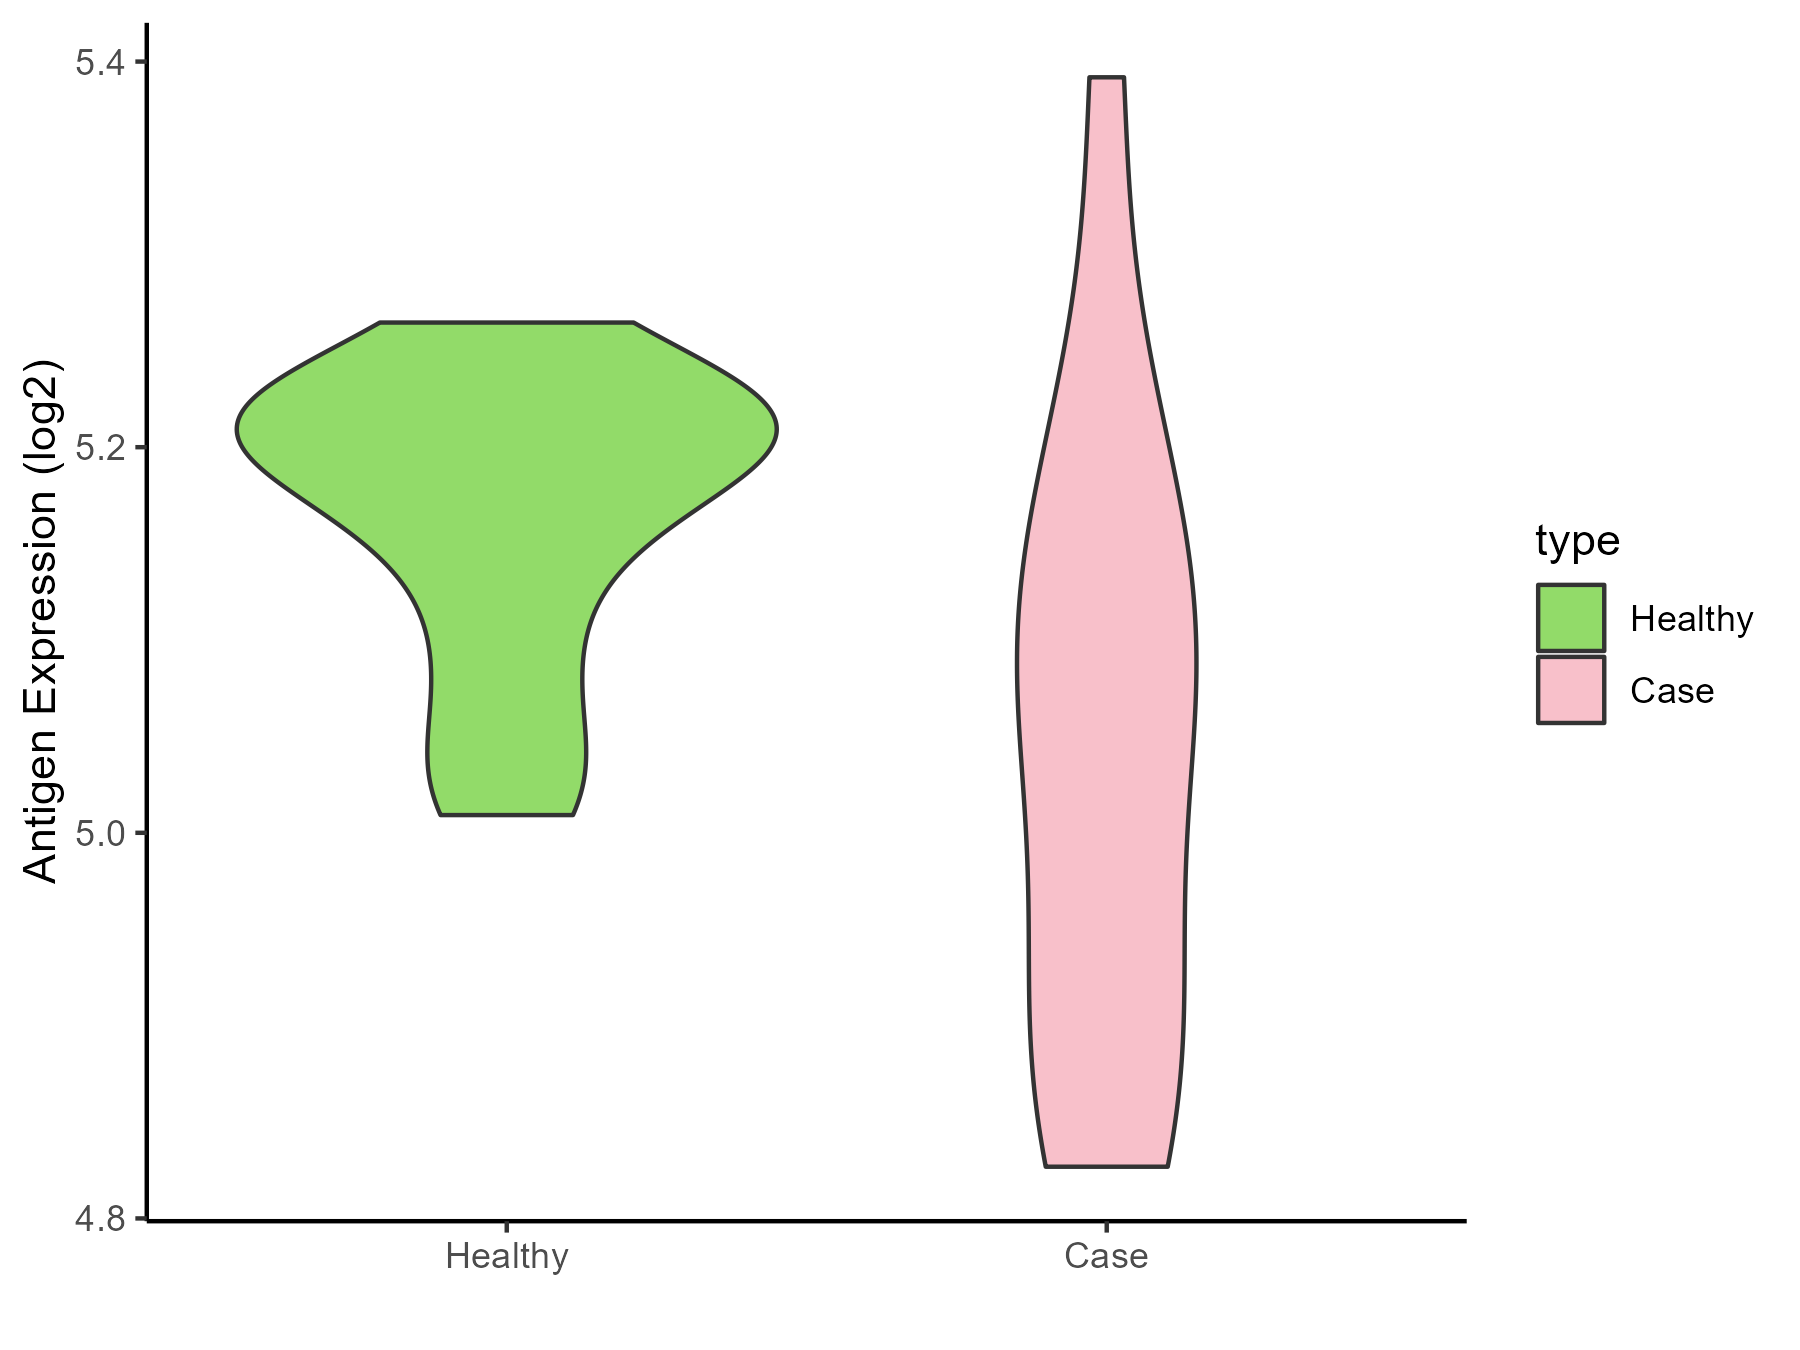
Batten disease [ICD-11: 5C56.1]
Click to Show/Hide
| Differential expression pattern of antigen in diseases |
| The Studied Tissue |
Whole blood |
| The Specific Disease |
Batten disease |
| The Expression Level of Disease Section Compare with the Healthy Individual Tissue |
p-value: 0.521455699;
Fold-change: 0.098013236;
Z-score: 0.860474435
|
| Disease-specific Antigen Abundances |
|
Click to View the Clearer Original Diagram
|
|
|
ICD Disease Classification 6
Click to Show/Hide the 2 Disease of This Class
Autism [ICD-11: 6A02]
Click to Show/Hide
| Differential expression pattern of antigen in diseases |
| The Studied Tissue |
Whole blood |
| The Specific Disease |
Autism |
| The Expression Level of Disease Section Compare with the Healthy Individual Tissue |
p-value: 0.518806143;
Fold-change: 0.017976716;
Z-score: 0.07771008
|
| Disease-specific Antigen Abundances |
|
Click to View the Clearer Original Diagram
|
|
|
Anxiety disorder [ICD-11: 6B00-6B0Z]
Click to Show/Hide
| Differential expression pattern of antigen in diseases |
| The Studied Tissue |
Whole blood |
| The Specific Disease |
Anxiety disorder |
| The Expression Level of Disease Section Compare with the Healthy Individual Tissue |
p-value: 0.009246283;
Fold-change: 0.153493291;
Z-score: 0.442668786
|
| Disease-specific Antigen Abundances |
|
Click to View the Clearer Original Diagram
|
|
|
ICD Disease Classification 8
Click to Show/Hide the 7 Disease of This Class
Parkinson disease [ICD-11: 8A00]
Click to Show/Hide
| Differential expression pattern of antigen in diseases |
| The Studied Tissue |
Substantia nigra |
| The Specific Disease |
Parkinson disease |
| The Expression Level of Disease Section Compare with the Healthy Individual Tissue |
p-value: 0.11449269;
Fold-change: 0.352860216;
Z-score: 0.967709357
|
| Disease-specific Antigen Abundances |
|
Click to View the Clearer Original Diagram
|
|
|
Huntington disease [ICD-11: 8A01]
Click to Show/Hide
| Differential expression pattern of antigen in diseases |
| The Studied Tissue |
Whole blood |
| The Specific Disease |
Huntington disease |
| The Expression Level of Disease Section Compare with the Healthy Individual Tissue |
p-value: 0.609012766;
Fold-change: -0.030832671;
Z-score: -0.323482531
|
| Disease-specific Antigen Abundances |
|
Click to View the Clearer Original Diagram
|
|
|
Alzheimer disease [ICD-11: 8A20]
Click to Show/Hide
| Differential expression pattern of antigen in diseases |
| The Studied Tissue |
Entorhinal cortex |
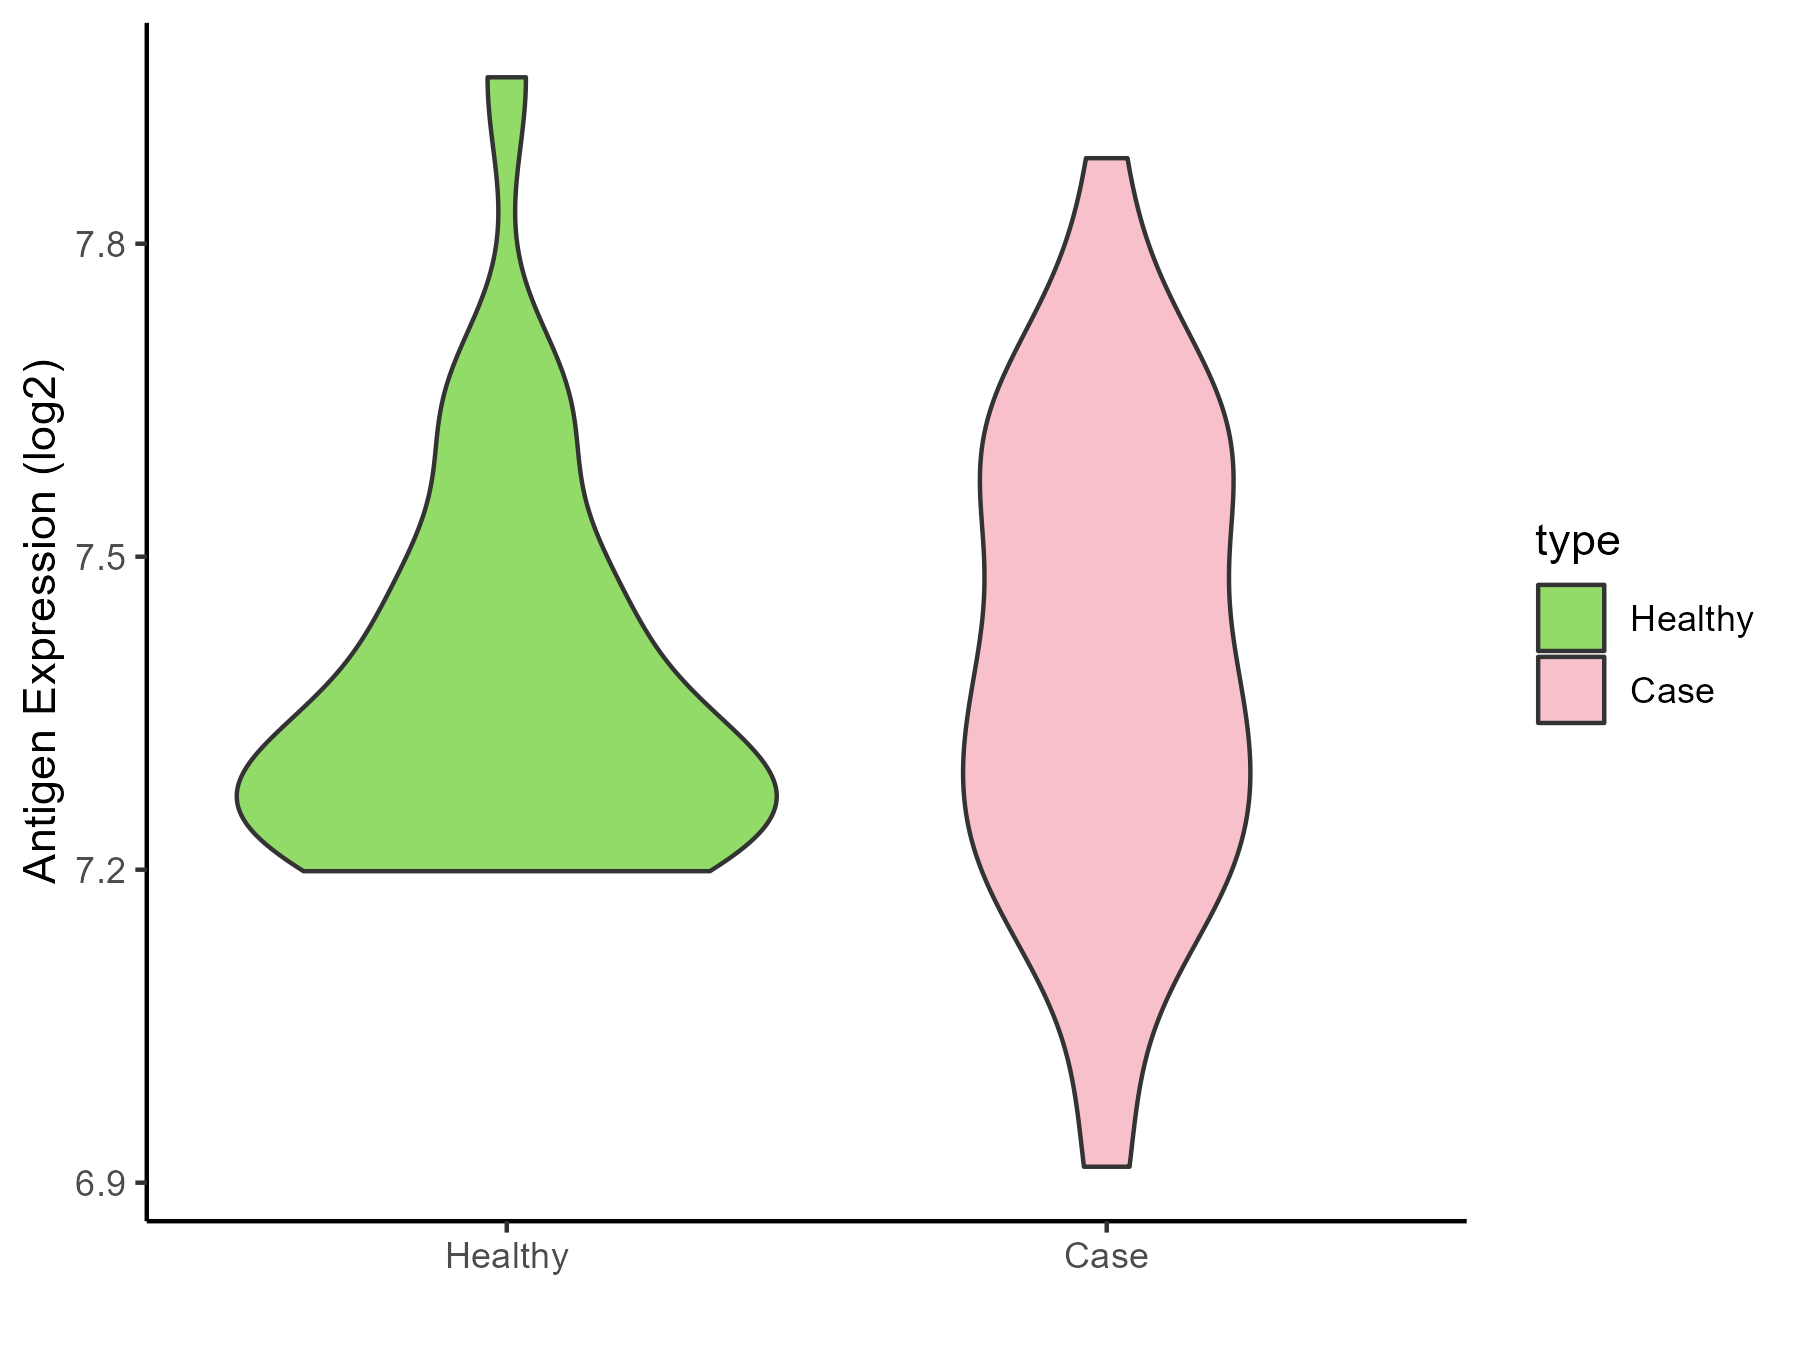
| The Specific Disease |
Alzheimer disease |
| The Expression Level of Disease Section Compare with the Healthy Individual Tissue |
p-value: 8.63E-13;
Fold-change: 0.355399902;
Z-score: 0.807855844
|
| Disease-specific Antigen Abundances |
|
Click to View the Clearer Original Diagram
|
|
|
Seizure [ICD-11: 8A60-8A6Z]
Click to Show/Hide
| Differential expression pattern of antigen in diseases |
| The Studied Tissue |
Whole blood |
| The Specific Disease |
Seizure |
| The Expression Level of Disease Section Compare with the Healthy Individual Tissue |
p-value: 0.844569904;
Fold-change: 0.060202069;
Z-score: 0.134568208
|
| Disease-specific Antigen Abundances |
|
Click to View the Clearer Original Diagram
|
|
|
Lateral sclerosis [ICD-11: 8B60.4]
Click to Show/Hide
| Differential expression pattern of antigen in diseases |
| The Studied Tissue |
Skin |
| The Specific Disease |
Lateral sclerosis |
| The Expression Level of Disease Section Compare with the Healthy Individual Tissue |
p-value: 0.051993862;
Fold-change: -0.219360249;
Z-score: -1.128290357
|
| Disease-specific Antigen Abundances |
|
Click to View the Clearer Original Diagram
|
|
|
| The Studied Tissue |
Cervical spinal cord |
| The Specific Disease |
Lateral sclerosis |
| The Expression Level of Disease Section Compare with the Healthy Individual Tissue |
p-value: 0.197969863;
Fold-change: -0.332199517;
Z-score: -0.54263755
|
| Disease-specific Antigen Abundances |
|
Click to View the Clearer Original Diagram
|
|
|
Muscular atrophy [ICD-11: 8C70]
Click to Show/Hide
| Differential expression pattern of antigen in diseases |
| The Studied Tissue |
Muscle |
| The Specific Disease |
Muscular atrophy |
| The Expression Level of Disease Section Compare with the Healthy Individual Tissue |
p-value: 0.000117714;
Fold-change: 1.151775938;
Z-score: 1.852444811
|
| Disease-specific Antigen Abundances |
|
Click to View the Clearer Original Diagram
|
|
|
Myopathy [ICD-11: 8C70.6]
Click to Show/Hide
| Differential expression pattern of antigen in diseases |
| The Studied Tissue |
Muscle |
| The Specific Disease |
Myopathy |
| The Expression Level of Disease Section Compare with the Healthy Individual Tissue |
p-value: 0.000386964;
Fold-change: 0.601614513;
Z-score: 2.094125045
|
| Disease-specific Antigen Abundances |

|
Click to View the Clearer Original Diagram
|
|
|
