Antigen Information
General Information of This Antigen
| Antigen ID | TAR0RMVXR |
|||||
|---|---|---|---|---|---|---|
| Antigen Name | ALK tyrosine kinase receptor (ALK) |
|||||
| Gene Name | ALK |
|||||
| Gene ID | ||||||
| Synonym | Anaplastic lymphoma kinase;CD_antigen=CD246 |
|||||
| Sequence |
MGAIGLLWLLPLLLSTAAVGSGMGTGQRAGSPAAGPPLQPREPLSYSRLQRKSLAVDFVV
PSLFRVYARDLLLPPSSSELKAGRPEARGSLALDCAPLLRLLGPAPGVSWTAGSPAPAEA RTLSRVLKGGSVRKLRRAKQLVLELGEEAILEGCVGPPGEAAVGLLQFNLSELFSWWIRQ GEGRLRIRLMPEKKASEVGREGRLSAAIRASQPRLLFQIFGTGHSSLESPTNMPSPSPDY FTWNLTWIMKDSFPFLSHRSRYGLECSFDFPCELEYSPPLHDLRNQSWSWRRIPSEEASQ MDLLDGPGAERSKEMPRGSFLLLNTSADSKHTILSPWMRSSSEHCTLAVSVHRHLQPSGR YIAQLLPHNEAAREILLMPTPGKHGWTVLQGRIGRPDNPFRVALEYISSGNRSLSAVDFF ALKNCSEGTSPGSKMALQSSFTCWNGTVLQLGQACDFHQDCAQGEDESQMCRKLPVGFYC NFEDGFCGWTQGTLSPHTPQWQVRTLKDARFQDHQDHALLLSTTDVPASESATVTSATFP APIKSSPCELRMSWLIRGVLRGNVSLVLVENKTGKEQGRMVWHVAAYEGLSLWQWMVLPL LDVSDRFWLQMVAWWGQGSRAIVAFDNISISLDCYLTISGEDKILQNTAPKSRNLFERNP NKELKPGENSPRQTPIFDPTVHWLFTTCGASGPHGPTQAQCNNAYQNSNLSVEVGSEGPL KGIQIWKVPATDTYSISGYGAAGGKGGKNTMMRSHGVSVLGIFNLEKDDMLYILVGQQGE DACPSTNQLIQKVCIGENNVIEEEIRVNRSVHEWAGGGGGGGGATYVFKMKDGVPVPLII AAGGGGRAYGAKTDTFHPERLENNSSVLGLNGNSGAAGGGGGWNDNTSLLWAGKSLQEGA TGGHSCPQAMKKWGWETRGGFGGGGGGCSSGGGGGGYIGGNAASNNDPEMDGEDGVSFIS PLGILYTPALKVMEGHGEVNIKHYLNCSHCEVDECHMDPESHKVICFCDHGTVLAEDGVS CIVSPTPEPHLPLSLILSVVTSALVAALVLAFSGIMIVYRRKHQELQAMQMELQSPEYKL SKLRTSTIMTDYNPNYCFAGKTSSISDLKEVPRKNITLIRGLGHGAFGEVYEGQVSGMPN DPSPLQVAVKTLPEVCSEQDELDFLMEALIISKFNHQNIVRCIGVSLQSLPRFILLELMA GGDLKSFLRETRPRPSQPSSLAMLDLLHVARDIACGCQYLEENHFIHRDIAARNCLLTCP GPGRVAKIGDFGMARDIYRASYYRKGGCAMLPVKWMPPEAFMEGIFTSKTDTWSFGVLLW EIFSLGYMPYPSKSNQEVLEFVTSGGRMDPPKNCPGPVYRIMTQCWQHQPEDRPNFAIIL ERIEYCTQDPDVINTALPIEYGPLVEEEEKVPVRPKDPEGVPPLLVSQQAKREEERSPAA PPPLPTTSSGKAAKKPTAAEISVRVPRGPAVEGGHVNMAFSQSNPPSELHKVHGSRNKPT SLWNPTYGSWFTEKPTKKNNPIAKKEPHDRGNLGLEGSCTVPPNVATGRLPGASLLLEPS SLTANMKEVPLFRLRHFPCGNVNYGYQQQGLPLEAATAPGAGHYEDTILKSKNSMNQPGP Click to Show/Hide
|
|||||
| Family | Tyr protein family |
|||||
| Function |
Neuronal receptor tyrosine kinase that is essentially and transiently expressed in specific regions of the central and peripheral nervous systems and plays an important role in the genesis and differentiation of the nervous system. Also acts as a key thinness protein involved in the resistance to weight gain: in hypothalamic neurons, controls energy expenditure acting as a negative regulator of white adipose tissue lipolysis and sympathetic tone to fine-tune energy homeostasis. Following activation by ALKAL2 ligand at the cell surface, transduces an extracellular signal into an intracellular response. In contrast, ALKAL1 is not a potent physiological ligand for ALK. Ligand-binding to the extracellular domain induces tyrosine kinase activation, leading to activation of the mitogen-activated protein kinase (MAPK) pathway. Phosphorylates almost exclusively at the first tyrosine of the Y-x-x-x-Y-Y motif. Induces tyrosine phosphorylation of CBL, FRS2, IRS1 and SHC1, as well as of the MAP kinases MAPK1/ERK2 and MAPK3/ERK1. ALK activation may also be regulated by pleiotrophin (PTN) and midkine (MDK). PTN-binding induces MAPK pathway activation, which is important for the anti-apoptotic signaling of PTN and regulation of cell proliferation. MDK-binding induces phosphorylation of the ALK .get insulin receptor substrate (IRS1), activates mitogen-activated protein kinases (MAPKs) and PI3-kinase, resulting also in cell proliferation induction. Drives NF-kappa-B activation, probably through IRS1 and the activation of the AKT serine/threonine kinase. Recruitment of IRS1 to activated ALK and the activation of NF-kappa-B are essential for the autocrine growth and survival signaling of MDK.
Click to Show/Hide
|
|||||
| Uniprot Entry | ||||||
| HGNC ID | ||||||
| KEGG ID | ||||||
Each Antibody-drug Conjuate AND It's Component Related to This Antigen
Full List of The ADC Related to This Antigen
Anti-ALK mAb DX-0125
| ADC Info | ADC Name | Payload | Target | Linker | Ref |
|---|---|---|---|---|---|
CDX-0125-TEI |
NMS-P945 |
Human Deoxyribonucleic acid (hDNA) |
Undisclosed |
[1] |
Undisclosed
| ADC Info | ADC Name | Payload | Target | Linker | Ref |
|---|---|---|---|---|---|
Anti-ALK antibody-drug conjugate (Medical Research Council Technology) |
Undisclosed |
Undisclosed |
Undisclosed |
[2] | |
KTN-0125 |
Undisclosed |
Undisclosed |
Undisclosed |
[3] |
Tissue/Disease specific Abundances of This Antigen
Tissue specific Abundances of This Antigen
ICD Disease Classification 01
| Differential expression pattern of antigen in diseases | ||
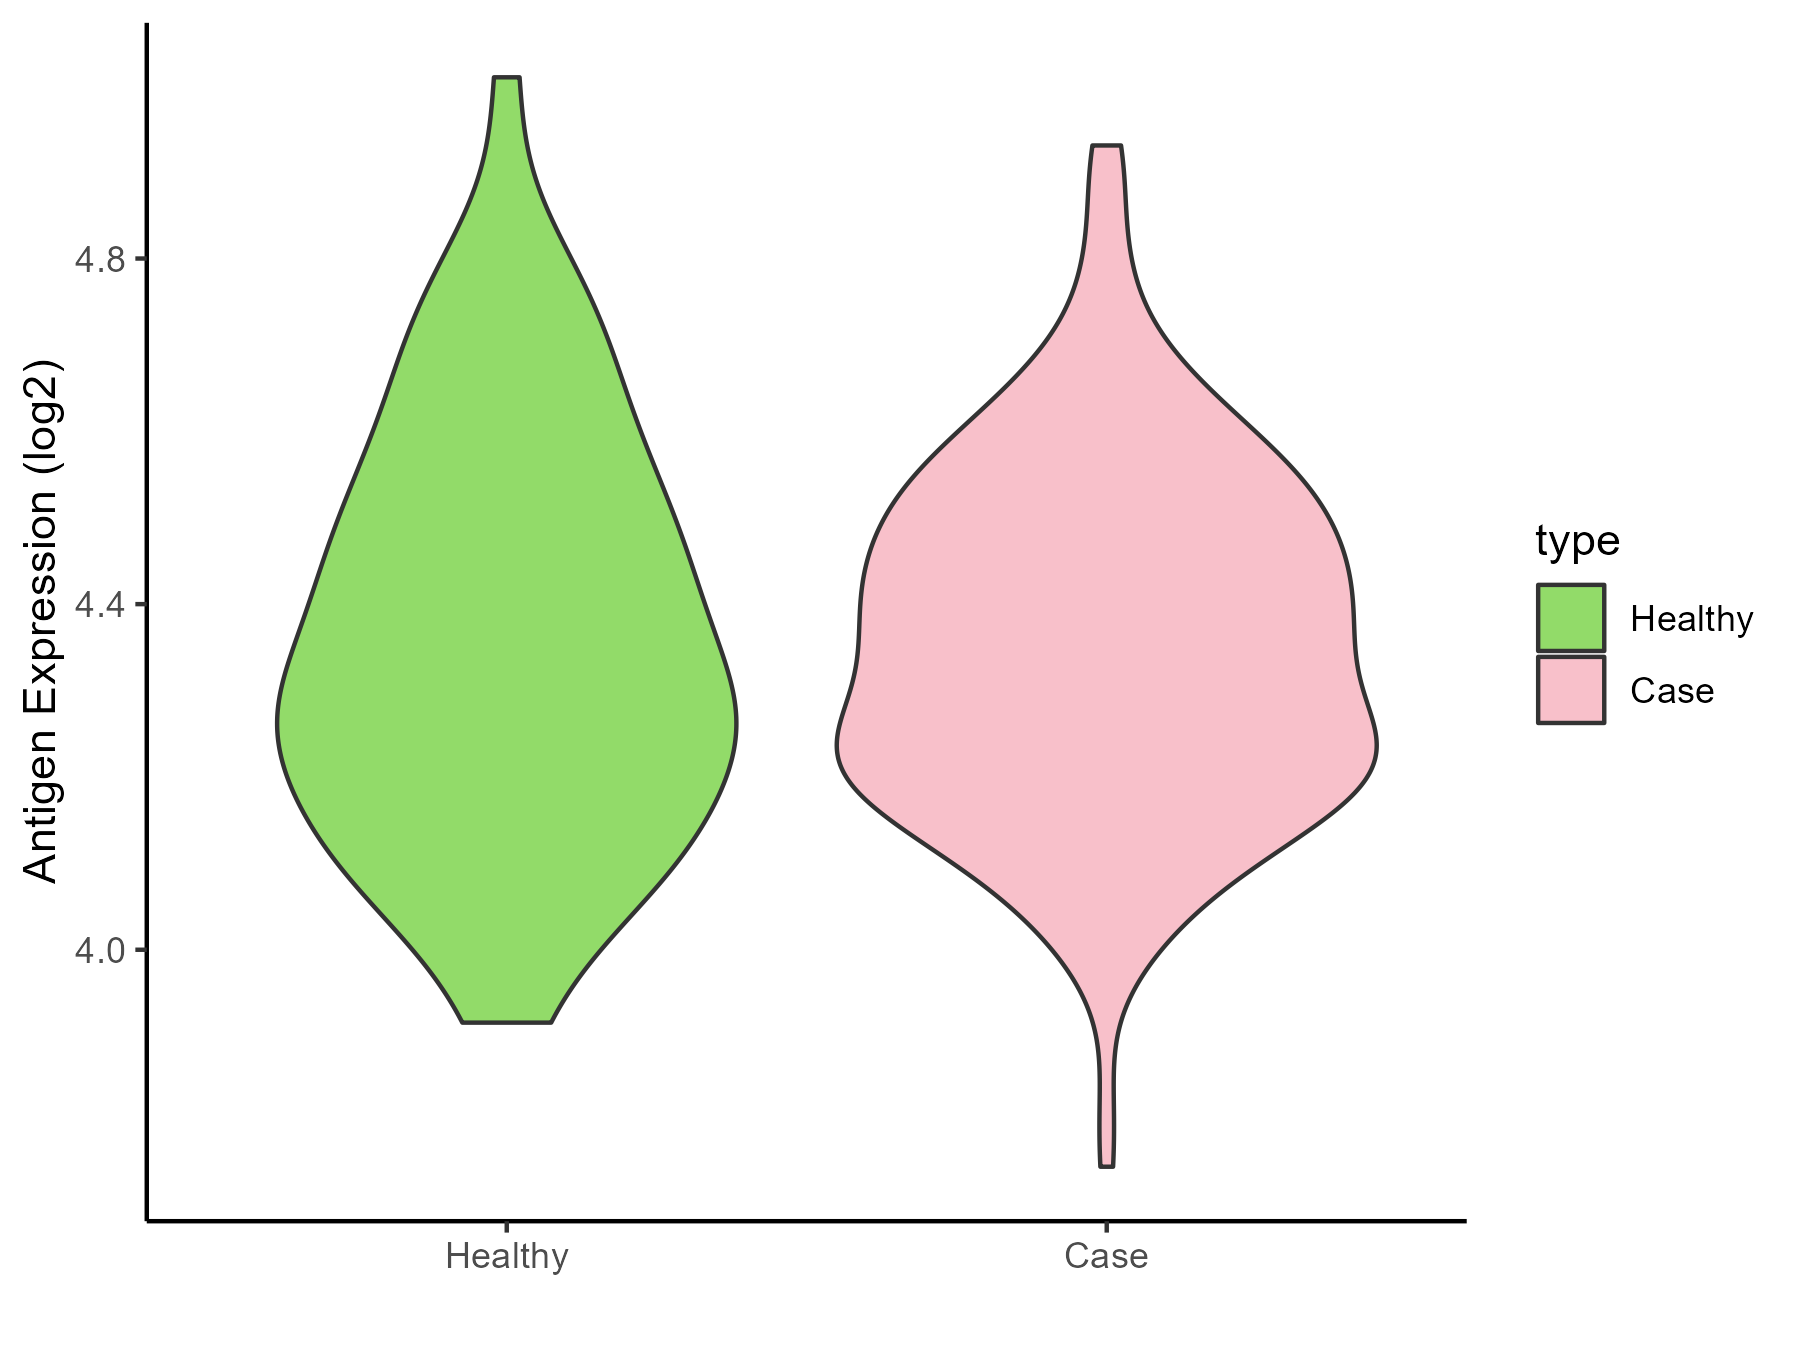
| The Studied Tissue | Gingival | |
| The Specific Disease | Bacterial infection of gingival | |
| The Expression Level of Disease Section Compare with the Healthy Individual Tissue | p-value: 0.805446211; Fold-change: 0.04138821; Z-score: 0.173439652 | |
| Disease-specific Antigen Abundances |
|
Click to View the Clearer Original Diagram |
ICD Disease Classification 02
| Differential expression pattern of antigen in diseases | ||
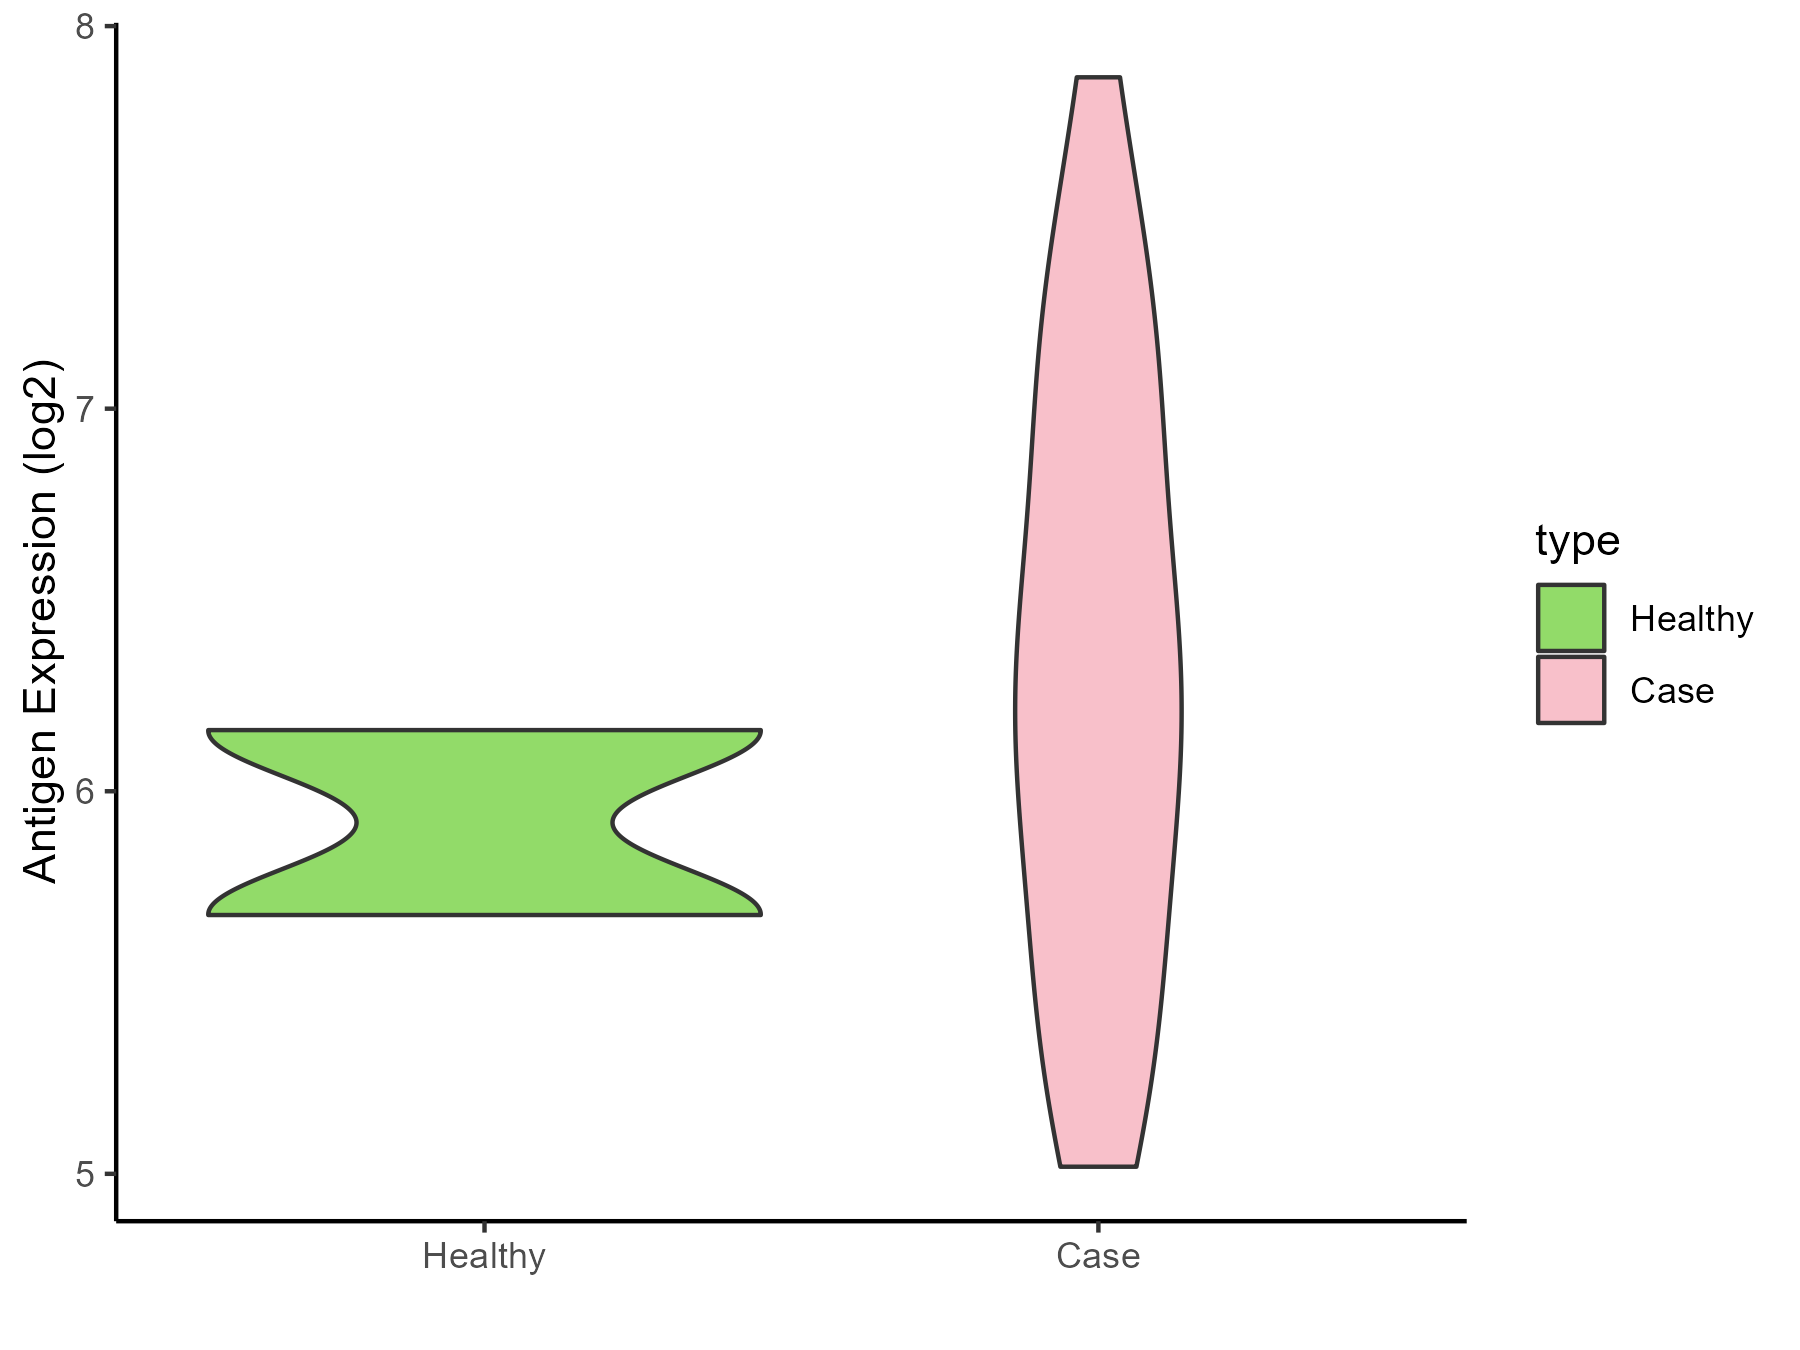
| The Studied Tissue | Brainstem | |
| The Specific Disease | Glioma | |
| The Expression Level of Disease Section Compare with the Healthy Individual Tissue | p-value: 0.306686969; Fold-change: 0.351722405; Z-score: 1.029072449 | |
| Disease-specific Antigen Abundances |
|
Click to View the Clearer Original Diagram |
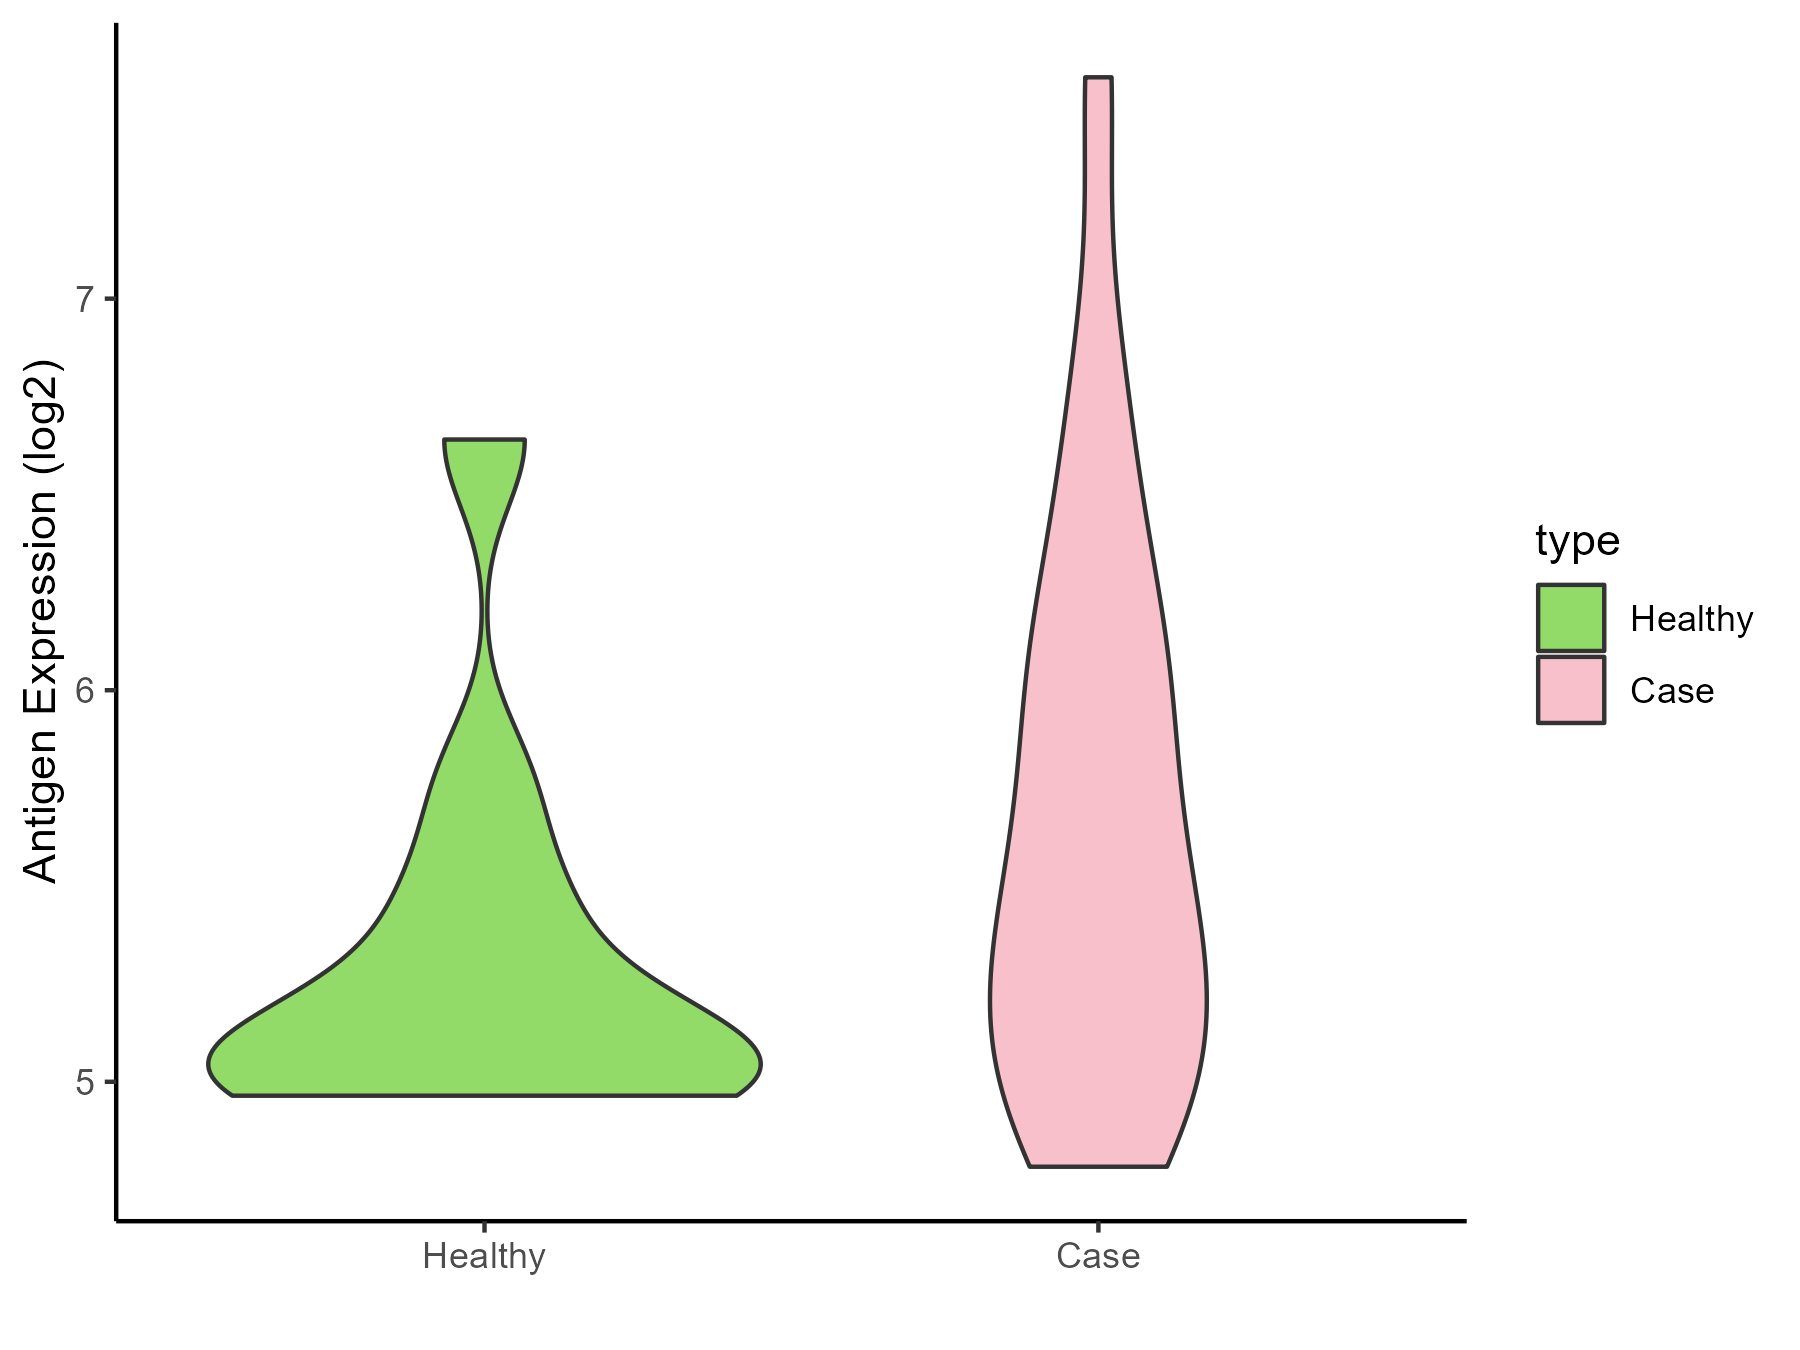
| The Studied Tissue | White matter | |
| The Specific Disease | Glioma | |
| The Expression Level of Disease Section Compare with the Healthy Individual Tissue | p-value: 0.060048323; Fold-change: 0.467780626; Z-score: 0.923428122 | |
| Disease-specific Antigen Abundances |
|
Click to View the Clearer Original Diagram |
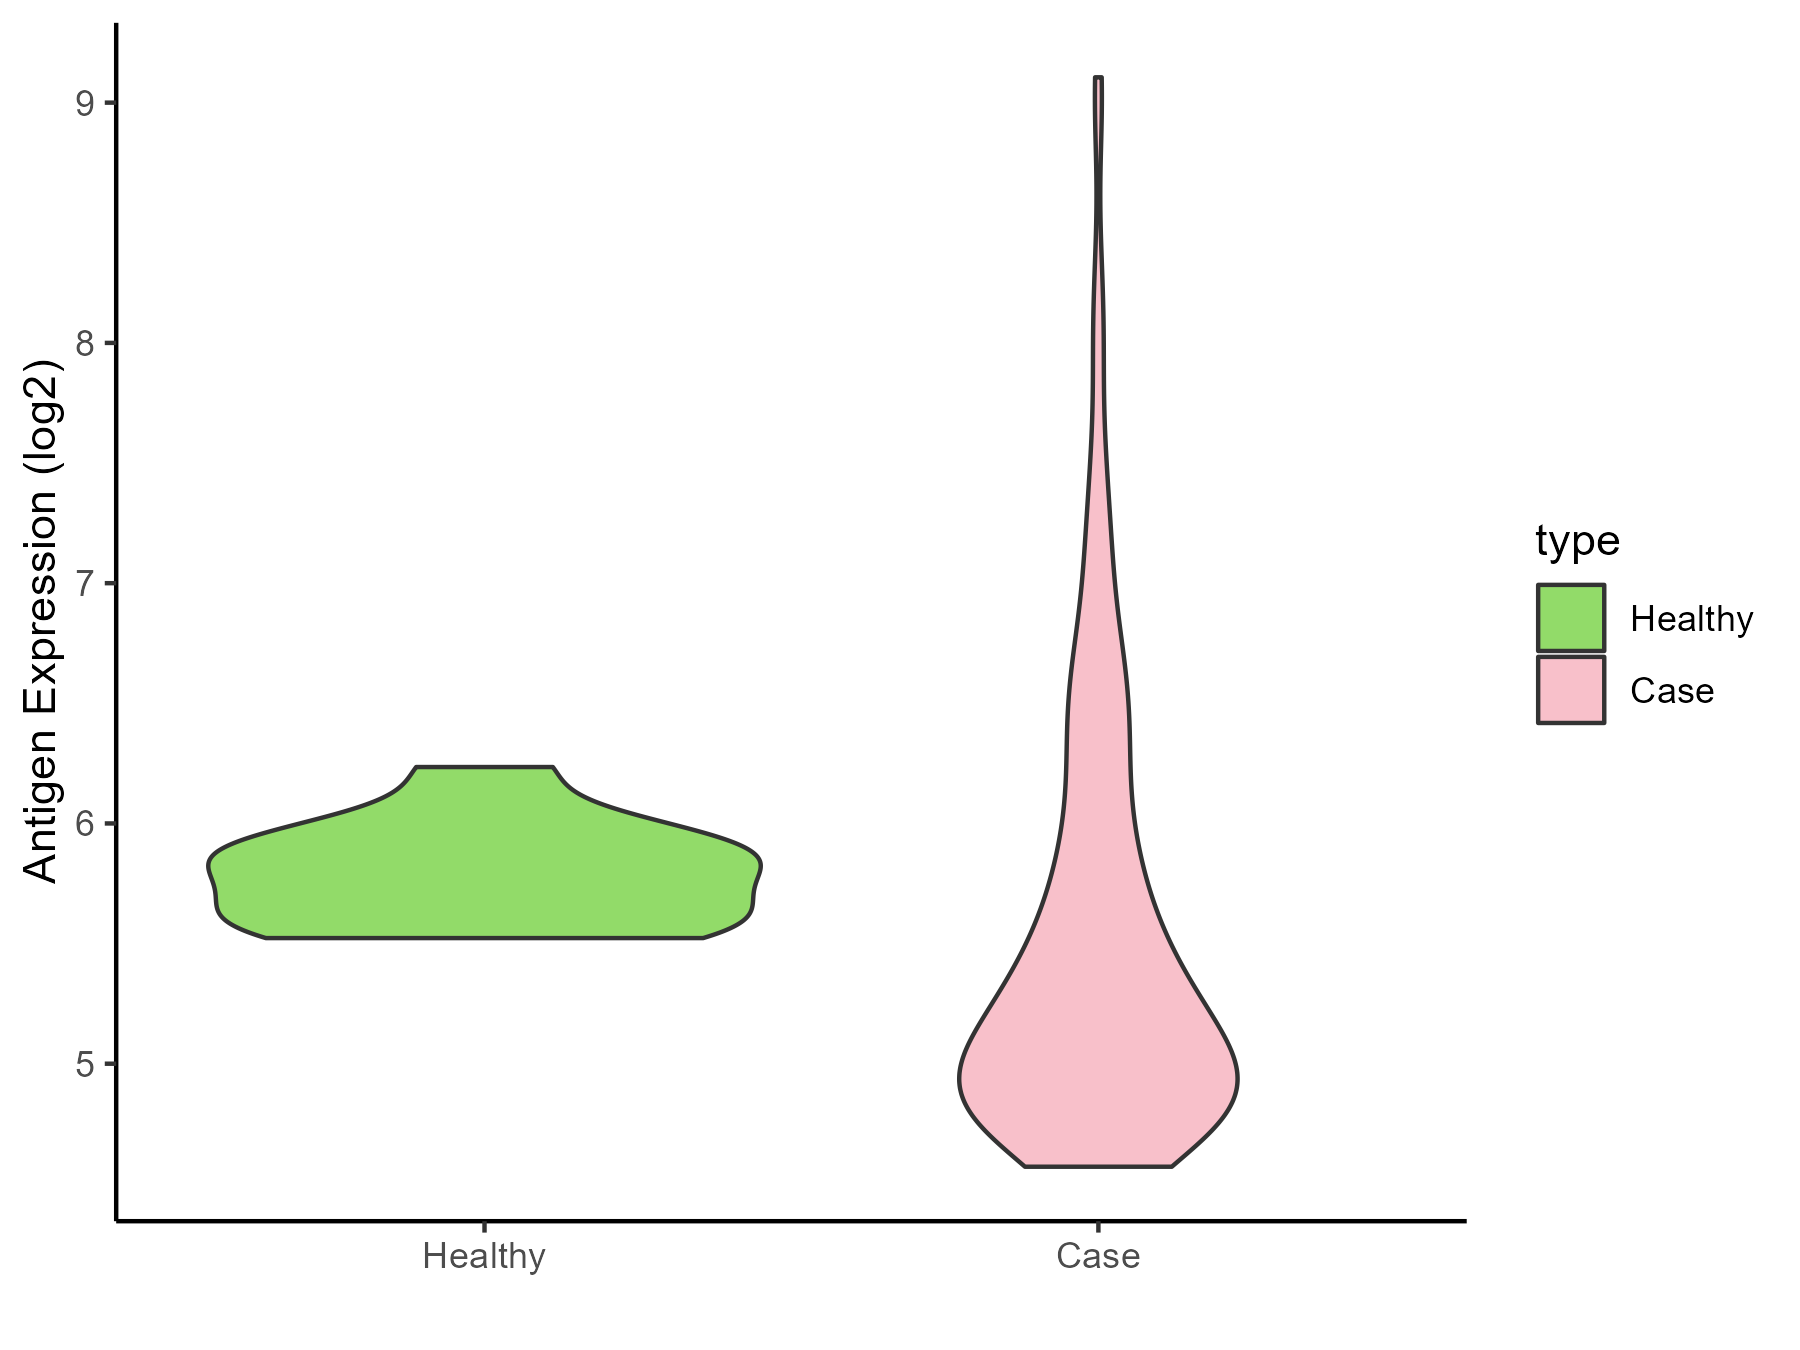
| The Studied Tissue | Brainstem | |
| The Specific Disease | Neuroectodermal tumor | |
| The Expression Level of Disease Section Compare with the Healthy Individual Tissue | p-value: 0.006015944; Fold-change: -0.608612704; Z-score: -2.708642223 | |
| Disease-specific Antigen Abundances |
|
Click to View the Clearer Original Diagram |
| The Studied Tissue | Nervous | |
| The Specific Disease | Brain cancer | |
| The Expression Level of Disease Section Compare with the Healthy Individual Tissue | p-value: 3.81E-05; Fold-change: -0.212099892; Z-score: -0.660224189 | |
| Disease-specific Antigen Abundances |
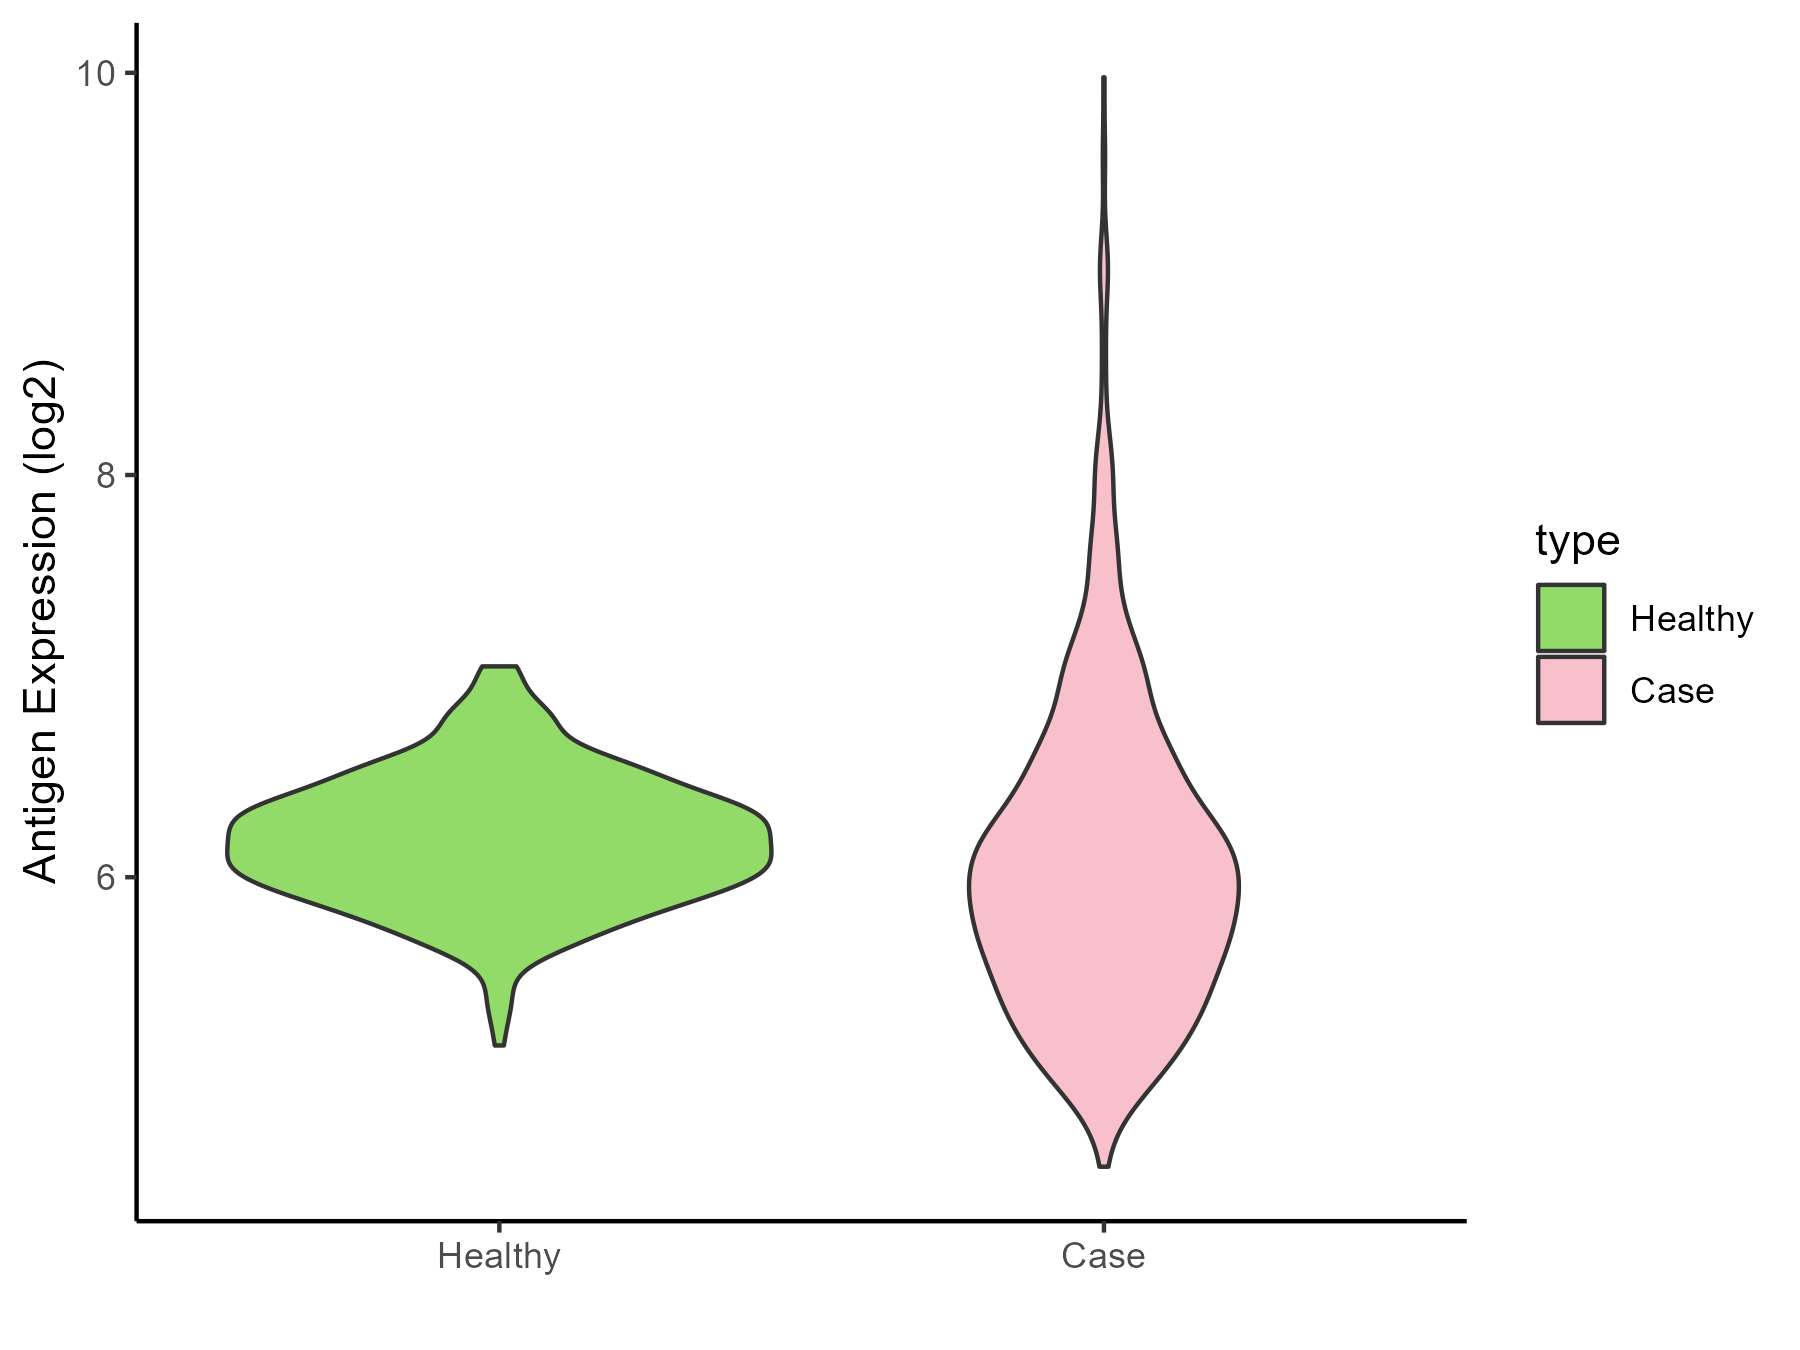
|
Click to View the Clearer Original Diagram |
| Differential expression pattern of antigen in diseases | ||
| The Studied Tissue | Whole blood | |
| The Specific Disease | Polycythemia vera | |
| The Expression Level of Disease Section Compare with the Healthy Individual Tissue | p-value: 0.008947581; Fold-change: 0.067959289; Z-score: 0.523477619 | |
| Disease-specific Antigen Abundances |
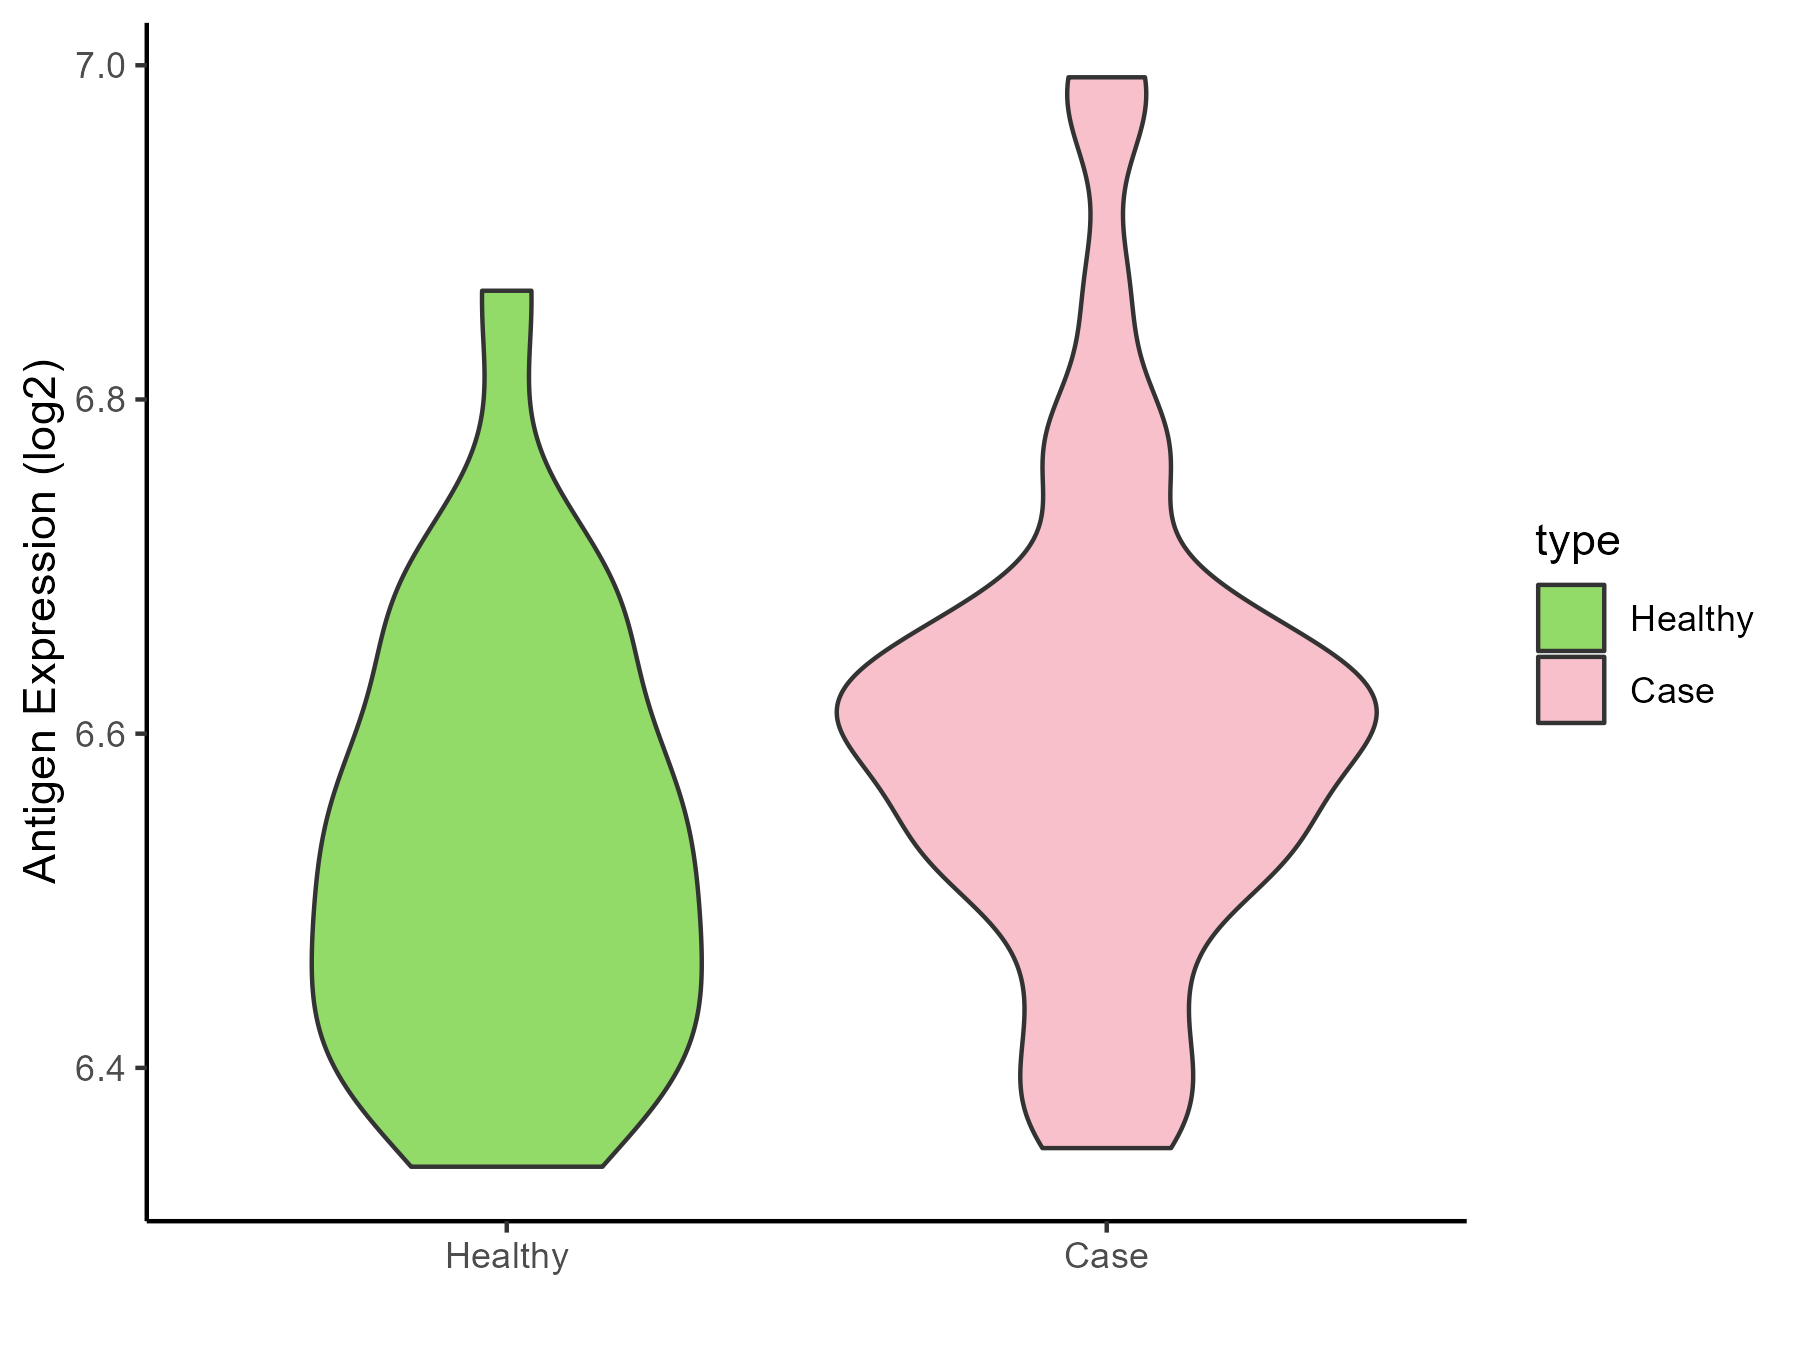
|
Click to View the Clearer Original Diagram |
| The Studied Tissue | Whole blood | |
| The Specific Disease | Myelofibrosis | |
| The Expression Level of Disease Section Compare with the Healthy Individual Tissue | p-value: 0.757777764; Fold-change: -0.039782614; Z-score: -0.349120605 | |
| Disease-specific Antigen Abundances |
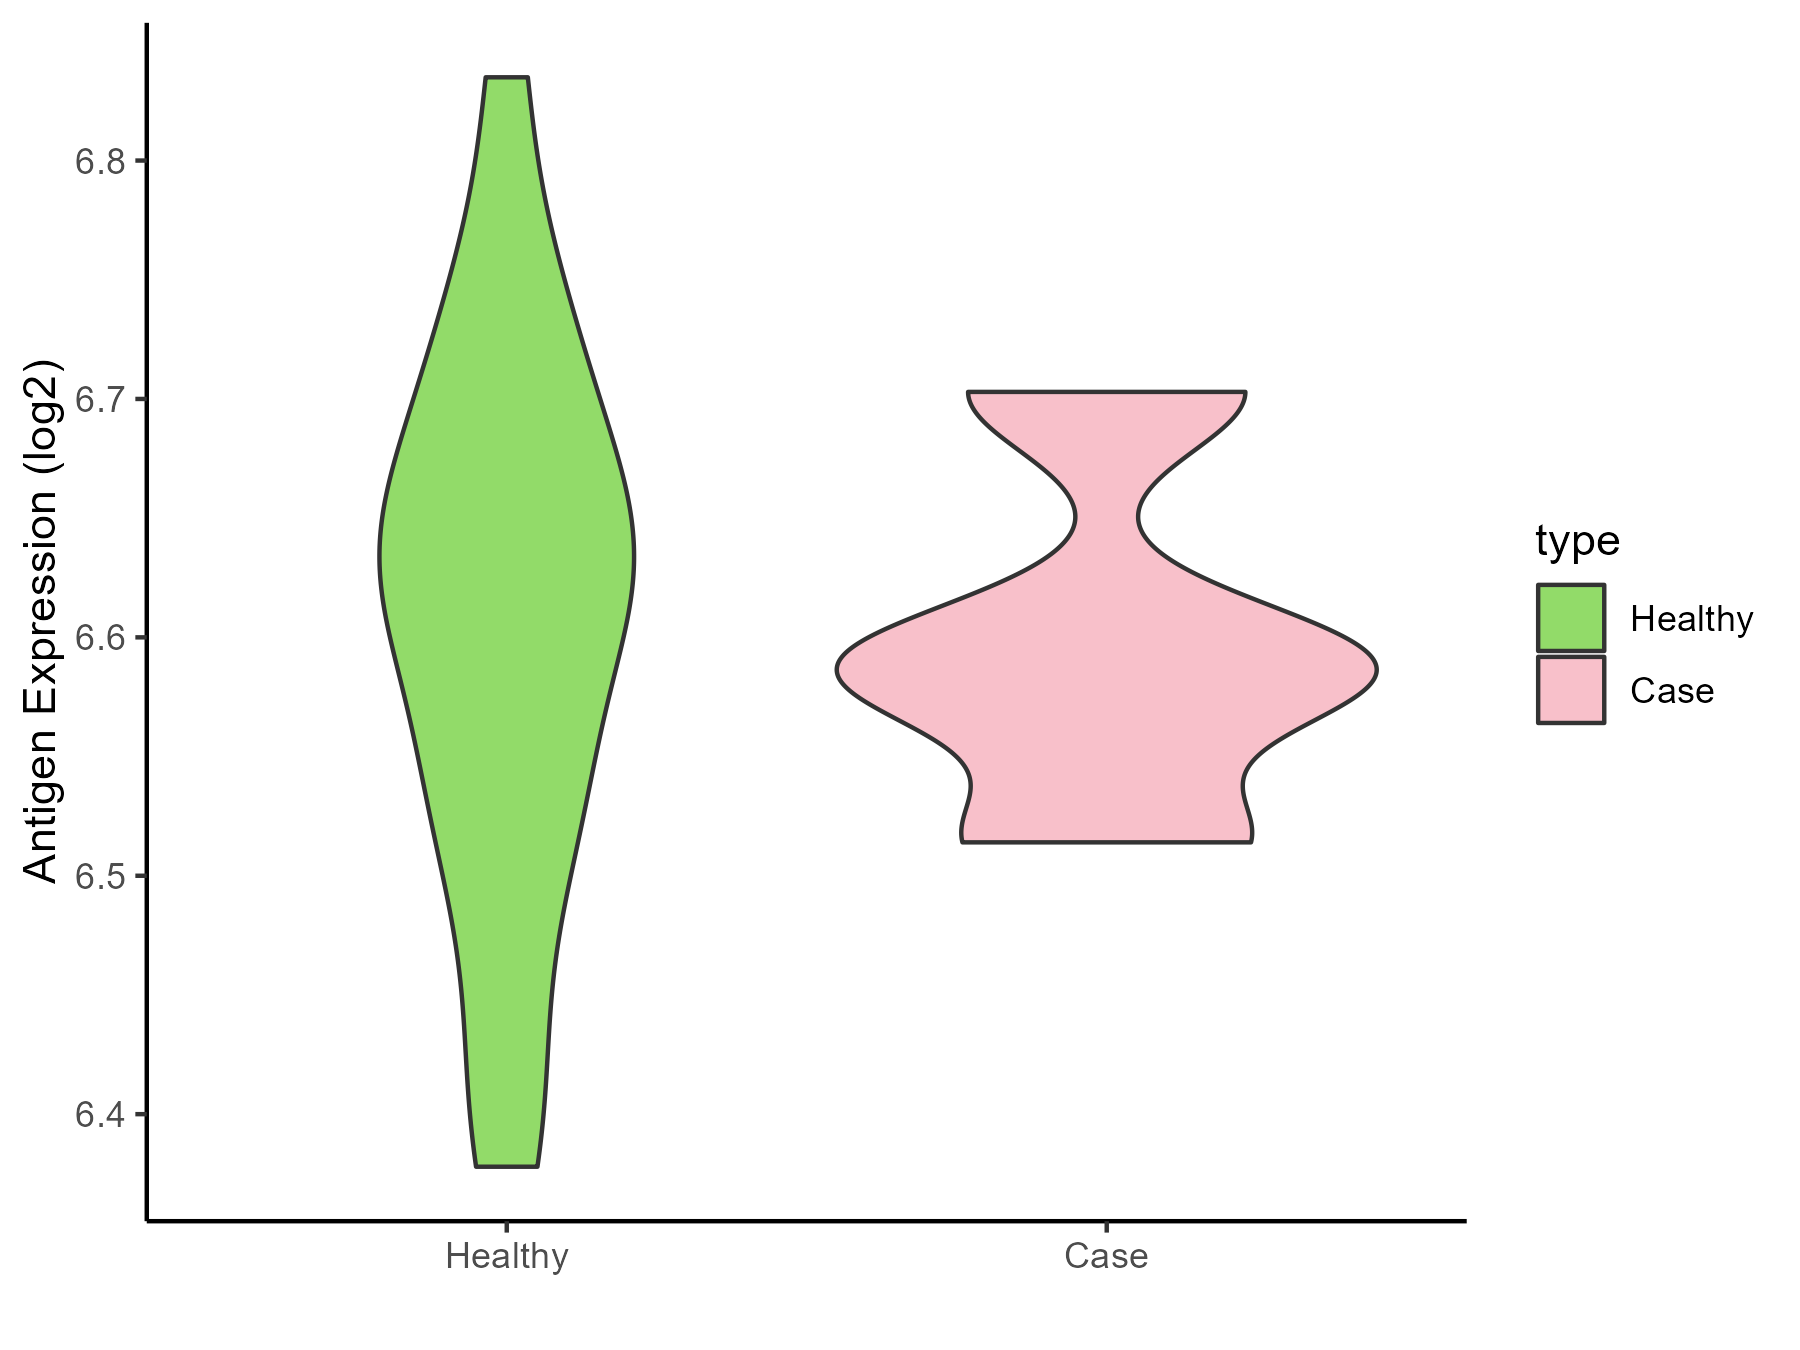
|
Click to View the Clearer Original Diagram |
| Differential expression pattern of antigen in diseases | ||
| The Studied Tissue | Bone marrow | |
| The Specific Disease | Myelodysplastic syndromes | |
| The Expression Level of Disease Section Compare with the Healthy Individual Tissue | p-value: 0.996645692; Fold-change: -0.013110379; Z-score: -0.172308596 | |
| The Expression Level of Disease Section Compare with the Adjacent Tissue | p-value: 0.996398303; Fold-change: -0.028234724; Z-score: -0.16419013 | |
| Disease-specific Antigen Abundances |
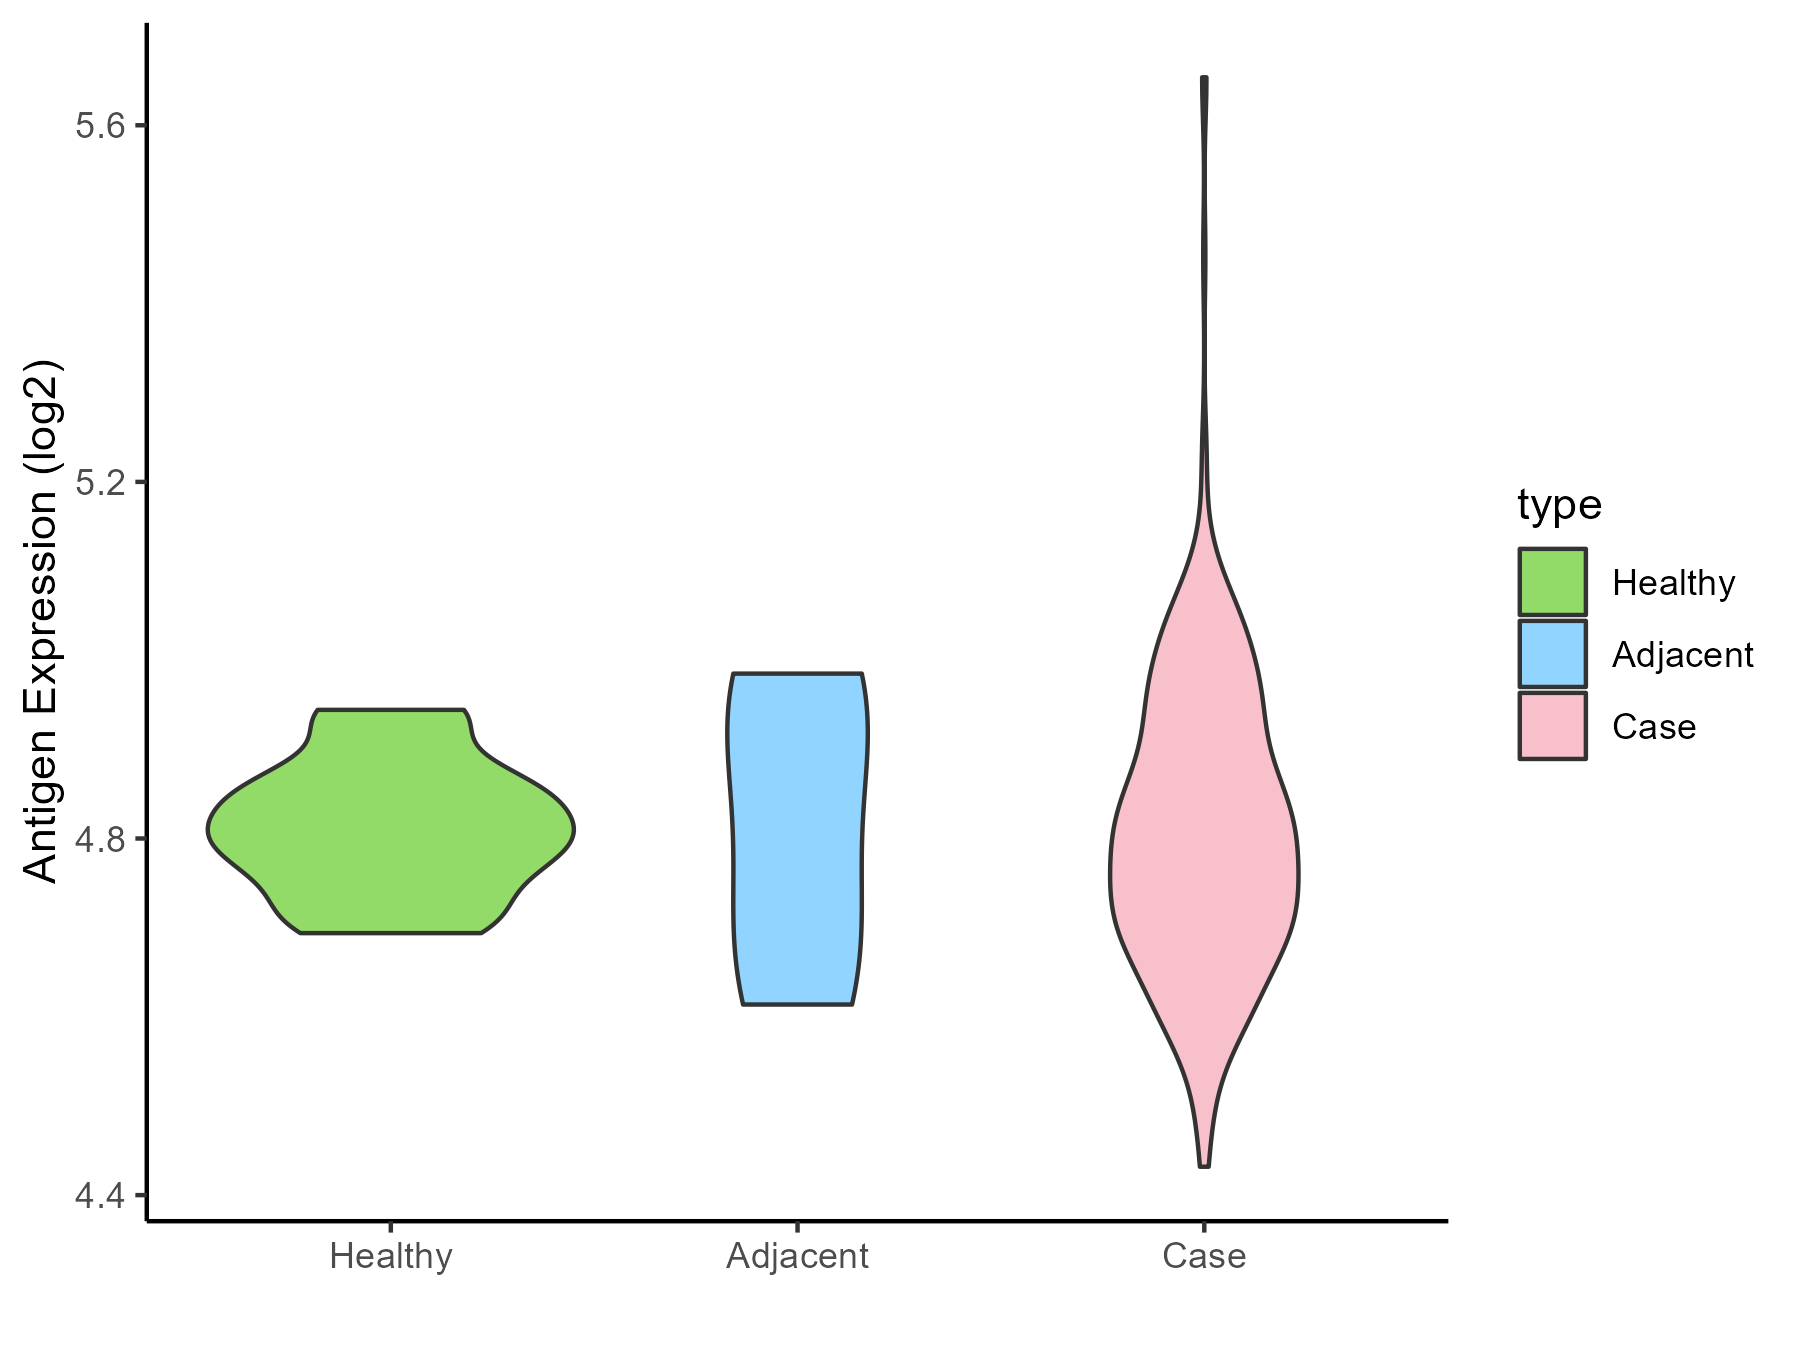
|
Click to View the Clearer Original Diagram |
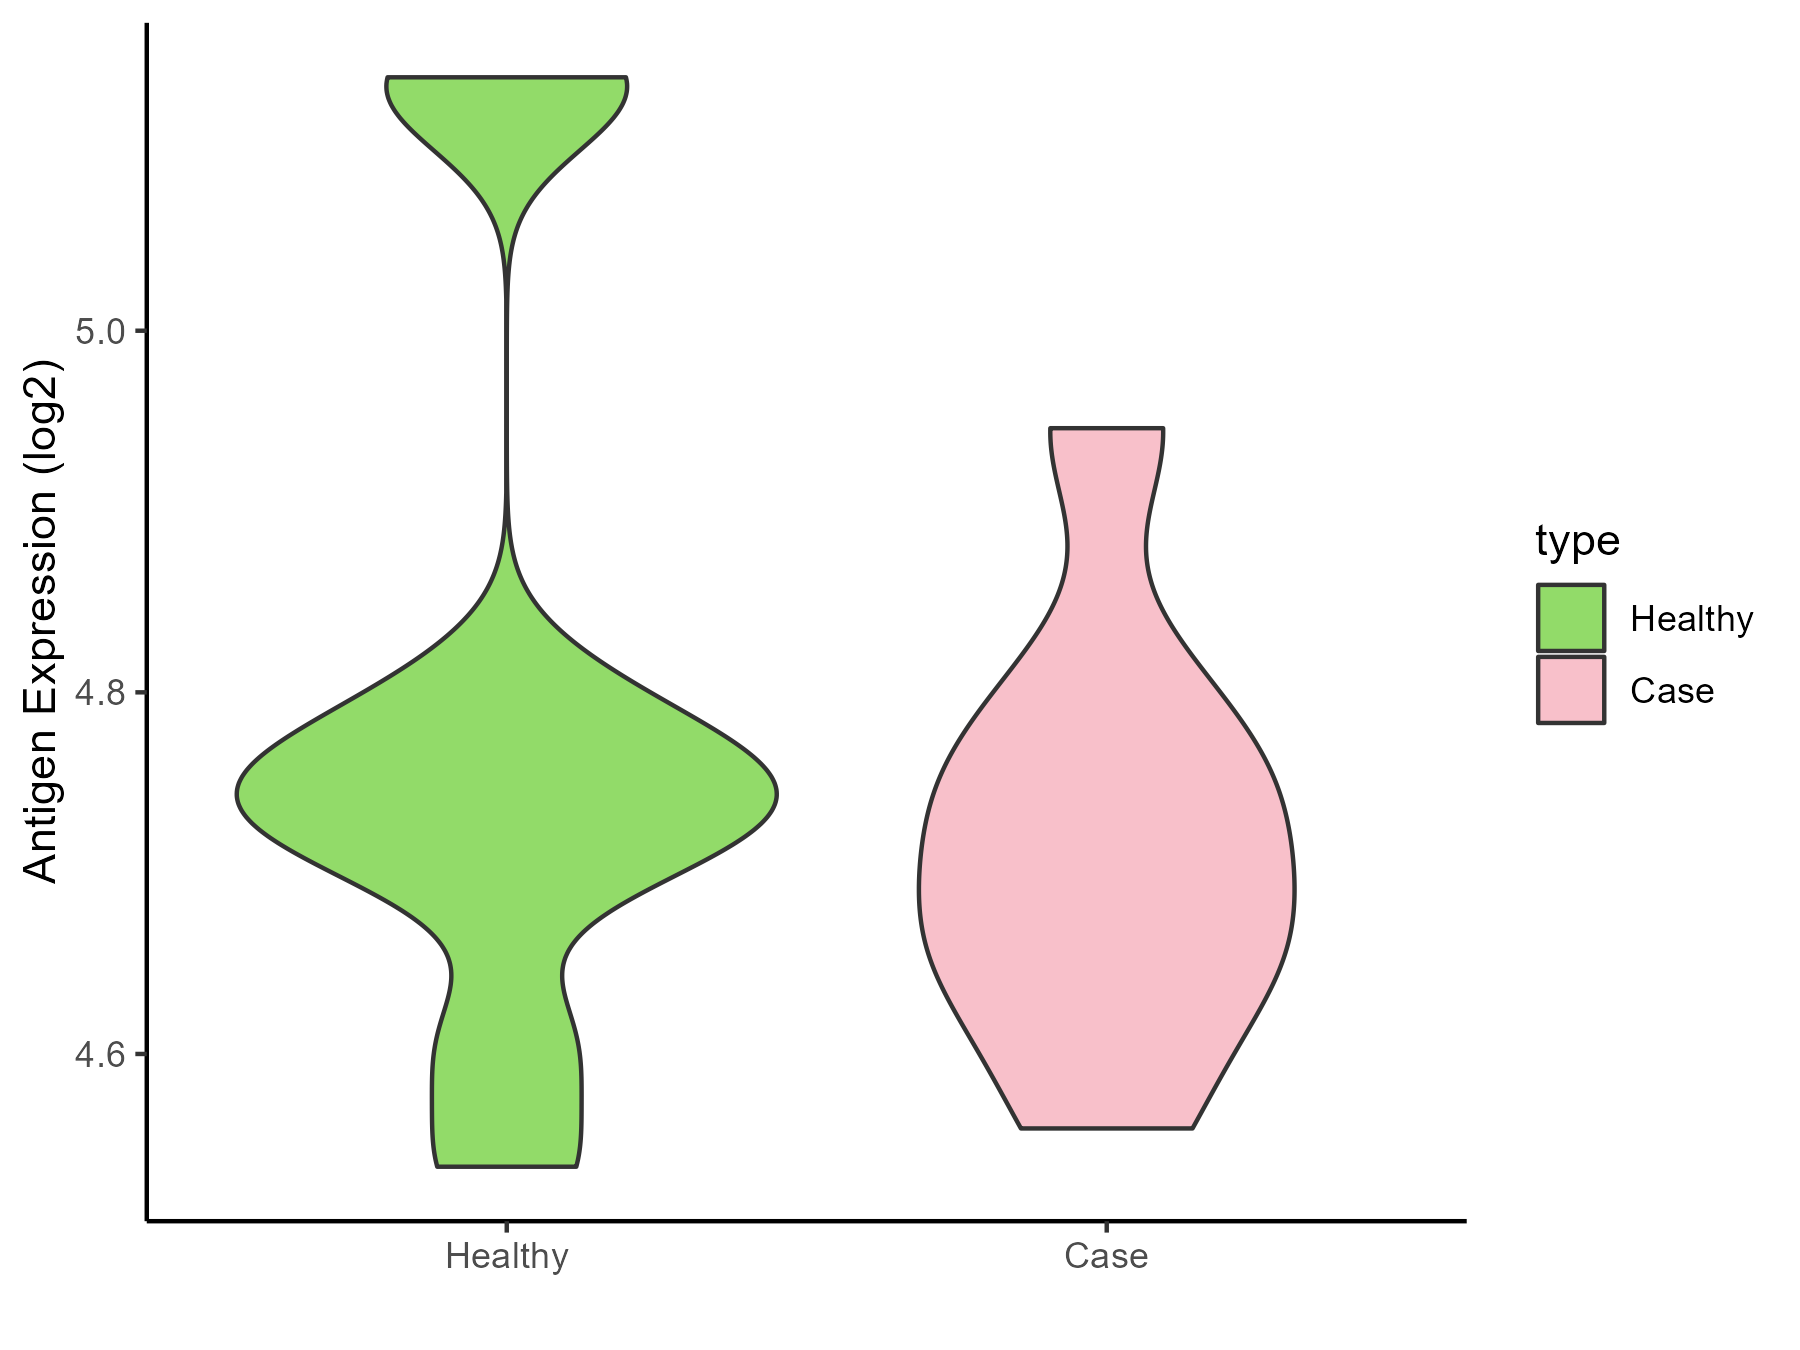
| Differential expression pattern of antigen in diseases | ||
| The Studied Tissue | Tonsil | |
| The Specific Disease | Lymphoma | |
| The Expression Level of Disease Section Compare with the Healthy Individual Tissue | p-value: 0.36601655; Fold-change: -0.038429942; Z-score: -0.19438326 | |
| Disease-specific Antigen Abundances |
|
Click to View the Clearer Original Diagram |
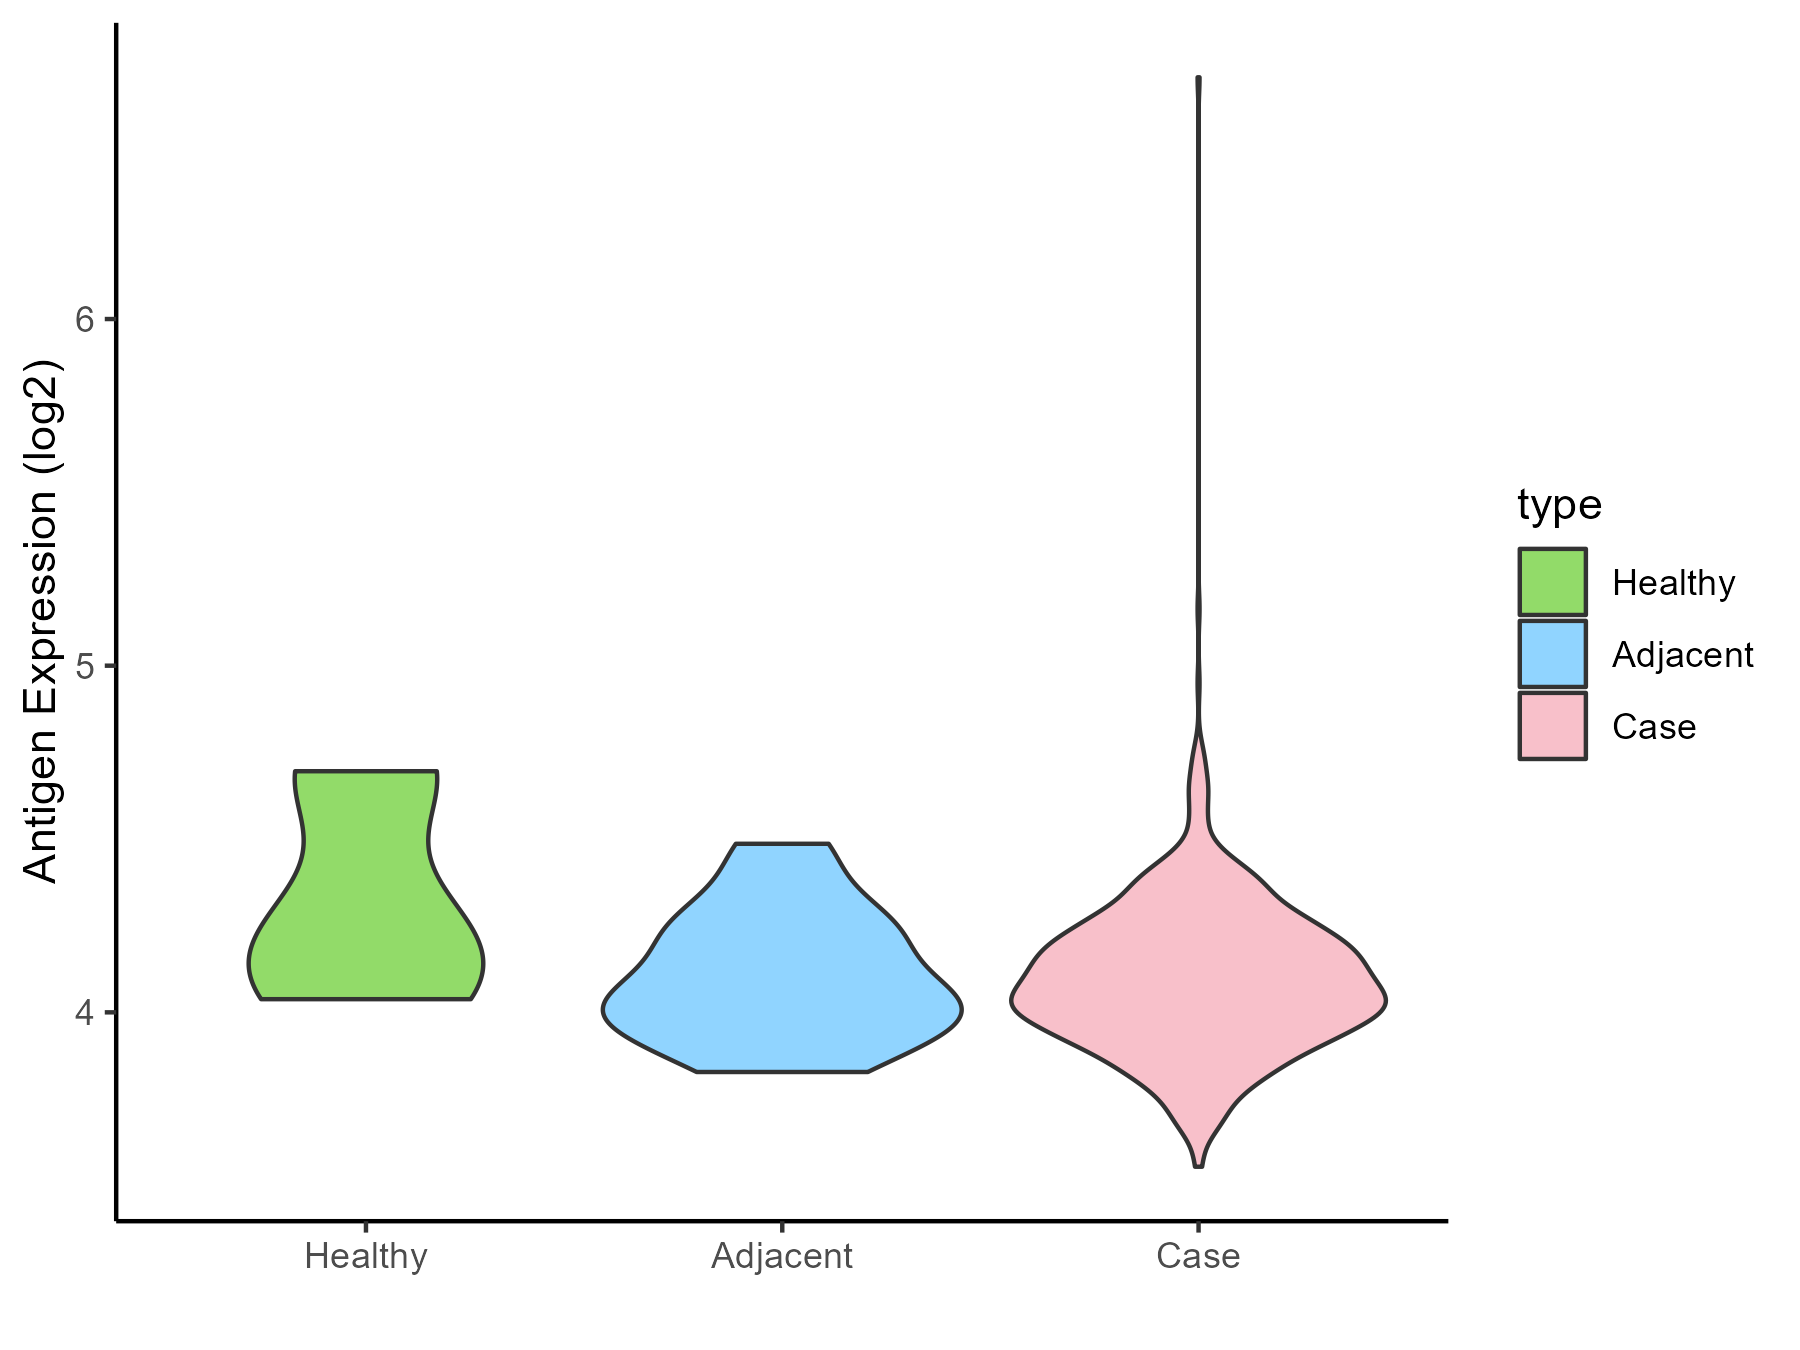
| Differential expression pattern of antigen in diseases | ||
| The Studied Tissue | Gastric | |
| The Specific Disease | Gastric cancer | |
| The Expression Level of Disease Section Compare with the Healthy Individual Tissue | p-value: 0.36305135; Fold-change: -0.158597231; Z-score: -0.470310192 | |
| The Expression Level of Disease Section Compare with the Adjacent Tissue | p-value: 0.837738866; Fold-change: 0.02938; Z-score: 0.154537543 | |
| Disease-specific Antigen Abundances |
|
Click to View the Clearer Original Diagram |
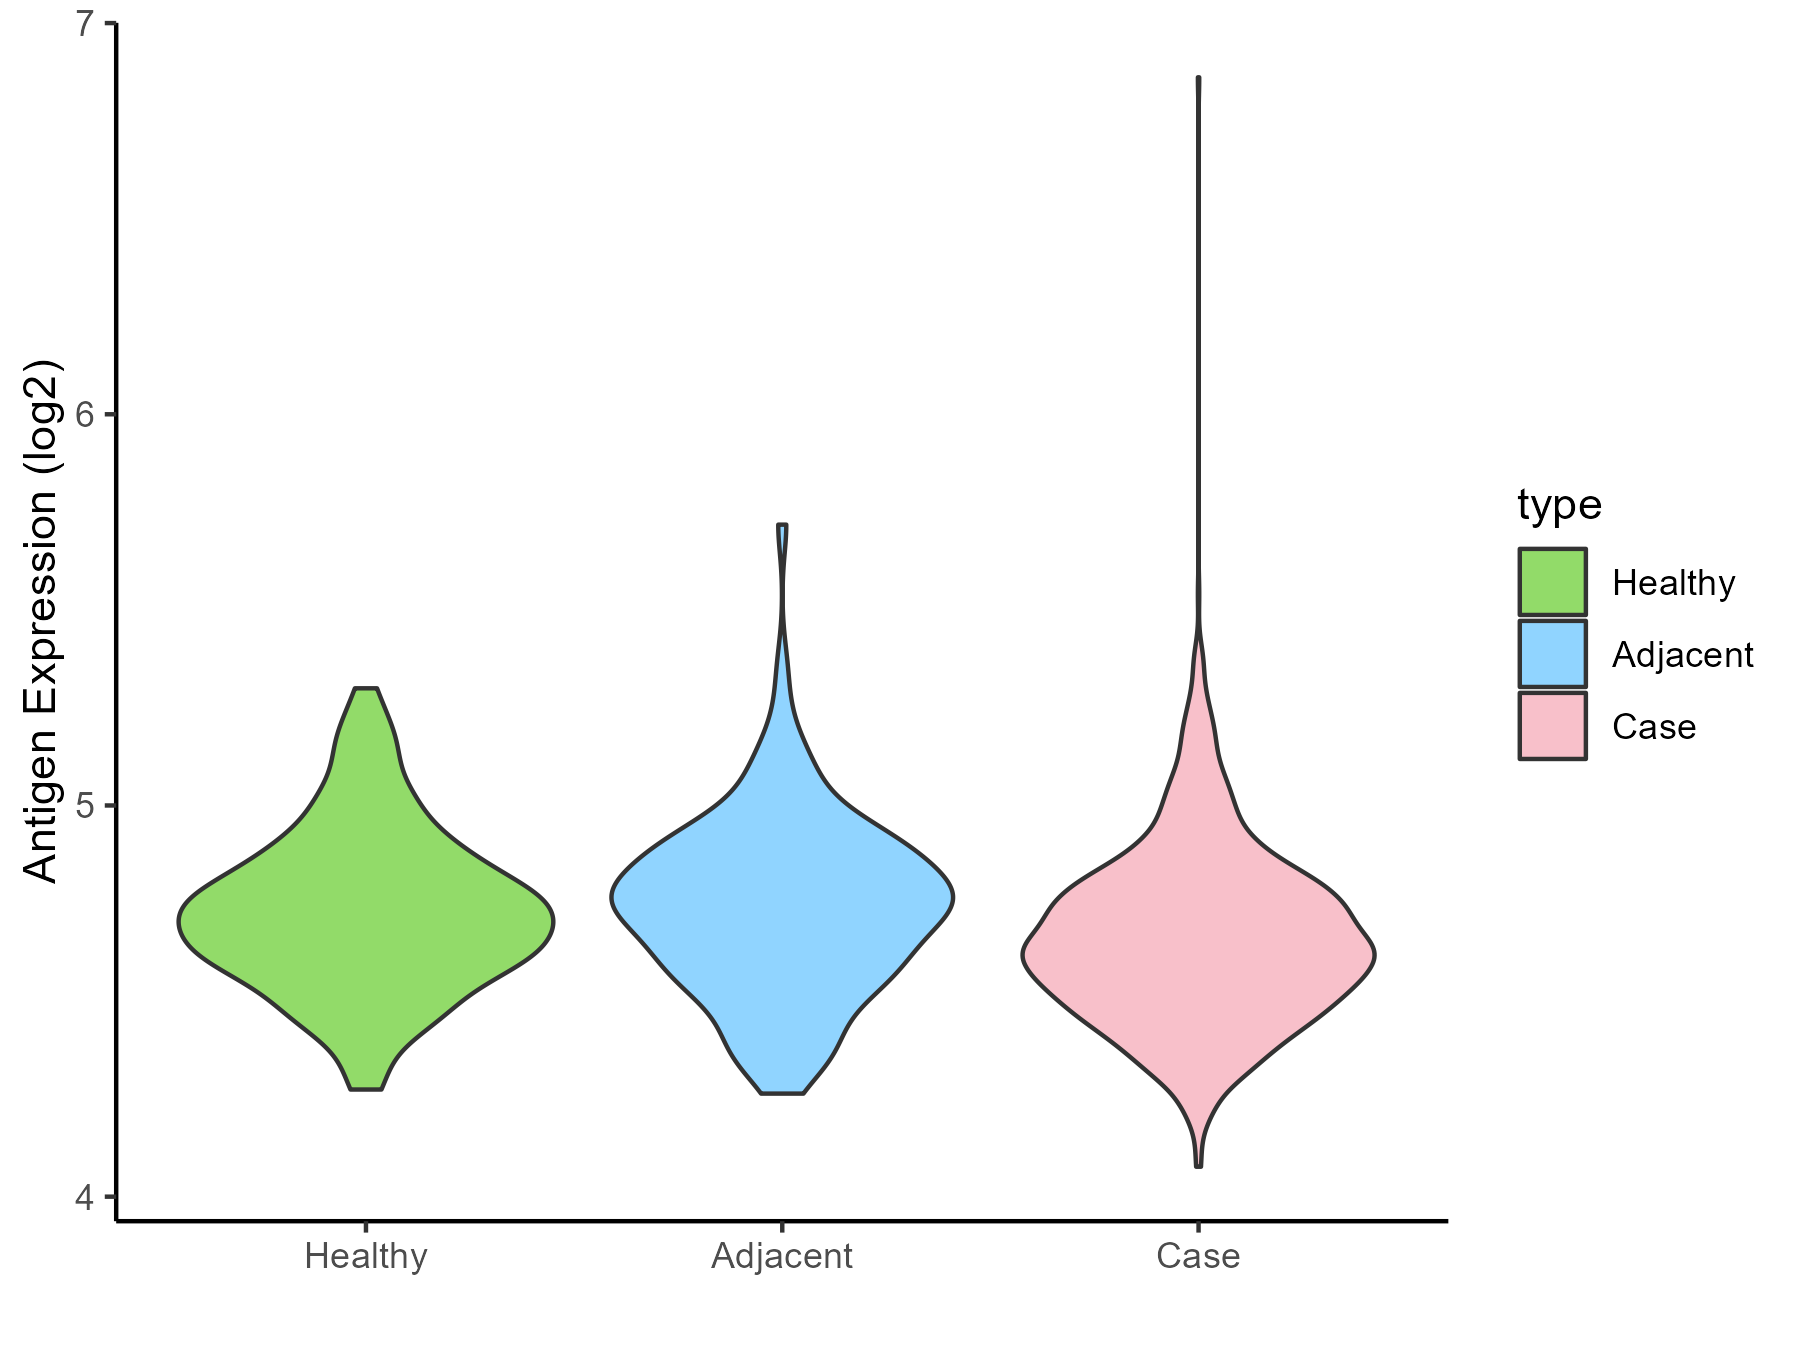
| Differential expression pattern of antigen in diseases | ||
| The Studied Tissue | Colon | |
| The Specific Disease | Colon cancer | |
| The Expression Level of Disease Section Compare with the Healthy Individual Tissue | p-value: 0.00015136; Fold-change: -0.073730906; Z-score: -0.360230412 | |
| The Expression Level of Disease Section Compare with the Adjacent Tissue | p-value: 0.0003919; Fold-change: -0.101796667; Z-score: -0.44750932 | |
| Disease-specific Antigen Abundances |
|
Click to View the Clearer Original Diagram |
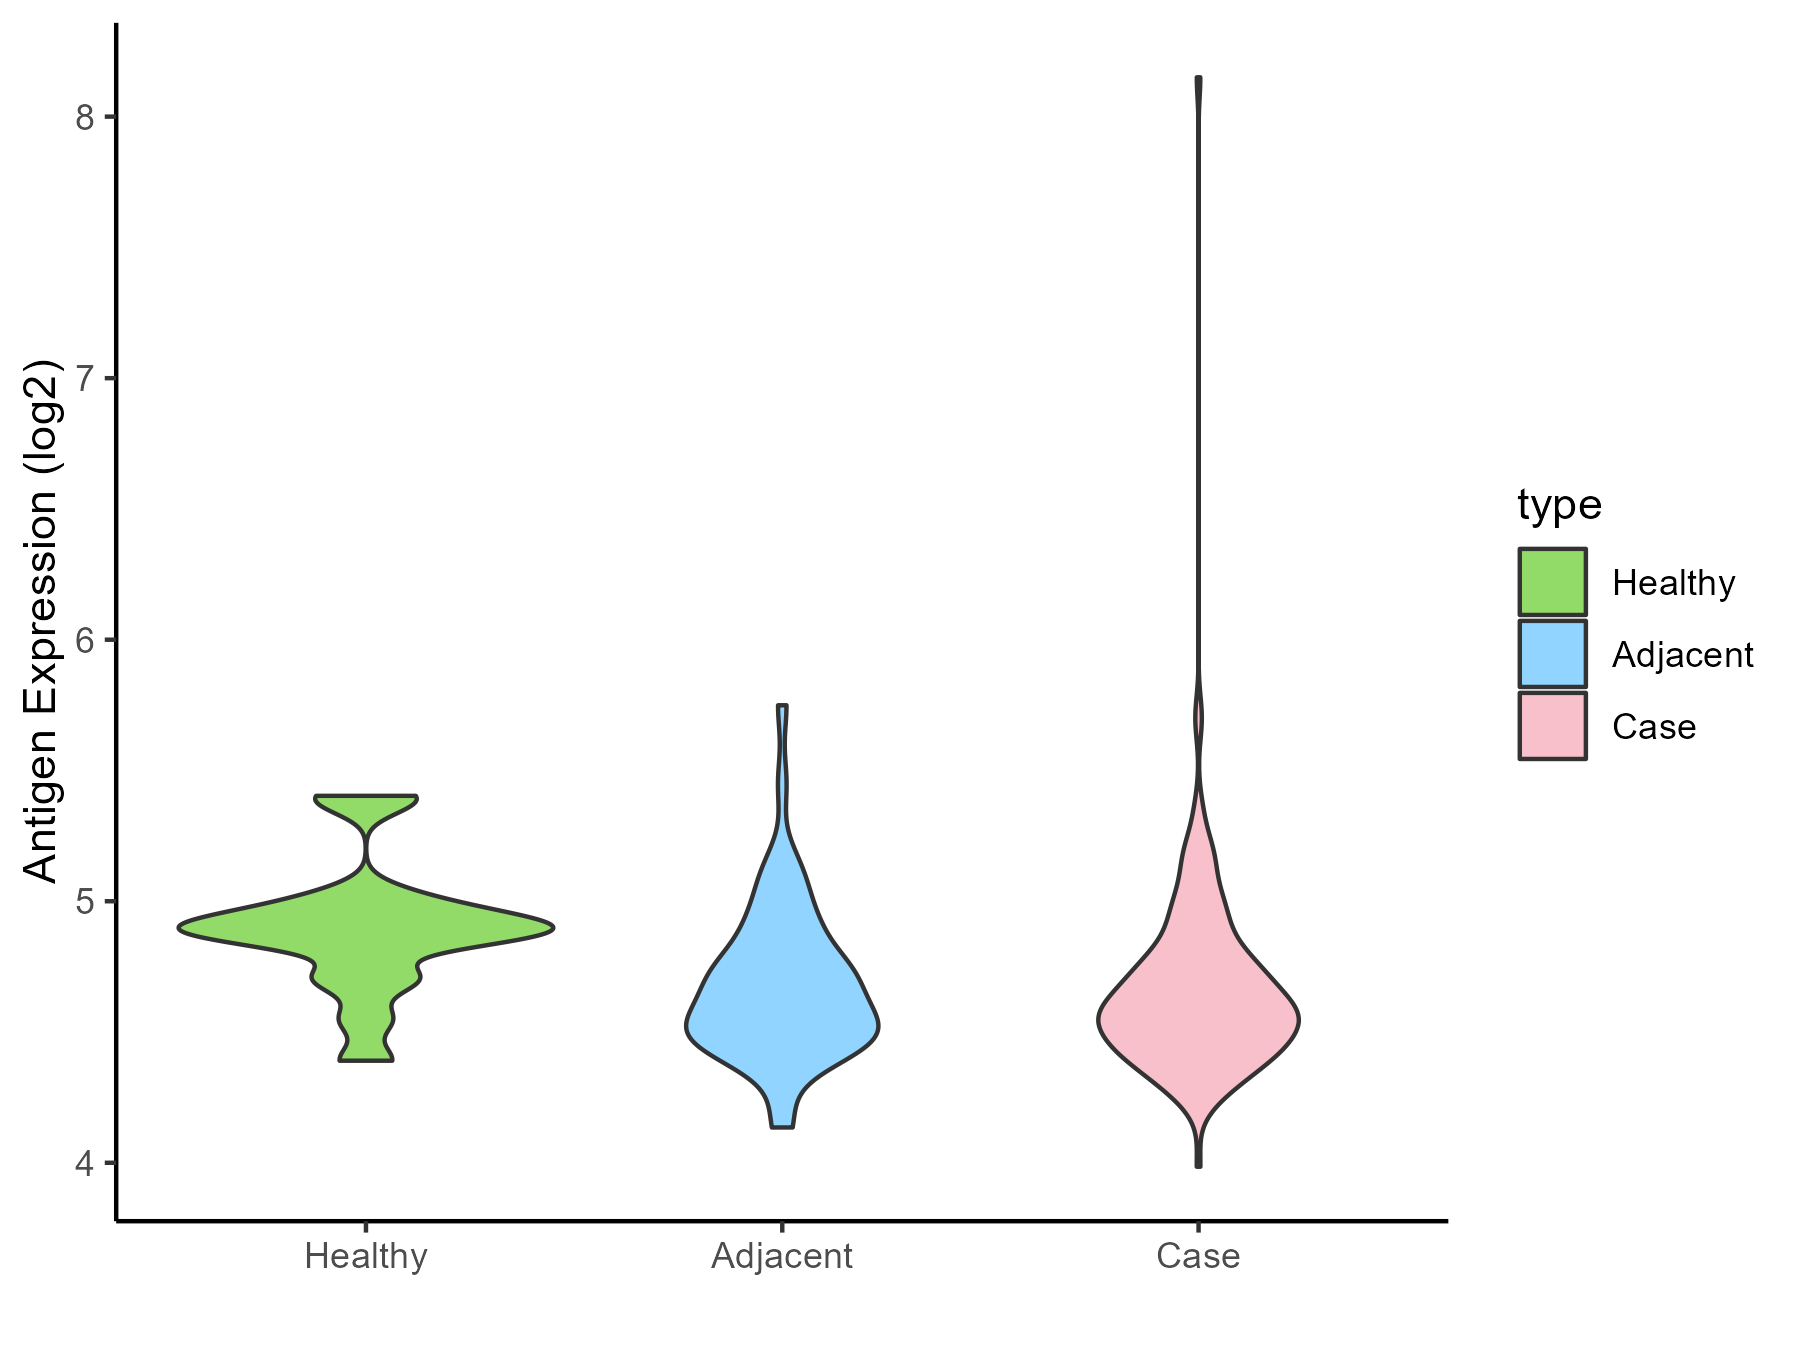
| Differential expression pattern of antigen in diseases | ||
| The Studied Tissue | Pancreas | |
| The Specific Disease | Pancreatic cancer | |
| The Expression Level of Disease Section Compare with the Healthy Individual Tissue | p-value: 0.003940469; Fold-change: -0.299352848; Z-score: -1.174545552 | |
| The Expression Level of Disease Section Compare with the Adjacent Tissue | p-value: 0.824724352; Fold-change: -0.042268686; Z-score: -0.145217543 | |
| Disease-specific Antigen Abundances |
|
Click to View the Clearer Original Diagram |
| Differential expression pattern of antigen in diseases | ||
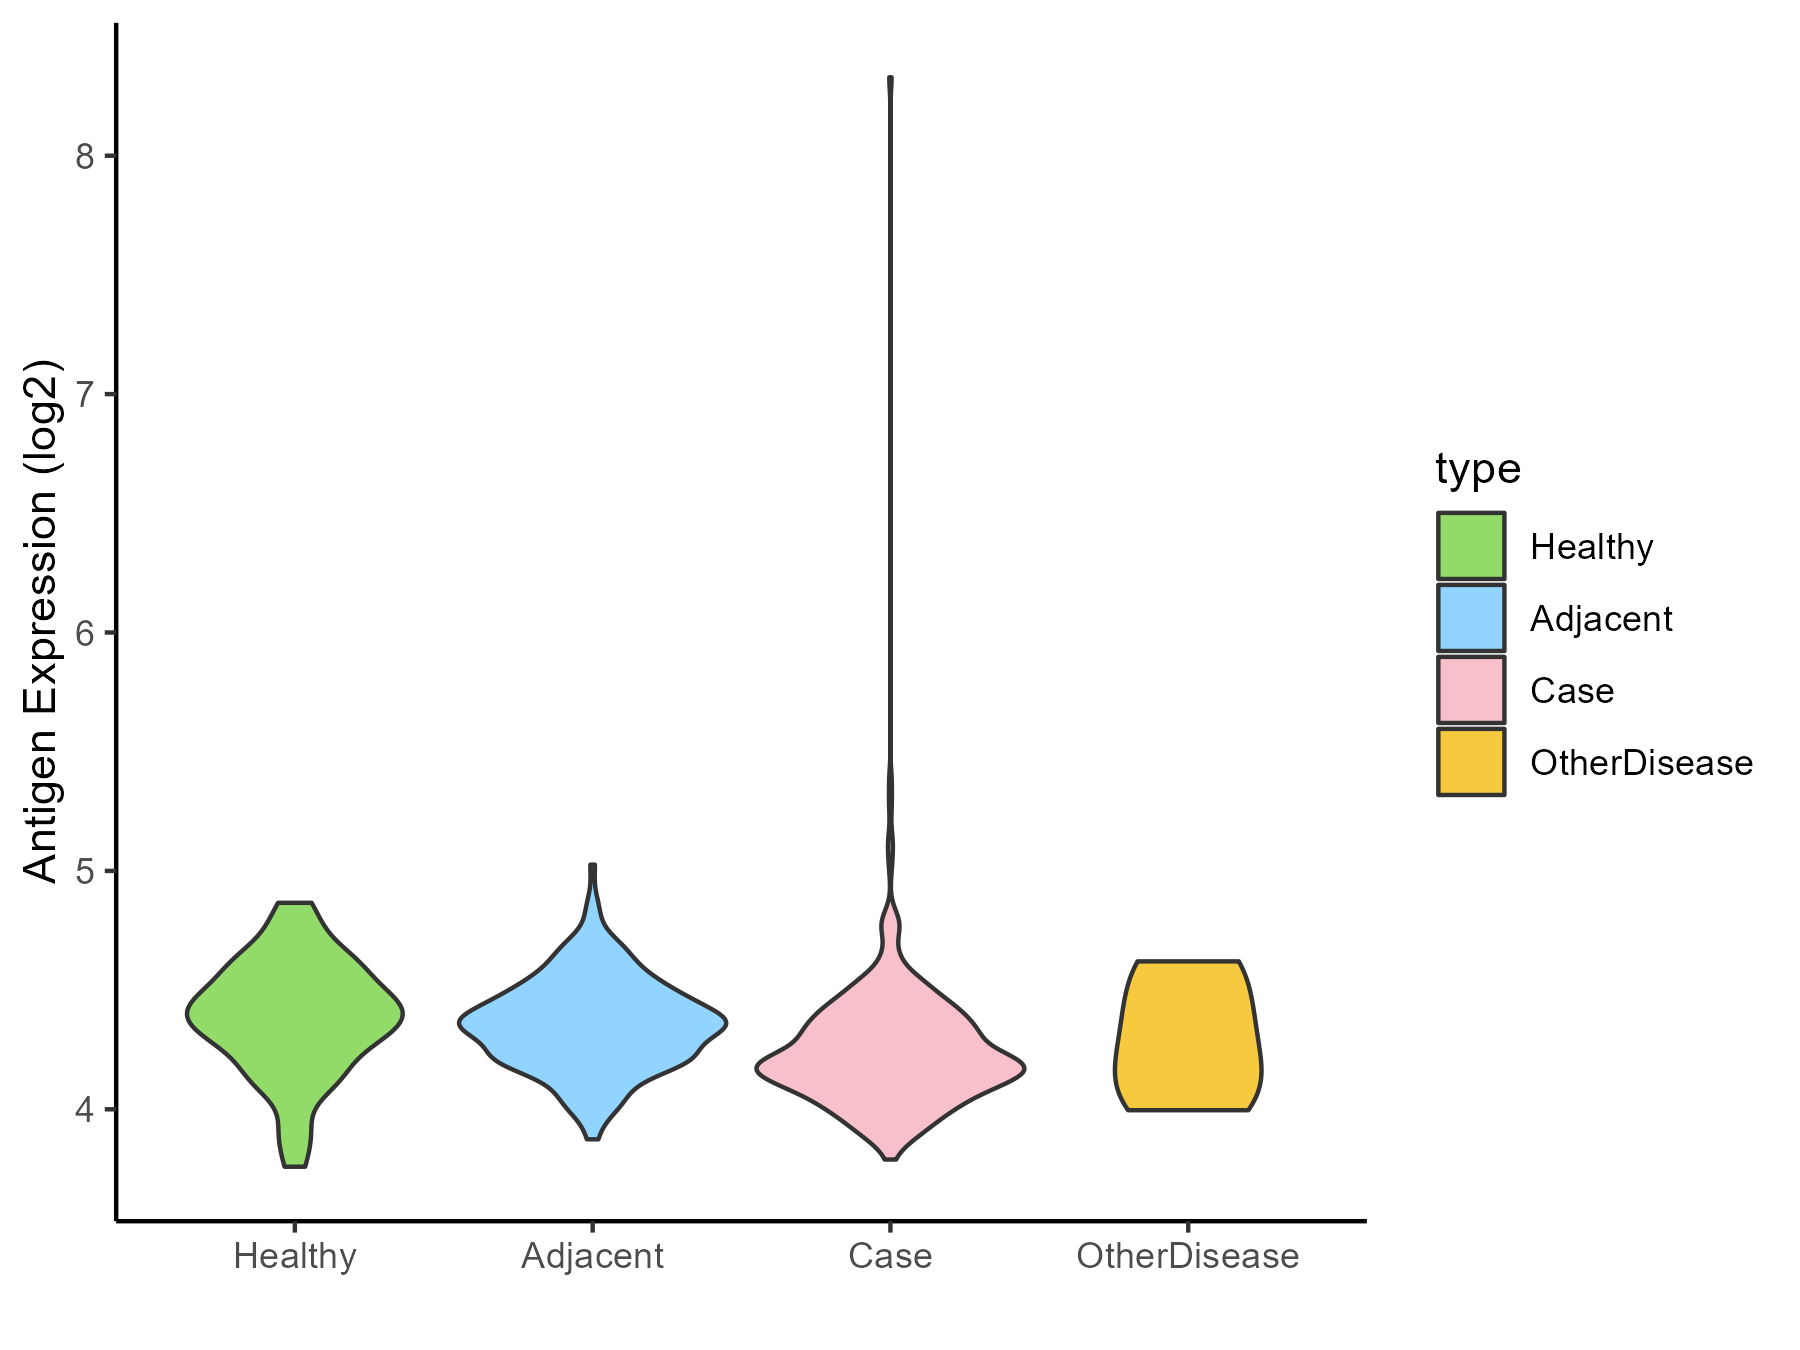
| The Studied Tissue | Liver | |
| The Specific Disease | Liver cancer | |
| The Expression Level of Disease Section Compare with the Healthy Individual Tissue | p-value: 0.00148407; Fold-change: -0.201332309; Z-score: -0.834211959 | |
| The Expression Level of Disease Section Compare with the Adjacent Tissue | p-value: 3.15E-07; Fold-change: -0.148019818; Z-score: -0.776524846 | |
| The Expression Level of Disease Section Compare with the Other Disease Section | p-value: 0.782100202; Fold-change: -0.071149848; Z-score: -0.262277284 | |
| Disease-specific Antigen Abundances |
|
Click to View the Clearer Original Diagram |
| Differential expression pattern of antigen in diseases | ||
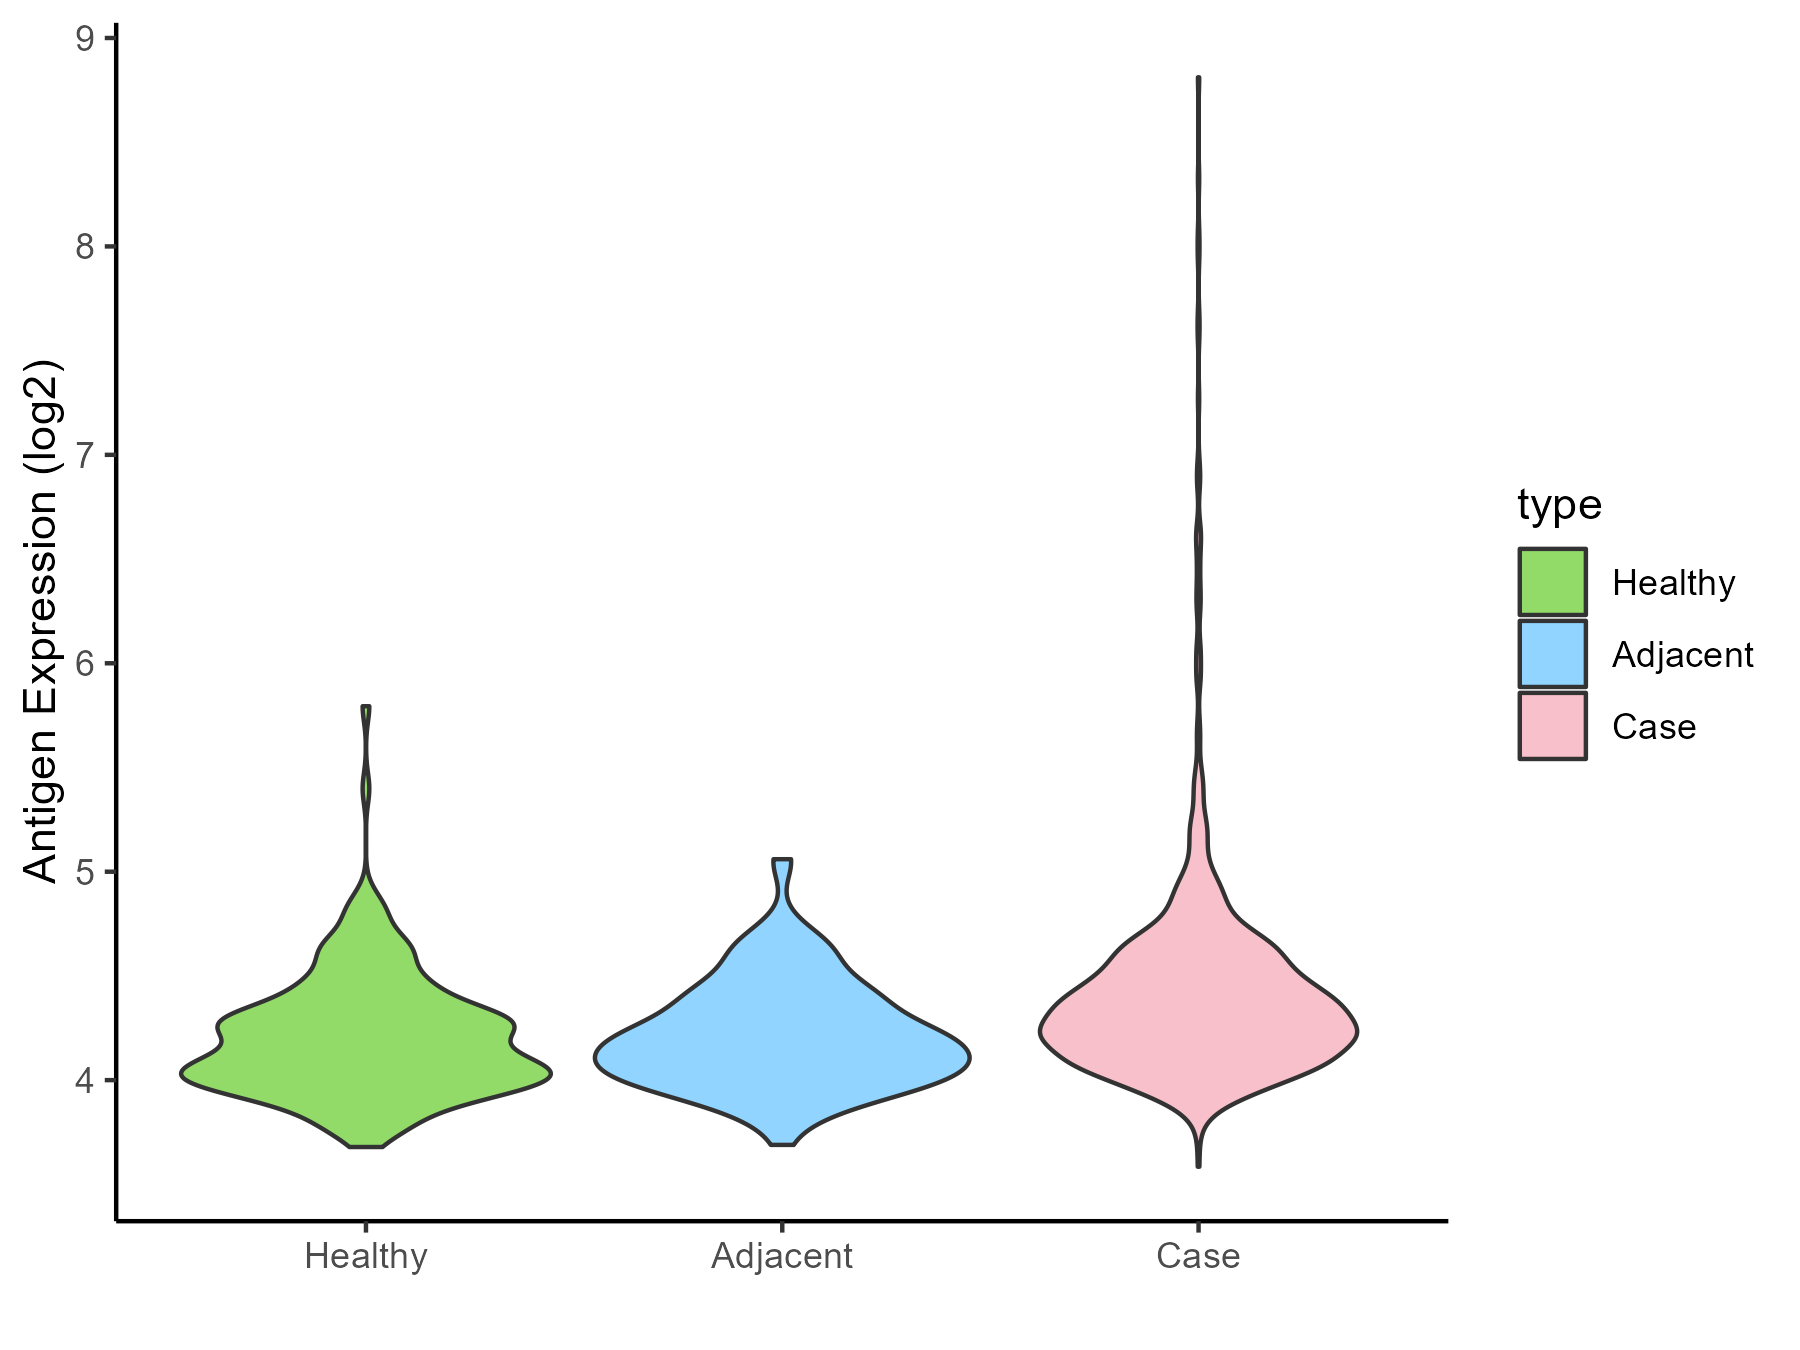
| The Studied Tissue | Lung | |
| The Specific Disease | Lung cancer | |
| The Expression Level of Disease Section Compare with the Healthy Individual Tissue | p-value: 7.19E-15; Fold-change: 0.180412637; Z-score: 0.613299111 | |
| The Expression Level of Disease Section Compare with the Adjacent Tissue | p-value: 3.03E-12; Fold-change: 0.140364149; Z-score: 0.555945014 | |
| Disease-specific Antigen Abundances |
|
Click to View the Clearer Original Diagram |
| Differential expression pattern of antigen in diseases | ||
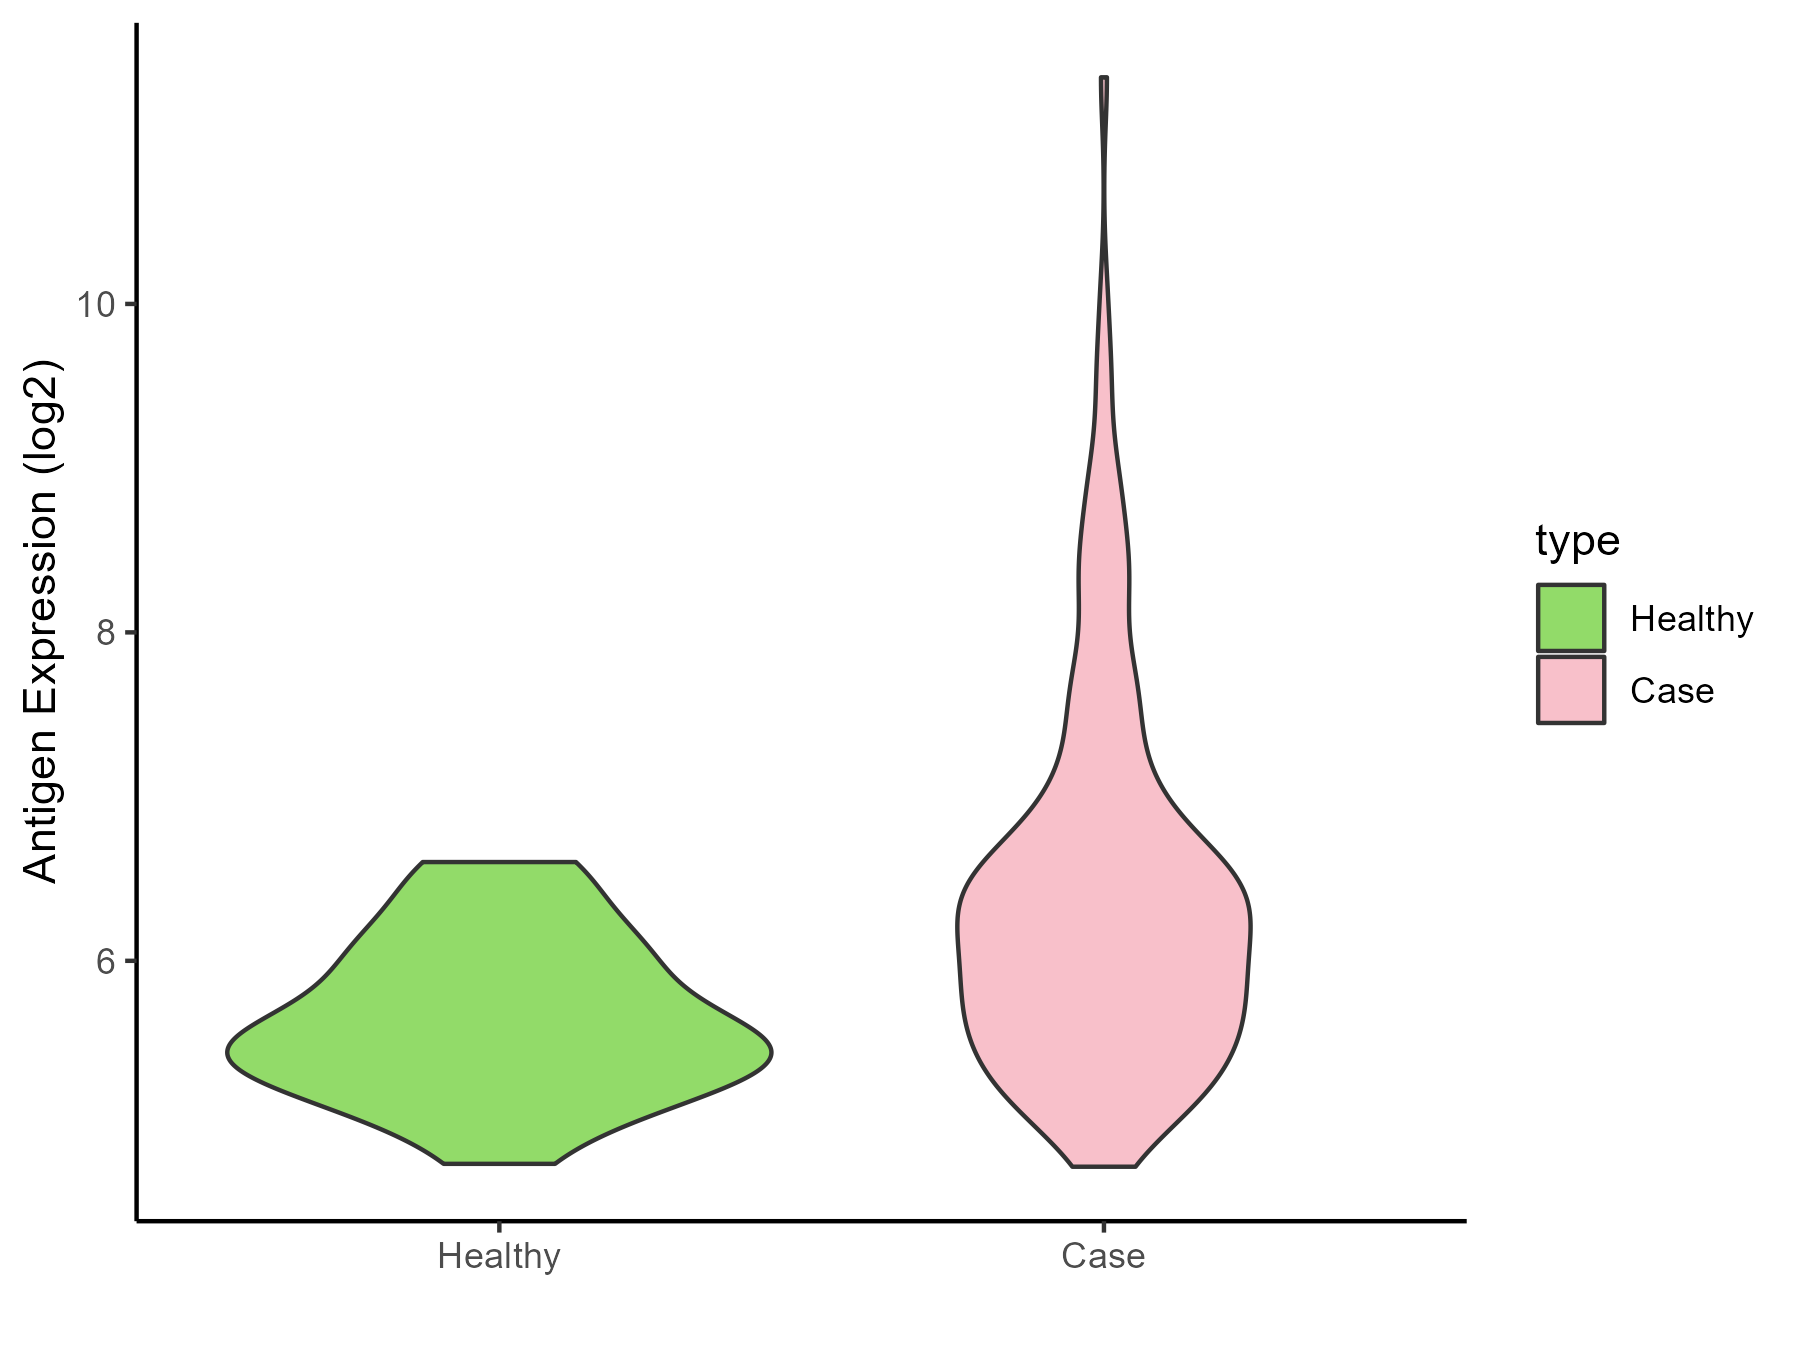
| The Studied Tissue | Skin | |
| The Specific Disease | Melanoma | |
| The Expression Level of Disease Section Compare with the Healthy Individual Tissue | p-value: 9.75E-07; Fold-change: 0.643897798; Z-score: 1.319004289 | |
| Disease-specific Antigen Abundances |
|
Click to View the Clearer Original Diagram |
| Differential expression pattern of antigen in diseases | ||
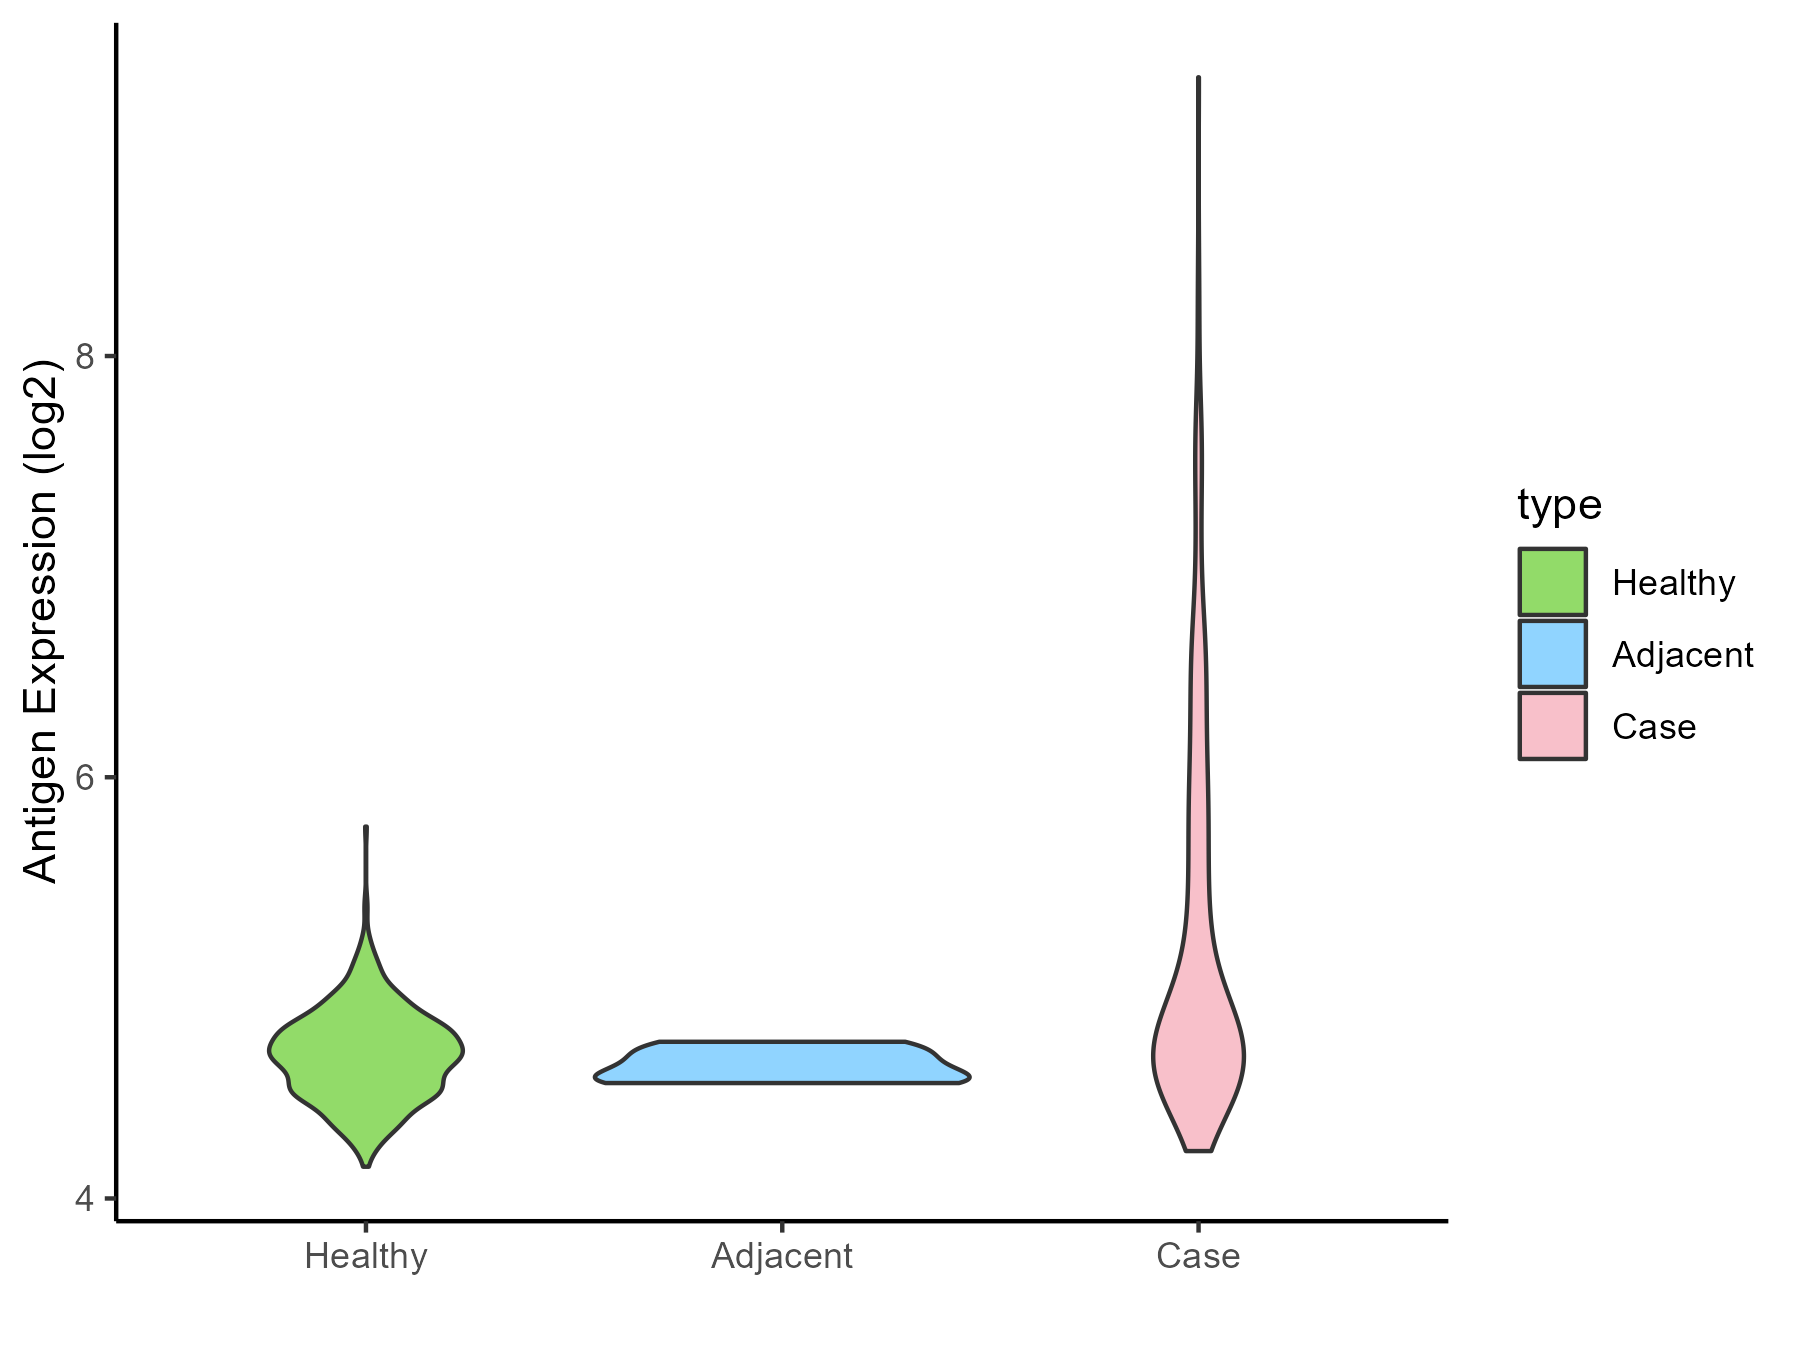
| The Studied Tissue | Muscle | |
| The Specific Disease | Sarcoma | |
| The Expression Level of Disease Section Compare with the Healthy Individual Tissue | p-value: 7.46E-42; Fold-change: 0.179414766; Z-score: 0.833995707 | |
| The Expression Level of Disease Section Compare with the Adjacent Tissue | p-value: 3.05E-06; Fold-change: 0.24372334; Z-score: 2.652751597 | |
| Disease-specific Antigen Abundances |
|
Click to View the Clearer Original Diagram |
| Differential expression pattern of antigen in diseases | ||
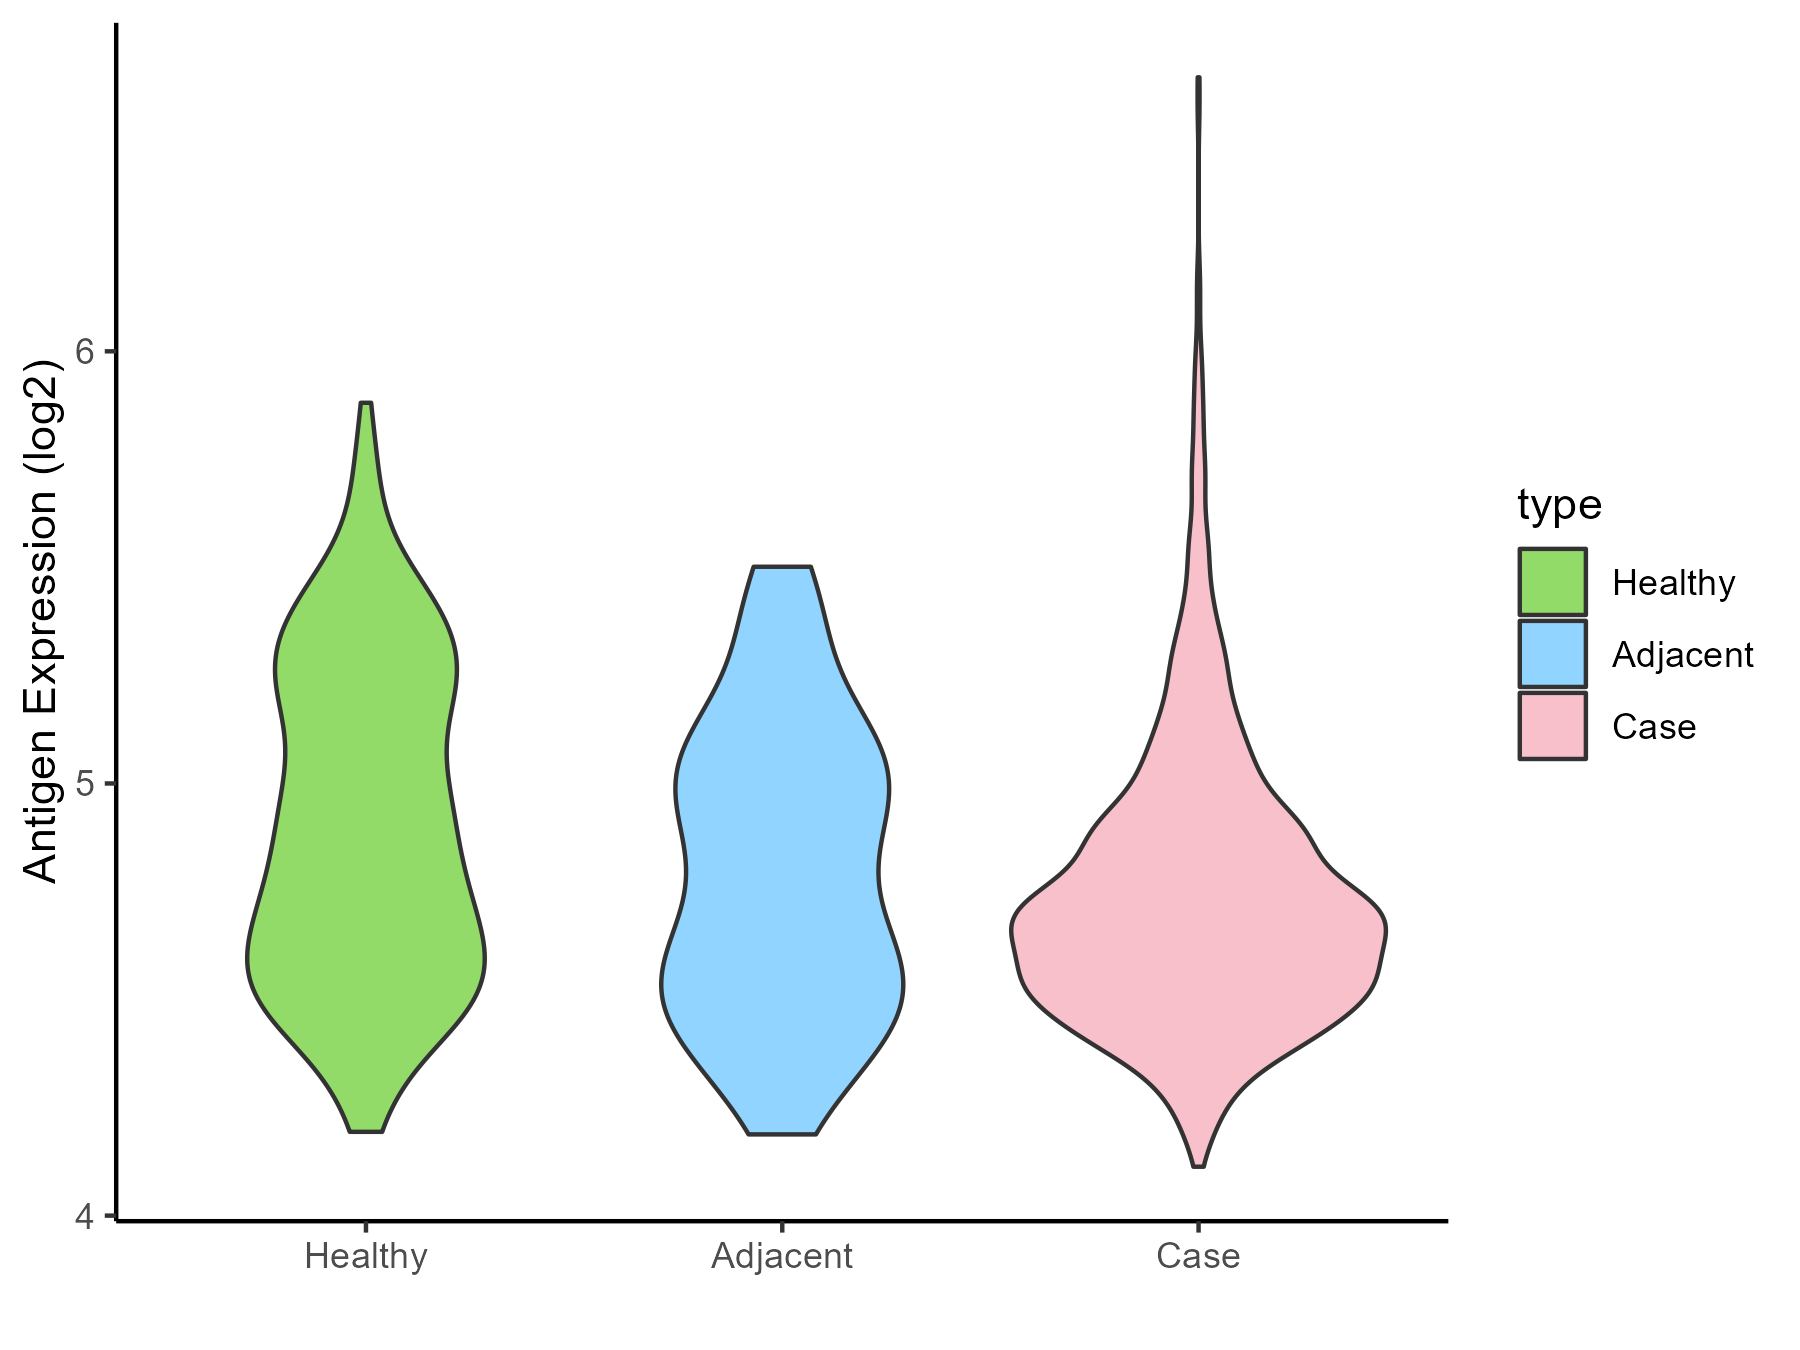
| The Studied Tissue | Breast | |
| The Specific Disease | Breast cancer | |
| The Expression Level of Disease Section Compare with the Healthy Individual Tissue | p-value: 9.80E-11; Fold-change: -0.179463483; Z-score: -0.483855372 | |
| The Expression Level of Disease Section Compare with the Adjacent Tissue | p-value: 0.270025049; Fold-change: -0.089424676; Z-score: -0.262400084 | |
| Disease-specific Antigen Abundances |
|
Click to View the Clearer Original Diagram |
| Differential expression pattern of antigen in diseases | ||
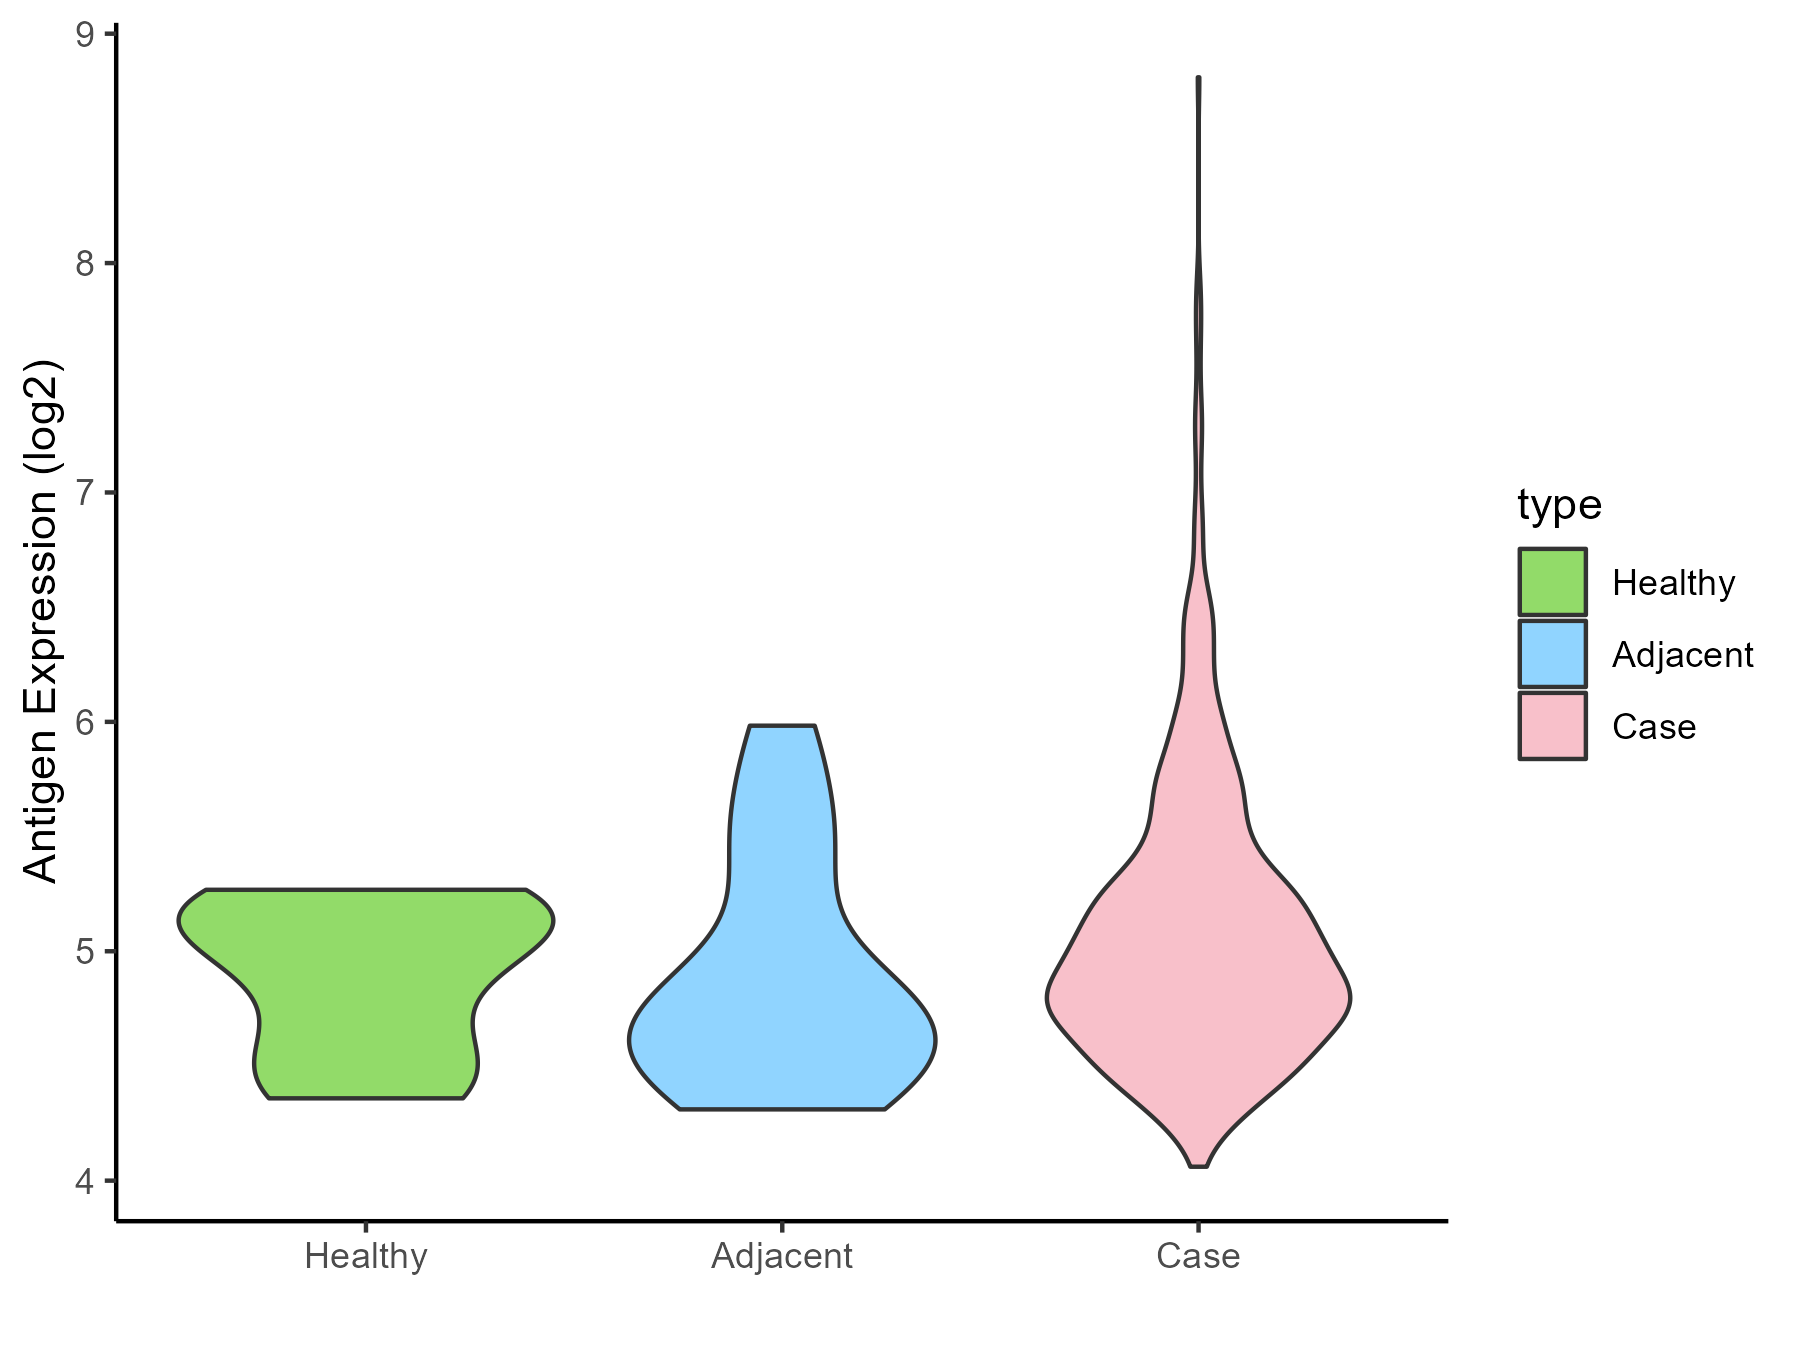
| The Studied Tissue | Ovarian | |
| The Specific Disease | Ovarian cancer | |
| The Expression Level of Disease Section Compare with the Healthy Individual Tissue | p-value: 0.117530687; Fold-change: -0.053356035; Z-score: -0.151551732 | |
| The Expression Level of Disease Section Compare with the Adjacent Tissue | p-value: 0.164858427; Fold-change: 0.200915788; Z-score: 0.388207257 | |
| Disease-specific Antigen Abundances |
|
Click to View the Clearer Original Diagram |
| Differential expression pattern of antigen in diseases | ||
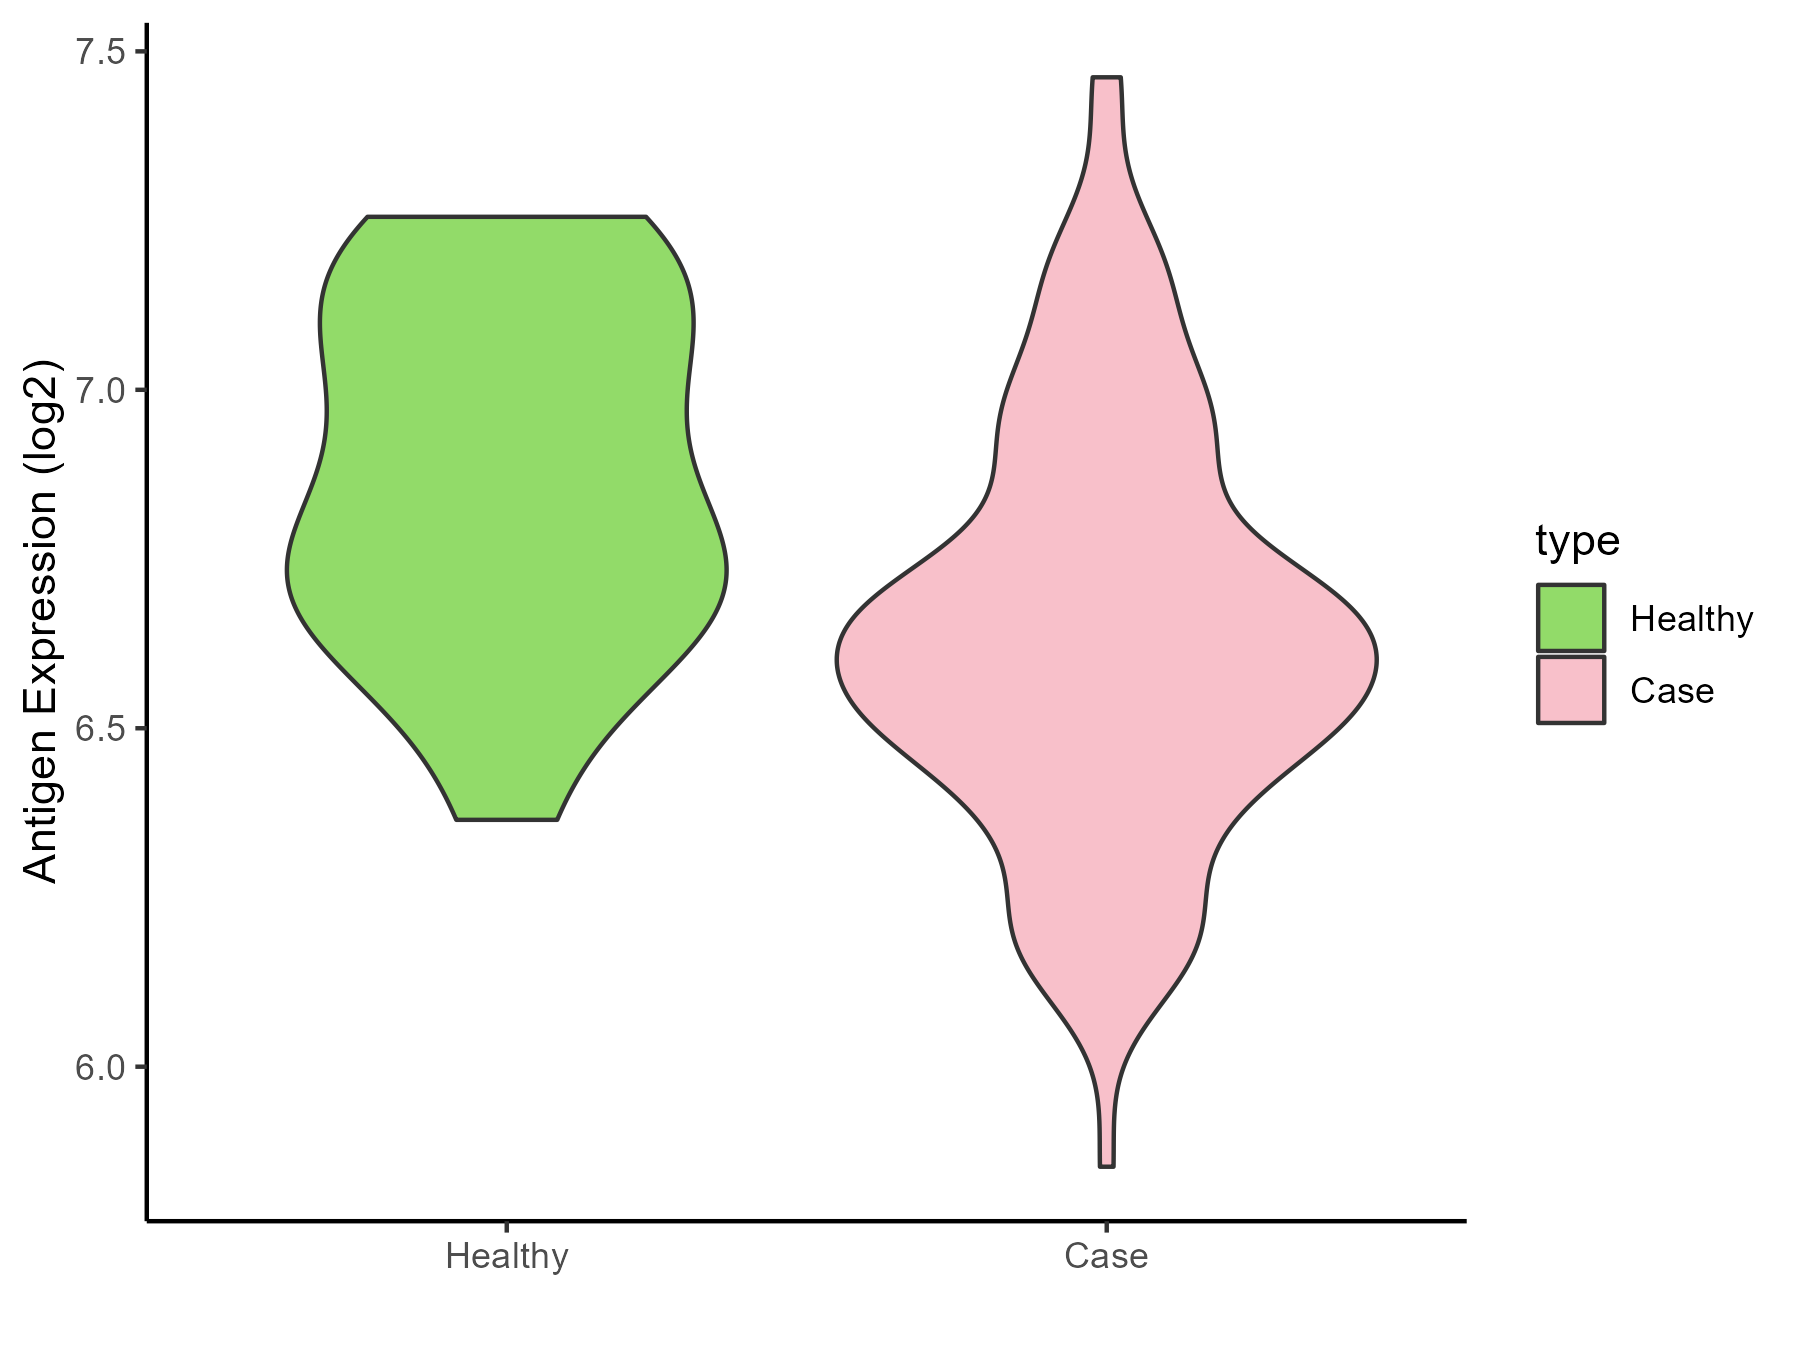
| The Studied Tissue | Cervical | |
| The Specific Disease | Cervical cancer | |
| The Expression Level of Disease Section Compare with the Healthy Individual Tissue | p-value: 0.001797331; Fold-change: -0.216058624; Z-score: -0.83097895 | |
| Disease-specific Antigen Abundances |
|
Click to View the Clearer Original Diagram |
| Differential expression pattern of antigen in diseases | ||
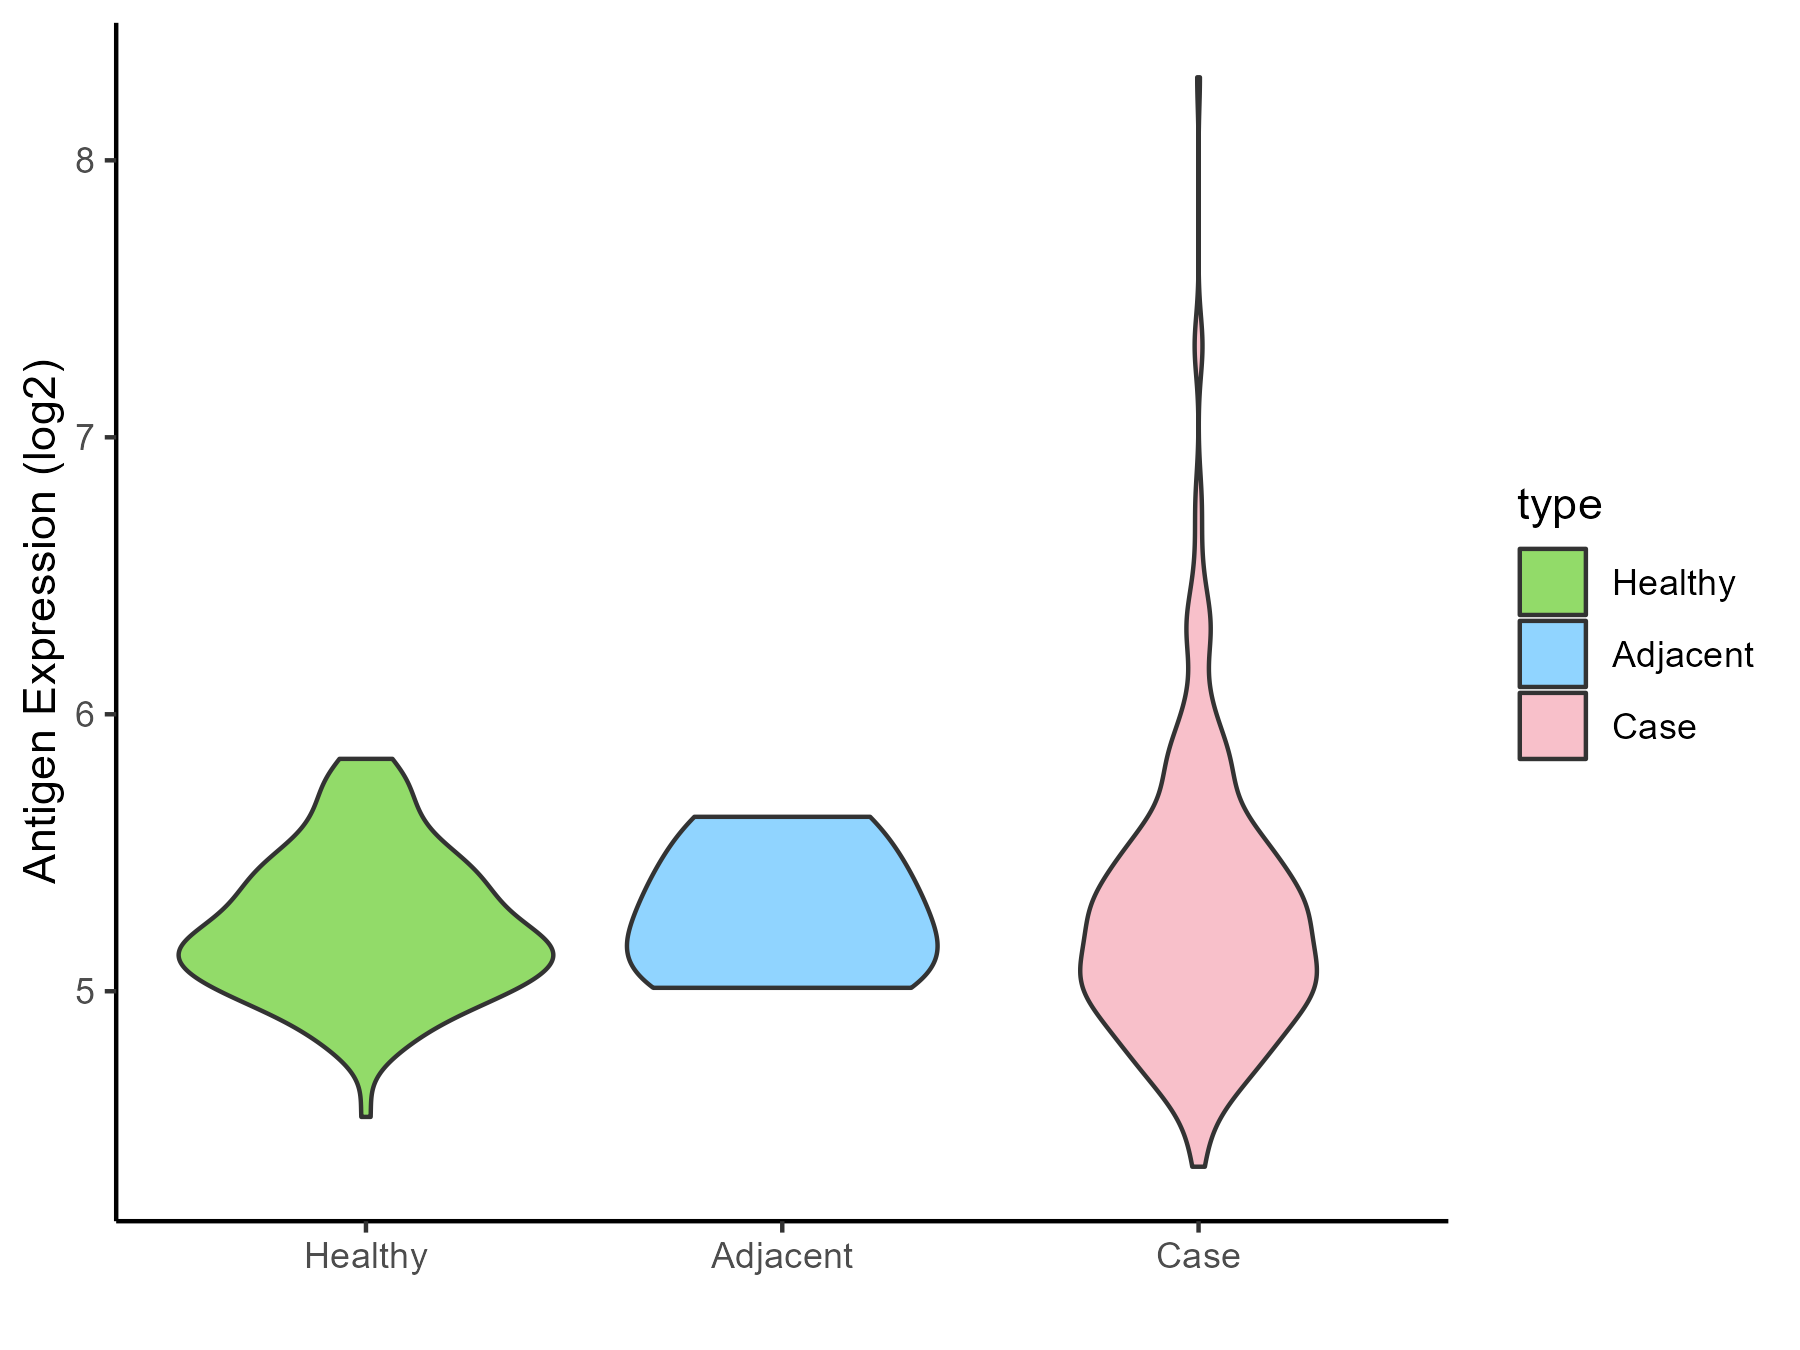
| The Studied Tissue | Endometrium | |
| The Specific Disease | Uterine cancer | |
| The Expression Level of Disease Section Compare with the Healthy Individual Tissue | p-value: 0.222210229; Fold-change: 0.009743978; Z-score: 0.037962721 | |
| The Expression Level of Disease Section Compare with the Adjacent Tissue | p-value: 0.97019708; Fold-change: -0.068459738; Z-score: -0.274782582 | |
| Disease-specific Antigen Abundances |
|
Click to View the Clearer Original Diagram |
| Differential expression pattern of antigen in diseases | ||
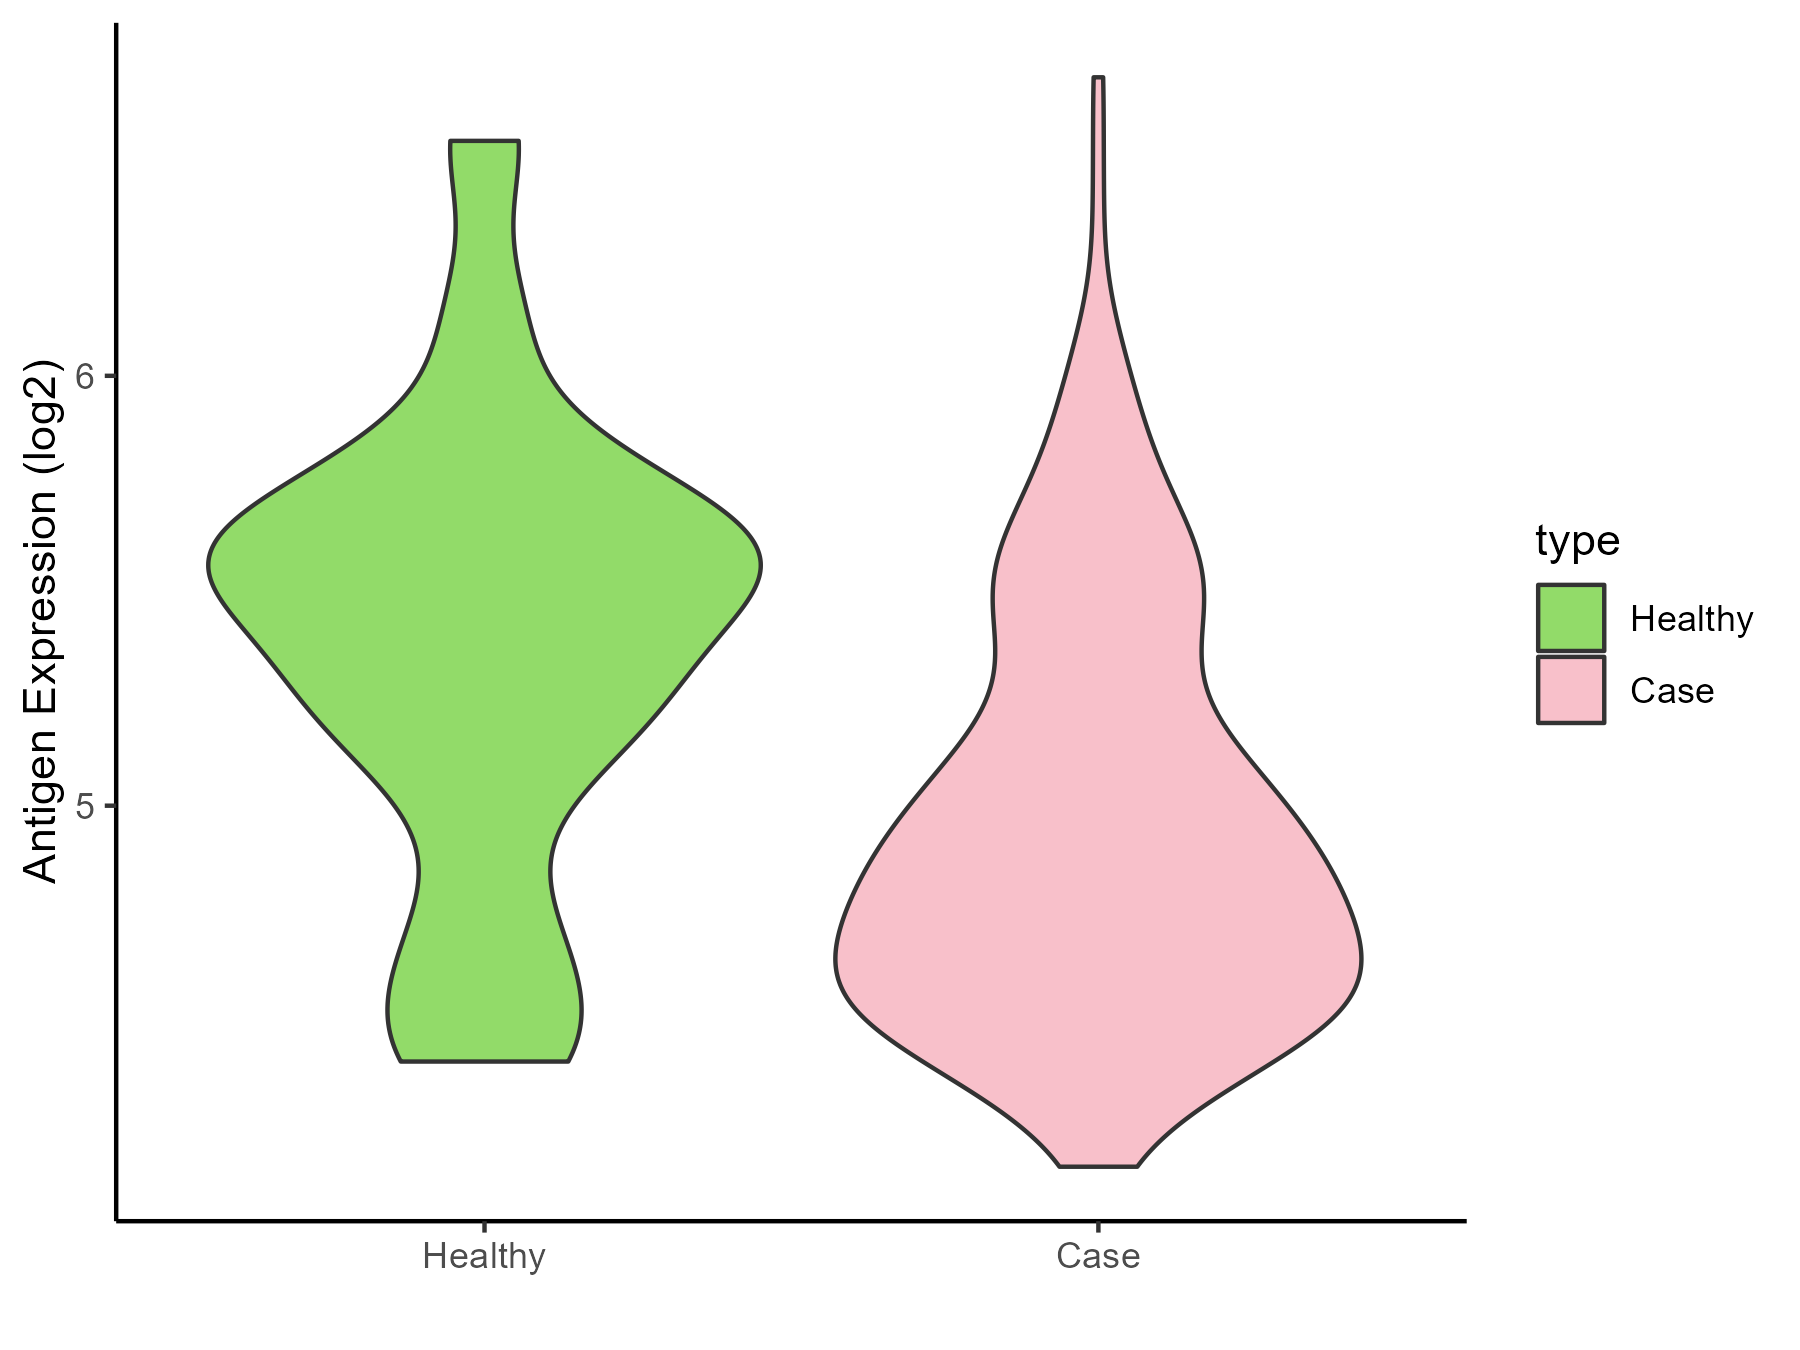
| The Studied Tissue | Prostate | |
| The Specific Disease | Prostate cancer | |
| The Expression Level of Disease Section Compare with the Healthy Individual Tissue | p-value: 0.001913081; Fold-change: -0.641377541; Z-score: -1.203004984 | |
| Disease-specific Antigen Abundances |
|
Click to View the Clearer Original Diagram |
| Differential expression pattern of antigen in diseases | ||
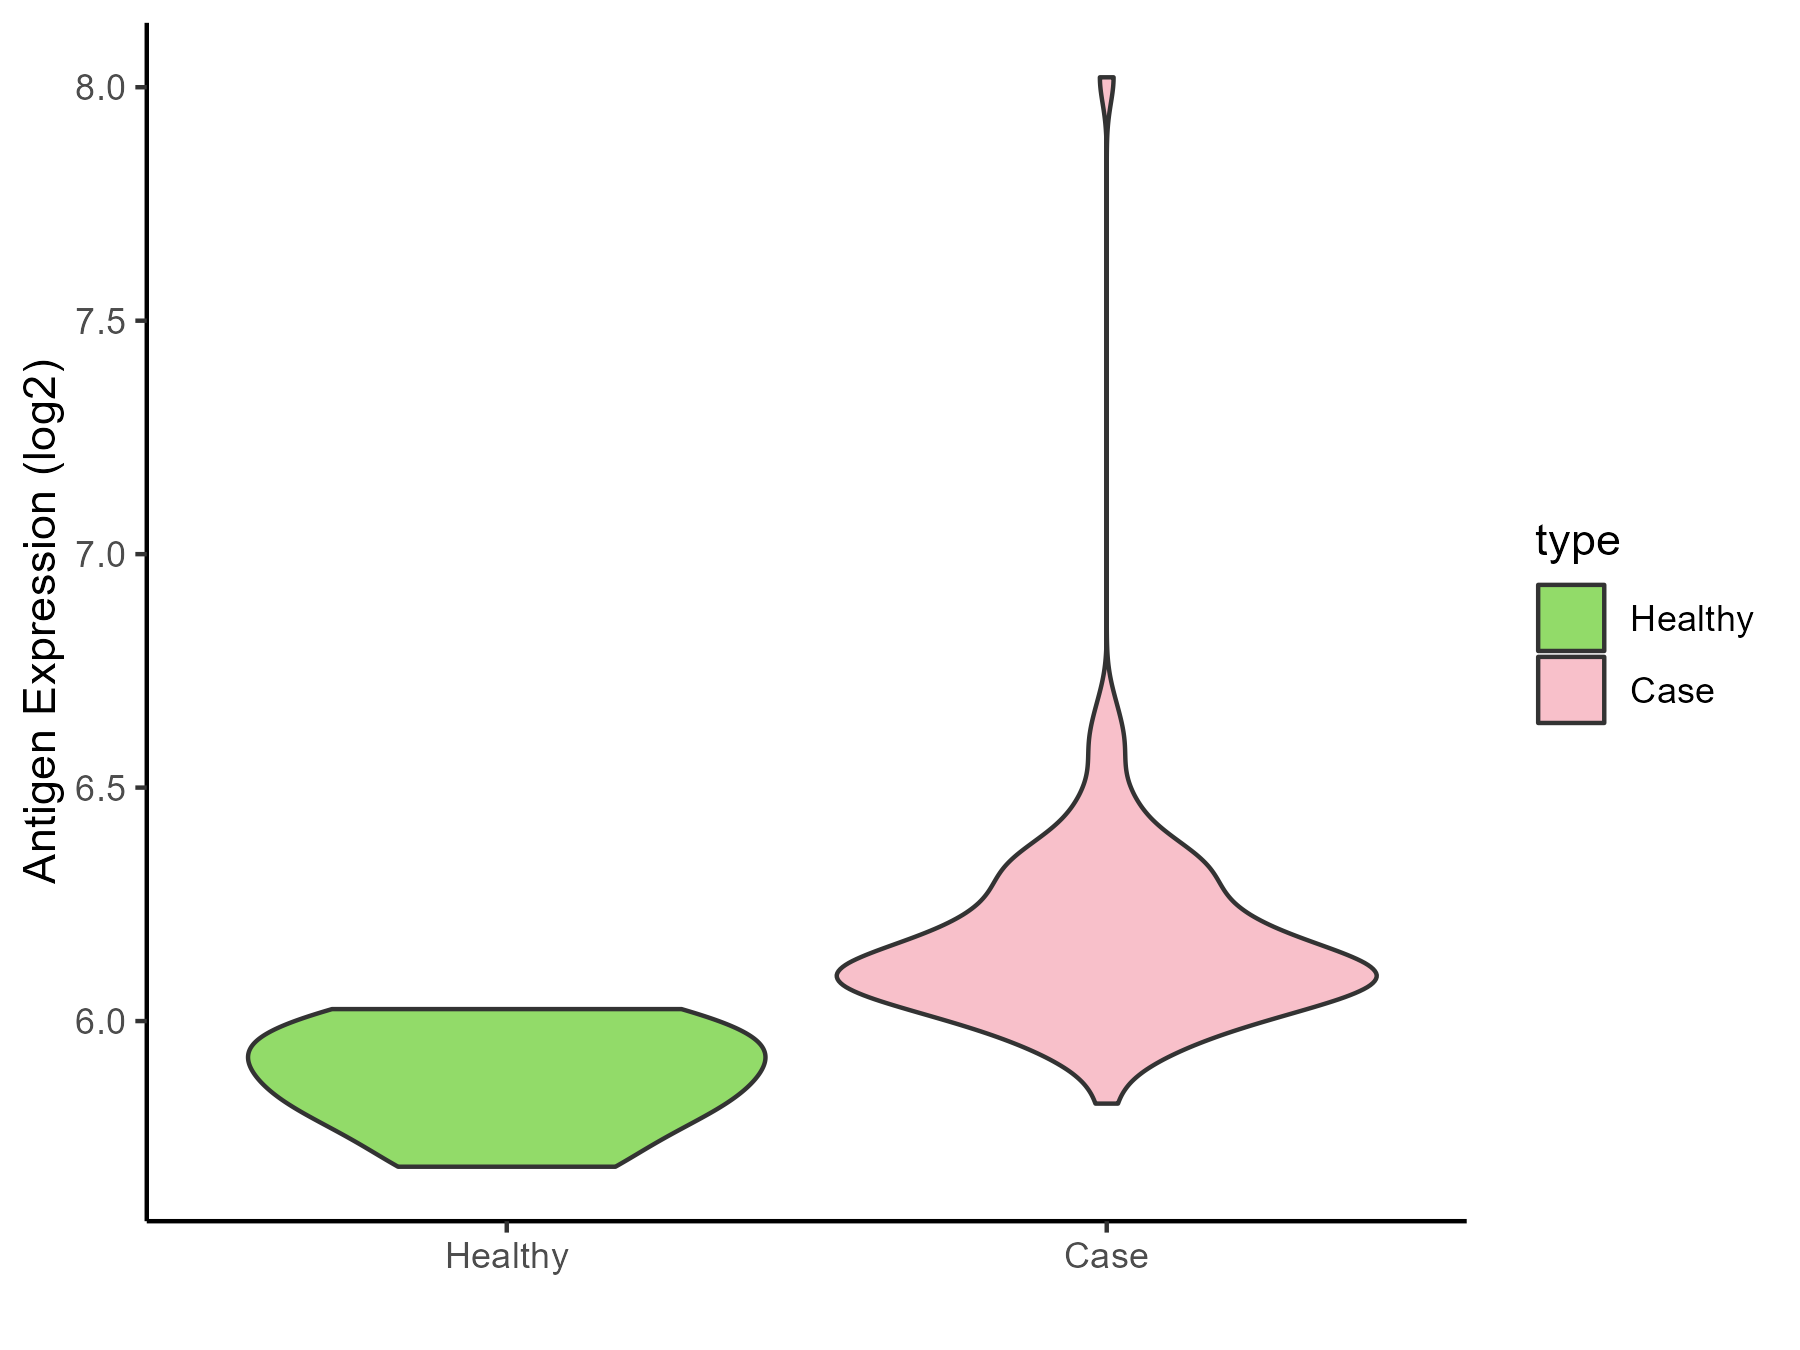
| The Studied Tissue | Bladder | |
| The Specific Disease | Bladder cancer | |
| The Expression Level of Disease Section Compare with the Healthy Individual Tissue | p-value: 0.000100921; Fold-change: 0.234361142; Z-score: 2.011116301 | |
| Disease-specific Antigen Abundances |
|
Click to View the Clearer Original Diagram |
| Differential expression pattern of antigen in diseases | ||
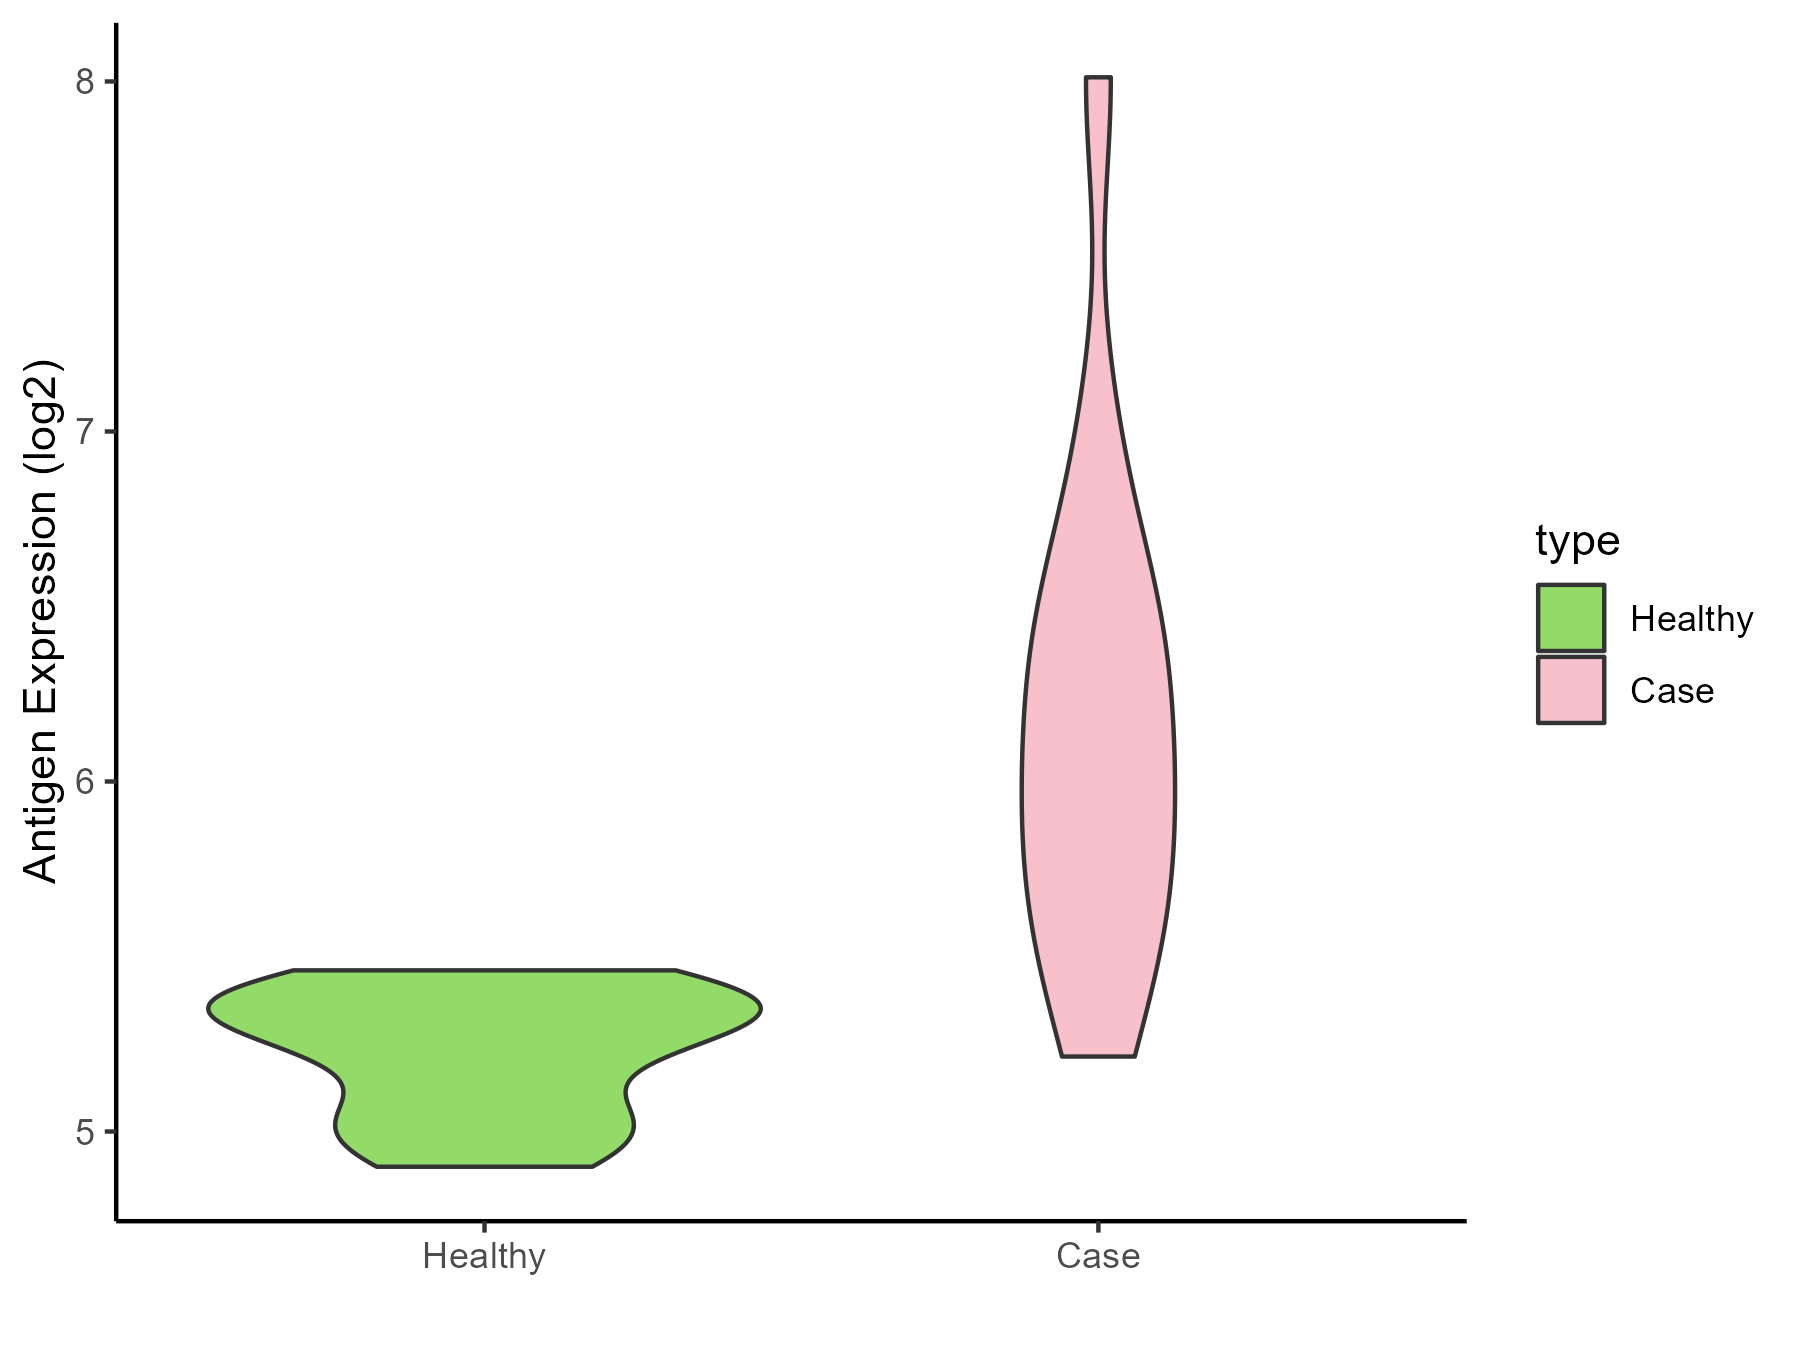
| The Studied Tissue | Uvea | |
| The Specific Disease | Retinoblastoma tumor | |
| The Expression Level of Disease Section Compare with the Healthy Individual Tissue | p-value: 0.000268279; Fold-change: 0.785285111; Z-score: 4.132758068 | |
| Disease-specific Antigen Abundances |
|
Click to View the Clearer Original Diagram |
| Differential expression pattern of antigen in diseases | ||
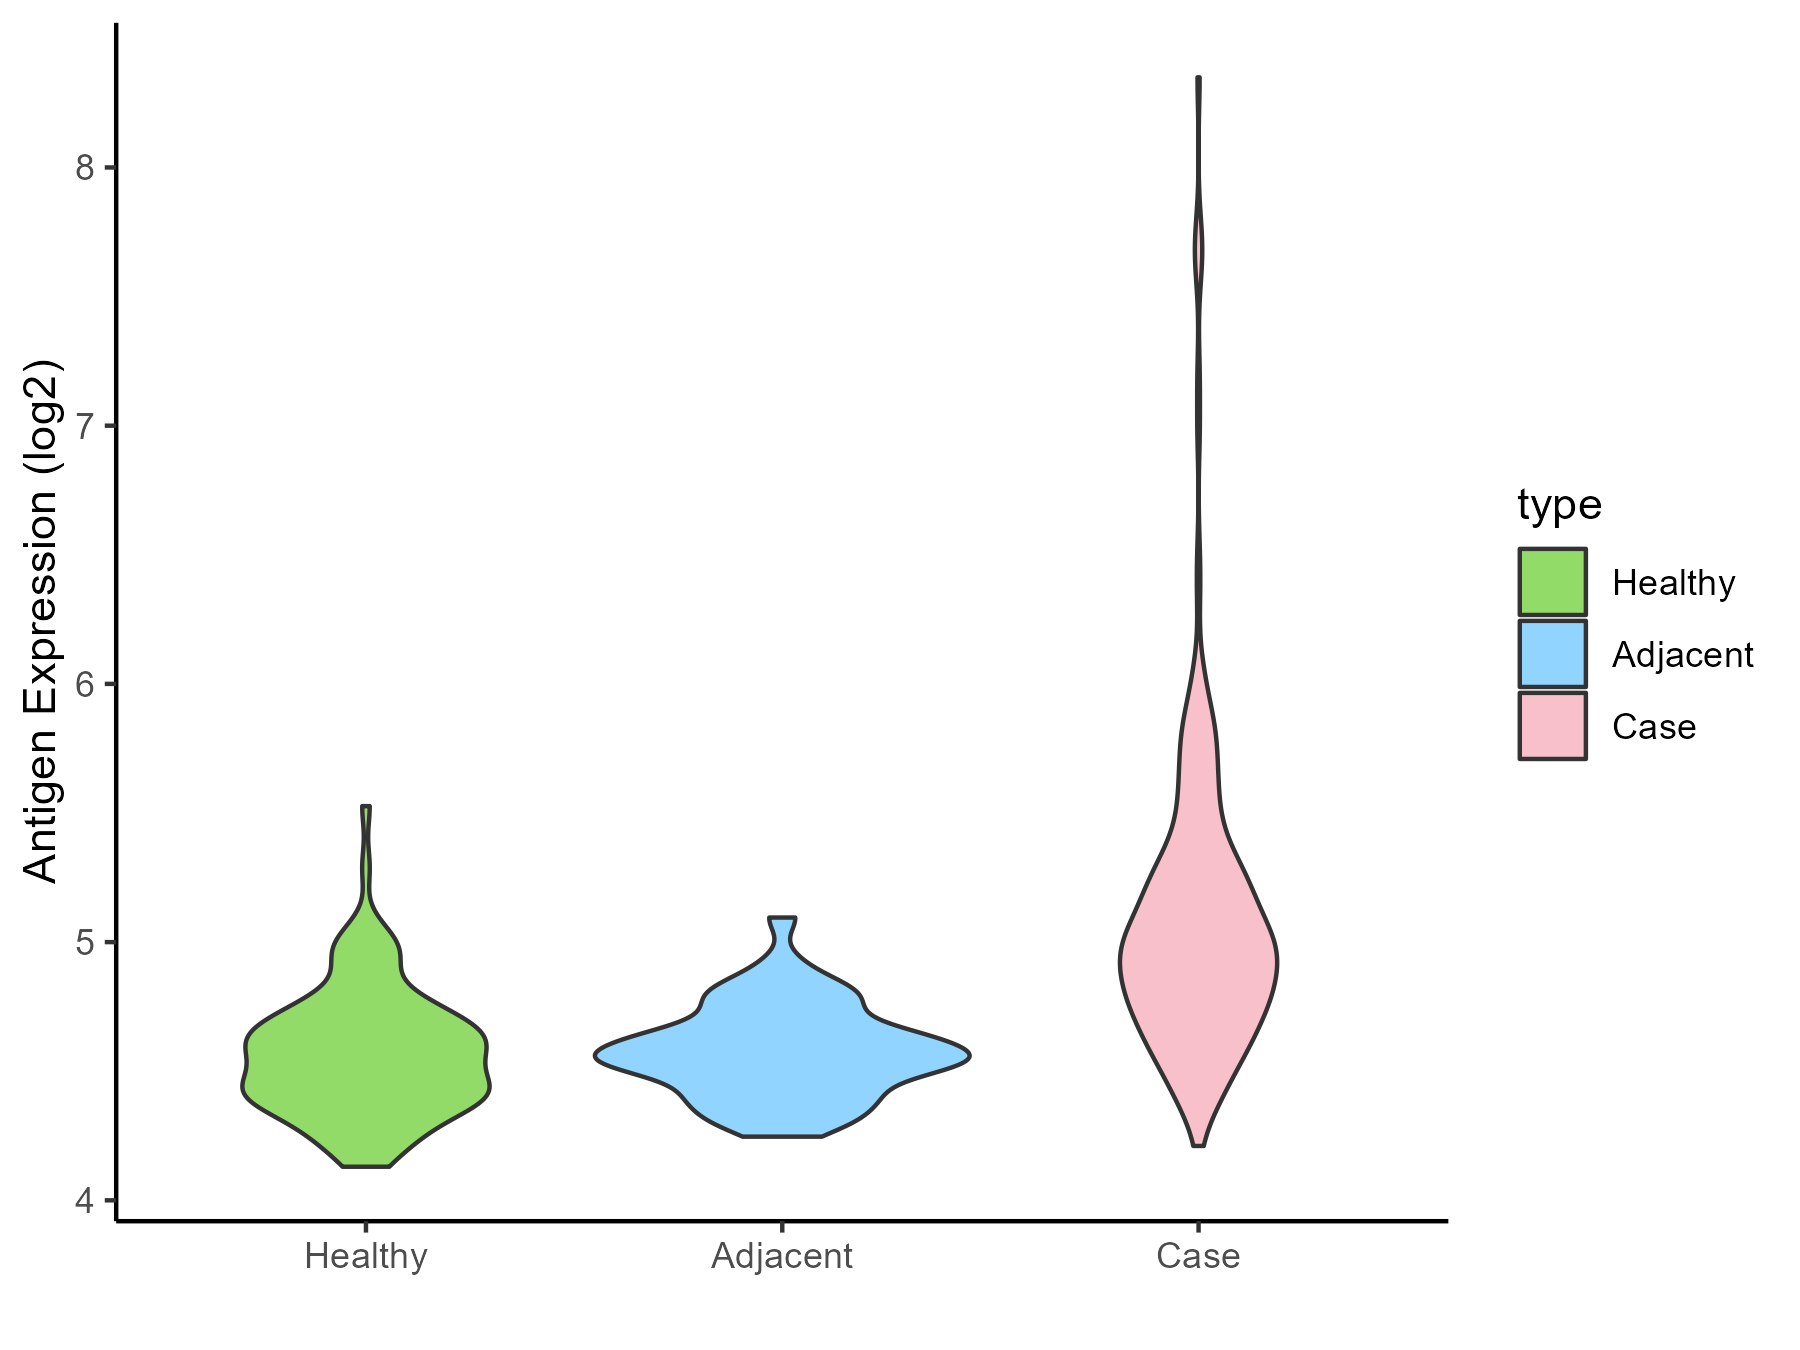
| The Studied Tissue | Thyroid | |
| The Specific Disease | Thyroid cancer | |
| The Expression Level of Disease Section Compare with the Healthy Individual Tissue | p-value: 1.44E-28; Fold-change: 0.428109465; Z-score: 1.754313028 | |
| The Expression Level of Disease Section Compare with the Adjacent Tissue | p-value: 7.53E-23; Fold-change: 0.421565154; Z-score: 2.31720548 | |
| Disease-specific Antigen Abundances |
|
Click to View the Clearer Original Diagram |
| Differential expression pattern of antigen in diseases | ||
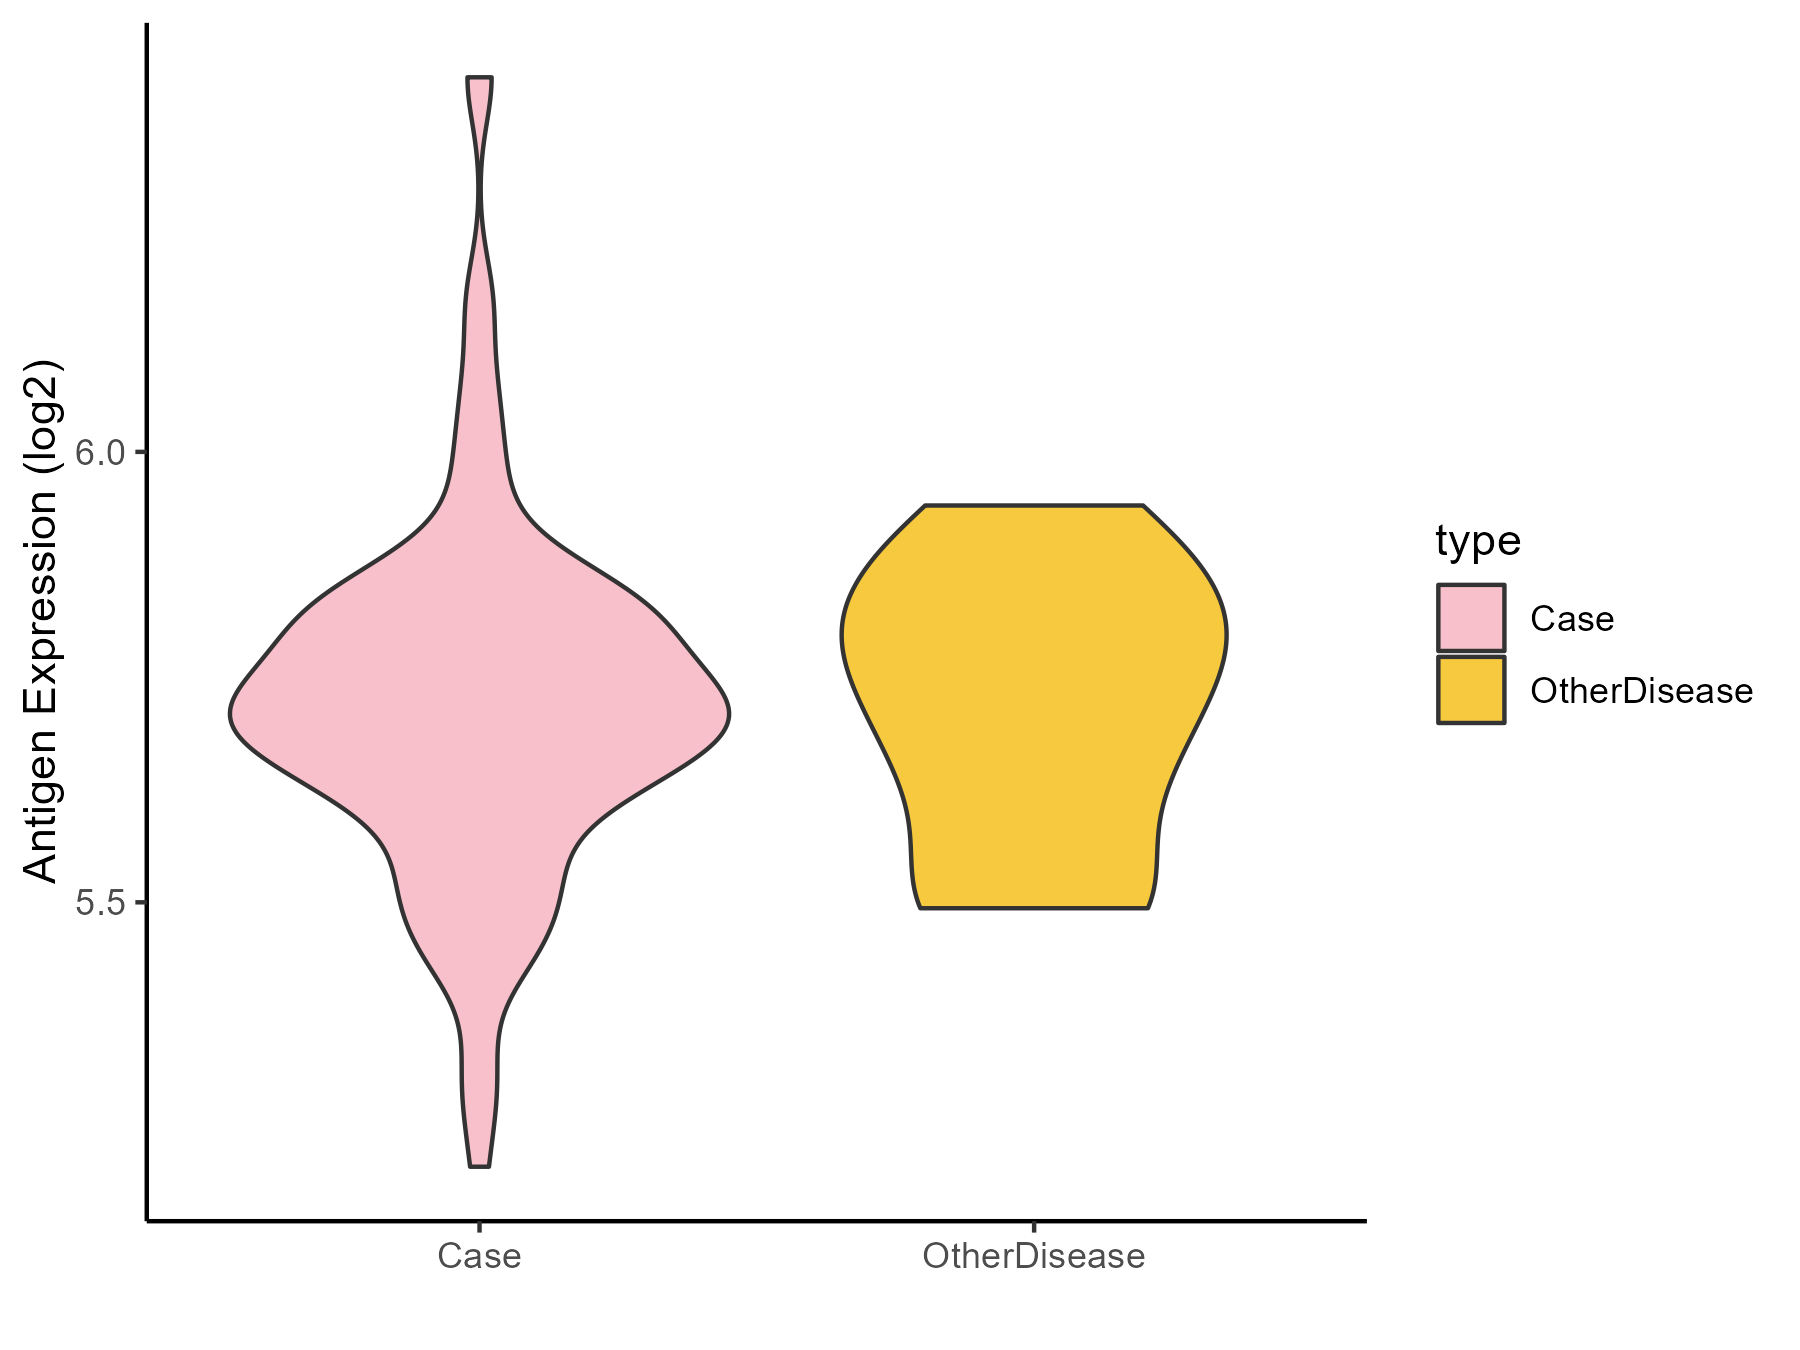
| The Studied Tissue | Adrenal cortex | |
| The Specific Disease | Adrenocortical carcinoma | |
| The Expression Level of Disease Section Compare with the Other Disease Section | p-value: 0.984297853; Fold-change: -0.043479269; Z-score: -0.282275638 | |
| Disease-specific Antigen Abundances |
|
Click to View the Clearer Original Diagram |
| Differential expression pattern of antigen in diseases | ||
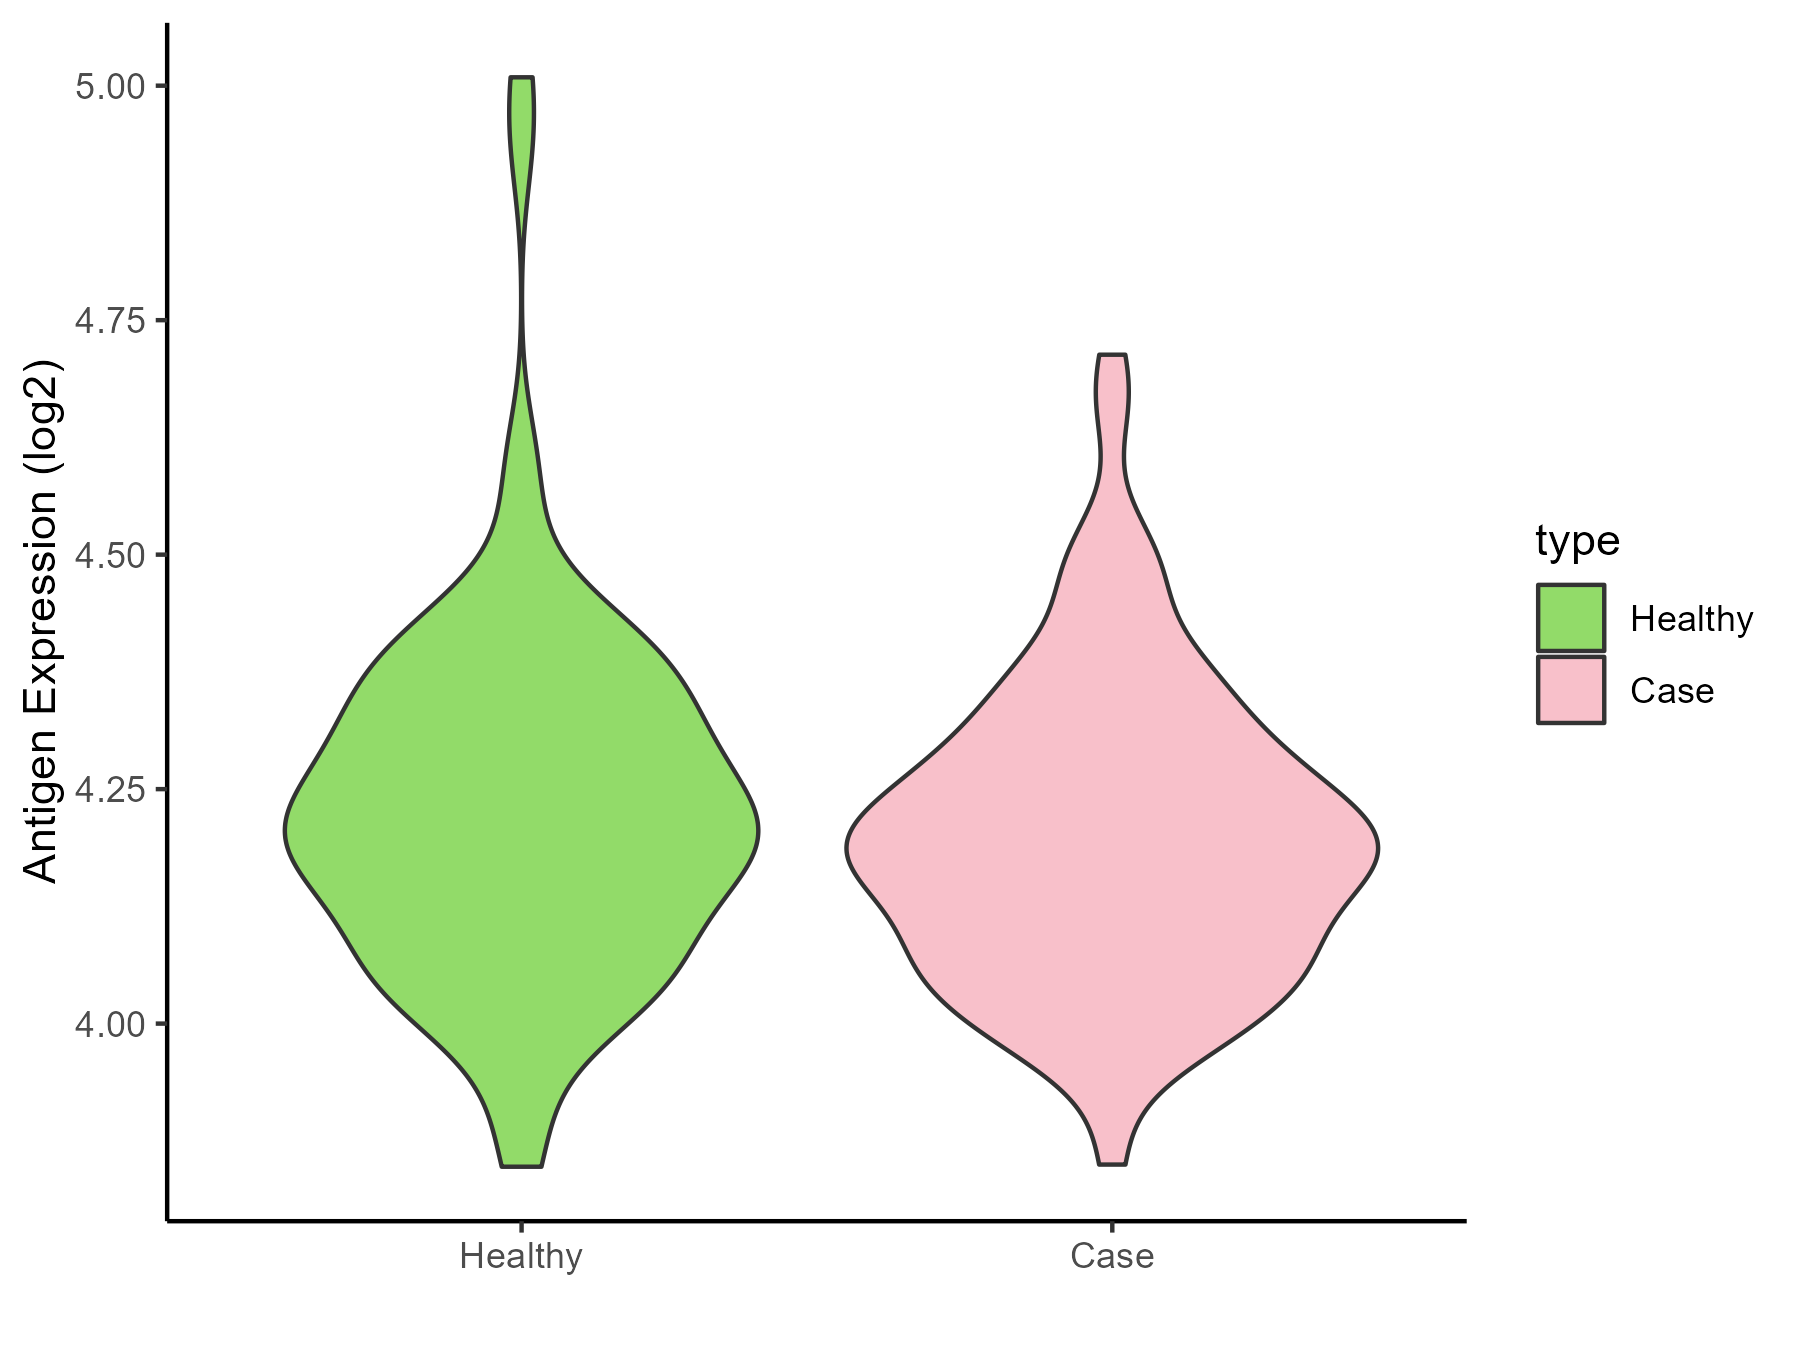
| The Studied Tissue | Head and neck | |
| The Specific Disease | Head and neck cancer | |
| The Expression Level of Disease Section Compare with the Healthy Individual Tissue | p-value: 0.158228741; Fold-change: -0.021880376; Z-score: -0.116219223 | |
| Disease-specific Antigen Abundances |
|
Click to View the Clearer Original Diagram |
| Differential expression pattern of antigen in diseases | ||
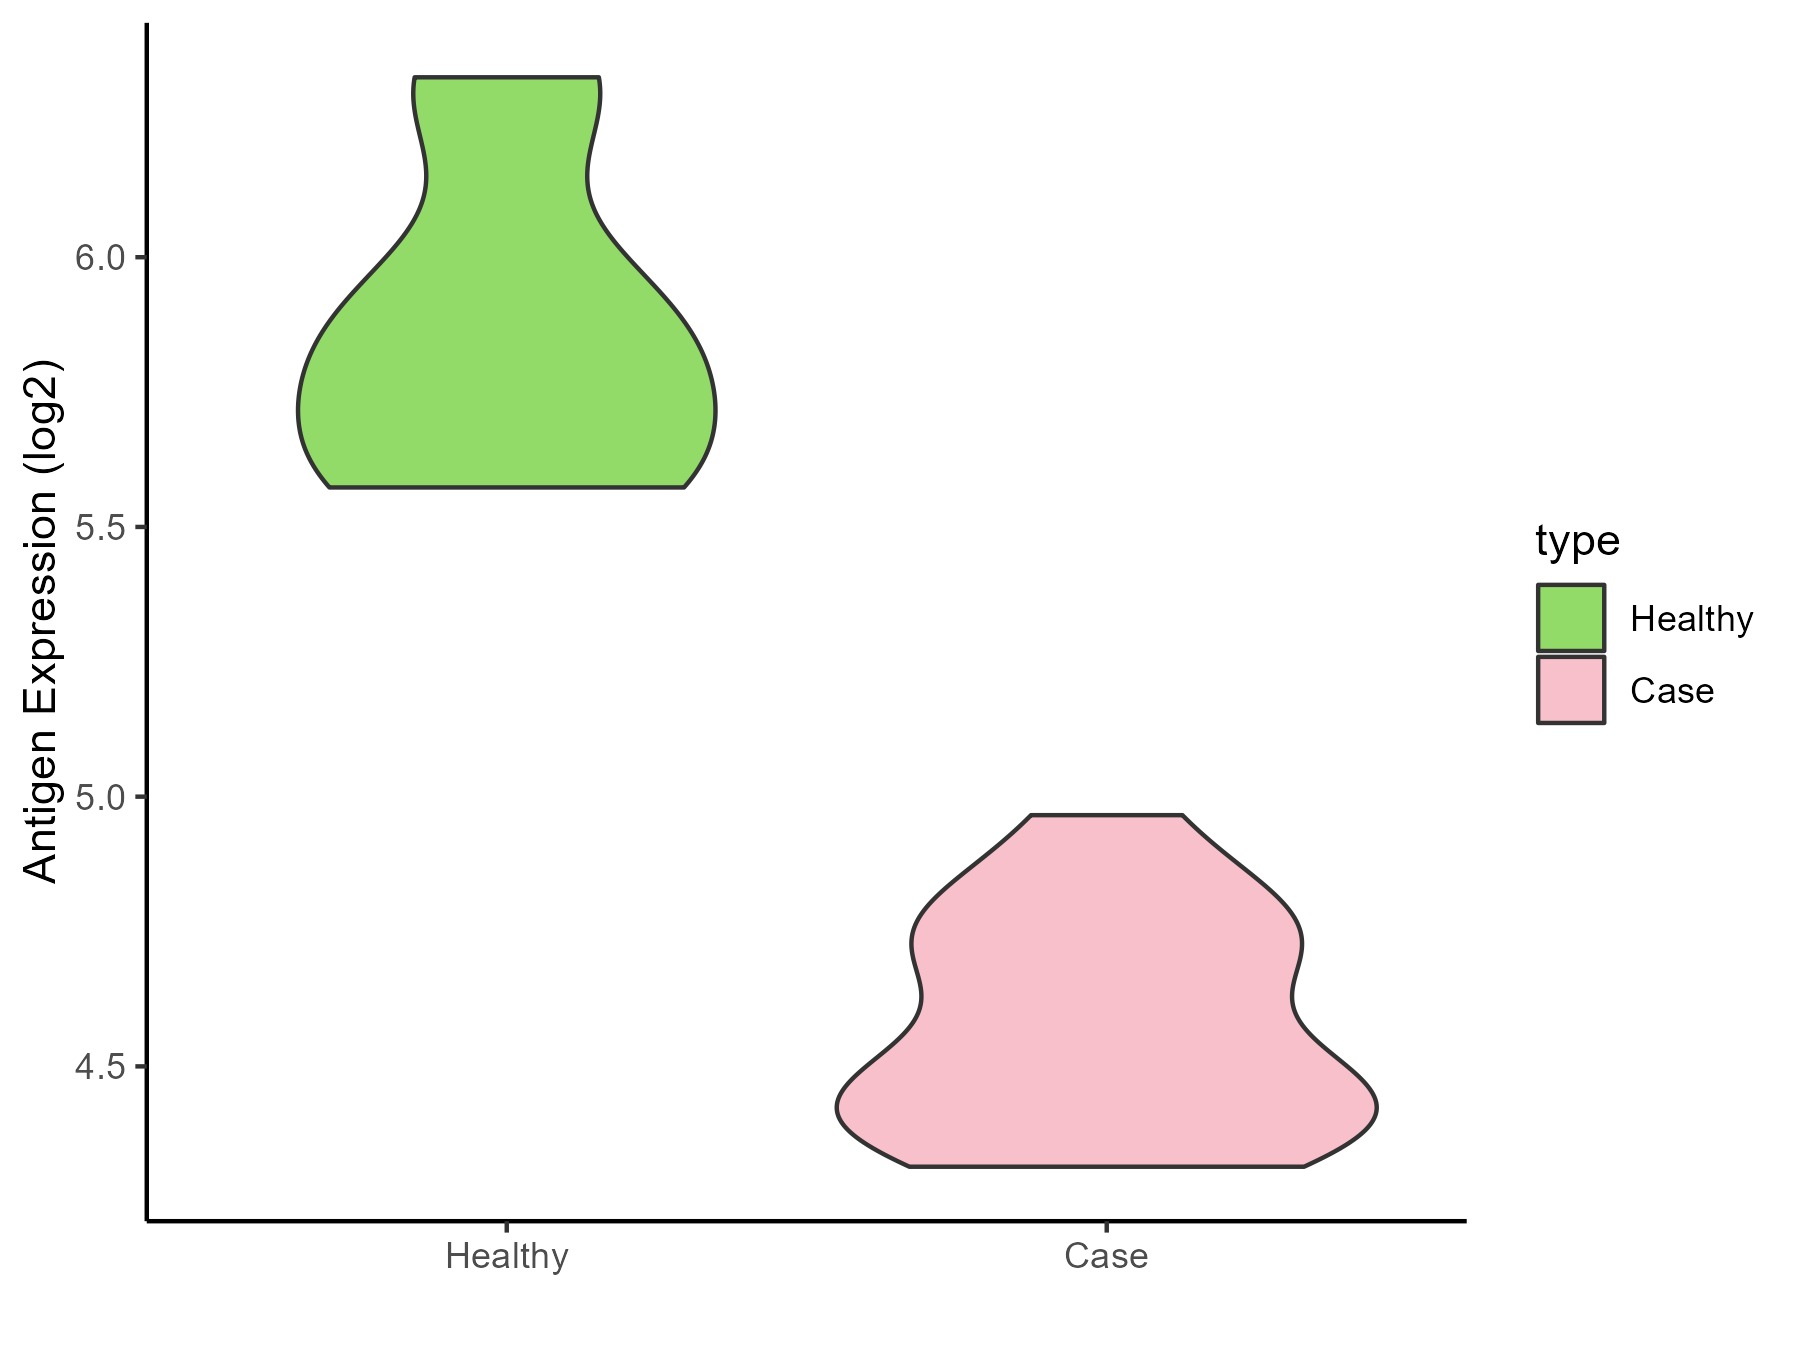
| The Studied Tissue | Pituitary | |
| The Specific Disease | Pituitary gonadotrope tumor | |
| The Expression Level of Disease Section Compare with the Healthy Individual Tissue | p-value: 2.90E-08; Fold-change: -1.312667018; Z-score: -4.510304003 | |
| Disease-specific Antigen Abundances |
|
Click to View the Clearer Original Diagram |
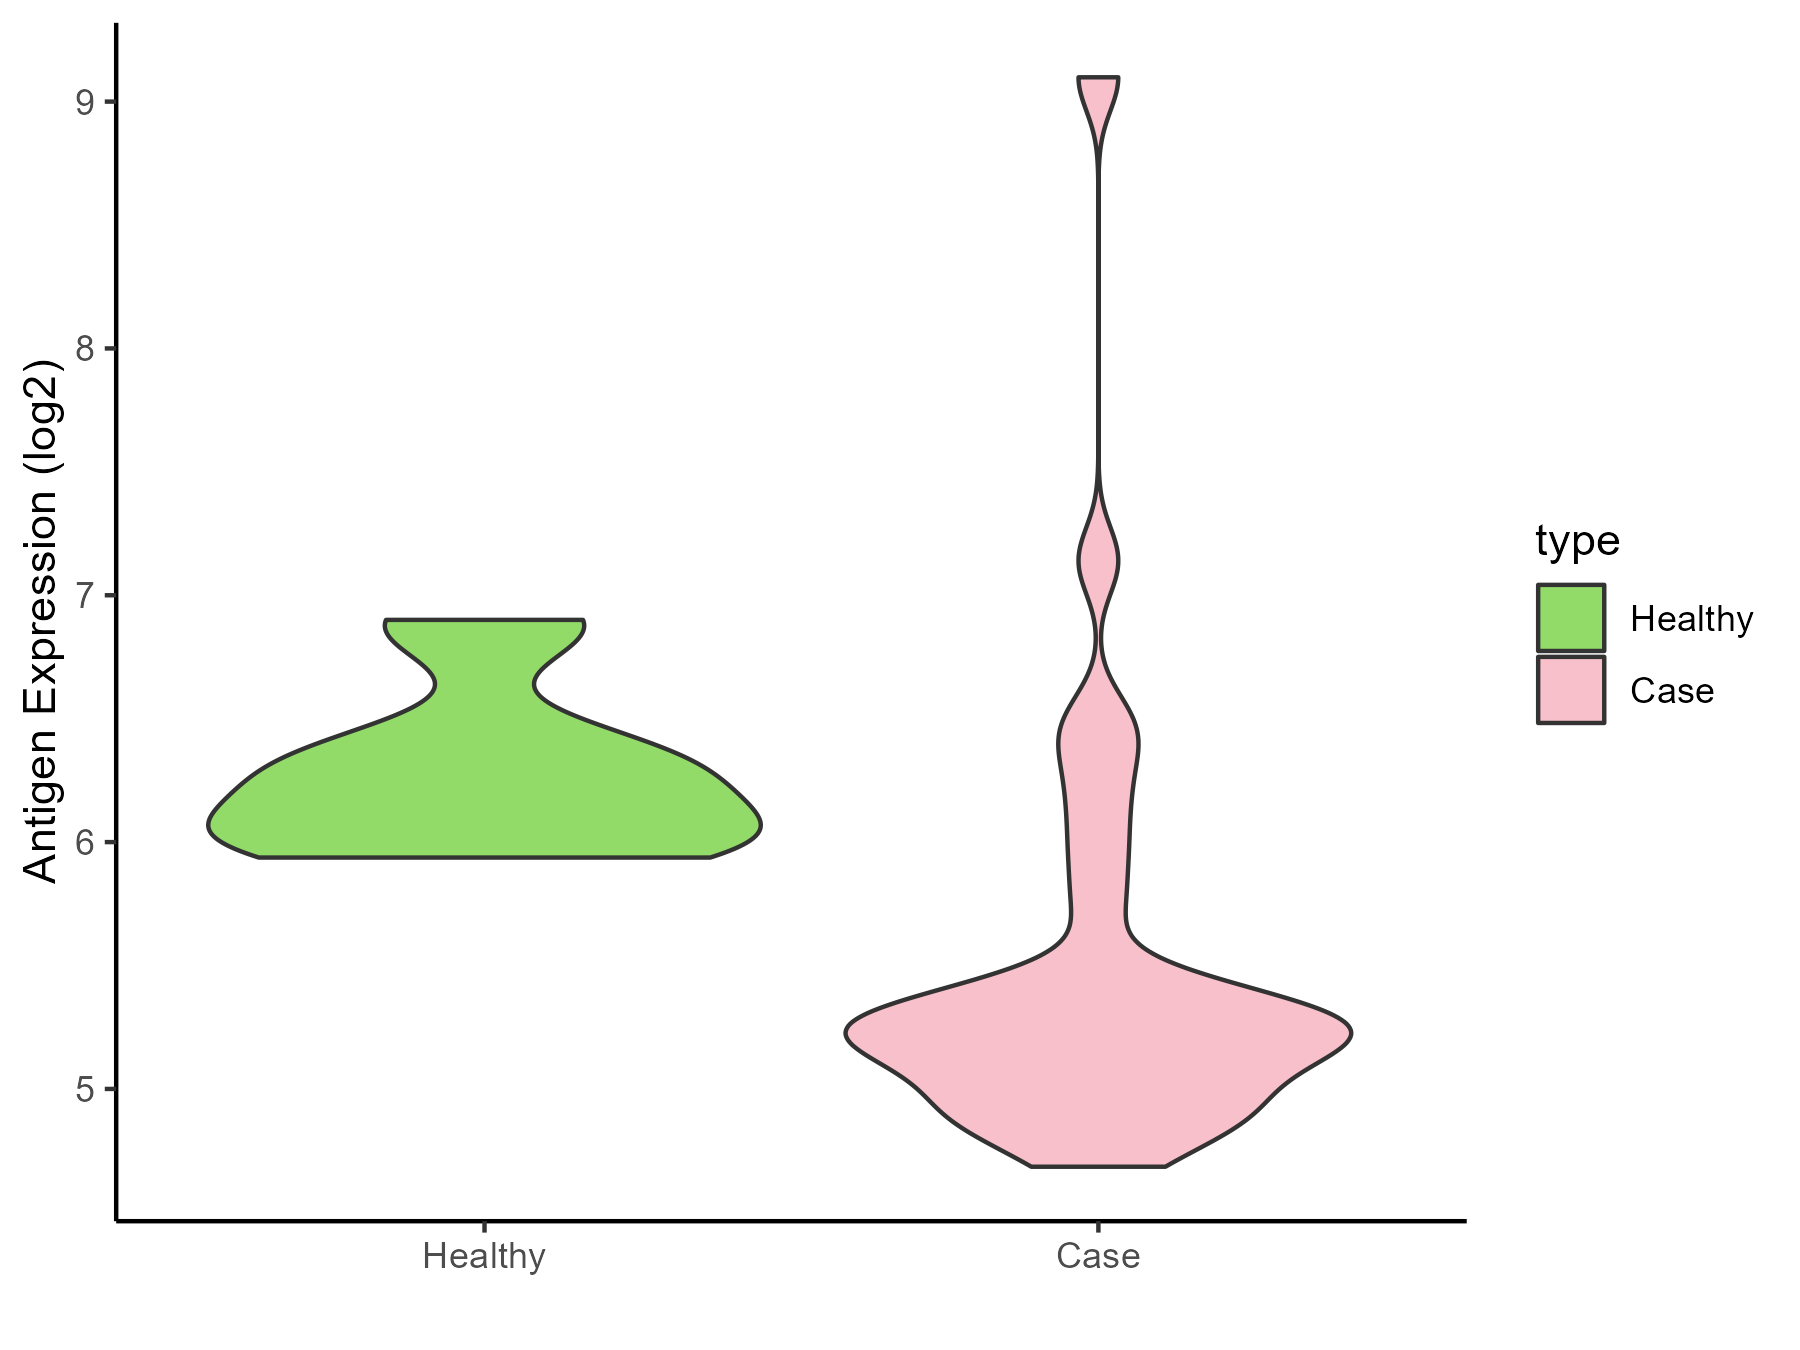
| The Studied Tissue | Pituitary | |
| The Specific Disease | Pituitary cancer | |
| The Expression Level of Disease Section Compare with the Healthy Individual Tissue | p-value: 0.000184056; Fold-change: -0.970347004; Z-score: -2.889520278 | |
| Disease-specific Antigen Abundances |
|
Click to View the Clearer Original Diagram |
ICD Disease Classification 03
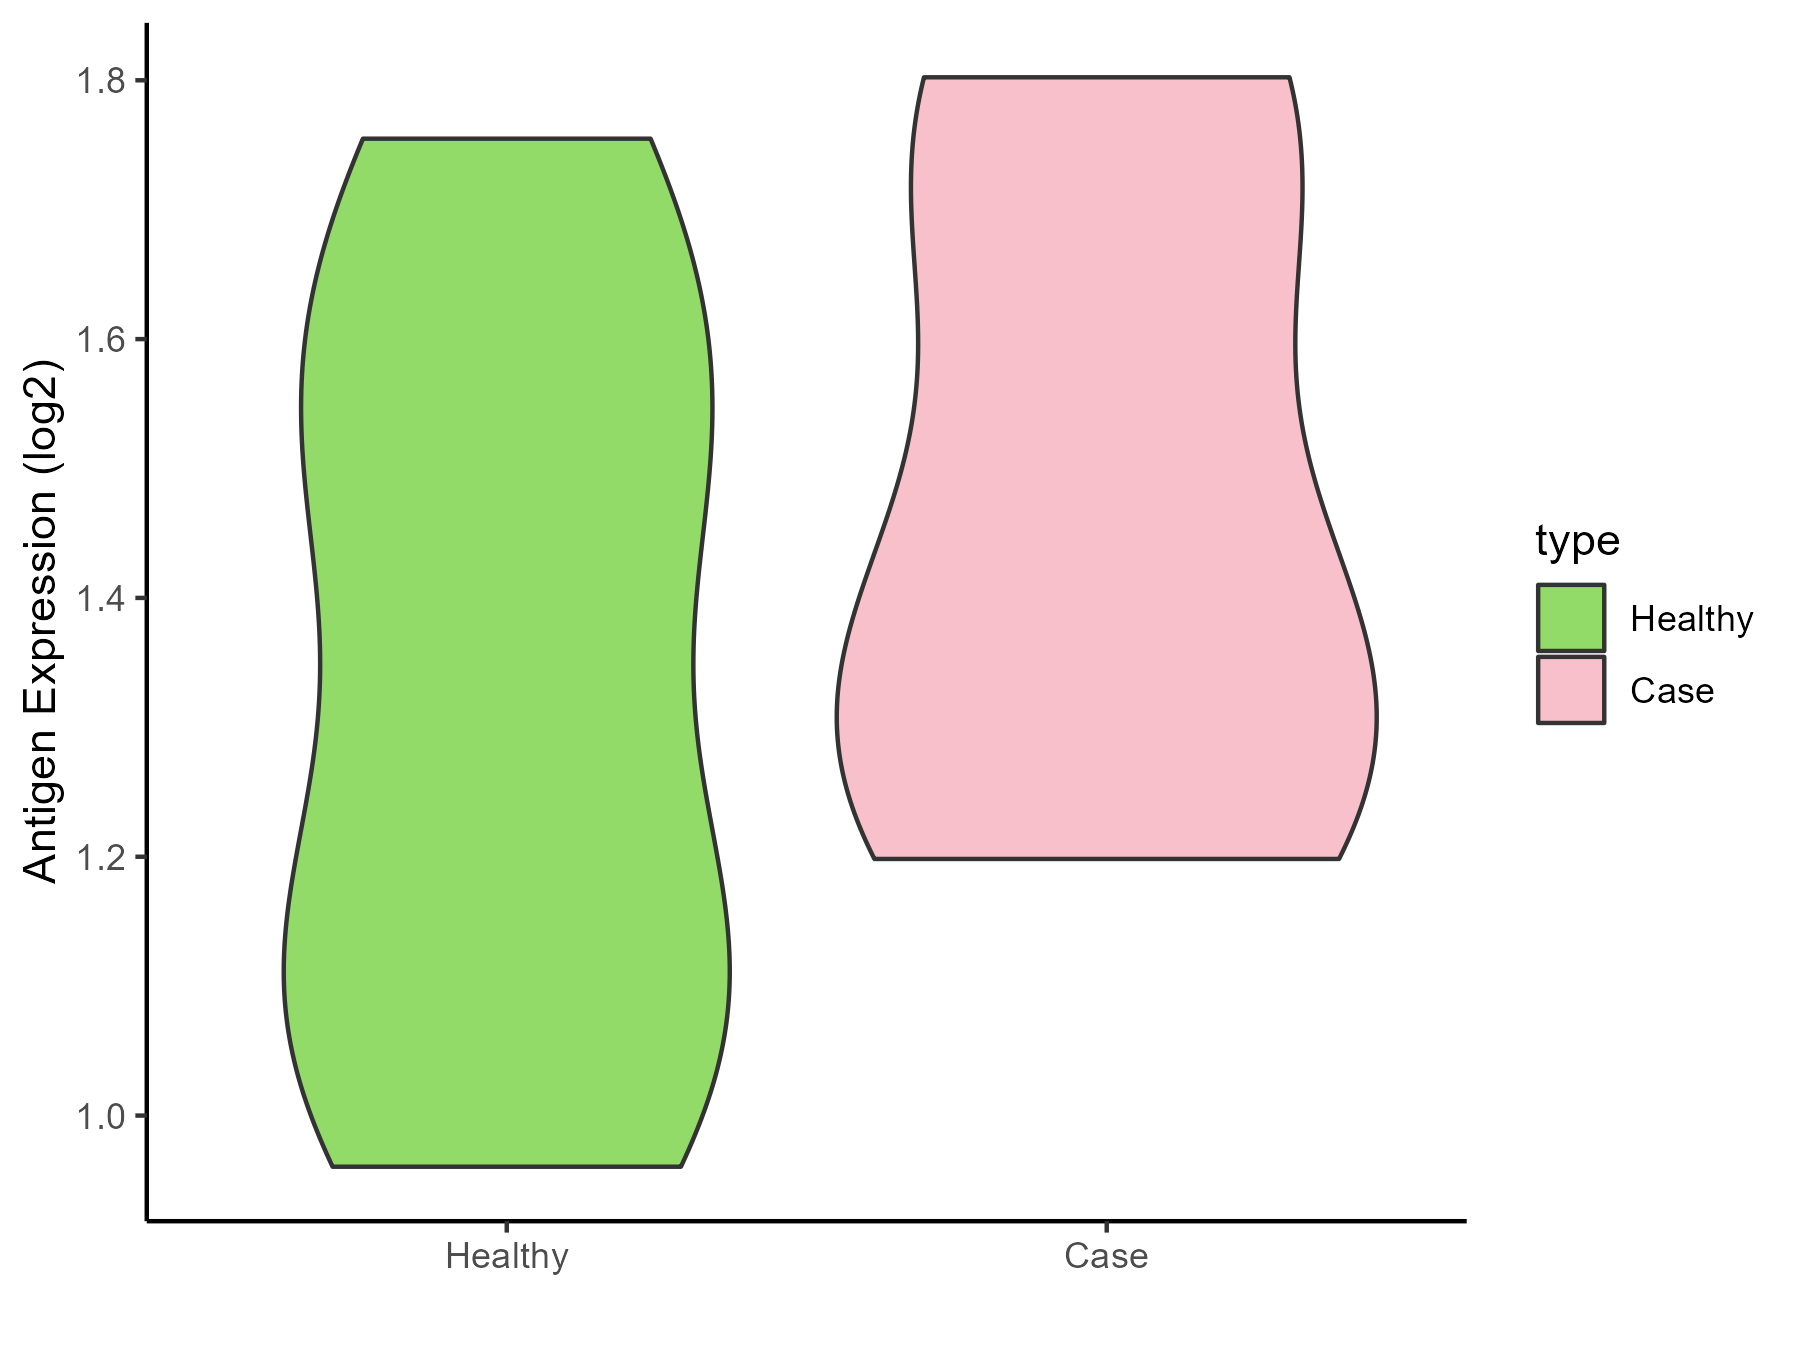
| Differential expression pattern of antigen in diseases | ||
| The Studied Tissue | Whole blood | |
| The Specific Disease | Thrombocytopenia | |
| The Expression Level of Disease Section Compare with the Healthy Individual Tissue | p-value: 0.373166973; Fold-change: 0.015671235; Z-score: 0.054503219 | |
| Disease-specific Antigen Abundances |
|
Click to View the Clearer Original Diagram |
ICD Disease Classification 04
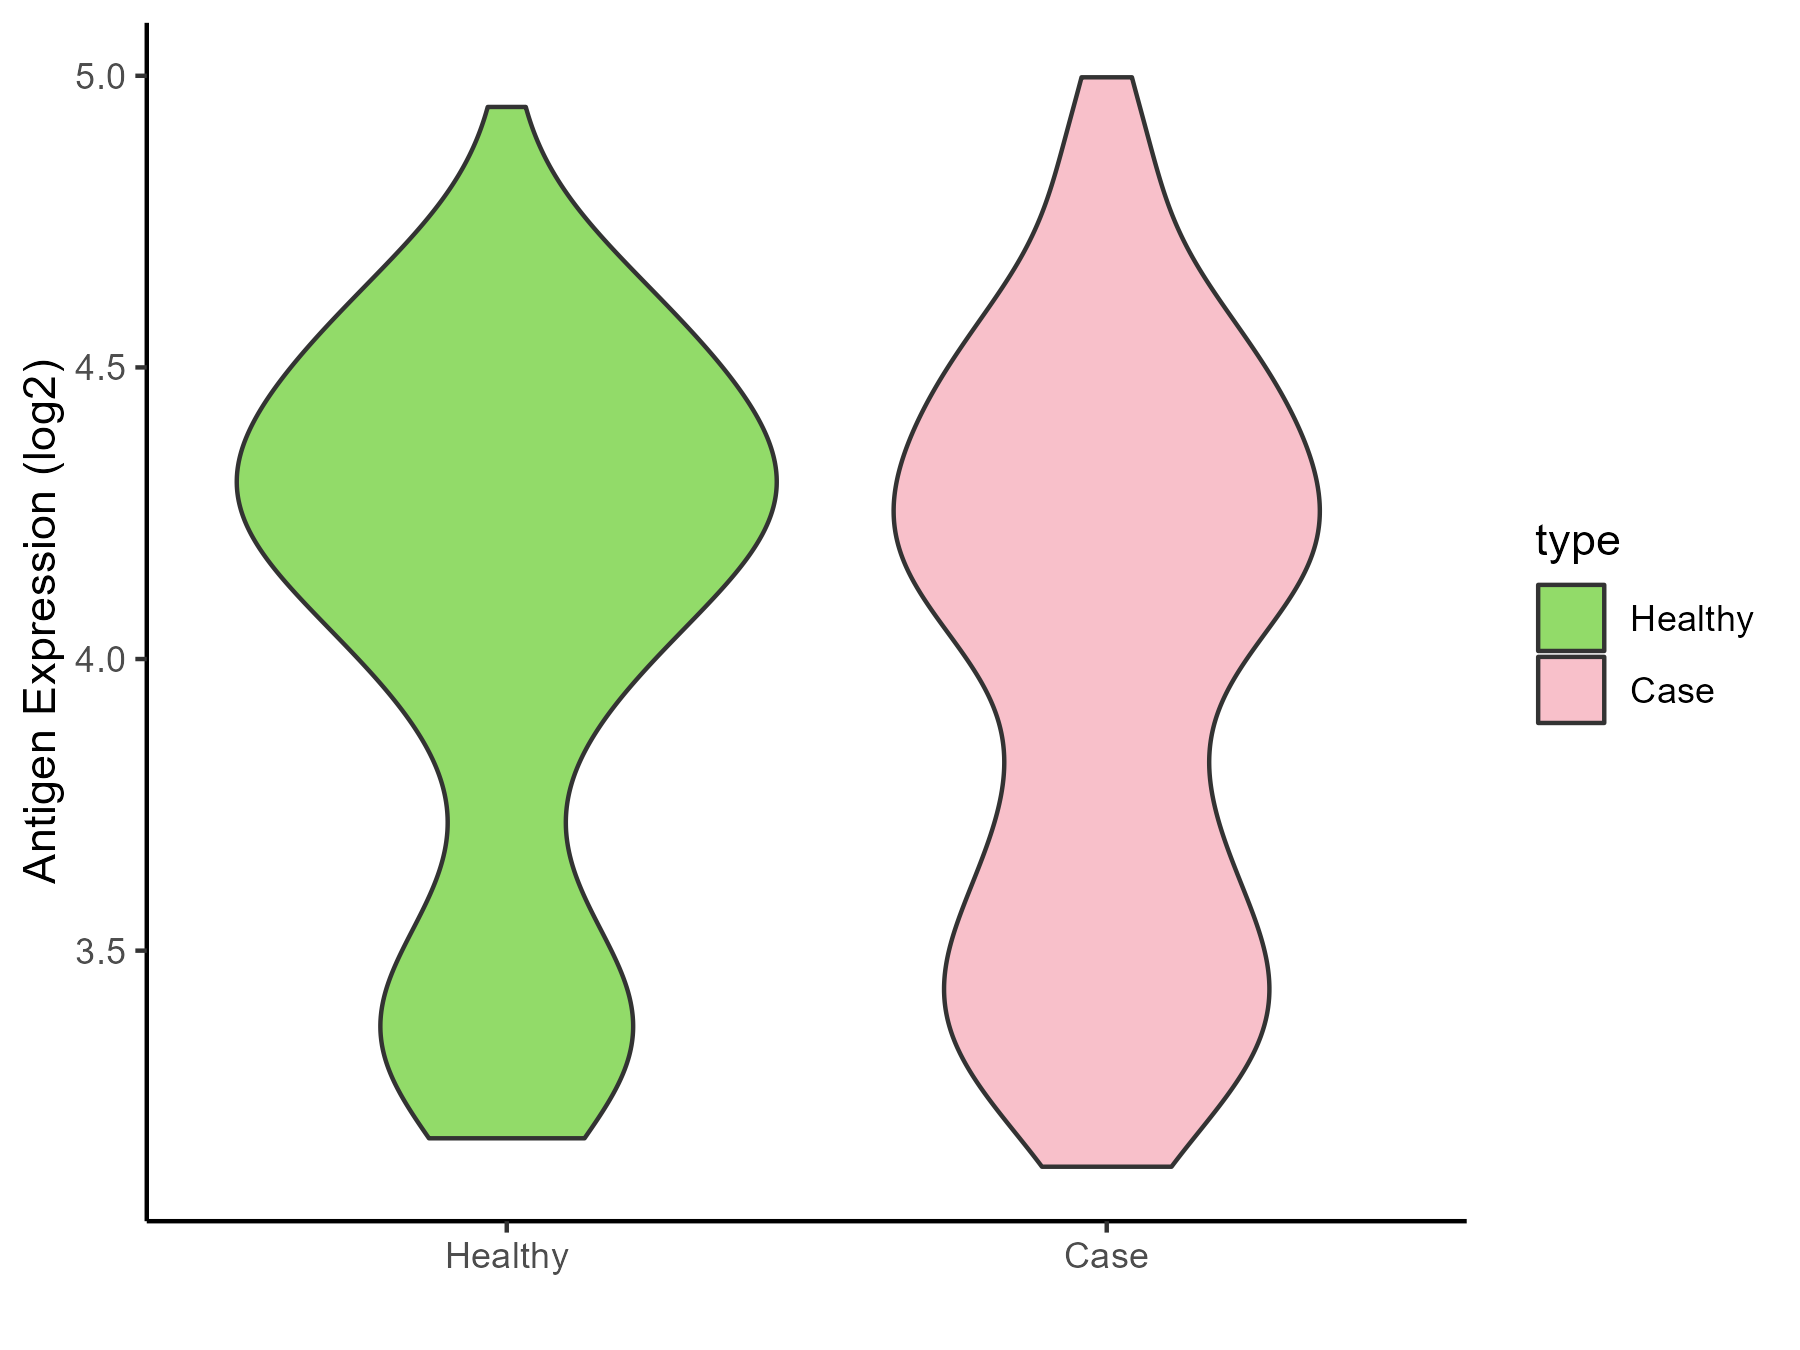
| Differential expression pattern of antigen in diseases | ||
| The Studied Tissue | Whole blood | |
| The Specific Disease | Lupus erythematosus | |
| The Expression Level of Disease Section Compare with the Healthy Individual Tissue | p-value: 0.08923363; Fold-change: -0.113567564; Z-score: -0.25033156 | |
| Disease-specific Antigen Abundances |
|
Click to View the Clearer Original Diagram |
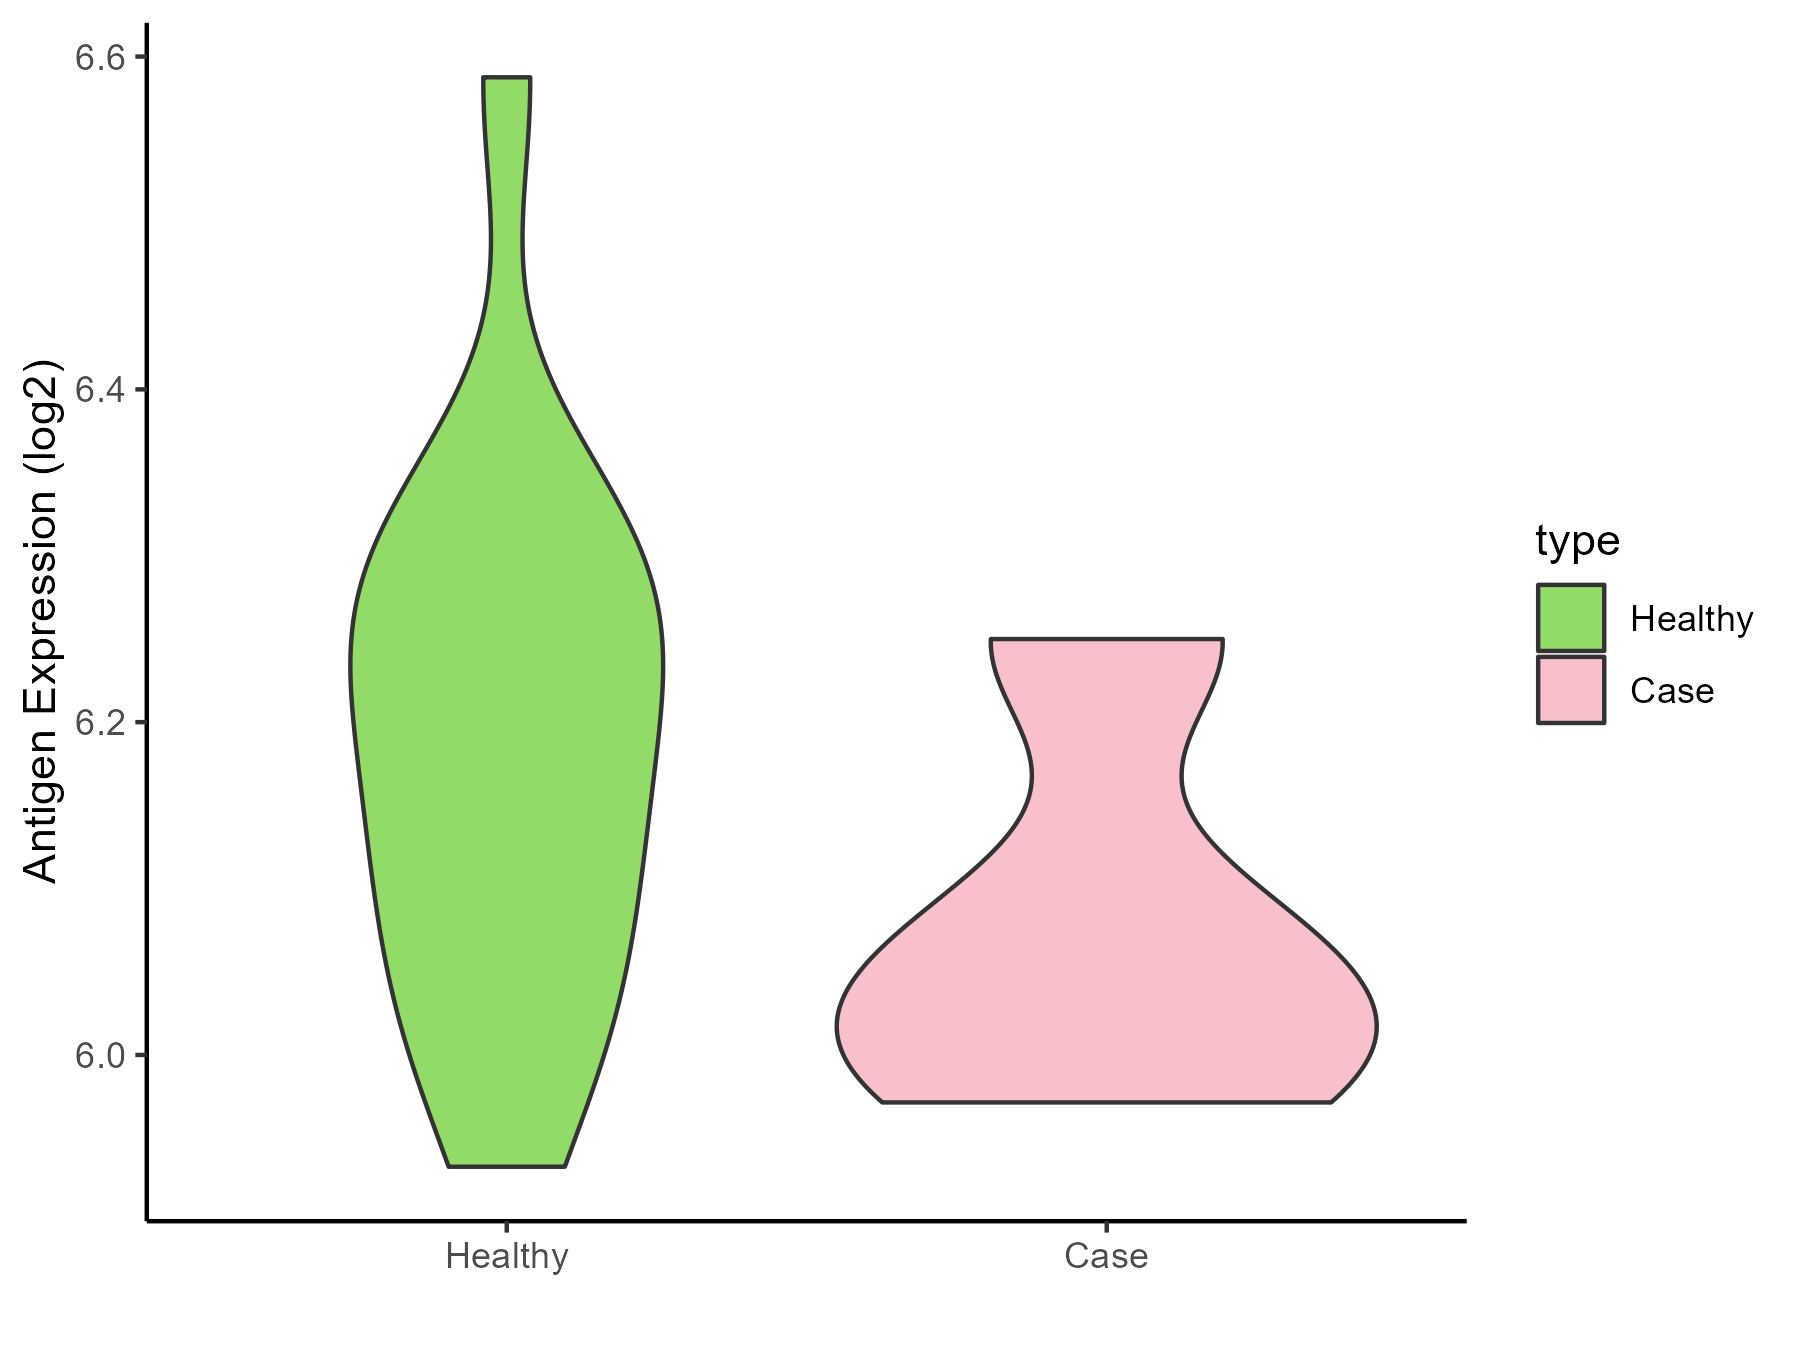
| Differential expression pattern of antigen in diseases | ||
| The Studied Tissue | Peripheral monocyte | |
| The Specific Disease | Autoimmune uveitis | |
| The Expression Level of Disease Section Compare with the Healthy Individual Tissue | p-value: 0.173135399; Fold-change: -0.156285684; Z-score: -0.956484233 | |
| Disease-specific Antigen Abundances |
|
Click to View the Clearer Original Diagram |
ICD Disease Classification 05
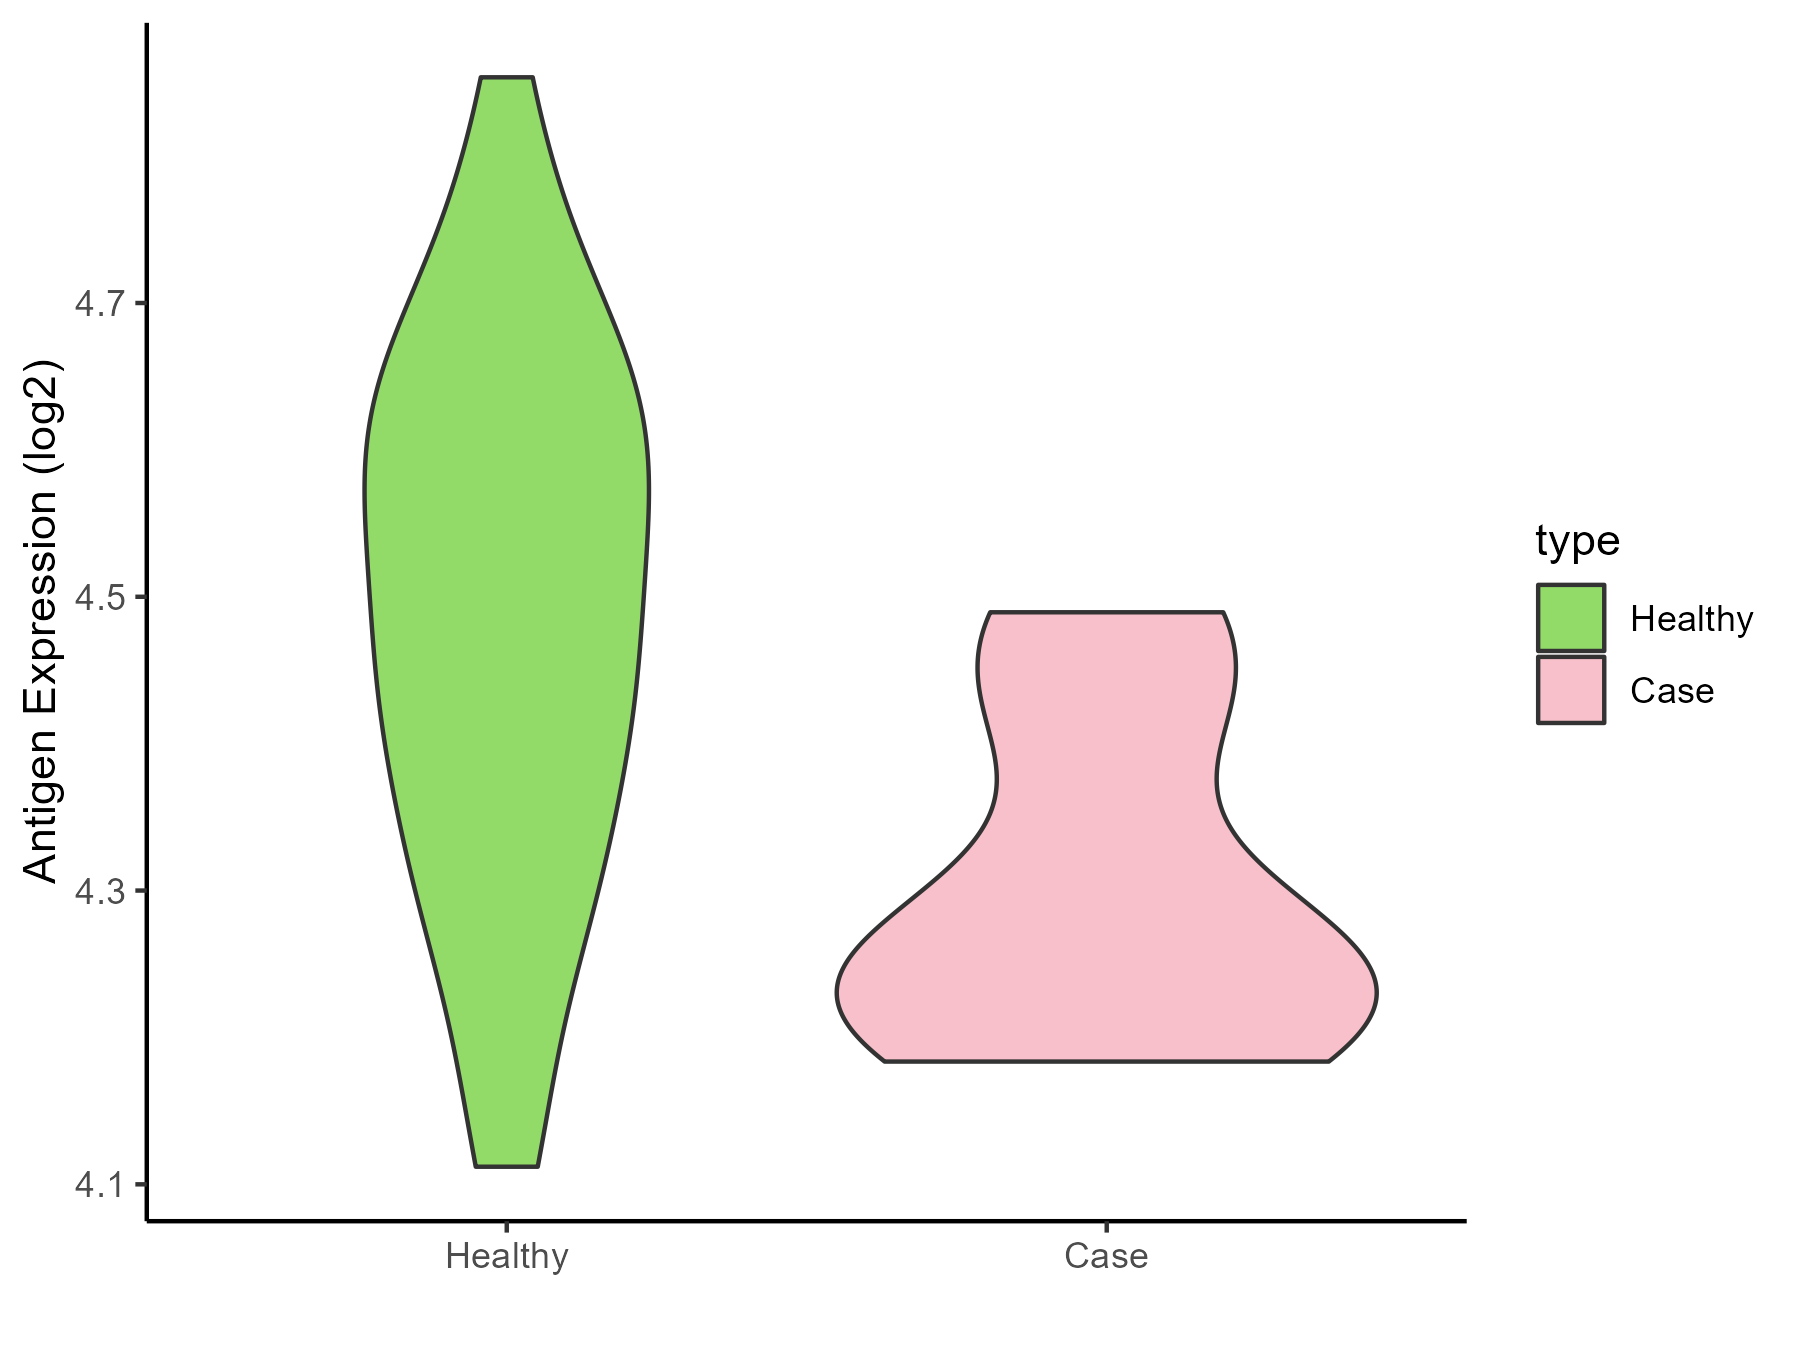
| Differential expression pattern of antigen in diseases | ||
| The Studied Tissue | Whole blood | |
| The Specific Disease | Familial hypercholesterolemia | |
| The Expression Level of Disease Section Compare with the Healthy Individual Tissue | p-value: 0.001014648; Fold-change: -0.264946435; Z-score: -1.466141652 | |
| Disease-specific Antigen Abundances |
|
Click to View the Clearer Original Diagram |
ICD Disease Classification 06
| Differential expression pattern of antigen in diseases | ||
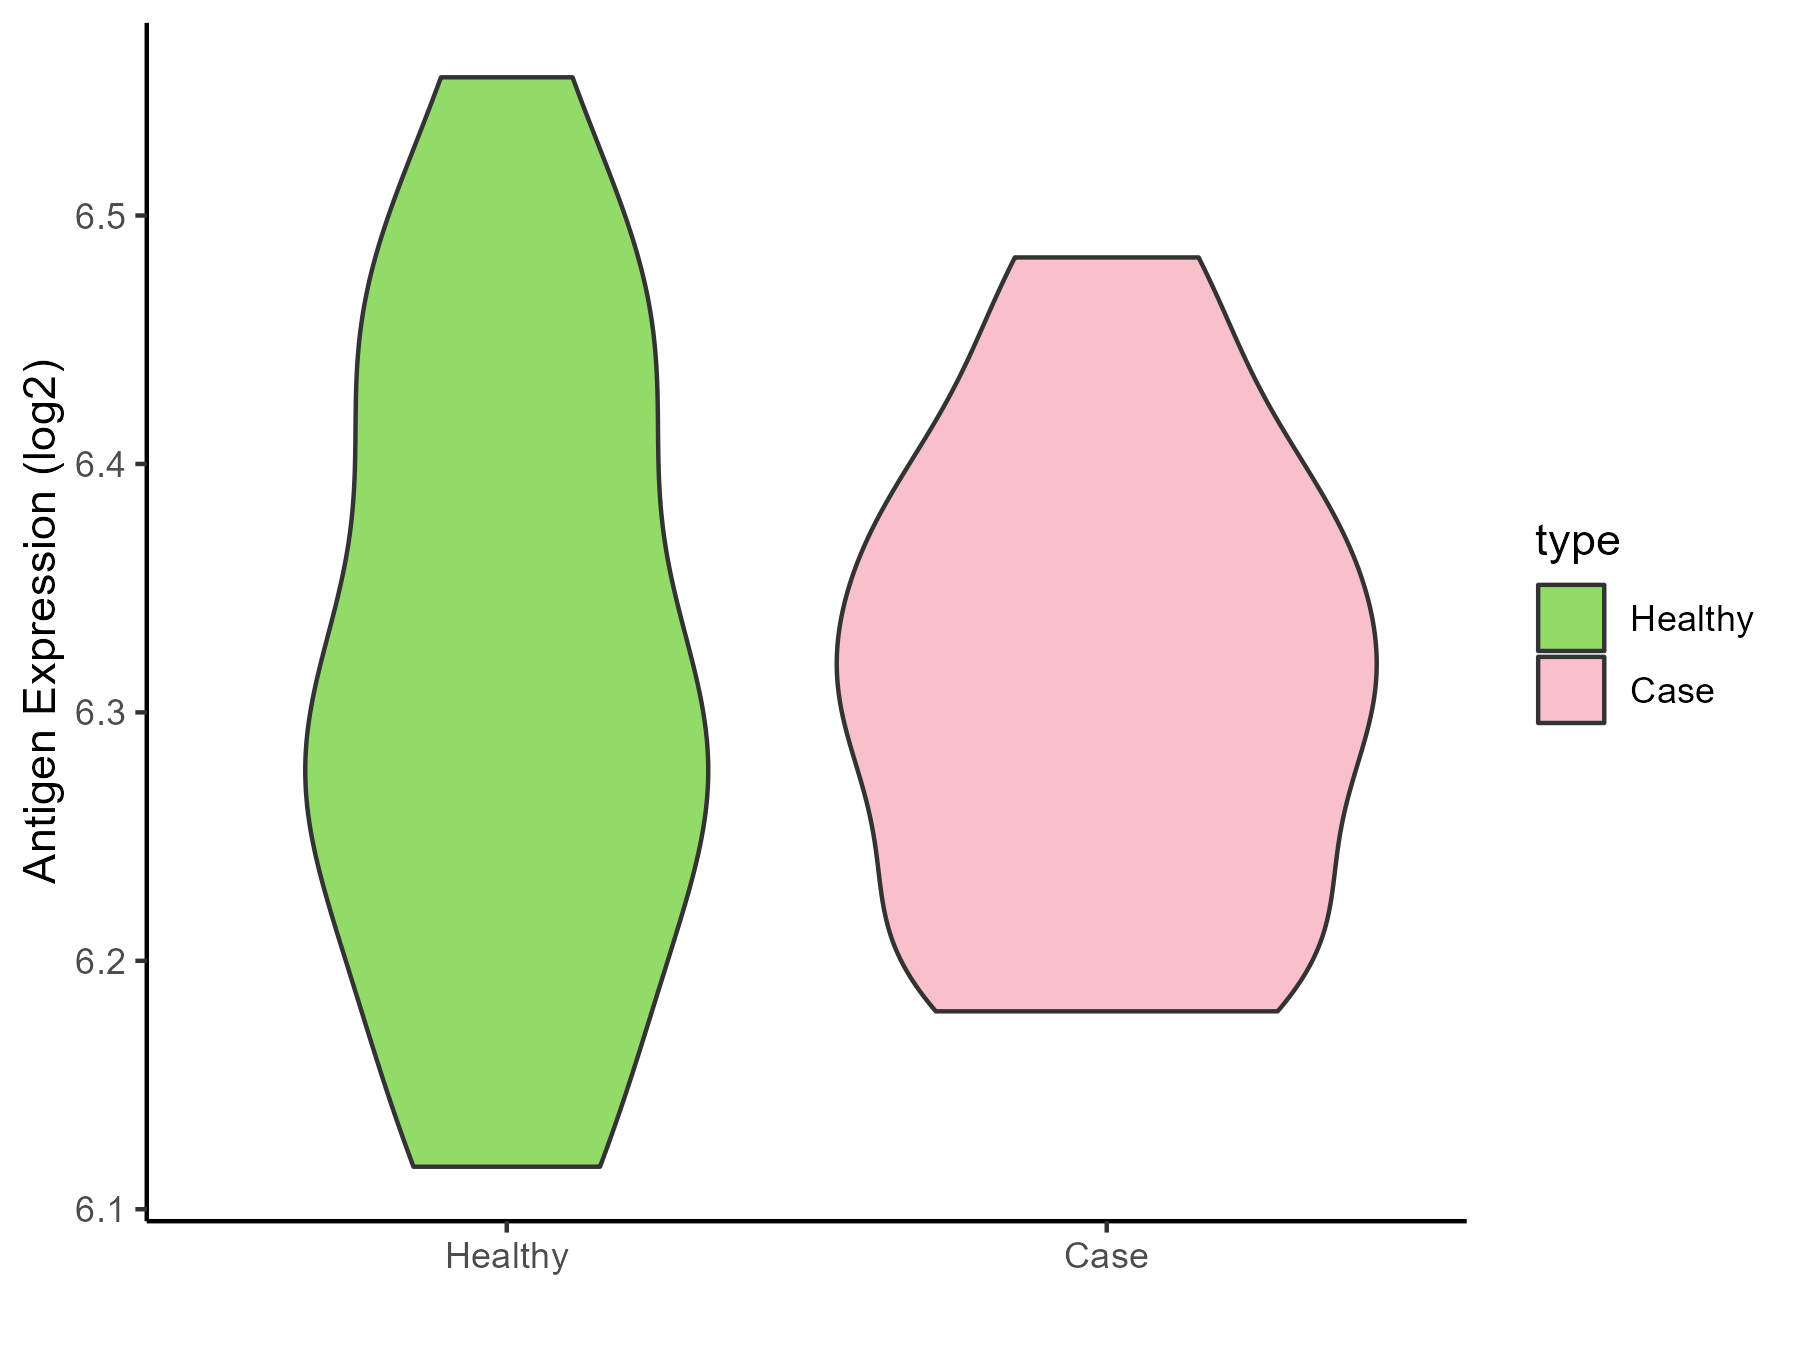
| The Studied Tissue | Superior temporal cortex | |
| The Specific Disease | Schizophrenia | |
| The Expression Level of Disease Section Compare with the Healthy Individual Tissue | p-value: 0.848609338; Fold-change: 0.01221774; Z-score: 0.095408614 | |
| Disease-specific Antigen Abundances |
|
Click to View the Clearer Original Diagram |
ICD Disease Classification 08
| Differential expression pattern of antigen in diseases | ||
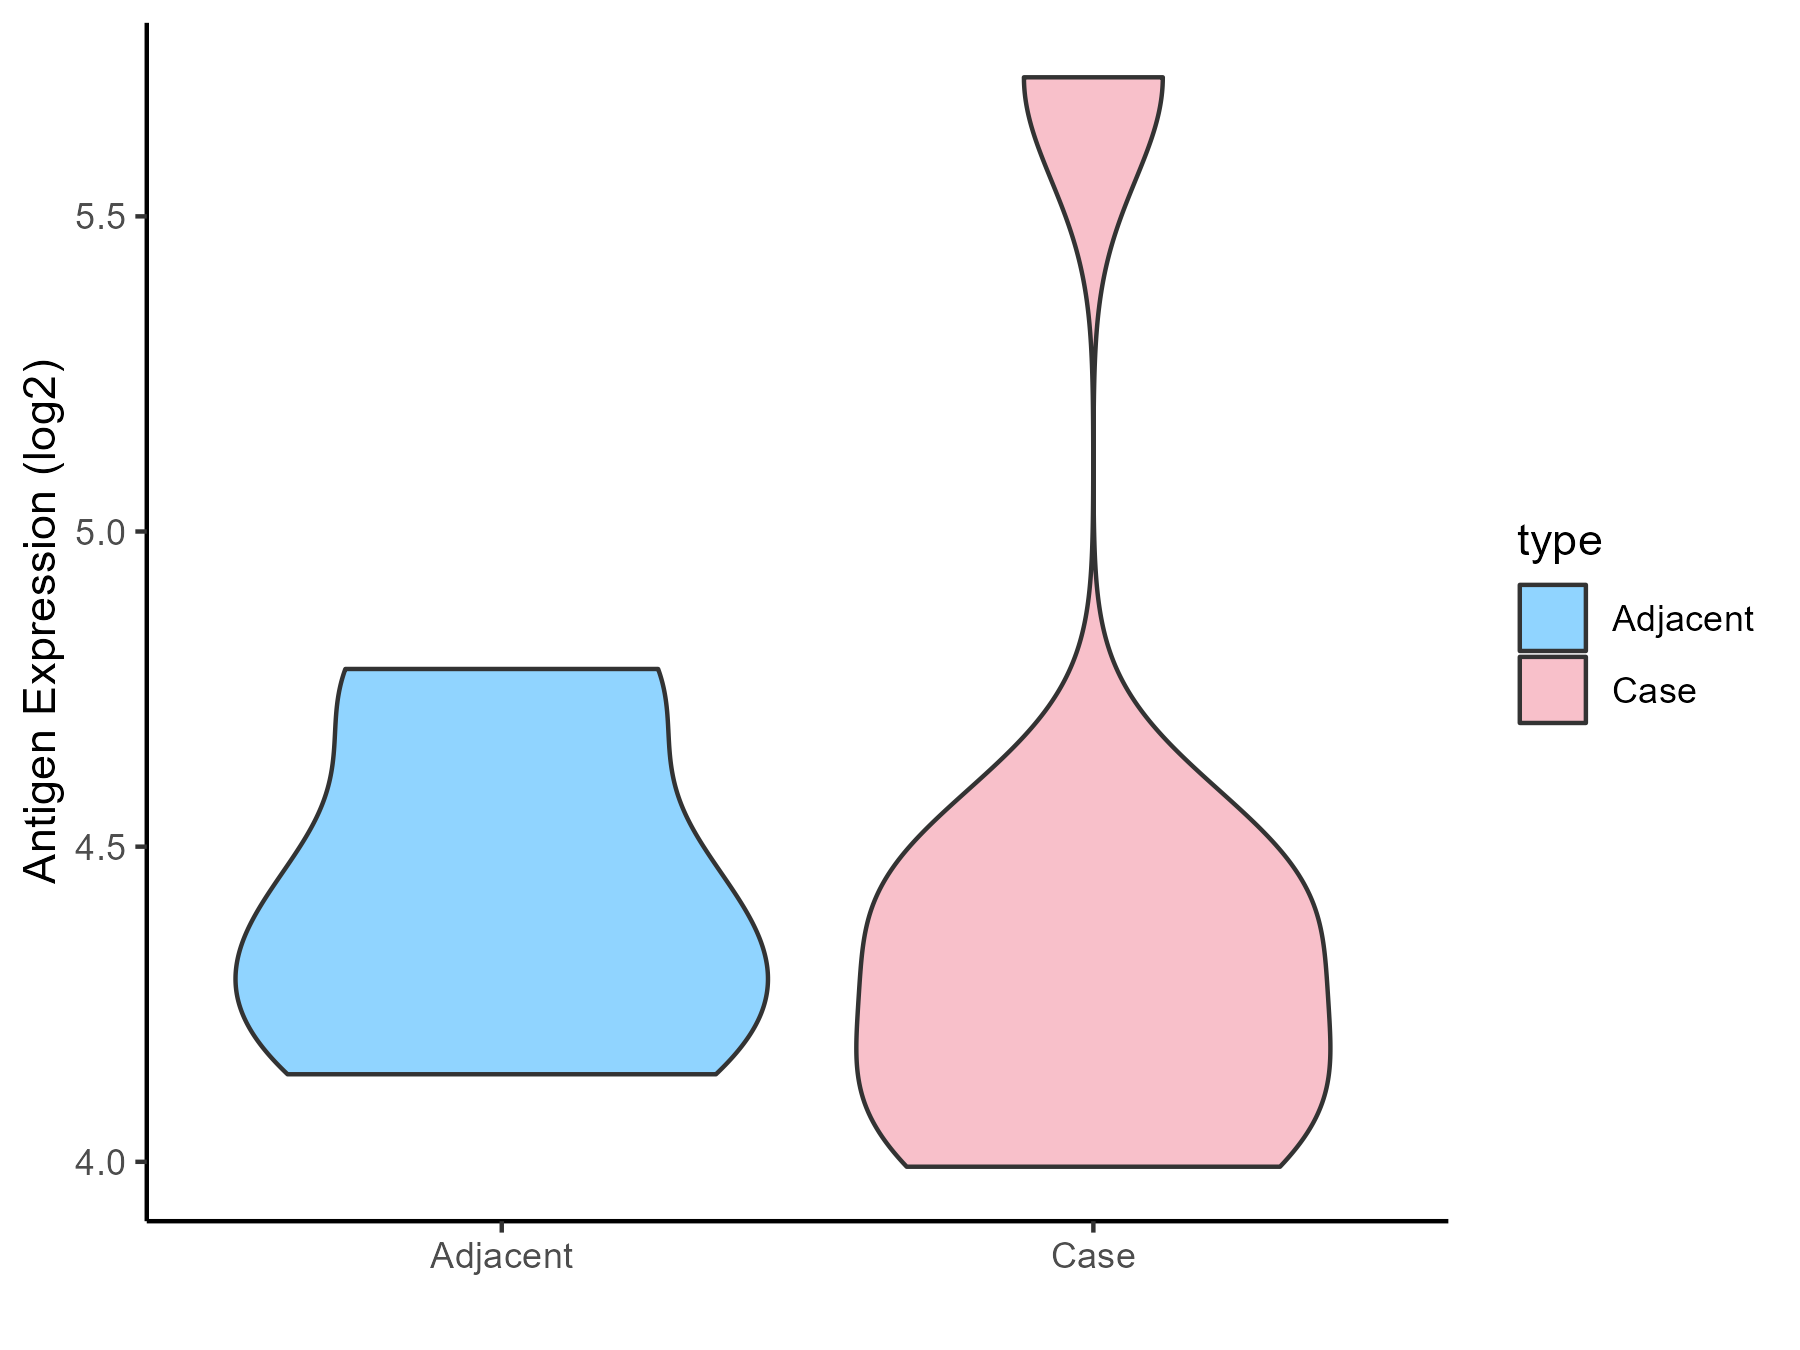
| The Studied Tissue | Spinal cord | |
| The Specific Disease | Multiple sclerosis | |
| The Expression Level of Disease Section Compare with the Adjacent Tissue | p-value: 0.920071264; Fold-change: -0.06630403; Z-score: -0.252204552 | |
| Disease-specific Antigen Abundances |
|
Click to View the Clearer Original Diagram |
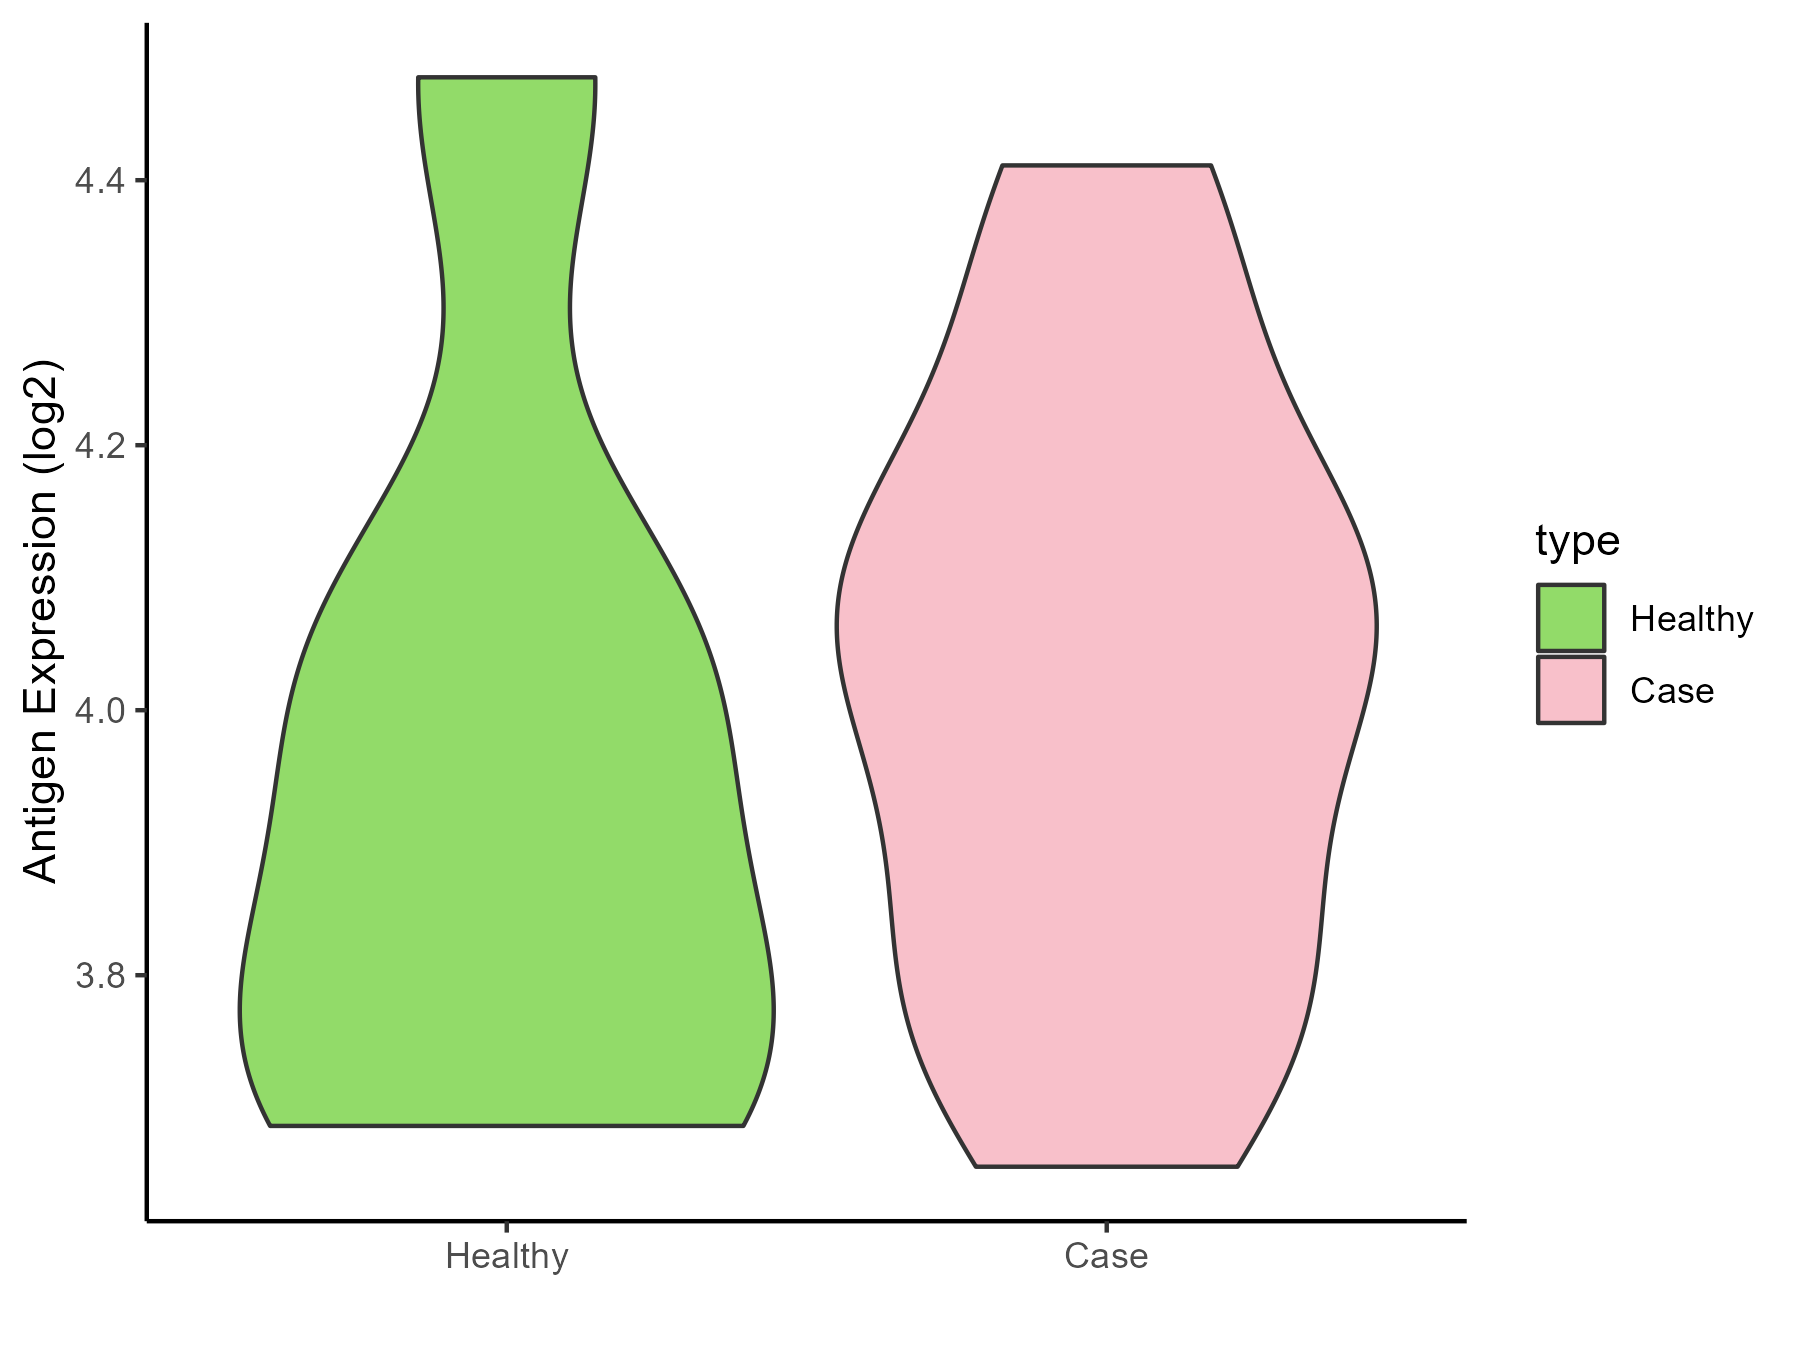
| The Studied Tissue | Plasmacytoid dendritic cells | |
| The Specific Disease | Multiple sclerosis | |
| The Expression Level of Disease Section Compare with the Healthy Individual Tissue | p-value: 0.682603559; Fold-change: 0.160060308; Z-score: 0.54530326 | |
| Disease-specific Antigen Abundances |
|
Click to View the Clearer Original Diagram |
| Differential expression pattern of antigen in diseases | ||
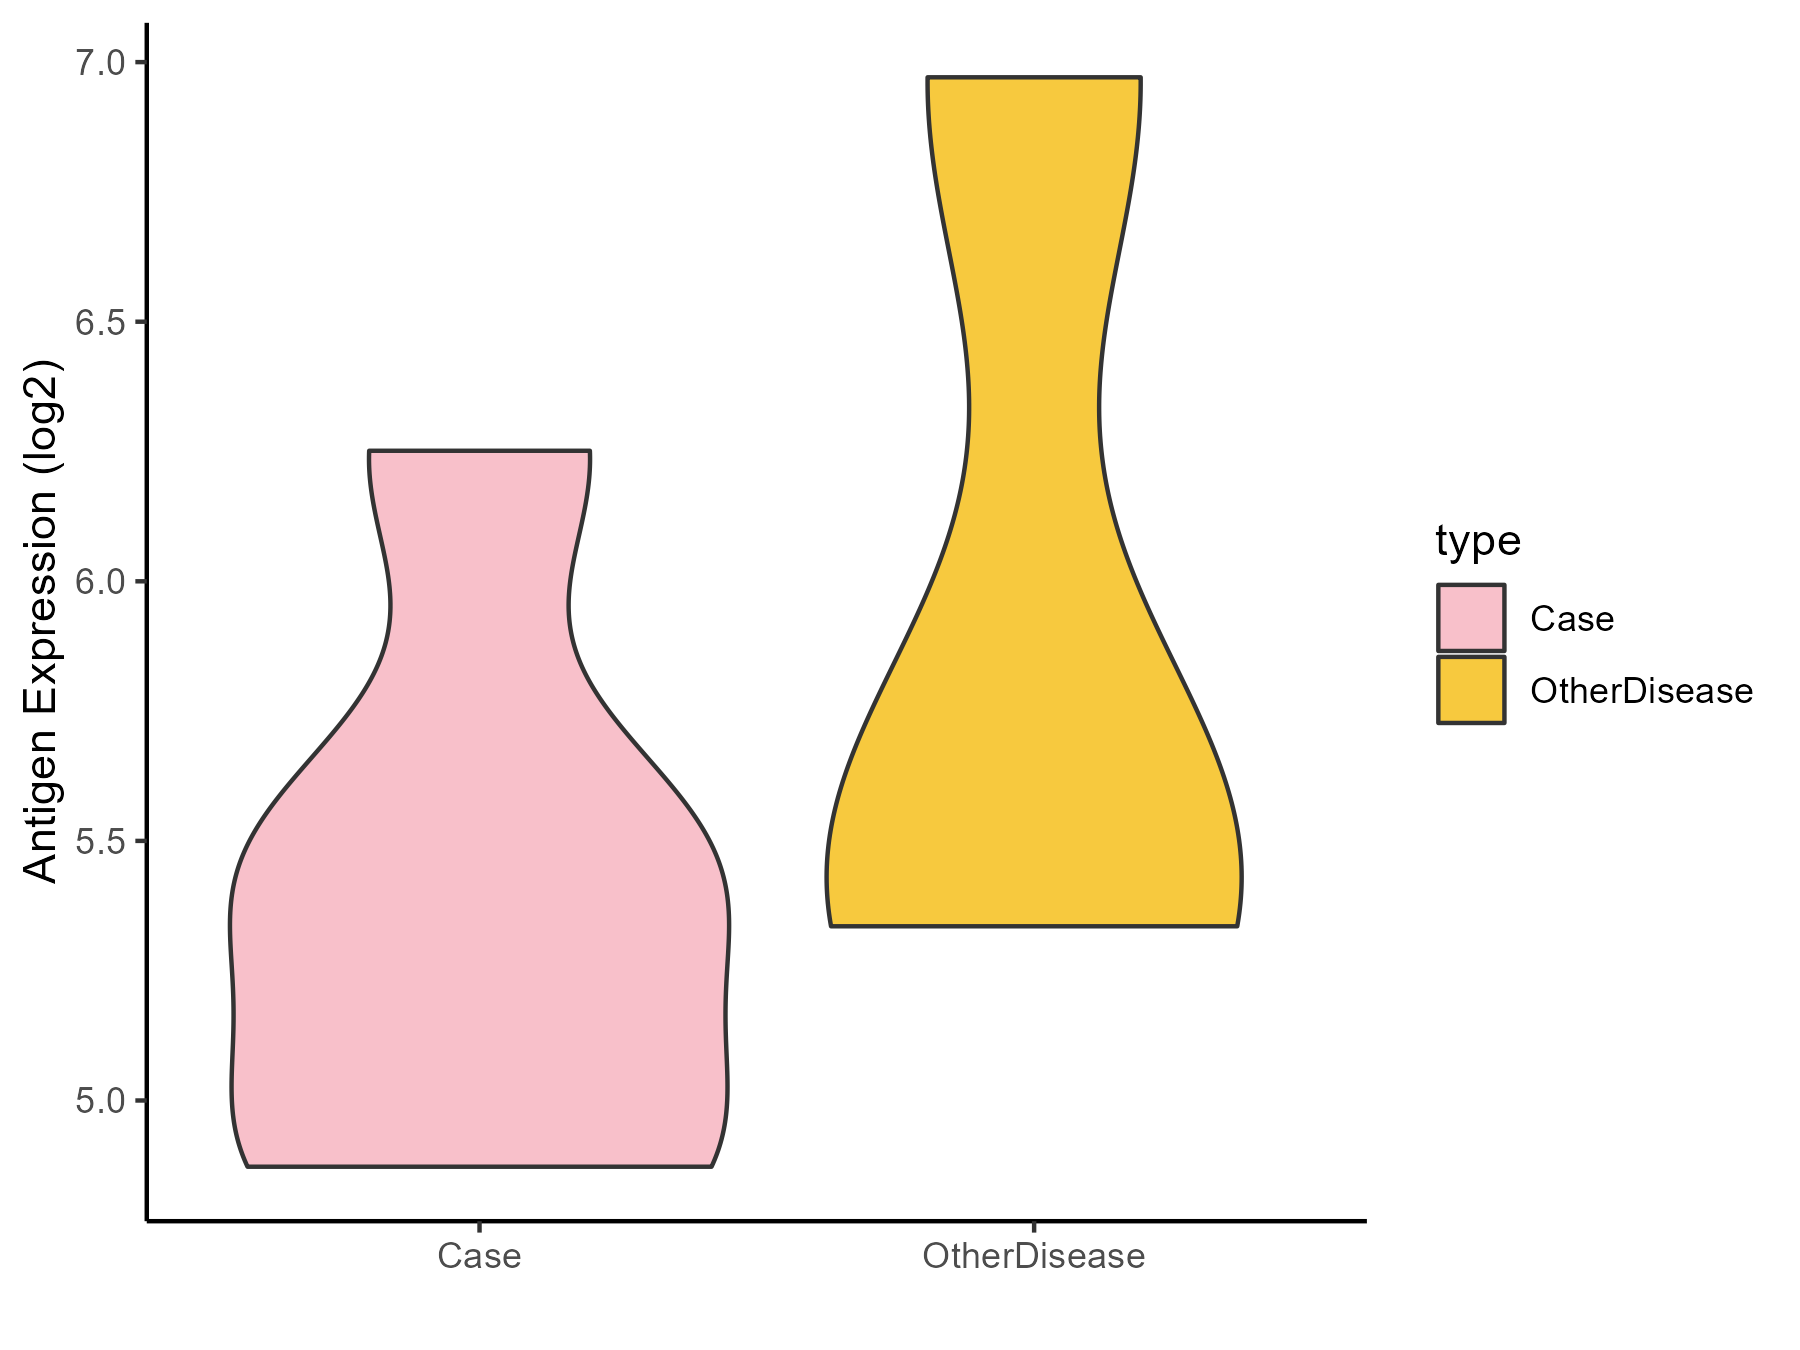
| The Studied Tissue | Peritumoral cortex | |
| The Specific Disease | Epilepsy | |
| The Expression Level of Disease Section Compare with the Other Disease Section | p-value: 0.408737763; Fold-change: -0.076334459; Z-score: -0.085250612 | |
| Disease-specific Antigen Abundances |
|
Click to View the Clearer Original Diagram |
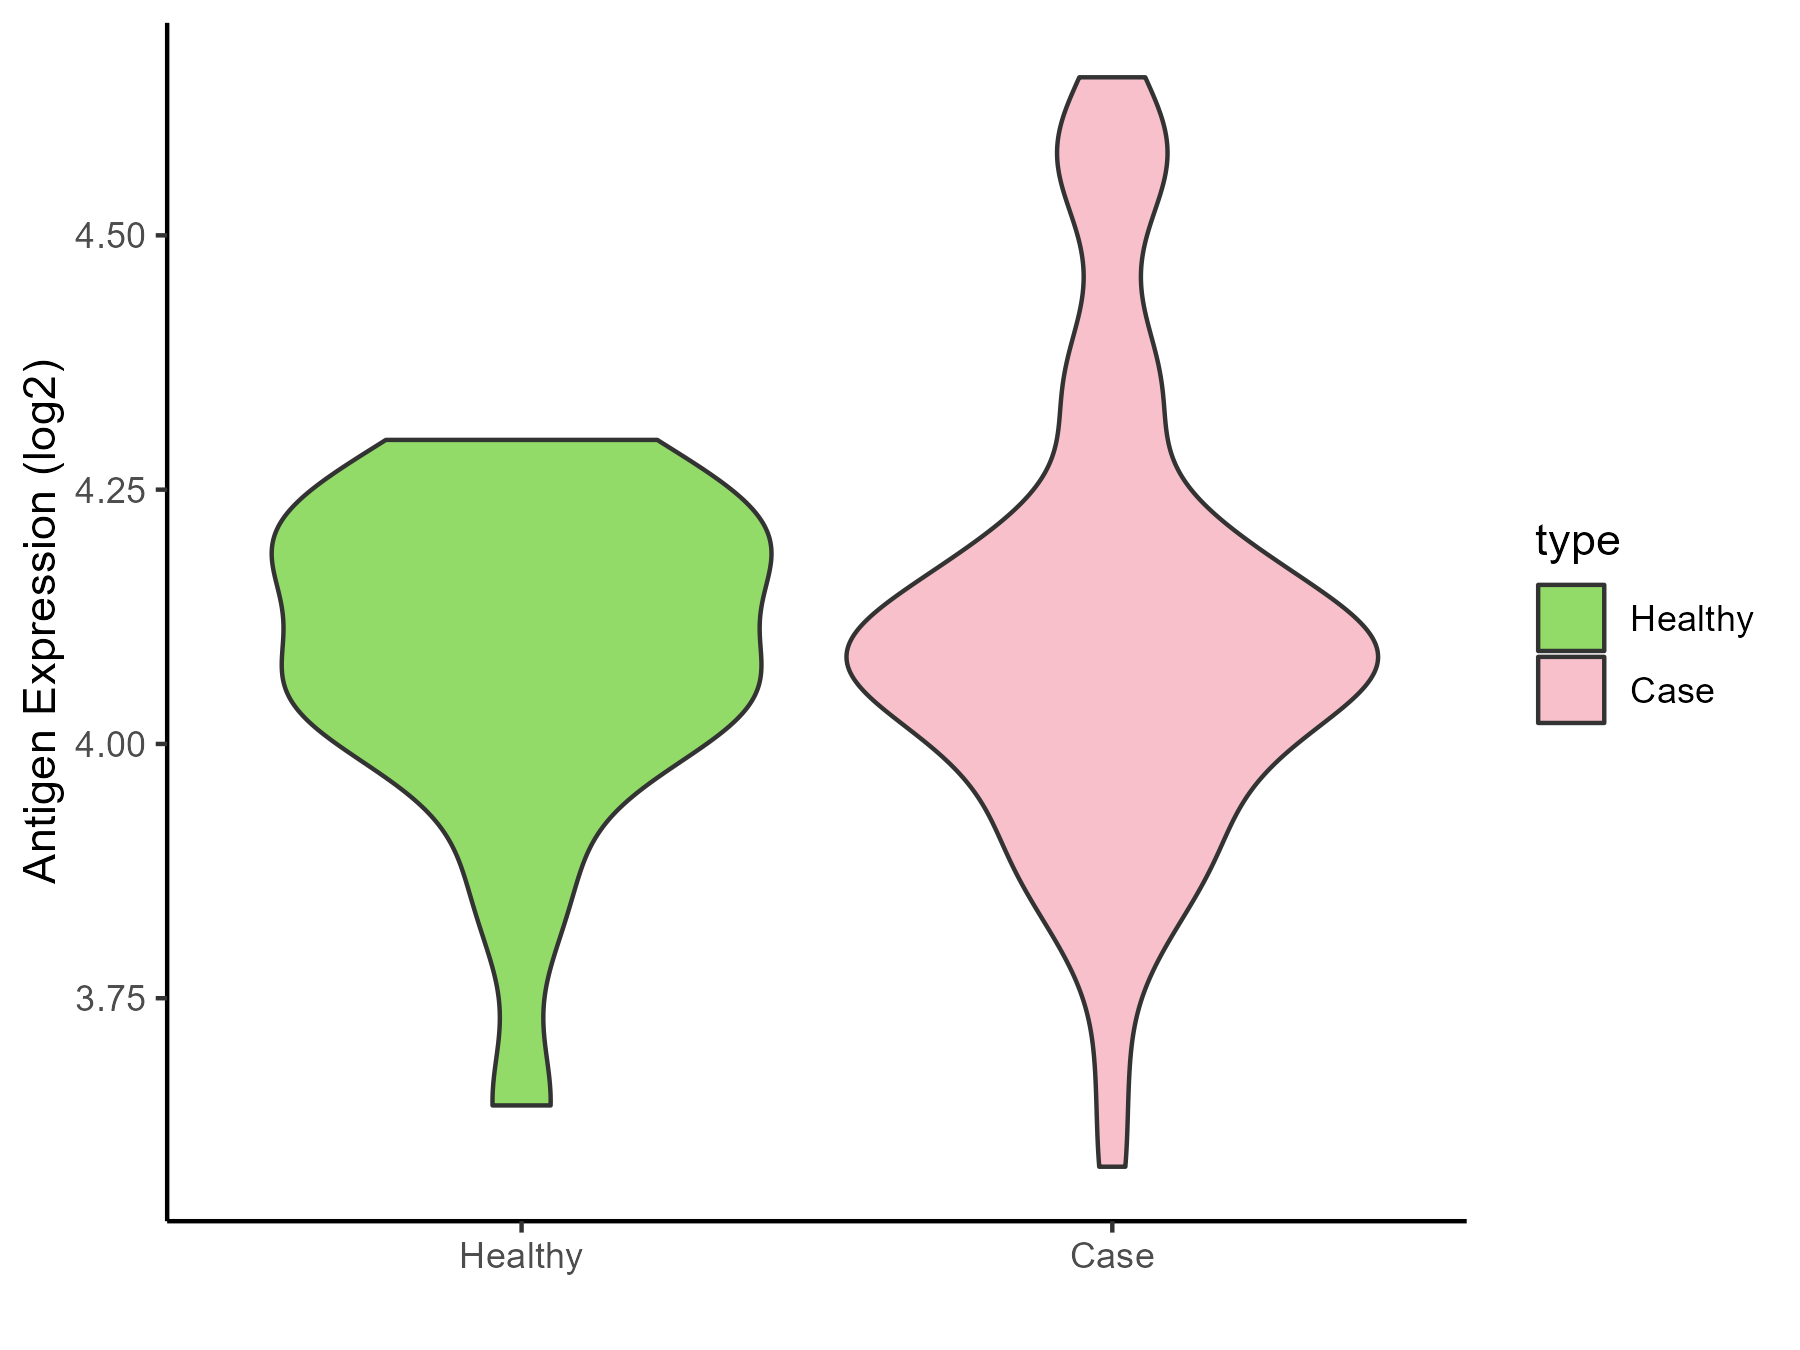
| Differential expression pattern of antigen in diseases | ||
| The Studied Tissue | Whole blood | |
| The Specific Disease | Cardioembolic Stroke | |
| The Expression Level of Disease Section Compare with the Healthy Individual Tissue | p-value: 0.630657394; Fold-change: -0.024613776; Z-score: -0.154760141 | |
| Disease-specific Antigen Abundances |
|
Click to View the Clearer Original Diagram |
| The Studied Tissue | Peripheral blood | |
| The Specific Disease | Ischemic stroke | |
| The Expression Level of Disease Section Compare with the Healthy Individual Tissue | p-value: 0.144269076; Fold-change: 0.035285246; Z-score: 0.292978476 | |
| Disease-specific Antigen Abundances |

|
Click to View the Clearer Original Diagram |
ICD Disease Classification 1
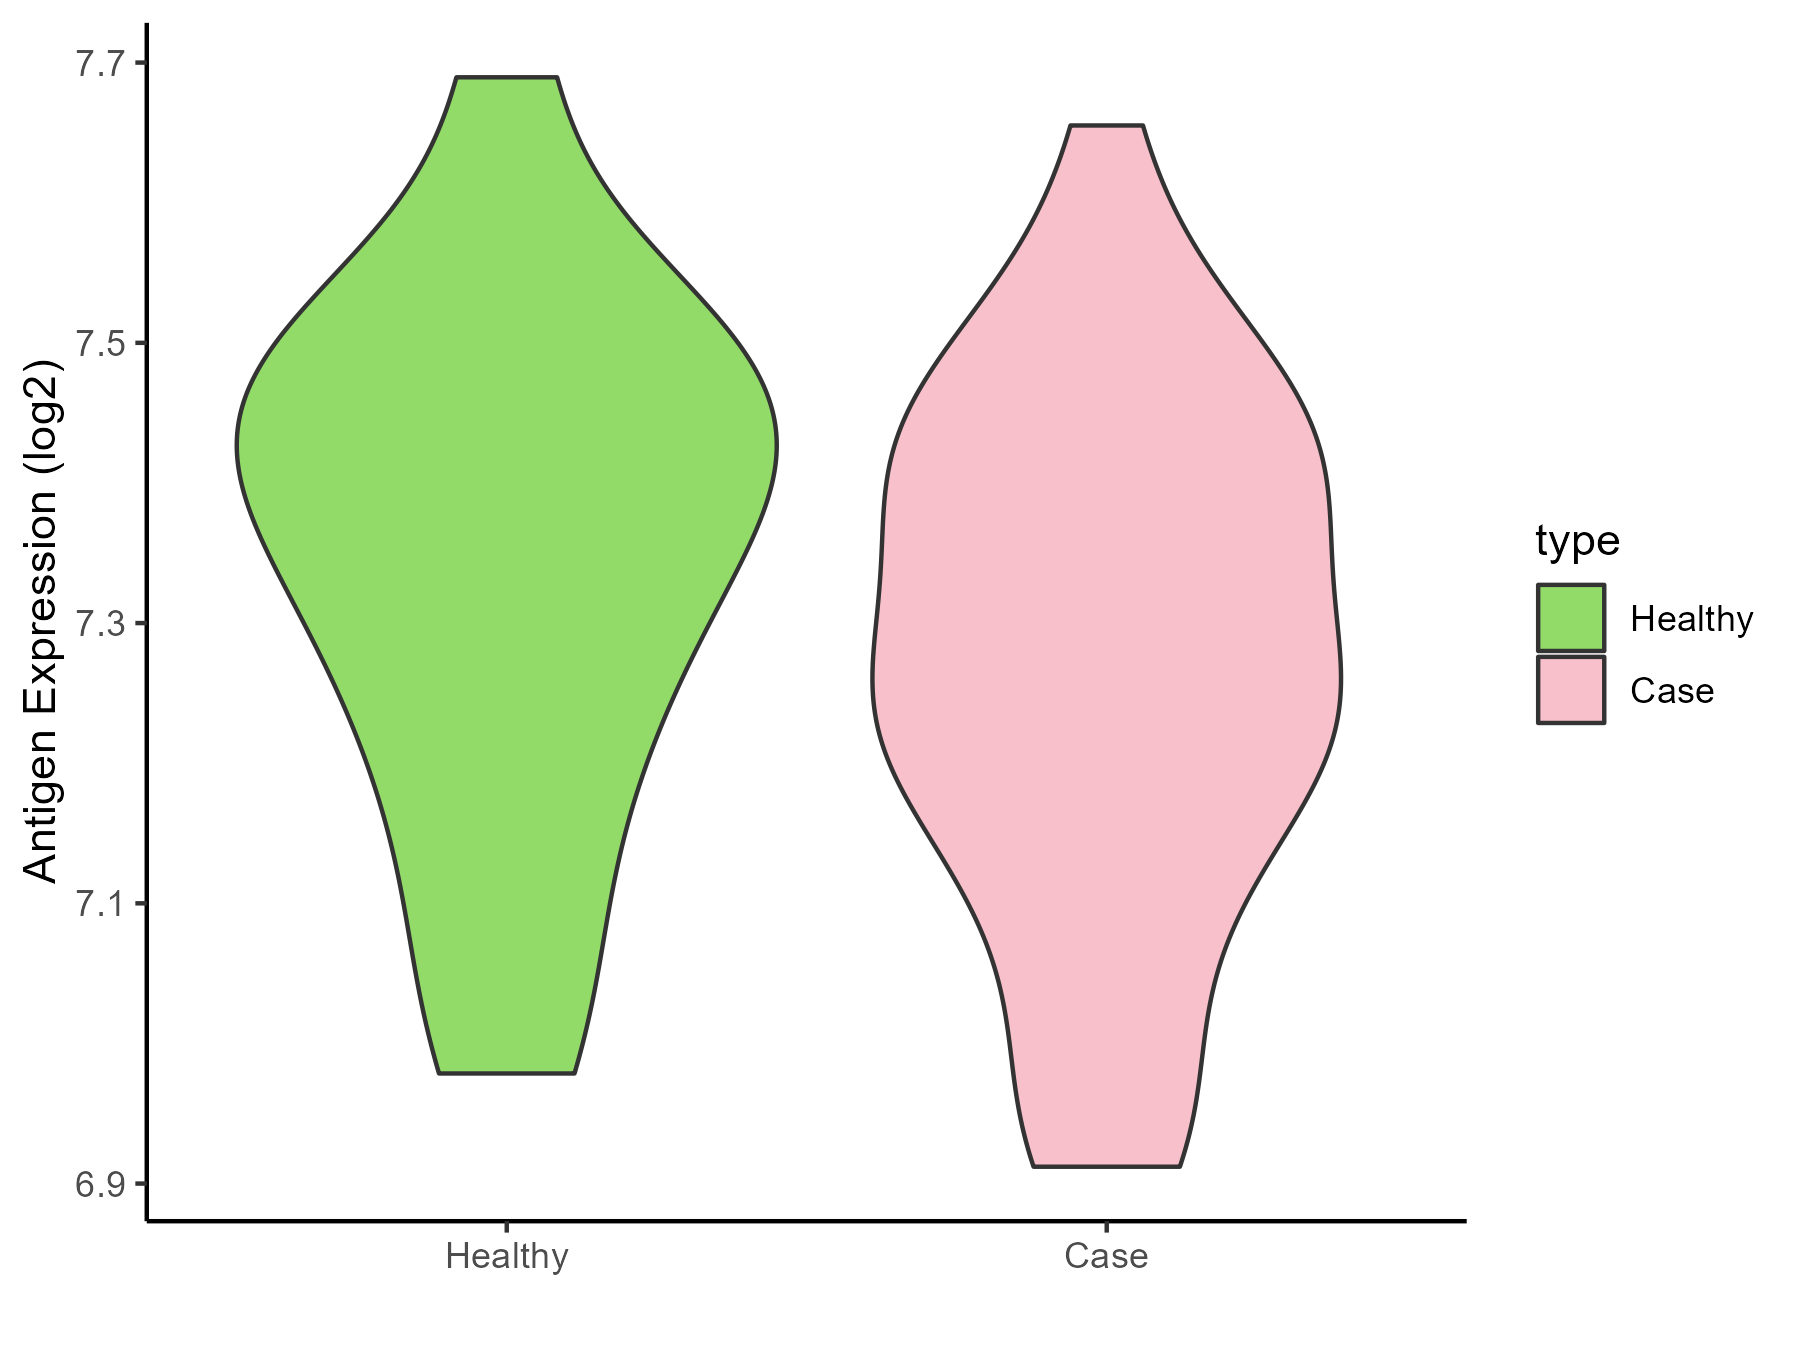
| Differential expression pattern of antigen in diseases | ||
| The Studied Tissue | White matter | |
| The Specific Disease | HIV | |
| The Expression Level of Disease Section Compare with the Healthy Individual Tissue | p-value: 0.183397936; Fold-change: -0.128675349; Z-score: -0.688479814 | |
| Disease-specific Antigen Abundances |
|
Click to View the Clearer Original Diagram |
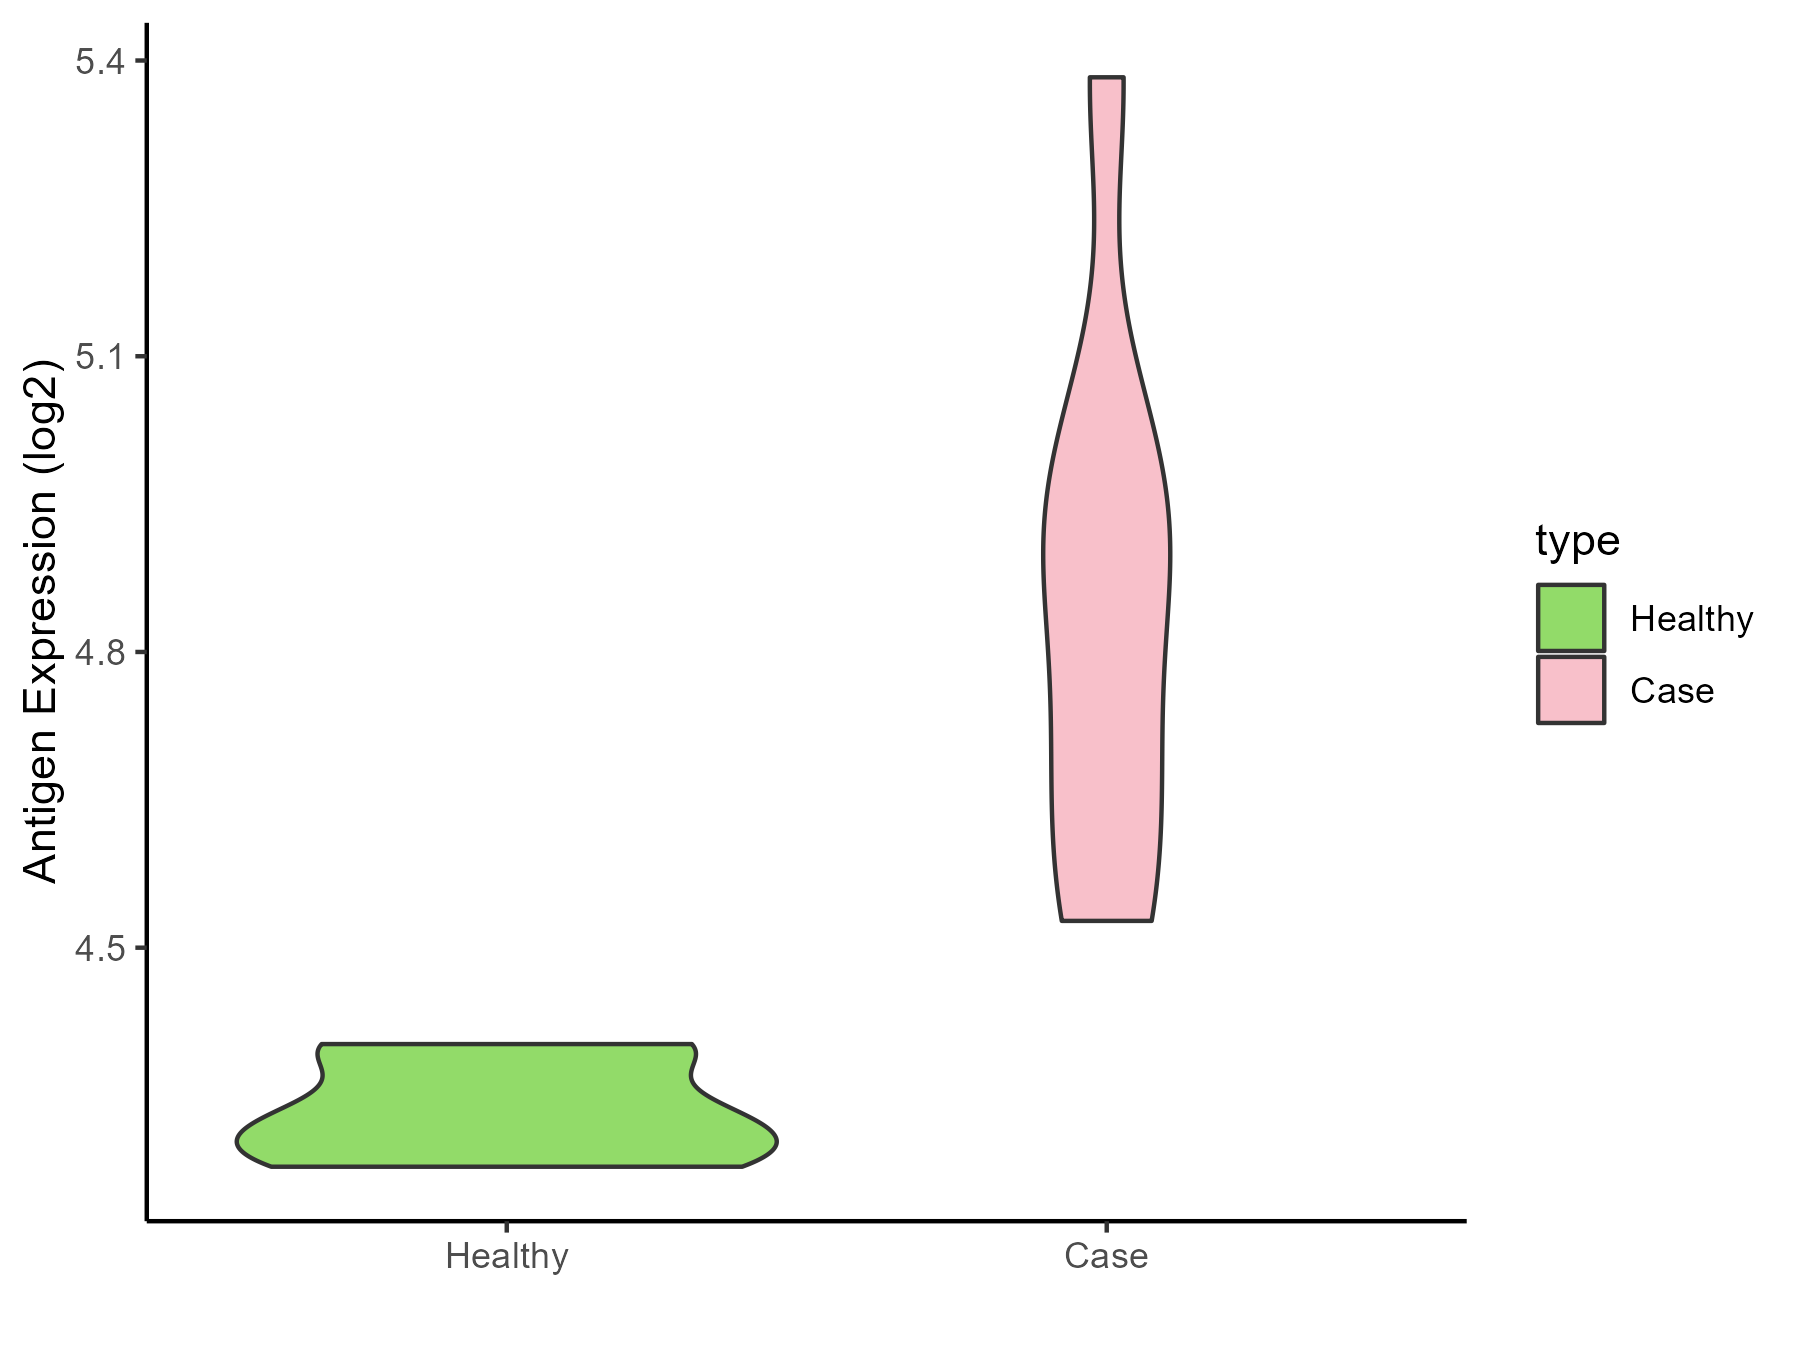
| Differential expression pattern of antigen in diseases | ||
| The Studied Tissue | Whole blood | |
| The Specific Disease | Influenza | |
| The Expression Level of Disease Section Compare with the Healthy Individual Tissue | p-value: 0.000396268; Fold-change: 0.561100065; Z-score: 8.938976931 | |
| Disease-specific Antigen Abundances |
|
Click to View the Clearer Original Diagram |
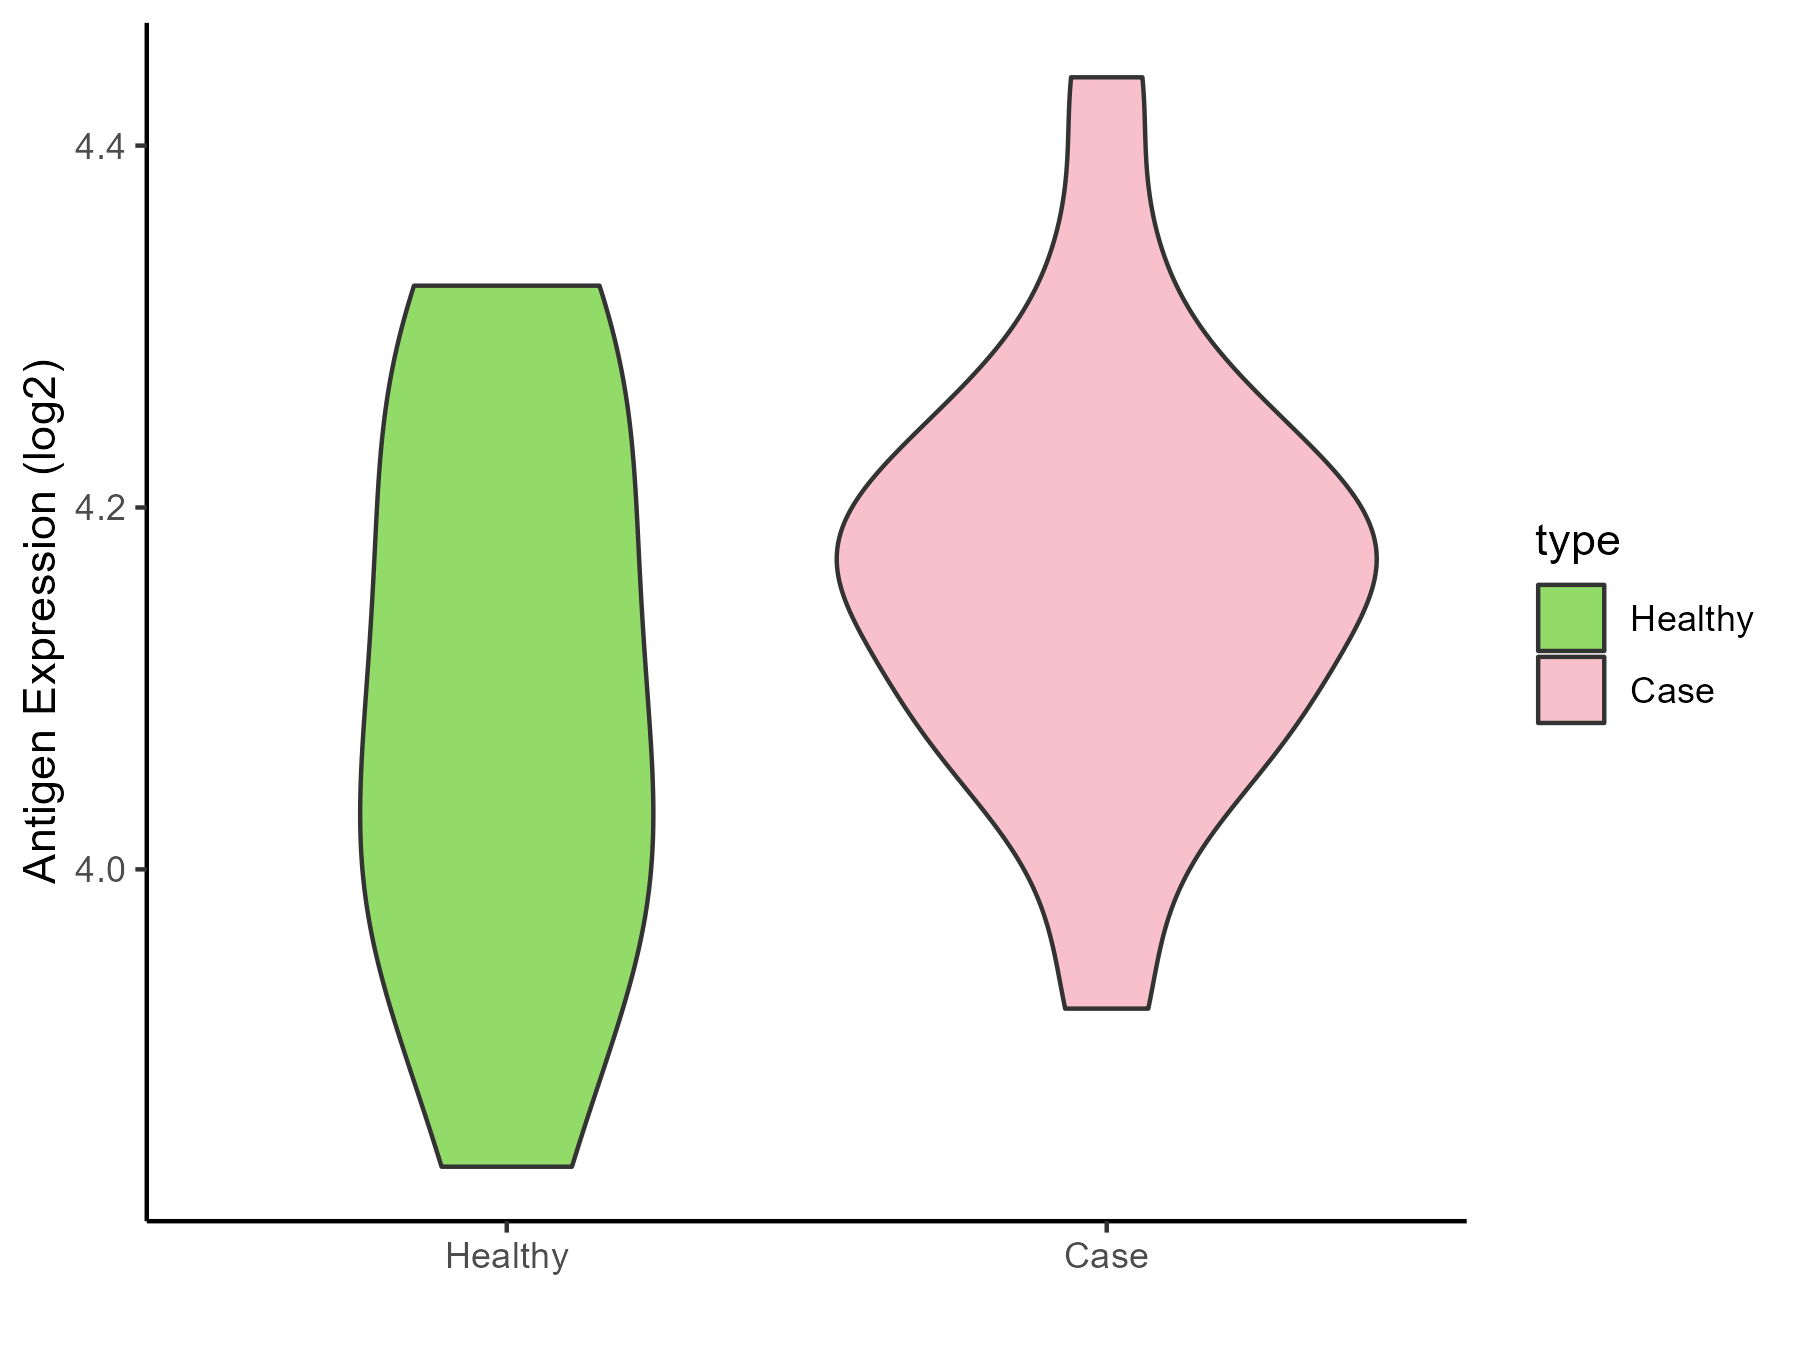
| Differential expression pattern of antigen in diseases | ||
| The Studied Tissue | Whole blood | |
| The Specific Disease | Chronic hepatitis C | |
| The Expression Level of Disease Section Compare with the Healthy Individual Tissue | p-value: 0.242249488; Fold-change: 0.068235654; Z-score: 0.430433009 | |
| Disease-specific Antigen Abundances |
|
Click to View the Clearer Original Diagram |
| Differential expression pattern of antigen in diseases | ||
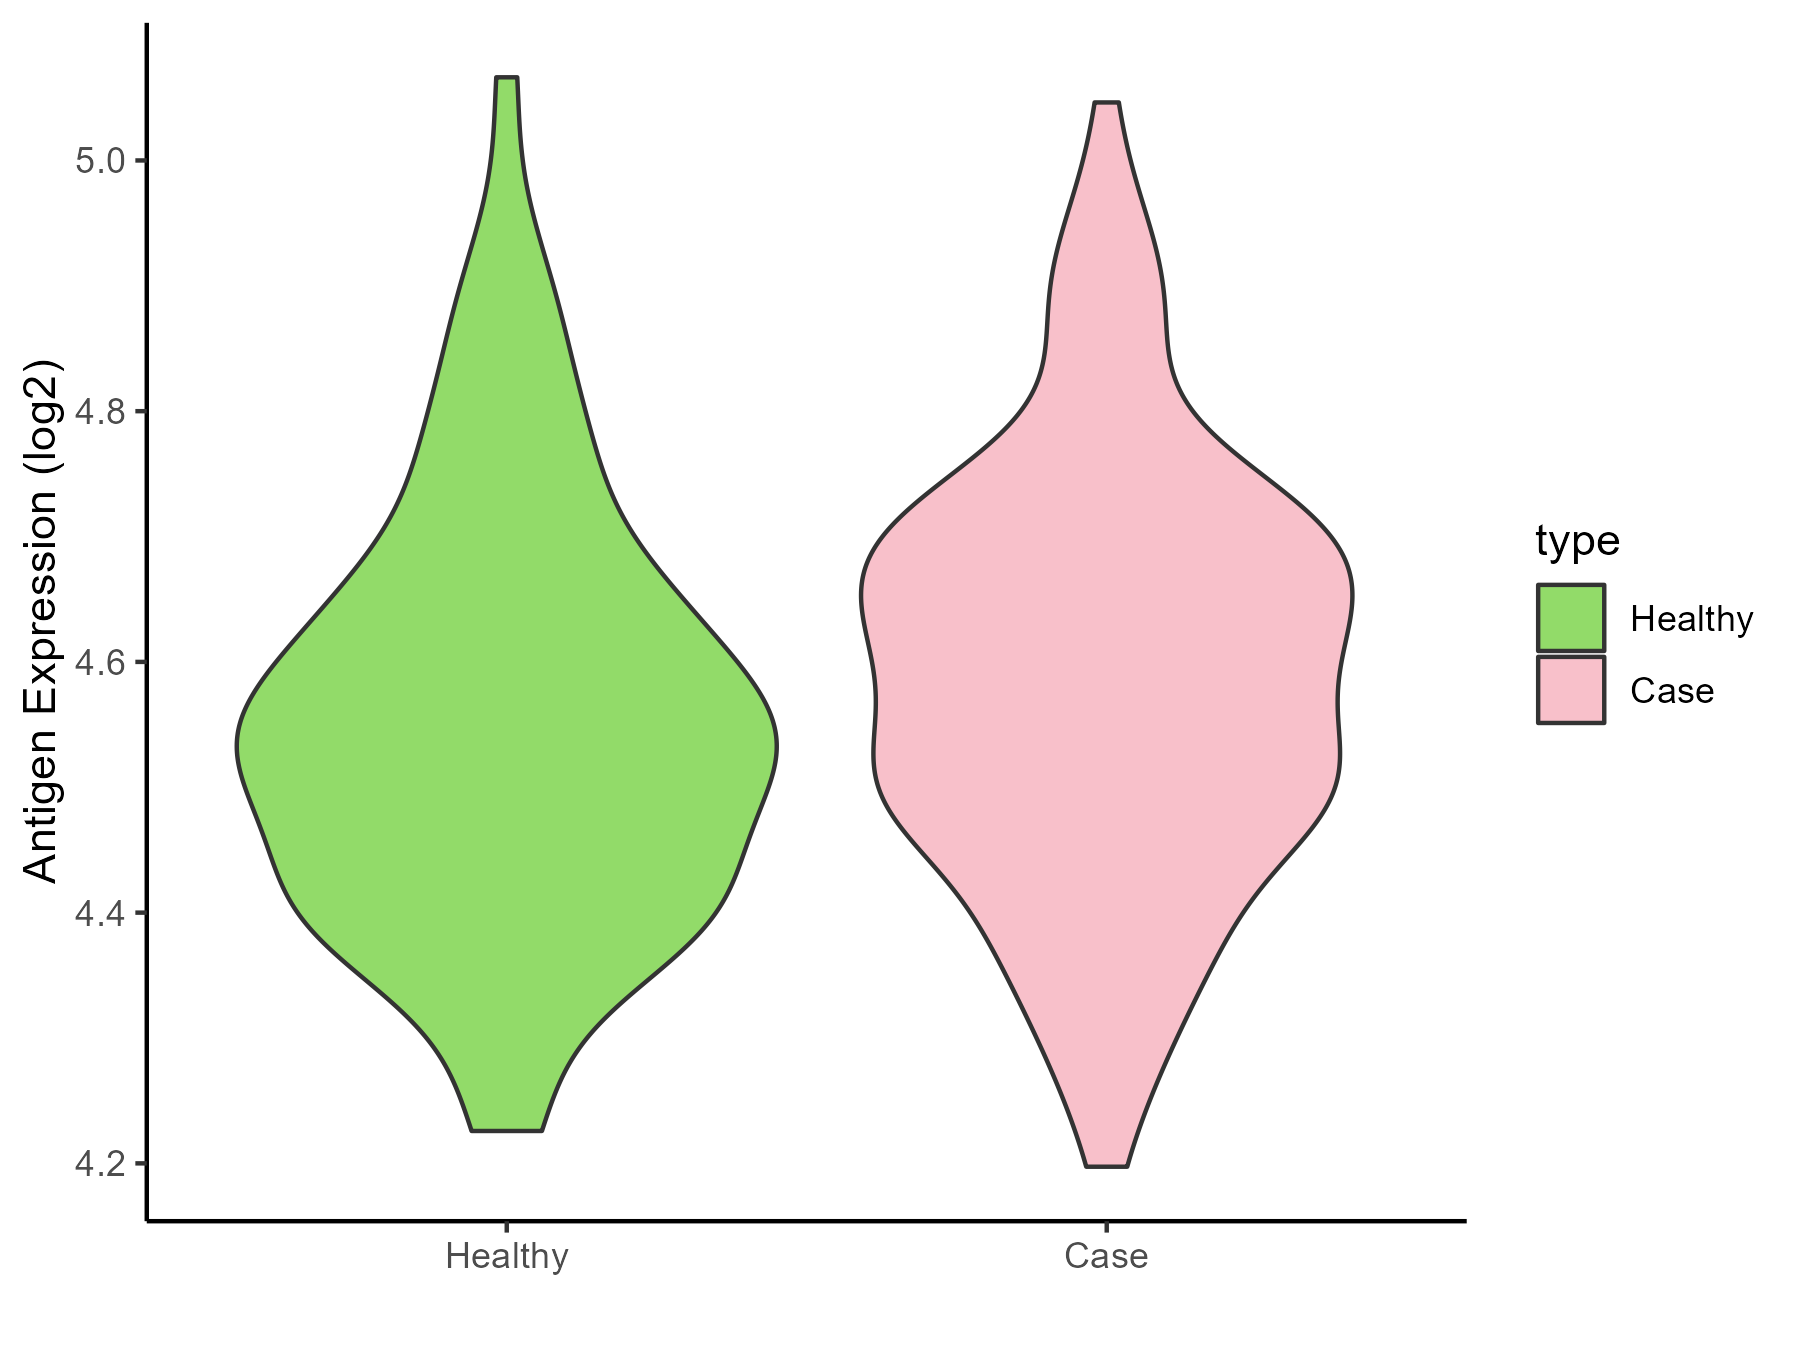
| The Studied Tissue | Whole blood | |
| The Specific Disease | Sepsis | |
| The Expression Level of Disease Section Compare with the Healthy Individual Tissue | p-value: 0.123646185; Fold-change: 0.045940205; Z-score: 0.274414147 | |
| Disease-specific Antigen Abundances |
|
Click to View the Clearer Original Diagram |
| Differential expression pattern of antigen in diseases | ||
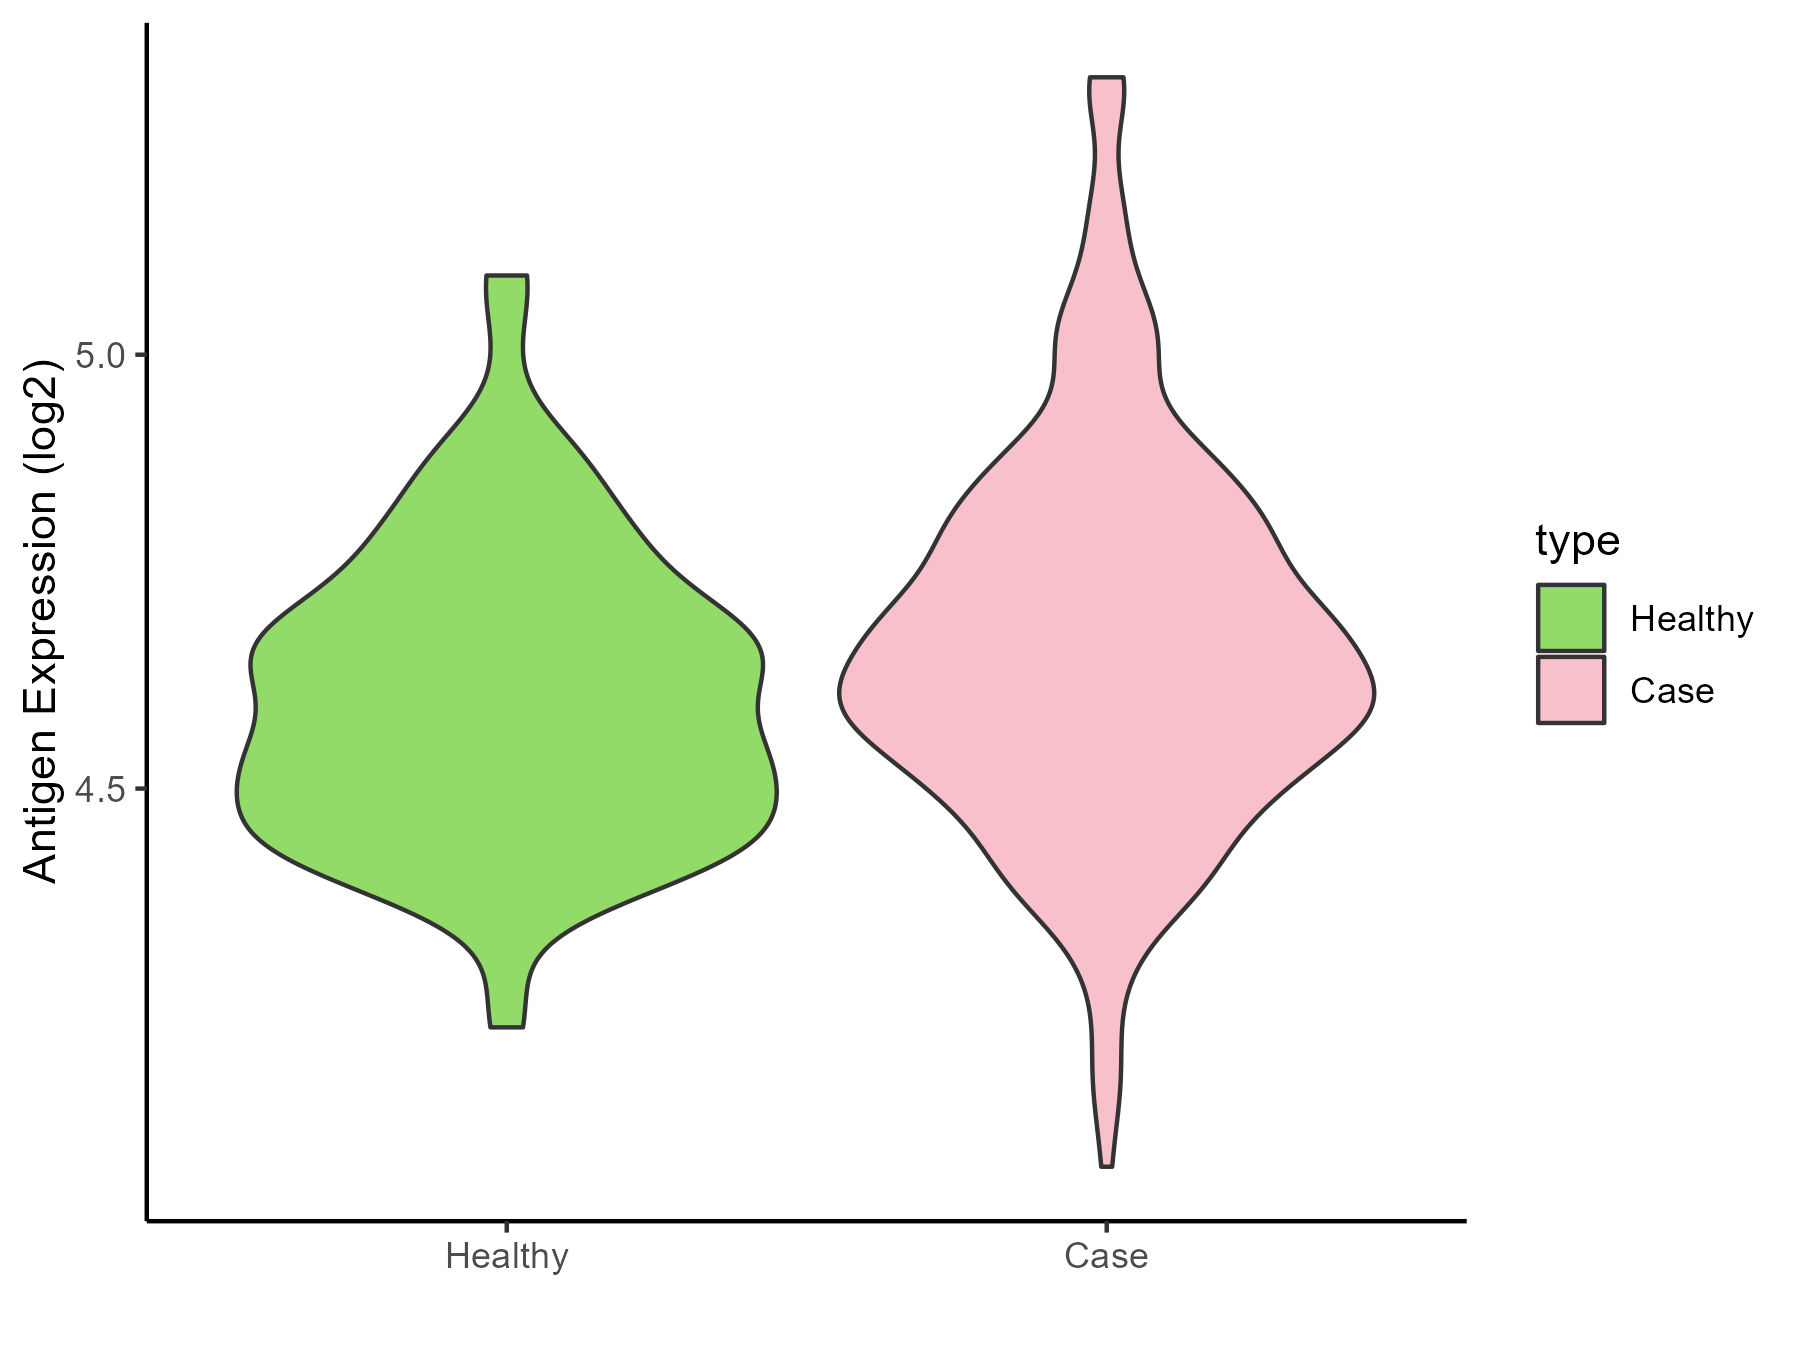
| The Studied Tissue | Whole blood | |
| The Specific Disease | Septic shock | |
| The Expression Level of Disease Section Compare with the Healthy Individual Tissue | p-value: 0.000139894; Fold-change: 0.056057666; Z-score: 0.339024305 | |
| Disease-specific Antigen Abundances |
|
Click to View the Clearer Original Diagram |
| Differential expression pattern of antigen in diseases | ||
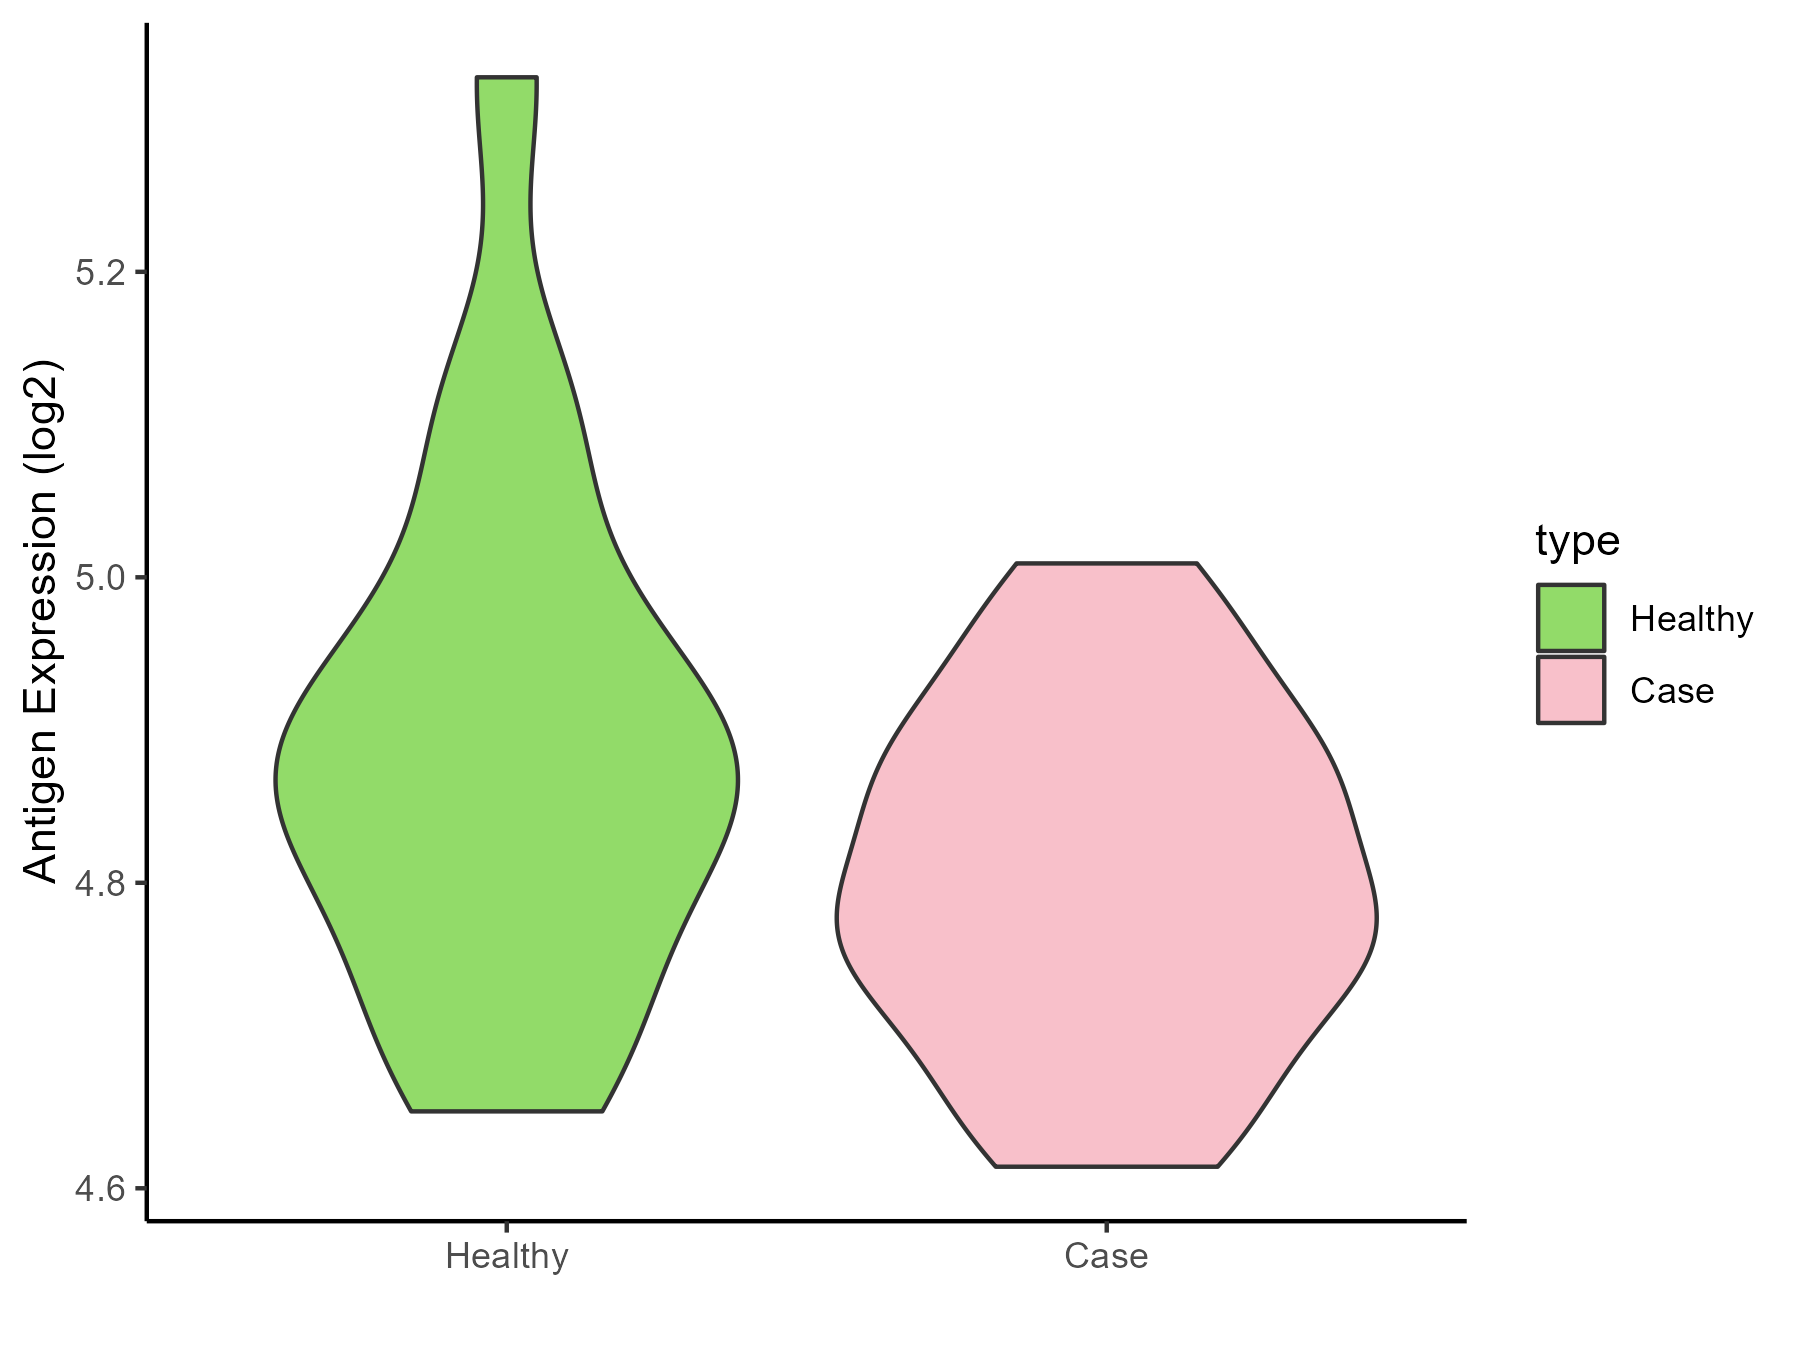
| The Studied Tissue | Peripheral blood | |
| The Specific Disease | Pediatric respiratory syncytial virus infection | |
| The Expression Level of Disease Section Compare with the Healthy Individual Tissue | p-value: 0.069107652; Fold-change: -0.082289878; Z-score: -0.477749473 | |
| Disease-specific Antigen Abundances |
|
Click to View the Clearer Original Diagram |
ICD Disease Classification 11
| Differential expression pattern of antigen in diseases | ||
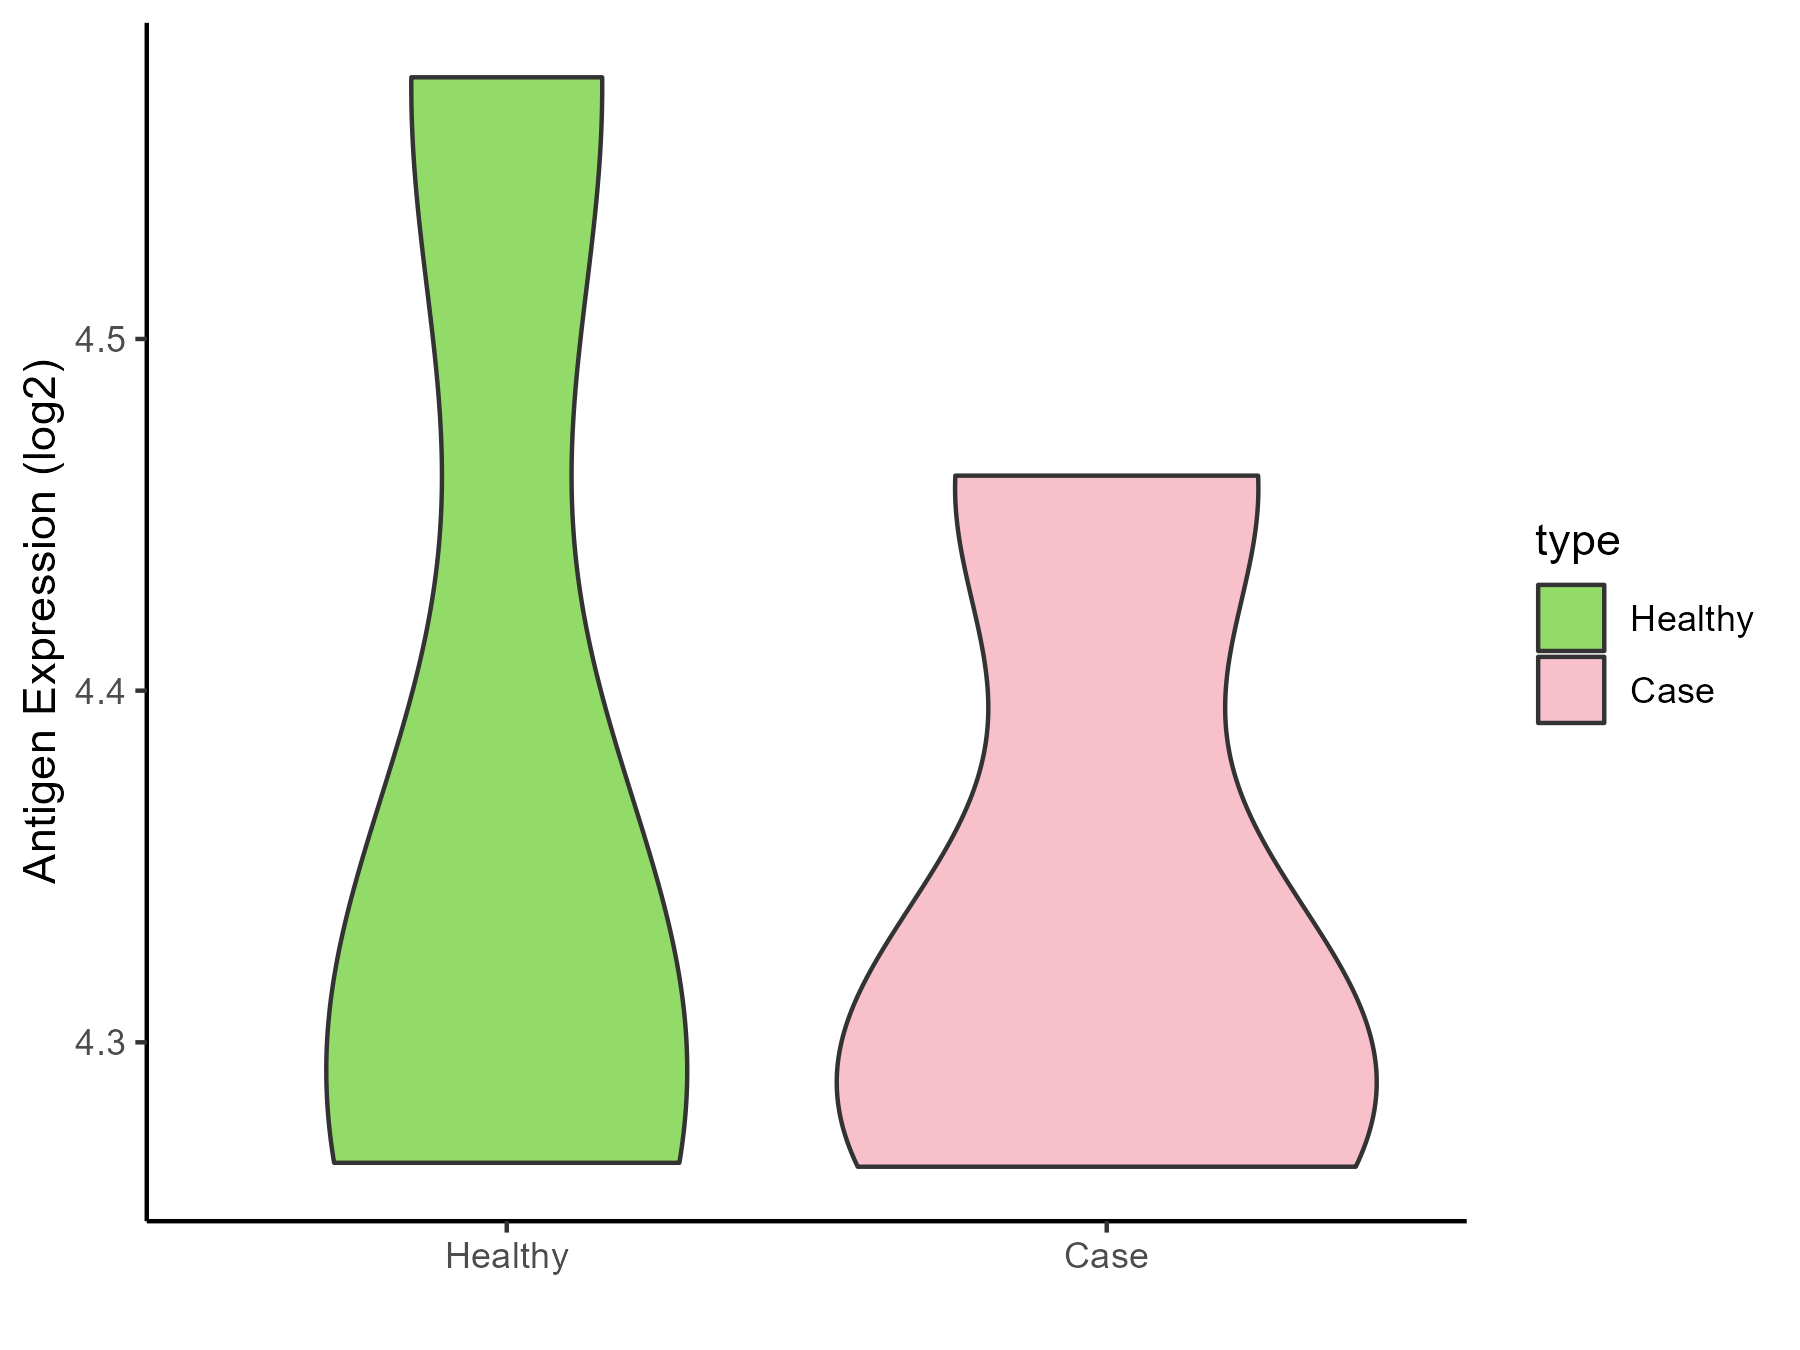
| The Studied Tissue | Peripheral blood | |
| The Specific Disease | Essential hypertension | |
| The Expression Level of Disease Section Compare with the Healthy Individual Tissue | p-value: 0.742757354; Fold-change: -0.005802601; Z-score: -0.035093496 | |
| Disease-specific Antigen Abundances |
|
Click to View the Clearer Original Diagram |
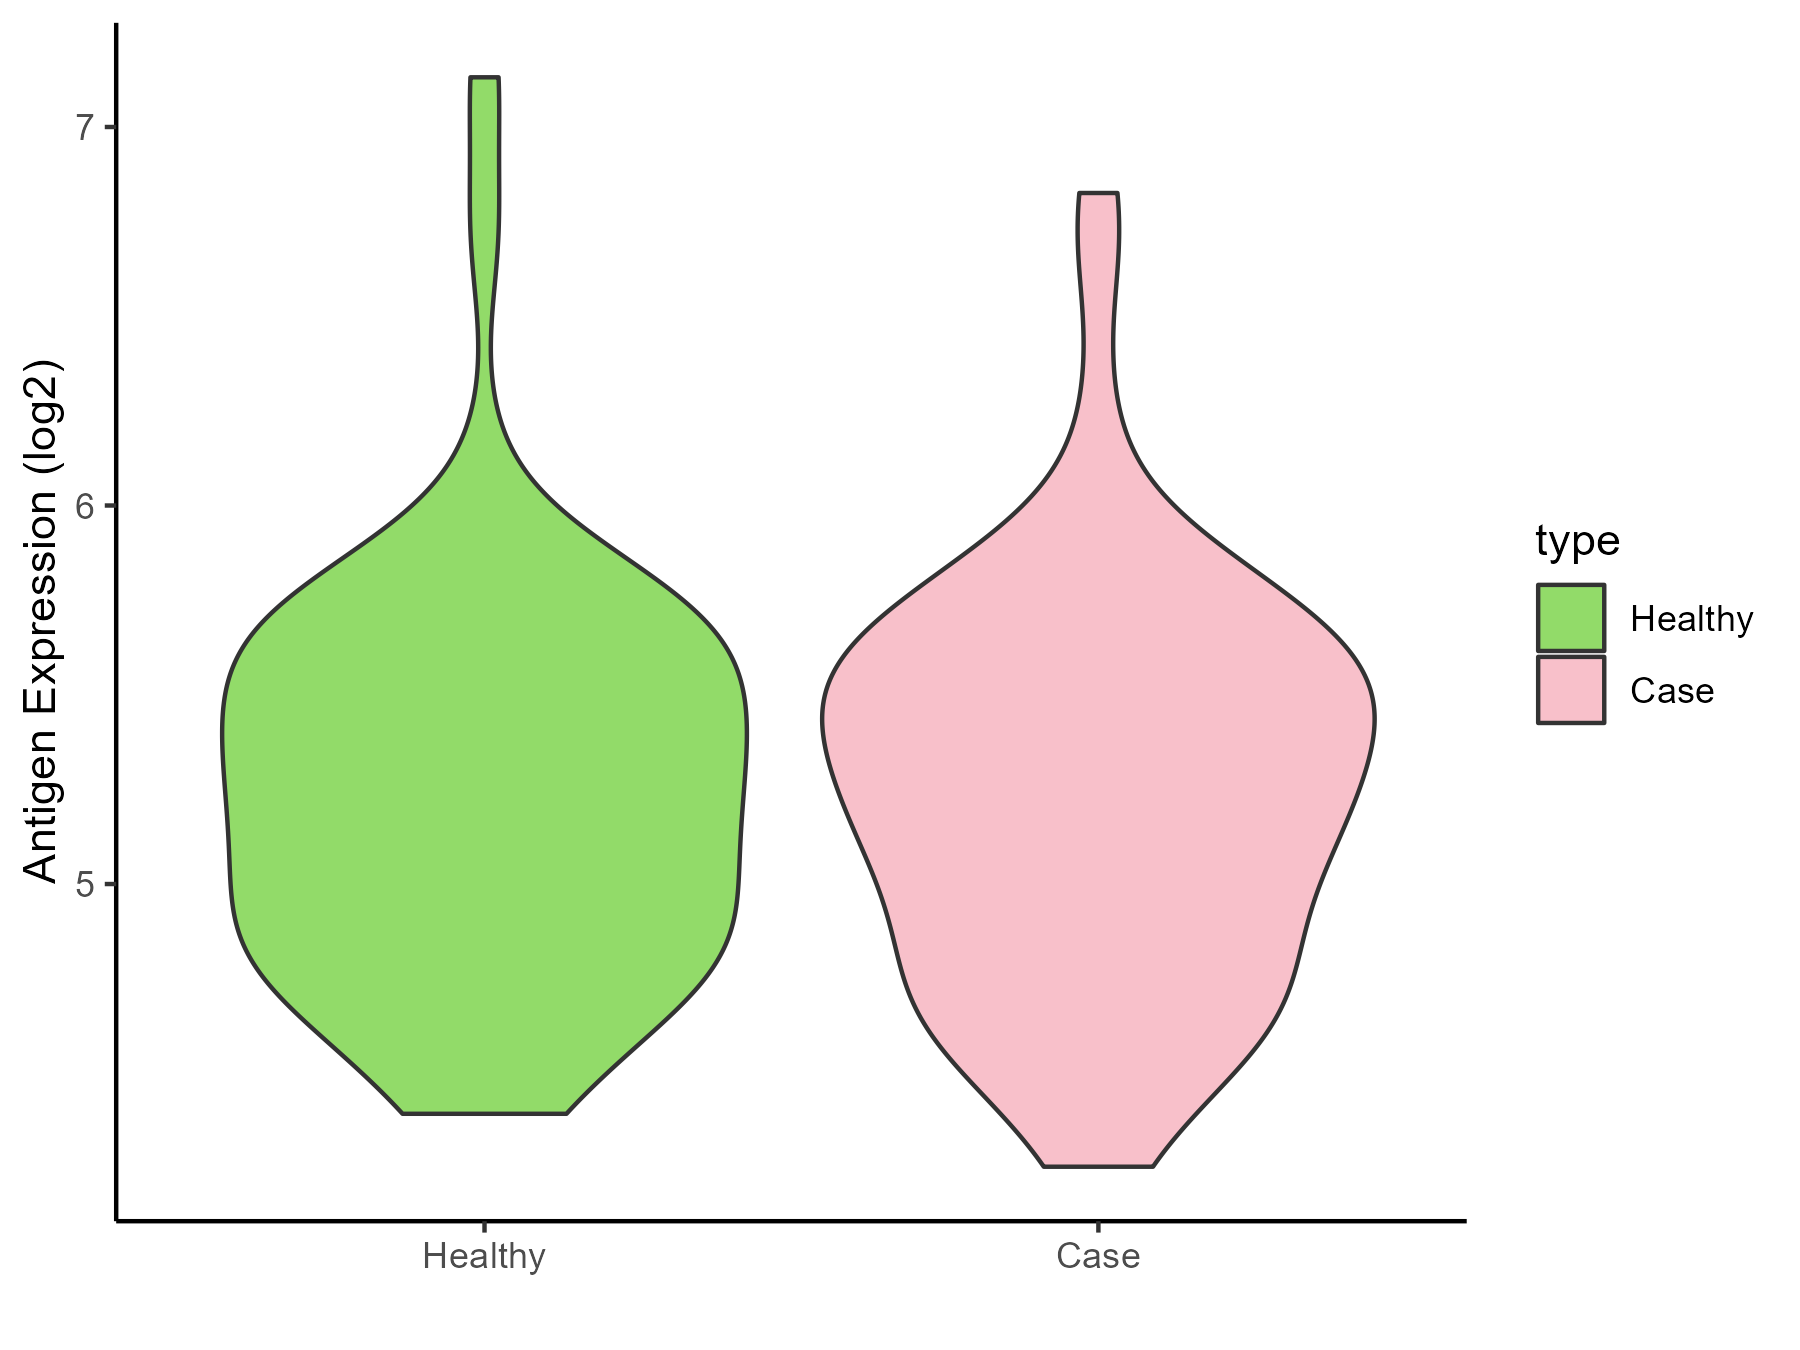
| Differential expression pattern of antigen in diseases | ||
| The Studied Tissue | Peripheral blood | |
| The Specific Disease | Myocardial infarction | |
| The Expression Level of Disease Section Compare with the Healthy Individual Tissue | p-value: 0.934394136; Fold-change: 0.007239546; Z-score: 0.013977294 | |
| Disease-specific Antigen Abundances |
|
Click to View the Clearer Original Diagram |
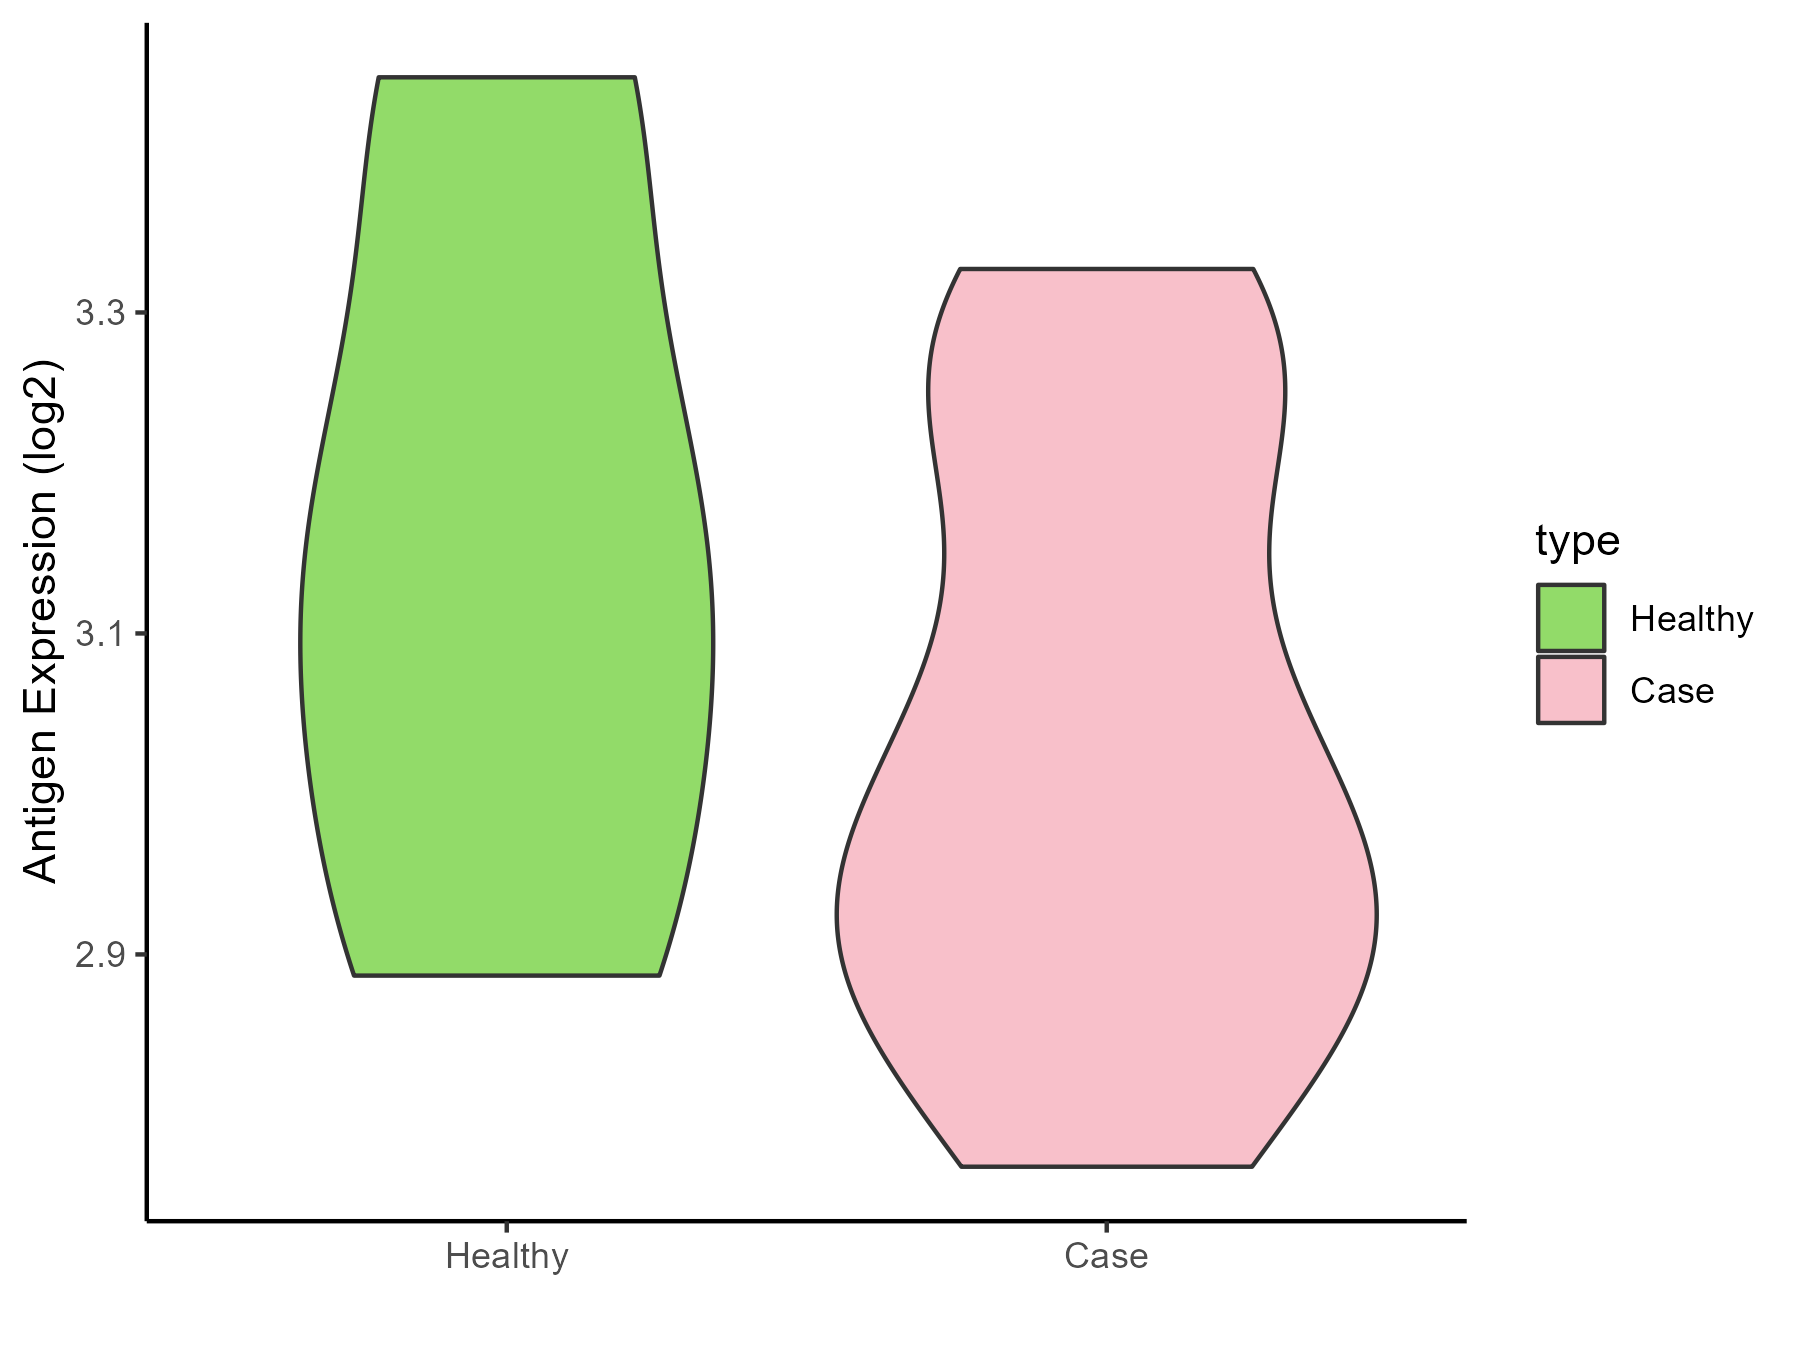
| Differential expression pattern of antigen in diseases | ||
| The Studied Tissue | Peripheral blood | |
| The Specific Disease | Coronary artery disease | |
| The Expression Level of Disease Section Compare with the Healthy Individual Tissue | p-value: 0.406978183; Fold-change: -0.146821723; Z-score: -0.620018326 | |
| Disease-specific Antigen Abundances |
|
Click to View the Clearer Original Diagram |
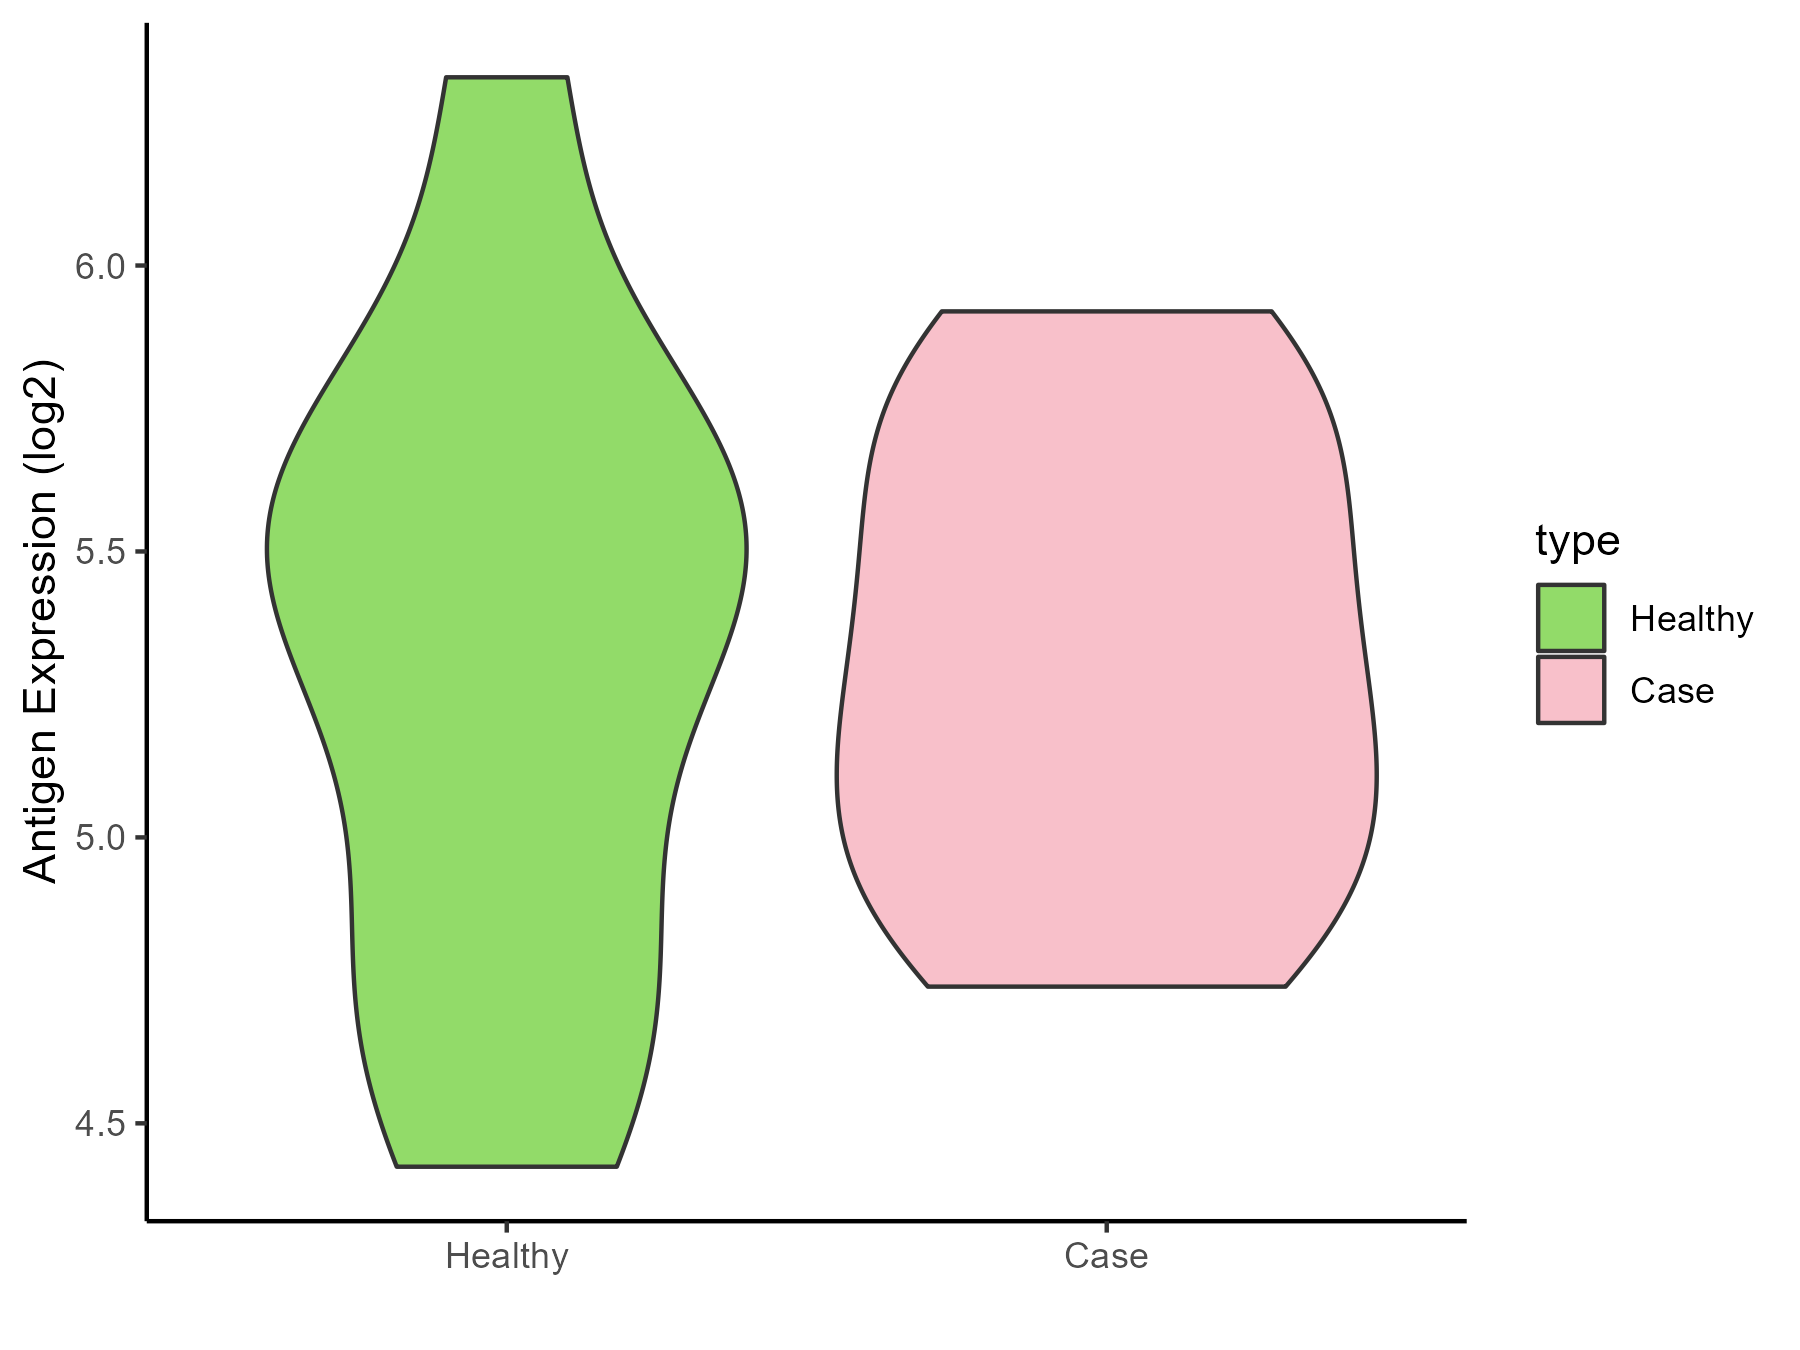
| Differential expression pattern of antigen in diseases | ||
| The Studied Tissue | Calcified aortic valve | |
| The Specific Disease | Aortic stenosis | |
| The Expression Level of Disease Section Compare with the Healthy Individual Tissue | p-value: 0.983187244; Fold-change: -0.179171999; Z-score: -0.312388909 | |
| Disease-specific Antigen Abundances |
|
Click to View the Clearer Original Diagram |
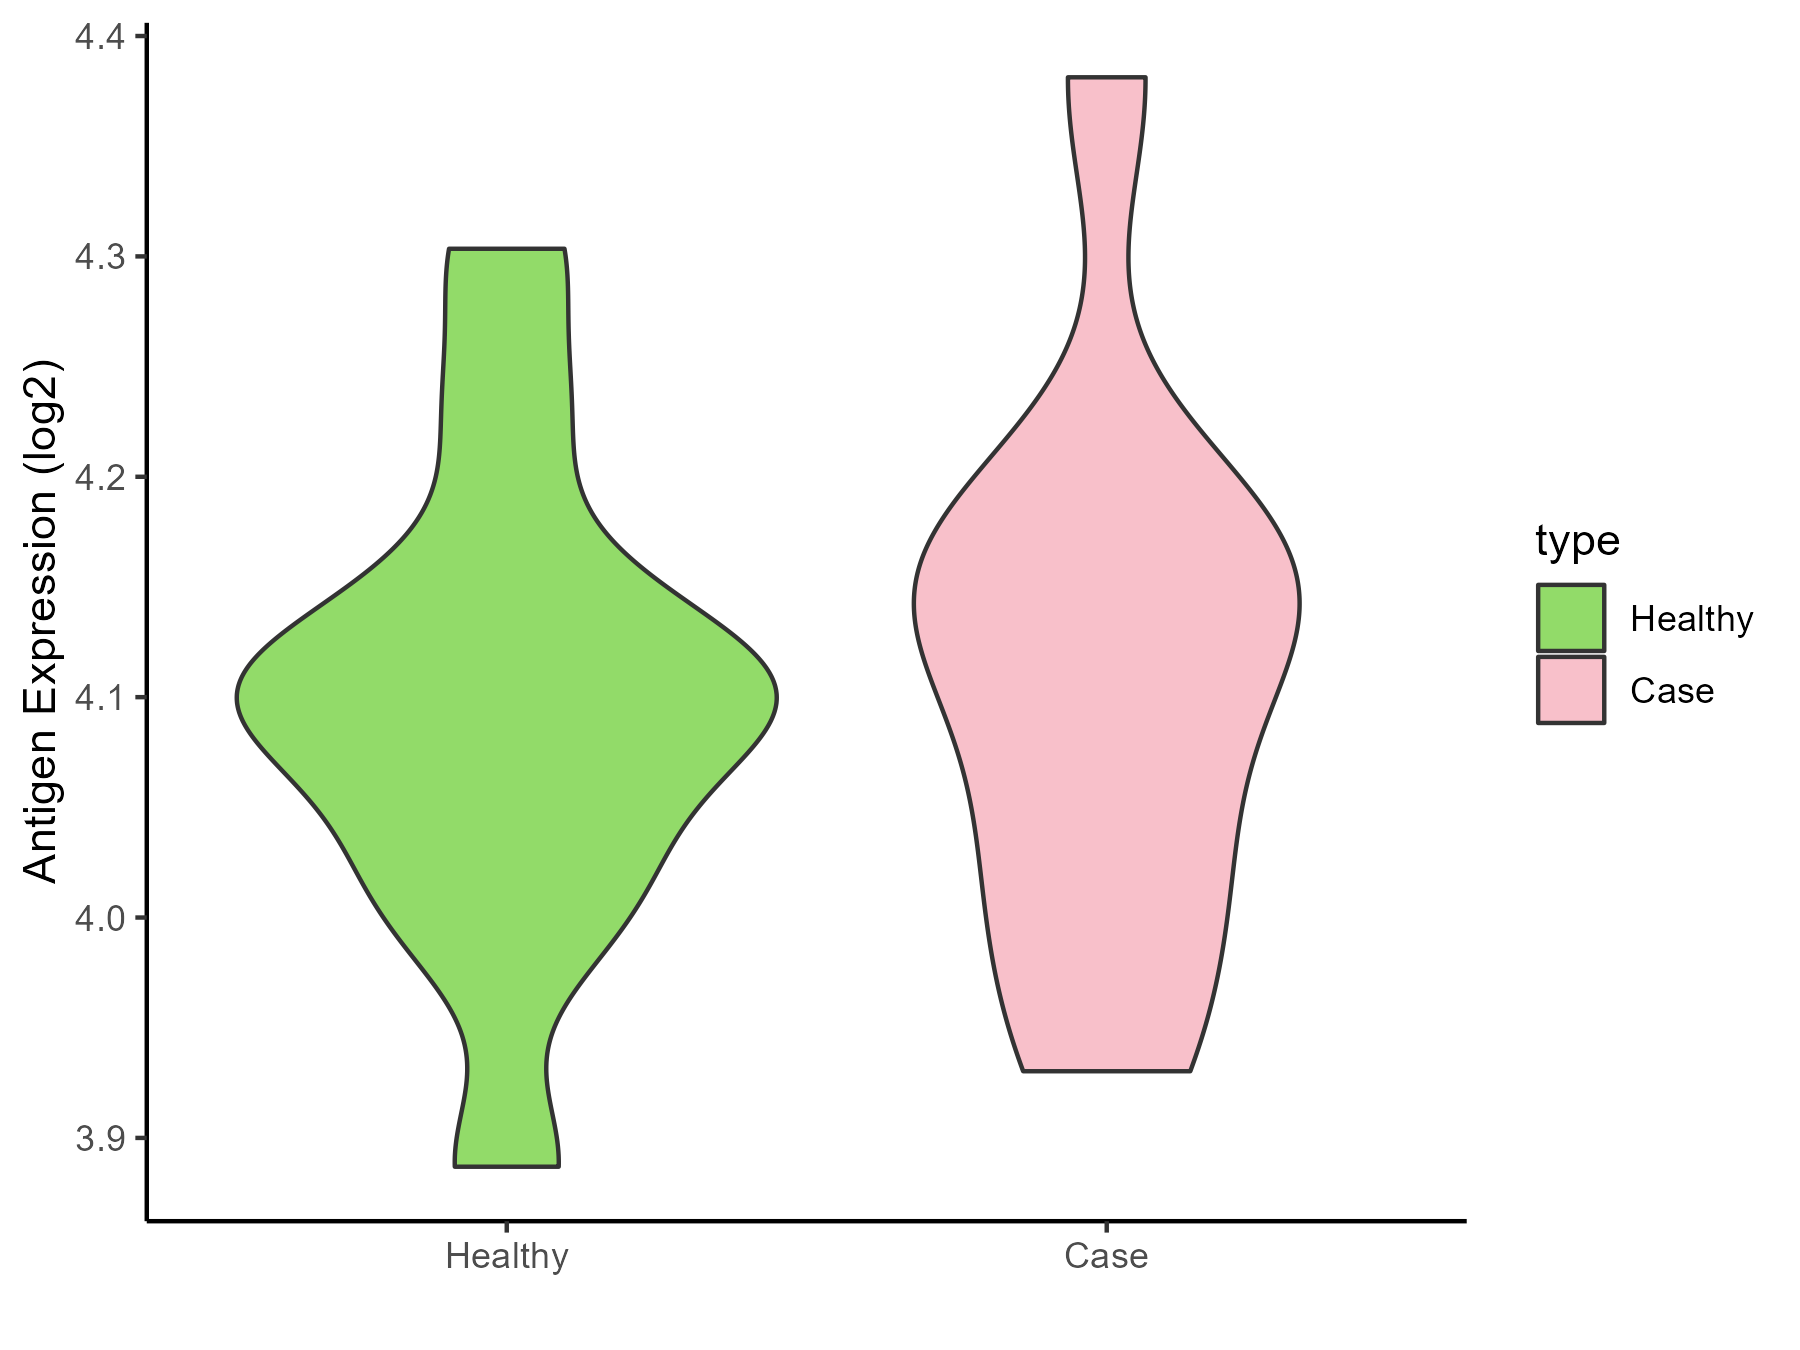
| Differential expression pattern of antigen in diseases | ||
| The Studied Tissue | Peripheral blood | |
| The Specific Disease | Arteriosclerosis | |
| The Expression Level of Disease Section Compare with the Healthy Individual Tissue | p-value: 0.768934333; Fold-change: 0.028090037; Z-score: 0.258069573 | |
| Disease-specific Antigen Abundances |
|
Click to View the Clearer Original Diagram |
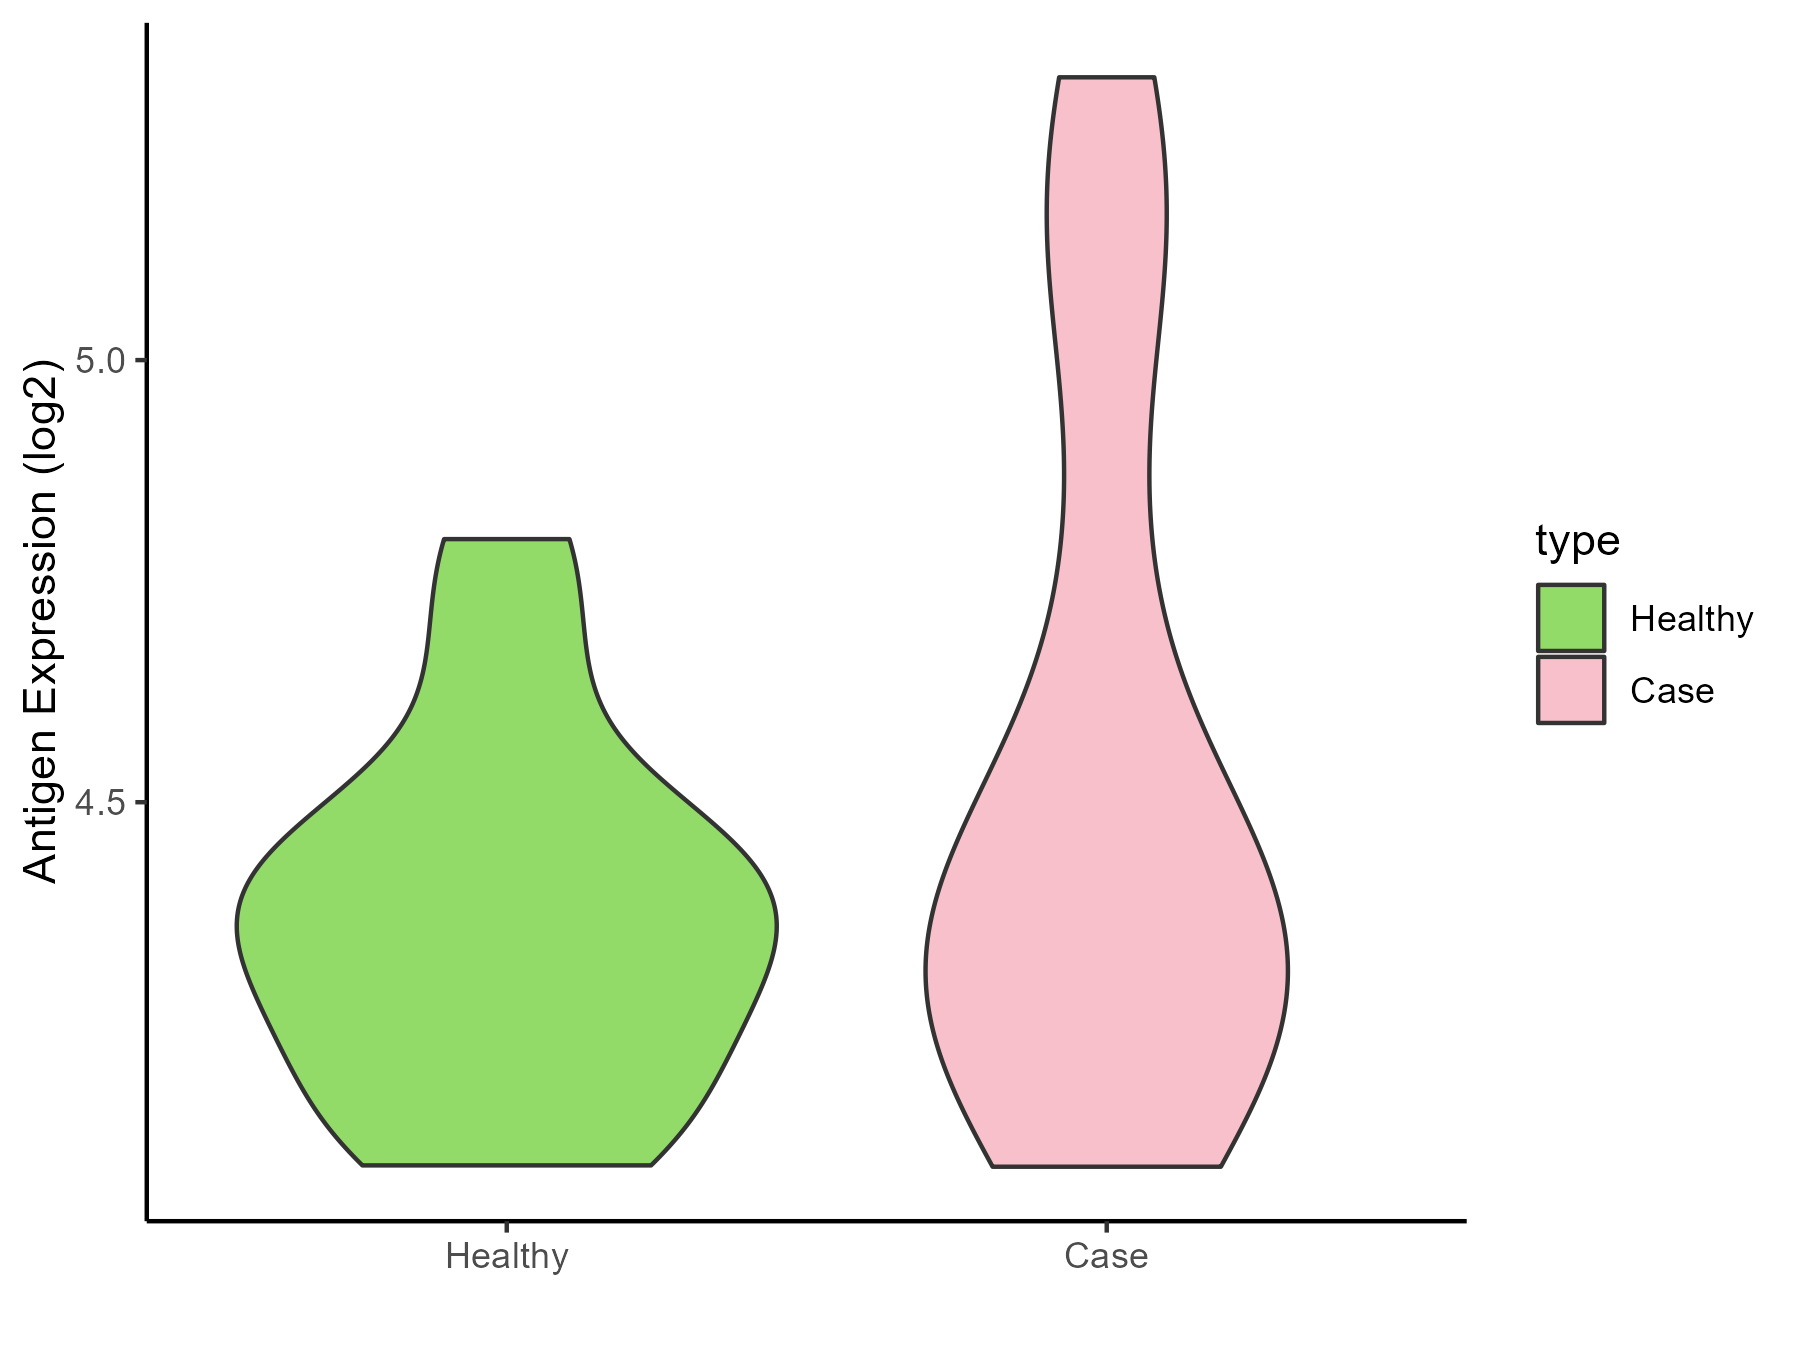
| Differential expression pattern of antigen in diseases | ||
| The Studied Tissue | Intracranial artery | |
| The Specific Disease | Aneurysm | |
| The Expression Level of Disease Section Compare with the Healthy Individual Tissue | p-value: 0.214657889; Fold-change: 0.000450033; Z-score: 0.002189076 | |
| Disease-specific Antigen Abundances |
|
Click to View the Clearer Original Diagram |
ICD Disease Classification 12
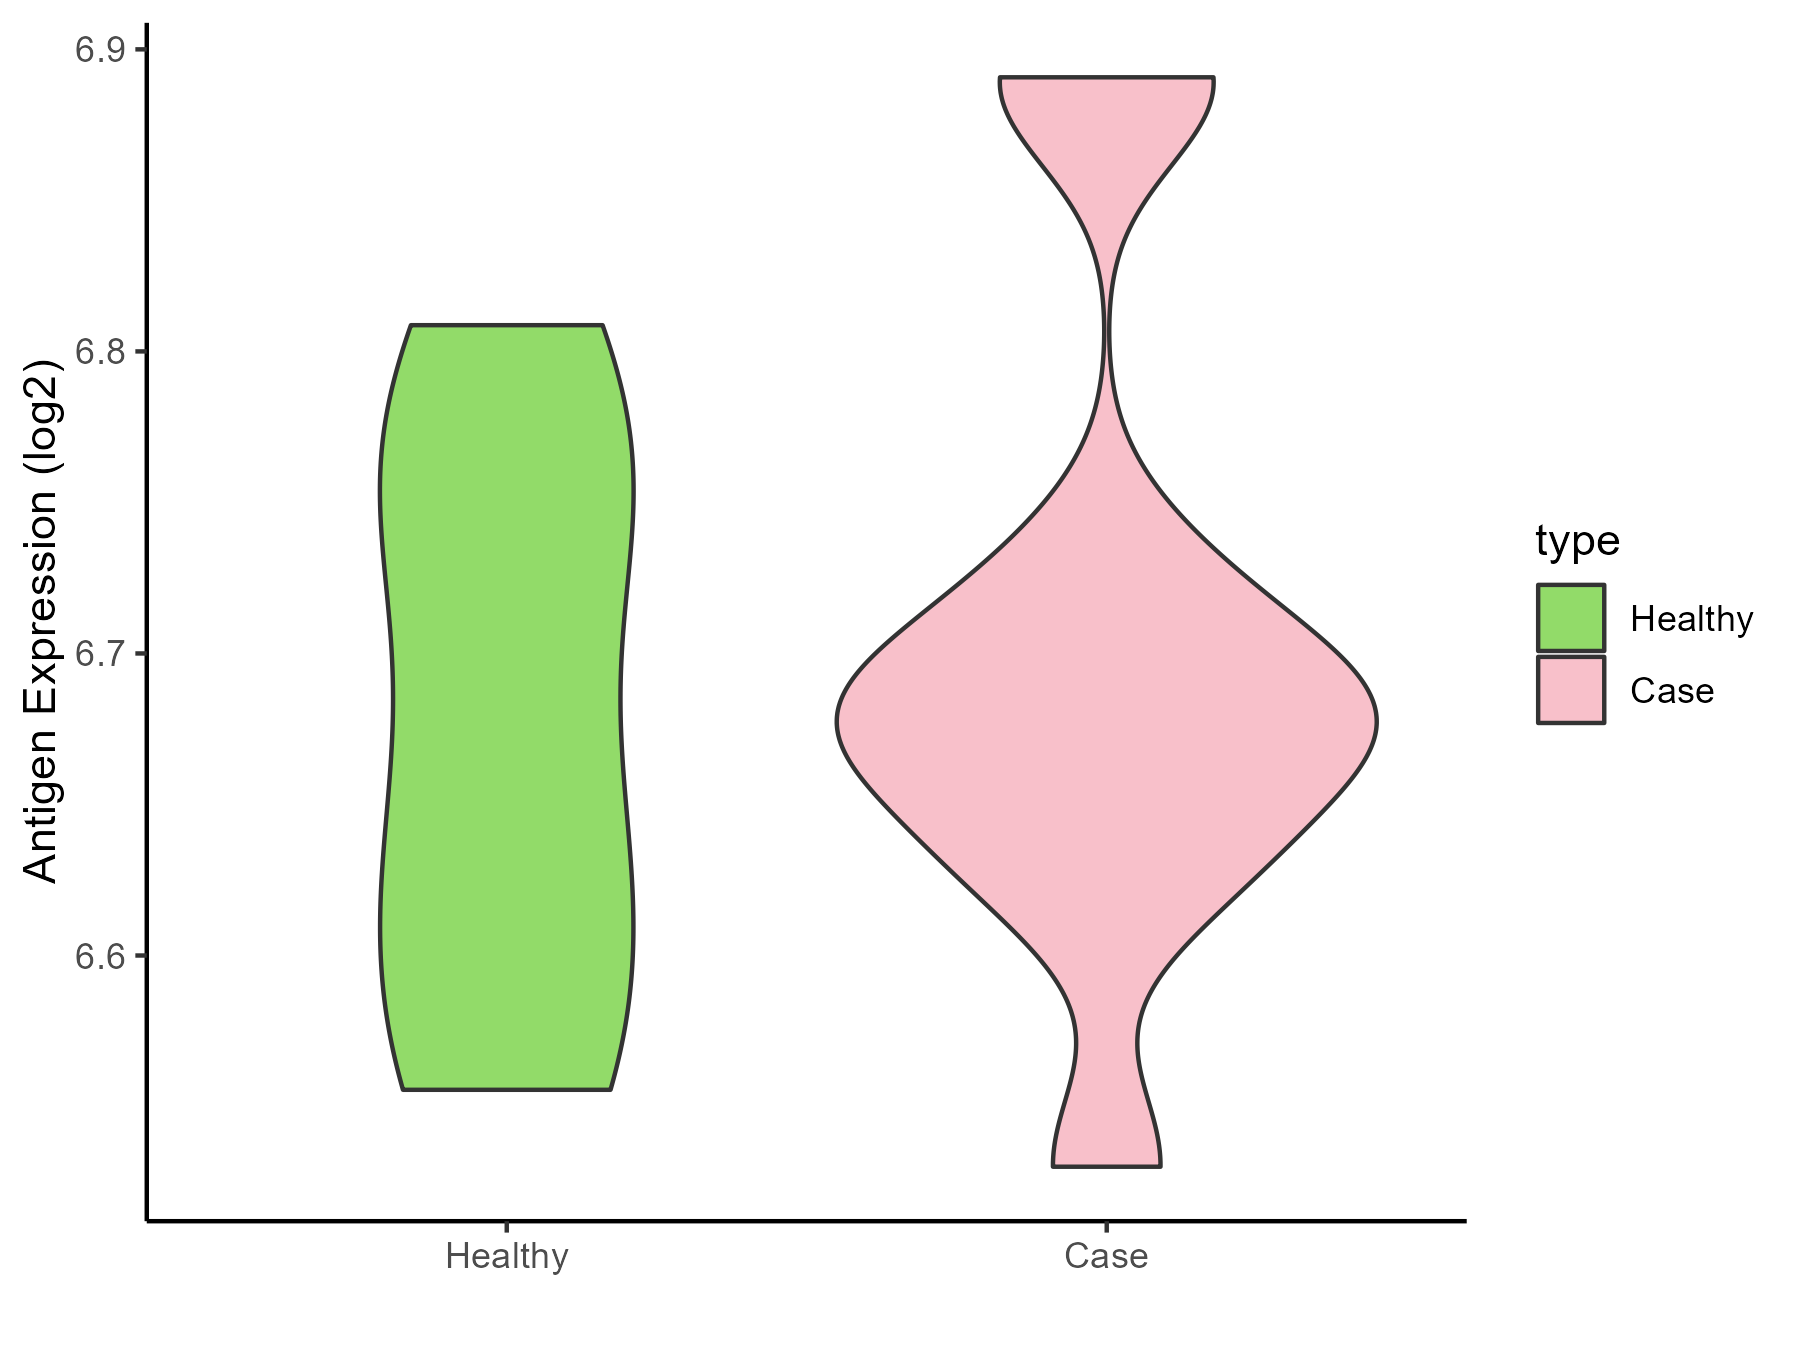
| Differential expression pattern of antigen in diseases | ||
| The Studied Tissue | Peripheral blood | |
| The Specific Disease | Immunodeficiency | |
| The Expression Level of Disease Section Compare with the Healthy Individual Tissue | p-value: 0.611480783; Fold-change: 0.01782516; Z-score: 0.186746712 | |
| Disease-specific Antigen Abundances |
|
Click to View the Clearer Original Diagram |
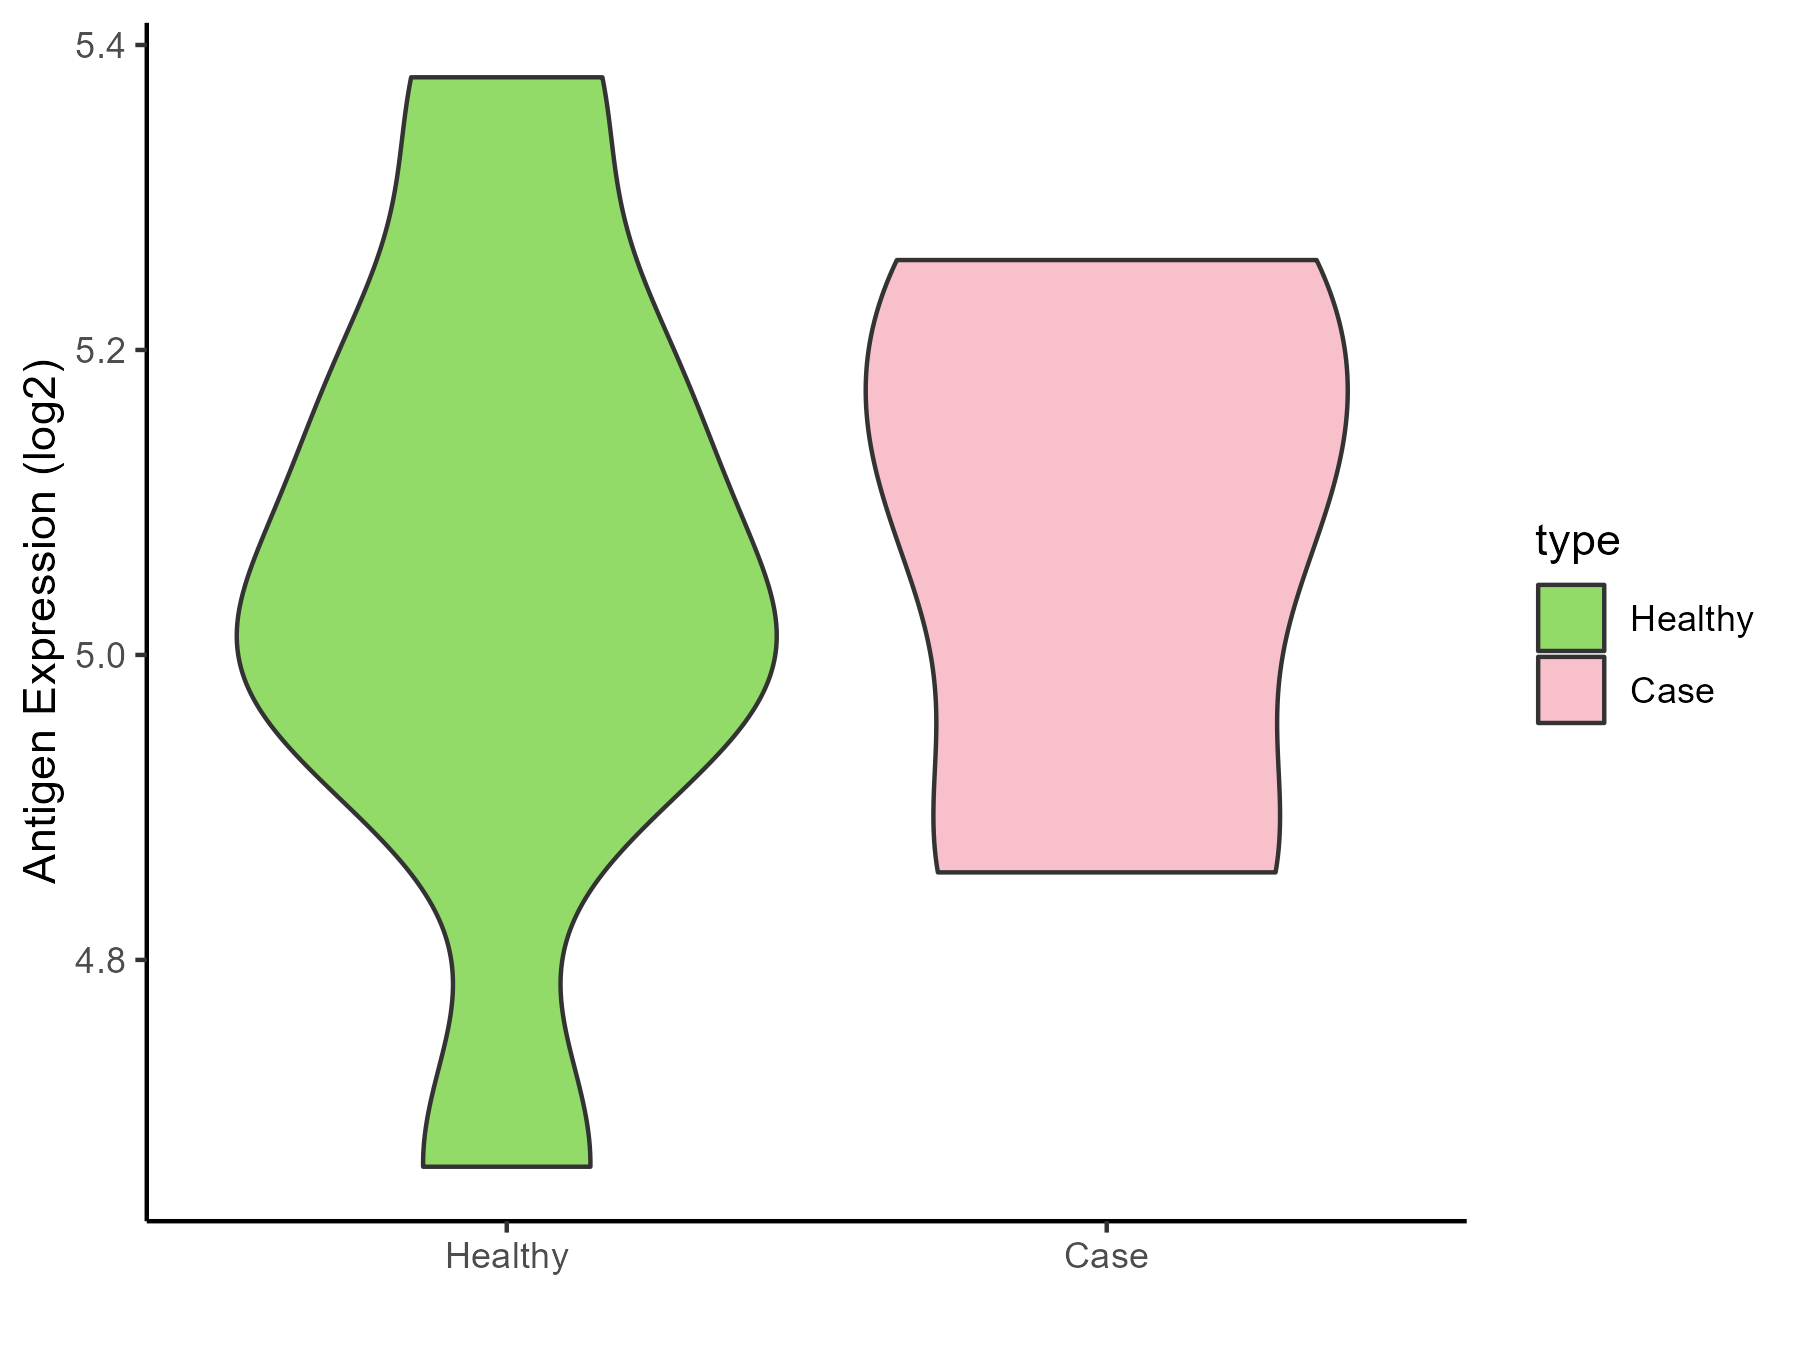
| Differential expression pattern of antigen in diseases | ||
| The Studied Tissue | Hyperplastic tonsil | |
| The Specific Disease | Apnea | |
| The Expression Level of Disease Section Compare with the Healthy Individual Tissue | p-value: 0.870845675; Fold-change: 0.093924708; Z-score: 0.419074129 | |
| Disease-specific Antigen Abundances |
|
Click to View the Clearer Original Diagram |
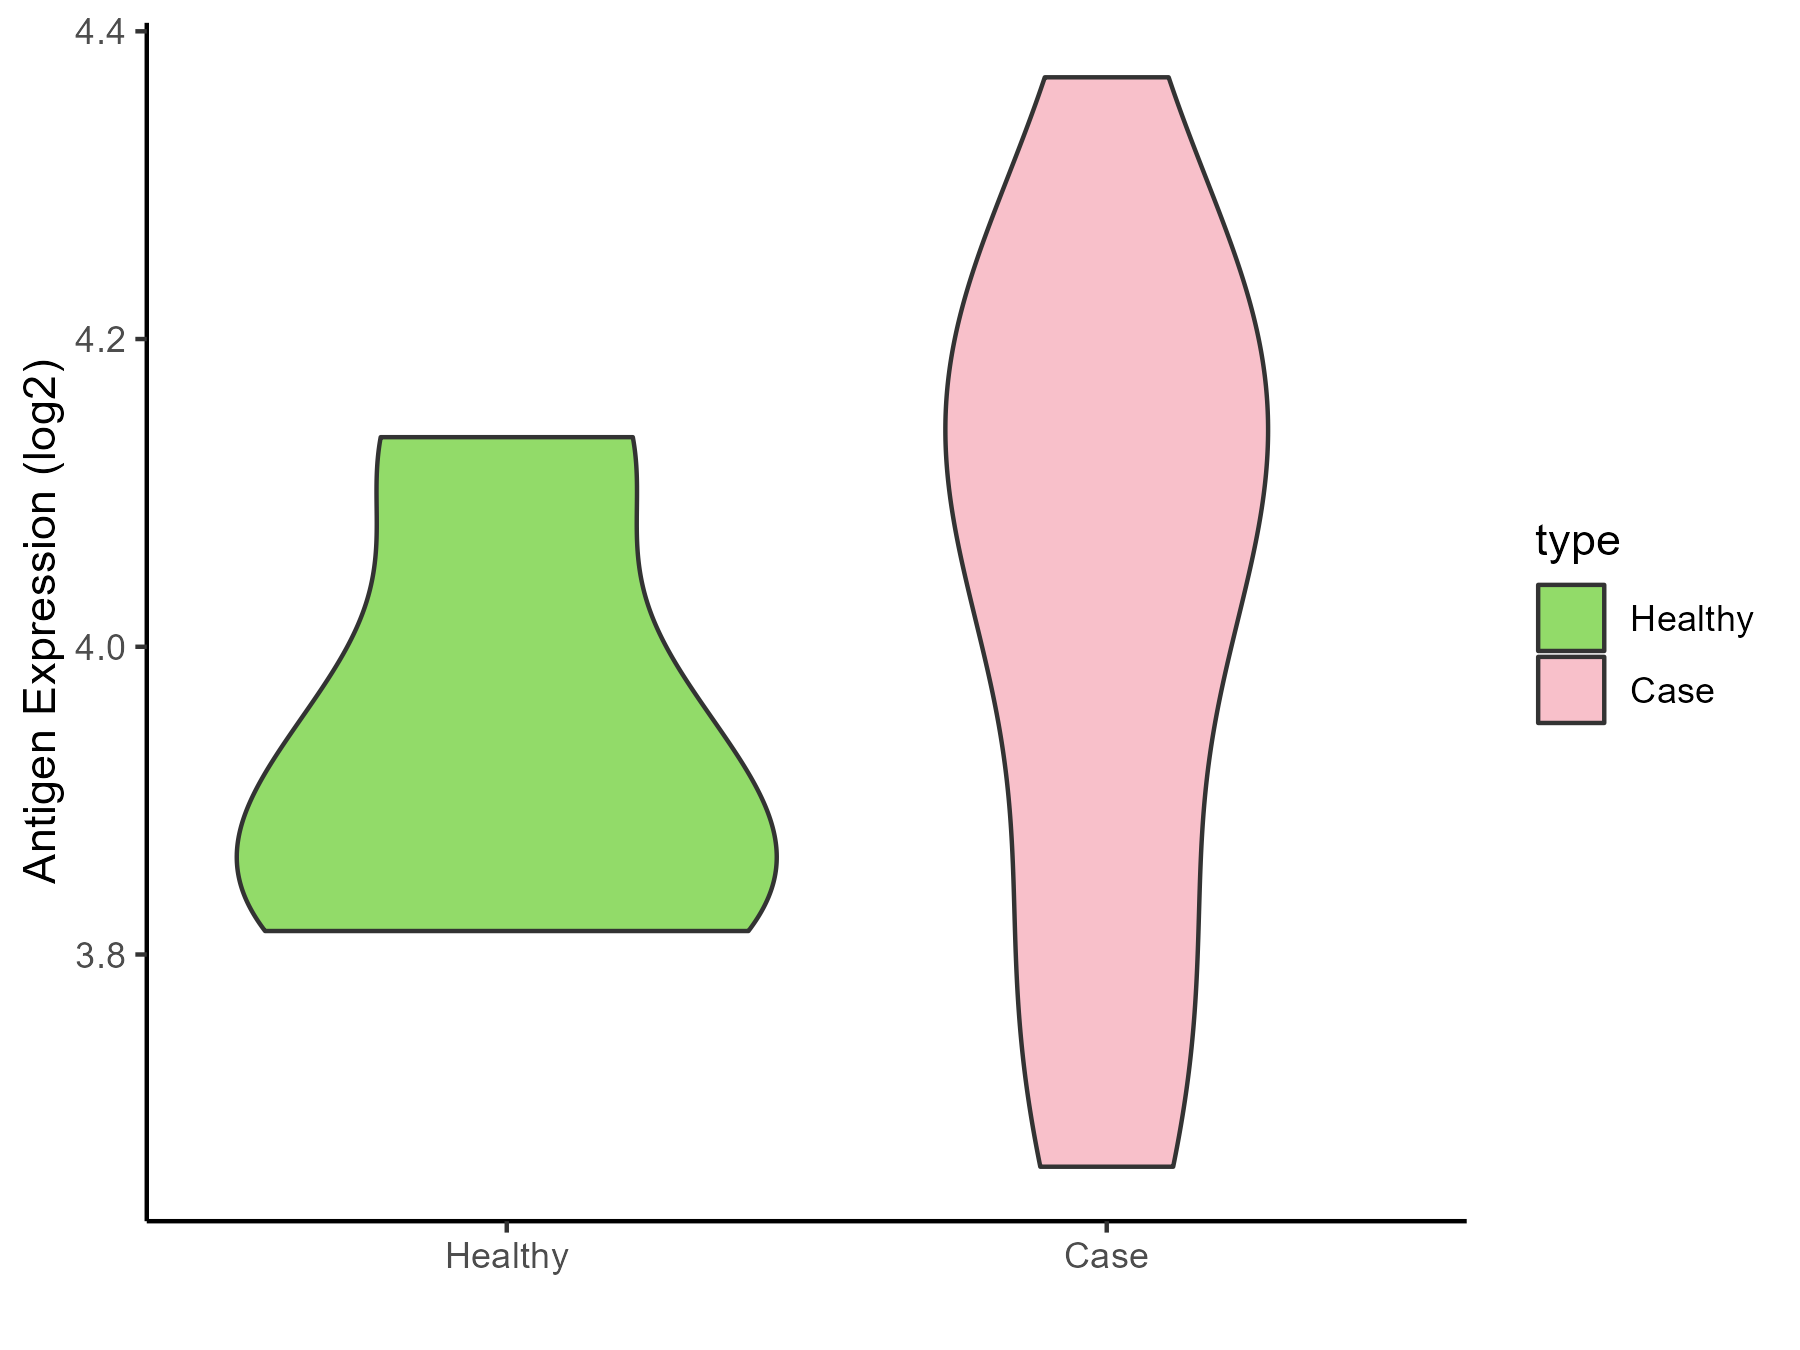
| Differential expression pattern of antigen in diseases | ||
| The Studied Tissue | Peripheral blood | |
| The Specific Disease | Olive pollen allergy | |
| The Expression Level of Disease Section Compare with the Healthy Individual Tissue | p-value: 0.364848077; Fold-change: 0.152073877; Z-score: 1.061917237 | |
| Disease-specific Antigen Abundances |
|
Click to View the Clearer Original Diagram |
| Differential expression pattern of antigen in diseases | ||
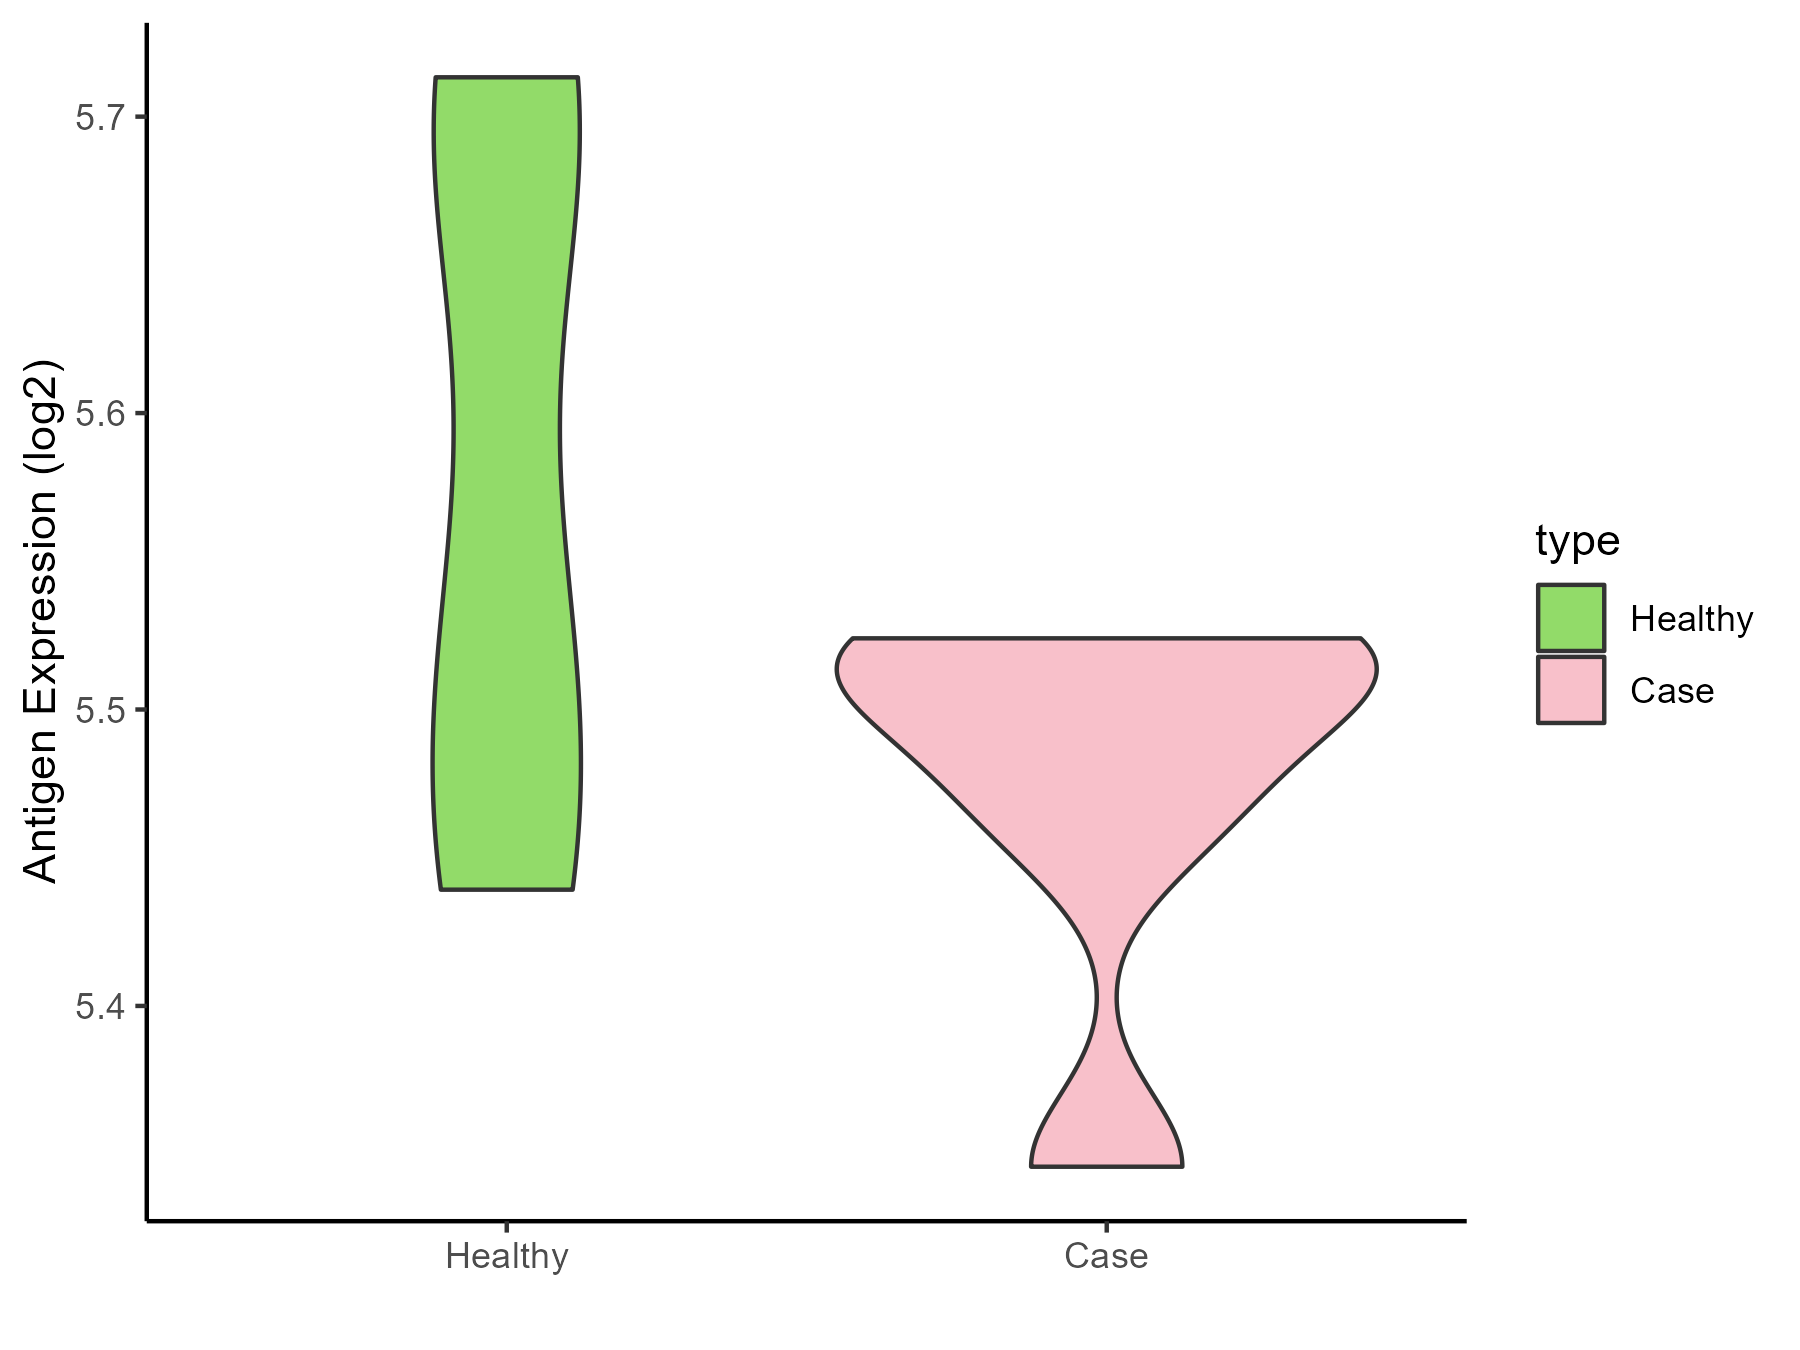
| The Studied Tissue | Sinus mucosa | |
| The Specific Disease | Chronic rhinosinusitis | |
| The Expression Level of Disease Section Compare with the Healthy Individual Tissue | p-value: 0.051653809; Fold-change: -0.045019963; Z-score: -0.37560726 | |
| Disease-specific Antigen Abundances |
|
Click to View the Clearer Original Diagram |
| Differential expression pattern of antigen in diseases | ||
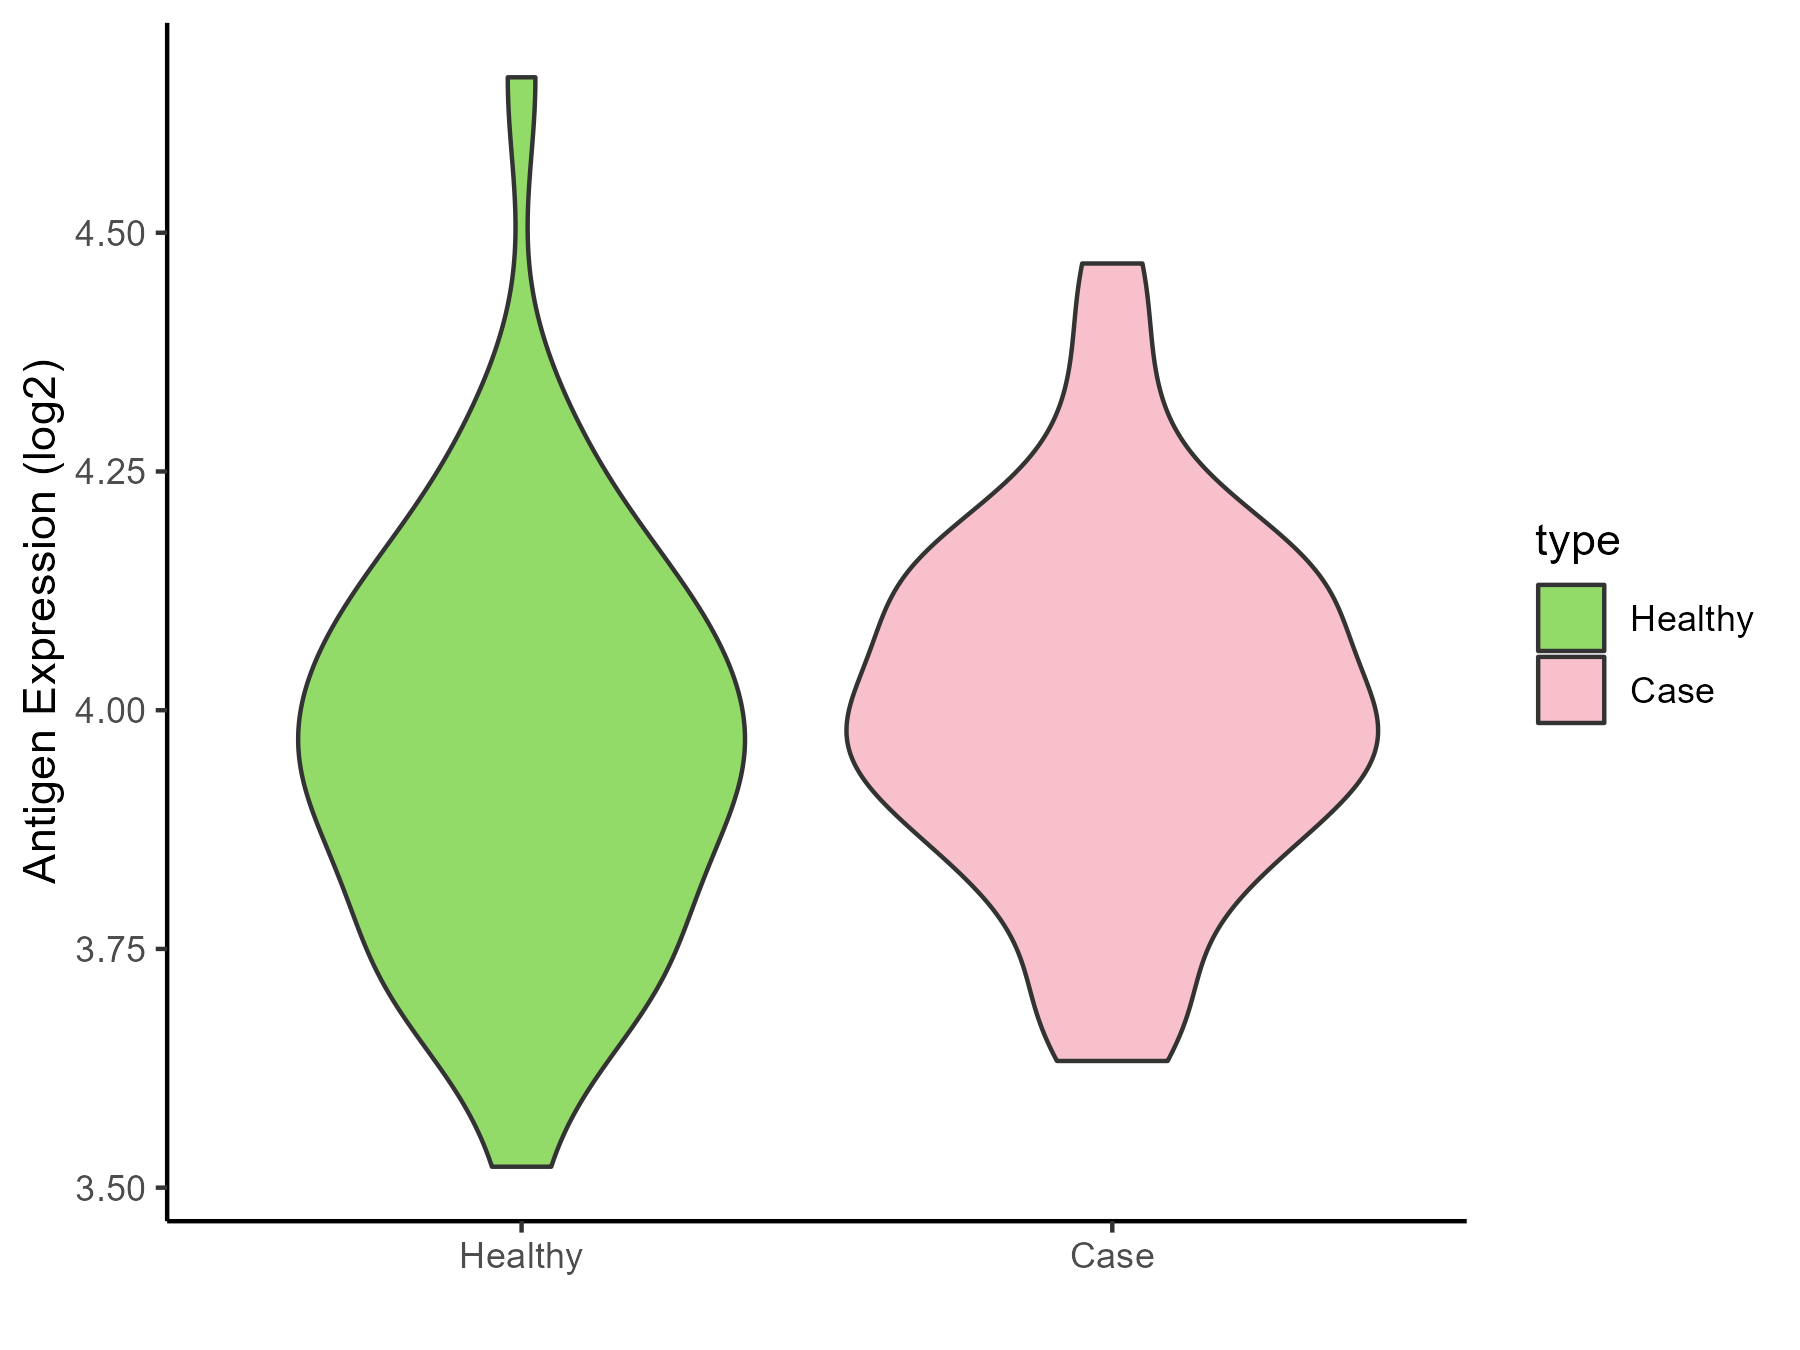
| The Studied Tissue | Lung | |
| The Specific Disease | Chronic obstructive pulmonary disease | |
| The Expression Level of Disease Section Compare with the Healthy Individual Tissue | p-value: 0.280398712; Fold-change: 0.053247213; Z-score: 0.244886164 | |
| Disease-specific Antigen Abundances |
|
Click to View the Clearer Original Diagram |
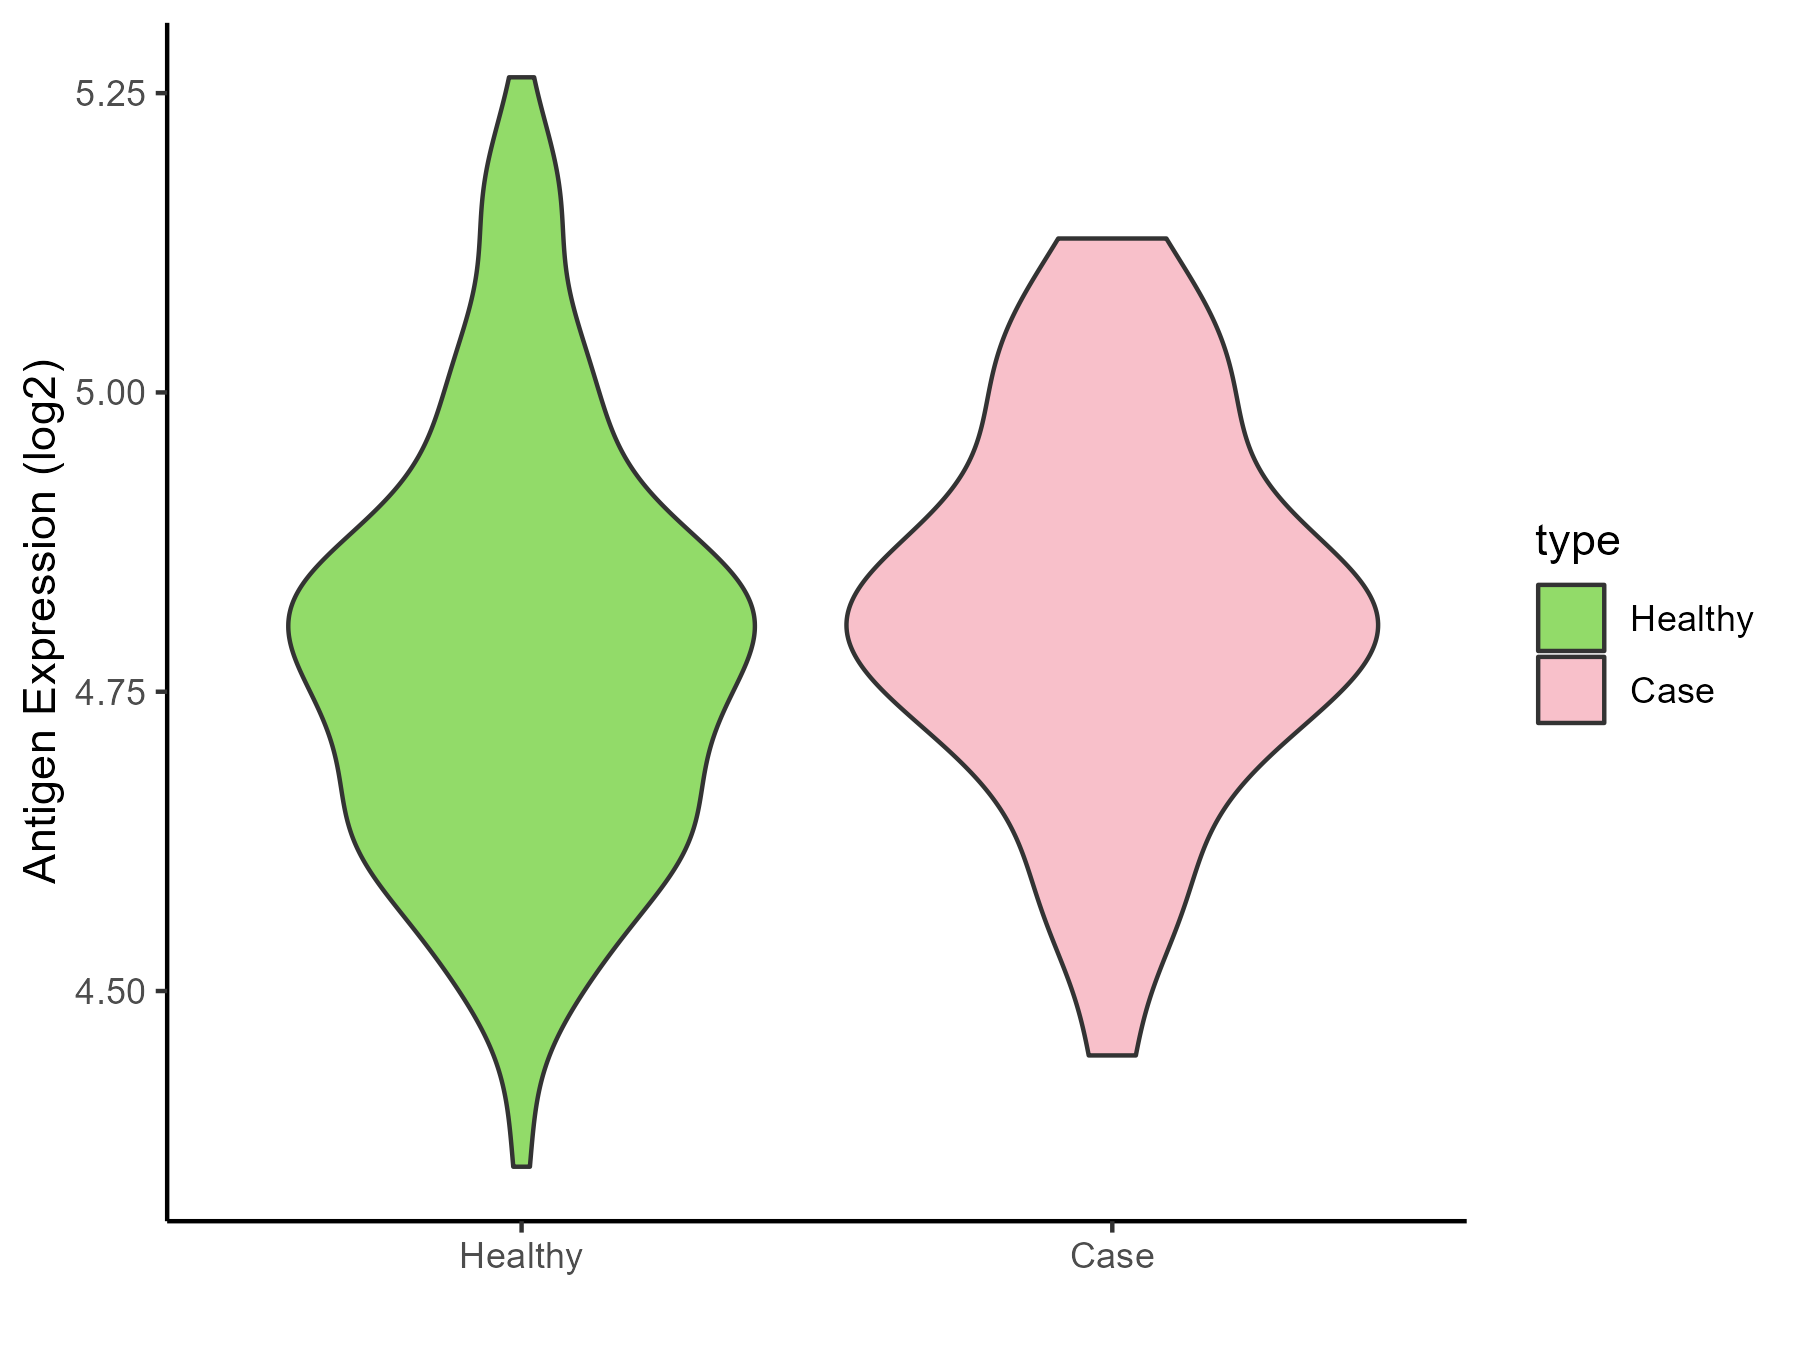
| The Studied Tissue | Small airway epithelium | |
| The Specific Disease | Chronic obstructive pulmonary disease | |
| The Expression Level of Disease Section Compare with the Healthy Individual Tissue | p-value: 0.189534955; Fold-change: 0.033906799; Z-score: 0.194953779 | |
| Disease-specific Antigen Abundances |
|
Click to View the Clearer Original Diagram |
| Differential expression pattern of antigen in diseases | ||
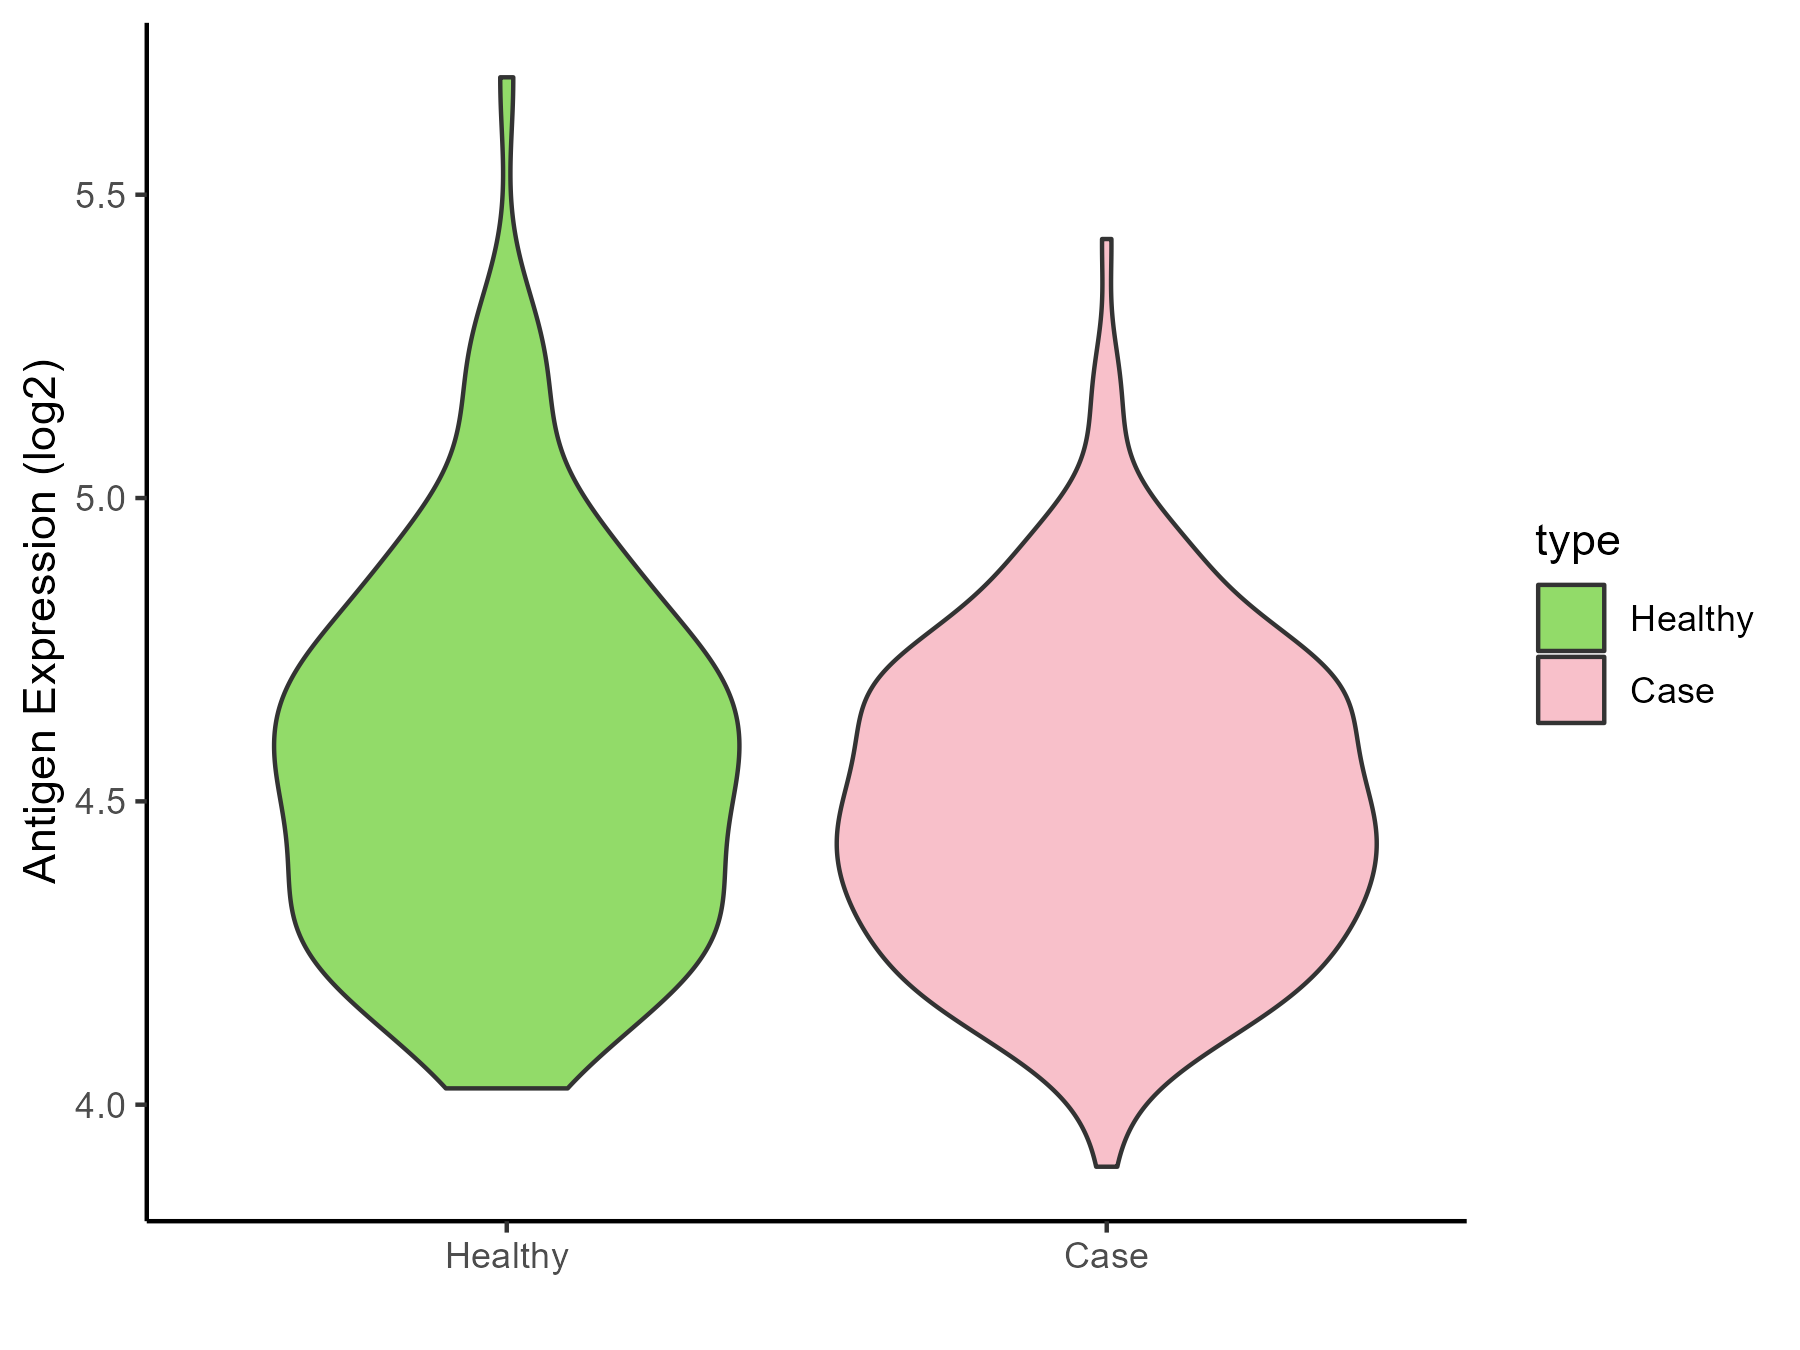
| The Studied Tissue | Nasal and bronchial airway | |
| The Specific Disease | Asthma | |
| The Expression Level of Disease Section Compare with the Healthy Individual Tissue | p-value: 0.059063769; Fold-change: -0.061366088; Z-score: -0.196564085 | |
| Disease-specific Antigen Abundances |
|
Click to View the Clearer Original Diagram |
| Differential expression pattern of antigen in diseases | ||
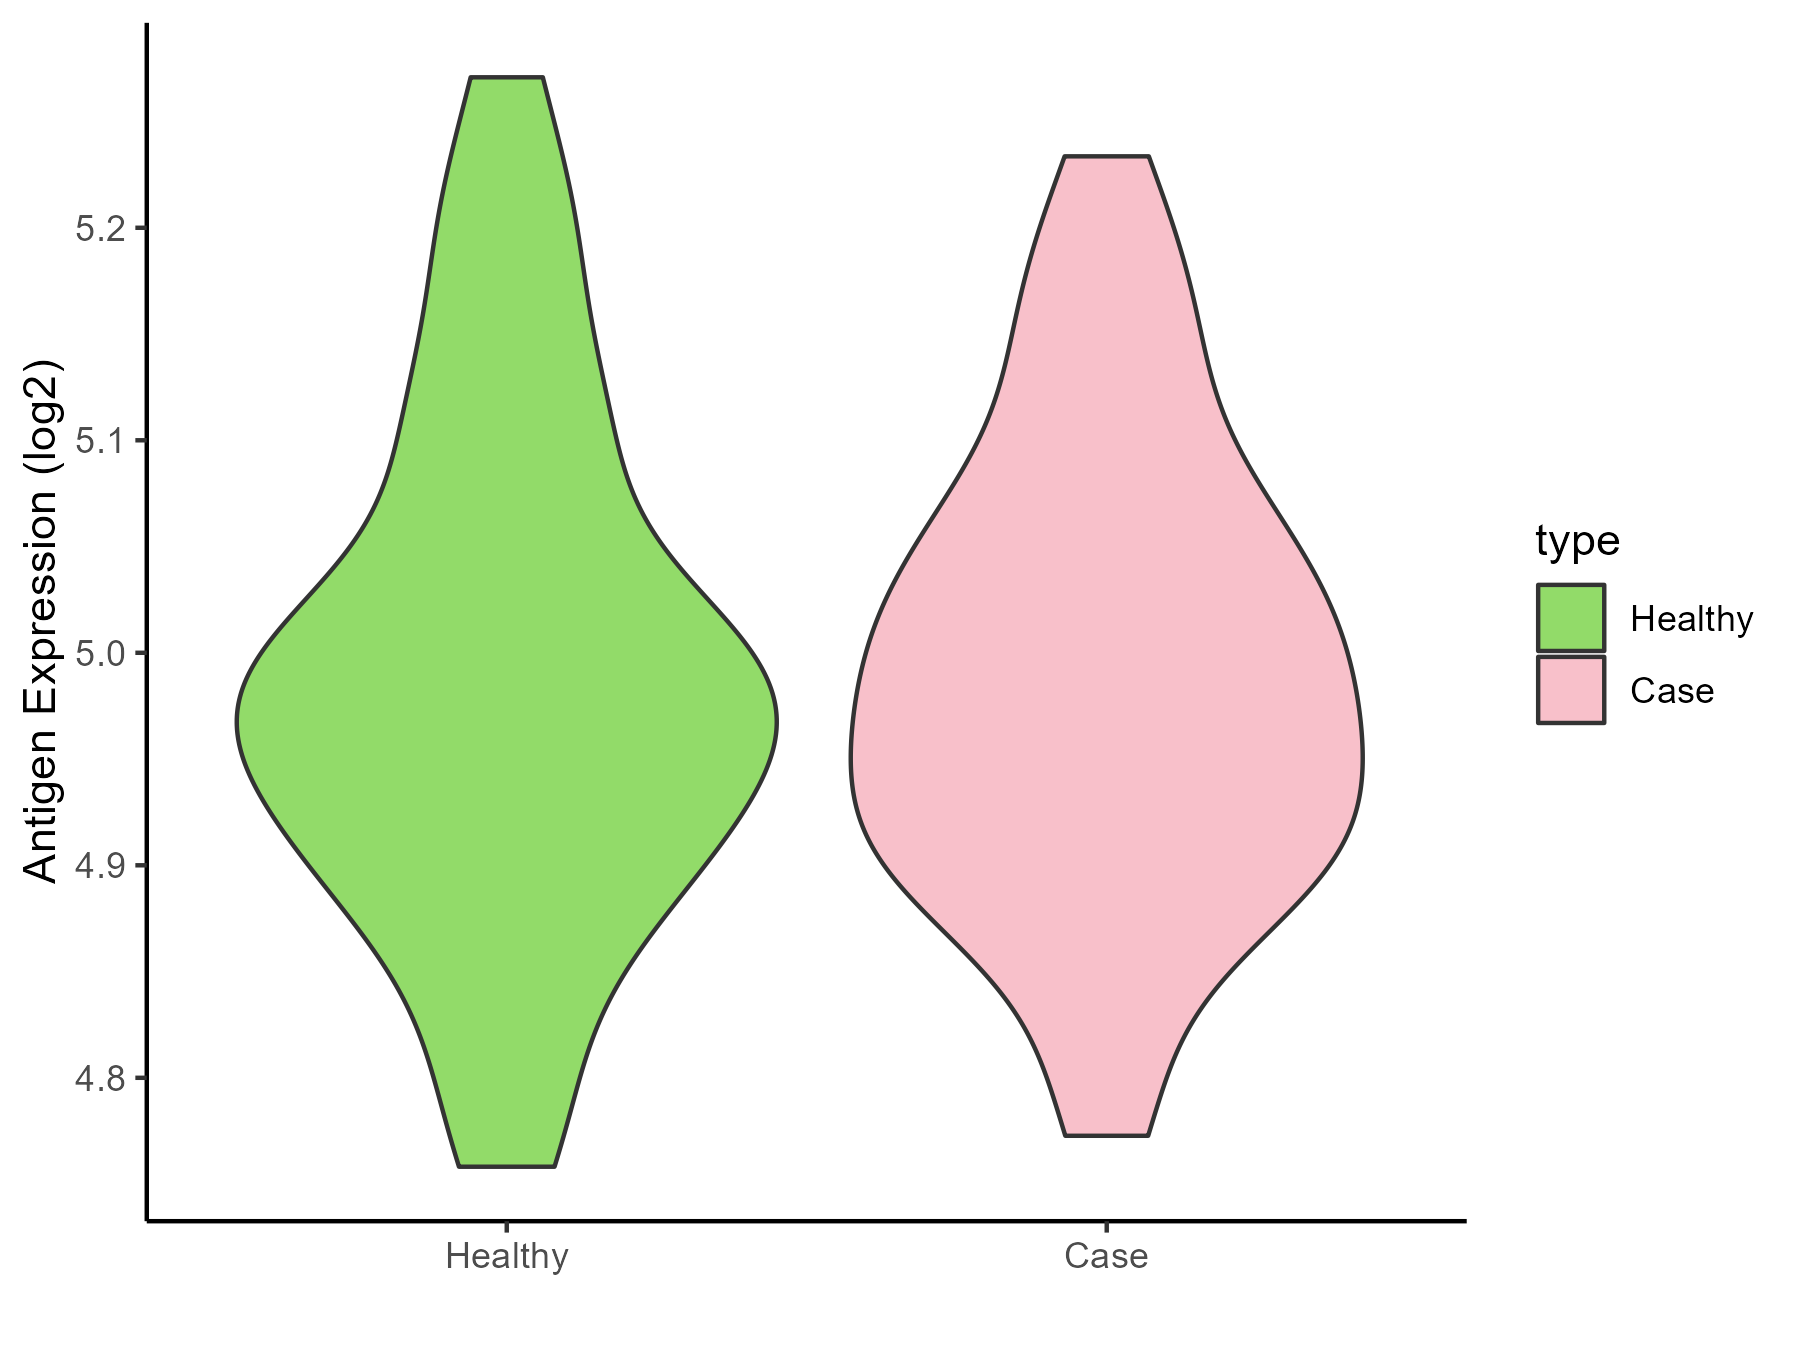
| The Studied Tissue | Nasal Epithelium | |
| The Specific Disease | Human rhinovirus infection | |
| The Expression Level of Disease Section Compare with the Healthy Individual Tissue | p-value: 0.996855259; Fold-change: 0.002822066; Z-score: 0.023214343 | |
| Disease-specific Antigen Abundances |
|
Click to View the Clearer Original Diagram |
| Differential expression pattern of antigen in diseases | ||
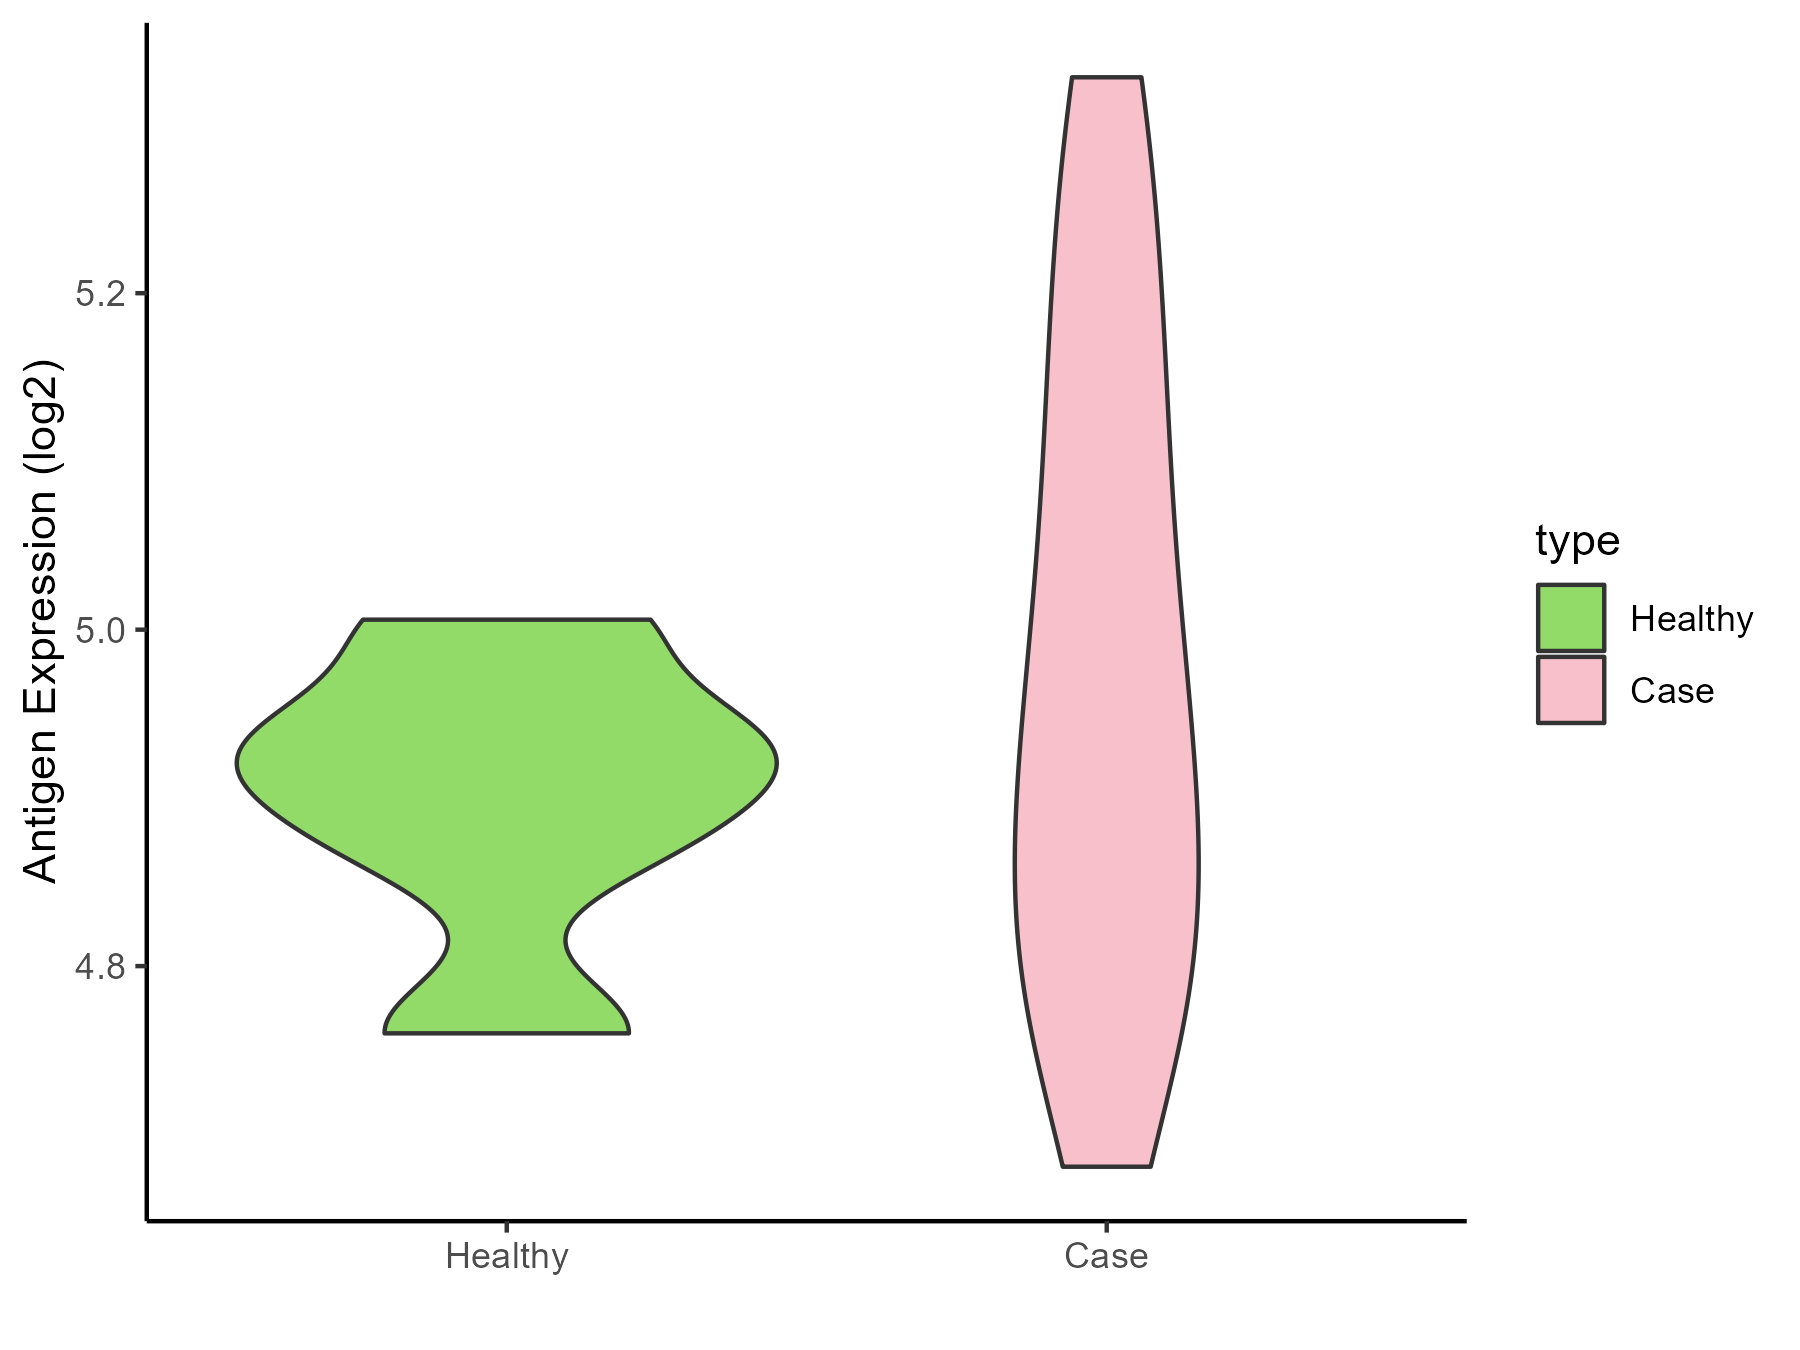
| The Studied Tissue | Lung | |
| The Specific Disease | Idiopathic pulmonary fibrosis | |
| The Expression Level of Disease Section Compare with the Healthy Individual Tissue | p-value: 0.226703546; Fold-change: 0.031228034; Z-score: 0.340973727 | |
| Disease-specific Antigen Abundances |
|
Click to View the Clearer Original Diagram |
ICD Disease Classification 13
| Differential expression pattern of antigen in diseases | ||
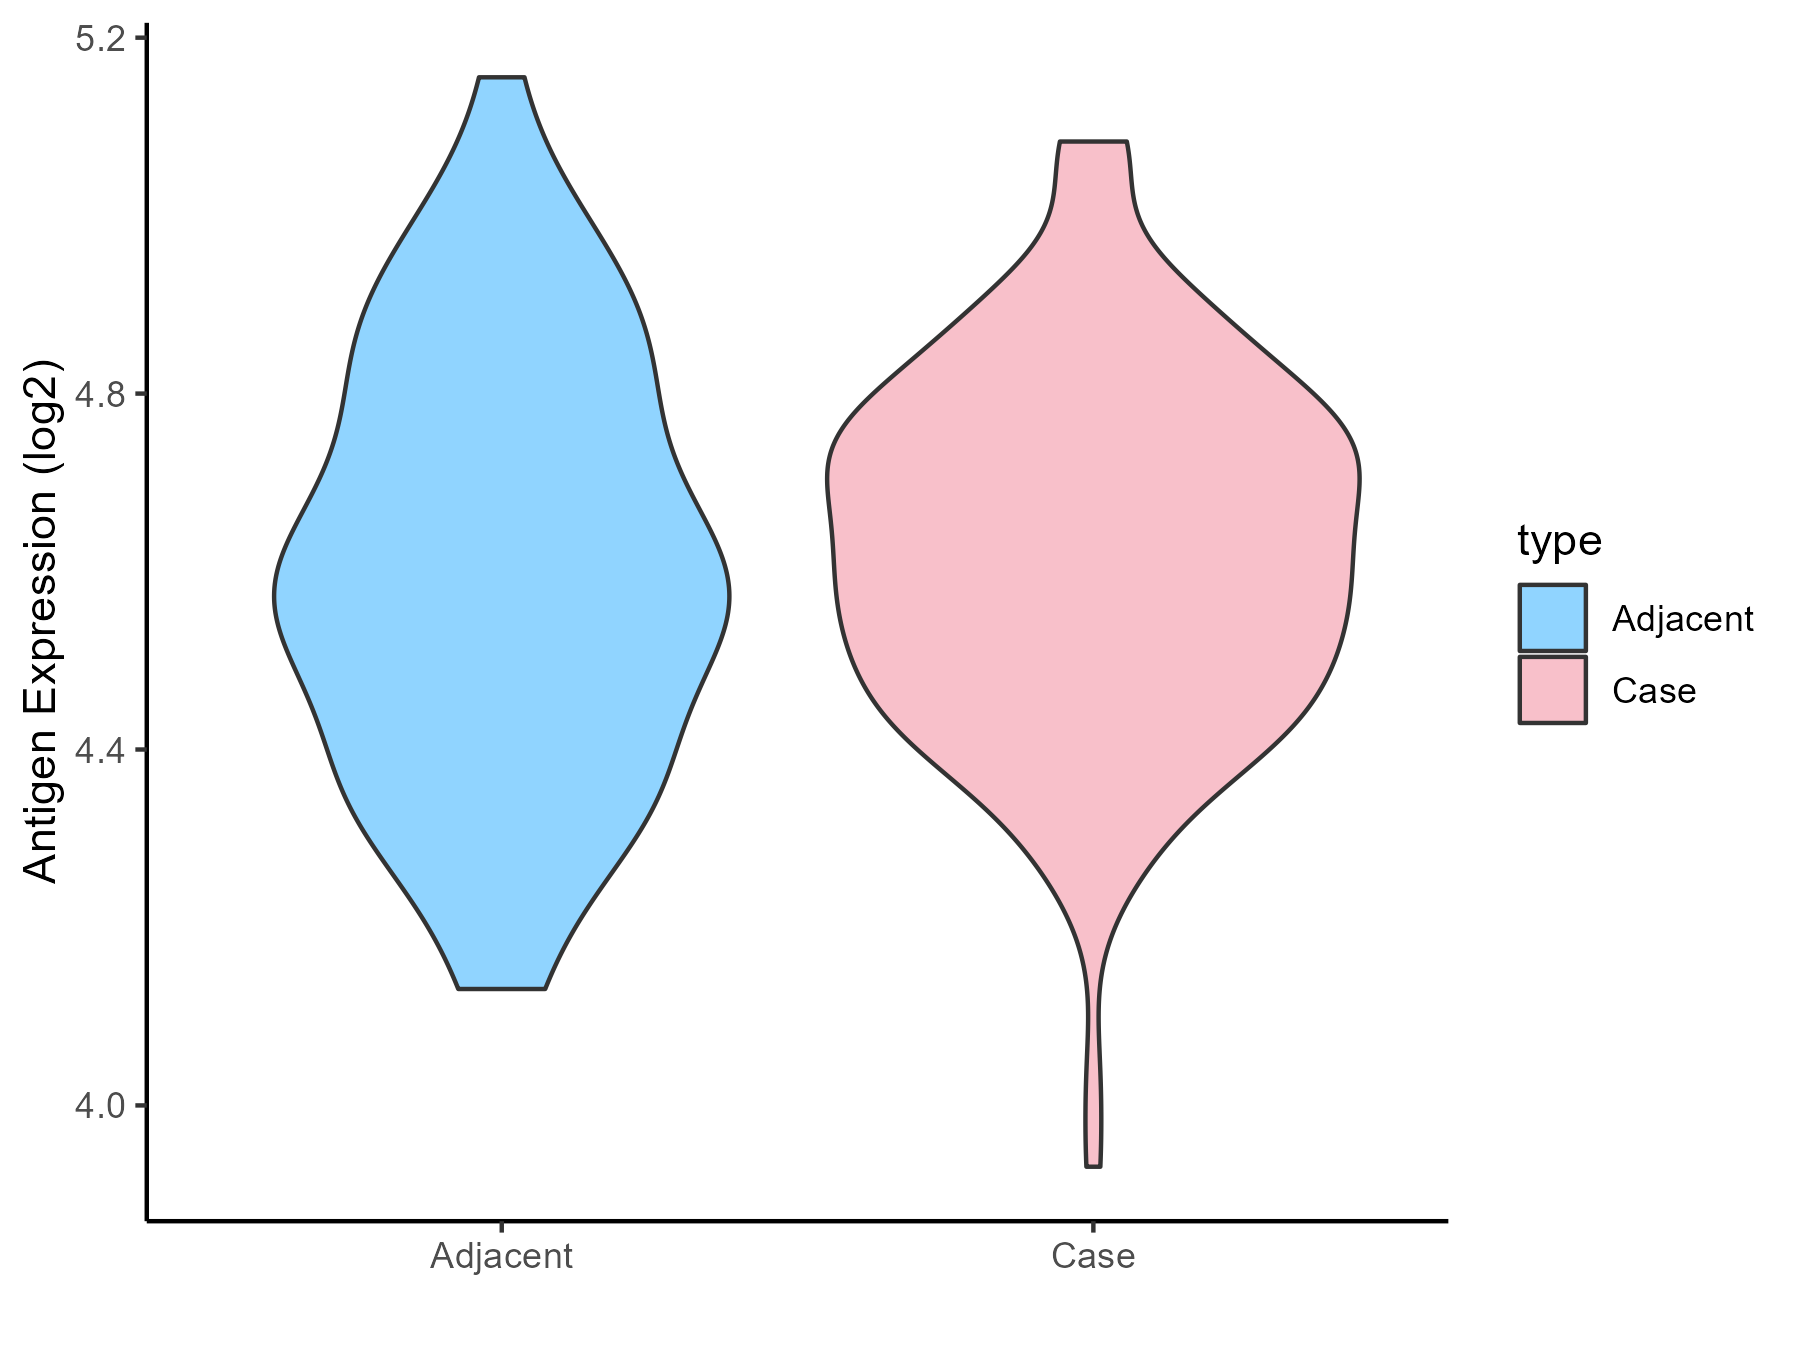
| The Studied Tissue | Gingival | |
| The Specific Disease | Periodontal disease | |
| The Expression Level of Disease Section Compare with the Adjacent Tissue | p-value: 0.543628468; Fold-change: 0.063645517; Z-score: 0.266948242 | |
| Disease-specific Antigen Abundances |
|
Click to View the Clearer Original Diagram |
| Differential expression pattern of antigen in diseases | ||
| The Studied Tissue | Gastric antrum | |
| The Specific Disease | Eosinophilic gastritis | |
| The Expression Level of Disease Section Compare with the Adjacent Tissue | p-value: 0.508199555; Fold-change: 0.136304205; Z-score: 0.74203722 | |
| Disease-specific Antigen Abundances |

|
Click to View the Clearer Original Diagram |
| Differential expression pattern of antigen in diseases | ||
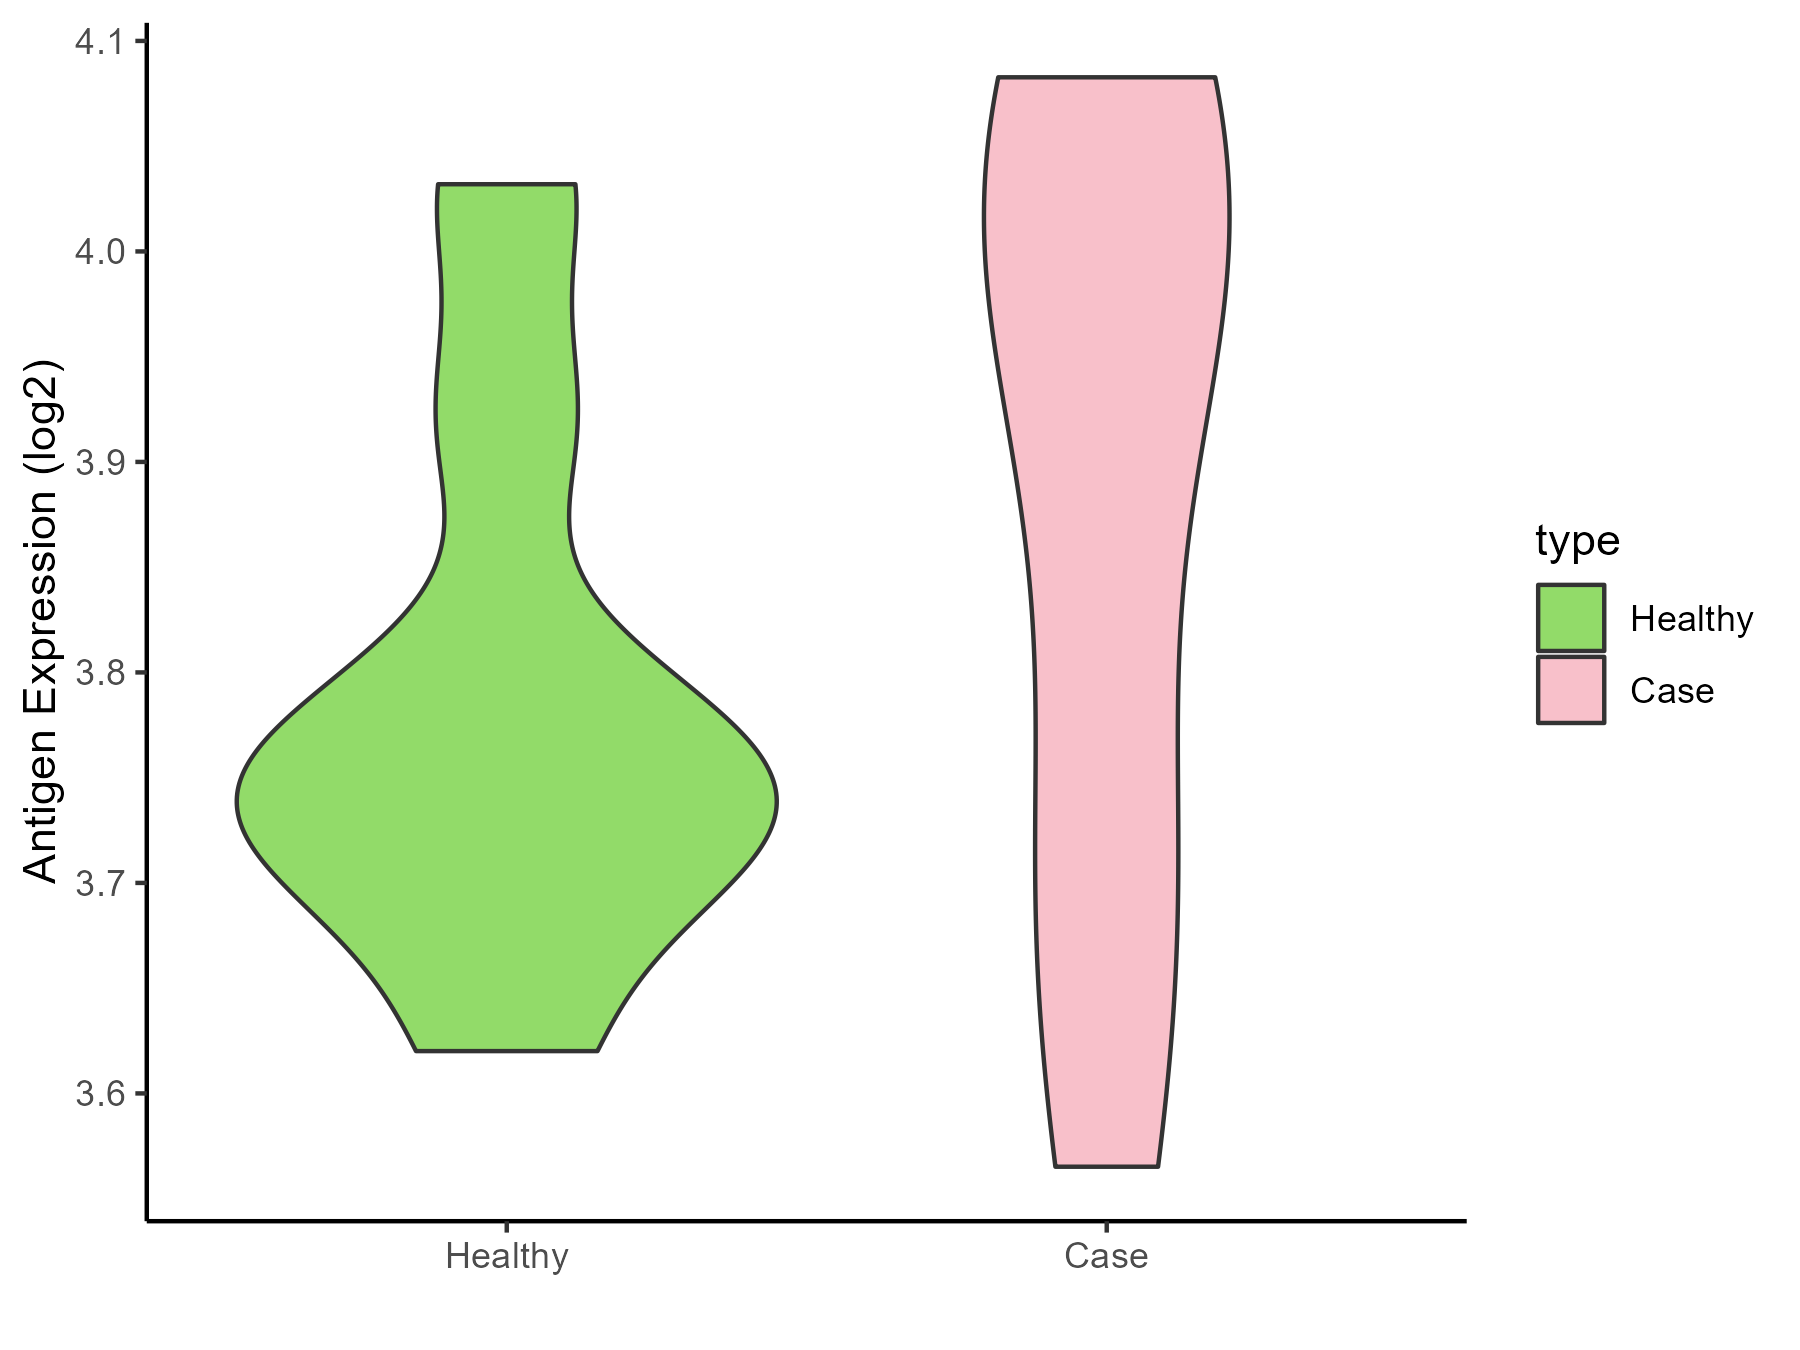
| The Studied Tissue | Liver | |
| The Specific Disease | Liver failure | |
| The Expression Level of Disease Section Compare with the Healthy Individual Tissue | p-value: 0.256099519; Fold-change: 0.217553352; Z-score: 1.661726068 | |
| Disease-specific Antigen Abundances |
|
Click to View the Clearer Original Diagram |
| Differential expression pattern of antigen in diseases | ||
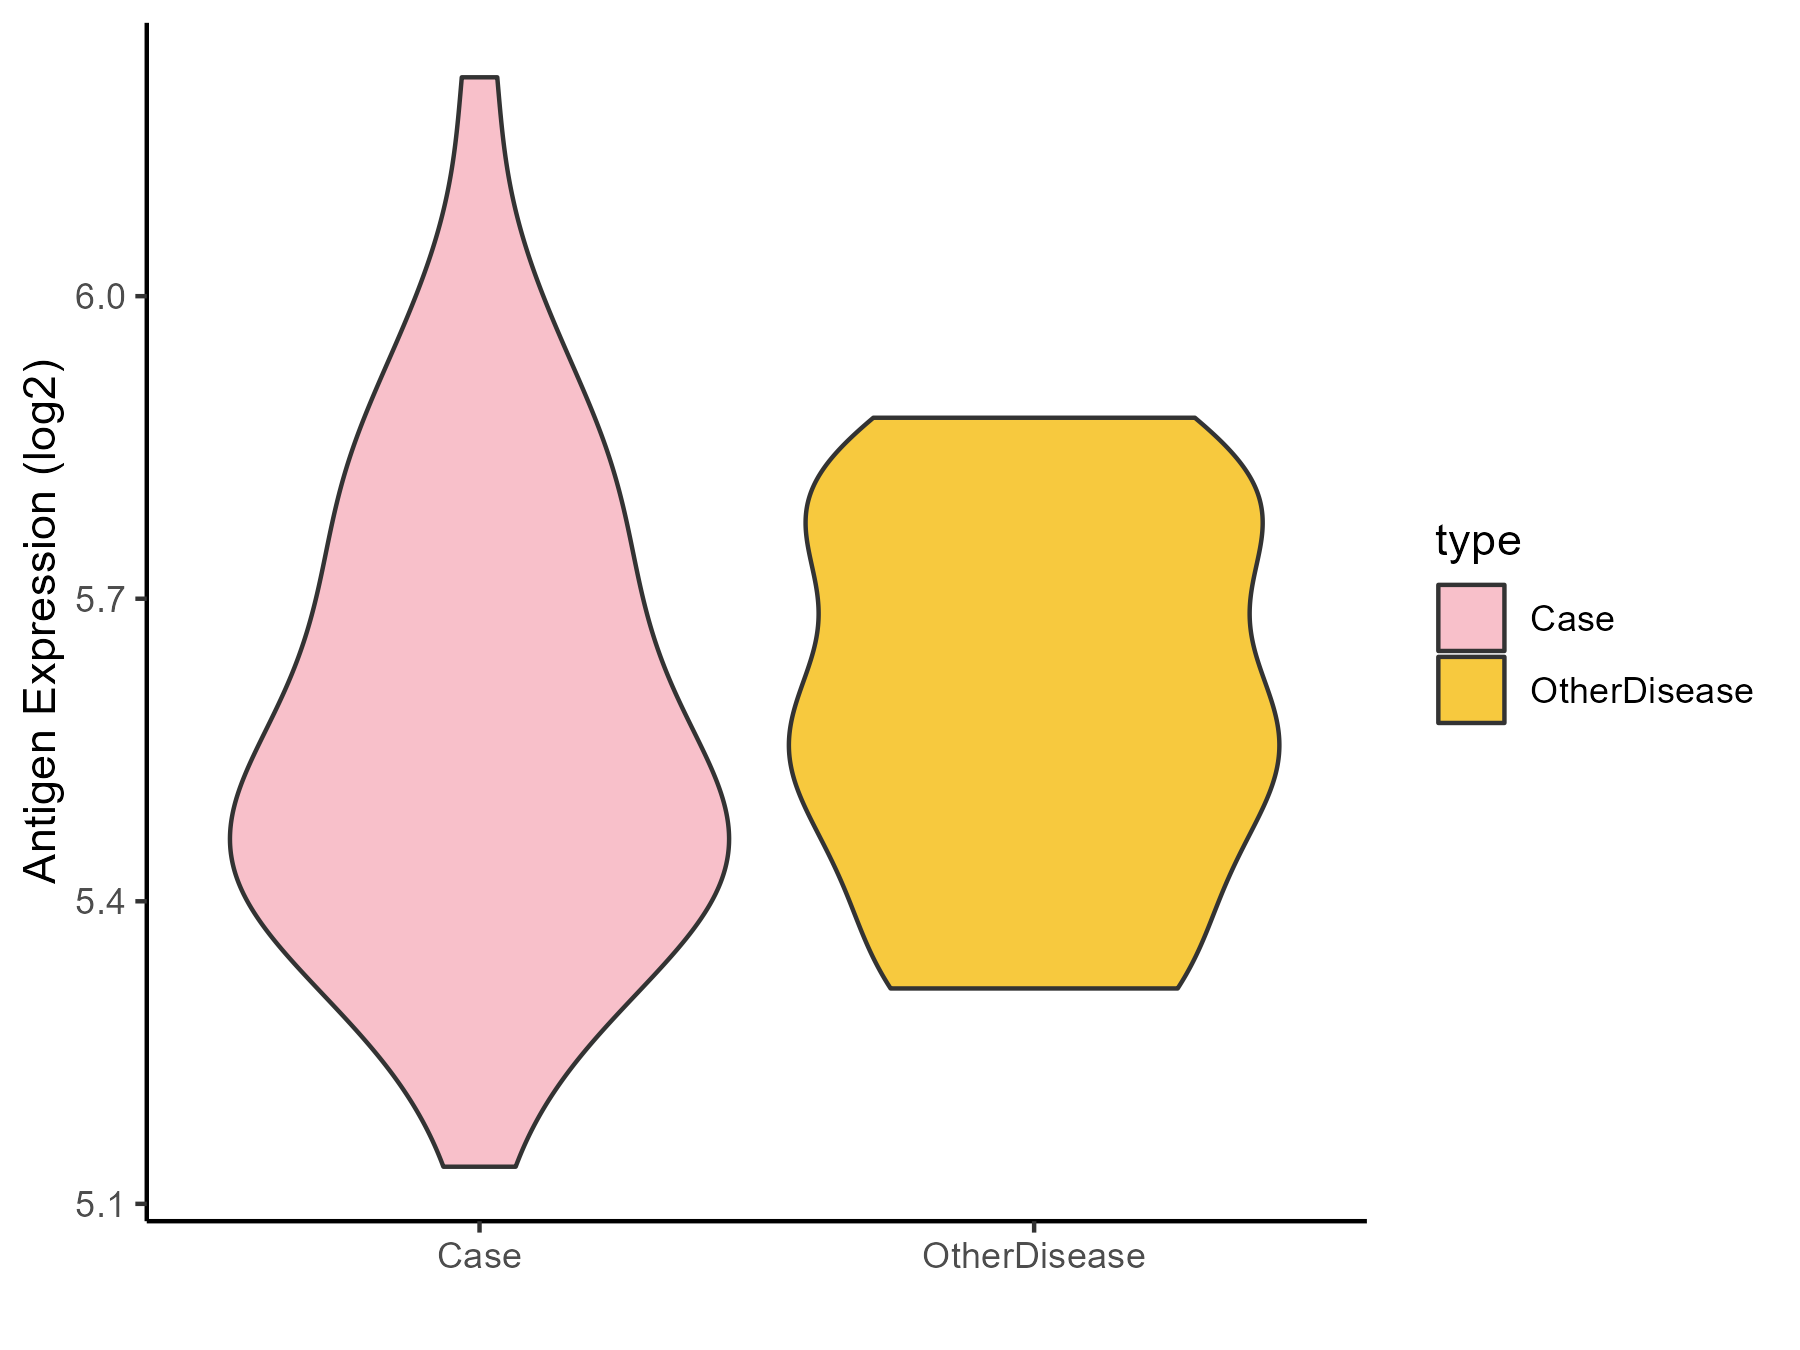
| The Studied Tissue | Colon mucosal | |
| The Specific Disease | Ulcerative colitis | |
| The Expression Level of Disease Section Compare with the Adjacent Tissue | p-value: 0.835950125; Fold-change: -0.031592927; Z-score: -0.168085143 | |
| Disease-specific Antigen Abundances |
|
Click to View the Clearer Original Diagram |
| Differential expression pattern of antigen in diseases | ||
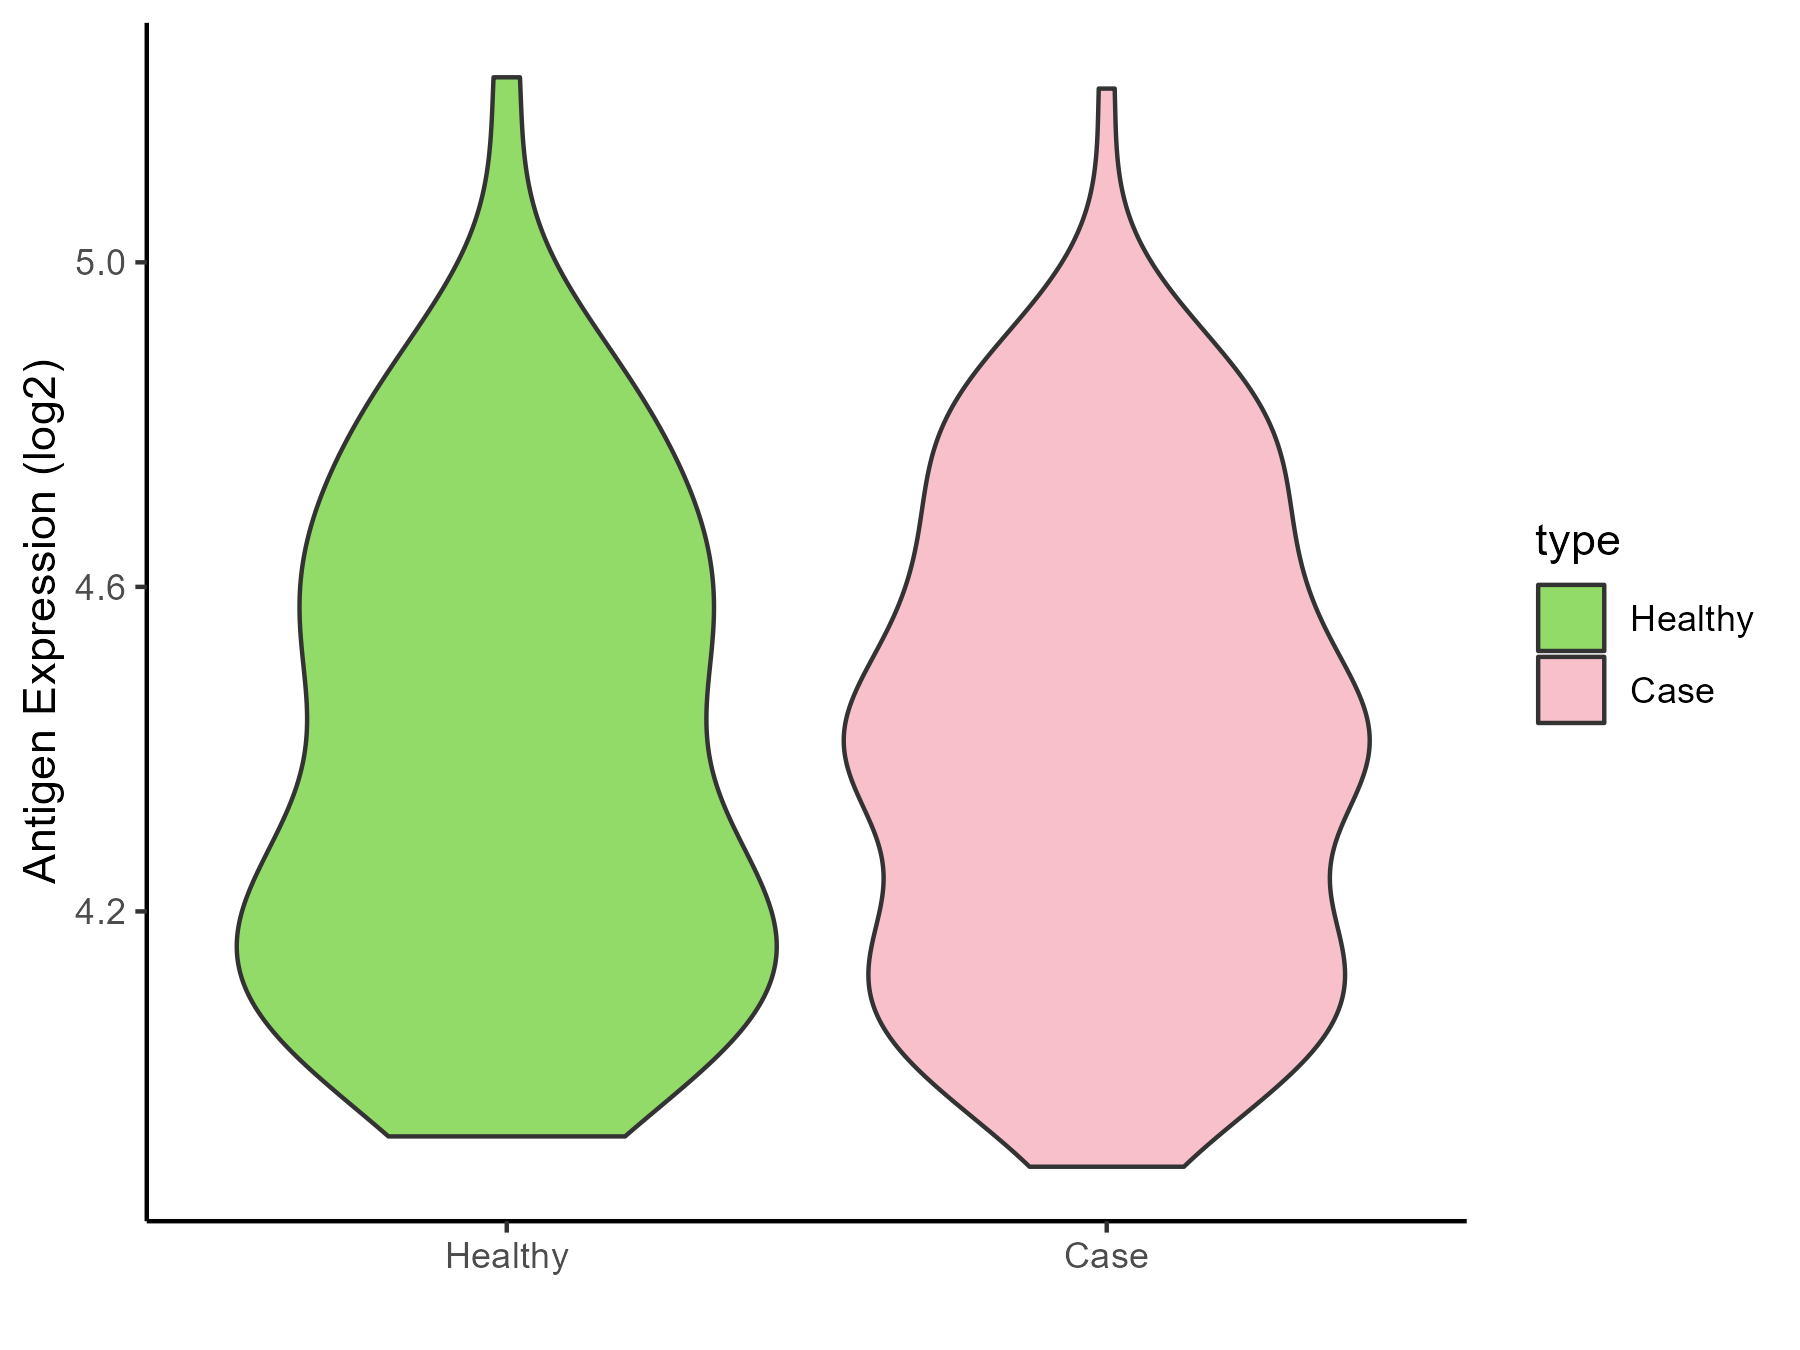
| The Studied Tissue | Rectal colon | |
| The Specific Disease | Irritable bowel syndrome | |
| The Expression Level of Disease Section Compare with the Healthy Individual Tissue | p-value: 0.8697132; Fold-change: 0.037659503; Z-score: 0.124278354 | |
| Disease-specific Antigen Abundances |
|
Click to View the Clearer Original Diagram |
ICD Disease Classification 14
| Differential expression pattern of antigen in diseases | ||
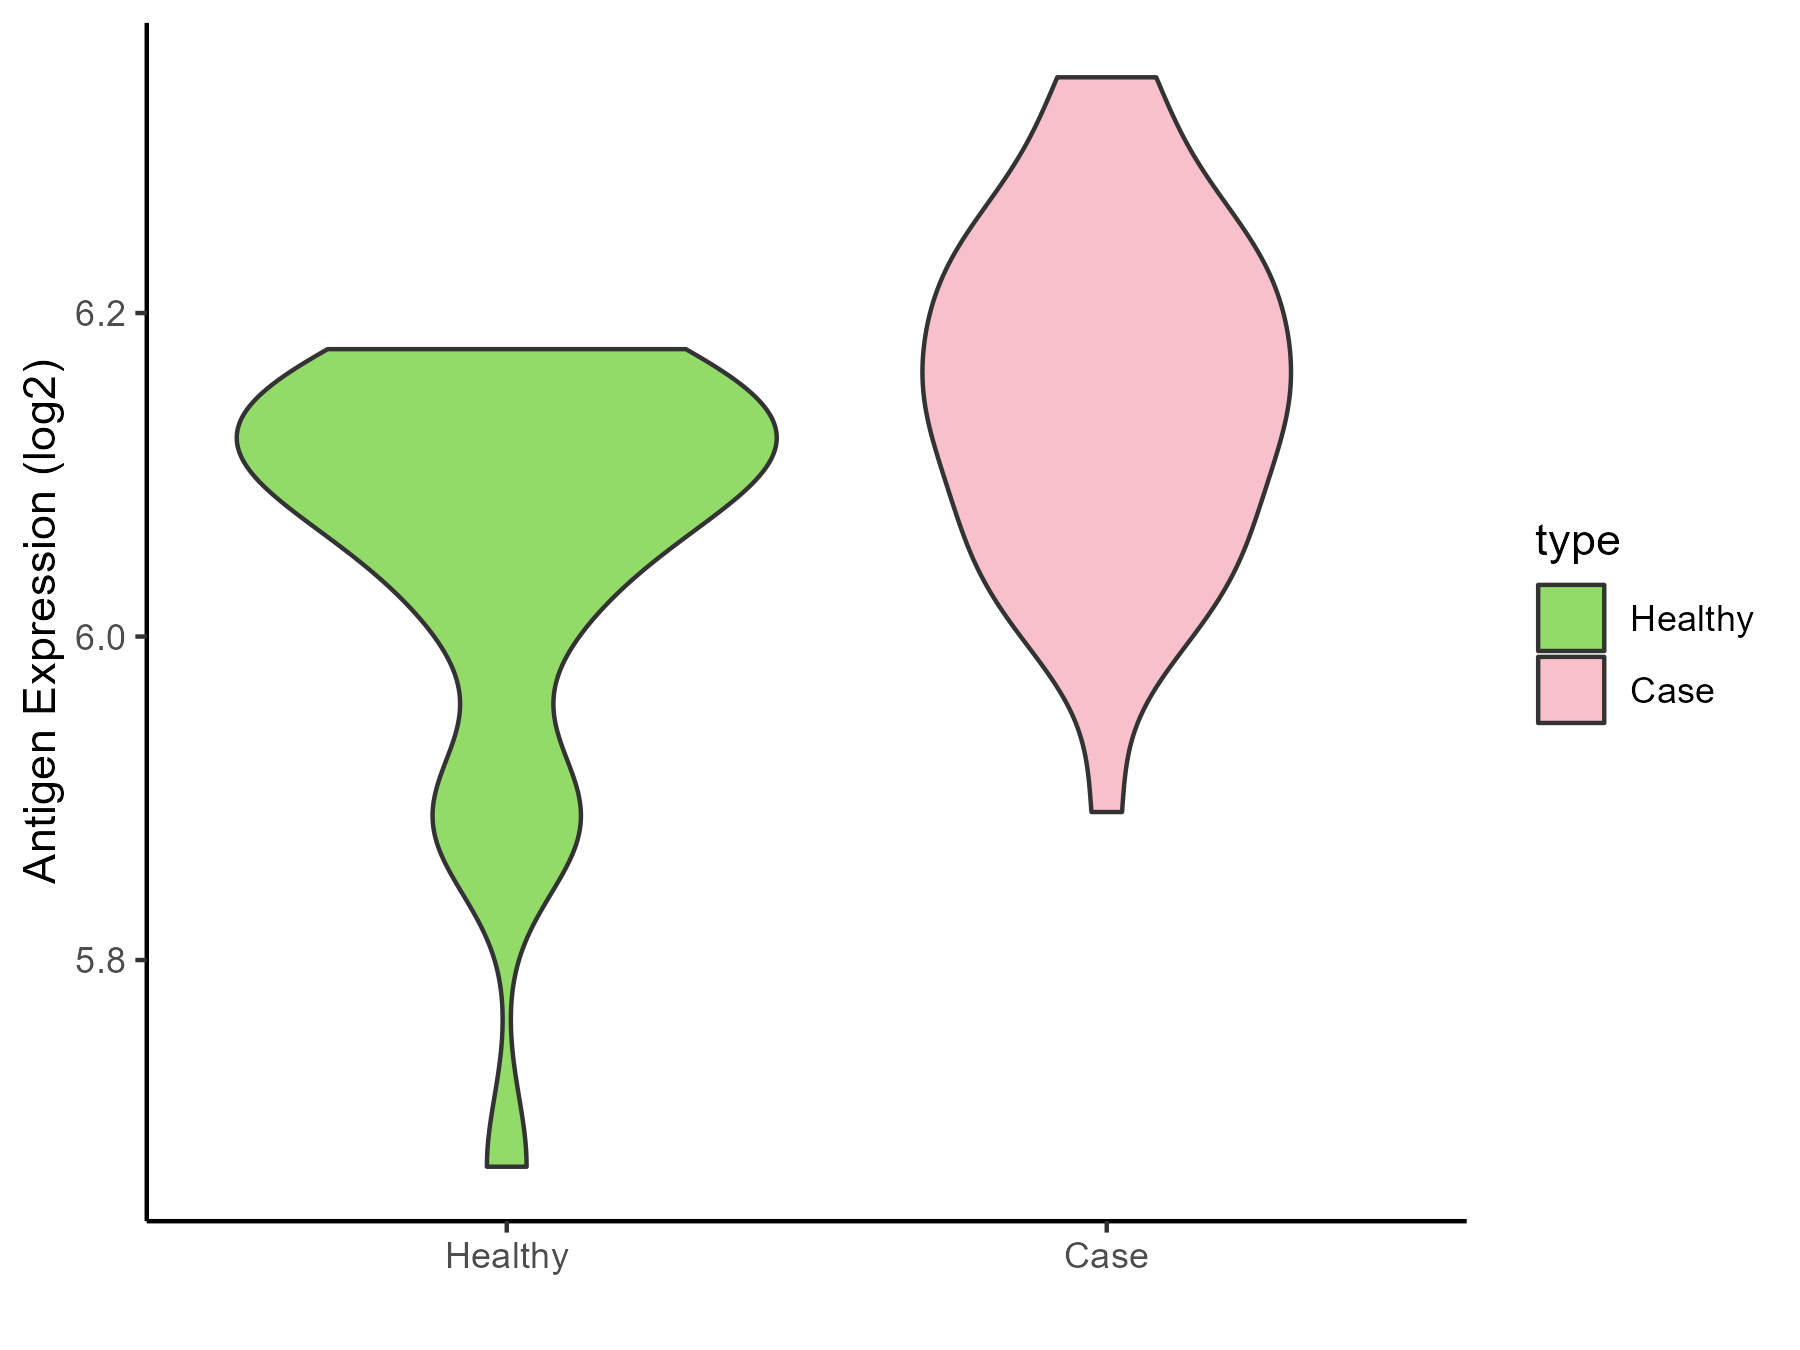
| The Studied Tissue | Skin | |
| The Specific Disease | Atopic dermatitis | |
| The Expression Level of Disease Section Compare with the Healthy Individual Tissue | p-value: 0.00376782; Fold-change: 0.058093935; Z-score: 0.471321485 | |
| Disease-specific Antigen Abundances |
|
Click to View the Clearer Original Diagram |
| Differential expression pattern of antigen in diseases | ||
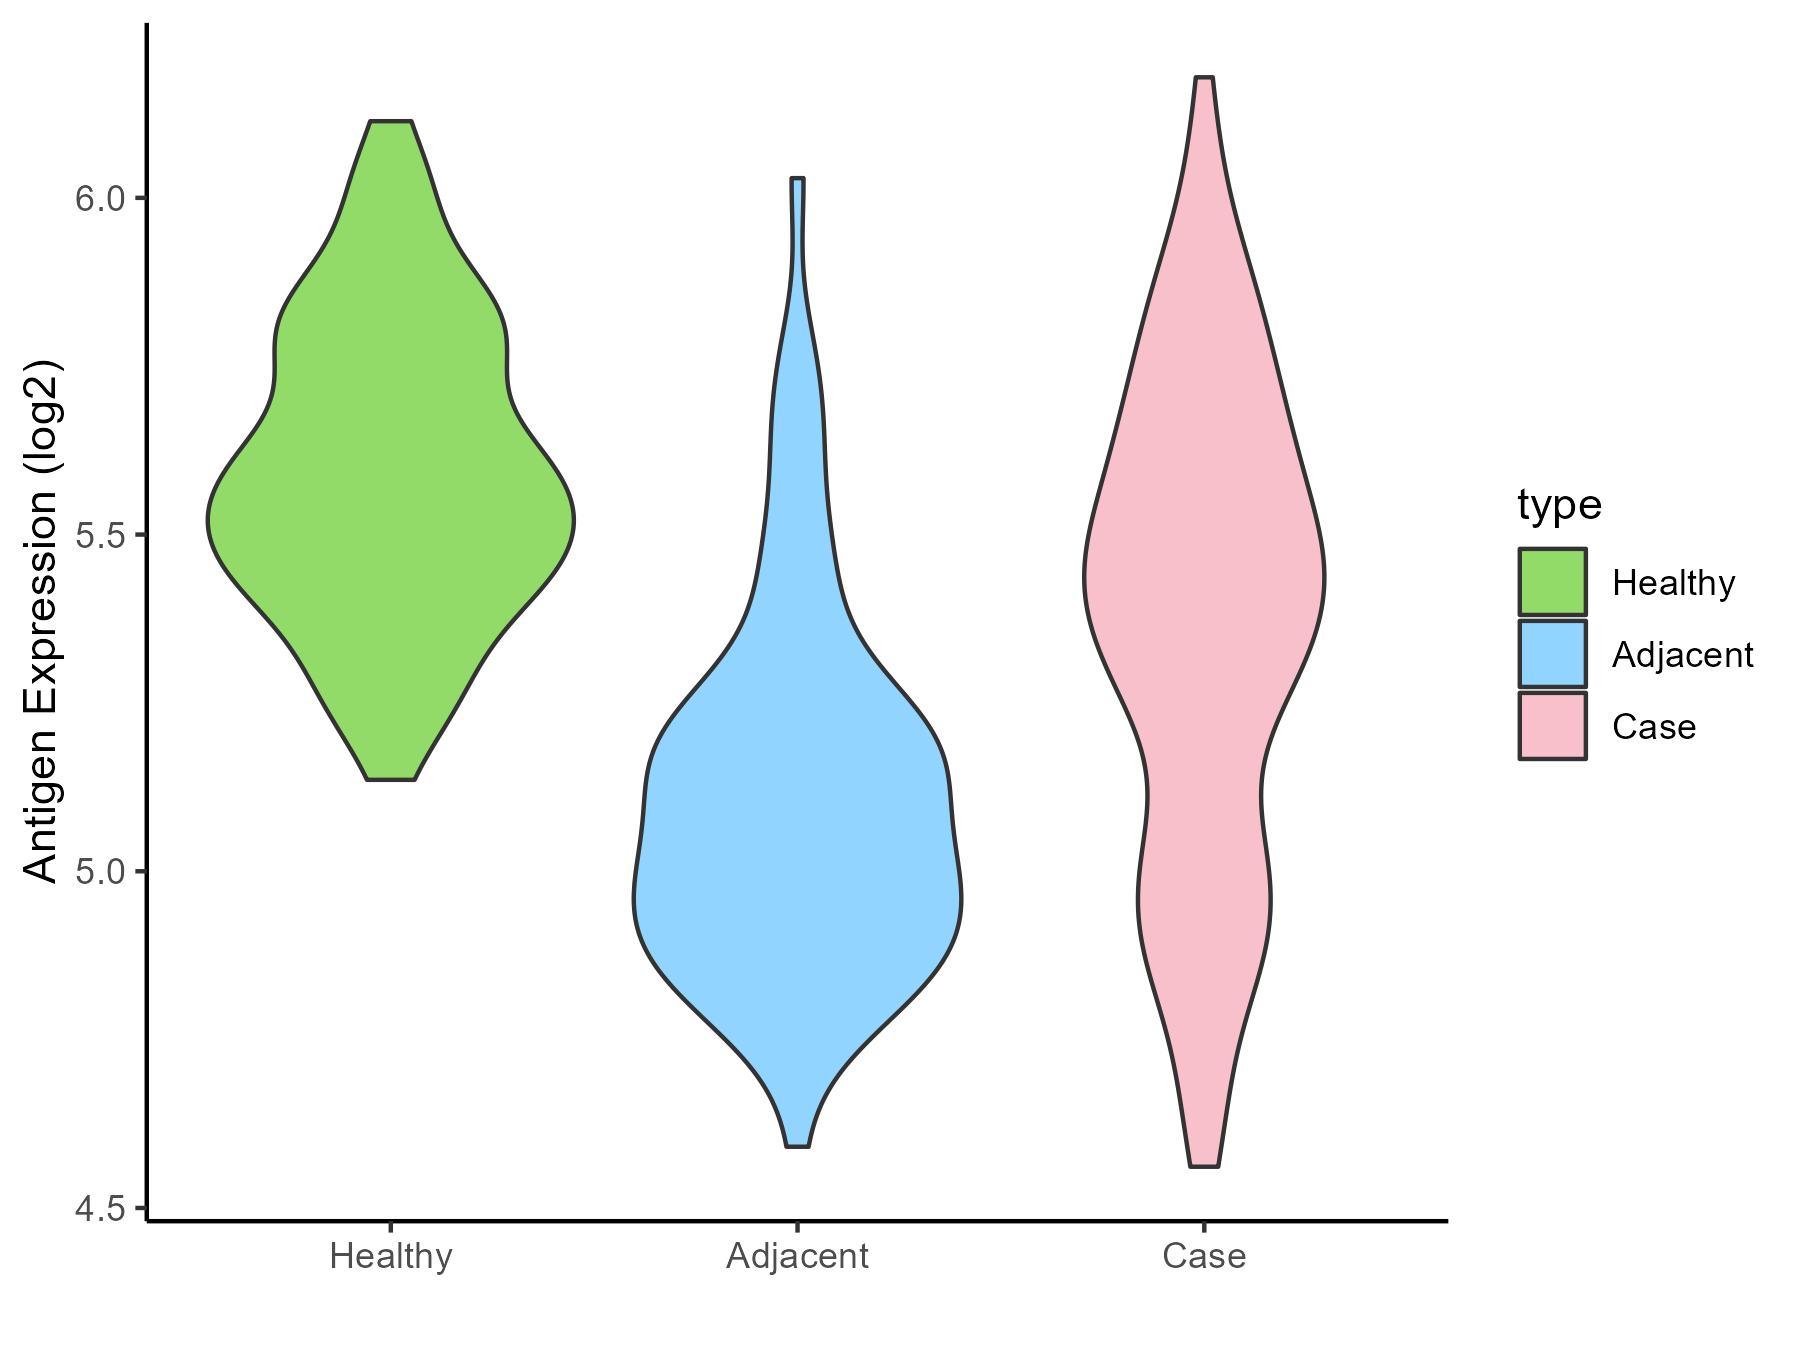
| The Studied Tissue | Skin | |
| The Specific Disease | Psoriasis | |
| The Expression Level of Disease Section Compare with the Healthy Individual Tissue | p-value: 1.76E-11; Fold-change: -0.170049071; Z-score: -0.77368047 | |
| The Expression Level of Disease Section Compare with the Adjacent Tissue | p-value: 1.11E-11; Fold-change: 0.354447794; Z-score: 1.326378546 | |
| Disease-specific Antigen Abundances |
|
Click to View the Clearer Original Diagram |
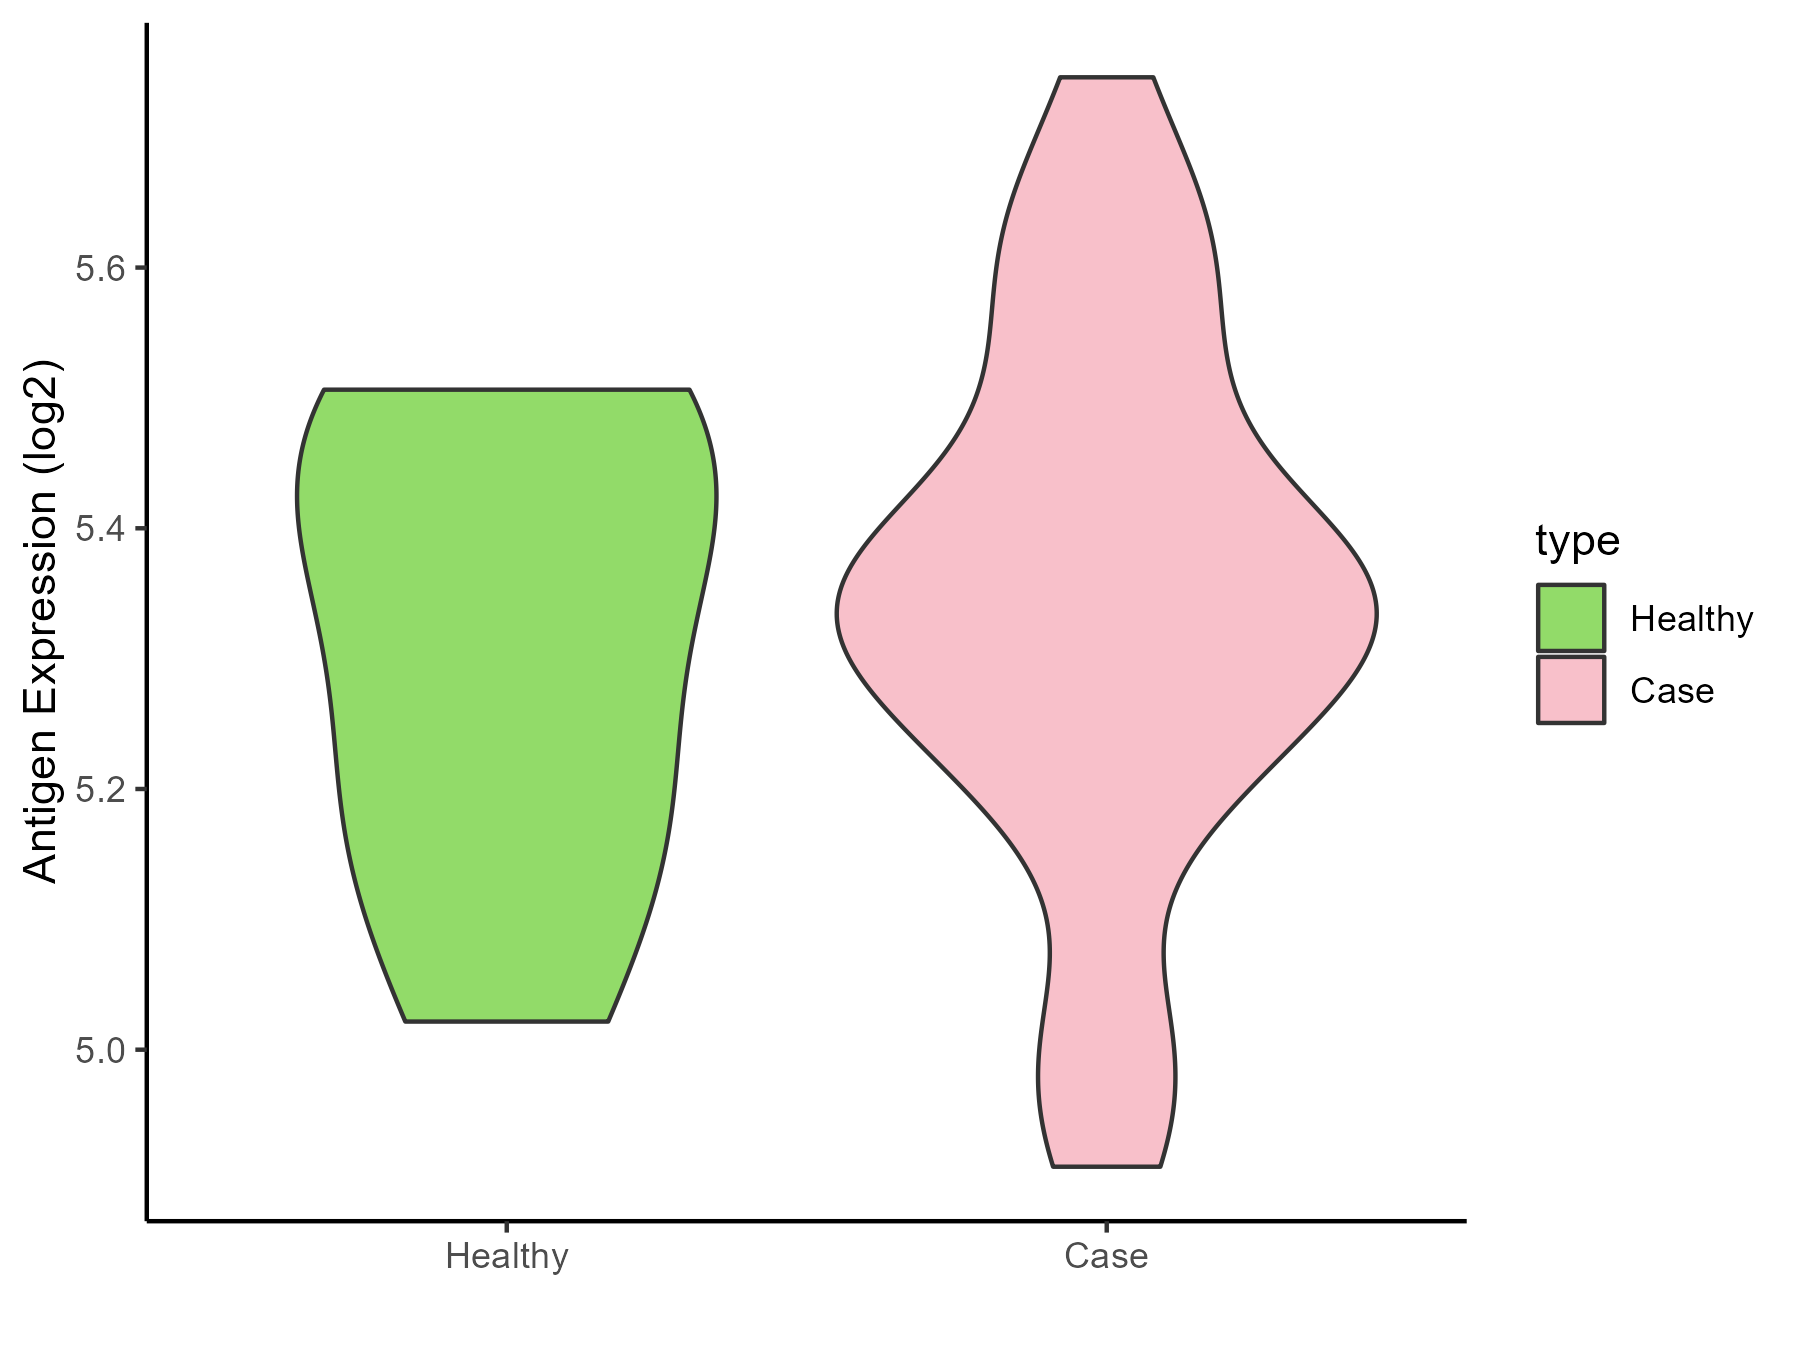
| Differential expression pattern of antigen in diseases | ||
| The Studied Tissue | Skin | |
| The Specific Disease | Vitiligo | |
| The Expression Level of Disease Section Compare with the Healthy Individual Tissue | p-value: 0.653824496; Fold-change: -0.006720072; Z-score: -0.036562401 | |
| Disease-specific Antigen Abundances |
|
Click to View the Clearer Original Diagram |
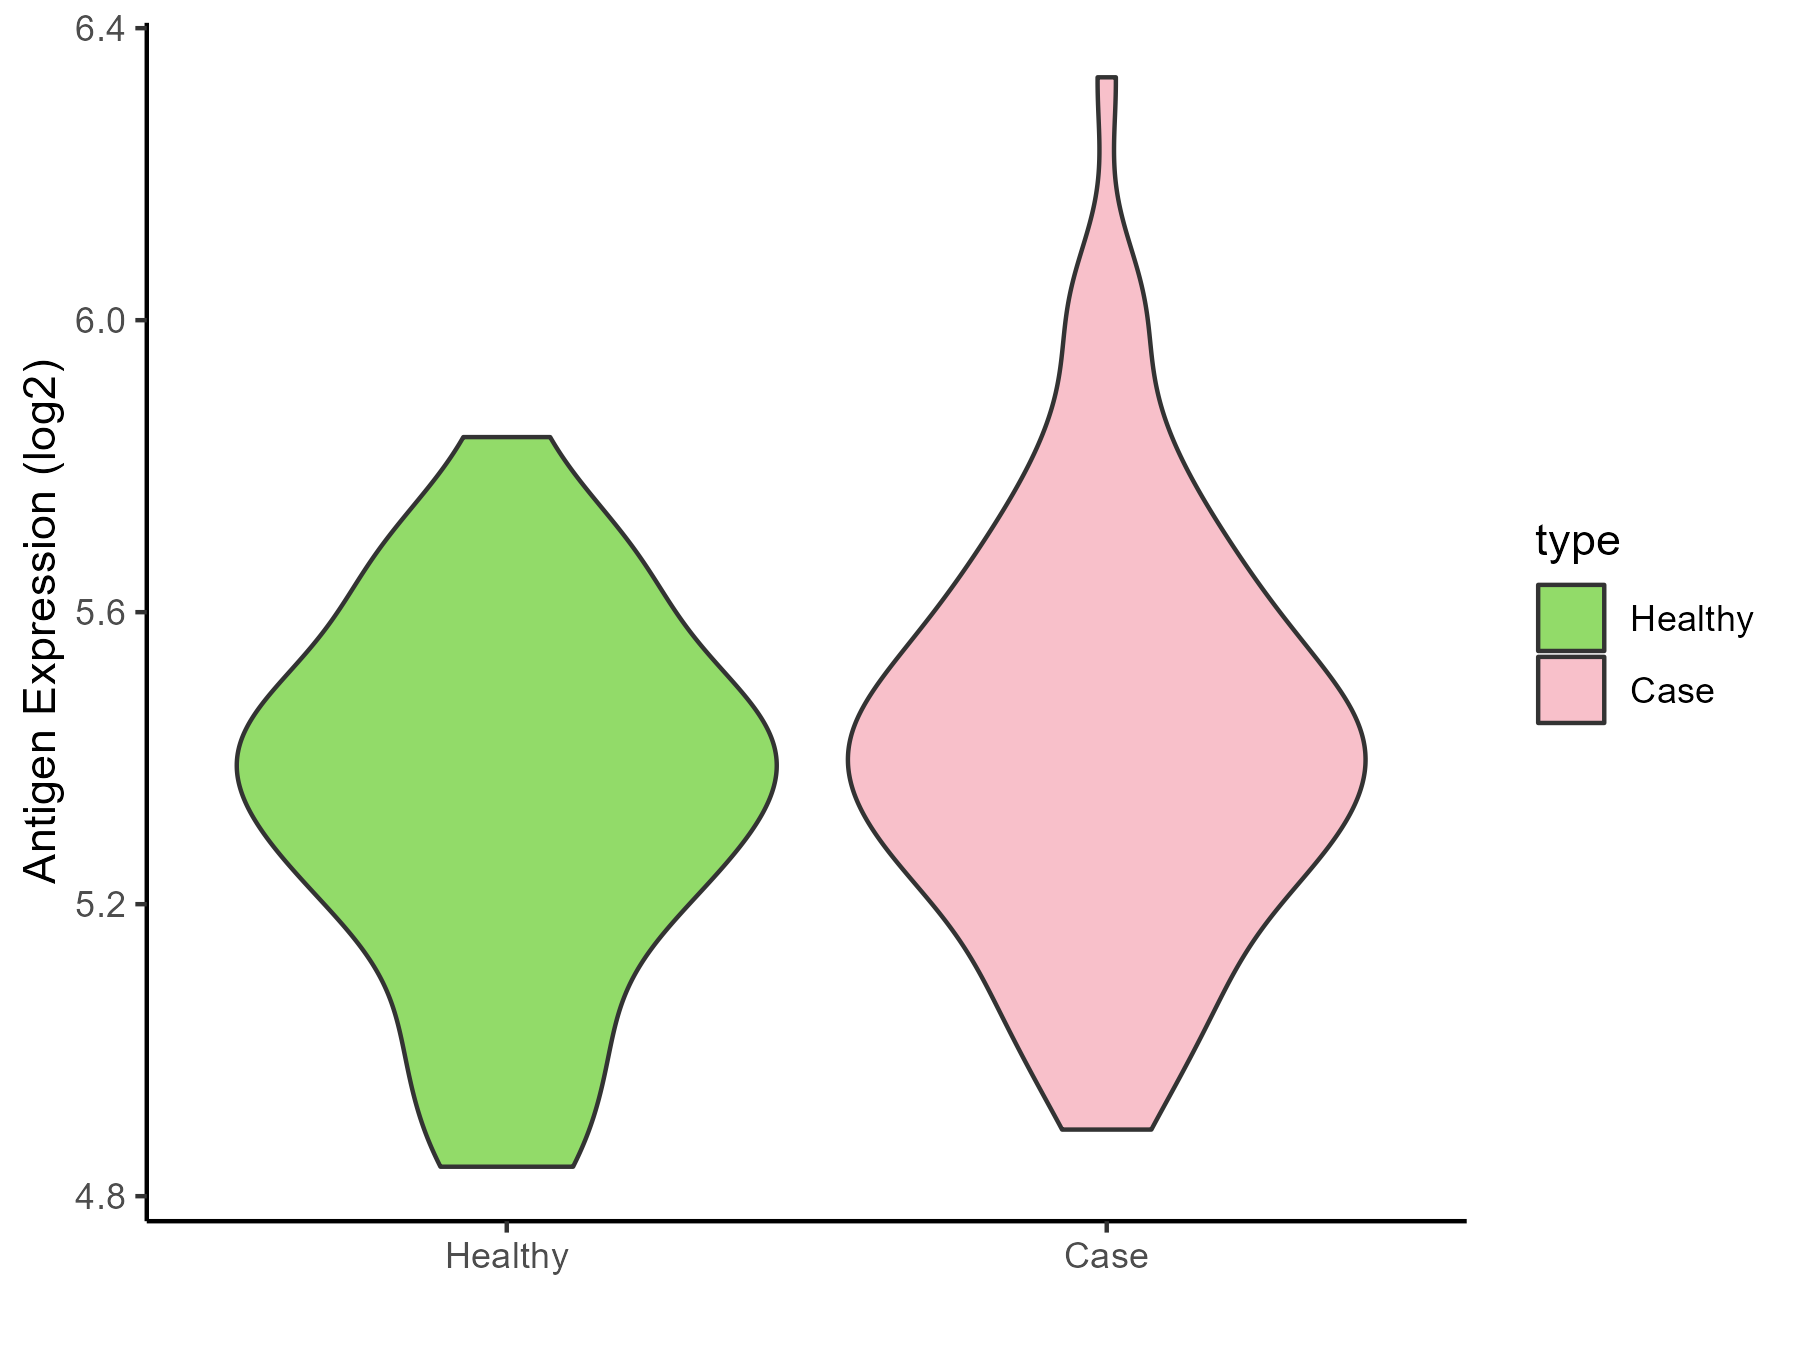
| Differential expression pattern of antigen in diseases | ||
| The Studied Tissue | Skin from scalp | |
| The Specific Disease | Alopecia | |
| The Expression Level of Disease Section Compare with the Healthy Individual Tissue | p-value: 0.098681481; Fold-change: 0.047301155; Z-score: 0.190026068 | |
| Disease-specific Antigen Abundances |
|
Click to View the Clearer Original Diagram |
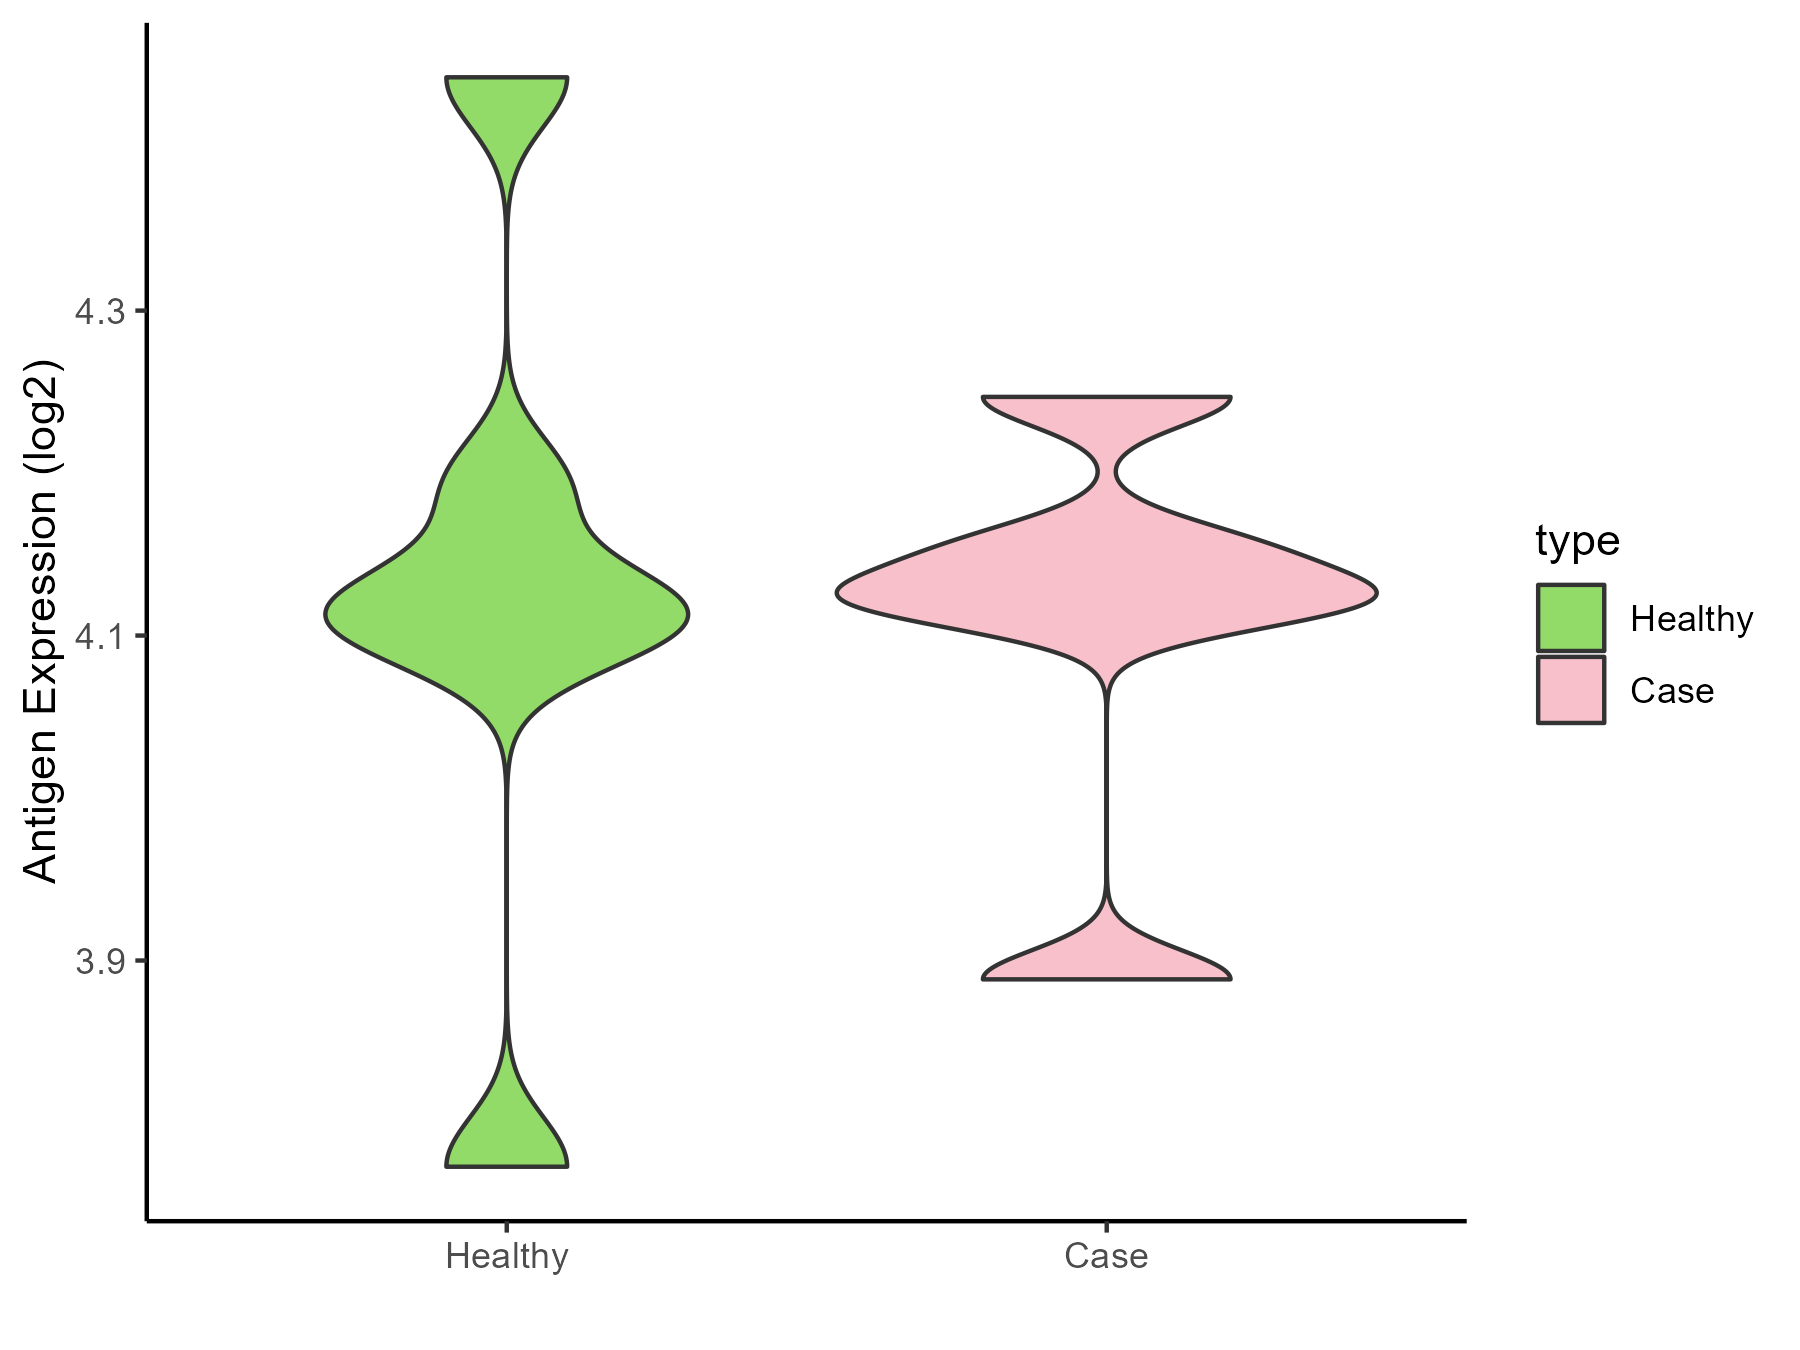
| Differential expression pattern of antigen in diseases | ||
| The Studied Tissue | Skin | |
| The Specific Disease | Sensitive skin | |
| The Expression Level of Disease Section Compare with the Healthy Individual Tissue | p-value: 0.873935706; Fold-change: 0.011019823; Z-score: 0.051344556 | |
| Disease-specific Antigen Abundances |
|
Click to View the Clearer Original Diagram |
ICD Disease Classification 15
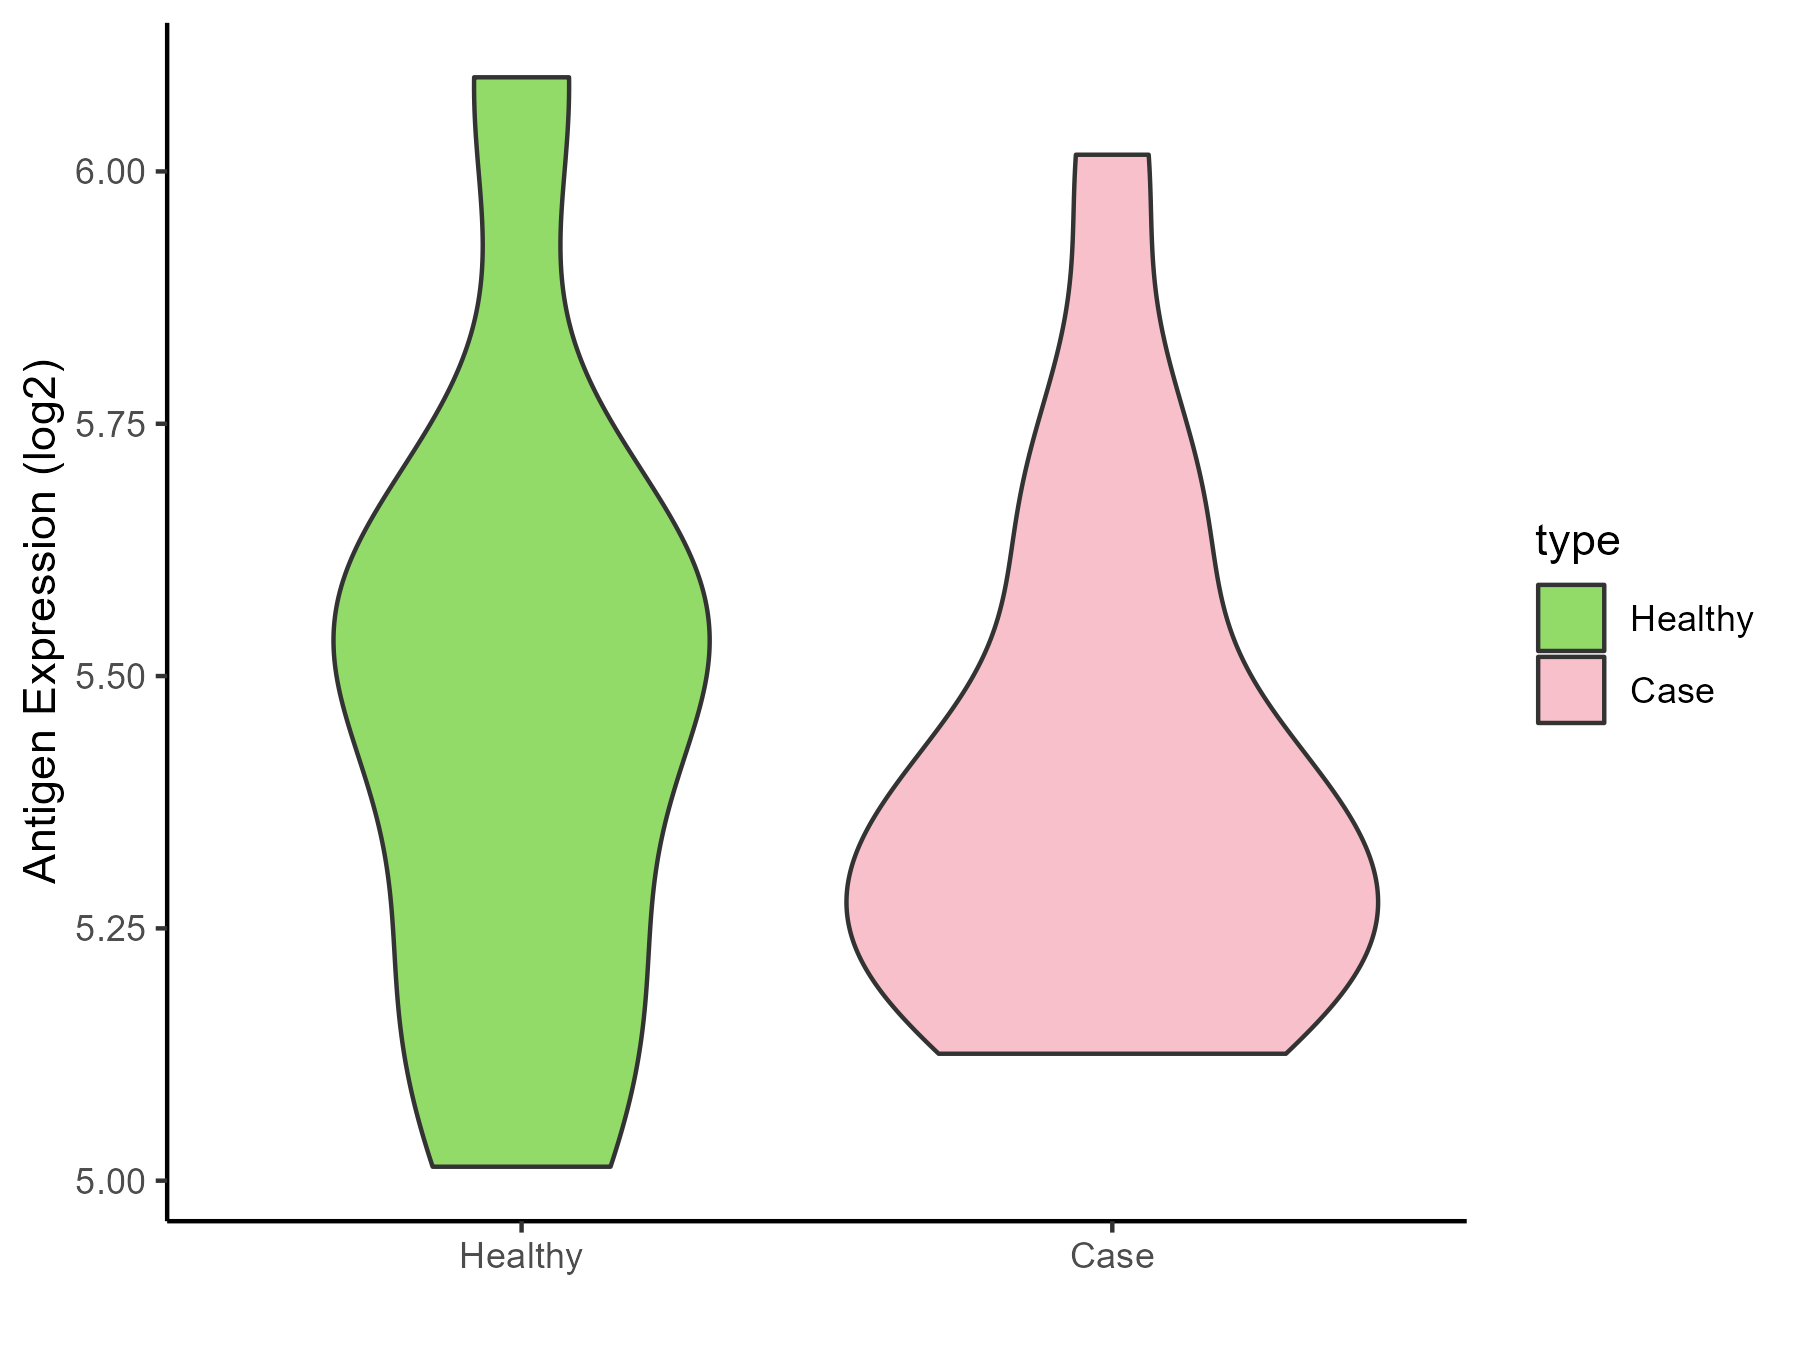
| Differential expression pattern of antigen in diseases | ||
| The Studied Tissue | Synovial | |
| The Specific Disease | Osteoarthritis | |
| The Expression Level of Disease Section Compare with the Healthy Individual Tissue | p-value: 0.647242644; Fold-change: -0.170120662; Z-score: -0.51110697 | |
| Disease-specific Antigen Abundances |
|
Click to View the Clearer Original Diagram |
| Differential expression pattern of antigen in diseases | ||
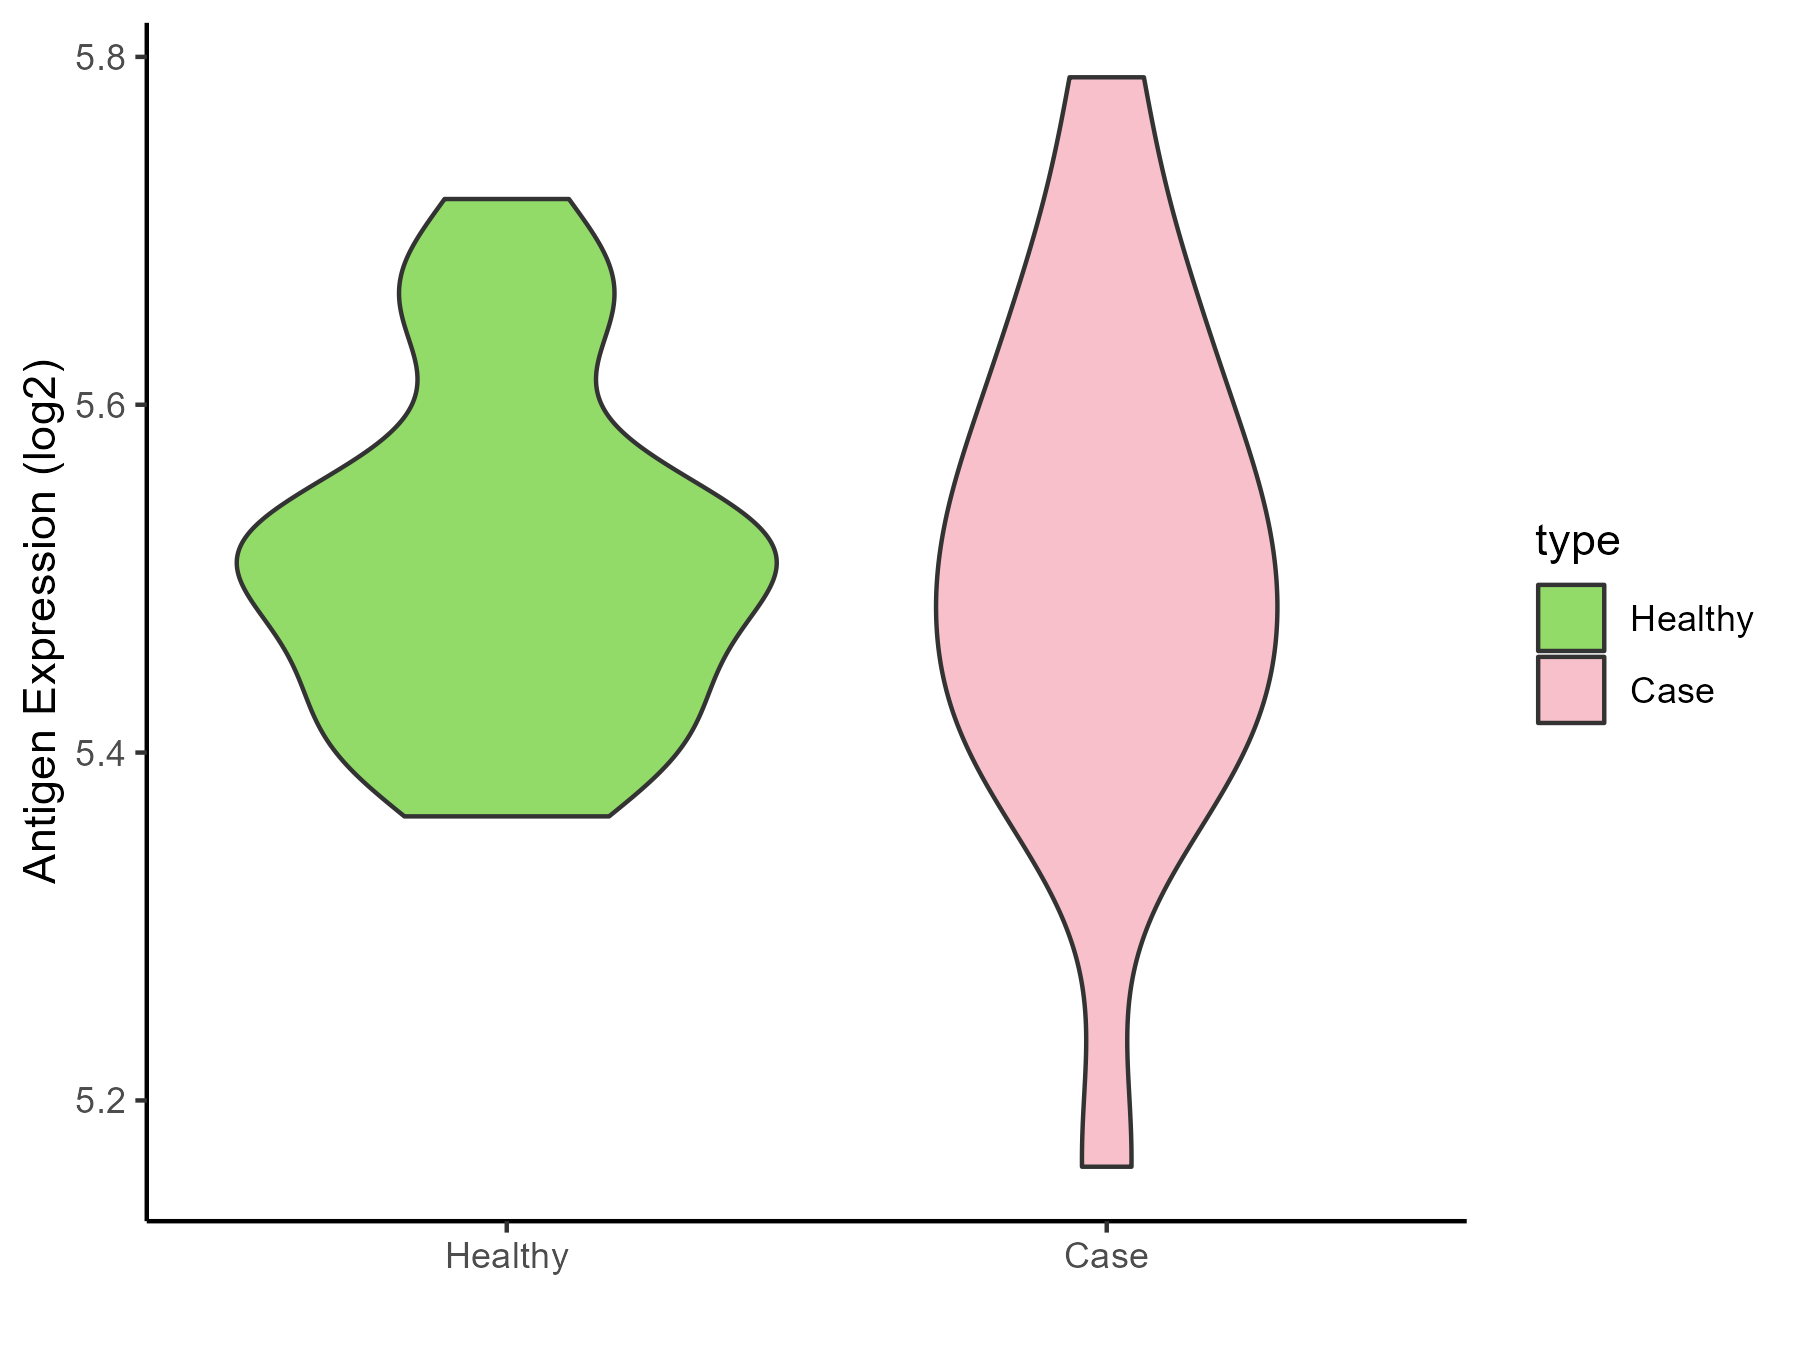
| The Studied Tissue | Peripheral blood | |
| The Specific Disease | Arthropathy | |
| The Expression Level of Disease Section Compare with the Healthy Individual Tissue | p-value: 0.842010989; Fold-change: 0.005176871; Z-score: 0.053013137 | |
| Disease-specific Antigen Abundances |
|
Click to View the Clearer Original Diagram |
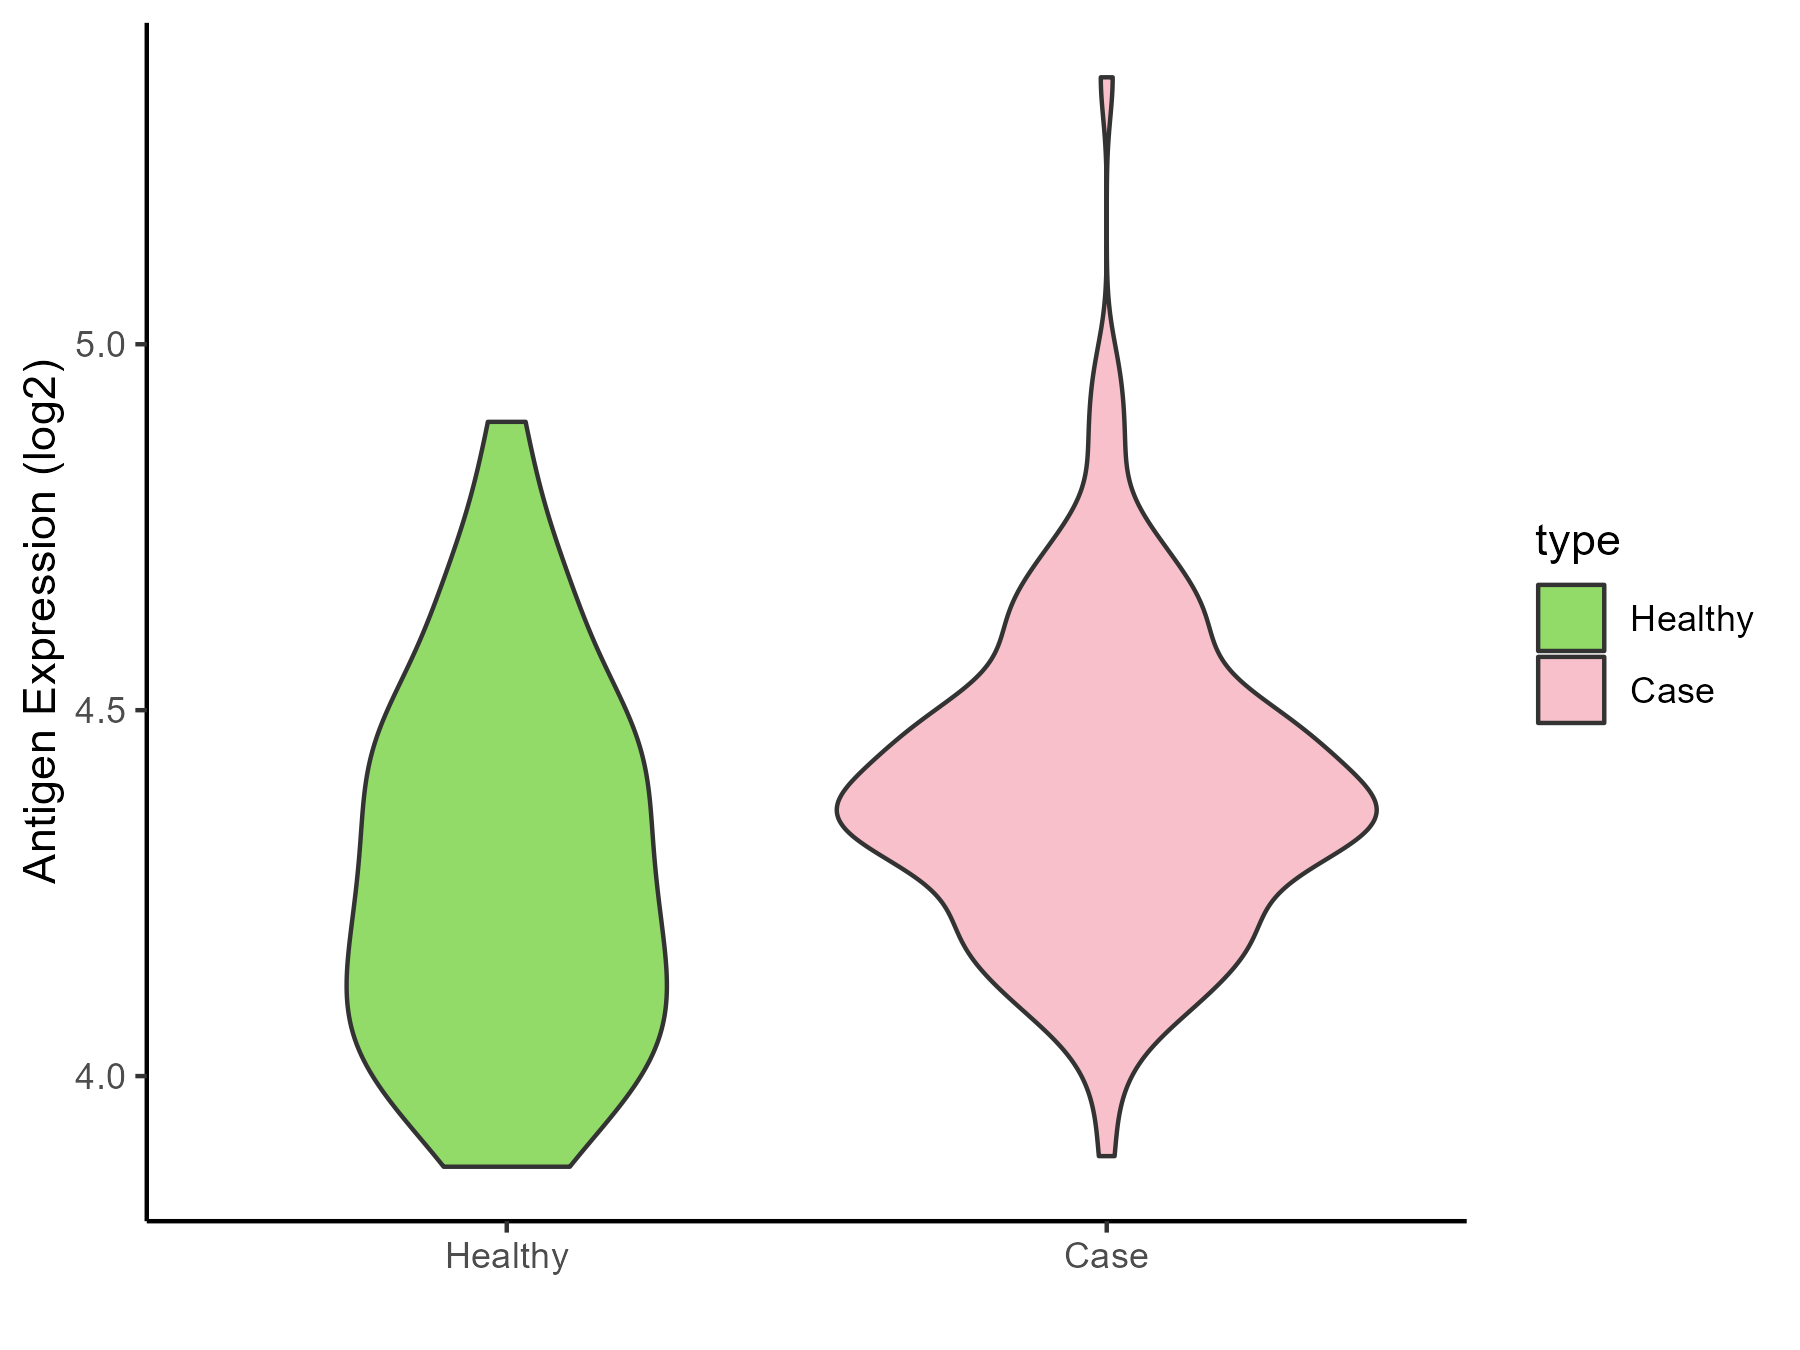
| Differential expression pattern of antigen in diseases | ||
| The Studied Tissue | Peripheral blood | |
| The Specific Disease | Arthritis | |
| The Expression Level of Disease Section Compare with the Healthy Individual Tissue | p-value: 0.001398097; Fold-change: 0.111864644; Z-score: 0.44910291 | |
| Disease-specific Antigen Abundances |
|
Click to View the Clearer Original Diagram |
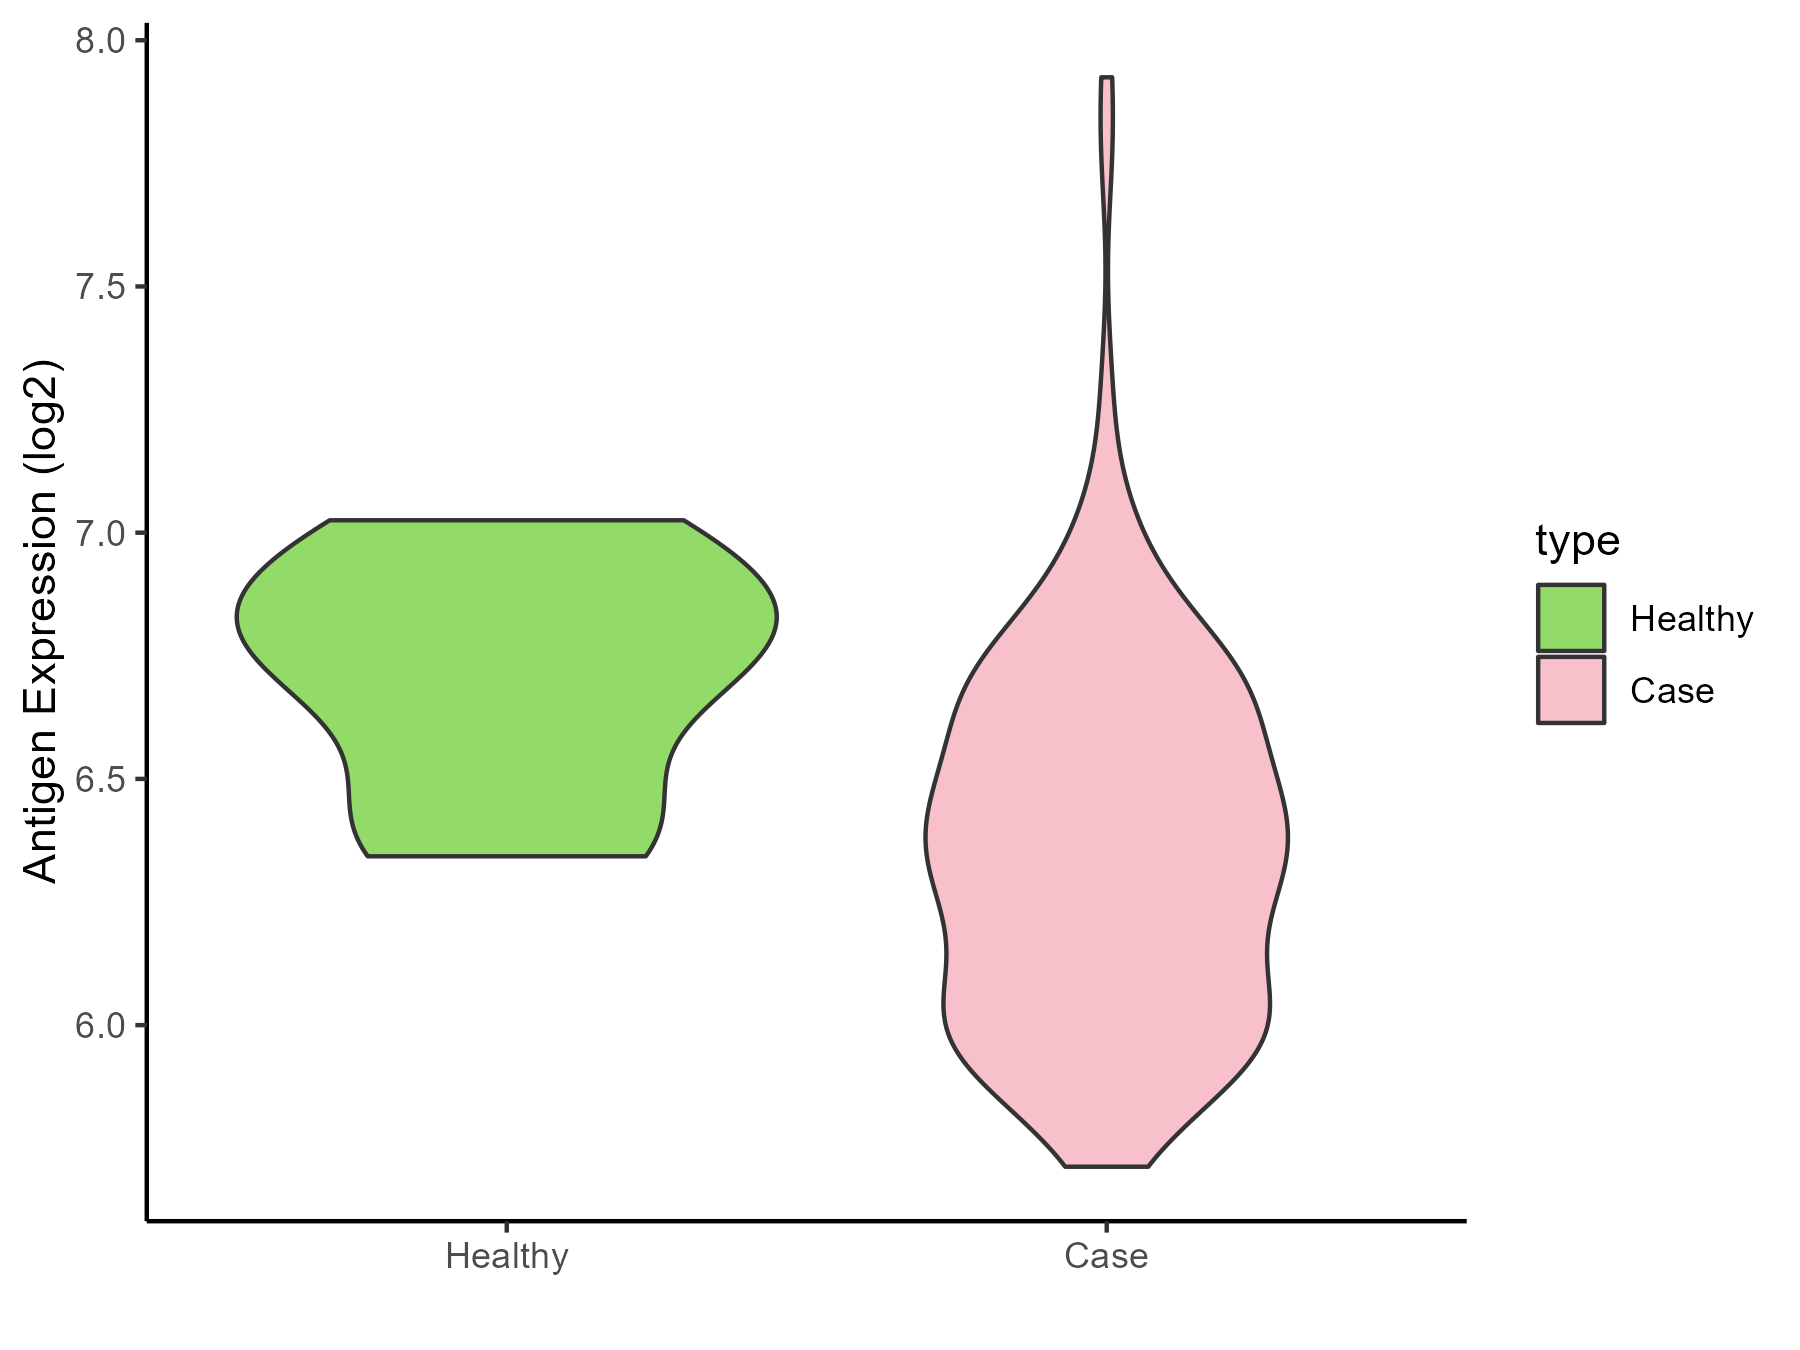
| Differential expression pattern of antigen in diseases | ||
| The Studied Tissue | Synovial | |
| The Specific Disease | Rheumatoid arthritis | |
| The Expression Level of Disease Section Compare with the Healthy Individual Tissue | p-value: 0.009505798; Fold-change: -0.425867738; Z-score: -1.698838455 | |
| Disease-specific Antigen Abundances |
|
Click to View the Clearer Original Diagram |
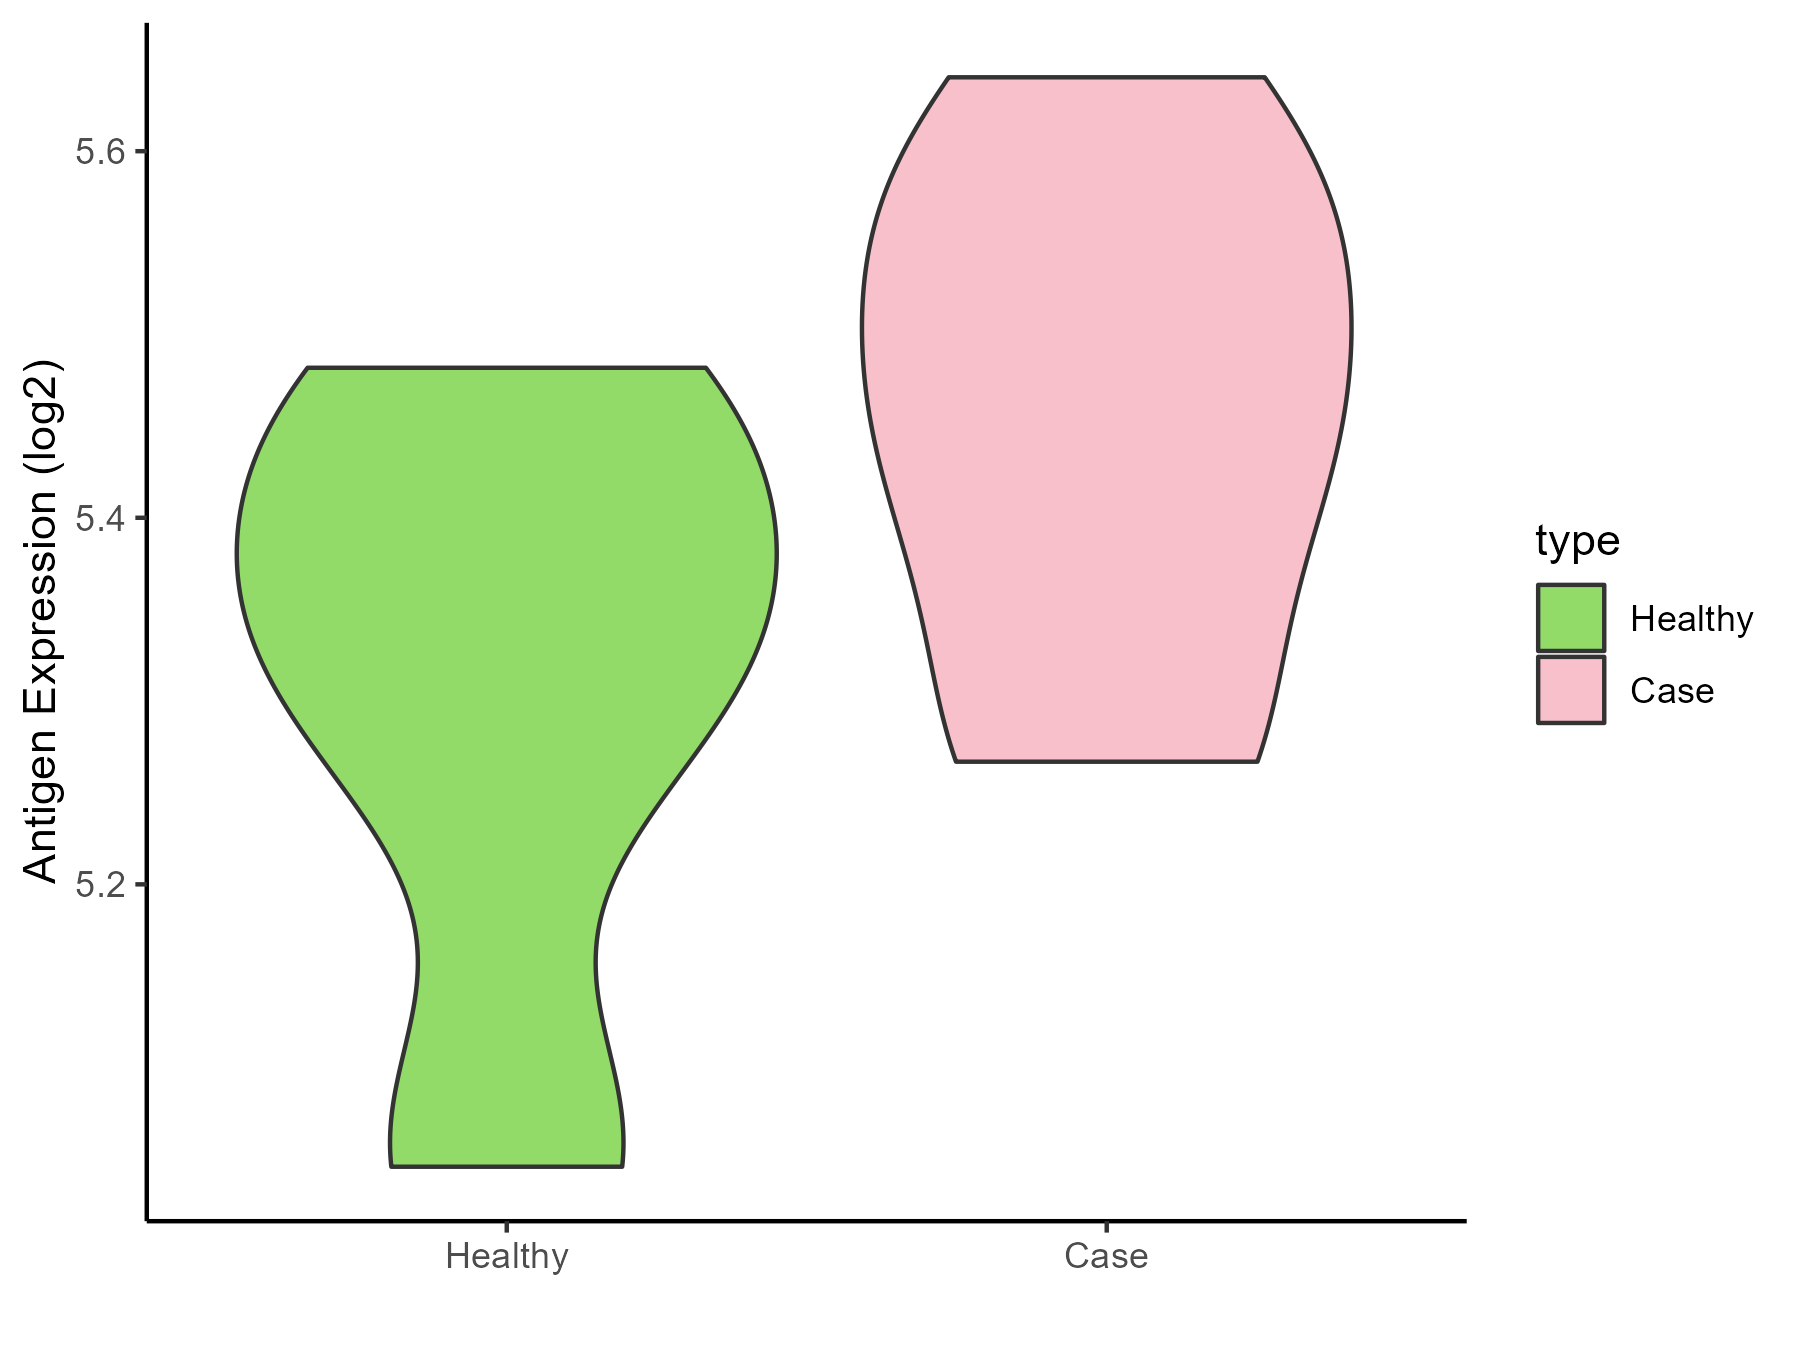
| Differential expression pattern of antigen in diseases | ||
| The Studied Tissue | Pheripheral blood | |
| The Specific Disease | Ankylosing spondylitis | |
| The Expression Level of Disease Section Compare with the Healthy Individual Tissue | p-value: 0.059868905; Fold-change: 0.12113138; Z-score: 0.755026495 | |
| Disease-specific Antigen Abundances |
|
Click to View the Clearer Original Diagram |
| Differential expression pattern of antigen in diseases | ||
| The Studied Tissue | Bone marrow | |
| The Specific Disease | Osteoporosis | |
| The Expression Level of Disease Section Compare with the Healthy Individual Tissue | p-value: 0.029457296; Fold-change: 0.120662926; Z-score: 0.972199667 | |
| Disease-specific Antigen Abundances |

|
Click to View the Clearer Original Diagram |
ICD Disease Classification 16
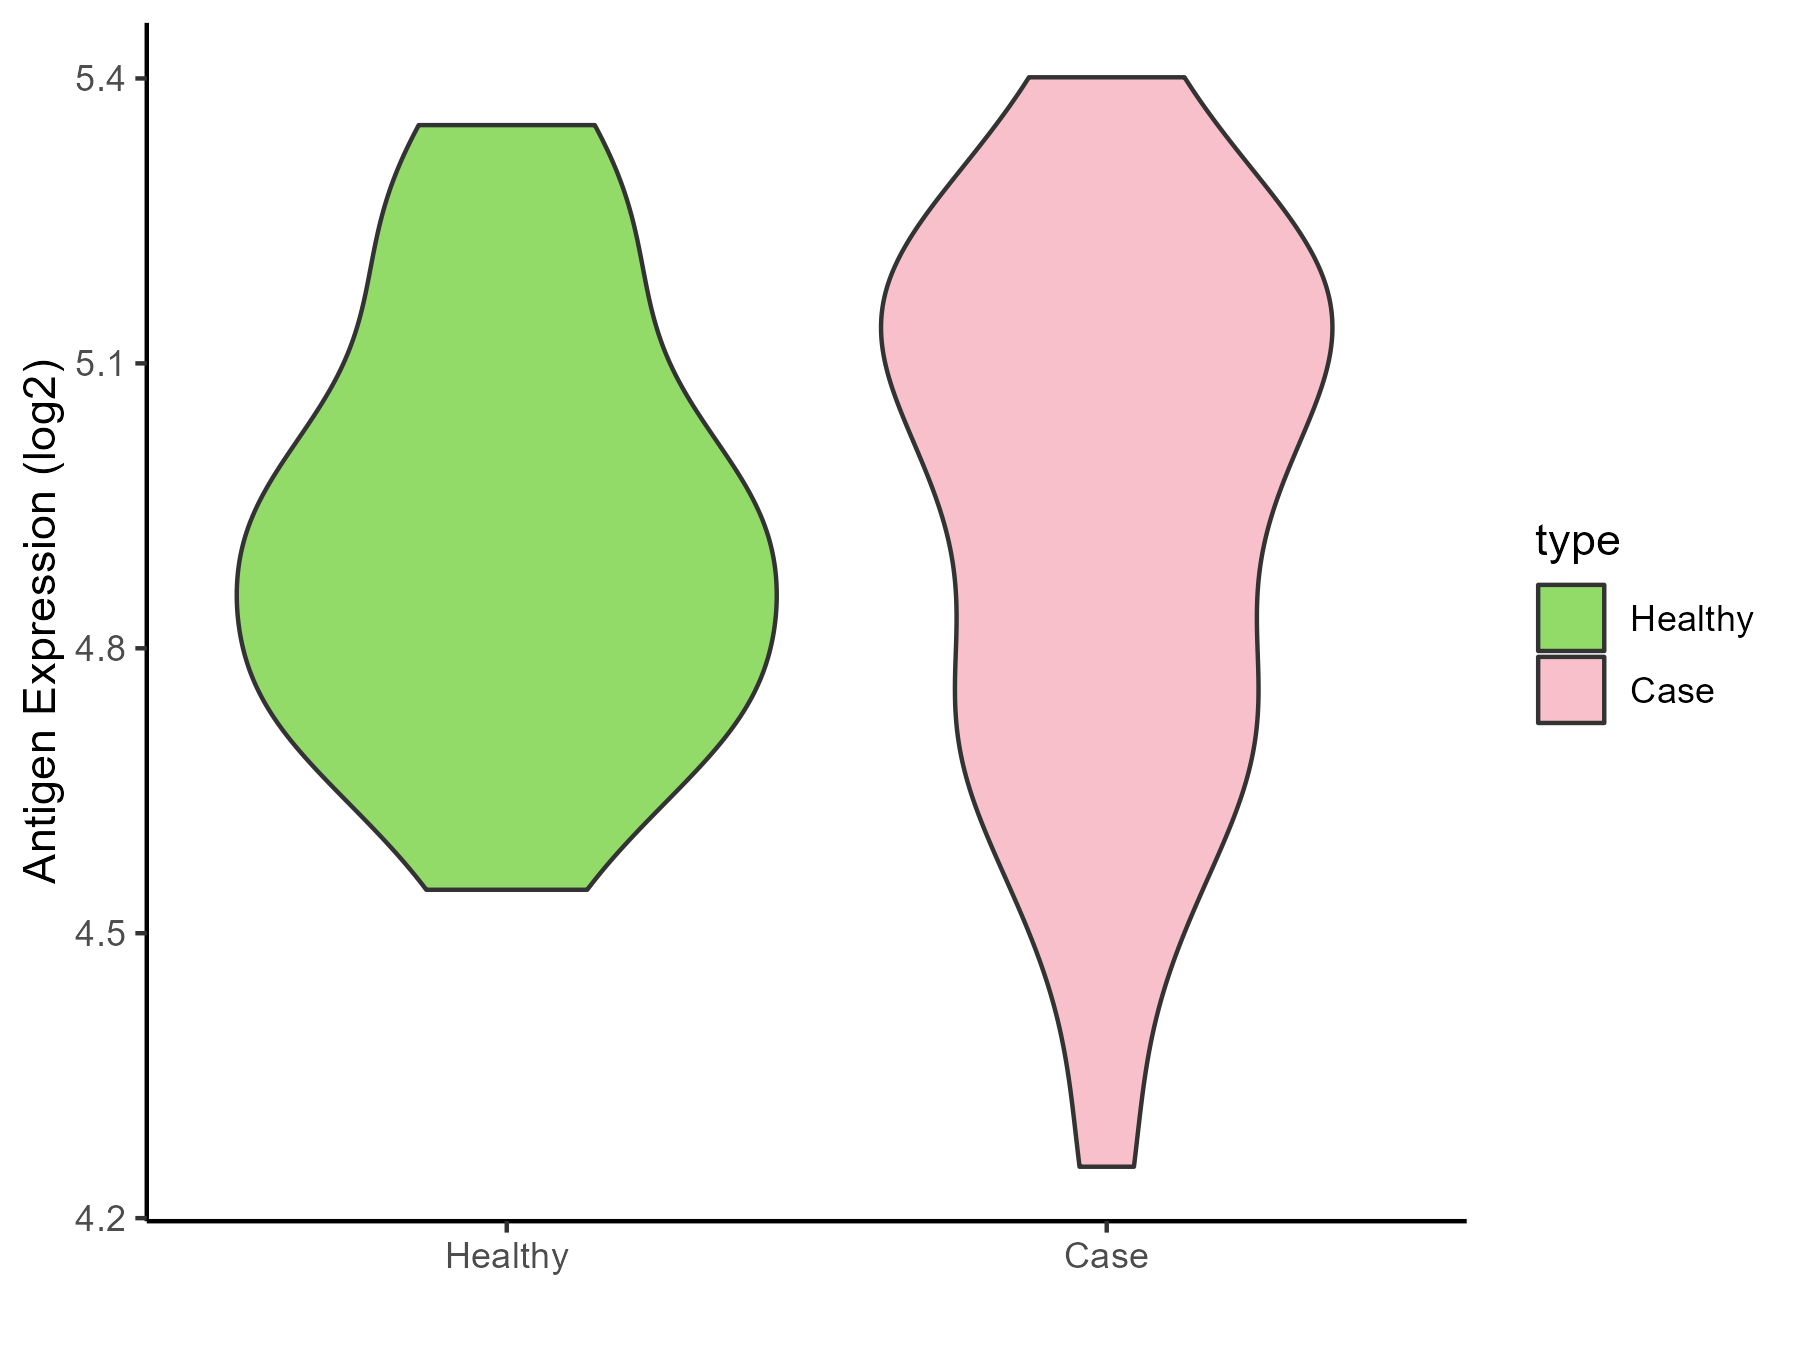
| Differential expression pattern of antigen in diseases | ||
| The Studied Tissue | Endometrium | |
| The Specific Disease | Endometriosis | |
| The Expression Level of Disease Section Compare with the Healthy Individual Tissue | p-value: 0.801744172; Fold-change: 0.053393891; Z-score: 0.241451532 | |
| Disease-specific Antigen Abundances |
|
Click to View the Clearer Original Diagram |
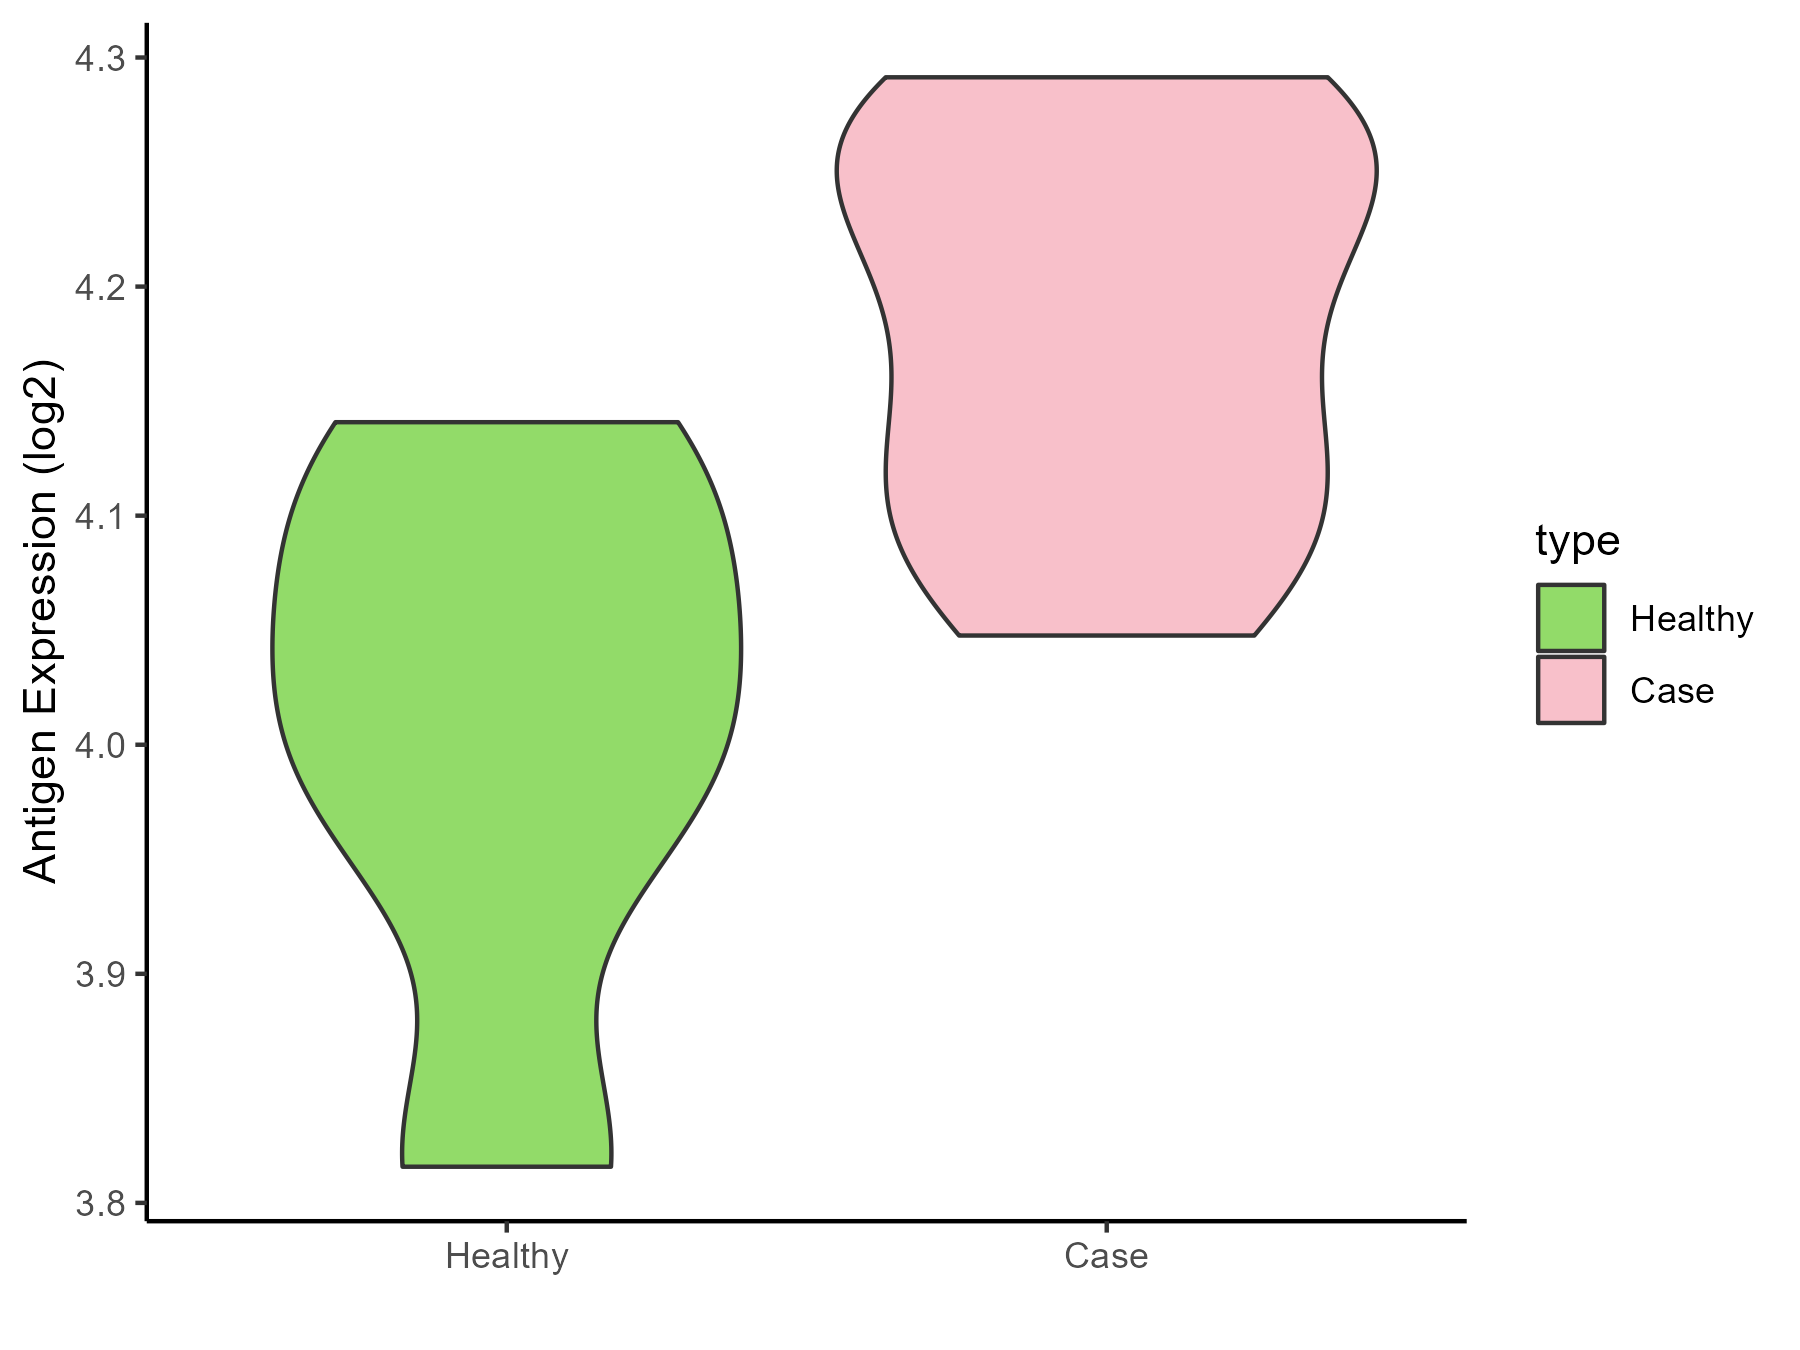
| Differential expression pattern of antigen in diseases | ||
| The Studied Tissue | Bladder | |
| The Specific Disease | Interstitial cystitis | |
| The Expression Level of Disease Section Compare with the Healthy Individual Tissue | p-value: 0.028212514; Fold-change: 0.174488359; Z-score: 1.402416895 | |
| Disease-specific Antigen Abundances |
|
Click to View the Clearer Original Diagram |
ICD Disease Classification 19
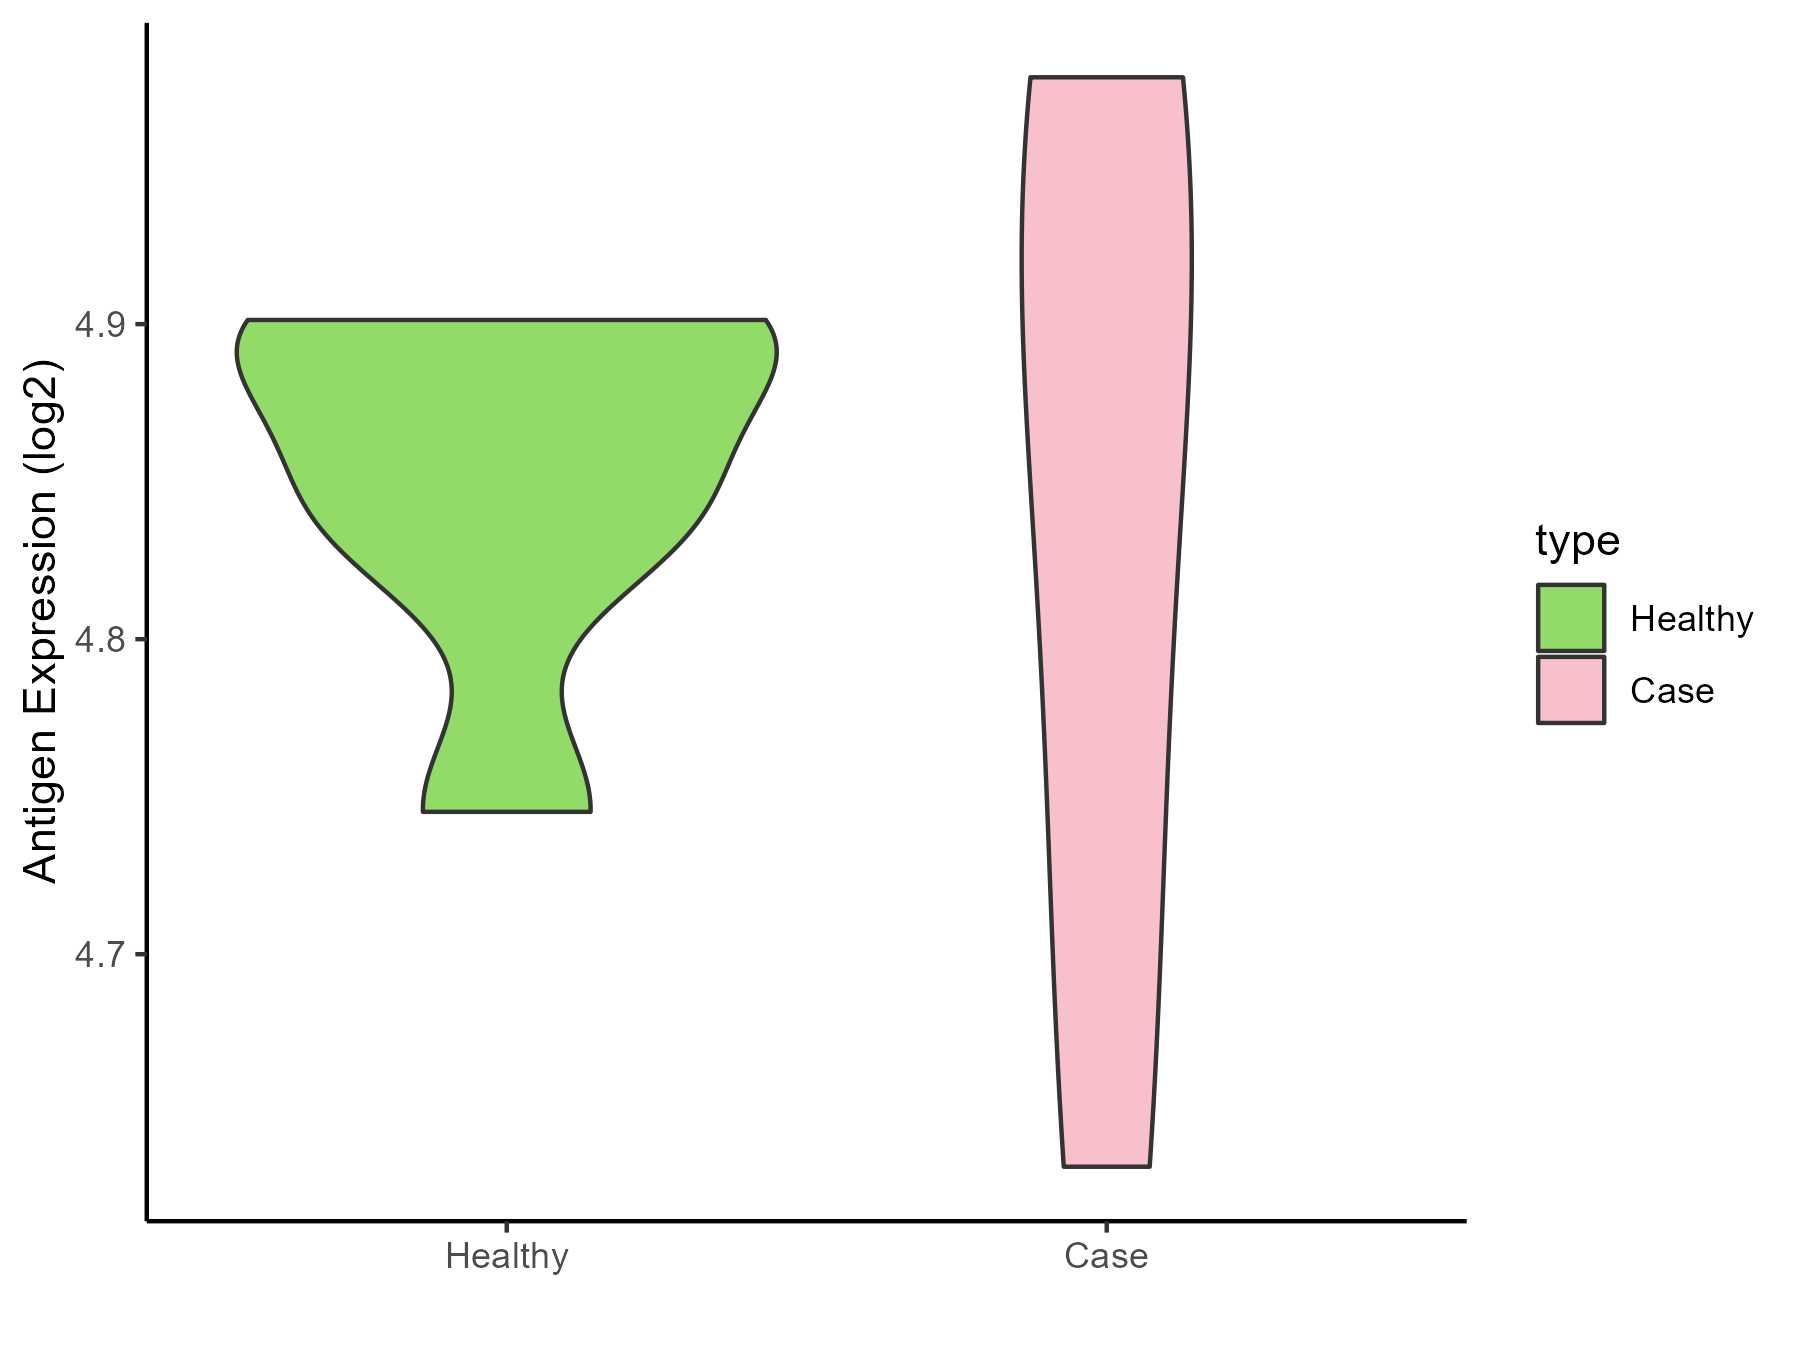
| Differential expression pattern of antigen in diseases | ||
| The Studied Tissue | Myometrium | |
| The Specific Disease | Preterm birth | |
| The Expression Level of Disease Section Compare with the Healthy Individual Tissue | p-value: 0.857949768; Fold-change: 0.007087787; Z-score: 0.117935597 | |
| Disease-specific Antigen Abundances |
|
Click to View the Clearer Original Diagram |
ICD Disease Classification 2
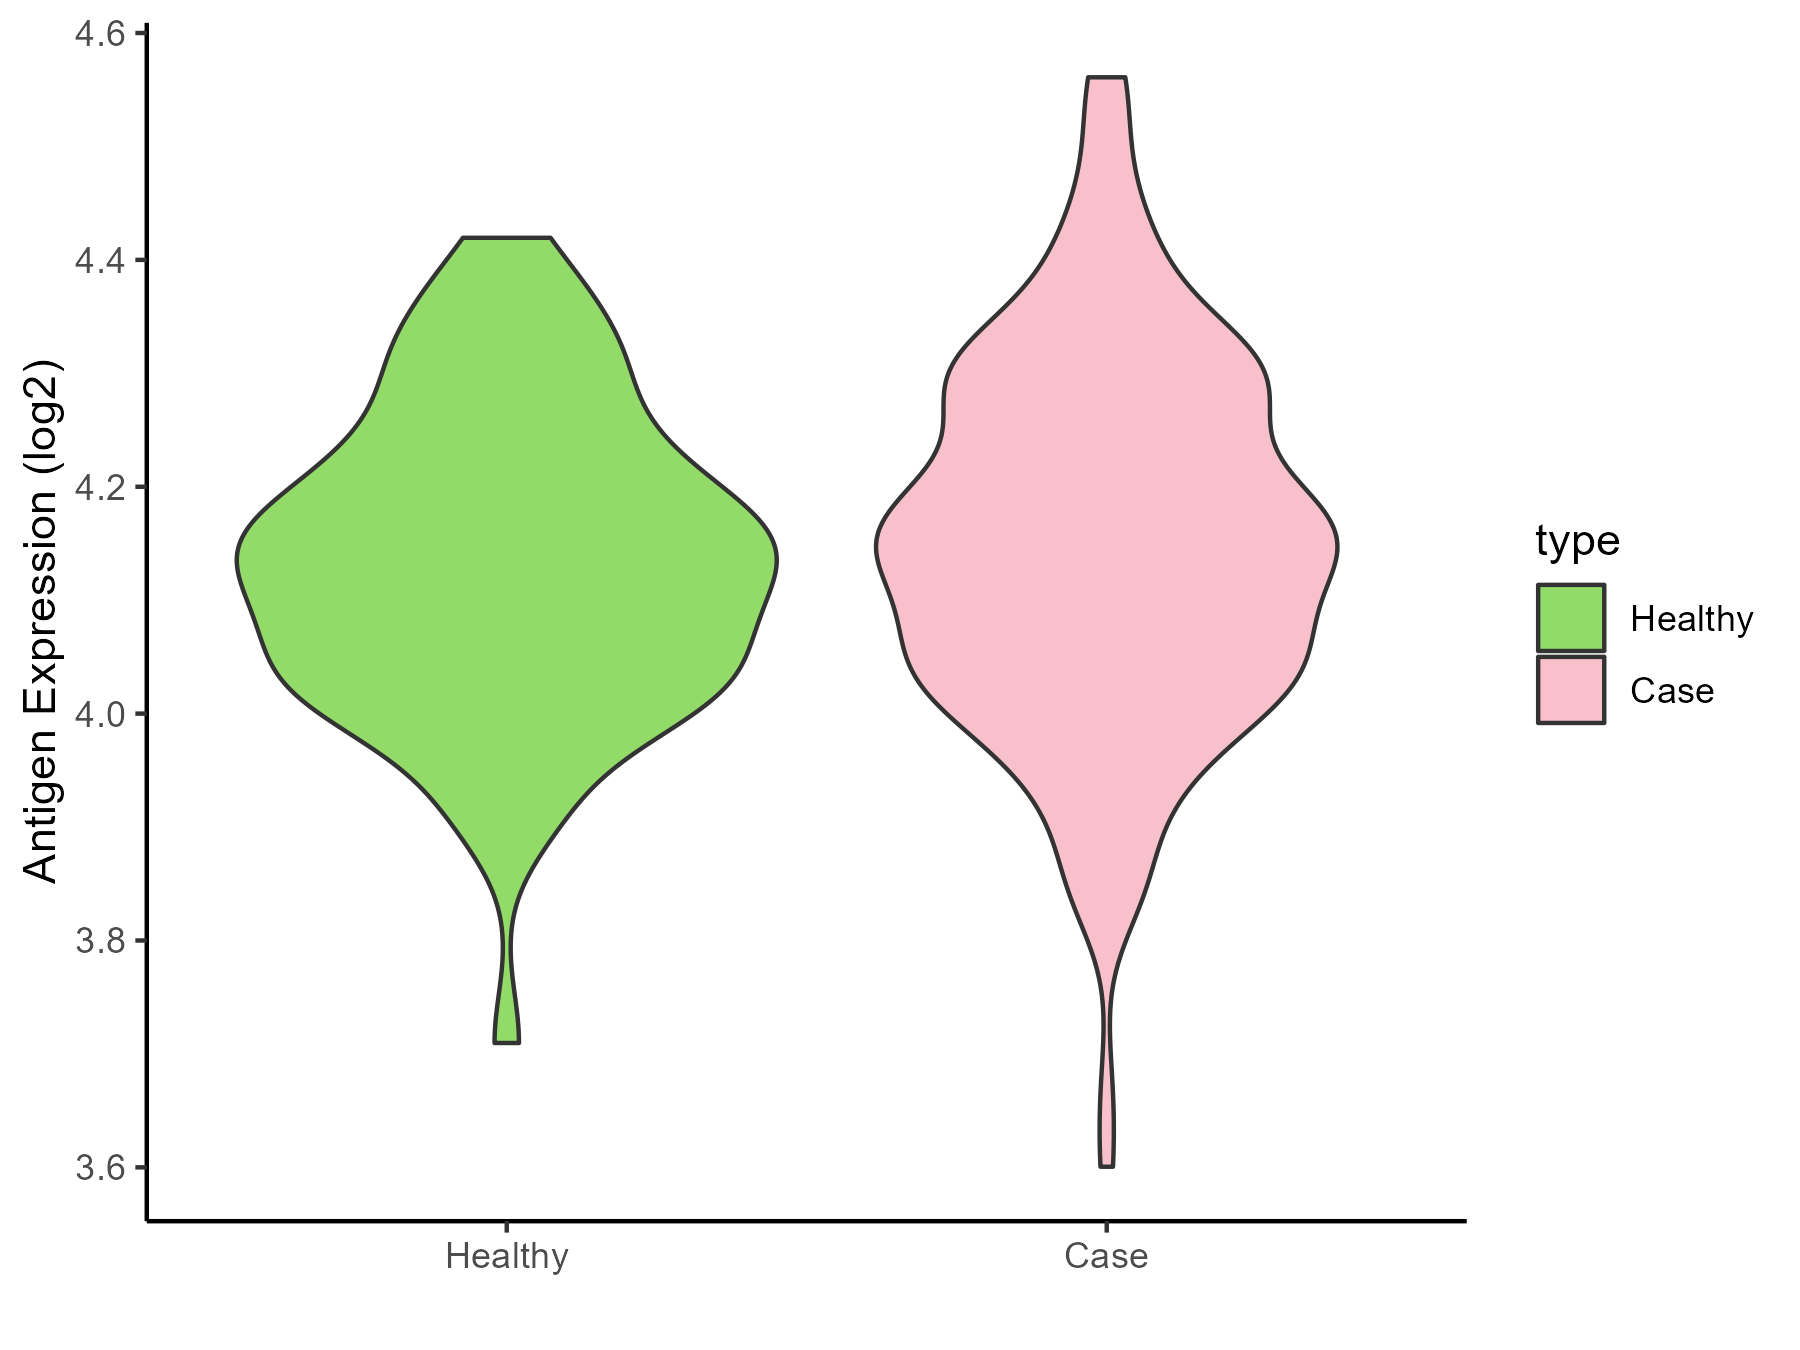
| Differential expression pattern of antigen in diseases | ||
| The Studied Tissue | Bone marrow | |
| The Specific Disease | Acute myelocytic leukemia | |
| The Expression Level of Disease Section Compare with the Healthy Individual Tissue | p-value: 0.249840814; Fold-change: 0.007332275; Z-score: 0.054582074 | |
| Disease-specific Antigen Abundances |
|
Click to View the Clearer Original Diagram |
| Differential expression pattern of antigen in diseases | ||
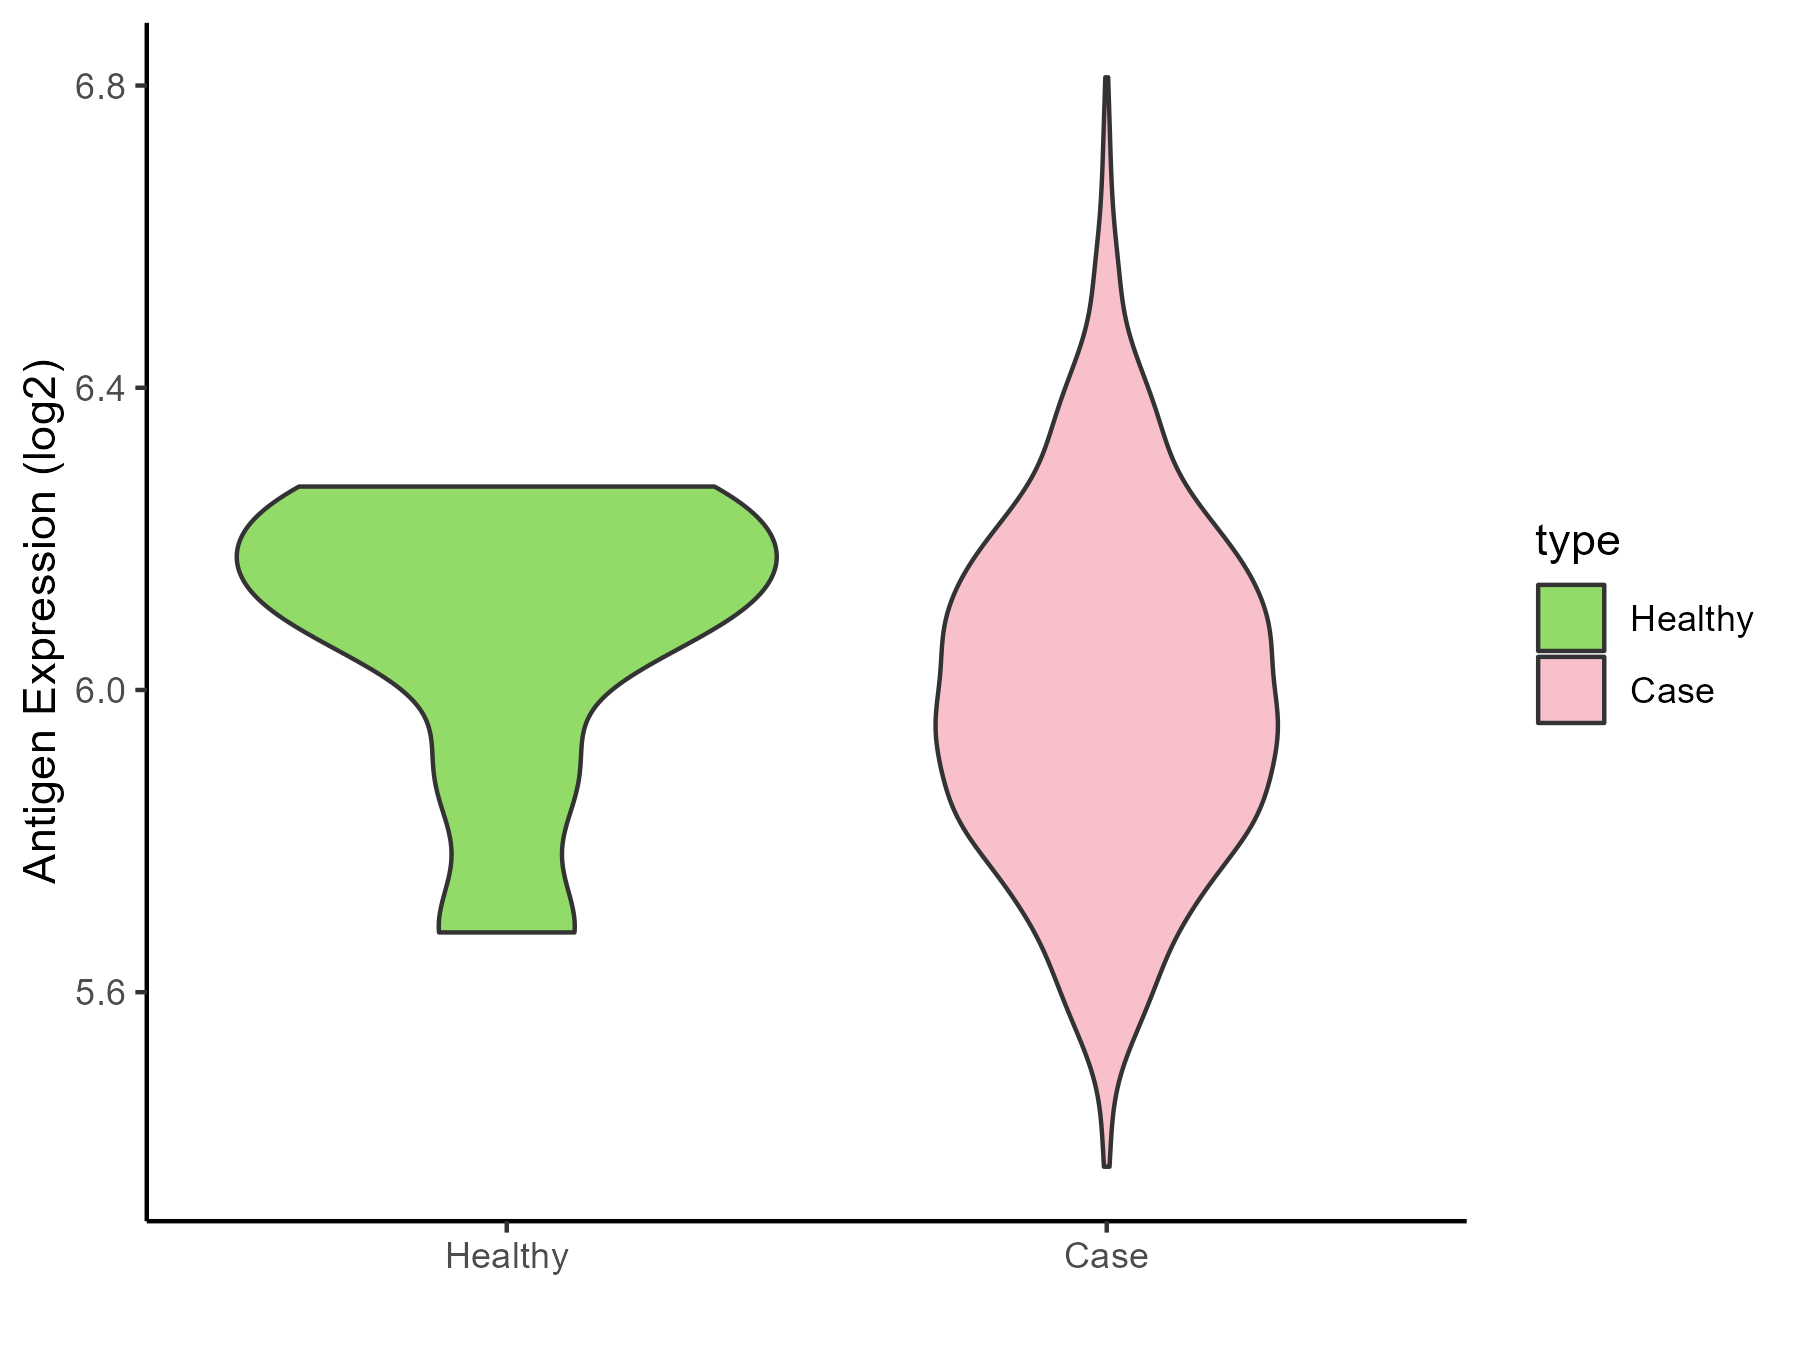
| The Studied Tissue | Bone marrow | |
| The Specific Disease | Myeloma | |
| The Expression Level of Disease Section Compare with the Healthy Individual Tissue | p-value: 0.298807755; Fold-change: -0.134032188; Z-score: -0.664847385 | |
| Disease-specific Antigen Abundances |
|
Click to View the Clearer Original Diagram |
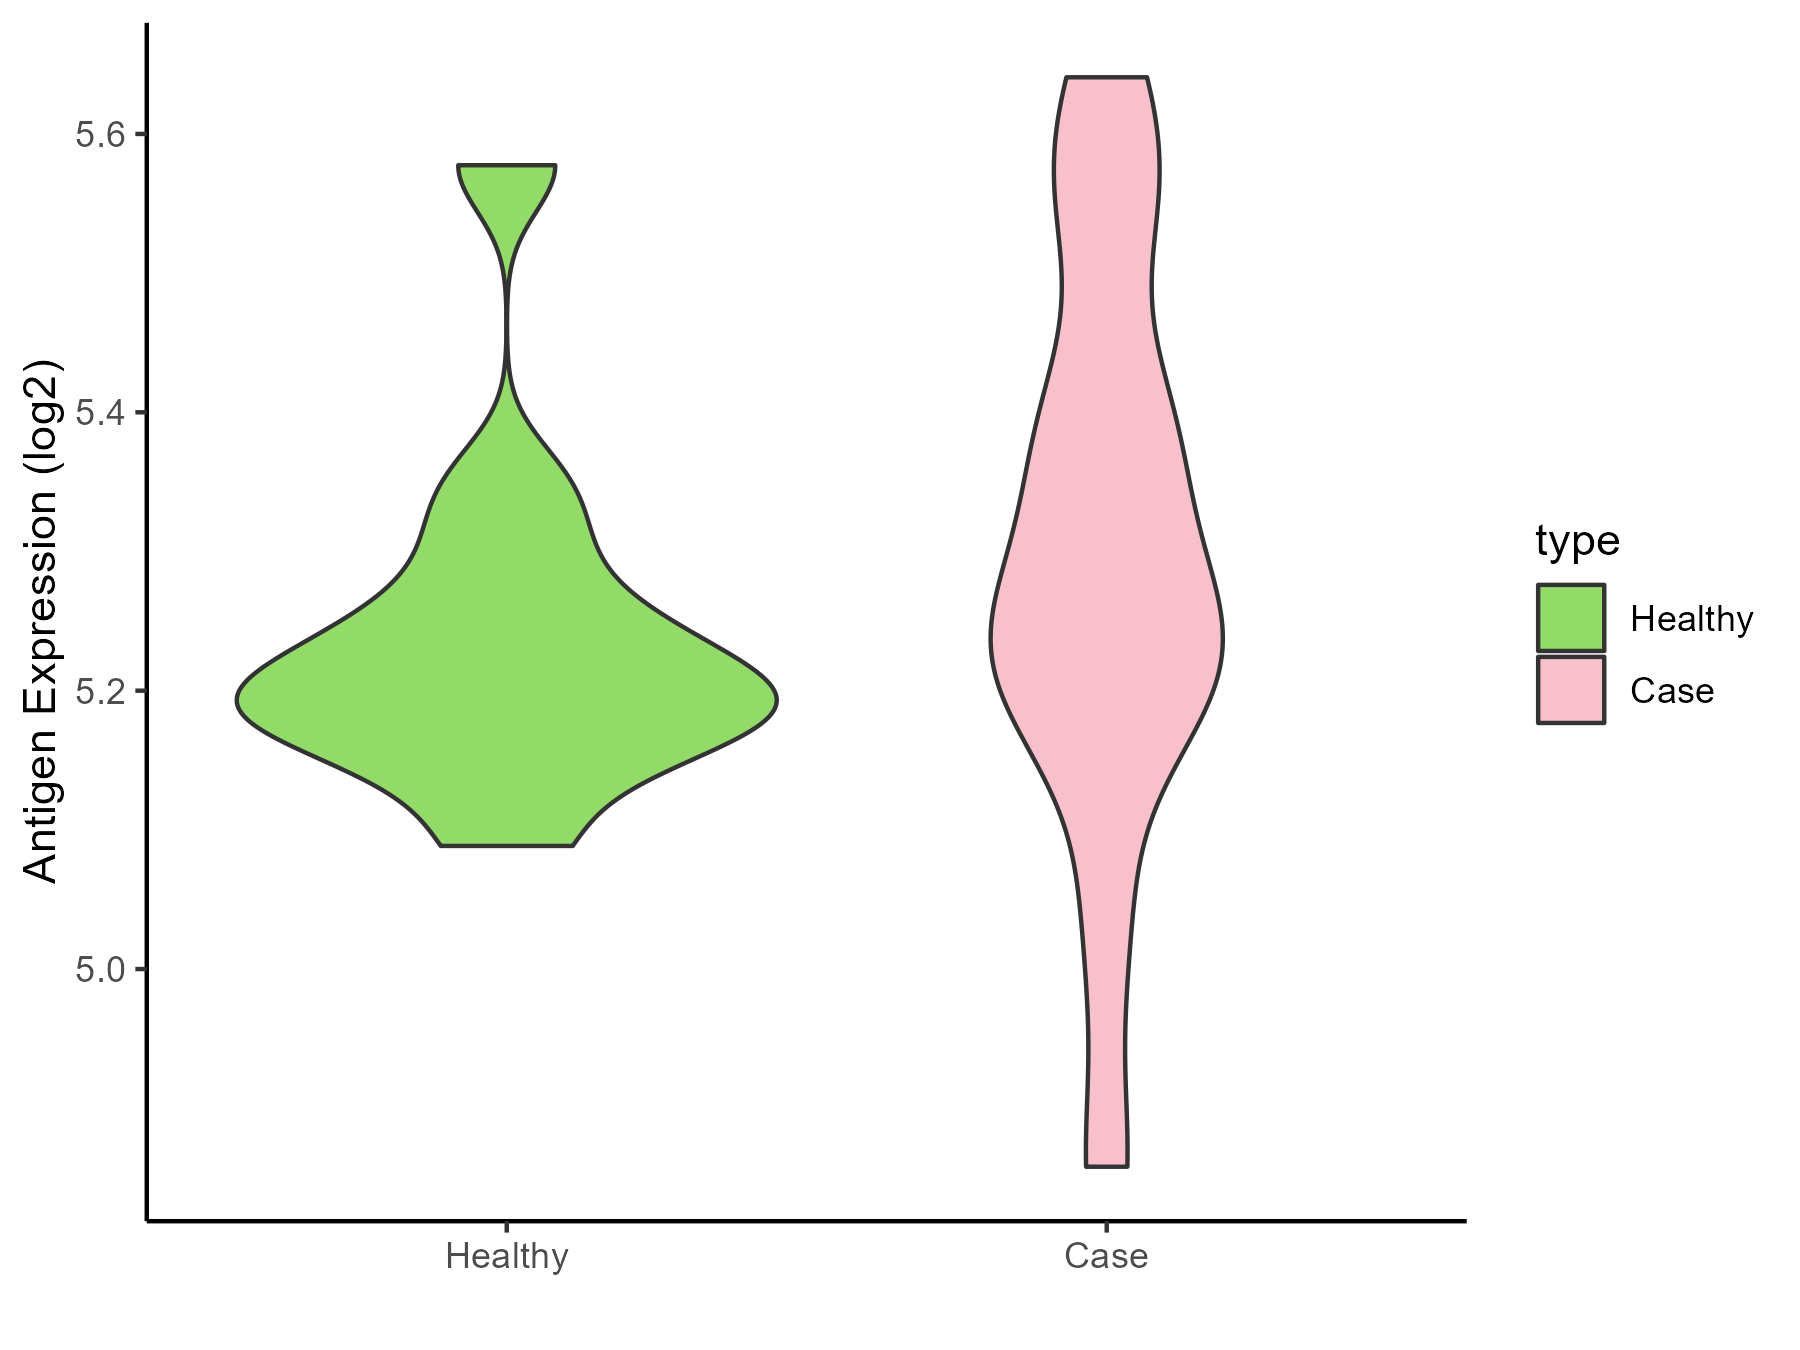
| The Studied Tissue | Peripheral blood | |
| The Specific Disease | Myeloma | |
| The Expression Level of Disease Section Compare with the Healthy Individual Tissue | p-value: 0.417417574; Fold-change: 0.050533626; Z-score: 0.399962468 | |
| Disease-specific Antigen Abundances |
|
Click to View the Clearer Original Diagram |
| Differential expression pattern of antigen in diseases | ||
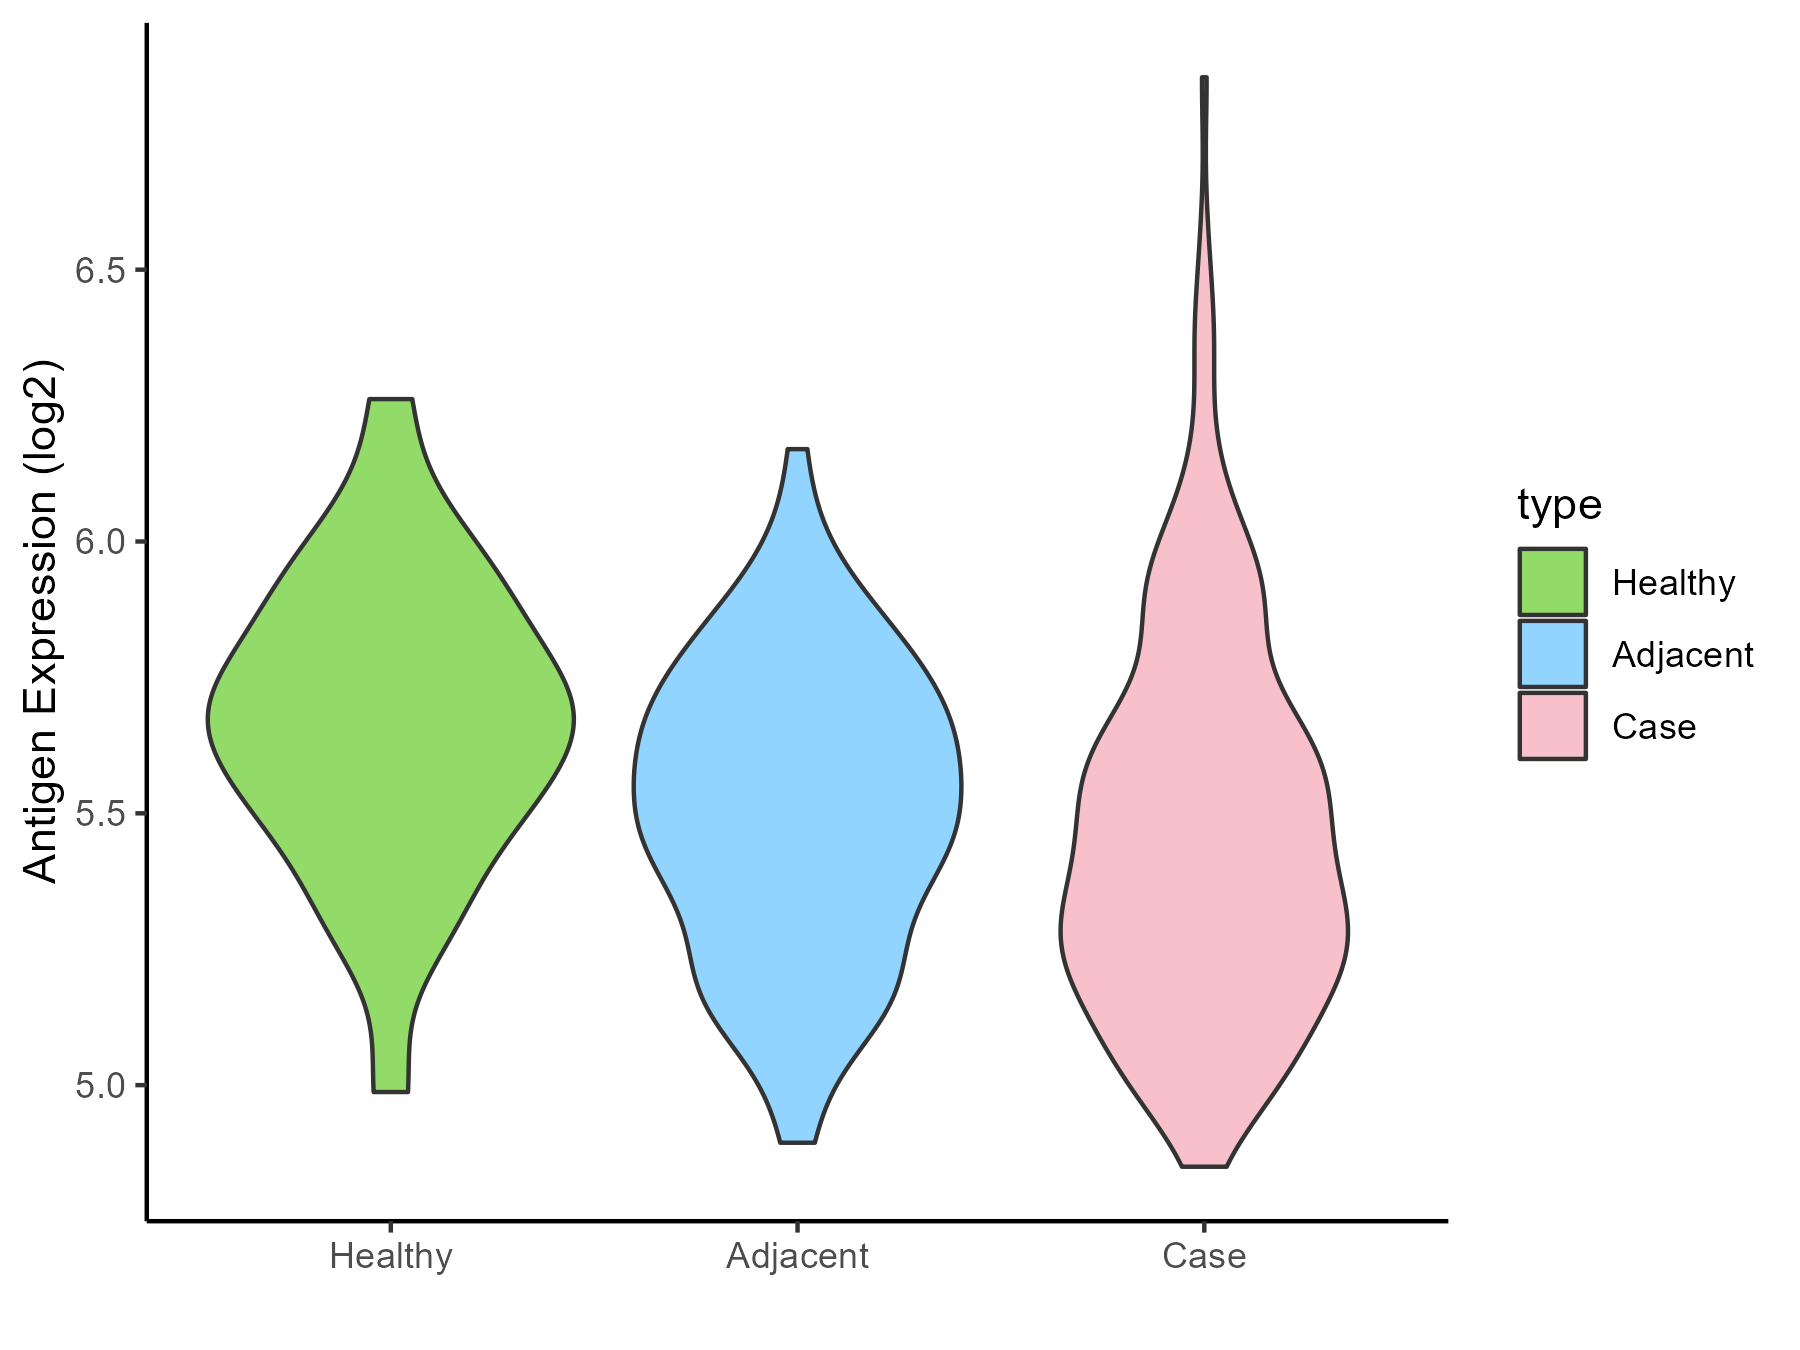
| The Studied Tissue | Oral | |
| The Specific Disease | Oral cancer | |
| The Expression Level of Disease Section Compare with the Healthy Individual Tissue | p-value: 0.001431456; Fold-change: -0.266656983; Z-score: -0.976576385 | |
| The Expression Level of Disease Section Compare with the Adjacent Tissue | p-value: 0.283134251; Fold-change: -0.09583923; Z-score: -0.359644292 | |
| Disease-specific Antigen Abundances |
|
Click to View the Clearer Original Diagram |
| Differential expression pattern of antigen in diseases | ||
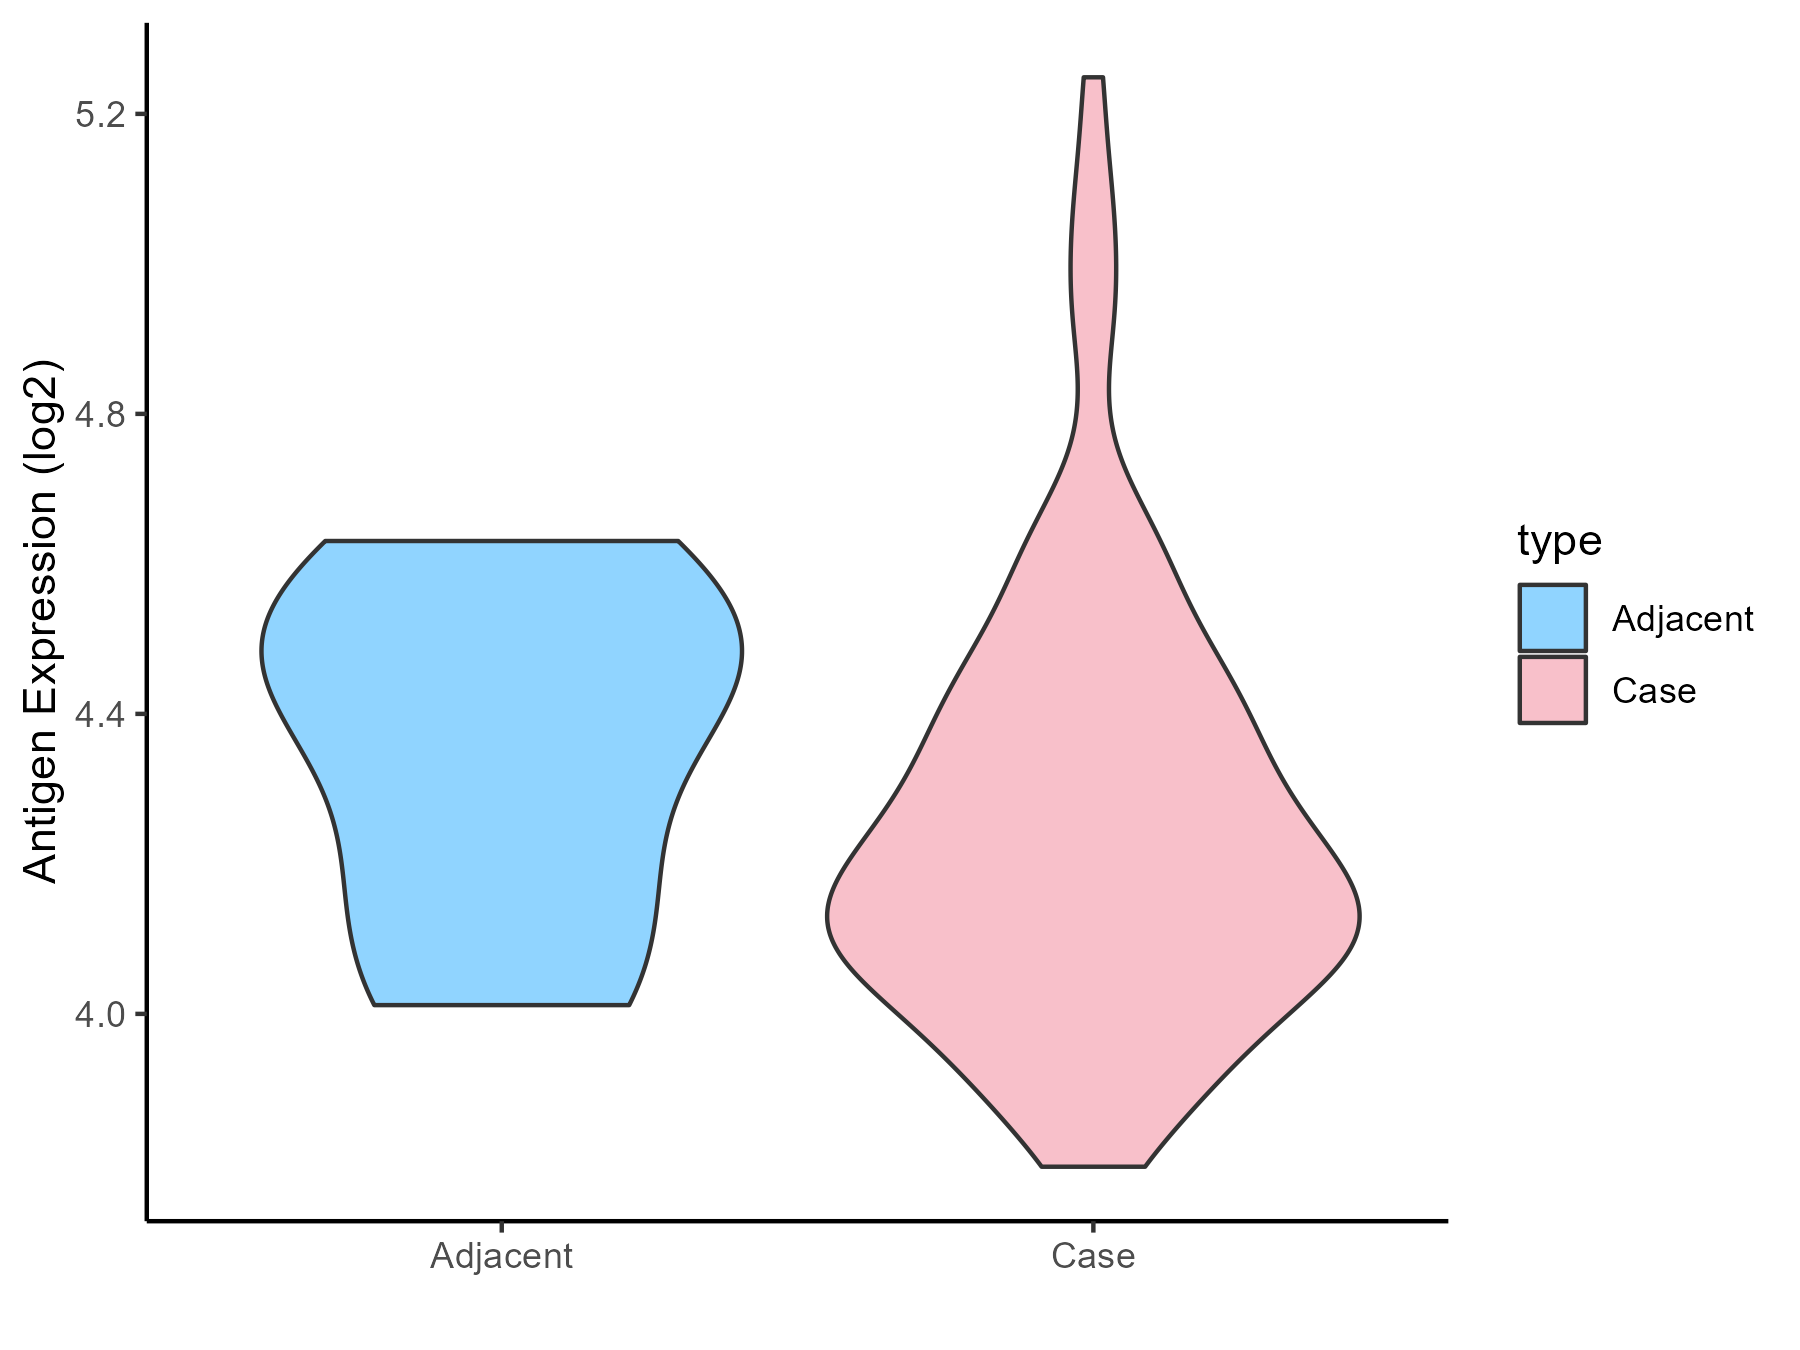
| The Studied Tissue | Esophagus | |
| The Specific Disease | Esophagal cancer | |
| The Expression Level of Disease Section Compare with the Adjacent Tissue | p-value: 0.4332804; Fold-change: -0.237363549; Z-score: -0.96960965 | |
| Disease-specific Antigen Abundances |
|
Click to View the Clearer Original Diagram |
| Differential expression pattern of antigen in diseases | ||
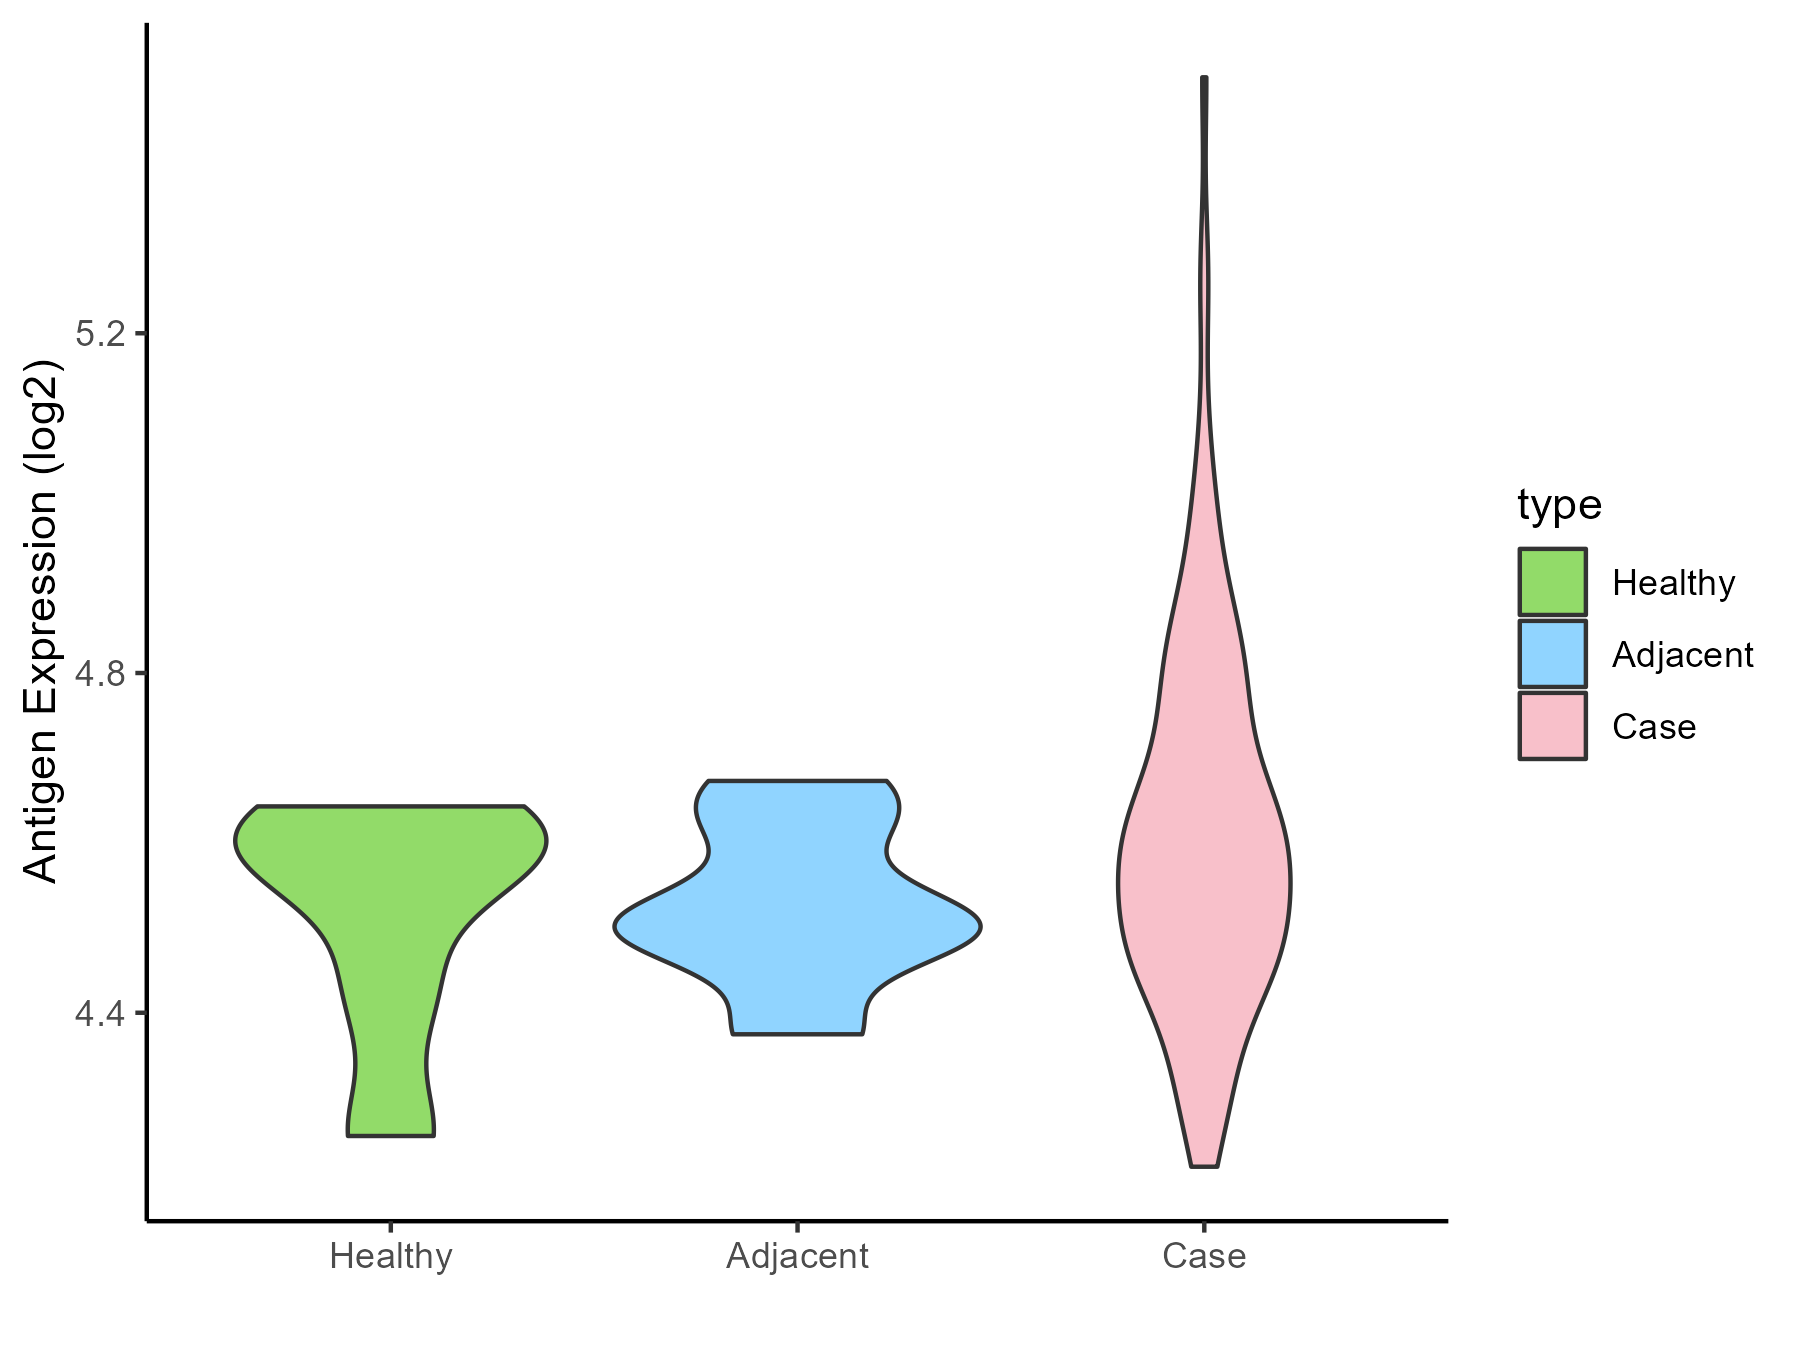
| The Studied Tissue | Rectal colon | |
| The Specific Disease | Rectal cancer | |
| The Expression Level of Disease Section Compare with the Healthy Individual Tissue | p-value: 0.17195769; Fold-change: -0.00485939; Z-score: -0.032746565 | |
| The Expression Level of Disease Section Compare with the Adjacent Tissue | p-value: 0.10320162; Fold-change: 0.075023821; Z-score: 0.716312217 | |
| Disease-specific Antigen Abundances |
|
Click to View the Clearer Original Diagram |
| Differential expression pattern of antigen in diseases | ||
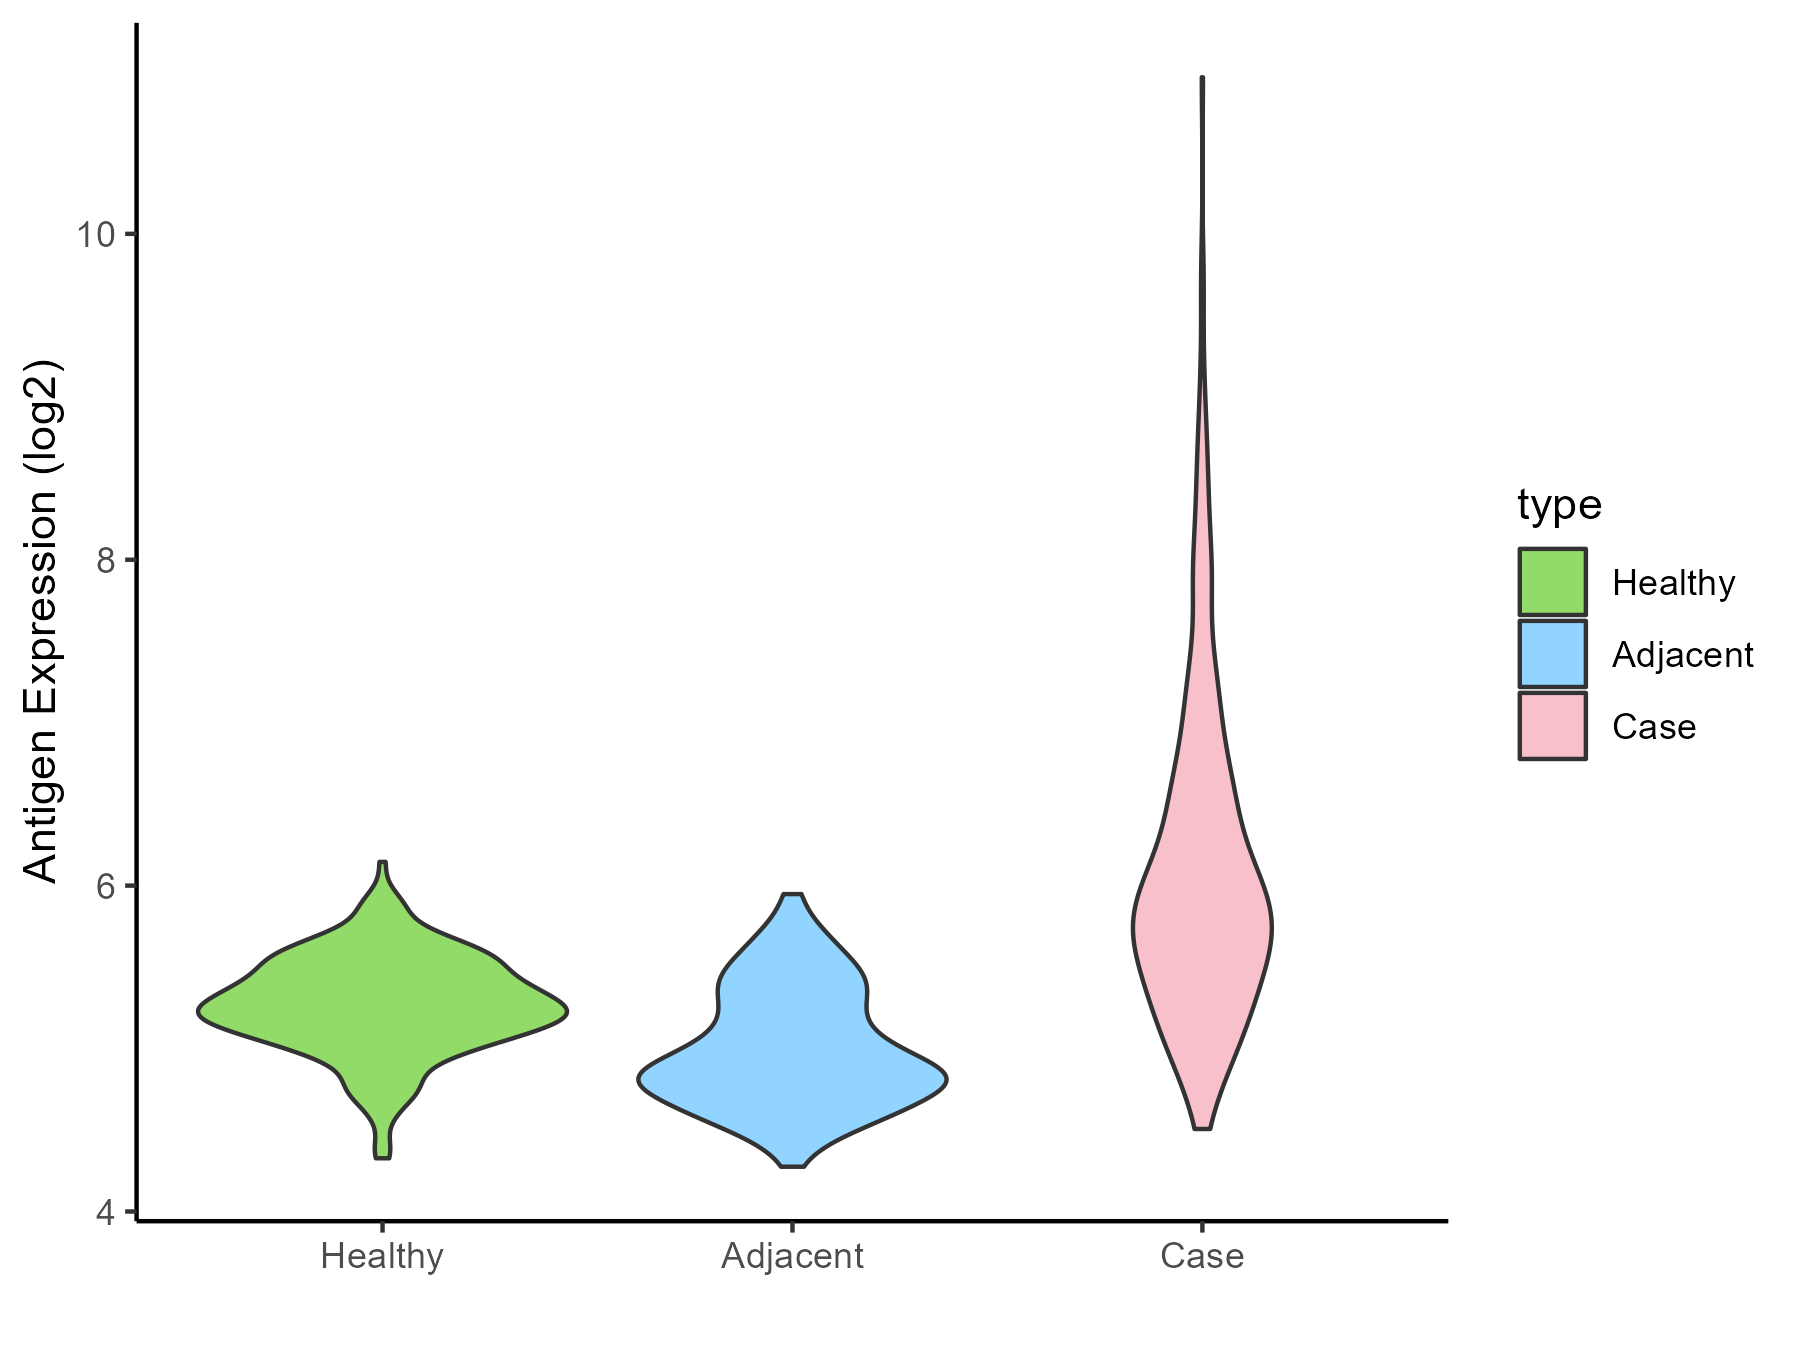
| The Studied Tissue | Skin | |
| The Specific Disease | Skin cancer | |
| The Expression Level of Disease Section Compare with the Healthy Individual Tissue | p-value: 4.55E-43; Fold-change: 0.609943837; Z-score: 2.040428573 | |
| The Expression Level of Disease Section Compare with the Adjacent Tissue | p-value: 1.39E-62; Fold-change: 0.957034325; Z-score: 2.628262731 | |
| Disease-specific Antigen Abundances |
|
Click to View the Clearer Original Diagram |
| Differential expression pattern of antigen in diseases | ||
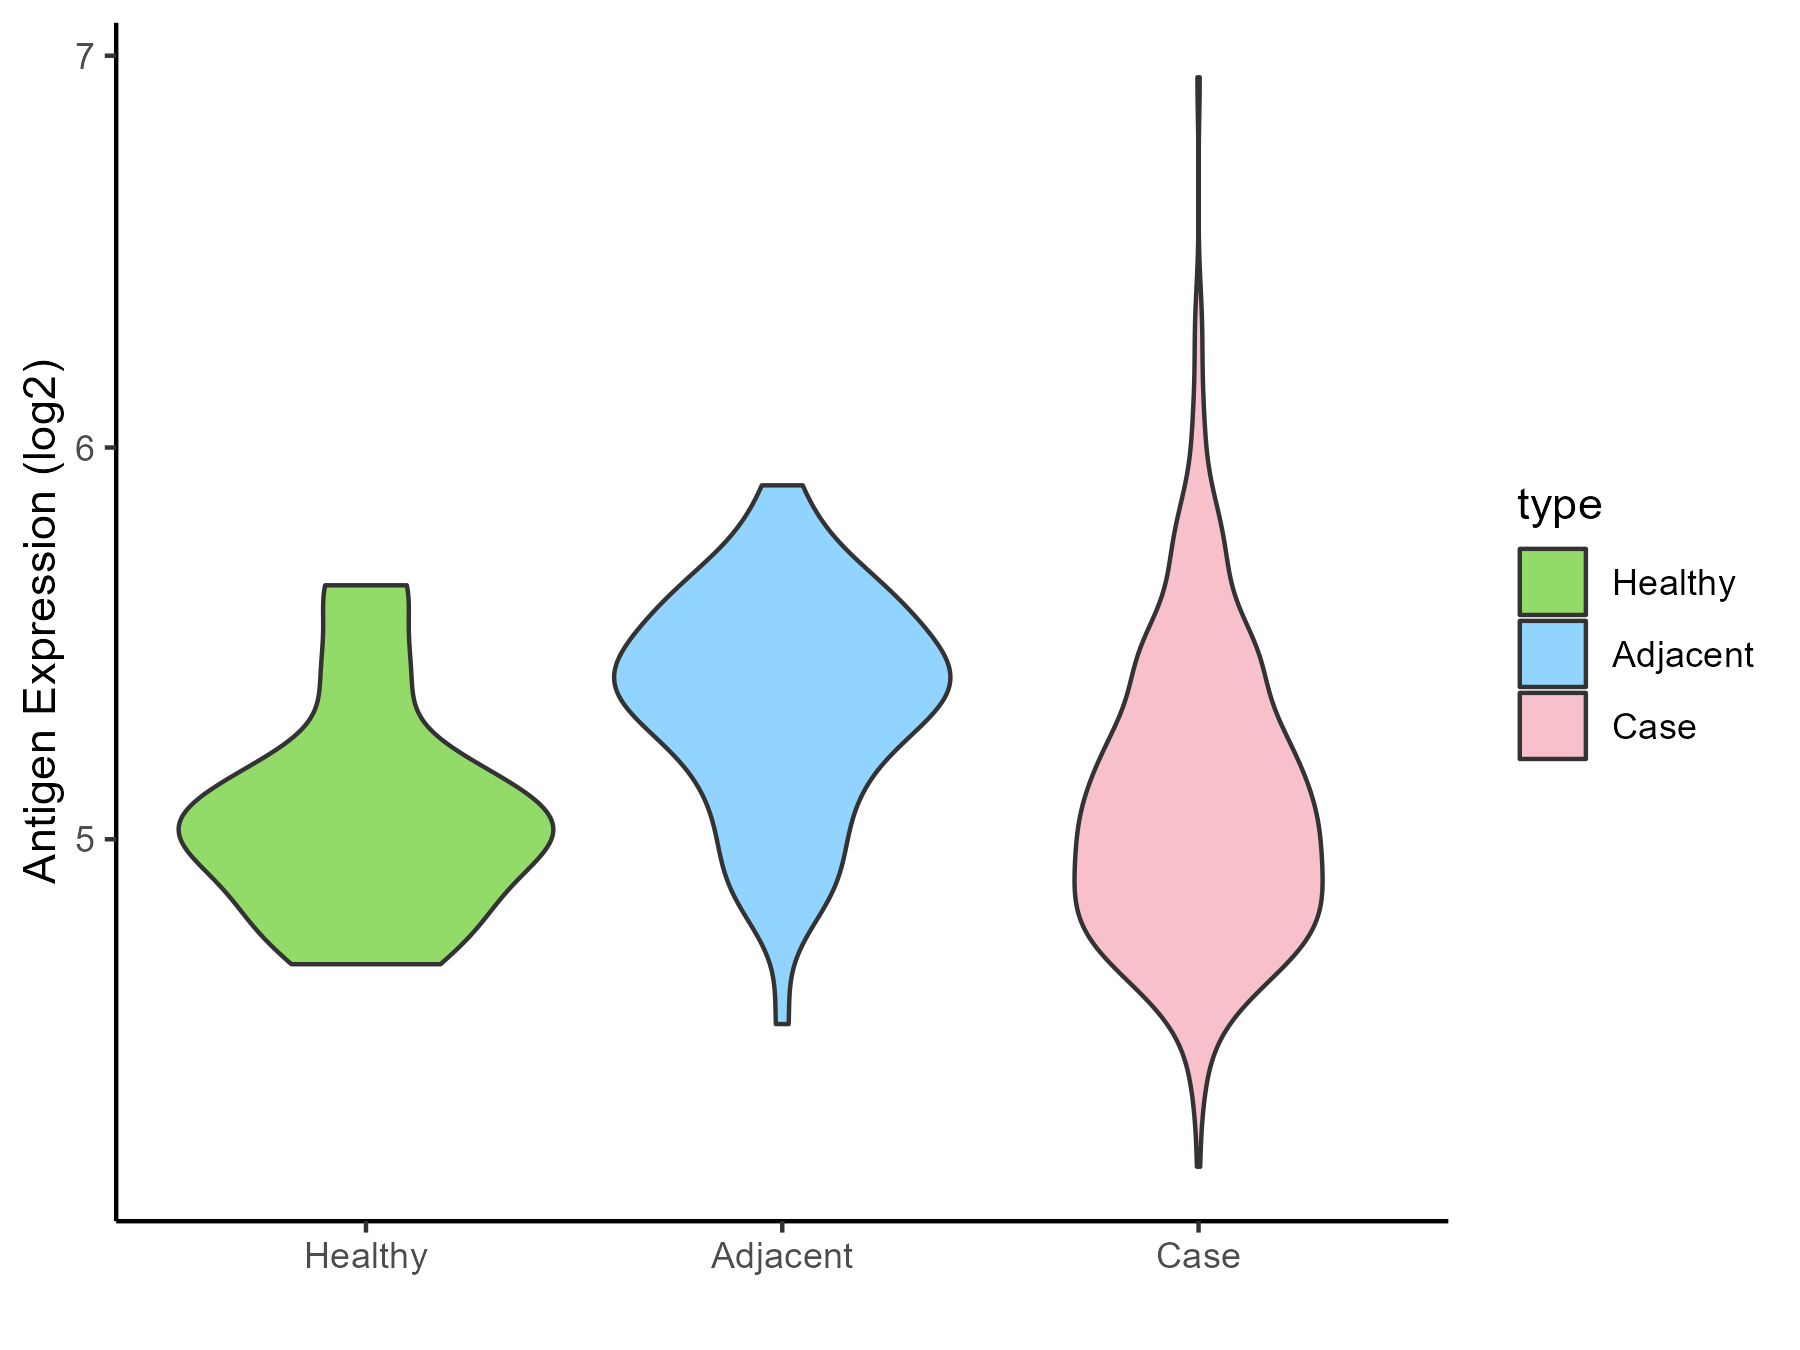
| The Studied Tissue | Kidney | |
| The Specific Disease | Renal cancer | |
| The Expression Level of Disease Section Compare with the Healthy Individual Tissue | p-value: 0.717066092; Fold-change: 0.028629716; Z-score: 0.102938887 | |
| The Expression Level of Disease Section Compare with the Adjacent Tissue | p-value: 2.03E-09; Fold-change: -0.347391328; Z-score: -1.256347155 | |
| Disease-specific Antigen Abundances |
|
Click to View the Clearer Original Diagram |
| Differential expression pattern of antigen in diseases | ||
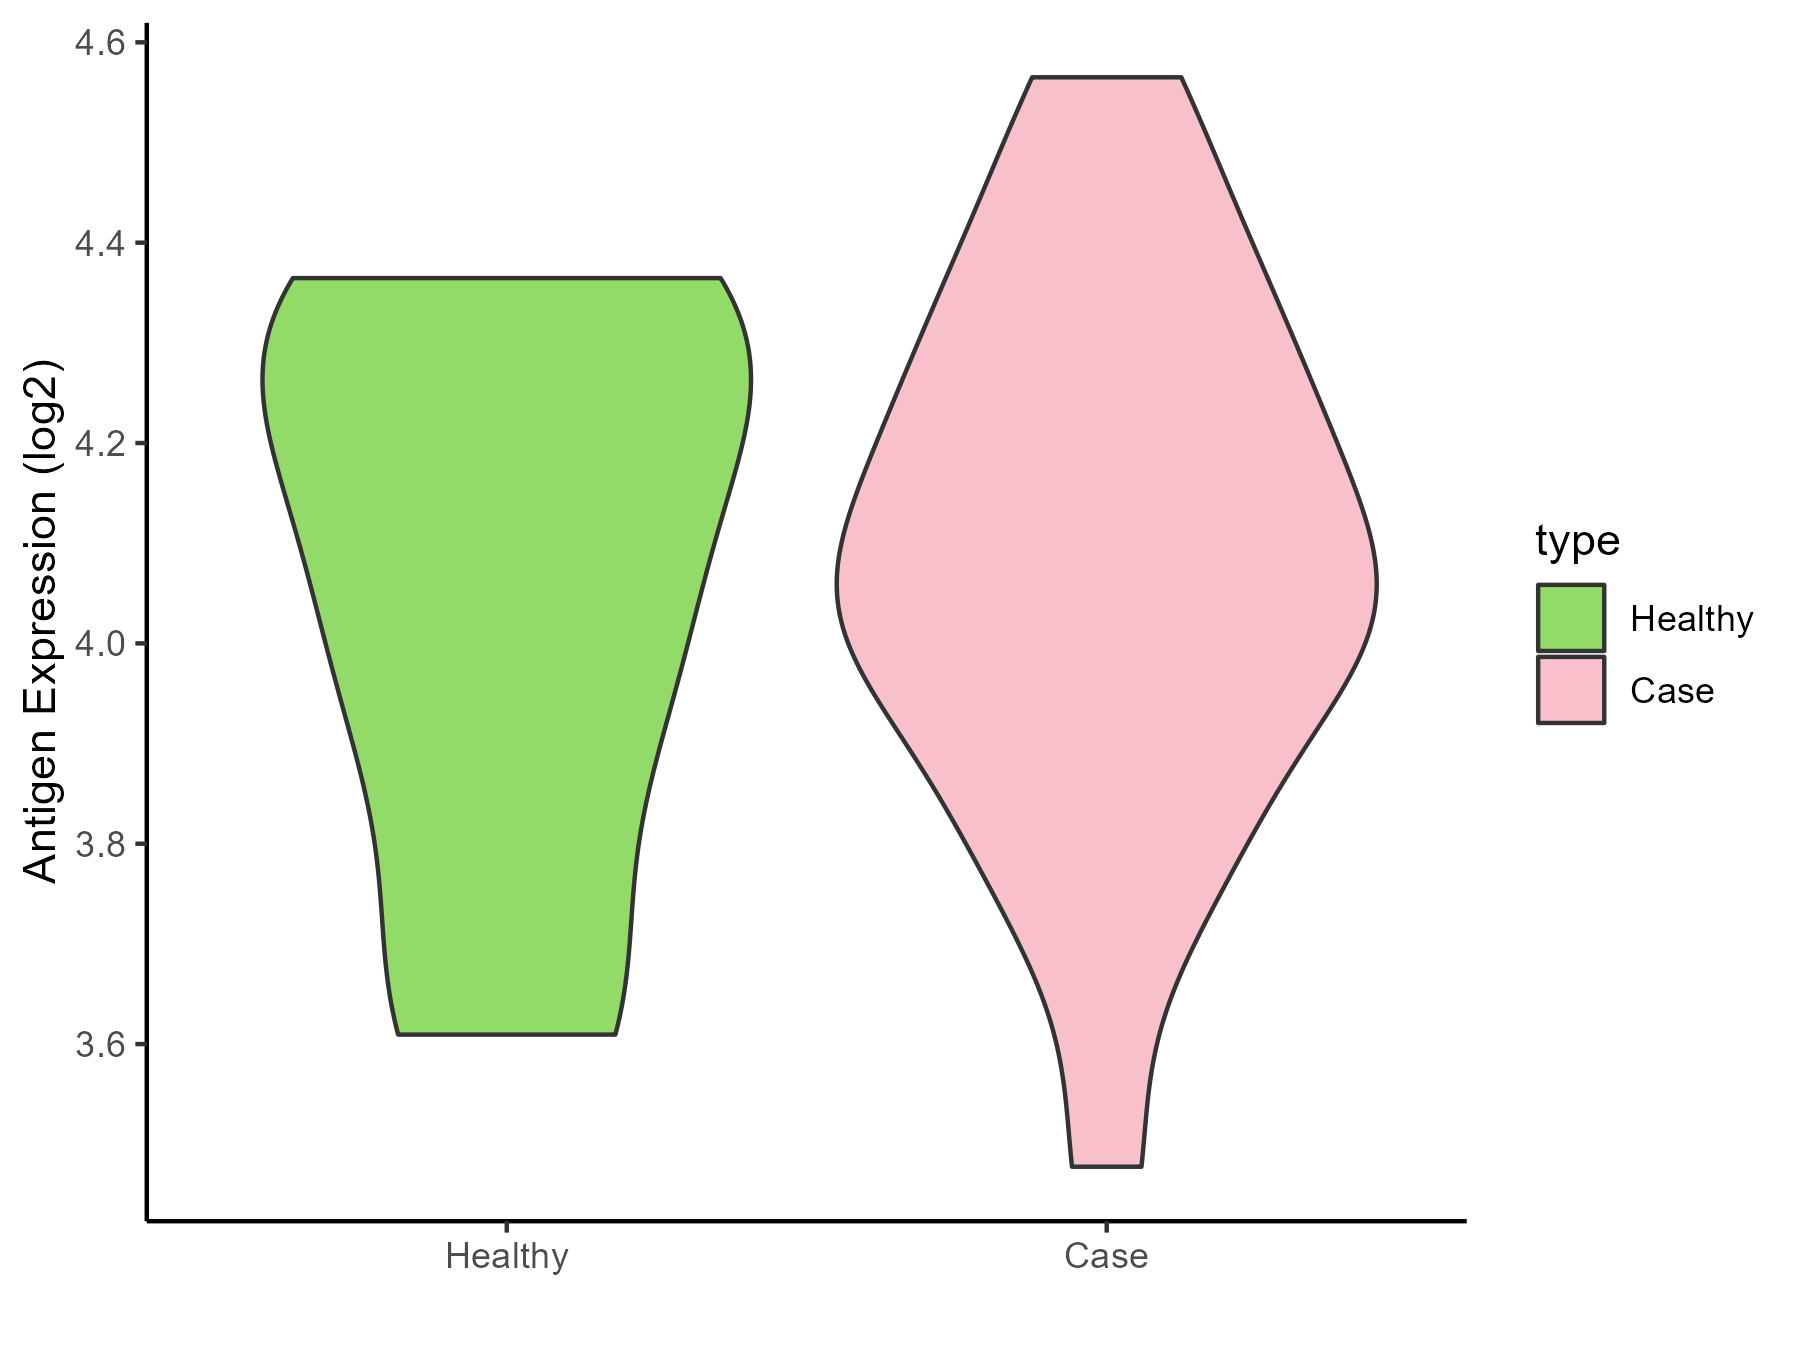
| The Studied Tissue | Urothelium | |
| The Specific Disease | Ureter cancer | |
| The Expression Level of Disease Section Compare with the Healthy Individual Tissue | p-value: 0.813739369; Fold-change: -0.024945061; Z-score: -0.090828973 | |
| Disease-specific Antigen Abundances |
|
Click to View the Clearer Original Diagram |
ICD Disease Classification 20
| Differential expression pattern of antigen in diseases | ||
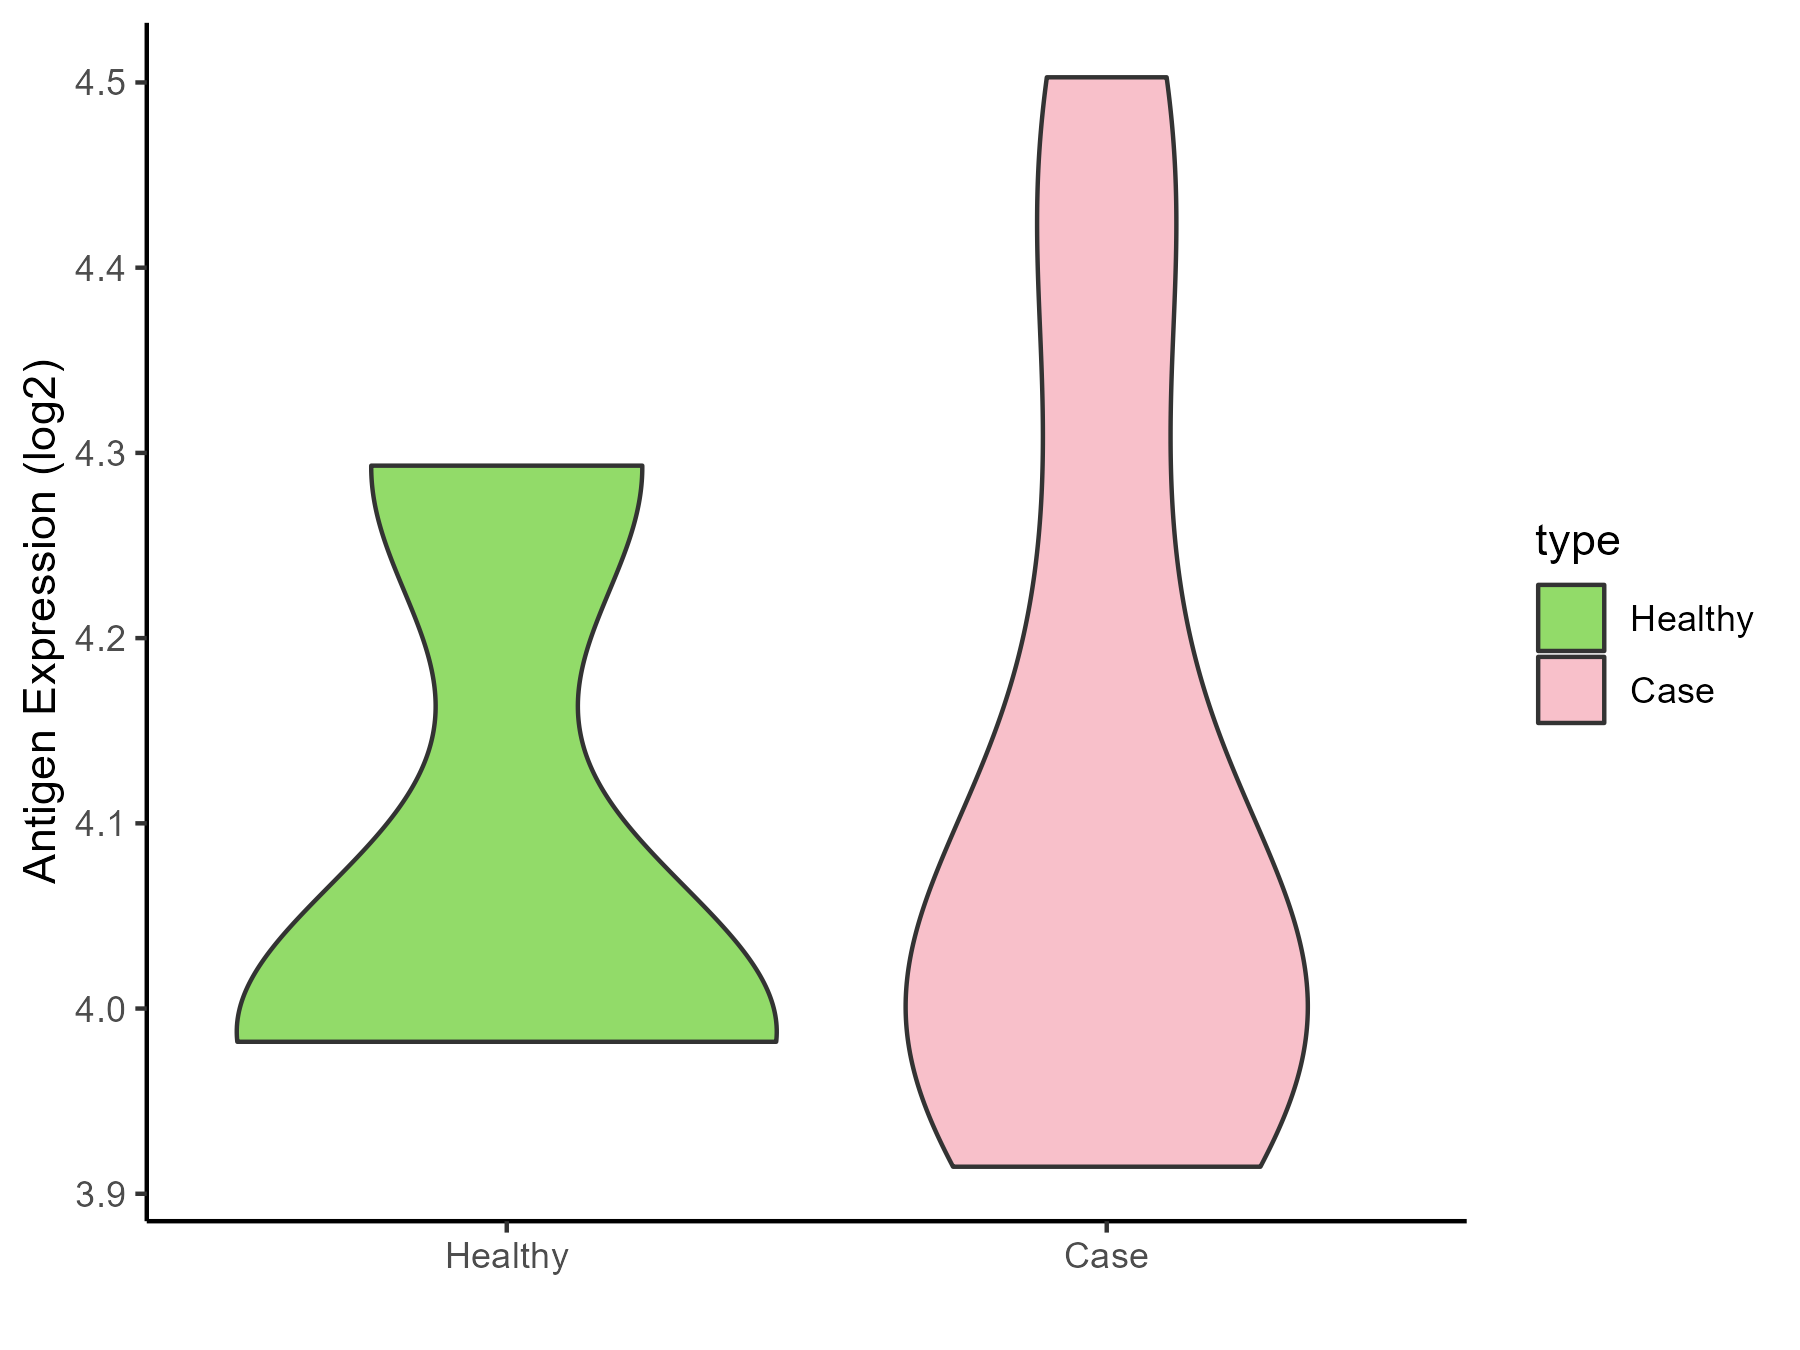
| The Studied Tissue | Adipose | |
| The Specific Disease | Simpson golabi behmel syndrome | |
| The Expression Level of Disease Section Compare with the Healthy Individual Tissue | p-value: 0.793309752; Fold-change: 0.025271899; Z-score: 0.1430823 | |
| Disease-specific Antigen Abundances |
|
Click to View the Clearer Original Diagram |
| Differential expression pattern of antigen in diseases | ||
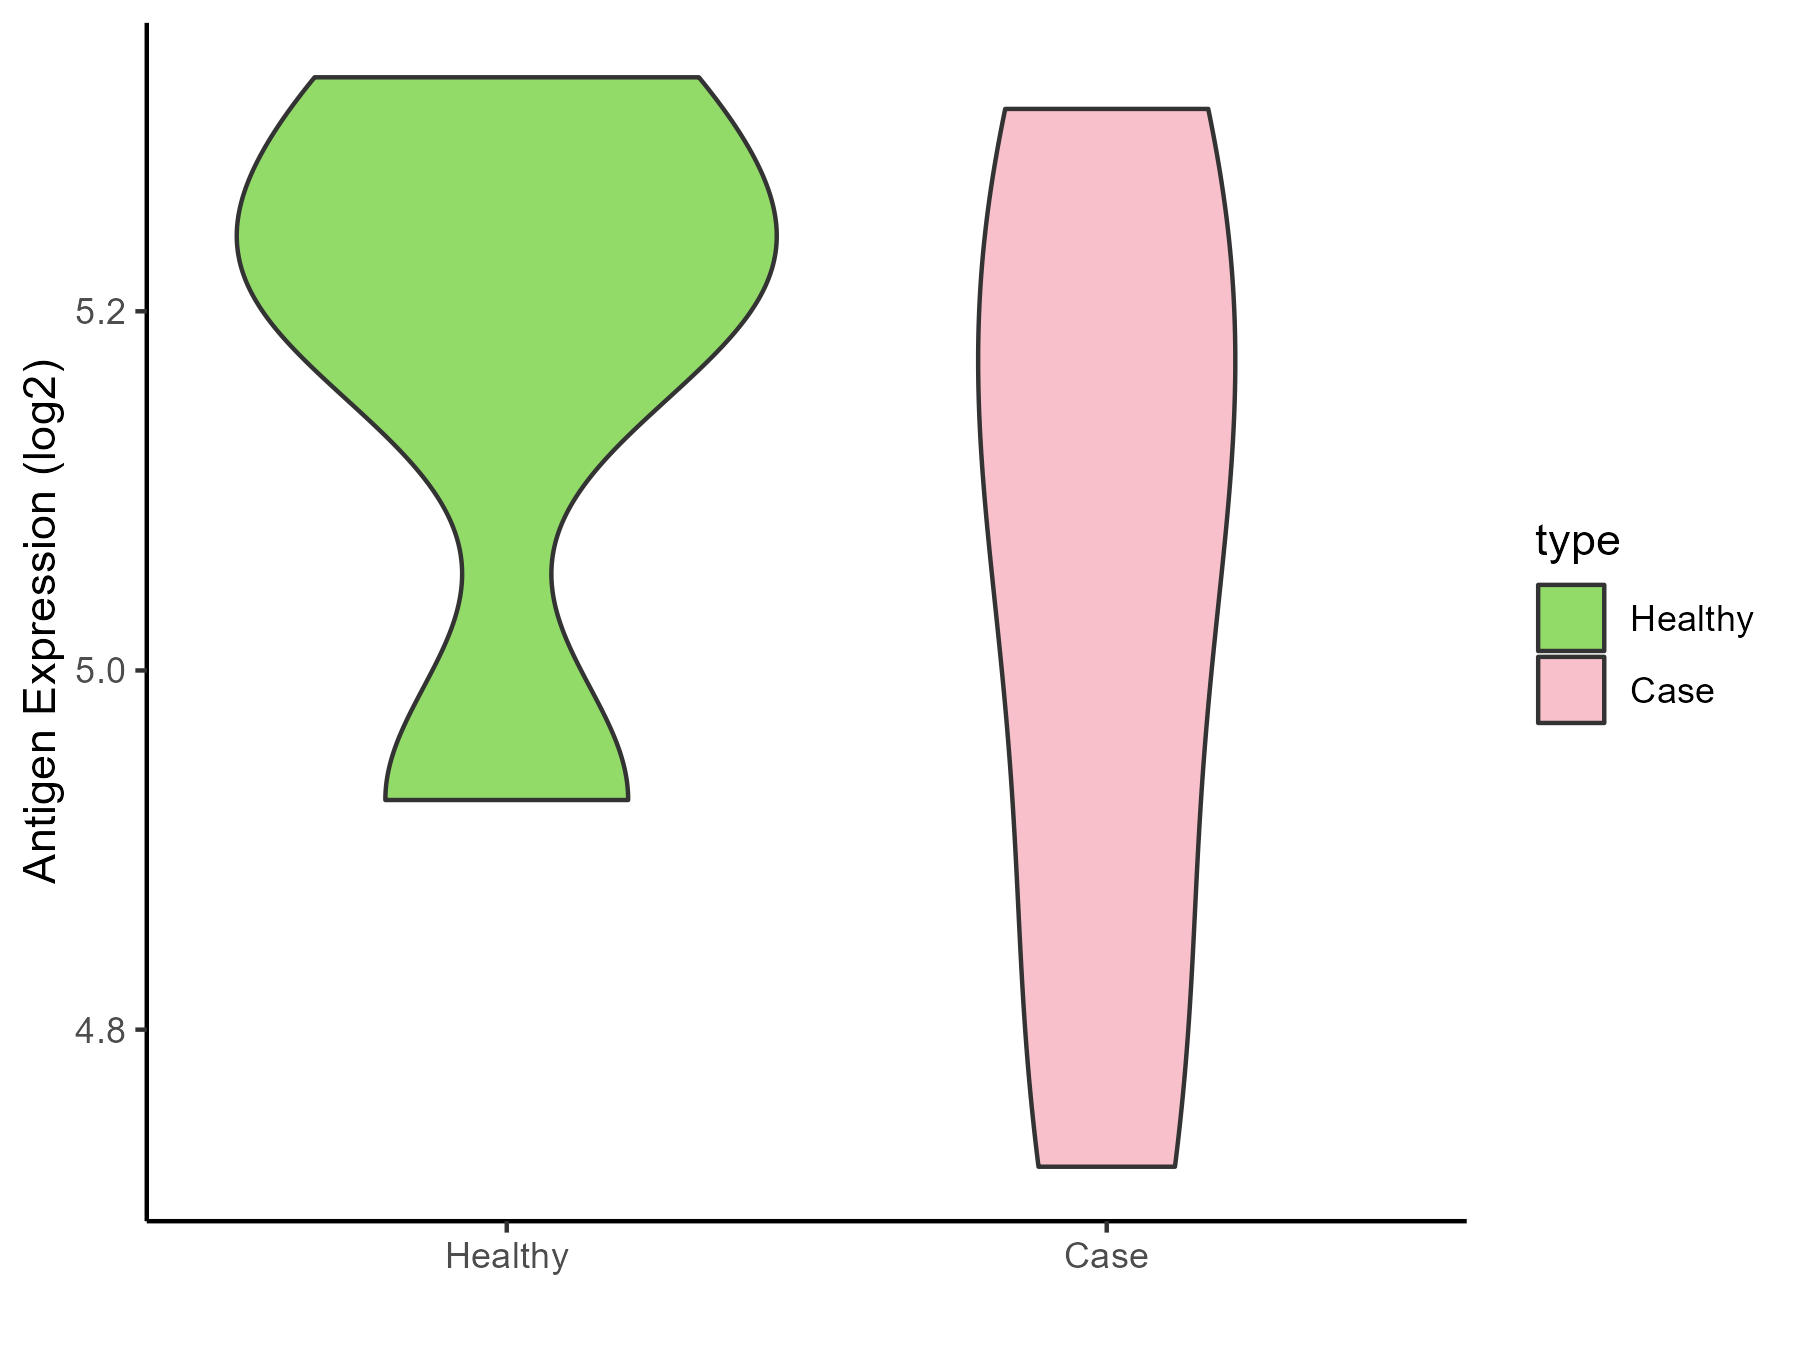
| The Studied Tissue | Perituberal | |
| The Specific Disease | Tuberous sclerosis complex | |
| The Expression Level of Disease Section Compare with the Healthy Individual Tissue | p-value: 0.384555429; Fold-change: -0.122367408; Z-score: -0.70722947 | |
| Disease-specific Antigen Abundances |
|
Click to View the Clearer Original Diagram |
ICD Disease Classification 3
| Differential expression pattern of antigen in diseases | ||
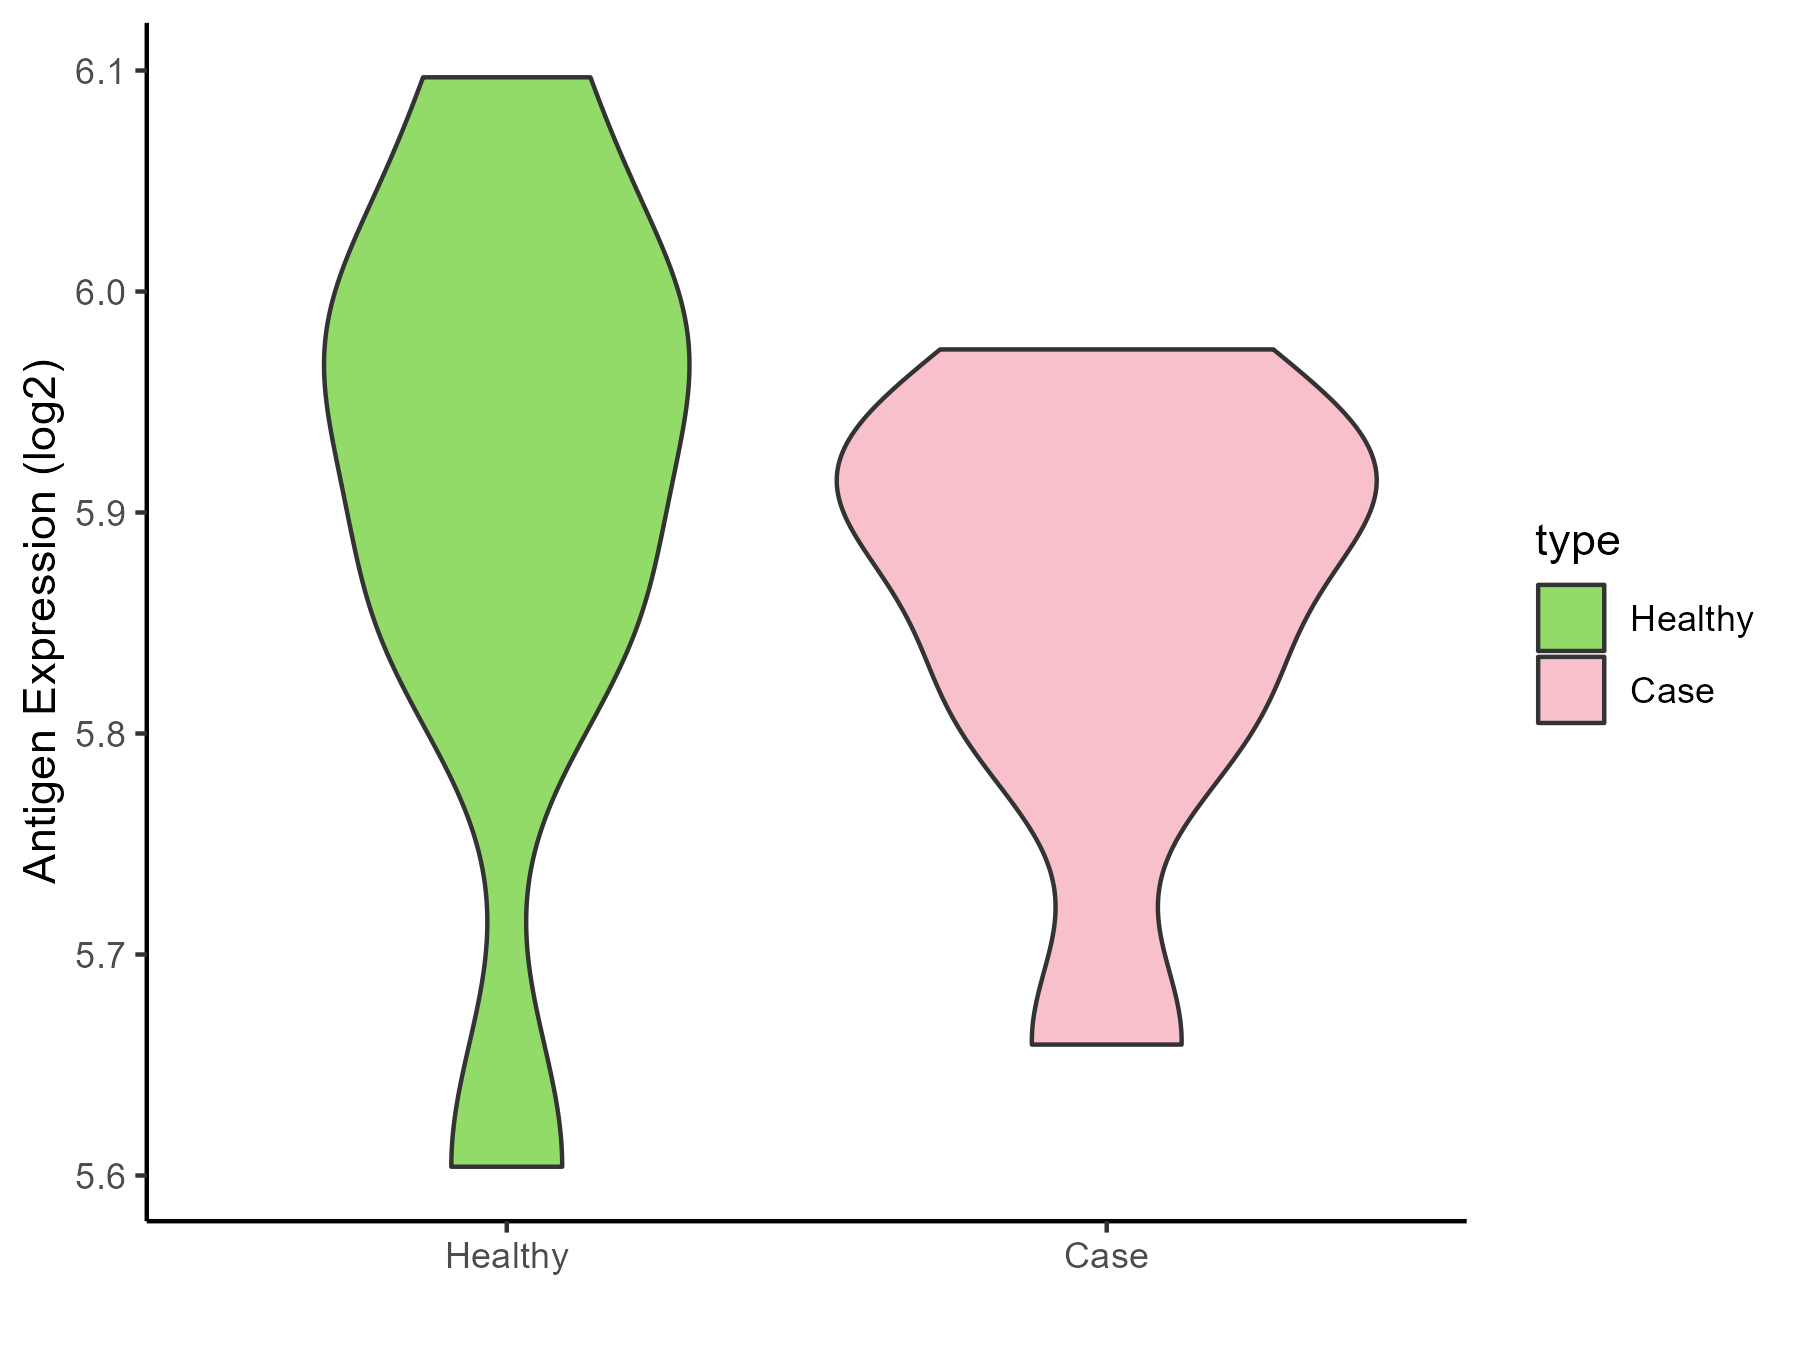
| The Studied Tissue | Bone marrow | |
| The Specific Disease | Anemia | |
| The Expression Level of Disease Section Compare with the Healthy Individual Tissue | p-value: 0.512989008; Fold-change: -0.050135385; Z-score: -0.317352443 | |
| Disease-specific Antigen Abundances |
|
Click to View the Clearer Original Diagram |
| Differential expression pattern of antigen in diseases | ||
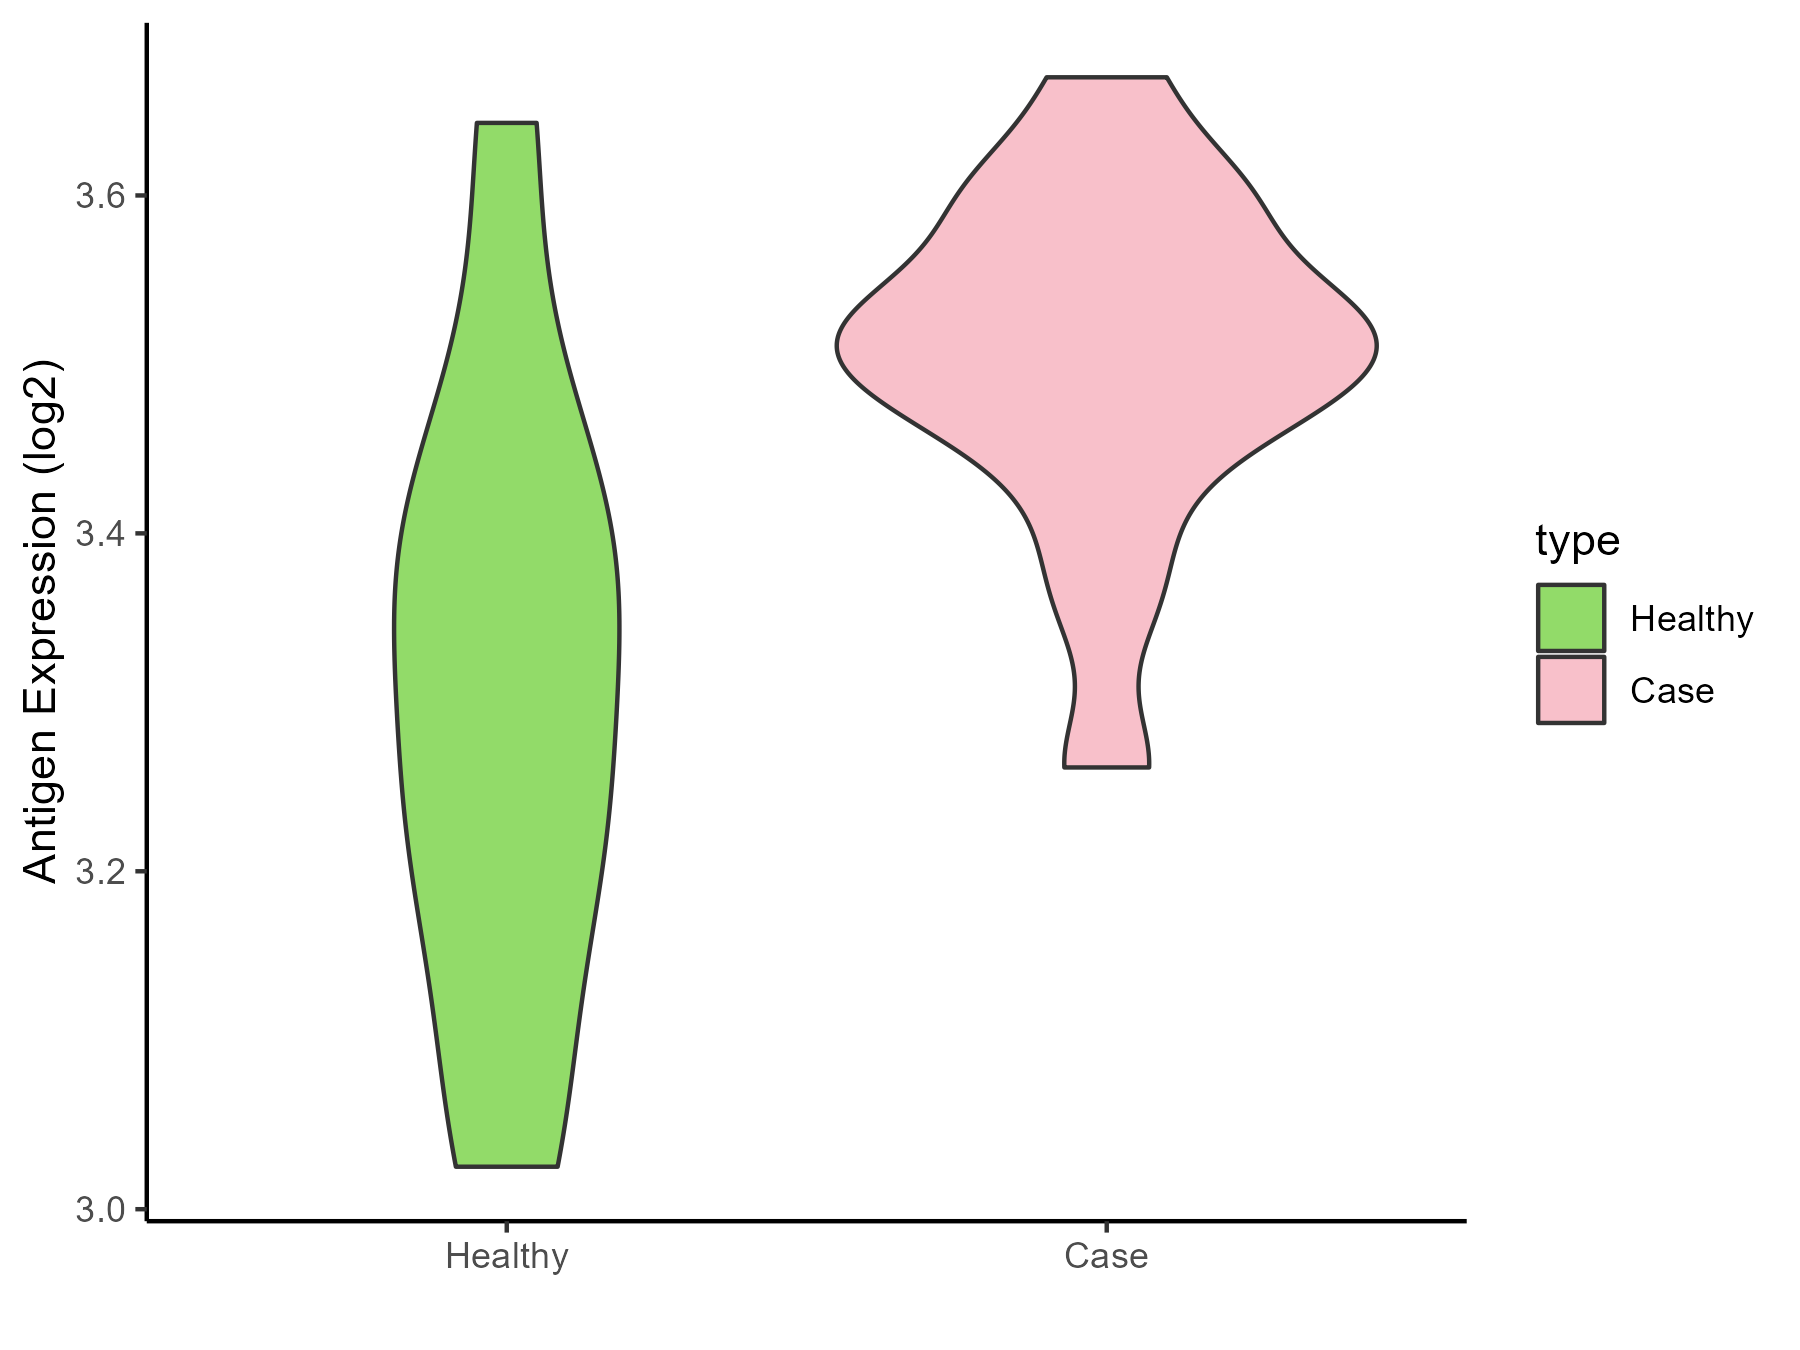
| The Studied Tissue | Peripheral blood | |
| The Specific Disease | Sickle cell disease | |
| The Expression Level of Disease Section Compare with the Healthy Individual Tissue | p-value: 0.005366157; Fold-change: 0.211934535; Z-score: 1.170760054 | |
| Disease-specific Antigen Abundances |
|
Click to View the Clearer Original Diagram |
| Differential expression pattern of antigen in diseases | ||
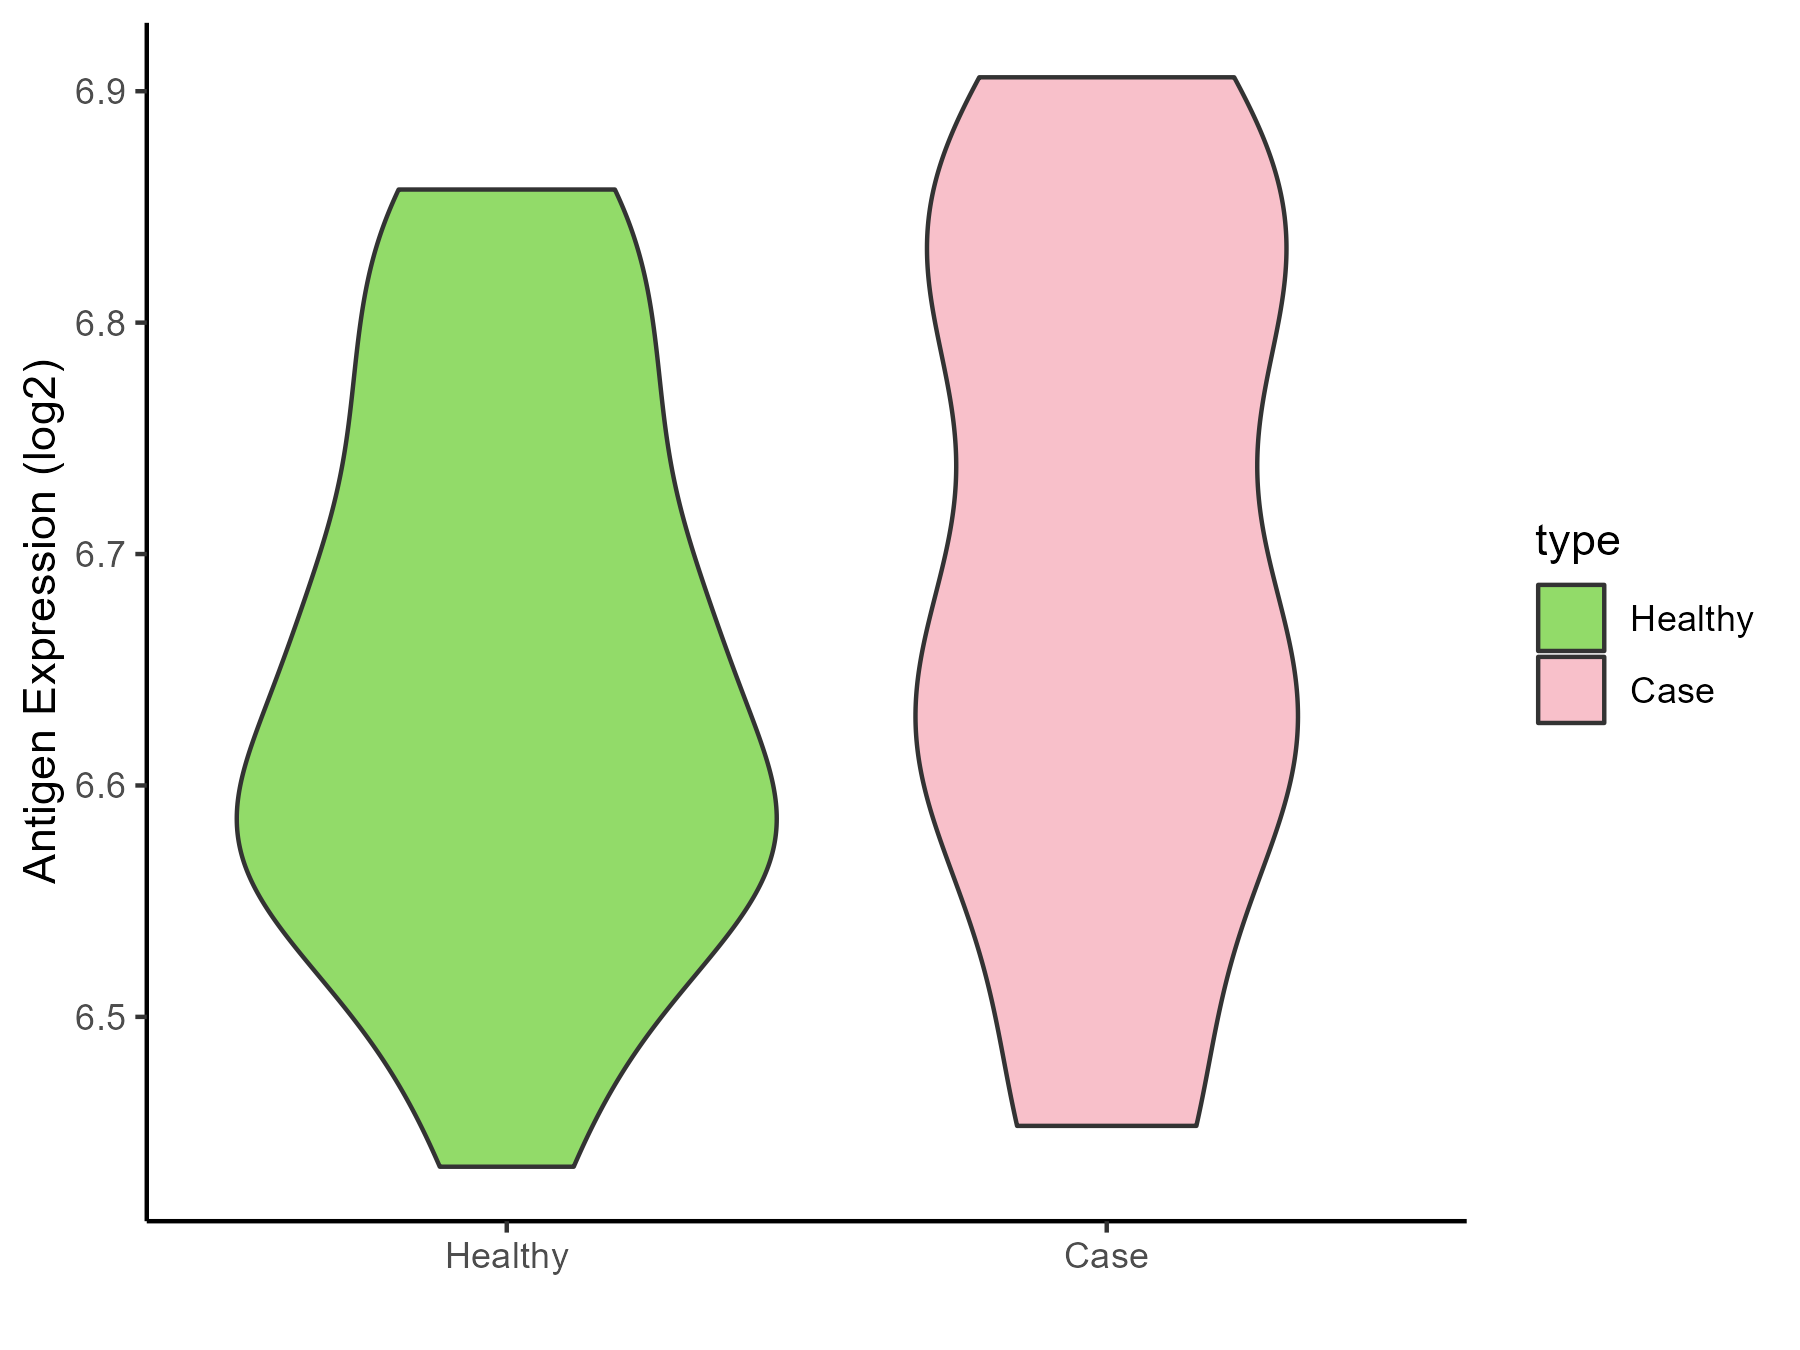
| The Studied Tissue | Whole blood | |
| The Specific Disease | Thrombocythemia | |
| The Expression Level of Disease Section Compare with the Healthy Individual Tissue | p-value: 0.220502827; Fold-change: 0.043738971; Z-score: 0.368643196 | |
| Disease-specific Antigen Abundances |
|
Click to View the Clearer Original Diagram |
ICD Disease Classification 4
| Differential expression pattern of antigen in diseases | ||
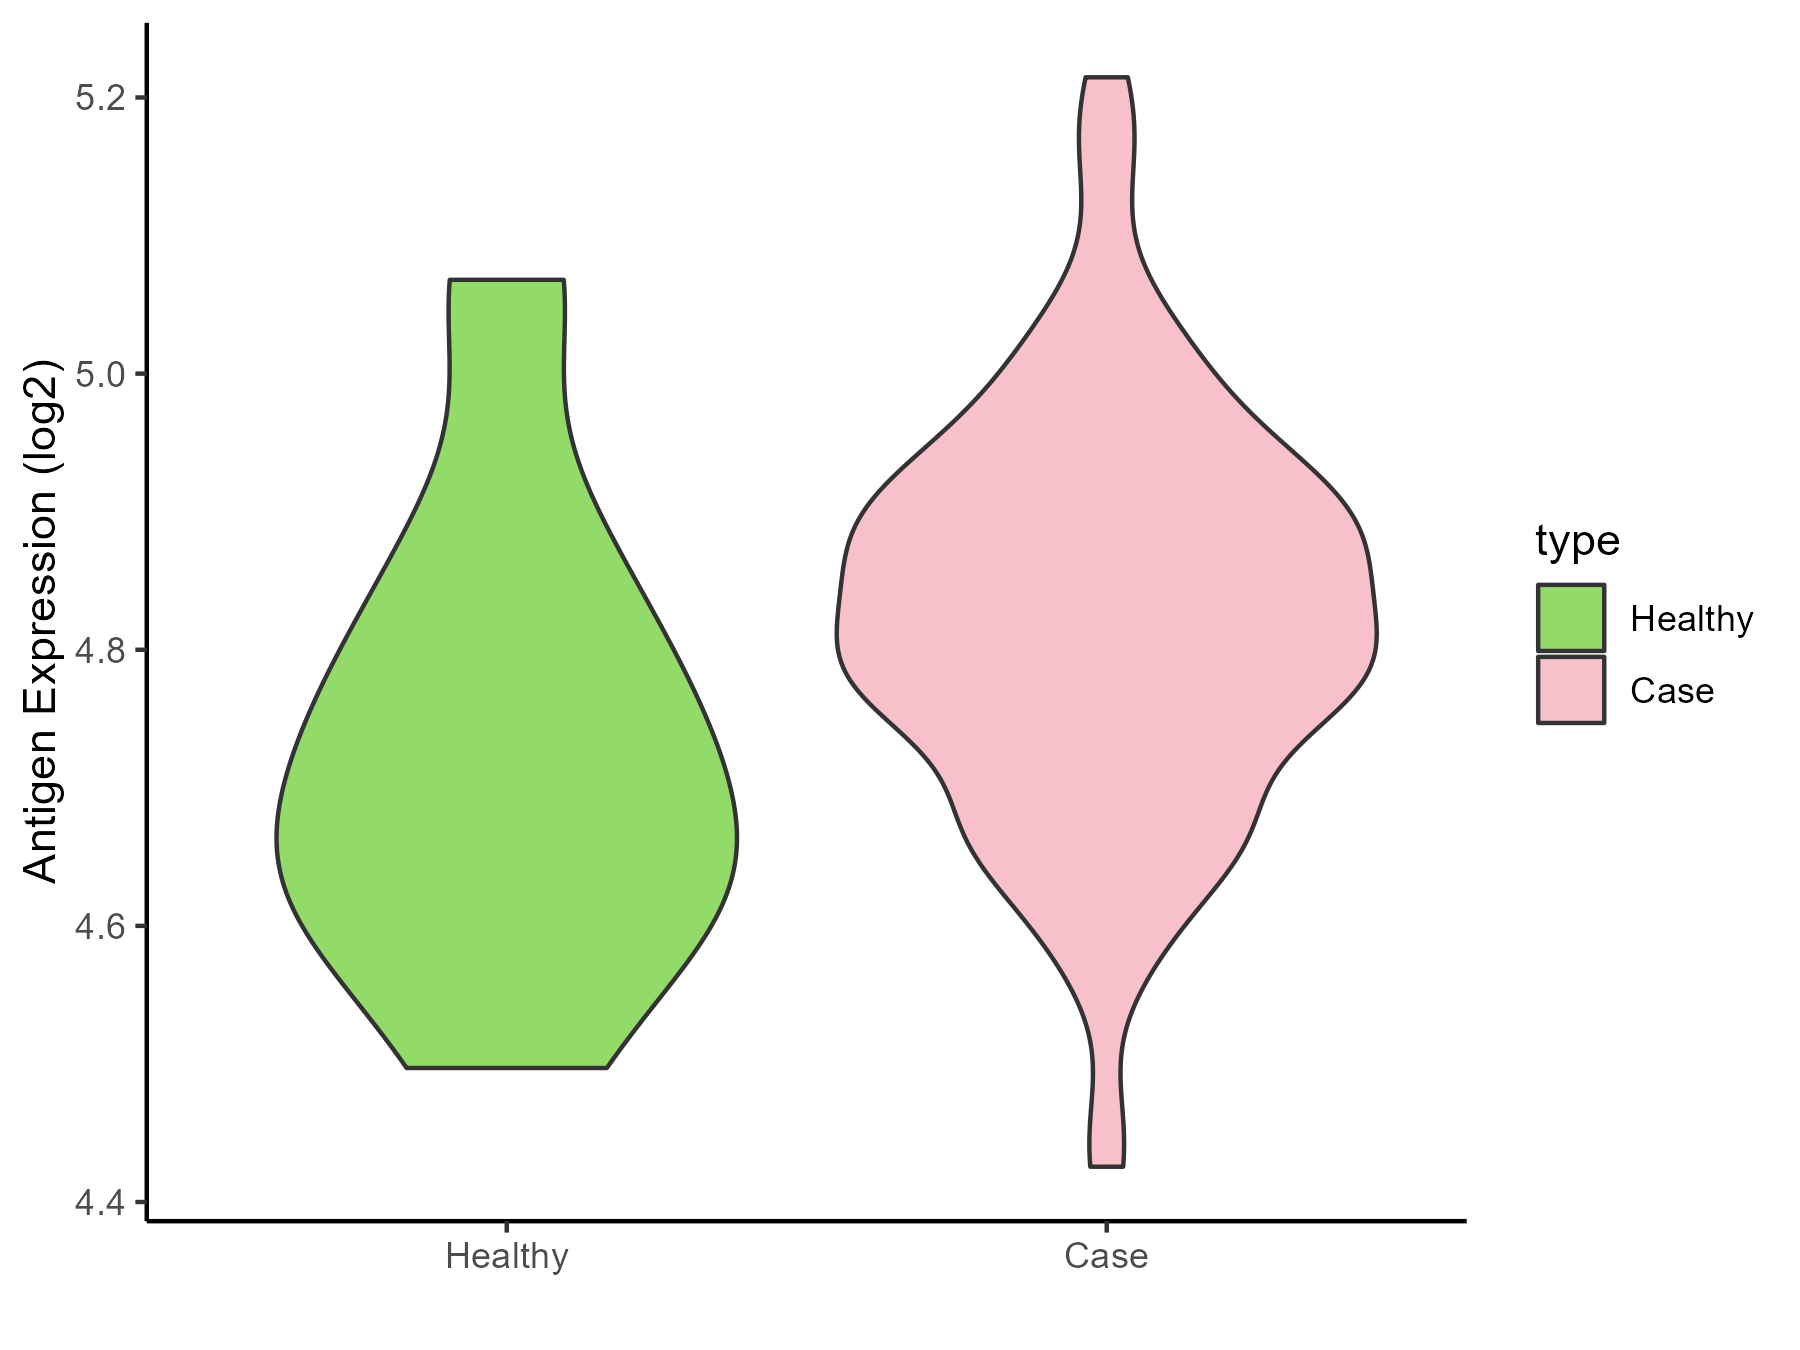
| The Studied Tissue | Whole blood | |
| The Specific Disease | Scleroderma | |
| The Expression Level of Disease Section Compare with the Healthy Individual Tissue | p-value: 0.143116248; Fold-change: 0.097518848; Z-score: 0.571240779 | |
| Disease-specific Antigen Abundances |
|
Click to View the Clearer Original Diagram |
| Differential expression pattern of antigen in diseases | ||
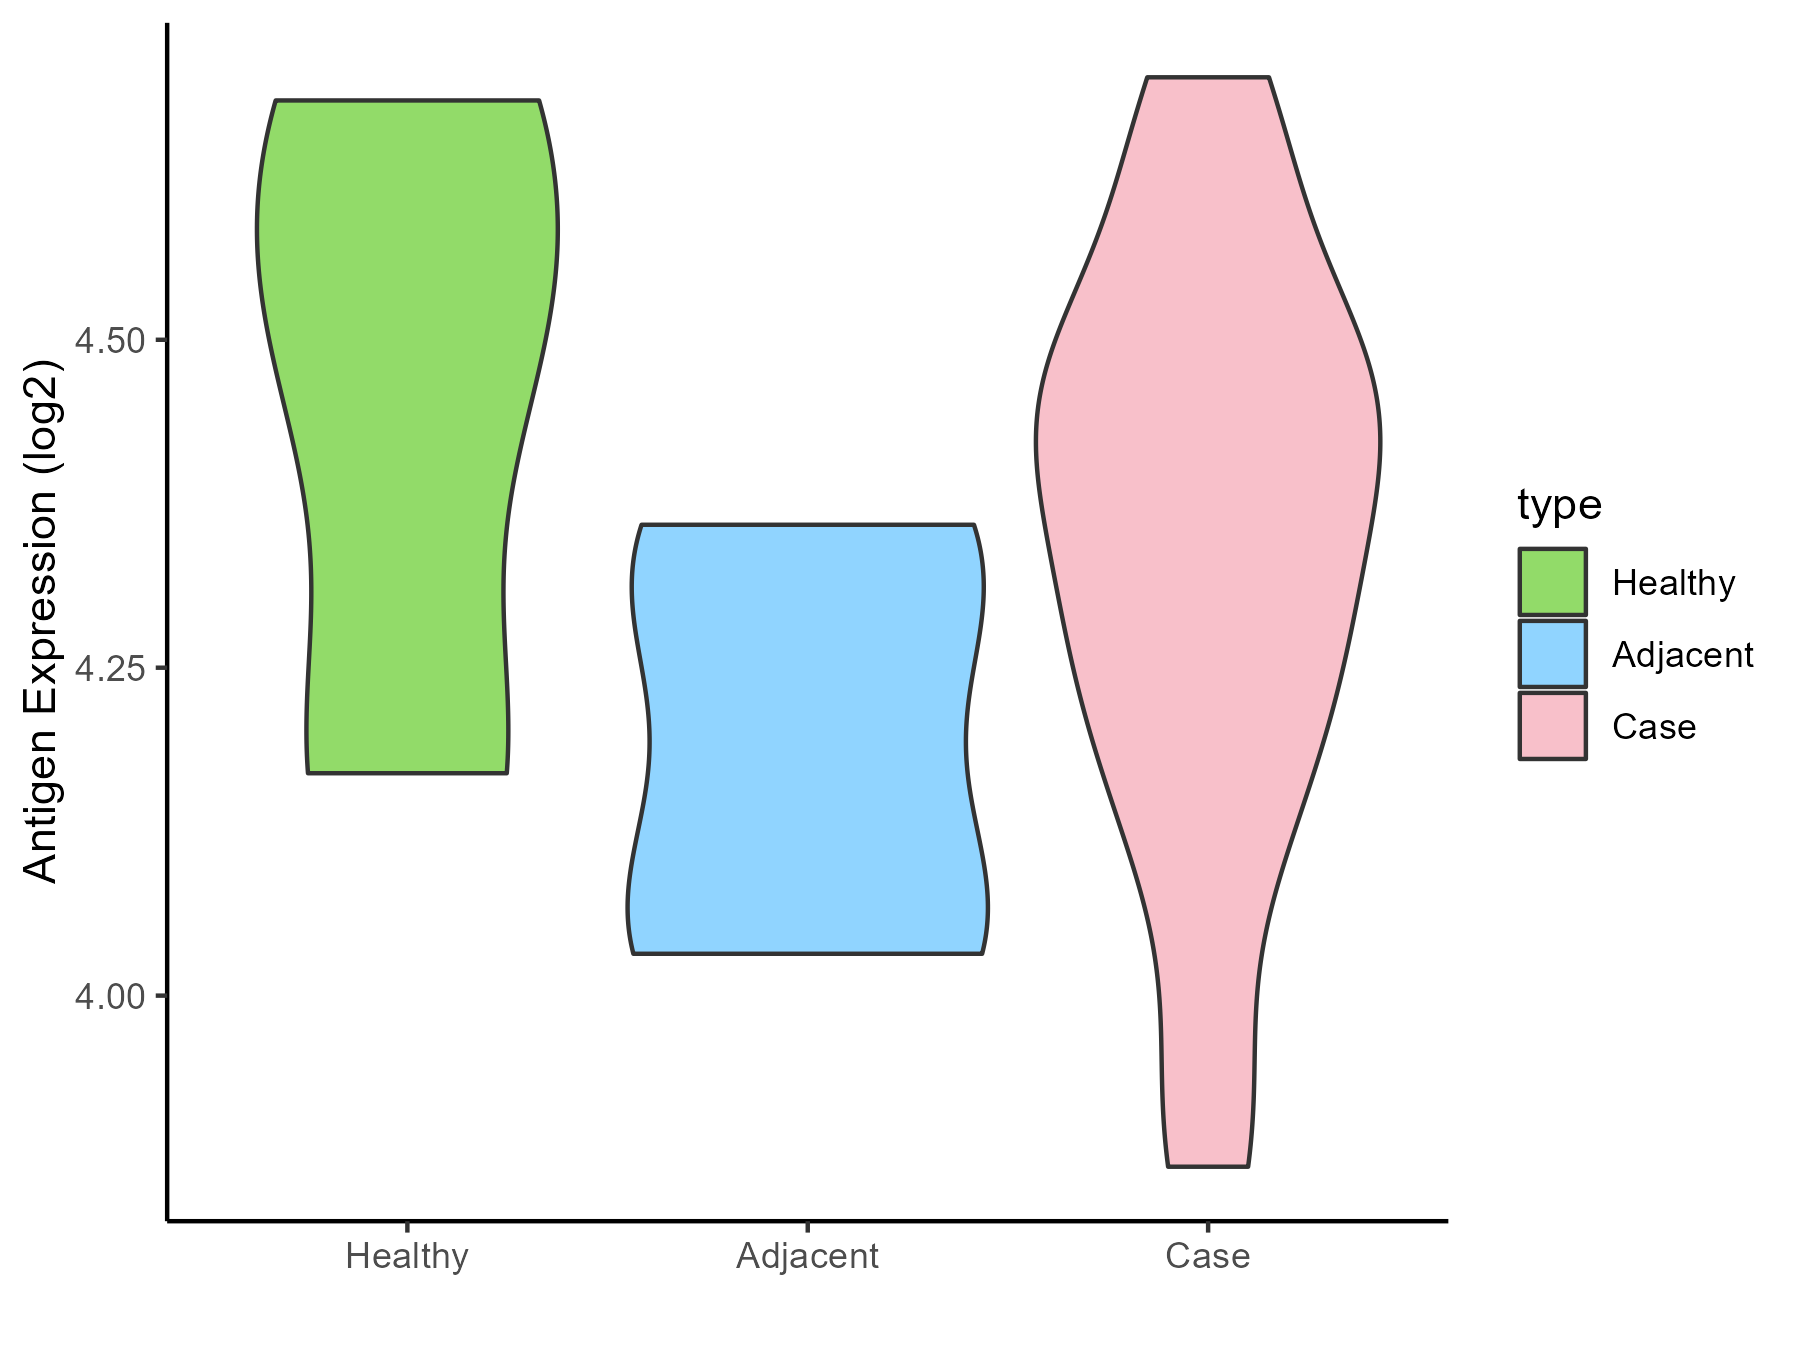
| The Studied Tissue | Salivary gland | |
| The Specific Disease | Sjogren syndrome | |
| The Expression Level of Disease Section Compare with the Healthy Individual Tissue | p-value: 0.551970689; Fold-change: -0.133817687; Z-score: -0.515303605 | |
| The Expression Level of Disease Section Compare with the Adjacent Tissue | p-value: 0.174972915; Fold-change: 0.17911516; Z-score: 1.07986222 | |
| Disease-specific Antigen Abundances |
|
Click to View the Clearer Original Diagram |
| Differential expression pattern of antigen in diseases | ||
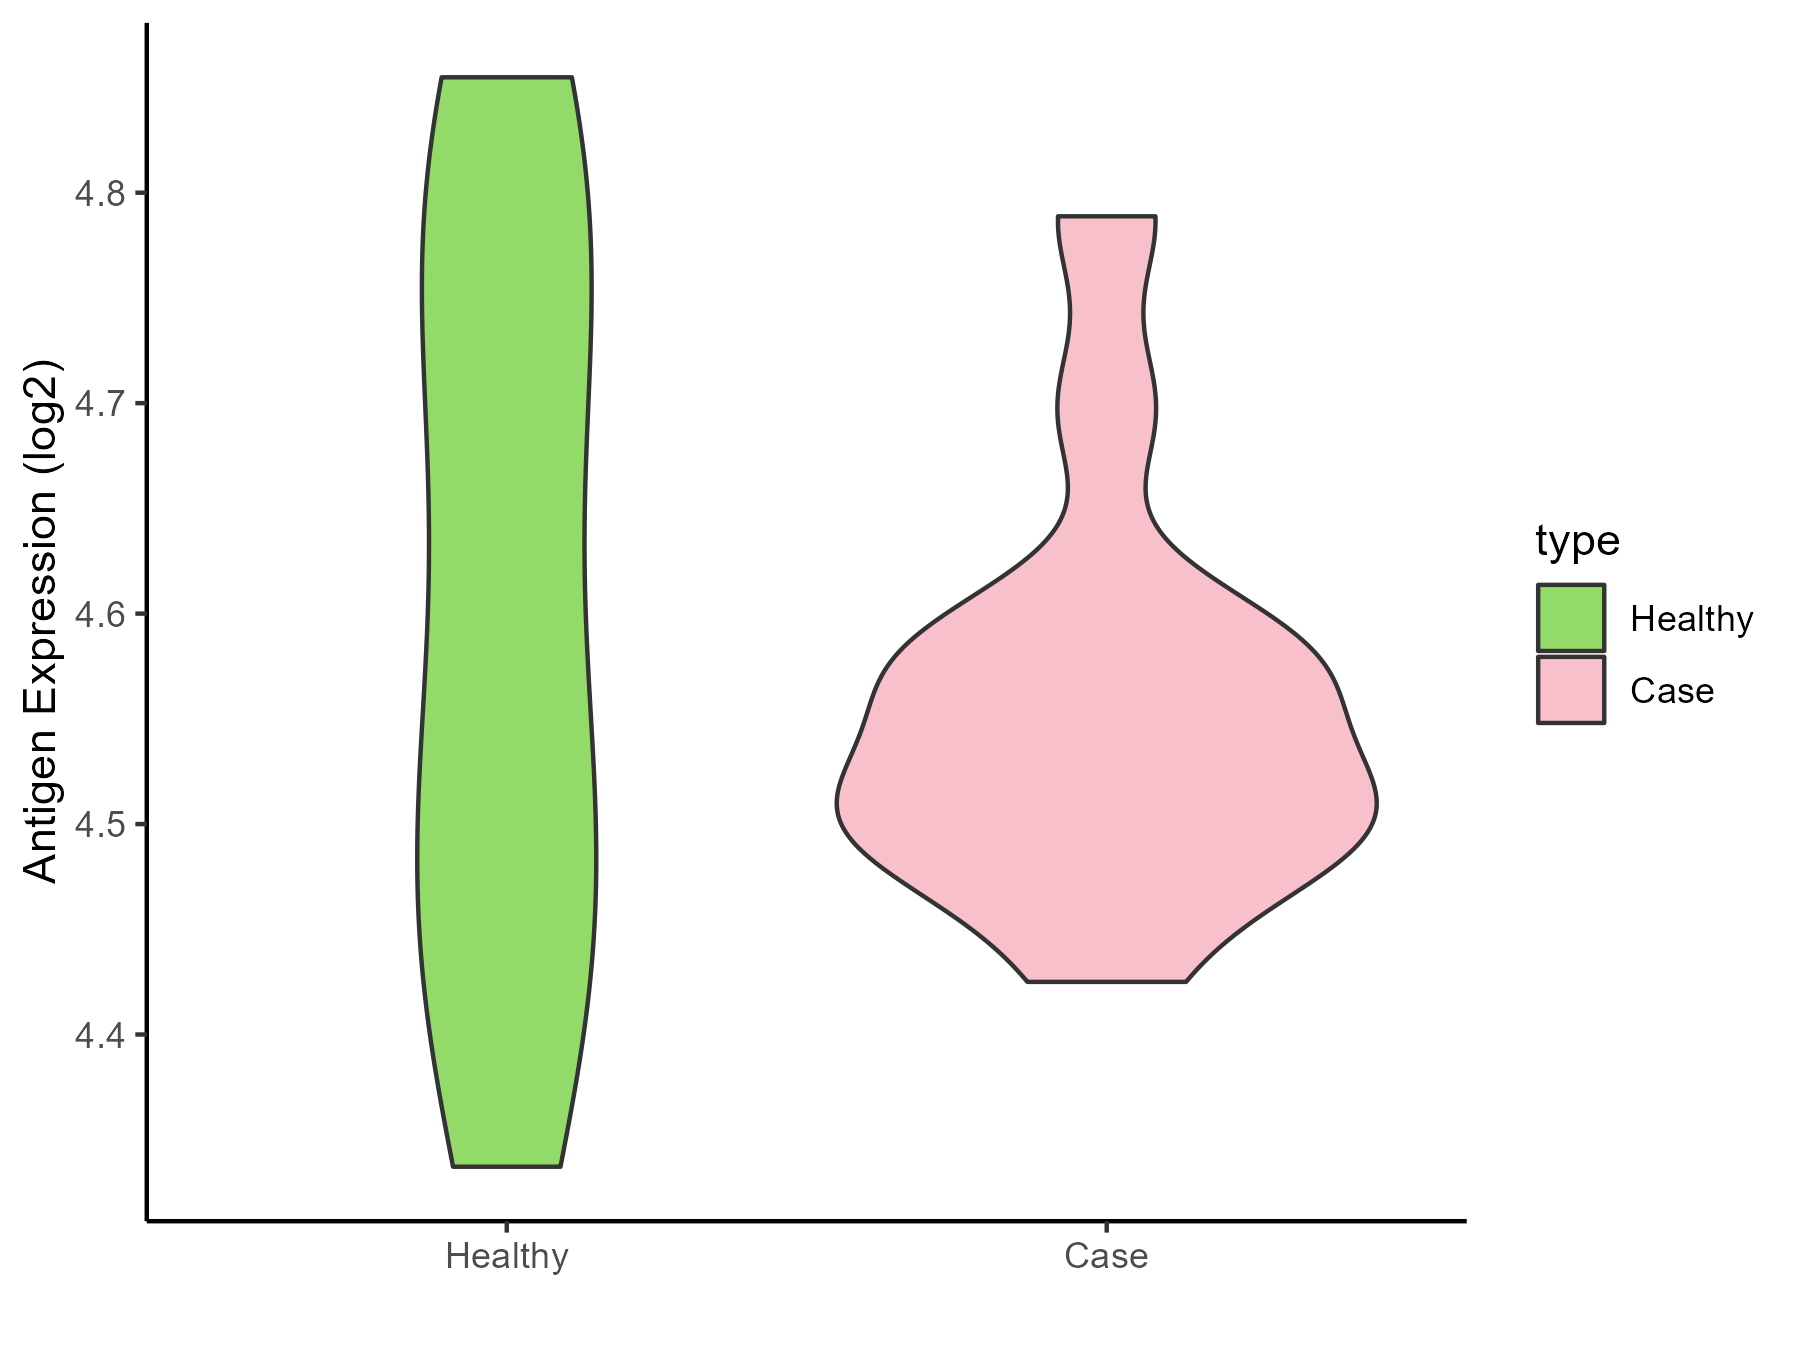
| The Studied Tissue | Peripheral blood | |
| The Specific Disease | Behcet disease | |
| The Expression Level of Disease Section Compare with the Healthy Individual Tissue | p-value: 0.409531314; Fold-change: -0.067875409; Z-score: -0.384083778 | |
| Disease-specific Antigen Abundances |
|
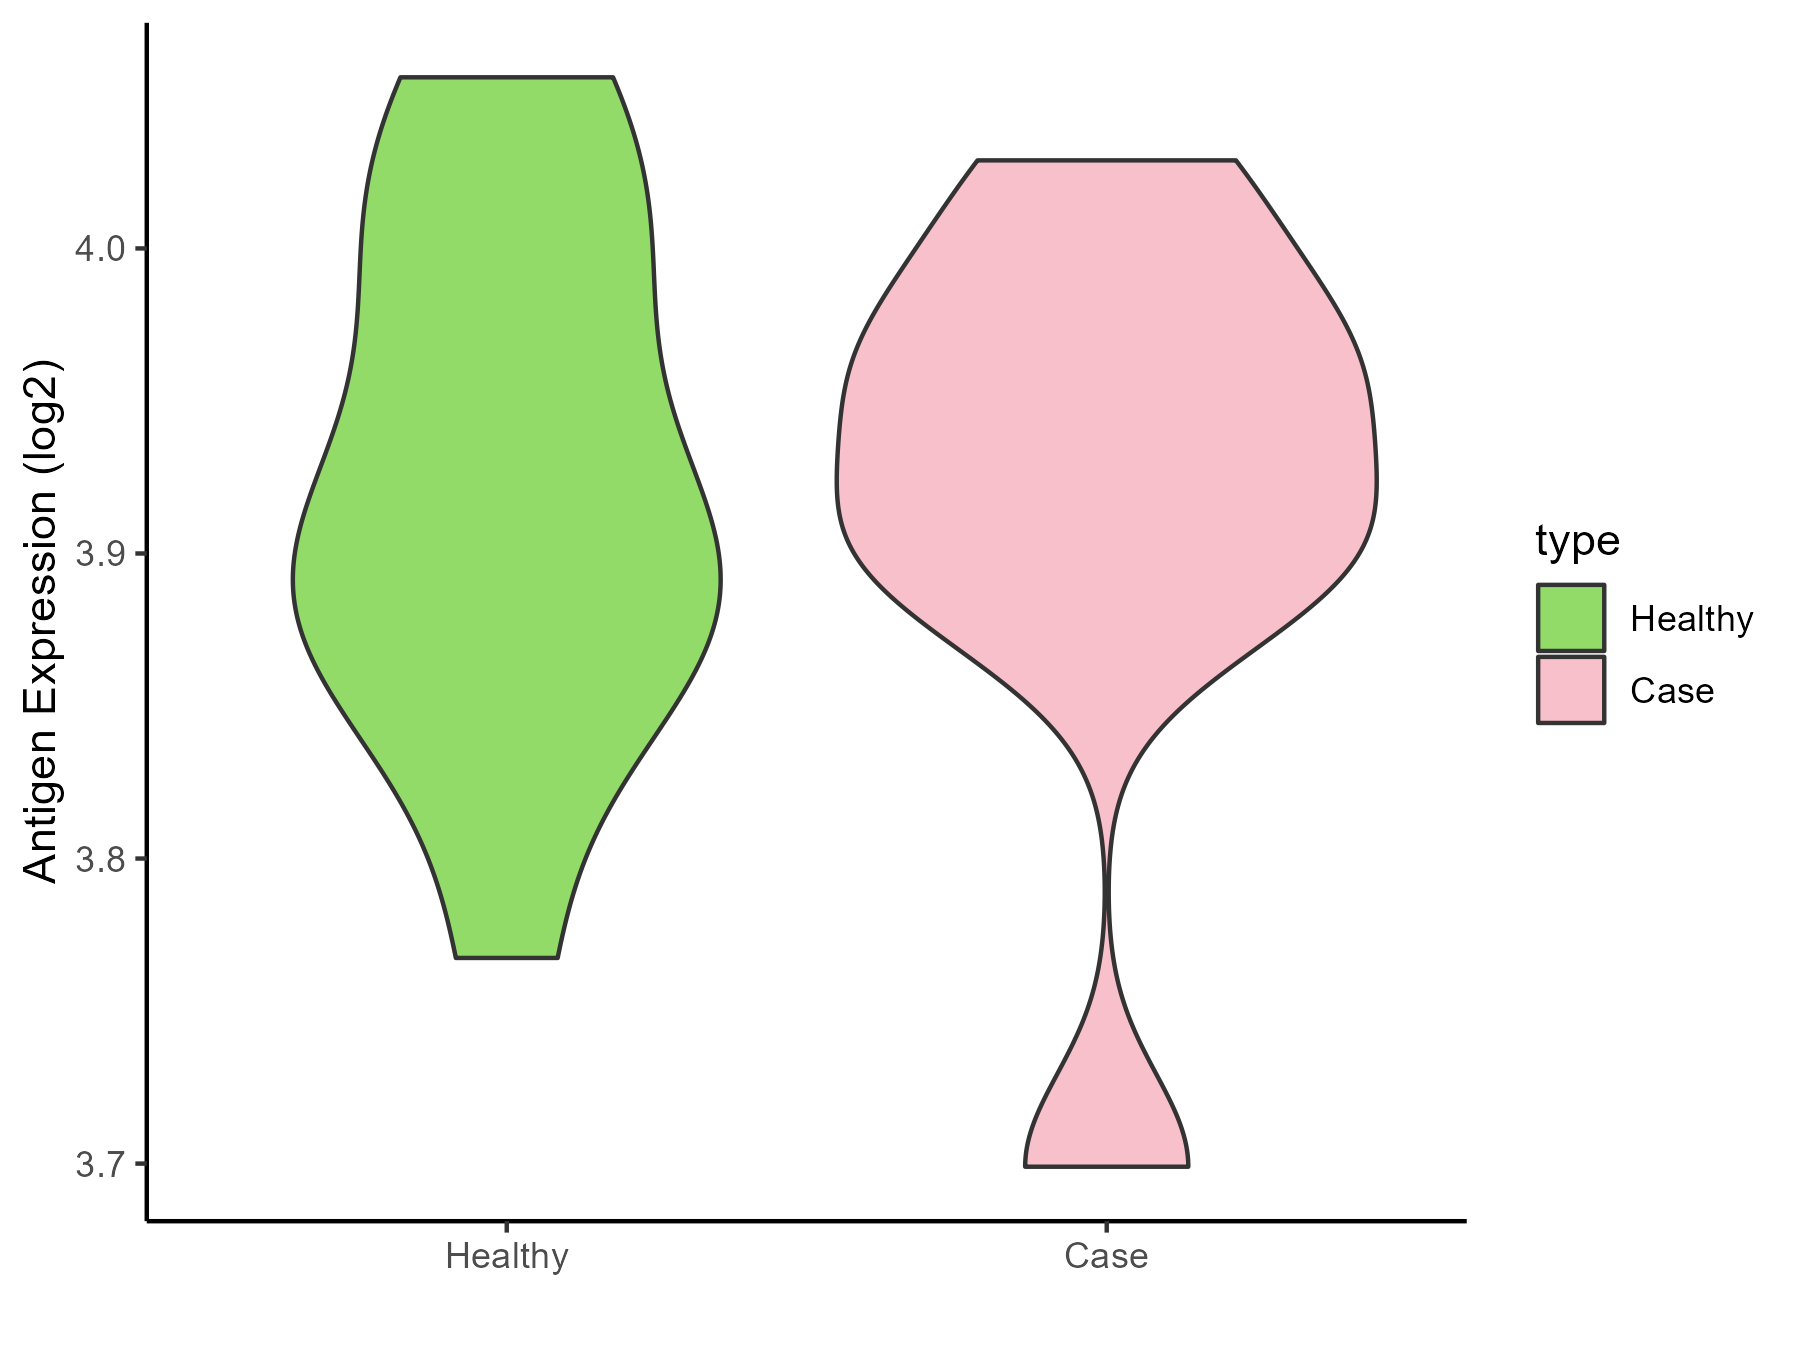
Click to View the Clearer Original Diagram |
| Differential expression pattern of antigen in diseases | ||
| The Studied Tissue | Whole blood | |
| The Specific Disease | Autosomal dominant monocytopenia | |
| The Expression Level of Disease Section Compare with the Healthy Individual Tissue | p-value: 0.830243569; Fold-change: 0.037003359; Z-score: 0.429637212 | |
| Disease-specific Antigen Abundances |
|
Click to View the Clearer Original Diagram |
ICD Disease Classification 5
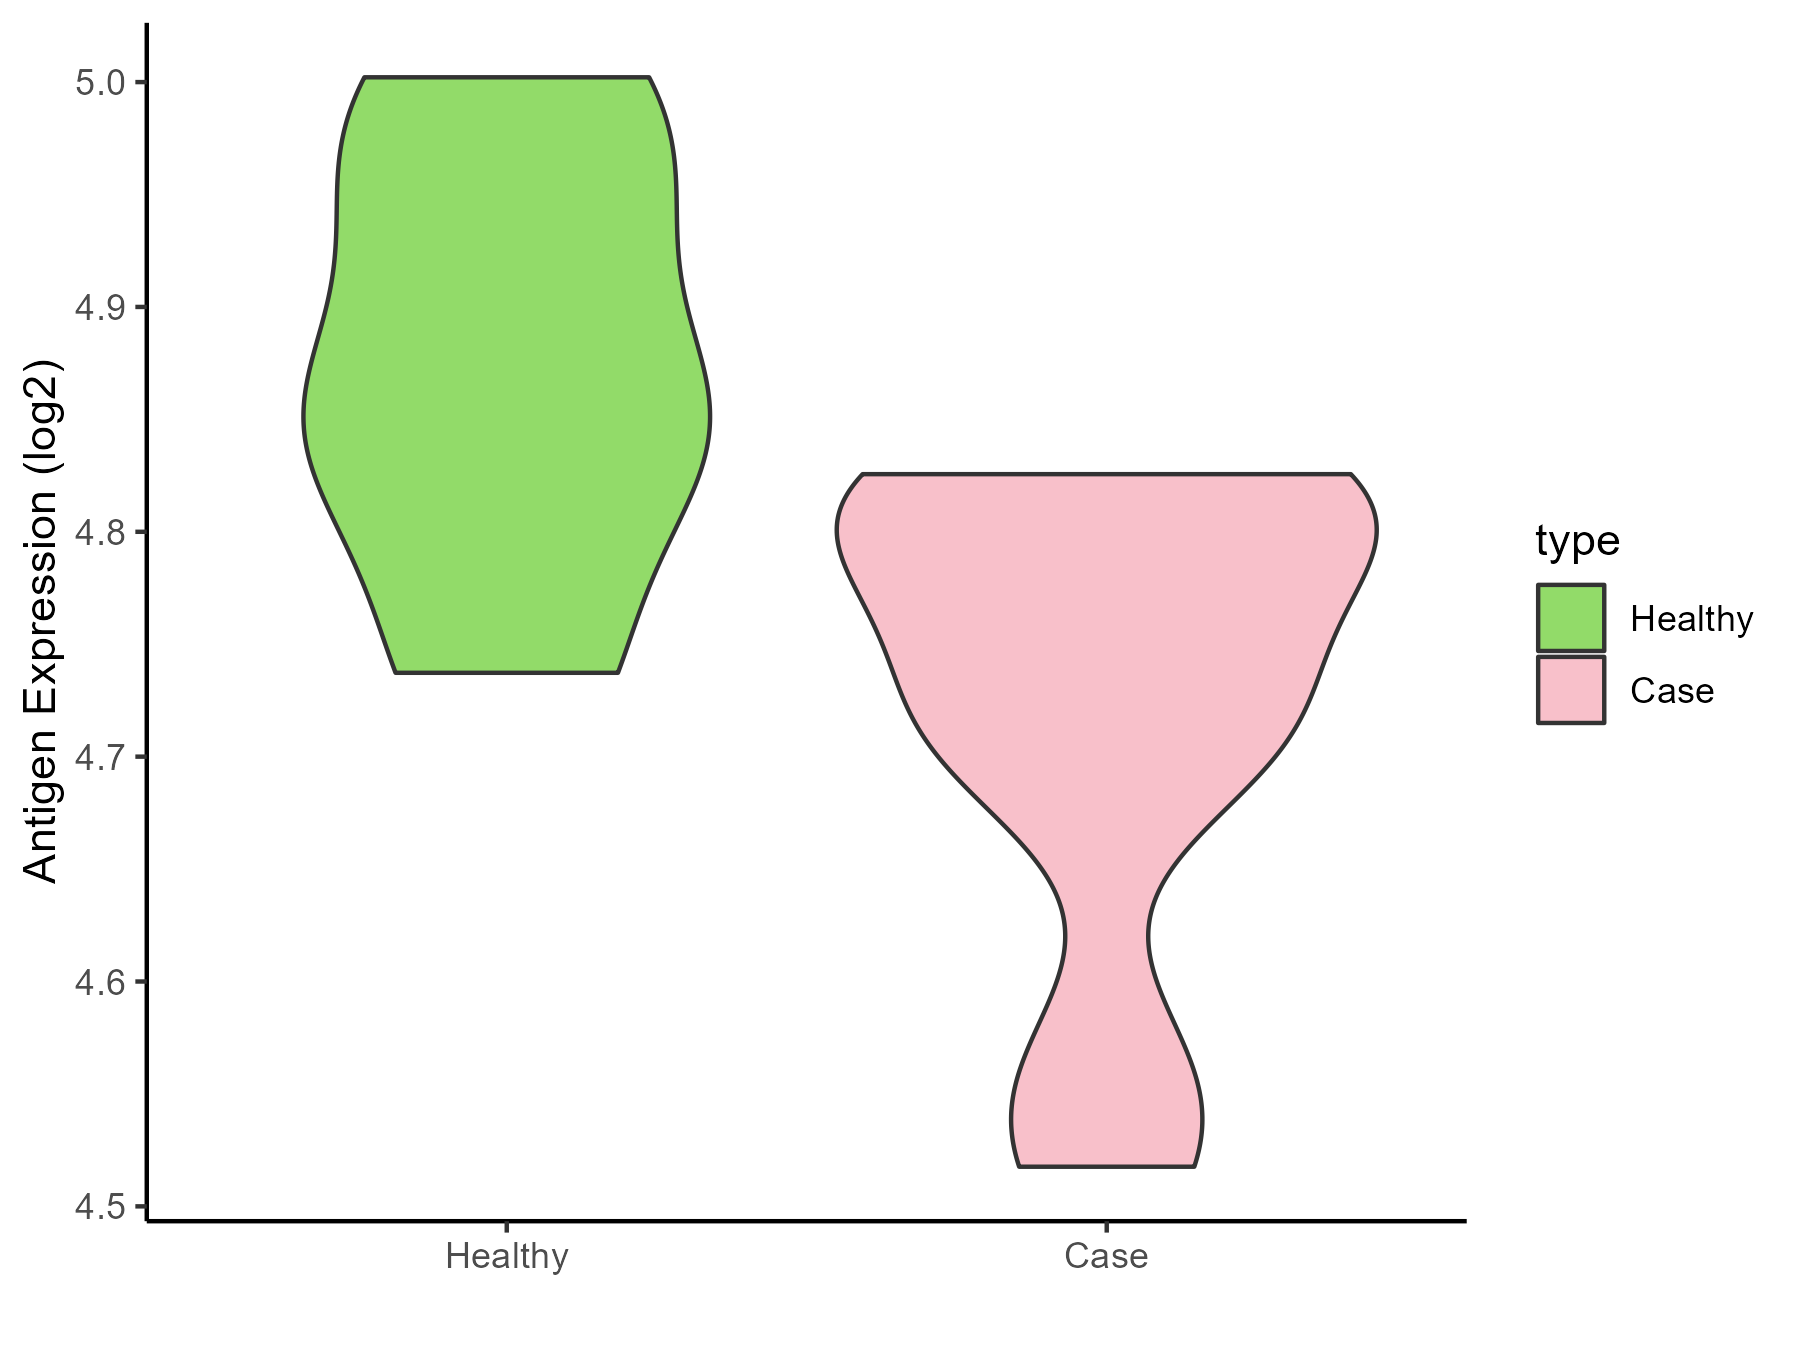
| Differential expression pattern of antigen in diseases | ||
| The Studied Tissue | Liver | |
| The Specific Disease | Type 2 diabetes | |
| The Expression Level of Disease Section Compare with the Healthy Individual Tissue | p-value: 0.029836419; Fold-change: -0.099233648; Z-score: -0.968477954 | |
| Disease-specific Antigen Abundances |
|
Click to View the Clearer Original Diagram |
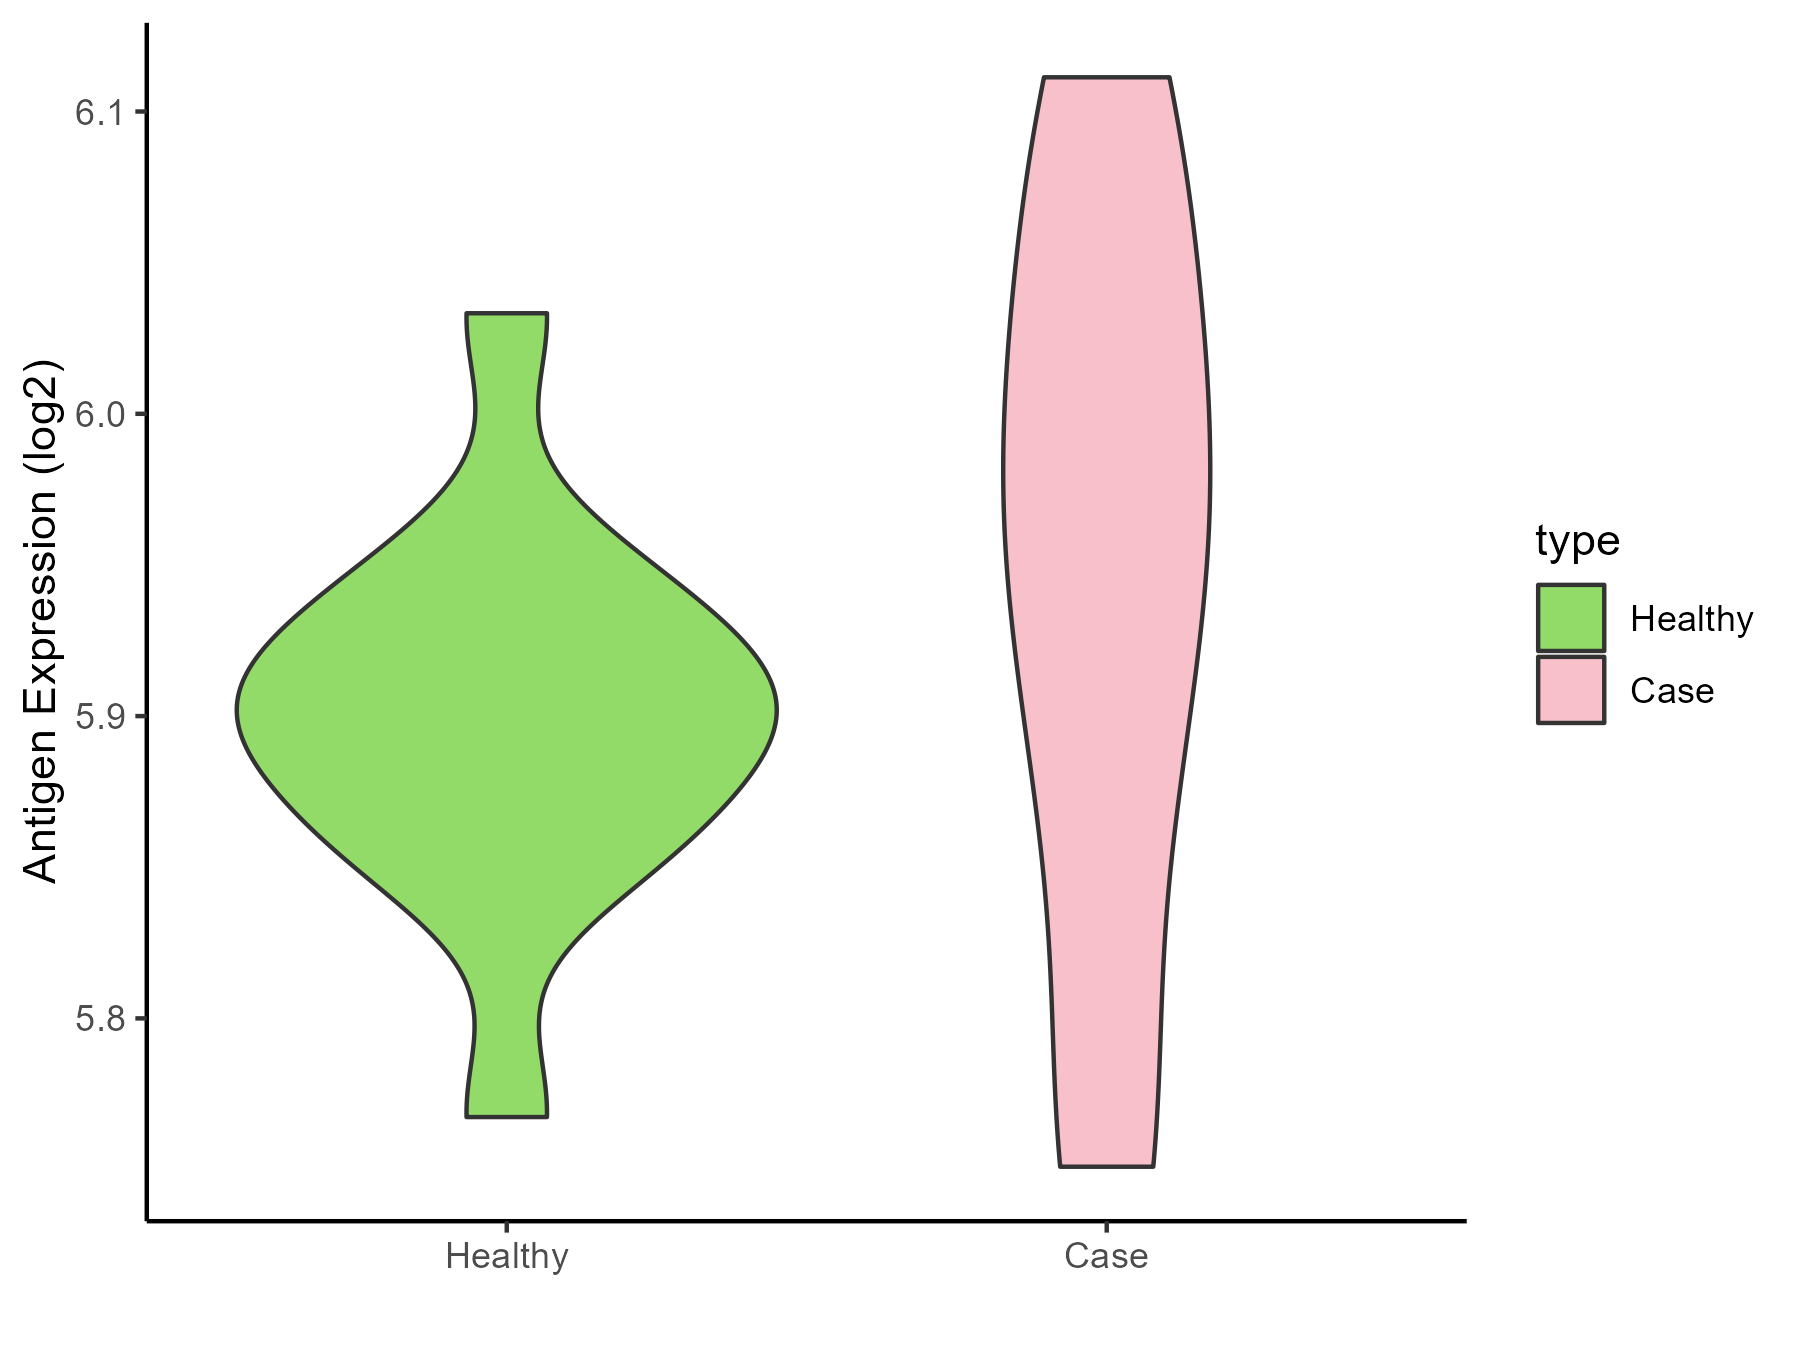
| Differential expression pattern of antigen in diseases | ||
| The Studied Tissue | Vastus lateralis muscle | |
| The Specific Disease | Polycystic ovary syndrome | |
| The Expression Level of Disease Section Compare with the Healthy Individual Tissue | p-value: 0.172968516; Fold-change: 0.079156772; Z-score: 1.277037643 | |
| Disease-specific Antigen Abundances |
|
Click to View the Clearer Original Diagram |
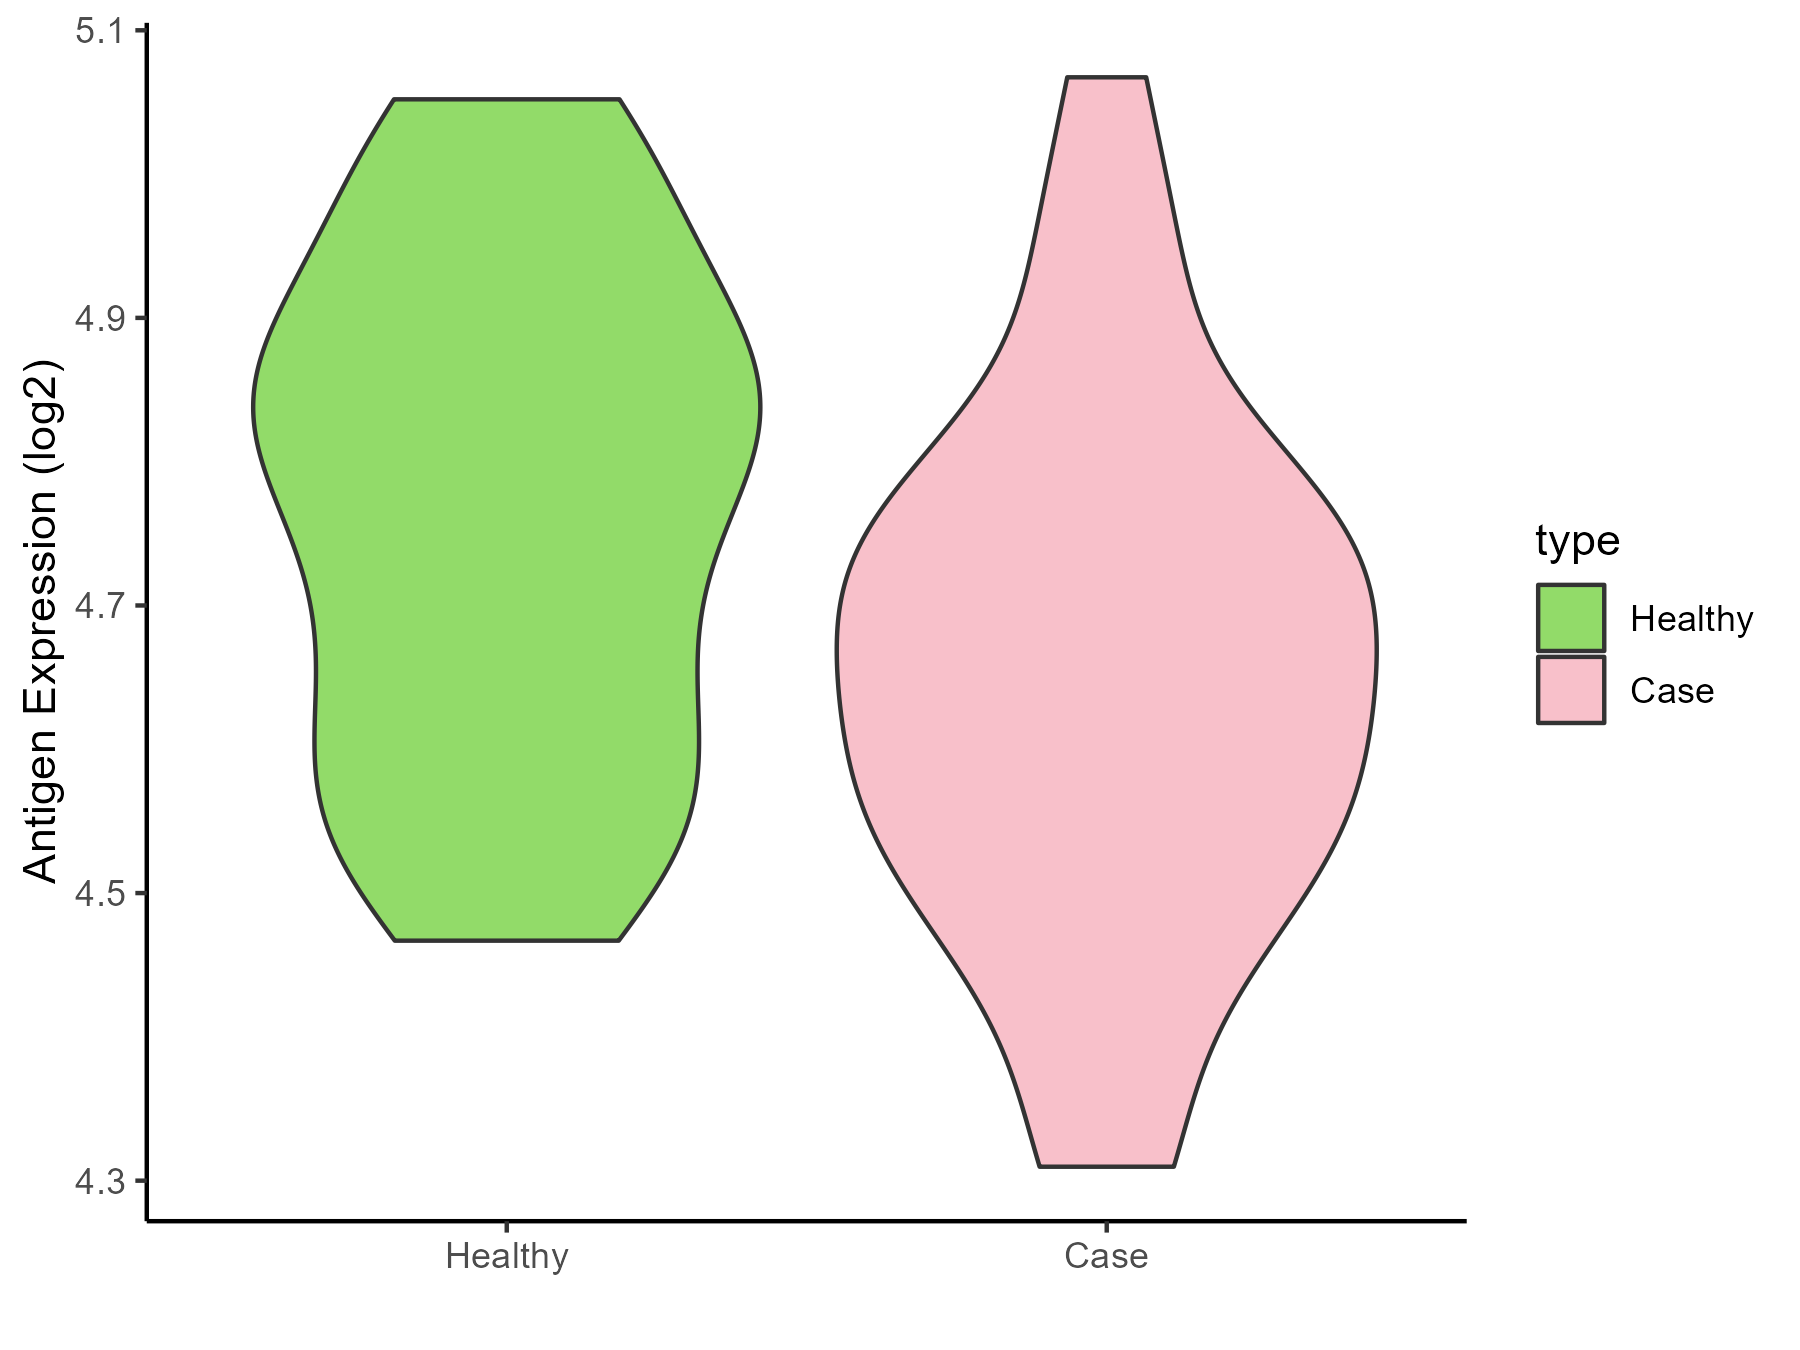
| Differential expression pattern of antigen in diseases | ||
| The Studied Tissue | Subcutaneous Adipose | |
| The Specific Disease | Obesity | |
| The Expression Level of Disease Section Compare with the Healthy Individual Tissue | p-value: 0.024578293; Fold-change: -0.153295174; Z-score: -0.880467656 | |
| Disease-specific Antigen Abundances |
|
Click to View the Clearer Original Diagram |
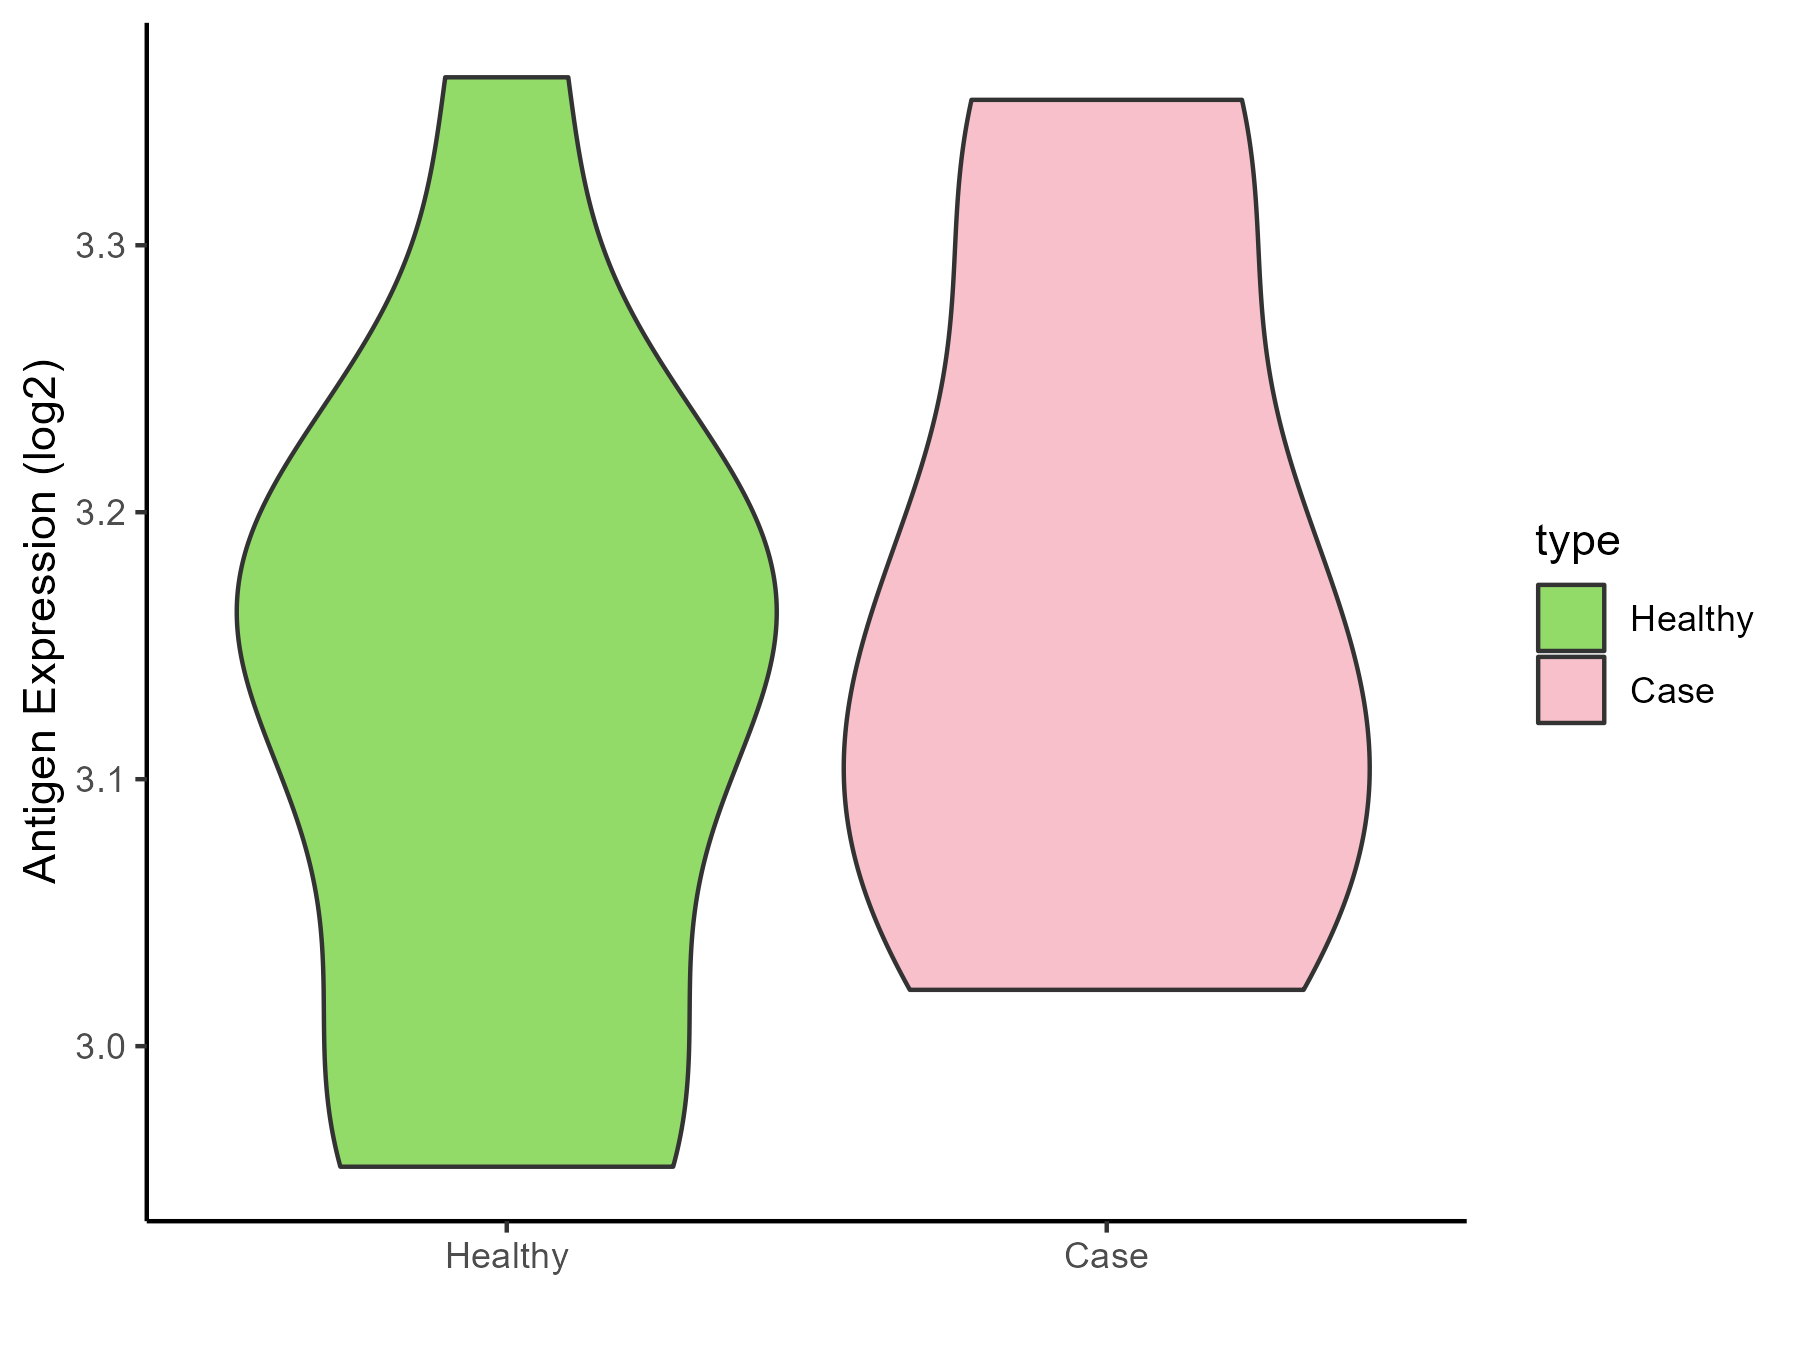
| Differential expression pattern of antigen in diseases | ||
| The Studied Tissue | Biceps muscle | |
| The Specific Disease | Pompe disease | |
| The Expression Level of Disease Section Compare with the Healthy Individual Tissue | p-value: 0.440408741; Fold-change: -0.013740165; Z-score: -0.106115239 | |
| Disease-specific Antigen Abundances |
|
Click to View the Clearer Original Diagram |
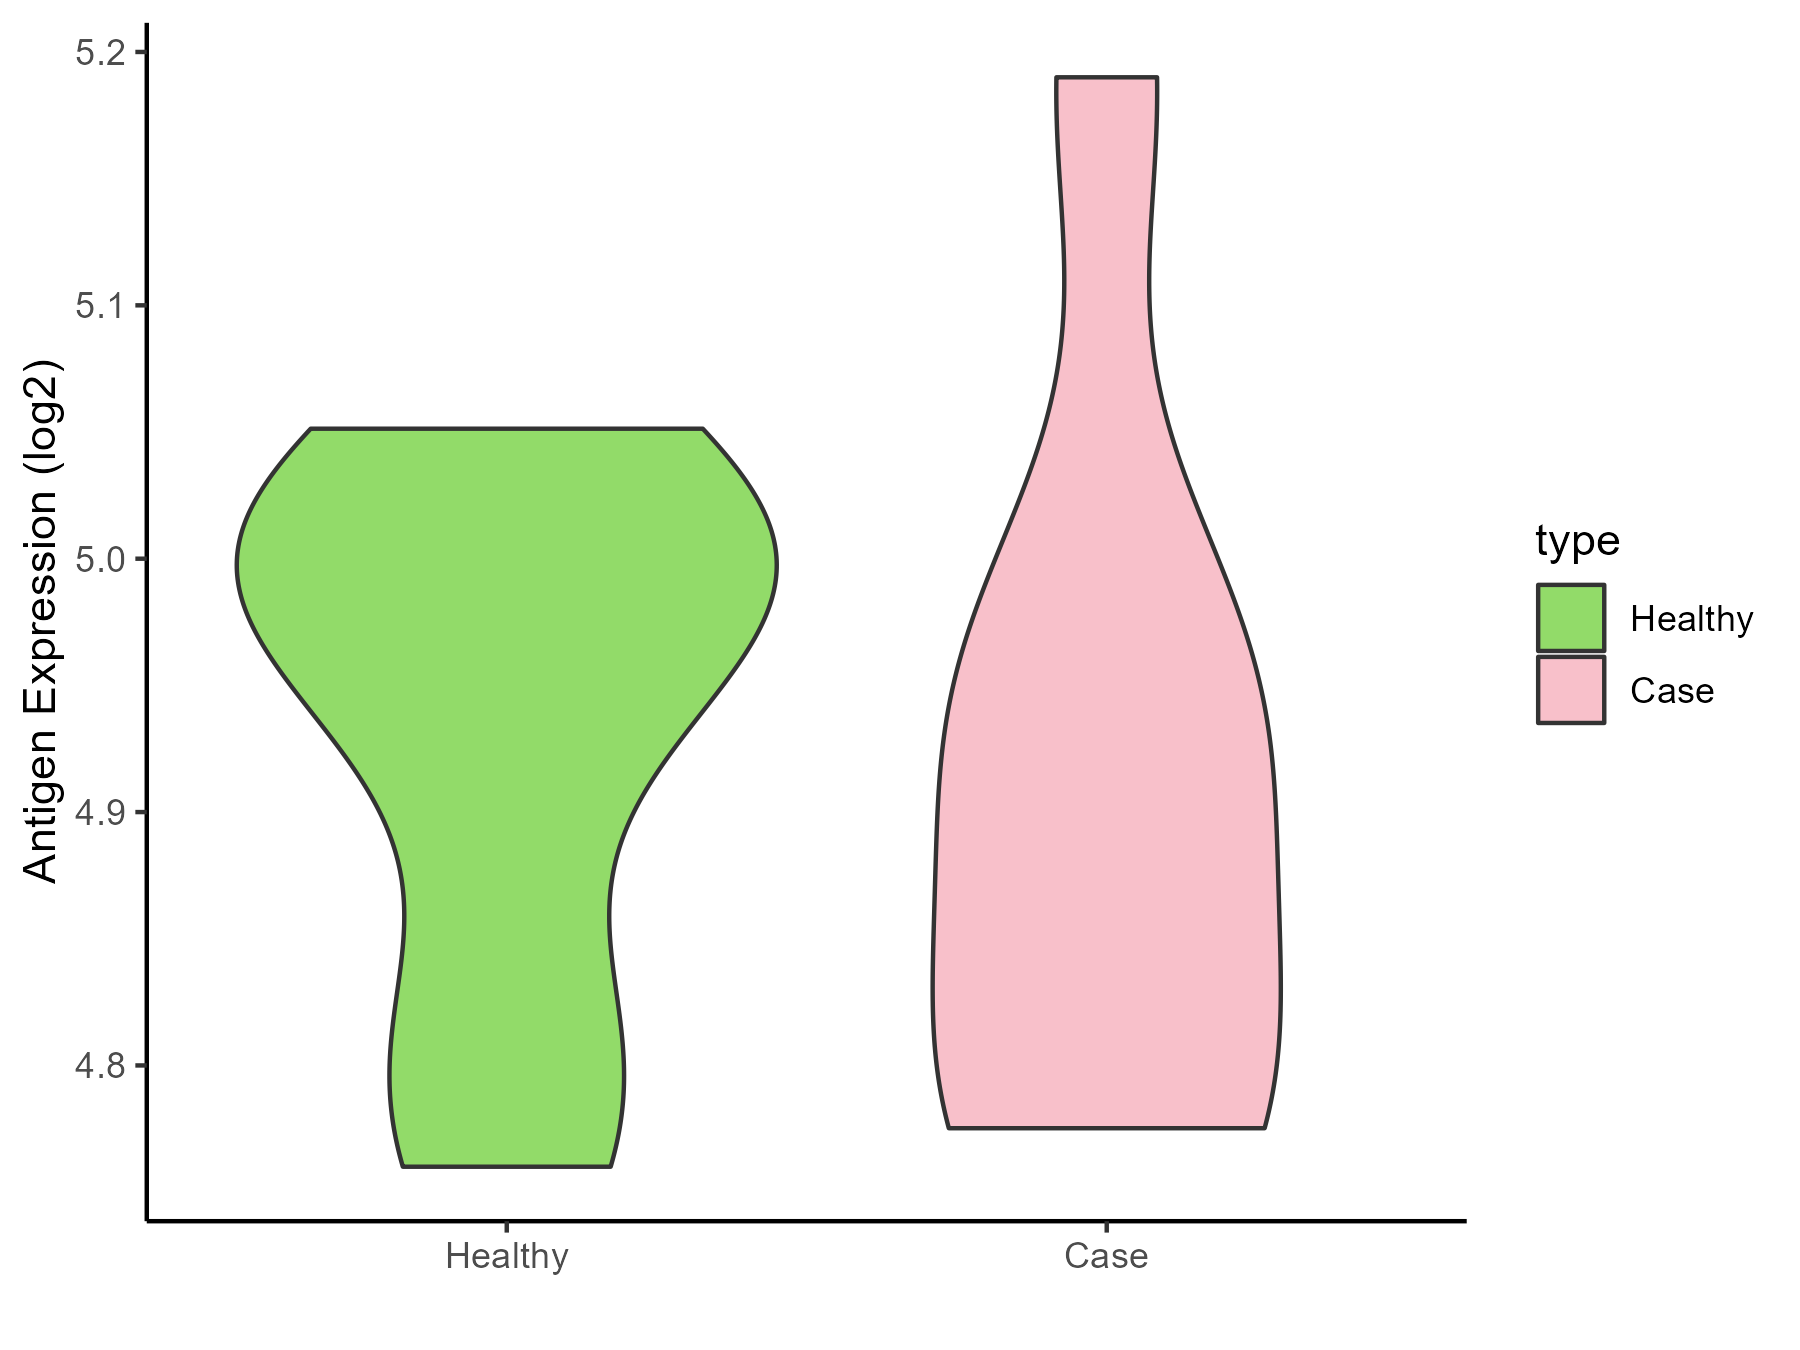
| Differential expression pattern of antigen in diseases | ||
| The Studied Tissue | Whole blood | |
| The Specific Disease | Batten disease | |
| The Expression Level of Disease Section Compare with the Healthy Individual Tissue | p-value: 0.721719714; Fold-change: -0.080408864; Z-score: -0.747253523 | |
| Disease-specific Antigen Abundances |
|
Click to View the Clearer Original Diagram |
ICD Disease Classification 6
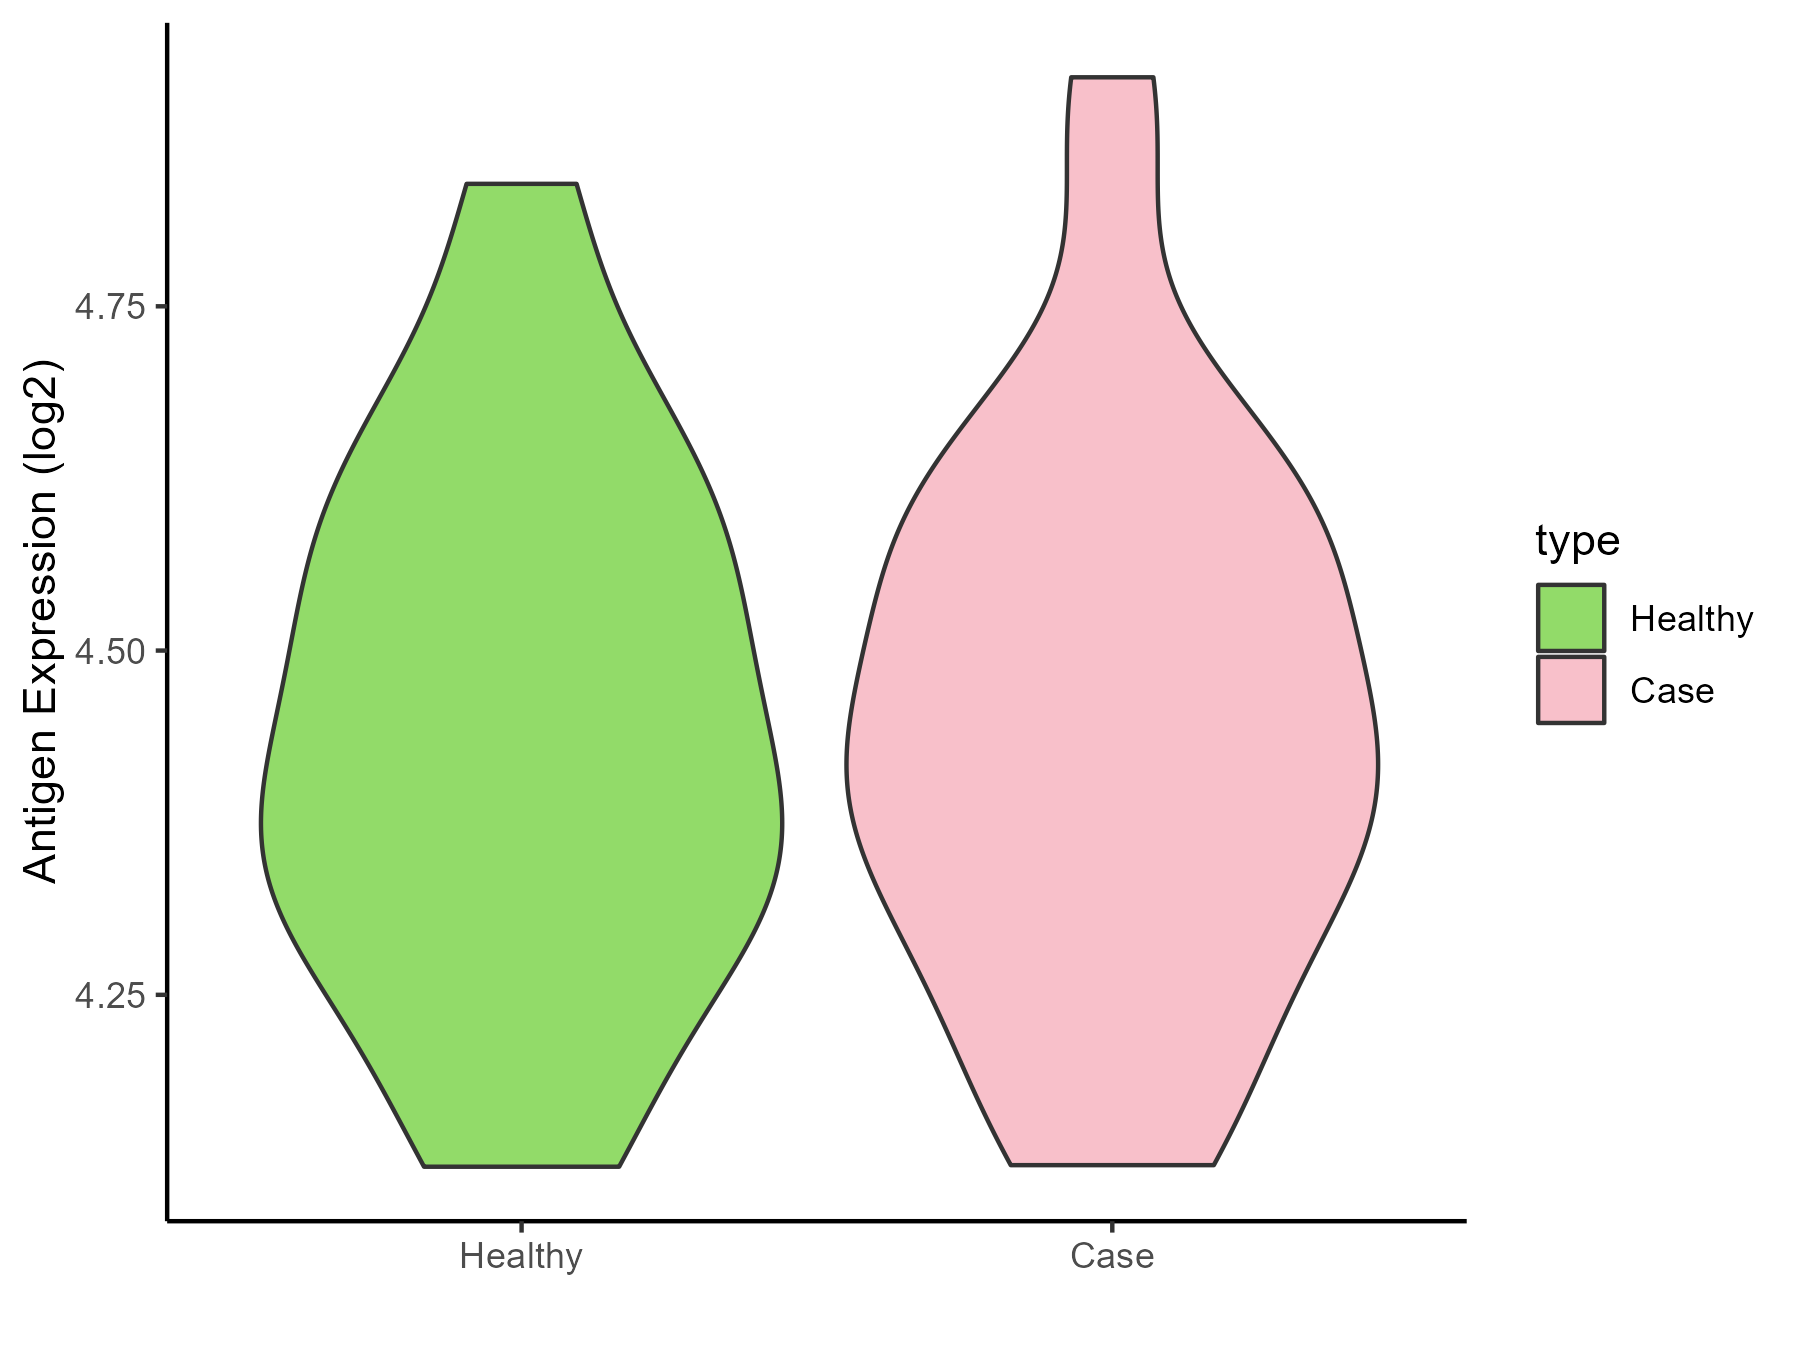
| Differential expression pattern of antigen in diseases | ||
| The Studied Tissue | Whole blood | |
| The Specific Disease | Autism | |
| The Expression Level of Disease Section Compare with the Healthy Individual Tissue | p-value: 0.924917619; Fold-change: 0.00981035; Z-score: 0.051839065 | |
| Disease-specific Antigen Abundances |
|
Click to View the Clearer Original Diagram |
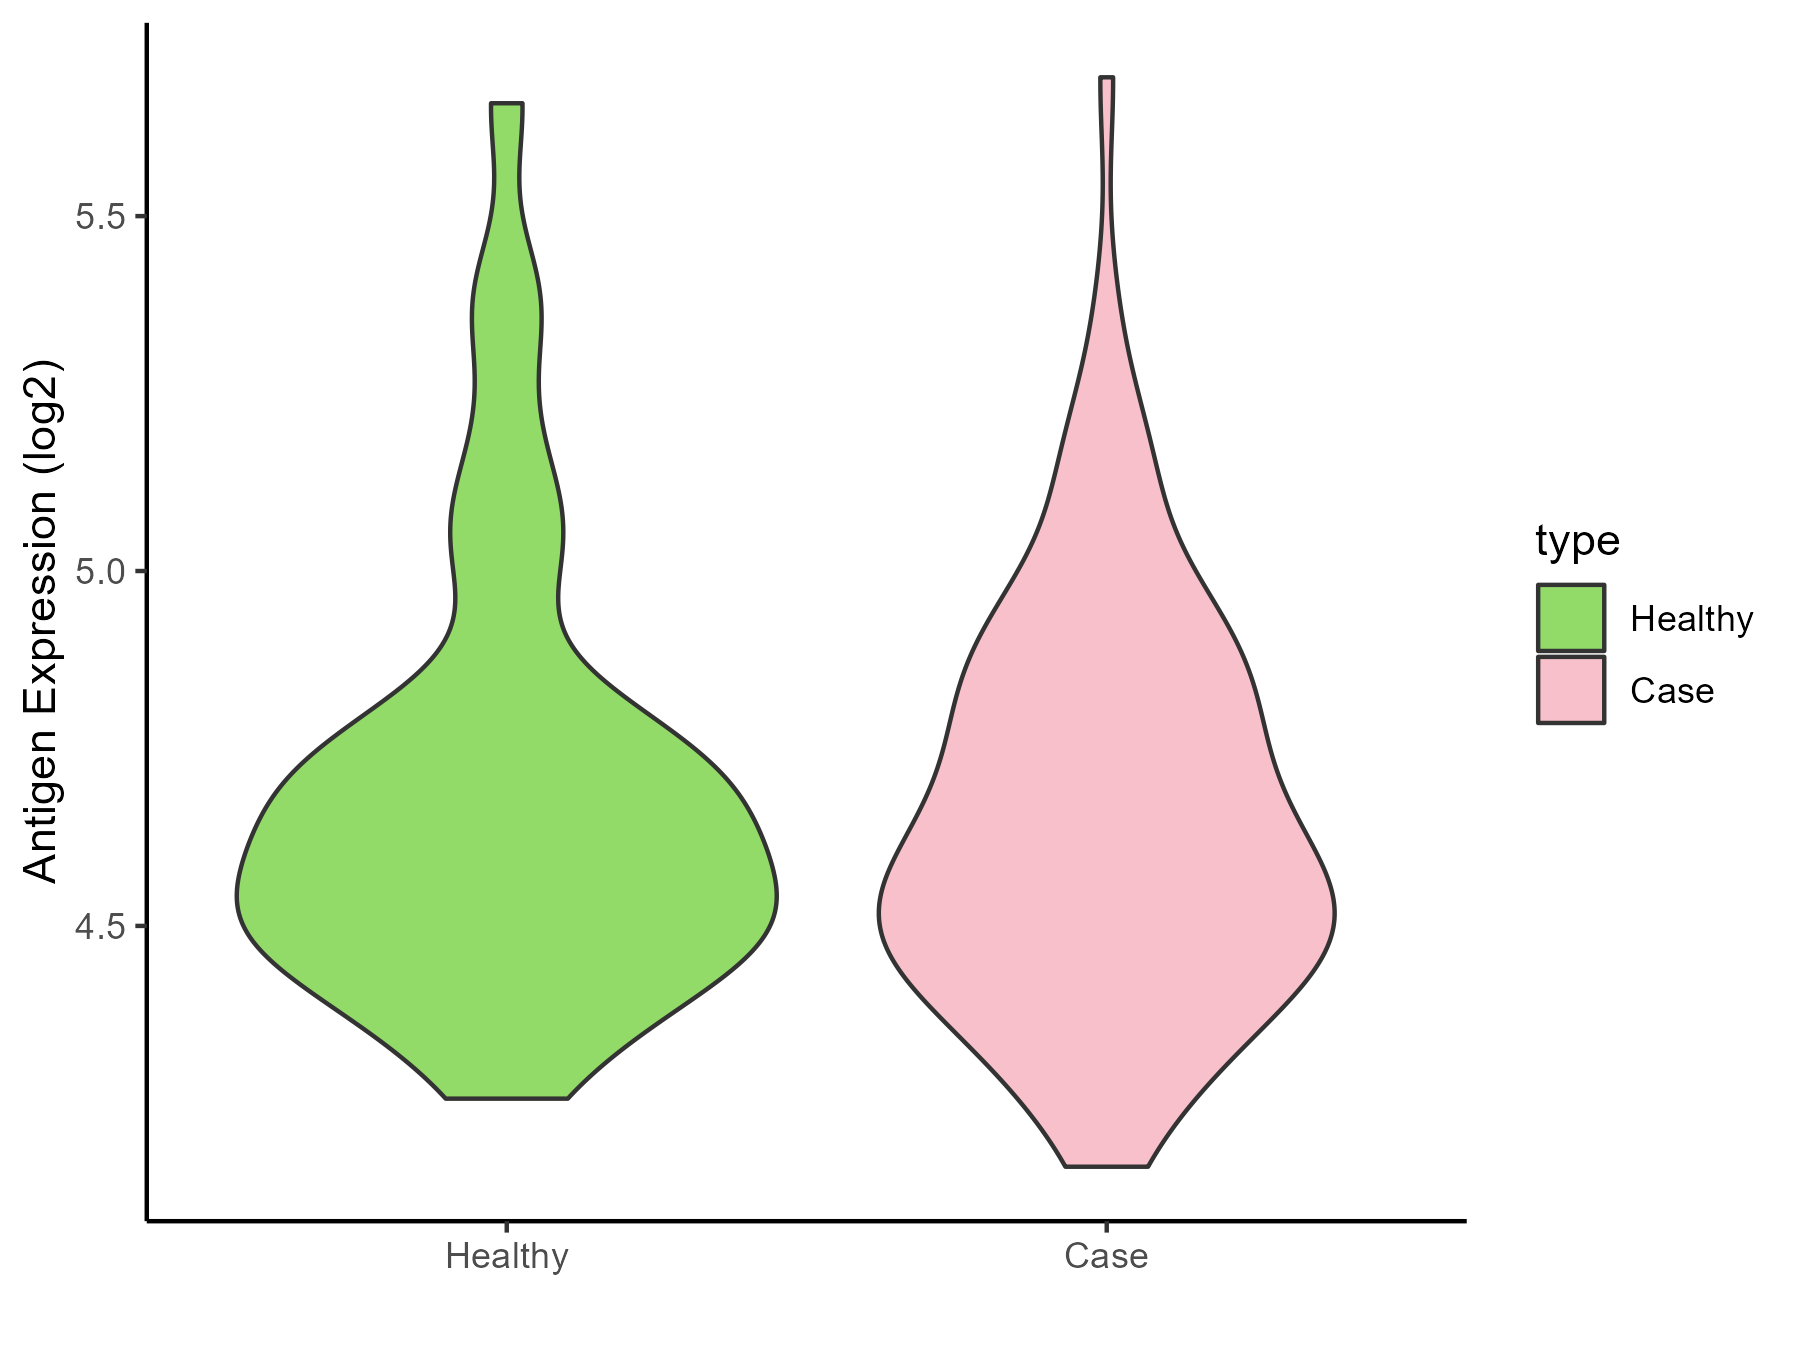
| Differential expression pattern of antigen in diseases | ||
| The Studied Tissue | Whole blood | |
| The Specific Disease | Anxiety disorder | |
| The Expression Level of Disease Section Compare with the Healthy Individual Tissue | p-value: 0.633180477; Fold-change: -0.007578685; Z-score: -0.024939728 | |
| Disease-specific Antigen Abundances |
|
Click to View the Clearer Original Diagram |
ICD Disease Classification 8
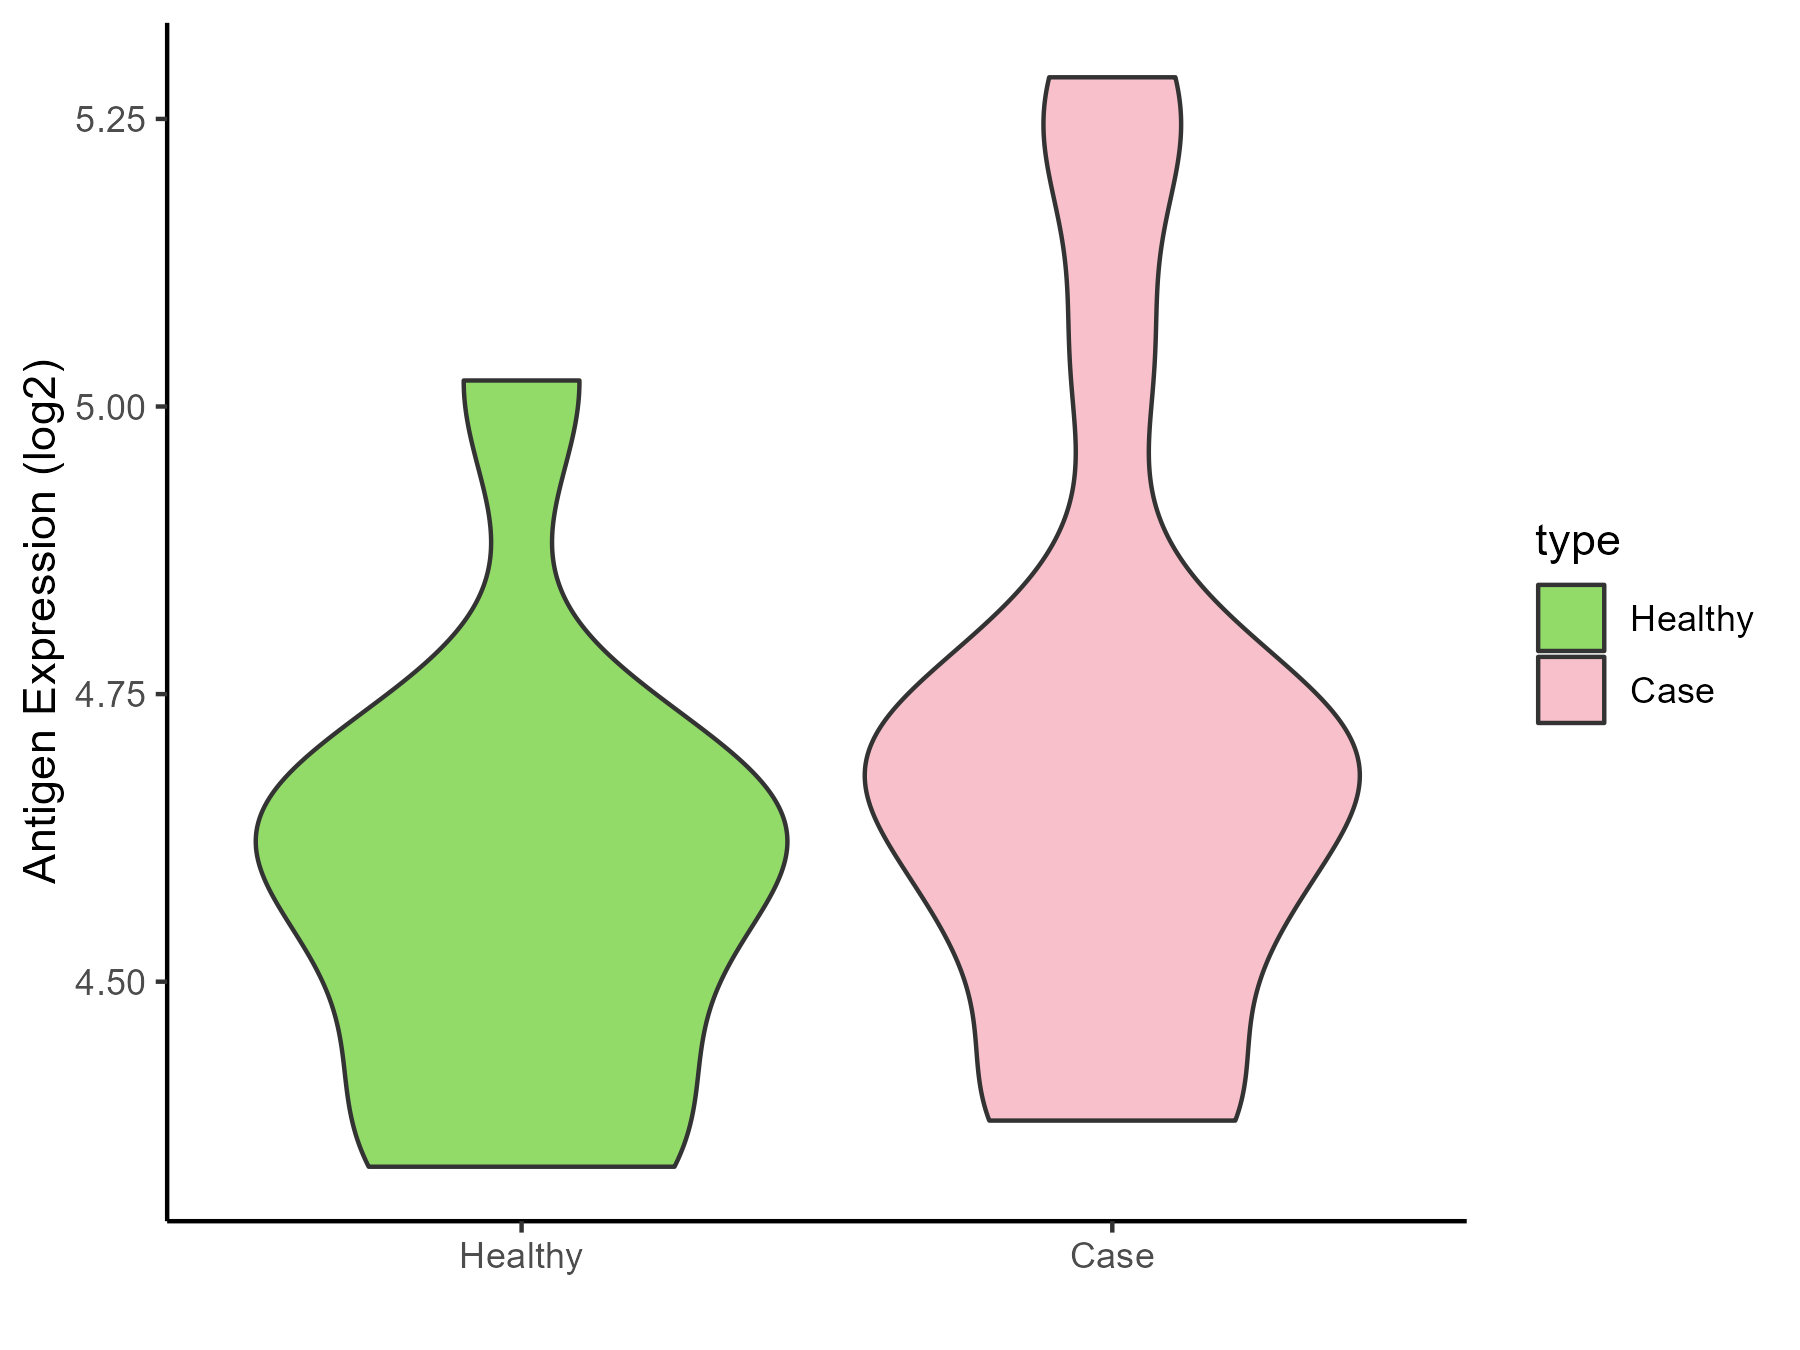
| Differential expression pattern of antigen in diseases | ||
| The Studied Tissue | Substantia nigra | |
| The Specific Disease | Parkinson disease | |
| The Expression Level of Disease Section Compare with the Healthy Individual Tissue | p-value: 0.216770061; Fold-change: 0.076231364; Z-score: 0.364688803 | |
| Disease-specific Antigen Abundances |
|
Click to View the Clearer Original Diagram |
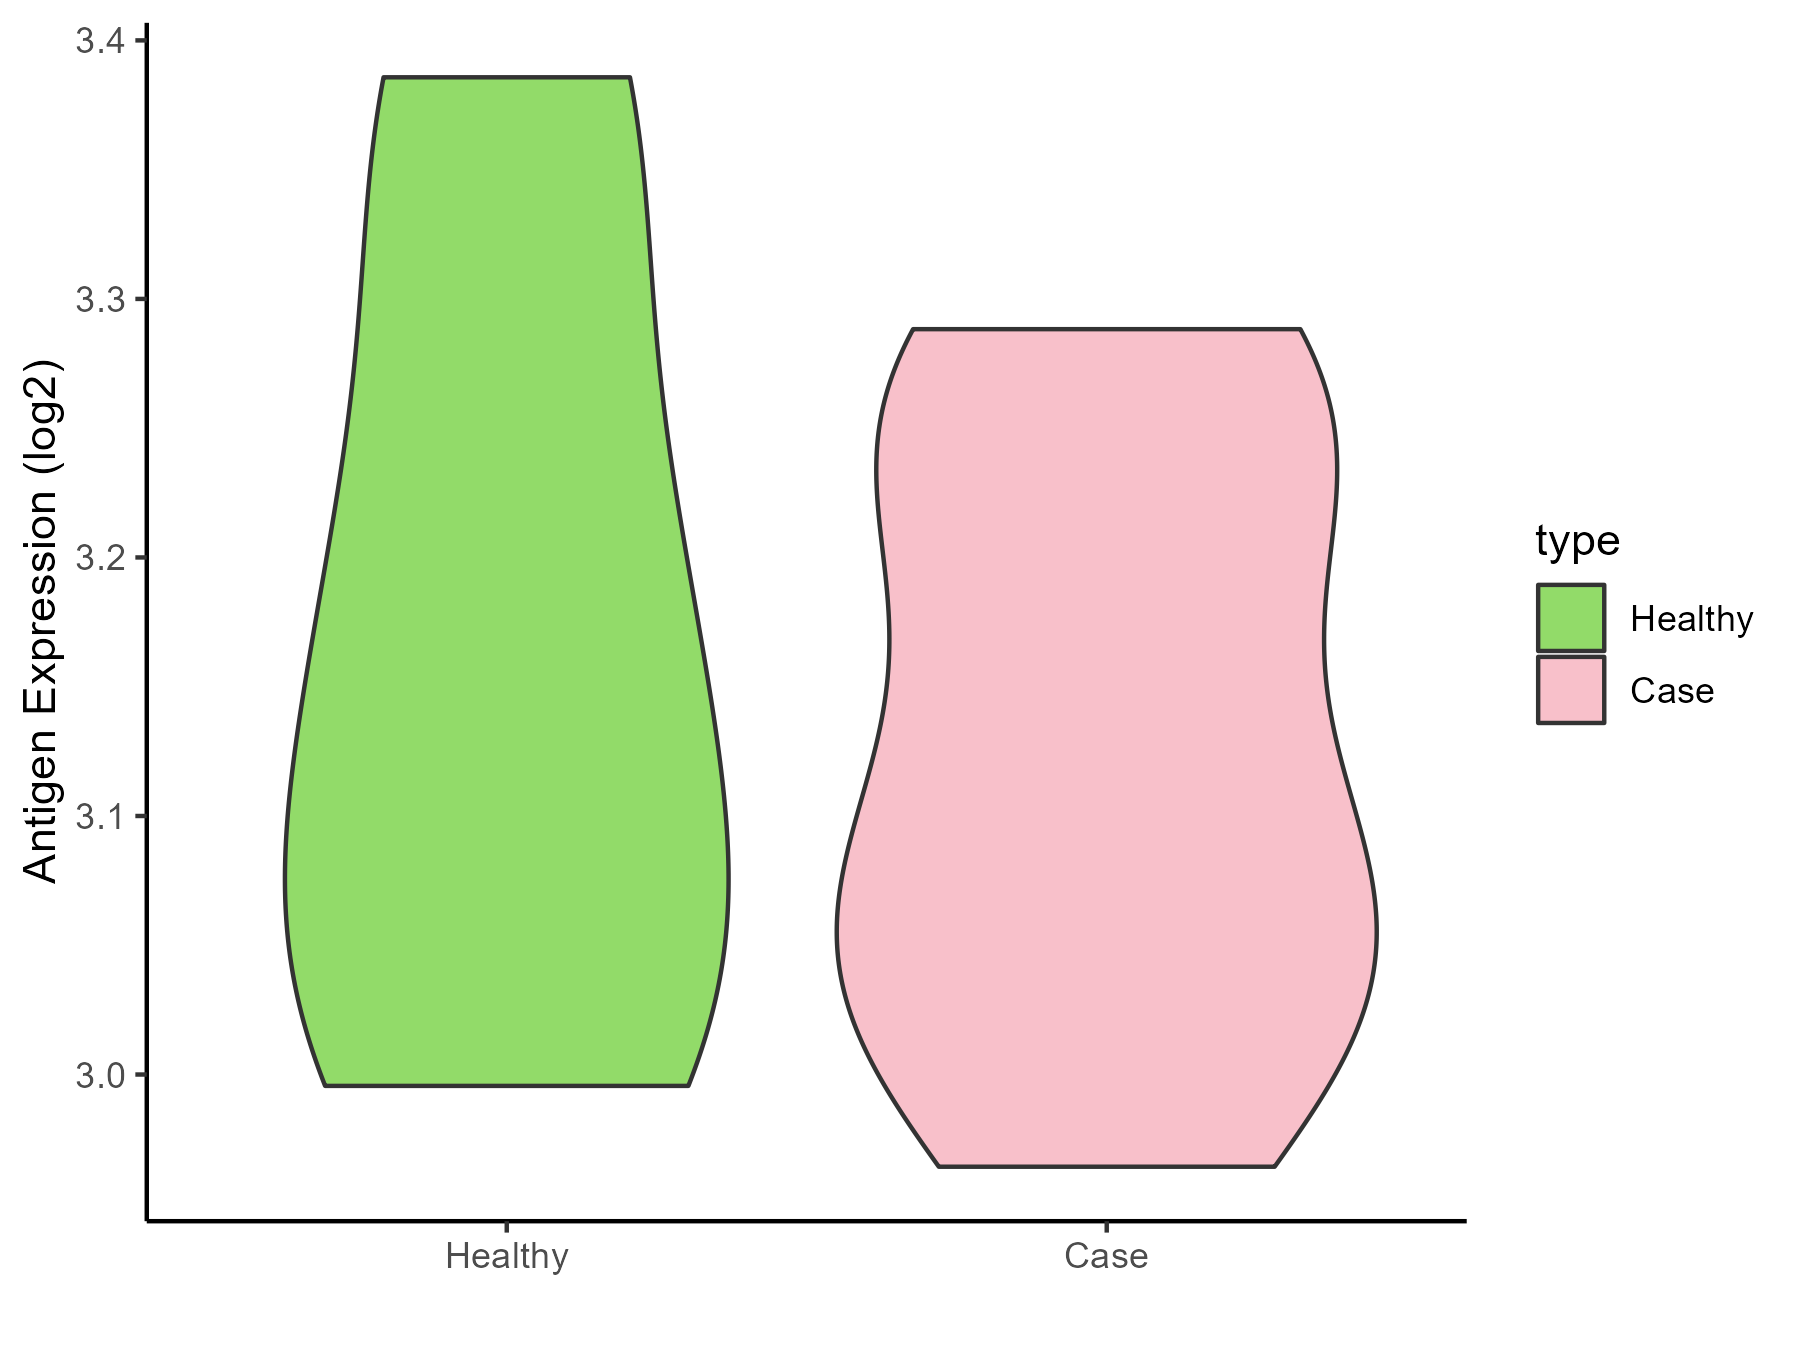
| Differential expression pattern of antigen in diseases | ||
| The Studied Tissue | Whole blood | |
| The Specific Disease | Huntington disease | |
| The Expression Level of Disease Section Compare with the Healthy Individual Tissue | p-value: 0.551981737; Fold-change: -0.057778786; Z-score: -0.386074993 | |
| Disease-specific Antigen Abundances |
|
Click to View the Clearer Original Diagram |
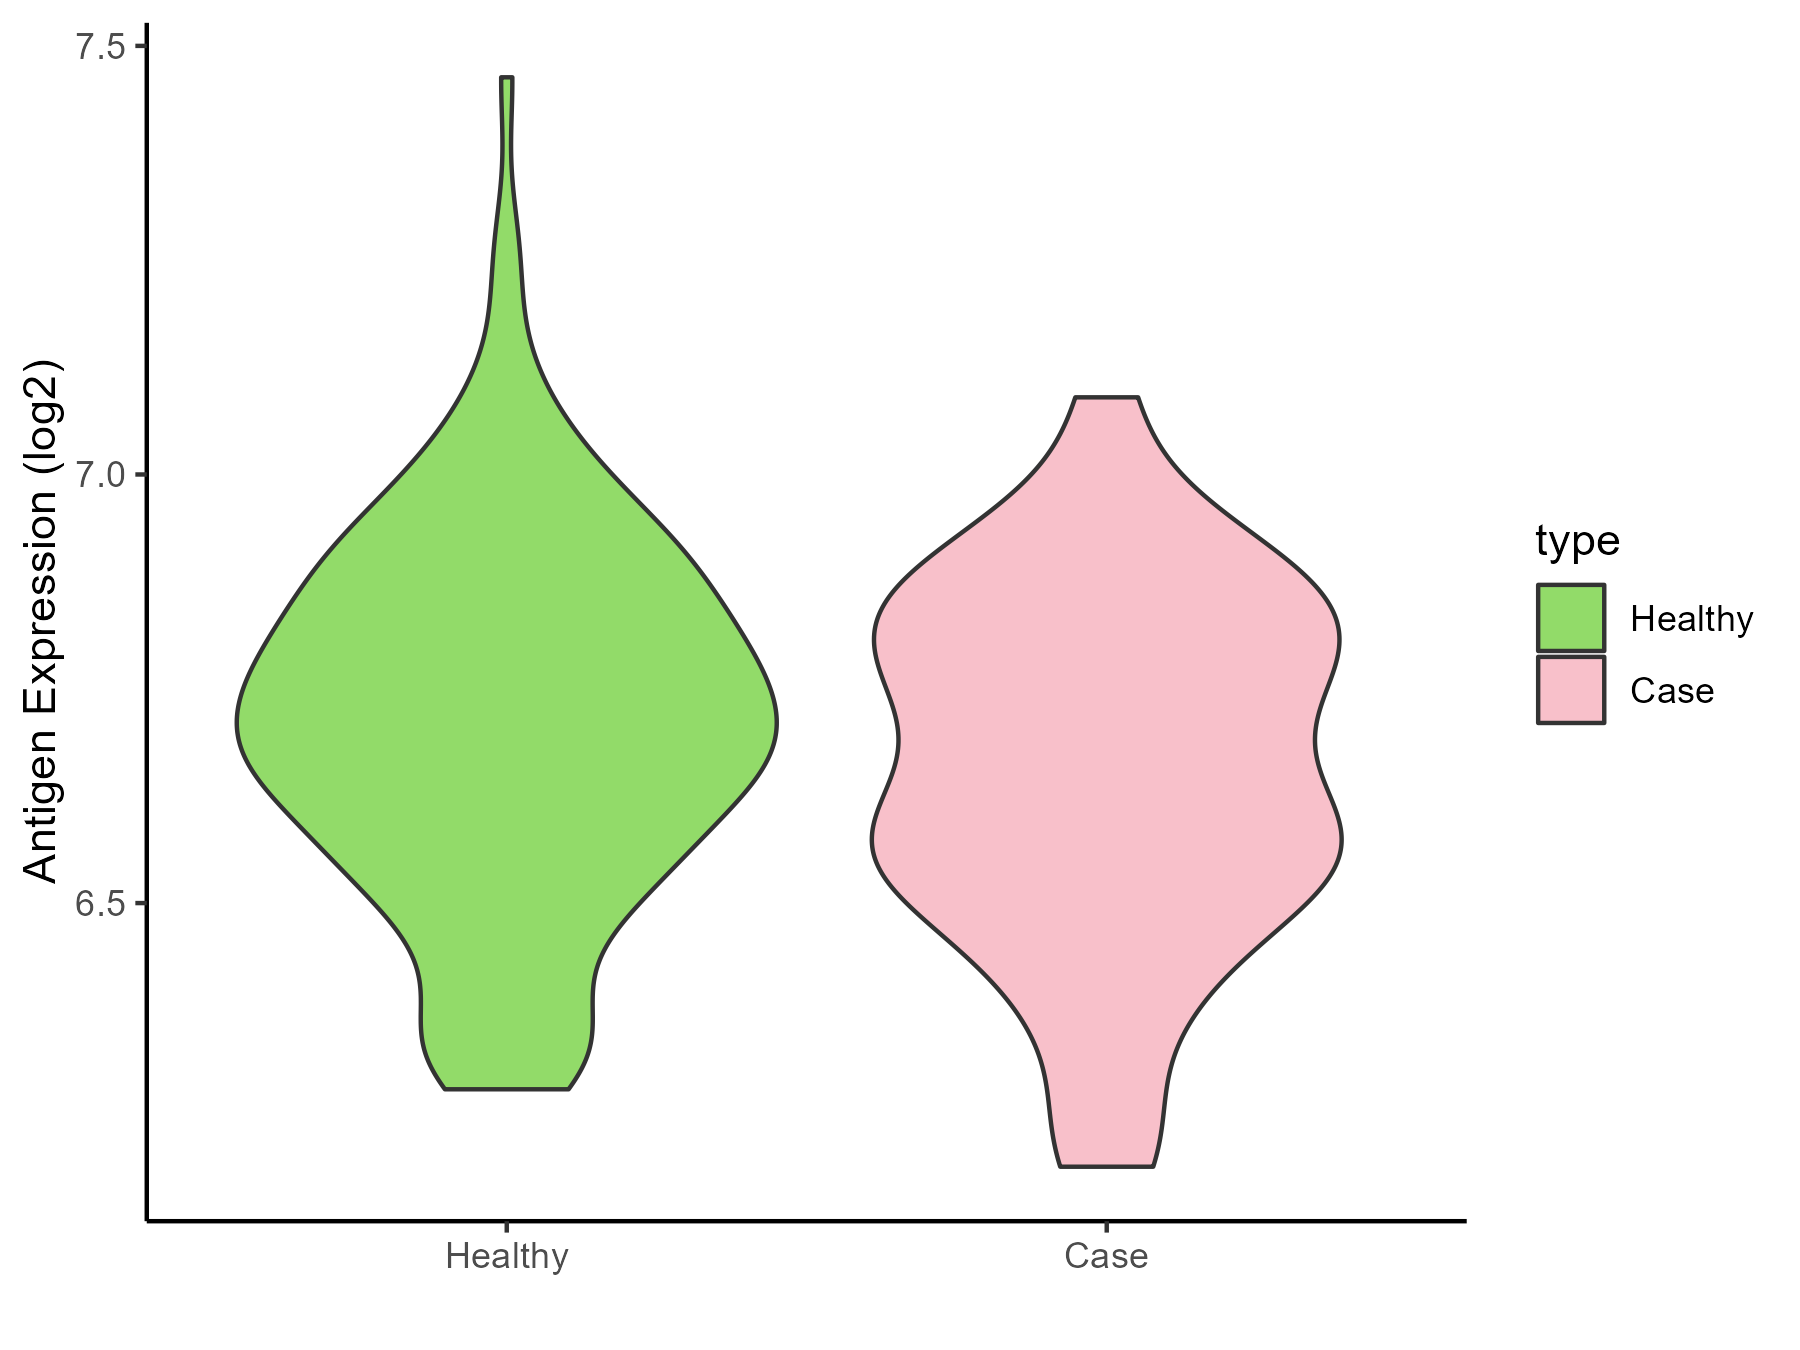
| Differential expression pattern of antigen in diseases | ||
| The Studied Tissue | Entorhinal cortex | |
| The Specific Disease | Alzheimer disease | |
| The Expression Level of Disease Section Compare with the Healthy Individual Tissue | p-value: 0.057833394; Fold-change: -0.057548939; Z-score: -0.269508449 | |
| Disease-specific Antigen Abundances |
|
Click to View the Clearer Original Diagram |
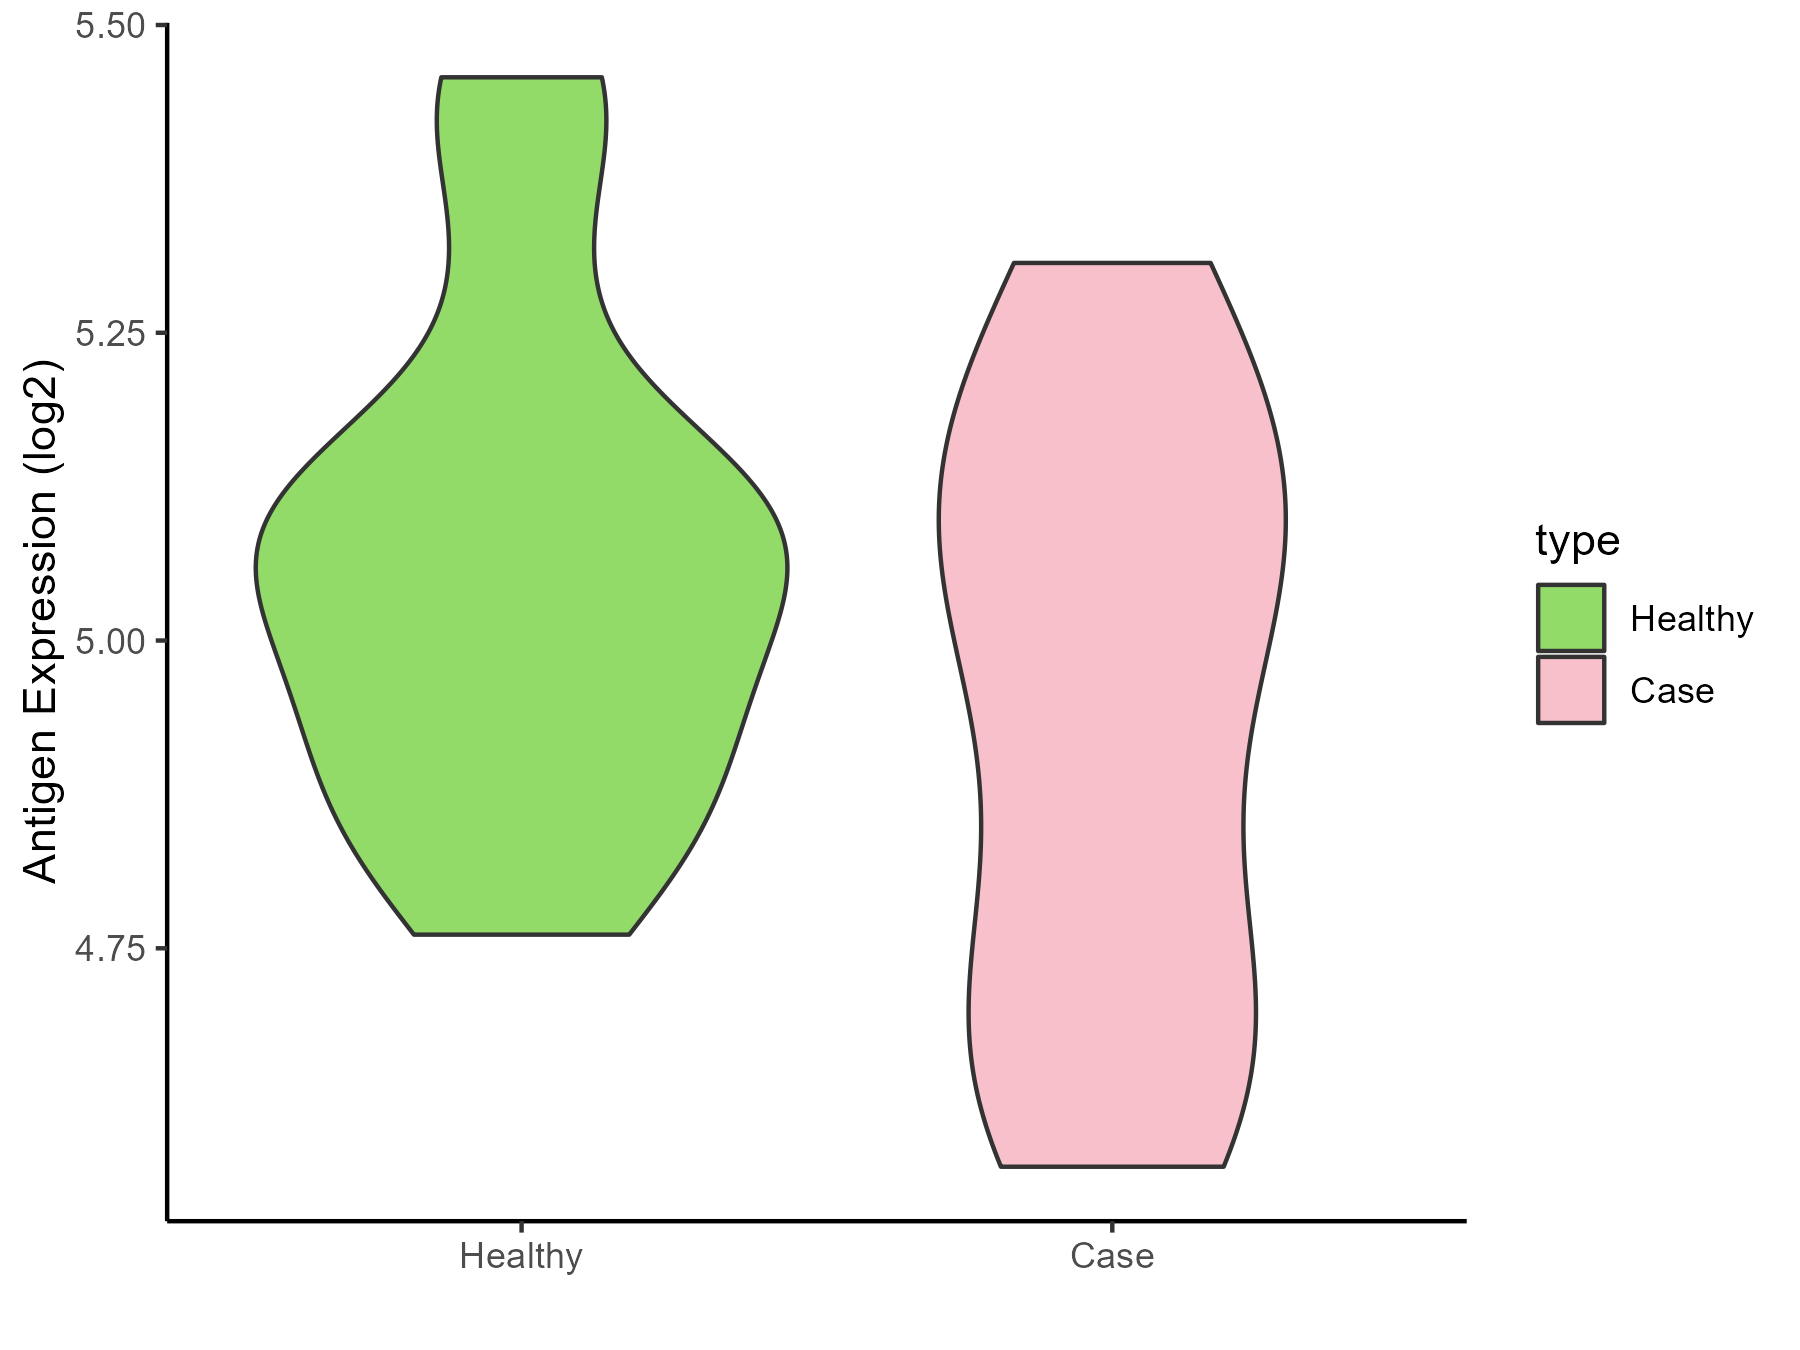
| Differential expression pattern of antigen in diseases | ||
| The Studied Tissue | Whole blood | |
| The Specific Disease | Seizure | |
| The Expression Level of Disease Section Compare with the Healthy Individual Tissue | p-value: 0.137881175; Fold-change: -0.093940657; Z-score: -0.466272177 | |
| Disease-specific Antigen Abundances |
|
Click to View the Clearer Original Diagram |
| Differential expression pattern of antigen in diseases | ||
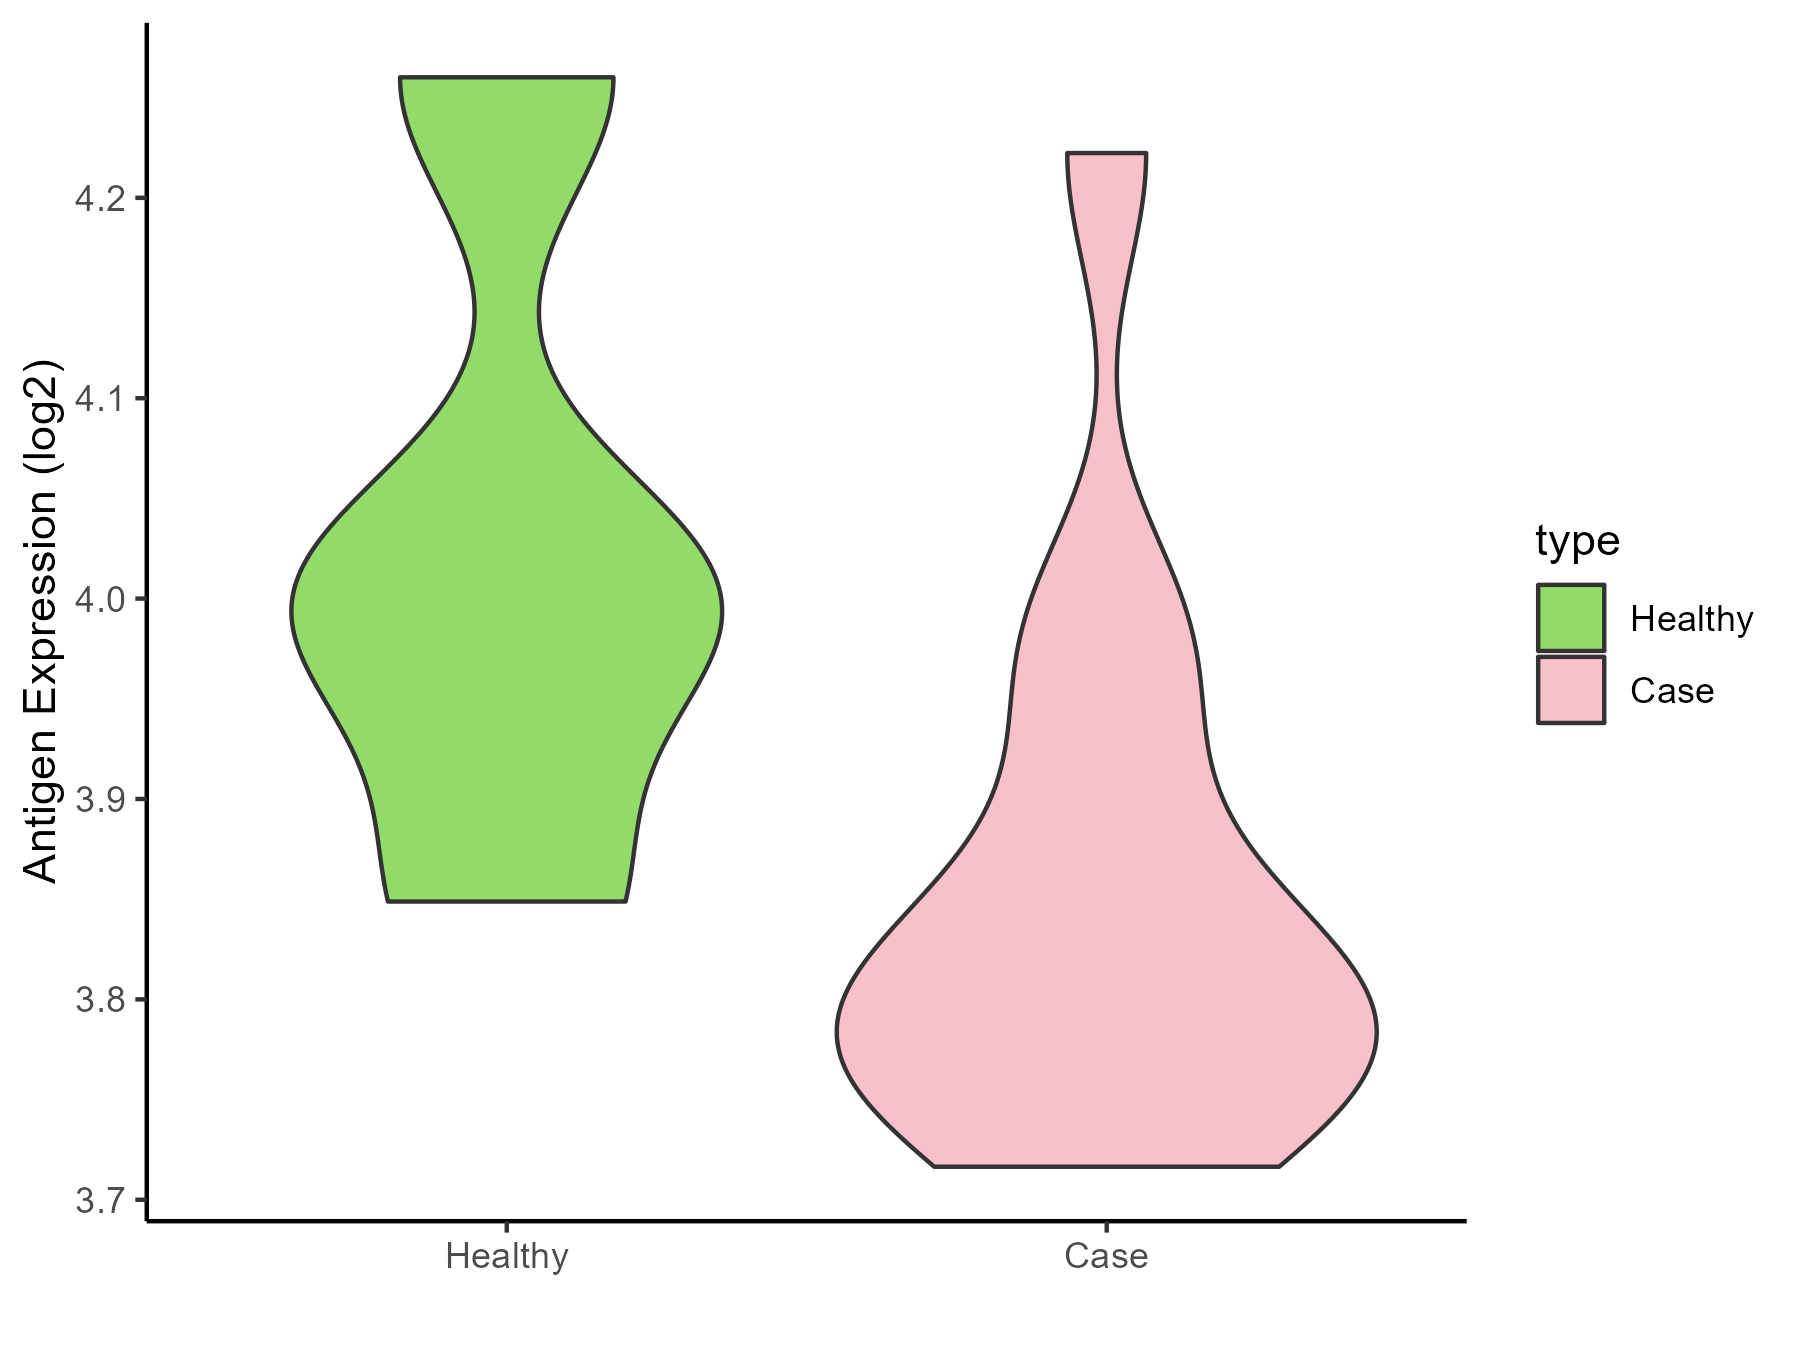
| The Studied Tissue | Skin | |
| The Specific Disease | Lateral sclerosis | |
| The Expression Level of Disease Section Compare with the Healthy Individual Tissue | p-value: 0.140583393; Fold-change: -0.194008214; Z-score: -1.132666125 | |
| Disease-specific Antigen Abundances |
|
Click to View the Clearer Original Diagram |
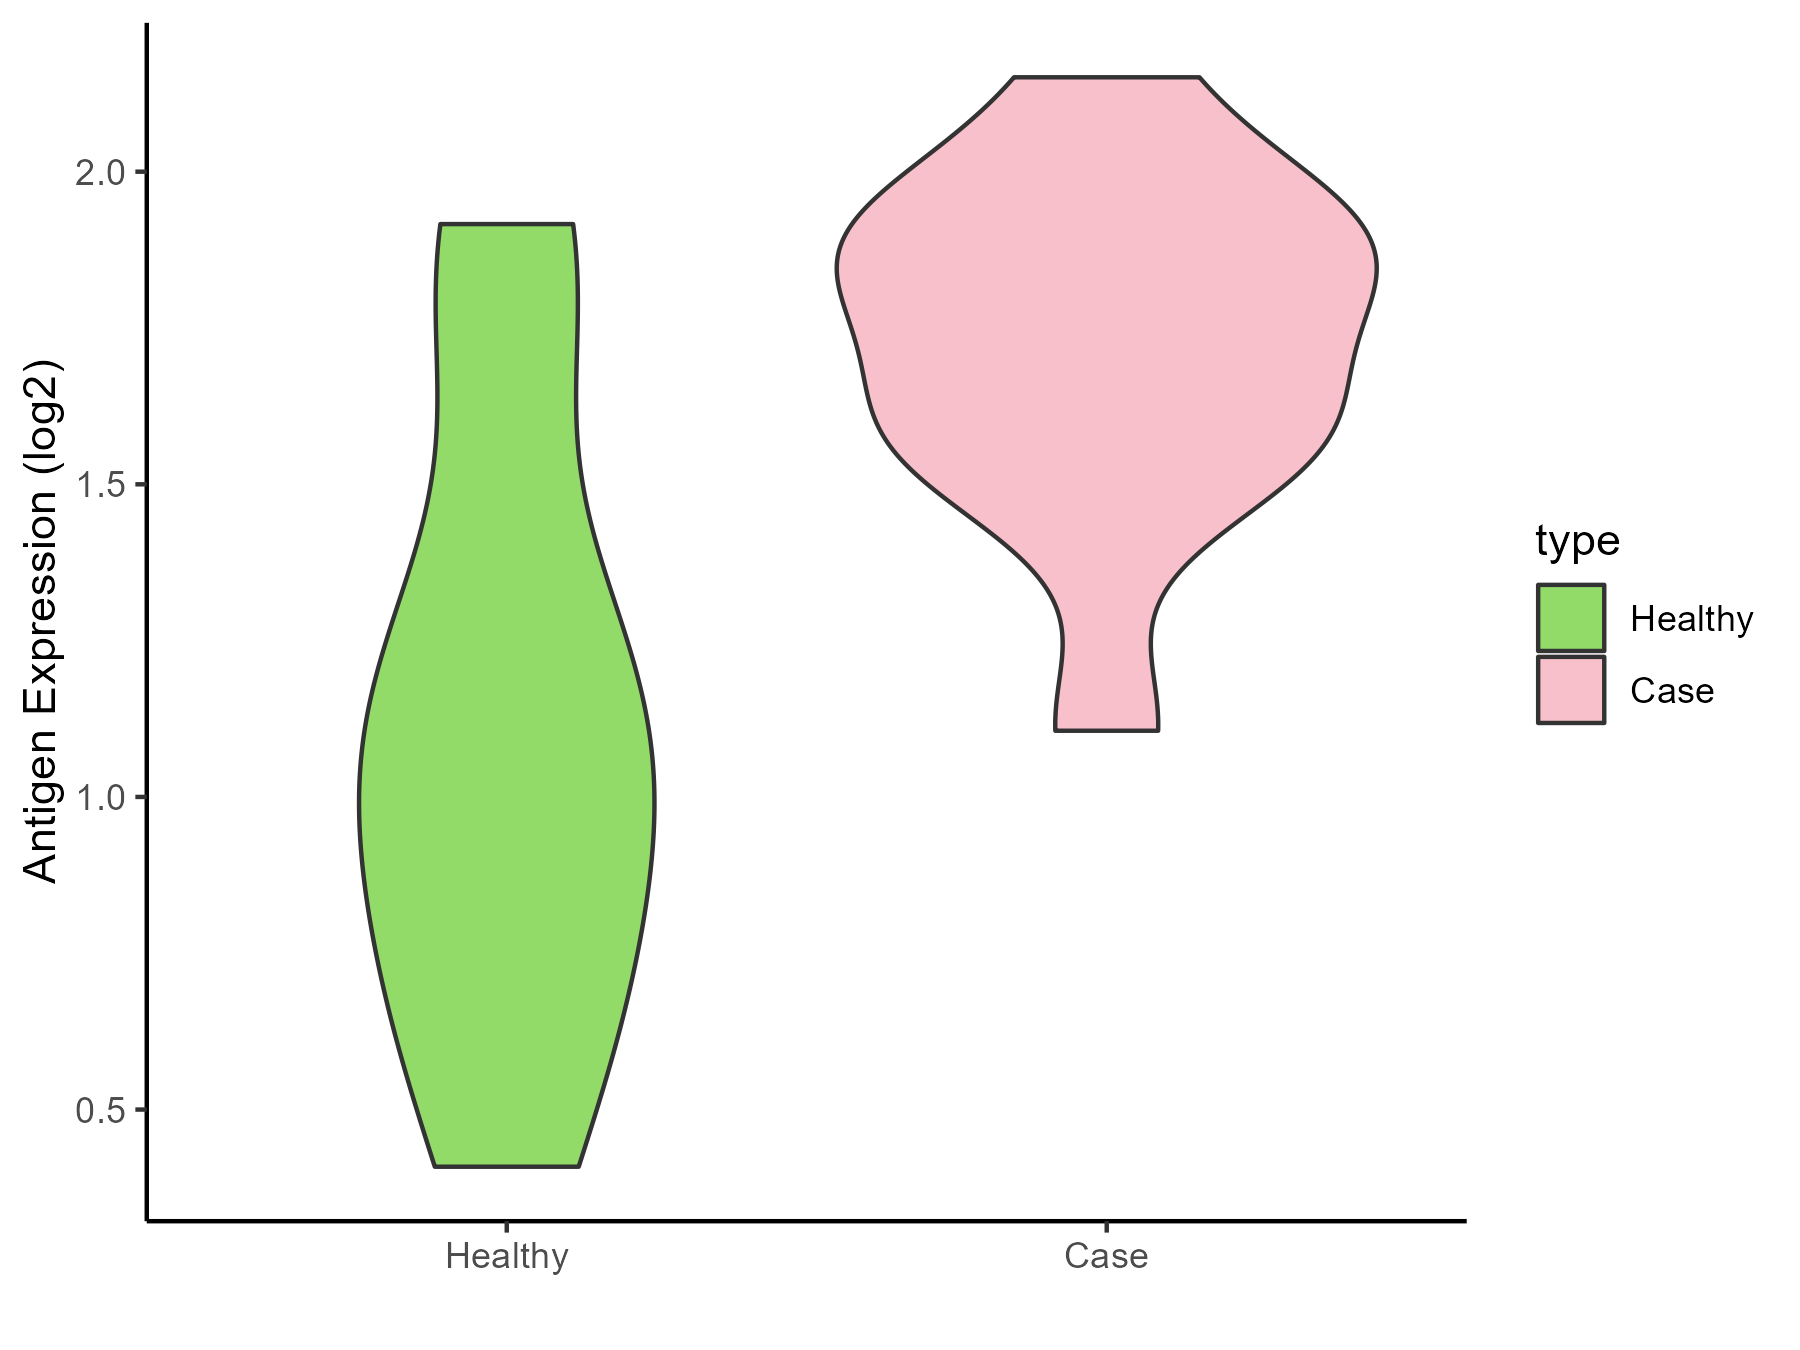
| The Studied Tissue | Cervical spinal cord | |
| The Specific Disease | Lateral sclerosis | |
| The Expression Level of Disease Section Compare with the Healthy Individual Tissue | p-value: 0.006886596; Fold-change: 0.769646845; Z-score: 1.540066734 | |
| Disease-specific Antigen Abundances |
|
Click to View the Clearer Original Diagram |
| Differential expression pattern of antigen in diseases | ||
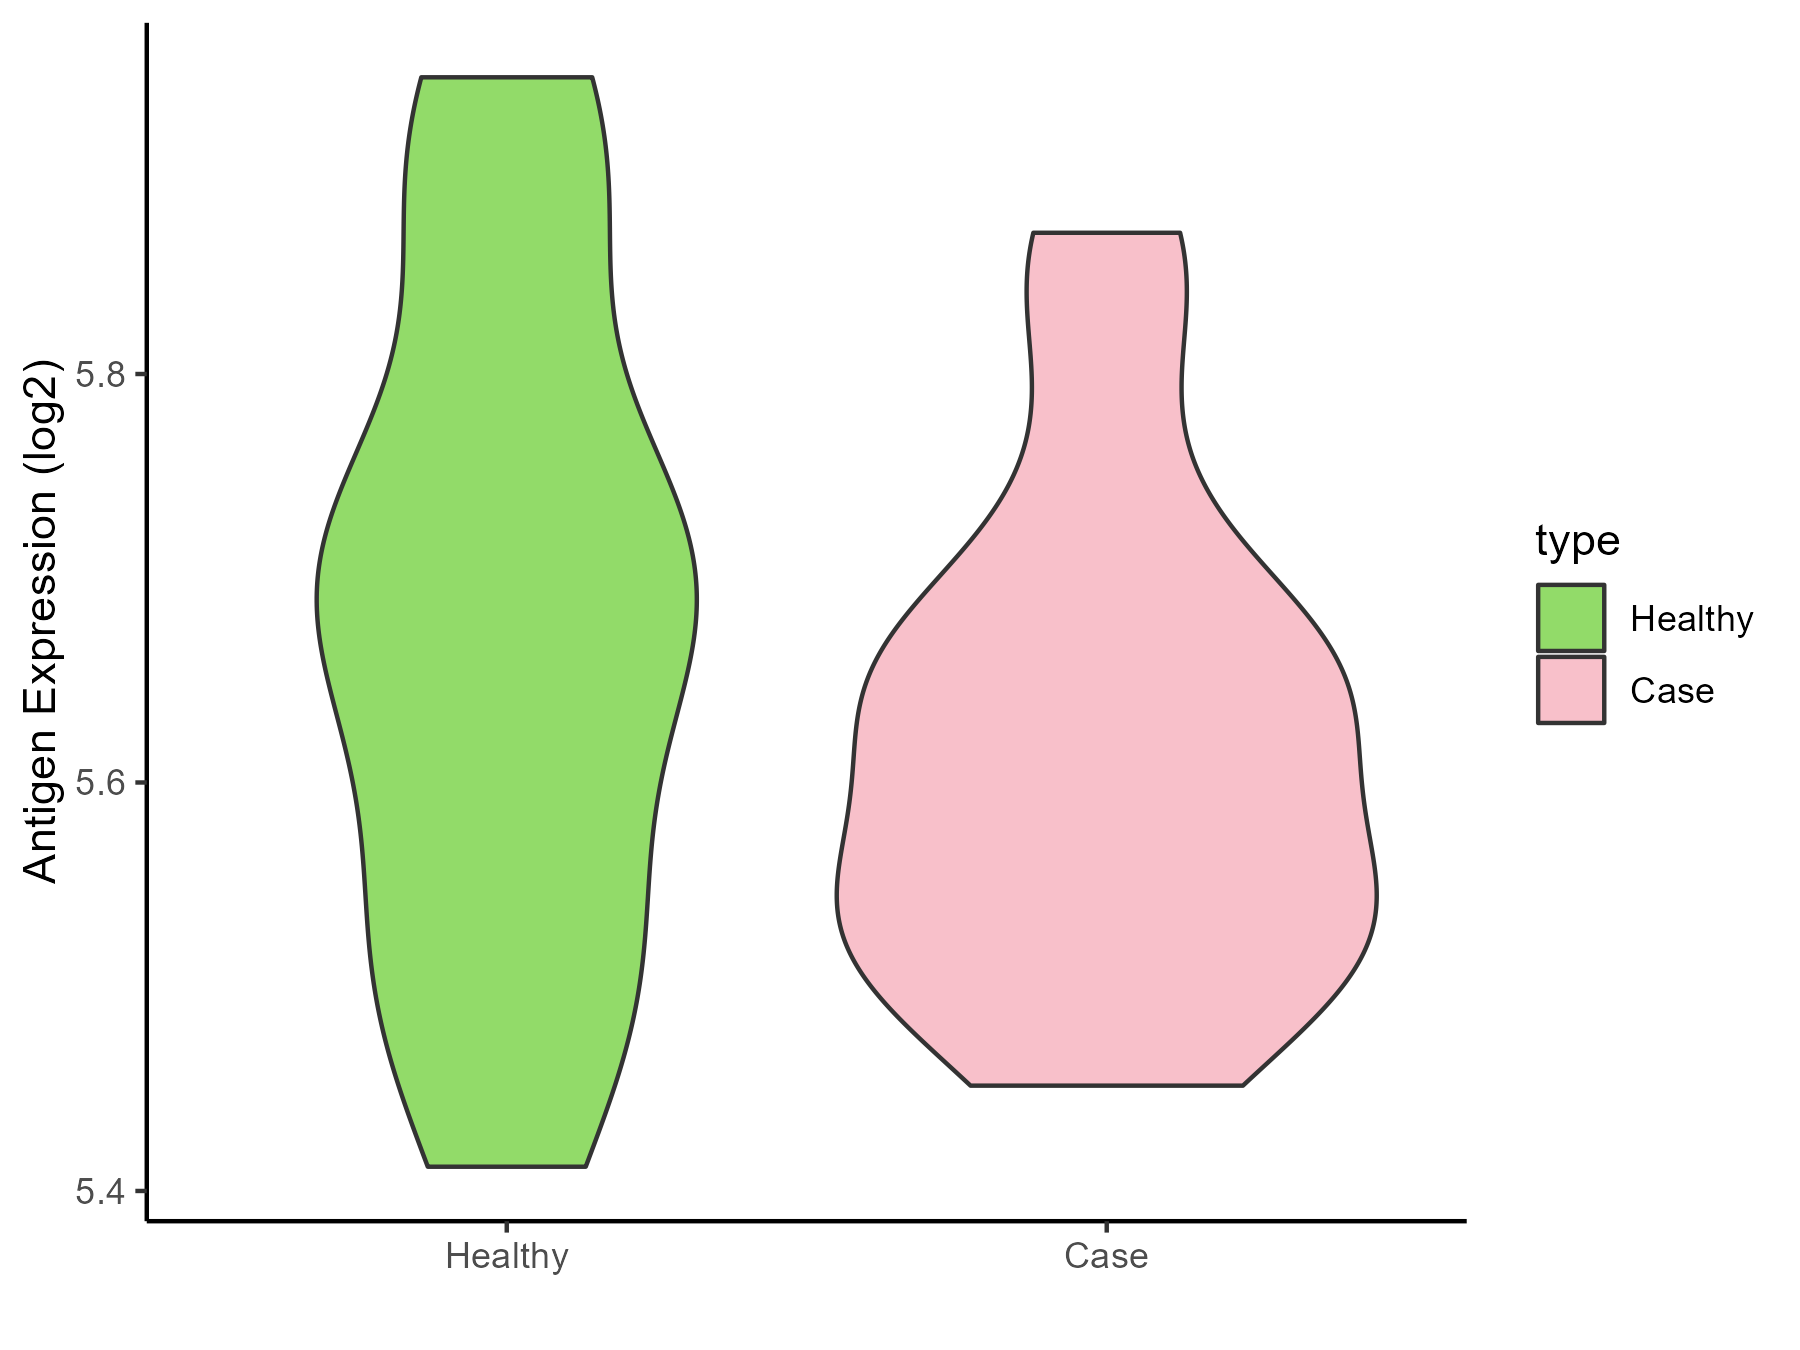
| The Studied Tissue | Muscle | |
| The Specific Disease | Muscular atrophy | |
| The Expression Level of Disease Section Compare with the Healthy Individual Tissue | p-value: 0.296567845; Fold-change: -0.075153691; Z-score: -0.457029629 | |
| Disease-specific Antigen Abundances |
|
Click to View the Clearer Original Diagram |
| Differential expression pattern of antigen in diseases | ||
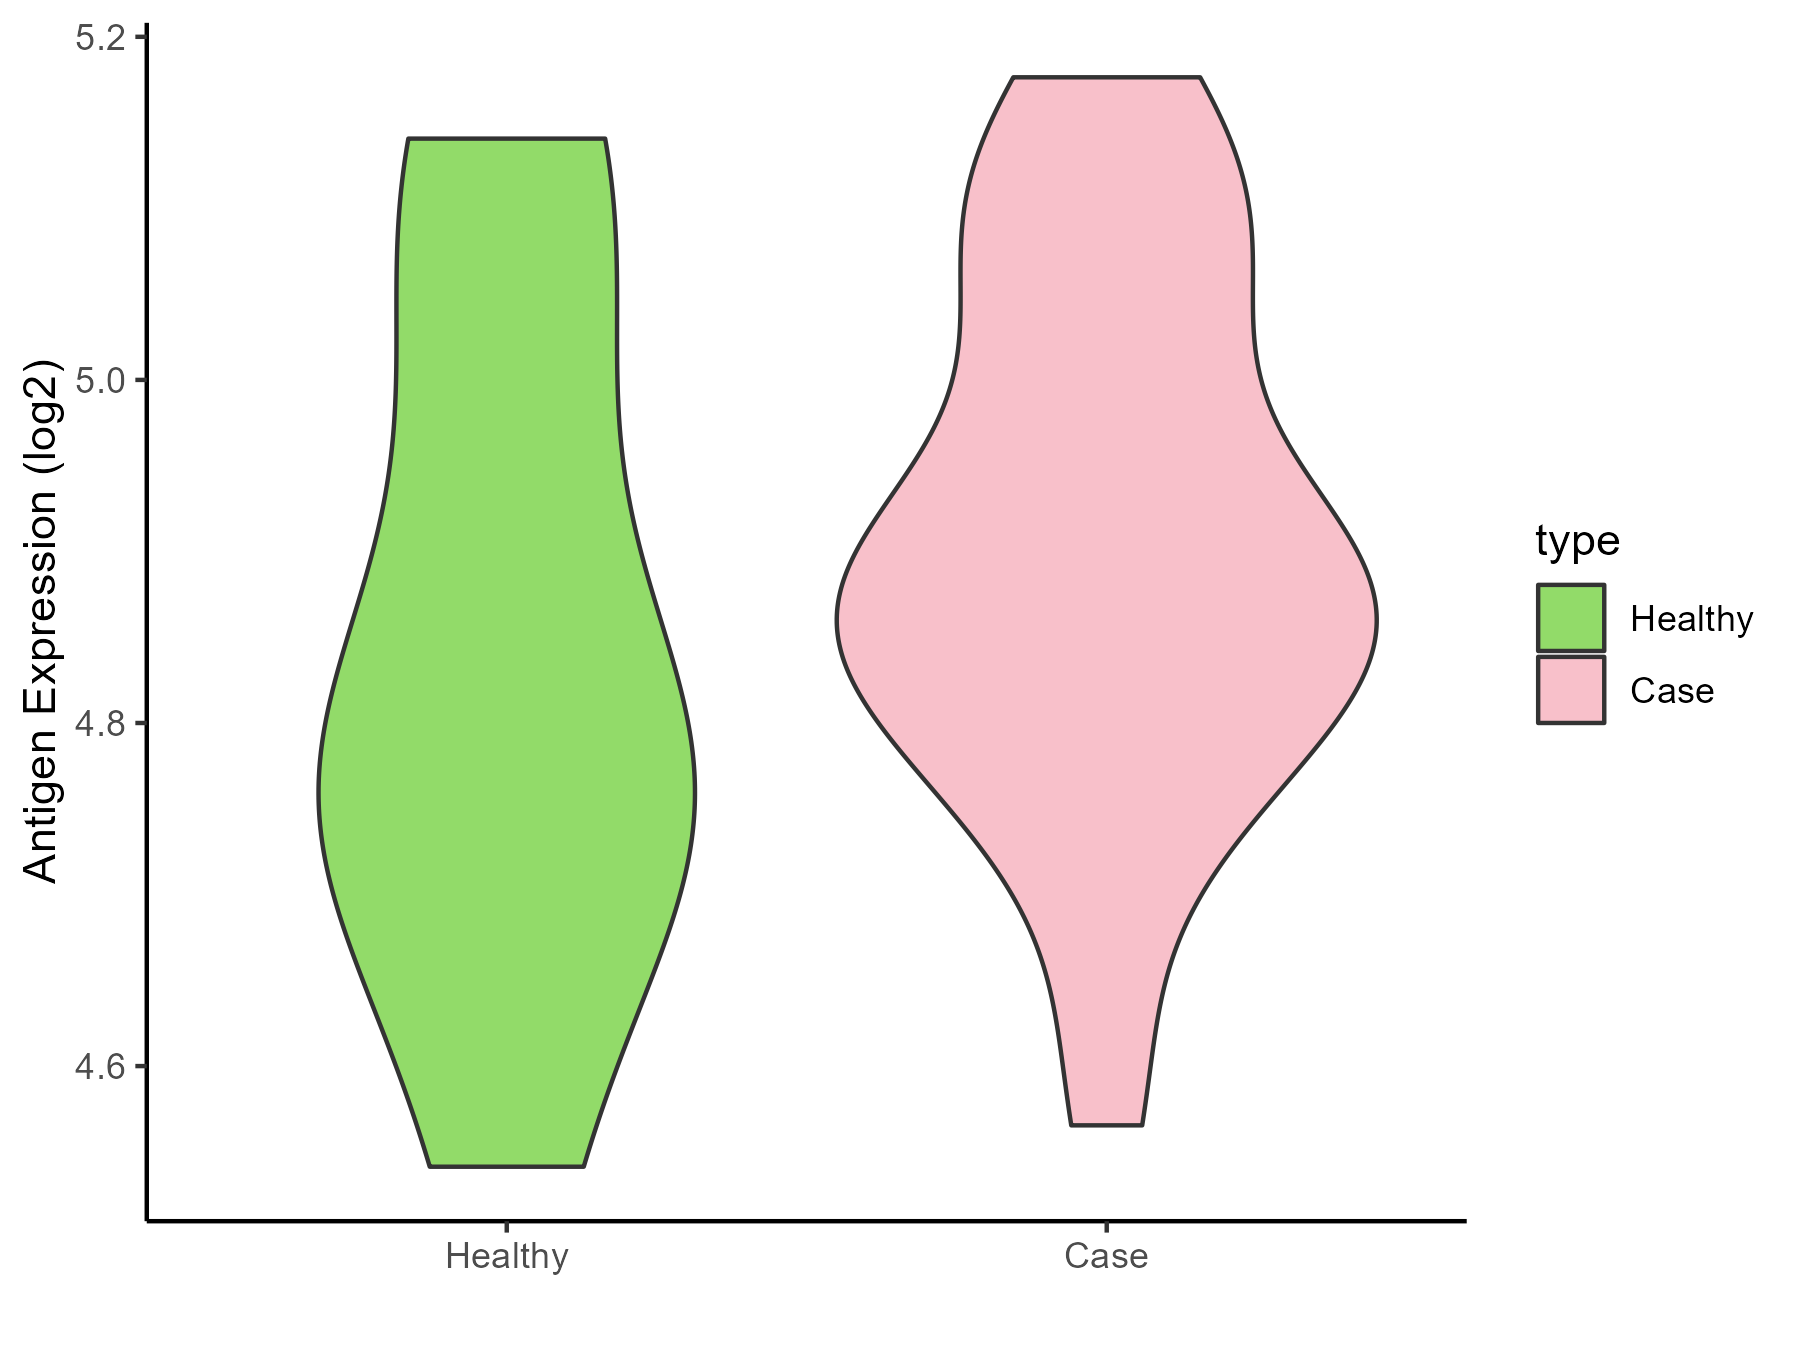
| The Studied Tissue | Muscle | |
| The Specific Disease | Myopathy | |
| The Expression Level of Disease Section Compare with the Healthy Individual Tissue | p-value: 0.452574317; Fold-change: 0.102307159; Z-score: 0.498769267 | |
| Disease-specific Antigen Abundances |
|
Click to View the Clearer Original Diagram |
References
