Antigen Information
General Information of This Antigen
| Antigen ID | TAR0LKRTD |
|||||
|---|---|---|---|---|---|---|
| Antigen Name | Pro-epidermal growth factor (EGF) |
|||||
| Gene Name | EGF |
|||||
| Gene ID | ||||||
| Sequence |
MLLTLIILLPVVSKFSFVSLSAPQHWSCPEGTLAGNGNSTCVGPAPFLIFSHGNSIFRID
TEGTNYEQLVVDAGVSVIMDFHYNEKRIYWVDLERQLLQRVFLNGSRQERVCNIEKNVSG MAINWINEEVIWSNQQEGIITVTDMKGNNSHILLSALKYPANVAVDPVERFIFWSSEVAG SLYRADLDGVGVKALLETSEKITAVSLDVLDKRLFWIQYNREGSNSLICSCDYDGGSVHI SKHPTQHNLFAMSLFGDRIFYSTWKMKTIWIANKHTGKDMVRINLHSSFVPLGELKVVHP LAQPKAEDDTWEPEQKLCKLRKGNCSSTVCGQDLQSHLCMCAEGYALSRDRKYCEDVNEC AFWNHGCTLGCKNTPGSYYCTCPVGFVLLPDGKRCHQLVSCPRNVSECSHDCVLTSEGPL CFCPEGSVLERDGKTCSGCSSPDNGGCSQLCVPLSPVSWECDCFPGYDLQLDEKSCAASG PQPFLLFANSQDIRHMHFDGTDYGTLLSQQMGMVYALDHDPVENKIYFAHTALKWIERAN MDGSQRERLIEEGVDVPEGLAVDWIGRRFYWTDRGKSLIGRSDLNGKRSKIITKENISQP RGIAVHPMAKRLFWTDTGINPRIESSSLQGLGRLVIASSDLIWPSGITIDFLTDKLYWCD AKQSVIEMANLDGSKRRRLTQNDVGHPFAVAVFEDYVWFSDWAMPSVMRVNKRTGKDRVR LQGSMLKPSSLVVVHPLAKPGADPCLYQNGGCEHICKKRLGTAWCSCREGFMKASDGKTC LALDGHQLLAGGEVDLKNQVTPLDILSKTRVSEDNITESQHMLVAEIMVSDQDDCAPVGC SMYARCISEGEDATCQCLKGFAGDGKLCSDIDECEMGVPVCPPASSKCINTEGGYVCRCS EGYQGDGIHCLDIDECQLGEHSCGENASCTNTEGGYTCMCAGRLSEPGLICPDSTPPPHL REDDHHYSVRNSDSECPLSHDGYCLHDGVCMYIEALDKYACNCVVGYIGERCQYRDLKWW ELRHAGHGQQQKVIVVAVCVVVLVMLLLLSLWGAHYYRTQKLLSKNPKNPYEESSRDVRS RRPADTEDGMSSCPQPWFVVIKEHQDLKNGGQPVAGEDGQAADGSMQPTSWRQEPQLCGM GTEQGCWIPVSSDKGSCPQVMERSFHMPSYGTQTLEGGVEKPHSLLSANPLWQQRALDPP HQMELTQ Click to Show/Hide
|
|||||
| Function |
EGF stimulates the growth of various epidermal and epithelial tissues in vivo and in vitro and of some fibroblasts in cell culture. Magnesiotropic hormone that stimulates magnesium reabsorption in the renal distal convoluted tubule via engagement of EGFR and activation of the magnesium channel TRPM6. Can induce neurite outgrowth in motoneurons of the pond snail Lymnaea stagnalis in vitro.
Click to Show/Hide
|
|||||
| Uniprot Entry | ||||||
| HGNC ID | ||||||
| KEGG ID | ||||||
Each Antibody-drug Conjuate AND It's Component Related to This Antigen
Full List of The ADC Related to This Antigen
Anti-EGF murine mAb B4G7
| ADC Info | ADC Name | Payload | Target | Linker | Ref |
|---|---|---|---|---|---|
Monoclonal antibody B4G7-gelonin conjugate |
Gelonin |
Ribosome (RB) |
Undisclosed |
[1] |
Tissue/Disease specific Abundances of This Antigen
Tissue specific Abundances of This Antigen
ICD Disease Classification 01
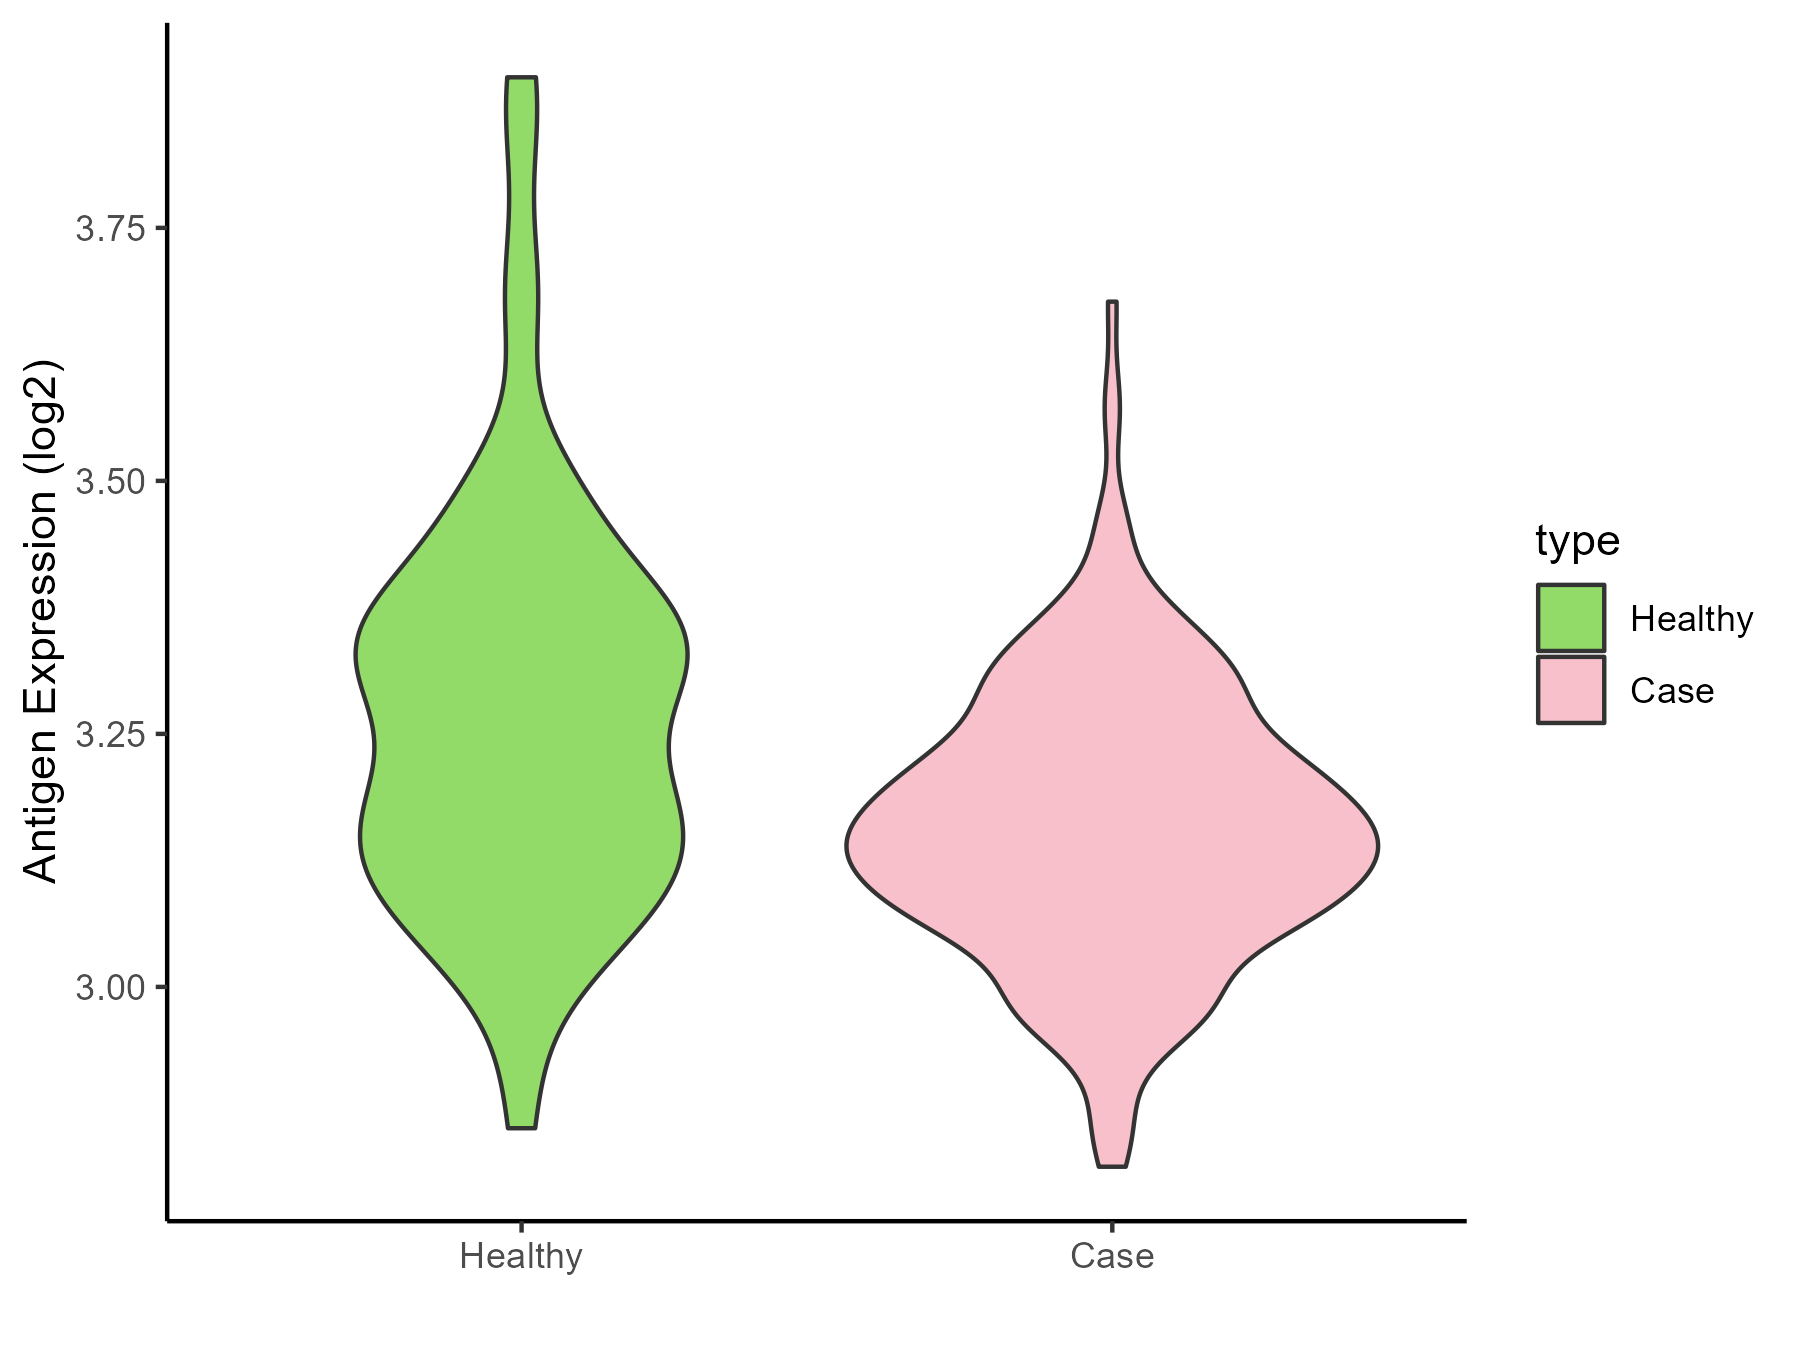
| Differential expression pattern of antigen in diseases | ||
| The Studied Tissue | Gingival | |
| The Specific Disease | Bacterial infection of gingival | |
| The Expression Level of Disease Section Compare with the Healthy Individual Tissue | p-value: 0.000100737; Fold-change: -0.115884456; Z-score: -0.578669588 | |
| Disease-specific Antigen Abundances |
|
Click to View the Clearer Original Diagram |
ICD Disease Classification 02
| Differential expression pattern of antigen in diseases | ||
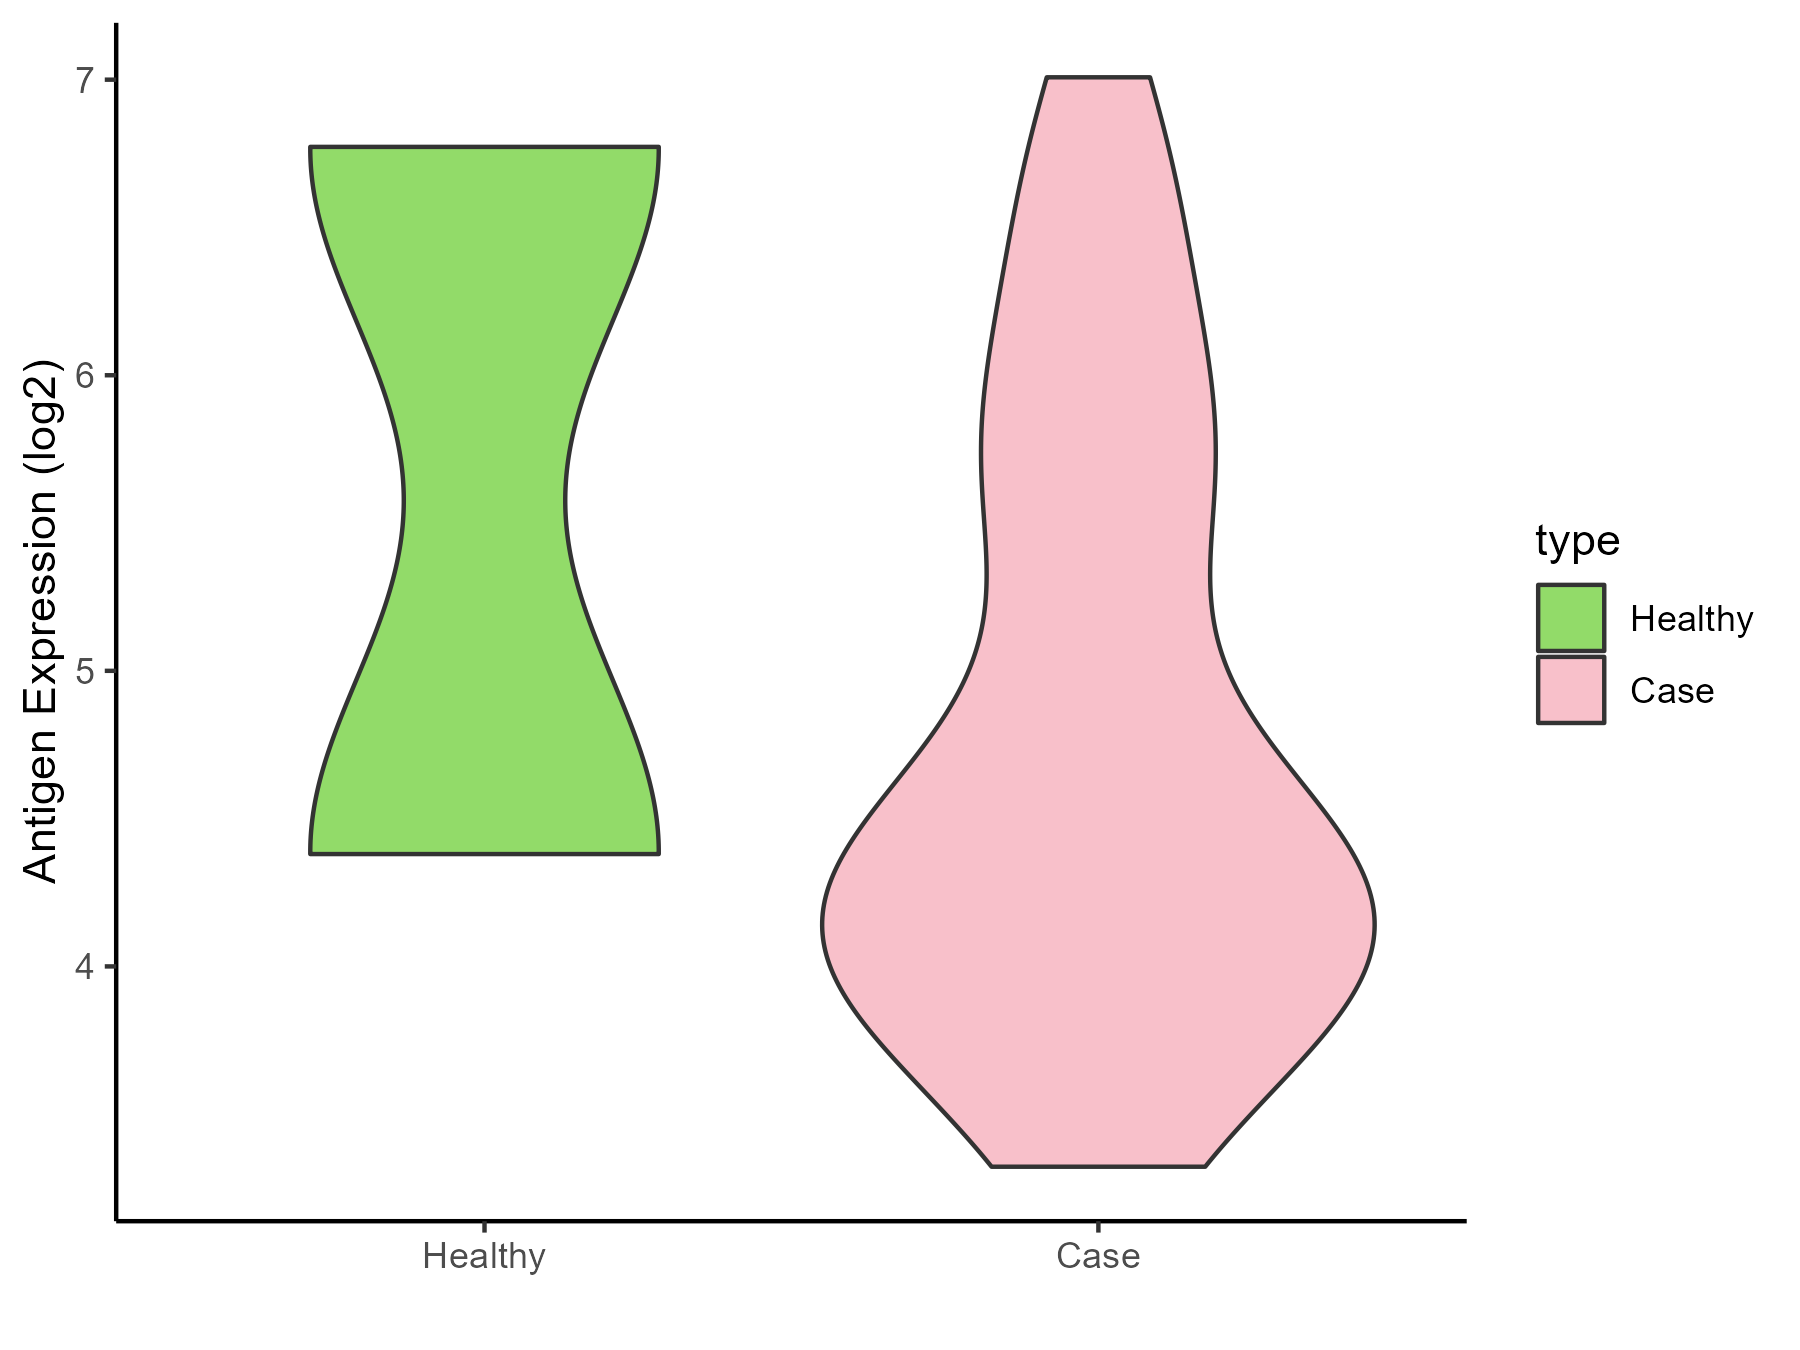
| The Studied Tissue | Brainstem | |
| The Specific Disease | Glioma | |
| The Expression Level of Disease Section Compare with the Healthy Individual Tissue | p-value: 0.623650299; Fold-change: -1.189574677; Z-score: -0.703149097 | |
| Disease-specific Antigen Abundances |
|
Click to View the Clearer Original Diagram |
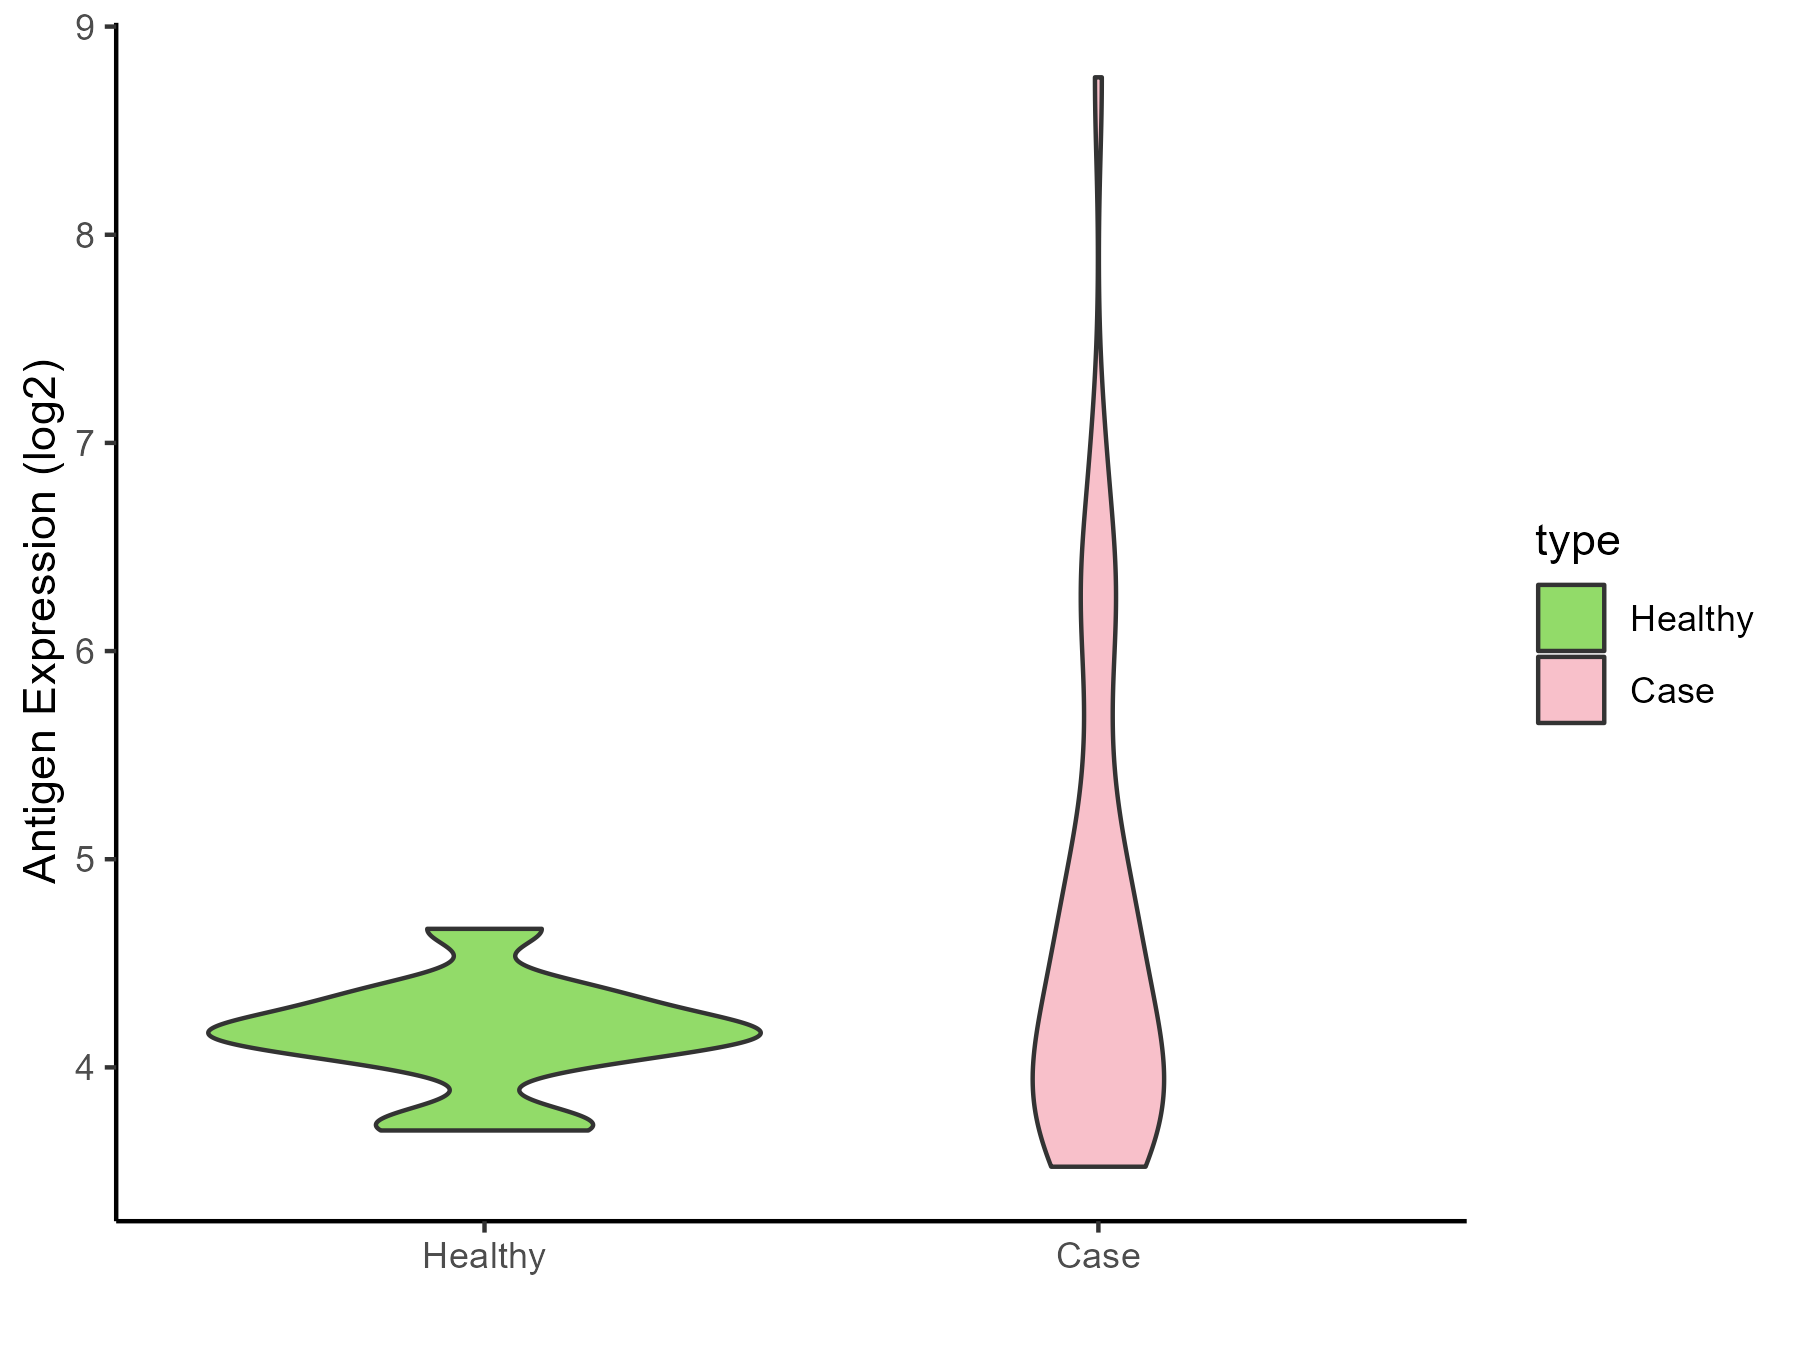
| The Studied Tissue | White matter | |
| The Specific Disease | Glioma | |
| The Expression Level of Disease Section Compare with the Healthy Individual Tissue | p-value: 0.011978001; Fold-change: 0.11398978; Z-score: 0.418694576 | |
| Disease-specific Antigen Abundances |
|
Click to View the Clearer Original Diagram |
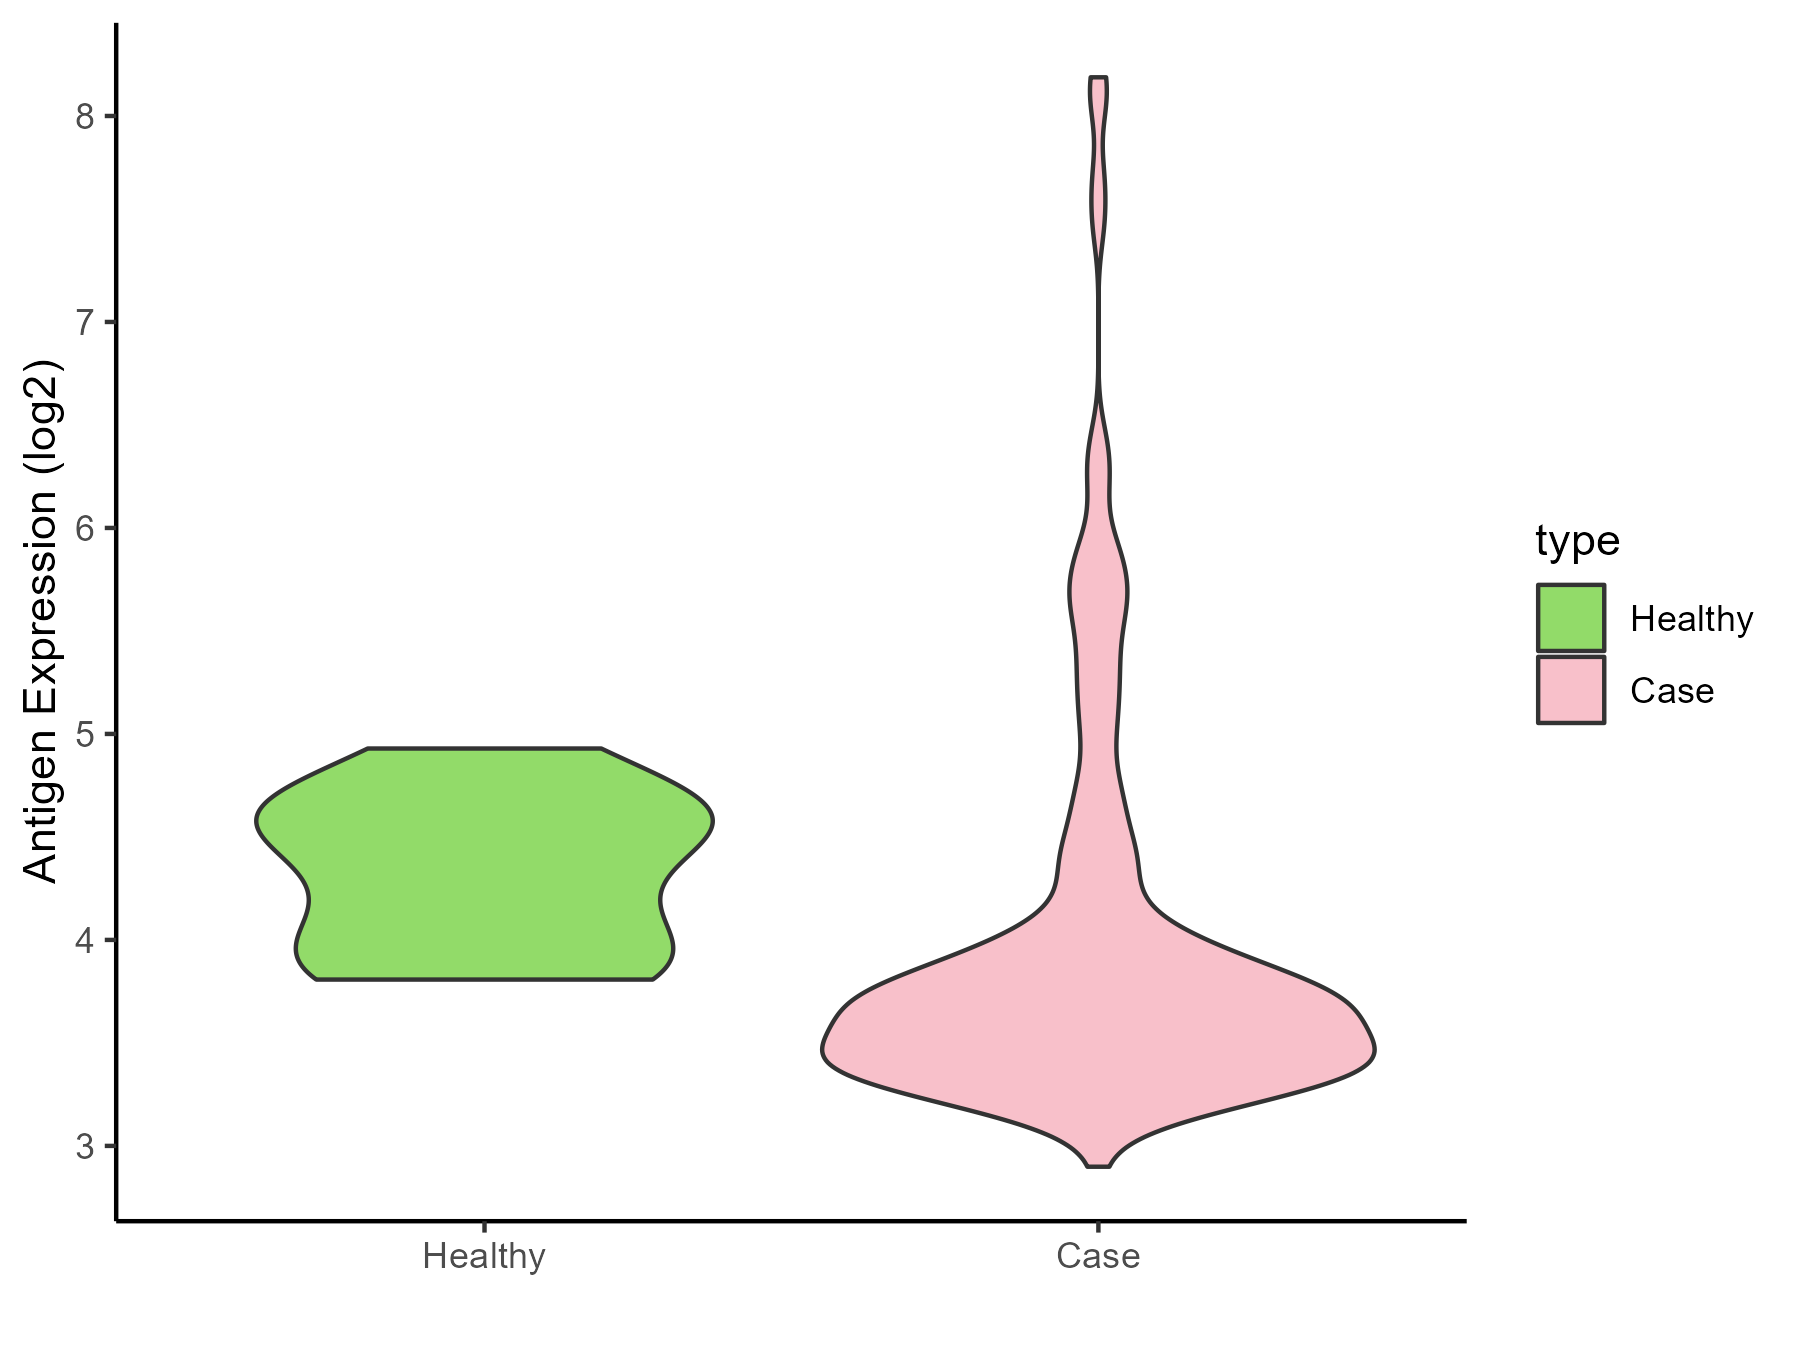
| The Studied Tissue | Brainstem | |
| The Specific Disease | Neuroectodermal tumor | |
| The Expression Level of Disease Section Compare with the Healthy Individual Tissue | p-value: 0.029786955; Fold-change: -0.729834823; Z-score: -1.838407528 | |
| Disease-specific Antigen Abundances |
|
Click to View the Clearer Original Diagram |
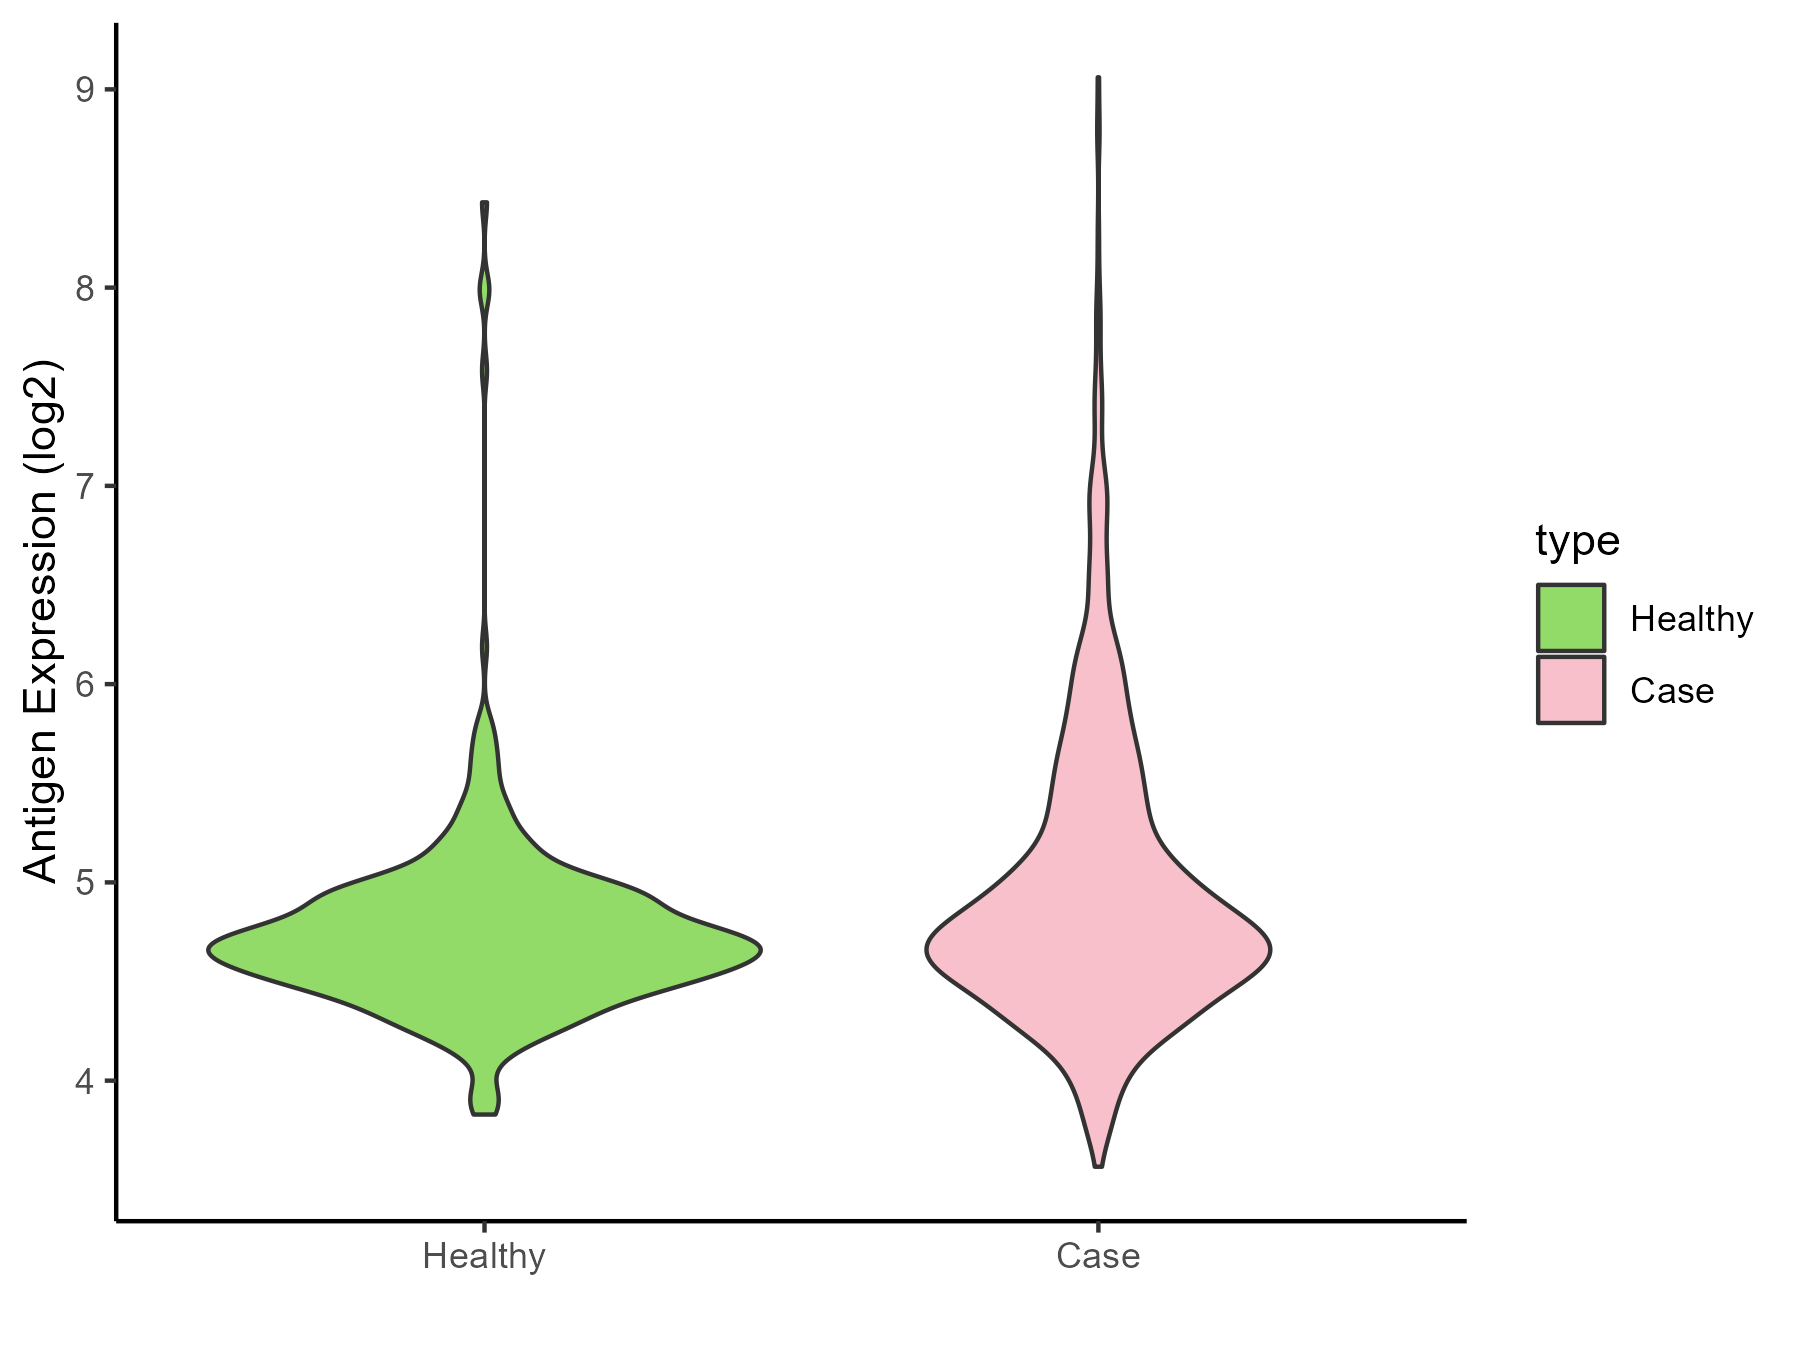
| The Studied Tissue | Nervous | |
| The Specific Disease | Brain cancer | |
| The Expression Level of Disease Section Compare with the Healthy Individual Tissue | p-value: 2.62E-11; Fold-change: 0.077366988; Z-score: 0.164764559 | |
| Disease-specific Antigen Abundances |
|
Click to View the Clearer Original Diagram |
| Differential expression pattern of antigen in diseases | ||
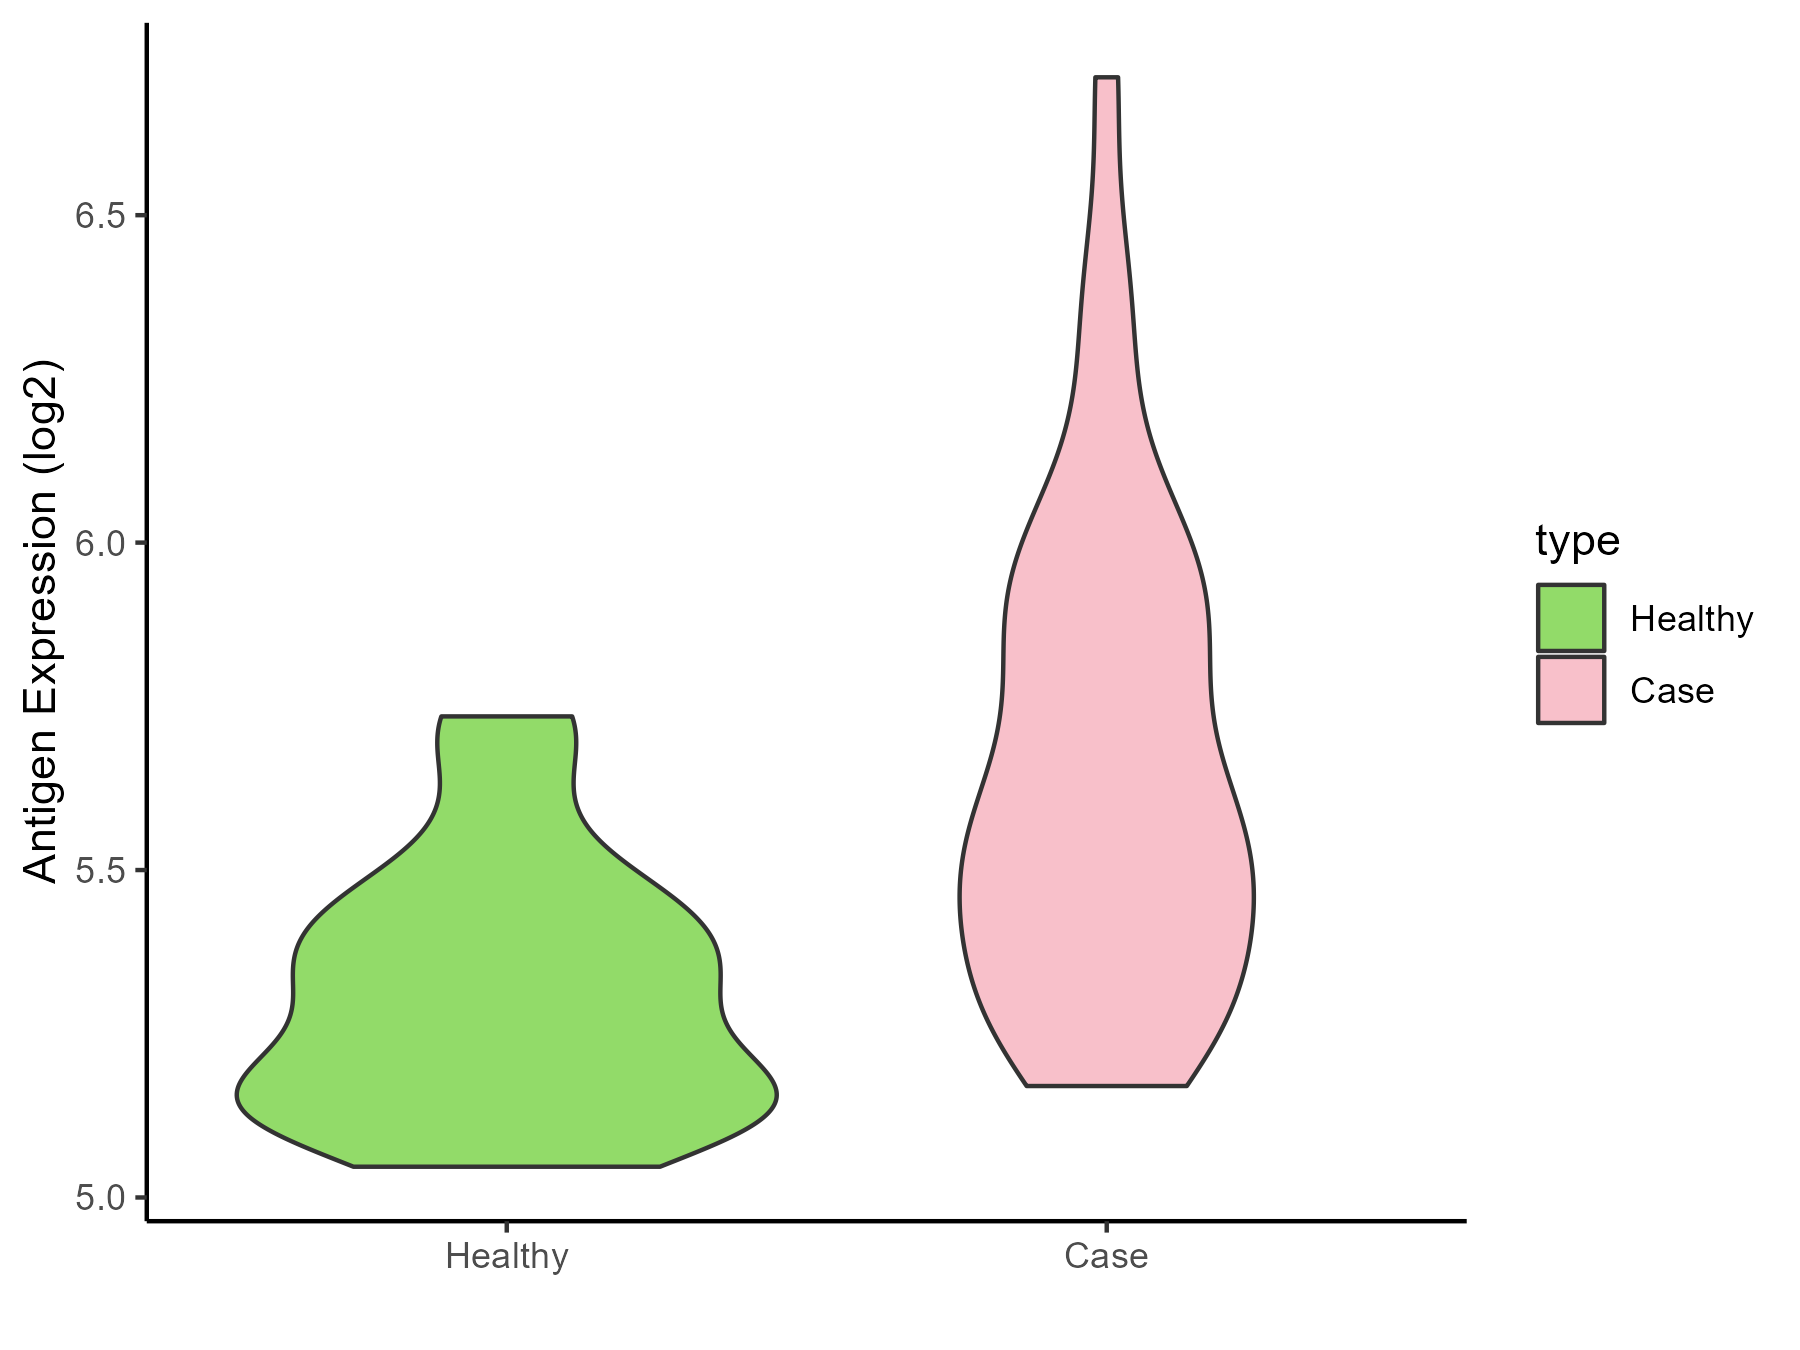
| The Studied Tissue | Whole blood | |
| The Specific Disease | Polycythemia vera | |
| The Expression Level of Disease Section Compare with the Healthy Individual Tissue | p-value: 5.75E-10; Fold-change: 0.262638296; Z-score: 1.34178024 | |
| Disease-specific Antigen Abundances |
|
Click to View the Clearer Original Diagram |
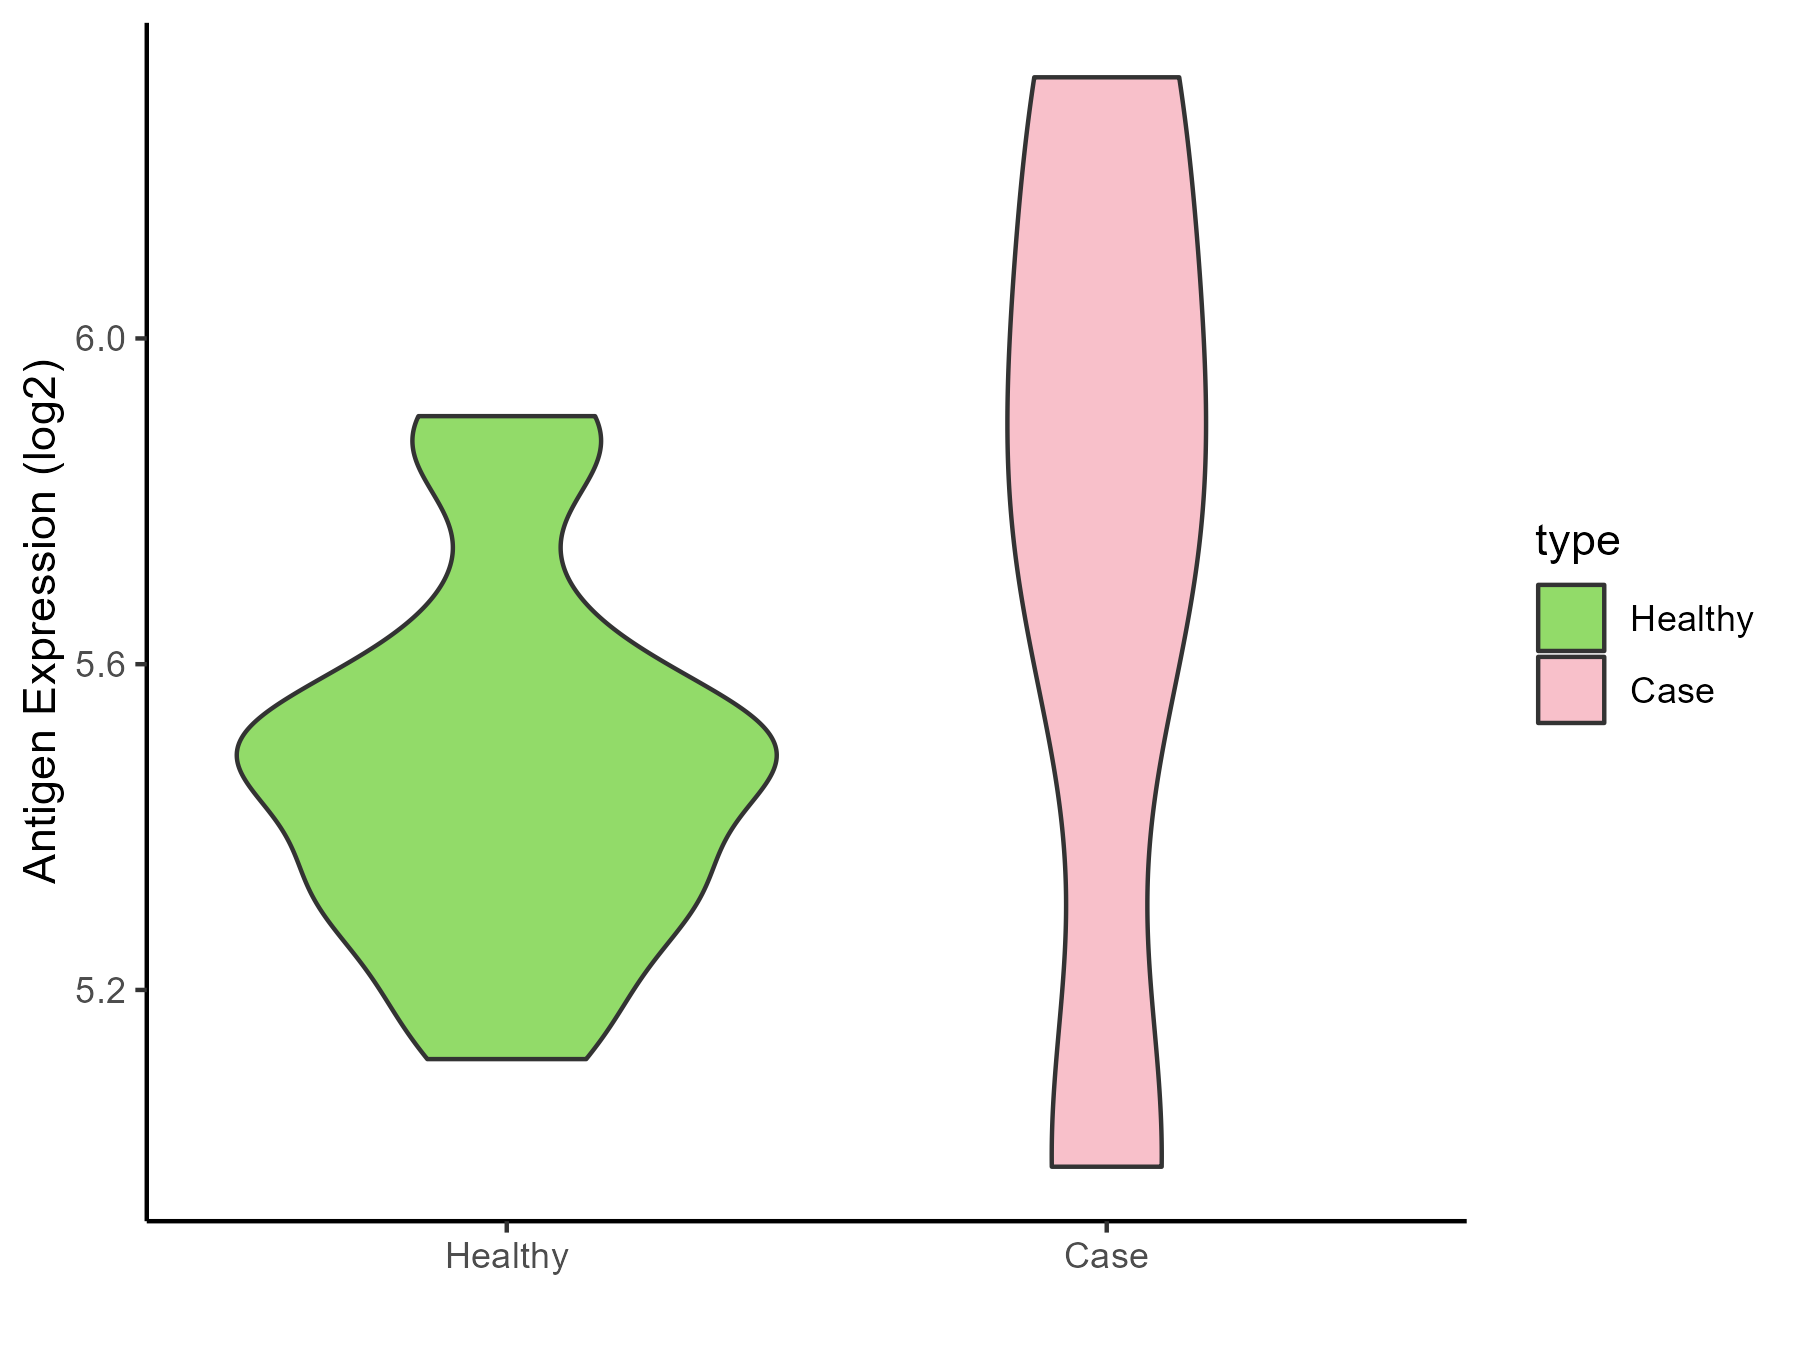
| The Studied Tissue | Whole blood | |
| The Specific Disease | Myelofibrosis | |
| The Expression Level of Disease Section Compare with the Healthy Individual Tissue | p-value: 0.211692036; Fold-change: 0.339236476; Z-score: 1.560971414 | |
| Disease-specific Antigen Abundances |
|
Click to View the Clearer Original Diagram |
| Differential expression pattern of antigen in diseases | ||
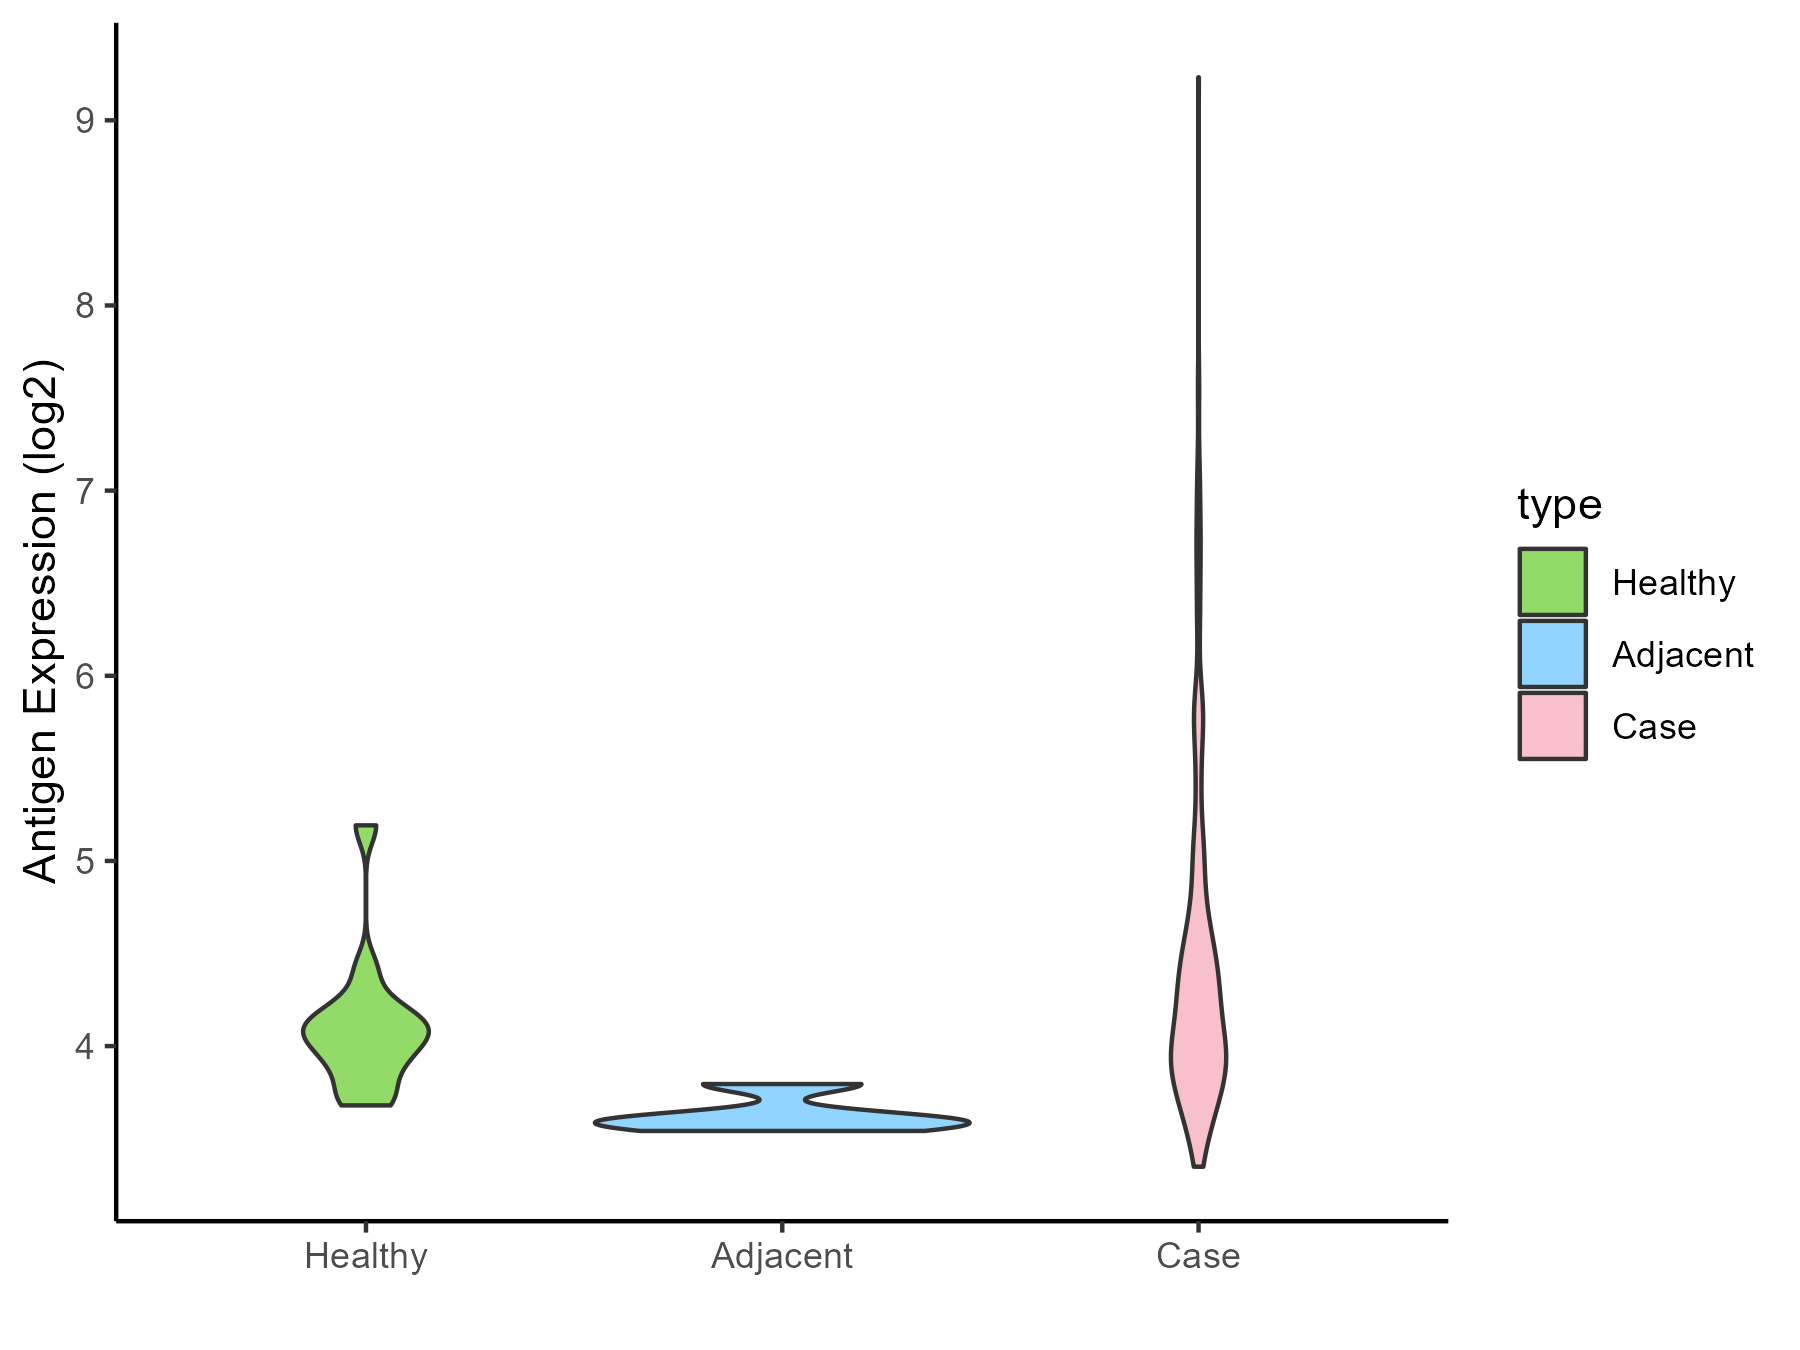
| The Studied Tissue | Bone marrow | |
| The Specific Disease | Myelodysplastic syndromes | |
| The Expression Level of Disease Section Compare with the Healthy Individual Tissue | p-value: 0.000215055; Fold-change: 0.129343006; Z-score: 0.355325137 | |
| The Expression Level of Disease Section Compare with the Adjacent Tissue | p-value: 8.24E-07; Fold-change: 0.601265756; Z-score: 5.425563261 | |
| Disease-specific Antigen Abundances |
|
Click to View the Clearer Original Diagram |
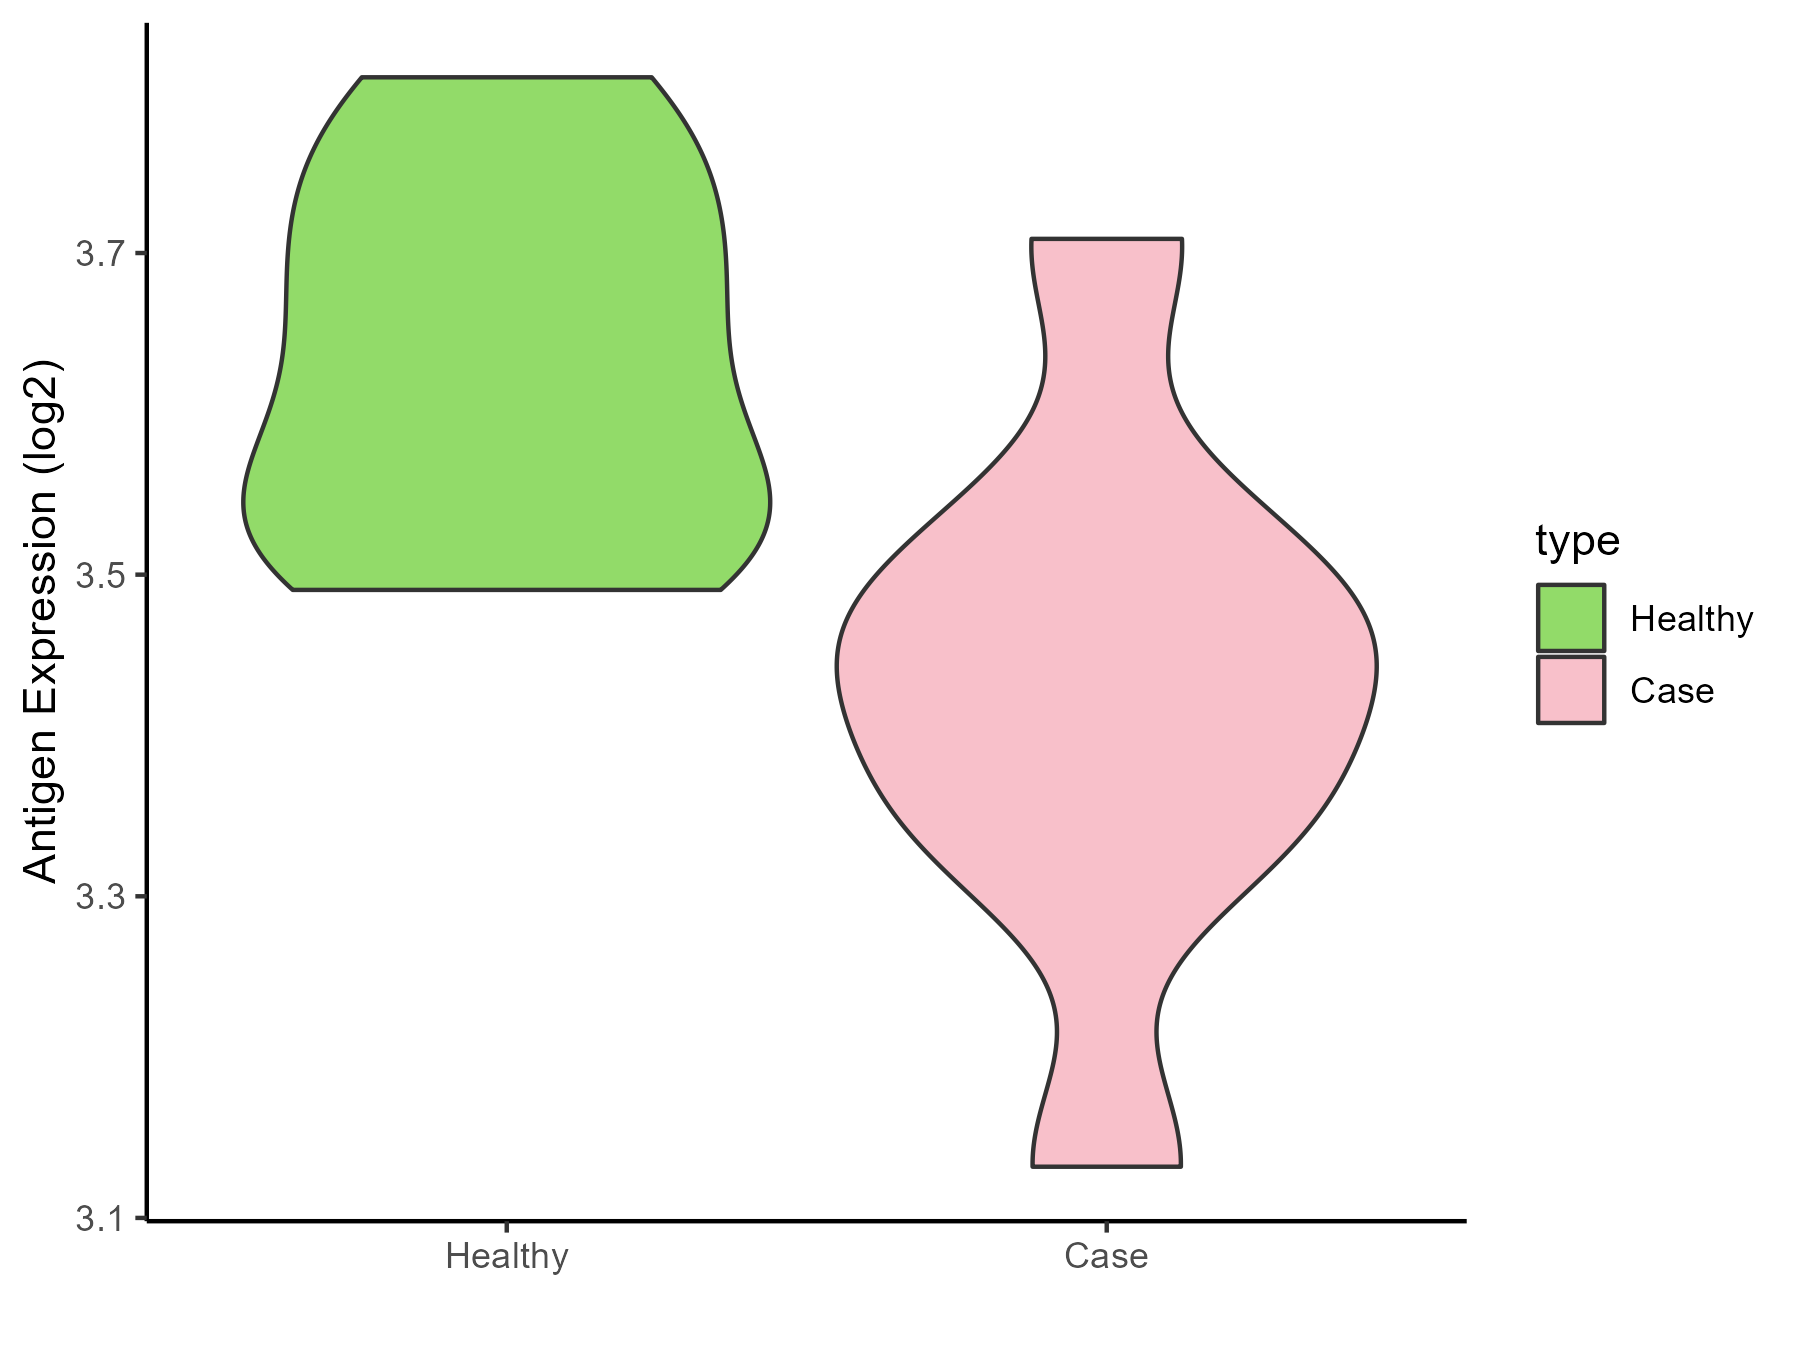
| Differential expression pattern of antigen in diseases | ||
| The Studied Tissue | Tonsil | |
| The Specific Disease | Lymphoma | |
| The Expression Level of Disease Section Compare with the Healthy Individual Tissue | p-value: 0.011548846; Fold-change: -0.188438578; Z-score: -1.656261623 | |
| Disease-specific Antigen Abundances |
|
Click to View the Clearer Original Diagram |
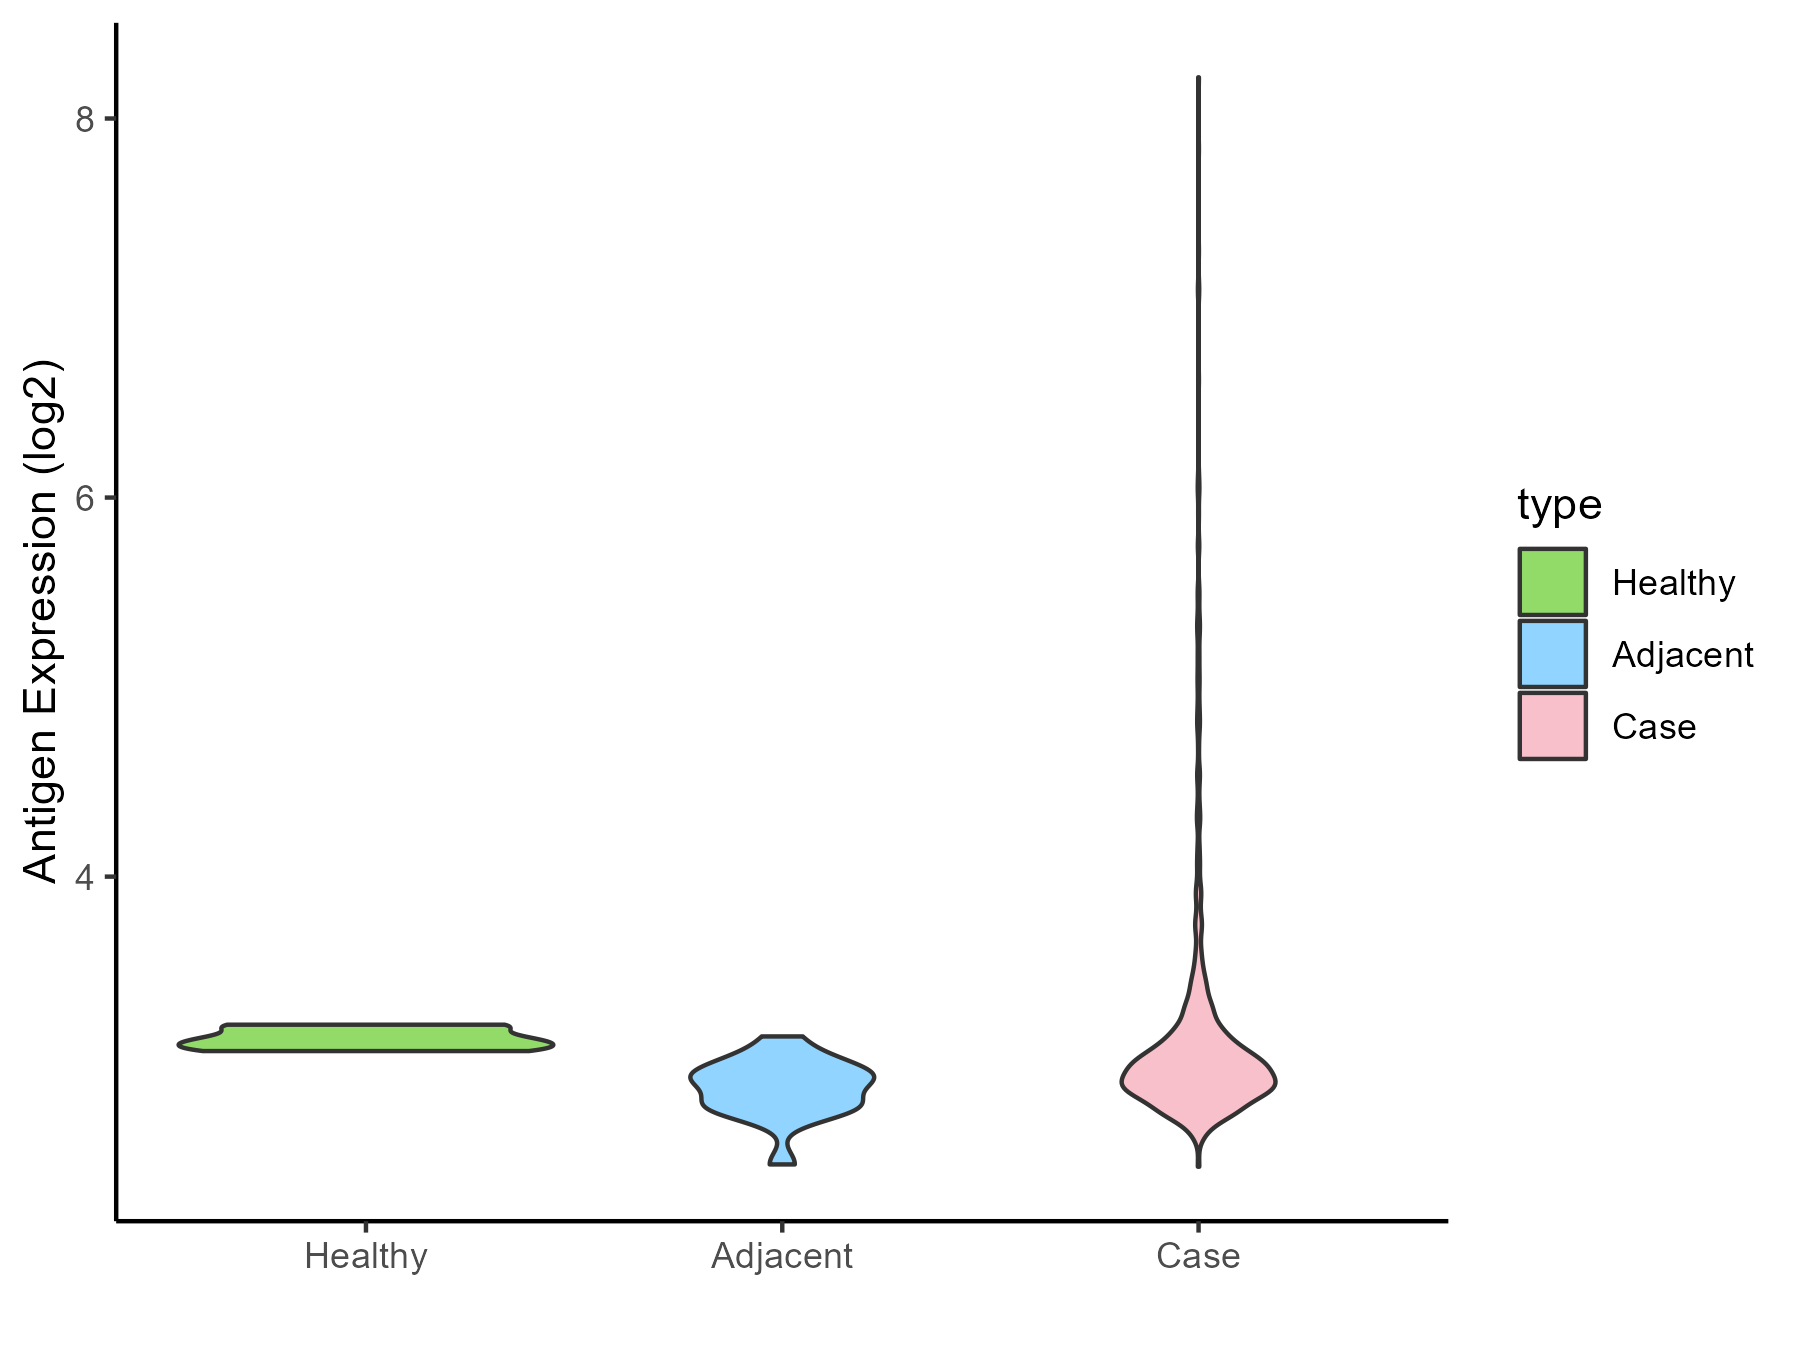
| Differential expression pattern of antigen in diseases | ||
| The Studied Tissue | Gastric | |
| The Specific Disease | Gastric cancer | |
| The Expression Level of Disease Section Compare with the Healthy Individual Tissue | p-value: 0.858925803; Fold-change: -0.157191614; Z-score: -2.251622434 | |
| The Expression Level of Disease Section Compare with the Adjacent Tissue | p-value: 3.09E-06; Fold-change: 0.071156134; Z-score: 0.456705956 | |
| Disease-specific Antigen Abundances |
|
Click to View the Clearer Original Diagram |
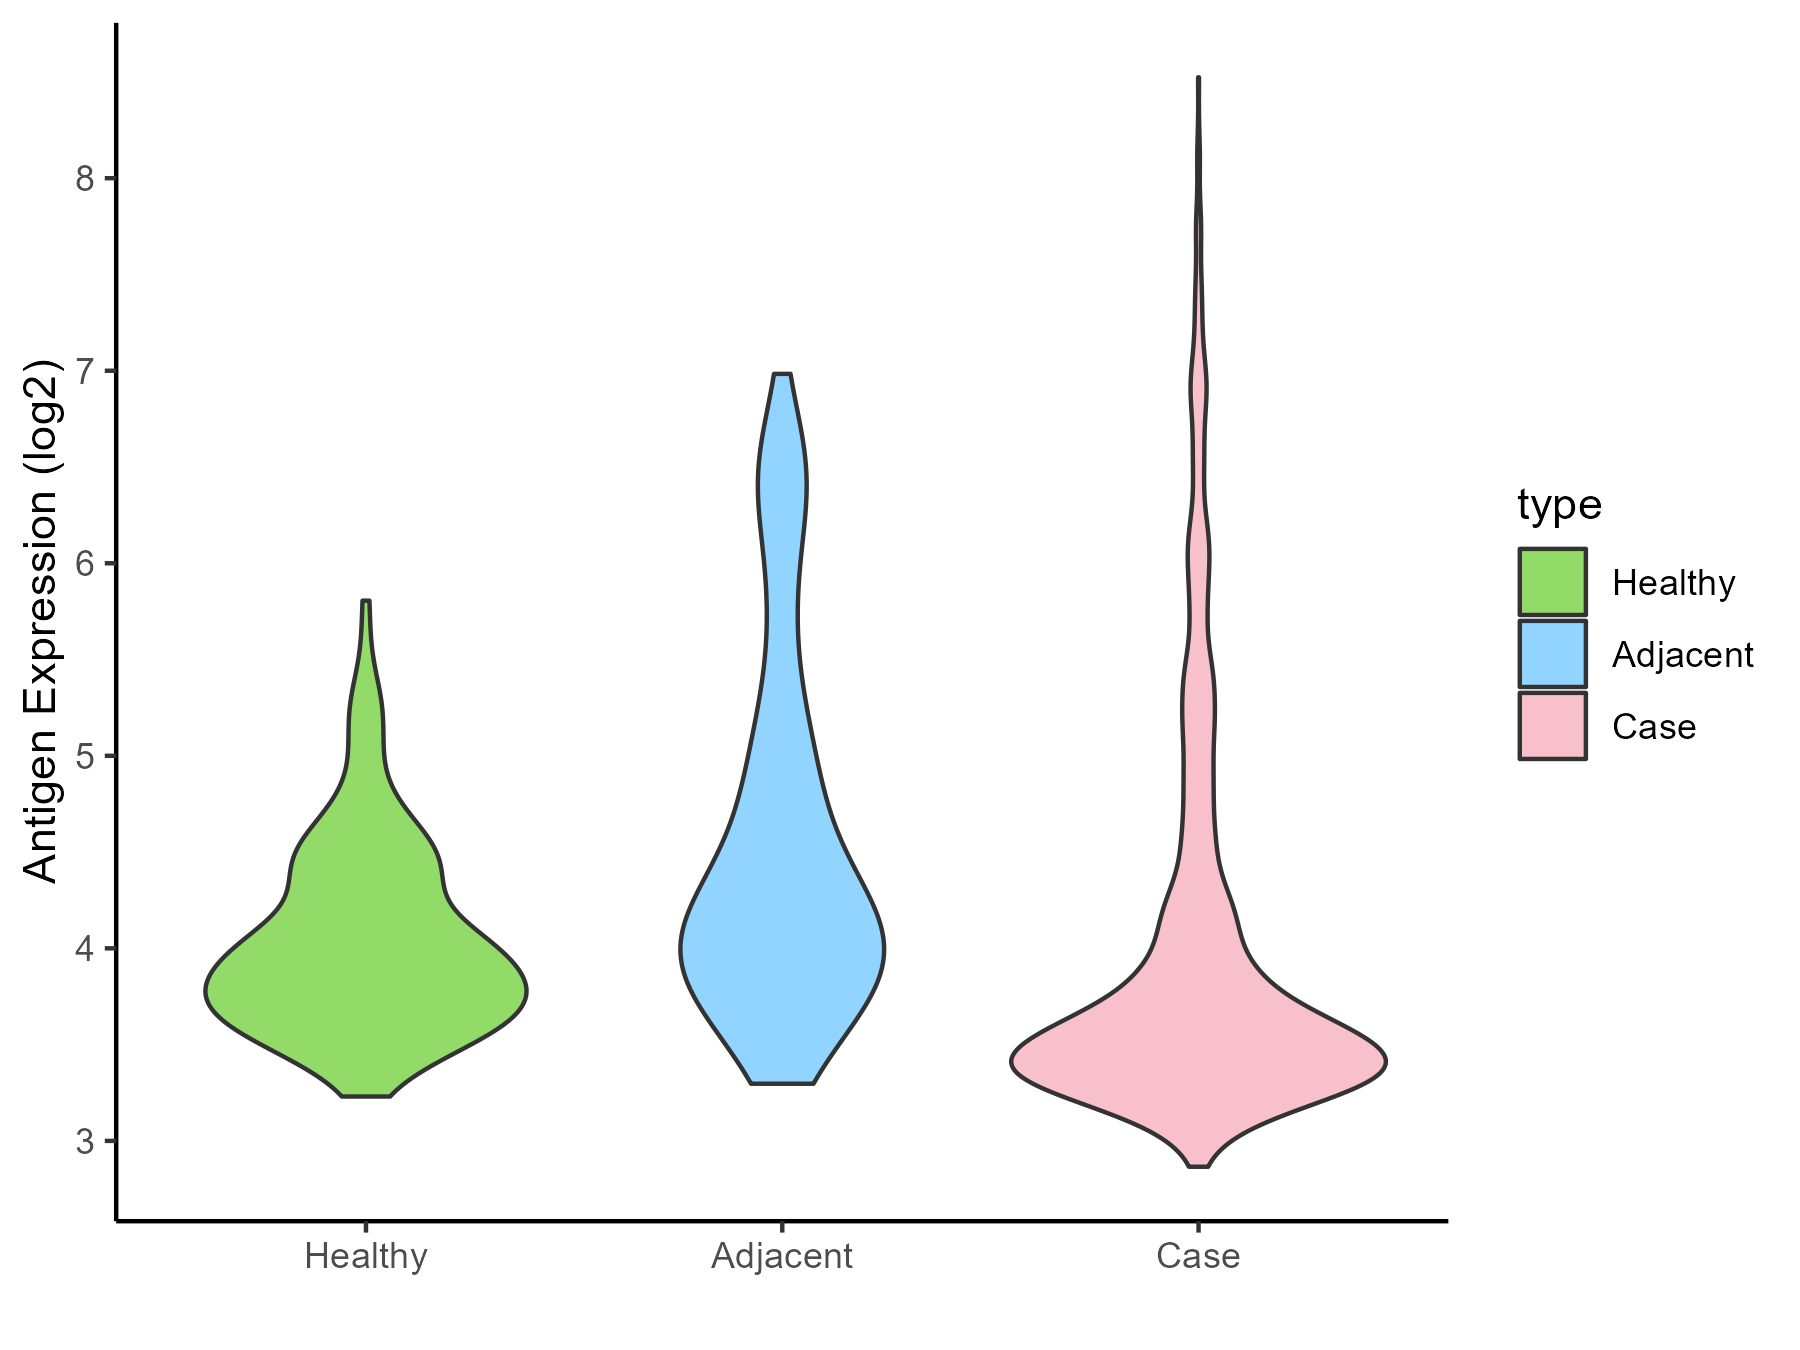
| Differential expression pattern of antigen in diseases | ||
| The Studied Tissue | Colon | |
| The Specific Disease | Colon cancer | |
| The Expression Level of Disease Section Compare with the Healthy Individual Tissue | p-value: 0.134929247; Fold-change: -0.368236224; Z-score: -0.752317691 | |
| The Expression Level of Disease Section Compare with the Adjacent Tissue | p-value: 2.17E-09; Fold-change: -0.616348549; Z-score: -0.659837008 | |
| Disease-specific Antigen Abundances |
|
Click to View the Clearer Original Diagram |
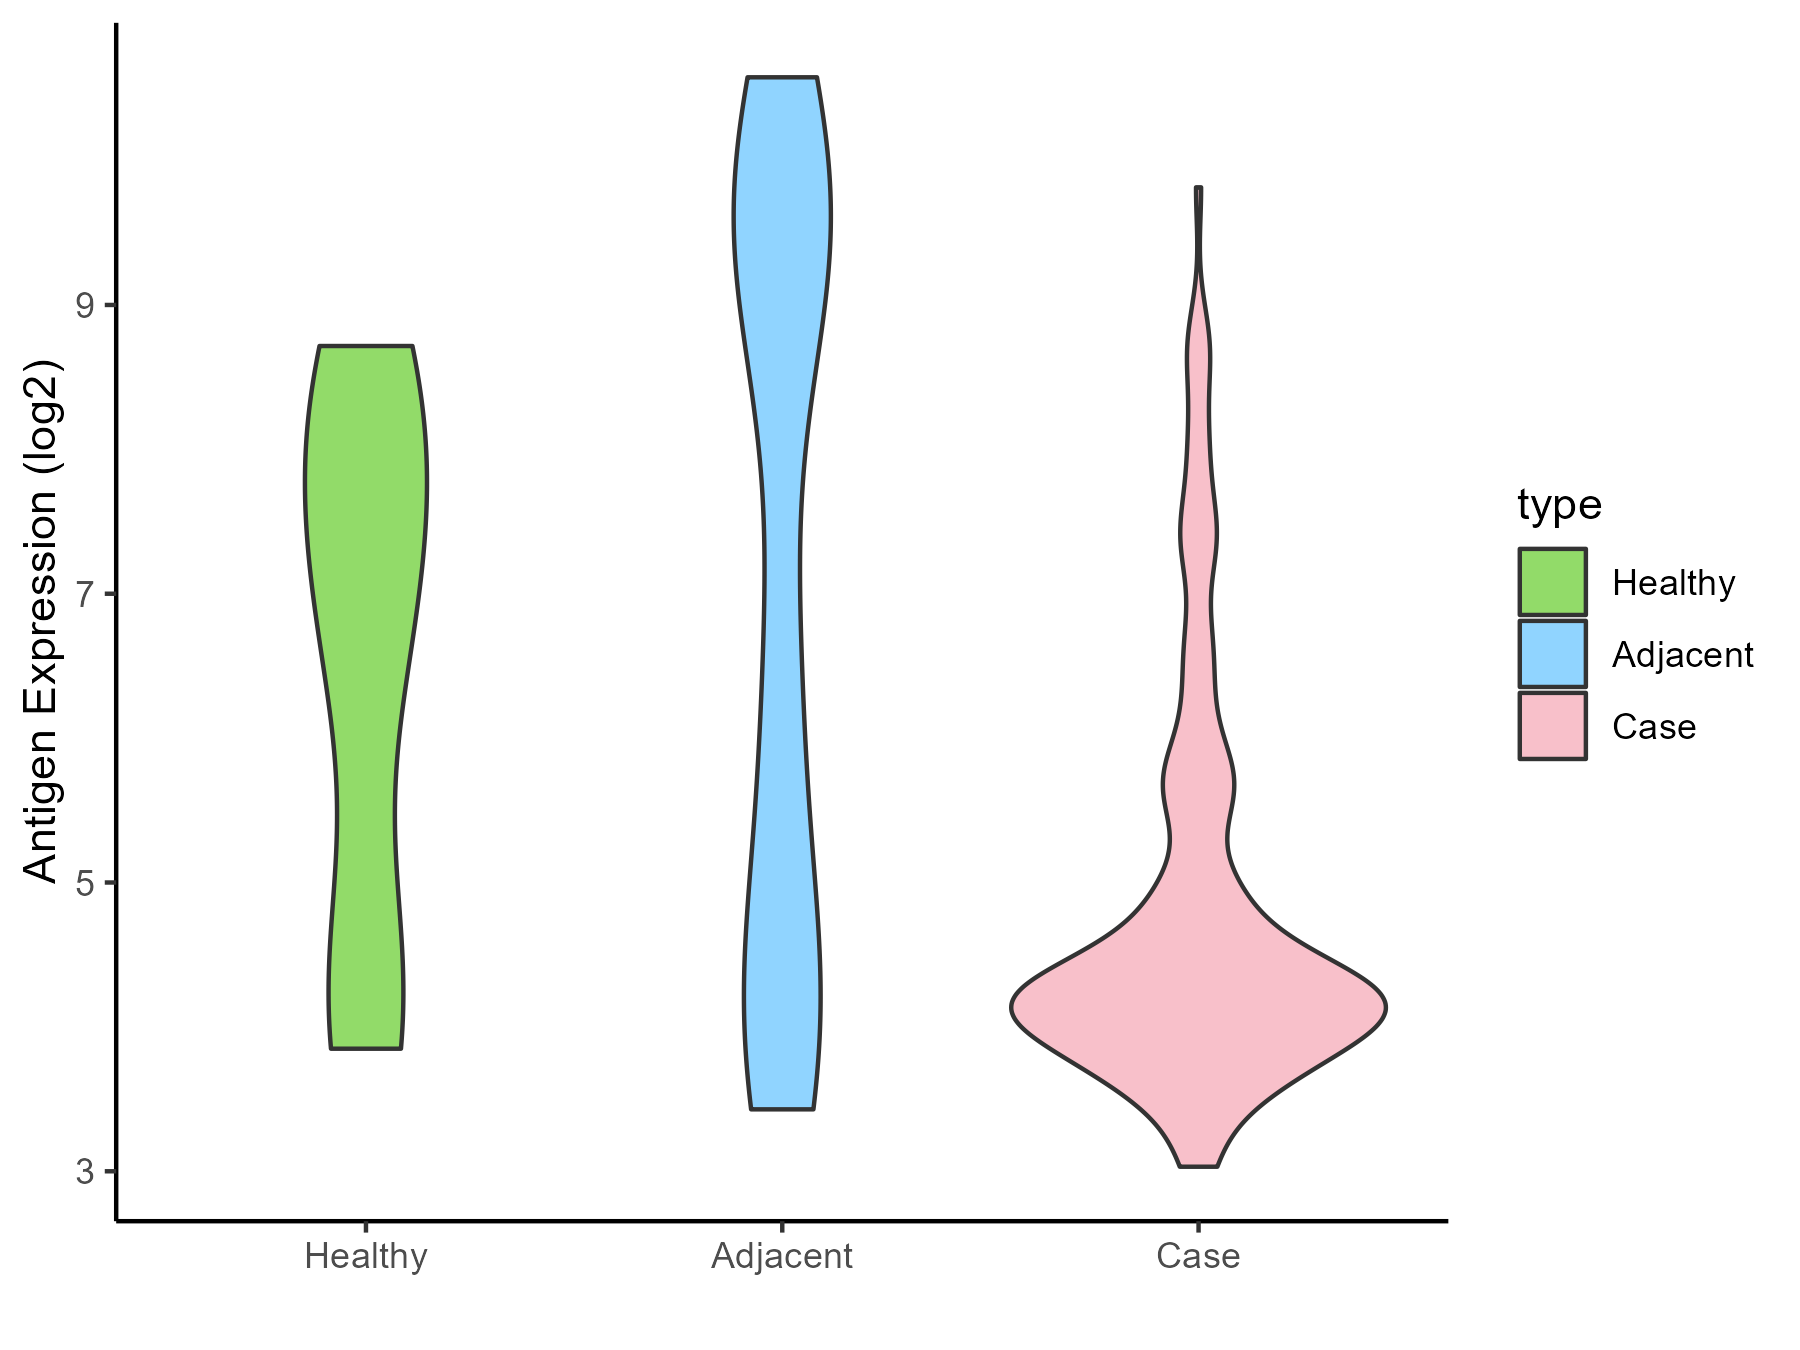
| Differential expression pattern of antigen in diseases | ||
| The Studied Tissue | Pancreas | |
| The Specific Disease | Pancreatic cancer | |
| The Expression Level of Disease Section Compare with the Healthy Individual Tissue | p-value: 0.001331783; Fold-change: -2.735088503; Z-score: -1.511395239 | |
| The Expression Level of Disease Section Compare with the Adjacent Tissue | p-value: 6.66E-09; Fold-change: -3.034580002; Z-score: -1.165822294 | |
| Disease-specific Antigen Abundances |
|
Click to View the Clearer Original Diagram |
| Differential expression pattern of antigen in diseases | ||
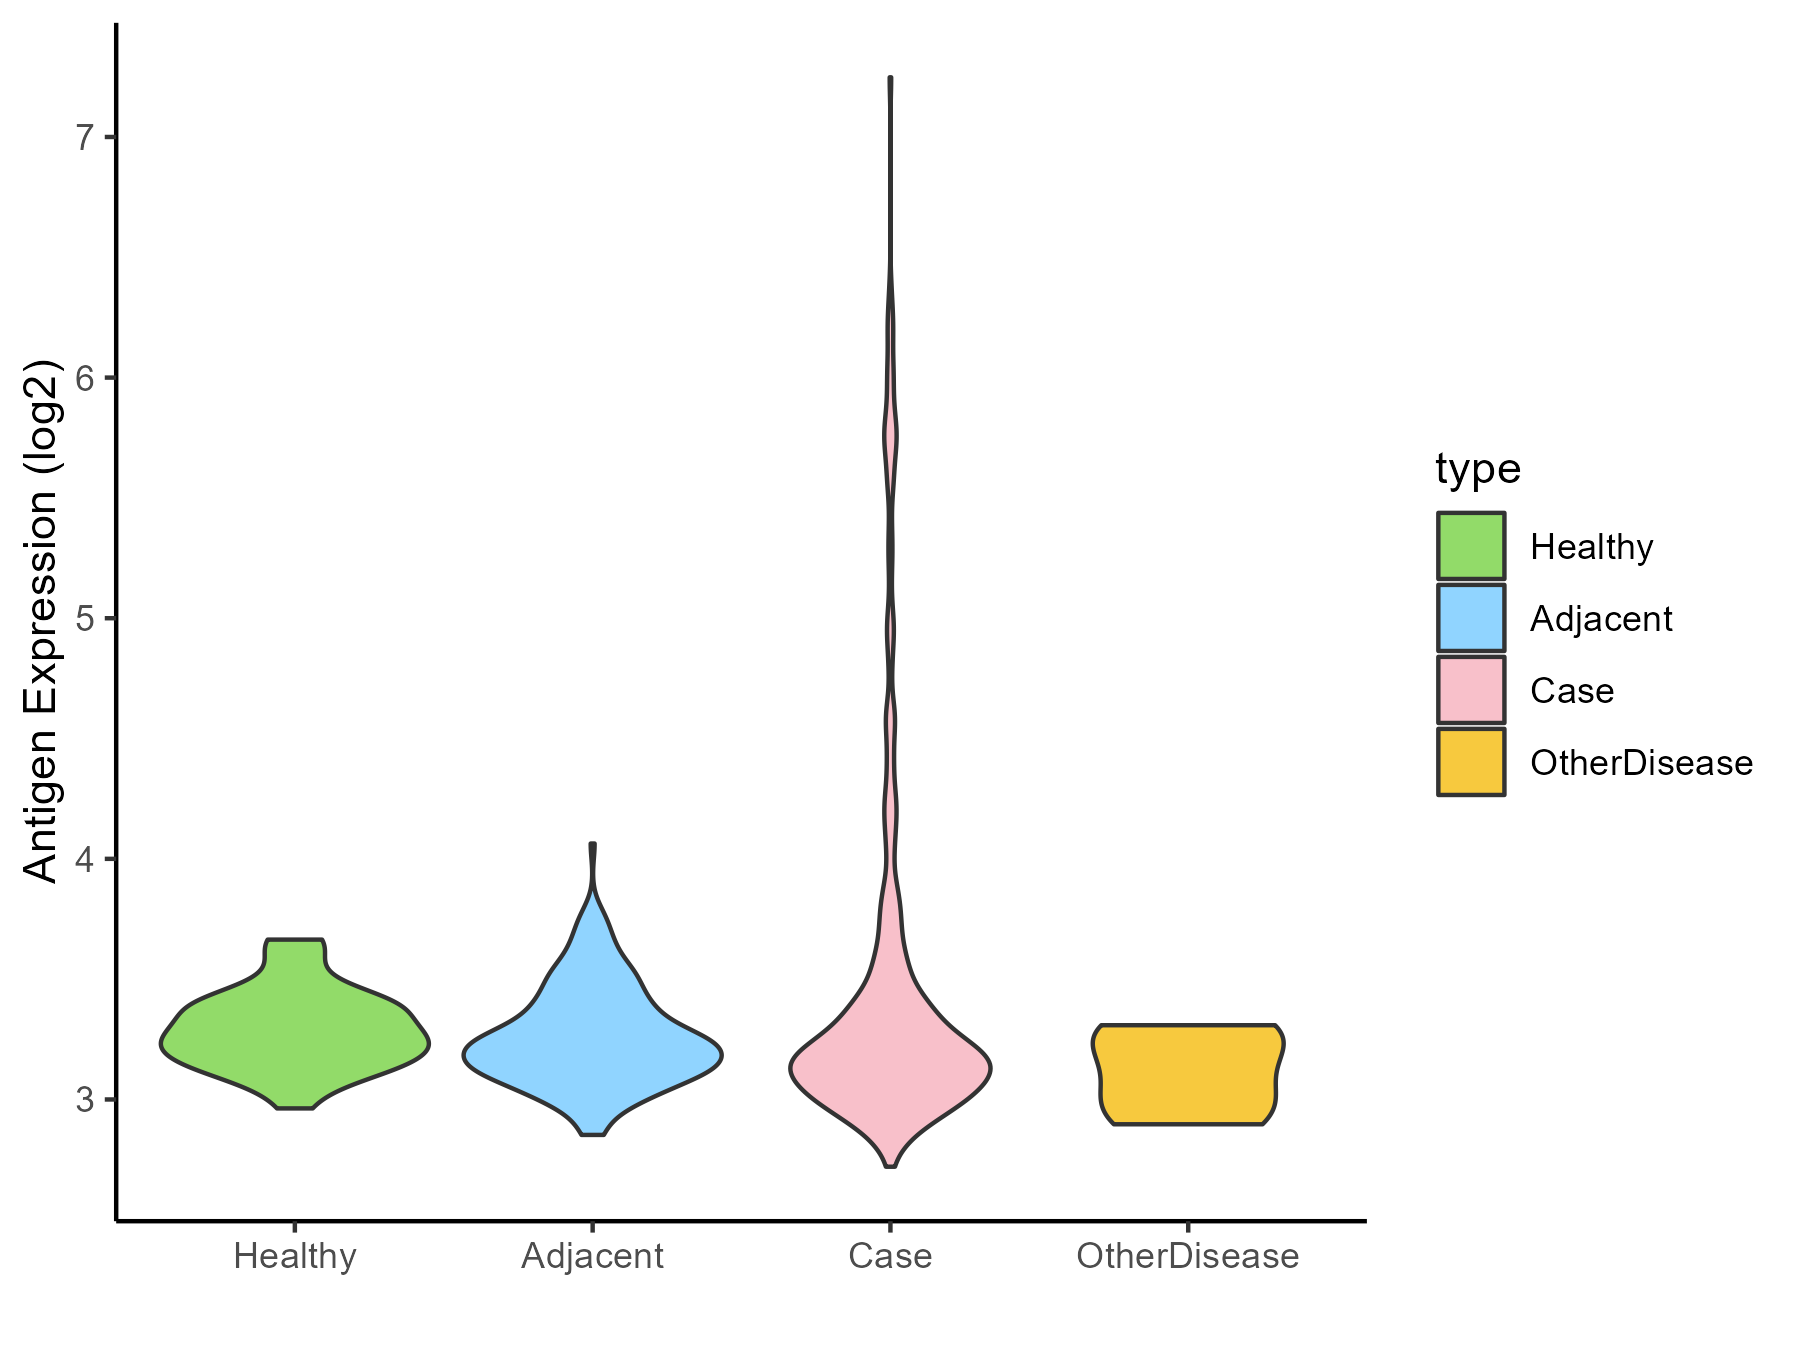
| The Studied Tissue | Liver | |
| The Specific Disease | Liver cancer | |
| The Expression Level of Disease Section Compare with the Healthy Individual Tissue | p-value: 0.000104421; Fold-change: -0.078603467; Z-score: -0.477226911 | |
| The Expression Level of Disease Section Compare with the Adjacent Tissue | p-value: 2.80E-07; Fold-change: -0.035085303; Z-score: -0.170662566 | |
| The Expression Level of Disease Section Compare with the Other Disease Section | p-value: 0.024092209; Fold-change: 0.063957866; Z-score: 0.336115378 | |
| Disease-specific Antigen Abundances |
|
Click to View the Clearer Original Diagram |
| Differential expression pattern of antigen in diseases | ||
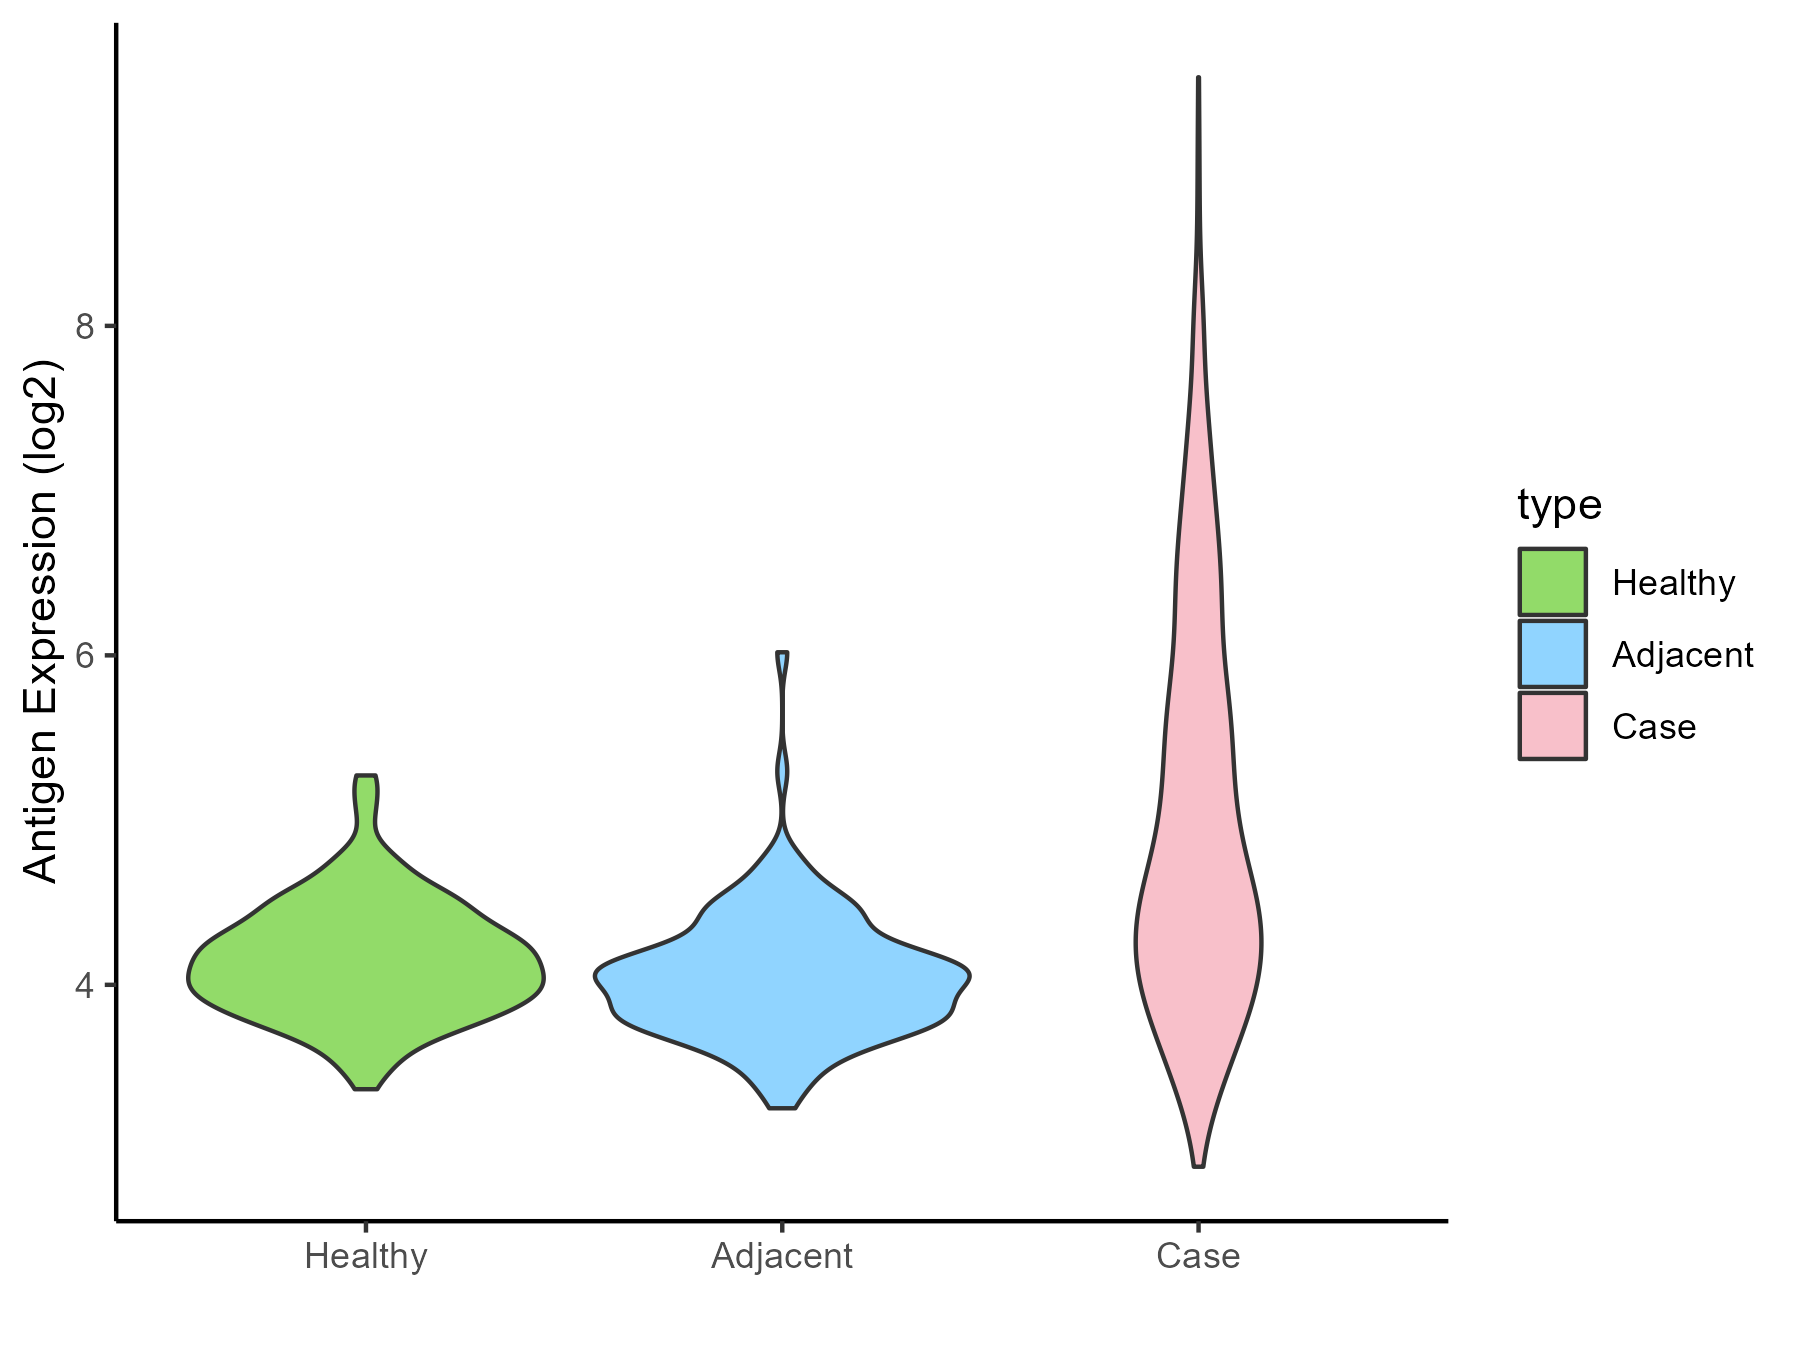
| The Studied Tissue | Lung | |
| The Specific Disease | Lung cancer | |
| The Expression Level of Disease Section Compare with the Healthy Individual Tissue | p-value: 1.02E-71; Fold-change: 0.587374327; Z-score: 1.698441145 | |
| The Expression Level of Disease Section Compare with the Adjacent Tissue | p-value: 2.11E-59; Fold-change: 0.671714568; Z-score: 1.750983784 | |
| Disease-specific Antigen Abundances |
|
Click to View the Clearer Original Diagram |
| Differential expression pattern of antigen in diseases | ||
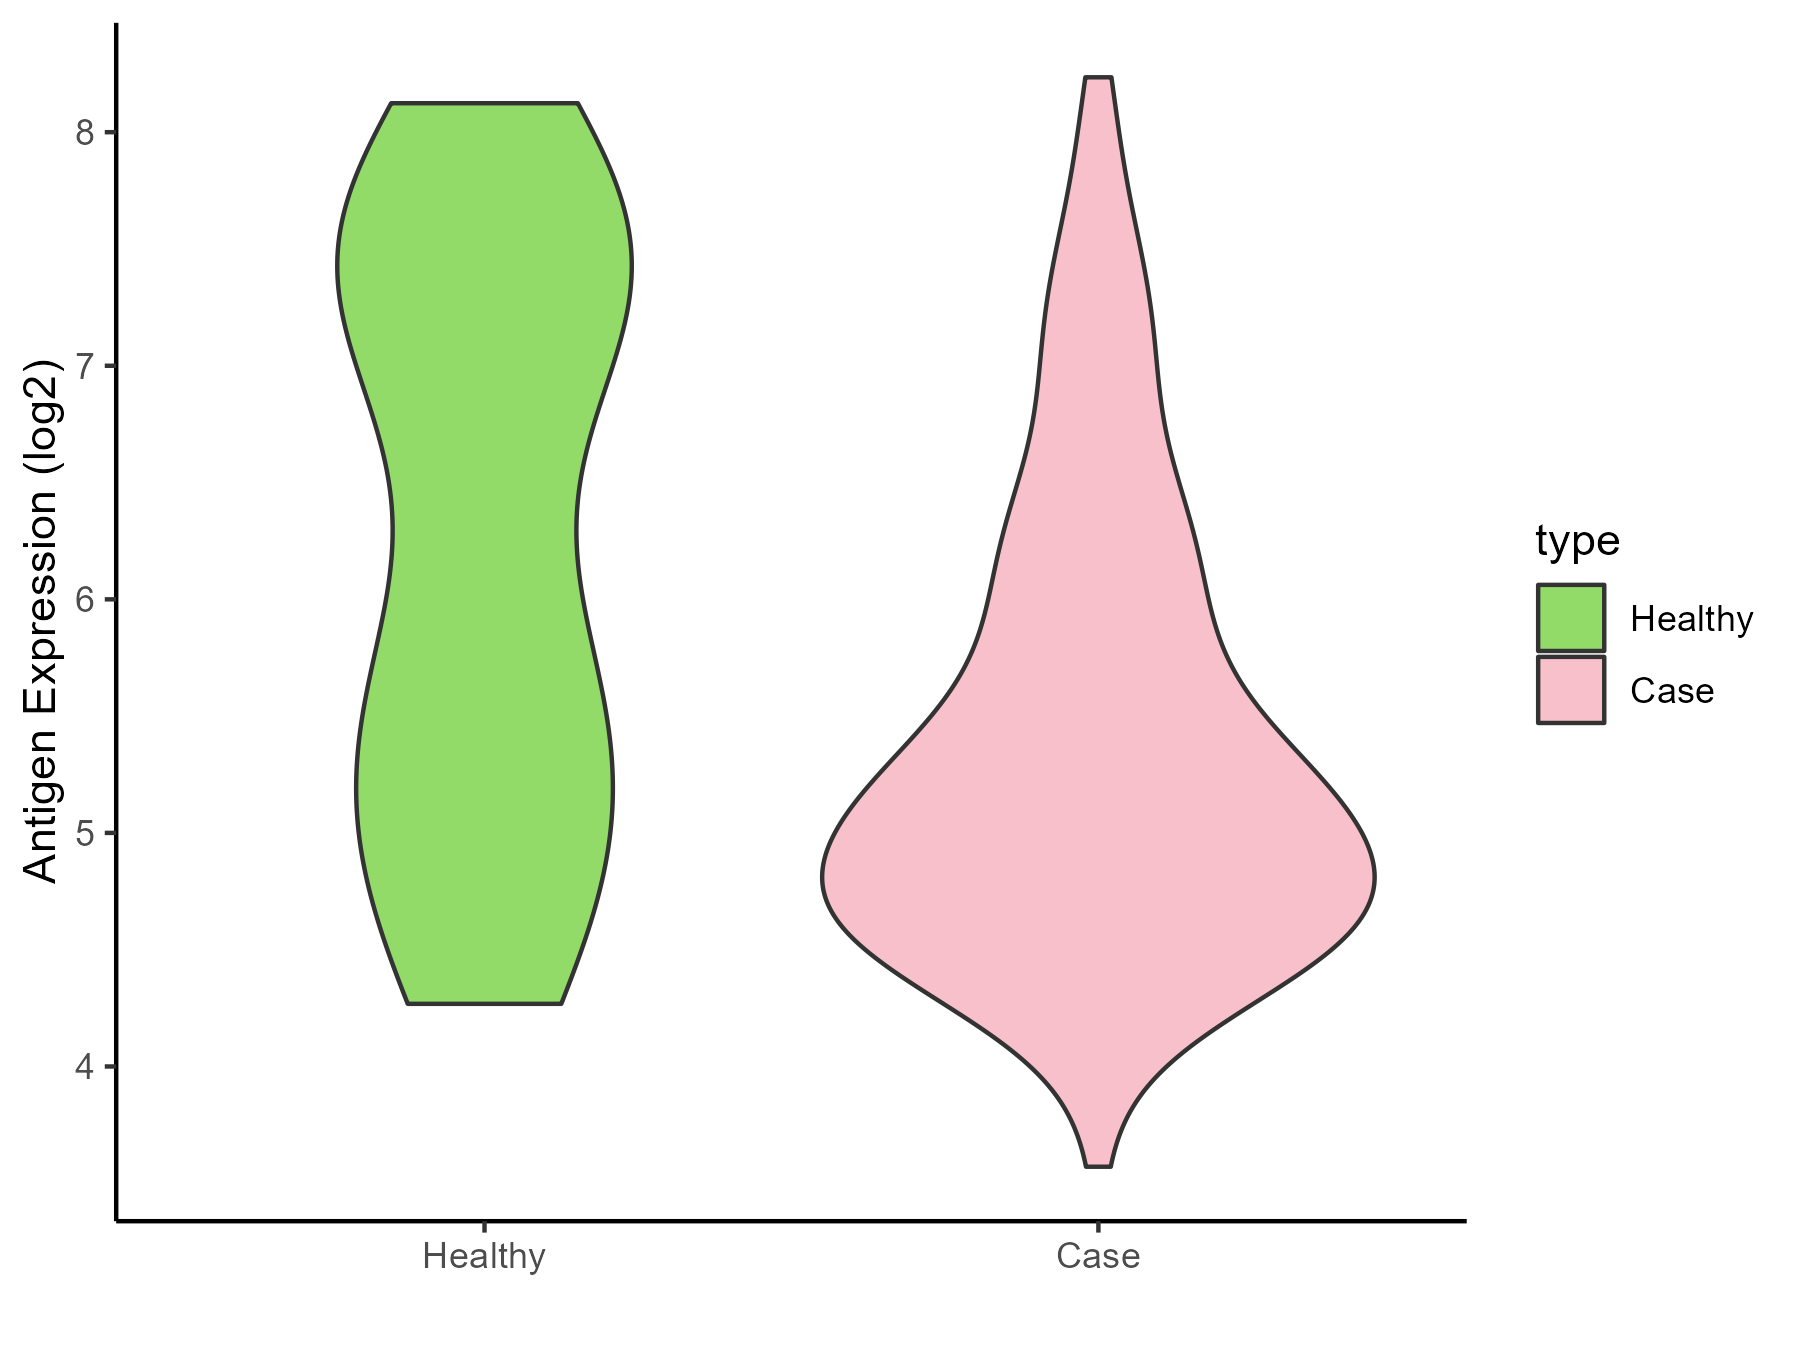
| The Studied Tissue | Skin | |
| The Specific Disease | Melanoma | |
| The Expression Level of Disease Section Compare with the Healthy Individual Tissue | p-value: 0.003712774; Fold-change: -1.075996193; Z-score: -0.849624214 | |
| Disease-specific Antigen Abundances |
|
Click to View the Clearer Original Diagram |
| Differential expression pattern of antigen in diseases | ||
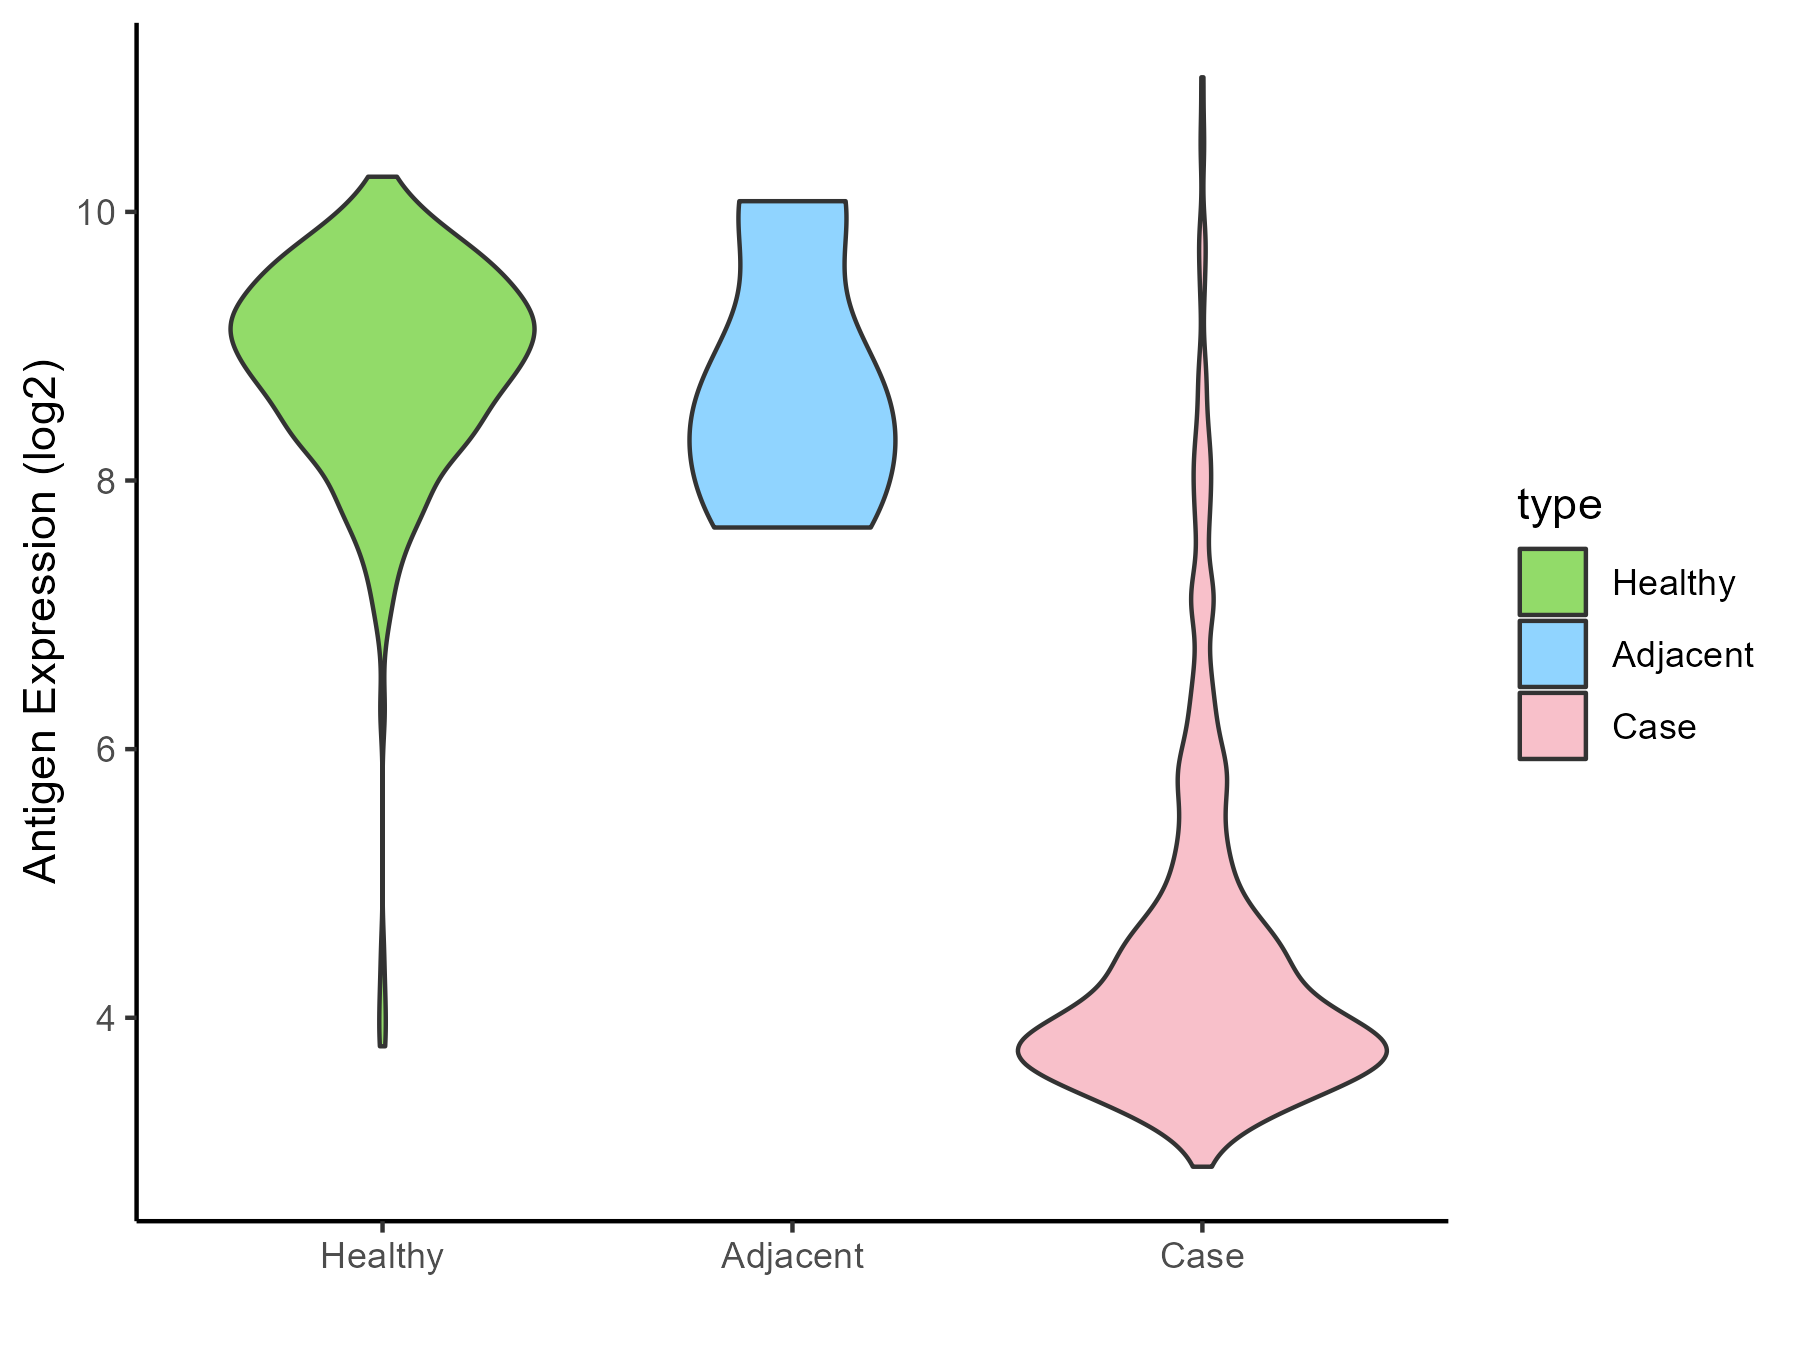
| The Studied Tissue | Muscle | |
| The Specific Disease | Sarcoma | |
| The Expression Level of Disease Section Compare with the Healthy Individual Tissue | p-value: 0; Fold-change: -4.957791968; Z-score: -5.878346798 | |
| The Expression Level of Disease Section Compare with the Adjacent Tissue | p-value: 0.003578879; Fold-change: -4.555865358; Z-score: -4.409585073 | |
| Disease-specific Antigen Abundances |
|
Click to View the Clearer Original Diagram |
| Differential expression pattern of antigen in diseases | ||
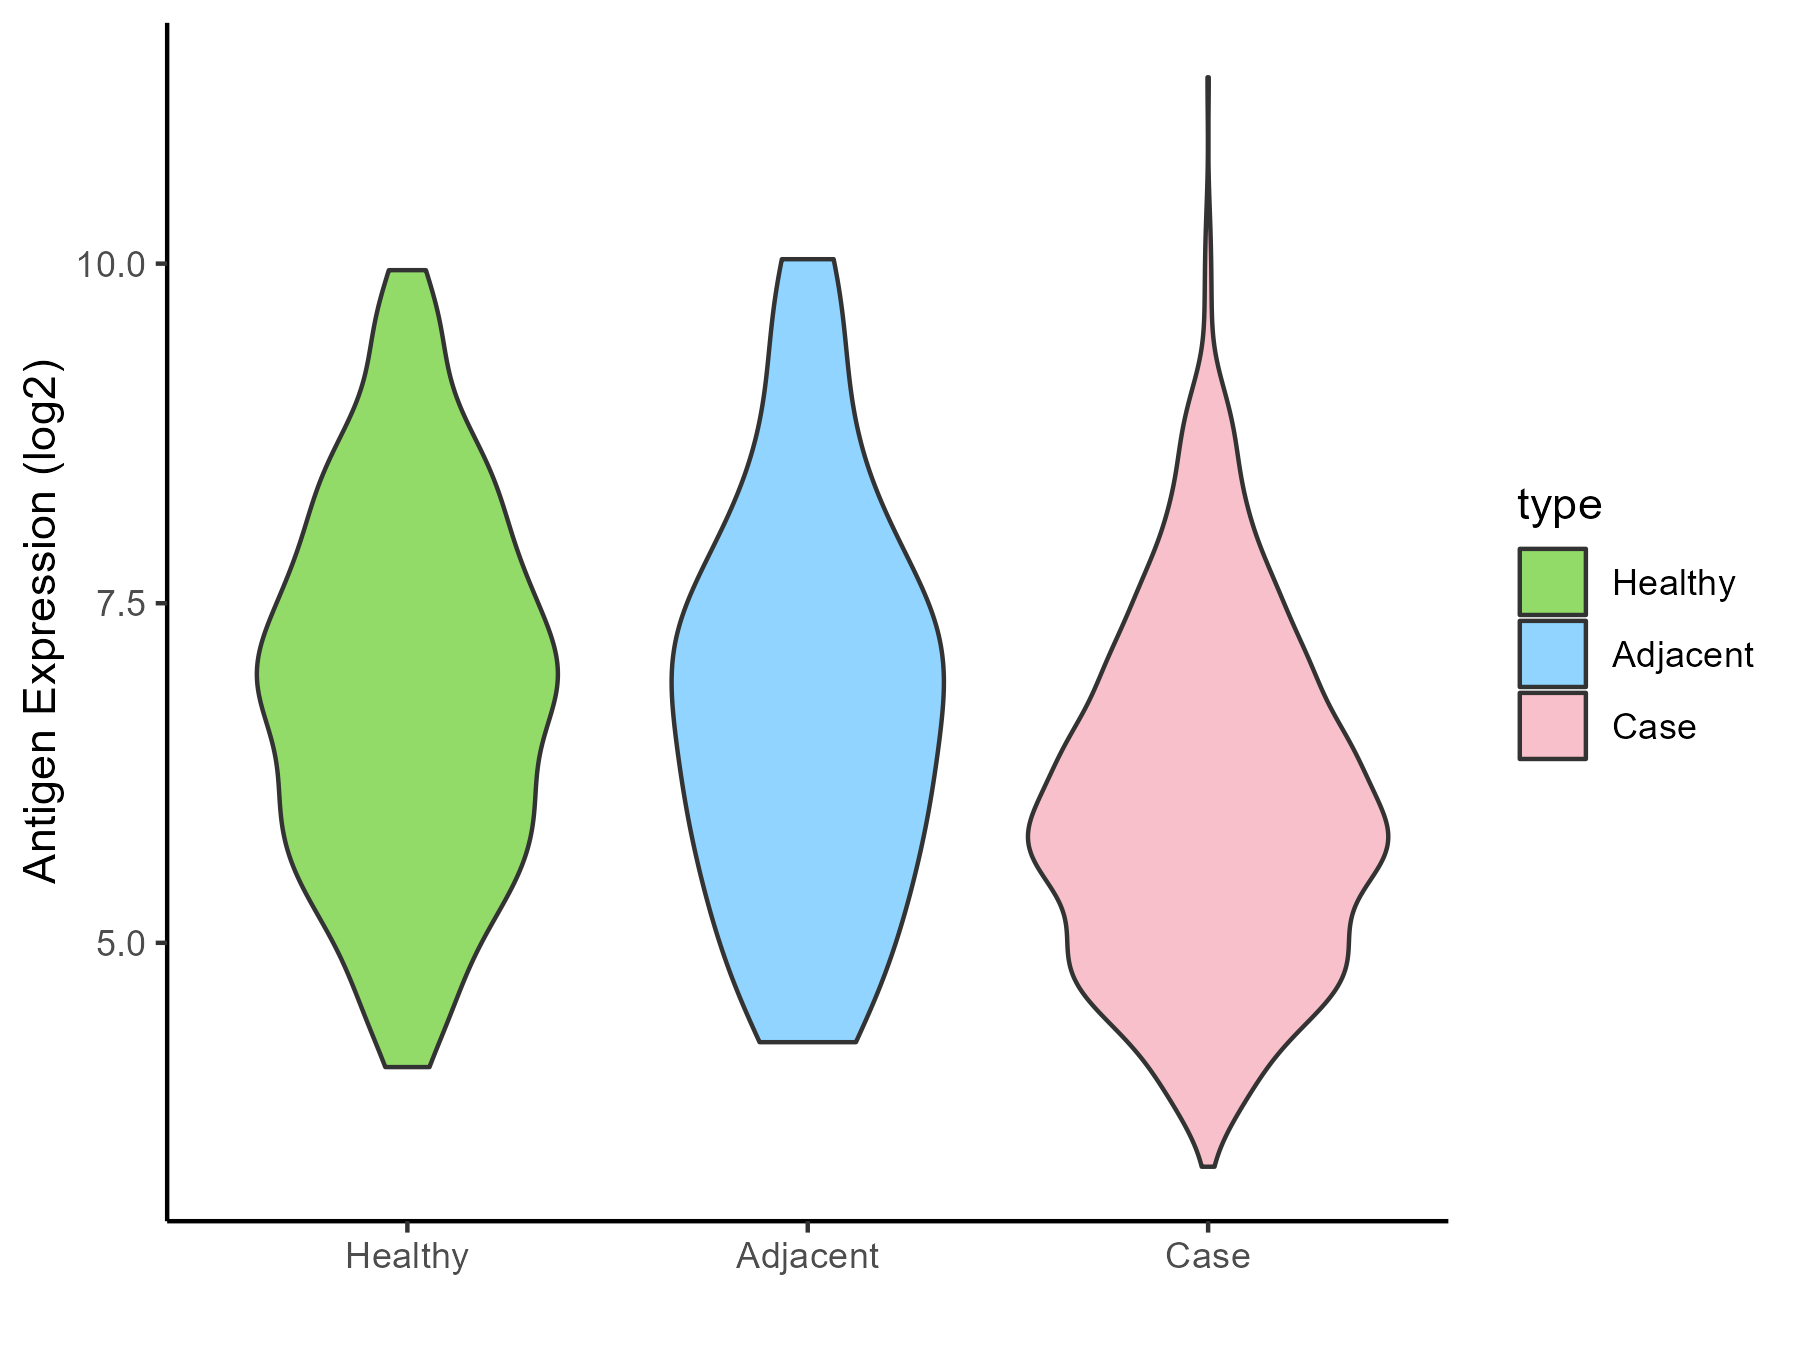
| The Studied Tissue | Breast | |
| The Specific Disease | Breast cancer | |
| The Expression Level of Disease Section Compare with the Healthy Individual Tissue | p-value: 5.04E-19; Fold-change: -0.994107352; Z-score: -0.747182932 | |
| The Expression Level of Disease Section Compare with the Adjacent Tissue | p-value: 0.000870479; Fold-change: -1.067014133; Z-score: -0.729133467 | |
| Disease-specific Antigen Abundances |
|
Click to View the Clearer Original Diagram |
| Differential expression pattern of antigen in diseases | ||
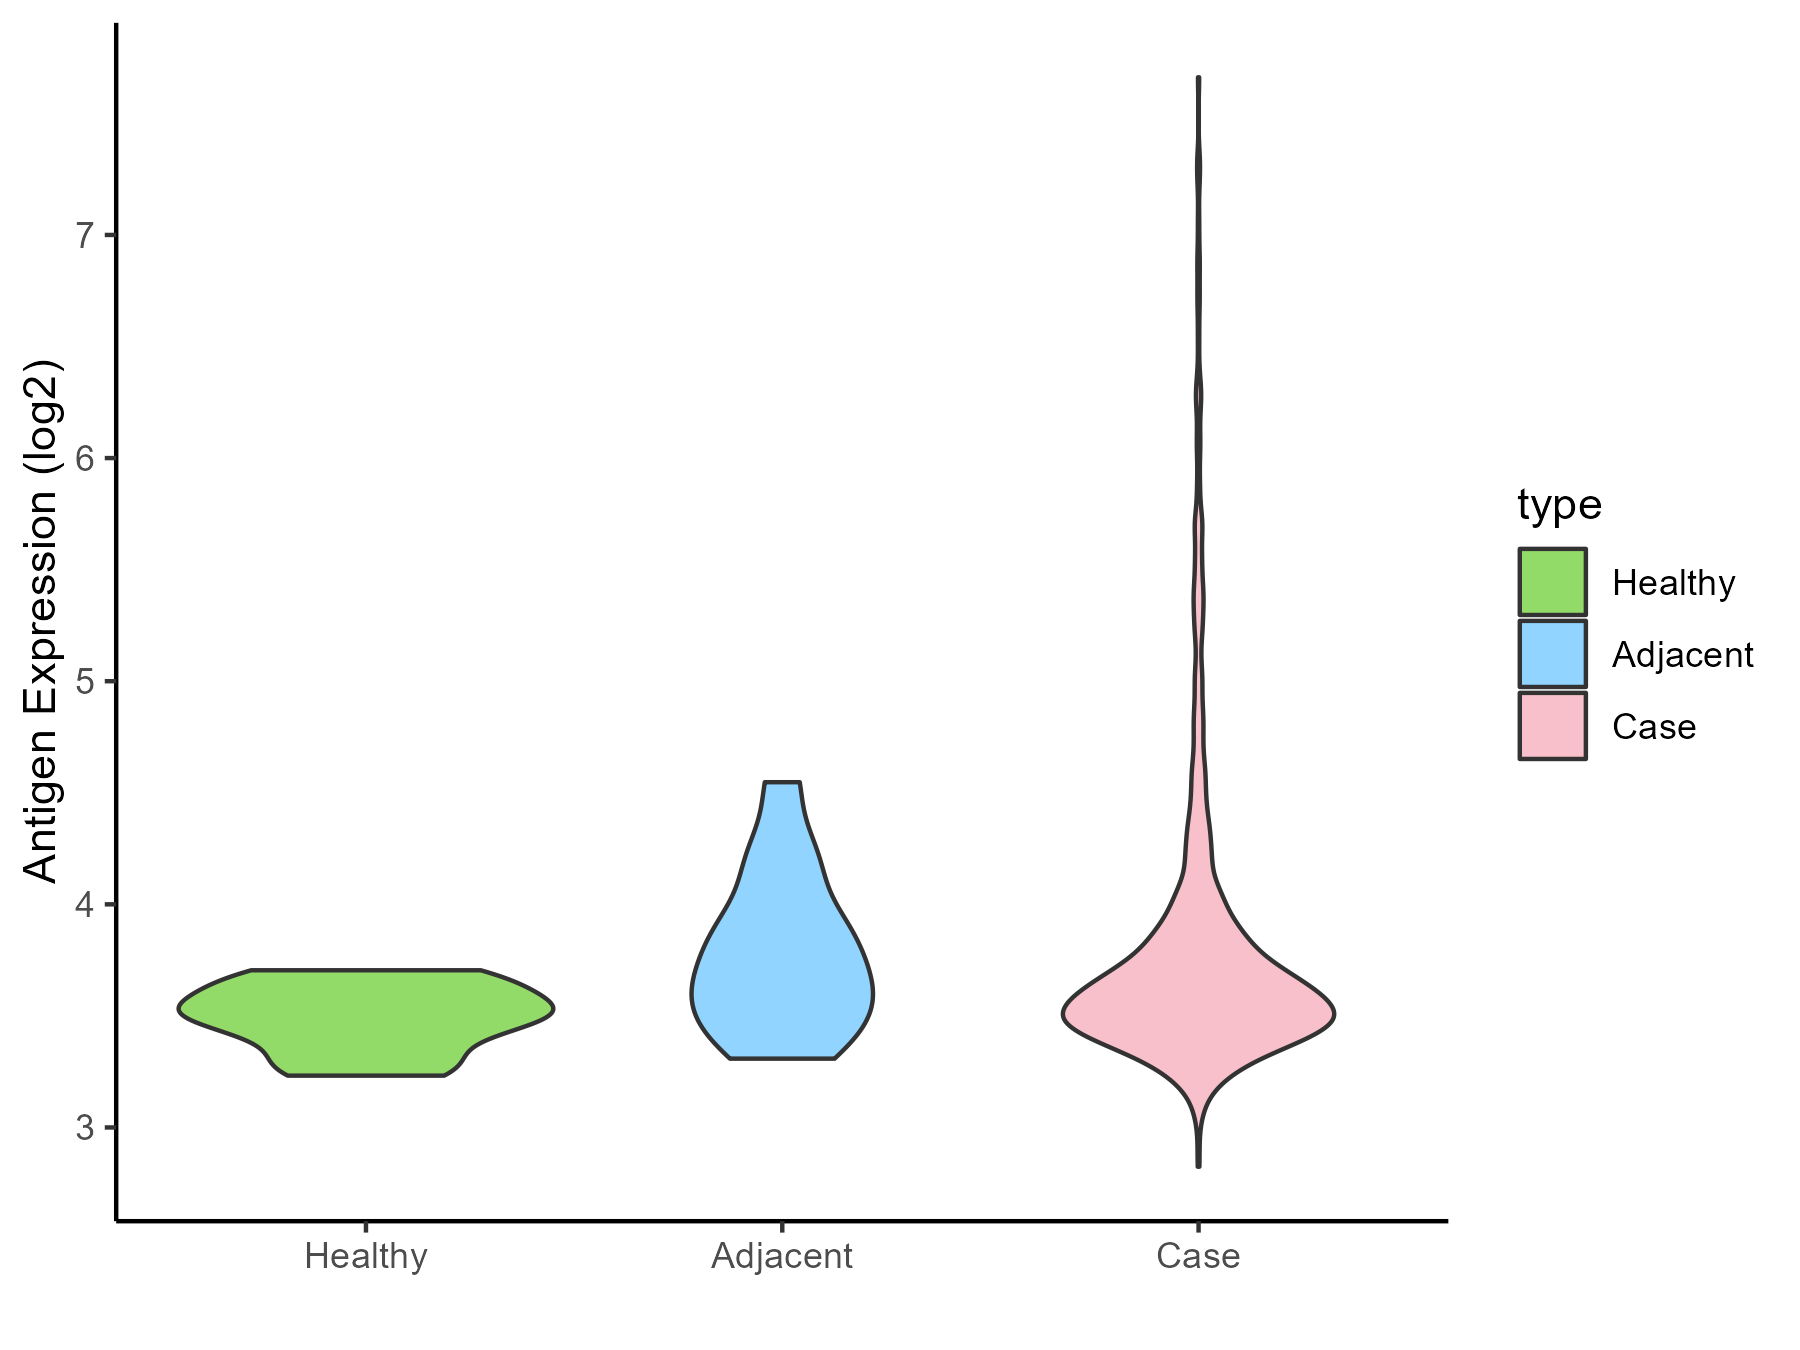
| The Studied Tissue | Ovarian | |
| The Specific Disease | Ovarian cancer | |
| The Expression Level of Disease Section Compare with the Healthy Individual Tissue | p-value: 0.000283104; Fold-change: 0.090832244; Z-score: 0.573695062 | |
| The Expression Level of Disease Section Compare with the Adjacent Tissue | p-value: 0.854900293; Fold-change: -0.095093387; Z-score: -0.267813711 | |
| Disease-specific Antigen Abundances |
|
Click to View the Clearer Original Diagram |
| Differential expression pattern of antigen in diseases | ||
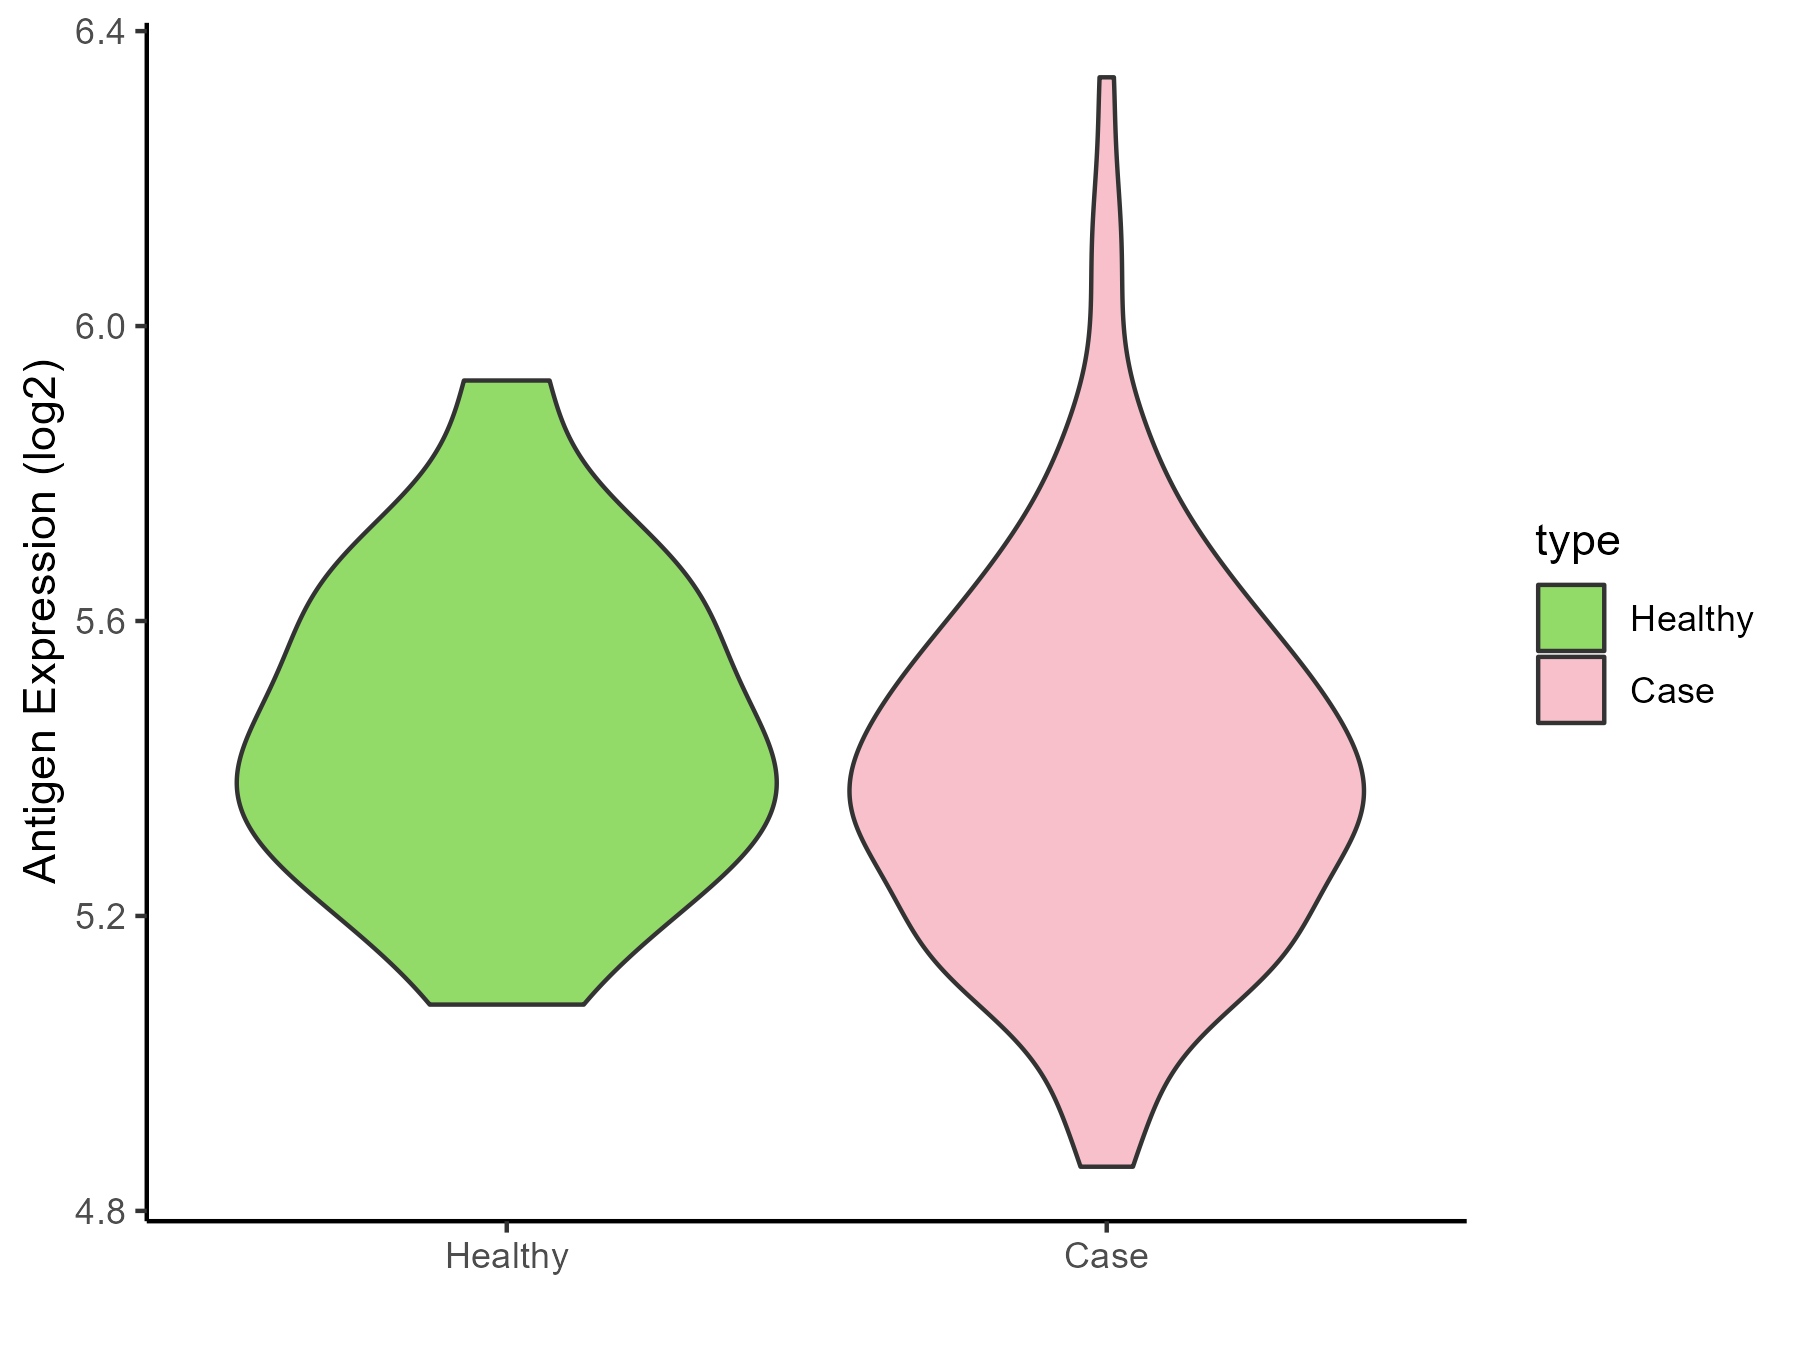
| The Studied Tissue | Cervical | |
| The Specific Disease | Cervical cancer | |
| The Expression Level of Disease Section Compare with the Healthy Individual Tissue | p-value: 0.33952586; Fold-change: -0.048664921; Z-score: -0.228618092 | |
| Disease-specific Antigen Abundances |
|
Click to View the Clearer Original Diagram |
| Differential expression pattern of antigen in diseases | ||
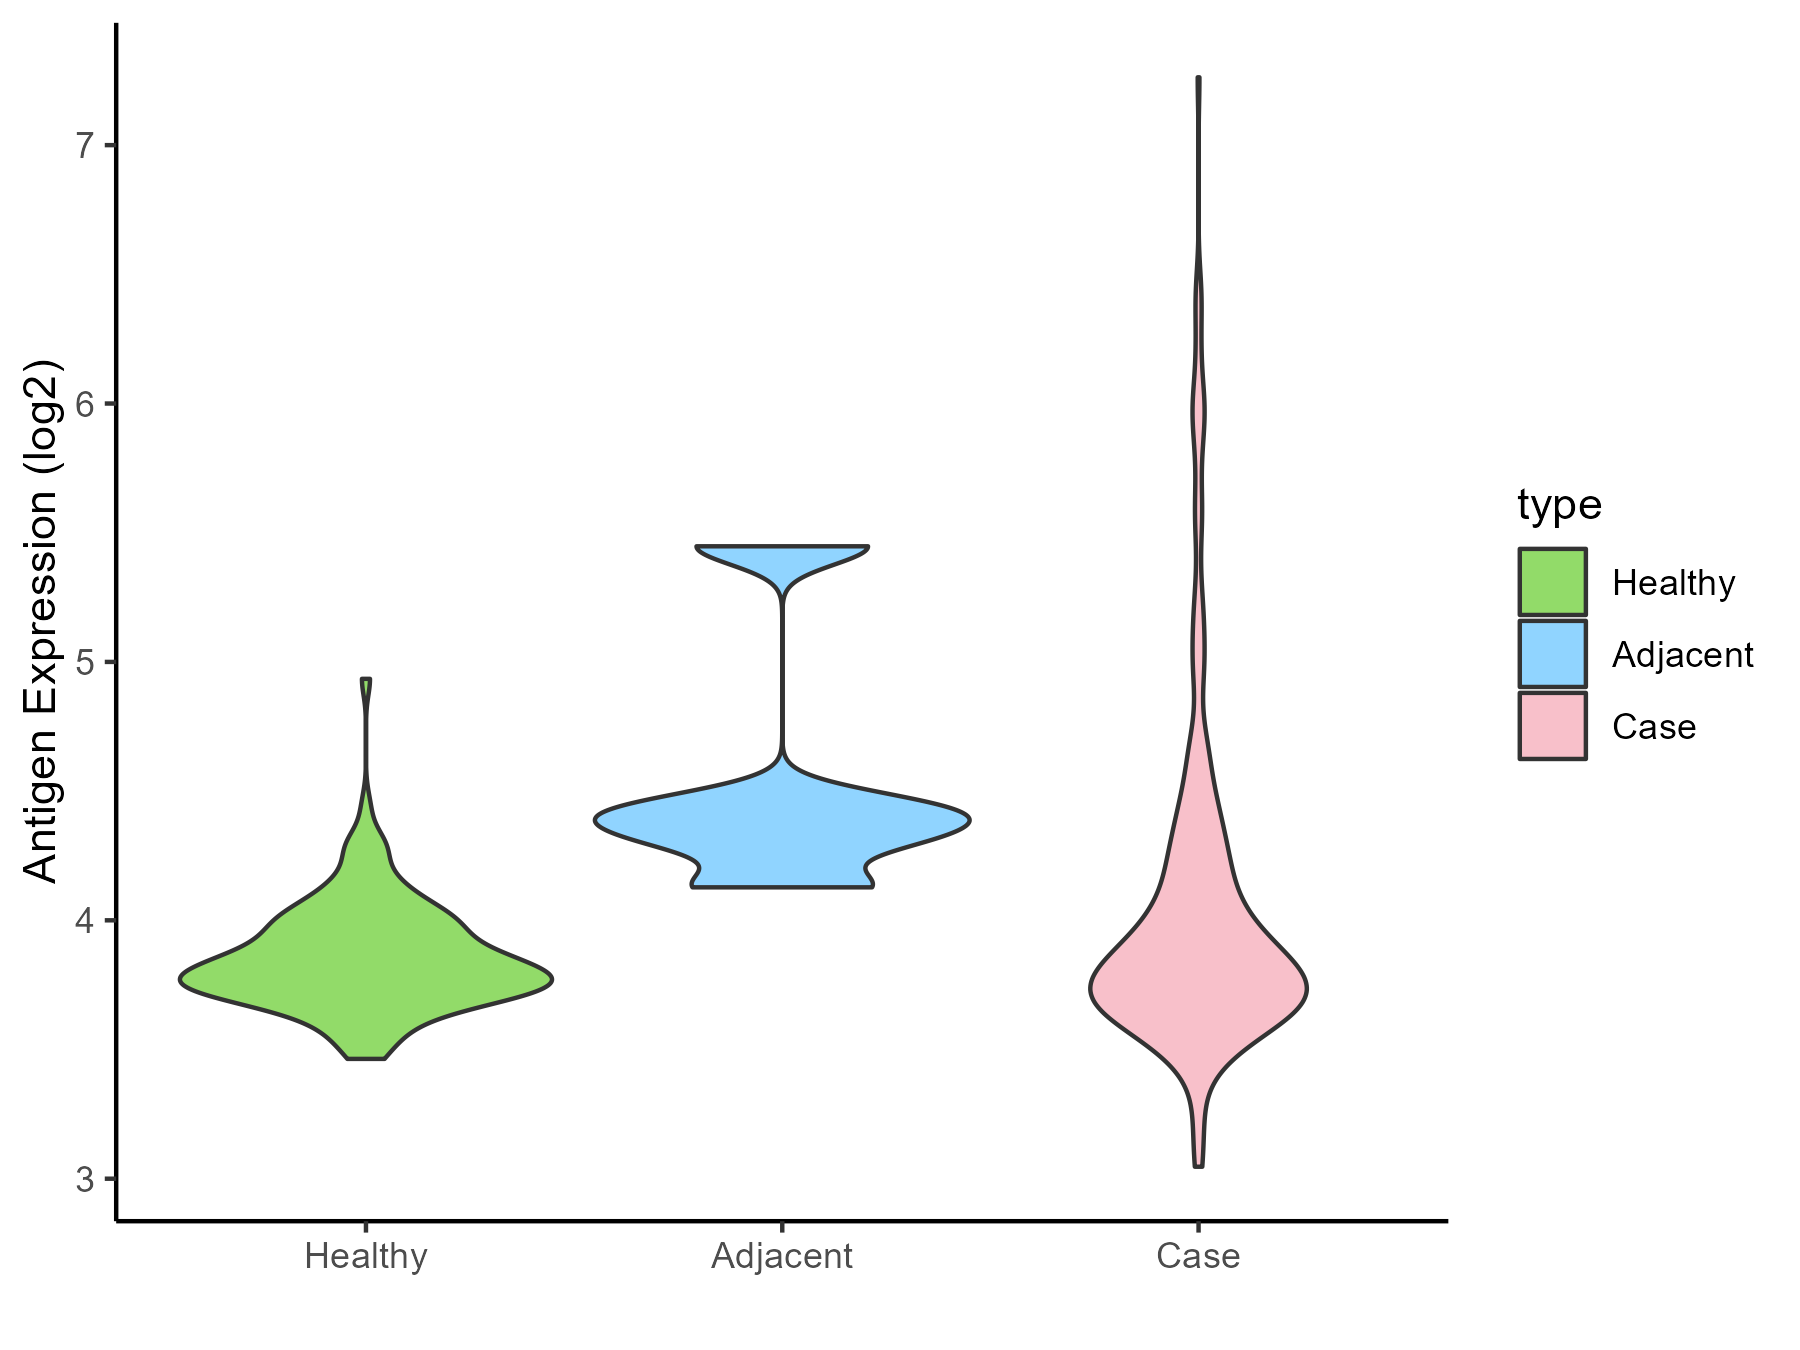
| The Studied Tissue | Endometrium | |
| The Specific Disease | Uterine cancer | |
| The Expression Level of Disease Section Compare with the Healthy Individual Tissue | p-value: 9.96E-06; Fold-change: 0.017610255; Z-score: 0.083554978 | |
| The Expression Level of Disease Section Compare with the Adjacent Tissue | p-value: 0.093741694; Fold-change: -0.549745462; Z-score: -1.057521668 | |
| Disease-specific Antigen Abundances |
|
Click to View the Clearer Original Diagram |
| Differential expression pattern of antigen in diseases | ||
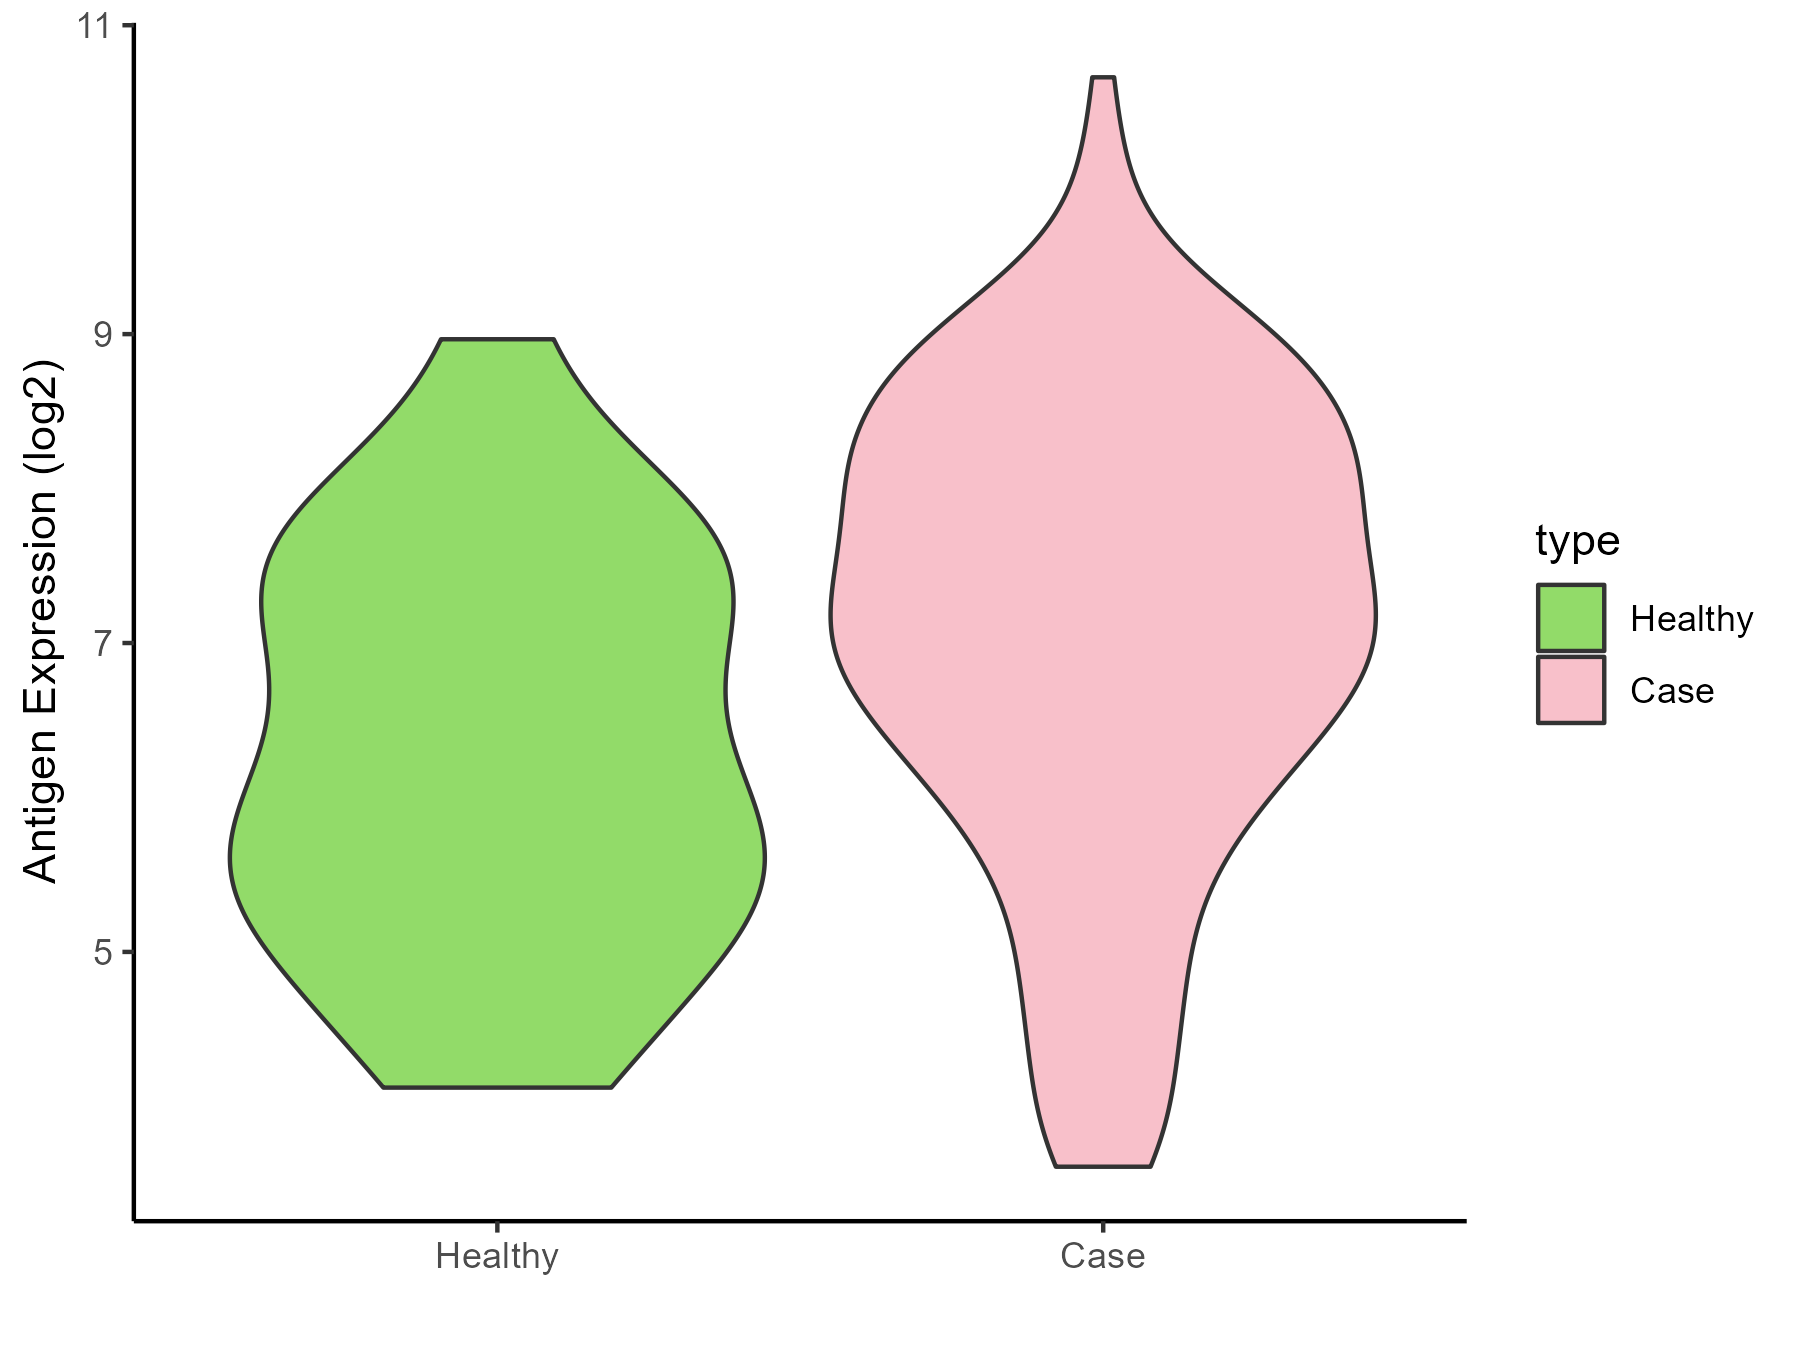
| The Studied Tissue | Prostate | |
| The Specific Disease | Prostate cancer | |
| The Expression Level of Disease Section Compare with the Healthy Individual Tissue | p-value: 0.01390659; Fold-change: 0.90752921; Z-score: 0.688335009 | |
| Disease-specific Antigen Abundances |
|
Click to View the Clearer Original Diagram |
| Differential expression pattern of antigen in diseases | ||
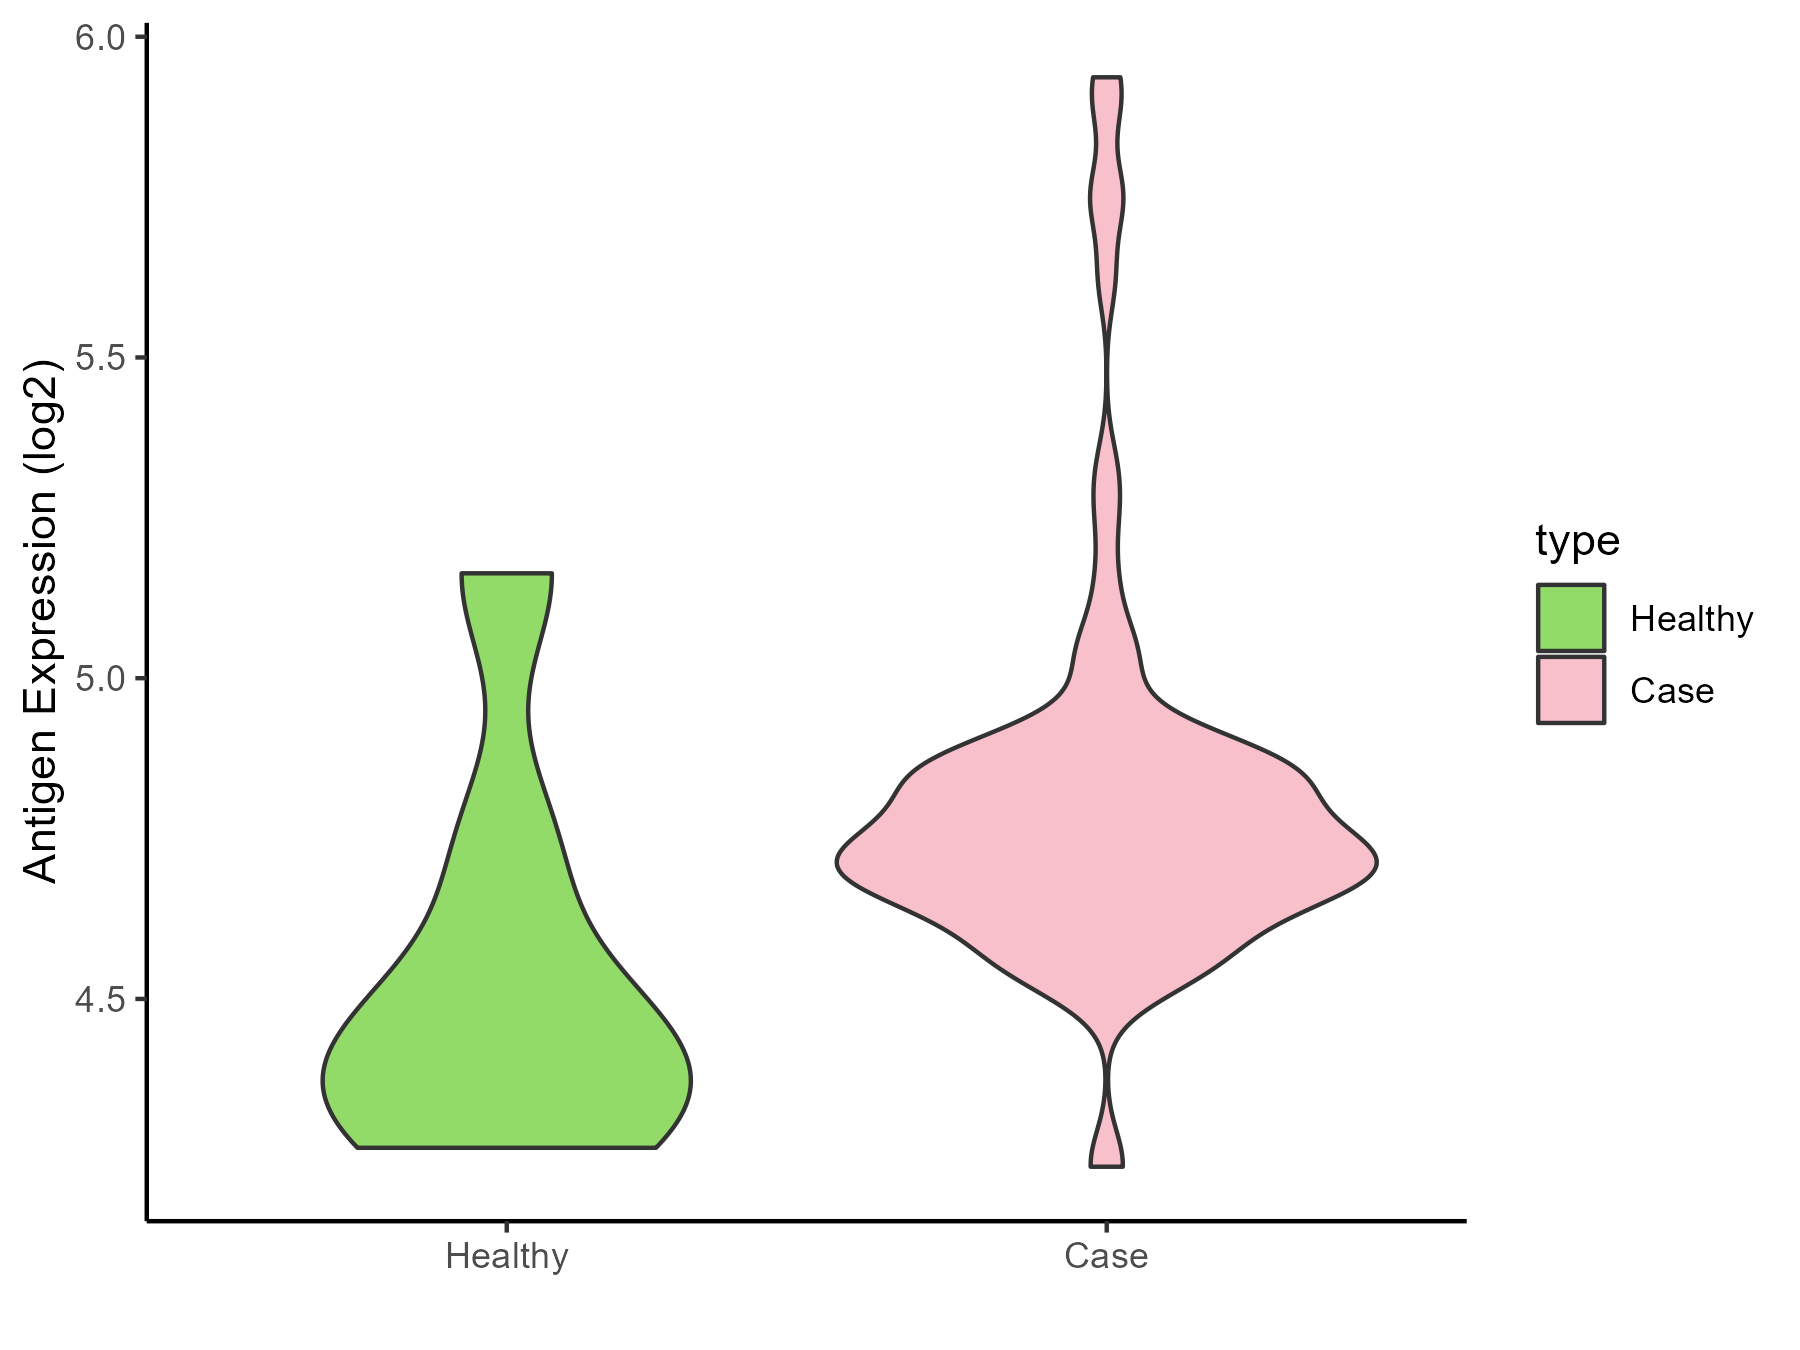
| The Studied Tissue | Bladder | |
| The Specific Disease | Bladder cancer | |
| The Expression Level of Disease Section Compare with the Healthy Individual Tissue | p-value: 0.066724704; Fold-change: 0.312072745; Z-score: 0.986959103 | |
| Disease-specific Antigen Abundances |
|
Click to View the Clearer Original Diagram |
| Differential expression pattern of antigen in diseases | ||
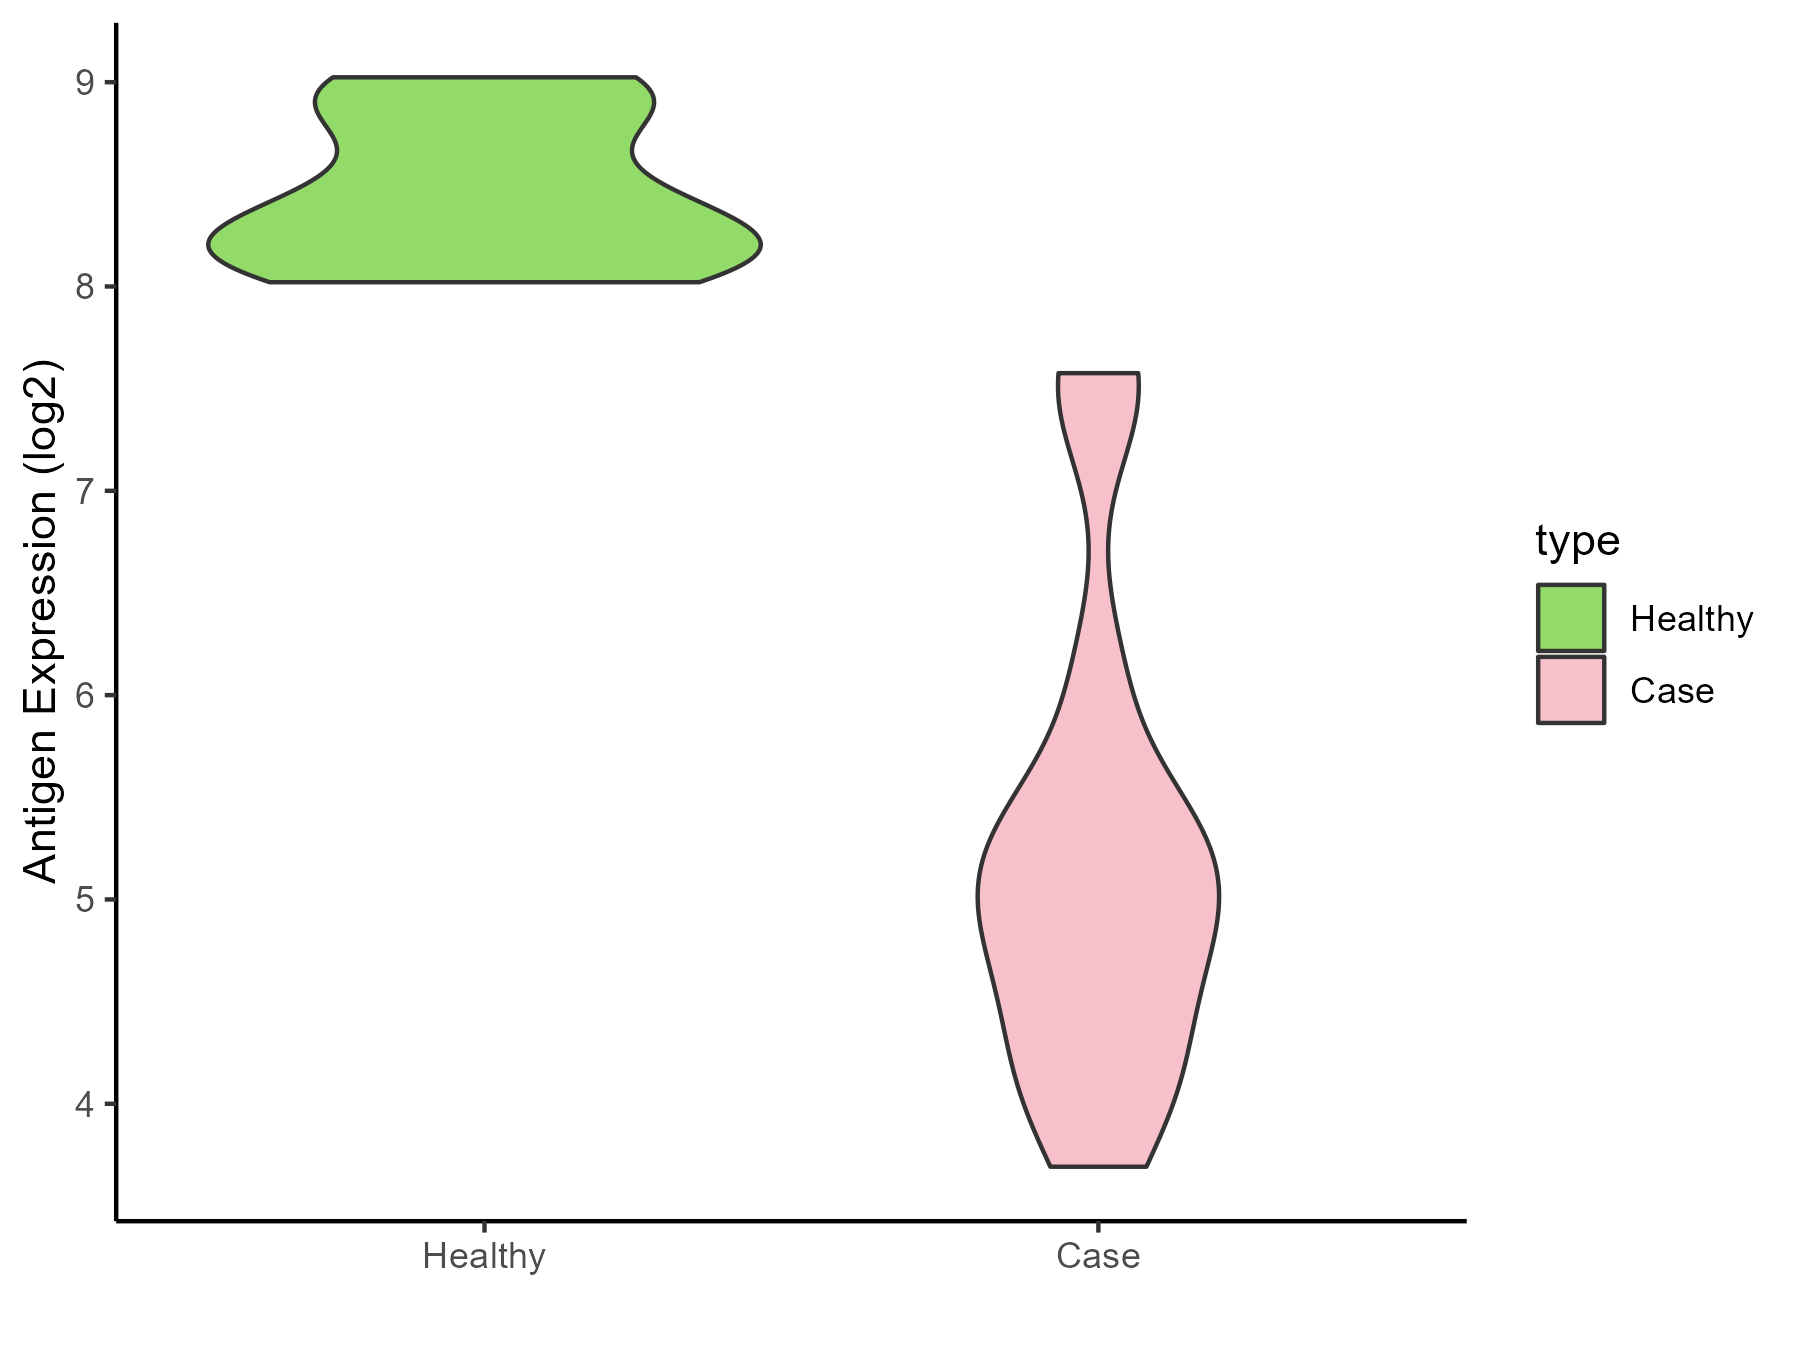
| The Studied Tissue | Uvea | |
| The Specific Disease | Retinoblastoma tumor | |
| The Expression Level of Disease Section Compare with the Healthy Individual Tissue | p-value: 2.91E-08; Fold-change: -3.330211144; Z-score: -8.853728982 | |
| Disease-specific Antigen Abundances |
|
Click to View the Clearer Original Diagram |
| Differential expression pattern of antigen in diseases | ||
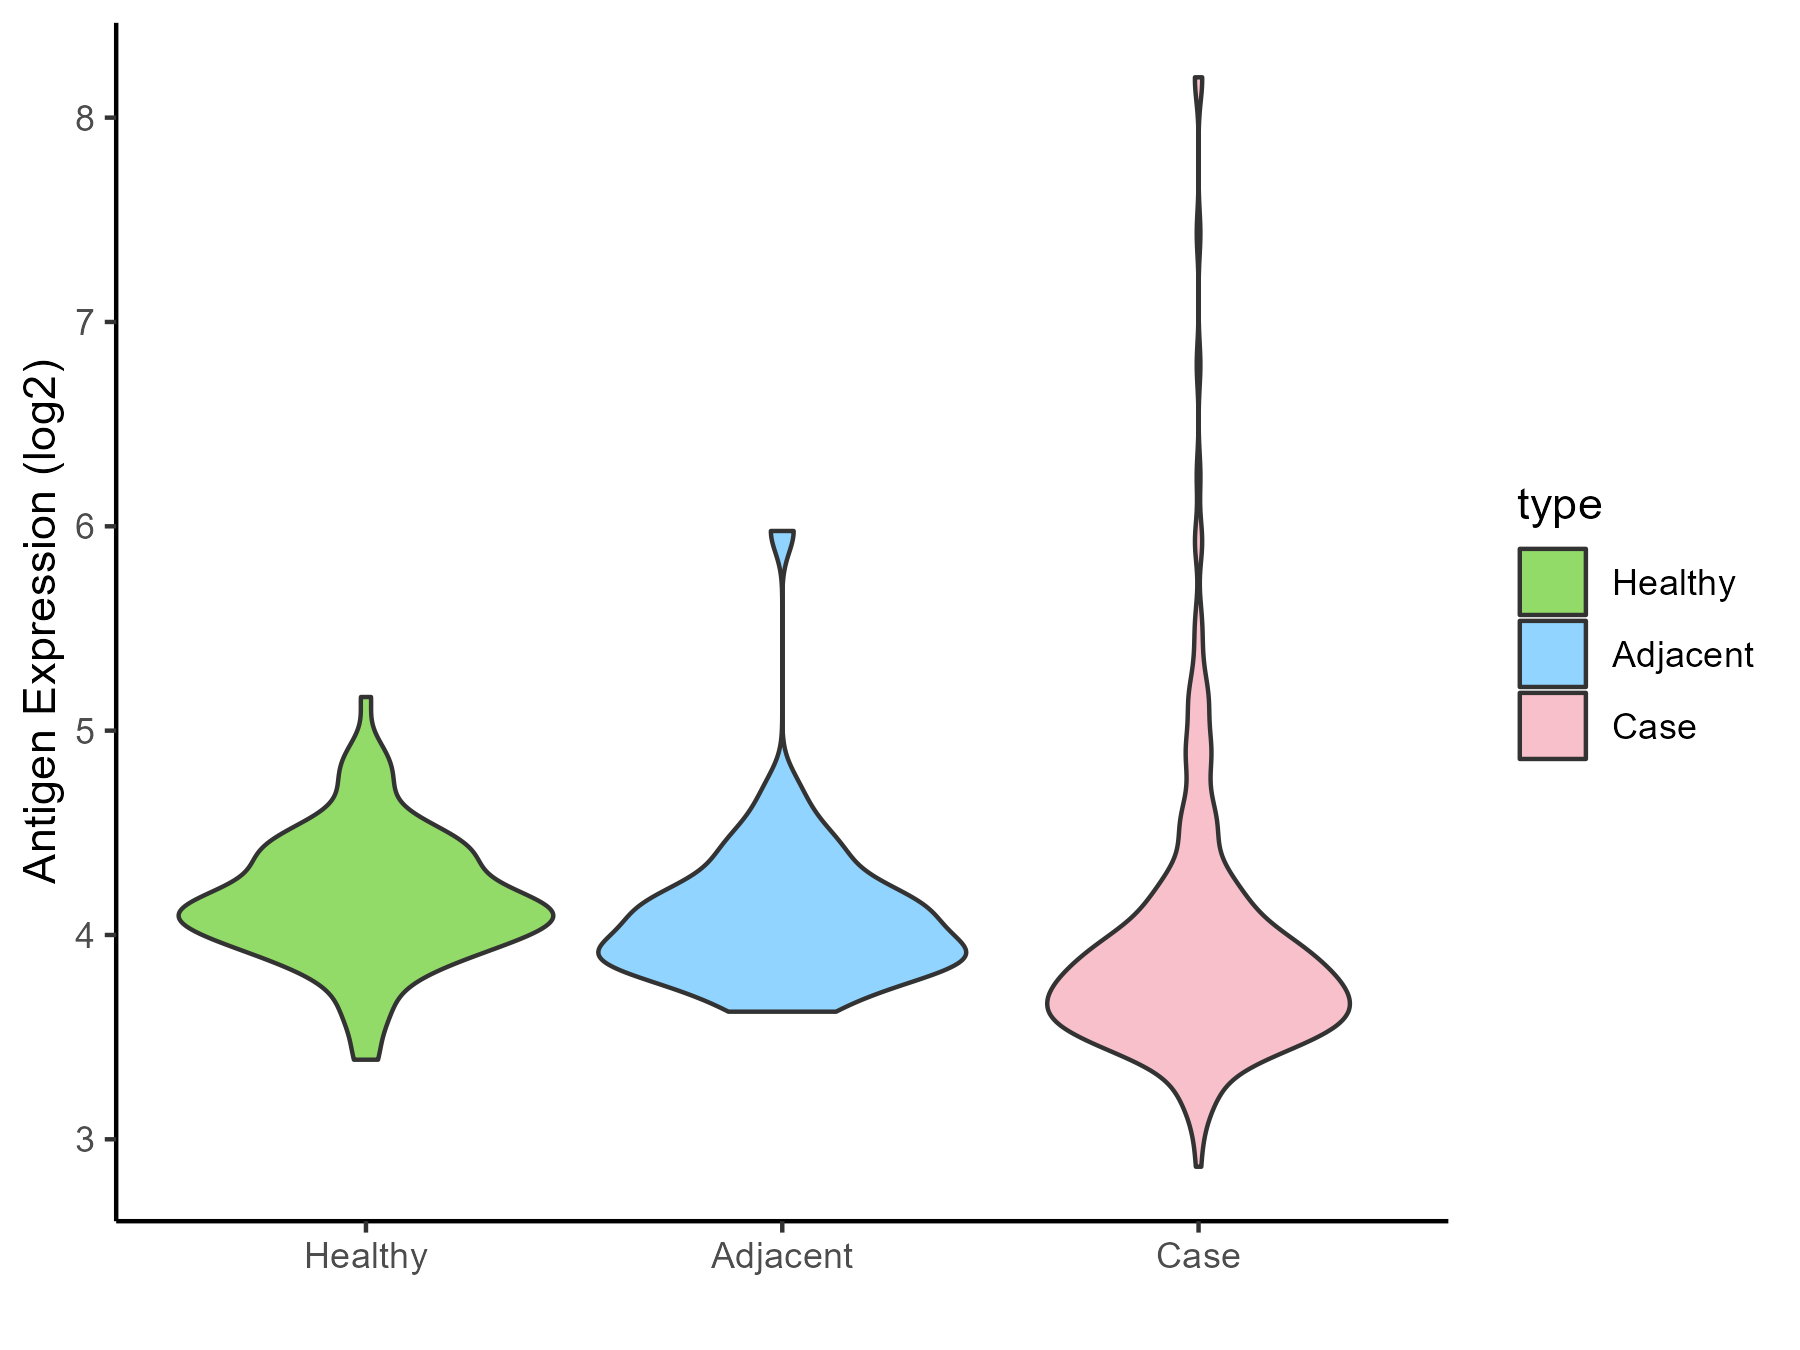
| The Studied Tissue | Thyroid | |
| The Specific Disease | Thyroid cancer | |
| The Expression Level of Disease Section Compare with the Healthy Individual Tissue | p-value: 2.02E-05; Fold-change: -0.363064949; Z-score: -1.159314969 | |
| The Expression Level of Disease Section Compare with the Adjacent Tissue | p-value: 0.046459893; Fold-change: -0.228097021; Z-score: -0.574204427 | |
| Disease-specific Antigen Abundances |
|
Click to View the Clearer Original Diagram |
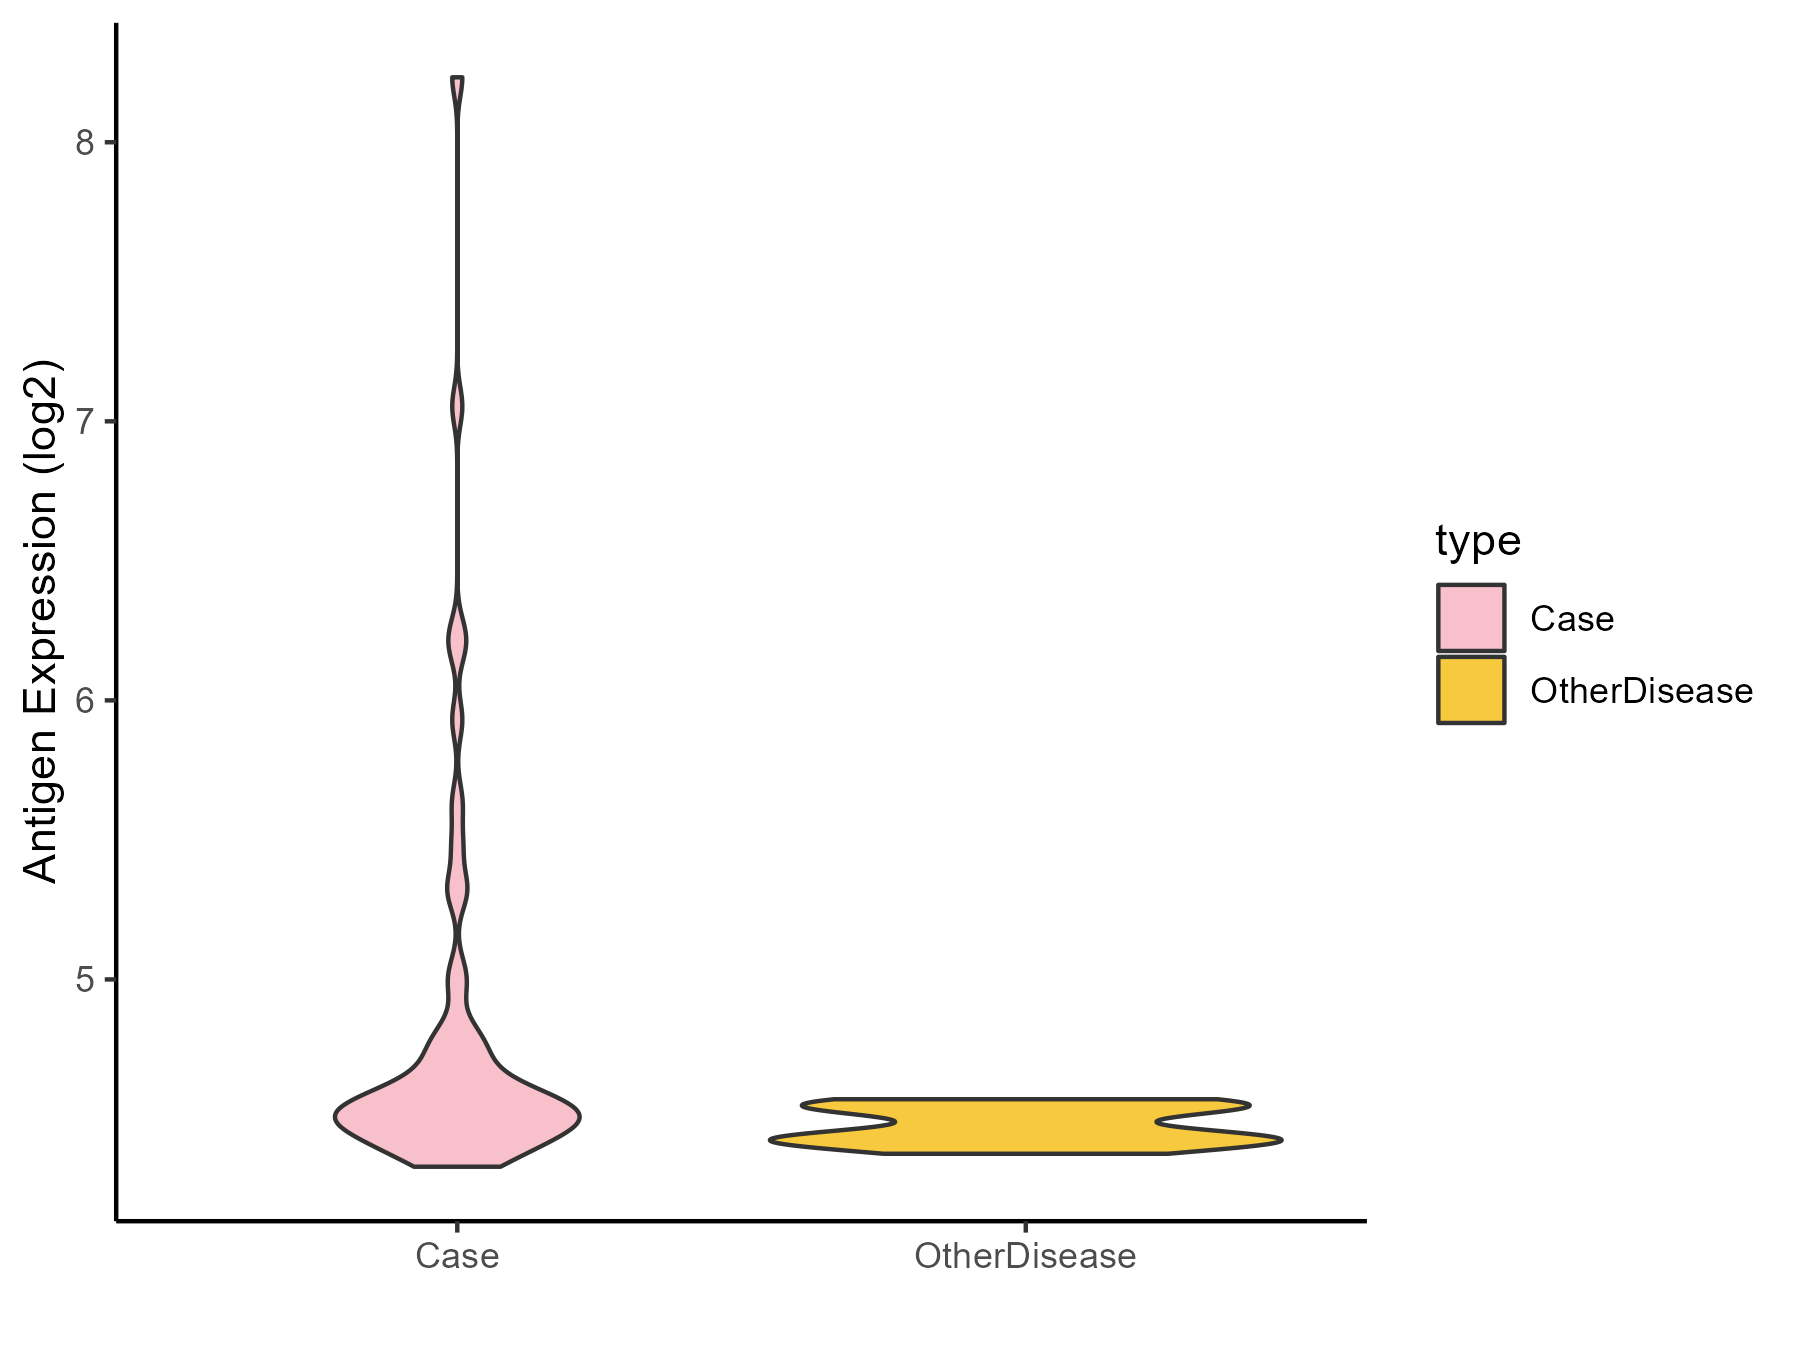
| Differential expression pattern of antigen in diseases | ||
| The Studied Tissue | Adrenal cortex | |
| The Specific Disease | Adrenocortical carcinoma | |
| The Expression Level of Disease Section Compare with the Other Disease Section | p-value: 4.60E-06; Fold-change: 0.107836086; Z-score: 1.536117867 | |
| Disease-specific Antigen Abundances |
|
Click to View the Clearer Original Diagram |
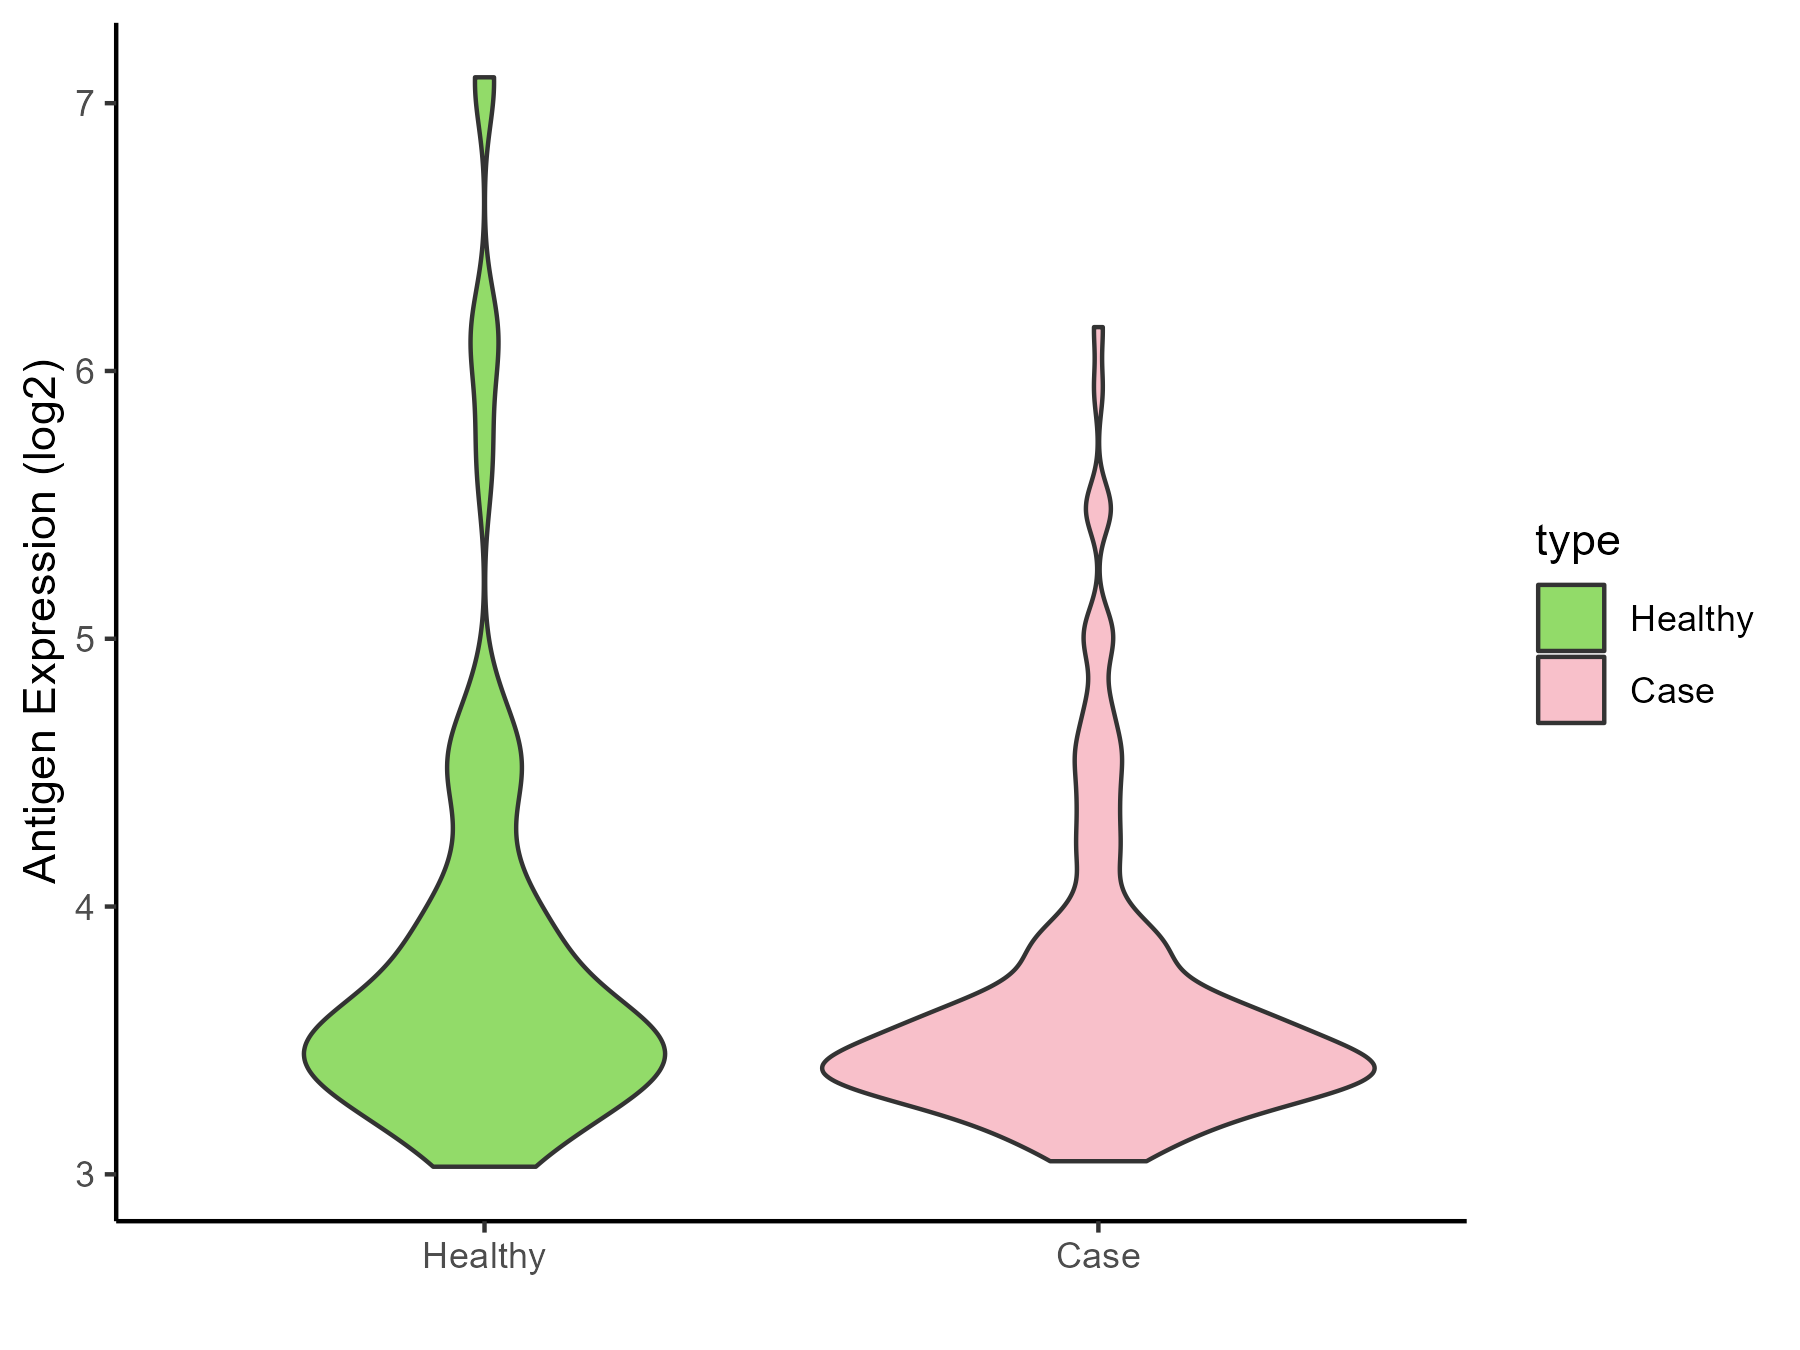
| Differential expression pattern of antigen in diseases | ||
| The Studied Tissue | Head and neck | |
| The Specific Disease | Head and neck cancer | |
| The Expression Level of Disease Section Compare with the Healthy Individual Tissue | p-value: 0.033731278; Fold-change: -0.071351057; Z-score: -0.084370783 | |
| Disease-specific Antigen Abundances |
|
Click to View the Clearer Original Diagram |
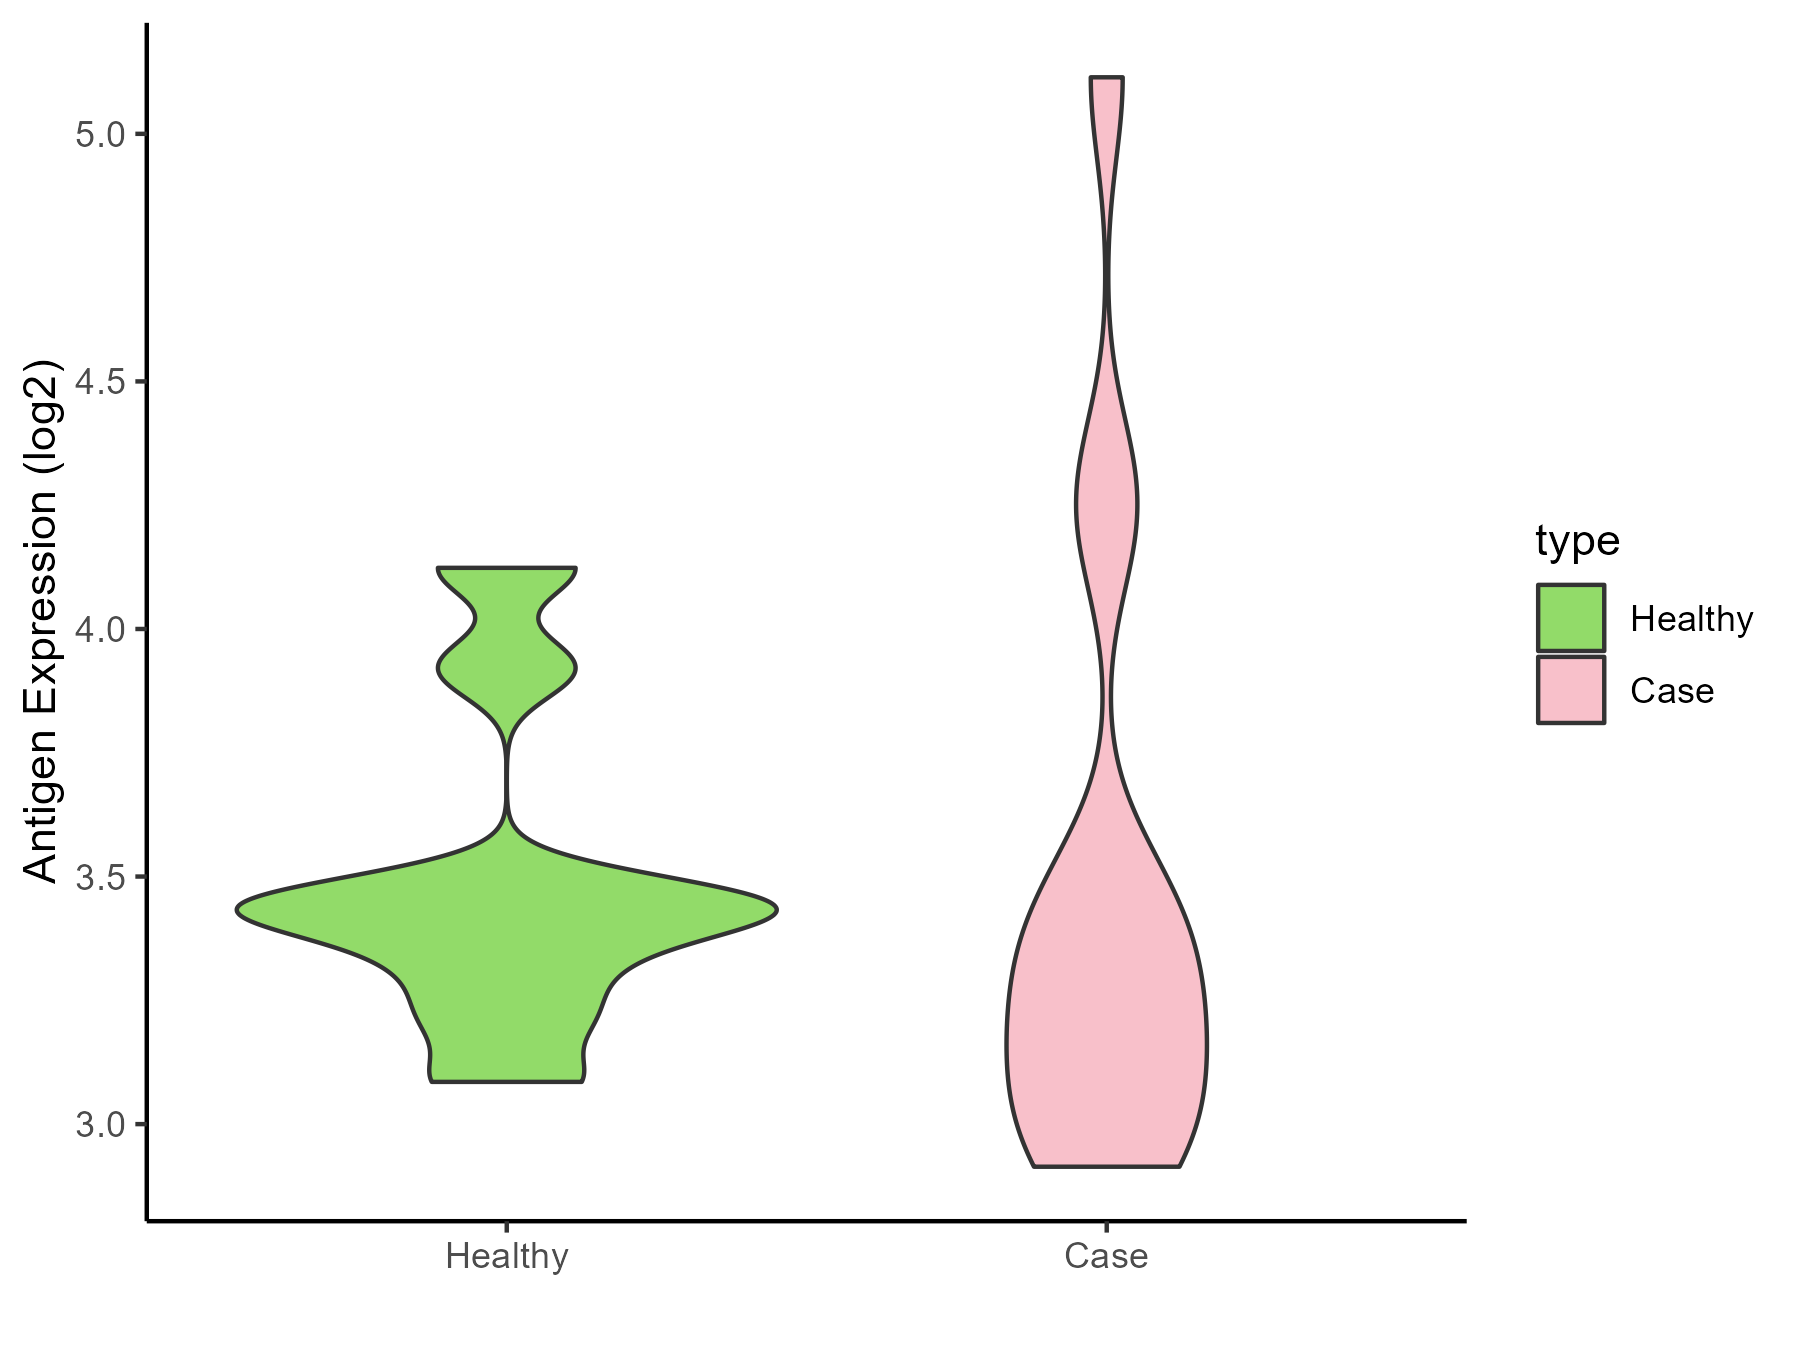
| Differential expression pattern of antigen in diseases | ||
| The Studied Tissue | Pituitary | |
| The Specific Disease | Pituitary gonadotrope tumor | |
| The Expression Level of Disease Section Compare with the Healthy Individual Tissue | p-value: 0.944806649; Fold-change: -0.166164189; Z-score: -0.504160102 | |
| Disease-specific Antigen Abundances |
|
Click to View the Clearer Original Diagram |
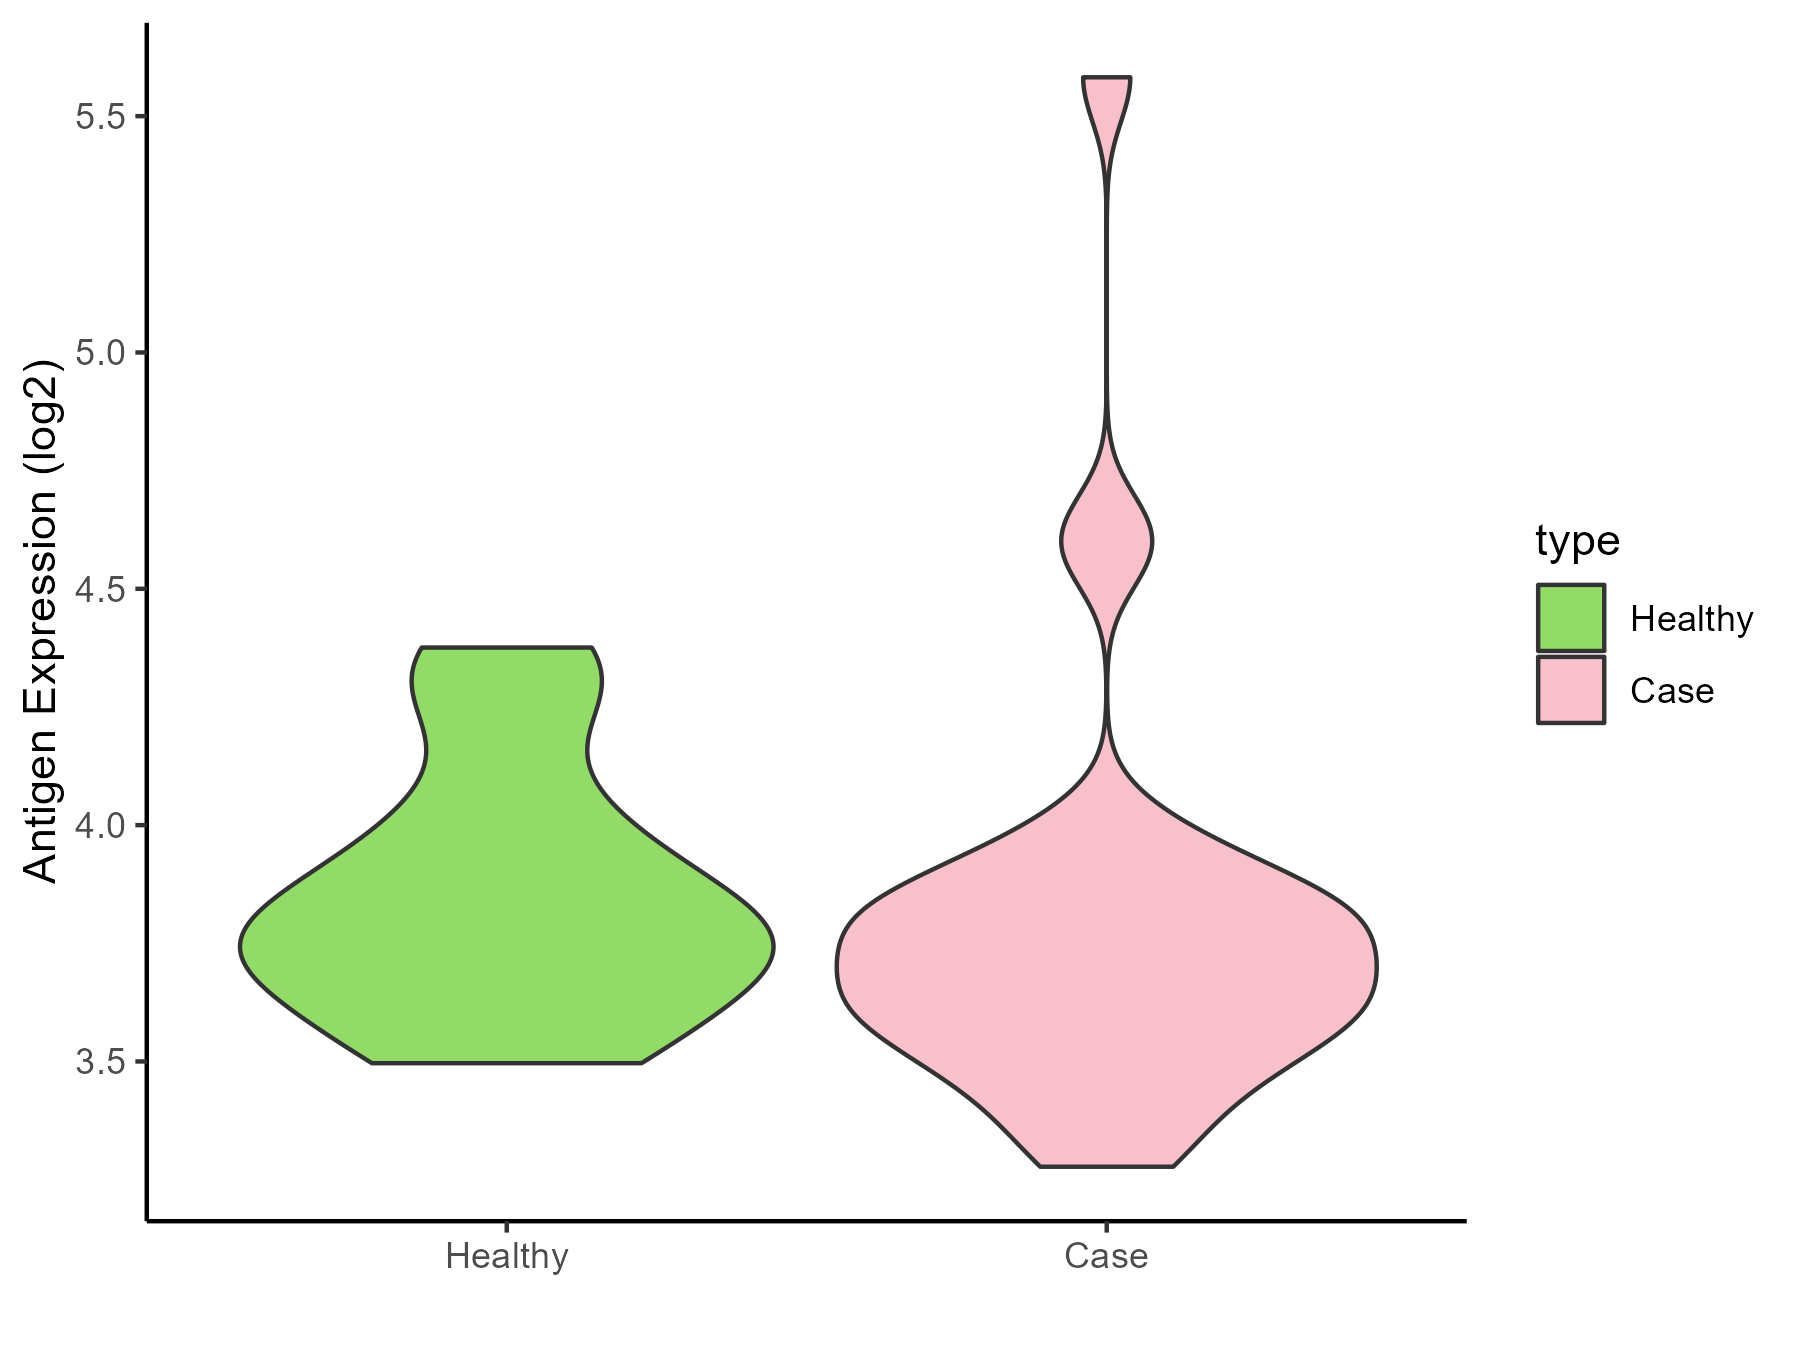
| The Studied Tissue | Pituitary | |
| The Specific Disease | Pituitary cancer | |
| The Expression Level of Disease Section Compare with the Healthy Individual Tissue | p-value: 0.603940913; Fold-change: -0.058893444; Z-score: -0.212234819 | |
| Disease-specific Antigen Abundances |
|
Click to View the Clearer Original Diagram |
ICD Disease Classification 03
| Differential expression pattern of antigen in diseases | ||
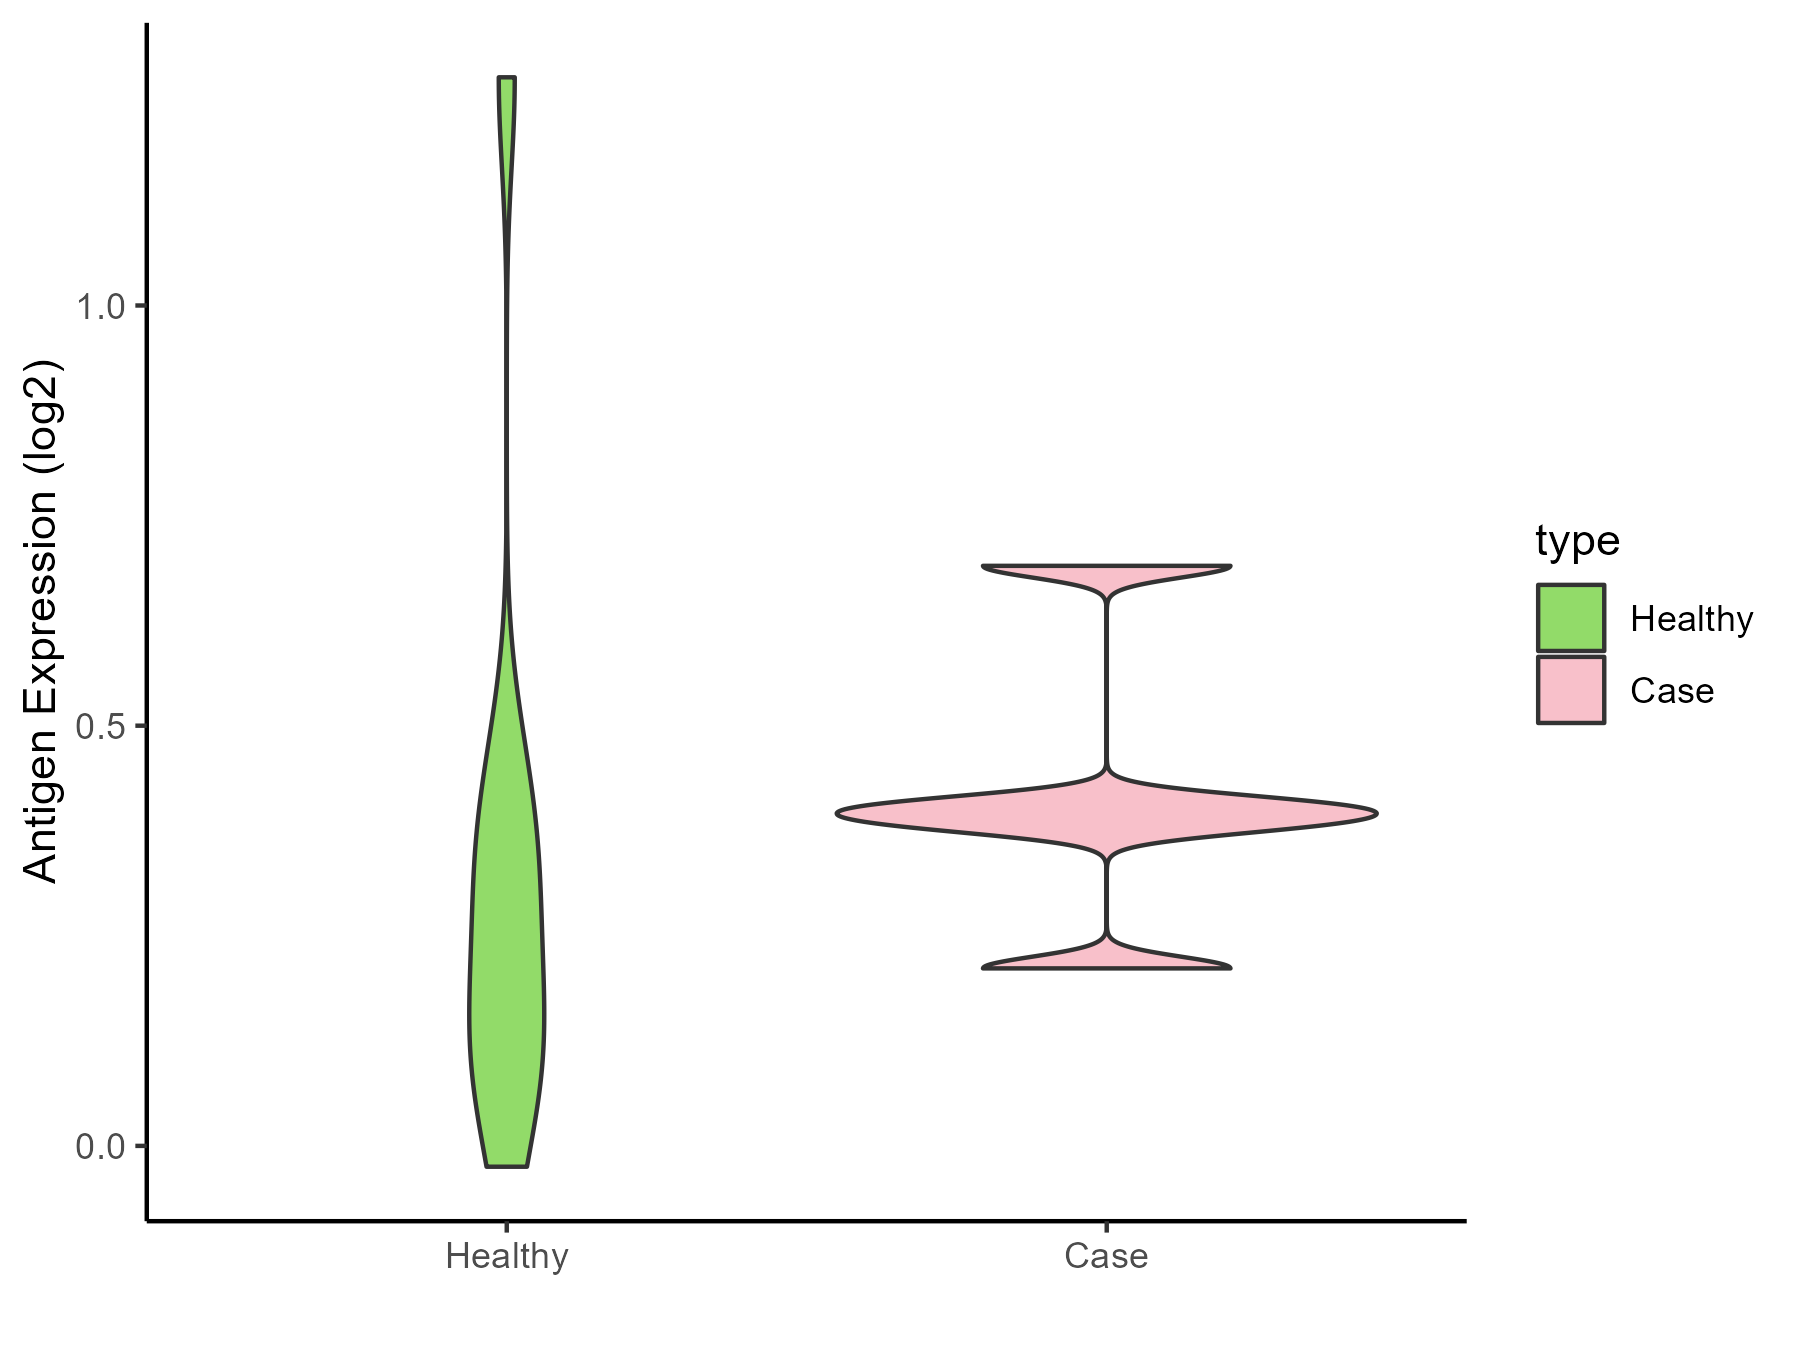
| The Studied Tissue | Whole blood | |
| The Specific Disease | Thrombocytopenia | |
| The Expression Level of Disease Section Compare with the Healthy Individual Tissue | p-value: 0.515425993; Fold-change: 0.15139453; Z-score: 0.414492296 | |
| Disease-specific Antigen Abundances |
|
Click to View the Clearer Original Diagram |
ICD Disease Classification 04
| Differential expression pattern of antigen in diseases | ||
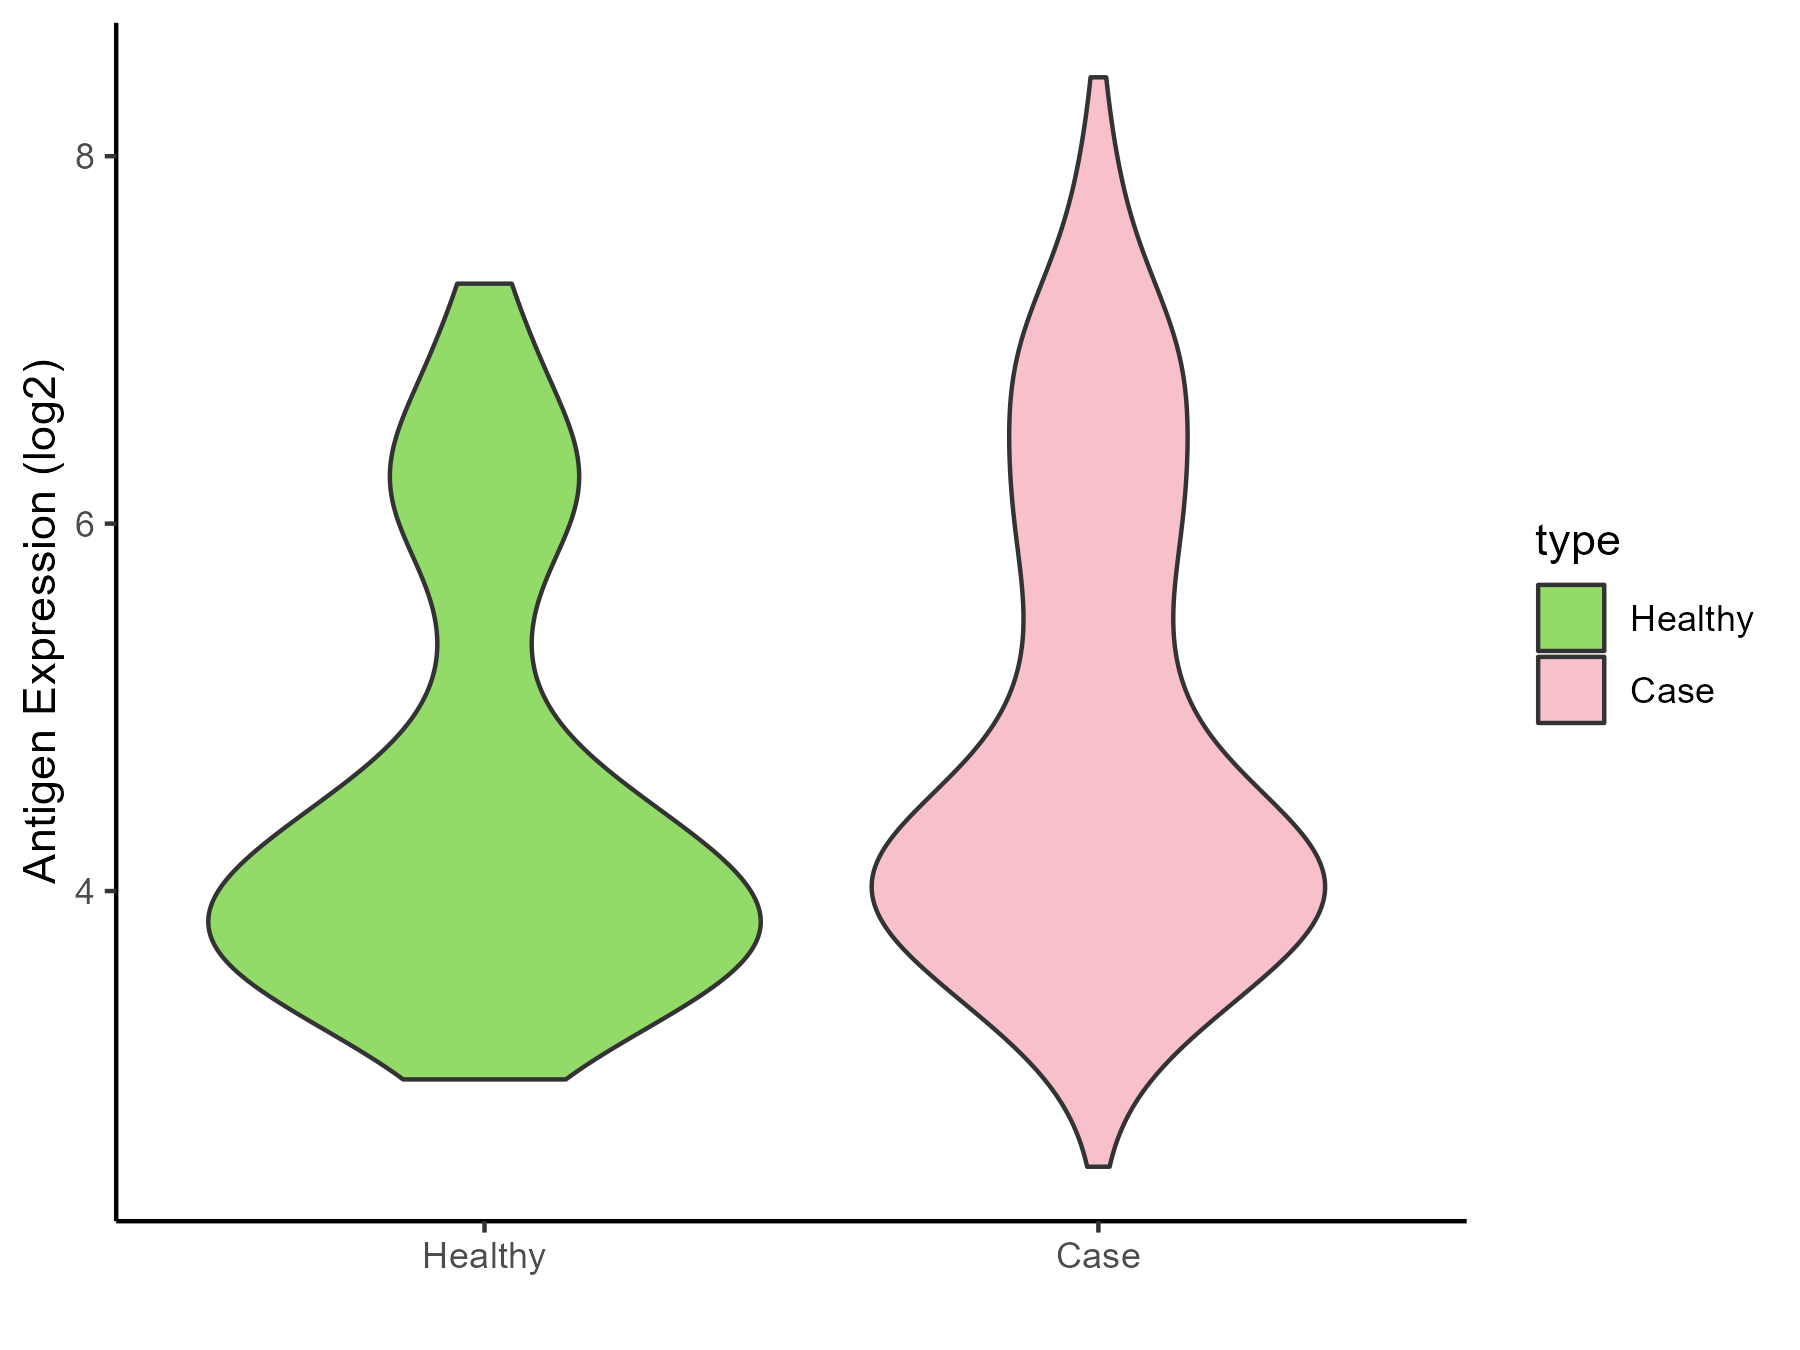
| The Studied Tissue | Whole blood | |
| The Specific Disease | Lupus erythematosus | |
| The Expression Level of Disease Section Compare with the Healthy Individual Tissue | p-value: 0.005185372; Fold-change: 0.291335289; Z-score: 0.253977515 | |
| Disease-specific Antigen Abundances |
|
Click to View the Clearer Original Diagram |
| Differential expression pattern of antigen in diseases | ||
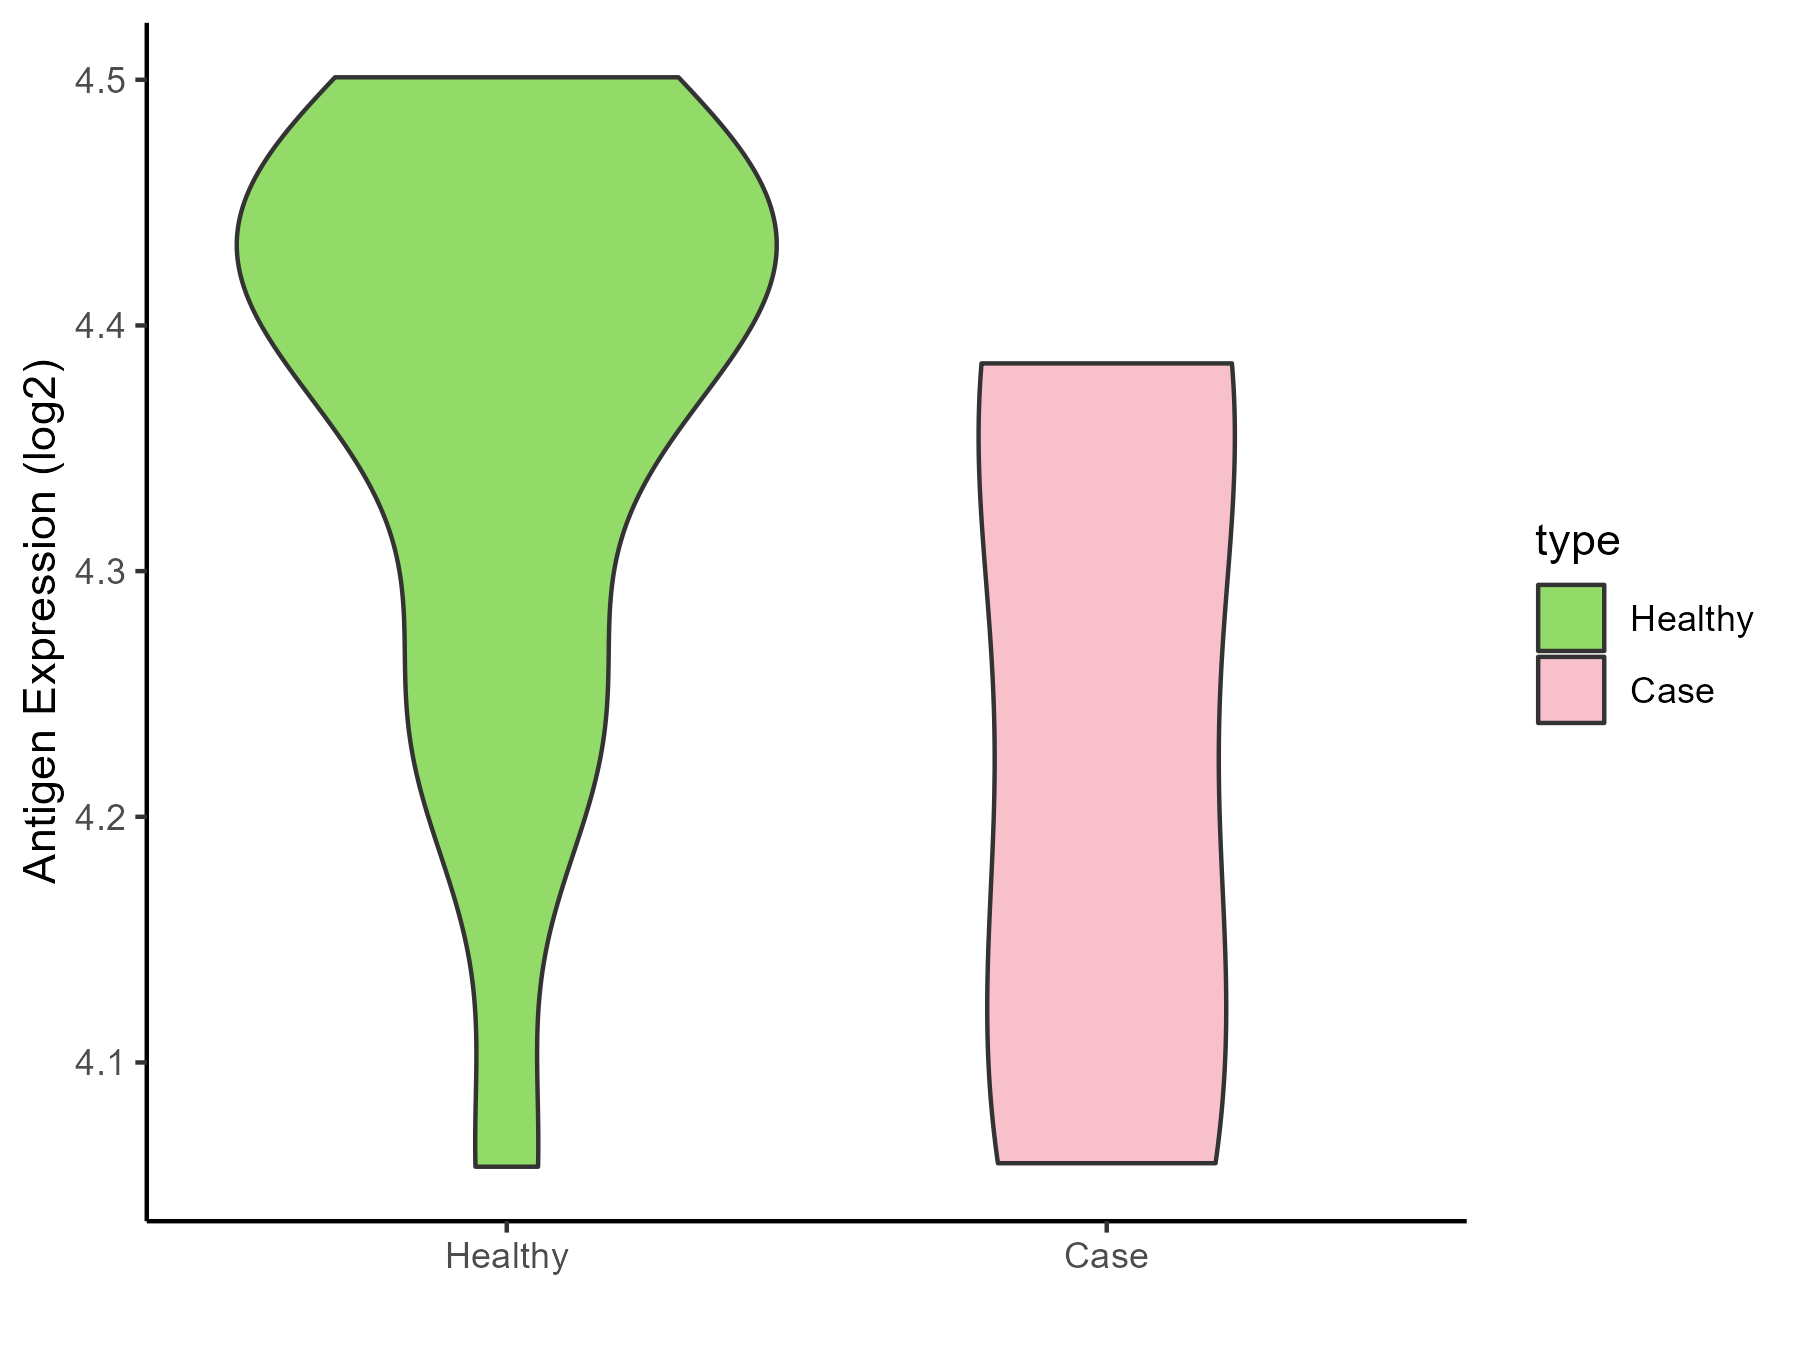
| The Studied Tissue | Peripheral monocyte | |
| The Specific Disease | Autoimmune uveitis | |
| The Expression Level of Disease Section Compare with the Healthy Individual Tissue | p-value: 0.21833565; Fold-change: -0.168468917; Z-score: -1.374424688 | |
| Disease-specific Antigen Abundances |
|
Click to View the Clearer Original Diagram |
ICD Disease Classification 05
| Differential expression pattern of antigen in diseases | ||
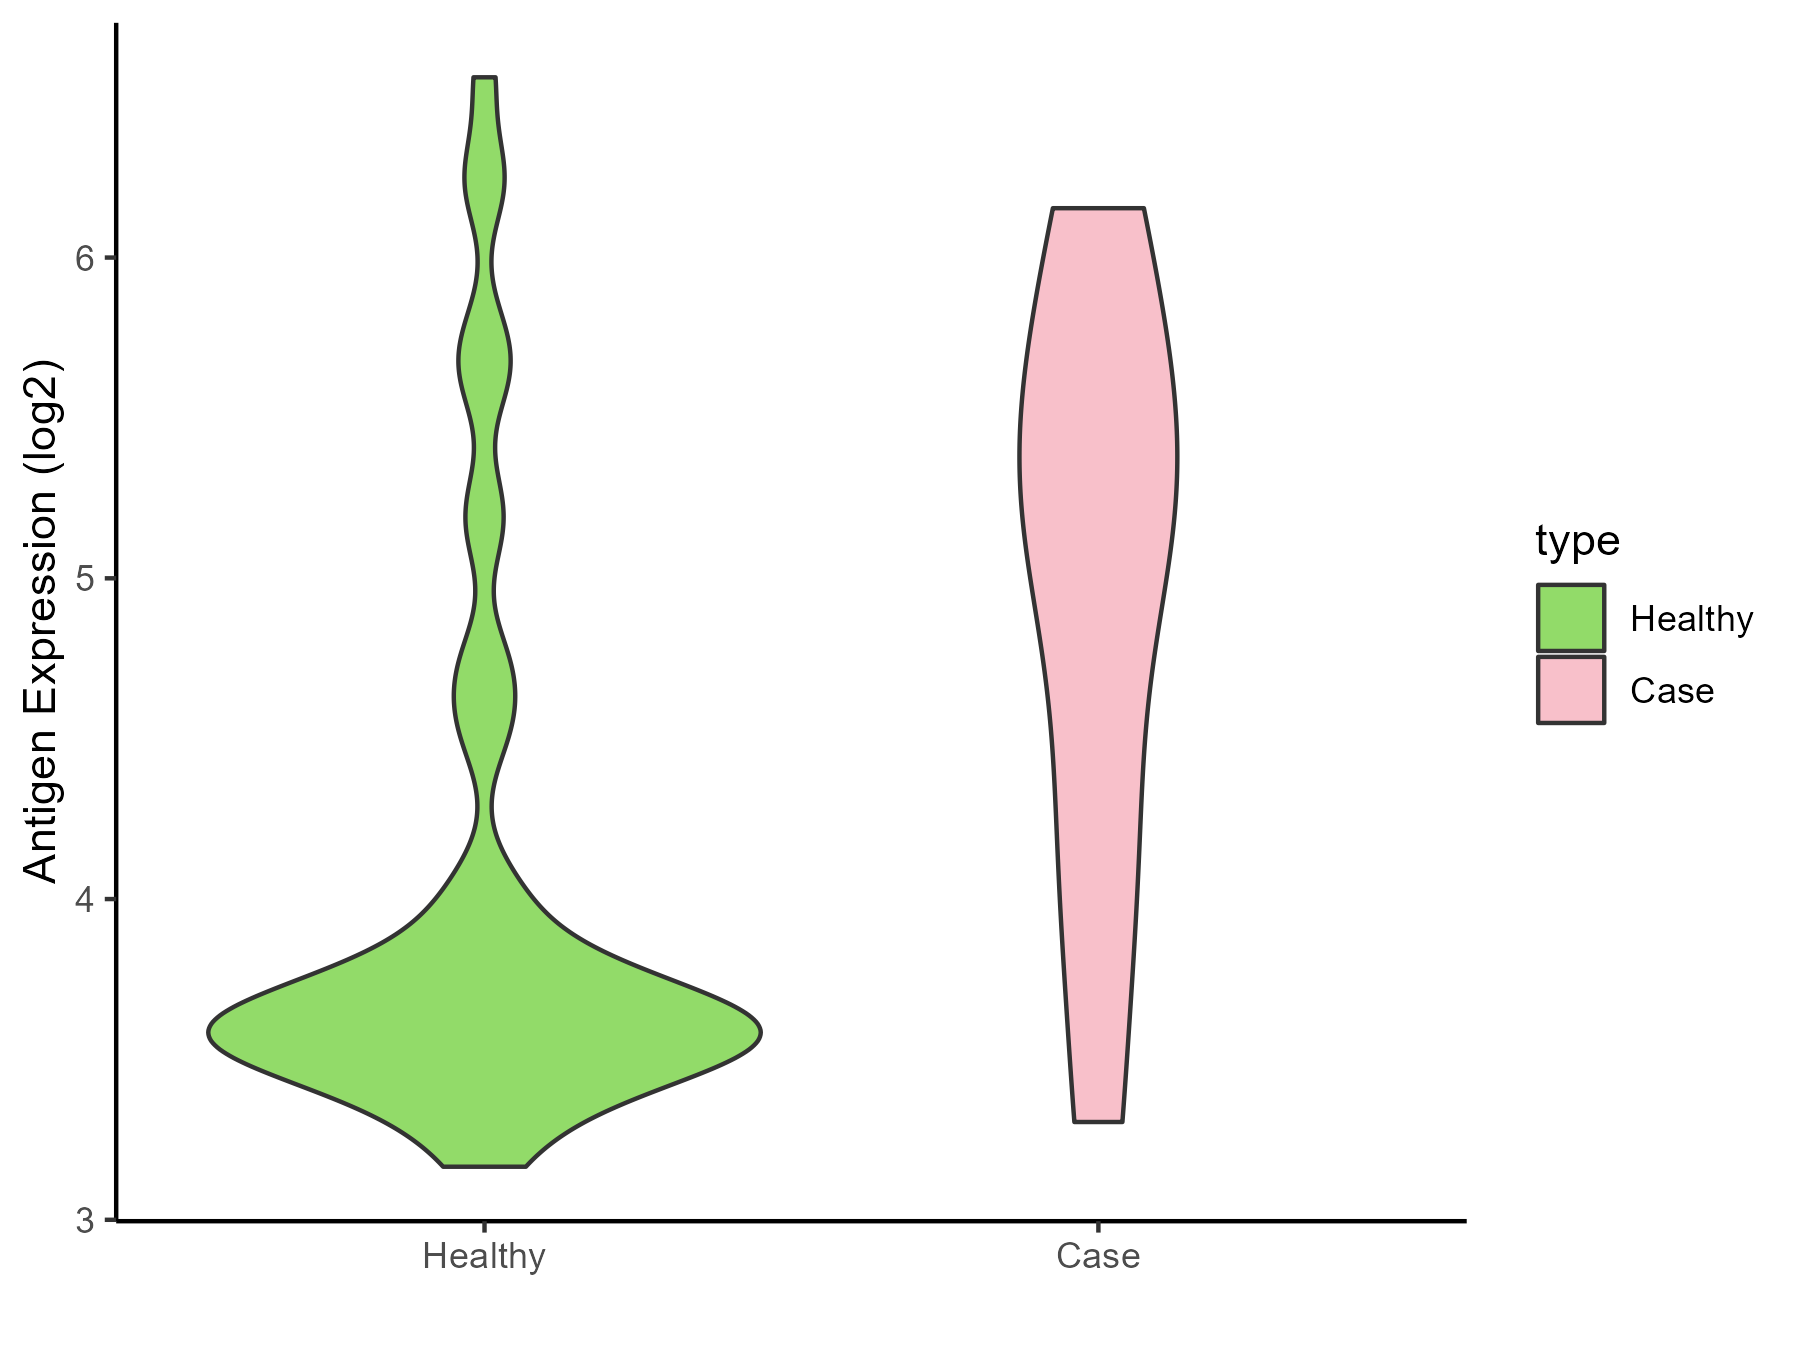
| The Studied Tissue | Whole blood | |
| The Specific Disease | Familial hypercholesterolemia | |
| The Expression Level of Disease Section Compare with the Healthy Individual Tissue | p-value: 0.012552475; Fold-change: 1.549144397; Z-score: 1.844369003 | |
| Disease-specific Antigen Abundances |
|
Click to View the Clearer Original Diagram |
ICD Disease Classification 06
| Differential expression pattern of antigen in diseases | ||
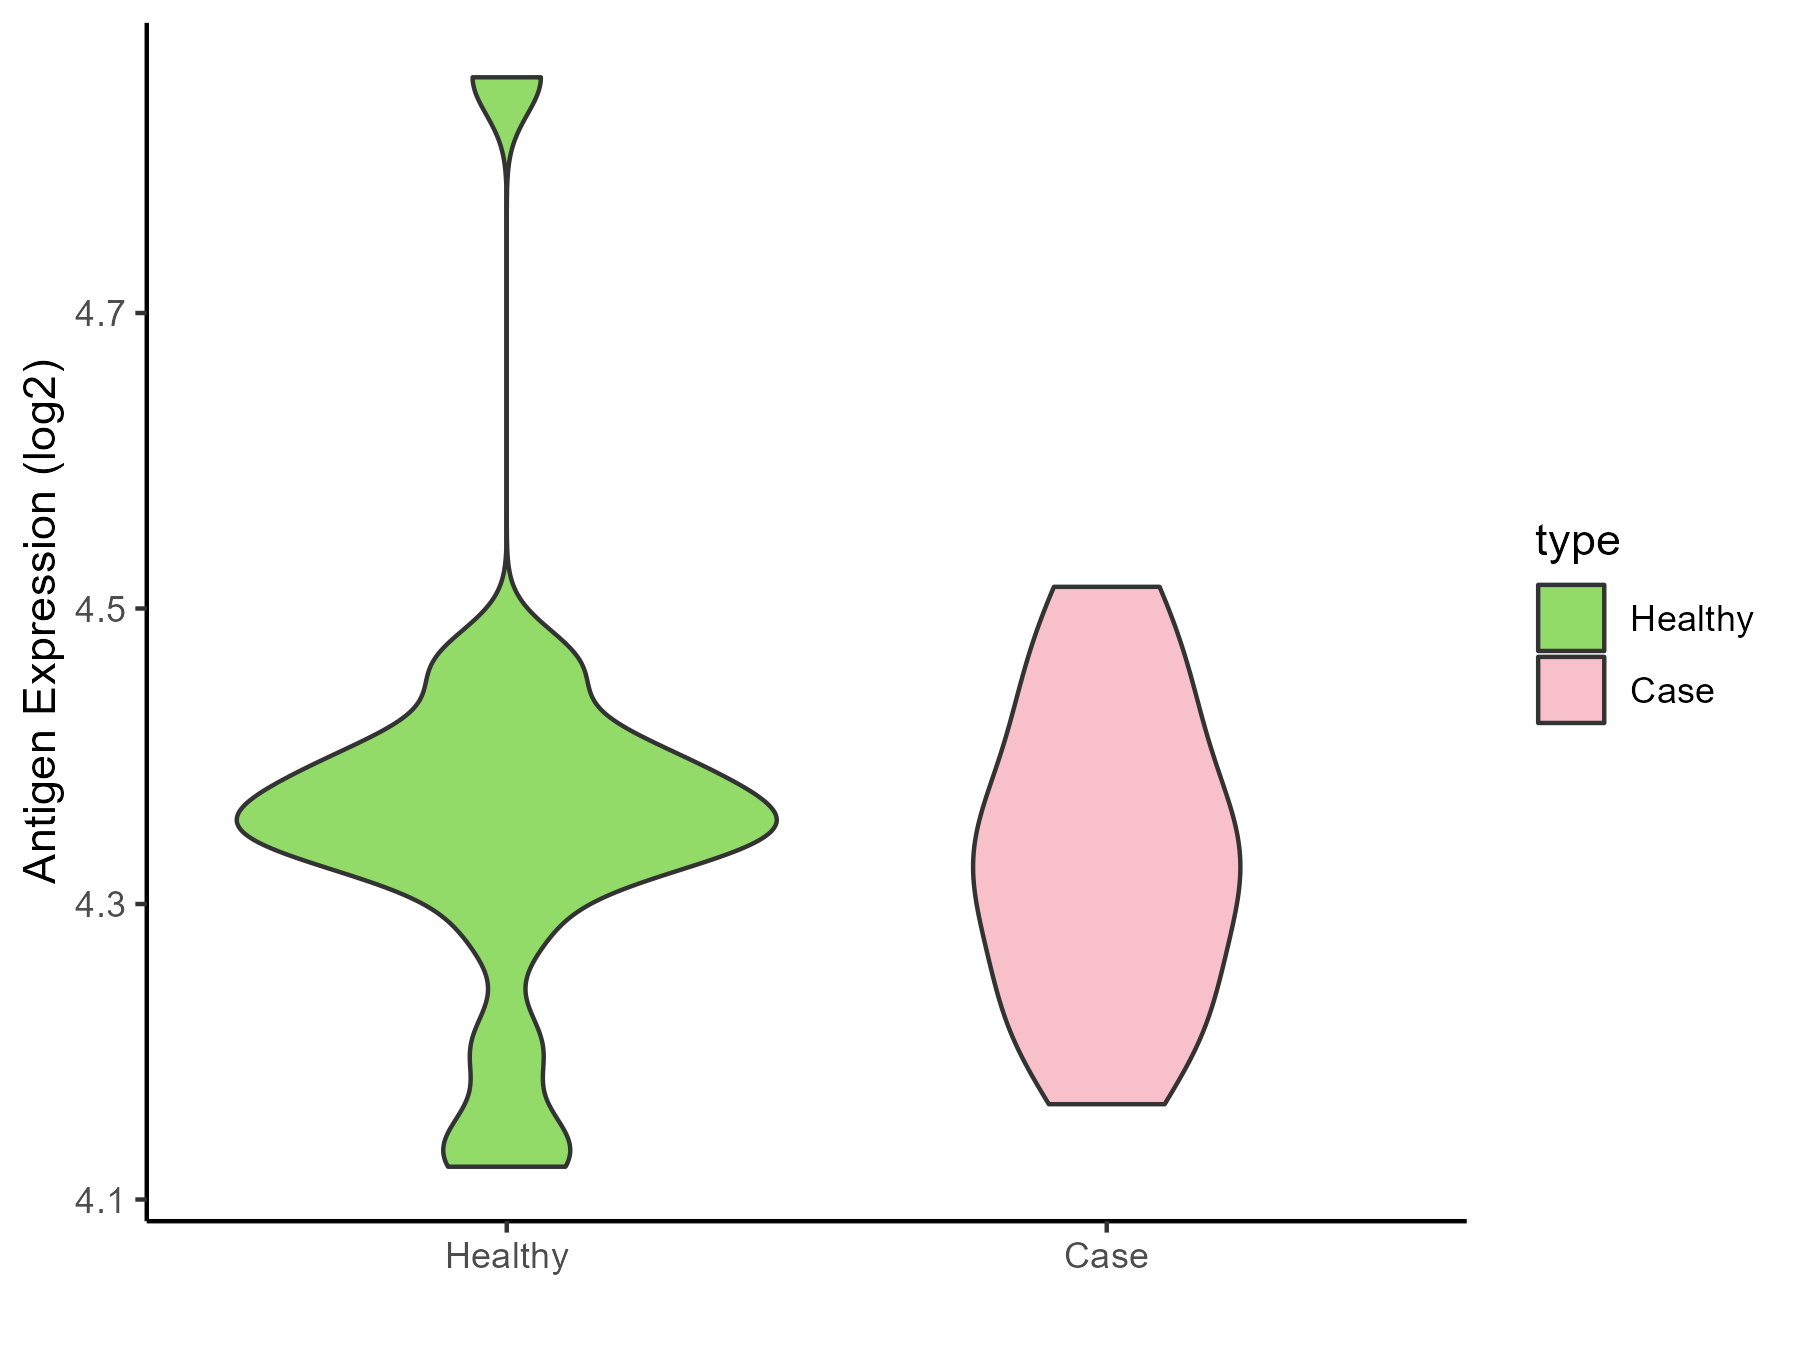
| The Studied Tissue | Superior temporal cortex | |
| The Specific Disease | Schizophrenia | |
| The Expression Level of Disease Section Compare with the Healthy Individual Tissue | p-value: 0.486121394; Fold-change: -0.024397299; Z-score: -0.161098346 | |
| Disease-specific Antigen Abundances |
|
Click to View the Clearer Original Diagram |
ICD Disease Classification 08
| Differential expression pattern of antigen in diseases | ||
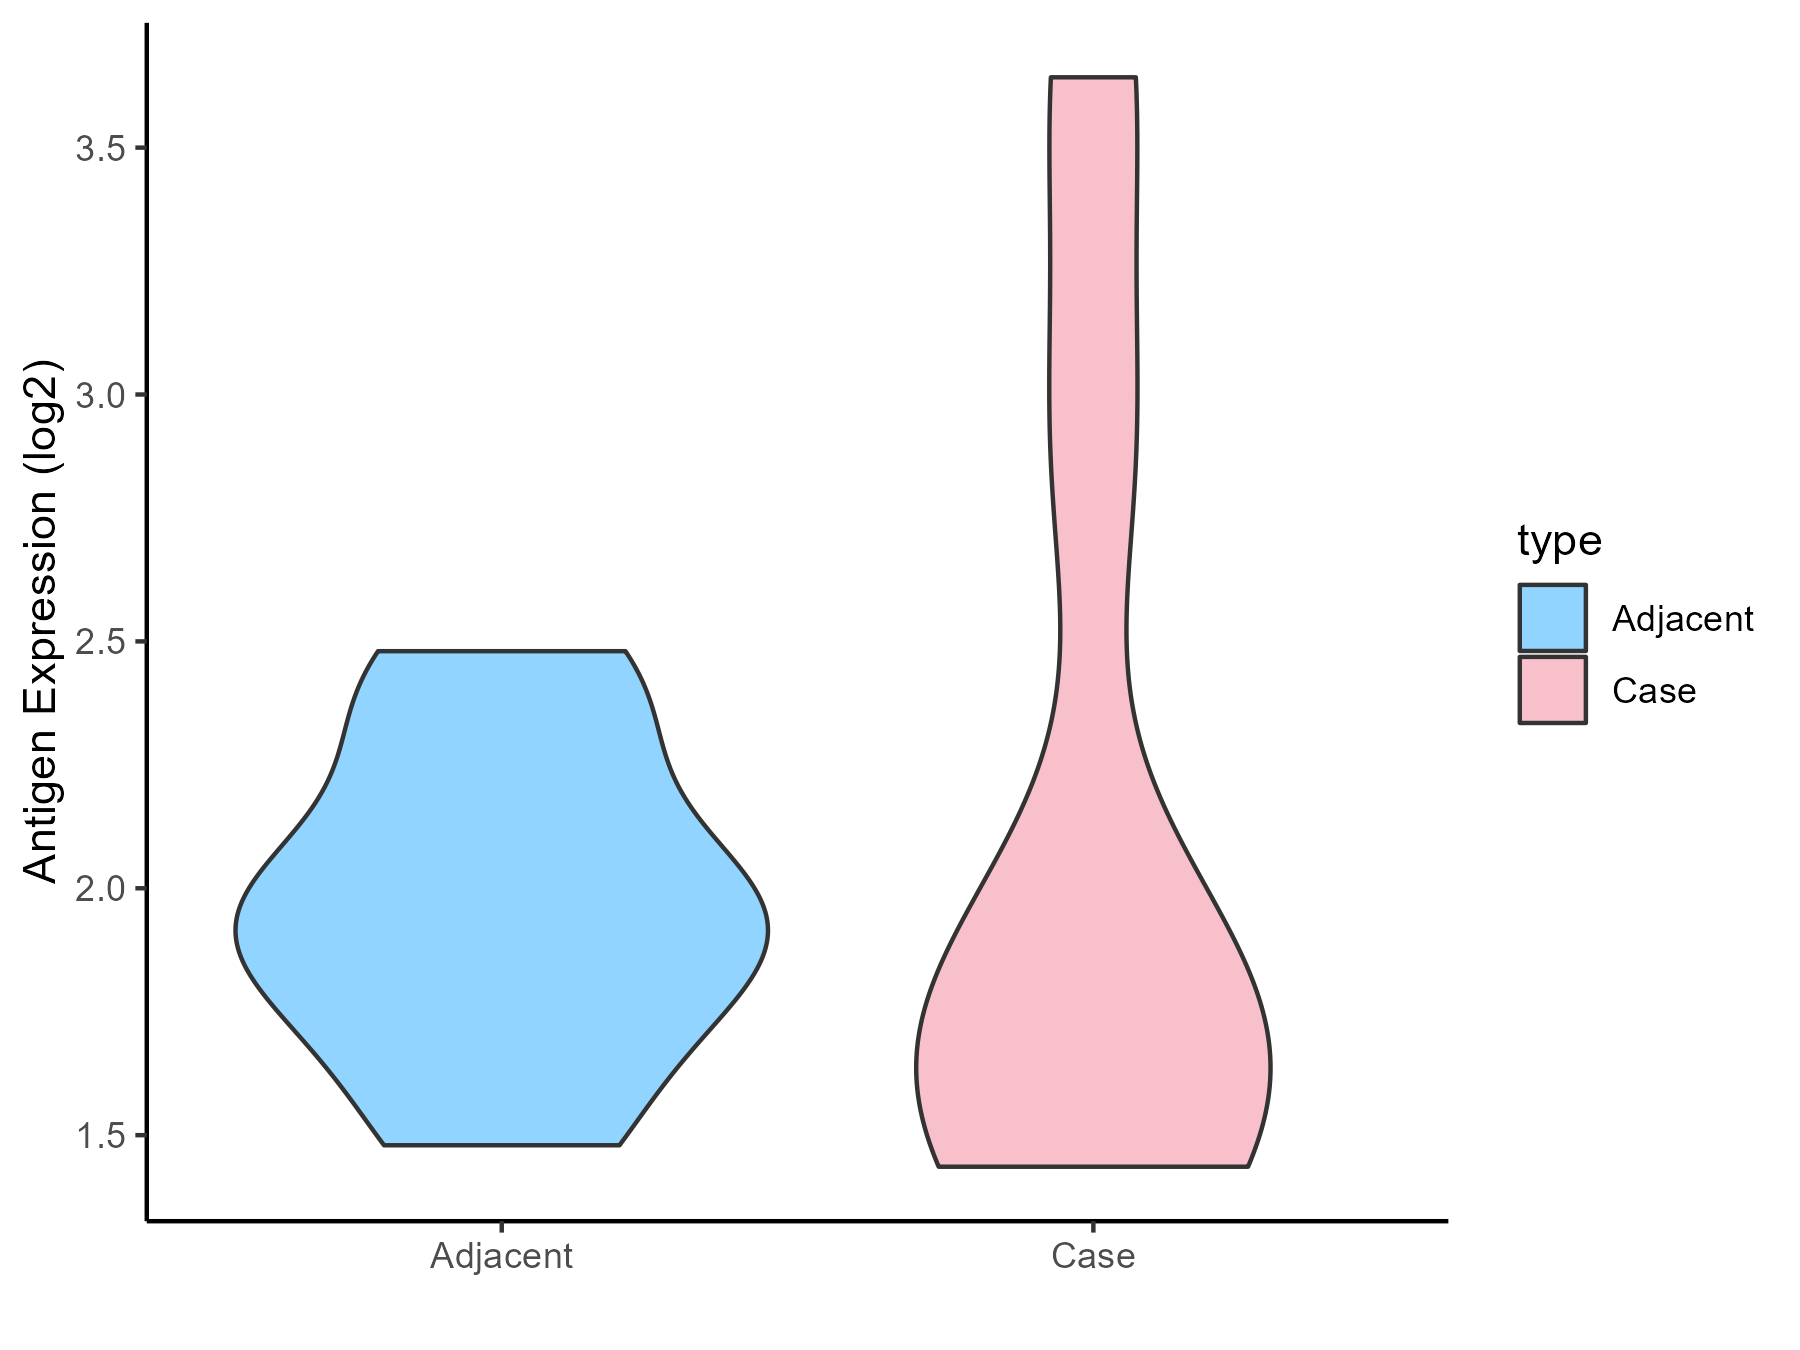
| The Studied Tissue | Spinal cord | |
| The Specific Disease | Multiple sclerosis | |
| The Expression Level of Disease Section Compare with the Adjacent Tissue | p-value: 0.721060163; Fold-change: -0.208128332; Z-score: -0.618195493 | |
| Disease-specific Antigen Abundances |
|
Click to View the Clearer Original Diagram |
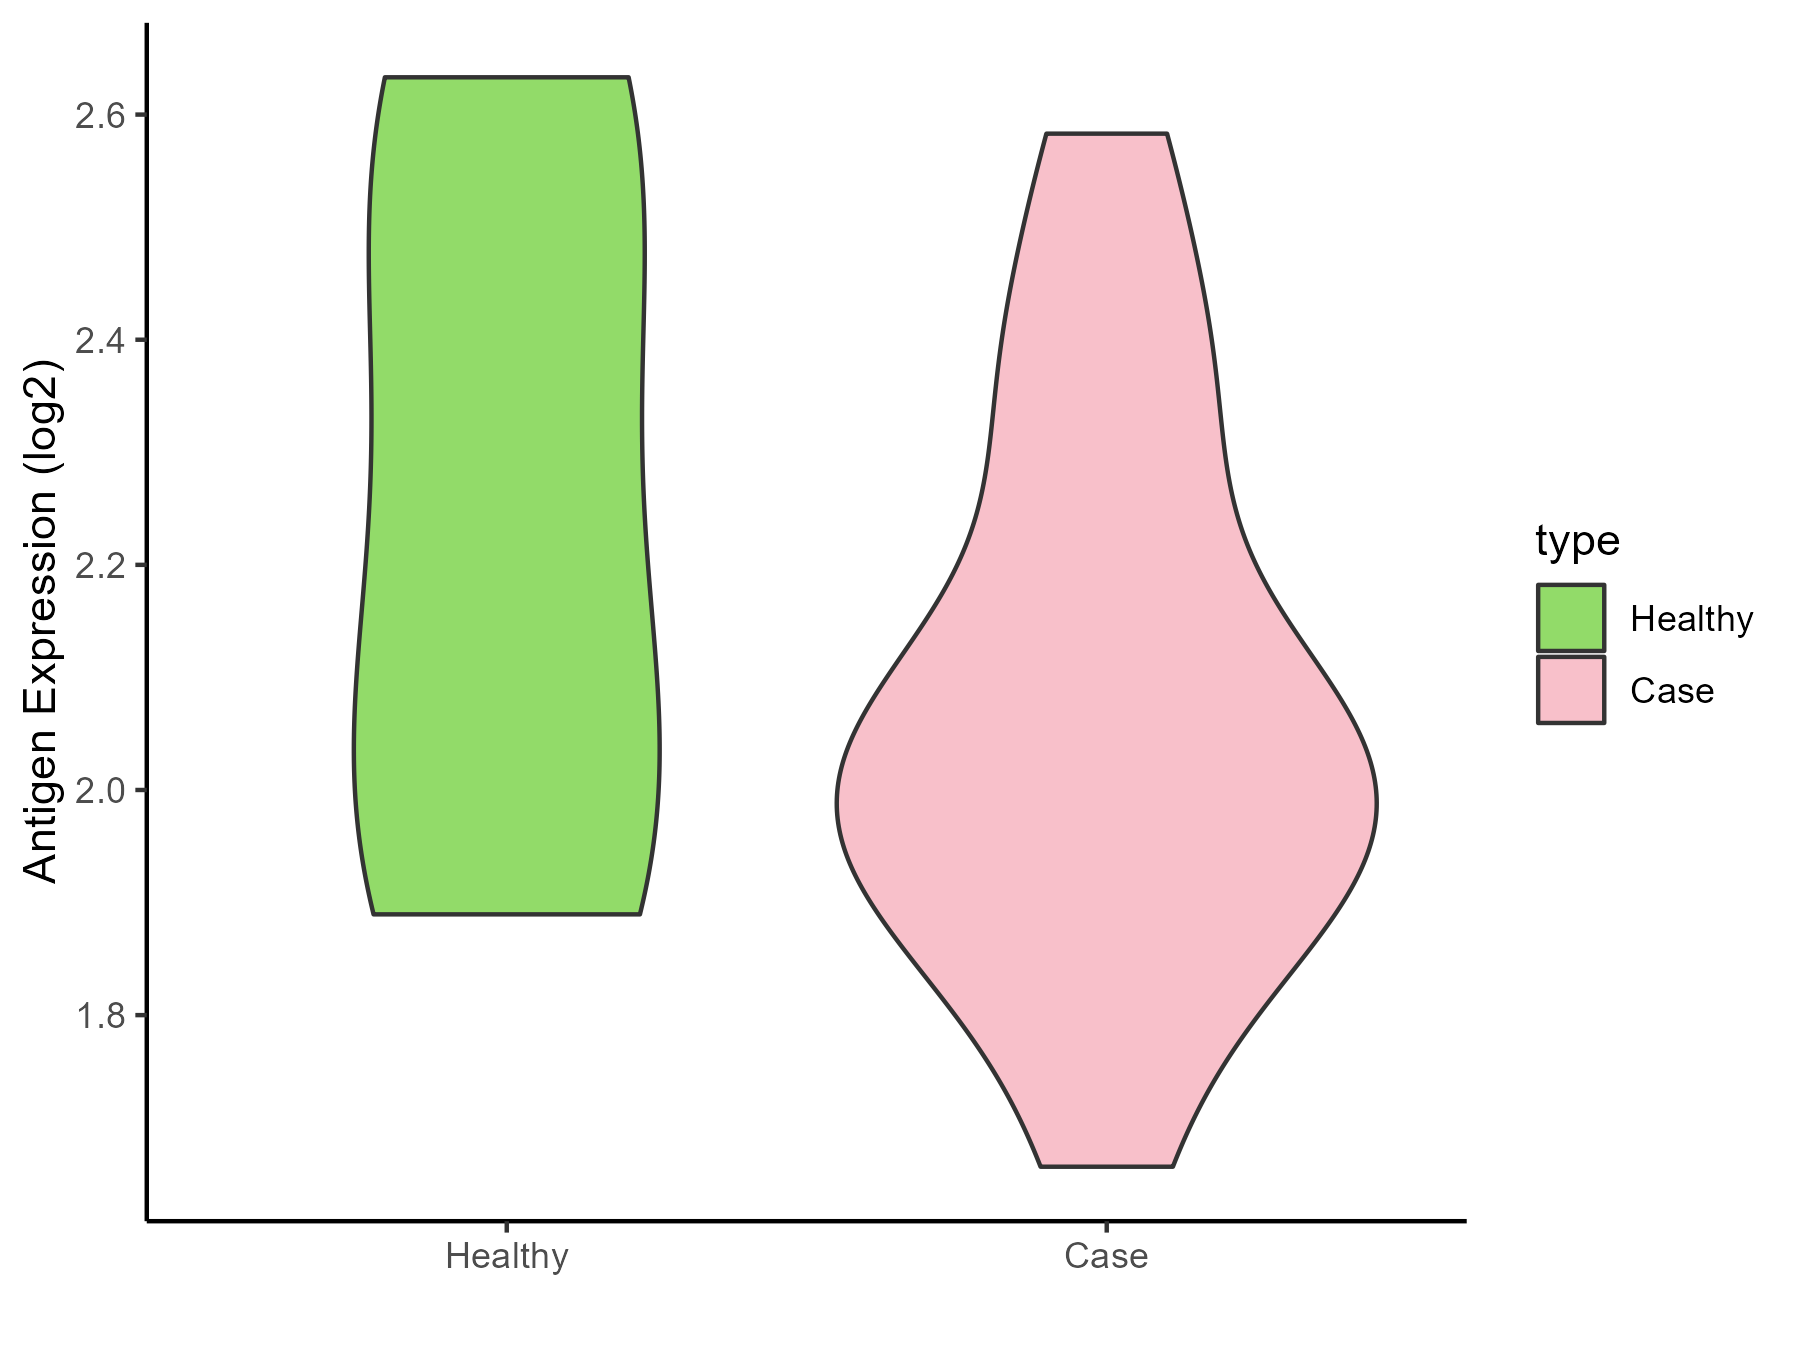
| The Studied Tissue | Plasmacytoid dendritic cells | |
| The Specific Disease | Multiple sclerosis | |
| The Expression Level of Disease Section Compare with the Healthy Individual Tissue | p-value: 0.270374951; Fold-change: -0.19462599; Z-score: -0.615015968 | |
| Disease-specific Antigen Abundances |
|
Click to View the Clearer Original Diagram |
| Differential expression pattern of antigen in diseases | ||
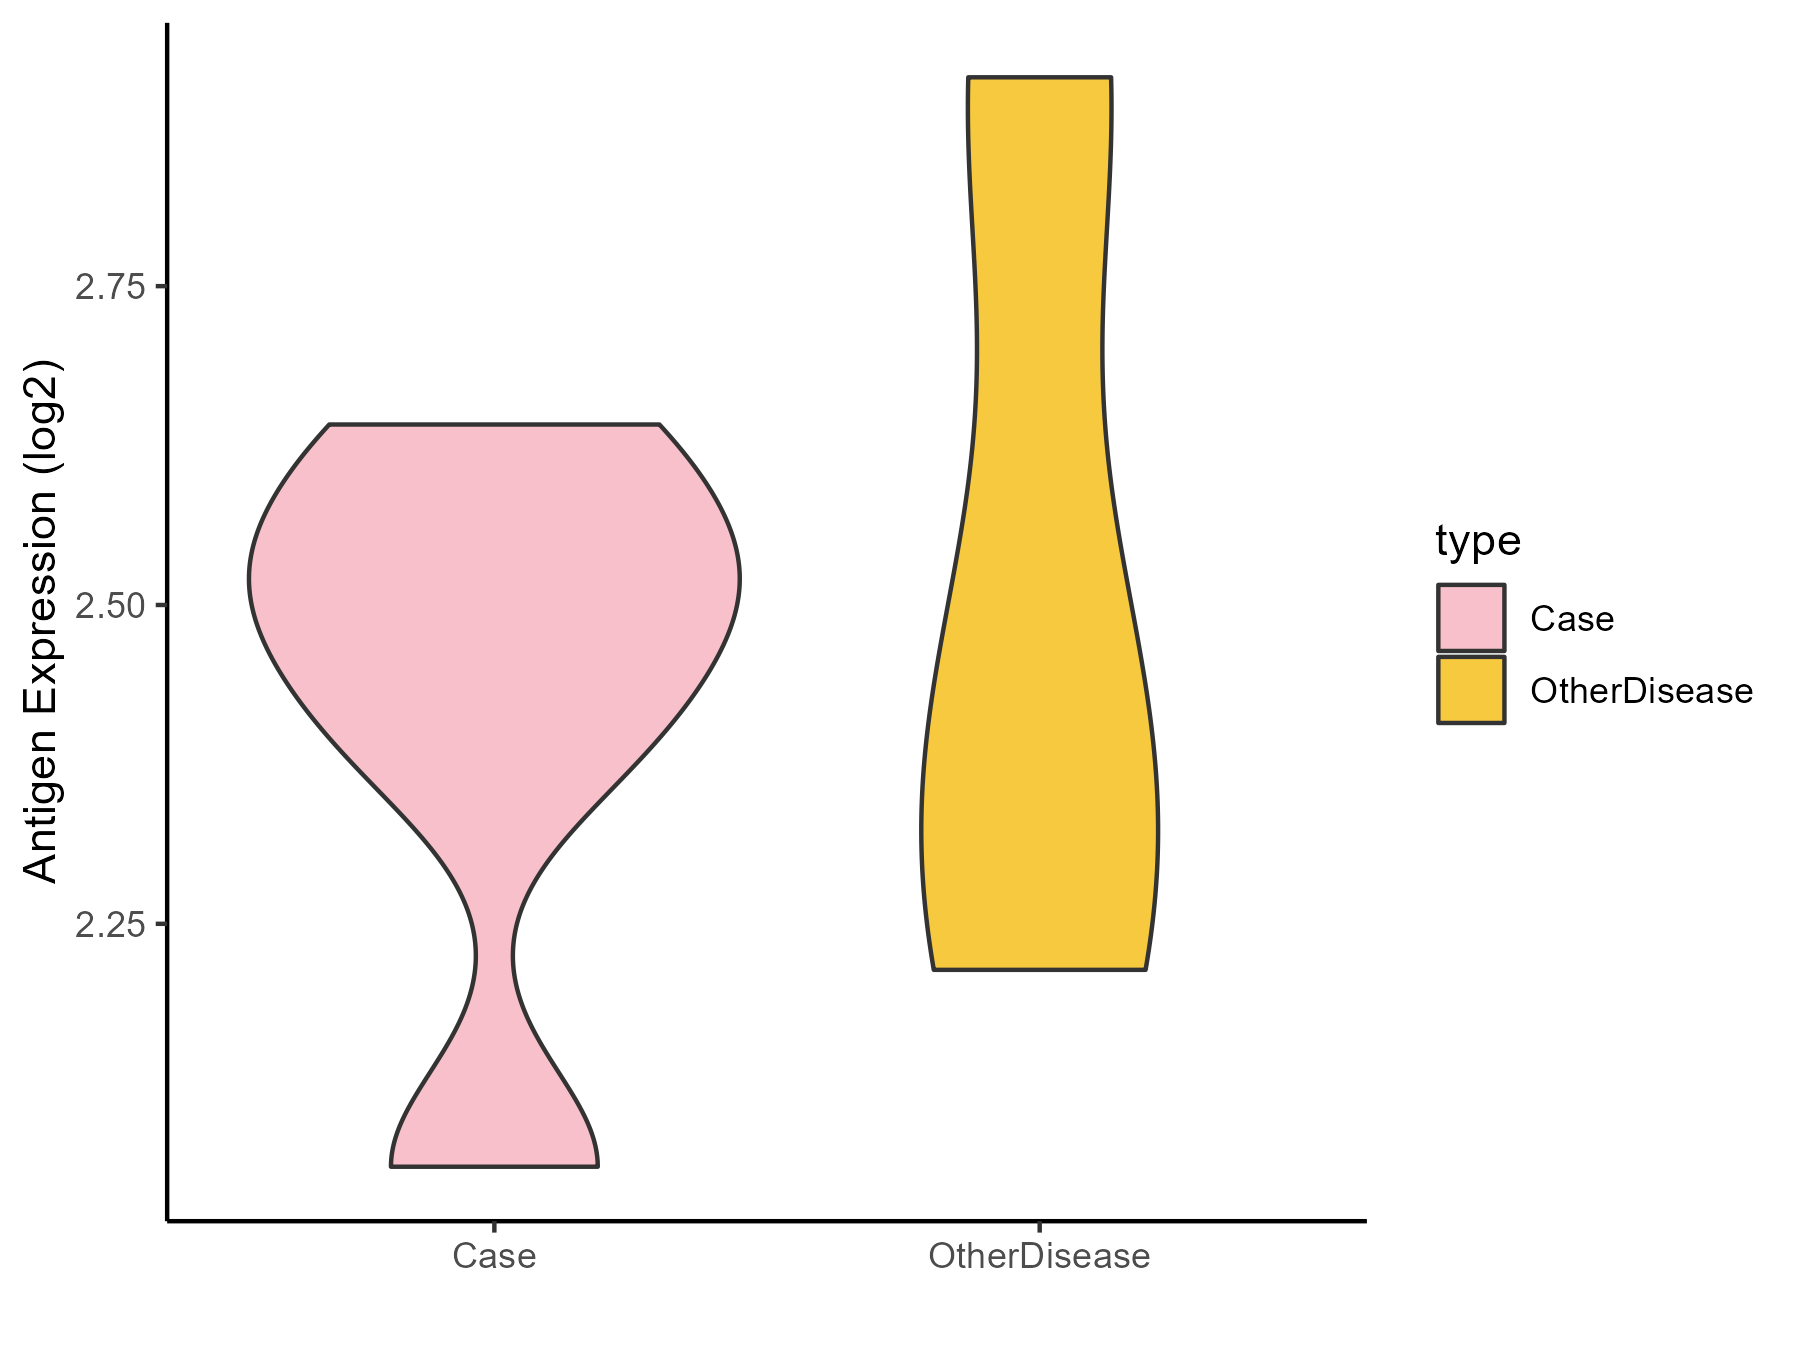
| The Studied Tissue | Peritumoral cortex | |
| The Specific Disease | Epilepsy | |
| The Expression Level of Disease Section Compare with the Other Disease Section | p-value: 0.717977308; Fold-change: 0.064797974; Z-score: 0.180502055 | |
| Disease-specific Antigen Abundances |
|
Click to View the Clearer Original Diagram |
| Differential expression pattern of antigen in diseases | ||
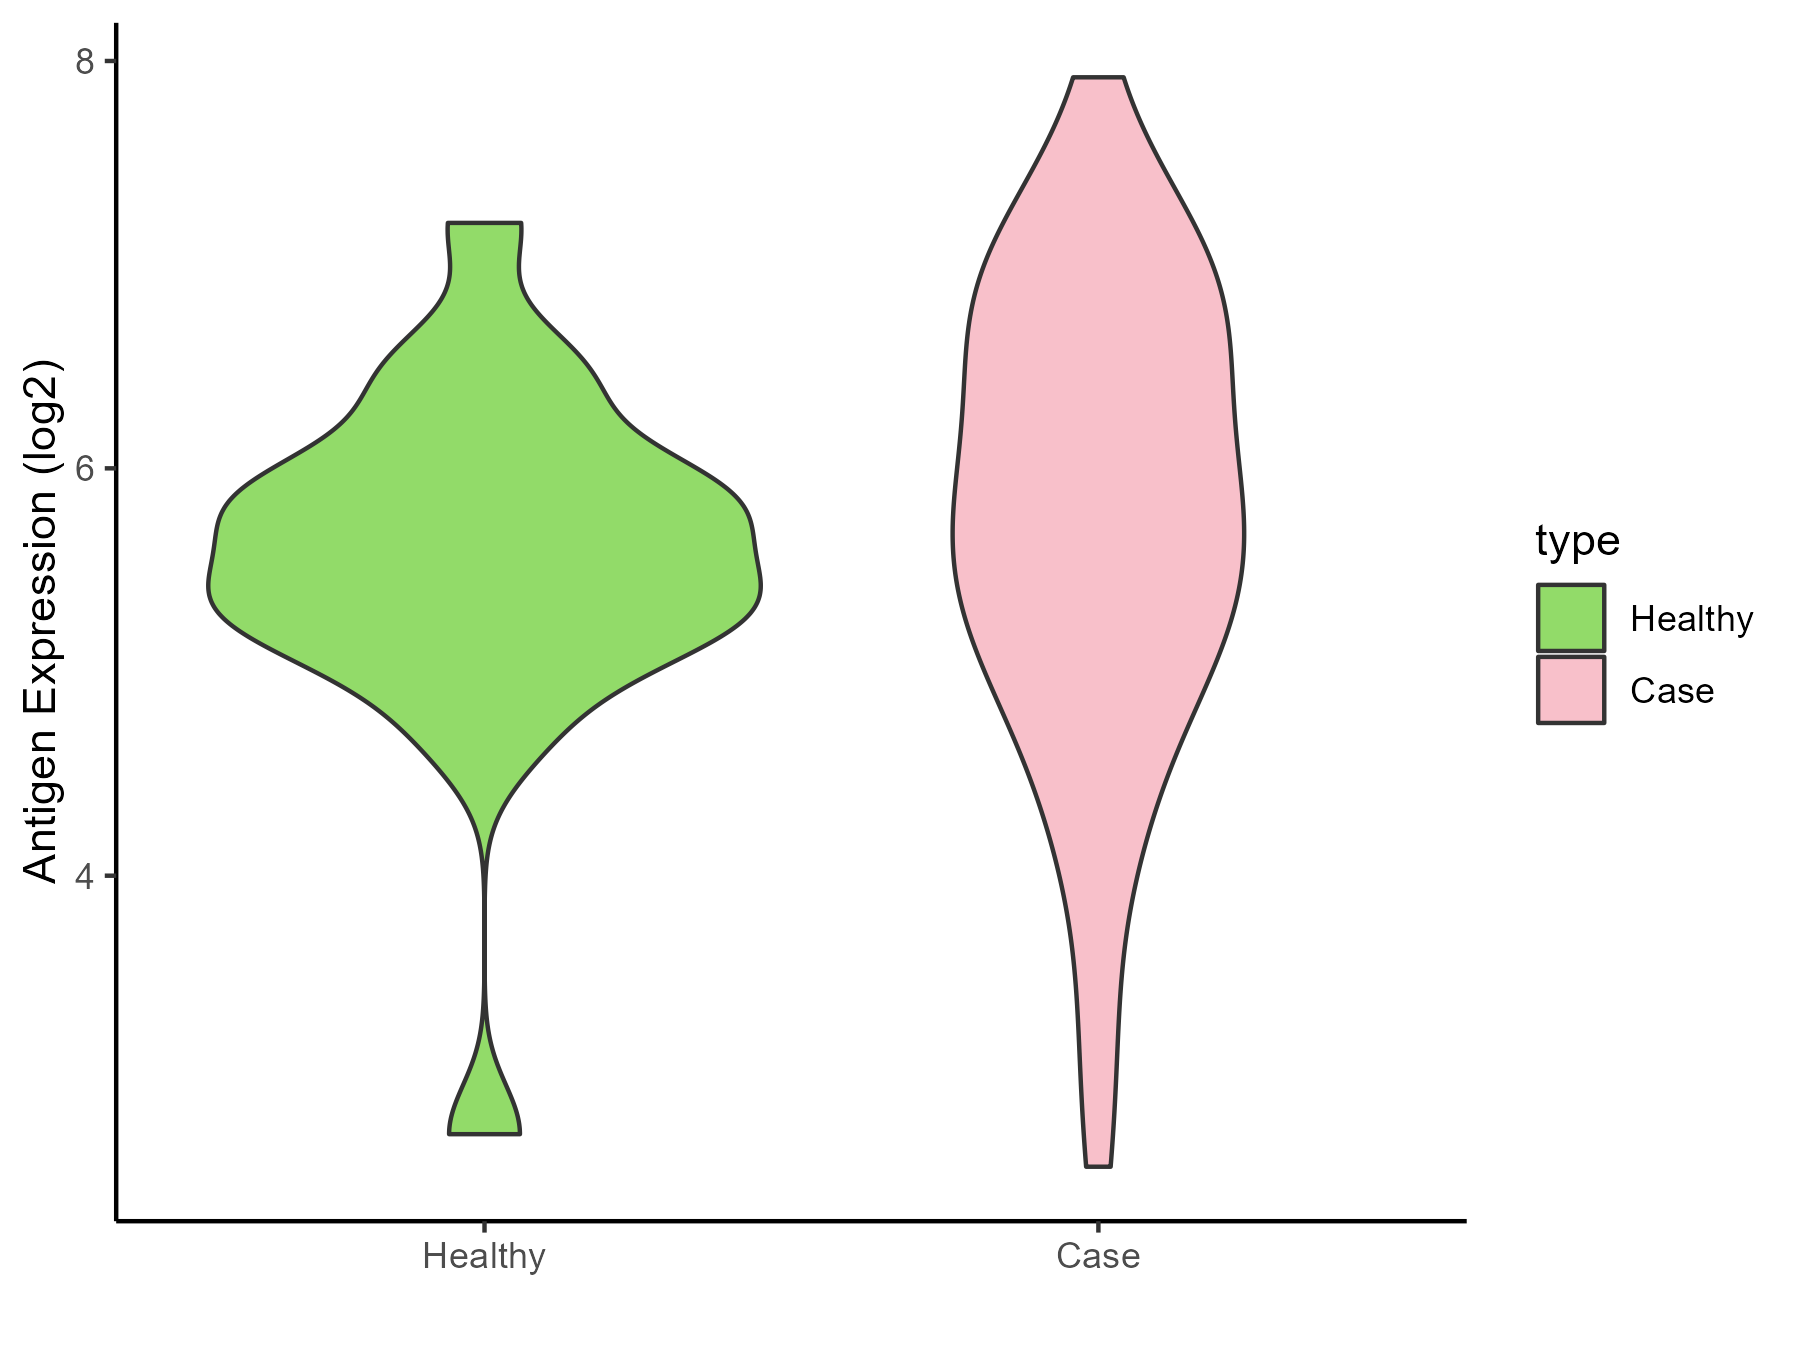
| The Studied Tissue | Whole blood | |
| The Specific Disease | Cardioembolic Stroke | |
| The Expression Level of Disease Section Compare with the Healthy Individual Tissue | p-value: 0.362929404; Fold-change: 0.234515577; Z-score: 0.266099785 | |
| Disease-specific Antigen Abundances |
|
Click to View the Clearer Original Diagram |
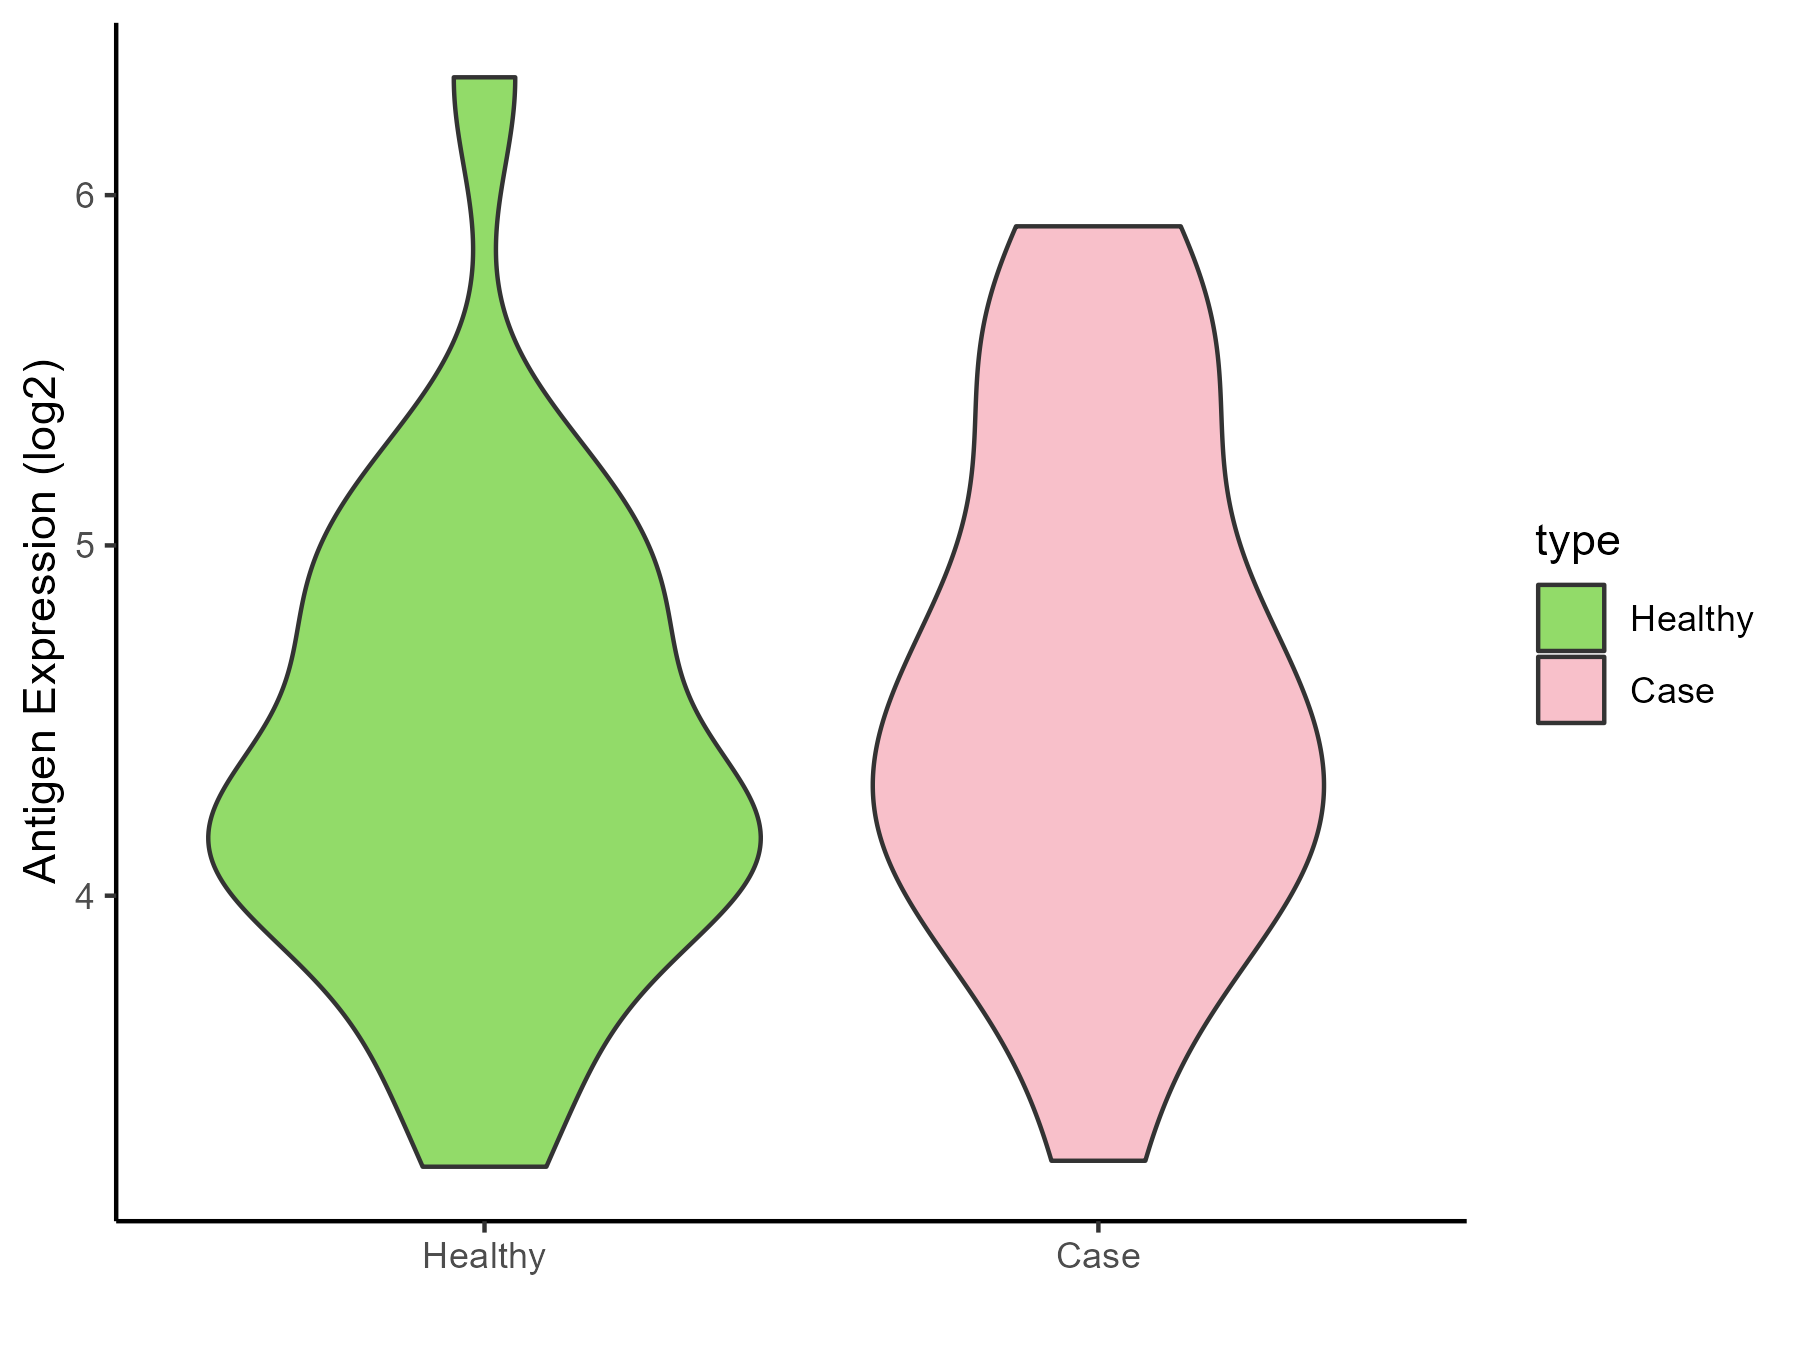
| The Studied Tissue | Peripheral blood | |
| The Specific Disease | Ischemic stroke | |
| The Expression Level of Disease Section Compare with the Healthy Individual Tissue | p-value: 0.415009492; Fold-change: 0.253544121; Z-score: 0.360524561 | |
| Disease-specific Antigen Abundances |
|
Click to View the Clearer Original Diagram |
ICD Disease Classification 1
| Differential expression pattern of antigen in diseases | ||
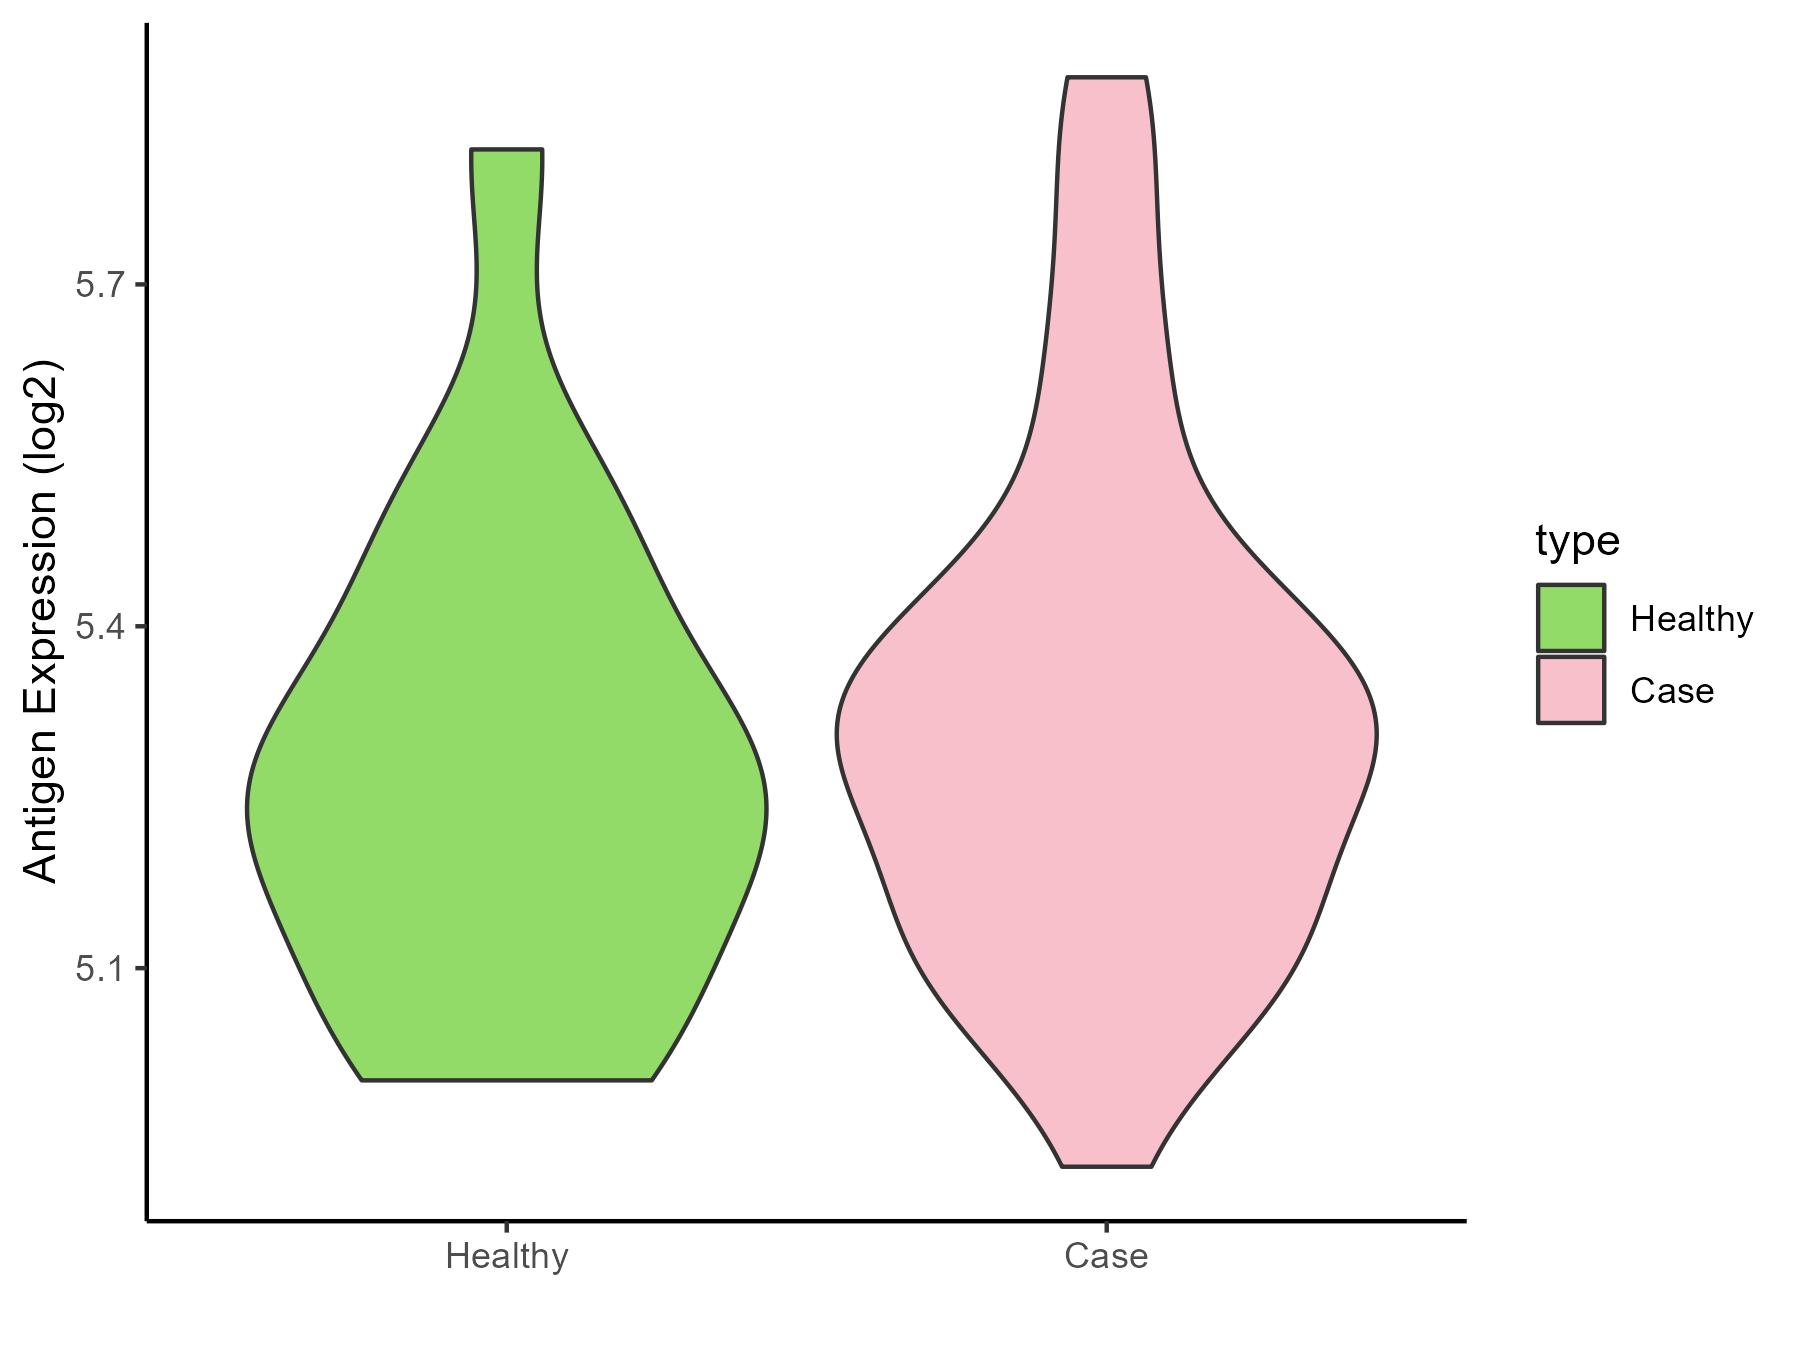
| The Studied Tissue | White matter | |
| The Specific Disease | HIV | |
| The Expression Level of Disease Section Compare with the Healthy Individual Tissue | p-value: 0.48160986; Fold-change: 0.046706679; Z-score: 0.215818578 | |
| Disease-specific Antigen Abundances |
|
Click to View the Clearer Original Diagram |
| Differential expression pattern of antigen in diseases | ||
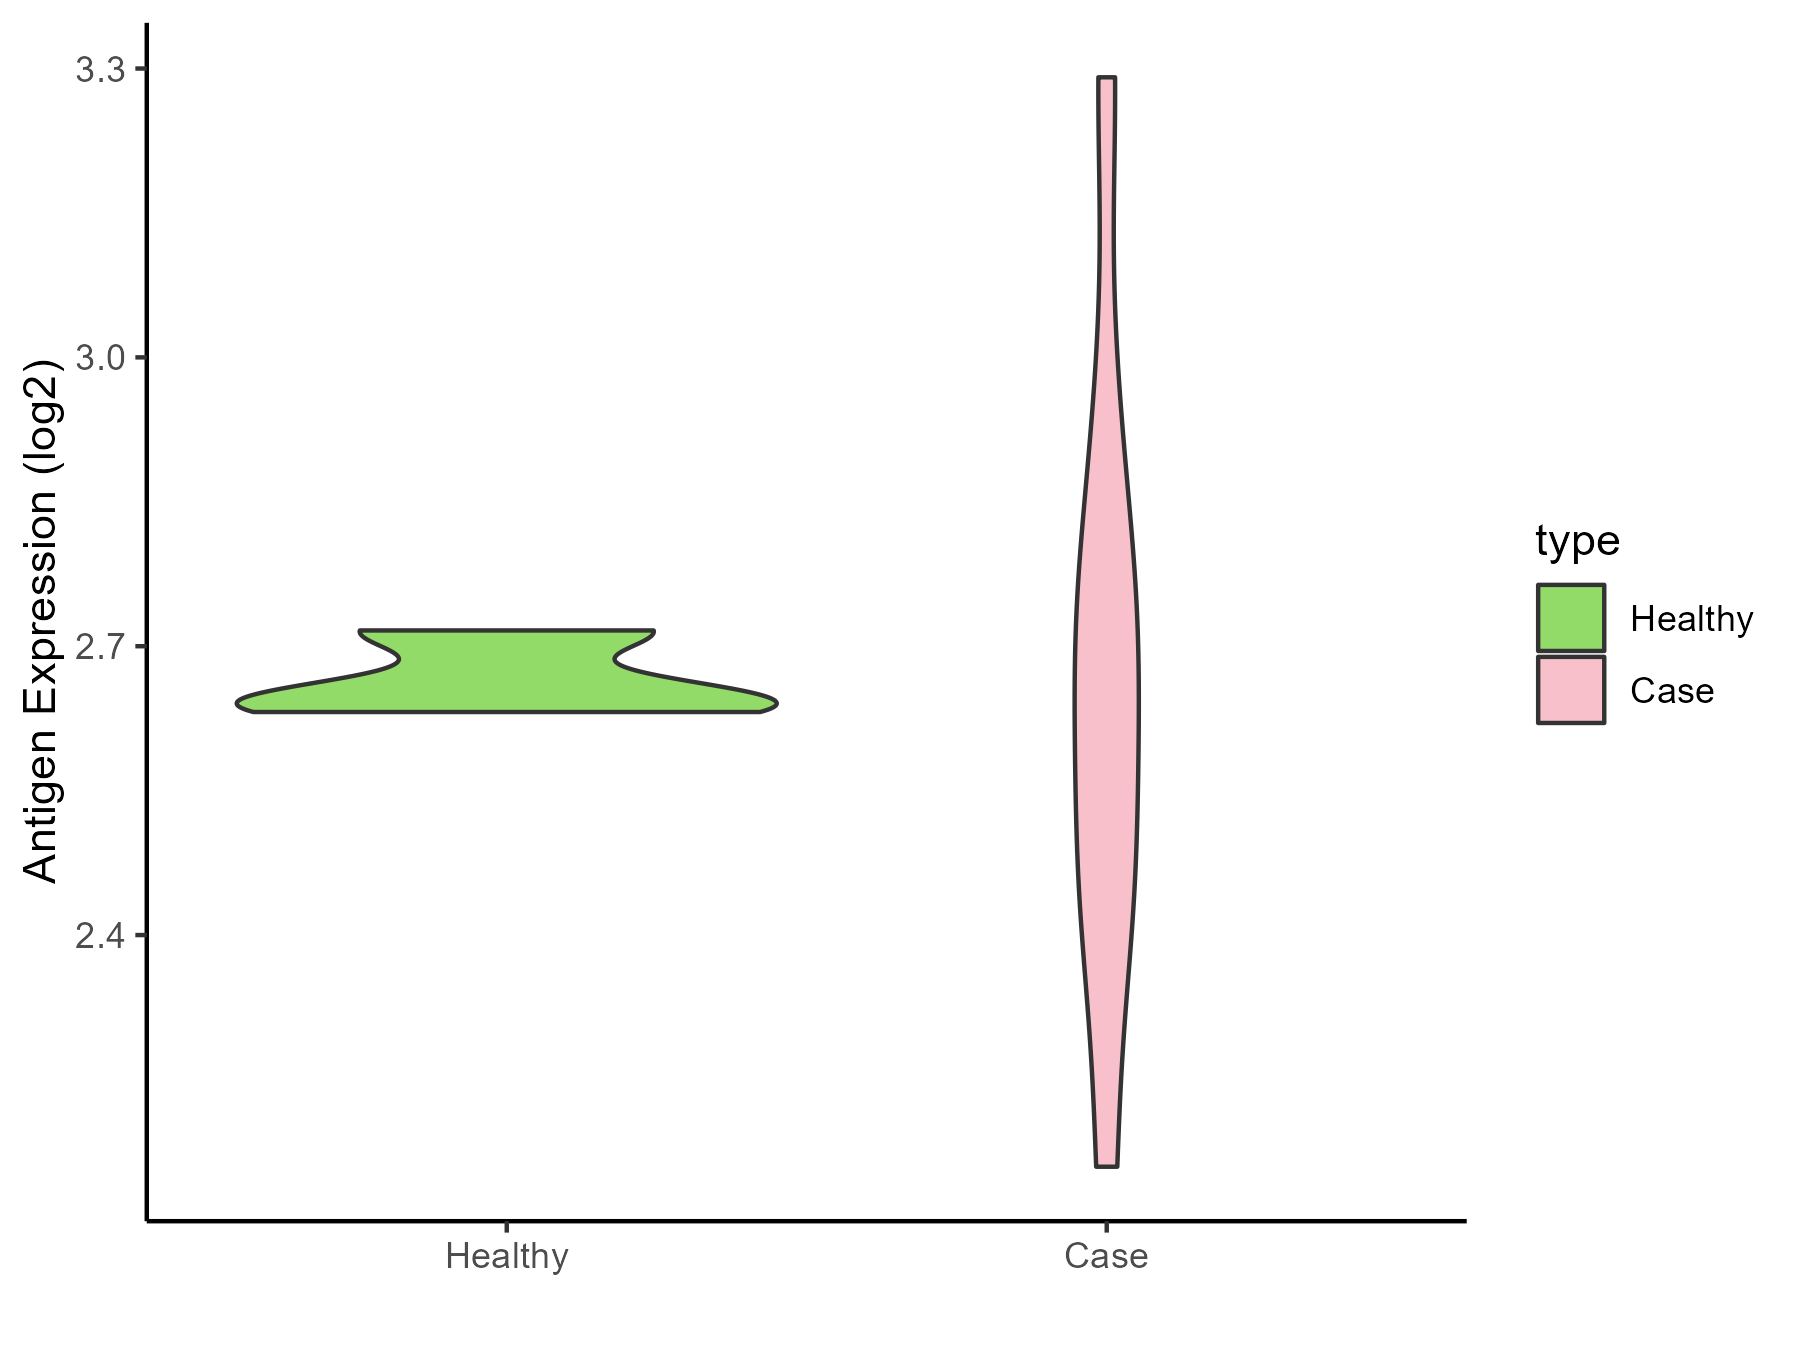
| The Studied Tissue | Whole blood | |
| The Specific Disease | Influenza | |
| The Expression Level of Disease Section Compare with the Healthy Individual Tissue | p-value: 0.93480035; Fold-change: 0.040640398; Z-score: 0.90847413 | |
| Disease-specific Antigen Abundances |
|
Click to View the Clearer Original Diagram |
| Differential expression pattern of antigen in diseases | ||
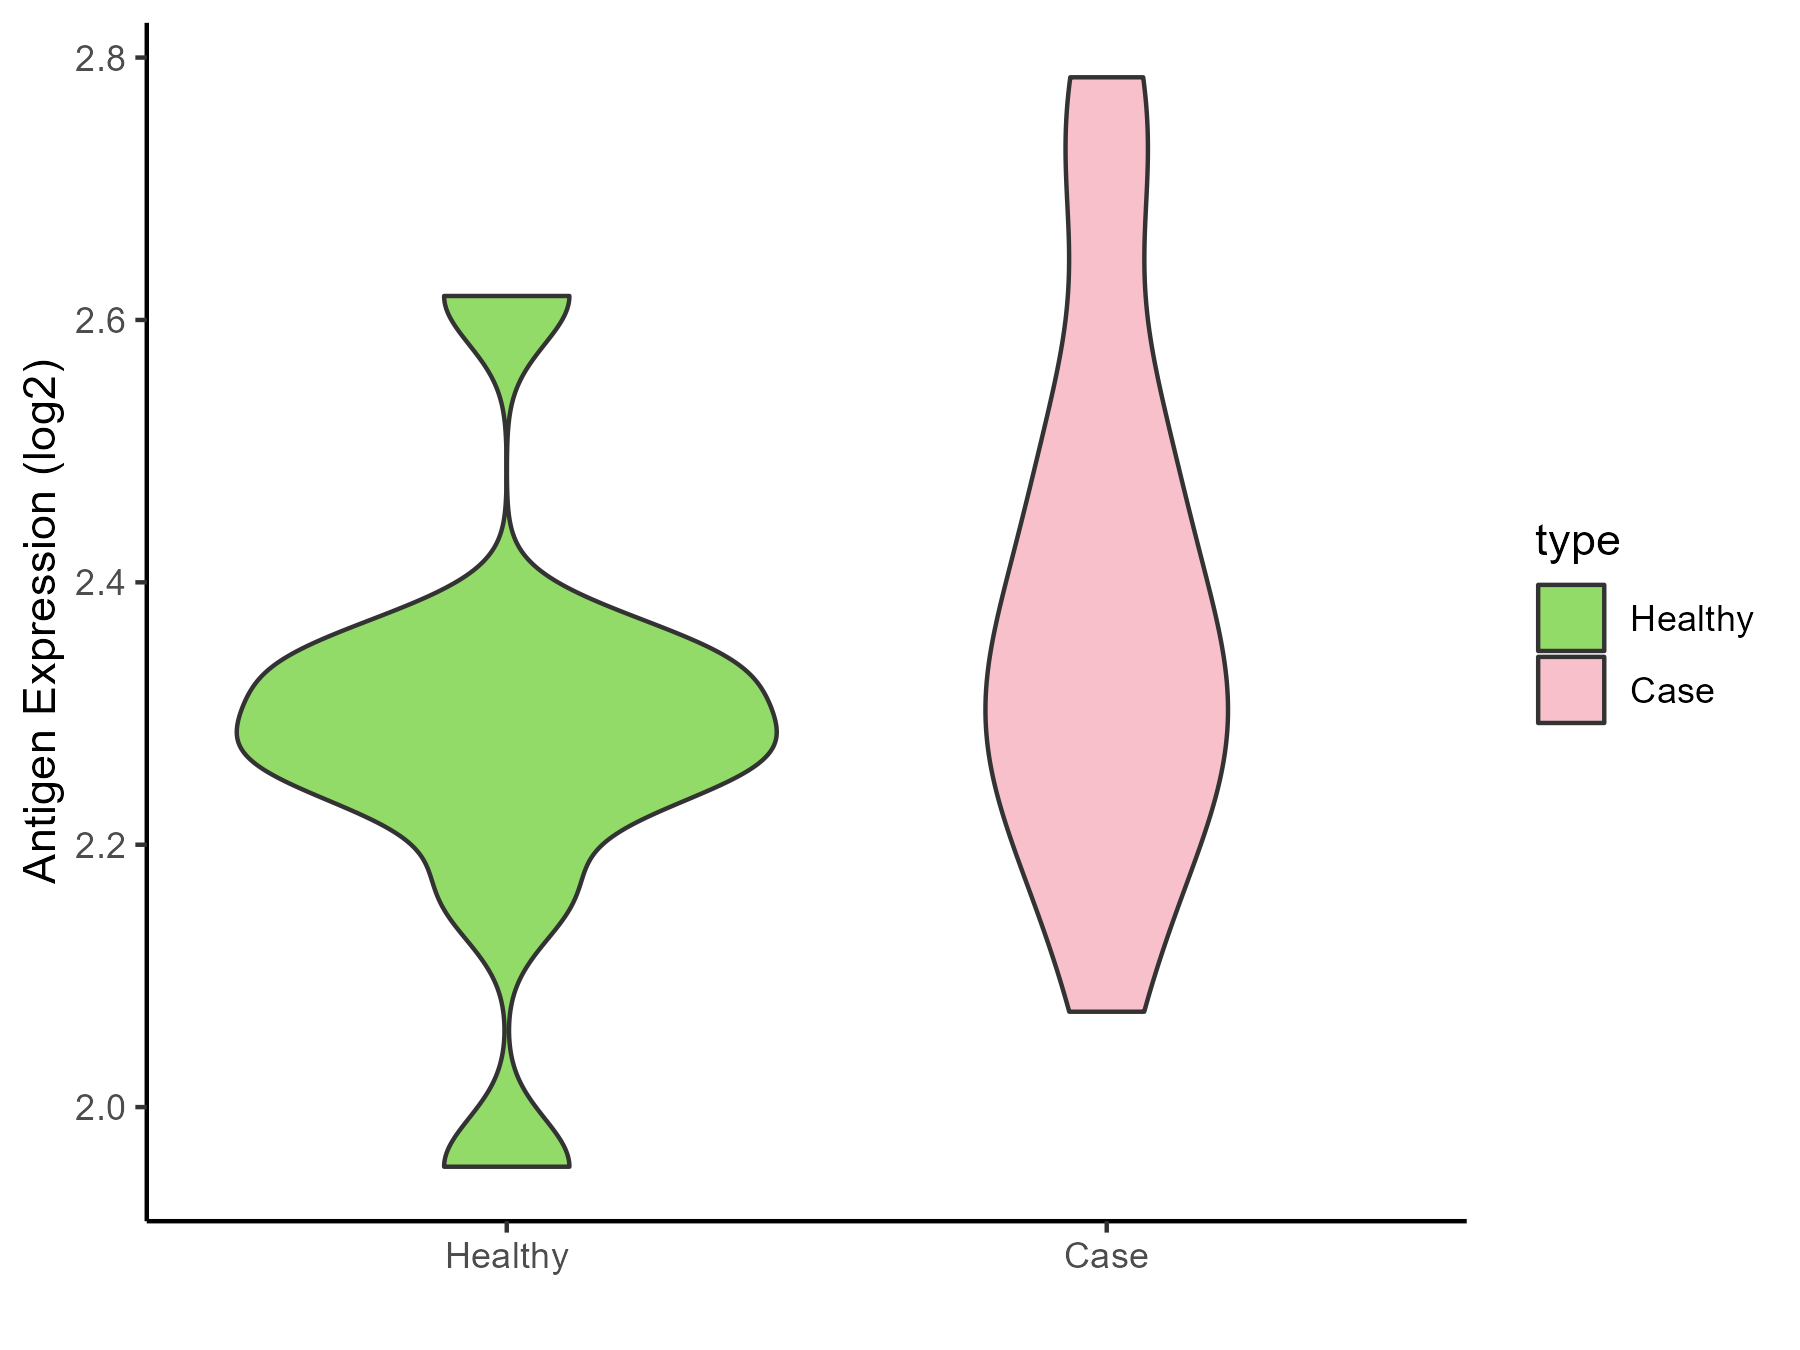
| The Studied Tissue | Whole blood | |
| The Specific Disease | Chronic hepatitis C | |
| The Expression Level of Disease Section Compare with the Healthy Individual Tissue | p-value: 0.142731844; Fold-change: 0.066246043; Z-score: 0.400152553 | |
| Disease-specific Antigen Abundances |
|
Click to View the Clearer Original Diagram |
| Differential expression pattern of antigen in diseases | ||
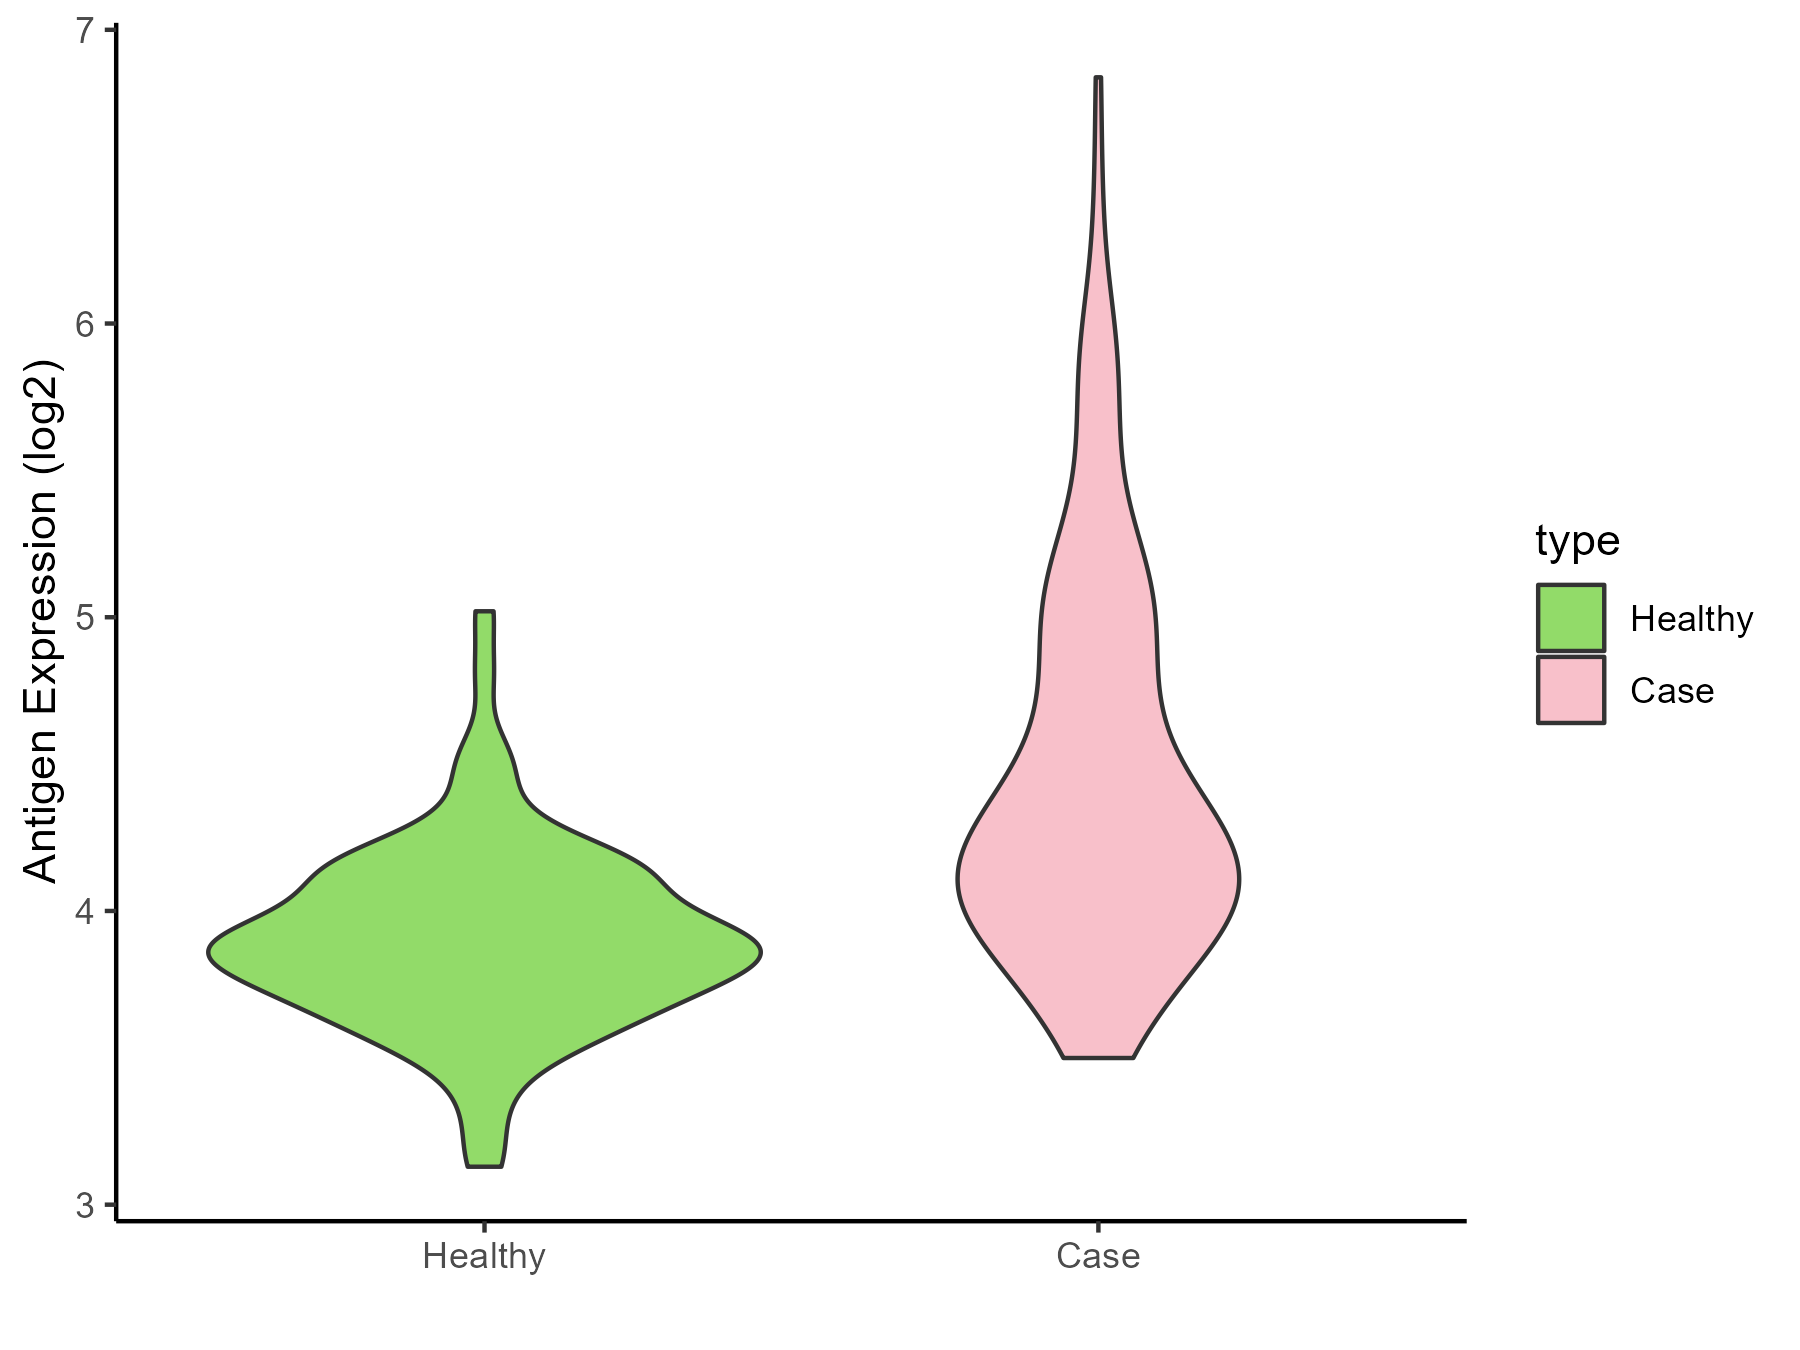
| The Studied Tissue | Whole blood | |
| The Specific Disease | Sepsis | |
| The Expression Level of Disease Section Compare with the Healthy Individual Tissue | p-value: 2.02E-17; Fold-change: 0.385338656; Z-score: 1.246310727 | |
| Disease-specific Antigen Abundances |
|
Click to View the Clearer Original Diagram |
| Differential expression pattern of antigen in diseases | ||
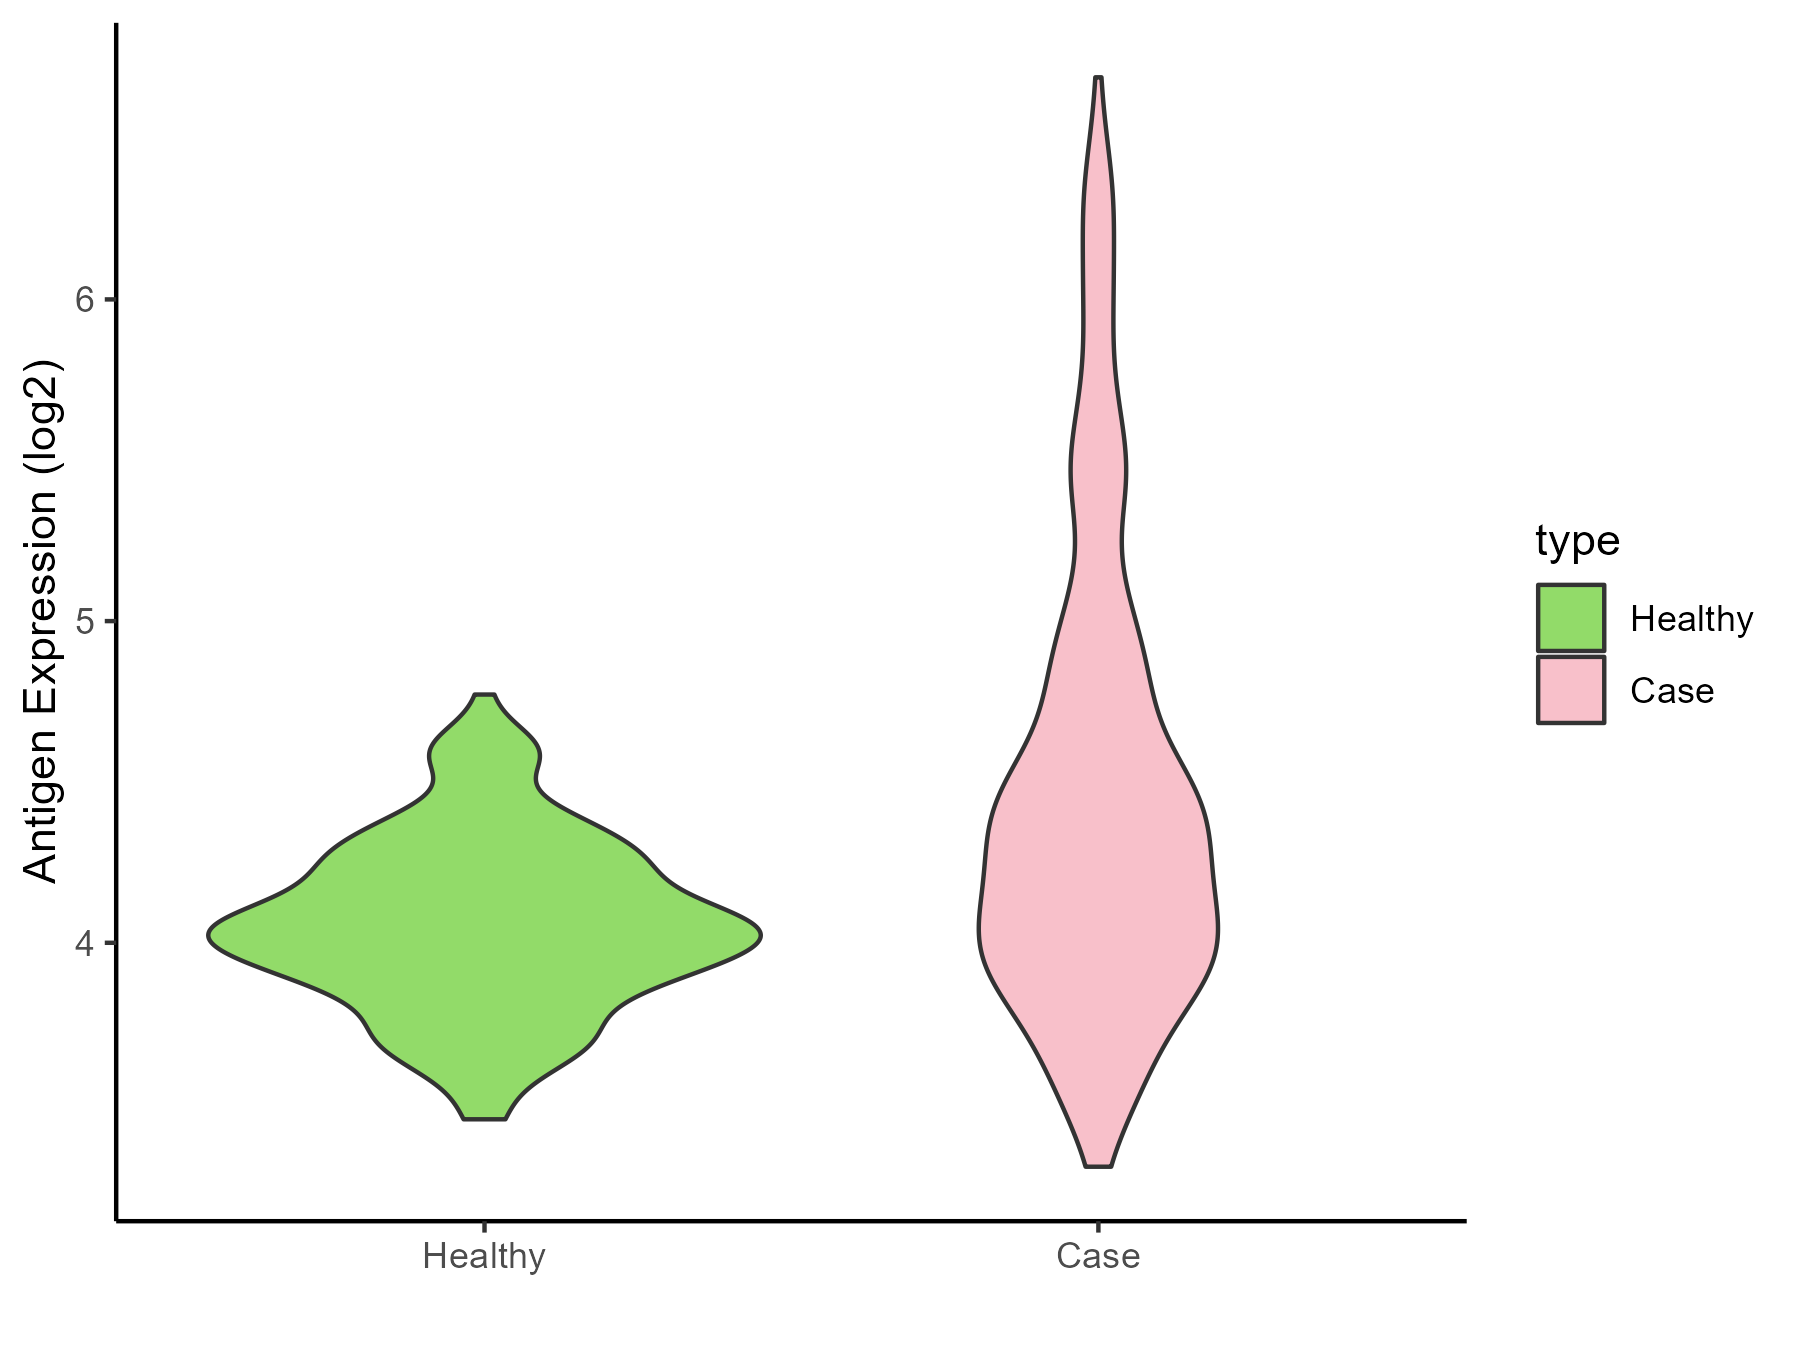
| The Studied Tissue | Whole blood | |
| The Specific Disease | Septic shock | |
| The Expression Level of Disease Section Compare with the Healthy Individual Tissue | p-value: 1.70E-28; Fold-change: 0.260556151; Z-score: 0.984272587 | |
| Disease-specific Antigen Abundances |
|
Click to View the Clearer Original Diagram |
| Differential expression pattern of antigen in diseases | ||
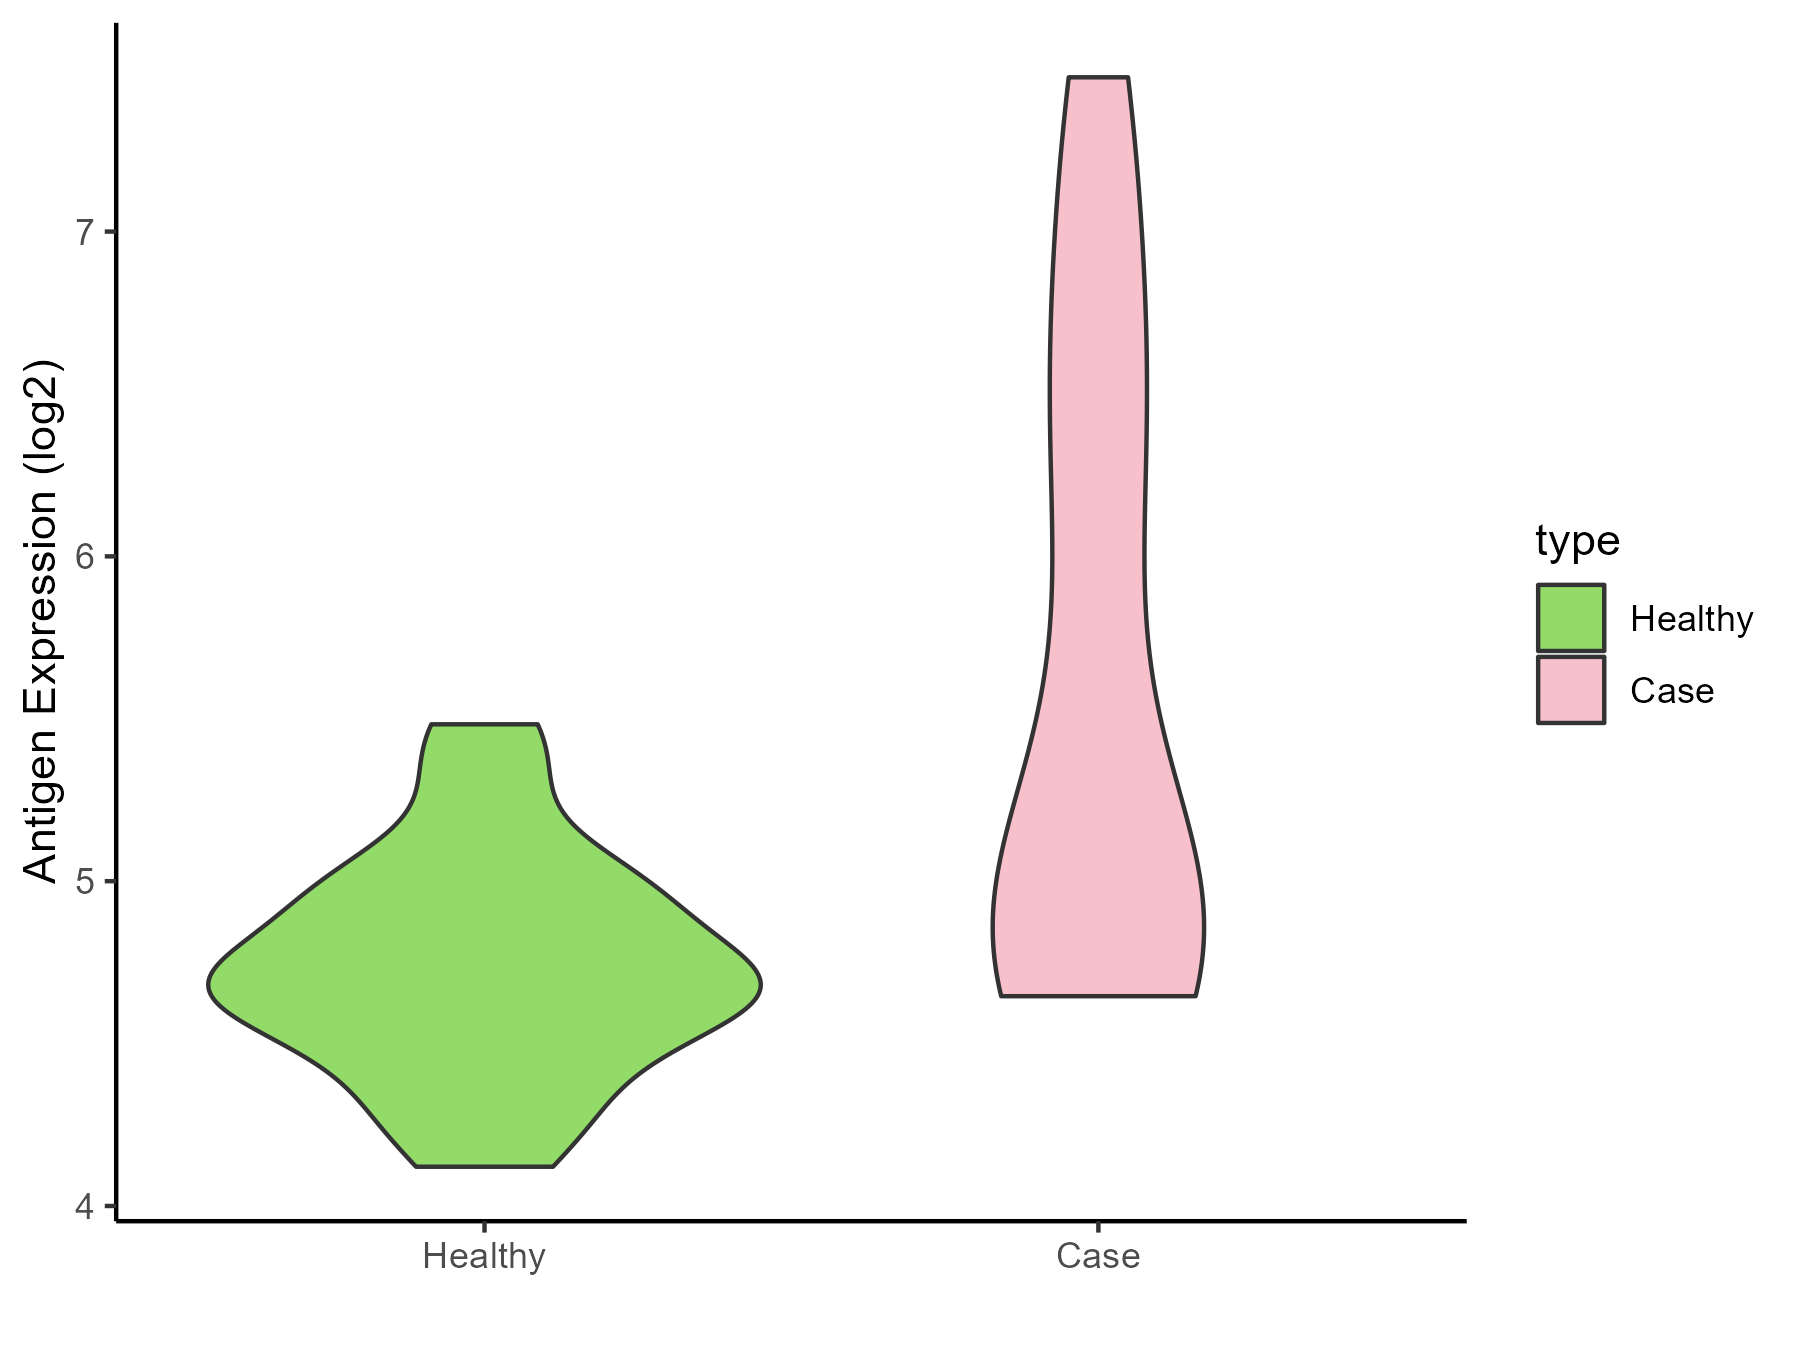
| The Studied Tissue | Peripheral blood | |
| The Specific Disease | Pediatric respiratory syncytial virus infection | |
| The Expression Level of Disease Section Compare with the Healthy Individual Tissue | p-value: 0.000305899; Fold-change: 0.297390278; Z-score: 0.851241374 | |
| Disease-specific Antigen Abundances |
|
Click to View the Clearer Original Diagram |
ICD Disease Classification 11
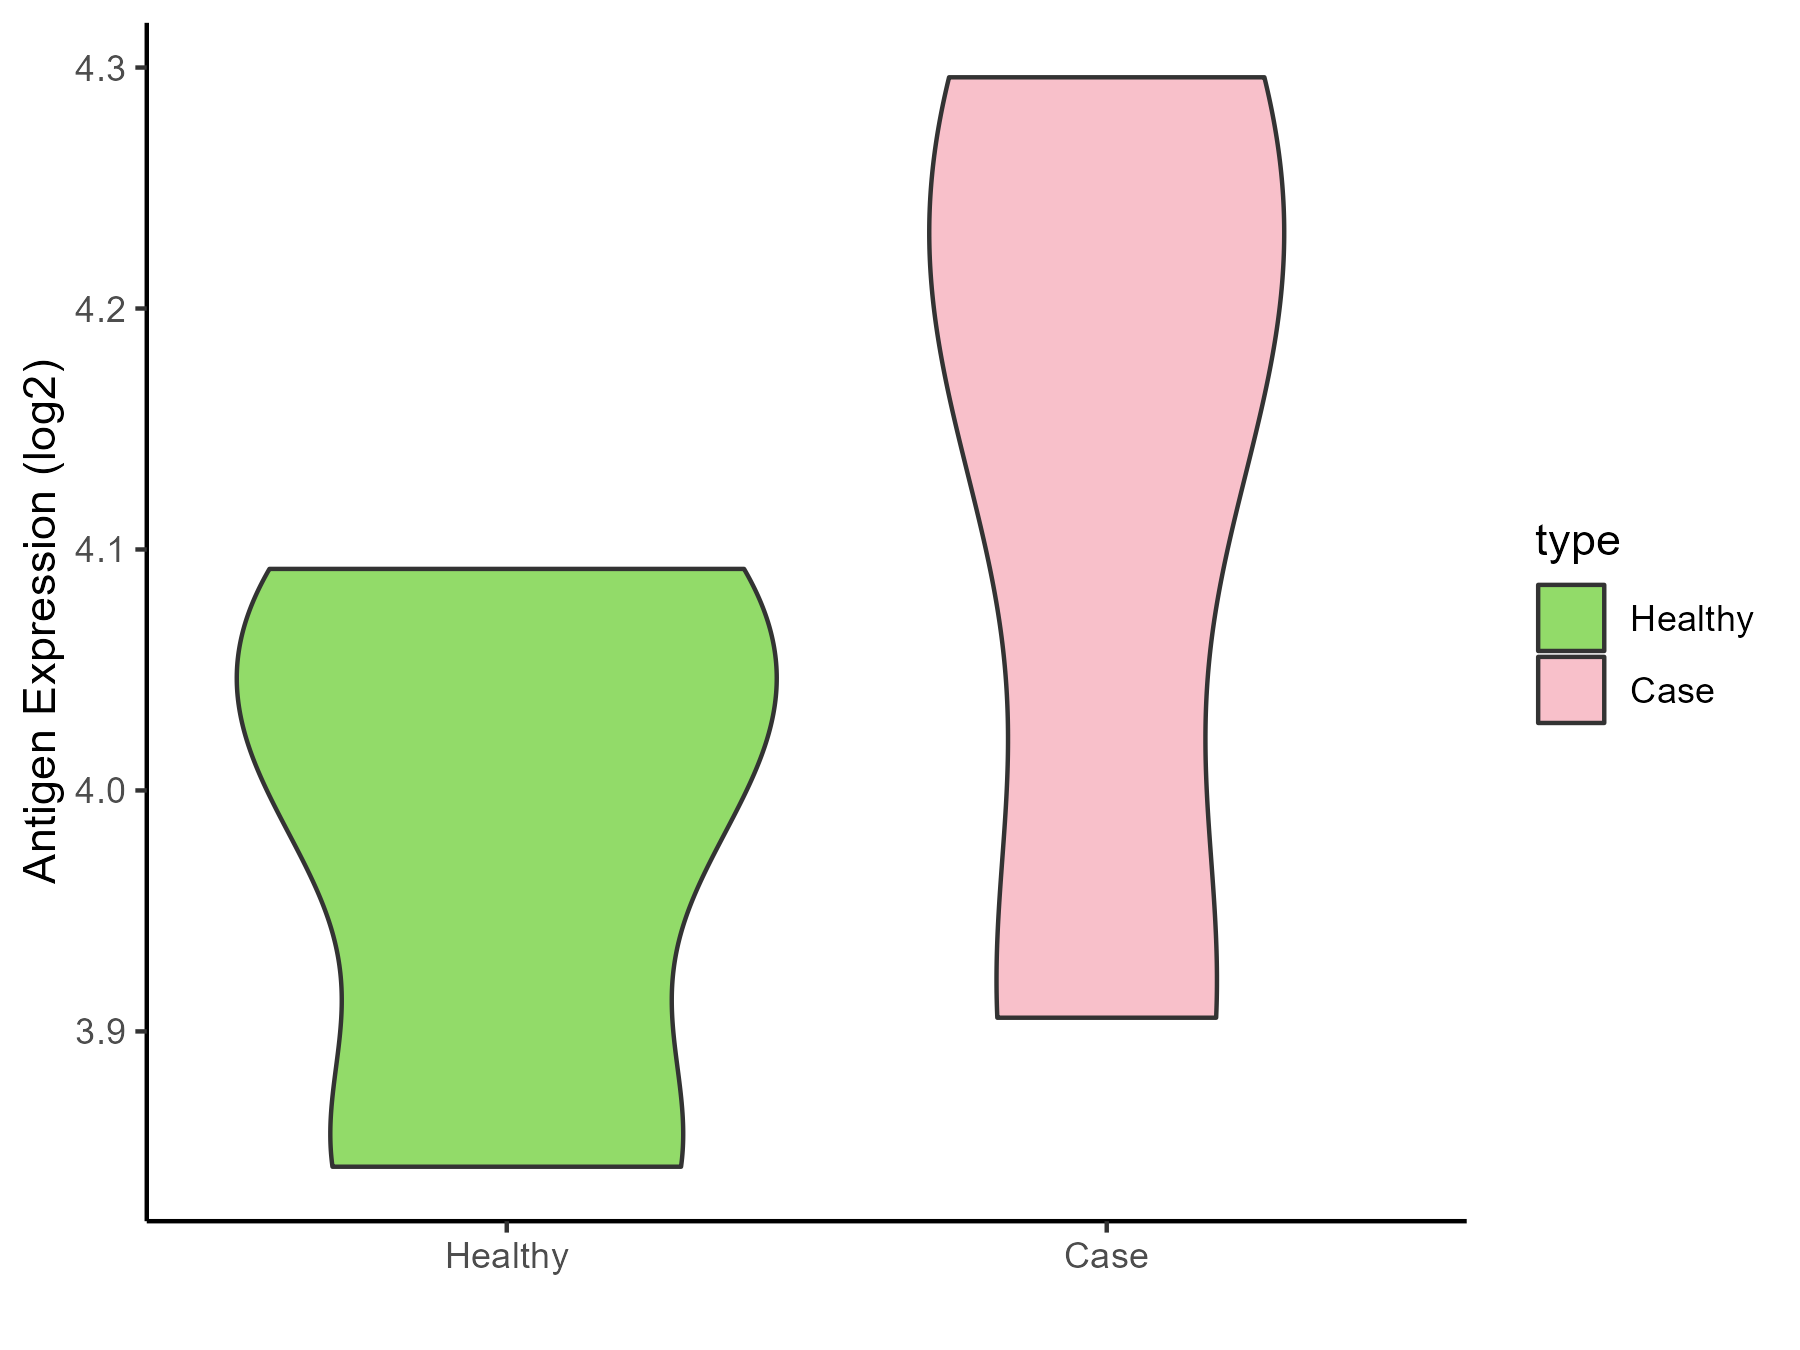
| Differential expression pattern of antigen in diseases | ||
| The Studied Tissue | Peripheral blood | |
| The Specific Disease | Essential hypertension | |
| The Expression Level of Disease Section Compare with the Healthy Individual Tissue | p-value: 0.359755948; Fold-change: 0.166402067; Z-score: 1.321266337 | |
| Disease-specific Antigen Abundances |
|
Click to View the Clearer Original Diagram |
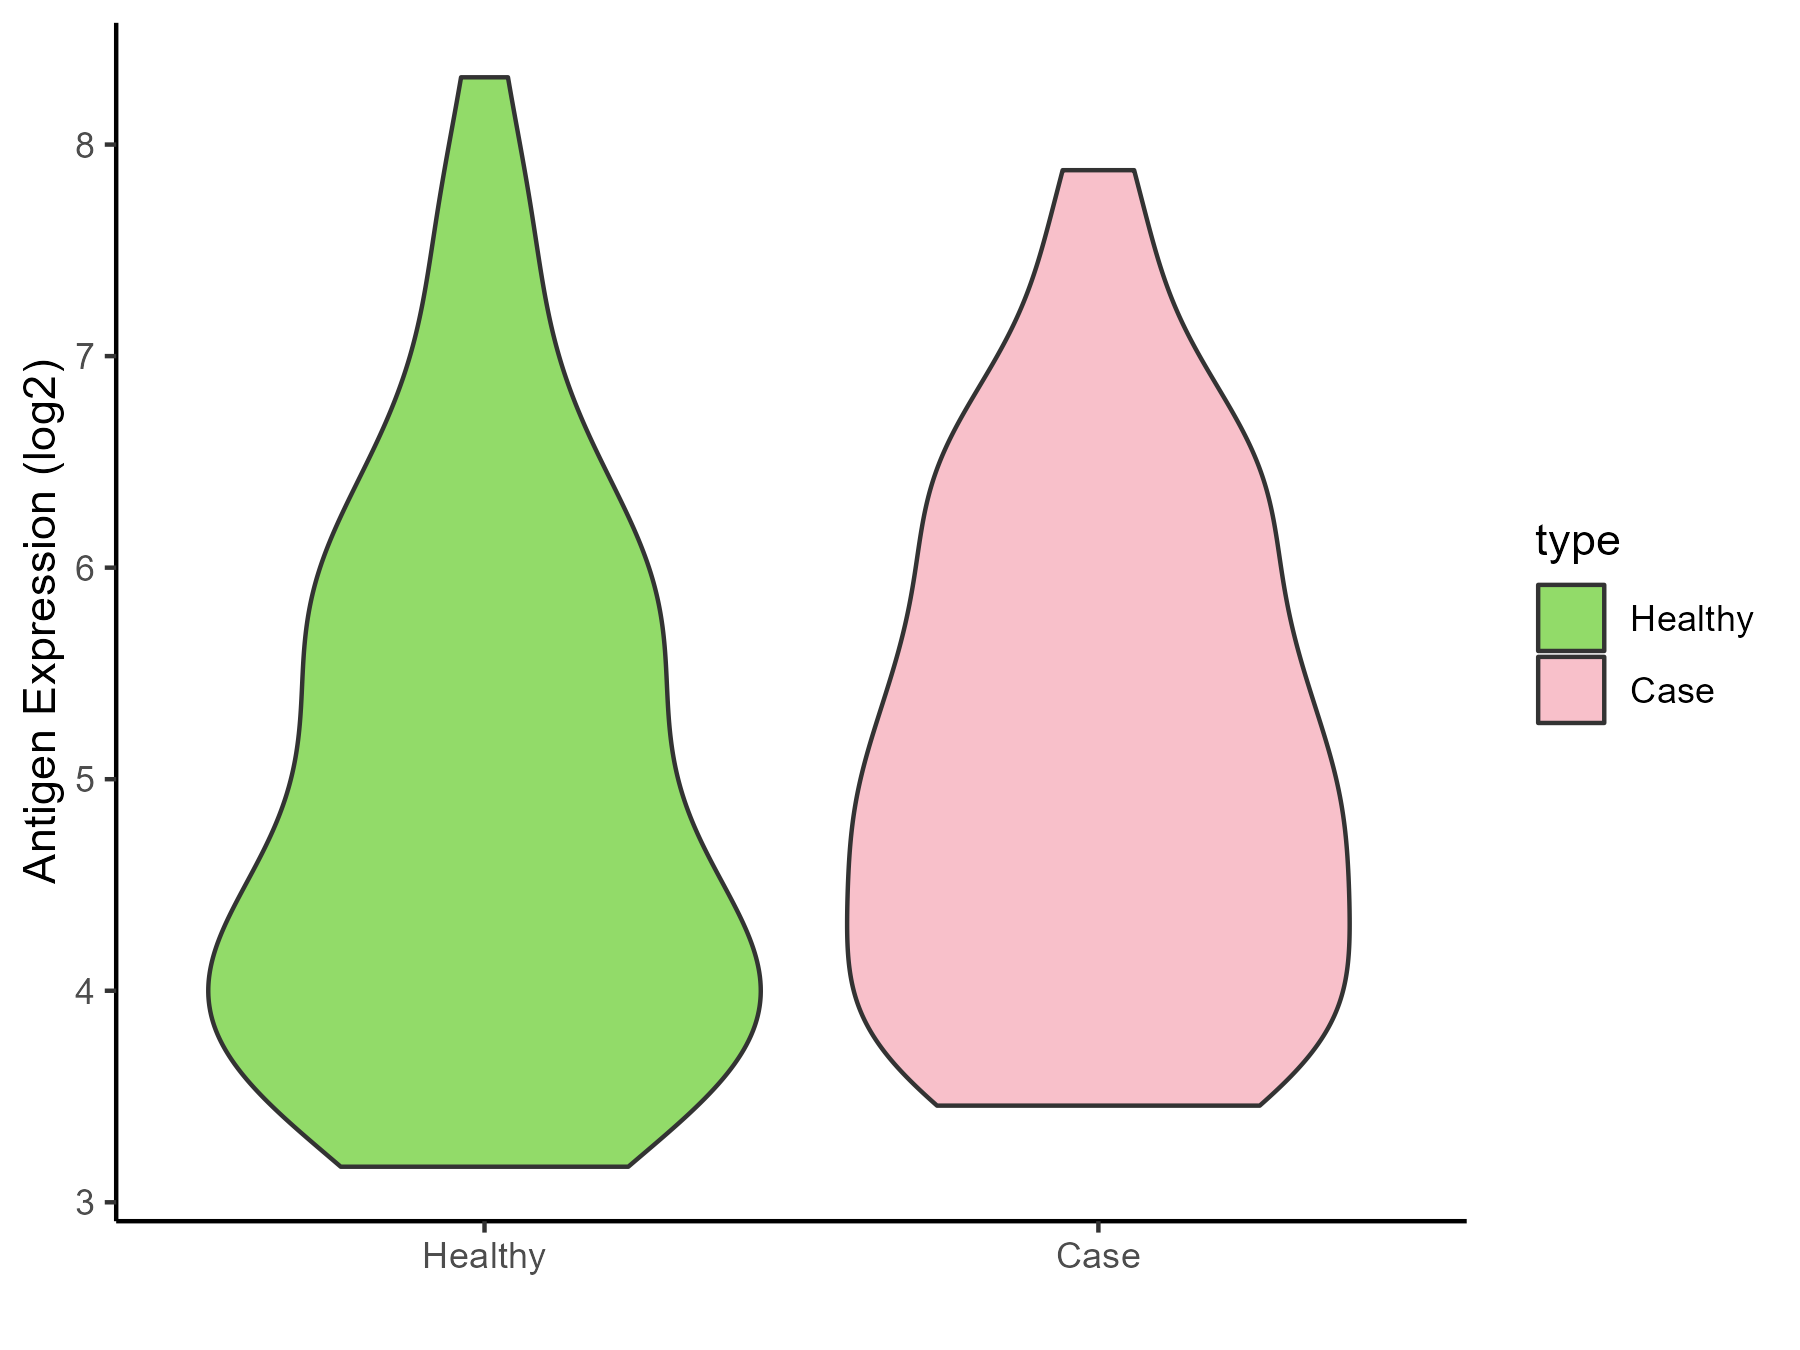
| Differential expression pattern of antigen in diseases | ||
| The Studied Tissue | Peripheral blood | |
| The Specific Disease | Myocardial infarction | |
| The Expression Level of Disease Section Compare with the Healthy Individual Tissue | p-value: 0.376156868; Fold-change: 0.272564144; Z-score: 0.214385921 | |
| Disease-specific Antigen Abundances |
|
Click to View the Clearer Original Diagram |
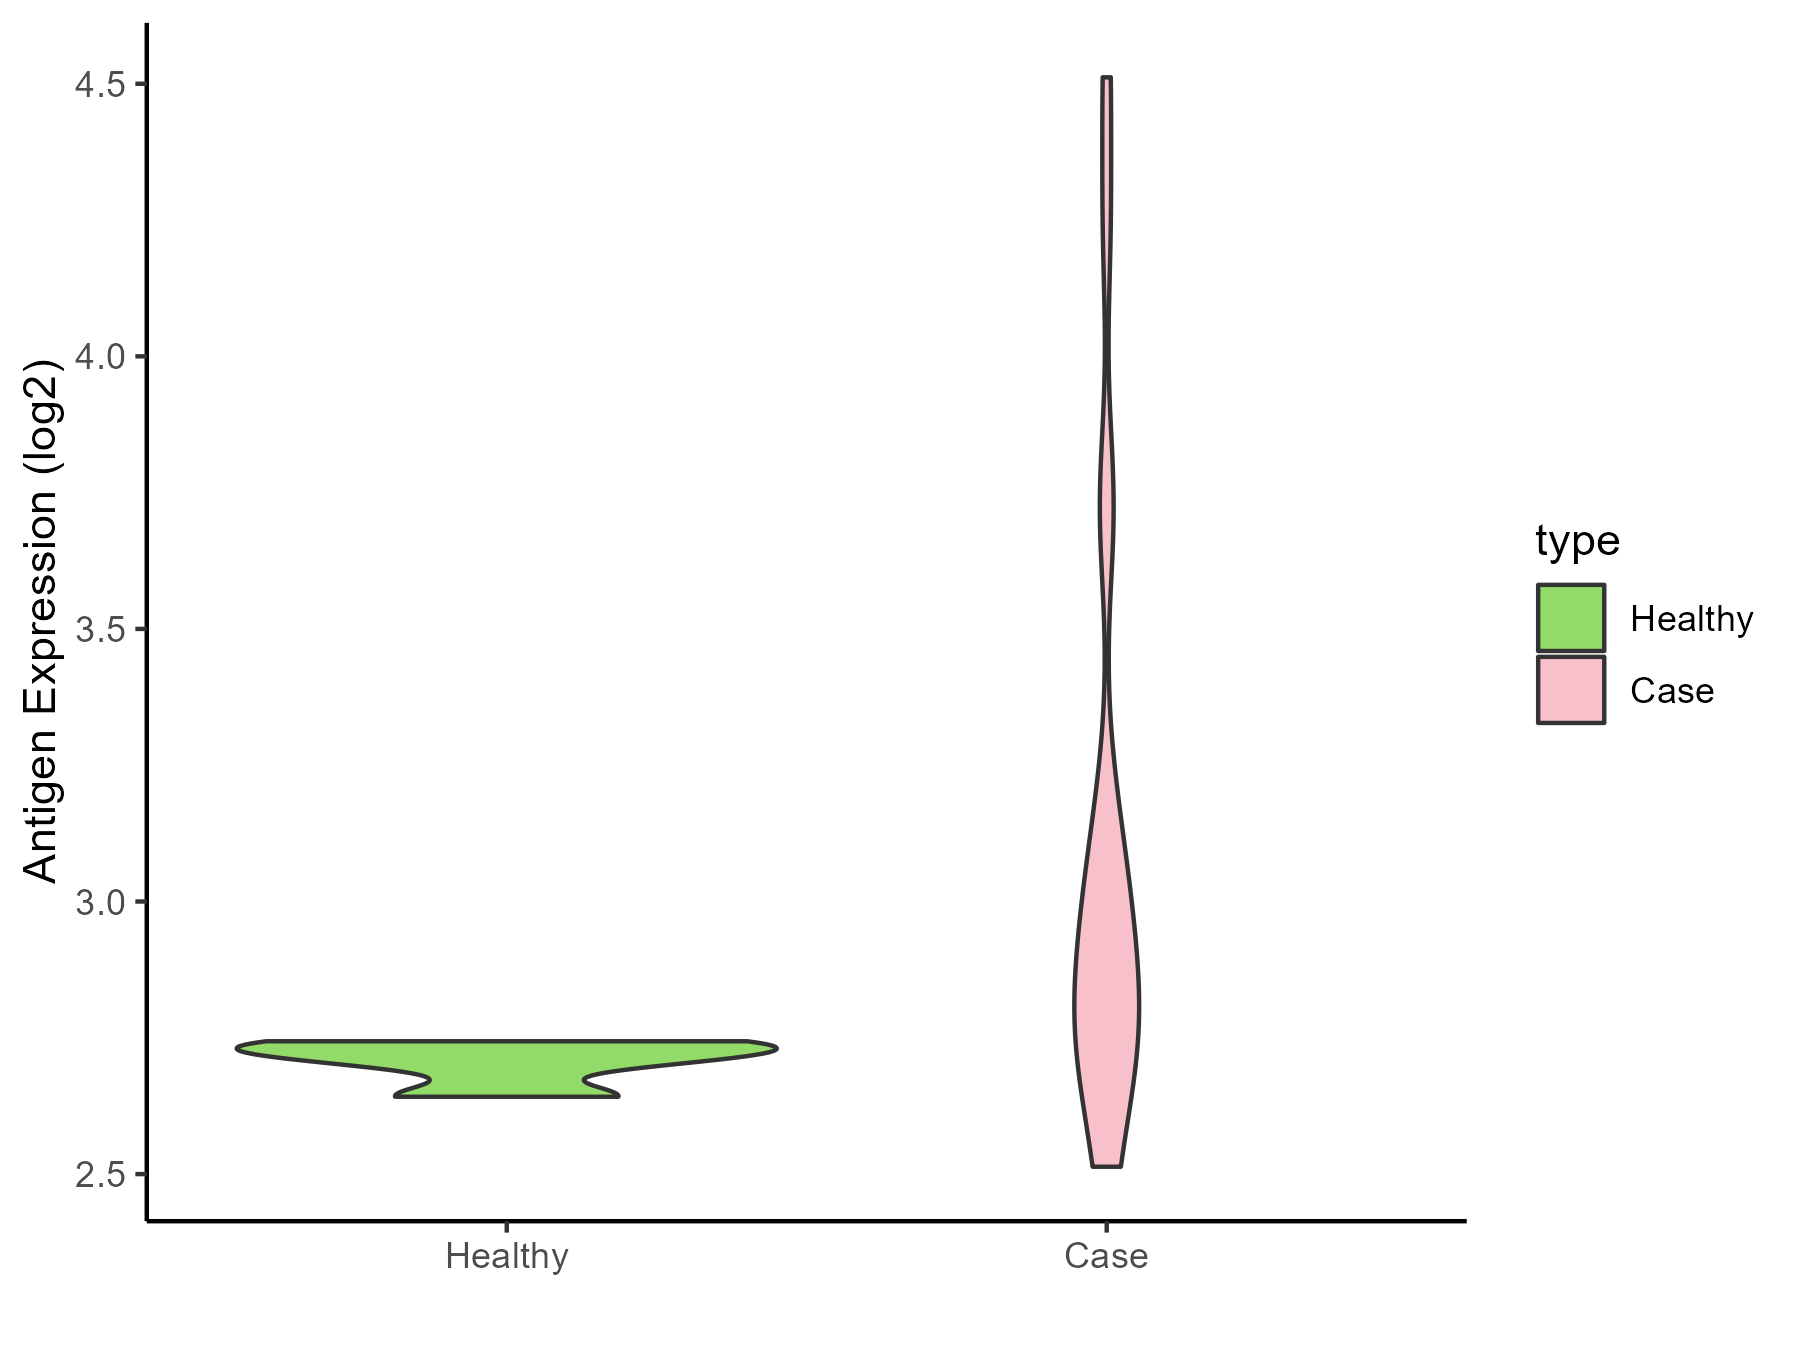
| Differential expression pattern of antigen in diseases | ||
| The Studied Tissue | Peripheral blood | |
| The Specific Disease | Coronary artery disease | |
| The Expression Level of Disease Section Compare with the Healthy Individual Tissue | p-value: 0.00787882; Fold-change: 0.177337376; Z-score: 3.883012089 | |
| Disease-specific Antigen Abundances |
|
Click to View the Clearer Original Diagram |
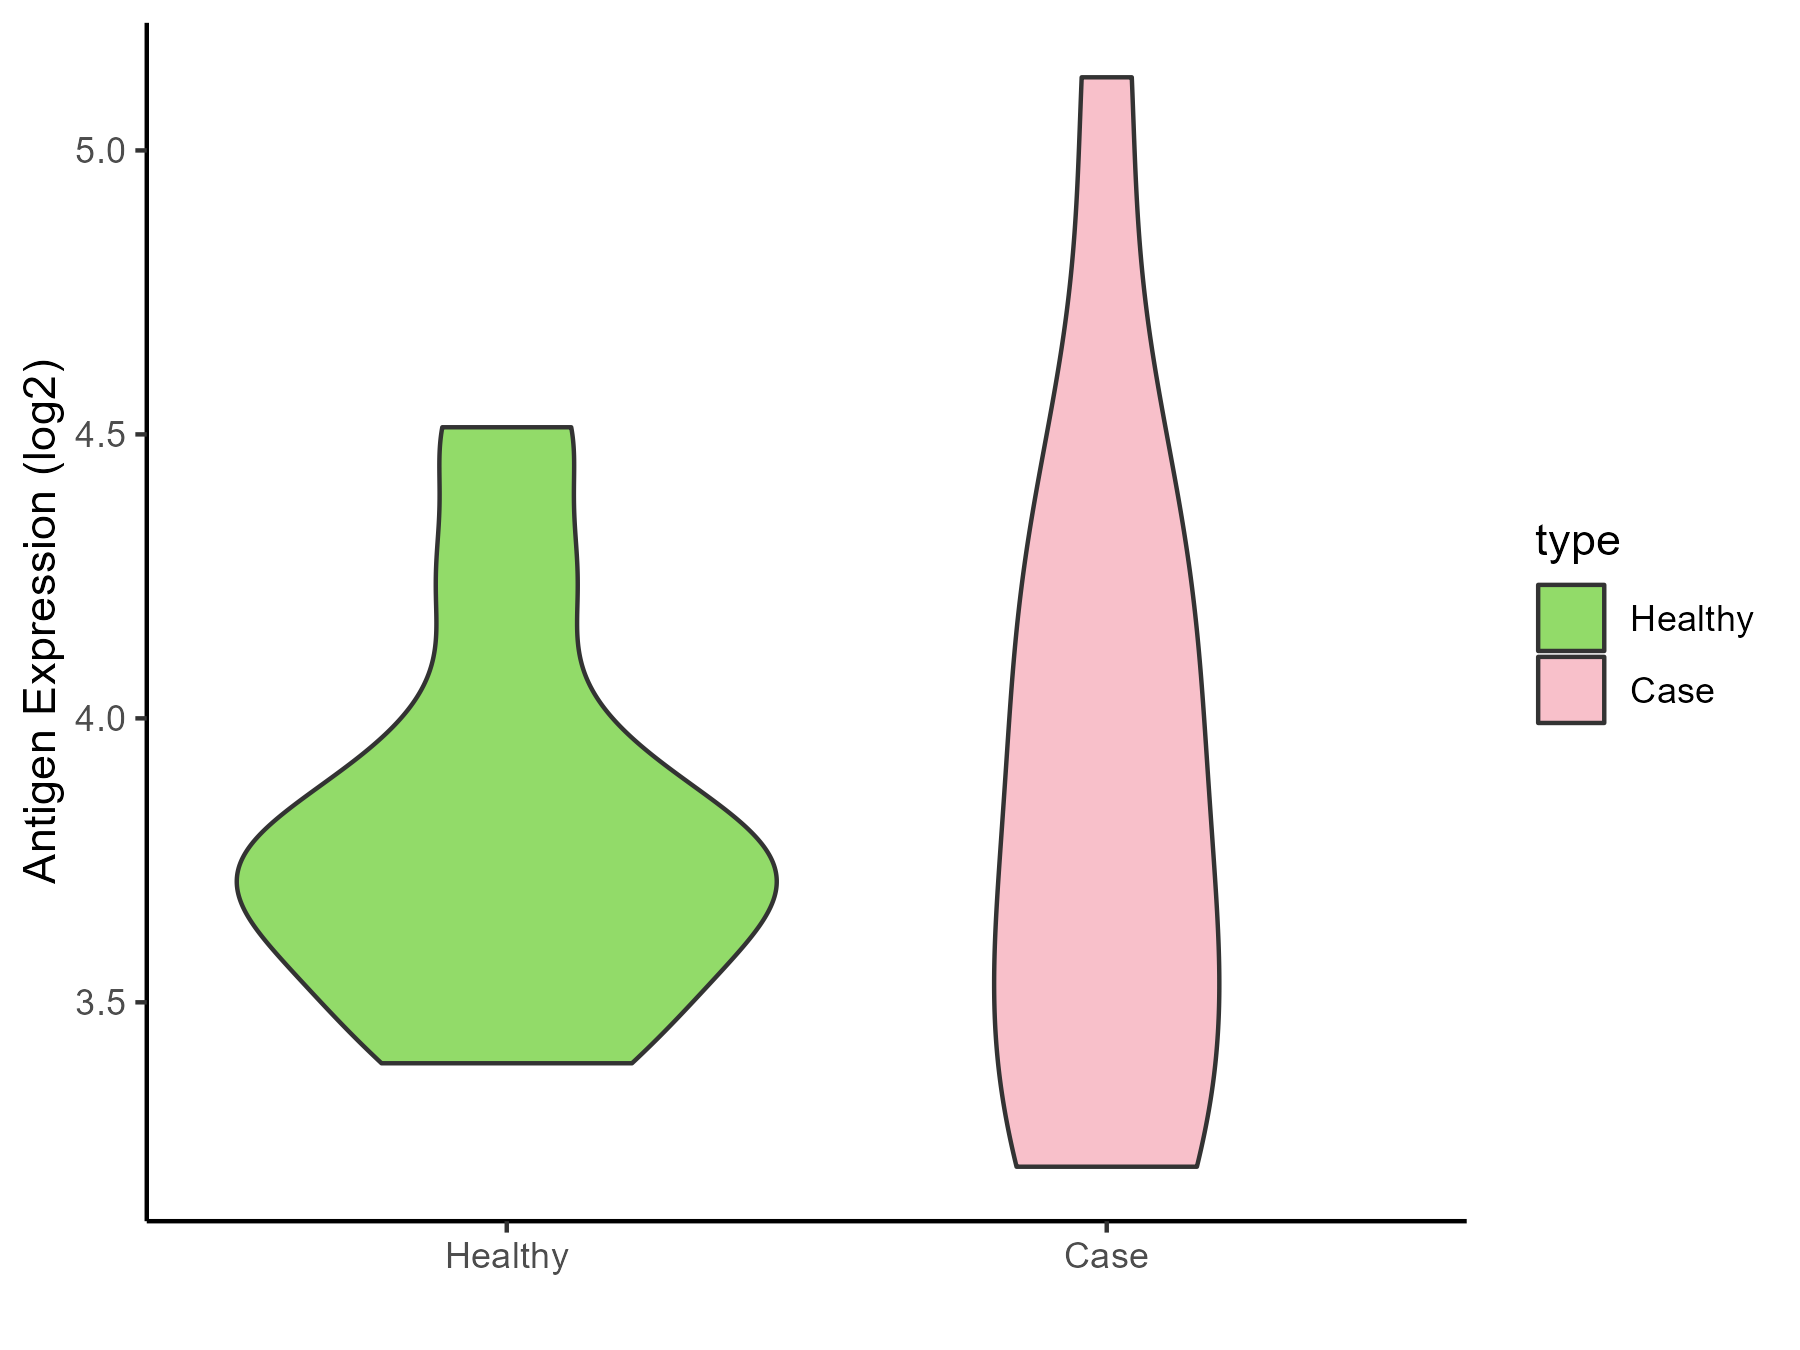
| Differential expression pattern of antigen in diseases | ||
| The Studied Tissue | Calcified aortic valve | |
| The Specific Disease | Aortic stenosis | |
| The Expression Level of Disease Section Compare with the Healthy Individual Tissue | p-value: 0.767846439; Fold-change: 0.024474472; Z-score: 0.071482508 | |
| Disease-specific Antigen Abundances |
|
Click to View the Clearer Original Diagram |
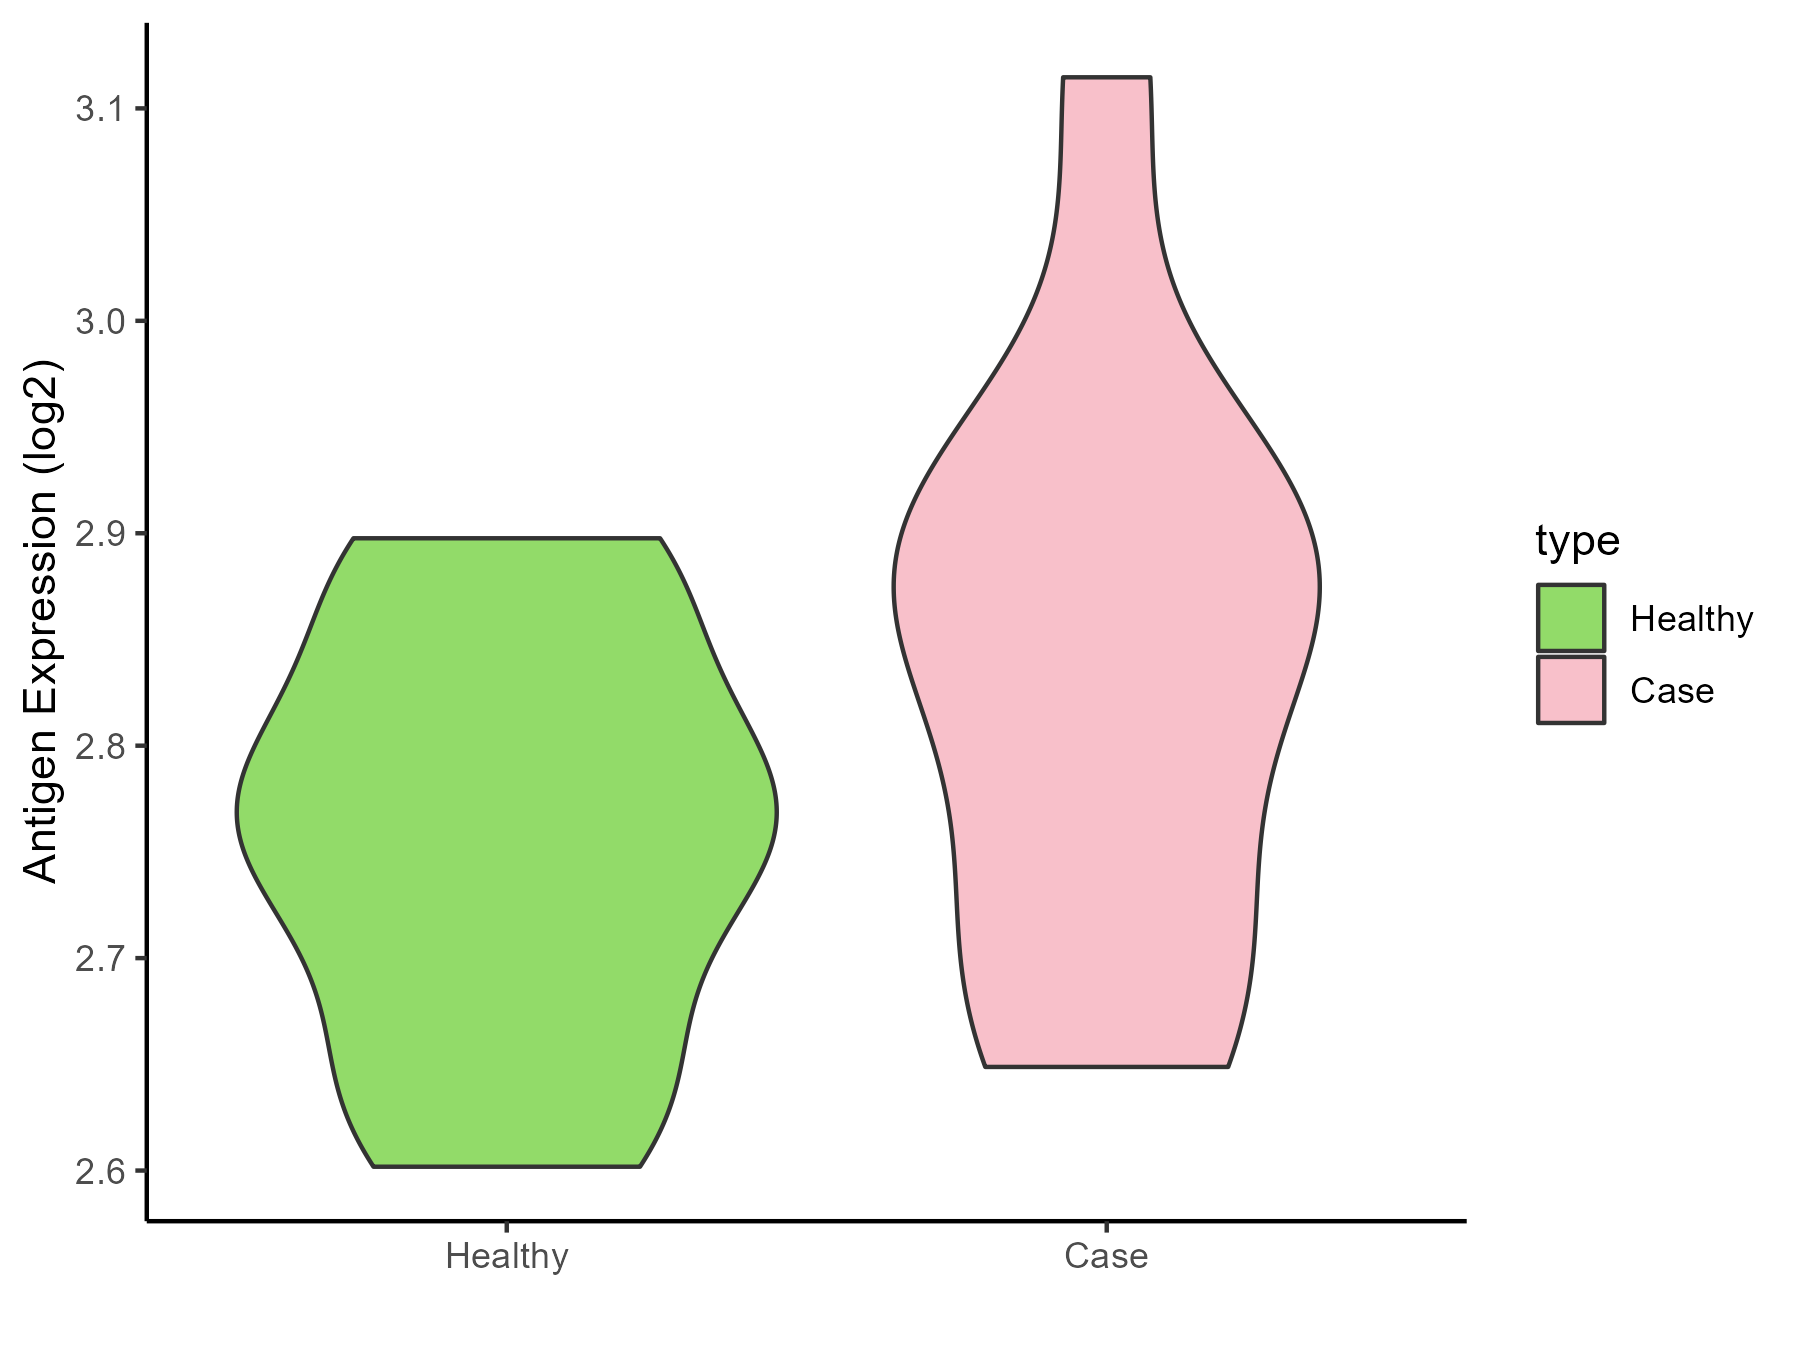
| Differential expression pattern of antigen in diseases | ||
| The Studied Tissue | Peripheral blood | |
| The Specific Disease | Arteriosclerosis | |
| The Expression Level of Disease Section Compare with the Healthy Individual Tissue | p-value: 0.156104791; Fold-change: 0.100138131; Z-score: 1.021098709 | |
| Disease-specific Antigen Abundances |
|
Click to View the Clearer Original Diagram |
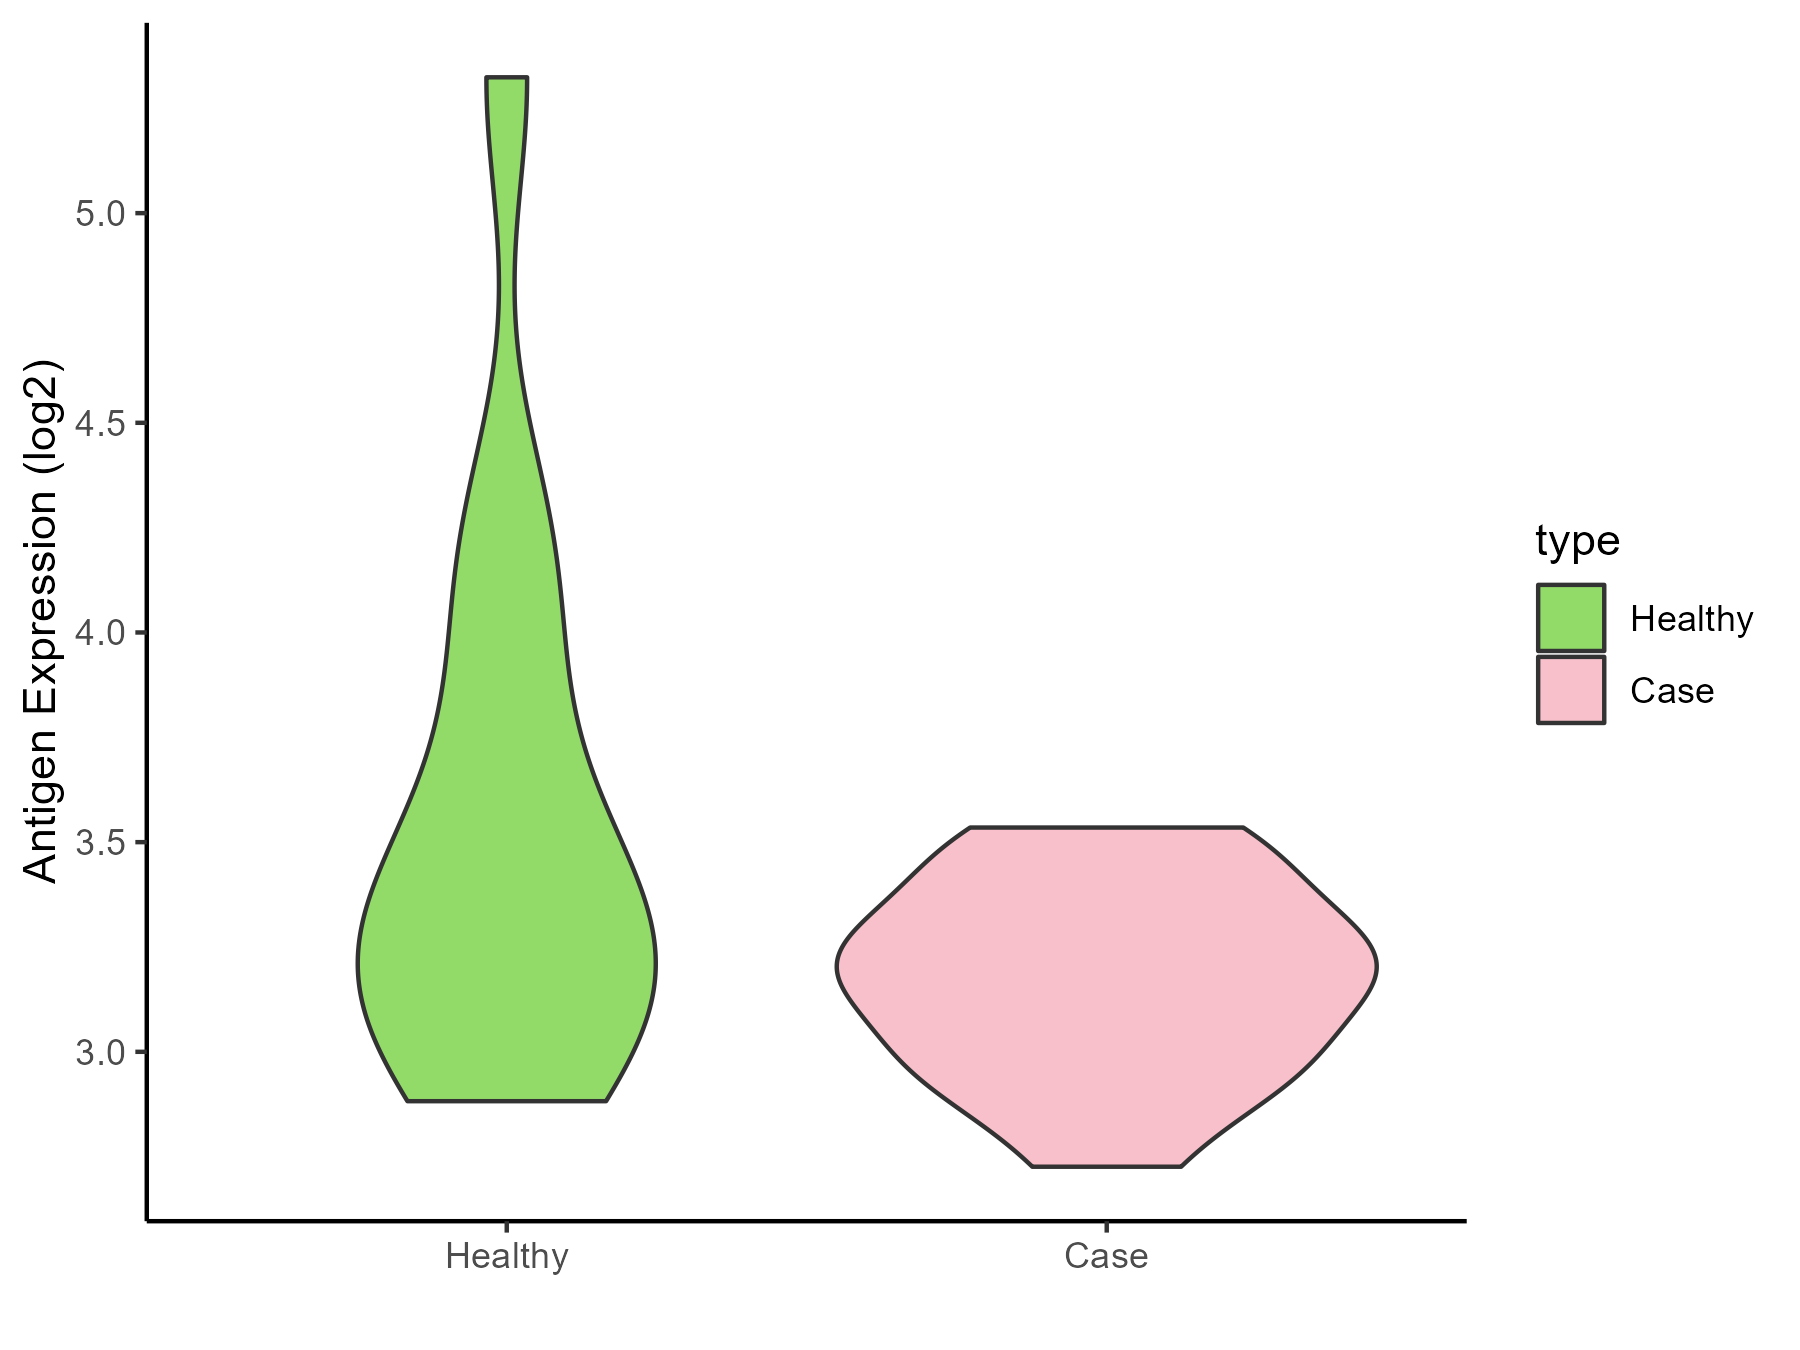
| Differential expression pattern of antigen in diseases | ||
| The Studied Tissue | Intracranial artery | |
| The Specific Disease | Aneurysm | |
| The Expression Level of Disease Section Compare with the Healthy Individual Tissue | p-value: 0.070574846; Fold-change: -0.116755836; Z-score: -0.172365597 | |
| Disease-specific Antigen Abundances |
|
Click to View the Clearer Original Diagram |
ICD Disease Classification 12
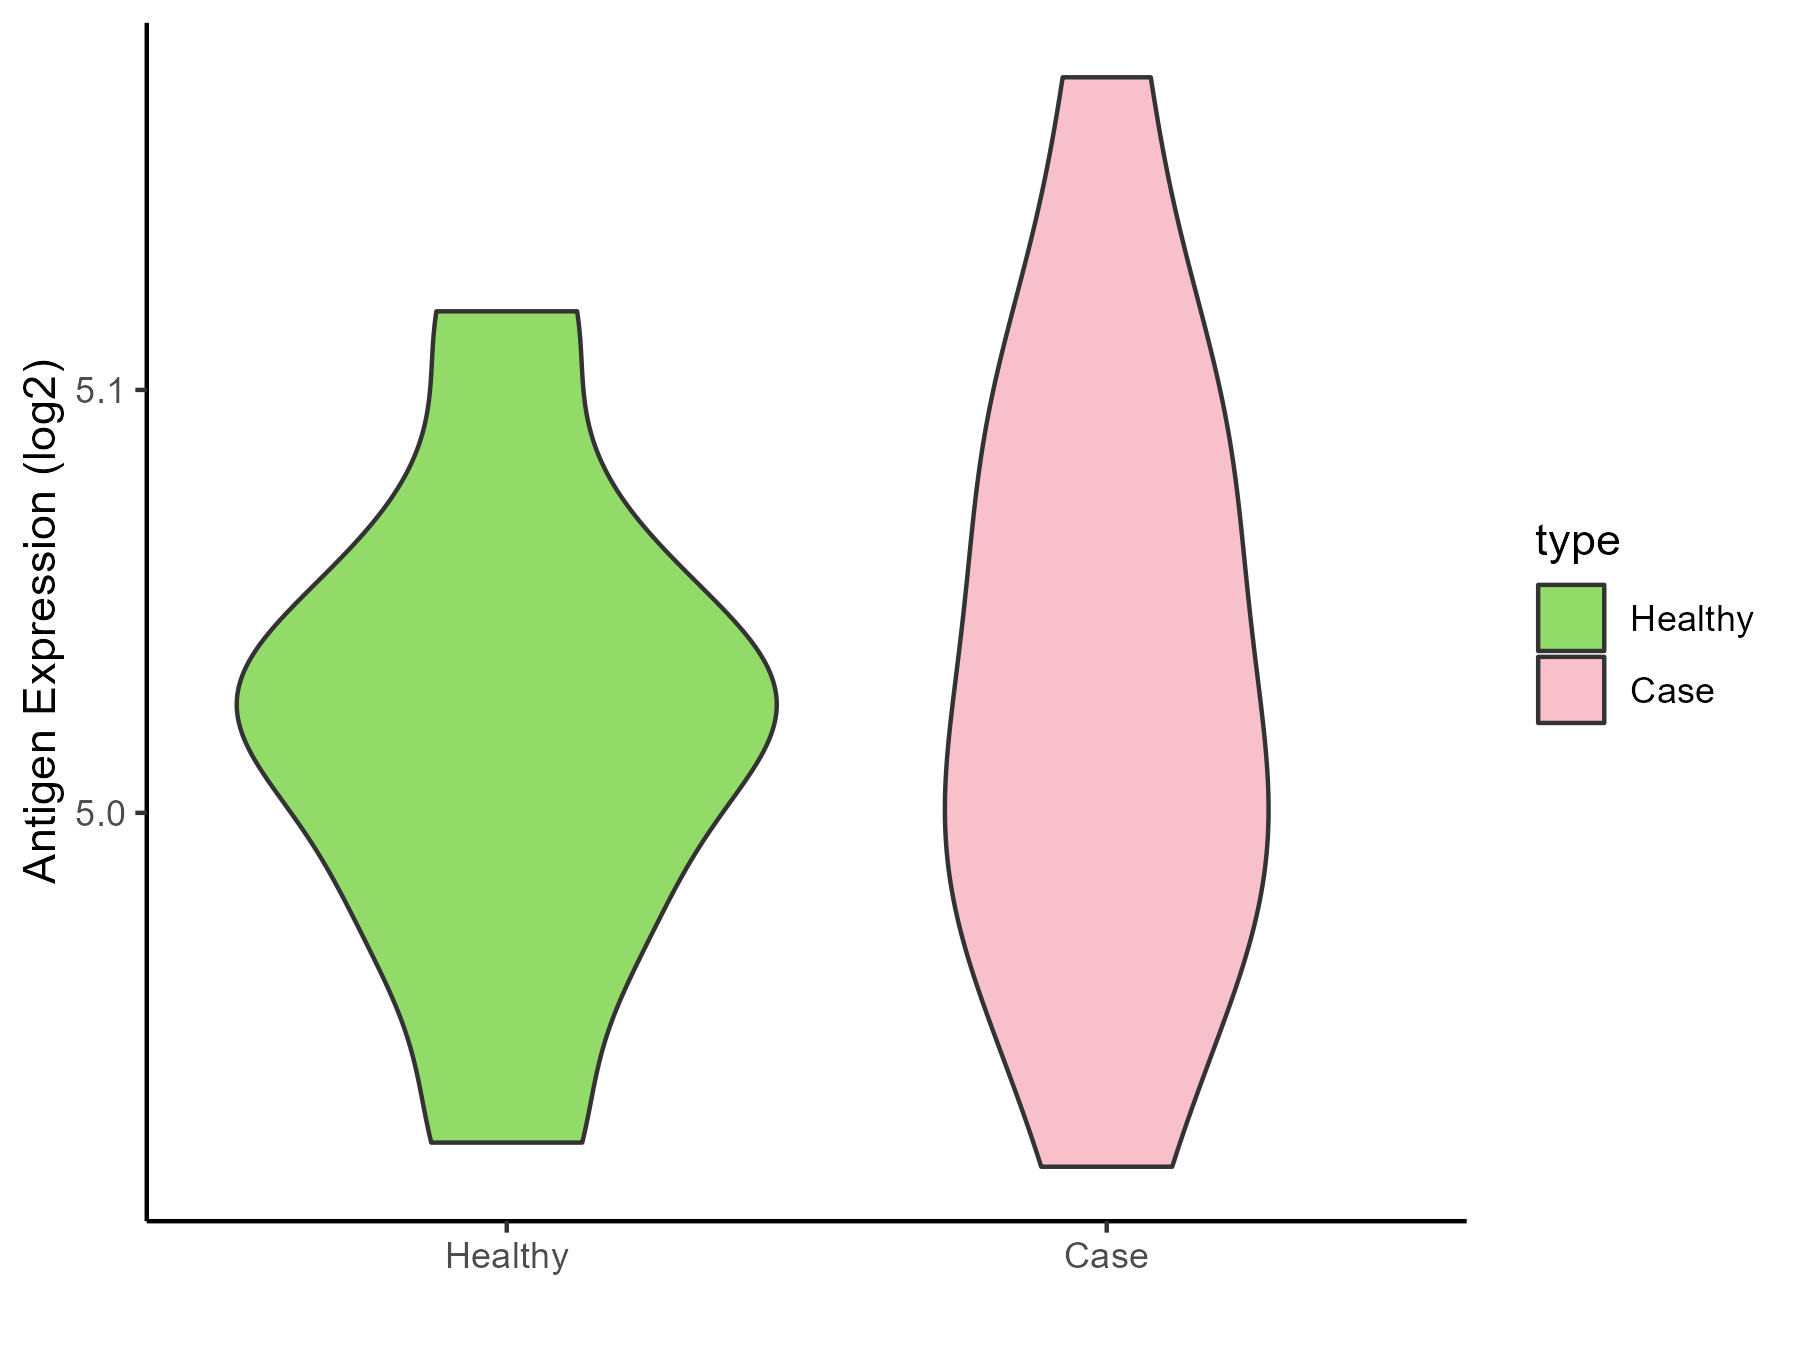
| Differential expression pattern of antigen in diseases | ||
| The Studied Tissue | Peripheral blood | |
| The Specific Disease | Immunodeficiency | |
| The Expression Level of Disease Section Compare with the Healthy Individual Tissue | p-value: 0.62370428; Fold-change: -0.002103921; Z-score: -0.036891002 | |
| Disease-specific Antigen Abundances |
|
Click to View the Clearer Original Diagram |
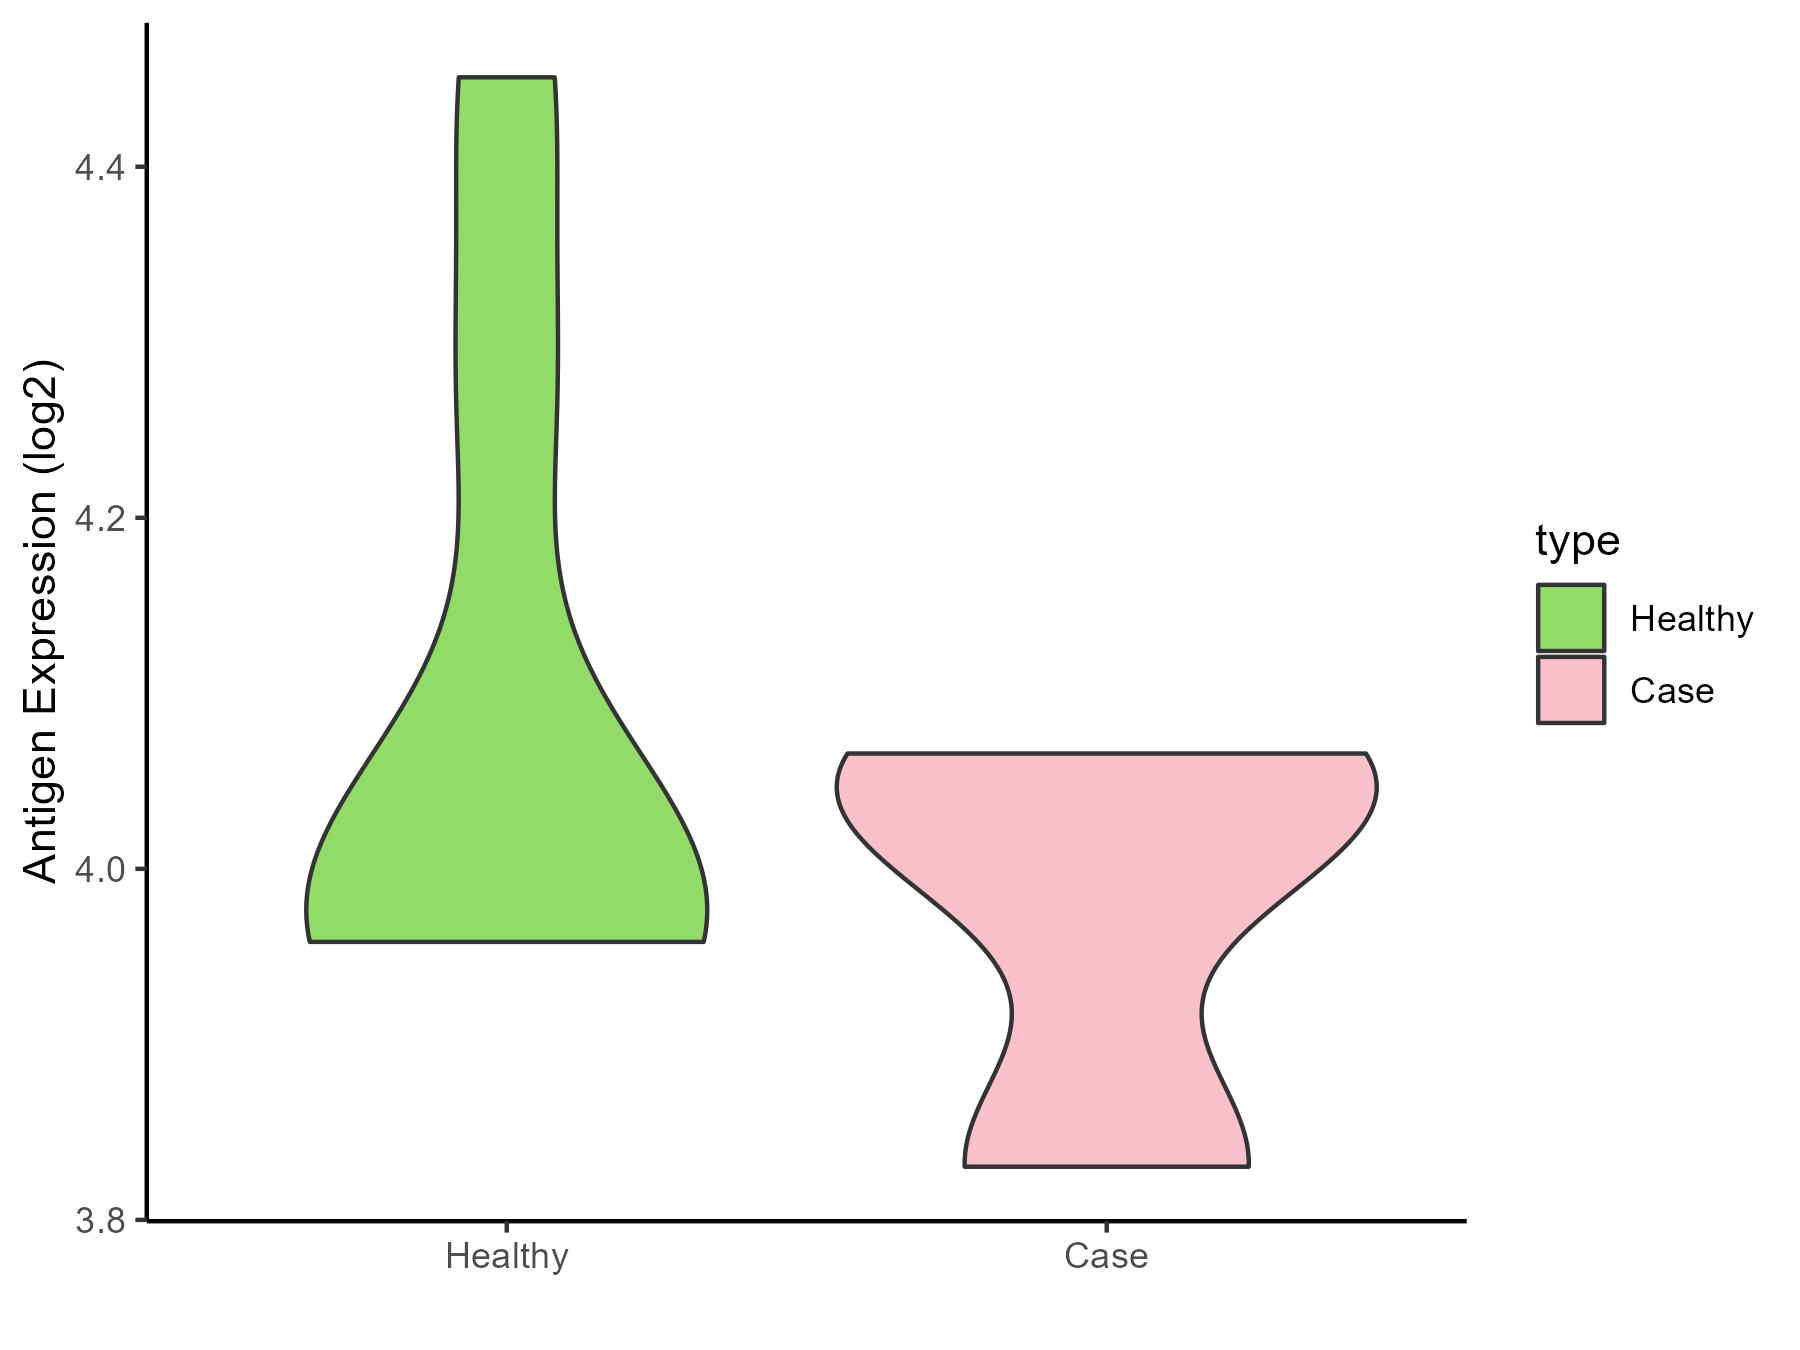
| Differential expression pattern of antigen in diseases | ||
| The Studied Tissue | Hyperplastic tonsil | |
| The Specific Disease | Apnea | |
| The Expression Level of Disease Section Compare with the Healthy Individual Tissue | p-value: 0.31623937; Fold-change: 0.054326706; Z-score: 0.278649565 | |
| Disease-specific Antigen Abundances |
|
Click to View the Clearer Original Diagram |
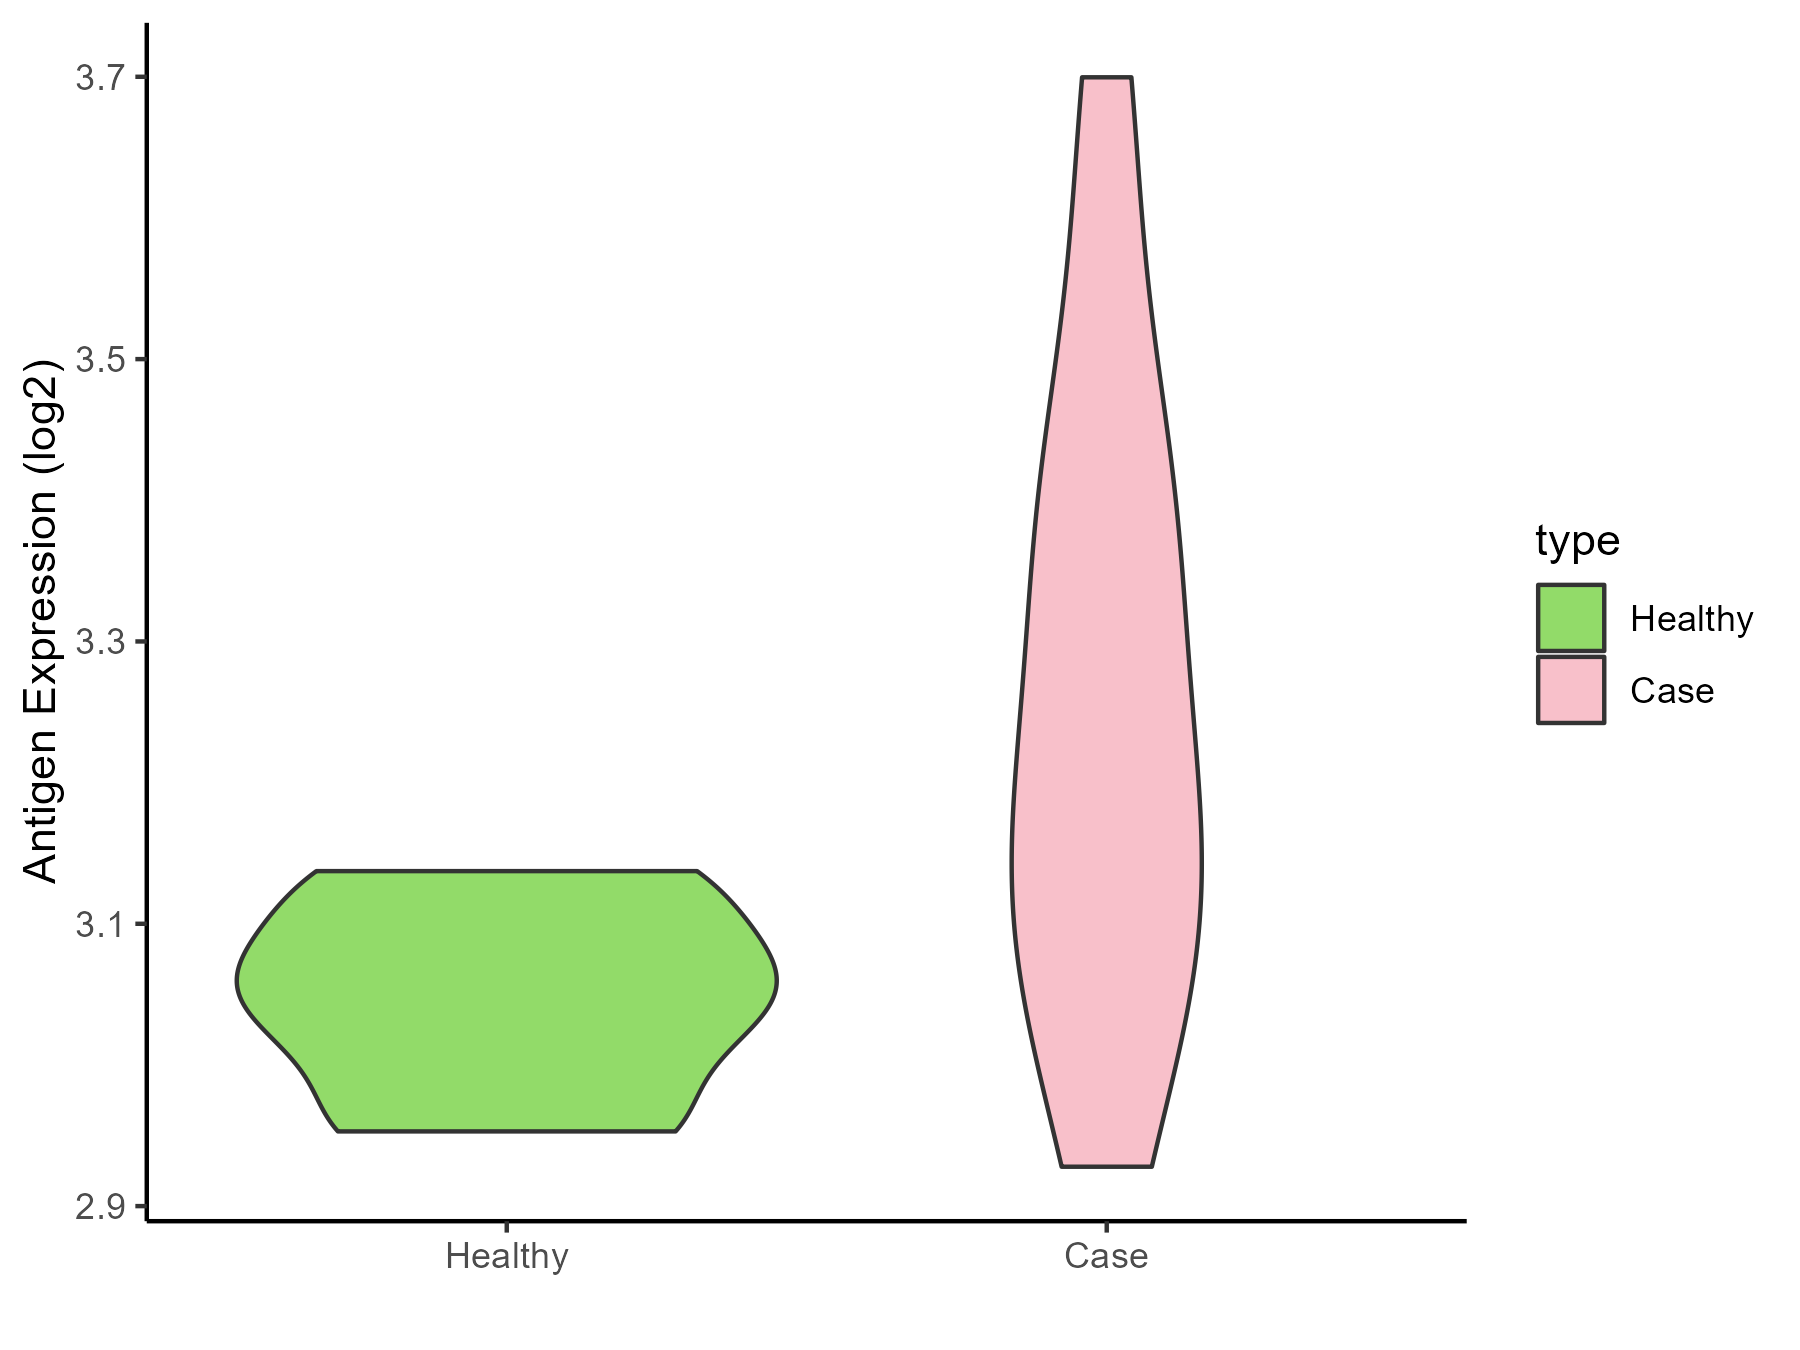
| Differential expression pattern of antigen in diseases | ||
| The Studied Tissue | Peripheral blood | |
| The Specific Disease | Olive pollen allergy | |
| The Expression Level of Disease Section Compare with the Healthy Individual Tissue | p-value: 0.008497631; Fold-change: 0.192263562; Z-score: 2.478492181 | |
| Disease-specific Antigen Abundances |
|
Click to View the Clearer Original Diagram |
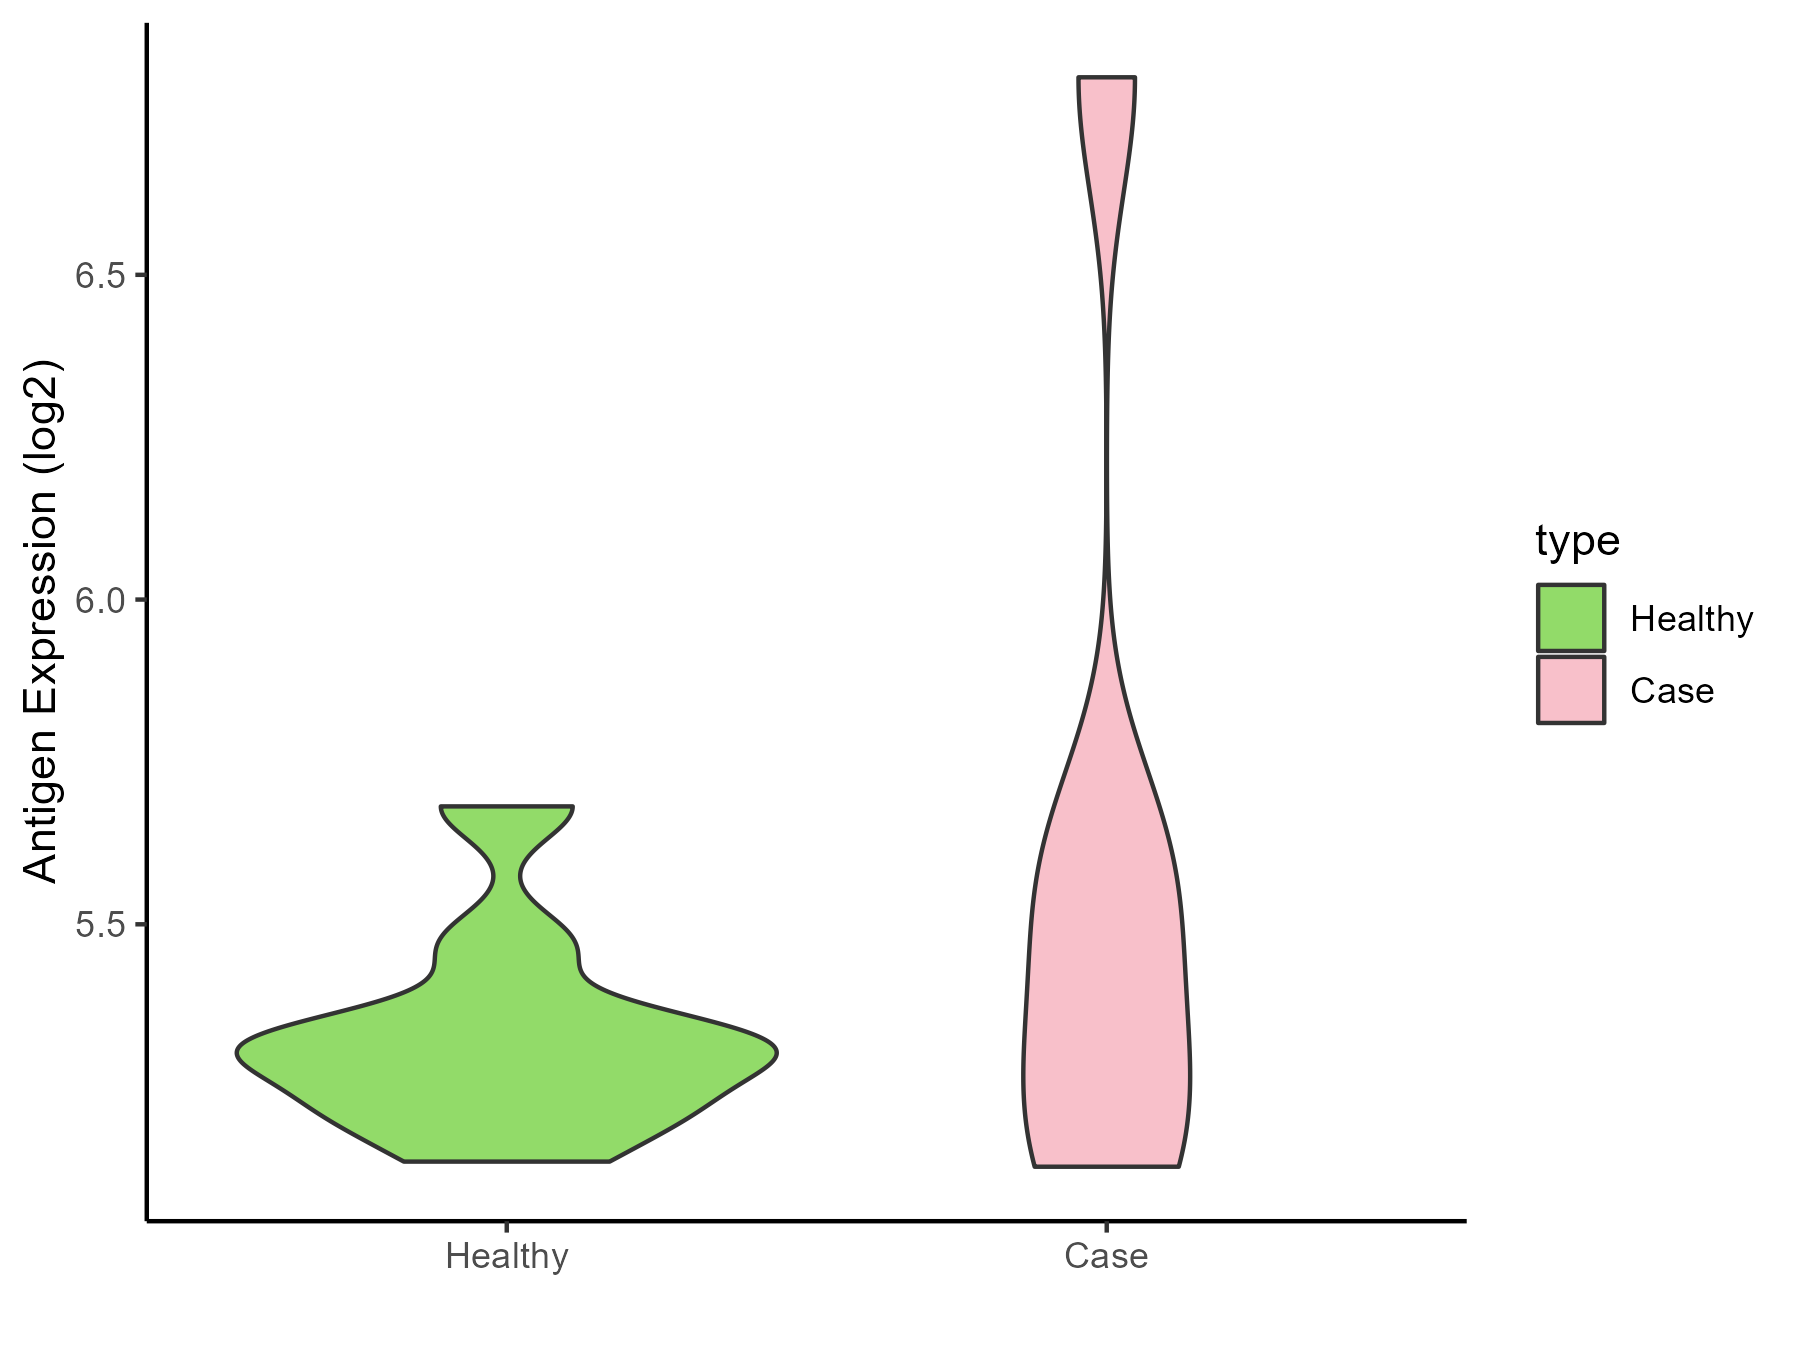
| Differential expression pattern of antigen in diseases | ||
| The Studied Tissue | Sinus mucosa | |
| The Specific Disease | Chronic rhinosinusitis | |
| The Expression Level of Disease Section Compare with the Healthy Individual Tissue | p-value: 0.339458528; Fold-change: 0.145336879; Z-score: 0.898693854 | |
| Disease-specific Antigen Abundances |
|
Click to View the Clearer Original Diagram |
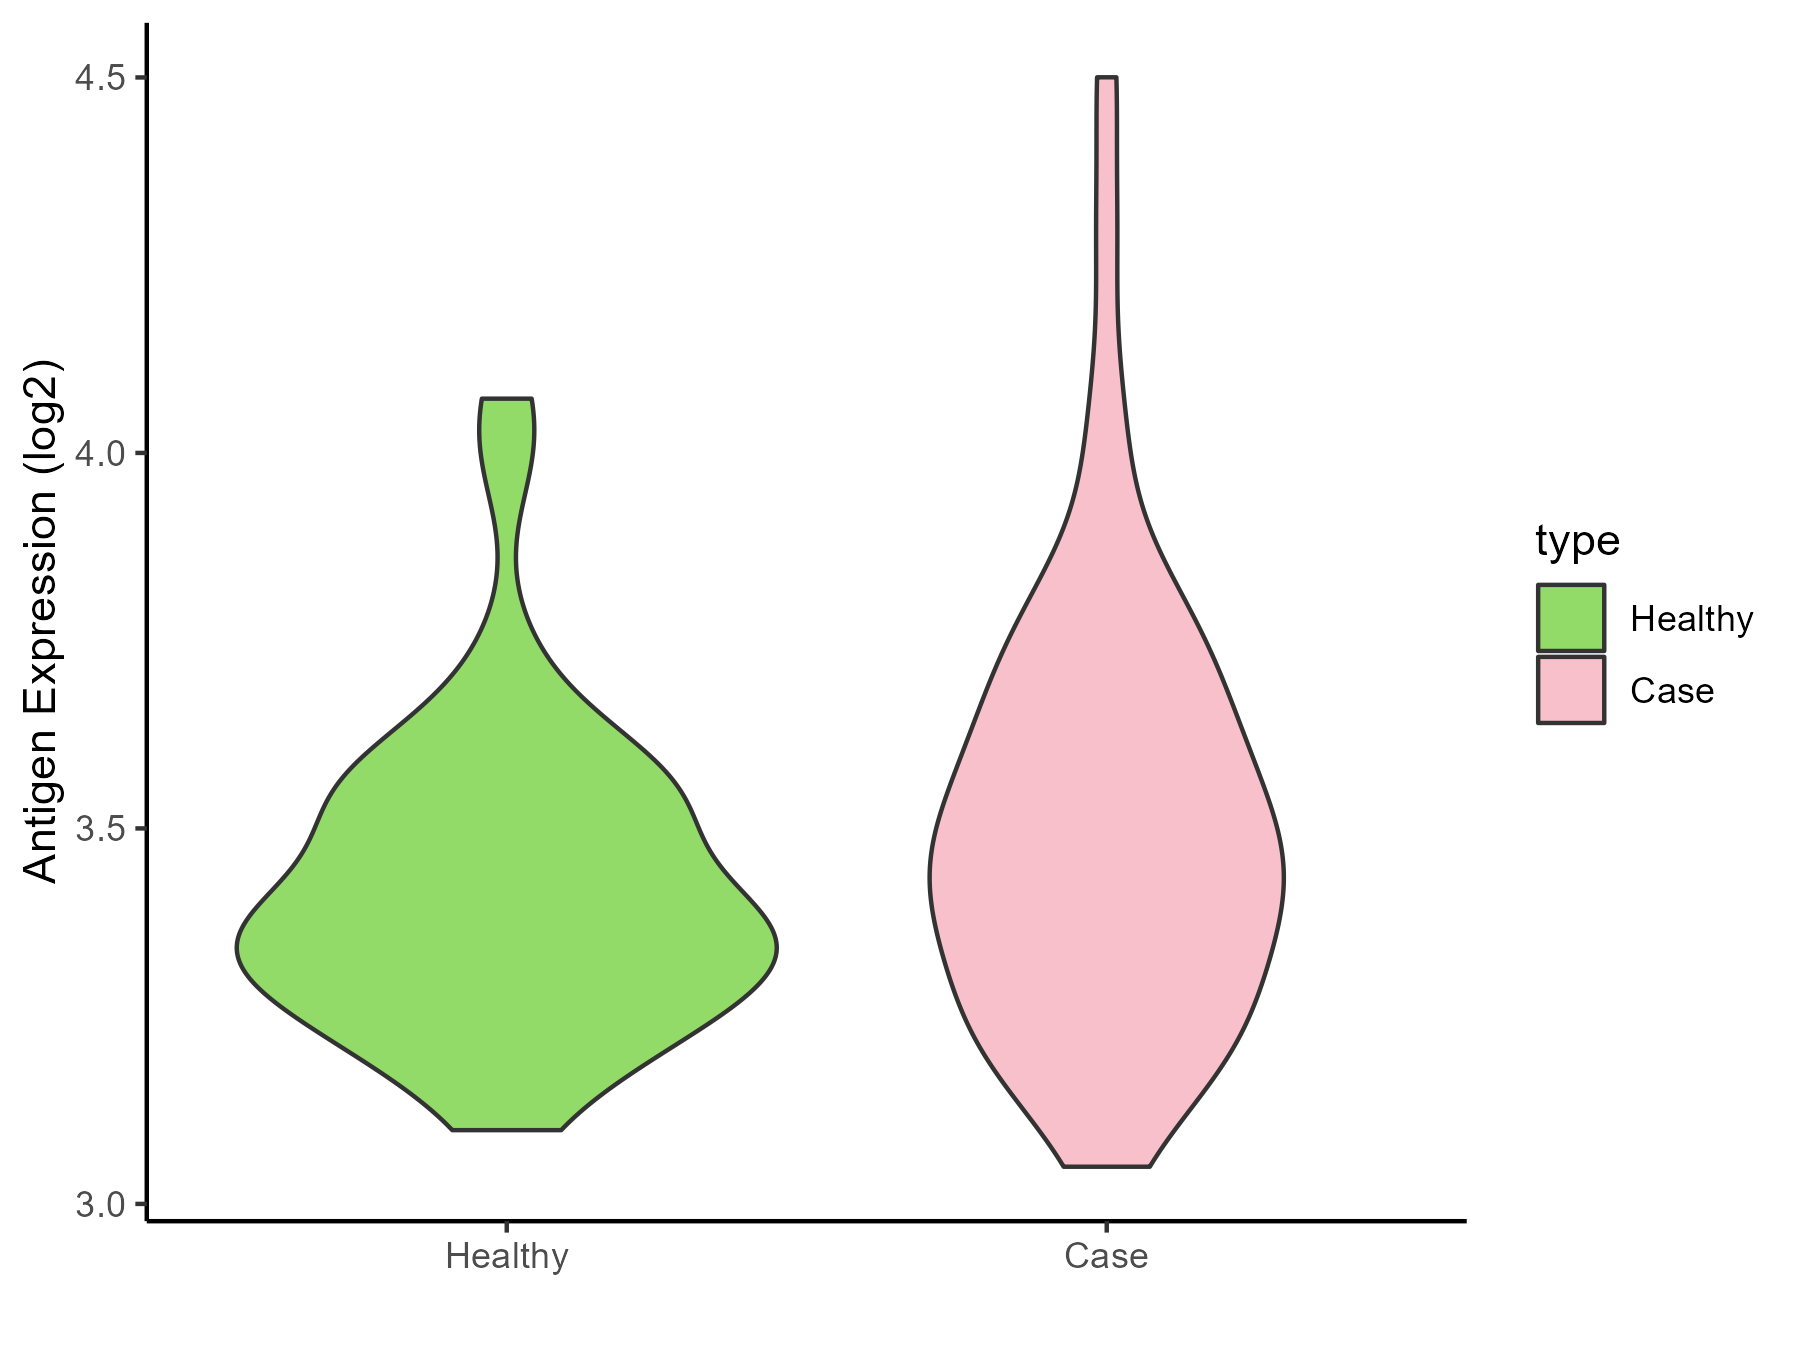
| Differential expression pattern of antigen in diseases | ||
| The Studied Tissue | Lung | |
| The Specific Disease | Chronic obstructive pulmonary disease | |
| The Expression Level of Disease Section Compare with the Healthy Individual Tissue | p-value: 0.102361855; Fold-change: 0.085826082; Z-score: 0.421421263 | |
| Disease-specific Antigen Abundances |
|
Click to View the Clearer Original Diagram |
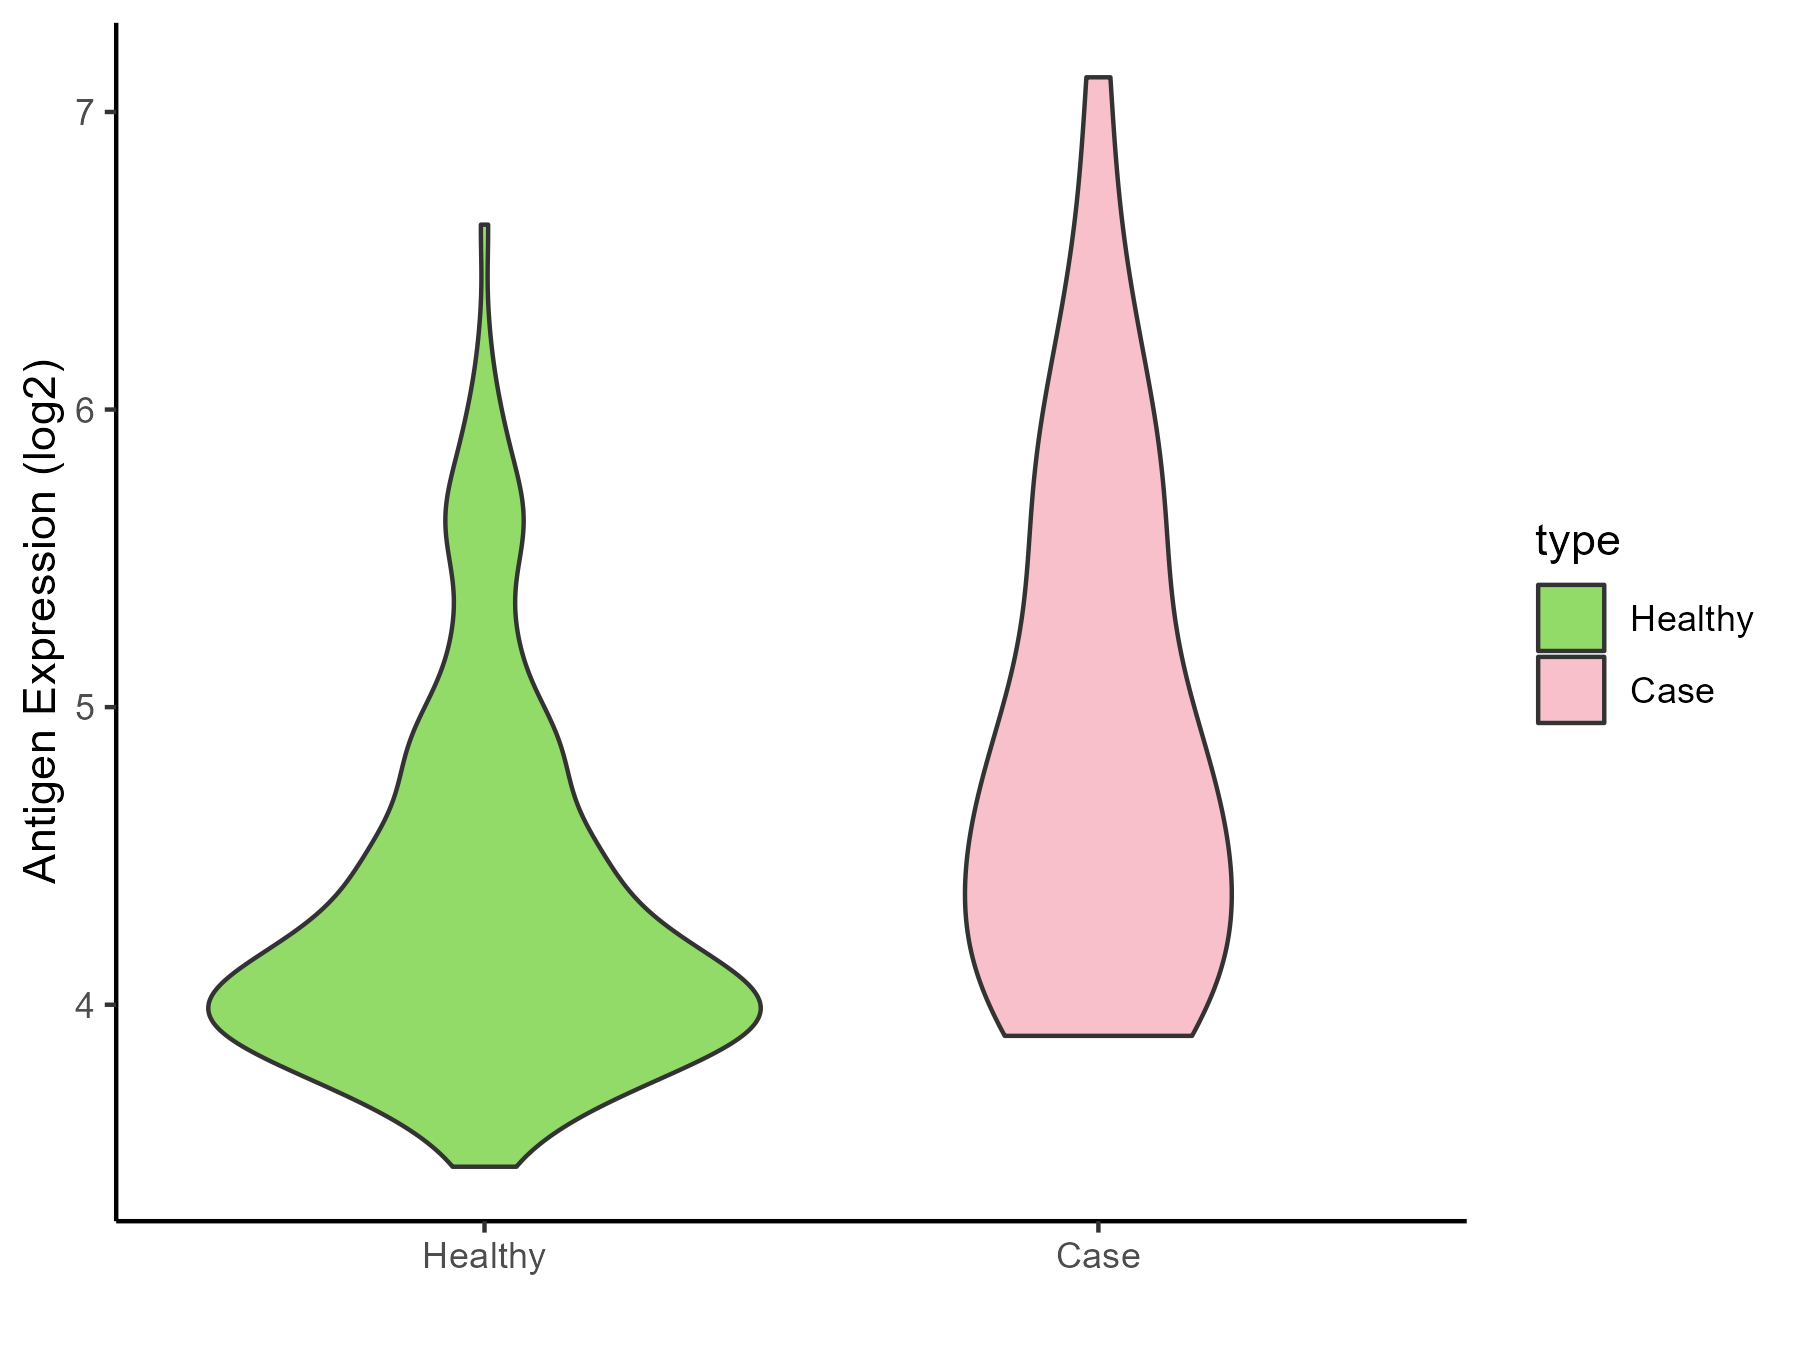
| The Studied Tissue | Small airway epithelium | |
| The Specific Disease | Chronic obstructive pulmonary disease | |
| The Expression Level of Disease Section Compare with the Healthy Individual Tissue | p-value: 0.000292604; Fold-change: 0.548056049; Z-score: 0.908140348 | |
| Disease-specific Antigen Abundances |
|
Click to View the Clearer Original Diagram |
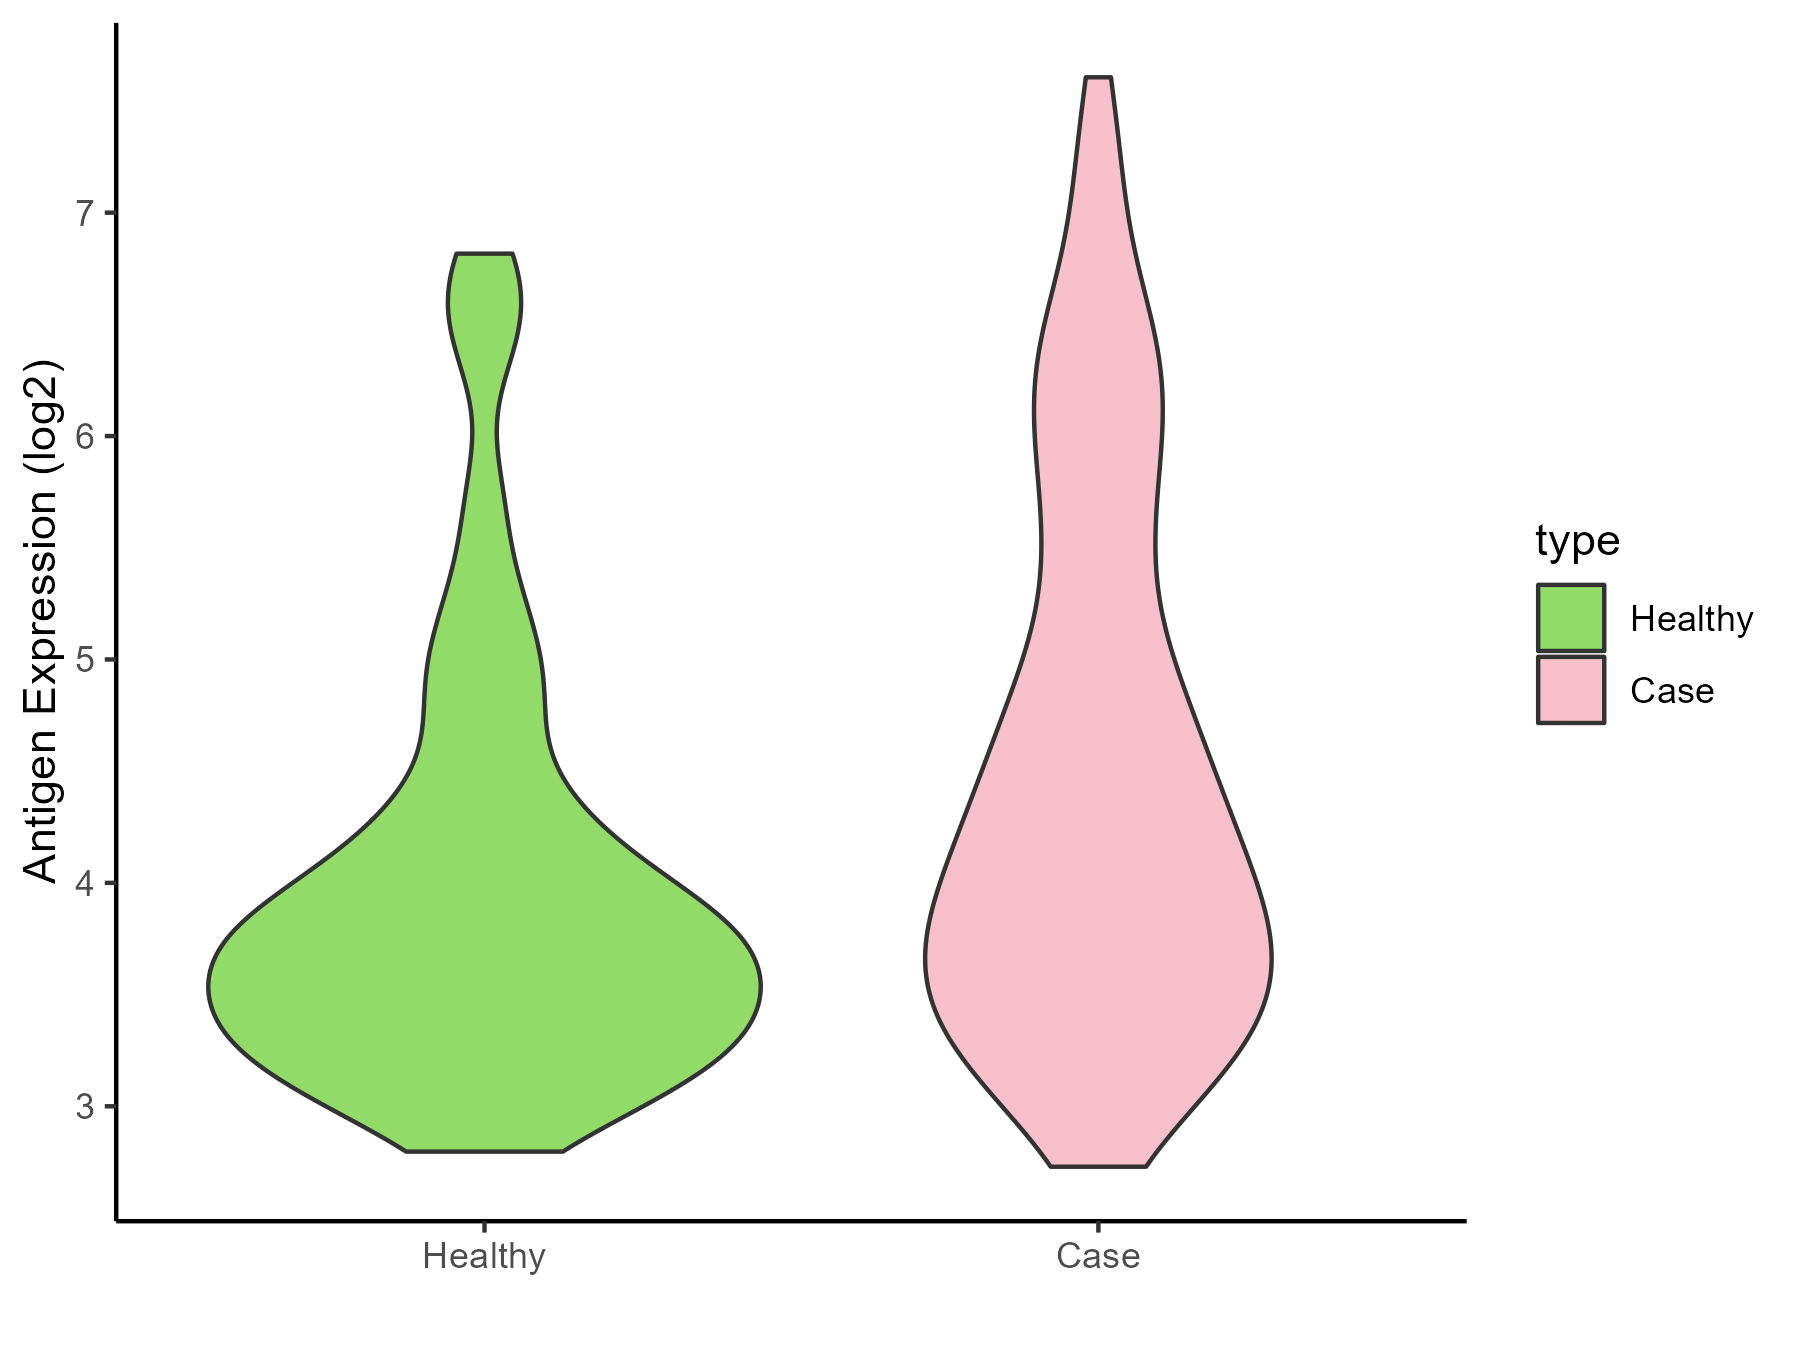
| Differential expression pattern of antigen in diseases | ||
| The Studied Tissue | Nasal and bronchial airway | |
| The Specific Disease | Asthma | |
| The Expression Level of Disease Section Compare with the Healthy Individual Tissue | p-value: 1.43E-05; Fold-change: 0.450340388; Z-score: 0.482700628 | |
| Disease-specific Antigen Abundances |
|
Click to View the Clearer Original Diagram |
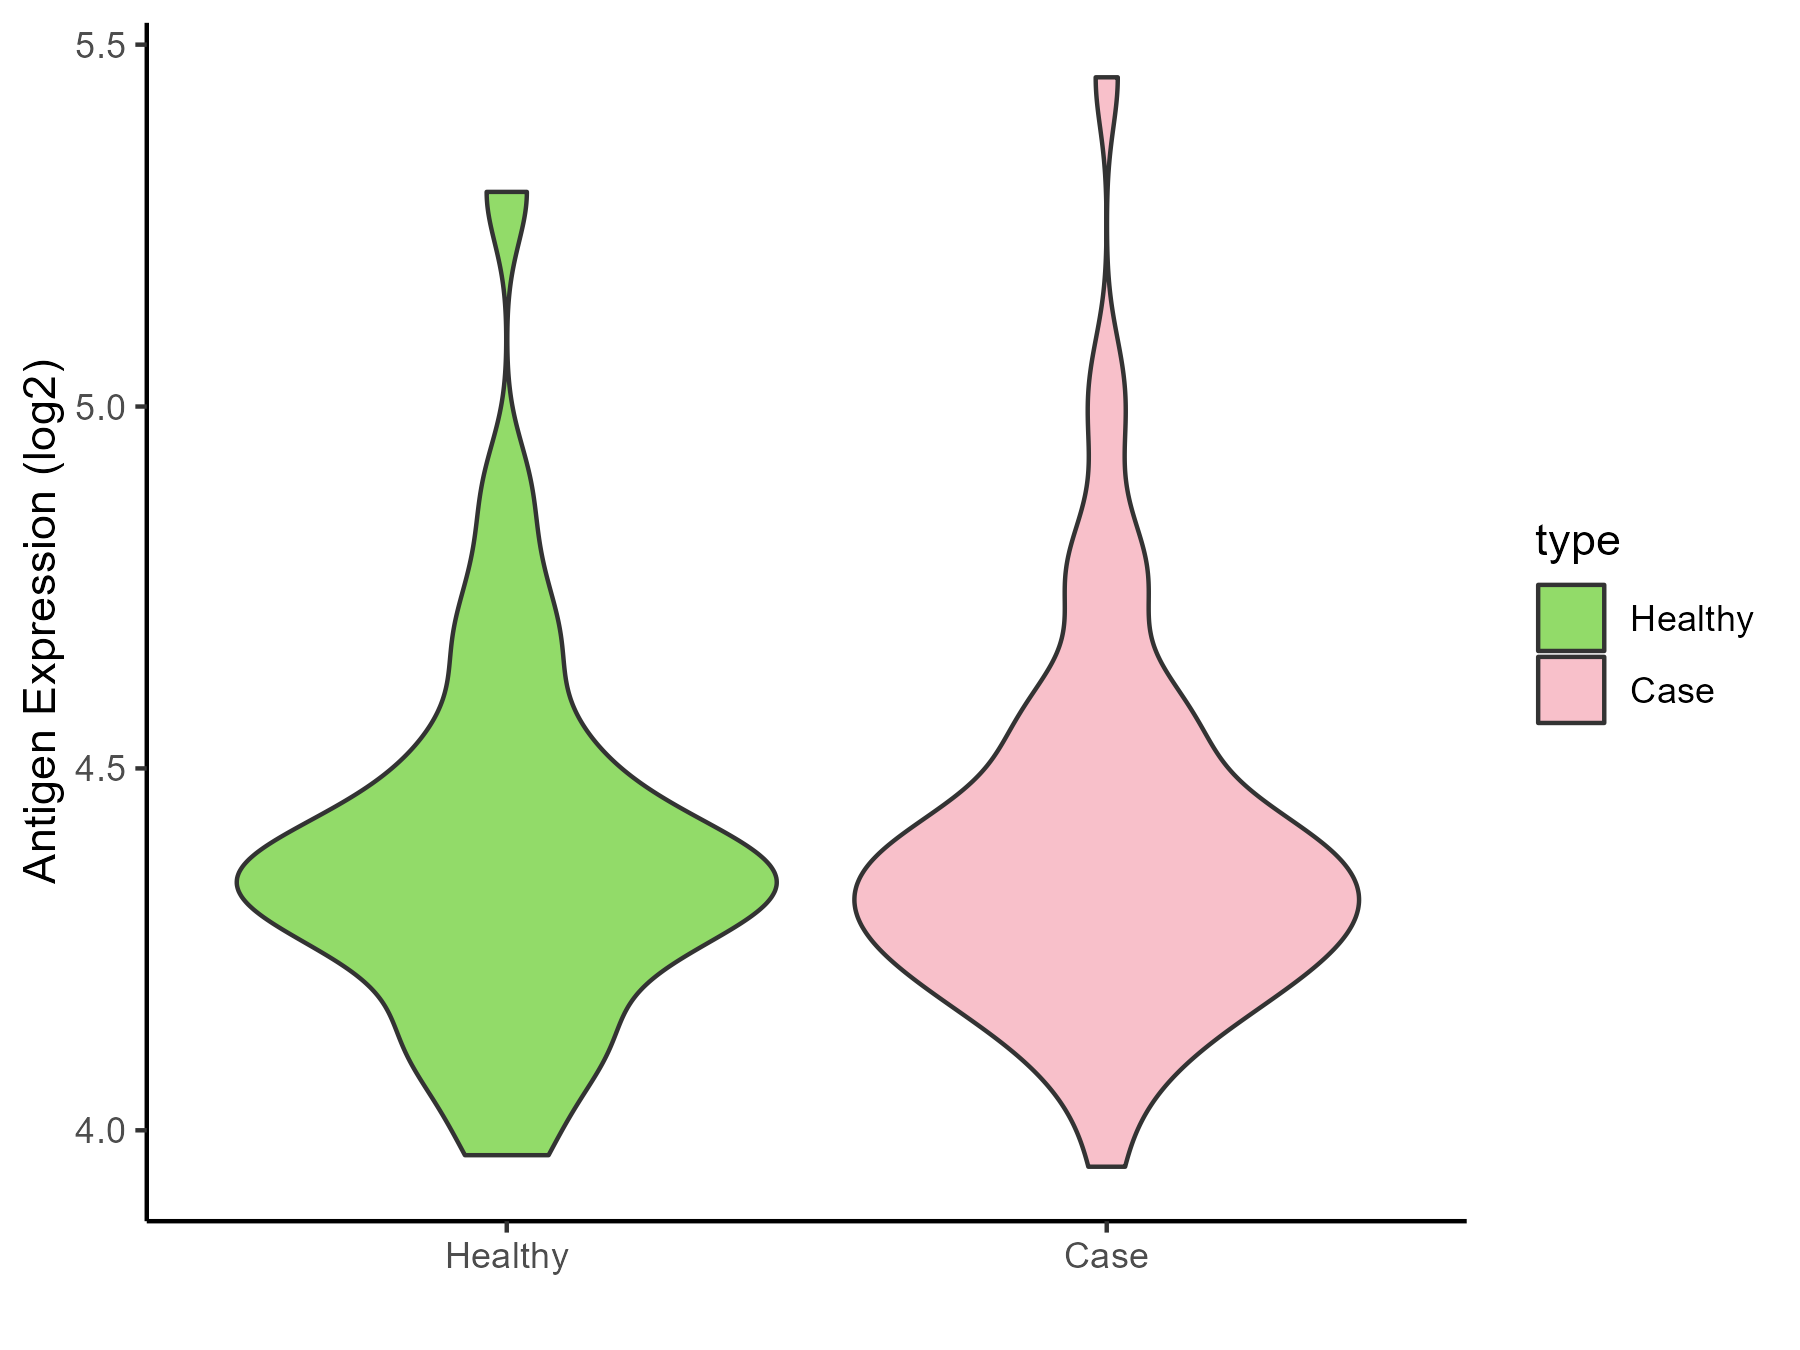
| Differential expression pattern of antigen in diseases | ||
| The Studied Tissue | Nasal Epithelium | |
| The Specific Disease | Human rhinovirus infection | |
| The Expression Level of Disease Section Compare with the Healthy Individual Tissue | p-value: 0.857895282; Fold-change: 0.00315038; Z-score: 0.011958526 | |
| Disease-specific Antigen Abundances |
|
Click to View the Clearer Original Diagram |
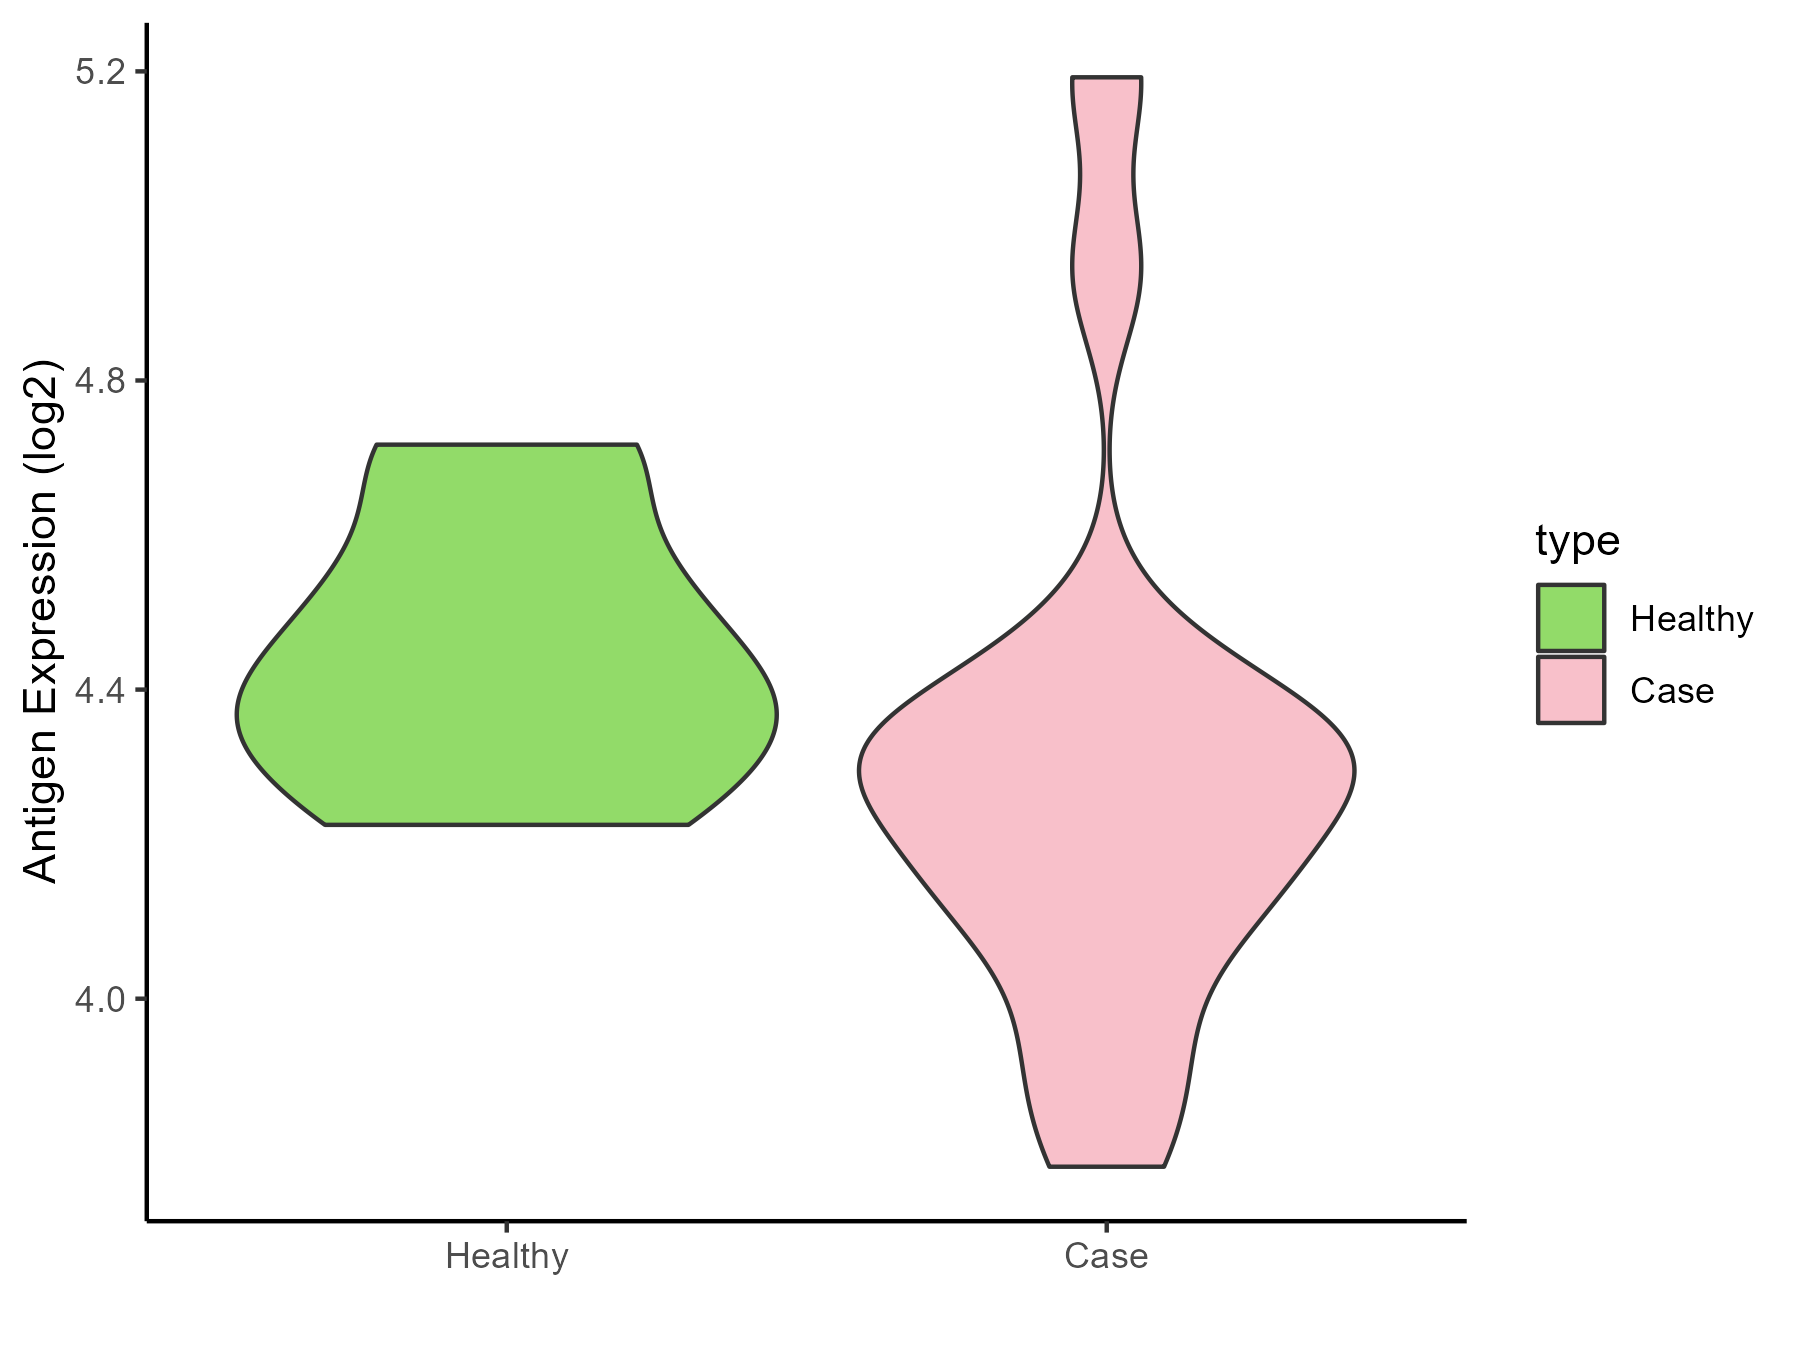
| Differential expression pattern of antigen in diseases | ||
| The Studied Tissue | Lung | |
| The Specific Disease | Idiopathic pulmonary fibrosis | |
| The Expression Level of Disease Section Compare with the Healthy Individual Tissue | p-value: 0.224542453; Fold-change: -0.111195131; Z-score: -0.588796953 | |
| Disease-specific Antigen Abundances |
|
Click to View the Clearer Original Diagram |
ICD Disease Classification 13
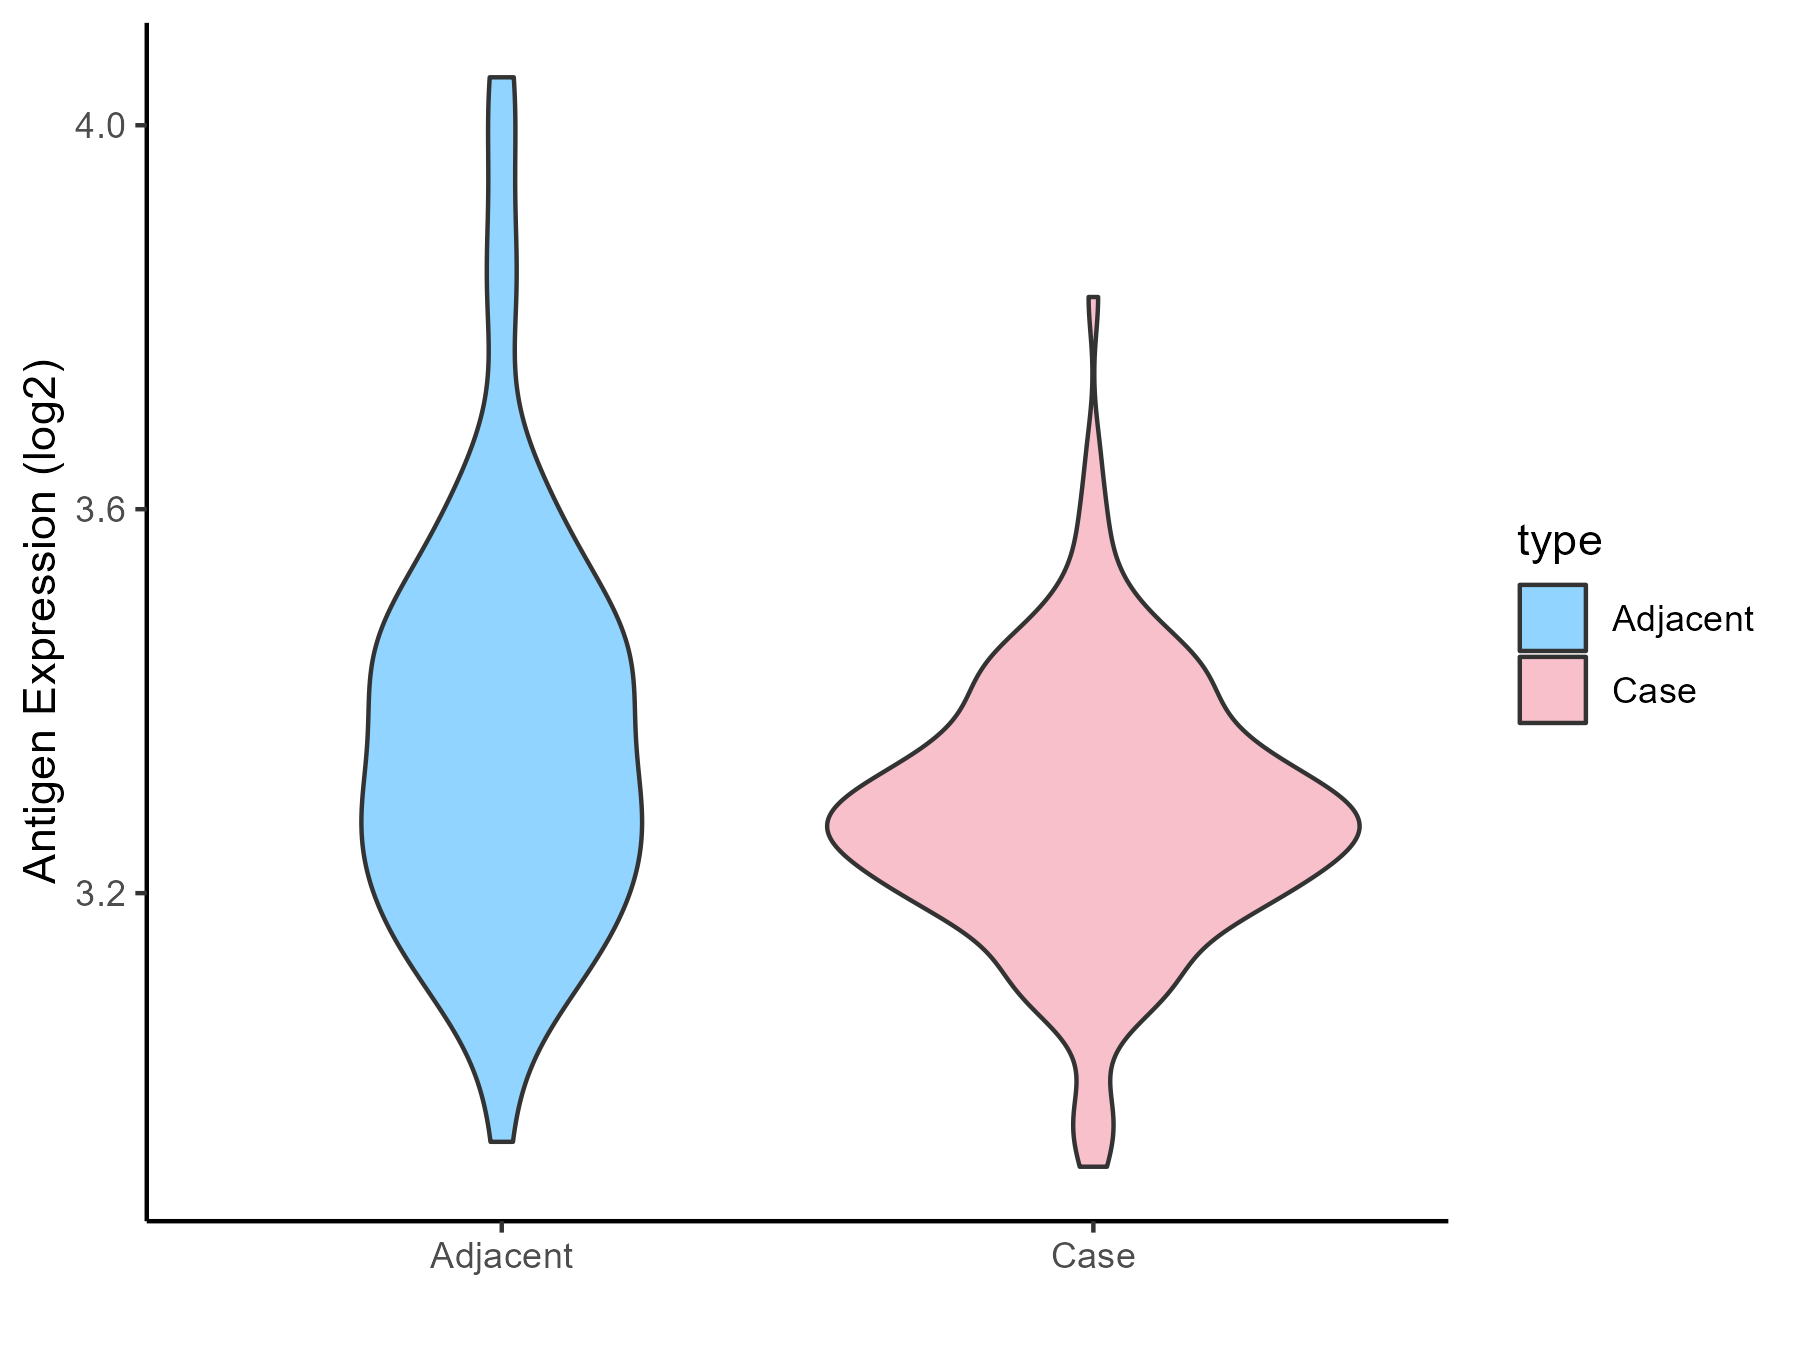
| Differential expression pattern of antigen in diseases | ||
| The Studied Tissue | Gingival | |
| The Specific Disease | Periodontal disease | |
| The Expression Level of Disease Section Compare with the Adjacent Tissue | p-value: 0.004406325; Fold-change: -0.053923331; Z-score: -0.247340565 | |
| Disease-specific Antigen Abundances |
|
Click to View the Clearer Original Diagram |
| Differential expression pattern of antigen in diseases | ||
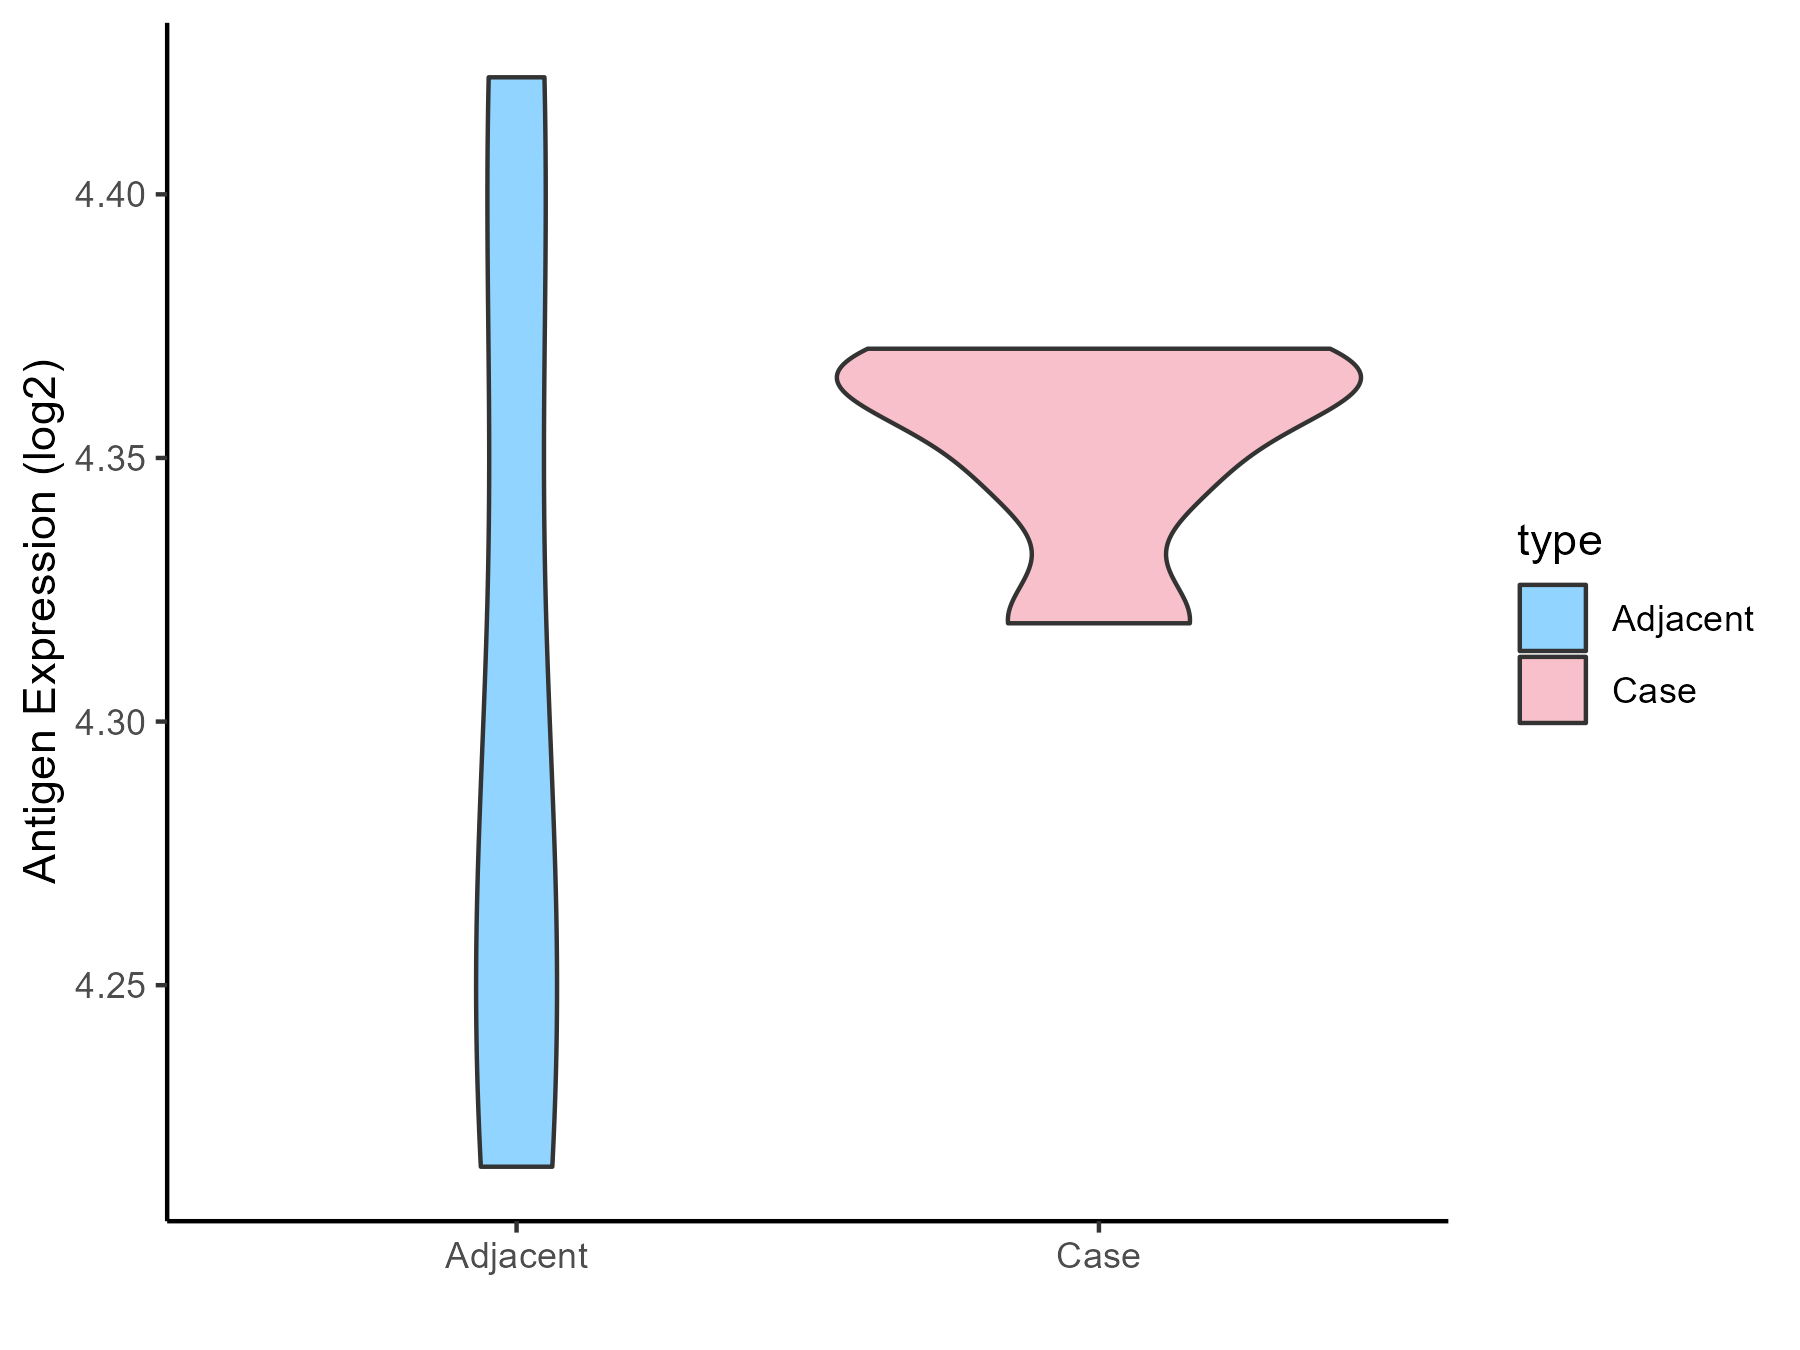
| The Studied Tissue | Gastric antrum | |
| The Specific Disease | Eosinophilic gastritis | |
| The Expression Level of Disease Section Compare with the Adjacent Tissue | p-value: 0.383050487; Fold-change: 0.100573282; Z-score: 1.080118304 | |
| Disease-specific Antigen Abundances |
|
Click to View the Clearer Original Diagram |
| Differential expression pattern of antigen in diseases | ||
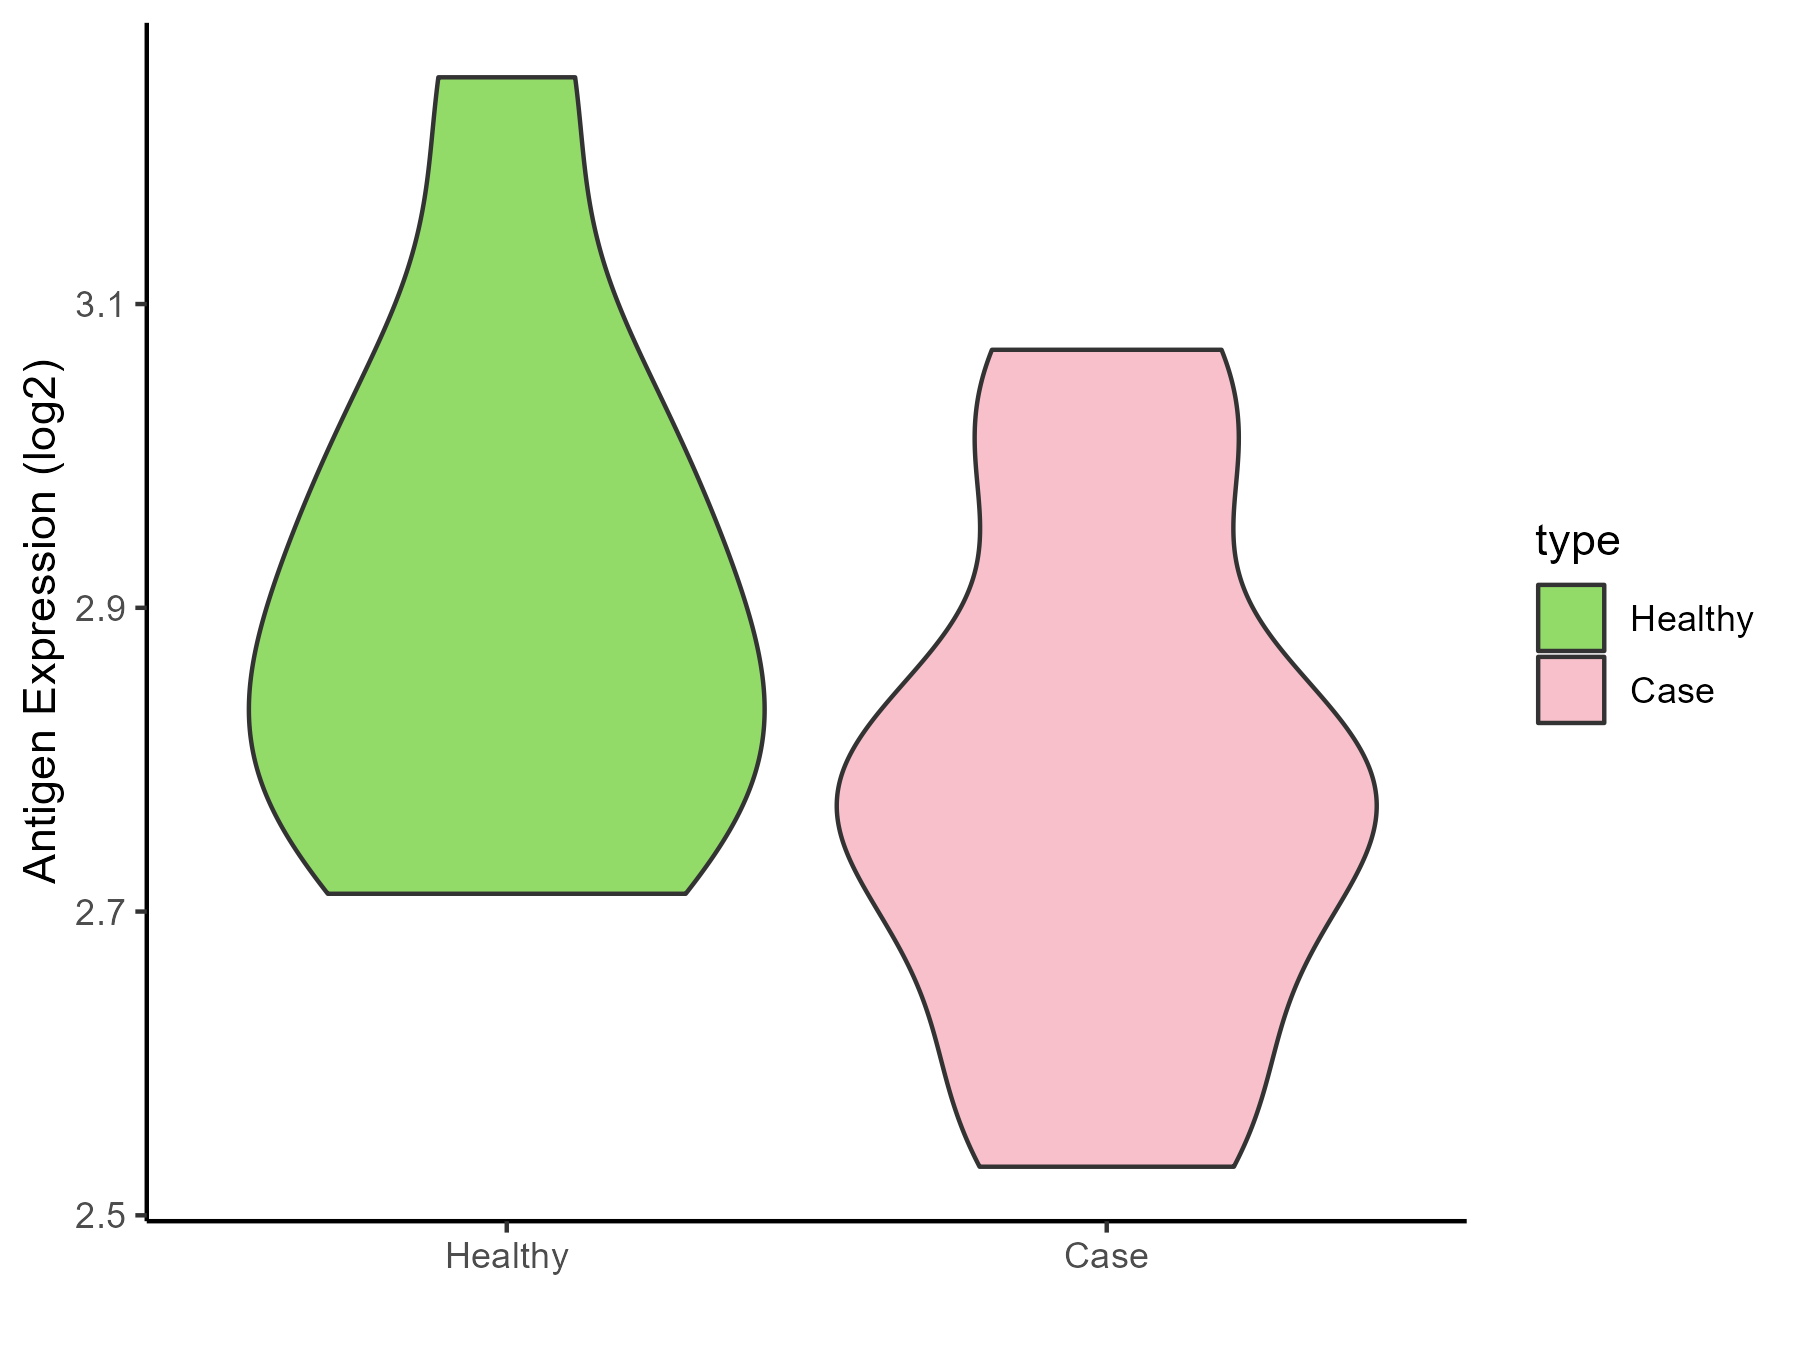
| The Studied Tissue | Liver | |
| The Specific Disease | Liver failure | |
| The Expression Level of Disease Section Compare with the Healthy Individual Tissue | p-value: 0.16332005; Fold-change: -0.100615254; Z-score: -0.575311487 | |
| Disease-specific Antigen Abundances |
|
Click to View the Clearer Original Diagram |
| Differential expression pattern of antigen in diseases | ||
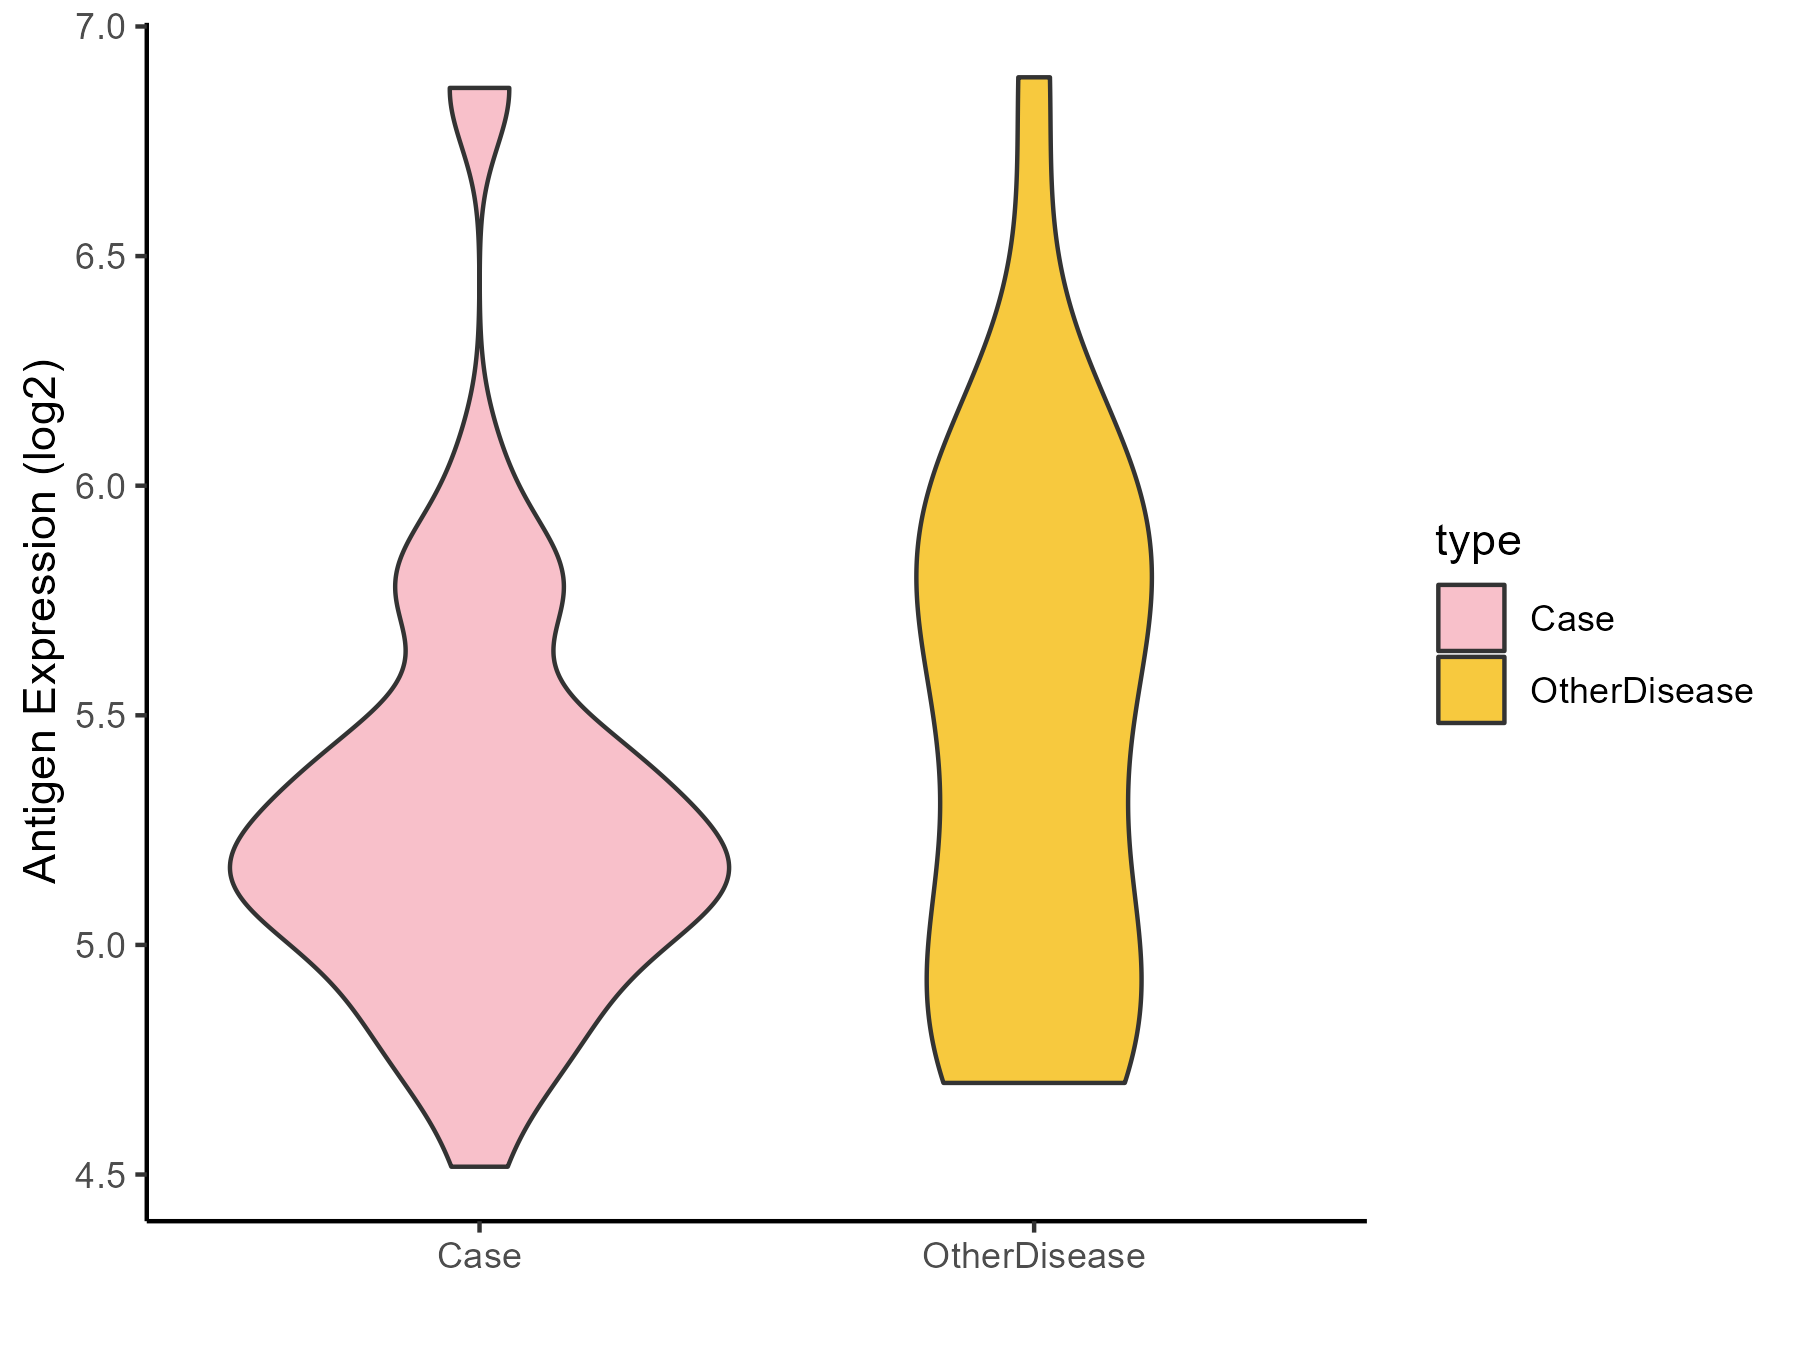
| The Studied Tissue | Colon mucosal | |
| The Specific Disease | Ulcerative colitis | |
| The Expression Level of Disease Section Compare with the Adjacent Tissue | p-value: 0.313763953; Fold-change: -0.301605885; Z-score: -0.500631949 | |
| Disease-specific Antigen Abundances |
|
Click to View the Clearer Original Diagram |
| Differential expression pattern of antigen in diseases | ||
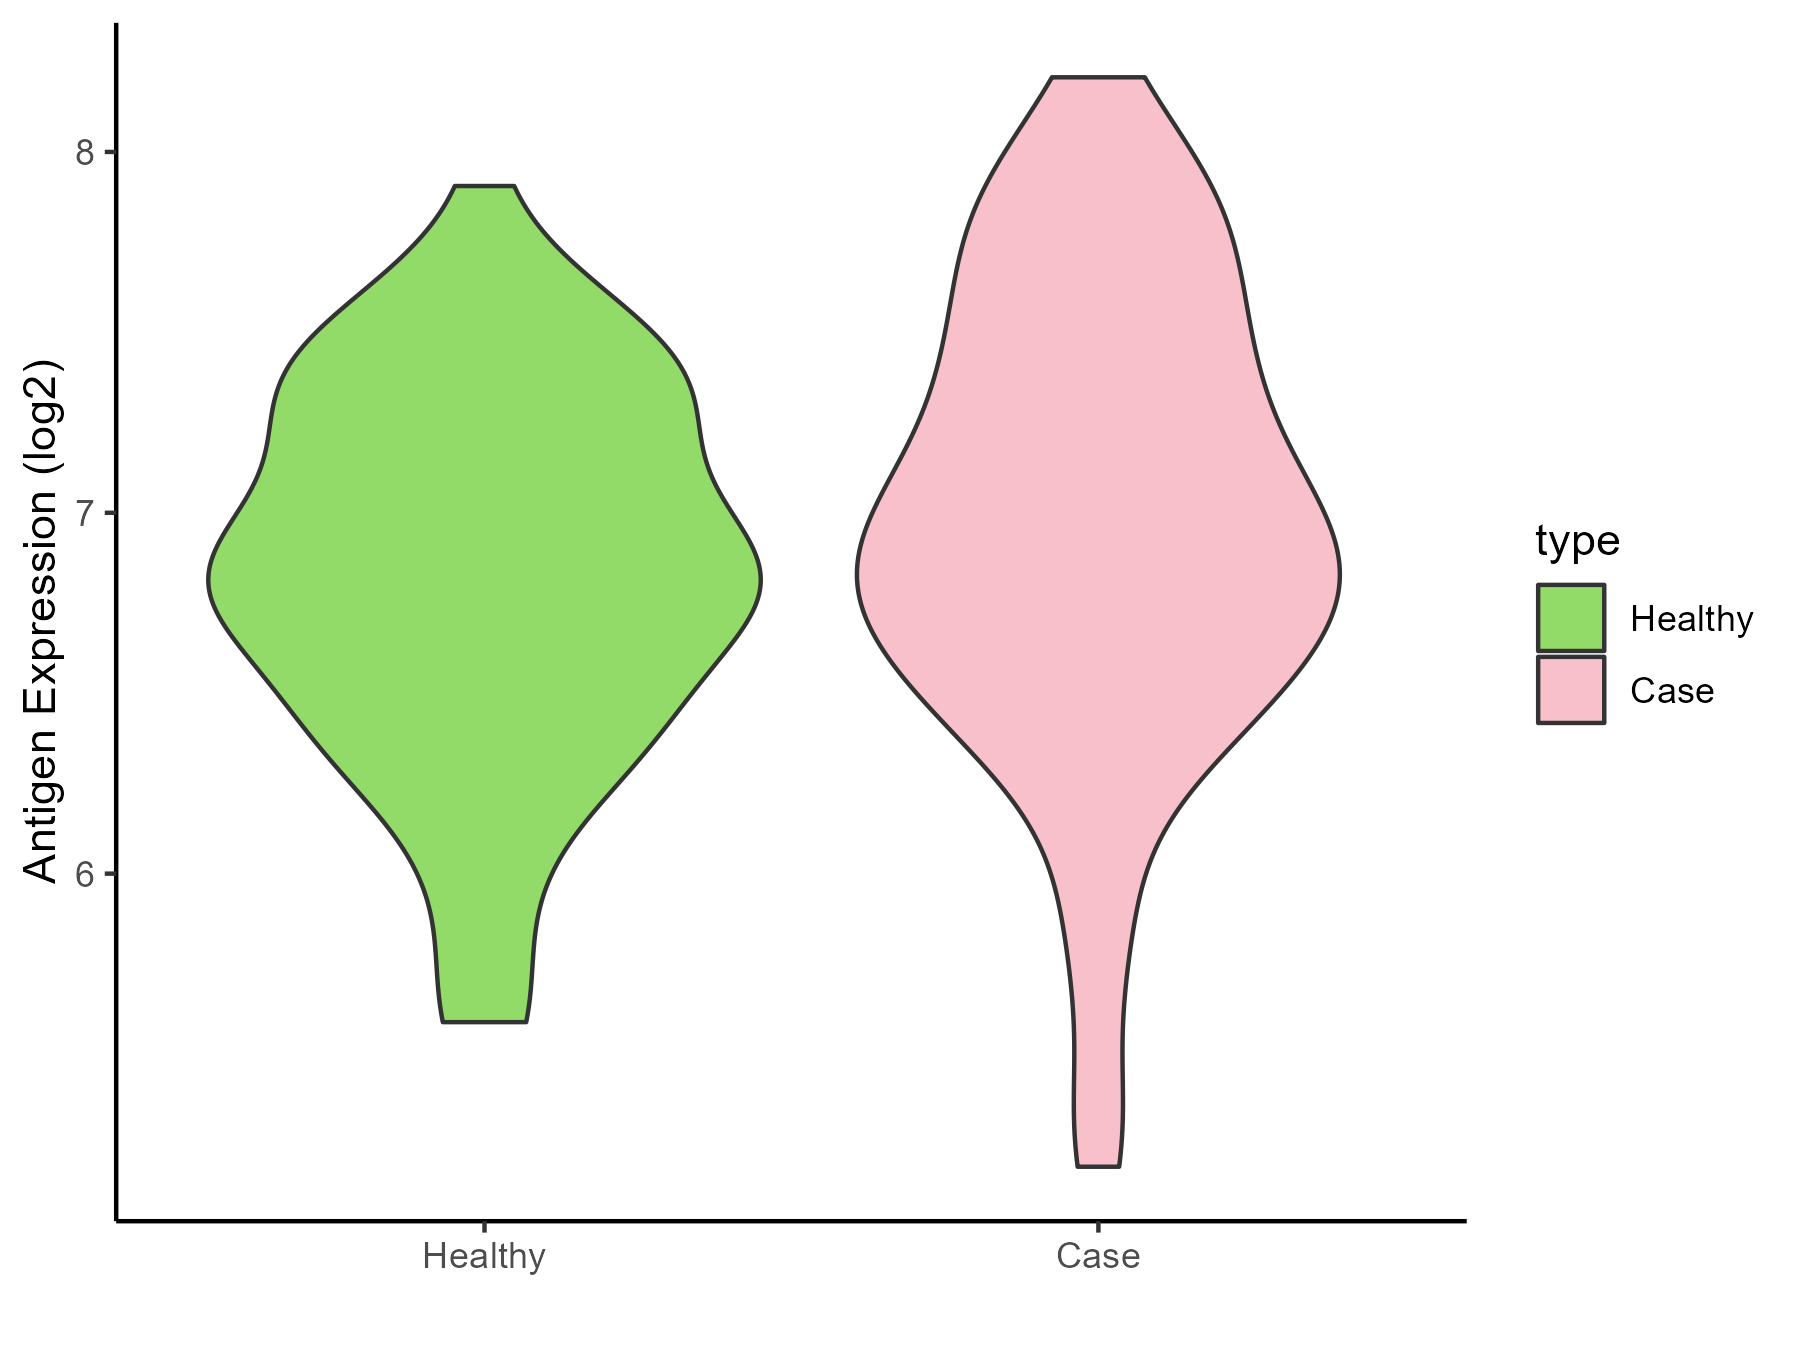
| The Studied Tissue | Rectal colon | |
| The Specific Disease | Irritable bowel syndrome | |
| The Expression Level of Disease Section Compare with the Healthy Individual Tissue | p-value: 0.08965931; Fold-change: 0.156785105; Z-score: 0.300508446 | |
| Disease-specific Antigen Abundances |
|
Click to View the Clearer Original Diagram |
ICD Disease Classification 14
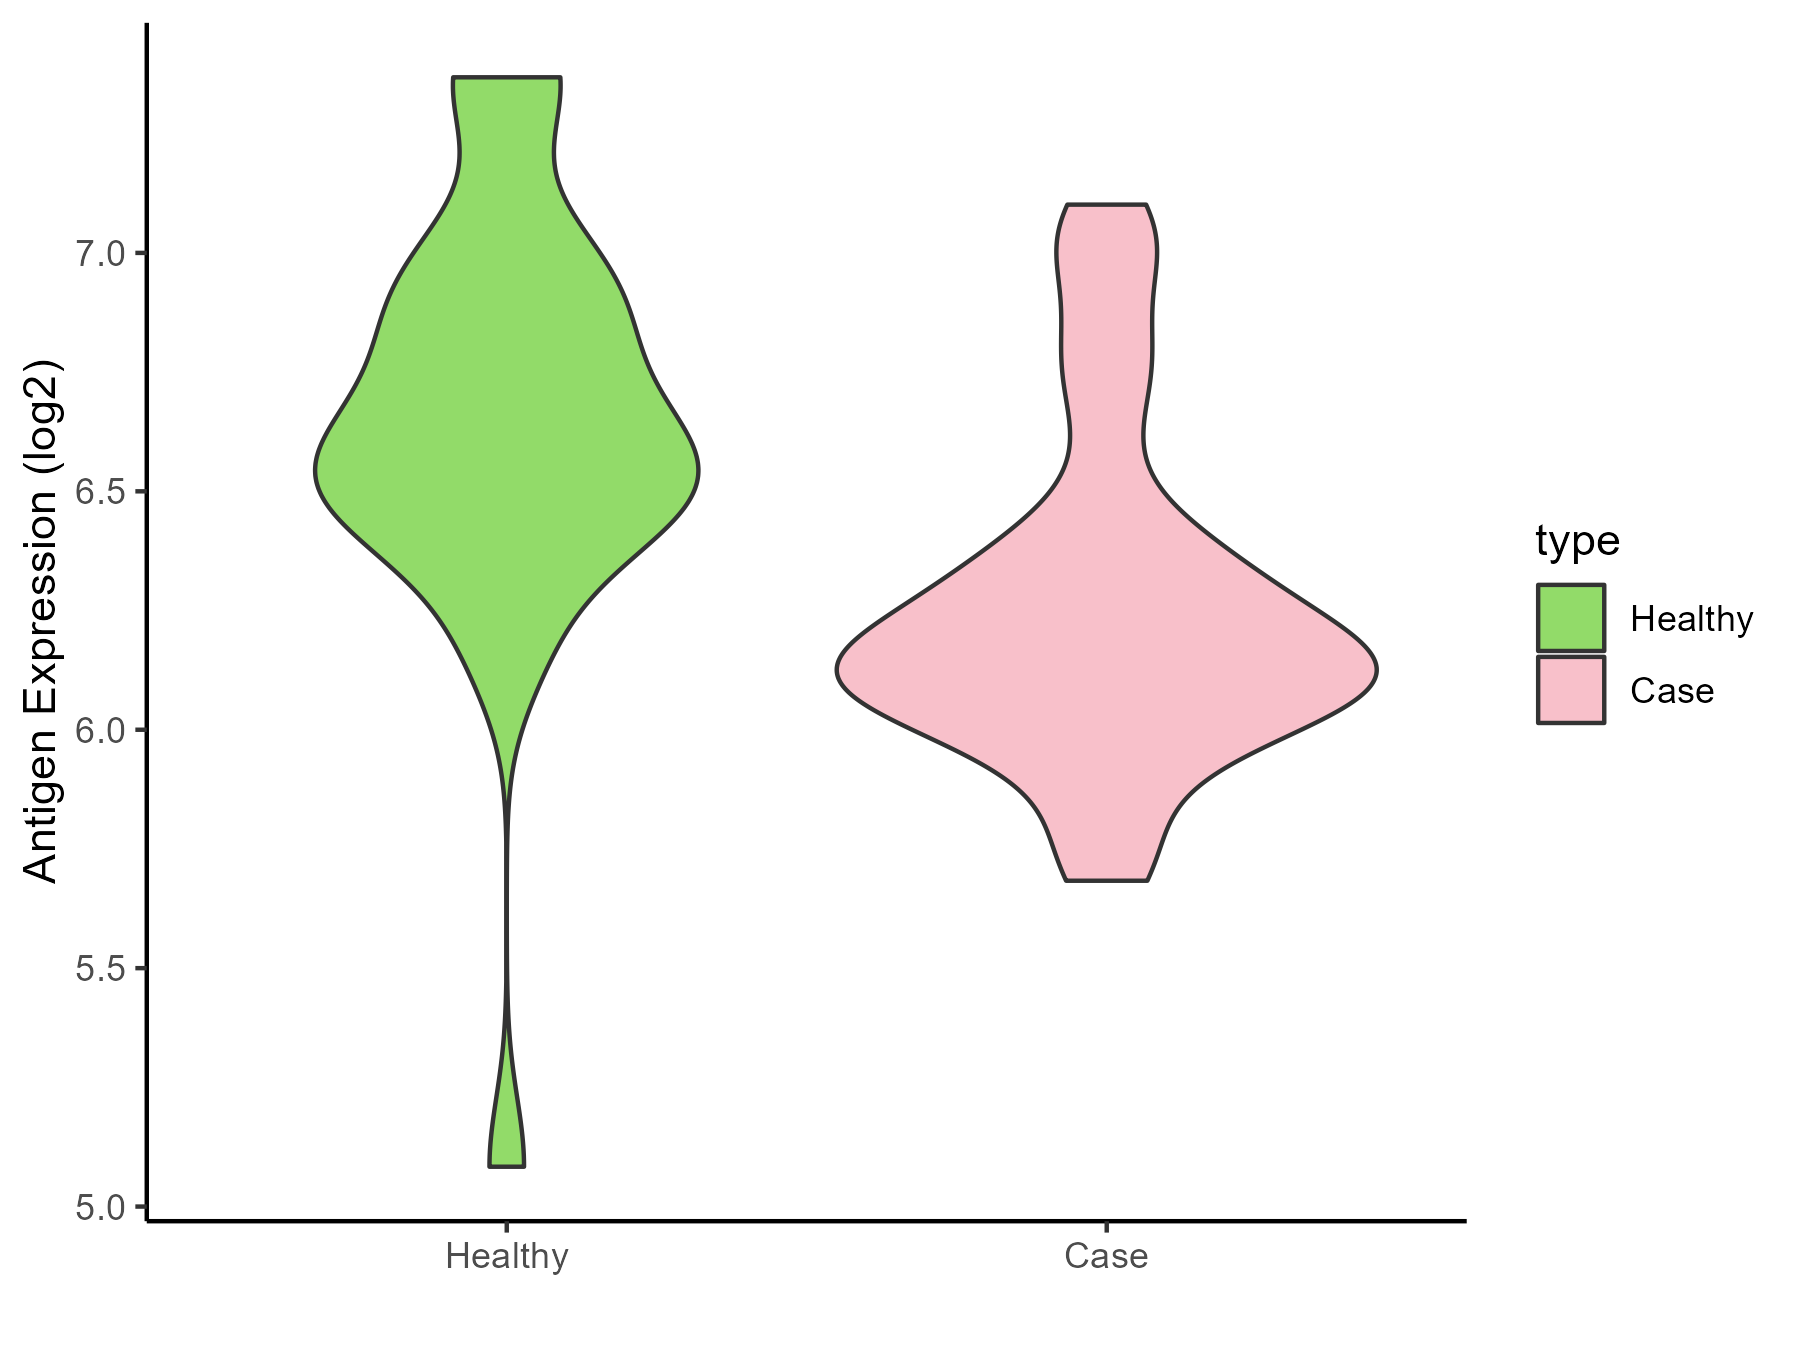
| Differential expression pattern of antigen in diseases | ||
| The Studied Tissue | Skin | |
| The Specific Disease | Atopic dermatitis | |
| The Expression Level of Disease Section Compare with the Healthy Individual Tissue | p-value: 0.000831982; Fold-change: -0.461836592; Z-score: -0.995902846 | |
| Disease-specific Antigen Abundances |
|
Click to View the Clearer Original Diagram |
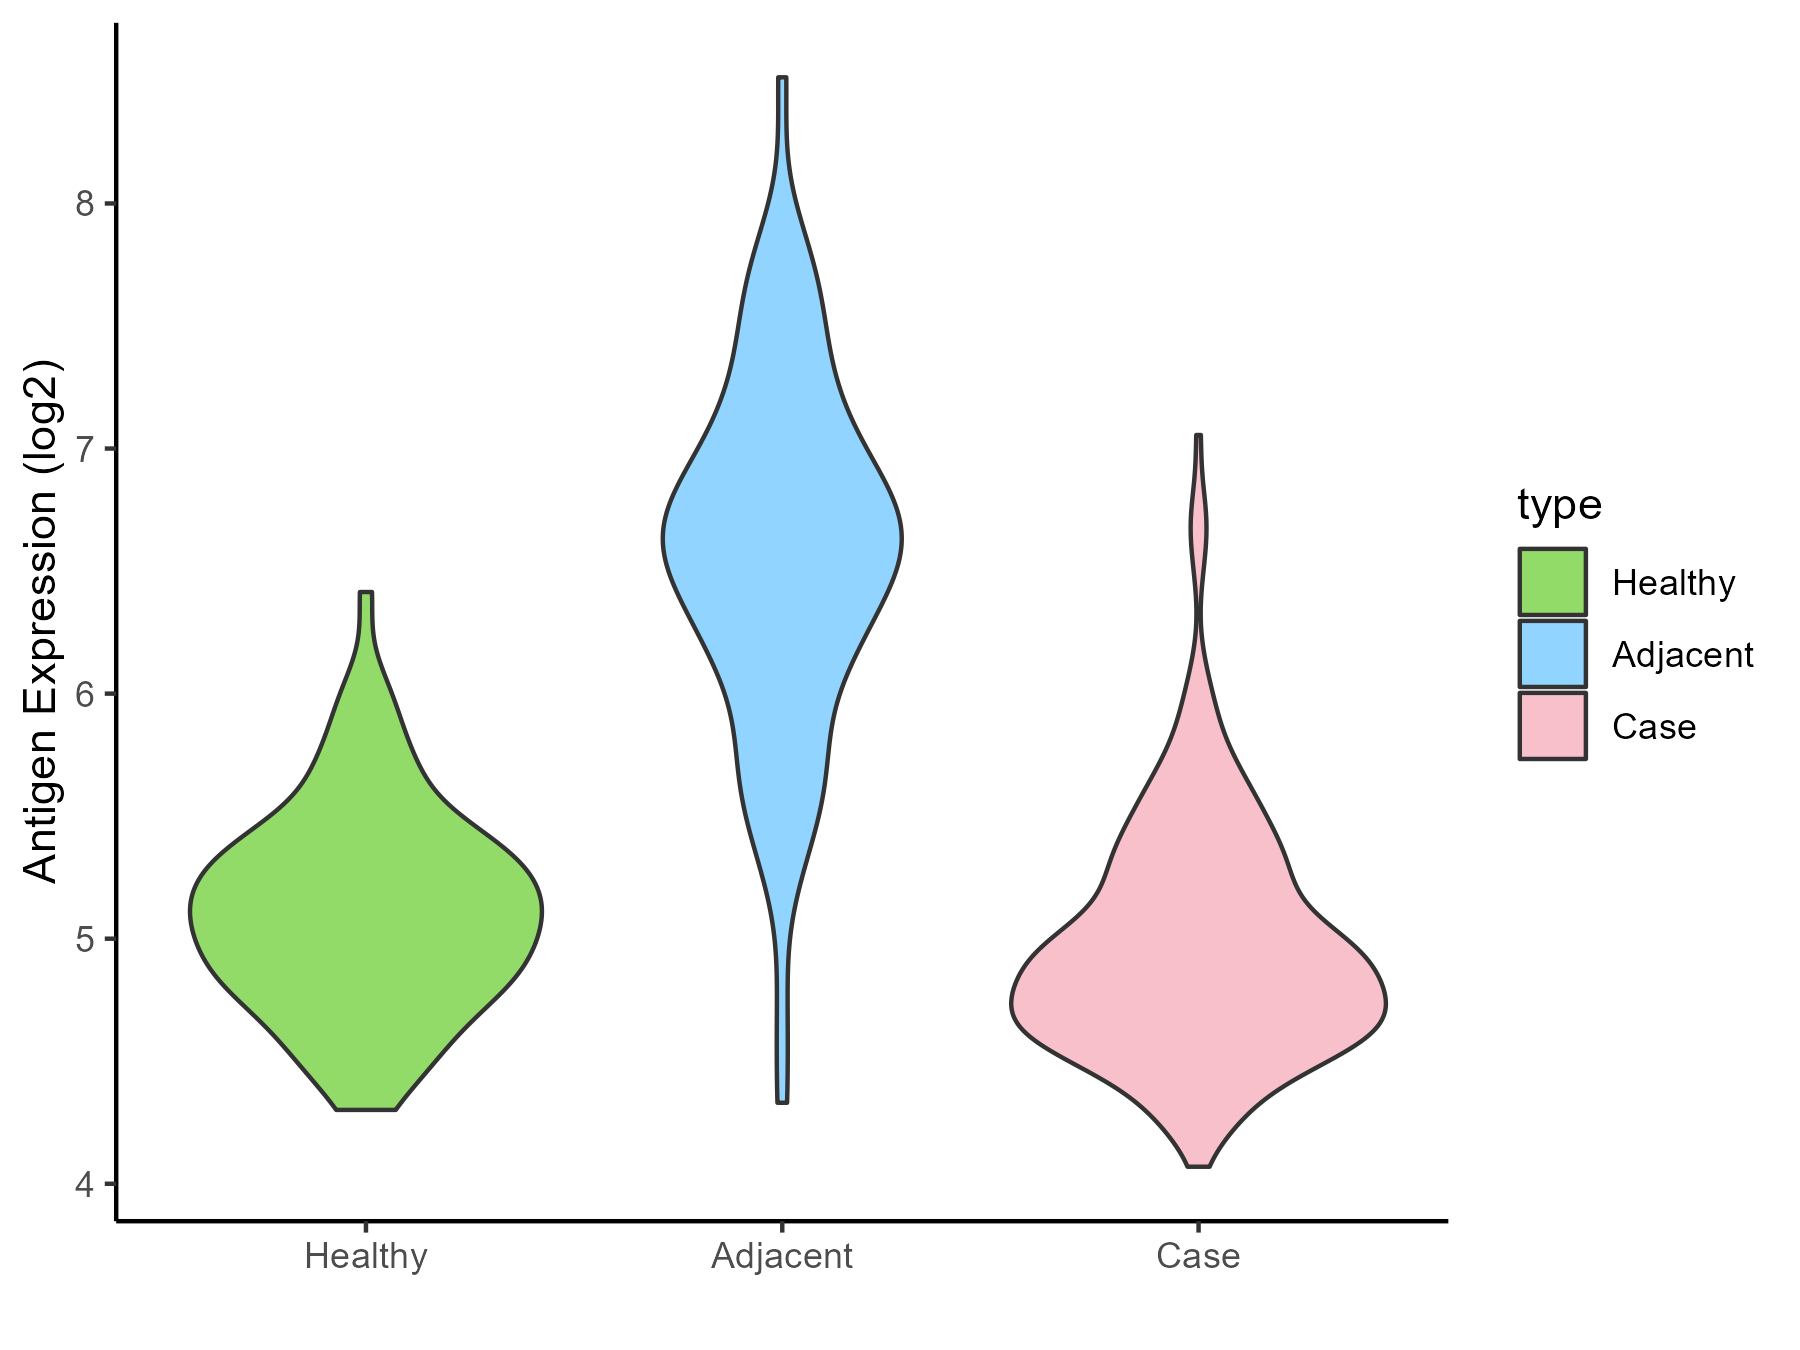
| Differential expression pattern of antigen in diseases | ||
| The Studied Tissue | Skin | |
| The Specific Disease | Psoriasis | |
| The Expression Level of Disease Section Compare with the Healthy Individual Tissue | p-value: 0.007770134; Fold-change: -0.216596659; Z-score: -0.525229966 | |
| The Expression Level of Disease Section Compare with the Adjacent Tissue | p-value: 3.60E-35; Fold-change: -1.725631853; Z-score: -2.371503844 | |
| Disease-specific Antigen Abundances |
|
Click to View the Clearer Original Diagram |
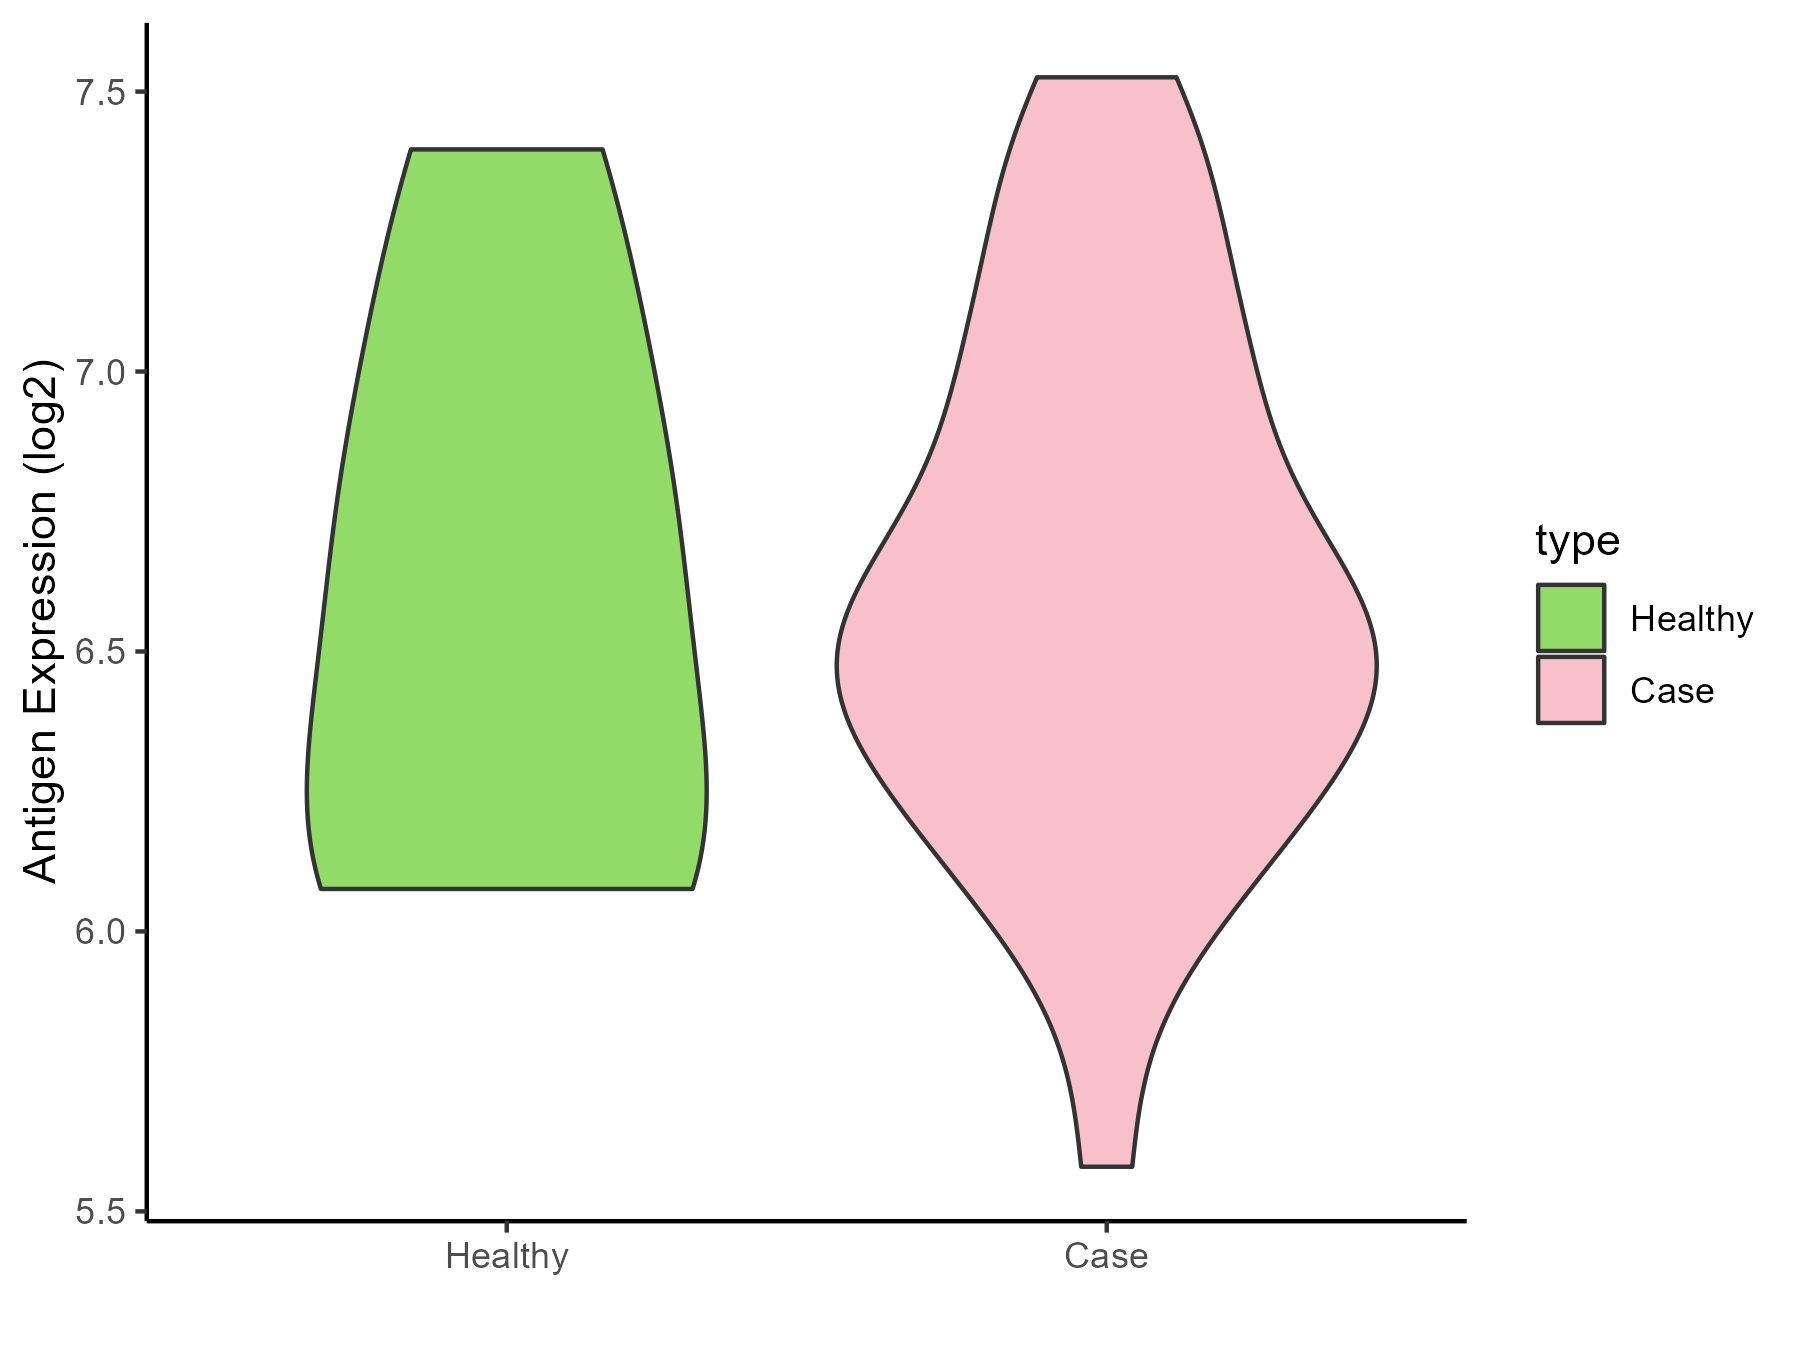
| Differential expression pattern of antigen in diseases | ||
| The Studied Tissue | Skin | |
| The Specific Disease | Vitiligo | |
| The Expression Level of Disease Section Compare with the Healthy Individual Tissue | p-value: 0.877058939; Fold-change: -0.138687527; Z-score: -0.269633798 | |
| Disease-specific Antigen Abundances |
|
Click to View the Clearer Original Diagram |
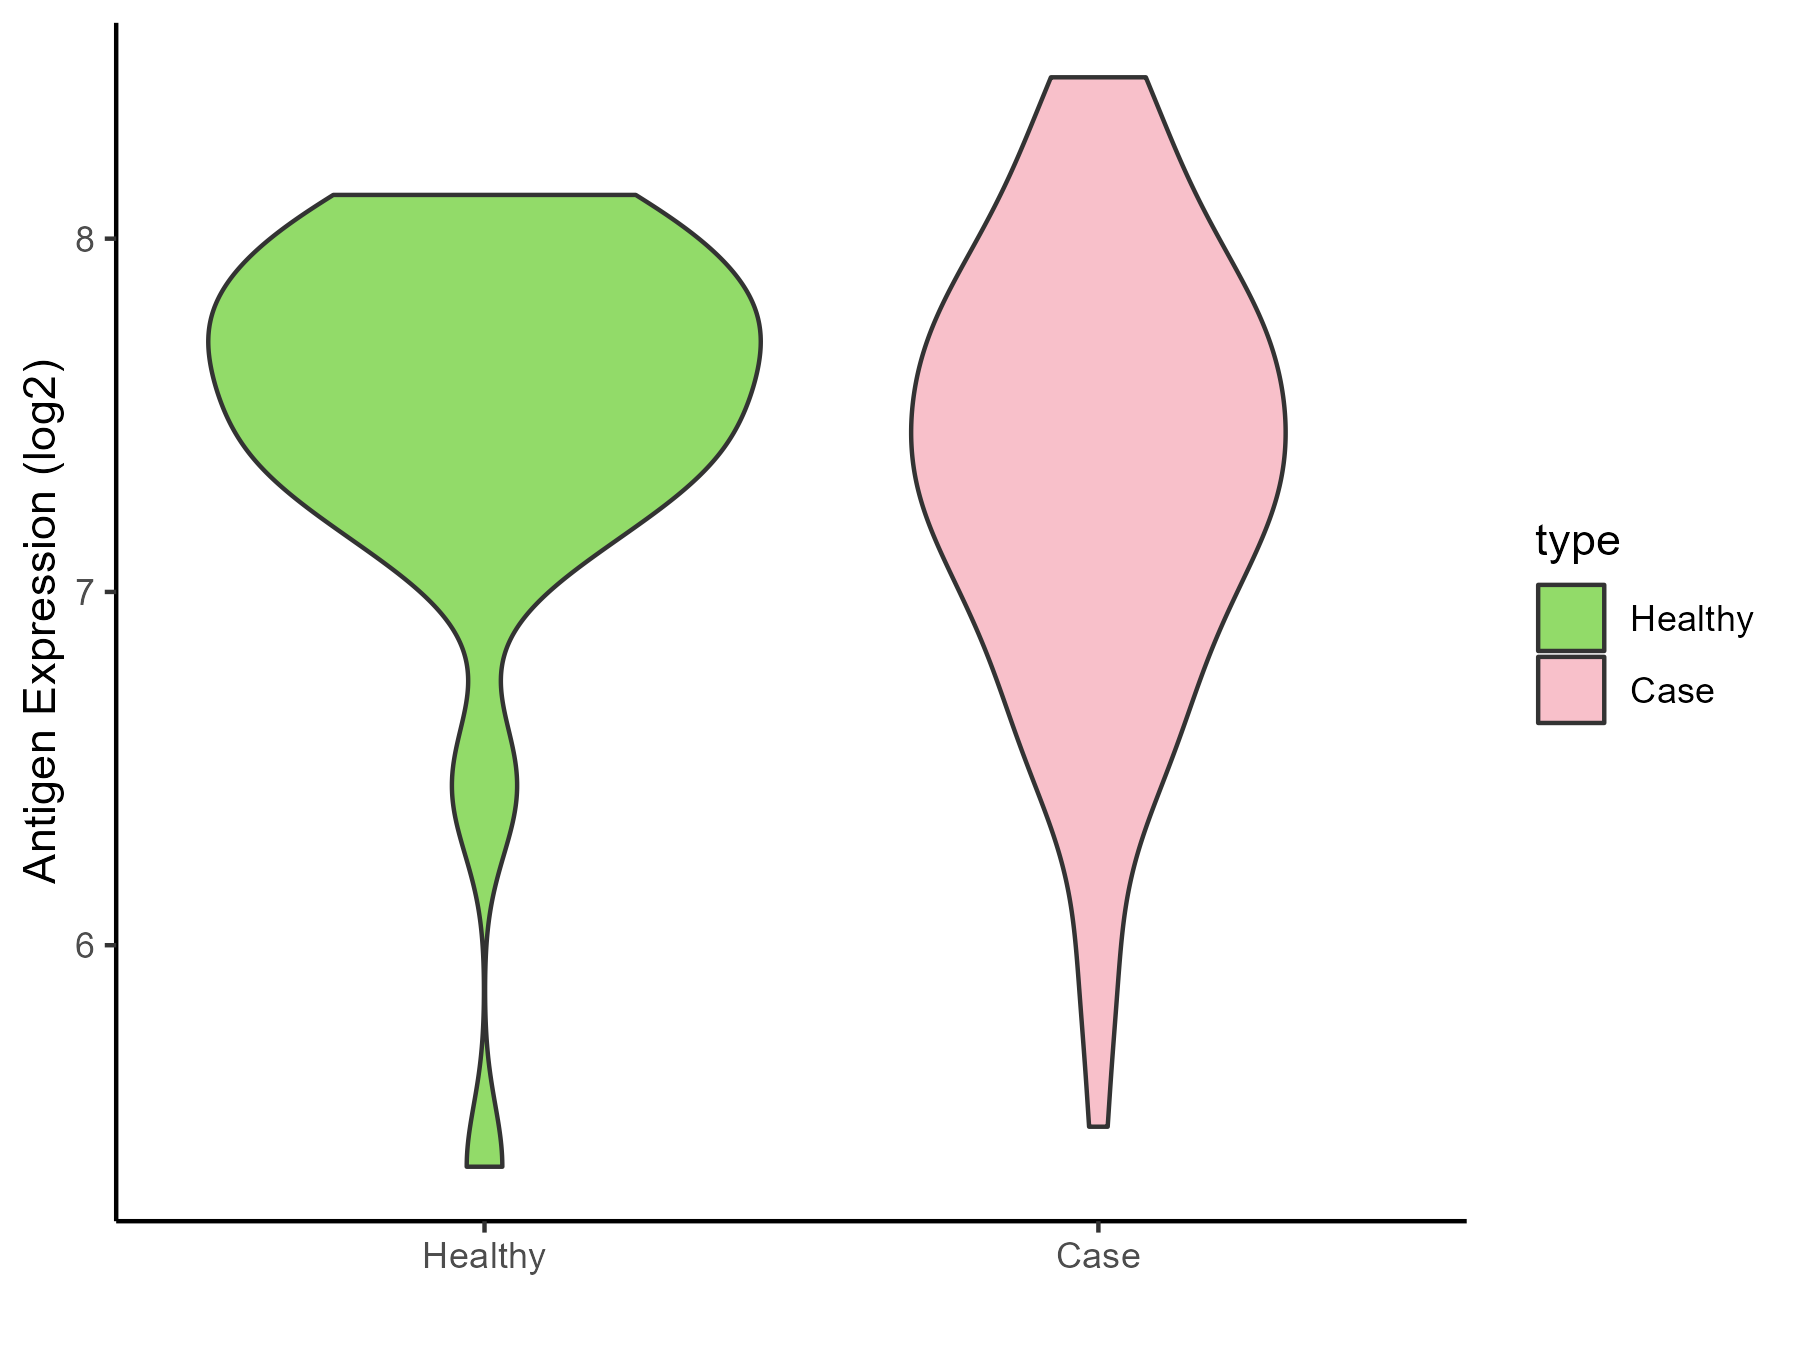
| Differential expression pattern of antigen in diseases | ||
| The Studied Tissue | Skin from scalp | |
| The Specific Disease | Alopecia | |
| The Expression Level of Disease Section Compare with the Healthy Individual Tissue | p-value: 0.110379989; Fold-change: -0.265675678; Z-score: -0.495869408 | |
| Disease-specific Antigen Abundances |
|
Click to View the Clearer Original Diagram |
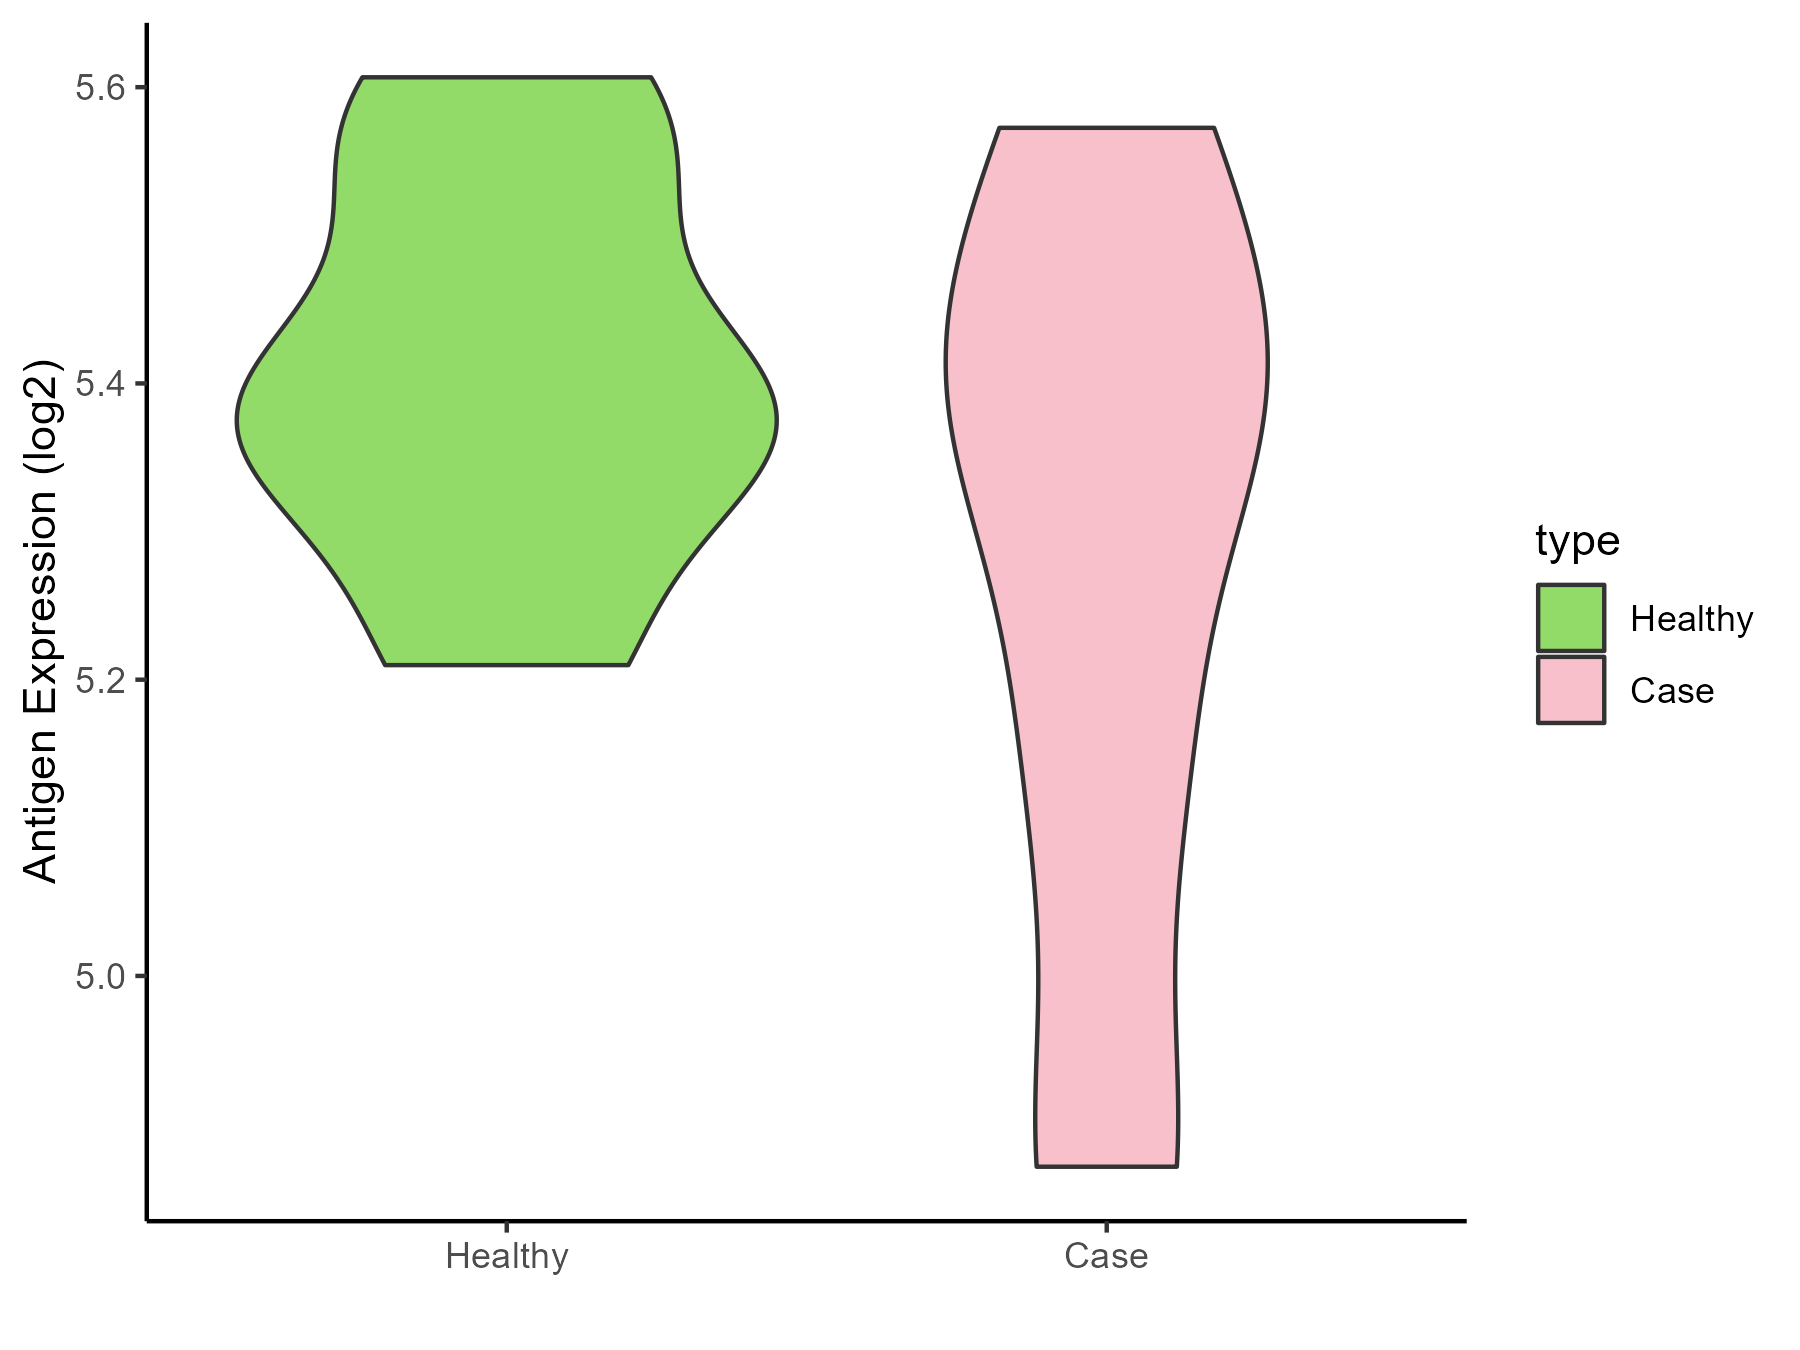
| Differential expression pattern of antigen in diseases | ||
| The Studied Tissue | Skin | |
| The Specific Disease | Sensitive skin | |
| Disease-specific Antigen Abundances |
|
Click to View the Clearer Original Diagram |
ICD Disease Classification 15
| Differential expression pattern of antigen in diseases | ||
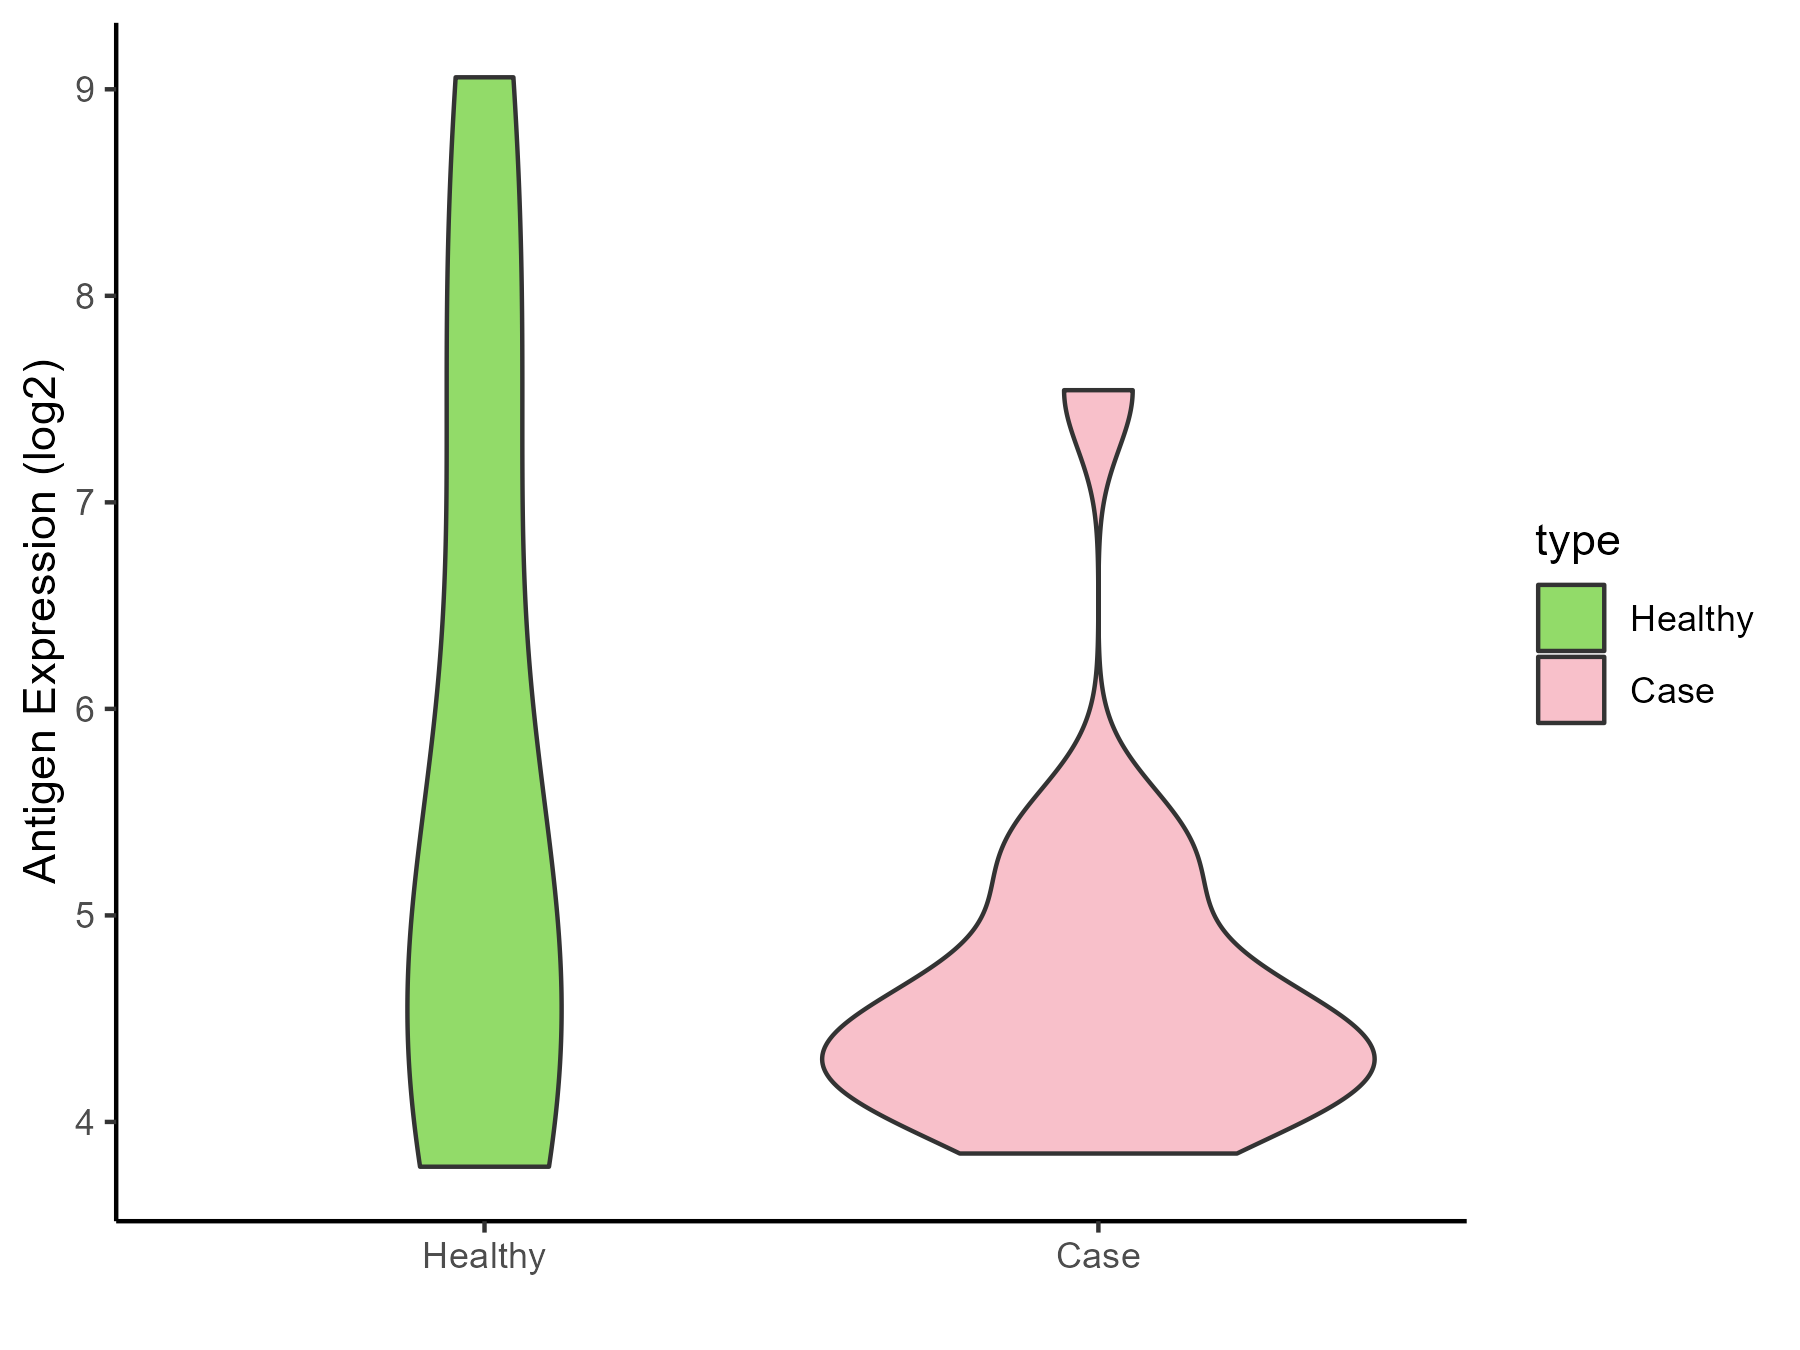
| The Studied Tissue | Synovial | |
| The Specific Disease | Osteoarthritis | |
| The Expression Level of Disease Section Compare with the Healthy Individual Tissue | p-value: 0.179829688; Fold-change: -0.274024462; Z-score: -0.141210198 | |
| Disease-specific Antigen Abundances |
|
Click to View the Clearer Original Diagram |
| Differential expression pattern of antigen in diseases | ||
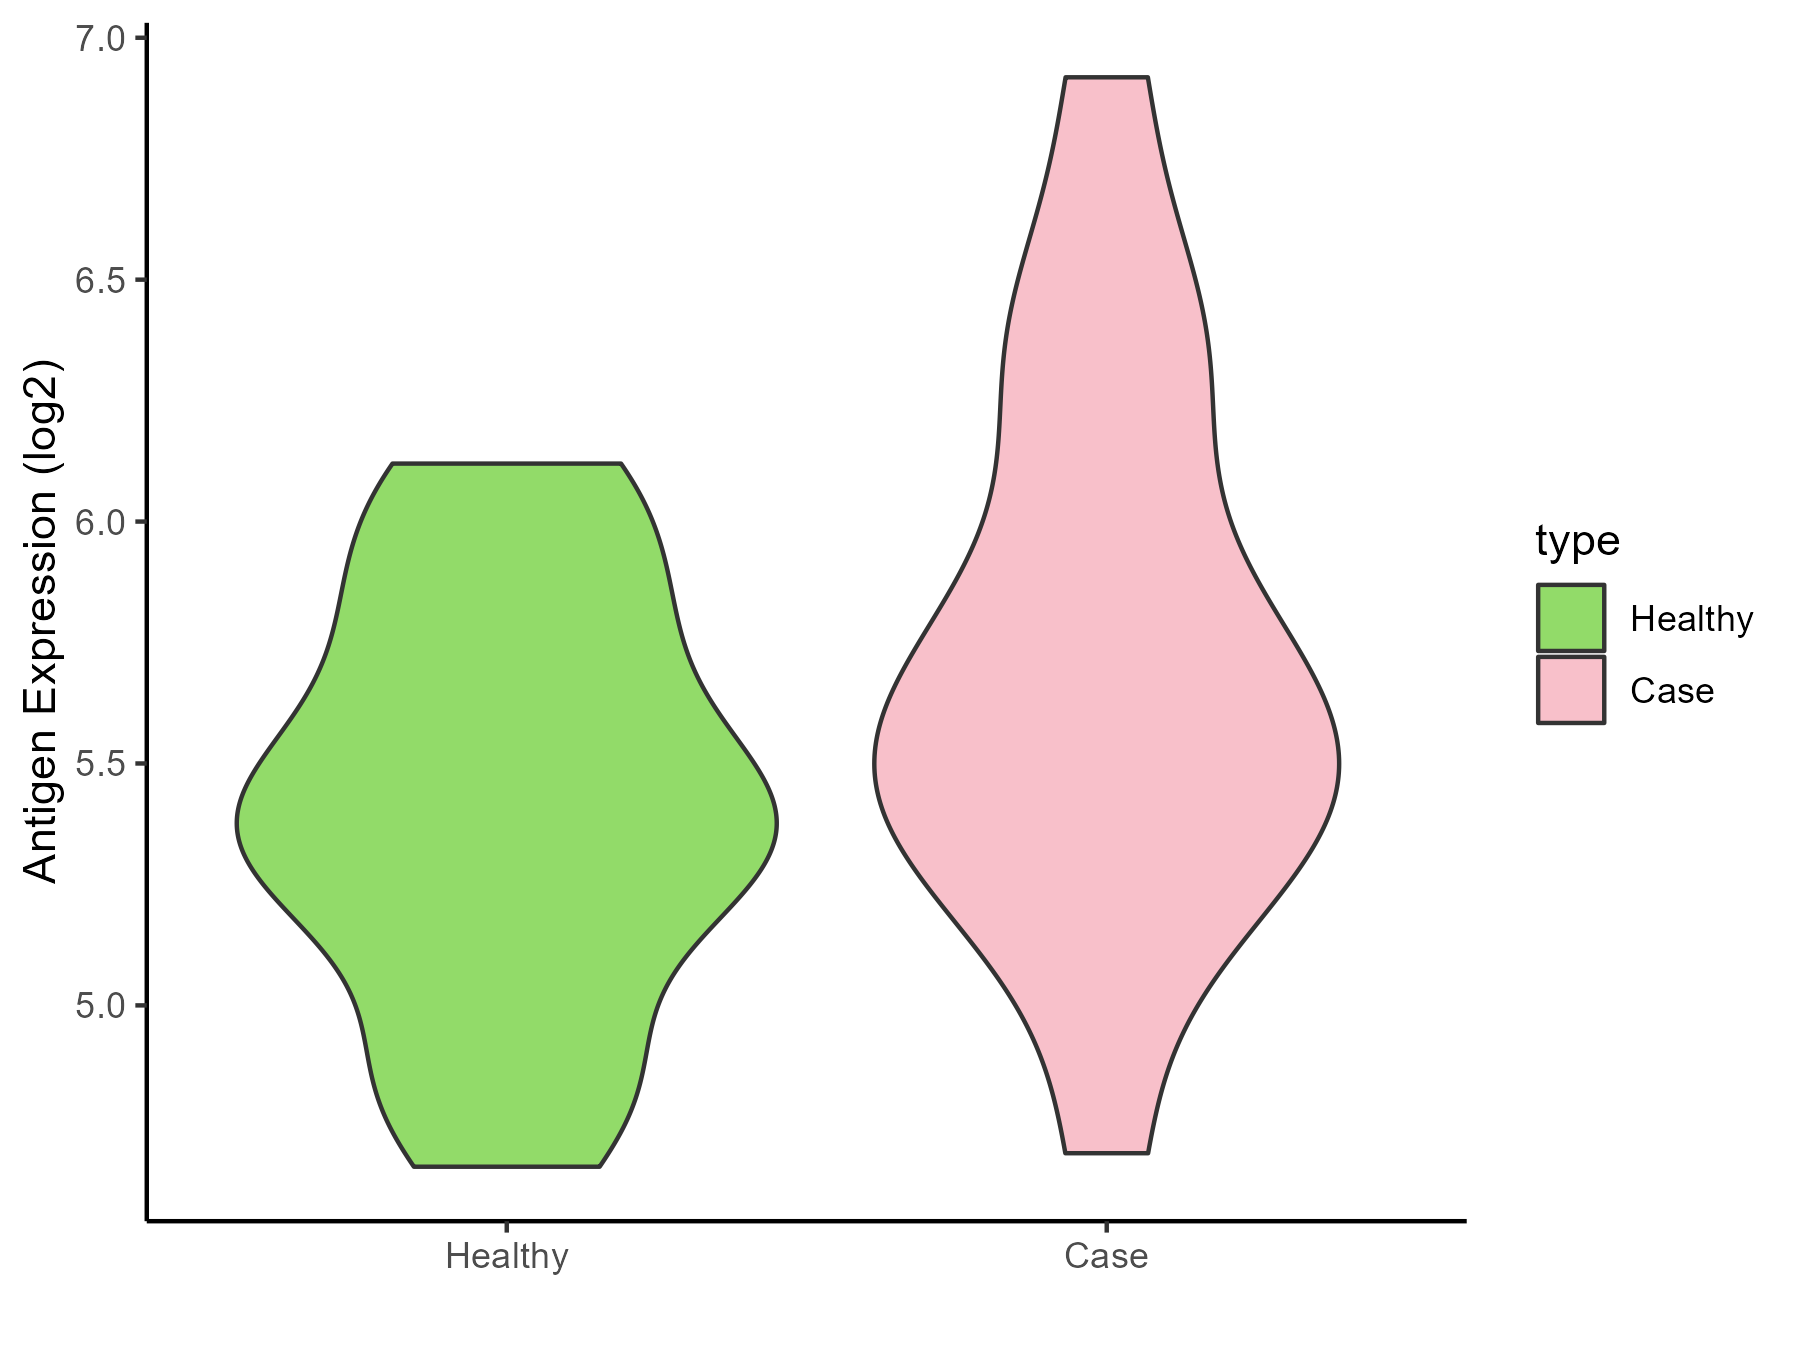
| The Studied Tissue | Peripheral blood | |
| The Specific Disease | Arthropathy | |
| The Expression Level of Disease Section Compare with the Healthy Individual Tissue | p-value: 0.092823934; Fold-change: 0.19227022; Z-score: 0.452078923 | |
| Disease-specific Antigen Abundances |
|
Click to View the Clearer Original Diagram |
| Differential expression pattern of antigen in diseases | ||
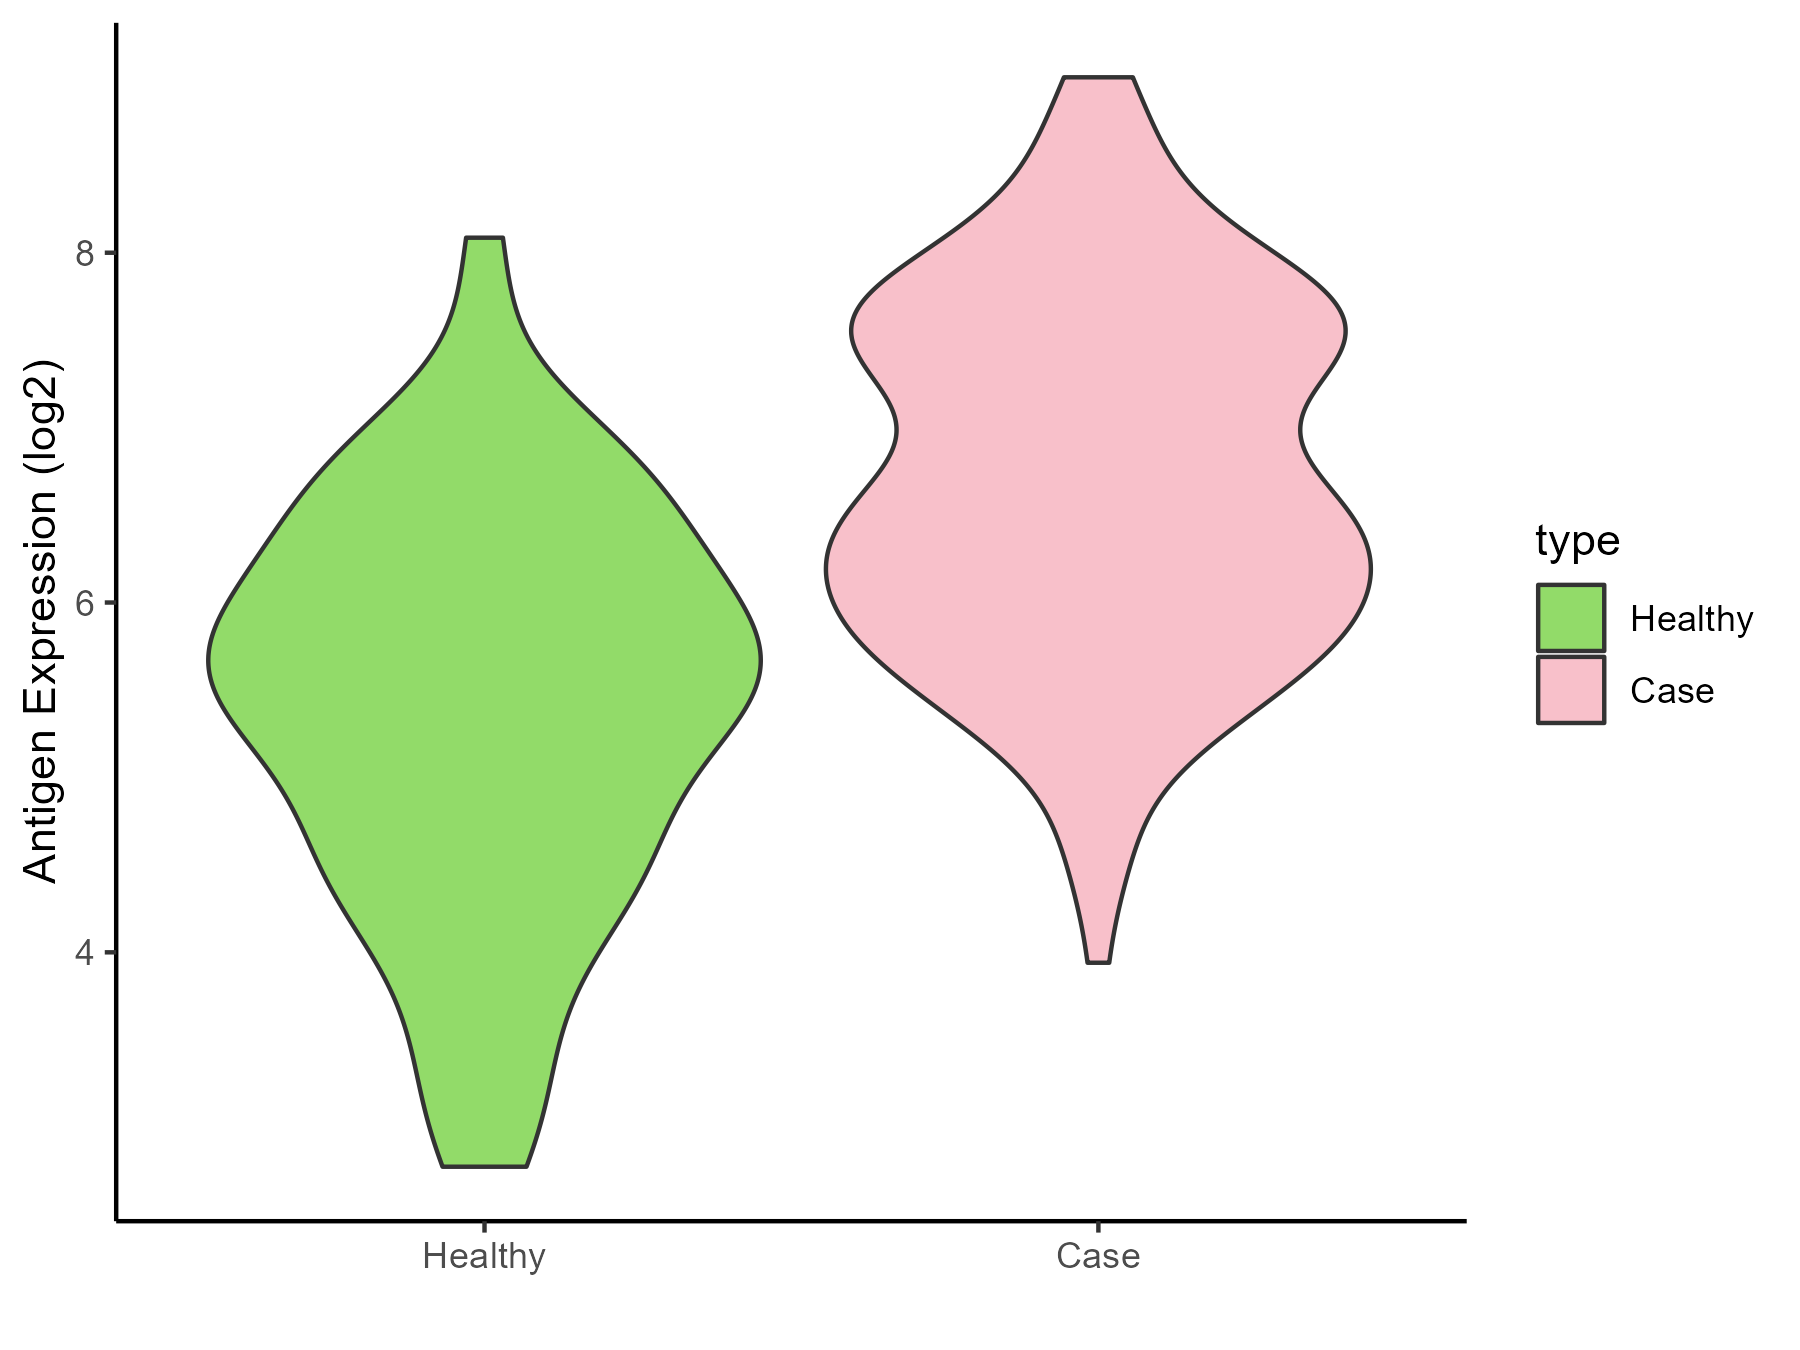
| The Studied Tissue | Peripheral blood | |
| The Specific Disease | Arthritis | |
| The Expression Level of Disease Section Compare with the Healthy Individual Tissue | p-value: 7.77E-14; Fold-change: 1.063421388; Z-score: 0.93239313 | |
| Disease-specific Antigen Abundances |
|
Click to View the Clearer Original Diagram |
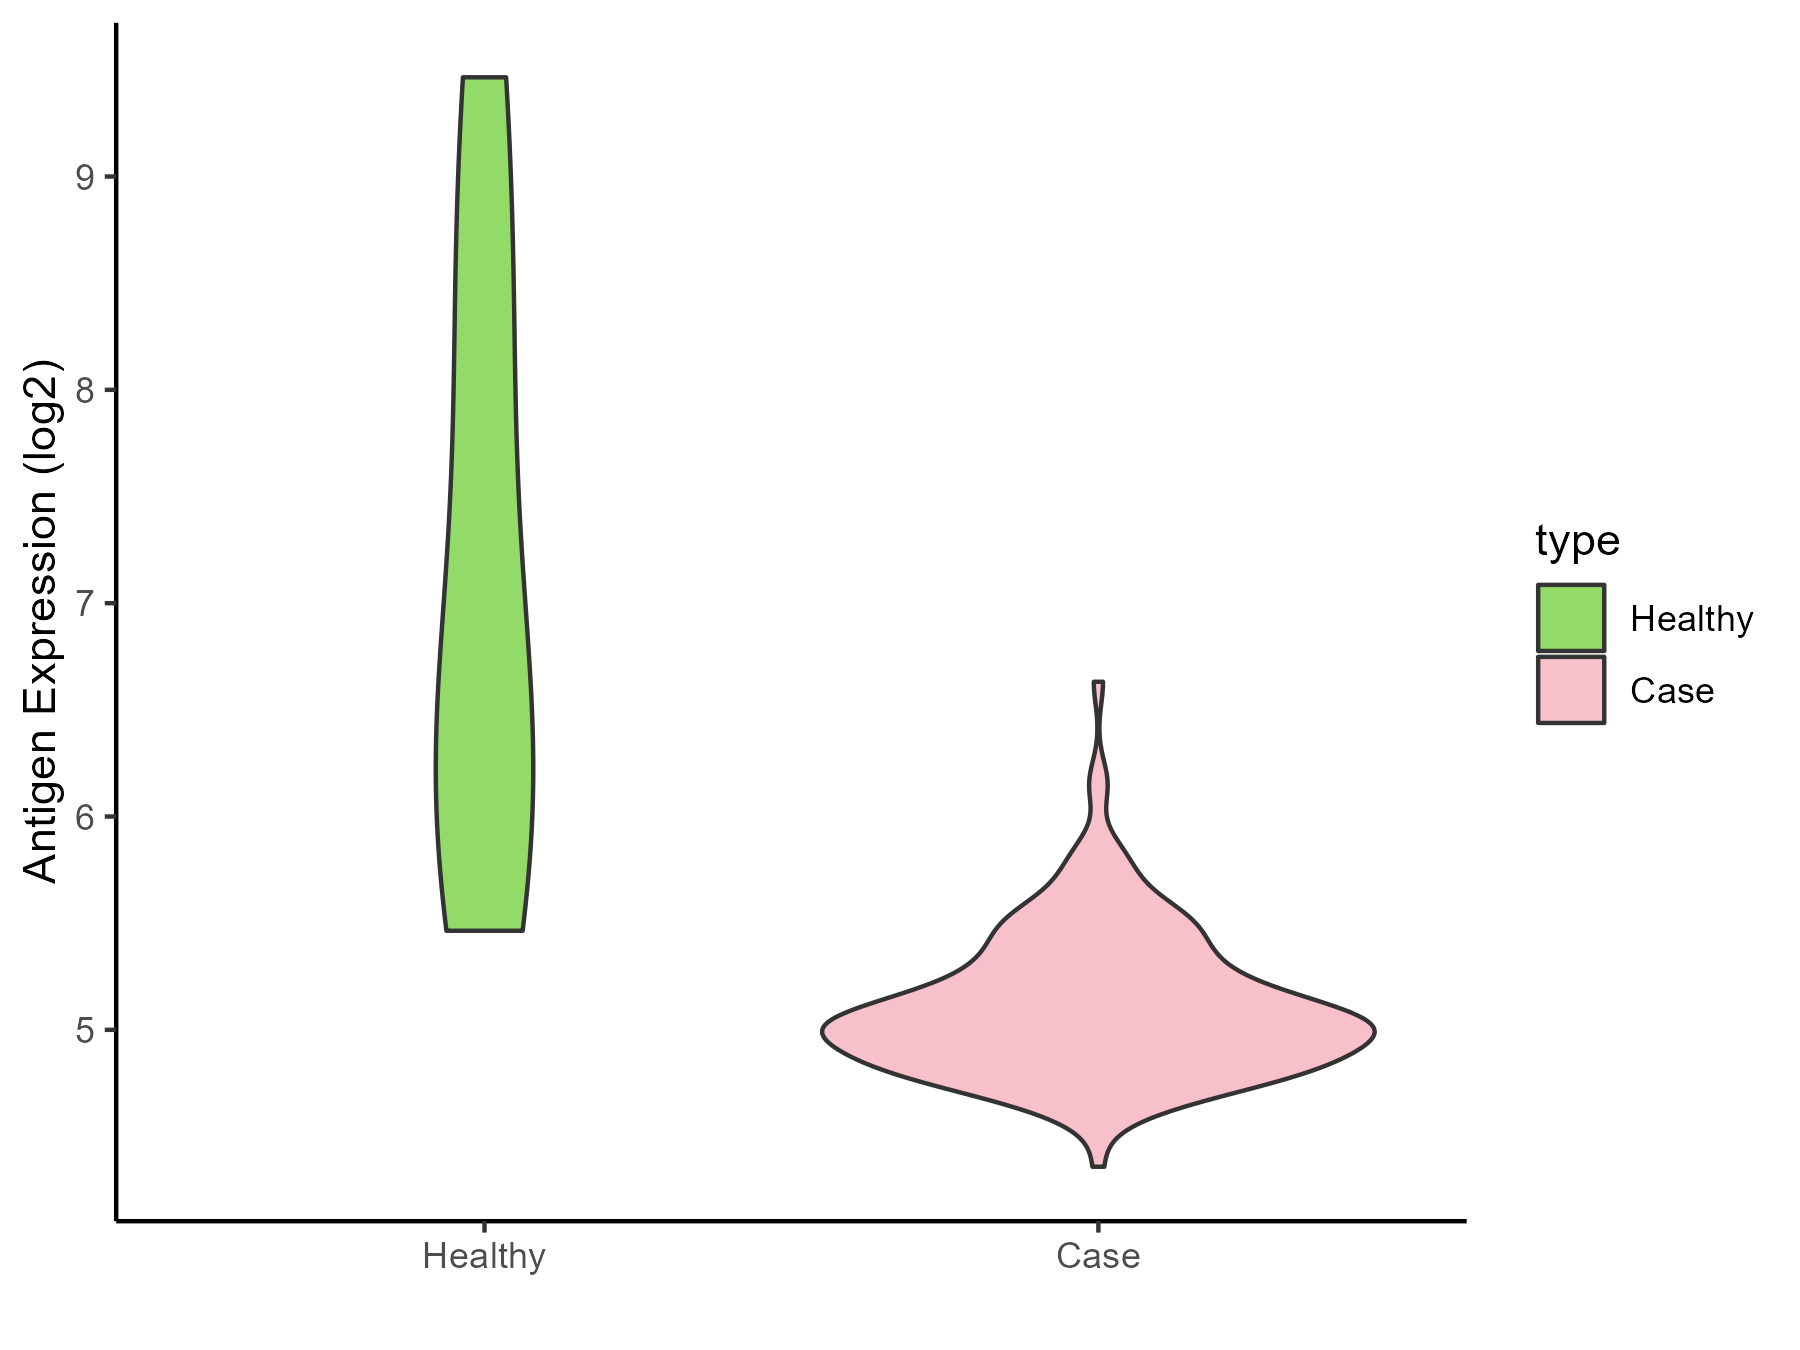
| Differential expression pattern of antigen in diseases | ||
| The Studied Tissue | Synovial | |
| The Specific Disease | Rheumatoid arthritis | |
| The Expression Level of Disease Section Compare with the Healthy Individual Tissue | p-value: 0.010841793; Fold-change: -1.383282016; Z-score: -0.939798529 | |
| Disease-specific Antigen Abundances |
|
Click to View the Clearer Original Diagram |
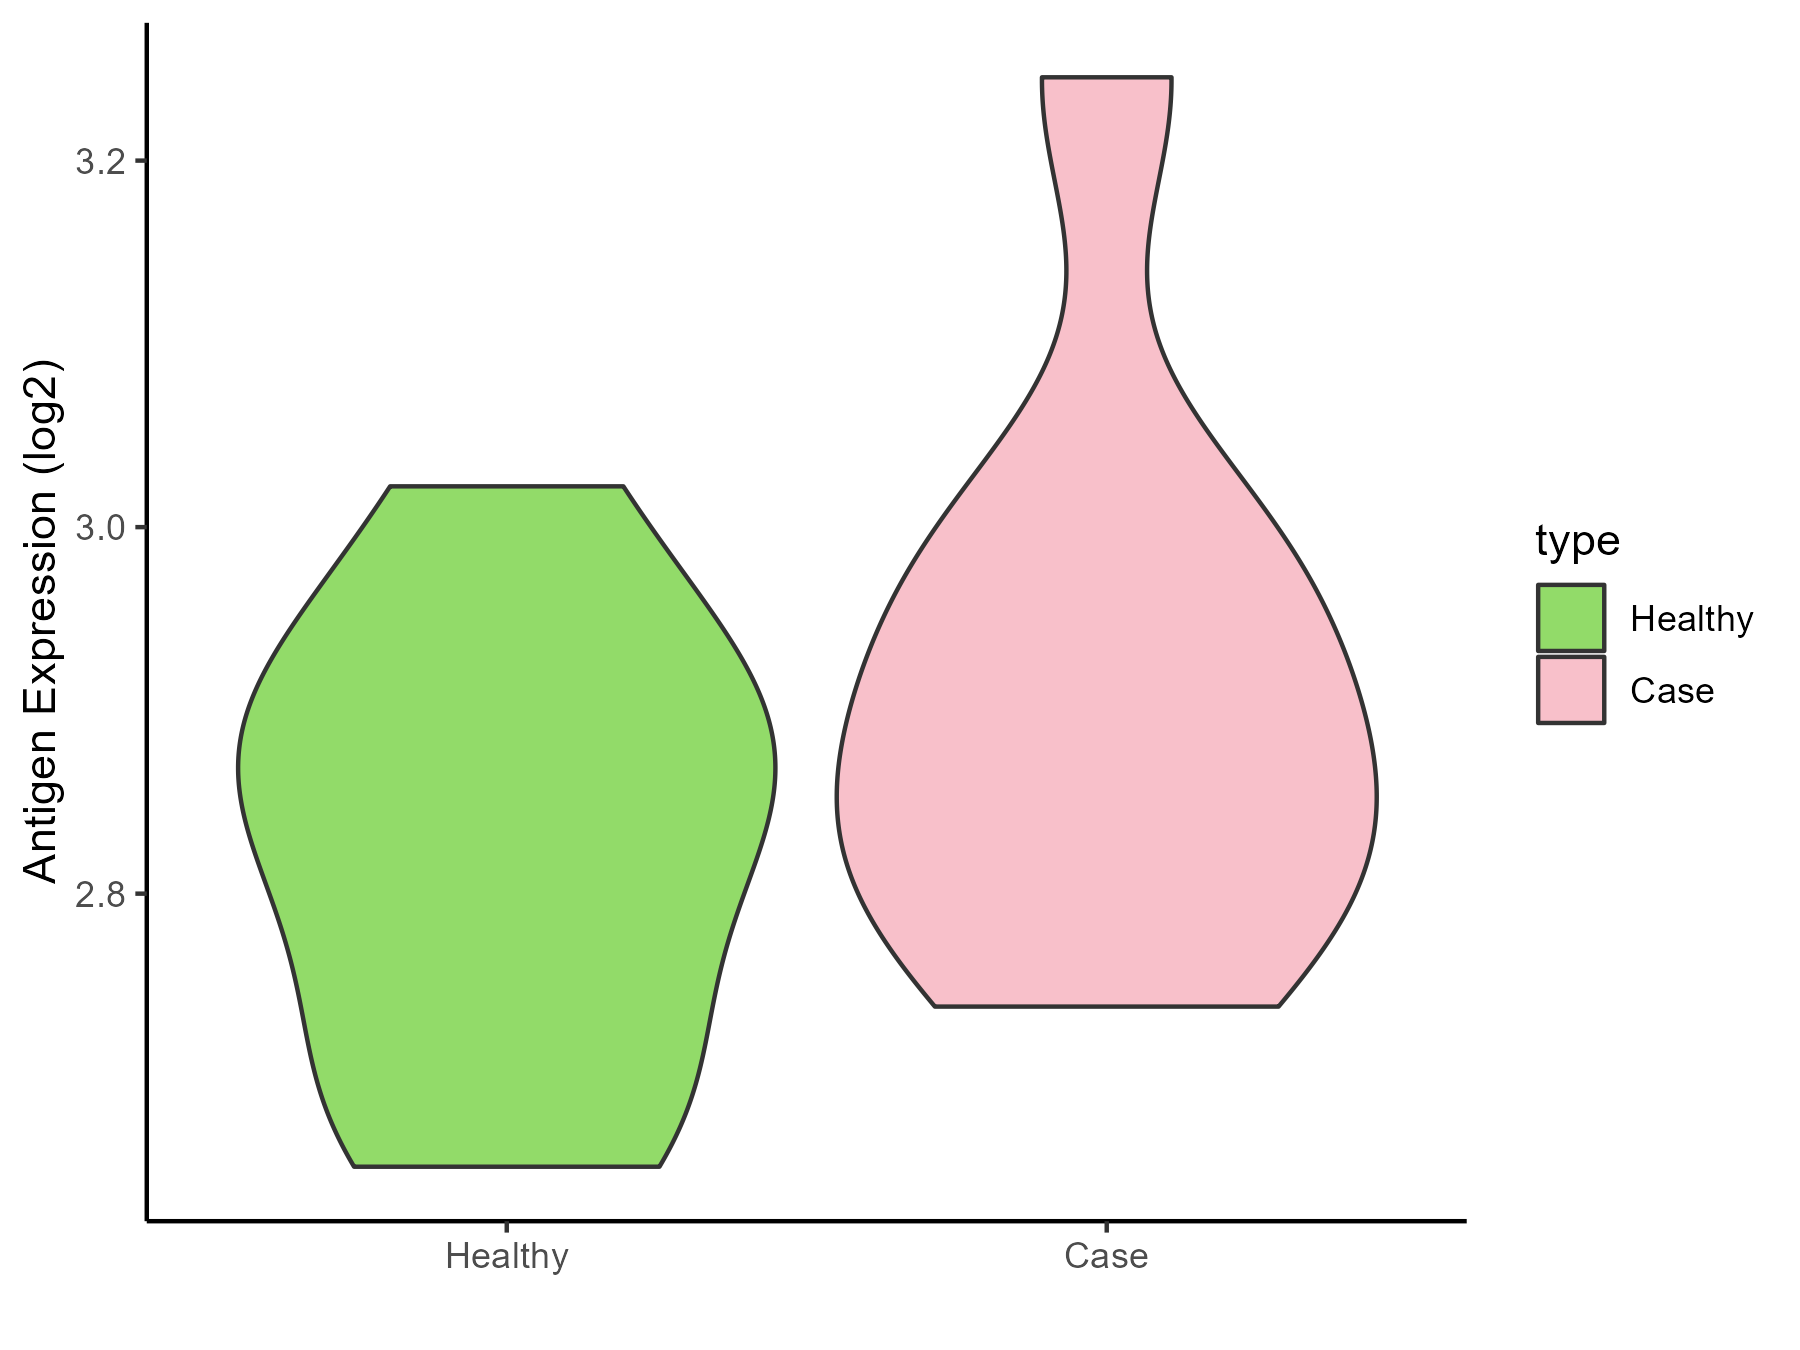
| Differential expression pattern of antigen in diseases | ||
| The Studied Tissue | Pheripheral blood | |
| The Specific Disease | Ankylosing spondylitis | |
| The Expression Level of Disease Section Compare with the Healthy Individual Tissue | p-value: 0.229518816; Fold-change: 0.037686081; Z-score: 0.308129917 | |
| Disease-specific Antigen Abundances |
|
Click to View the Clearer Original Diagram |
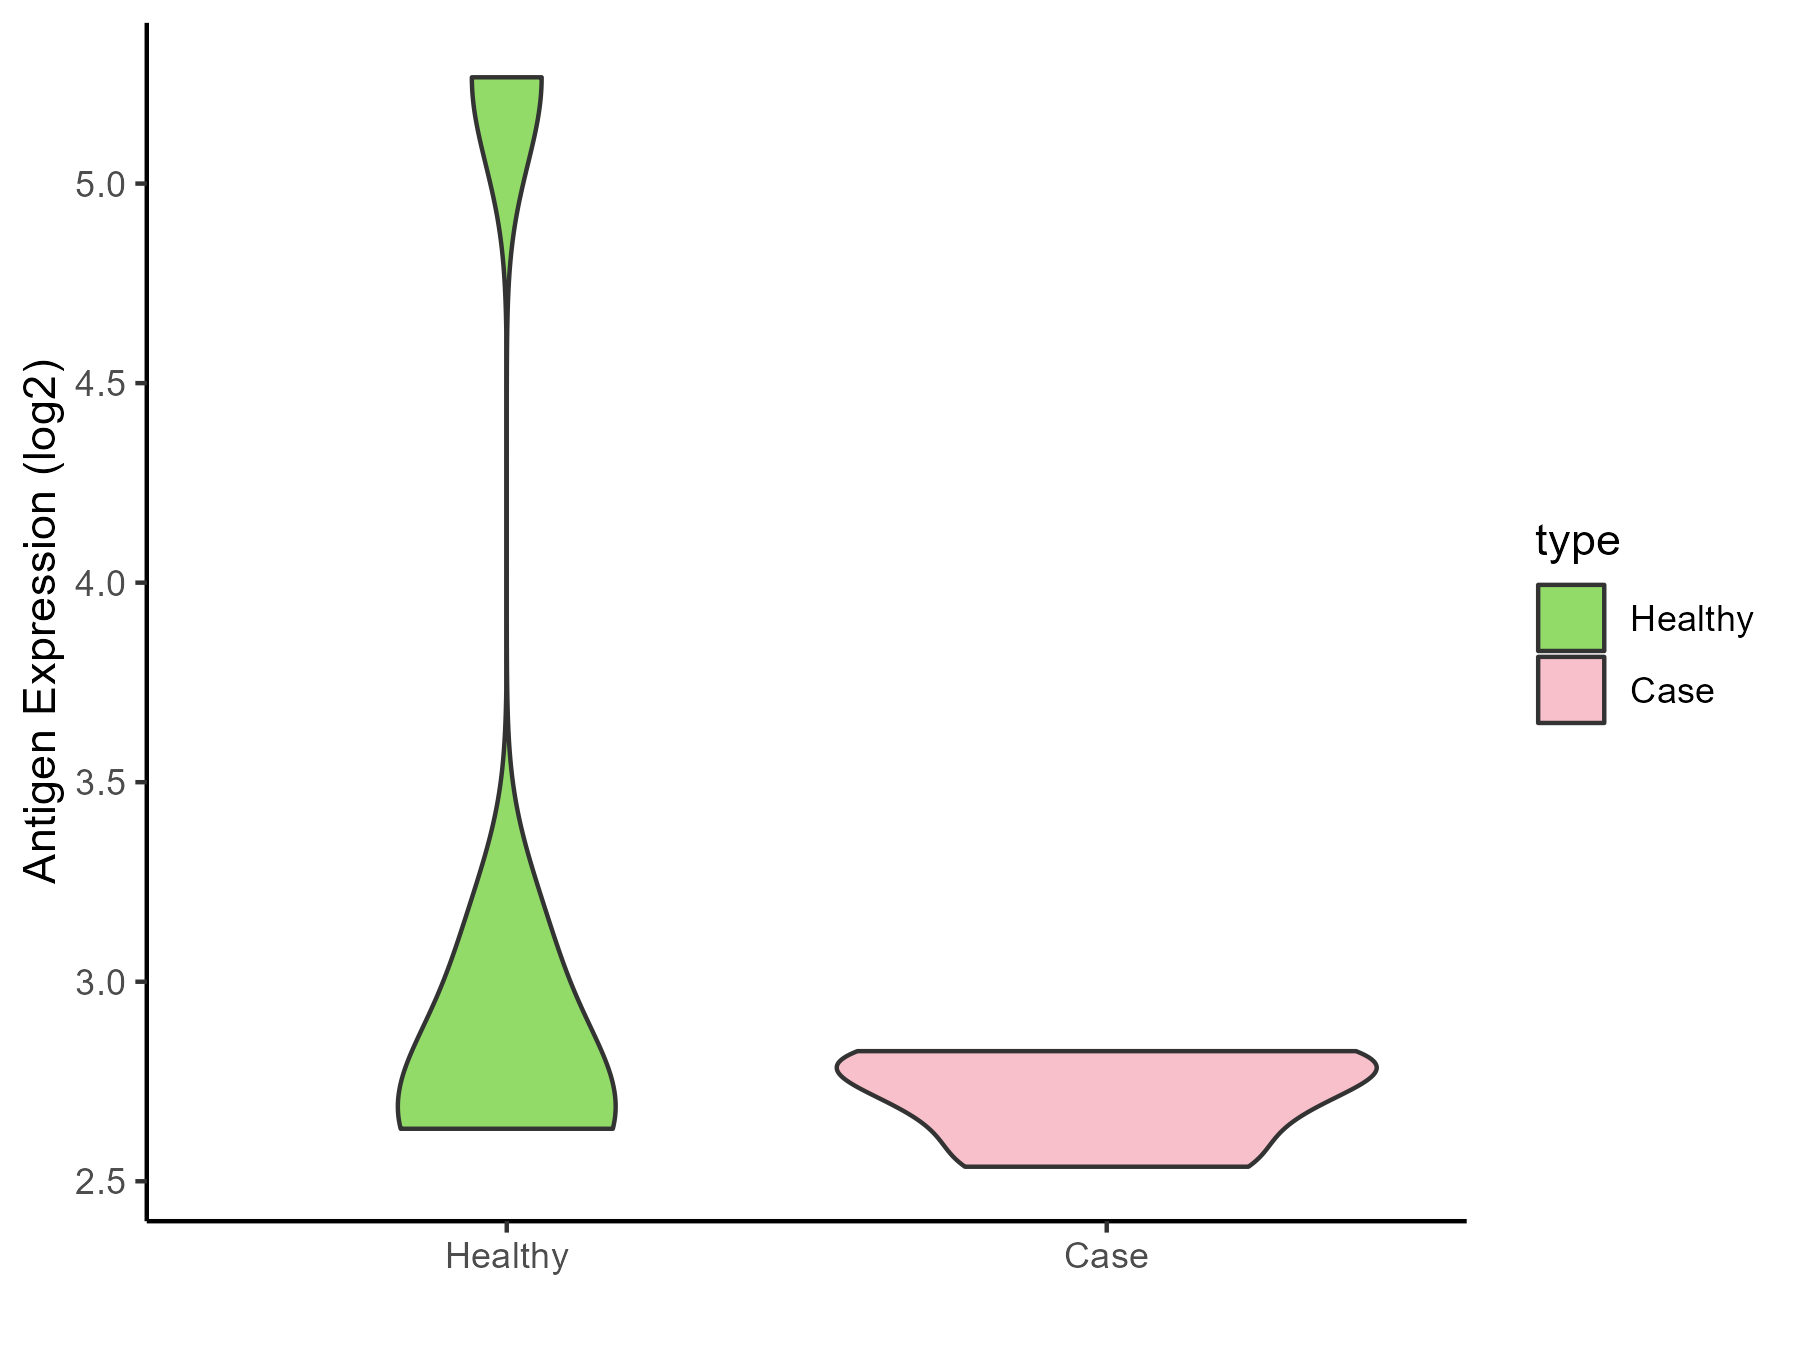
| Differential expression pattern of antigen in diseases | ||
| The Studied Tissue | Bone marrow | |
| The Specific Disease | Osteoporosis | |
| The Expression Level of Disease Section Compare with the Healthy Individual Tissue | p-value: 0.332505423; Fold-change: 0.029033981; Z-score: 0.025648956 | |
| Disease-specific Antigen Abundances |
|
Click to View the Clearer Original Diagram |
ICD Disease Classification 16
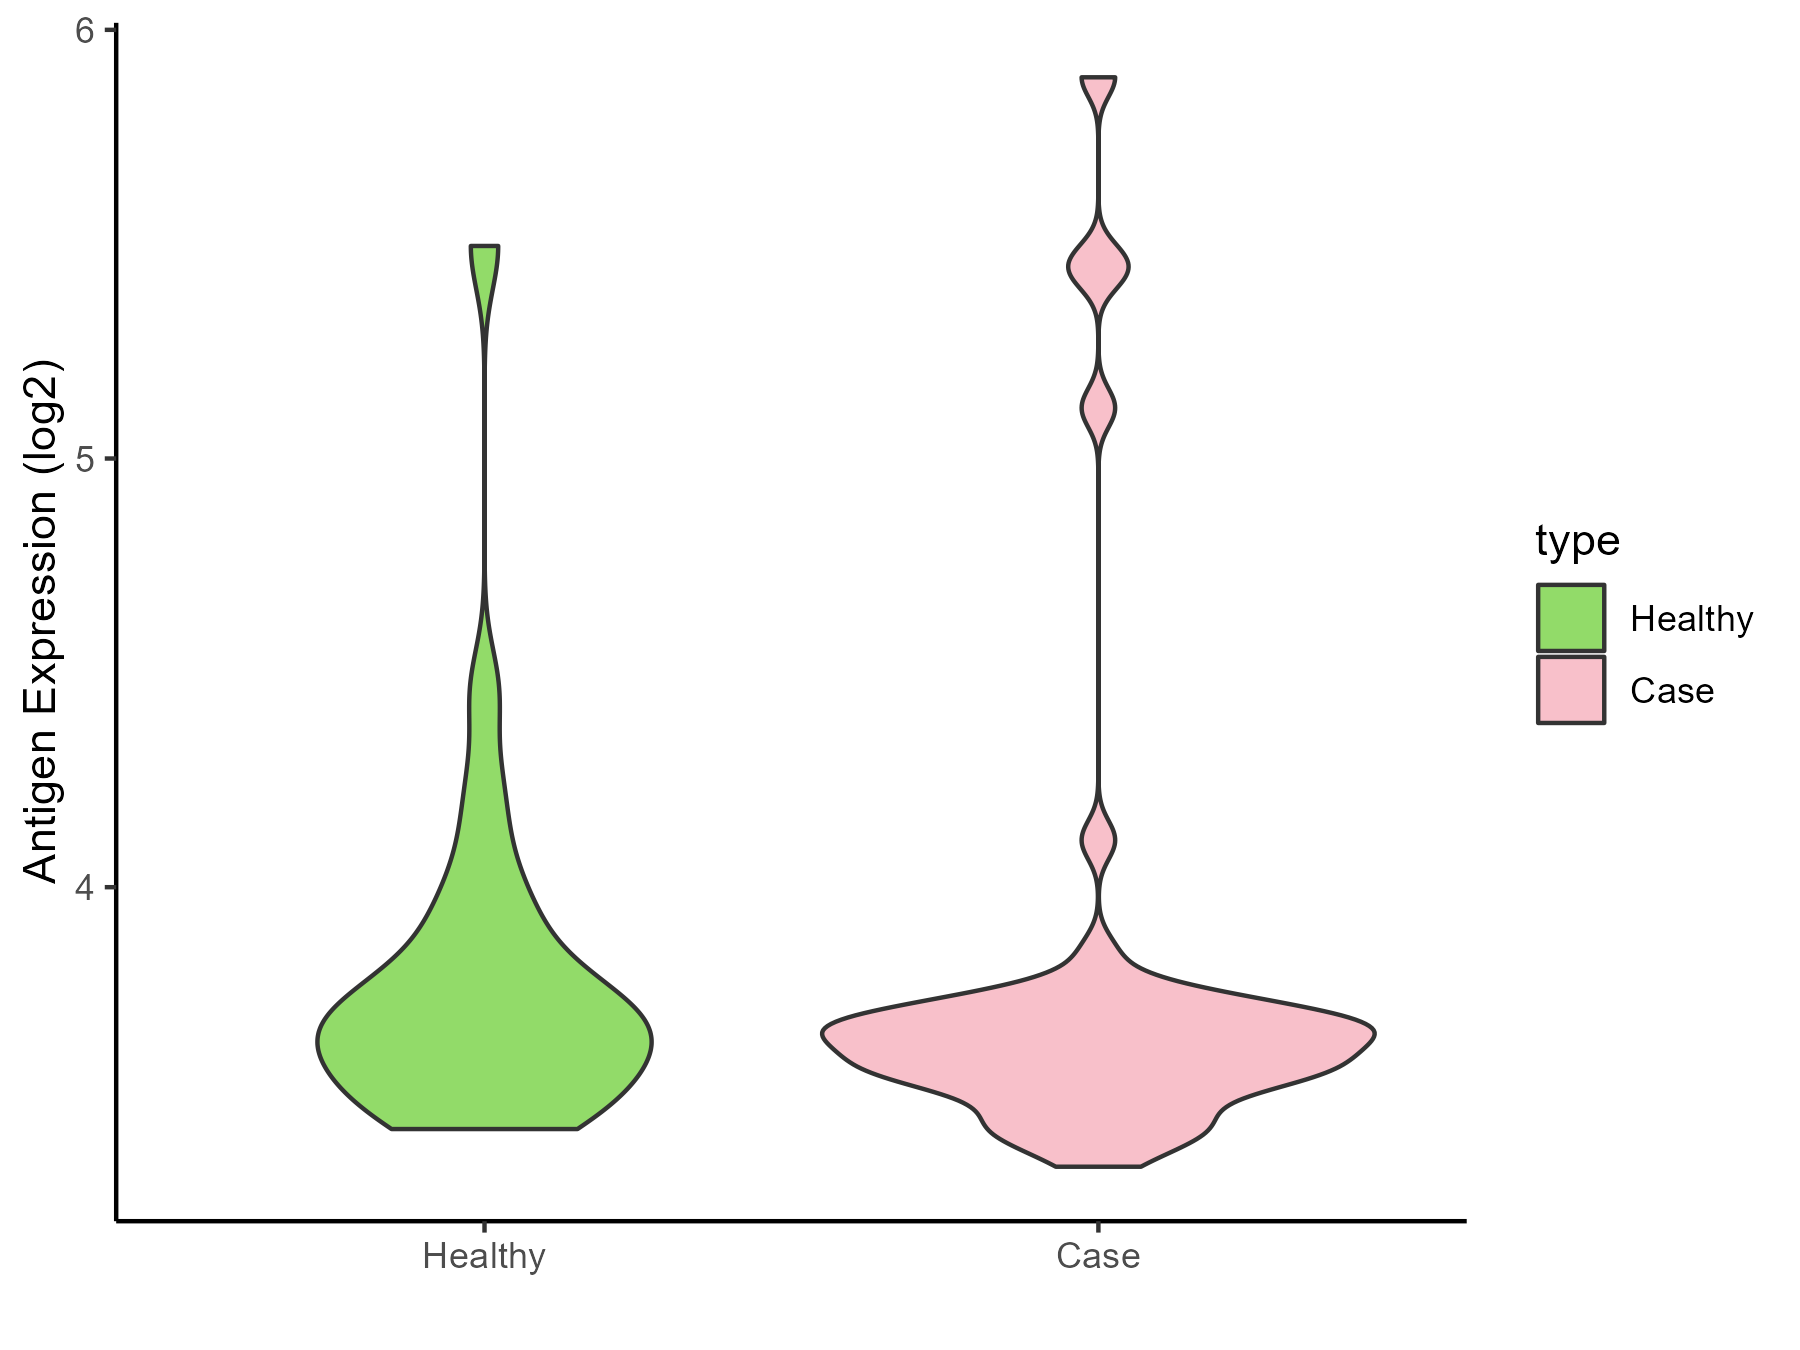
| Differential expression pattern of antigen in diseases | ||
| The Studied Tissue | Endometrium | |
| The Specific Disease | Endometriosis | |
| The Expression Level of Disease Section Compare with the Healthy Individual Tissue | p-value: 0.838620535; Fold-change: -0.045654156; Z-score: -0.107515428 | |
| Disease-specific Antigen Abundances |
|
Click to View the Clearer Original Diagram |
| Differential expression pattern of antigen in diseases | ||
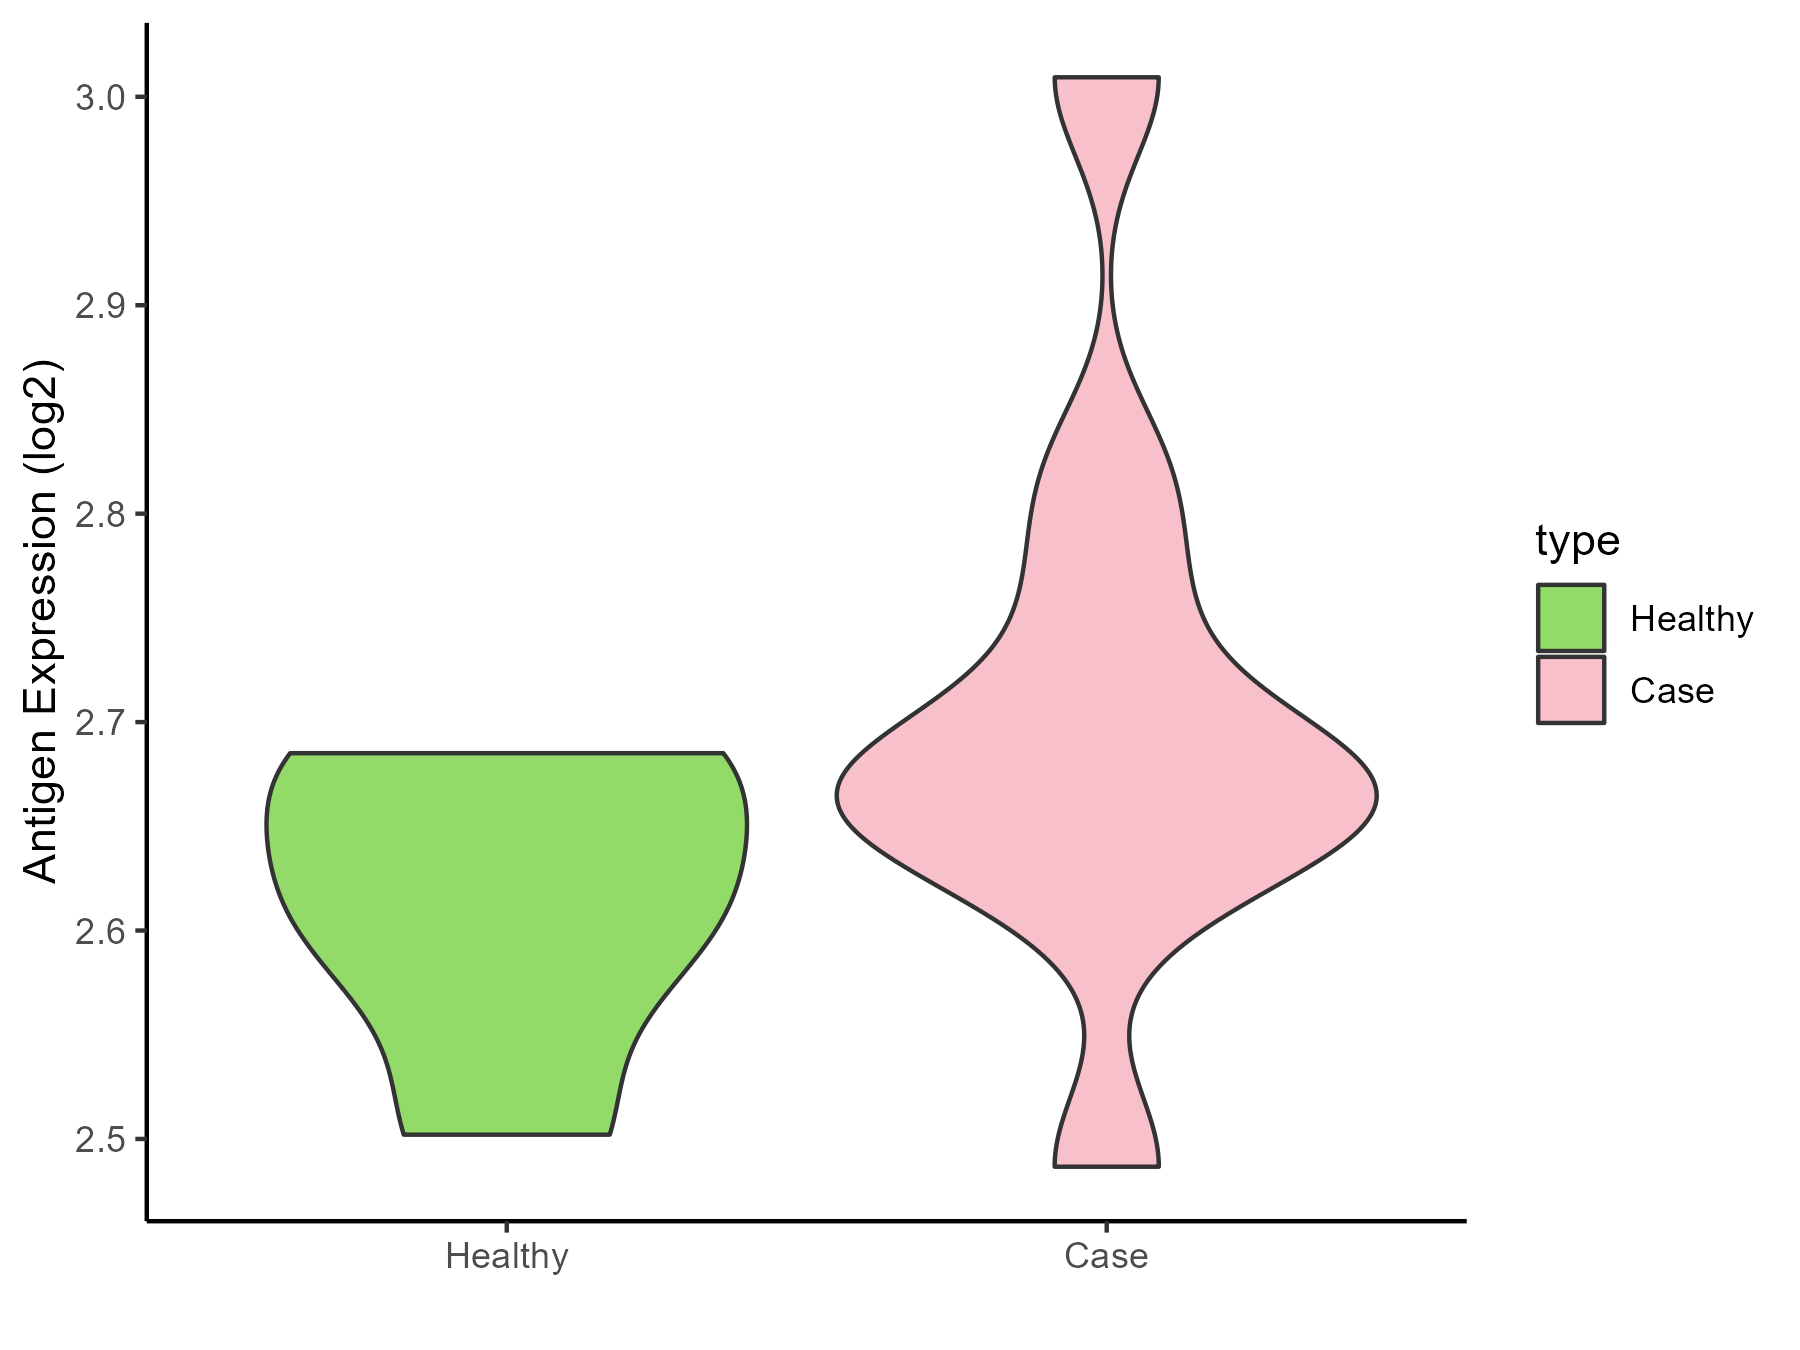
| The Studied Tissue | Bladder | |
| The Specific Disease | Interstitial cystitis | |
| The Expression Level of Disease Section Compare with the Healthy Individual Tissue | p-value: 0.12838685; Fold-change: 0.051066537; Z-score: 0.679572222 | |
| Disease-specific Antigen Abundances |
|
Click to View the Clearer Original Diagram |
ICD Disease Classification 19
| Differential expression pattern of antigen in diseases | ||
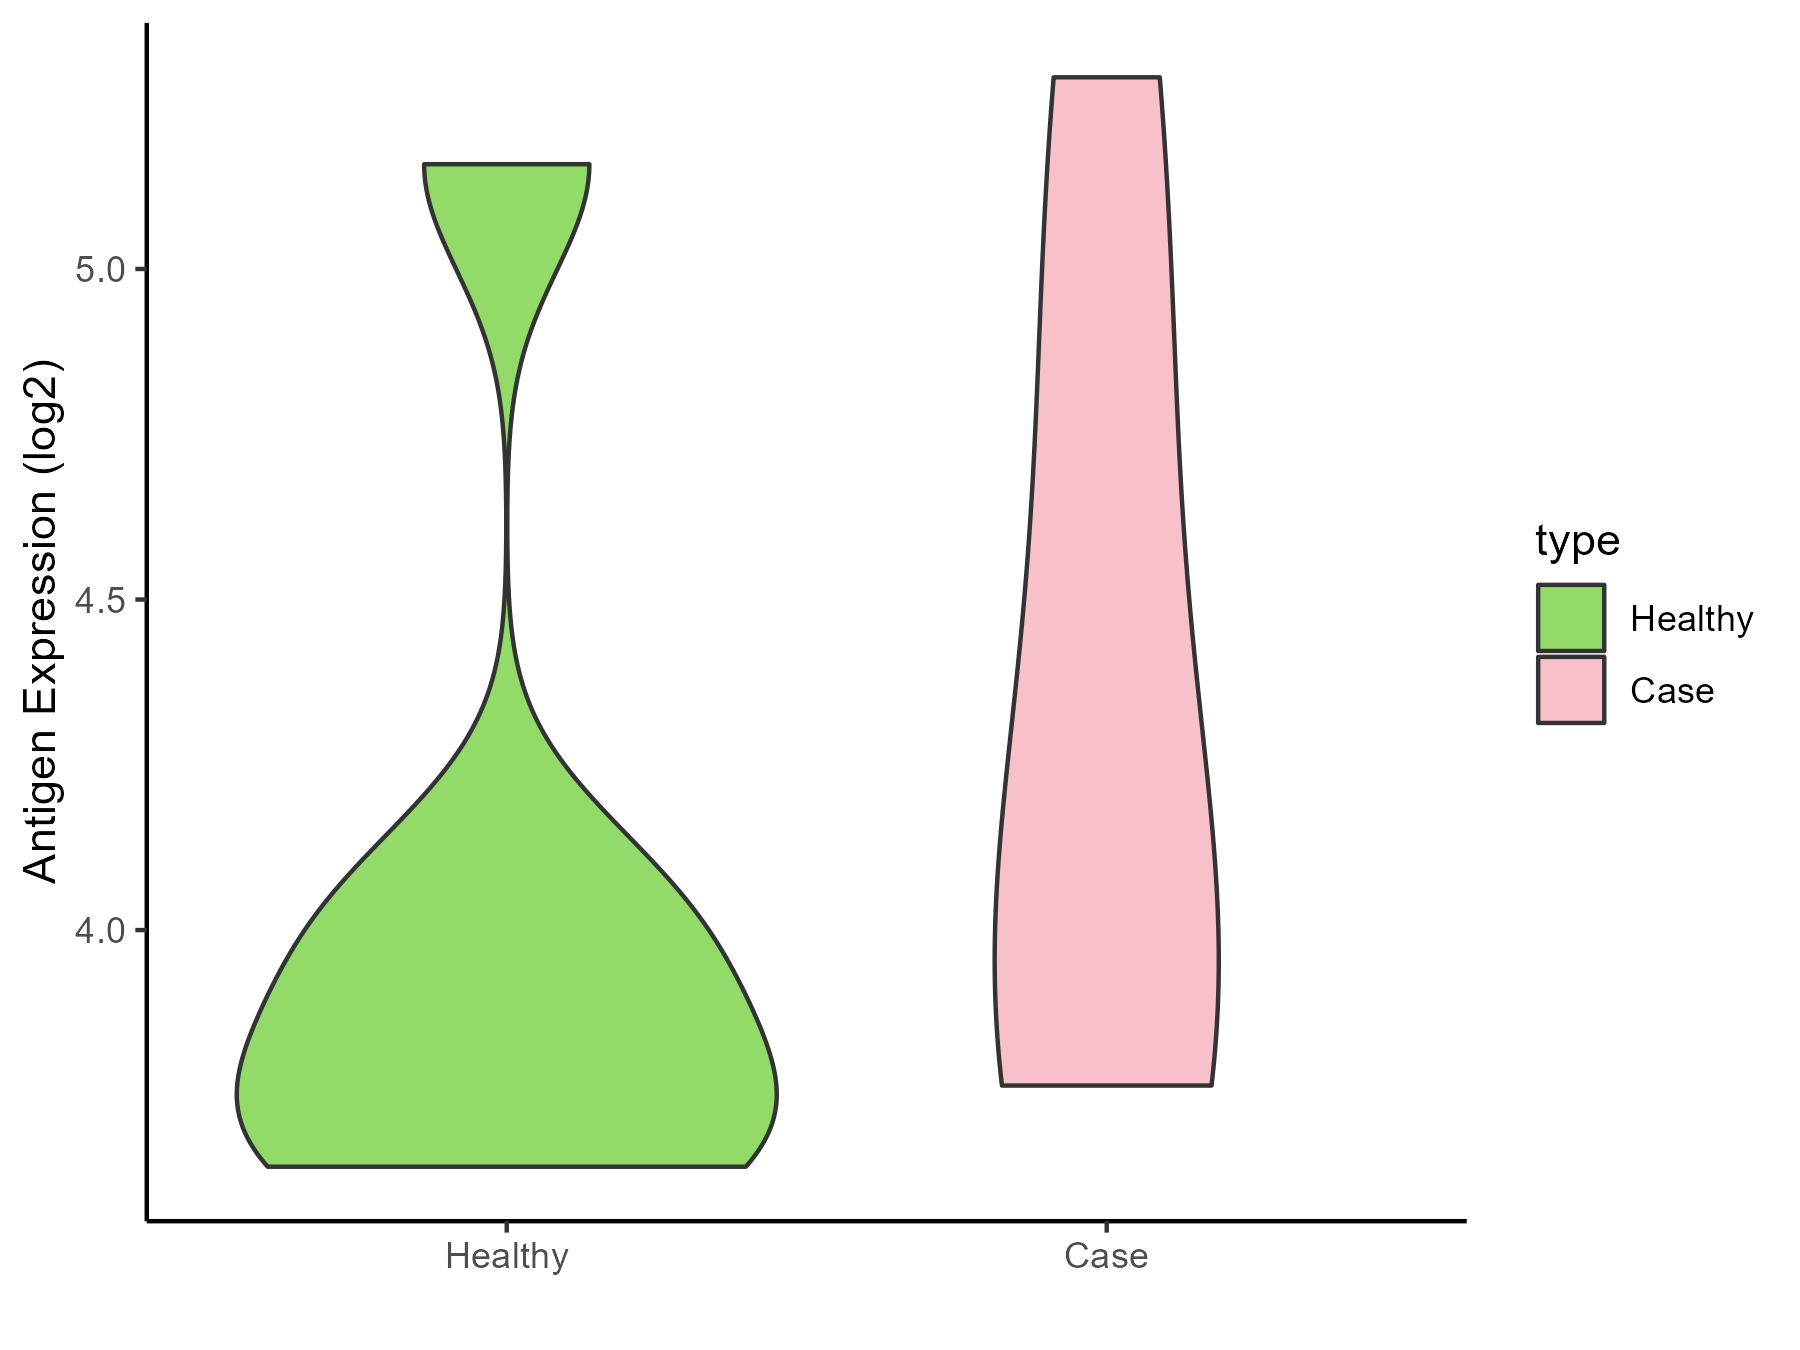
| The Studied Tissue | Myometrium | |
| The Specific Disease | Preterm birth | |
| The Expression Level of Disease Section Compare with the Healthy Individual Tissue | p-value: 0.455103278; Fold-change: 0.243664783; Z-score: 0.427023714 | |
| Disease-specific Antigen Abundances |
|
Click to View the Clearer Original Diagram |
ICD Disease Classification 2
| Differential expression pattern of antigen in diseases | ||
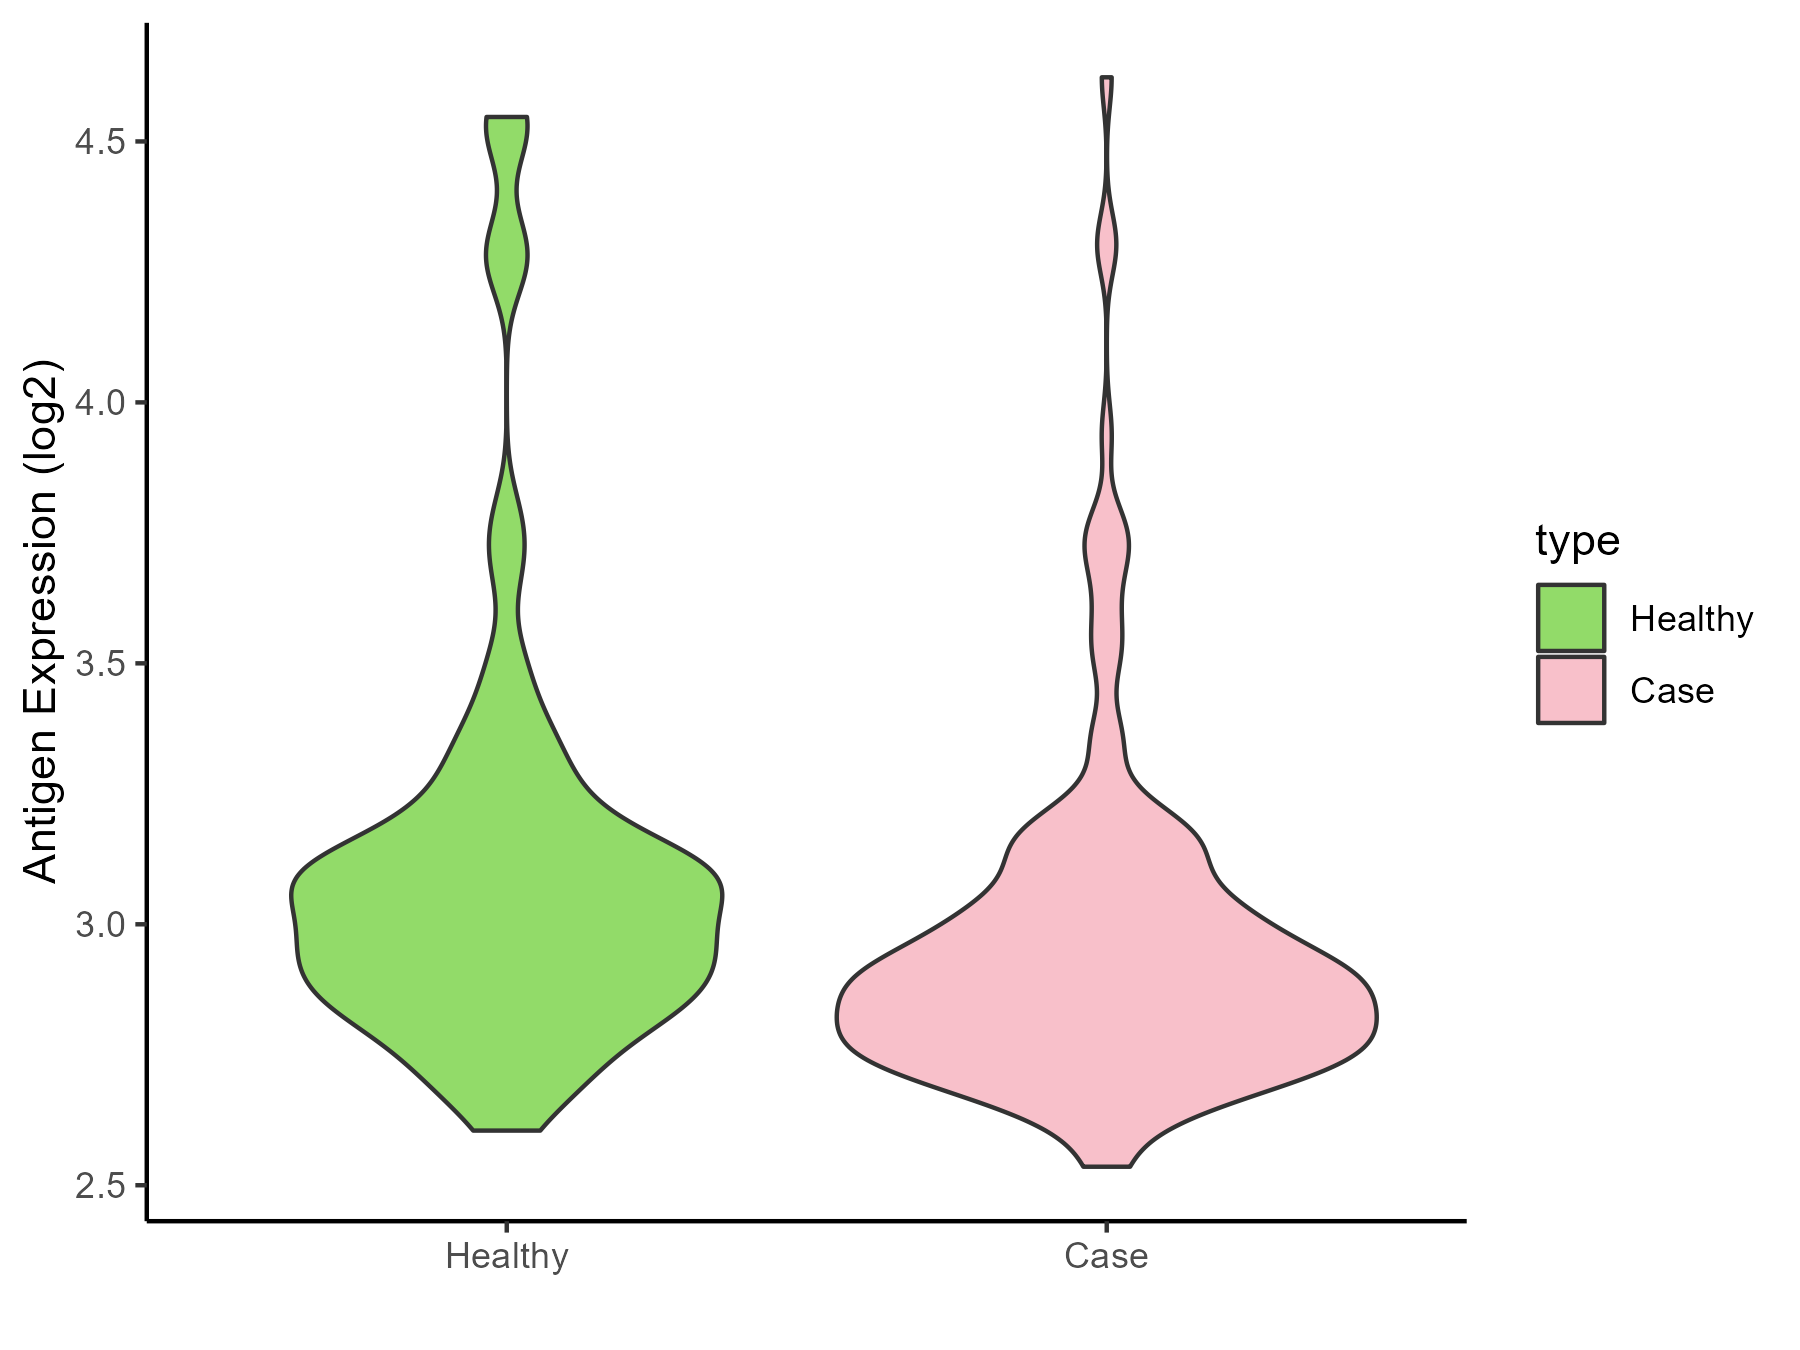
| The Studied Tissue | Bone marrow | |
| The Specific Disease | Acute myelocytic leukemia | |
| The Expression Level of Disease Section Compare with the Healthy Individual Tissue | p-value: 0.000105192; Fold-change: -0.139254875; Z-score: -0.348461495 | |
| Disease-specific Antigen Abundances |
|
Click to View the Clearer Original Diagram |
| Differential expression pattern of antigen in diseases | ||
| The Studied Tissue | Bone marrow | |
| The Specific Disease | Myeloma | |
| The Expression Level of Disease Section Compare with the Healthy Individual Tissue | p-value: 0.241847225; Fold-change: -0.119440968; Z-score: -0.321392967 | |
| Disease-specific Antigen Abundances |

|
Click to View the Clearer Original Diagram |
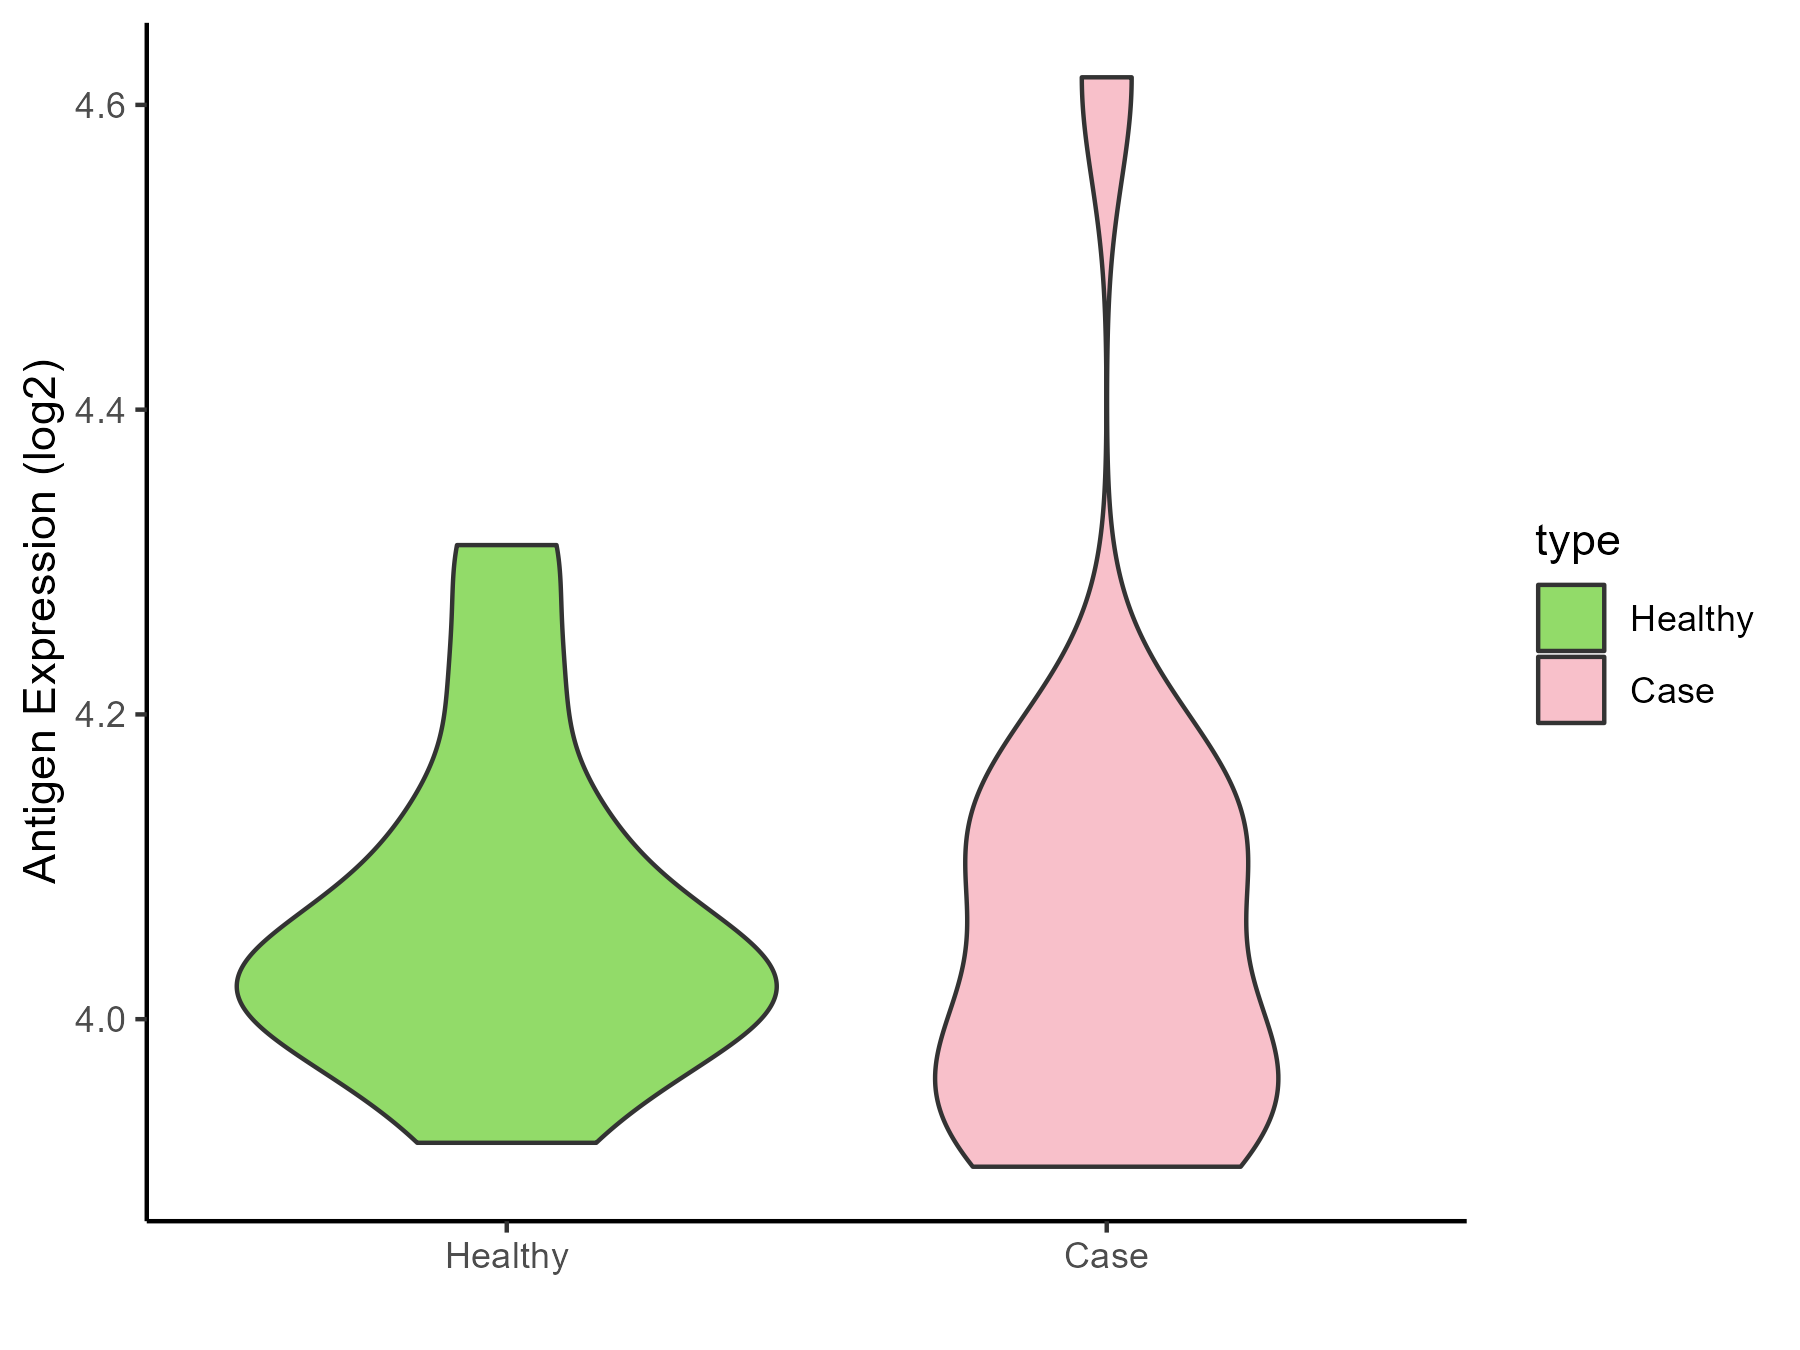
| The Studied Tissue | Peripheral blood | |
| The Specific Disease | Myeloma | |
| The Expression Level of Disease Section Compare with the Healthy Individual Tissue | p-value: 0.944535947; Fold-change: -0.01015248; Z-score: -0.091601175 | |
| Disease-specific Antigen Abundances |
|
Click to View the Clearer Original Diagram |
| Differential expression pattern of antigen in diseases | ||
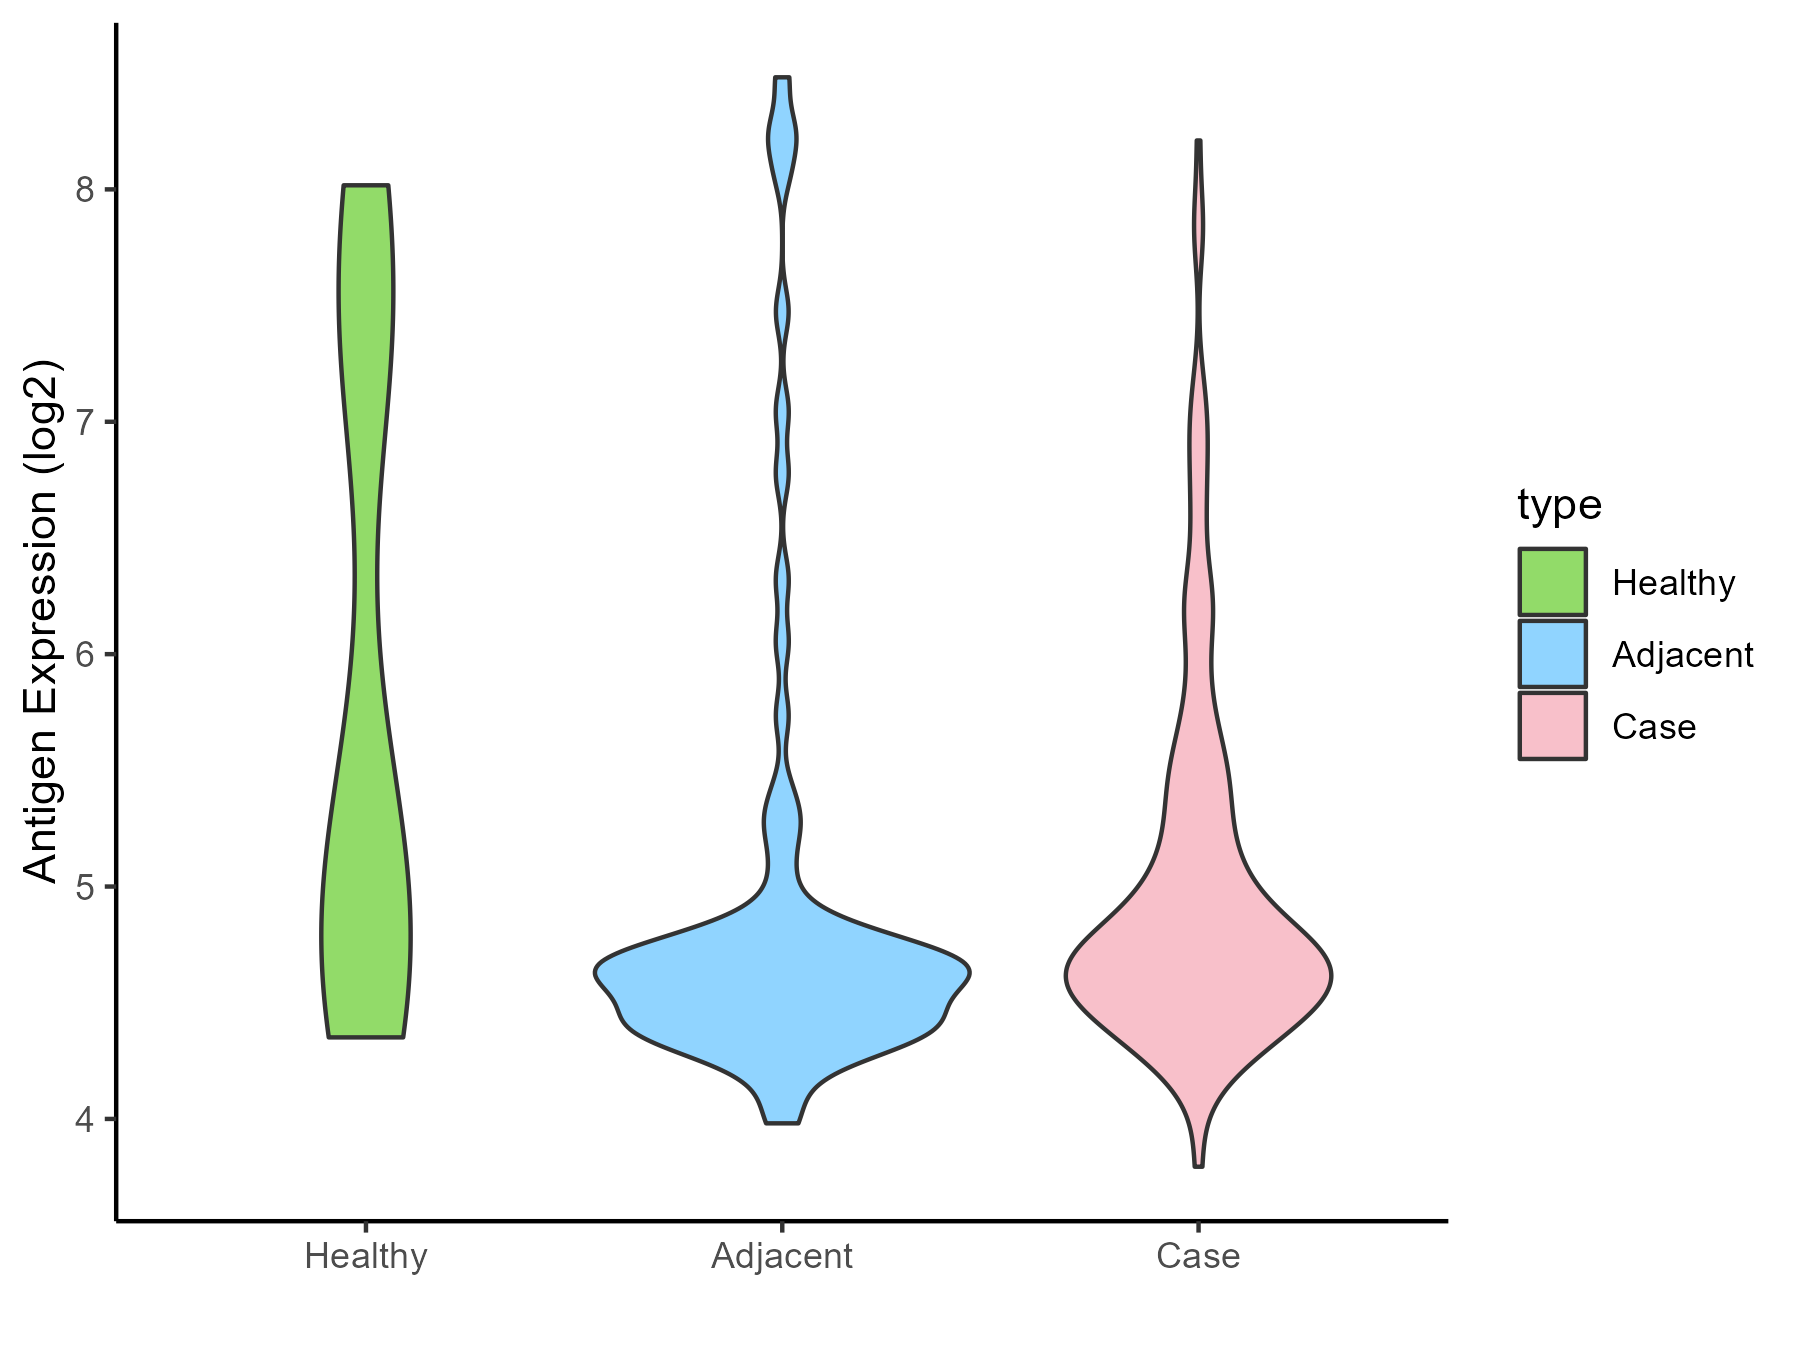
| The Studied Tissue | Oral | |
| The Specific Disease | Oral cancer | |
| The Expression Level of Disease Section Compare with the Healthy Individual Tissue | p-value: 0.004637341; Fold-change: -0.431884297; Z-score: -0.310505311 | |
| The Expression Level of Disease Section Compare with the Adjacent Tissue | p-value: 0.339956728; Fold-change: 0.111899583; Z-score: 0.116145924 | |
| Disease-specific Antigen Abundances |
|
Click to View the Clearer Original Diagram |
| Differential expression pattern of antigen in diseases | ||
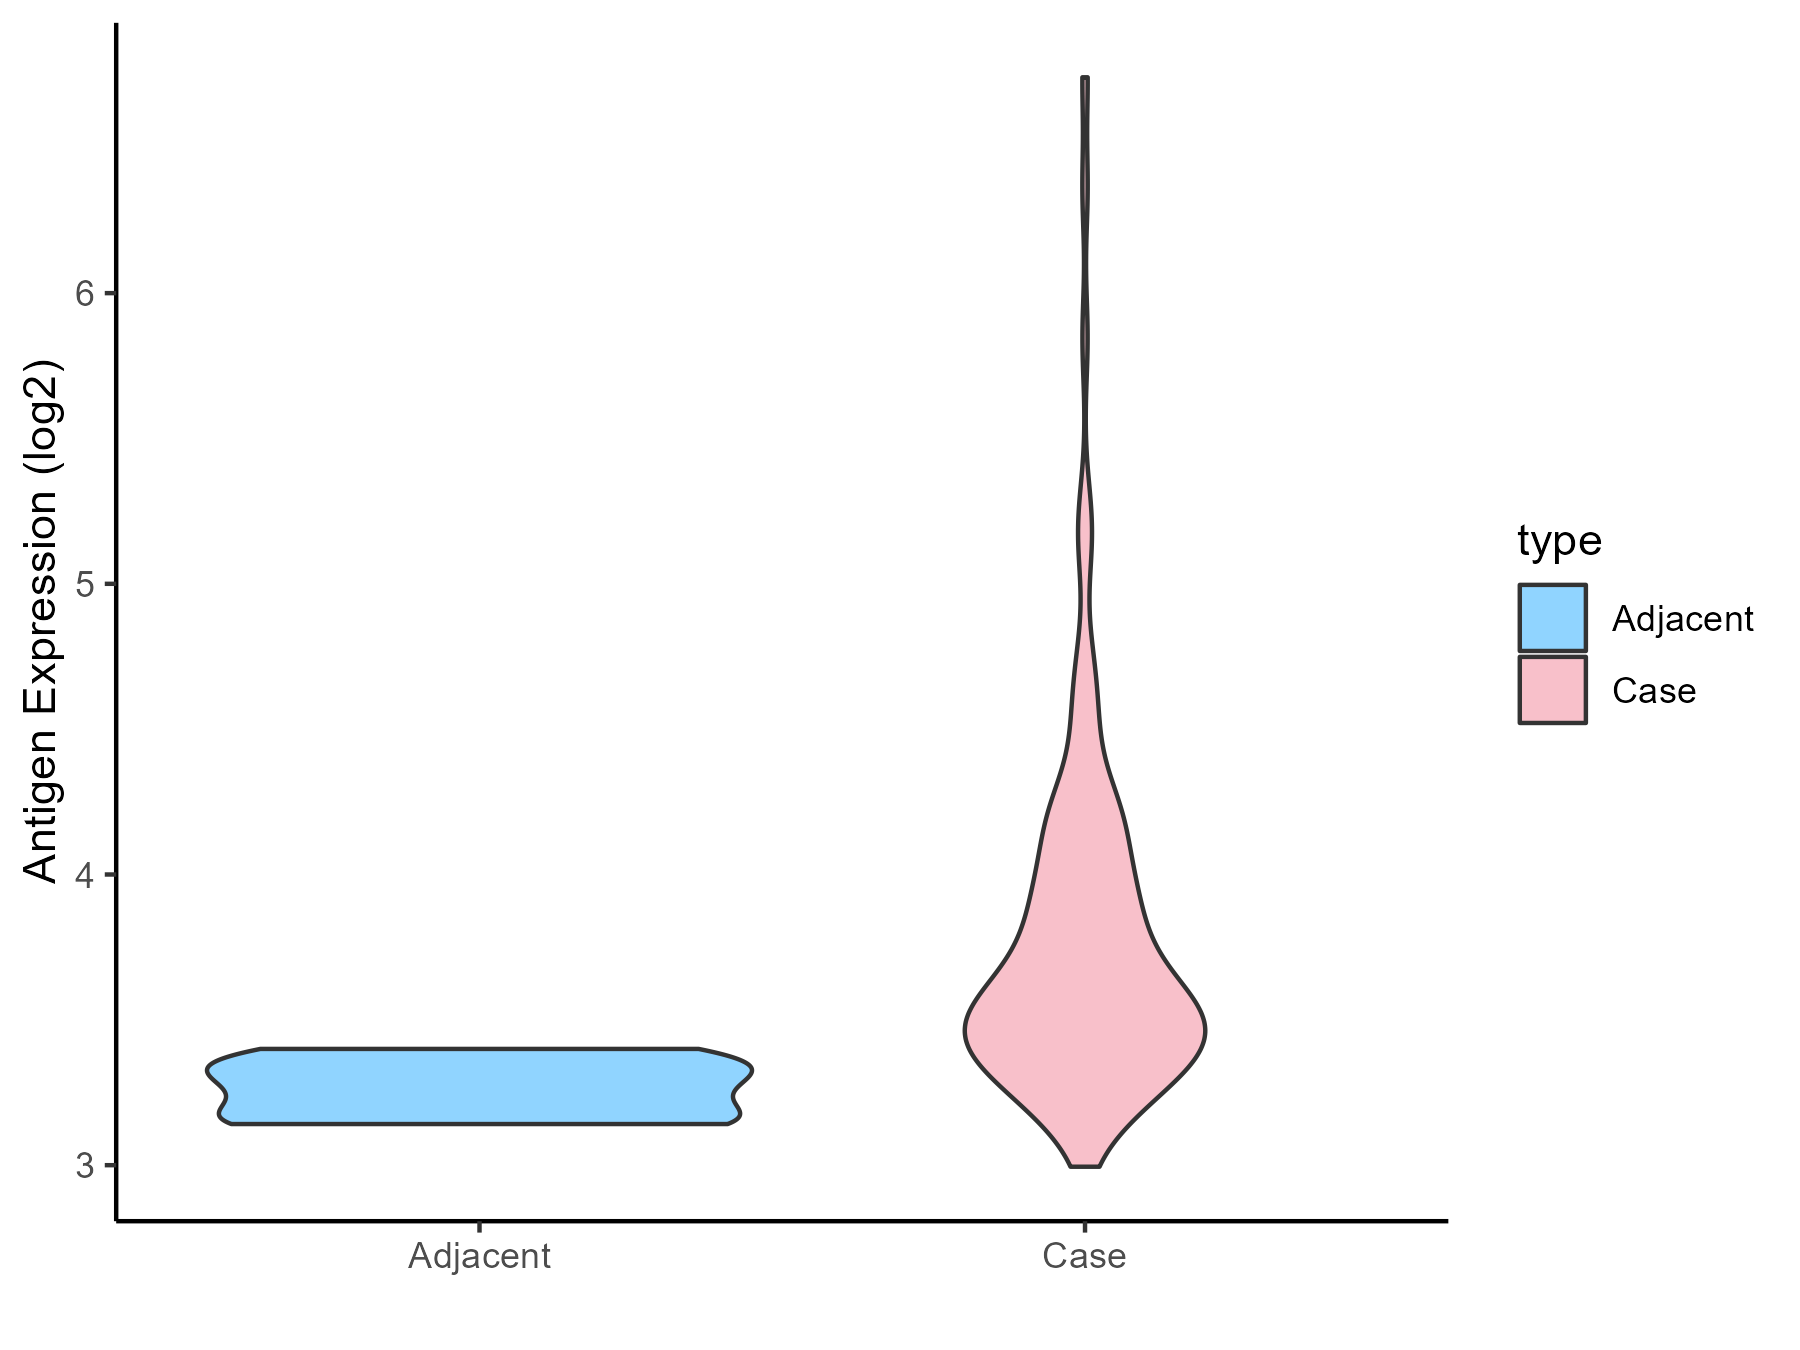
| The Studied Tissue | Esophagus | |
| The Specific Disease | Esophagal cancer | |
| The Expression Level of Disease Section Compare with the Adjacent Tissue | p-value: 1.81E-06; Fold-change: 0.331567685; Z-score: 2.859933526 | |
| Disease-specific Antigen Abundances |
|
Click to View the Clearer Original Diagram |
| Differential expression pattern of antigen in diseases | ||
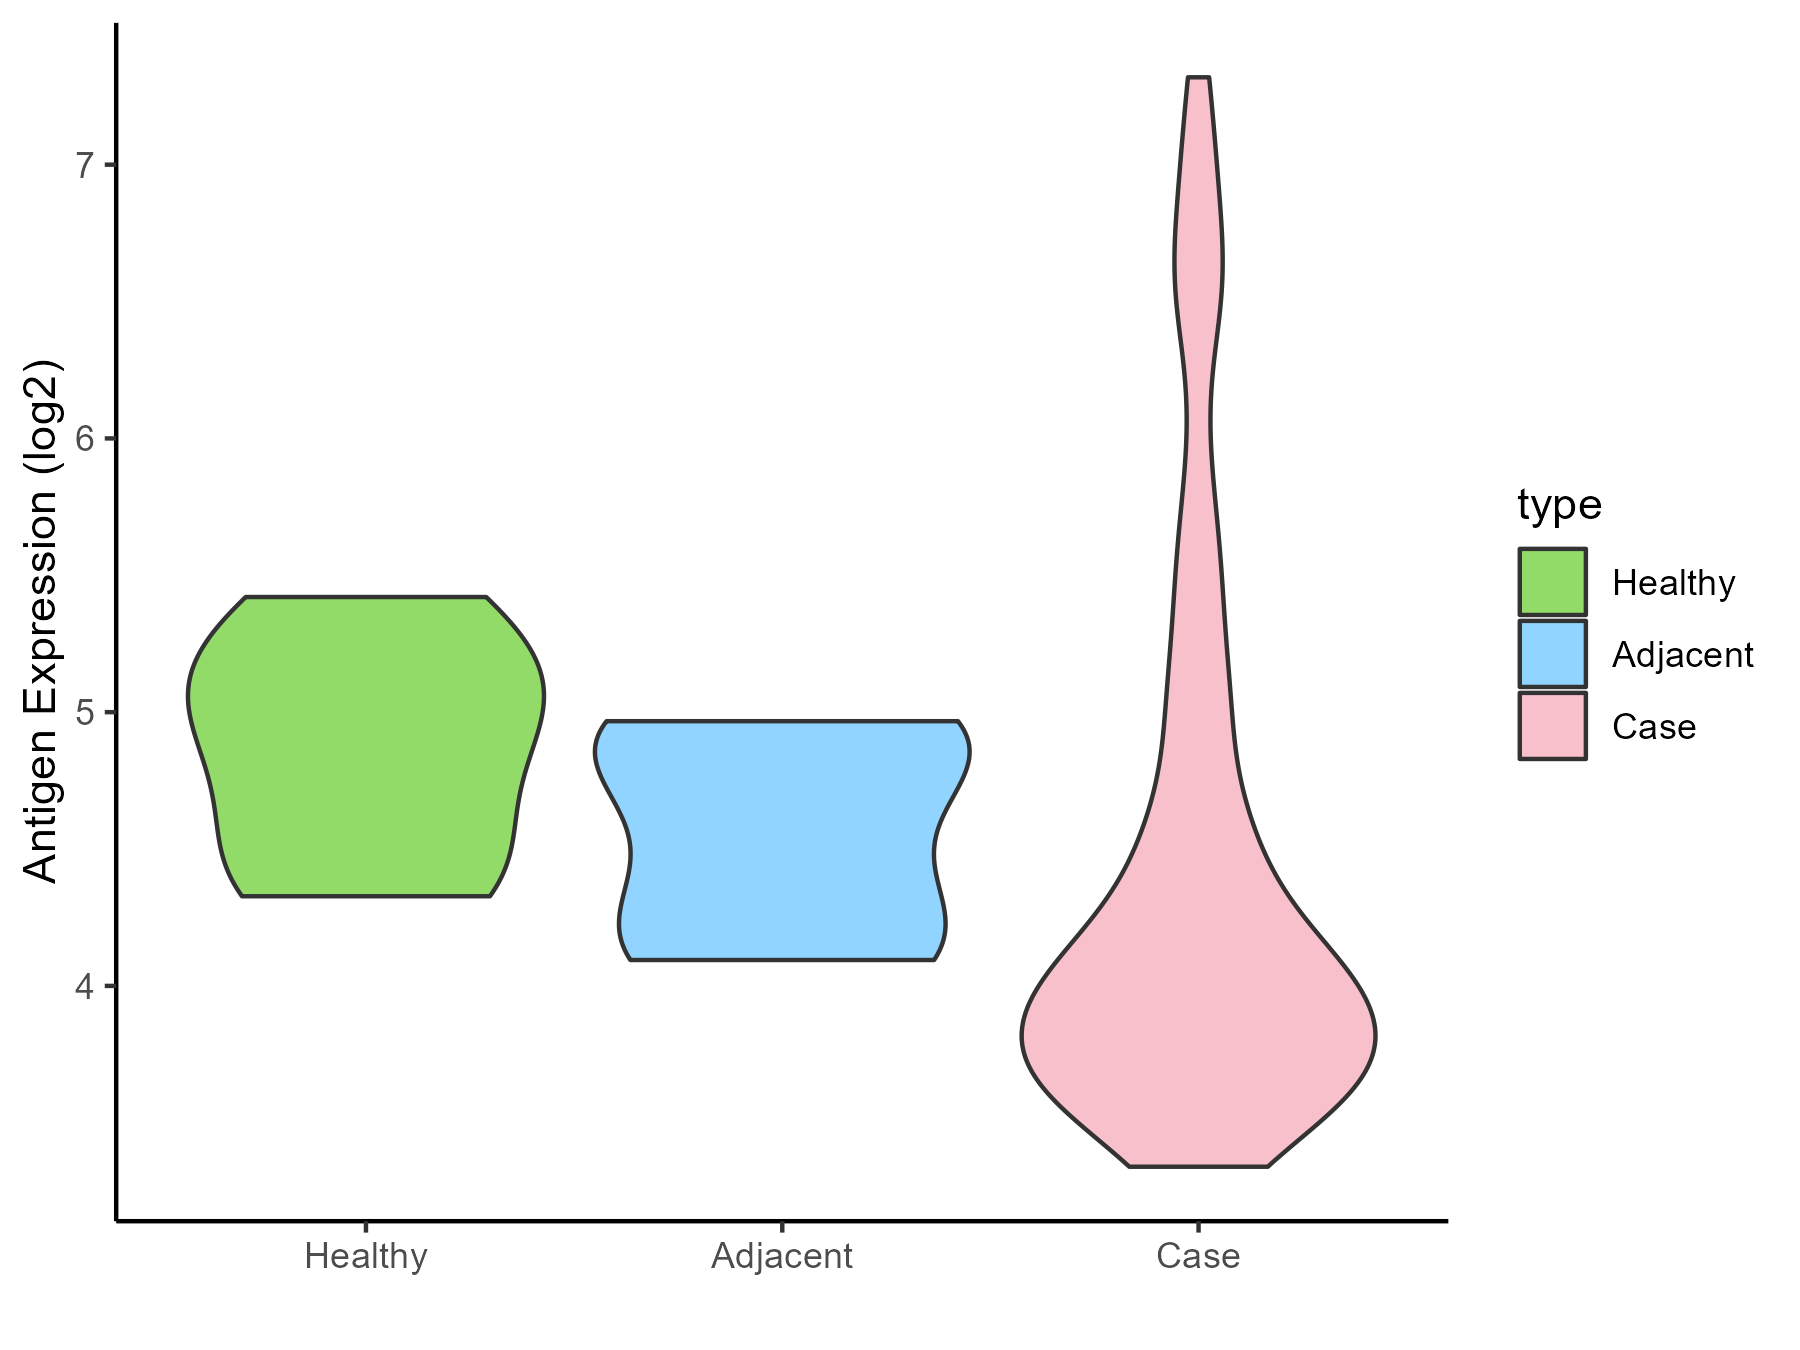
| The Studied Tissue | Rectal colon | |
| The Specific Disease | Rectal cancer | |
| The Expression Level of Disease Section Compare with the Healthy Individual Tissue | p-value: 0.042964849; Fold-change: -0.905511735; Z-score: -2.146905289 | |
| The Expression Level of Disease Section Compare with the Adjacent Tissue | p-value: 0.439331612; Fold-change: -0.580835367; Z-score: -1.454865411 | |
| Disease-specific Antigen Abundances |
|
Click to View the Clearer Original Diagram |
| Differential expression pattern of antigen in diseases | ||
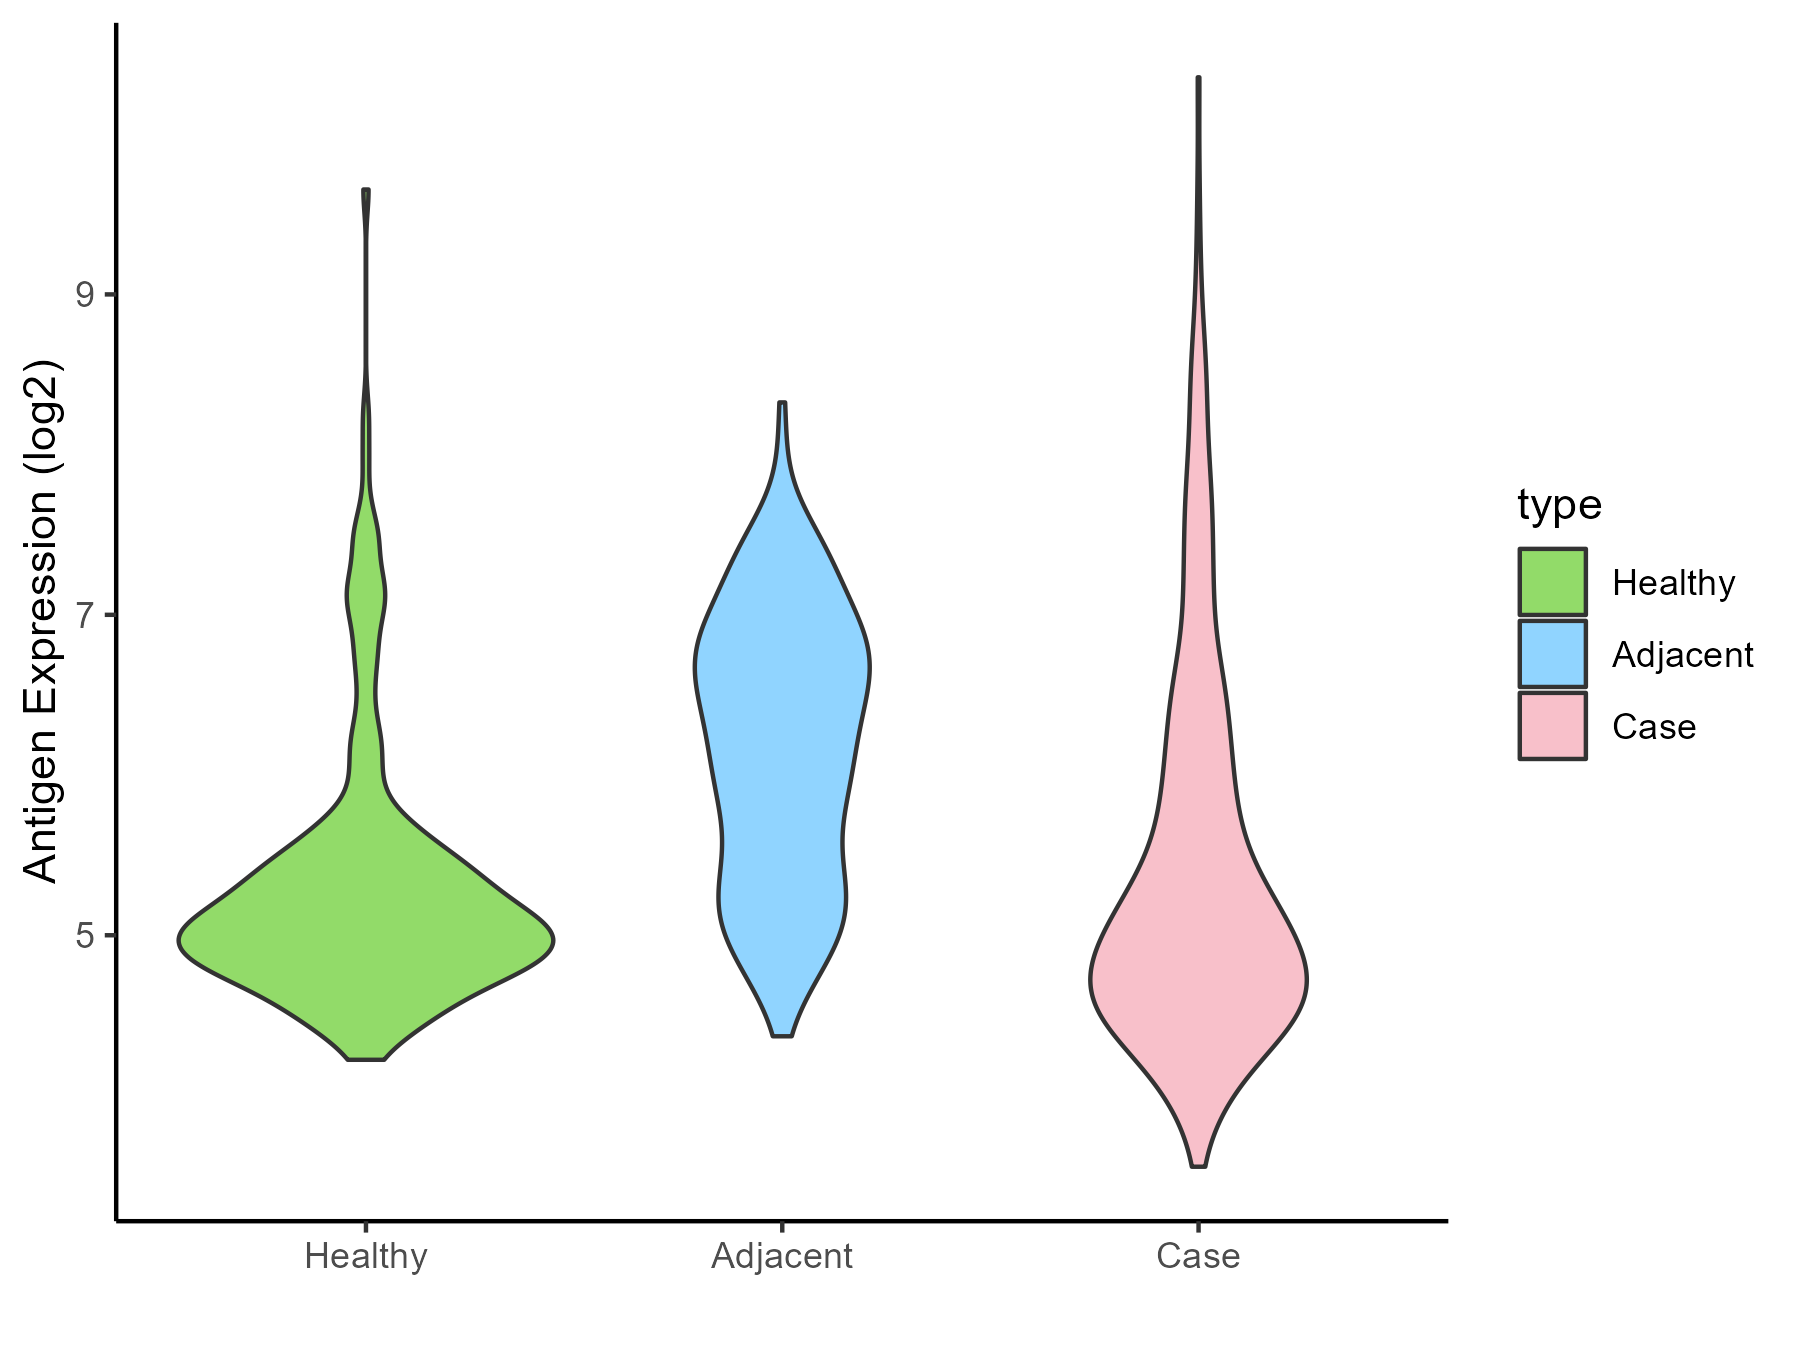
| The Studied Tissue | Skin | |
| The Specific Disease | Skin cancer | |
| The Expression Level of Disease Section Compare with the Healthy Individual Tissue | p-value: 0.153840188; Fold-change: -0.036258369; Z-score: -0.04529261 | |
| The Expression Level of Disease Section Compare with the Adjacent Tissue | p-value: 1.05E-17; Fold-change: -1.204755756; Z-score: -1.435560356 | |
| Disease-specific Antigen Abundances |
|
Click to View the Clearer Original Diagram |
| Differential expression pattern of antigen in diseases | ||
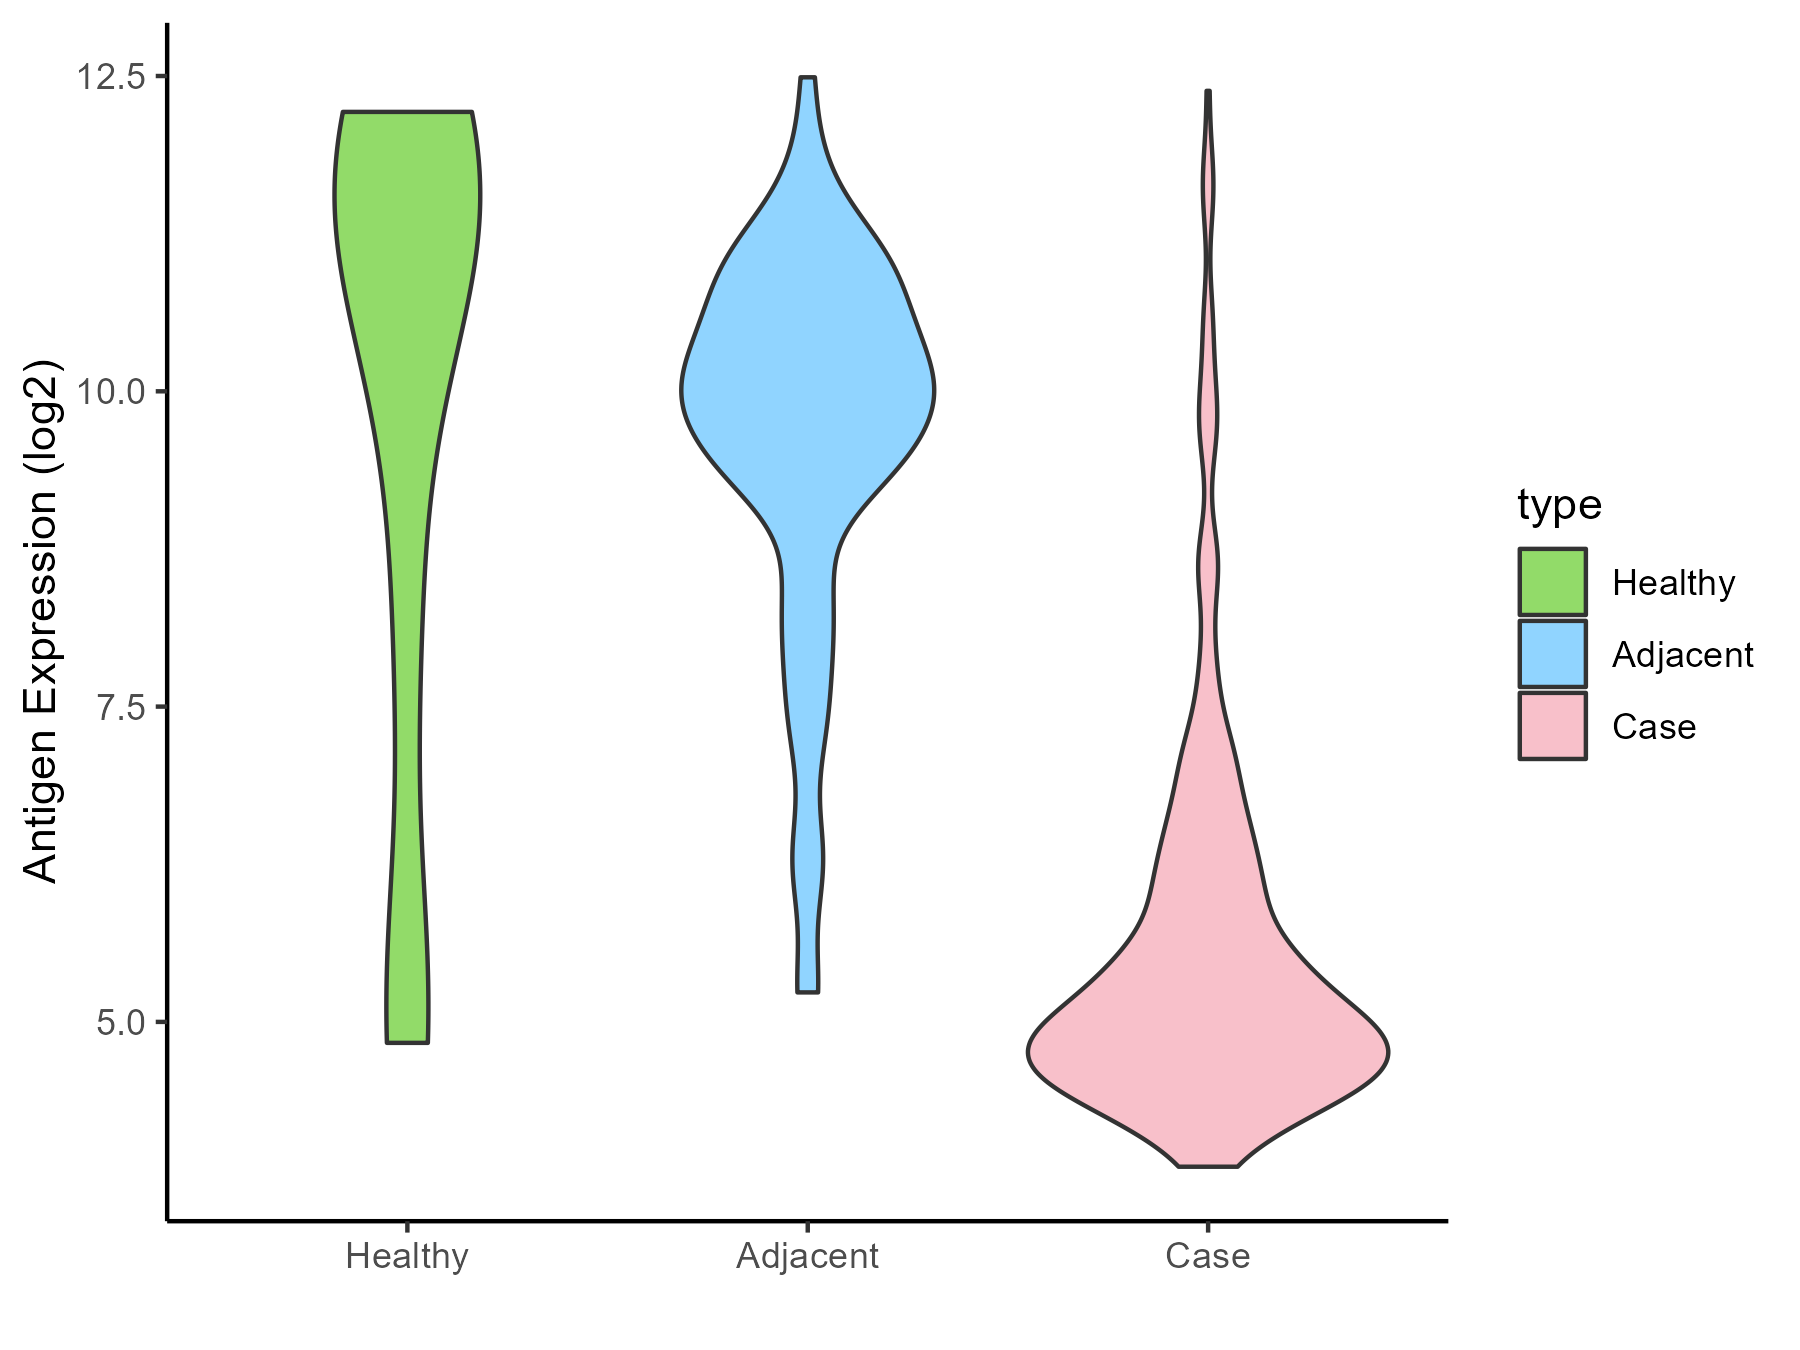
| The Studied Tissue | Kidney | |
| The Specific Disease | Renal cancer | |
| The Expression Level of Disease Section Compare with the Healthy Individual Tissue | p-value: 0.000289863; Fold-change: -6.168108447; Z-score: -2.274924834 | |
| The Expression Level of Disease Section Compare with the Adjacent Tissue | p-value: 1.43E-37; Fold-change: -4.921971989; Z-score: -3.278456499 | |
| Disease-specific Antigen Abundances |
|
Click to View the Clearer Original Diagram |
| Differential expression pattern of antigen in diseases | ||
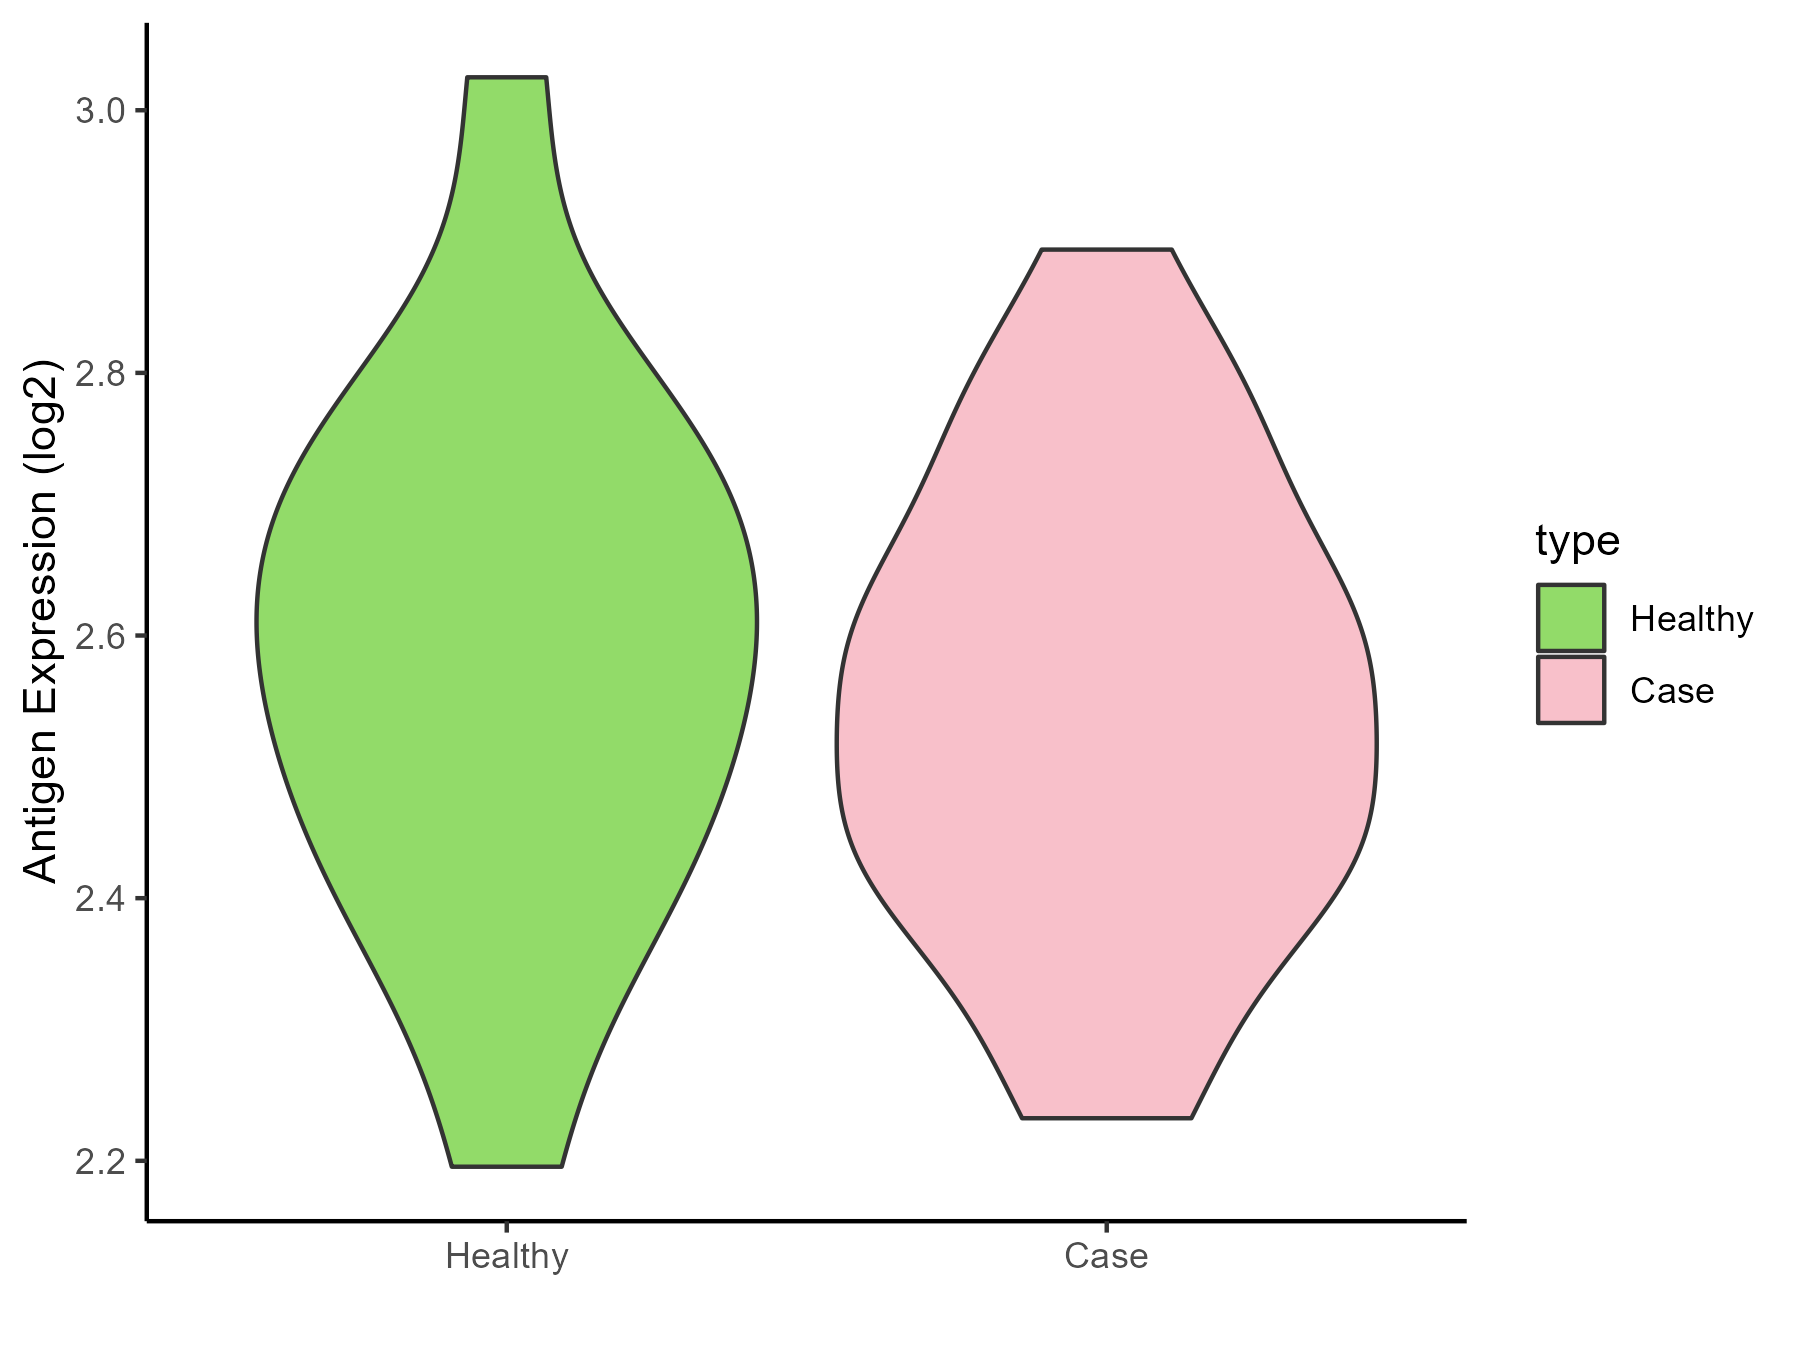
| The Studied Tissue | Urothelium | |
| The Specific Disease | Ureter cancer | |
| The Expression Level of Disease Section Compare with the Healthy Individual Tissue | p-value: 0.529311885; Fold-change: -0.045745162; Z-score: -0.224540936 | |
| Disease-specific Antigen Abundances |
|
Click to View the Clearer Original Diagram |
ICD Disease Classification 20
| Differential expression pattern of antigen in diseases | ||
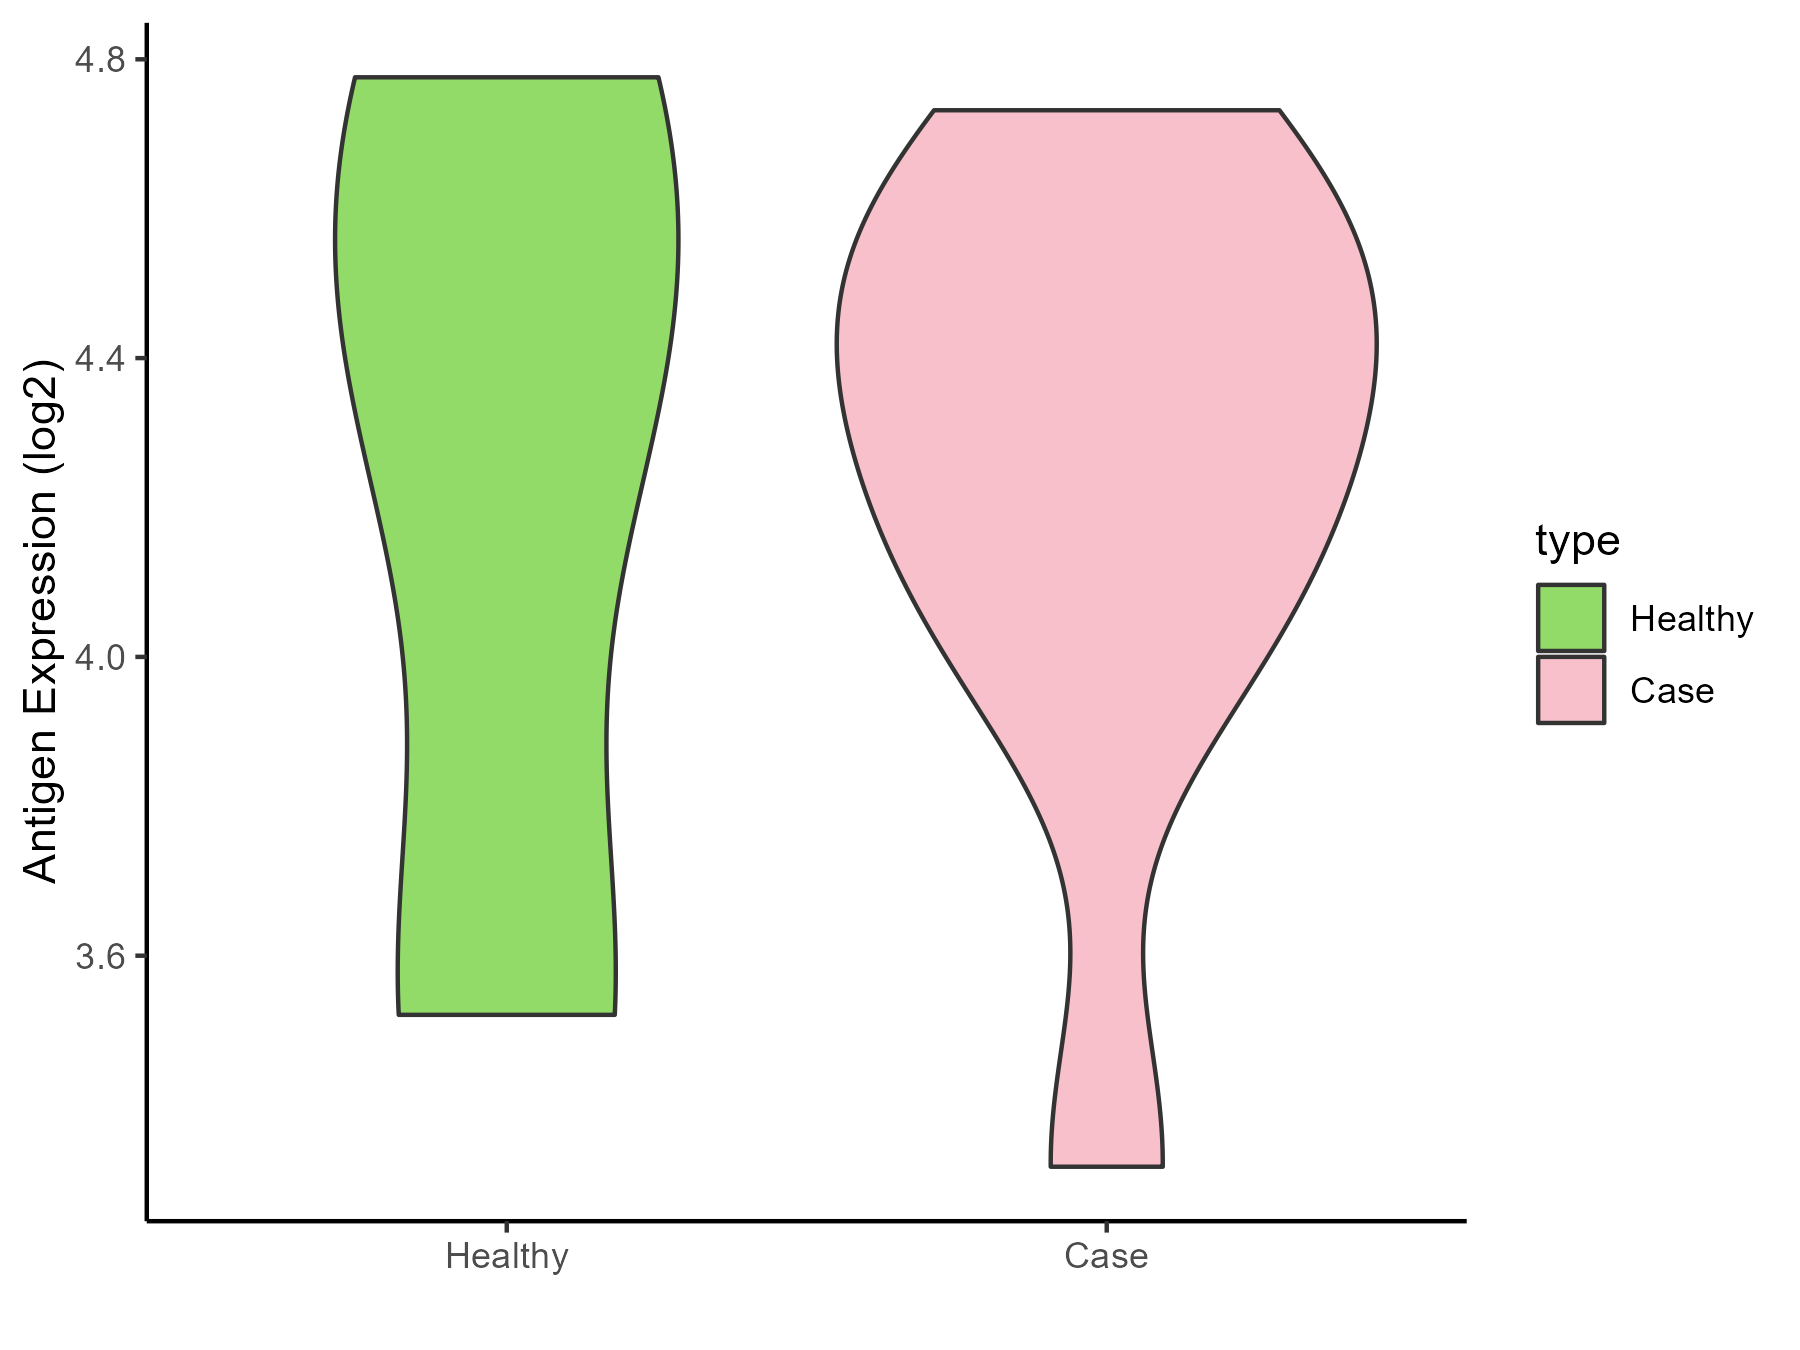
| The Studied Tissue | Adipose | |
| The Specific Disease | Simpson golabi behmel syndrome | |
| The Expression Level of Disease Section Compare with the Healthy Individual Tissue | p-value: 0.93591657; Fold-change: 0.003904335; Z-score: 0.006107028 | |
| Disease-specific Antigen Abundances |
|
Click to View the Clearer Original Diagram |
| Differential expression pattern of antigen in diseases | ||
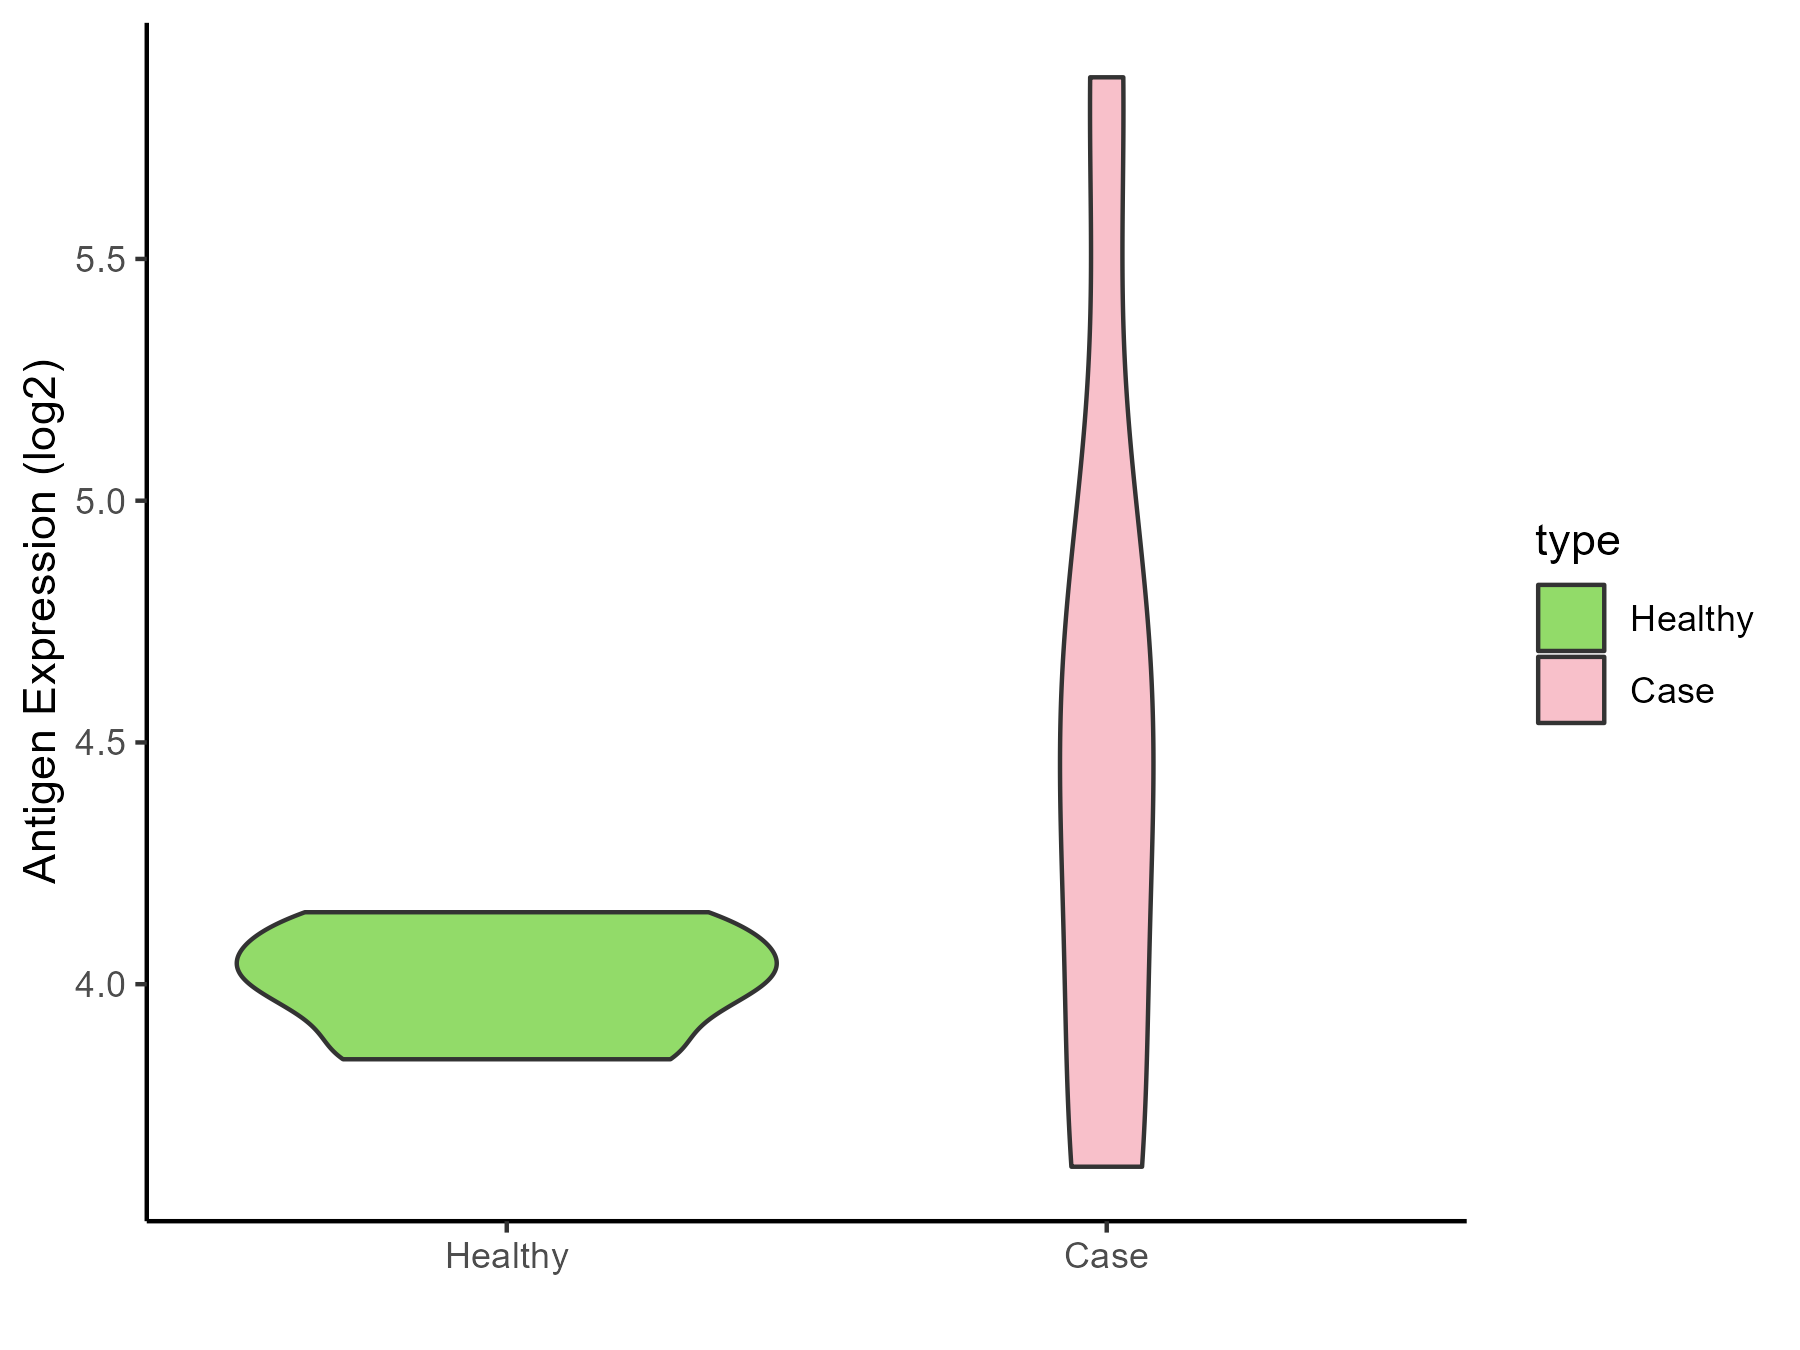
| The Studied Tissue | Perituberal | |
| The Specific Disease | Tuberous sclerosis complex | |
| The Expression Level of Disease Section Compare with the Healthy Individual Tissue | p-value: 0.205873143; Fold-change: 0.439581989; Z-score: 3.412949863 | |
| Disease-specific Antigen Abundances |
|
Click to View the Clearer Original Diagram |
ICD Disease Classification 3
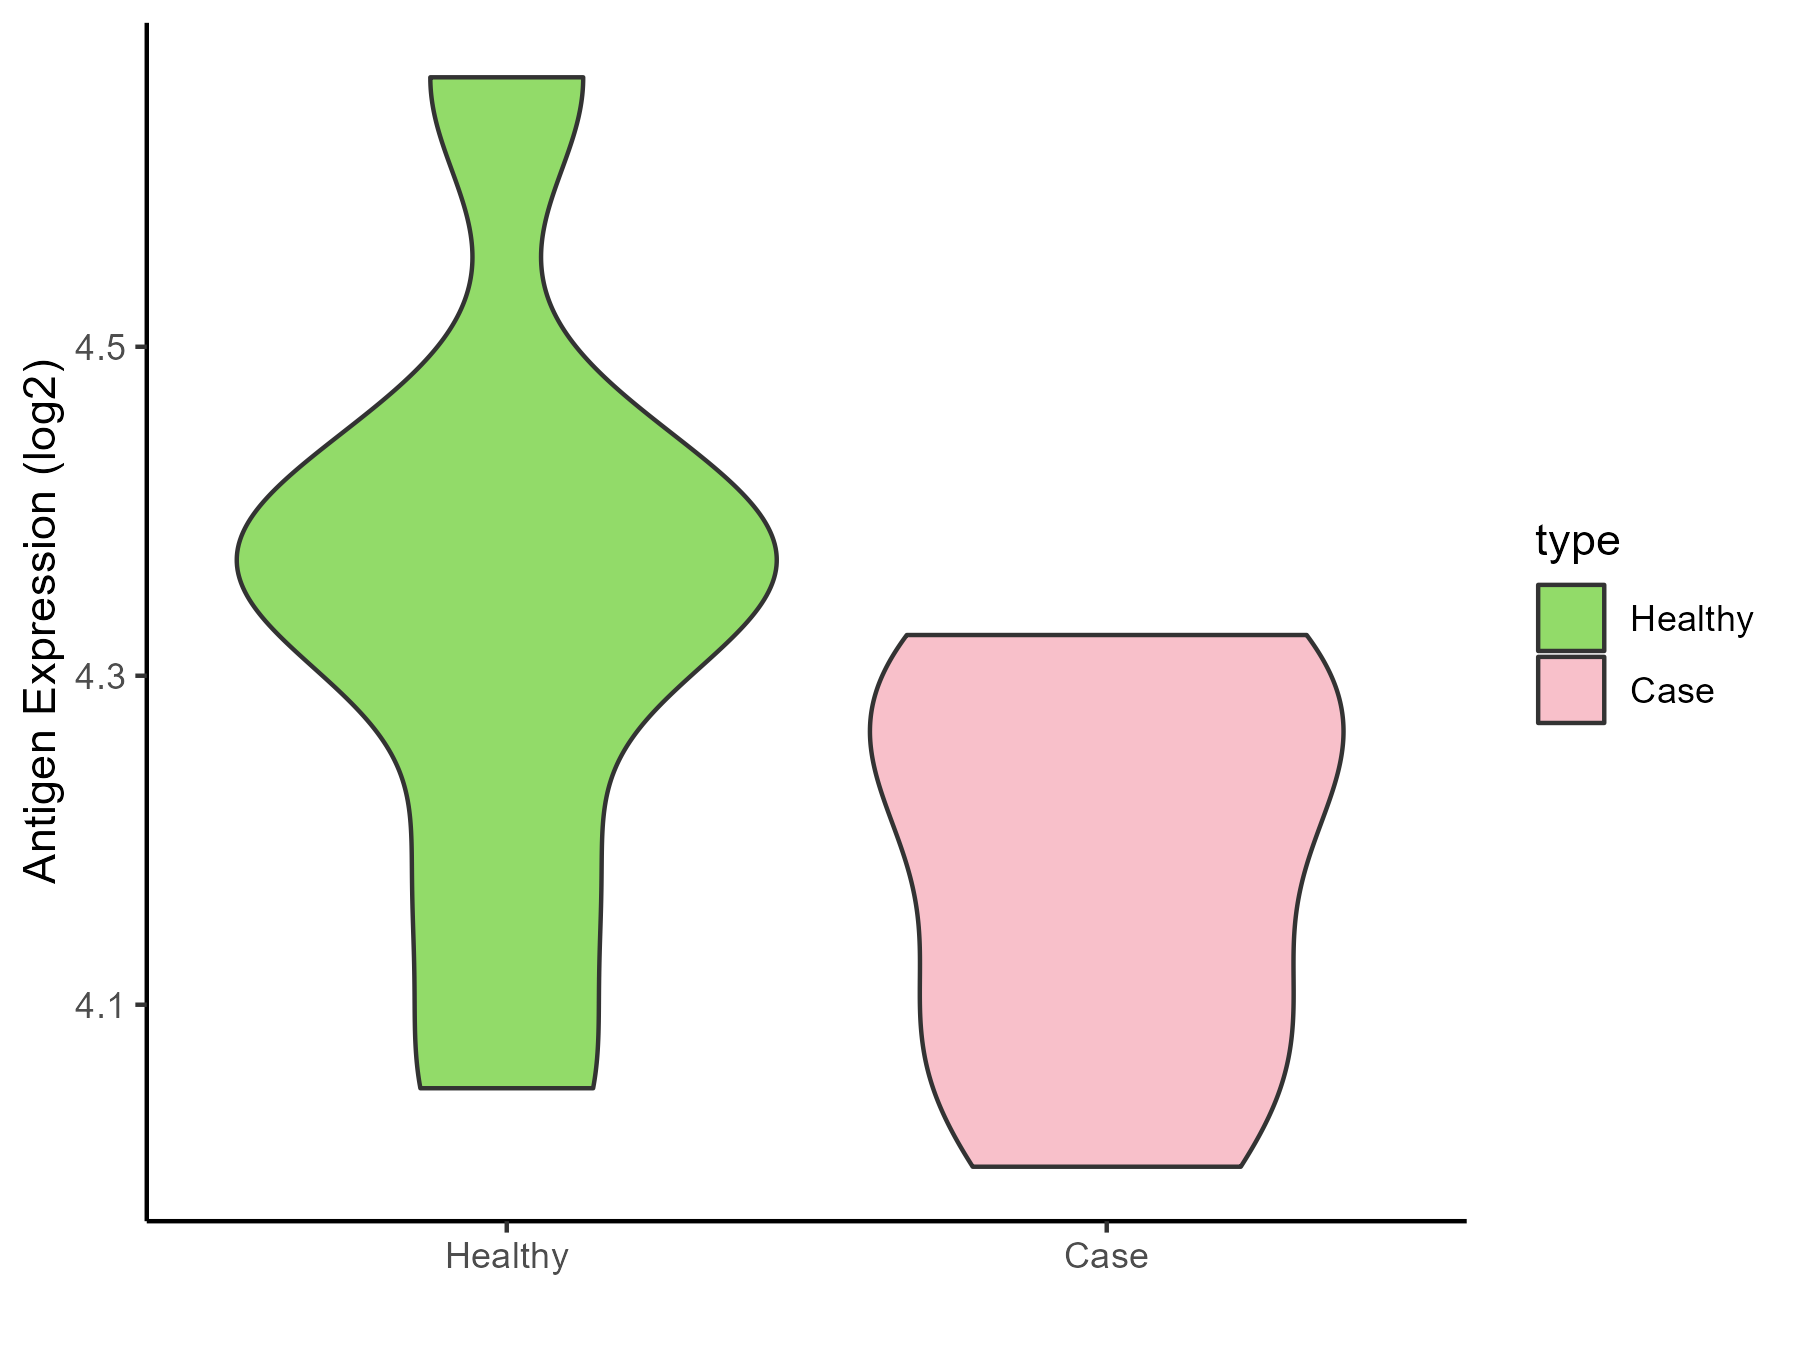
| Differential expression pattern of antigen in diseases | ||
| The Studied Tissue | Bone marrow | |
| The Specific Disease | Anemia | |
| The Expression Level of Disease Section Compare with the Healthy Individual Tissue | p-value: 0.099843154; Fold-change: -0.116051327; Z-score: -0.601046452 | |
| Disease-specific Antigen Abundances |
|
Click to View the Clearer Original Diagram |
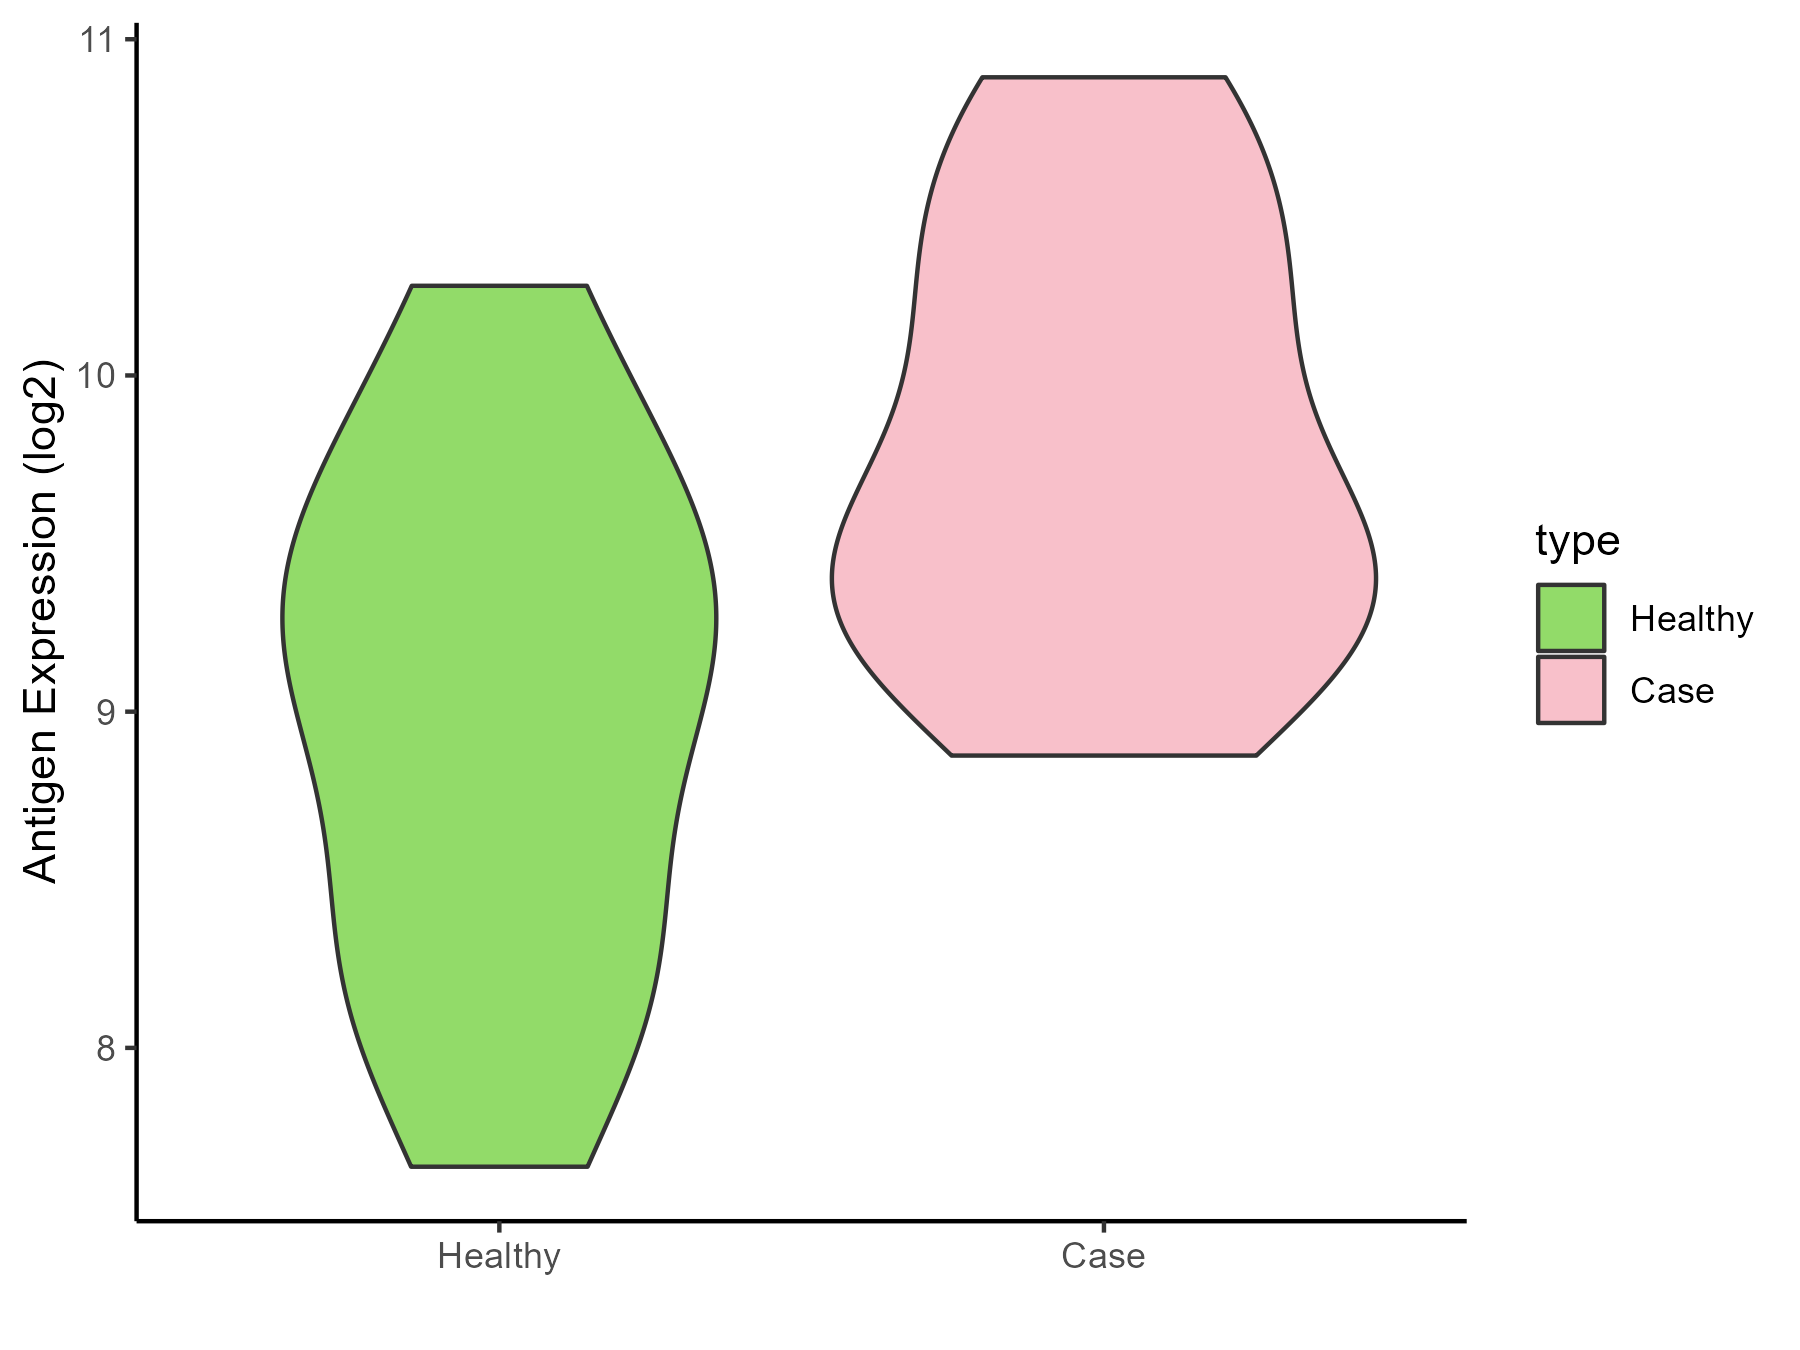
| Differential expression pattern of antigen in diseases | ||
| The Studied Tissue | Peripheral blood | |
| The Specific Disease | Sickle cell disease | |
| The Expression Level of Disease Section Compare with the Healthy Individual Tissue | p-value: 0.011068799; Fold-change: 0.660377124; Z-score: 0.834959705 | |
| Disease-specific Antigen Abundances |
|
Click to View the Clearer Original Diagram |
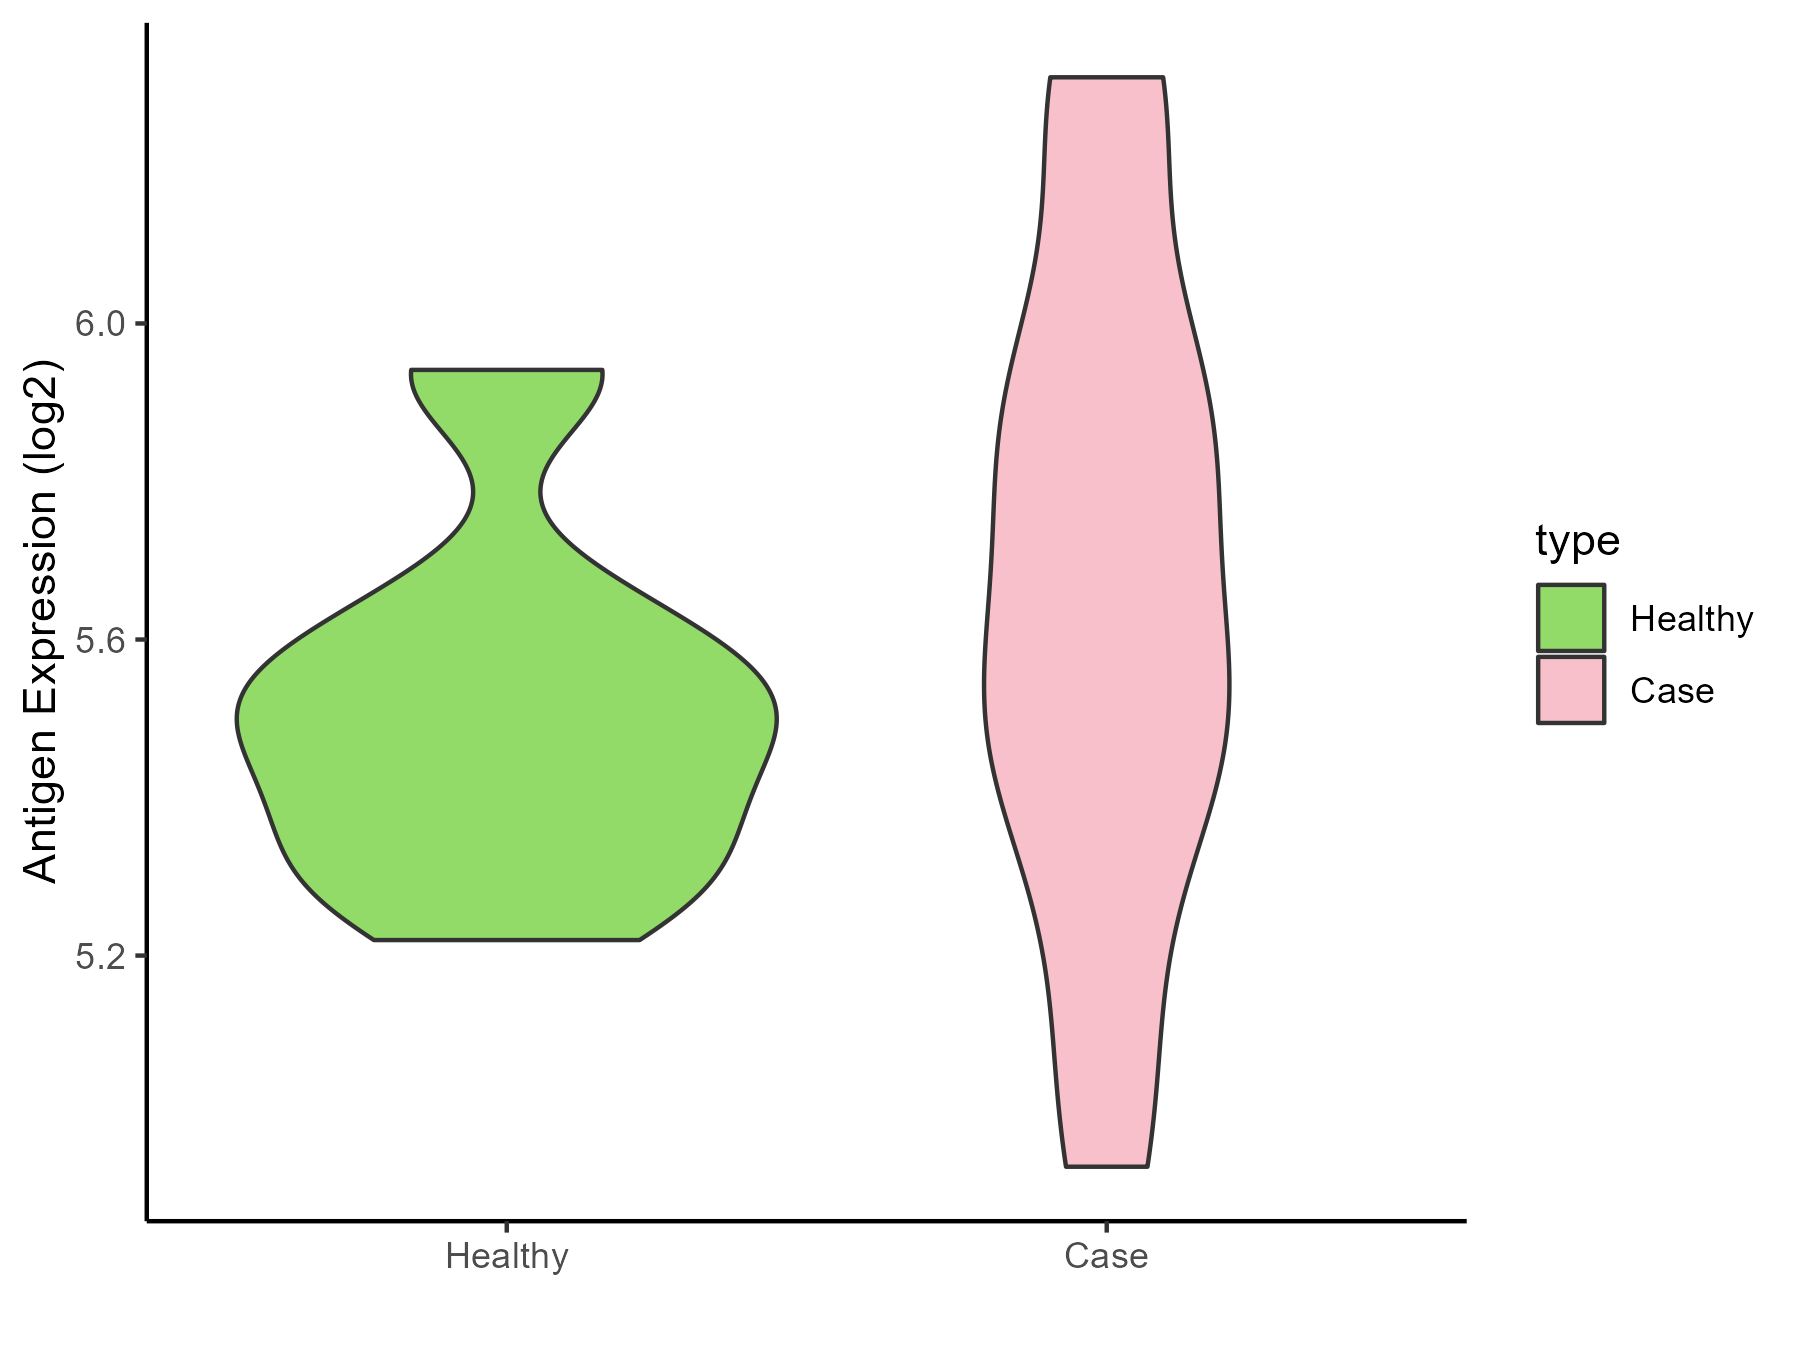
| Differential expression pattern of antigen in diseases | ||
| The Studied Tissue | Whole blood | |
| The Specific Disease | Thrombocythemia | |
| The Expression Level of Disease Section Compare with the Healthy Individual Tissue | p-value: 0.095501269; Fold-change: 0.116551748; Z-score: 0.547905446 | |
| Disease-specific Antigen Abundances |
|
Click to View the Clearer Original Diagram |
ICD Disease Classification 4
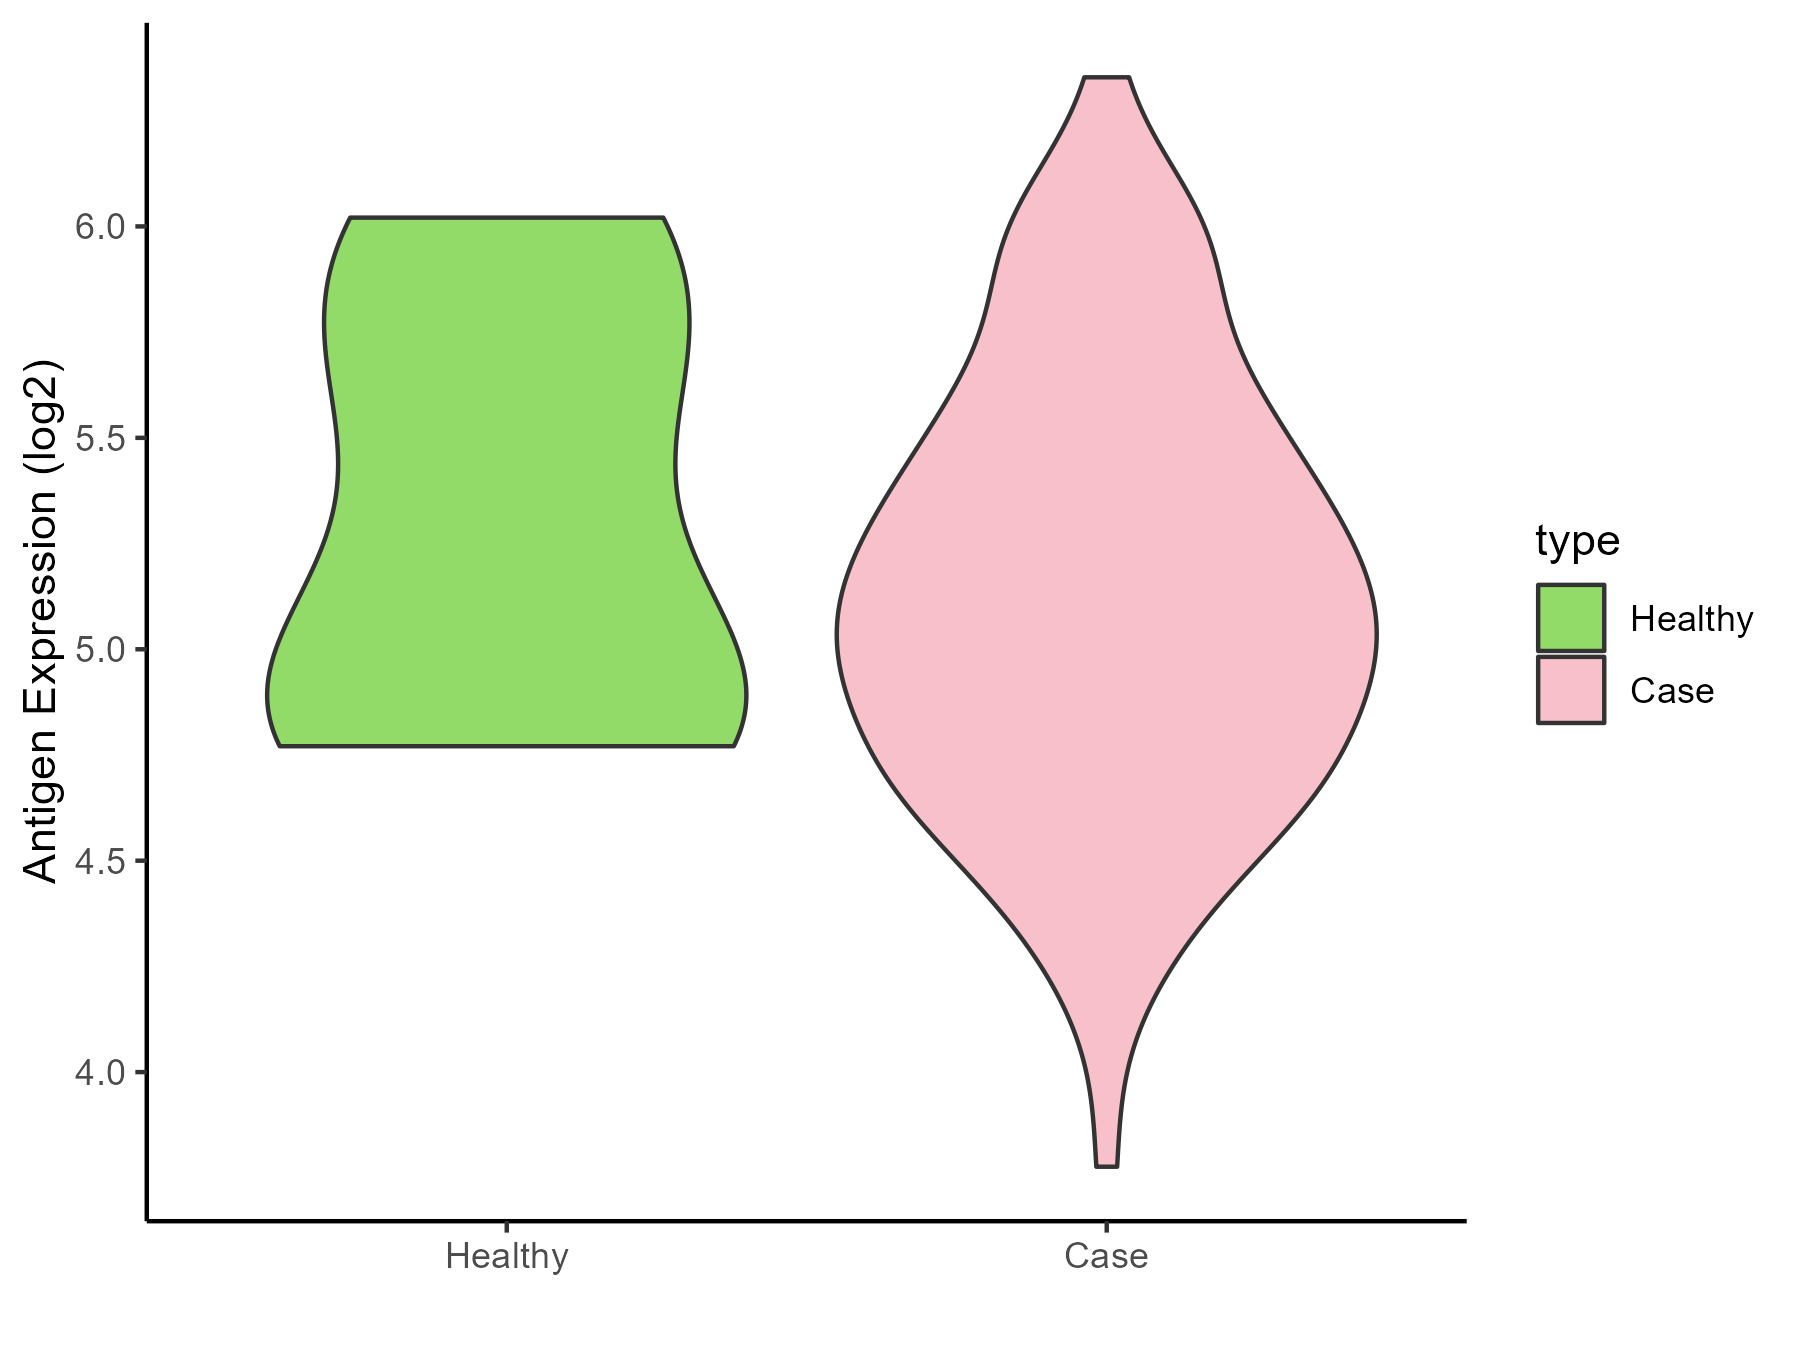
| Differential expression pattern of antigen in diseases | ||
| The Studied Tissue | Whole blood | |
| The Specific Disease | Scleroderma | |
| The Expression Level of Disease Section Compare with the Healthy Individual Tissue | p-value: 0.356798228; Fold-change: -0.077011867; Z-score: -0.146308572 | |
| Disease-specific Antigen Abundances |
|
Click to View the Clearer Original Diagram |
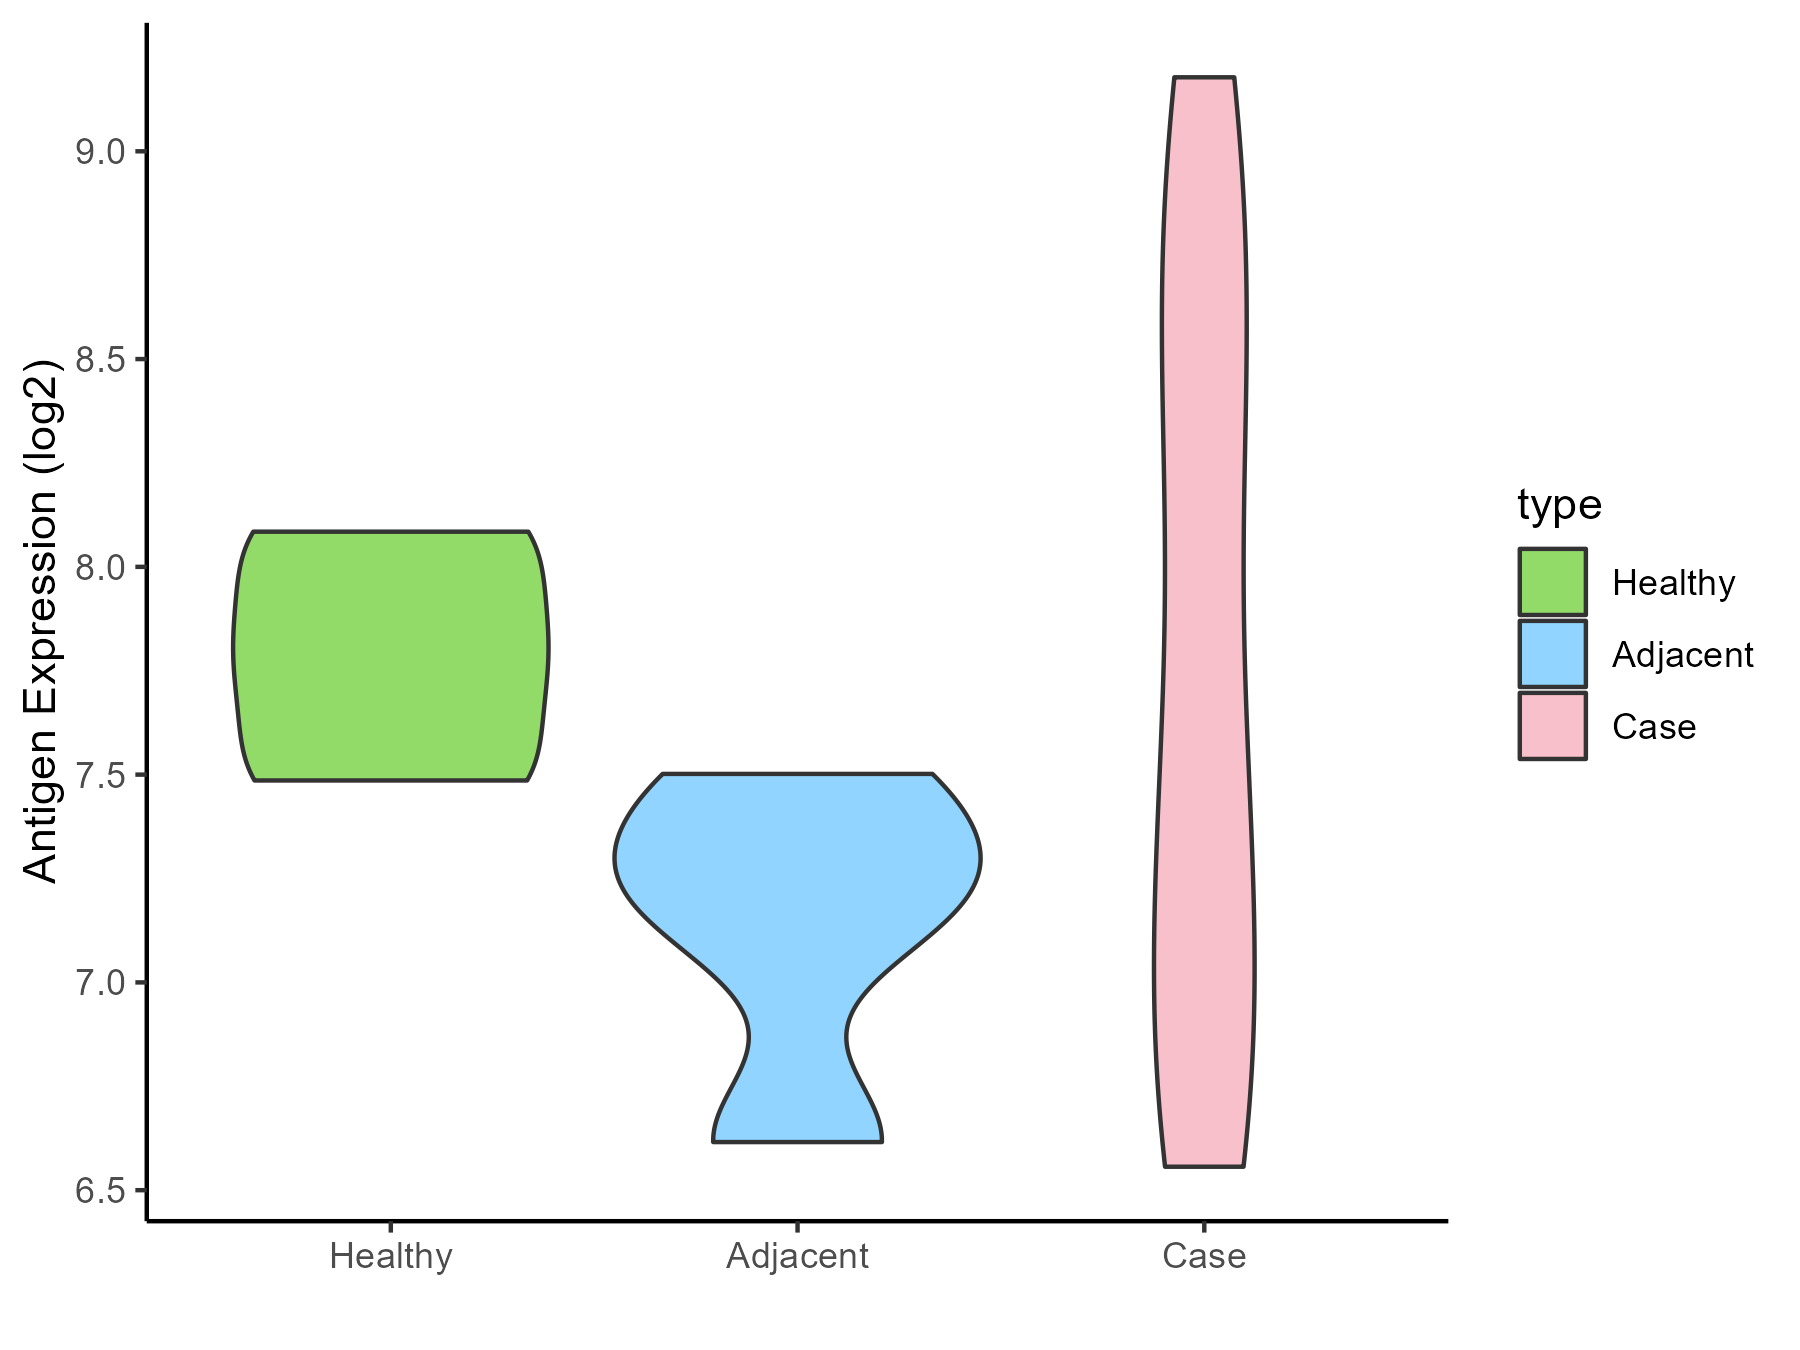
| Differential expression pattern of antigen in diseases | ||
| The Studied Tissue | Salivary gland | |
| The Specific Disease | Sjogren syndrome | |
| The Expression Level of Disease Section Compare with the Healthy Individual Tissue | p-value: 0.942482588; Fold-change: -0.283687578; Z-score: -0.947669562 | |
| The Expression Level of Disease Section Compare with the Adjacent Tissue | p-value: 0.048061384; Fold-change: 0.274836731; Z-score: 0.724460377 | |
| Disease-specific Antigen Abundances |
|
Click to View the Clearer Original Diagram |
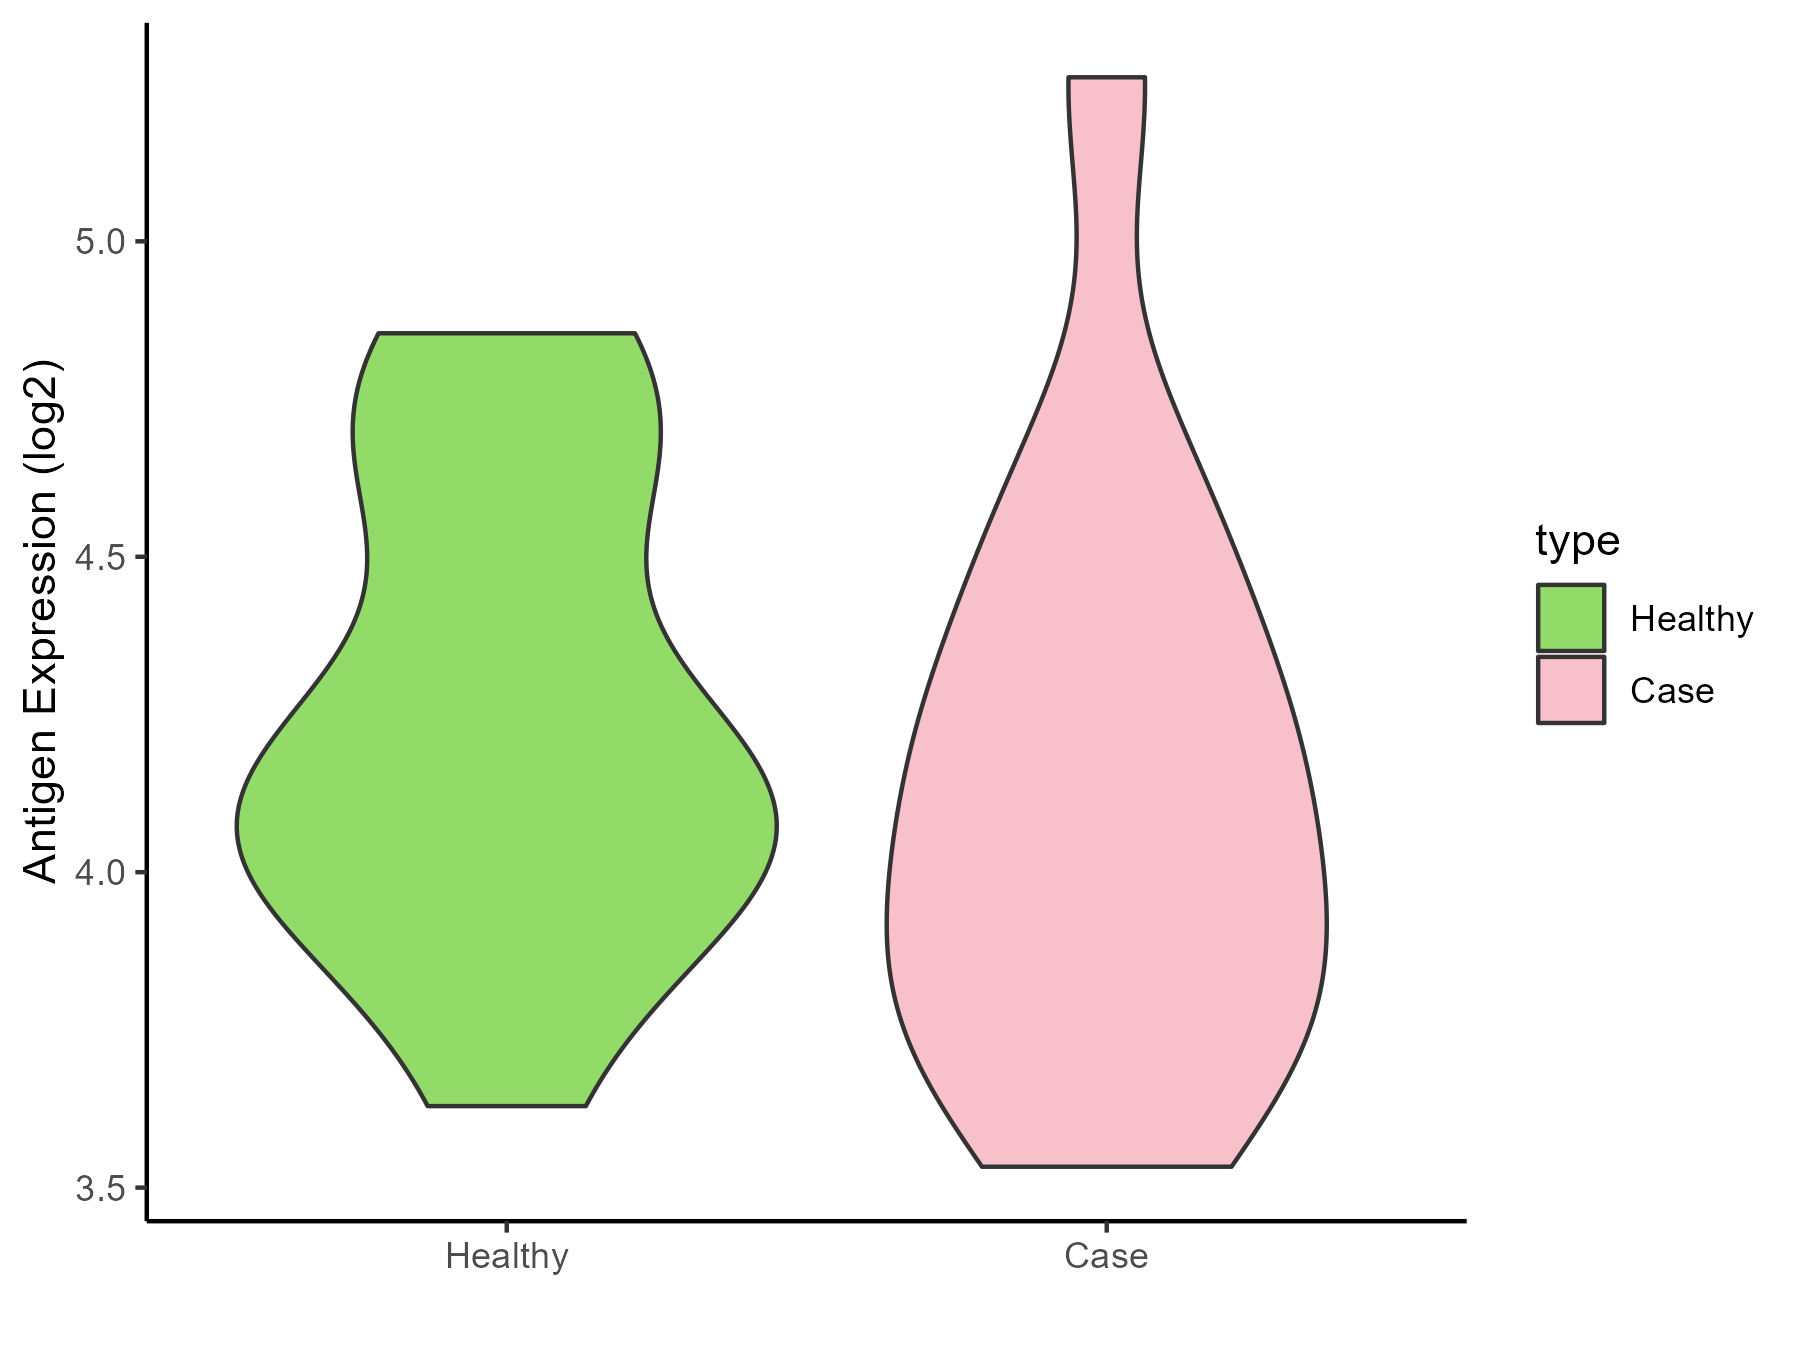
| Differential expression pattern of antigen in diseases | ||
| The Studied Tissue | Peripheral blood | |
| The Specific Disease | Behcet disease | |
| The Expression Level of Disease Section Compare with the Healthy Individual Tissue | p-value: 0.512247692; Fold-change: -0.053753125; Z-score: -0.141425882 | |
| Disease-specific Antigen Abundances |
|
Click to View the Clearer Original Diagram |
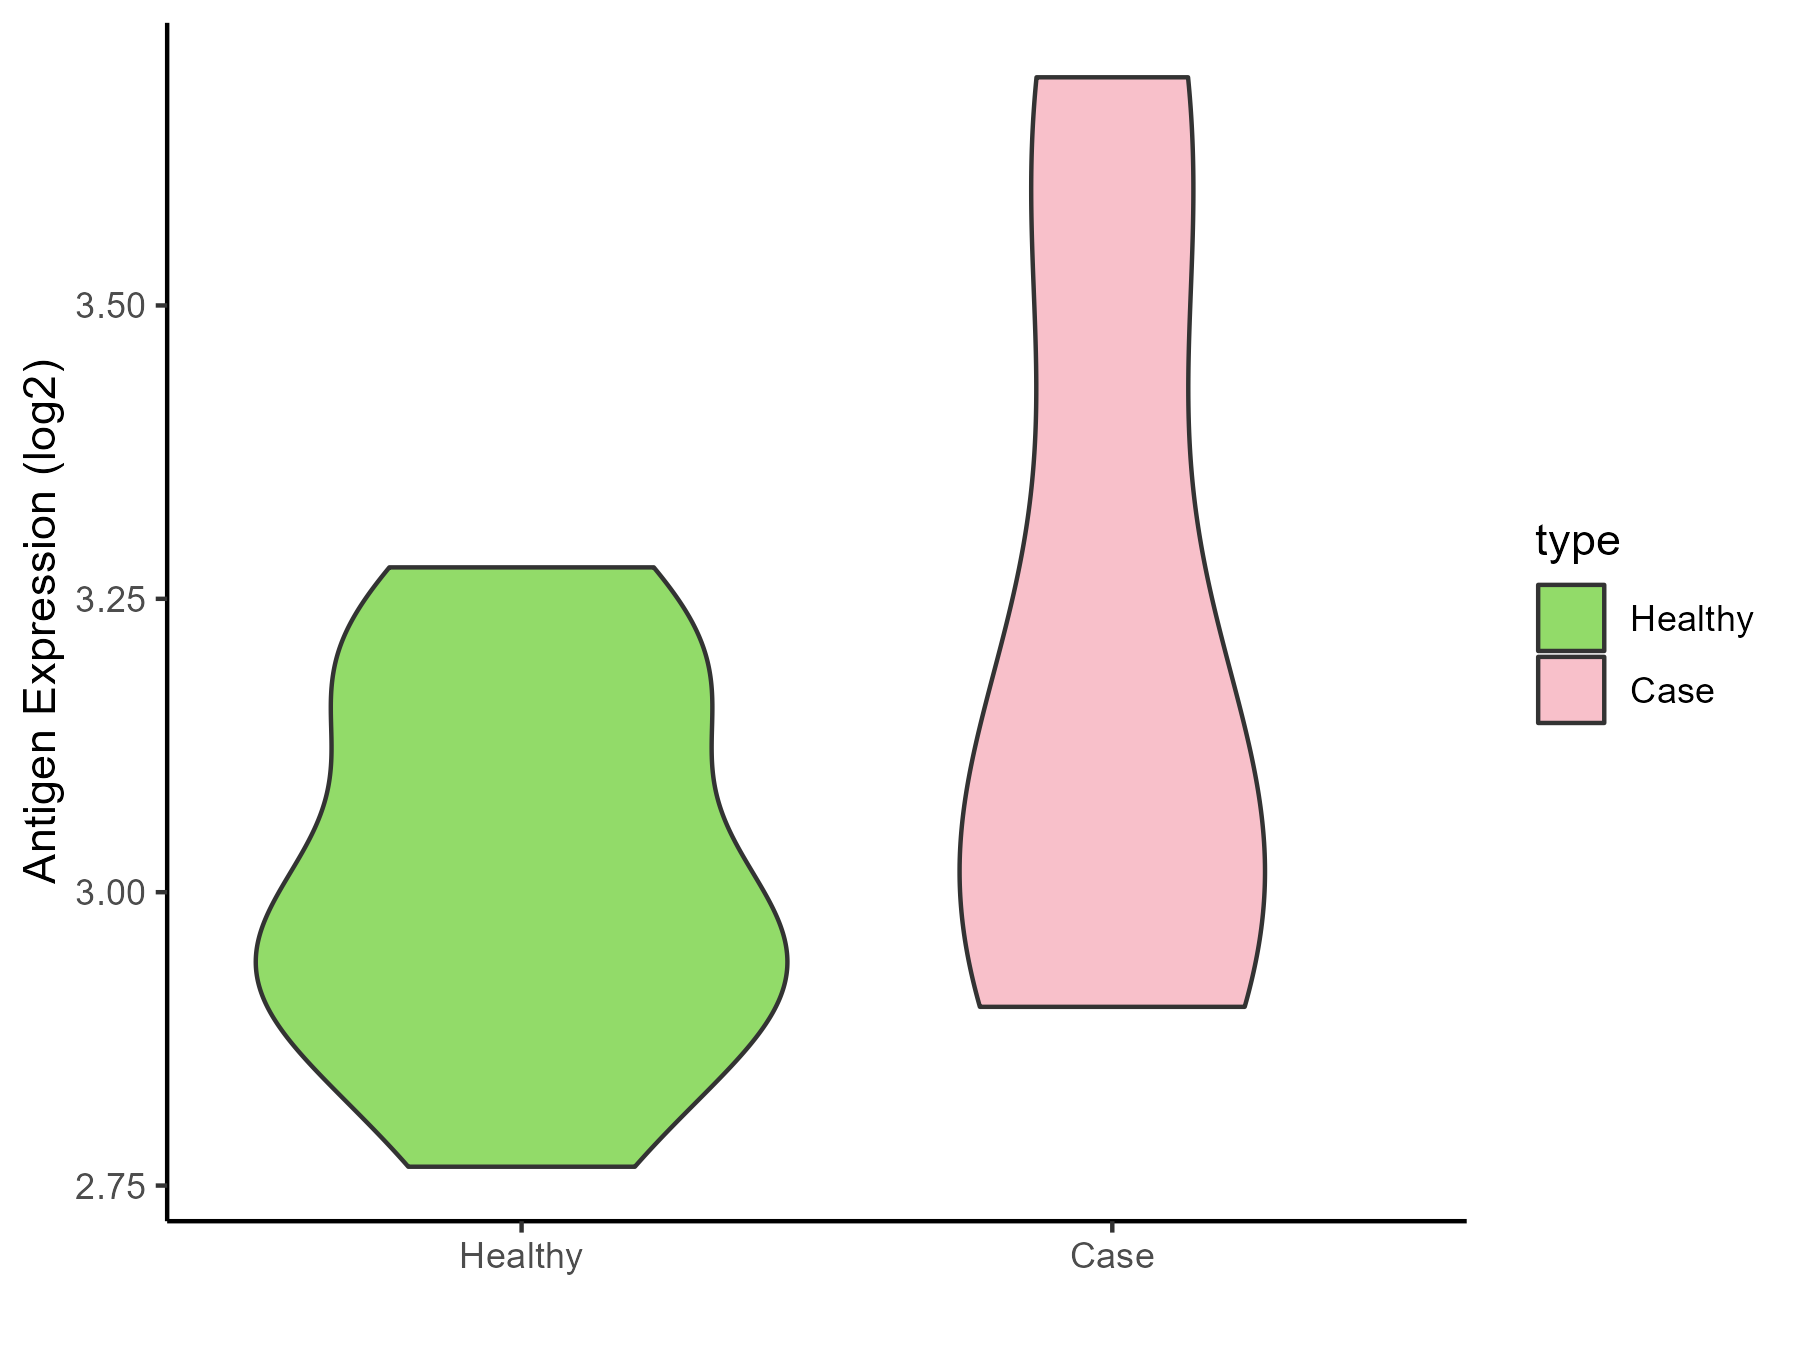
| Differential expression pattern of antigen in diseases | ||
| The Studied Tissue | Whole blood | |
| The Specific Disease | Autosomal dominant monocytopenia | |
| The Expression Level of Disease Section Compare with the Healthy Individual Tissue | p-value: 0.129330276; Fold-change: 0.083450042; Z-score: 0.516803245 | |
| Disease-specific Antigen Abundances |
|
Click to View the Clearer Original Diagram |
ICD Disease Classification 5
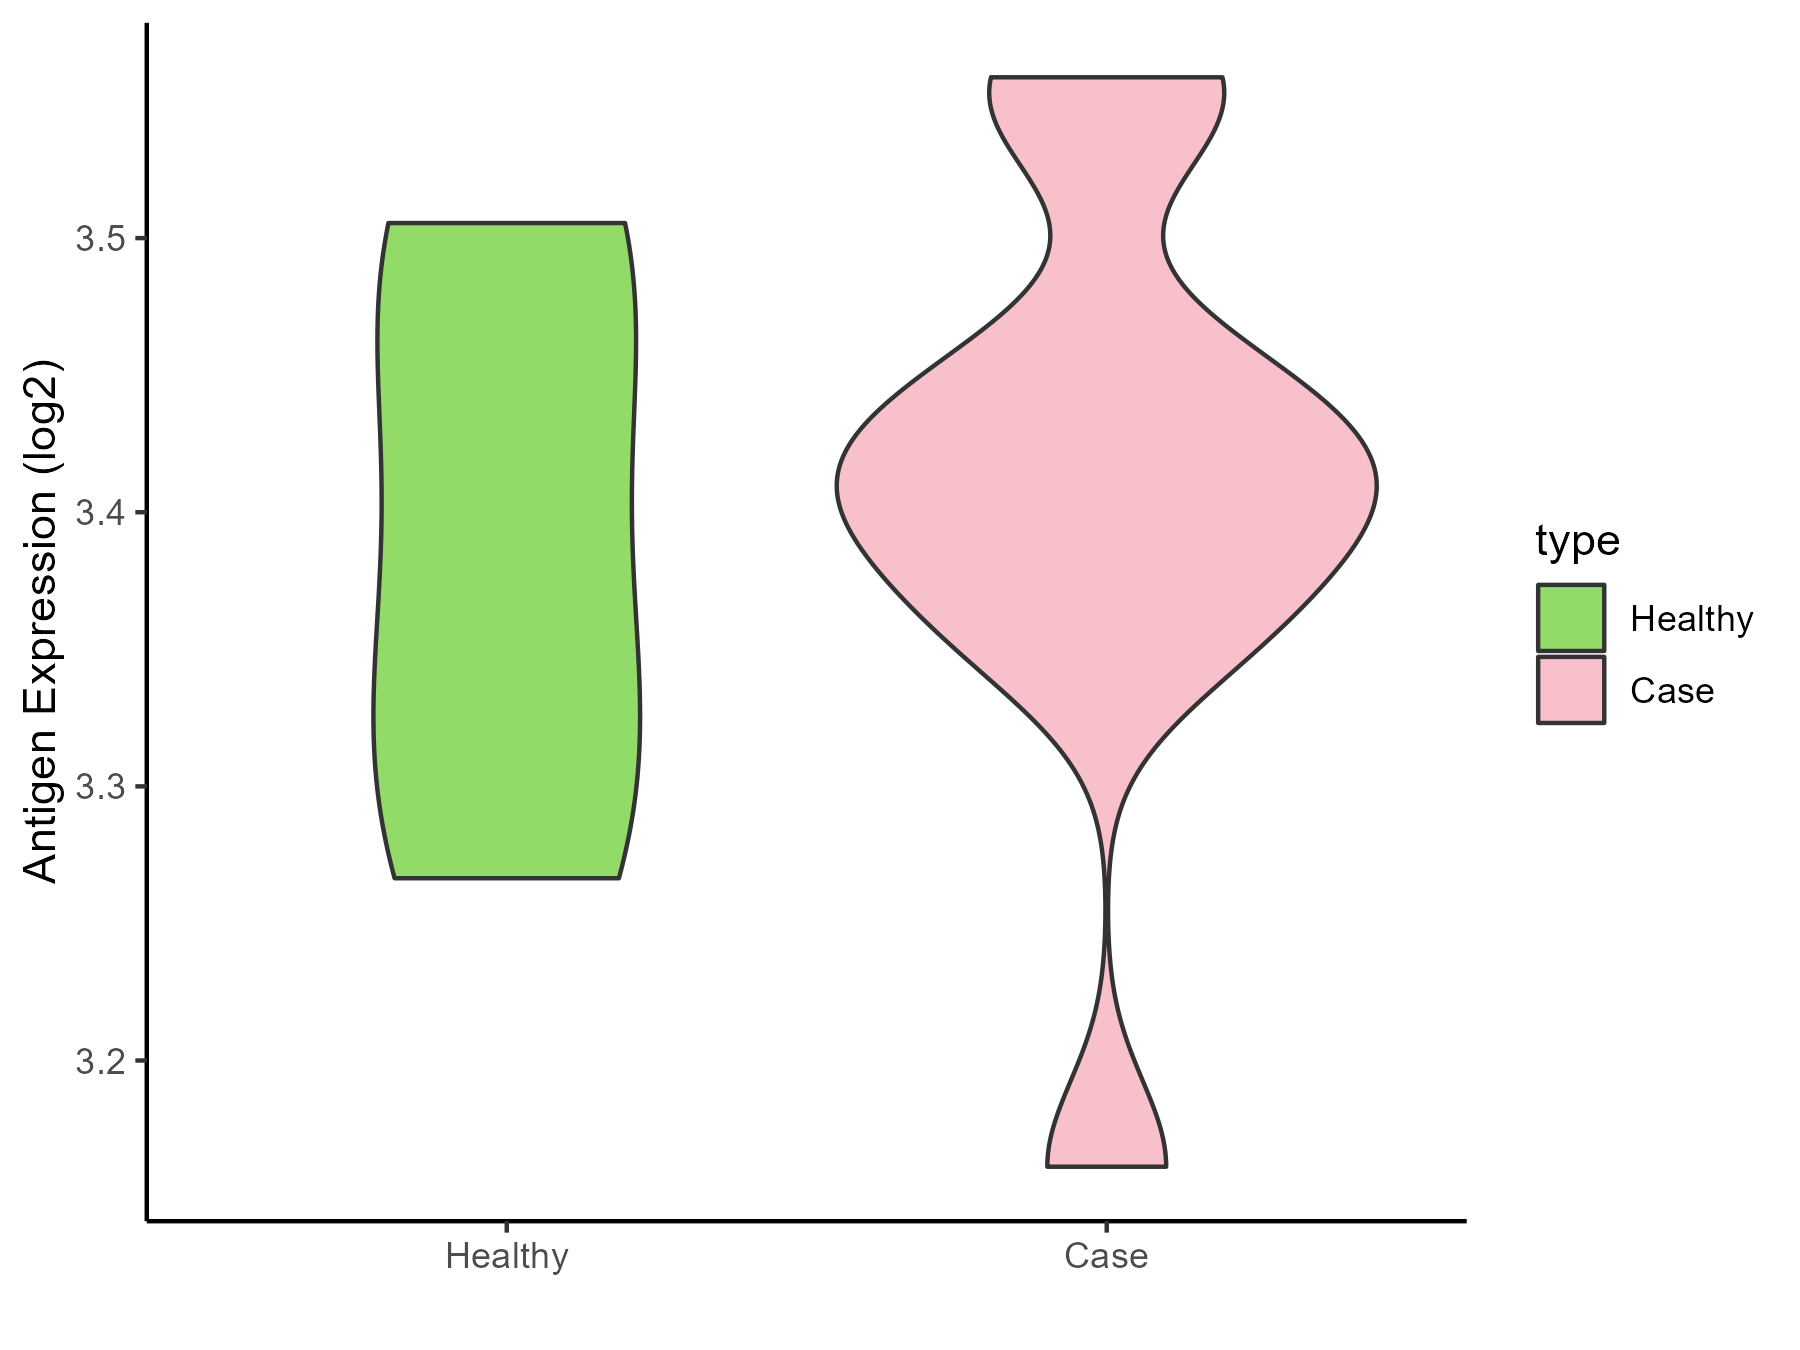
| Differential expression pattern of antigen in diseases | ||
| The Studied Tissue | Liver | |
| The Specific Disease | Type 2 diabetes | |
| The Expression Level of Disease Section Compare with the Healthy Individual Tissue | p-value: 0.751321799; Fold-change: 0.024288488; Z-score: 0.230875668 | |
| Disease-specific Antigen Abundances |
|
Click to View the Clearer Original Diagram |
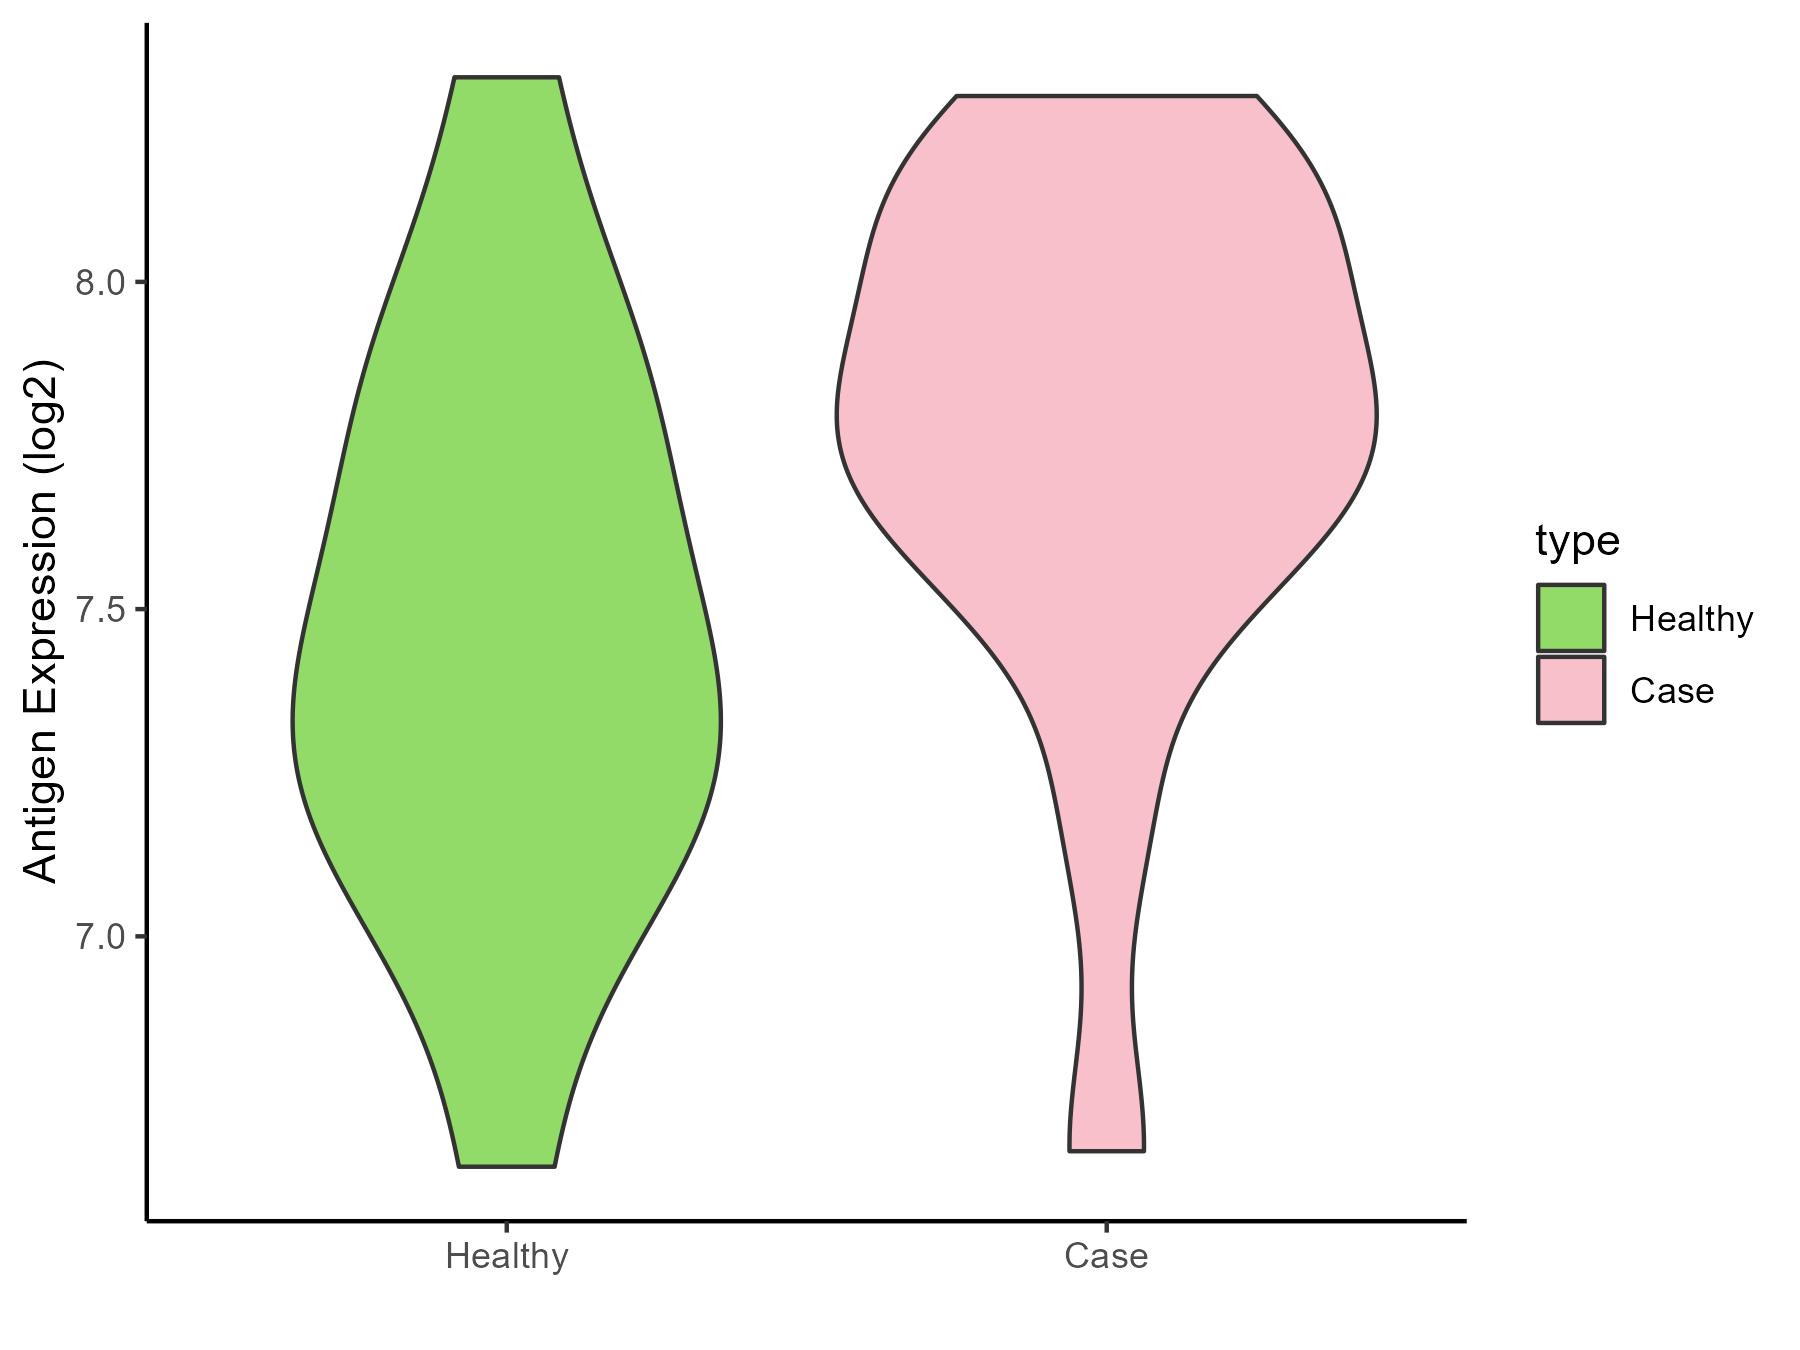
| Differential expression pattern of antigen in diseases | ||
| The Studied Tissue | Vastus lateralis muscle | |
| The Specific Disease | Polycystic ovary syndrome | |
| The Expression Level of Disease Section Compare with the Healthy Individual Tissue | p-value: 0.071860383; Fold-change: 0.385335457; Z-score: 0.876461679 | |
| Disease-specific Antigen Abundances |
|
Click to View the Clearer Original Diagram |
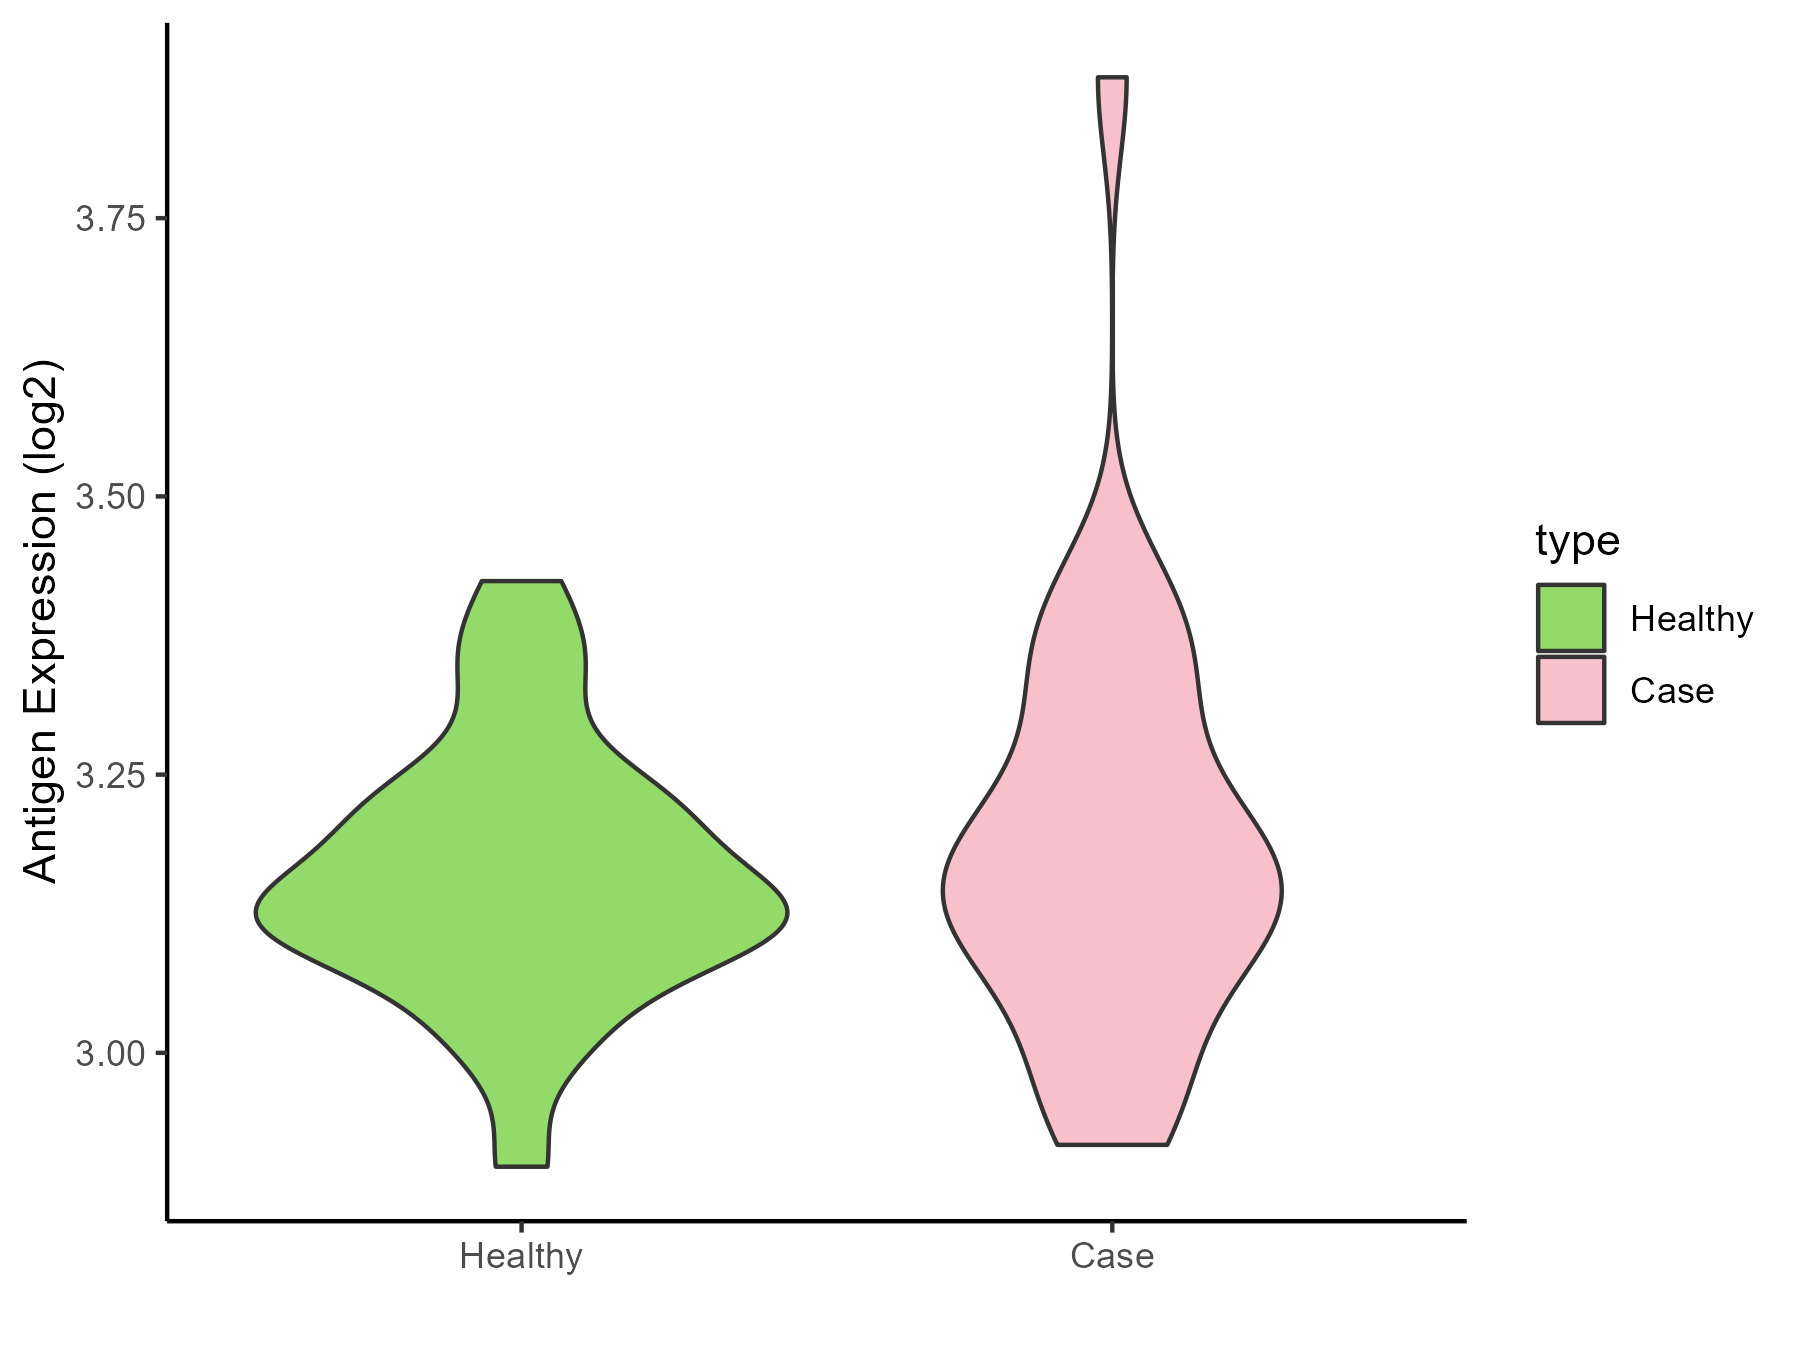
| Differential expression pattern of antigen in diseases | ||
| The Studied Tissue | Subcutaneous Adipose | |
| The Specific Disease | Obesity | |
| The Expression Level of Disease Section Compare with the Healthy Individual Tissue | p-value: 0.461891206; Fold-change: 0.016033798; Z-score: 0.13610584 | |
| Disease-specific Antigen Abundances |
|
Click to View the Clearer Original Diagram |
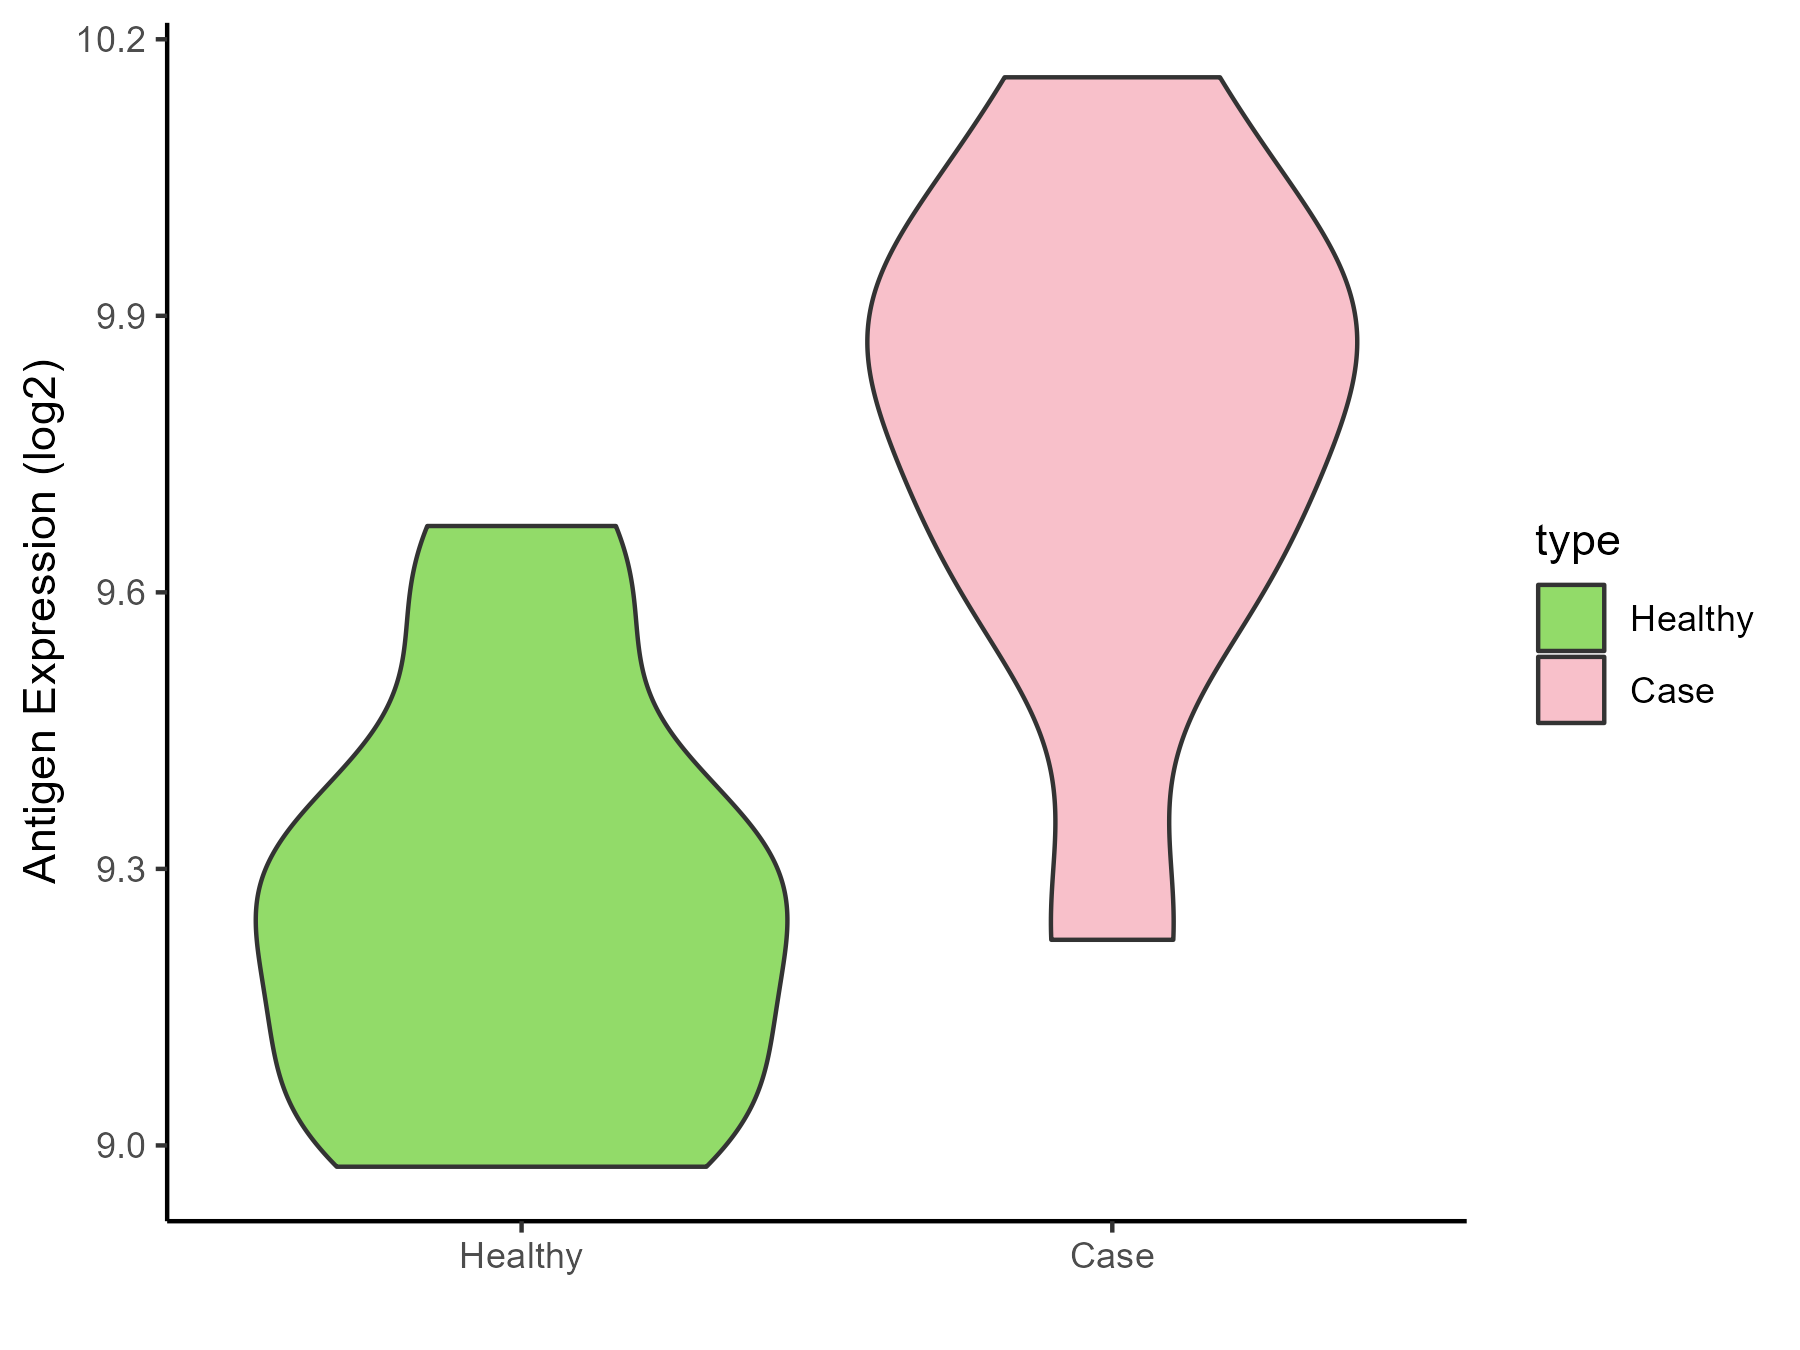
| Differential expression pattern of antigen in diseases | ||
| The Studied Tissue | Biceps muscle | |
| The Specific Disease | Pompe disease | |
| The Expression Level of Disease Section Compare with the Healthy Individual Tissue | p-value: 0.001081916; Fold-change: 0.587101413; Z-score: 2.600878624 | |
| Disease-specific Antigen Abundances |
|
Click to View the Clearer Original Diagram |
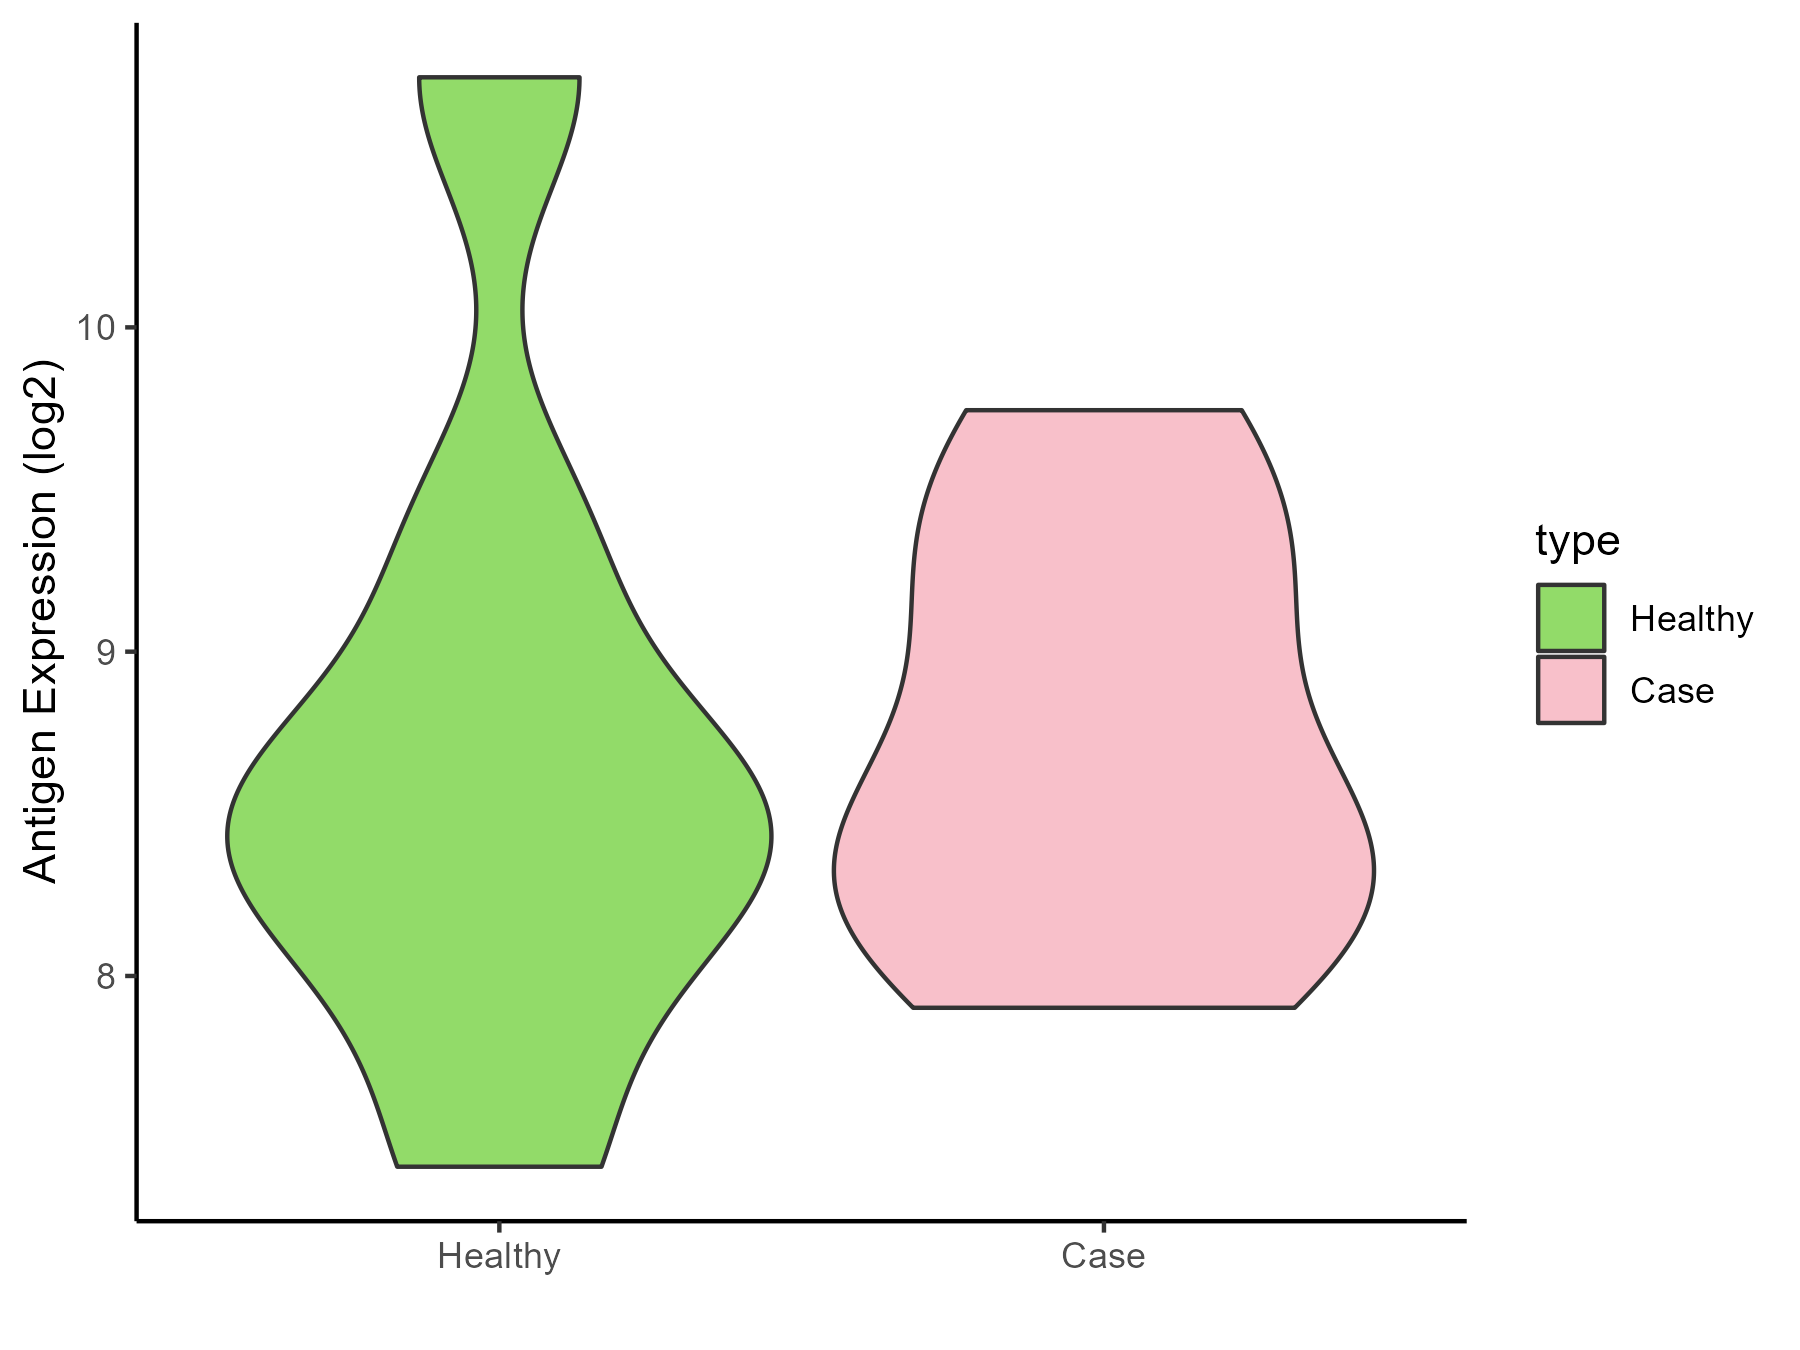
| Differential expression pattern of antigen in diseases | ||
| The Studied Tissue | Whole blood | |
| The Specific Disease | Batten disease | |
| The Expression Level of Disease Section Compare with the Healthy Individual Tissue | p-value: 0.989117291; Fold-change: -0.082655744; Z-score: -0.076903705 | |
| Disease-specific Antigen Abundances |
|
Click to View the Clearer Original Diagram |
ICD Disease Classification 6
| Differential expression pattern of antigen in diseases | ||
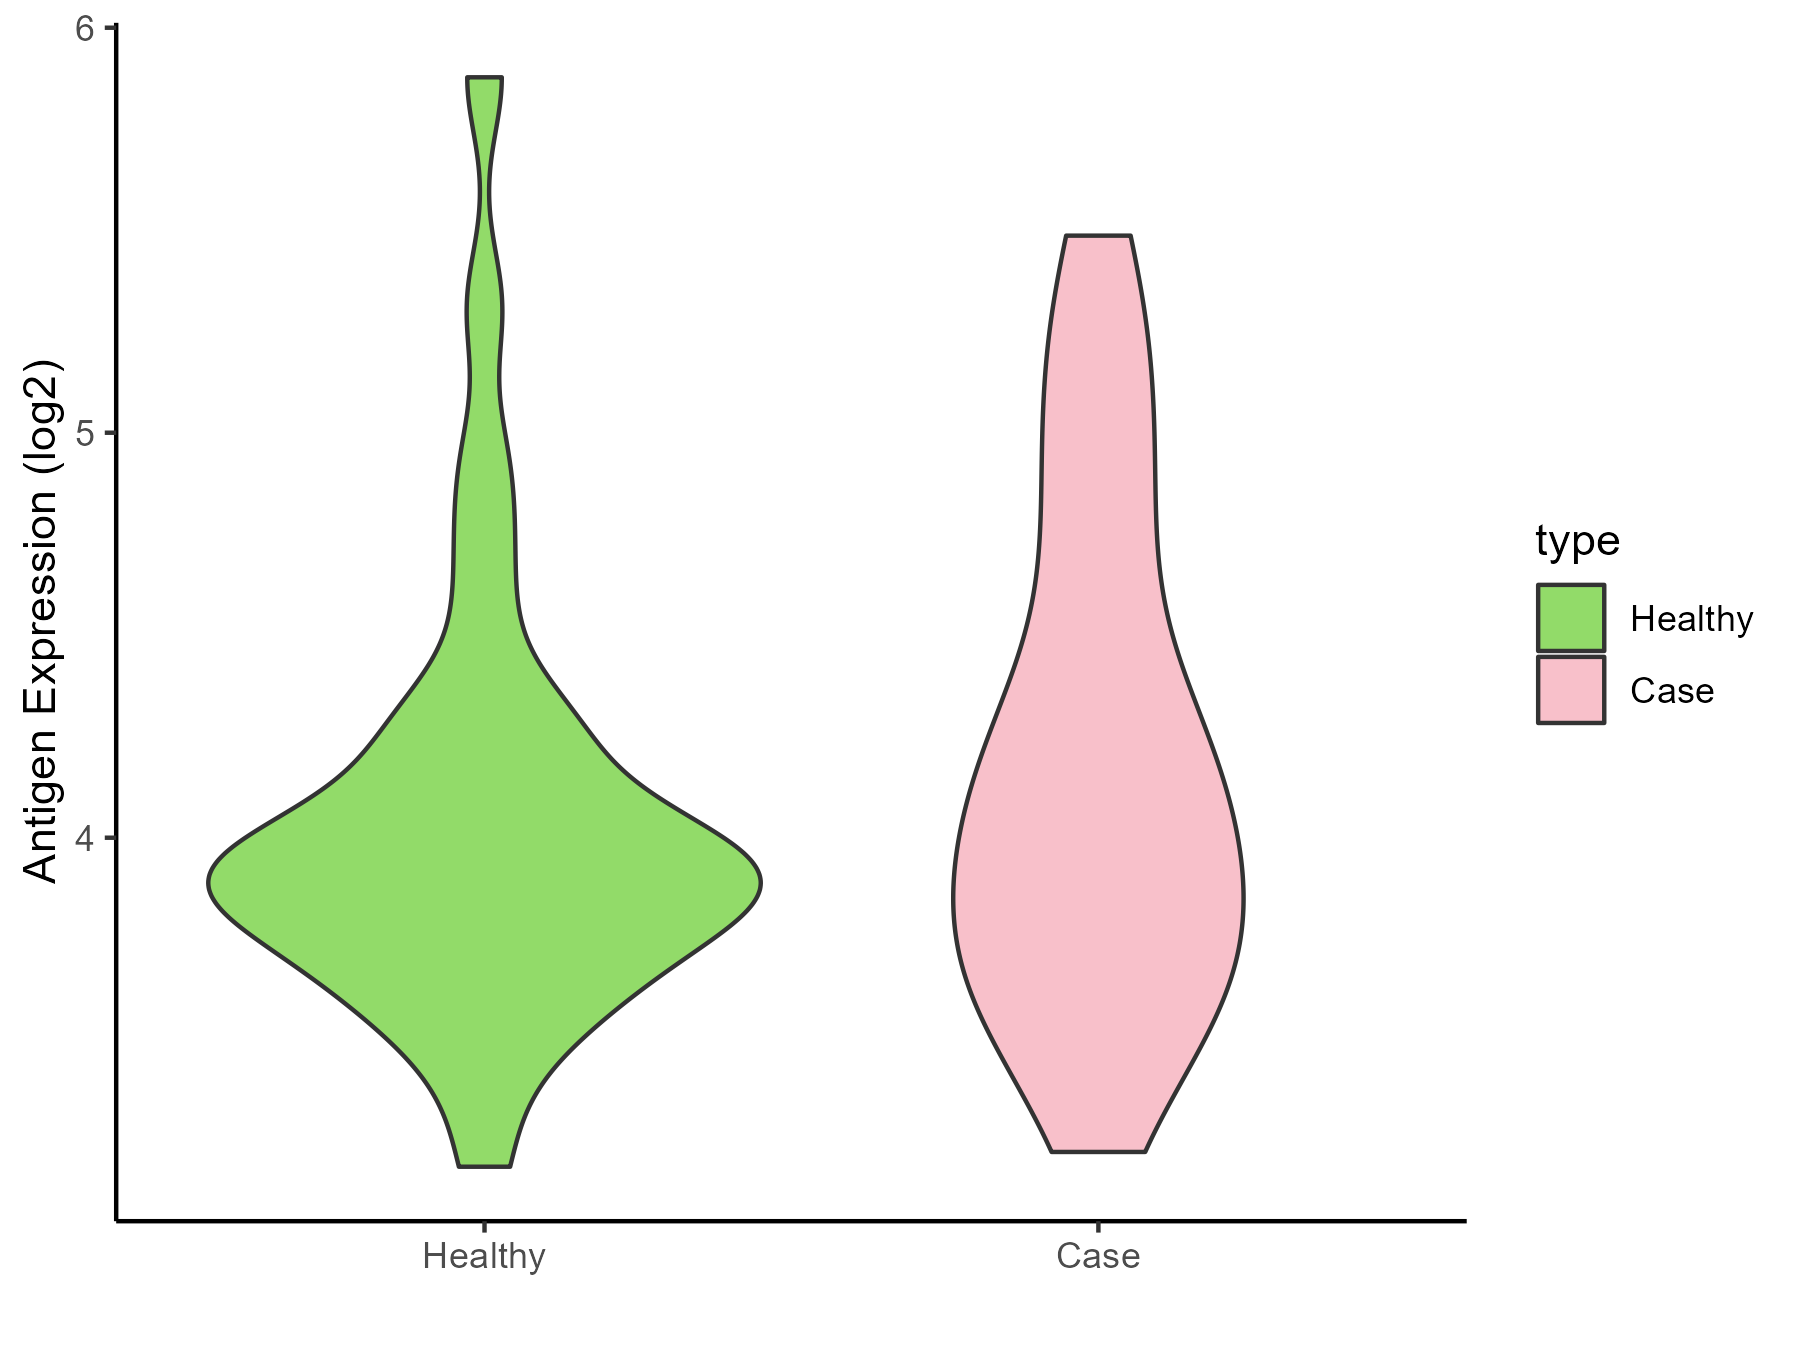
| The Studied Tissue | Whole blood | |
| The Specific Disease | Autism | |
| The Expression Level of Disease Section Compare with the Healthy Individual Tissue | p-value: 0.331850212; Fold-change: 0.158568375; Z-score: 0.300477009 | |
| Disease-specific Antigen Abundances |
|
Click to View the Clearer Original Diagram |
| Differential expression pattern of antigen in diseases | ||
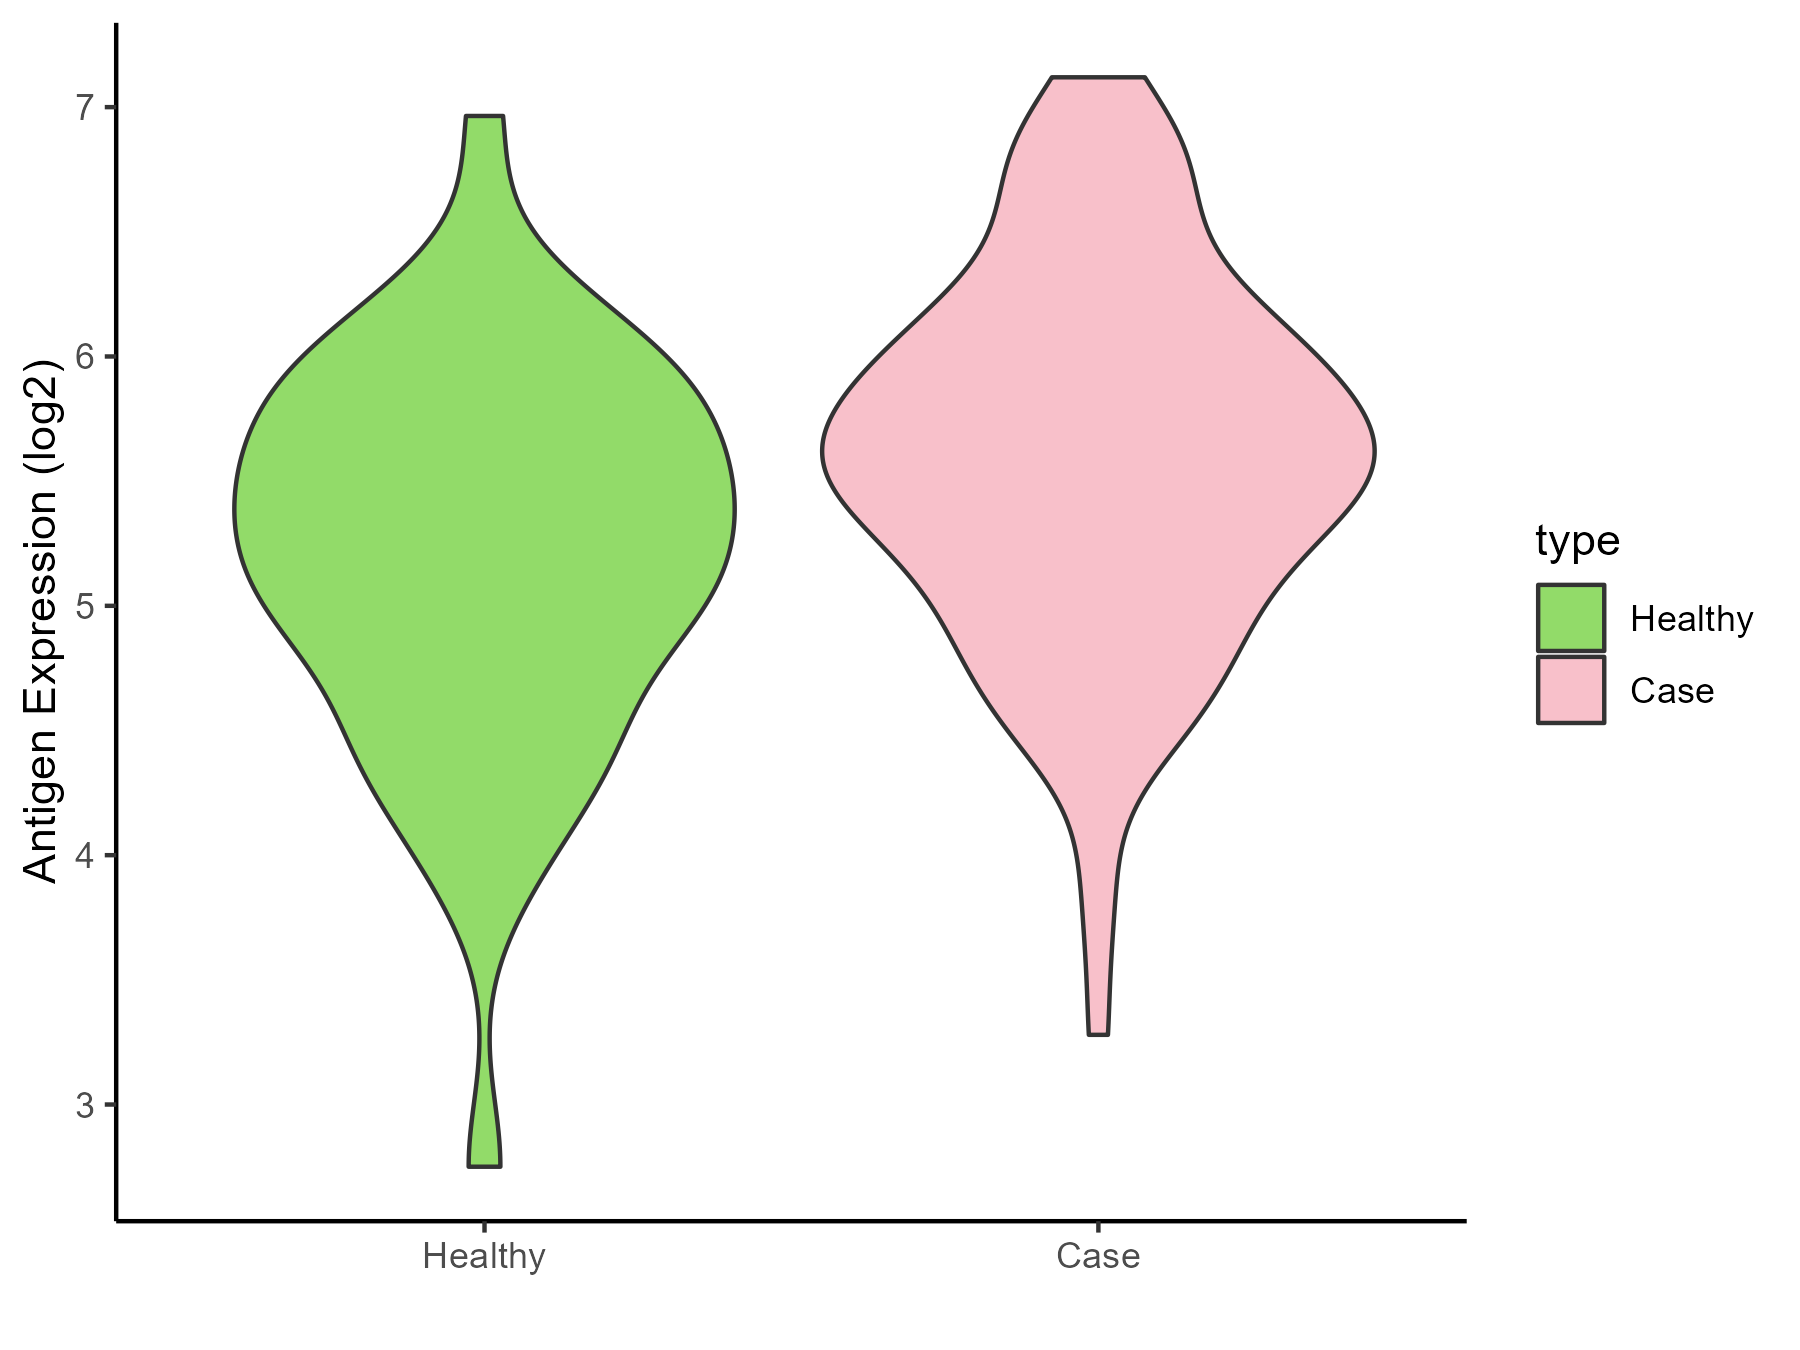
| The Studied Tissue | Whole blood | |
| The Specific Disease | Anxiety disorder | |
| The Expression Level of Disease Section Compare with the Healthy Individual Tissue | p-value: 0.009434926; Fold-change: 0.304794372; Z-score: 0.393021319 | |
| Disease-specific Antigen Abundances |
|
Click to View the Clearer Original Diagram |
ICD Disease Classification 8
| Differential expression pattern of antigen in diseases | ||
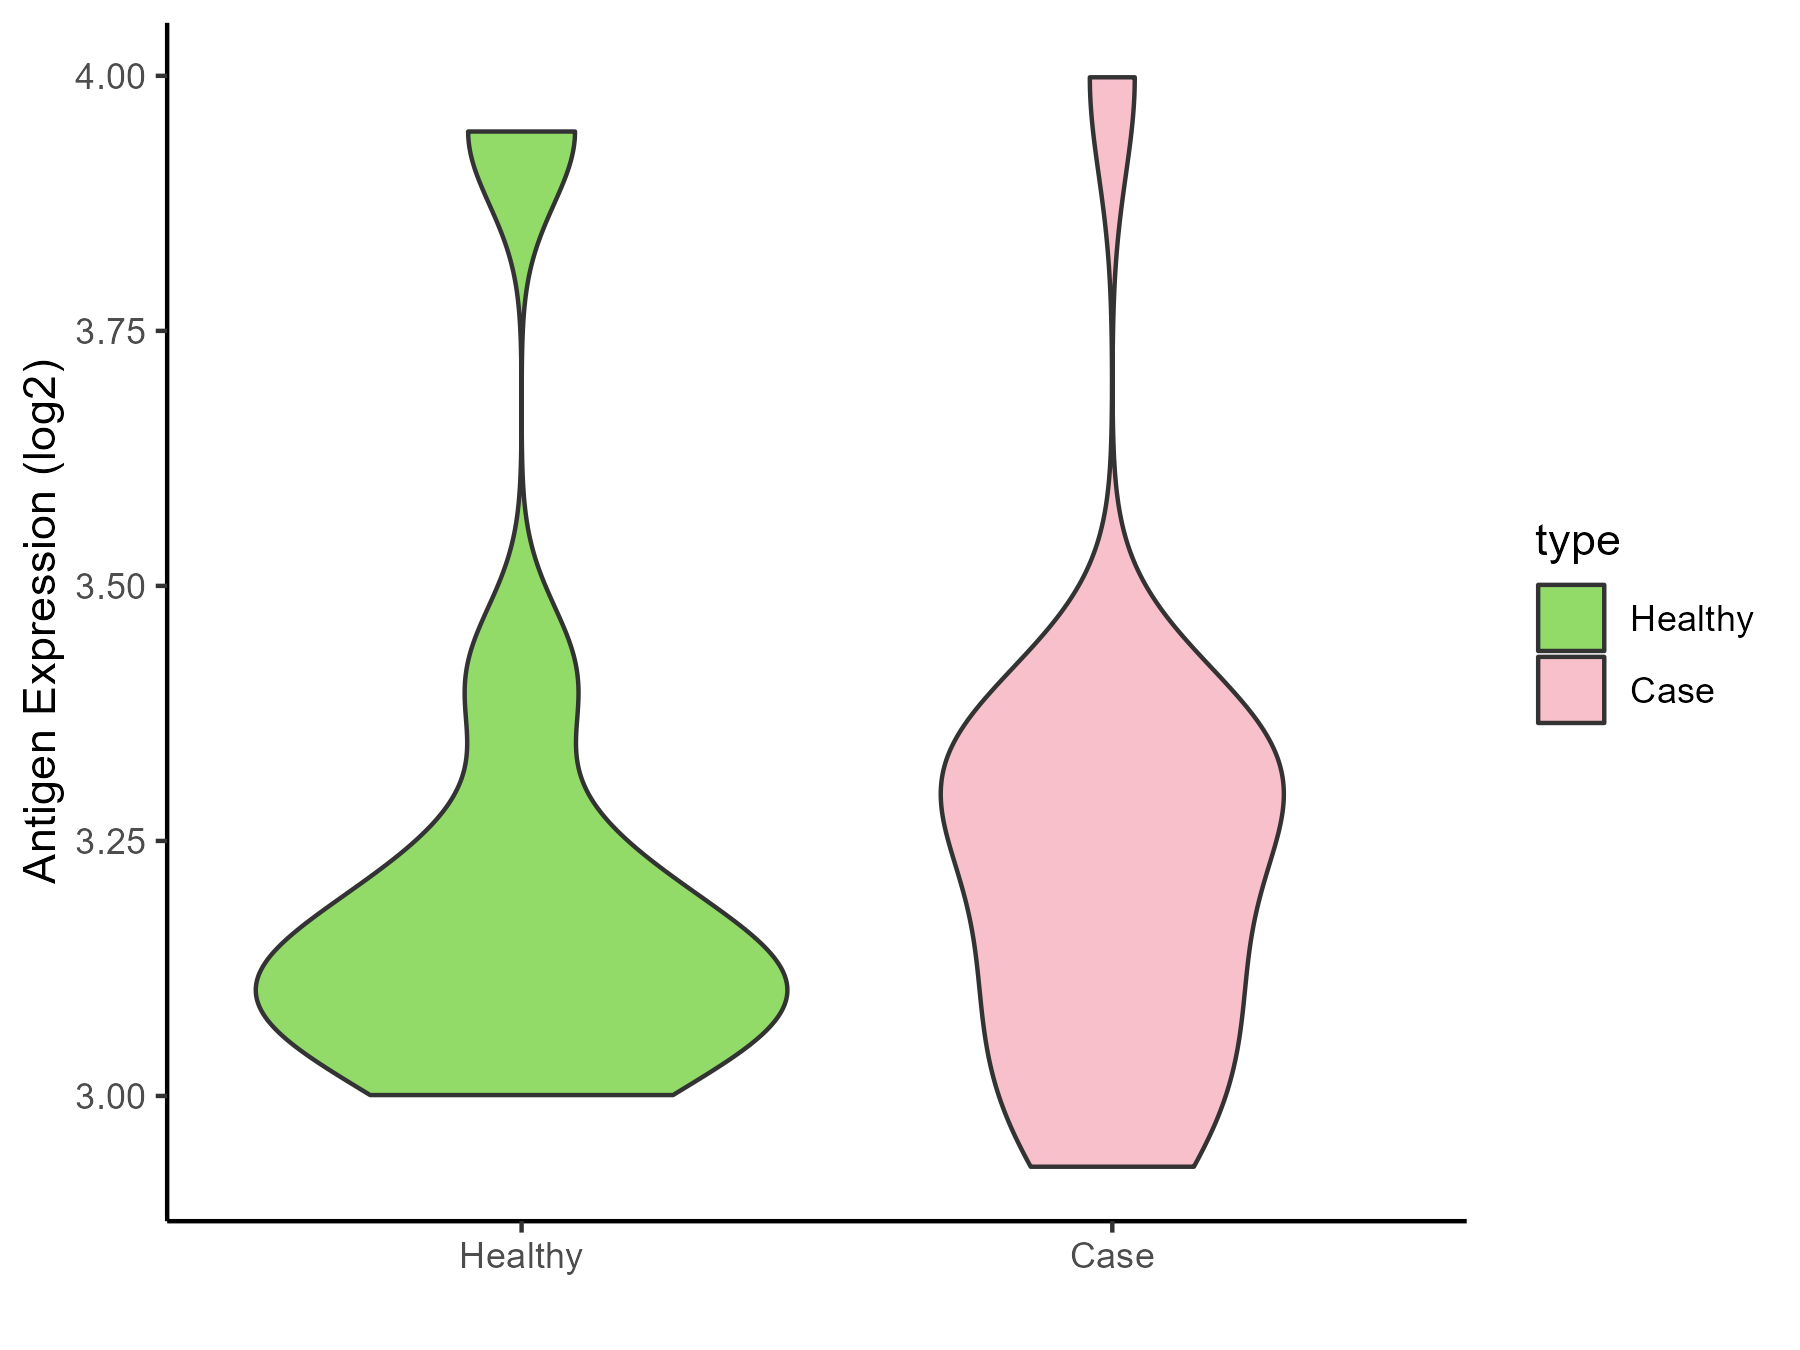
| The Studied Tissue | Substantia nigra | |
| The Specific Disease | Parkinson disease | |
| The Expression Level of Disease Section Compare with the Healthy Individual Tissue | p-value: 0.995644359; Fold-change: 0.112227984; Z-score: 0.385946265 | |
| Disease-specific Antigen Abundances |
|
Click to View the Clearer Original Diagram |
| Differential expression pattern of antigen in diseases | ||
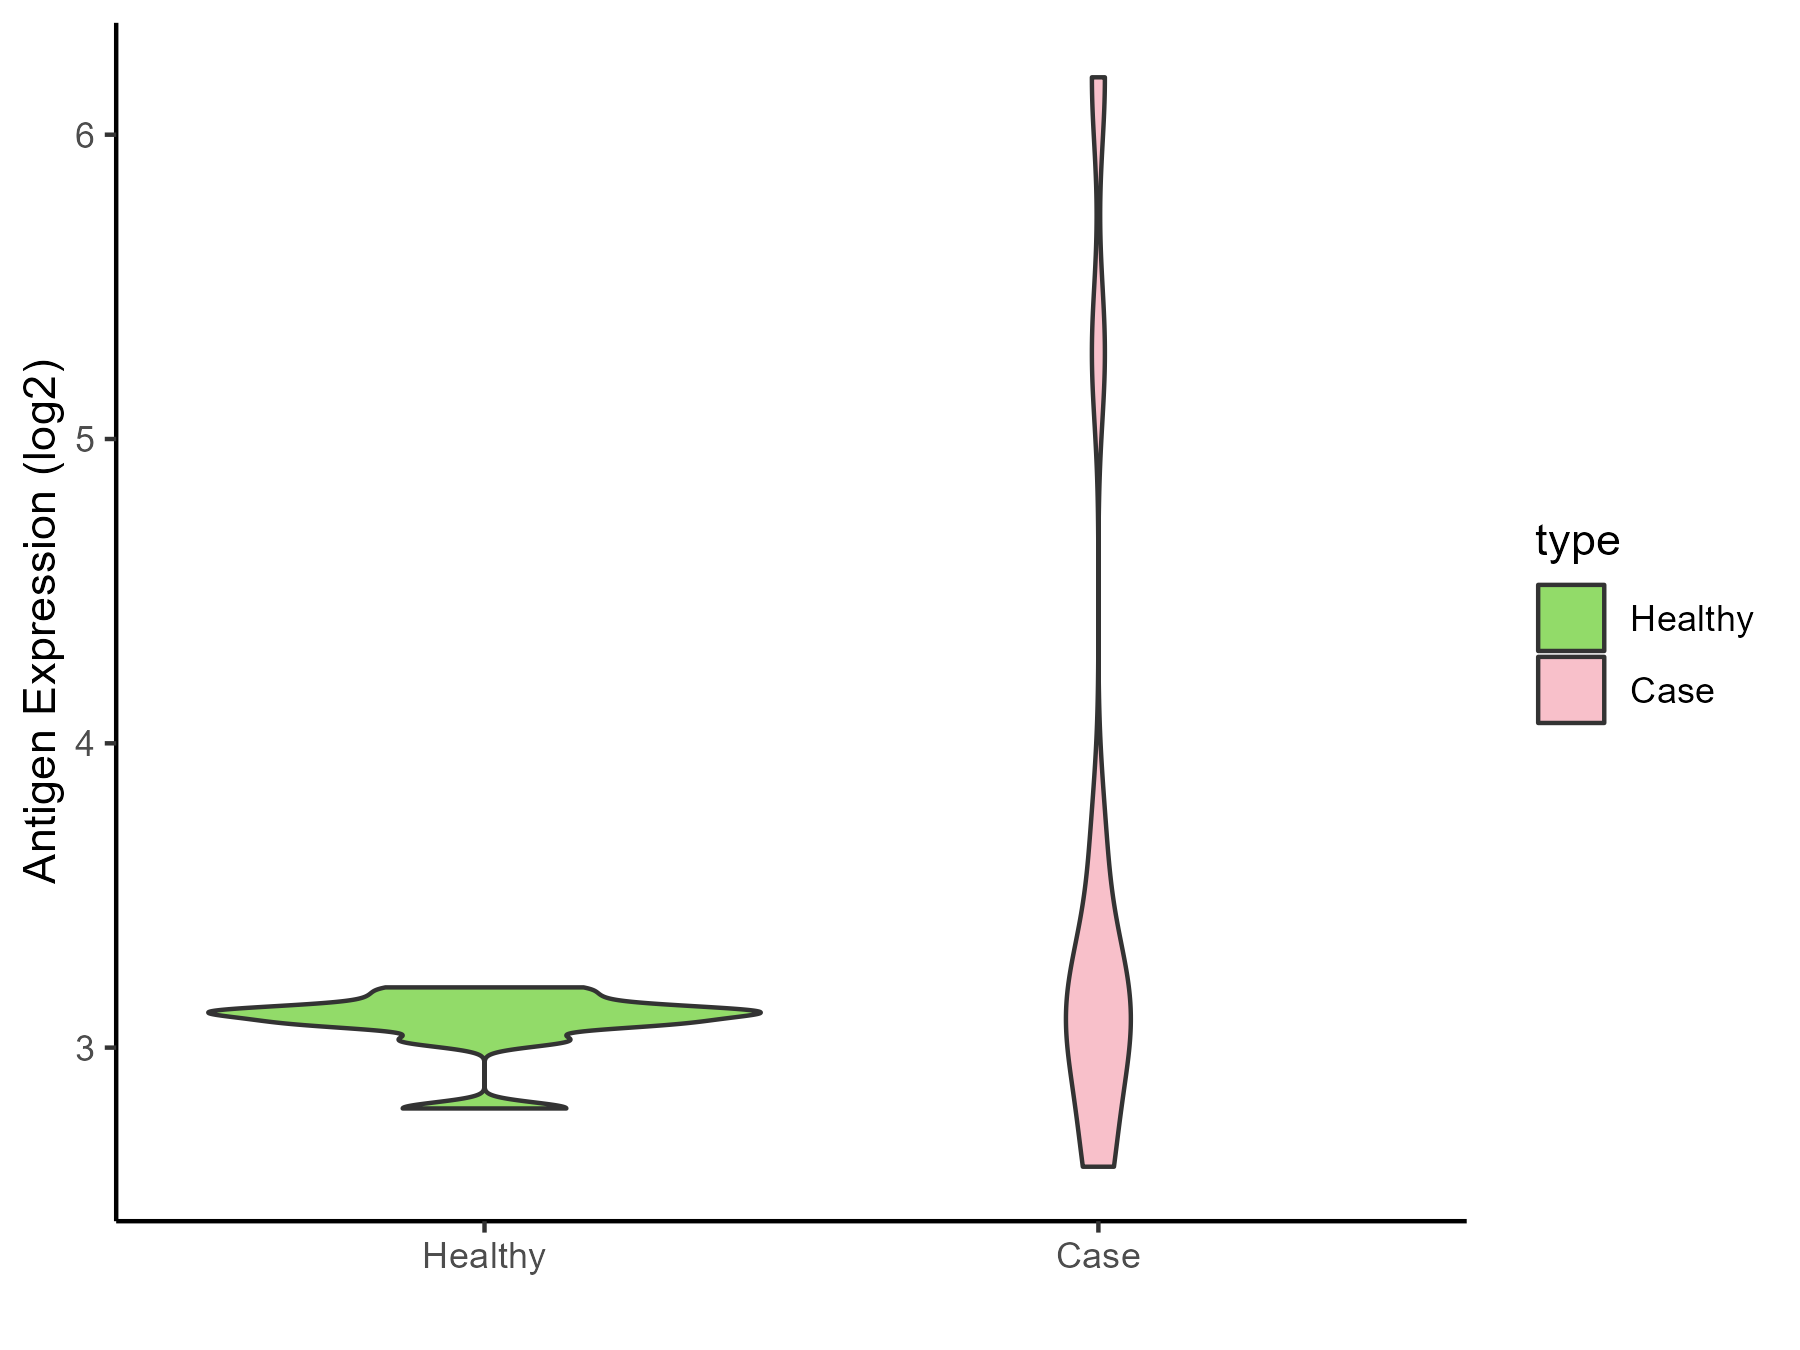
| The Studied Tissue | Whole blood | |
| The Specific Disease | Huntington disease | |
| The Expression Level of Disease Section Compare with the Healthy Individual Tissue | p-value: 0.189788779; Fold-change: 0.024960429; Z-score: 0.215895859 | |
| Disease-specific Antigen Abundances |
|
Click to View the Clearer Original Diagram |
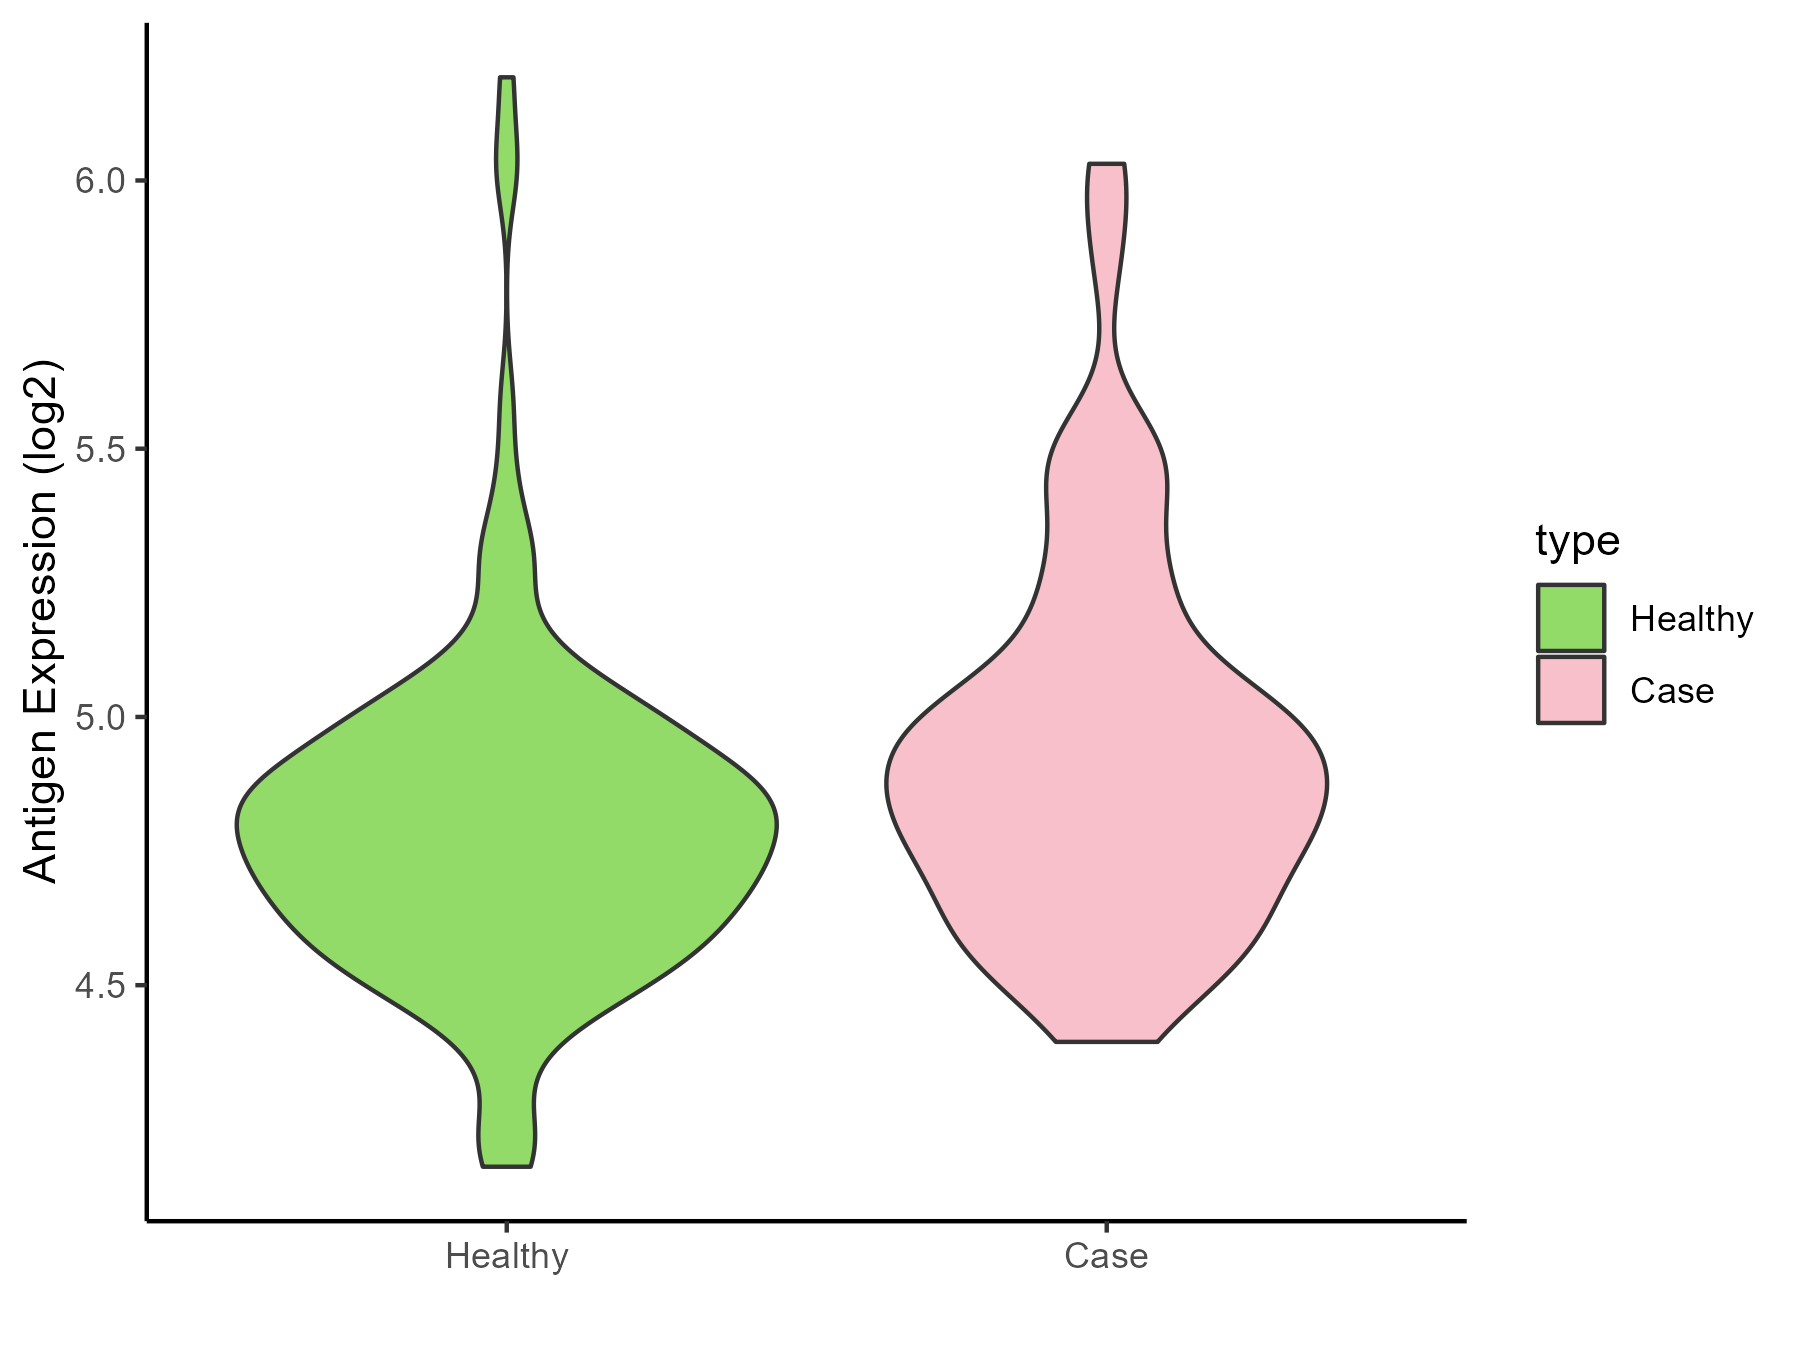
| Differential expression pattern of antigen in diseases | ||
| The Studied Tissue | Entorhinal cortex | |
| The Specific Disease | Alzheimer disease | |
| The Expression Level of Disease Section Compare with the Healthy Individual Tissue | p-value: 0.003693924; Fold-change: 0.096706707; Z-score: 0.322476624 | |
| Disease-specific Antigen Abundances |
|
Click to View the Clearer Original Diagram |
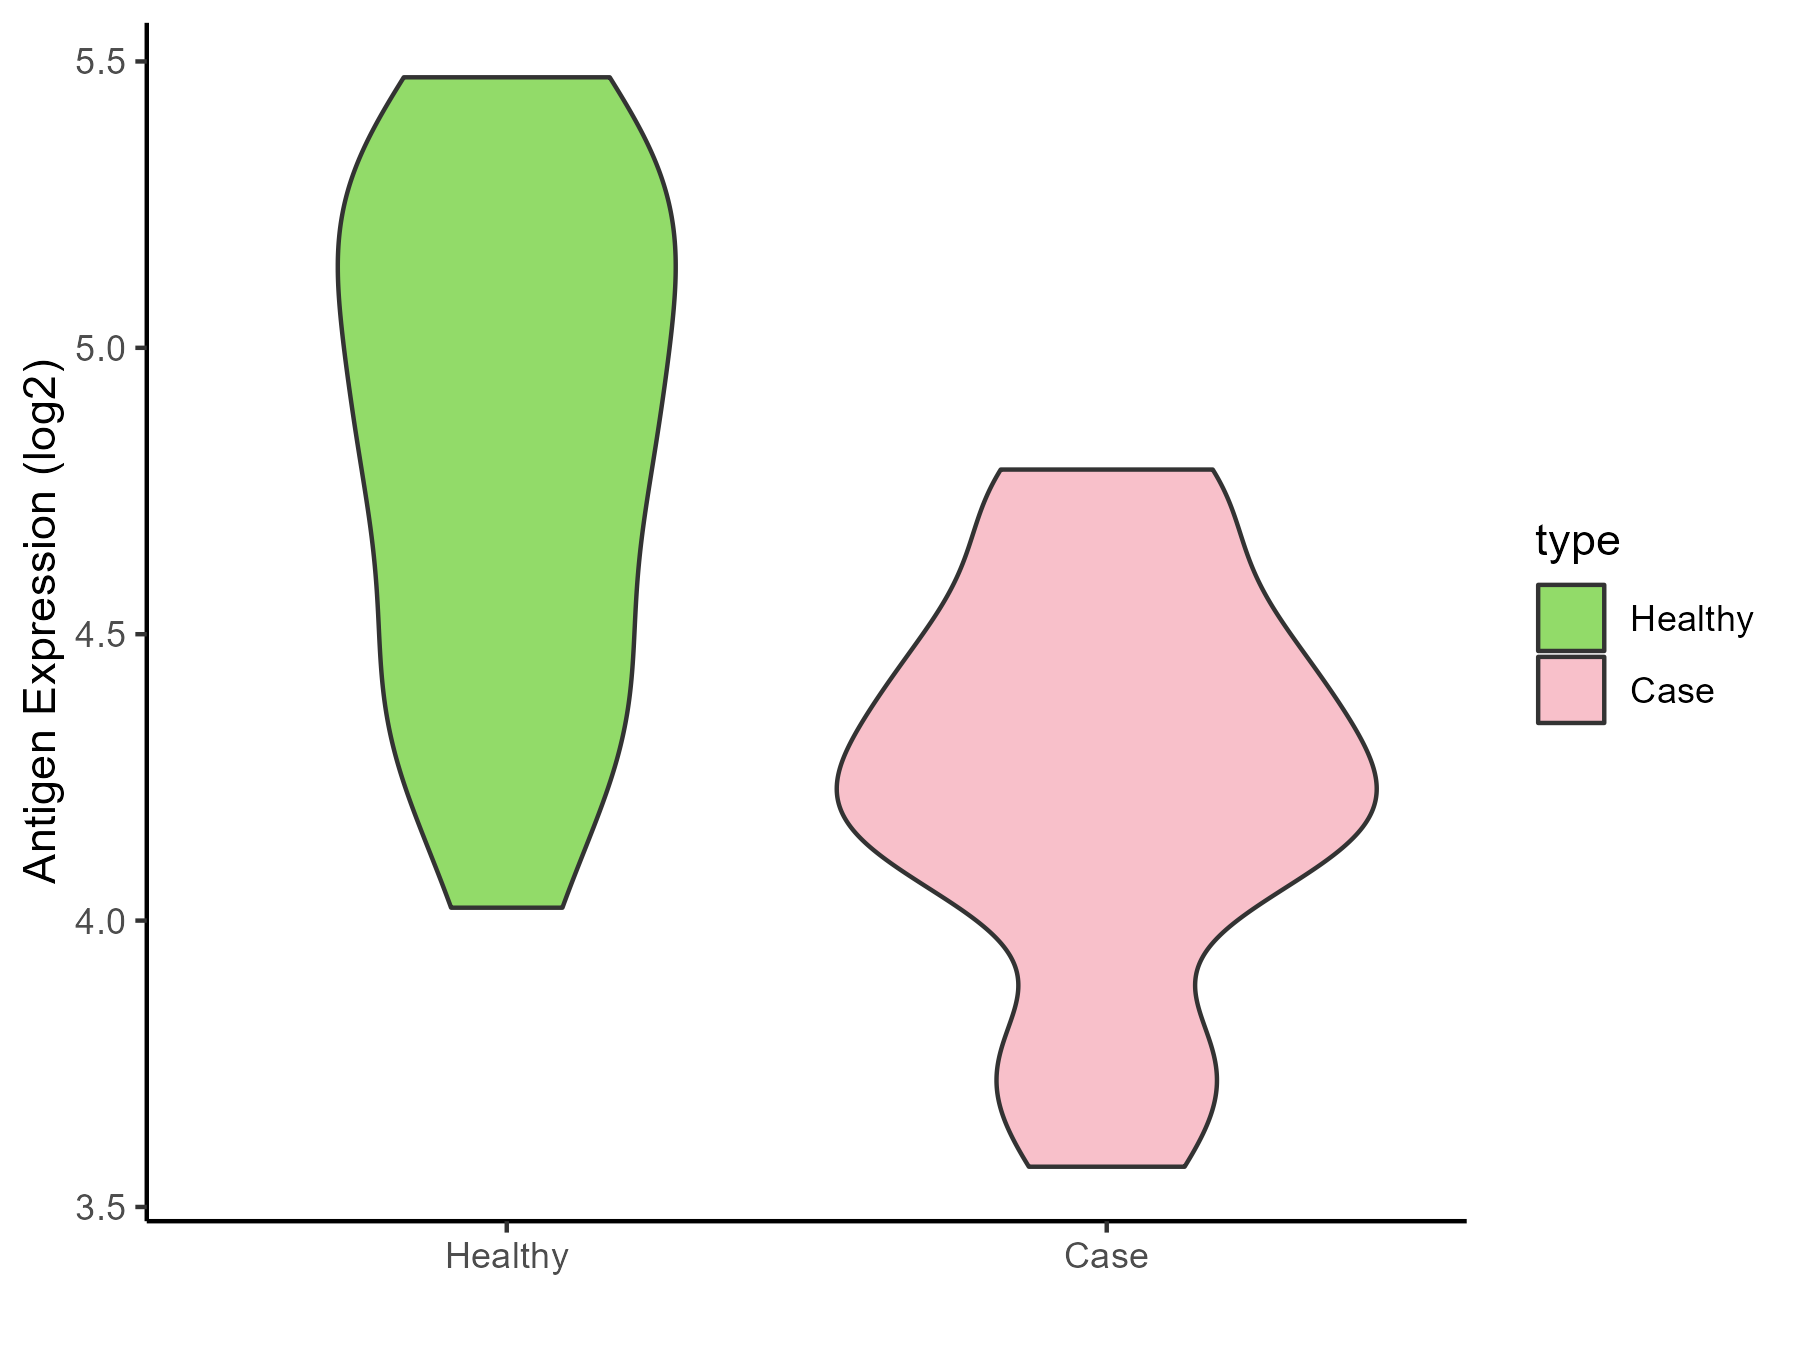
| Differential expression pattern of antigen in diseases | ||
| The Studied Tissue | Whole blood | |
| The Specific Disease | Seizure | |
| The Expression Level of Disease Section Compare with the Healthy Individual Tissue | p-value: 0.000234953; Fold-change: -0.615930899; Z-score: -1.413026875 | |
| Disease-specific Antigen Abundances |
|
Click to View the Clearer Original Diagram |
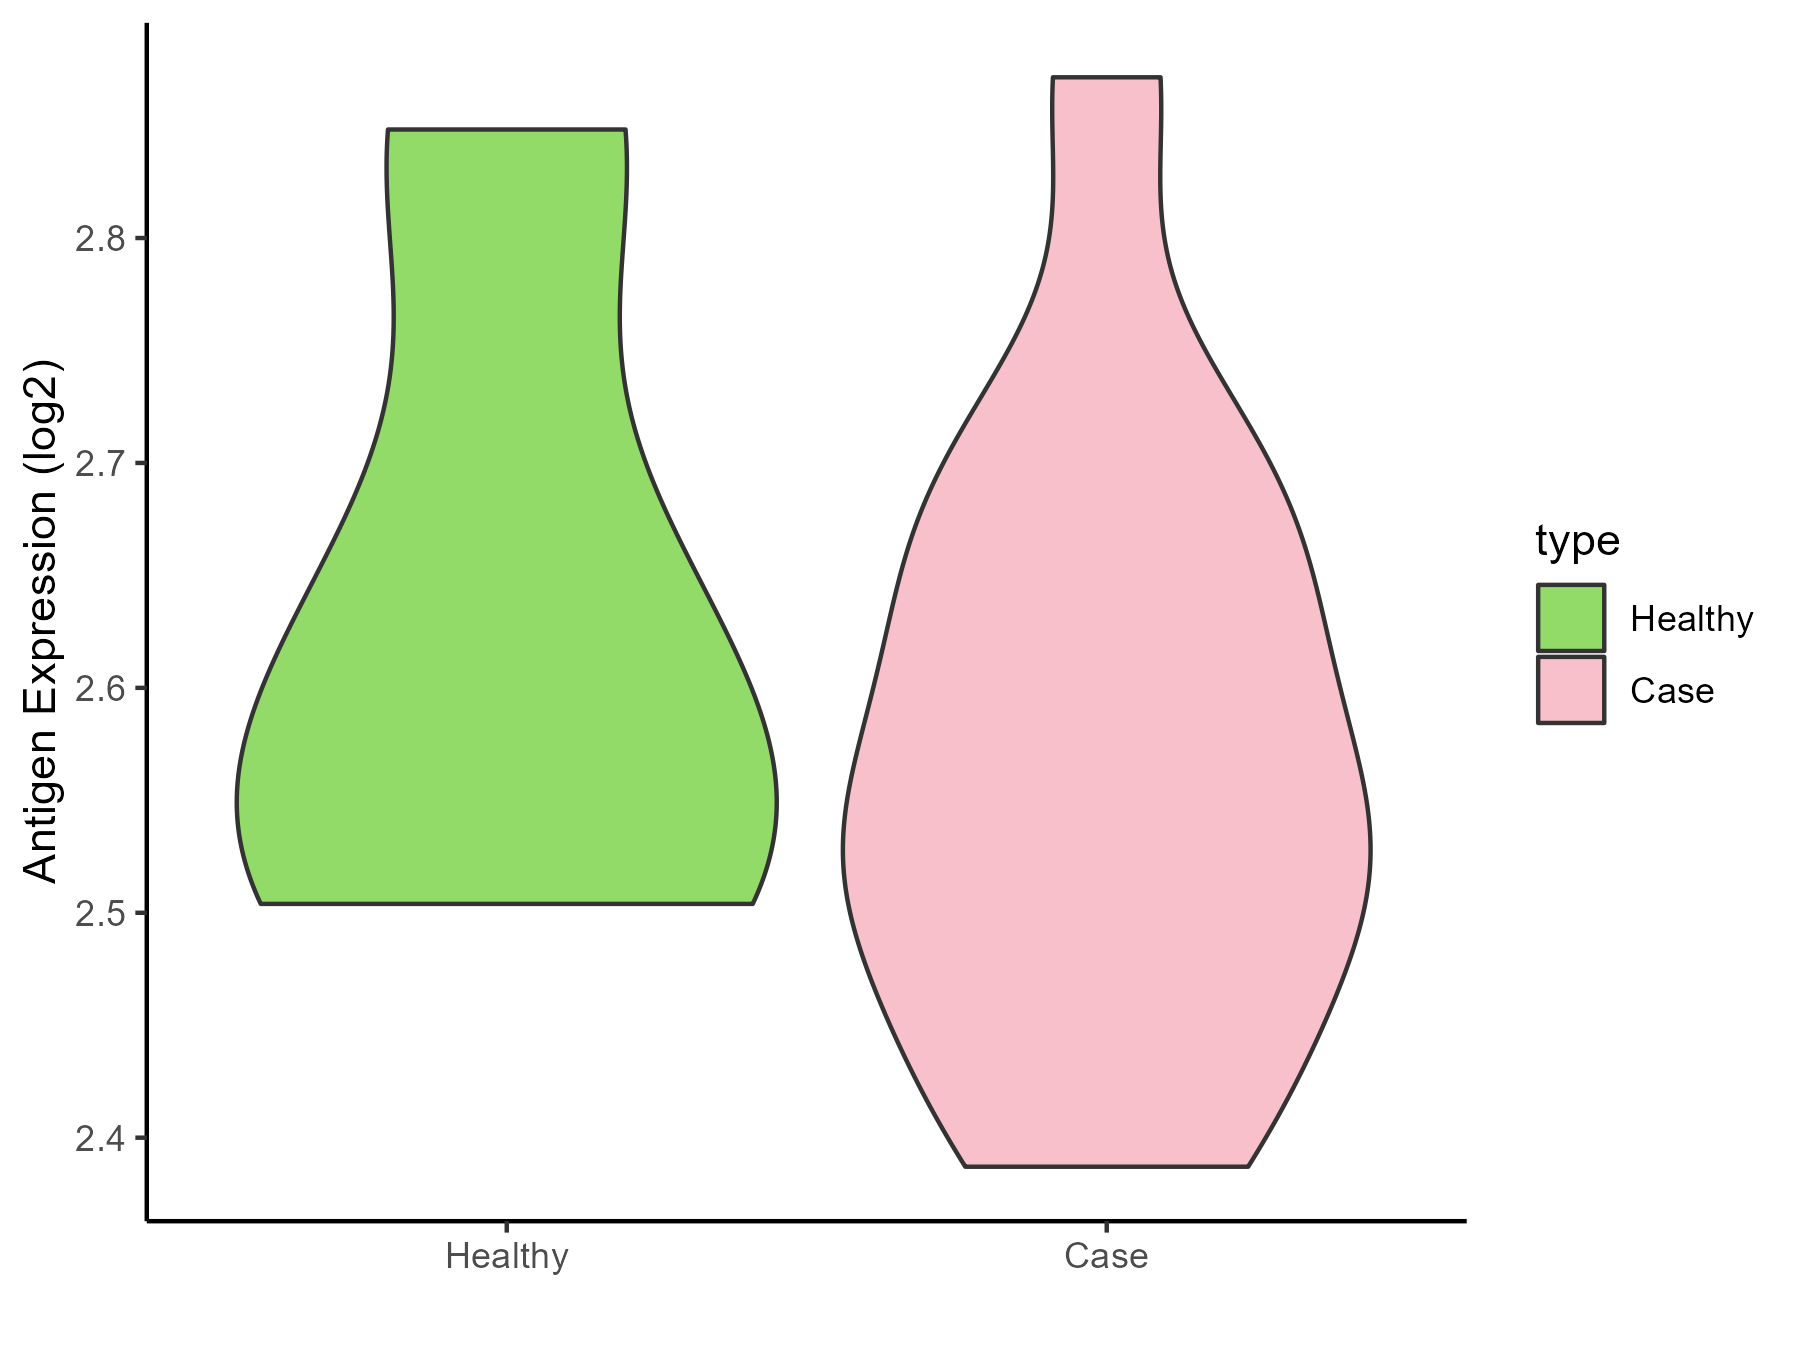
| Differential expression pattern of antigen in diseases | ||
| The Studied Tissue | Skin | |
| The Specific Disease | Lateral sclerosis | |
| The Expression Level of Disease Section Compare with the Healthy Individual Tissue | p-value: 0.545824891; Fold-change: -0.043726981; Z-score: -0.28165979 | |
| Disease-specific Antigen Abundances |
|
Click to View the Clearer Original Diagram |
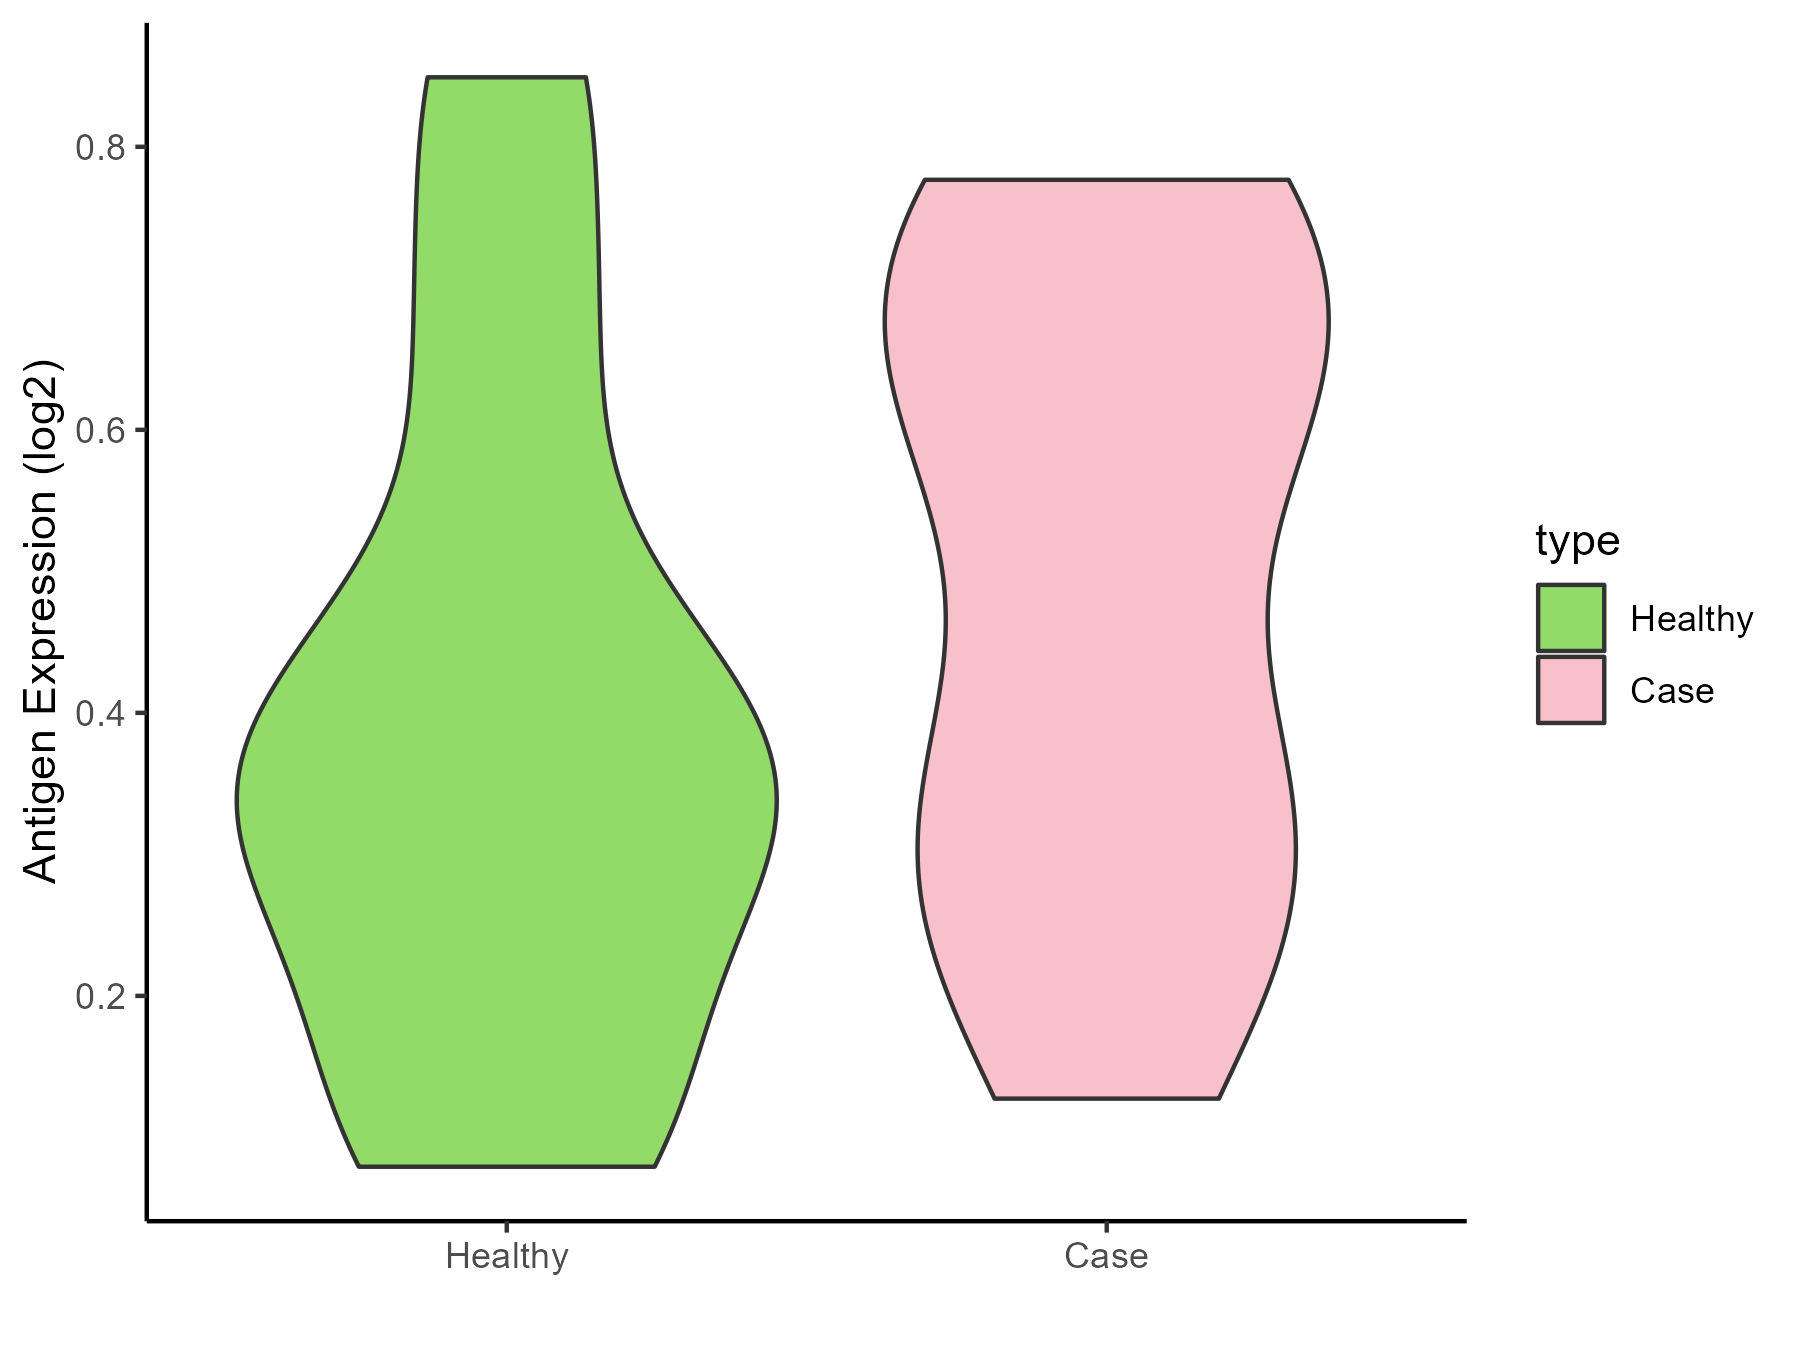
| The Studied Tissue | Cervical spinal cord | |
| The Specific Disease | Lateral sclerosis | |
| The Expression Level of Disease Section Compare with the Healthy Individual Tissue | p-value: 0.352524826; Fold-change: 0.204962197; Z-score: 0.829368394 | |
| Disease-specific Antigen Abundances |
|
Click to View the Clearer Original Diagram |
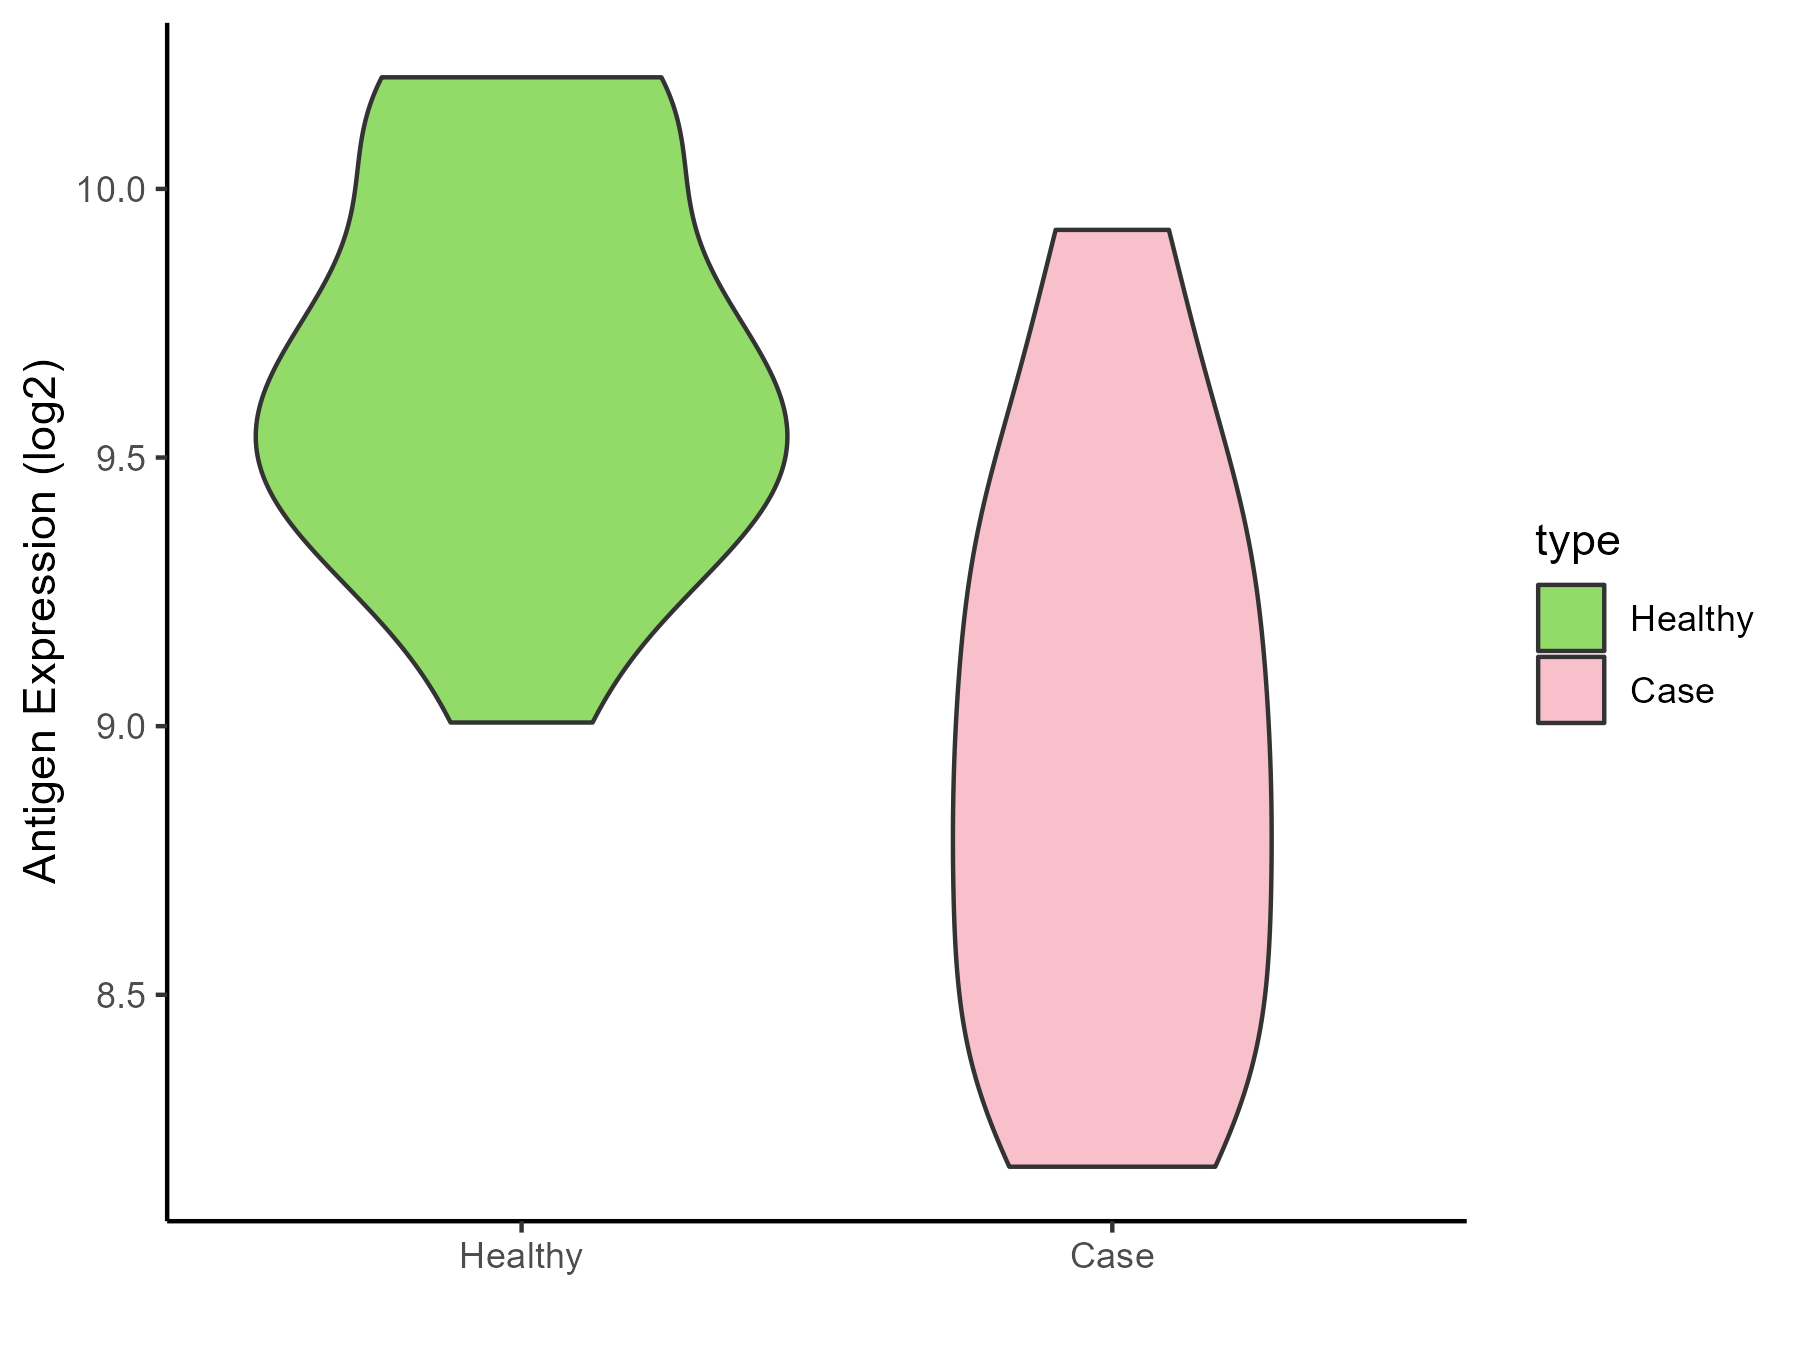
| Differential expression pattern of antigen in diseases | ||
| The Studied Tissue | Muscle | |
| The Specific Disease | Muscular atrophy | |
| The Expression Level of Disease Section Compare with the Healthy Individual Tissue | p-value: 0.000152401; Fold-change: -0.76985762; Z-score: -2.10816836 | |
| Disease-specific Antigen Abundances |
|
Click to View the Clearer Original Diagram |
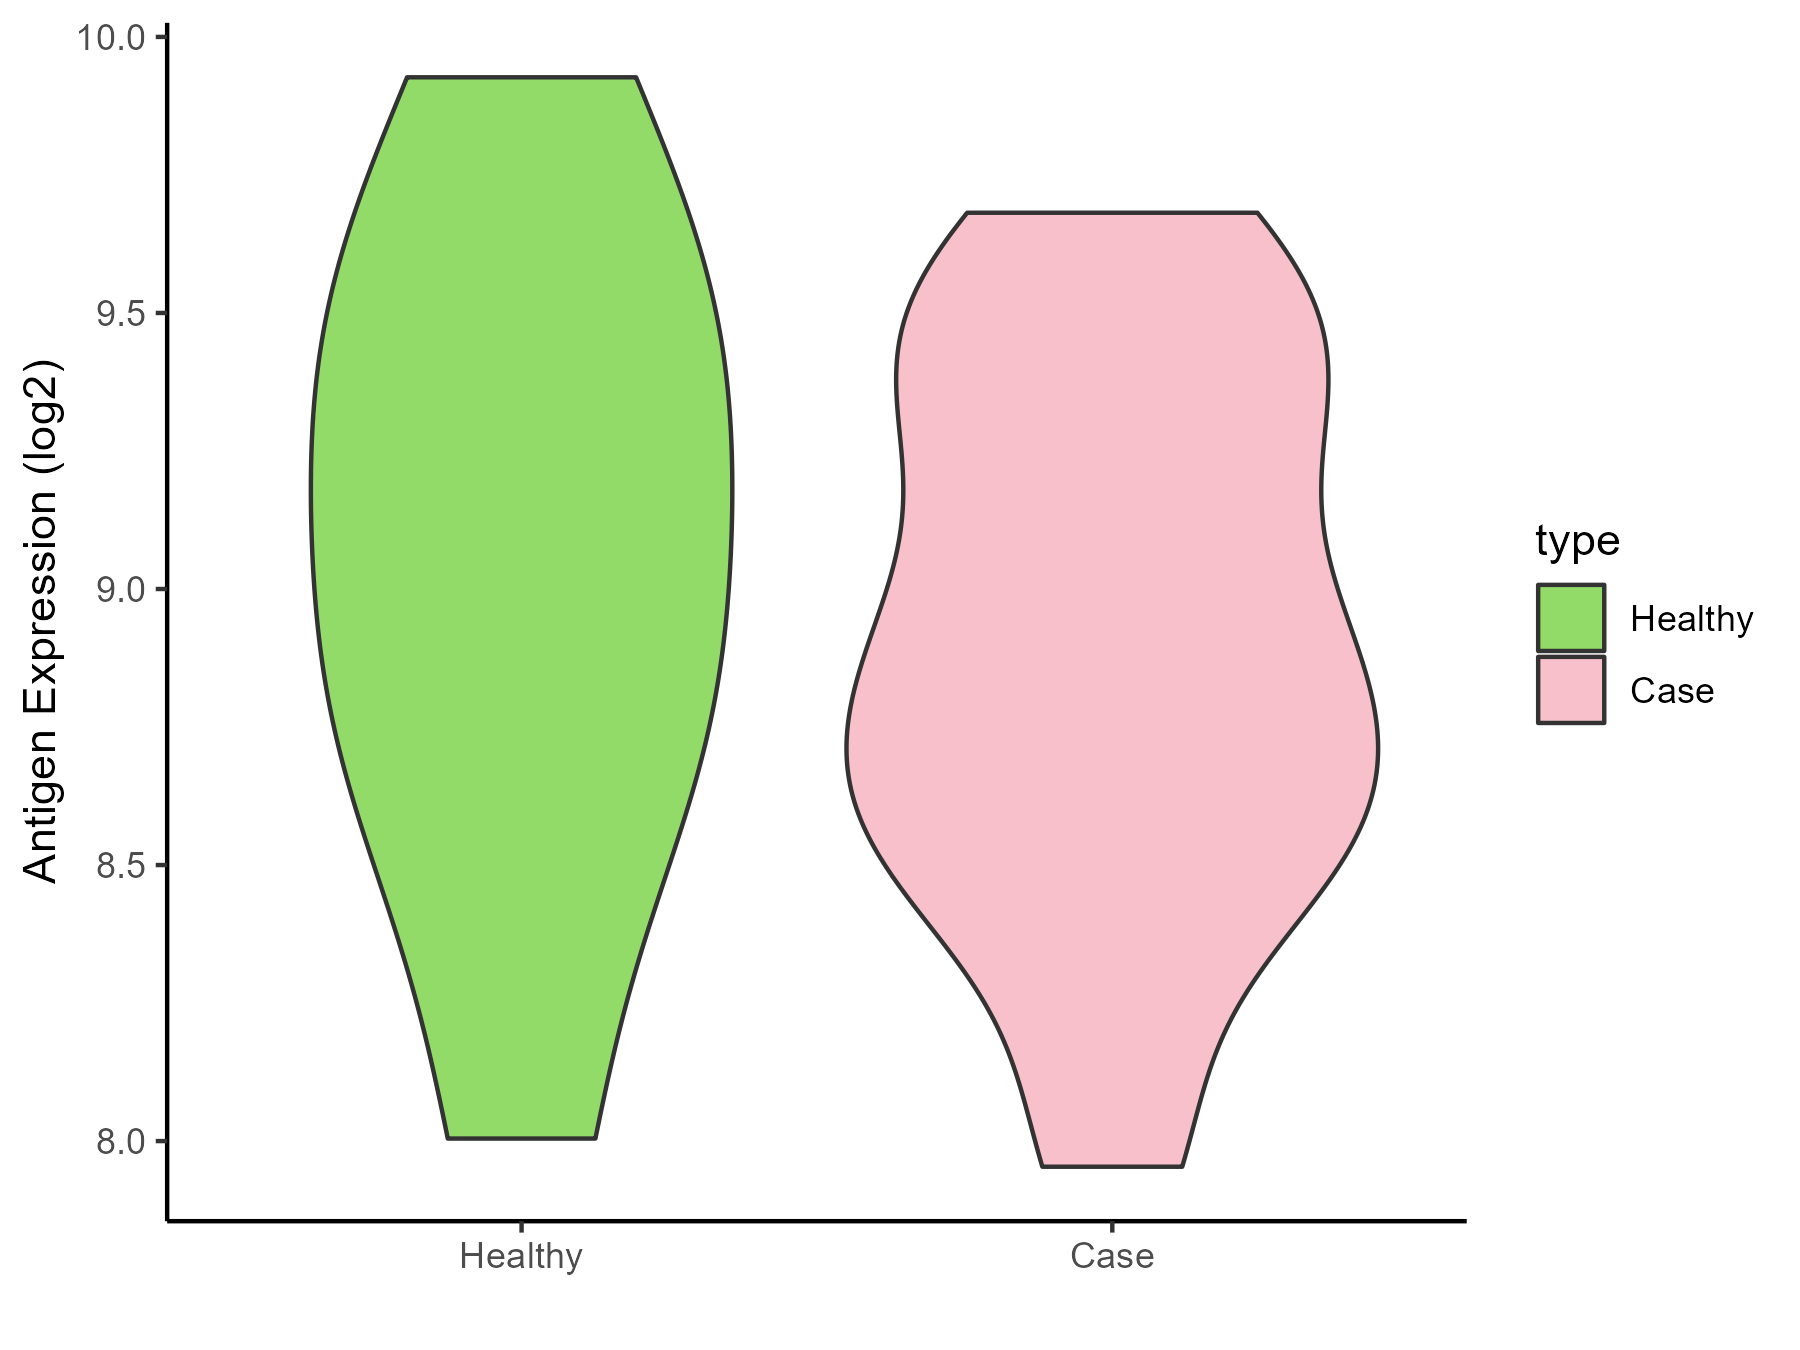
| Differential expression pattern of antigen in diseases | ||
| The Studied Tissue | Muscle | |
| The Specific Disease | Myopathy | |
| The Expression Level of Disease Section Compare with the Healthy Individual Tissue | p-value: 0.5534423; Fold-change: -0.244311631; Z-score: -0.400714496 | |
| Disease-specific Antigen Abundances |
|
Click to View the Clearer Original Diagram |
References
