
Antigen Information
General Information of This Antigen
| Antigen ID | TAR0HECUK |
|||||
|---|---|---|---|---|---|---|
| Antigen Name | Tumor-associated calcium signal transducer 2 (TROP2); Epidermal growth factor receptor (EGFR) |
|||||
| Gene Name | TACSTD2; EGFR |
|||||
| Gene ID | ||||||
| Synonym1 | GA733-1, M1S1, TROP2 |
|||||
| Synonym2 | ERBB, ERBB1, HER1 |
|||||
| Sequence1 |
MARGPGLAPPPLRLPLLLLVLAAVTGHTAAQDNCTCPTNKMTVCSPDGPGGRCQCRALGS
GMAVDCSTLTSKCLLLKARMSAPKNARTLVRPSEHALVDNDGLYDPDCDPEGRFKARQCN QTSVCWCVNSVGVRRTDKGDLSLRCDELVRTHHILIDLRHRPTAGAFNHSDLDAELRRLF RERYRLHPKFVAAVHYEQPTIQIELRQNTSQKAAGDVDIGDAAYYFERDIKGESLFQGRG GLDLRVRGEPLQVERTLIYYLDEIPPKFSMKRLTAGLIAVIVVVVVALVAGMAVLVITNR RKSGKYKKVEIKELGELRKEPSL Click to Show/Hide
|
|||||
| Sequence2 |
MRPSGTAGAALLALLAALCPASRALEEKKVCQGTSNKLTQLGTFEDHFLSLQRMFNNCEV
VLGNLEITYVQRNYDLSFLKTIQEVAGYVLIALNTVERIPLENLQIIRGNMYYENSYALA VLSNYDANKTGLKELPMRNLQEILHGAVRFSNNPALCNVESIQWRDIVSSDFLSNMSMDF QNHLGSCQKCDPSCPNGSCWGAGEENCQKLTKIICAQQCSGRCRGKSPSDCCHNQCAAGC TGPRESDCLVCRKFRDEATCKDTCPPLMLYNPTTYQMDVNPEGKYSFGATCVKKCPRNYV VTDHGSCVRACGADSYEMEEDGVRKCKKCEGPCRKVCNGIGIGEFKDSLSINATNIKHFK NCTSISGDLHILPVAFRGDSFTHTPPLDPQELDILKTVKEITGFLLIQAWPENRTDLHAF ENLEIIRGRTKQHGQFSLAVVSLNITSLGLRSLKEISDGDVIISGNKNLCYANTINWKKL FGTSGQKTKIISNRGENSCKATGQVCHALCSPEGCWGPEPRDCVSCRNVSRGRECVDKCN LLEGEPREFVENSECIQCHPECLPQAMNITCTGRGPDNCIQCAHYIDGPHCVKTCPAGVM GENNTLVWKYADAGHVCHLCHPNCTYGCTGPGLEGCPTNGPKIPSIATGMVGALLLLLVV ALGIGLFMRRRHIVRKRTLRRLLQERELVEPLTPSGEAPNQALLRILKETEFKKIKVLGS GAFGTVYKGLWIPEGEKVKIPVAIKELREATSPKANKEILDEAYVMASVDNPHVCRLLGI CLTSTVQLITQLMPFGCLLDYVREHKDNIGSQYLLNWCVQIAKGMNYLEDRRLVHRDLAA RNVLVKTPQHVKITDFGLAKLLGAEEKEYHAEGGKVPIKWMALESILHRIYTHQSDVWSY GVTVWELMTFGSKPYDGIPASEISSILEKGERLPQPPICTIDVYMIMVKCWMIDADSRPK FRELIIEFSKMARDPQRYLVIQGDERMHLPSPTDSNFYRALMDEEDMDDVVDADEYLIPQ QGFFSSPSTSRTPLLSSLSATSNNSTVACIDRNGLQSCPIKEDSFLQRYSSDPTGALTED SIDDTFLPVPEYINQSVPKRPAGSVQNPVYHNQPLNPAPSRDPHYQDPHSTAVGNPEYLN TVQPTCVNSTFDSPAHWAQKGSHQISLDNPDYQQDFFPKEAKPNGIFKGSTAENAEYLRV APQSSEFIGA Click to Show/Hide
|
|||||
| Family1 | EPCAM family |
|||||
| Family2 | Tyr protein kinase family |
|||||
| Function1 |
May function as a growth factor receptor.
Click to Show/Hide
|
|||||
| Function2 |
Receptor tyrosine kinase binding ligands of the EGF family and activating several signaling cascades to convert extracellular cues into appropriate cellular responses. Known ligands include EGF, TGFA/TGF-alpha, AREG, epigen/EPGN, BTC/betacellulin, epiregulin/EREG and HBEGF/heparin- binding EGF. Ligand binding triggers receptor homo- and/or heterodimerization and autophosphorylation on key cytoplasmic residues. The phosphorylated receptor recruits adapter proteins like GRB2 which in turn activates complex downstream signaling cascades. Activates at least 4 major downstream signaling cascades including the RAS-RAF-MEK-ERK, PI3 kinase-AKT, PLCgamma-PKC and STATs modules. May also activate the NF-kappa-B signaling cascade. Also directly phosphorylates other proteins like RGS16, activating its GTPase activity and probably coupling the EGF receptor signaling to the G protein-coupled receptor signaling. Also phosphorylates MUC1 and increases its interaction with SRC and CTNNB1/beta-catenin. Positively regulates cell migration via interaction with CCDC88A/GIV which retains EGFR at the cell membrane following ligand stimulation, promoting EGFR signaling which triggers cell migration. Plays a role in enhancing learning and memory performance. Plays a role in mammalian pain signaling (long-lasting hypersensitivity).
Click to Show/Hide
|
|||||
| Uniprot Entry | ||||||
| HGNC ID | ||||||
| KEGG ID | ||||||
Each Antibody-drug Conjuate AND It's Component Related to This Antigen
Full List of The ADC Related to This Antigen
Tissue/Disease specific Abundances of This Antigen
Tissue specific Abundances of This Antigen
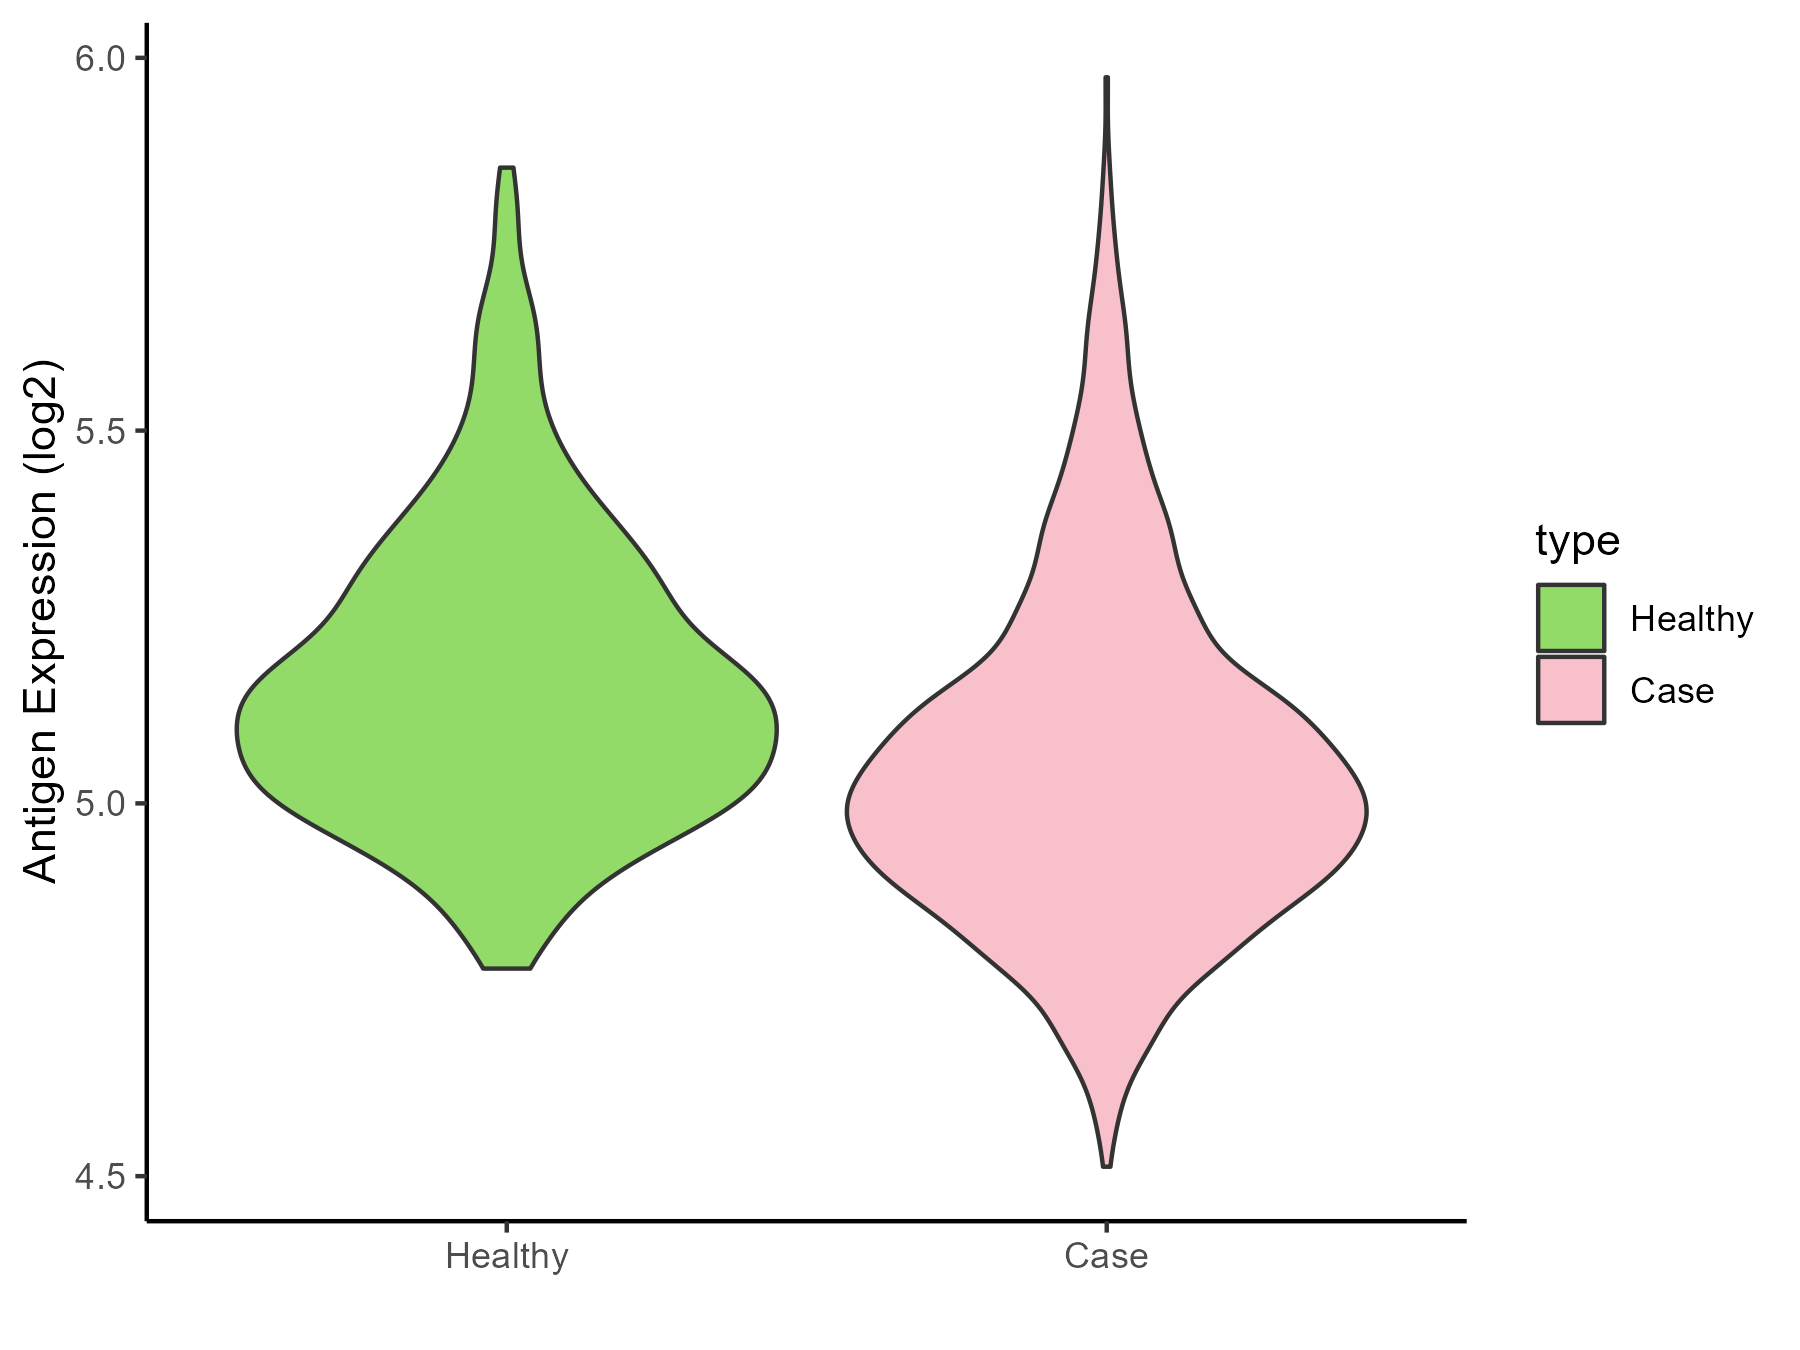
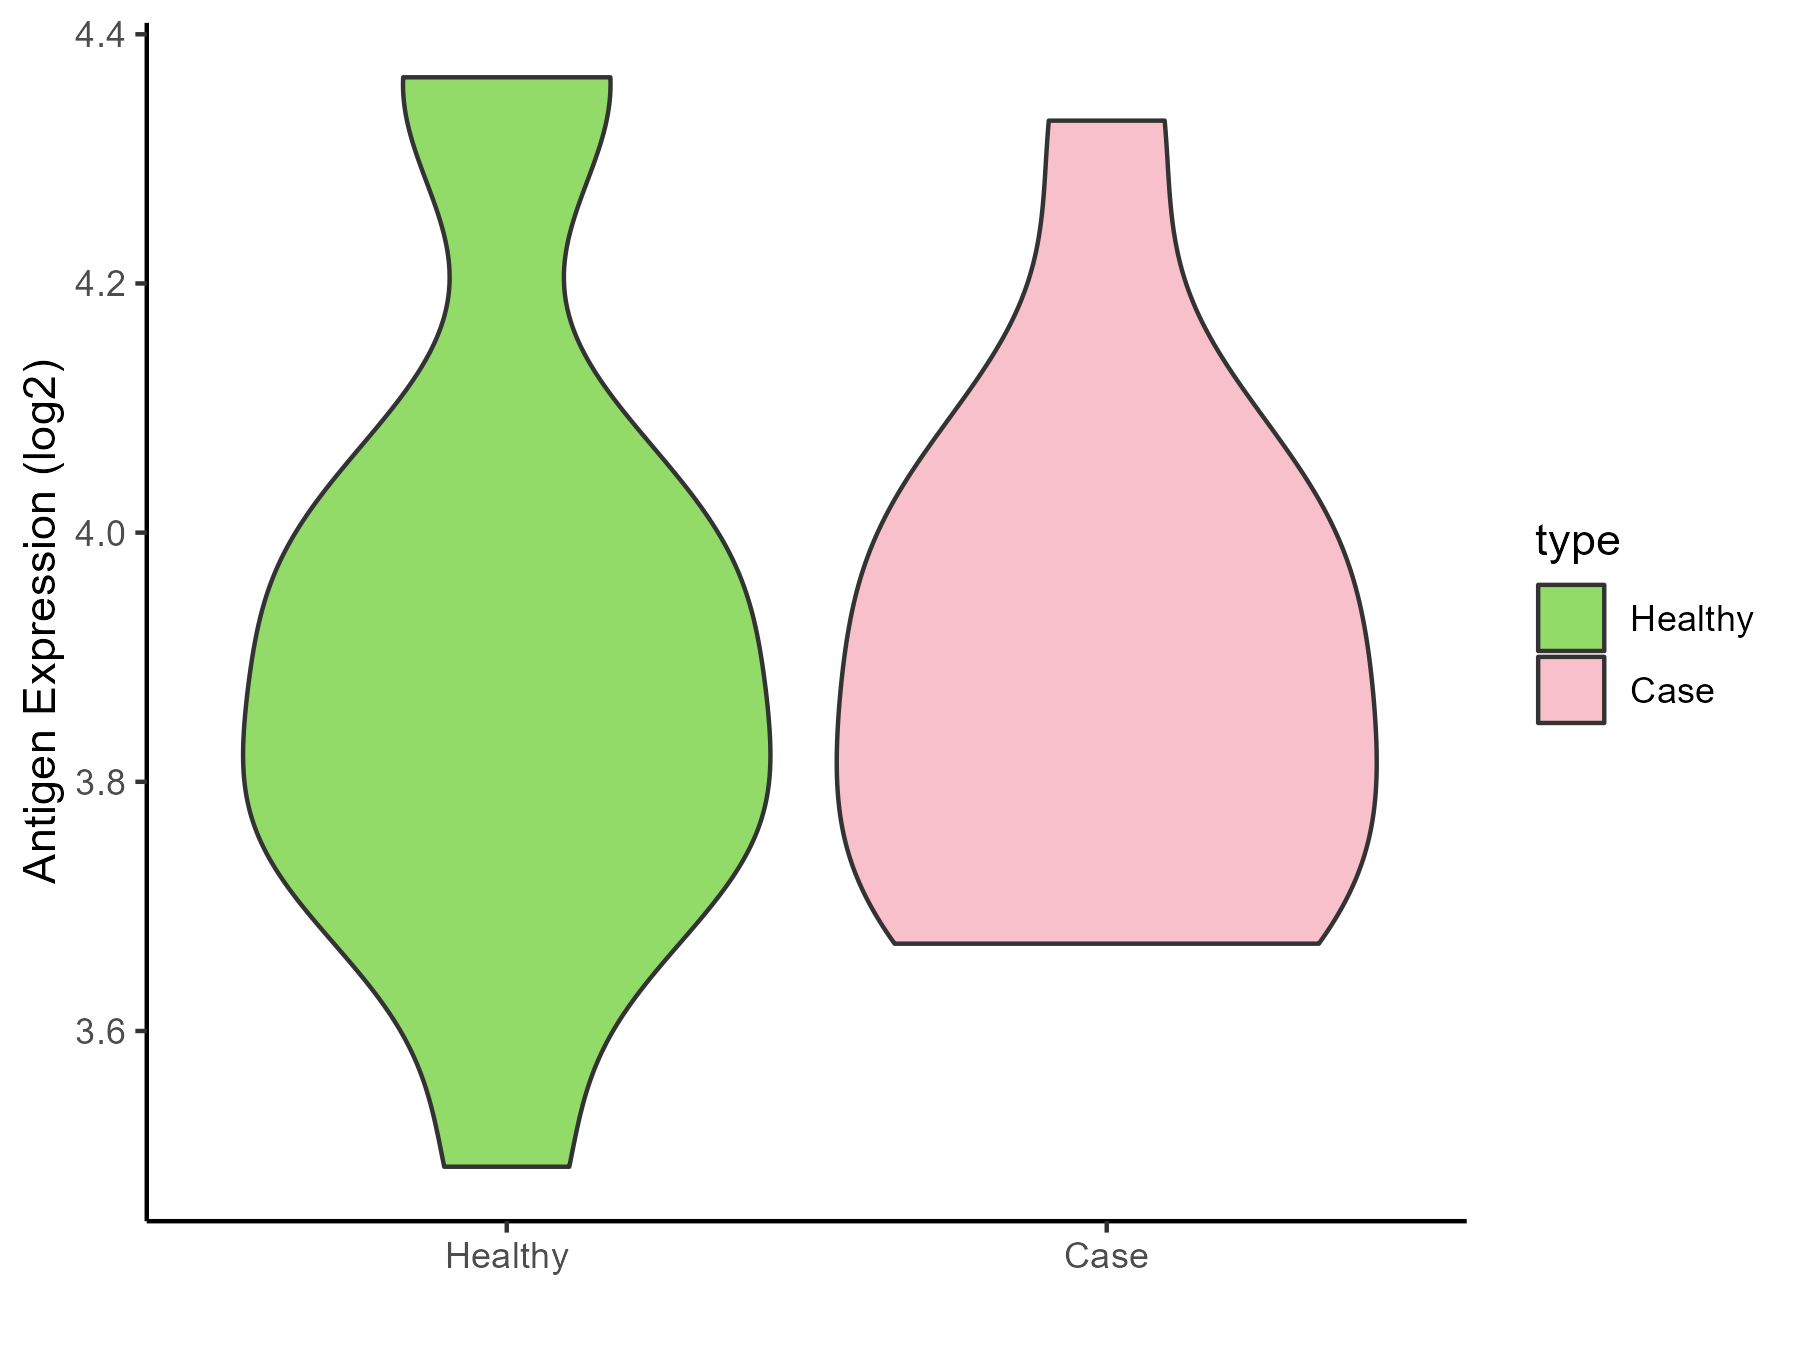
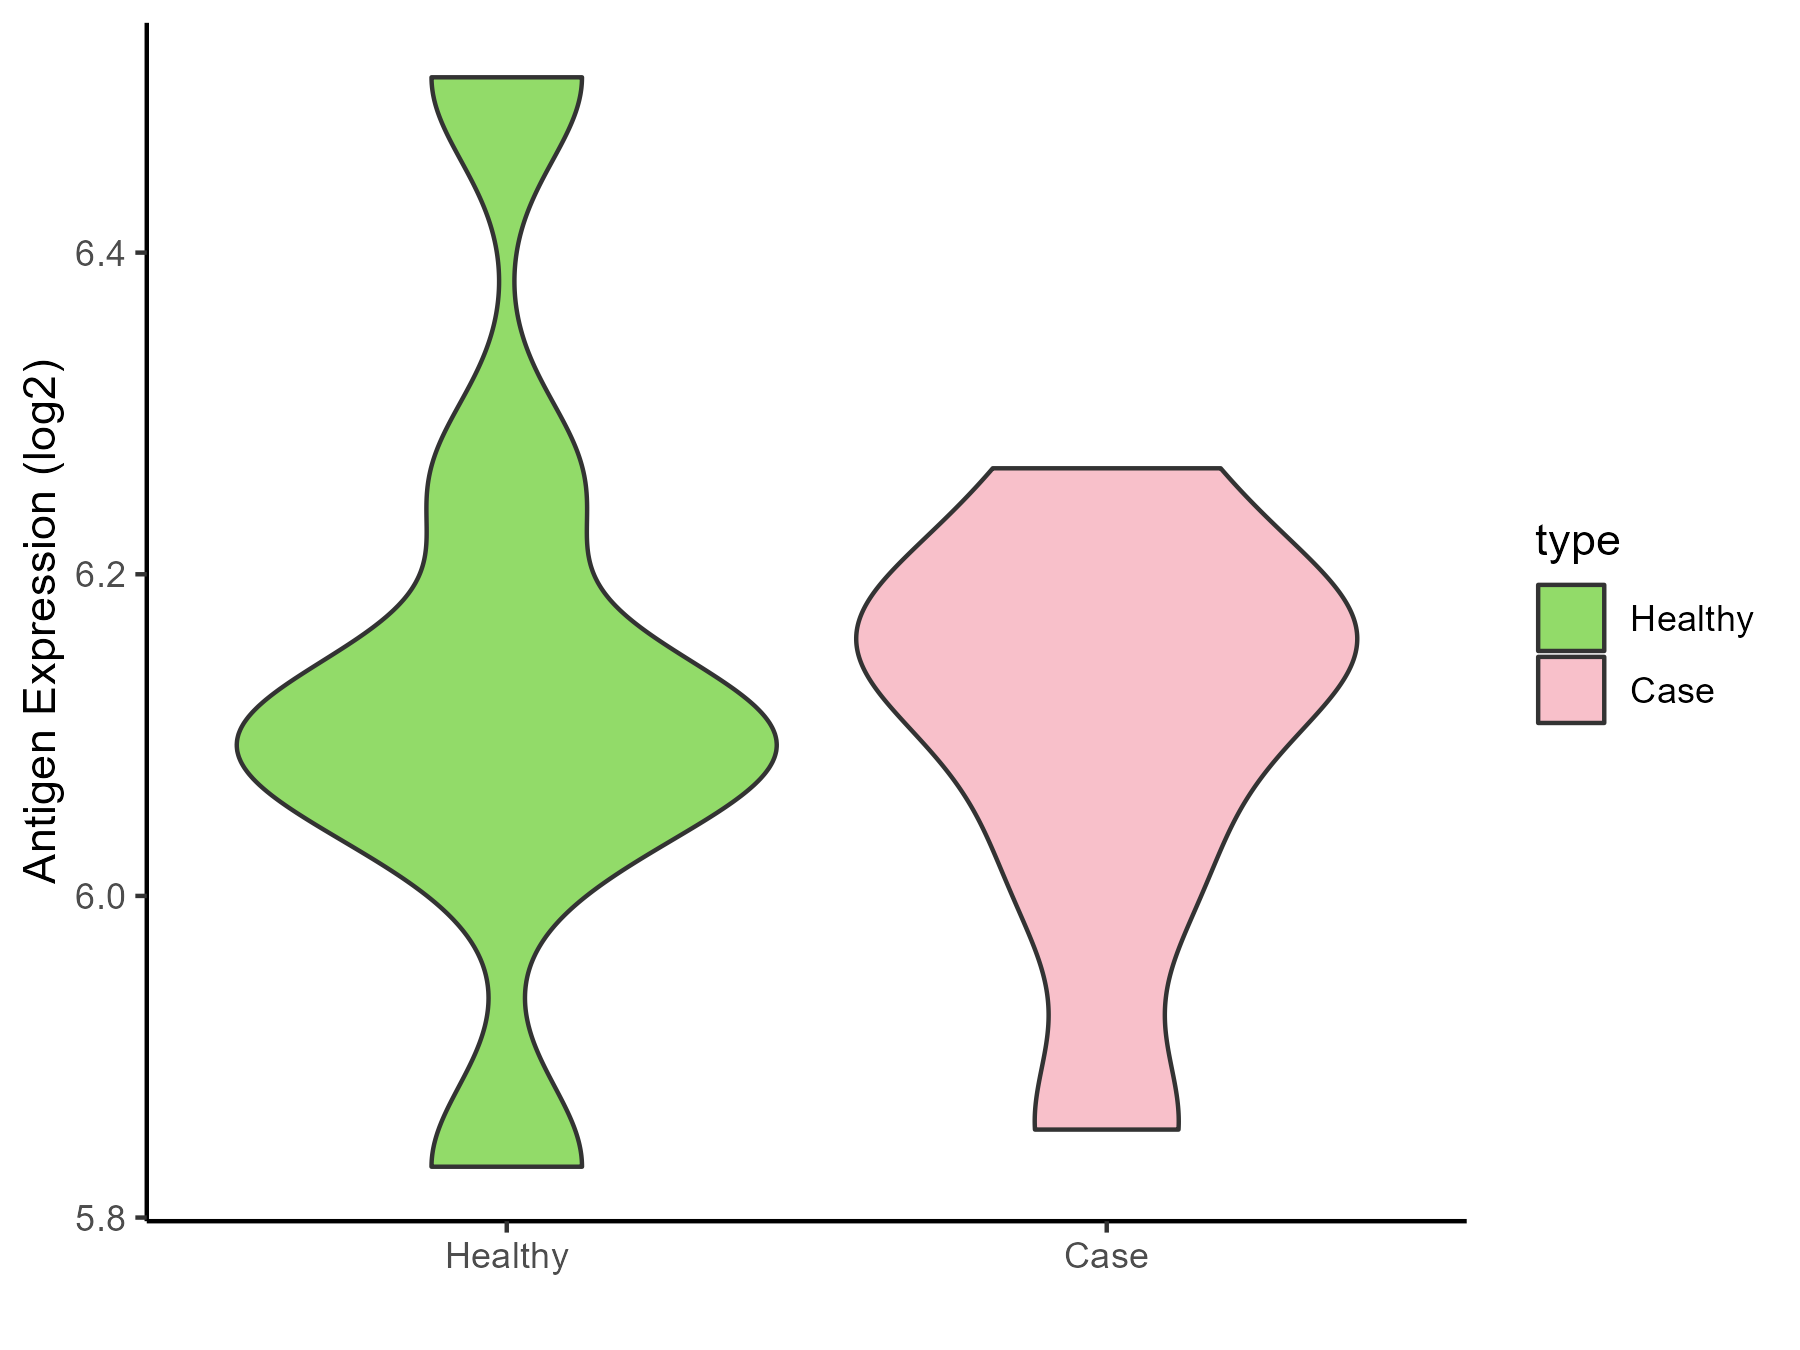
ICD Disease Classification 01
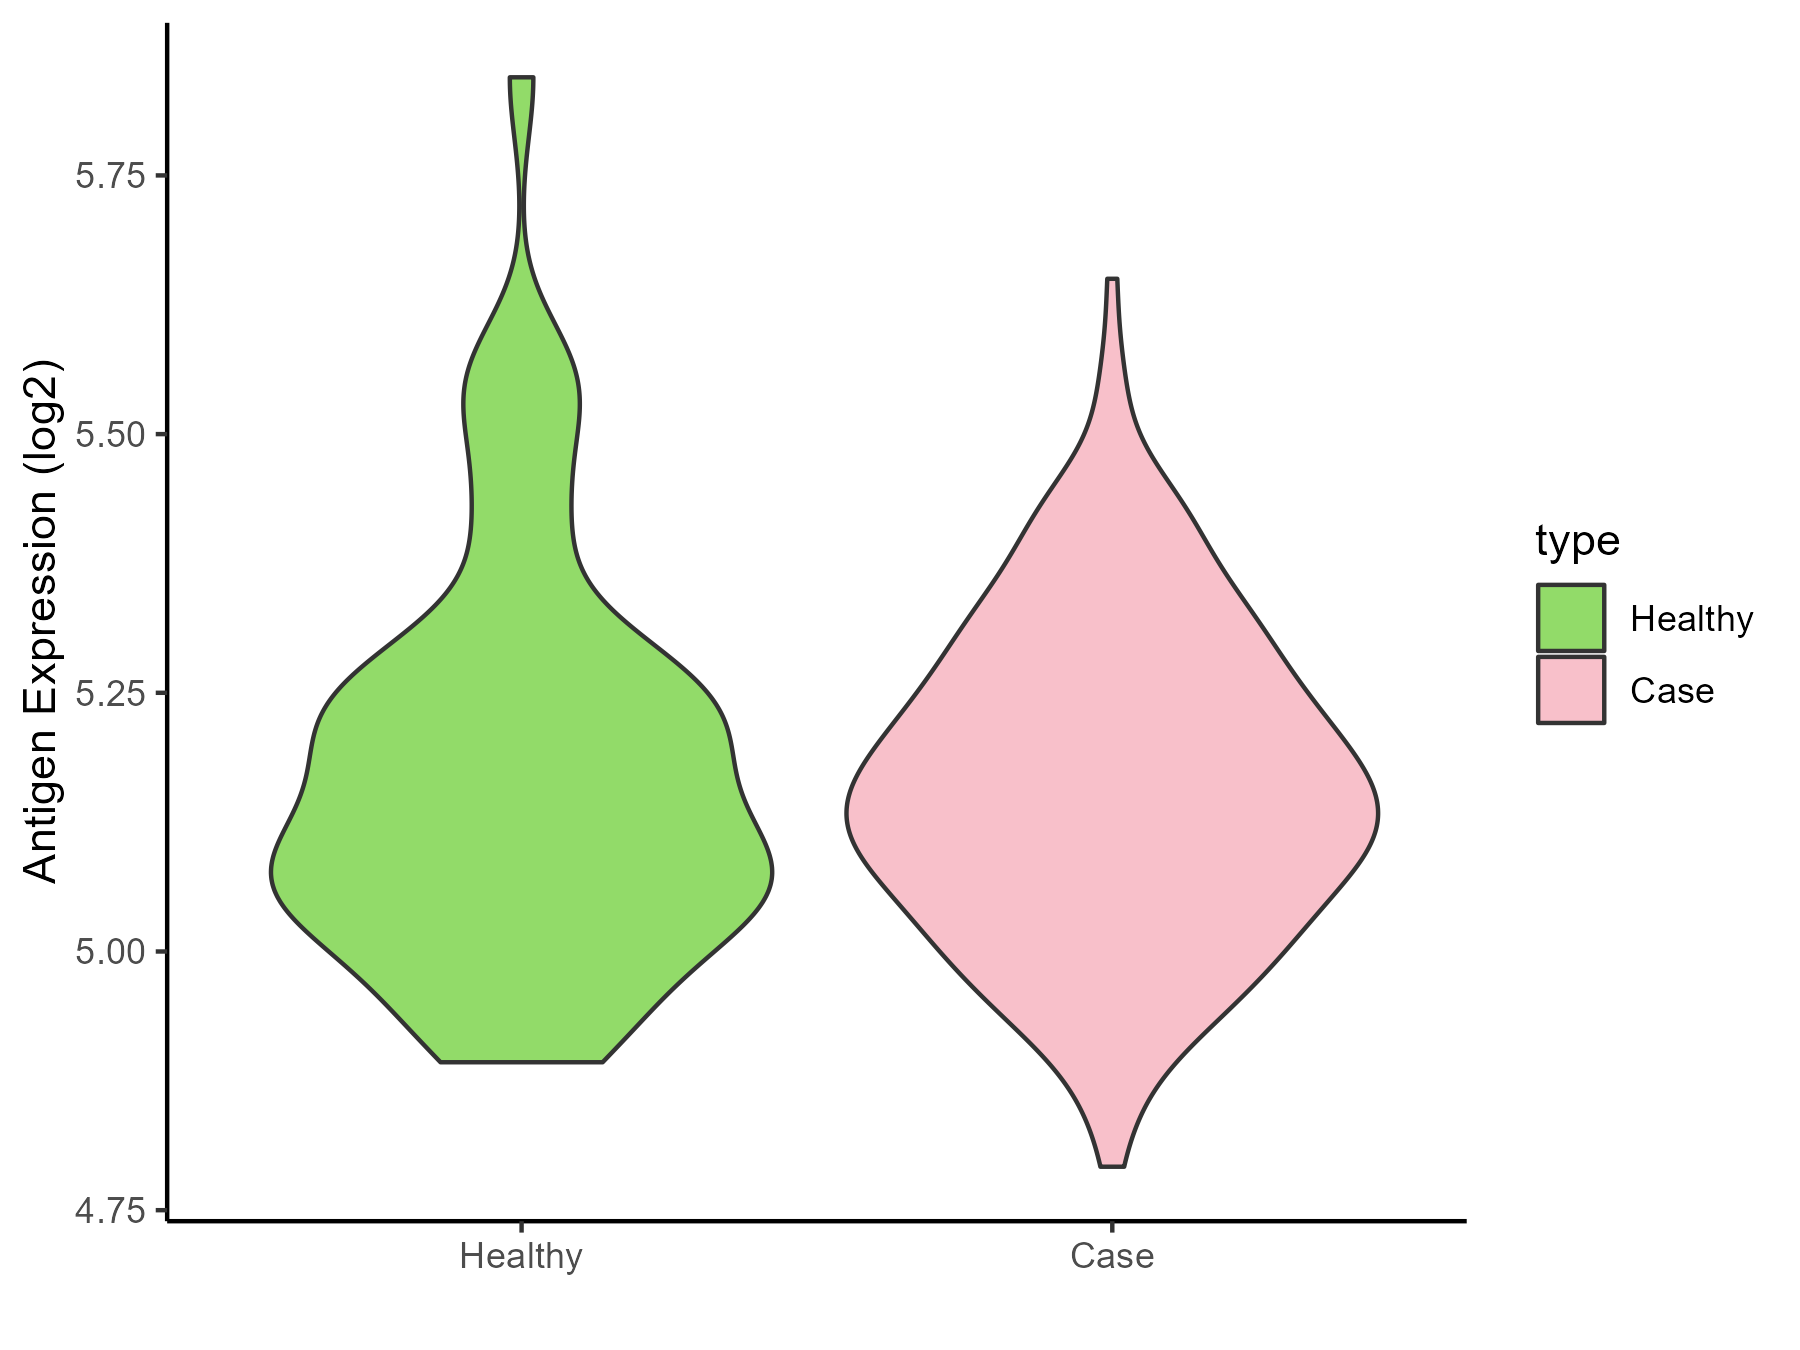
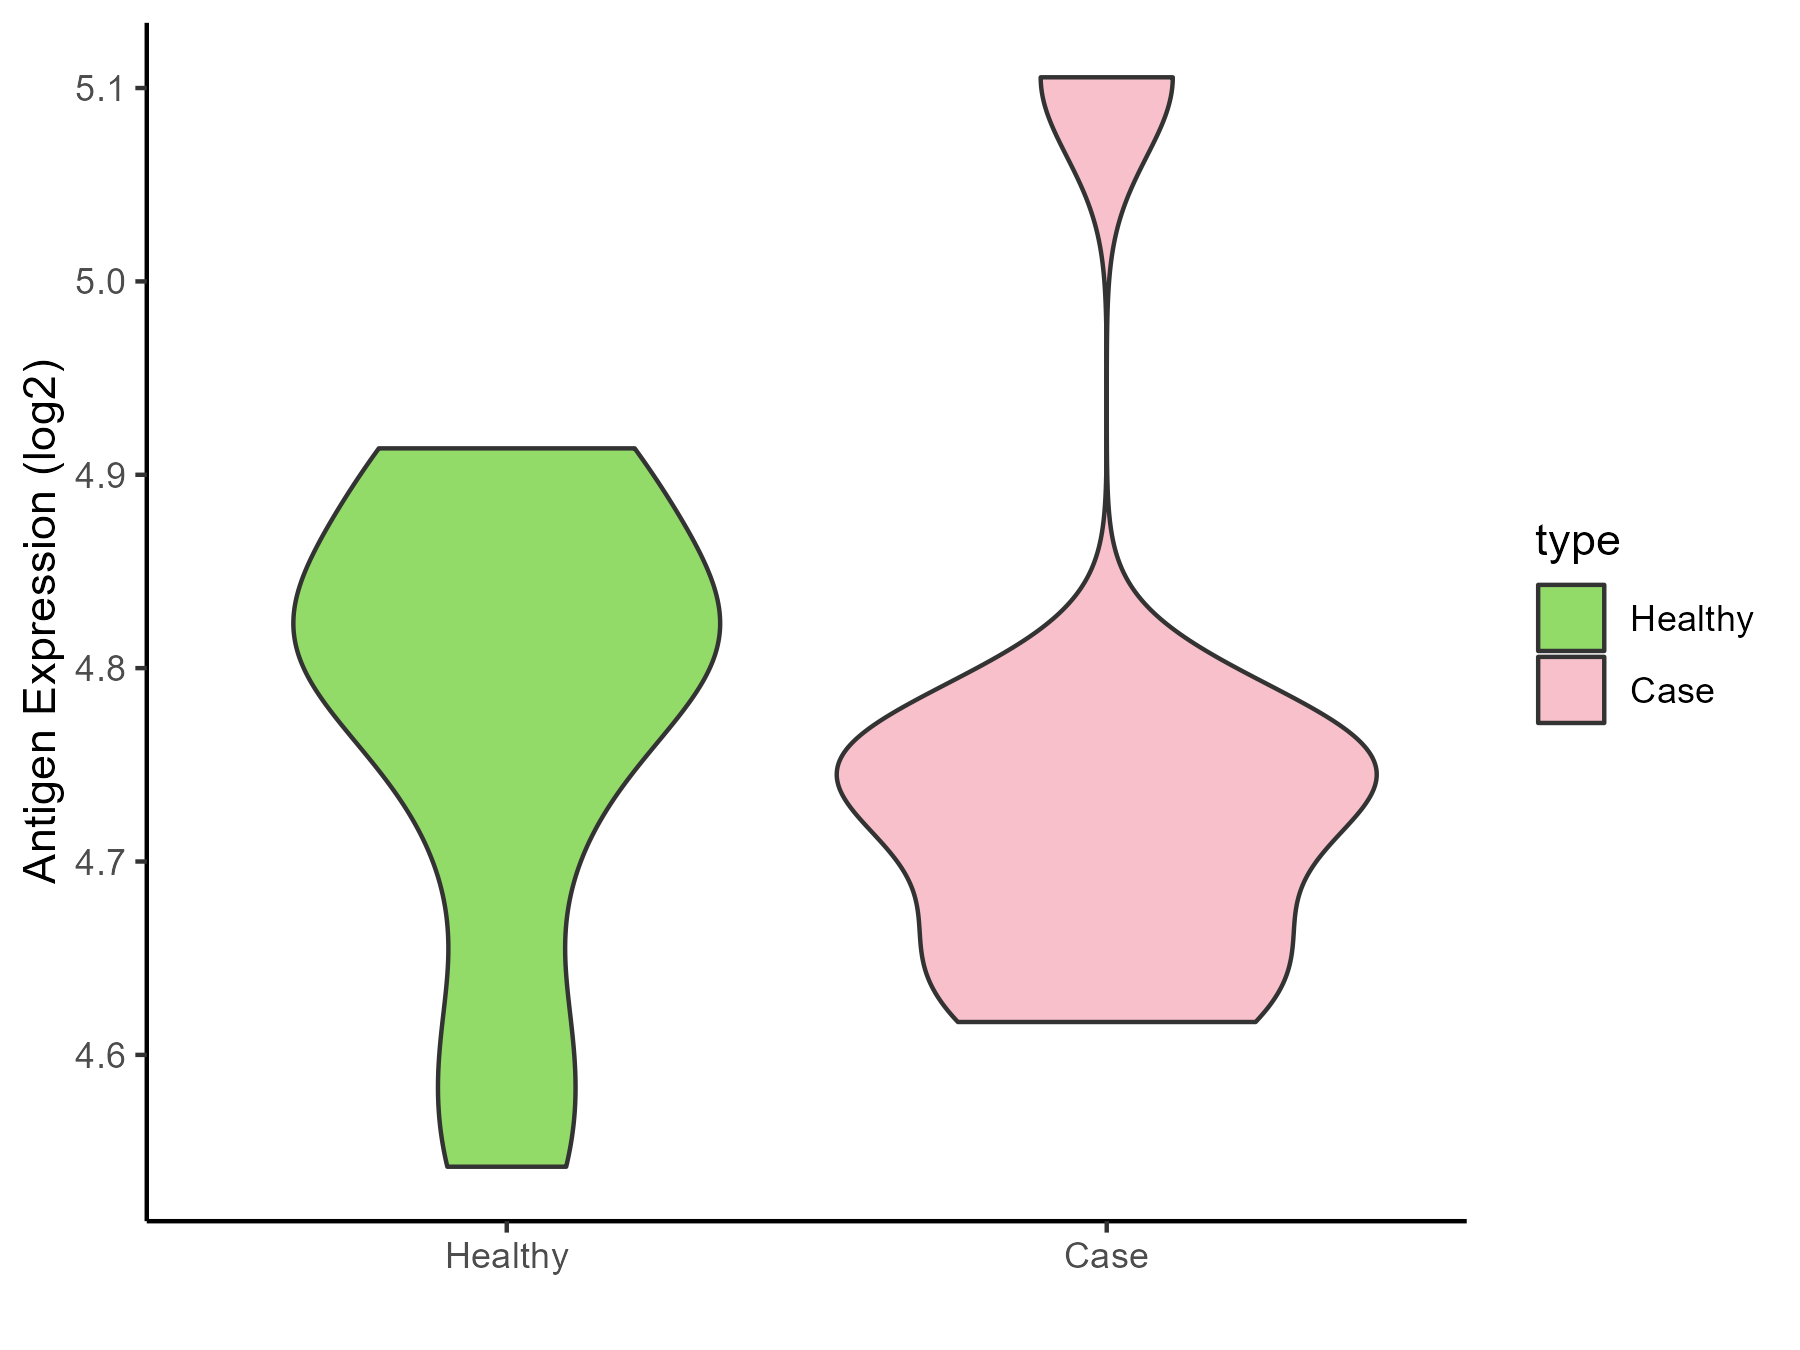
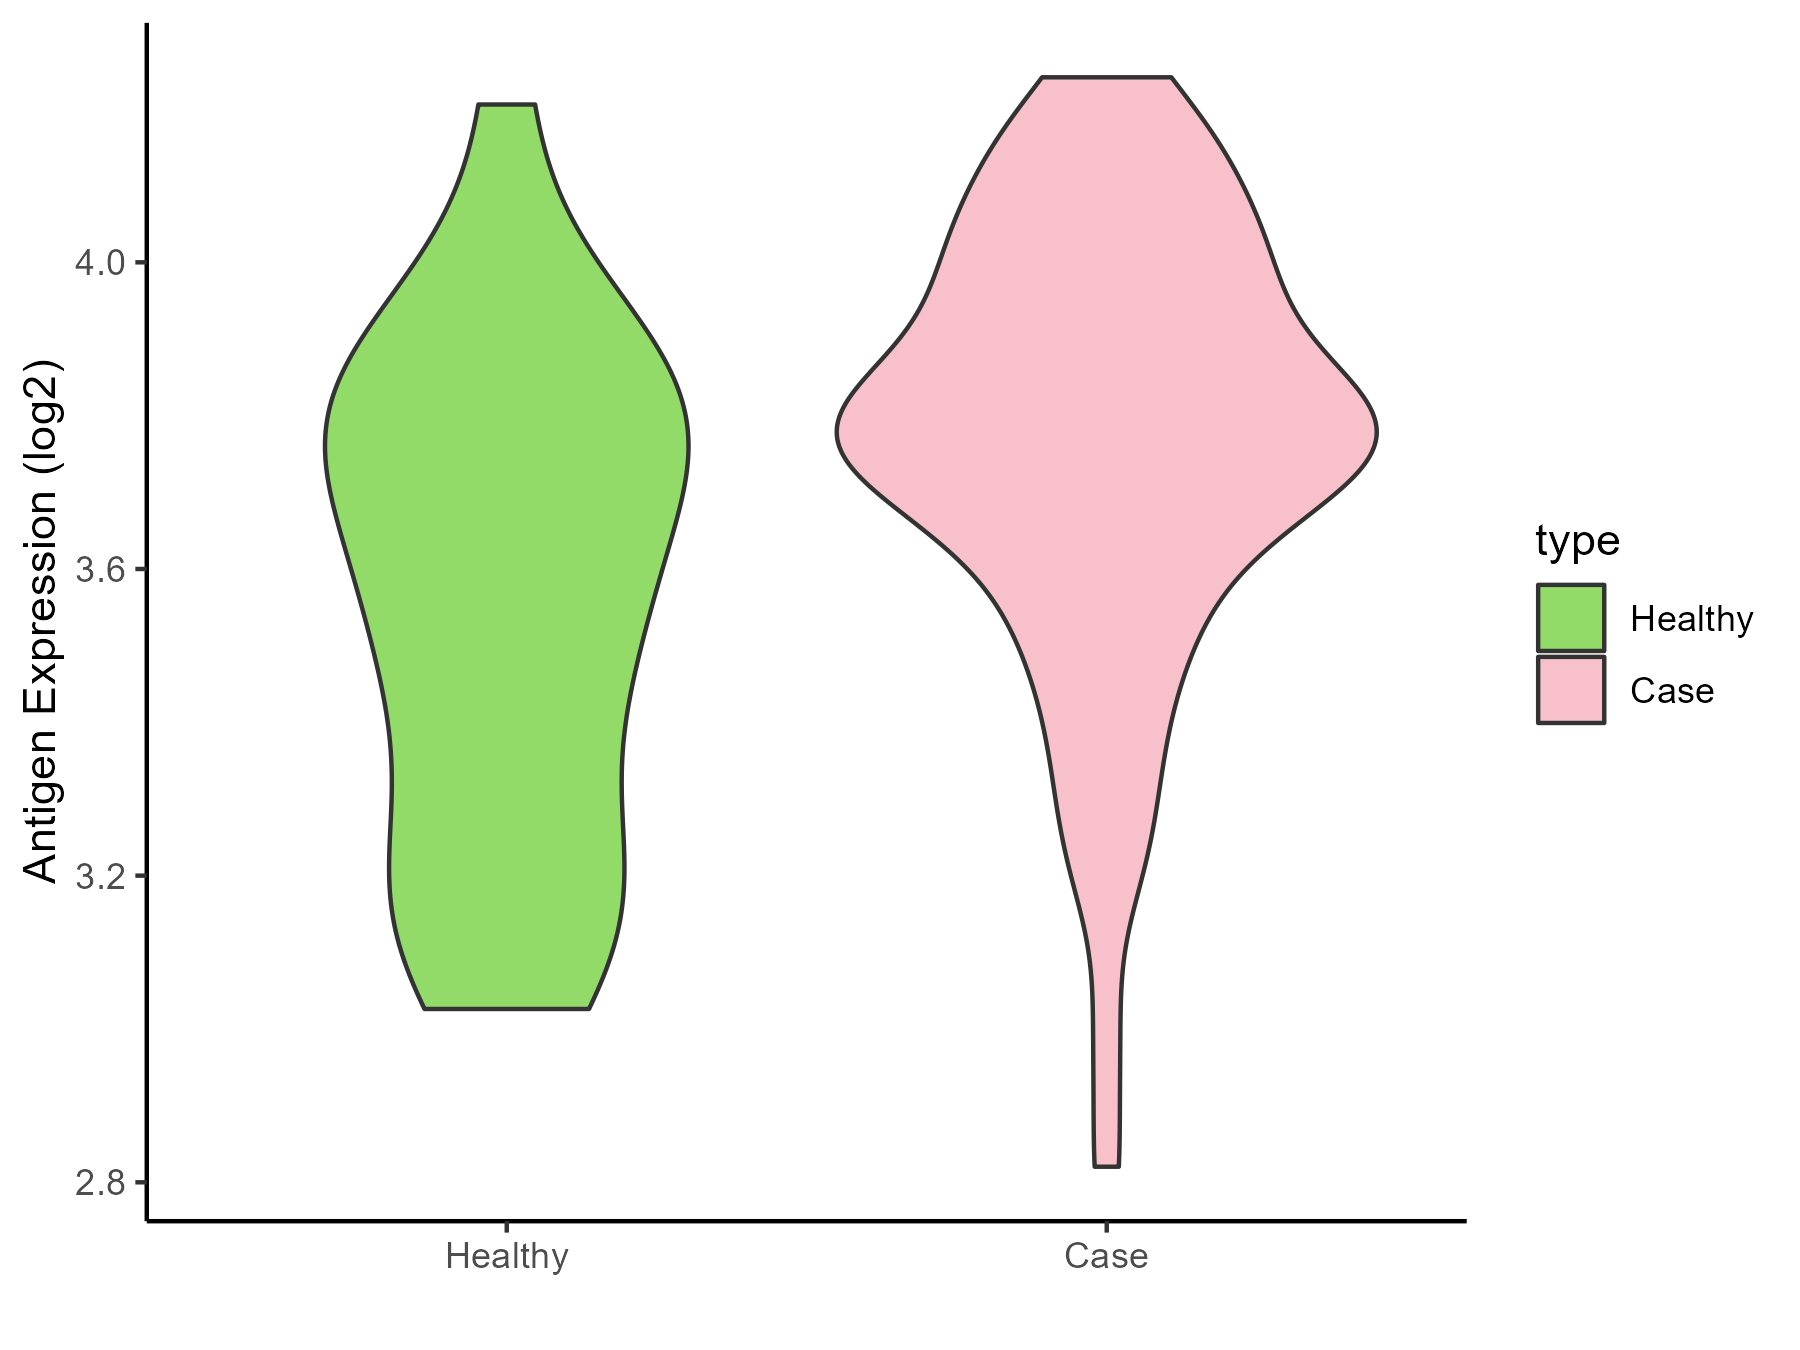
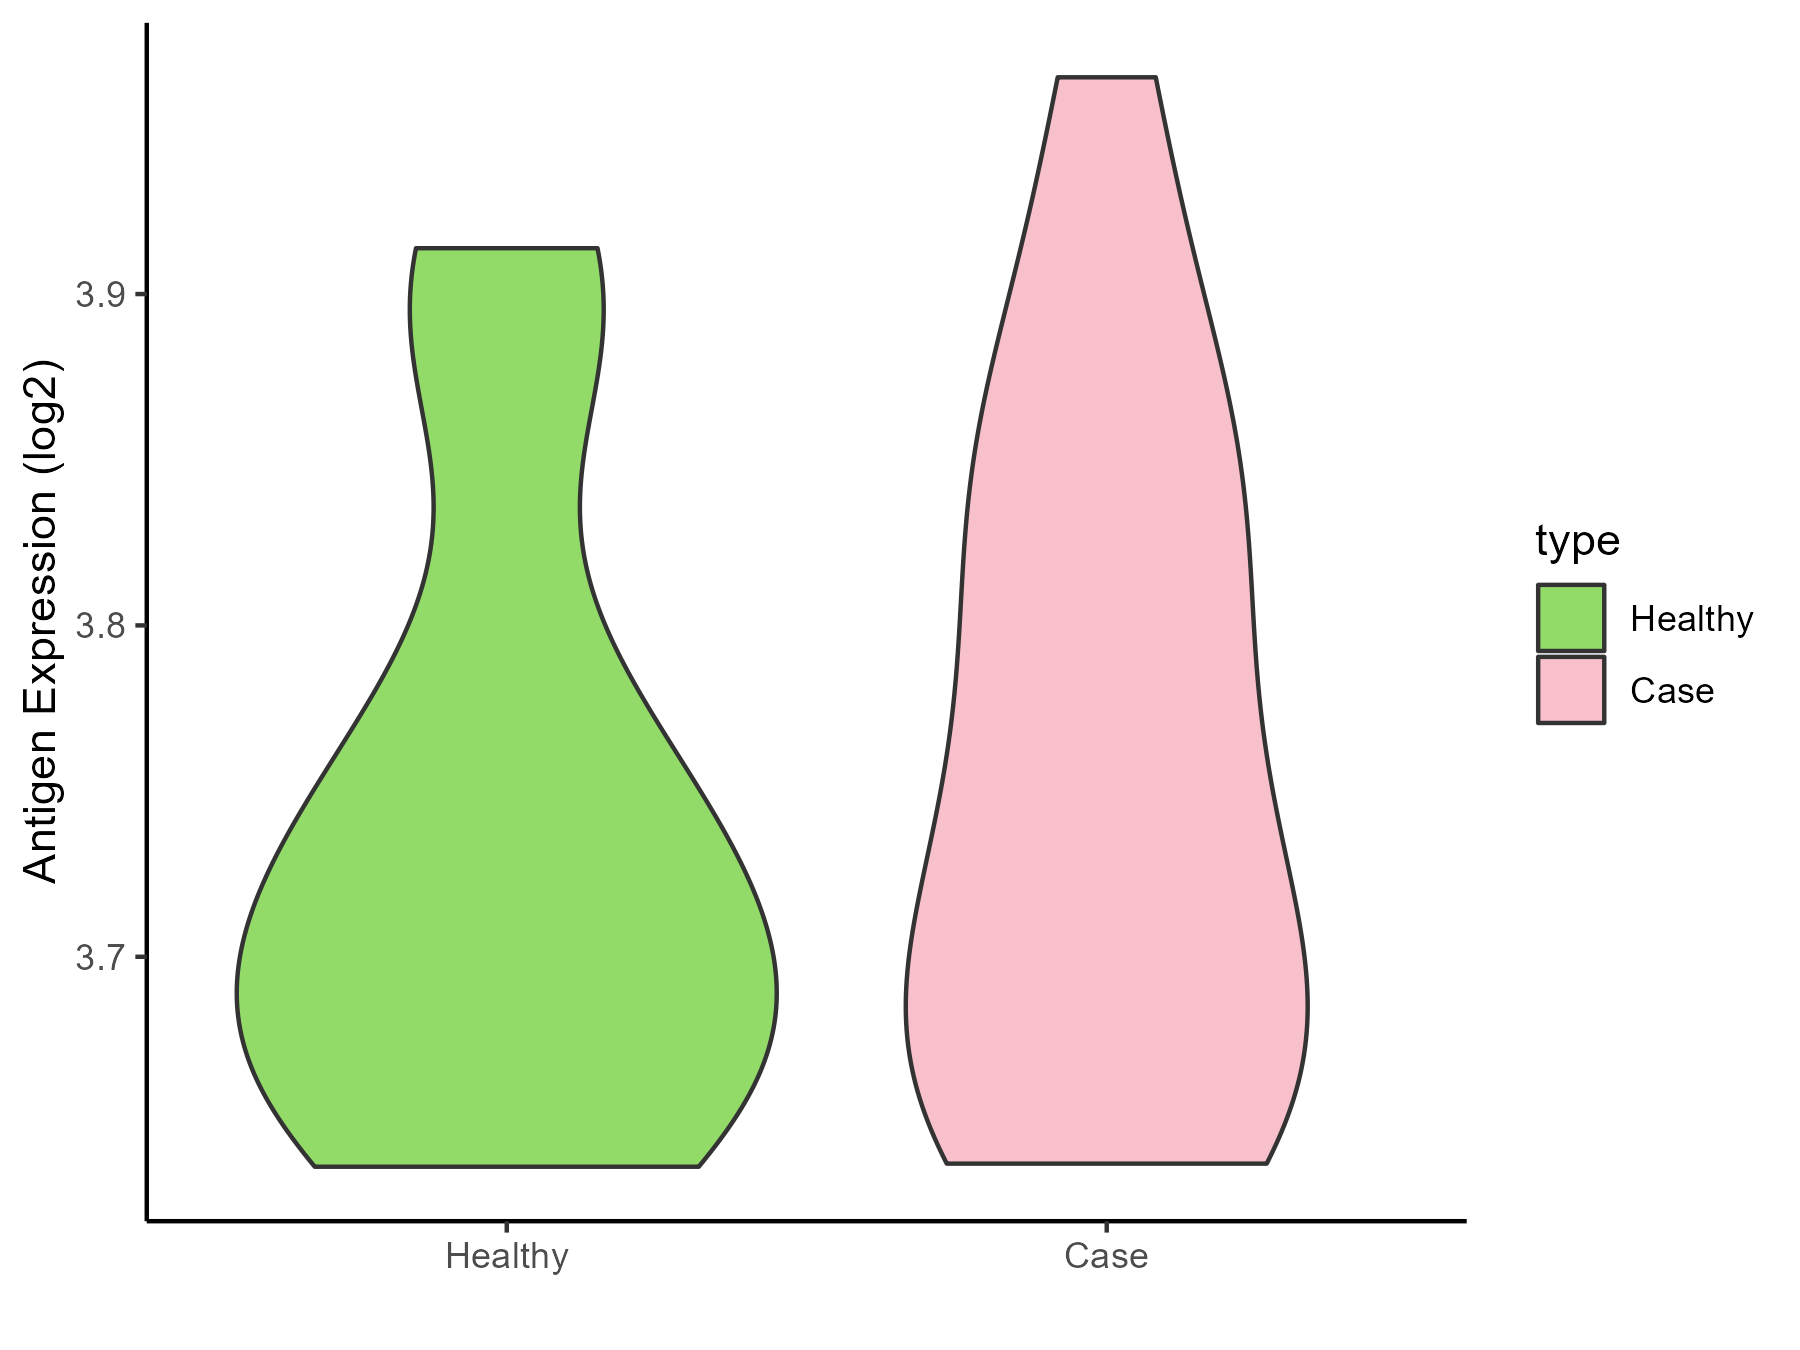
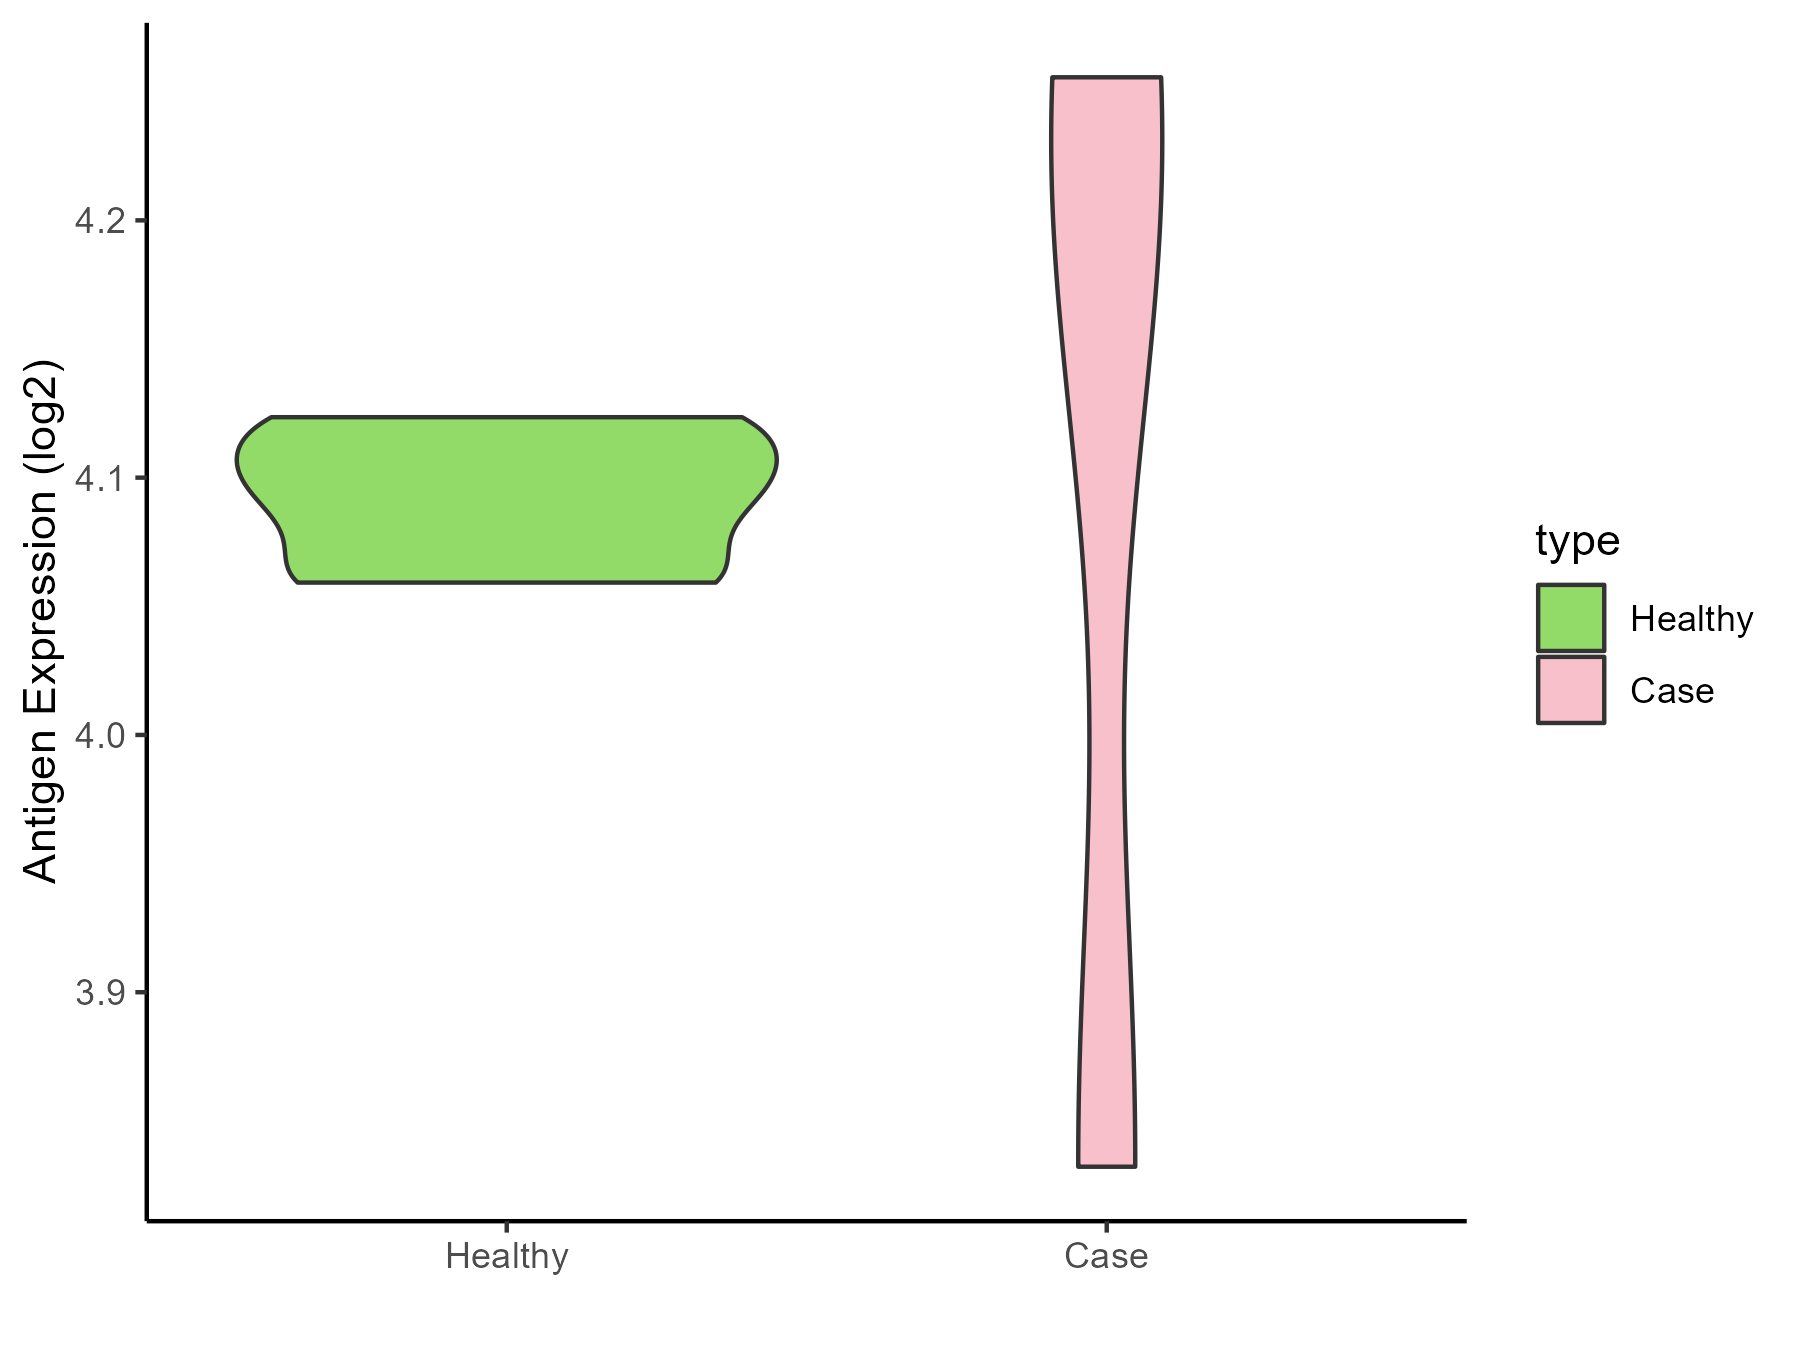
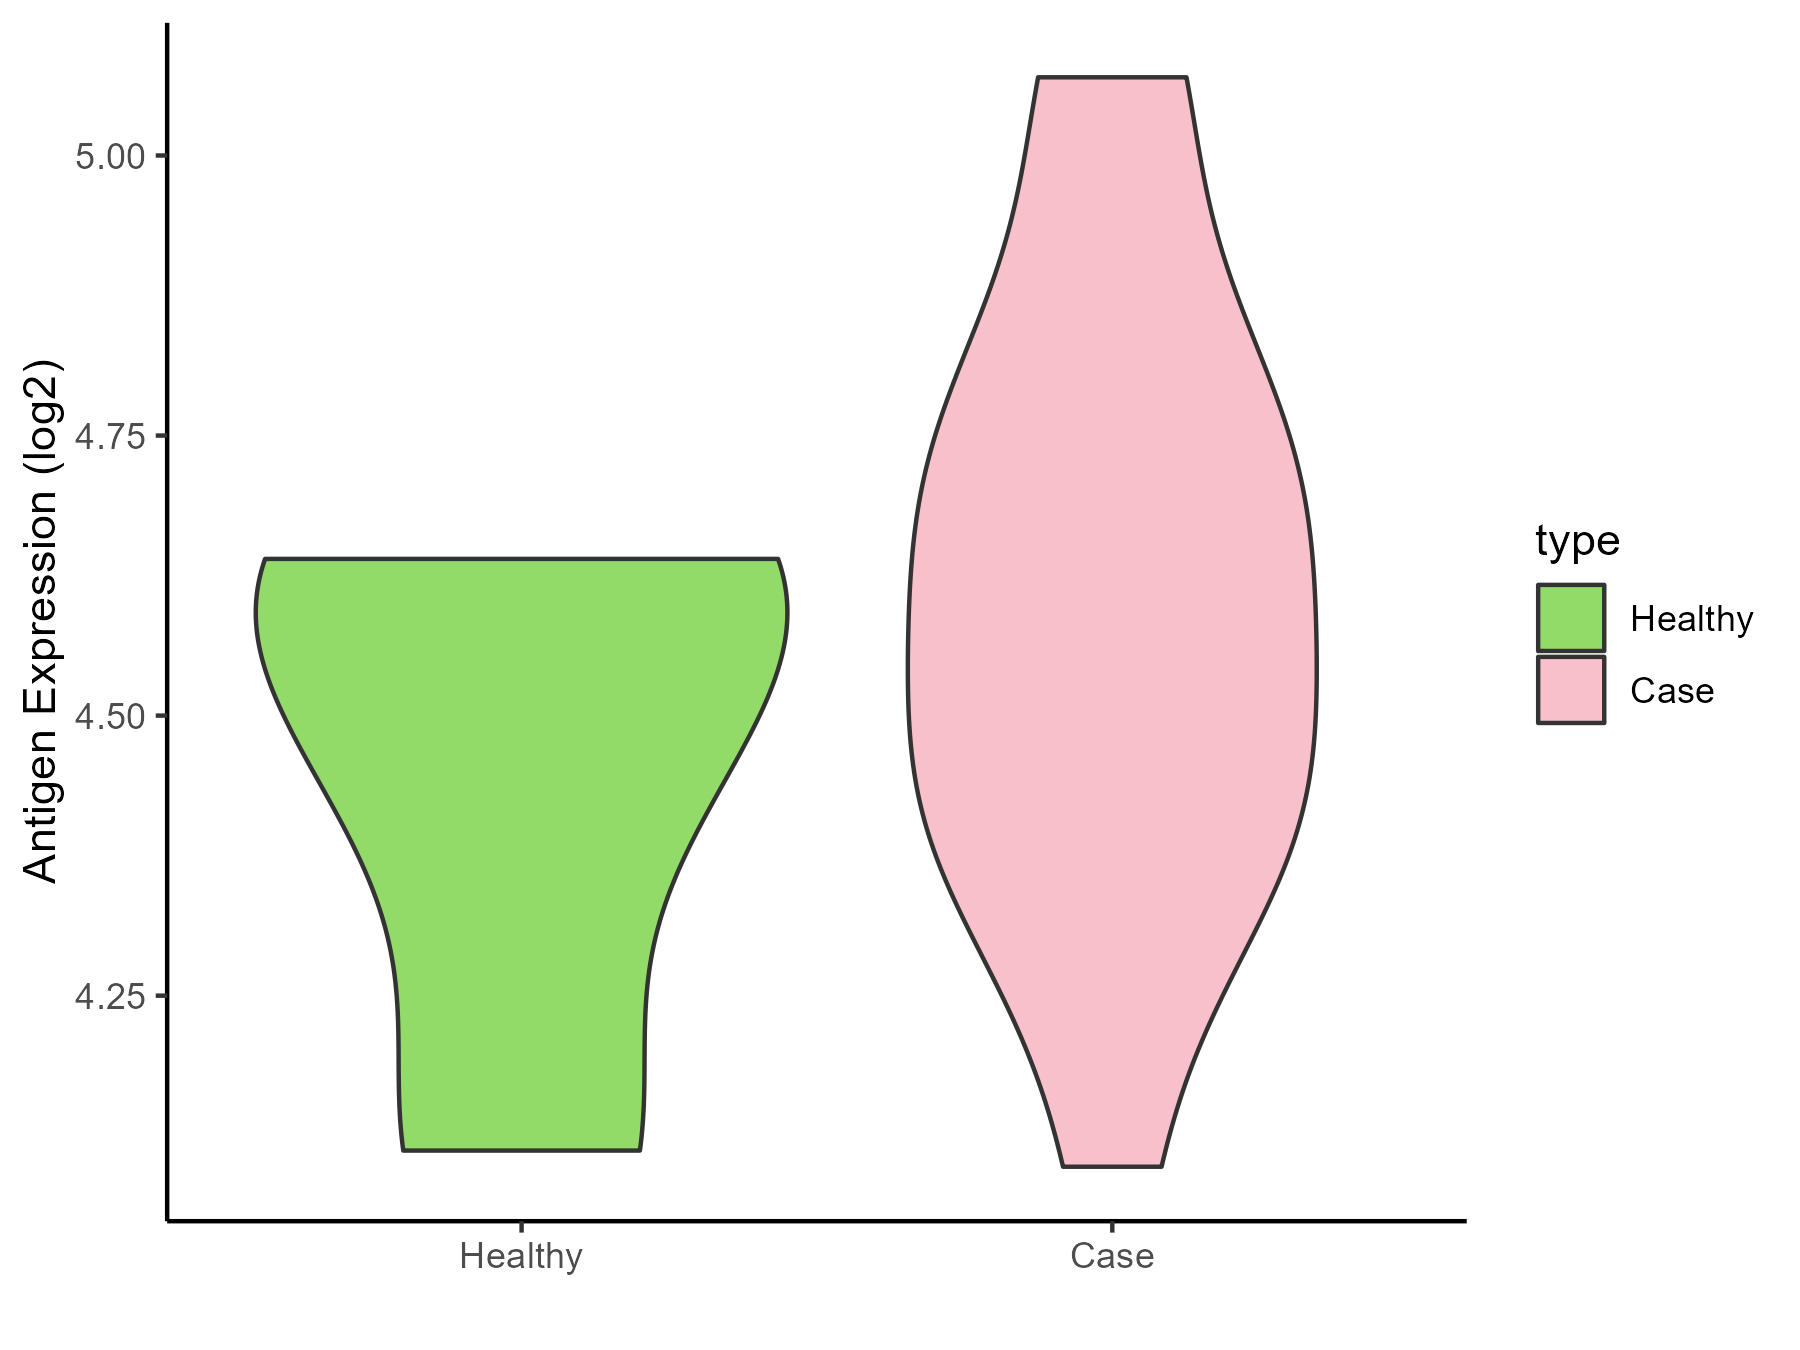
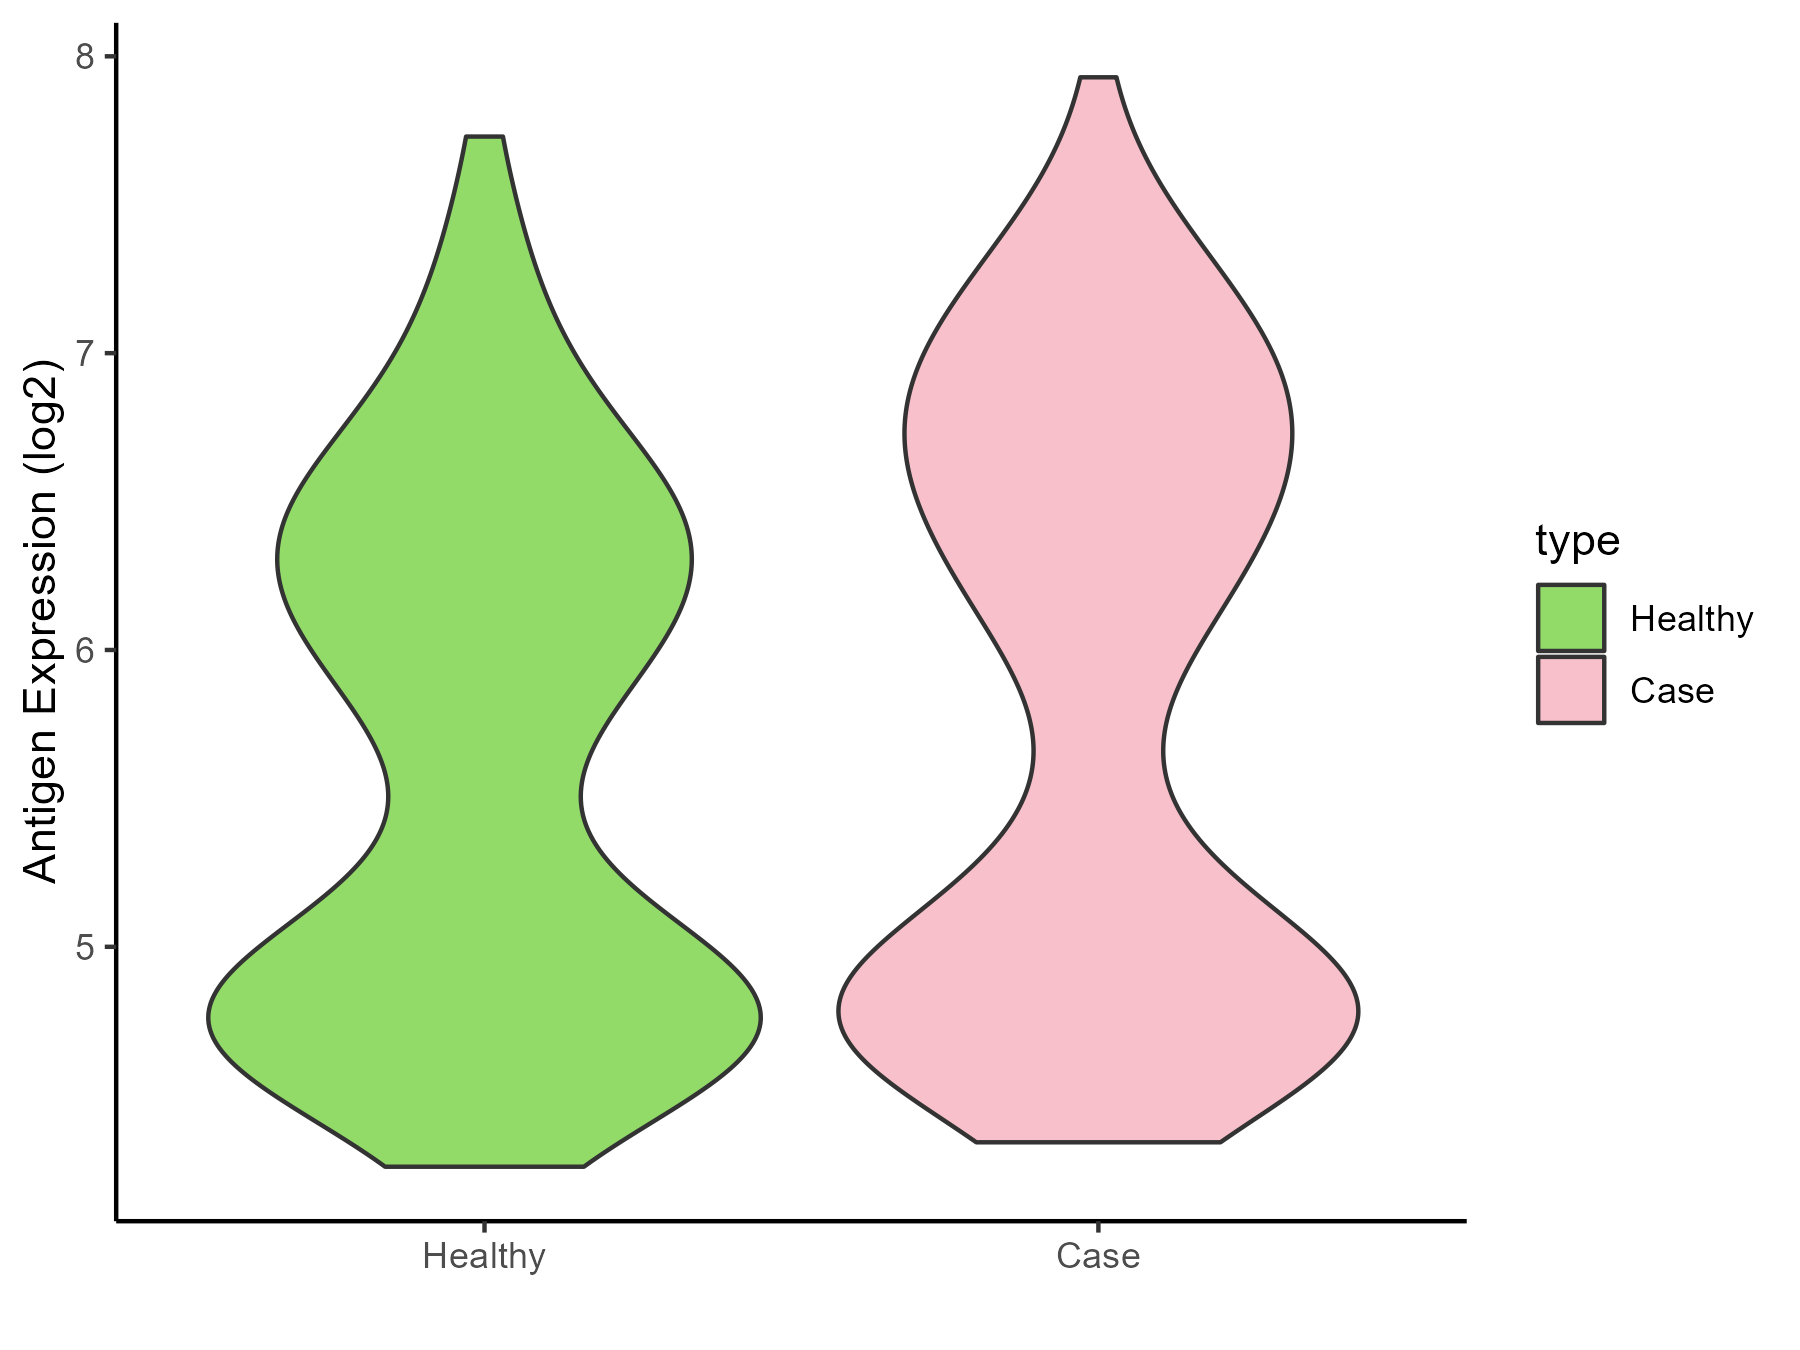
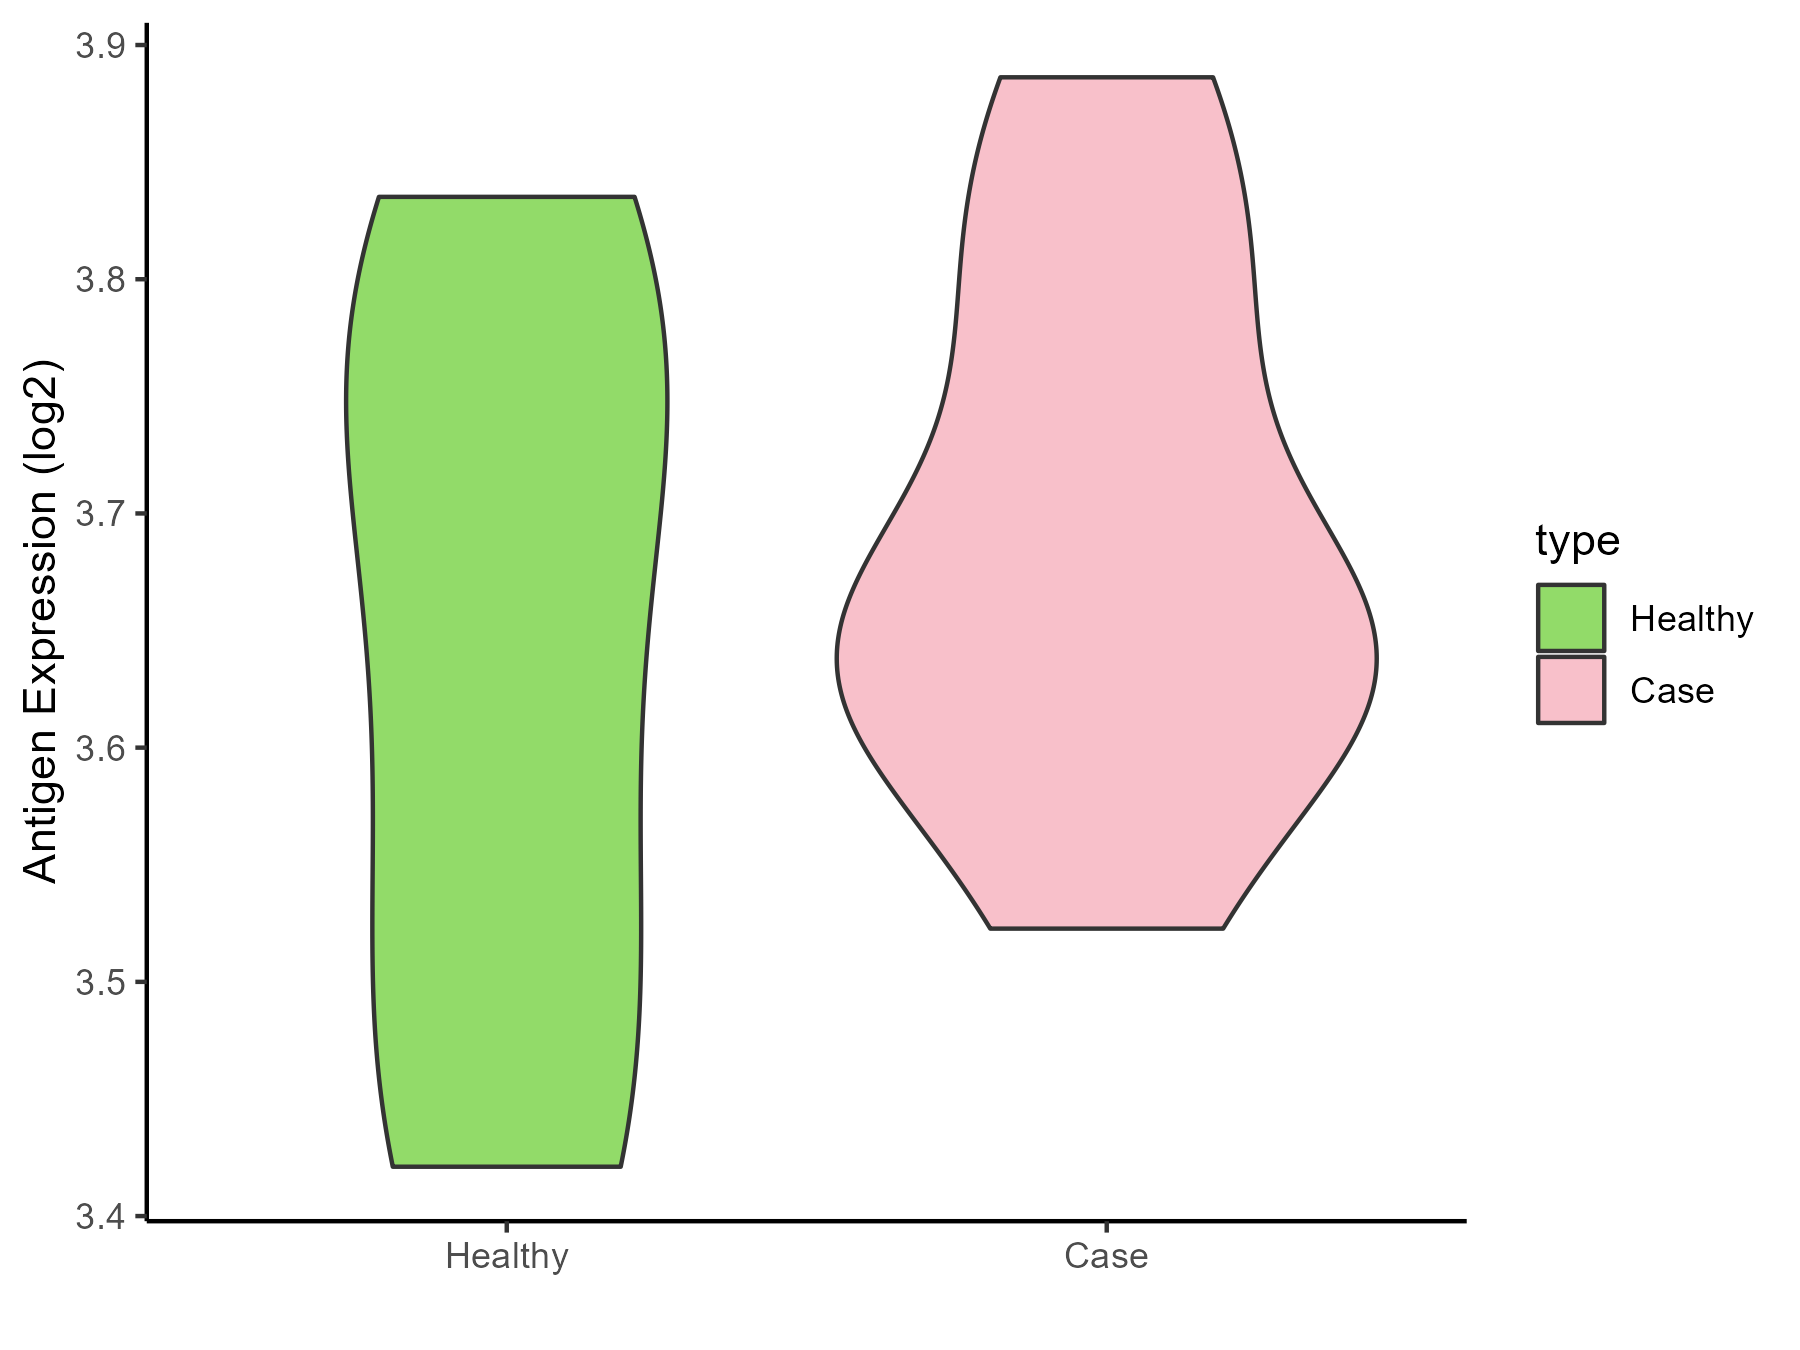
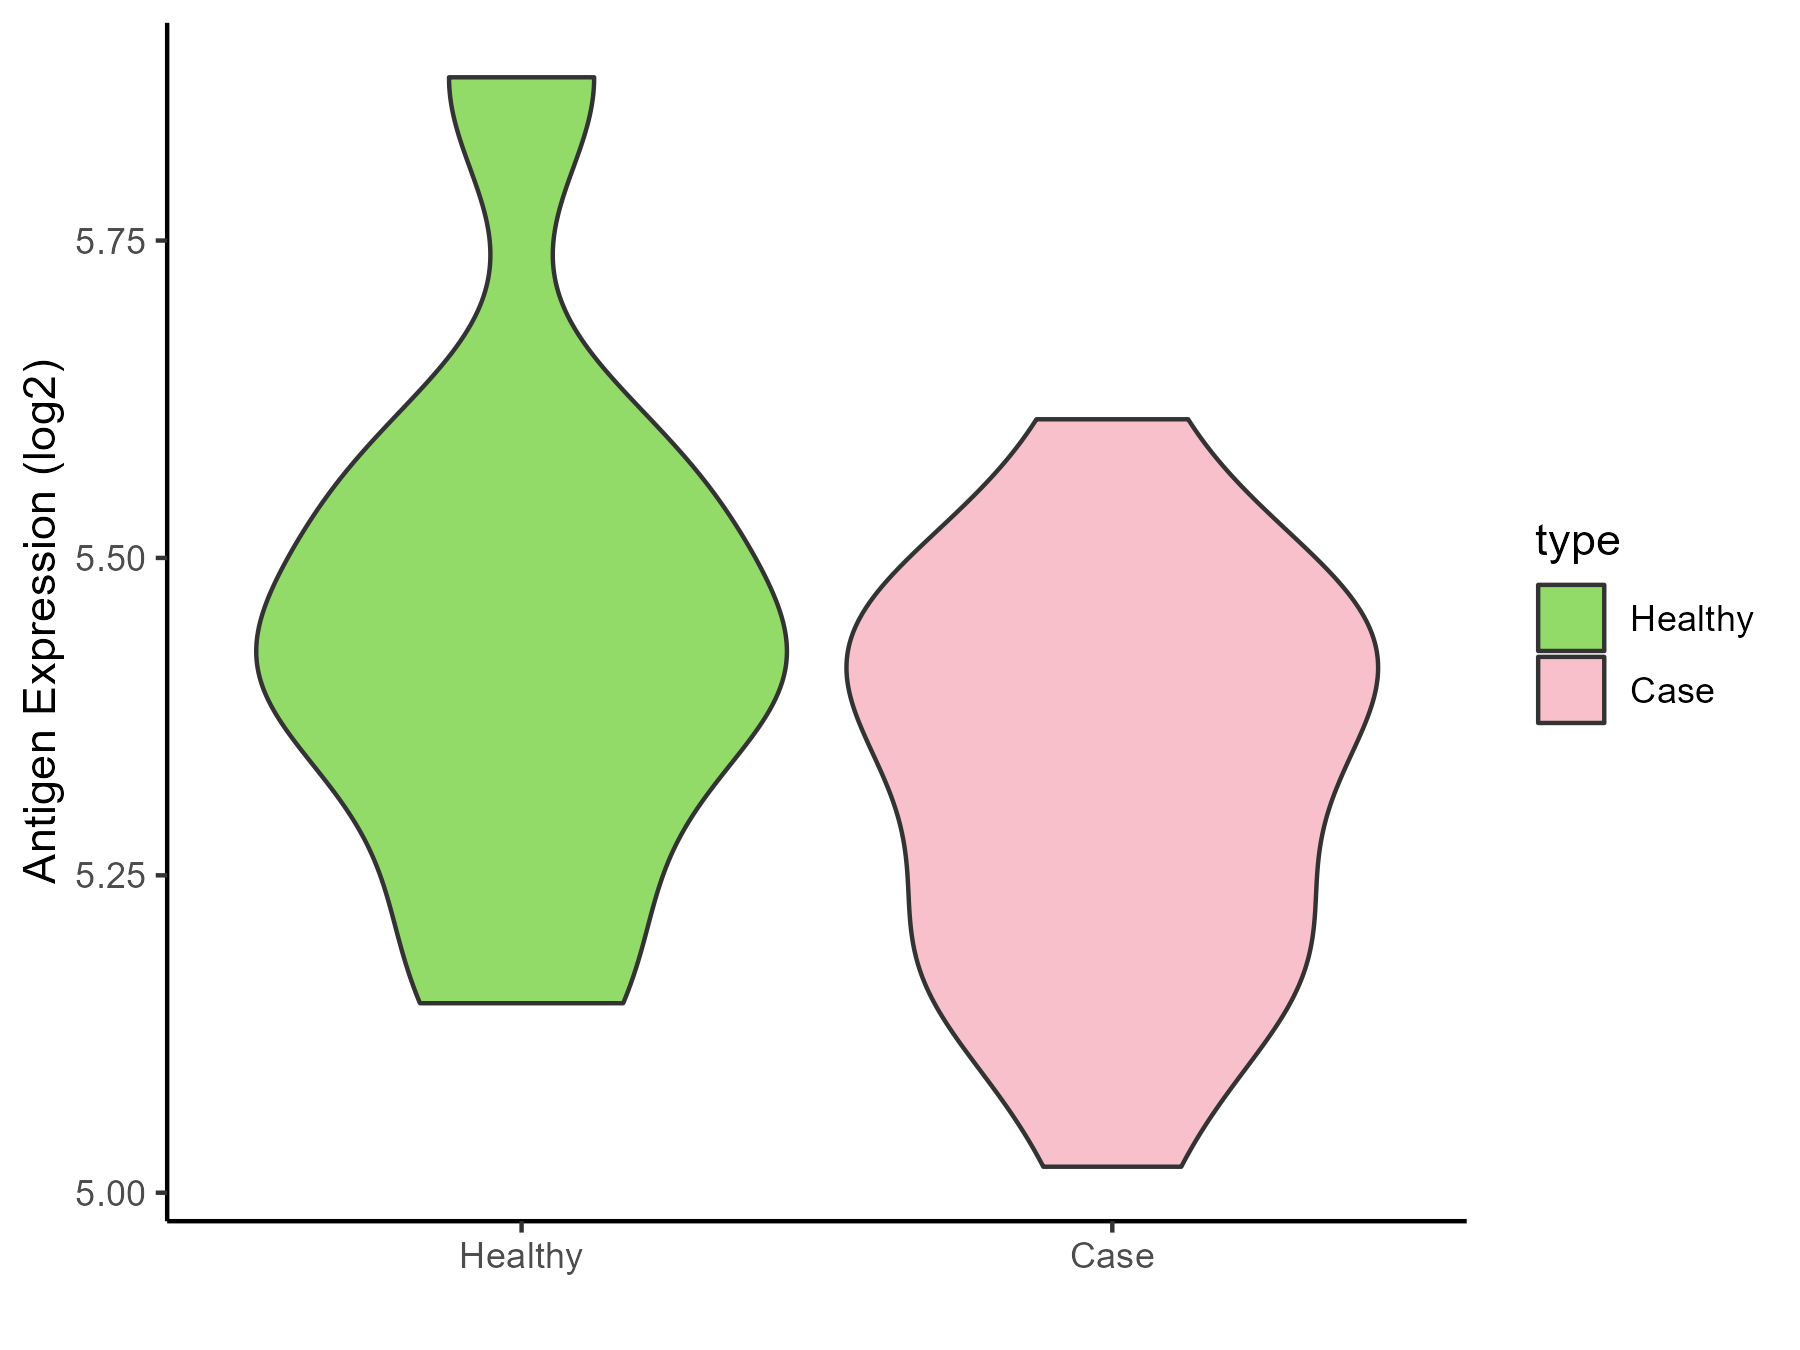
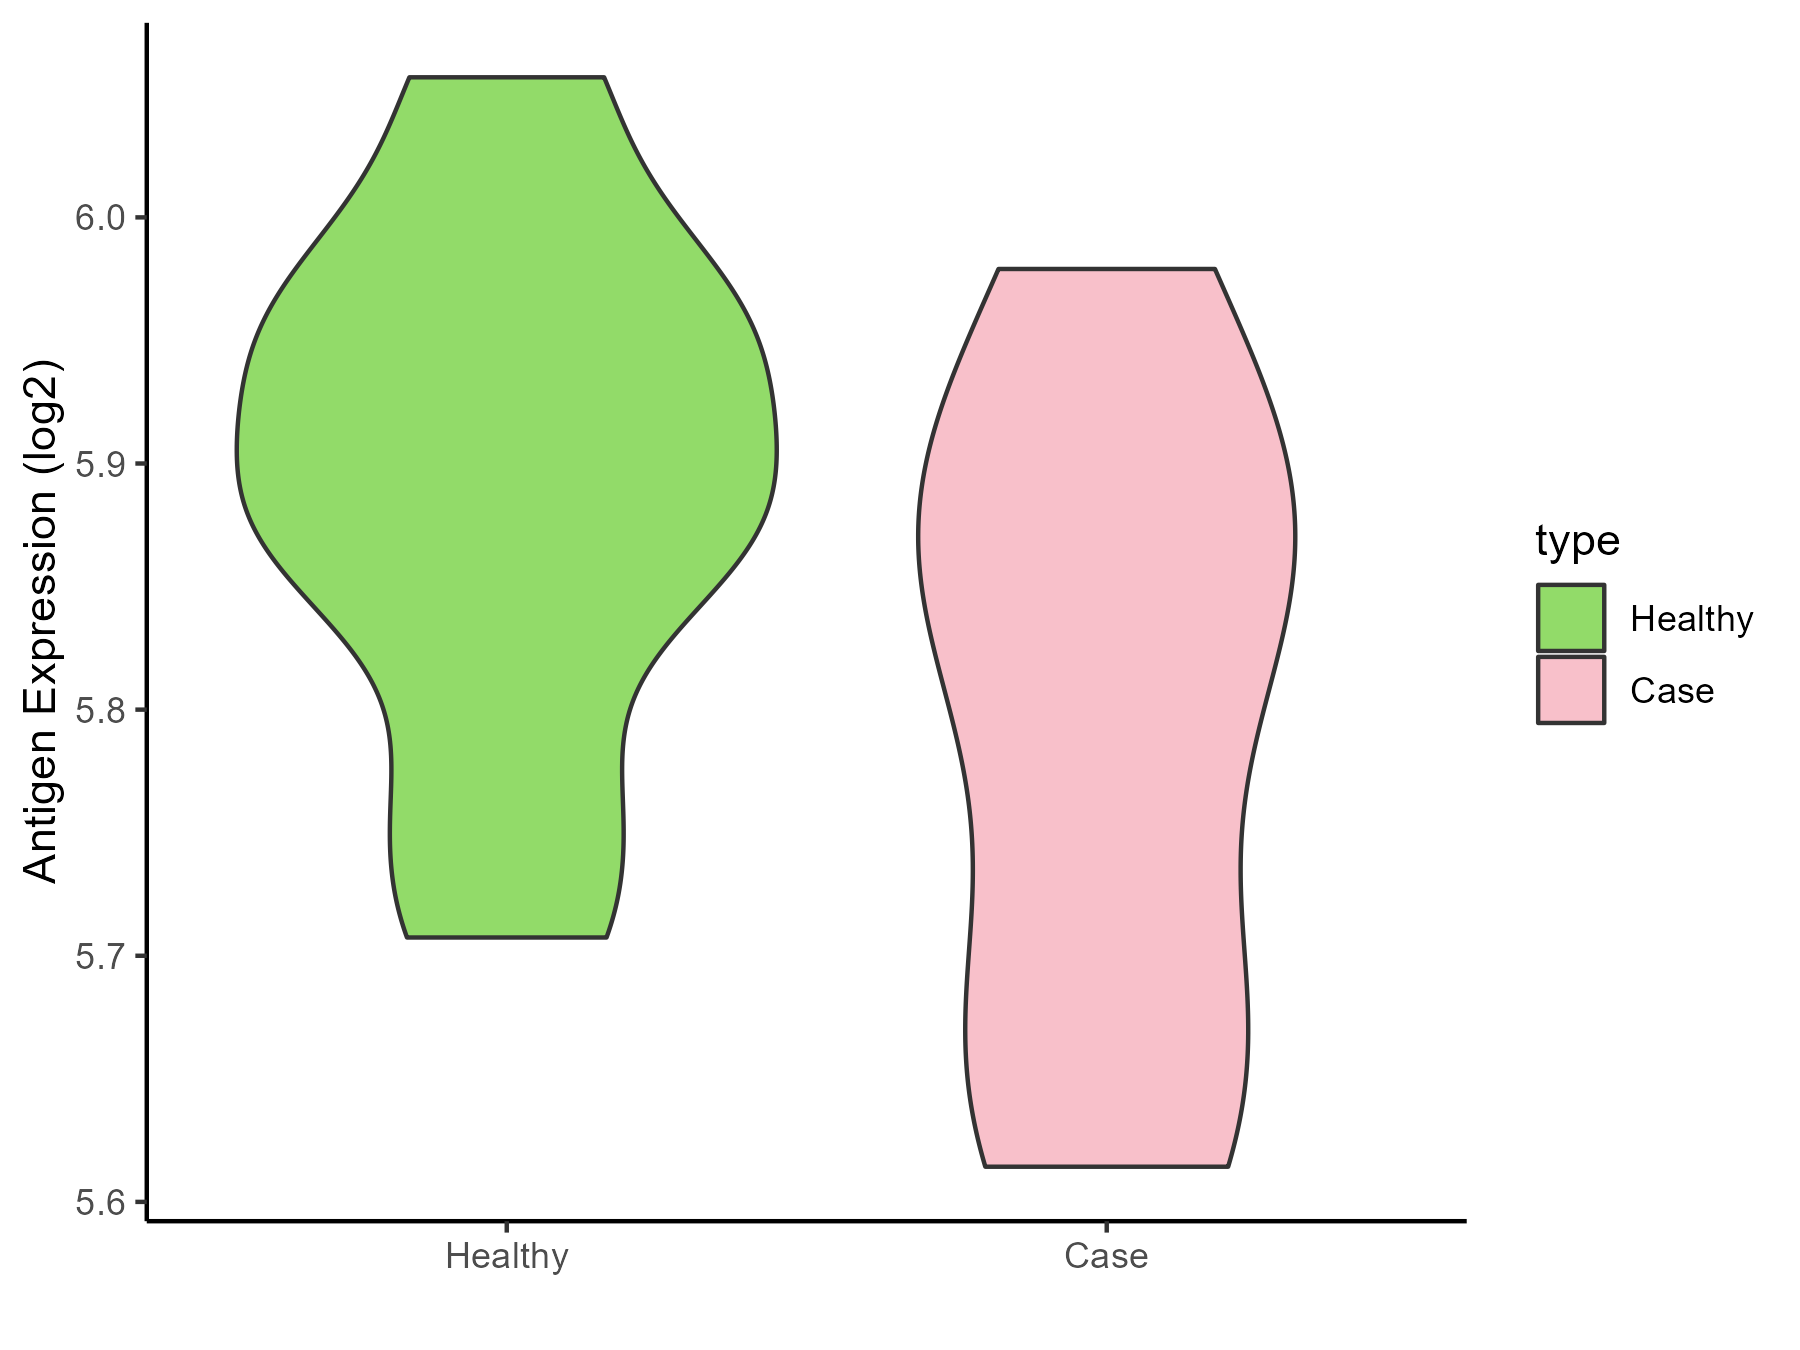
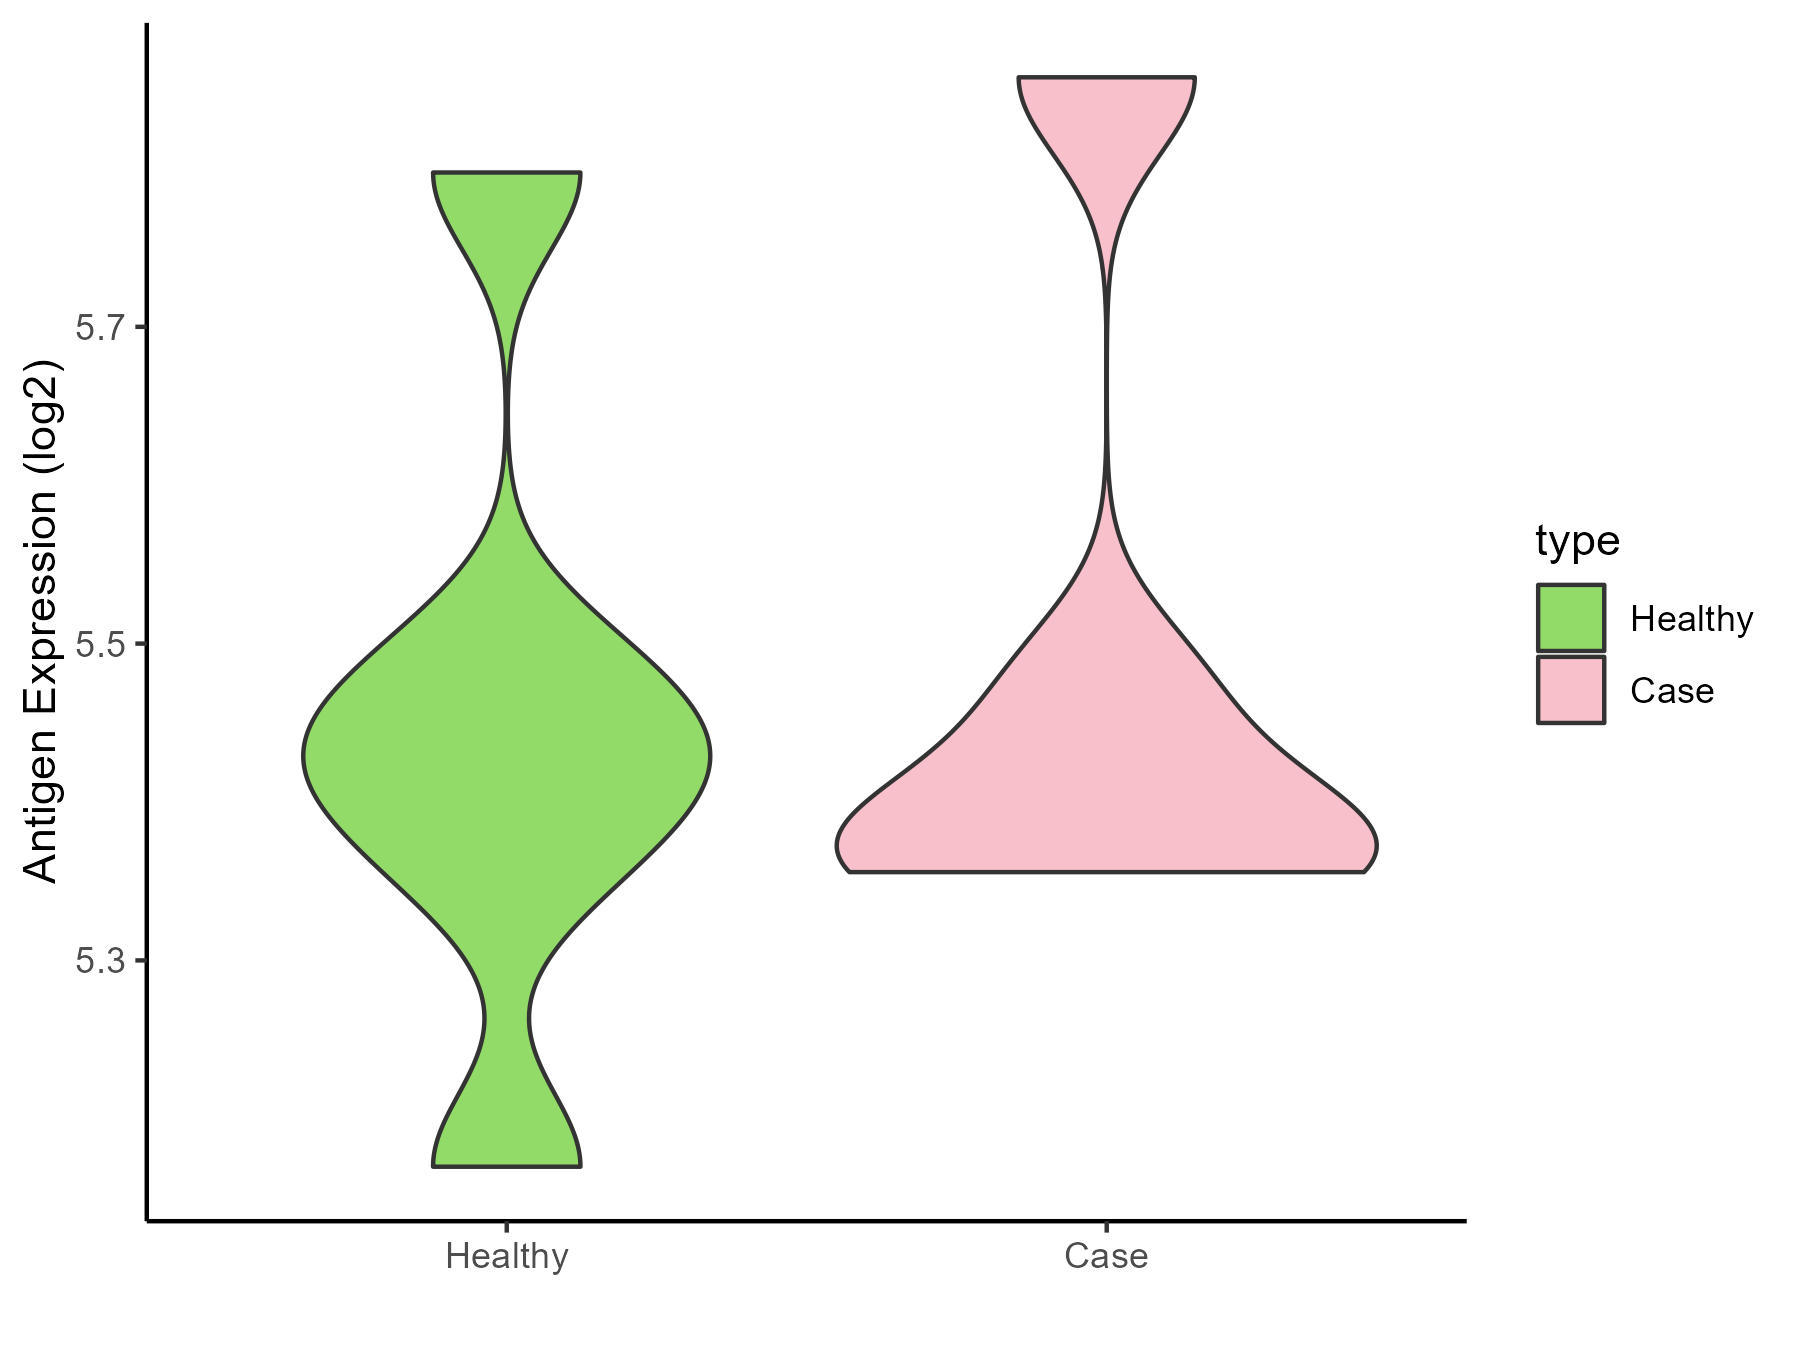
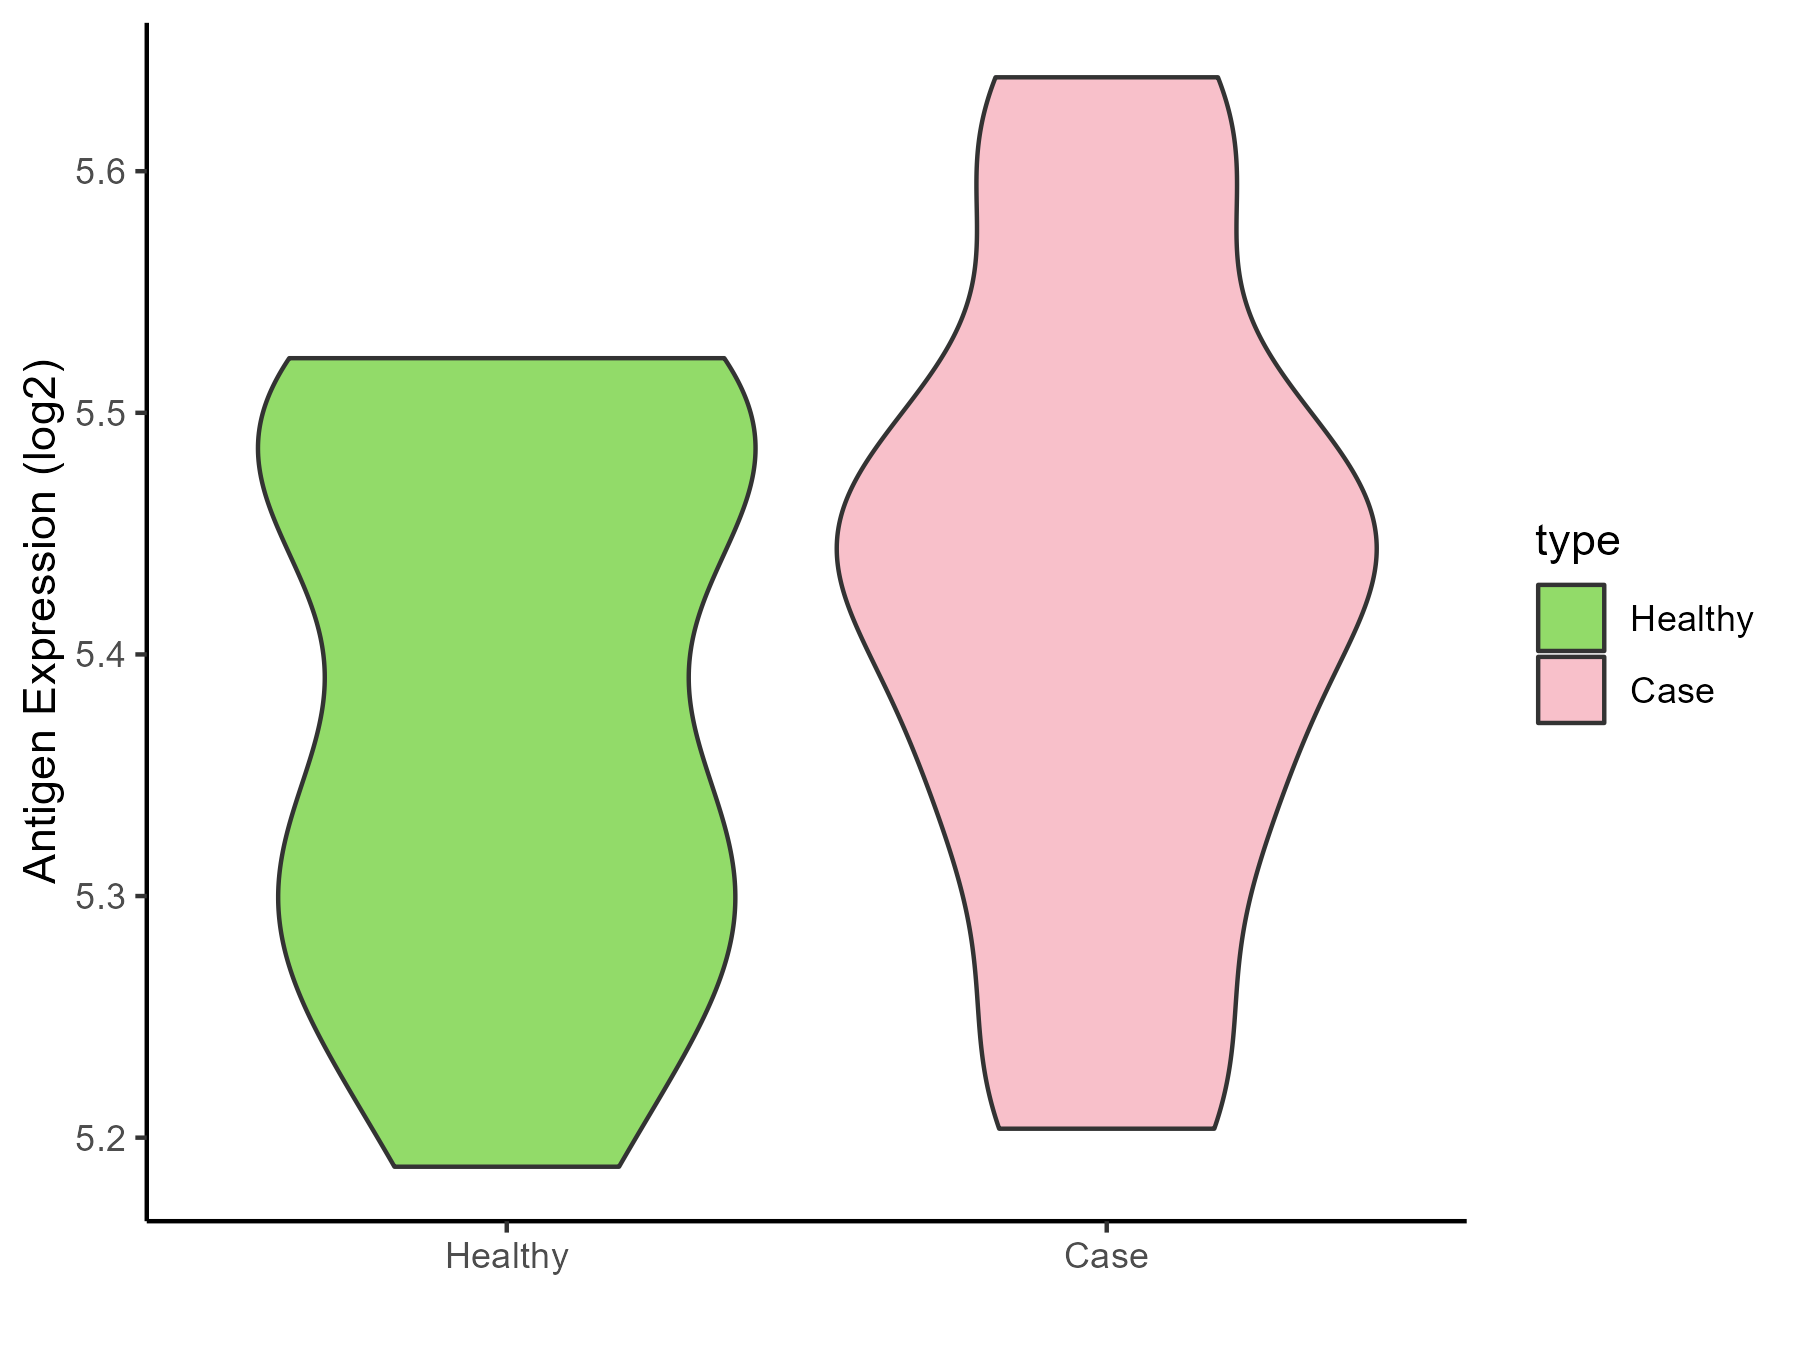
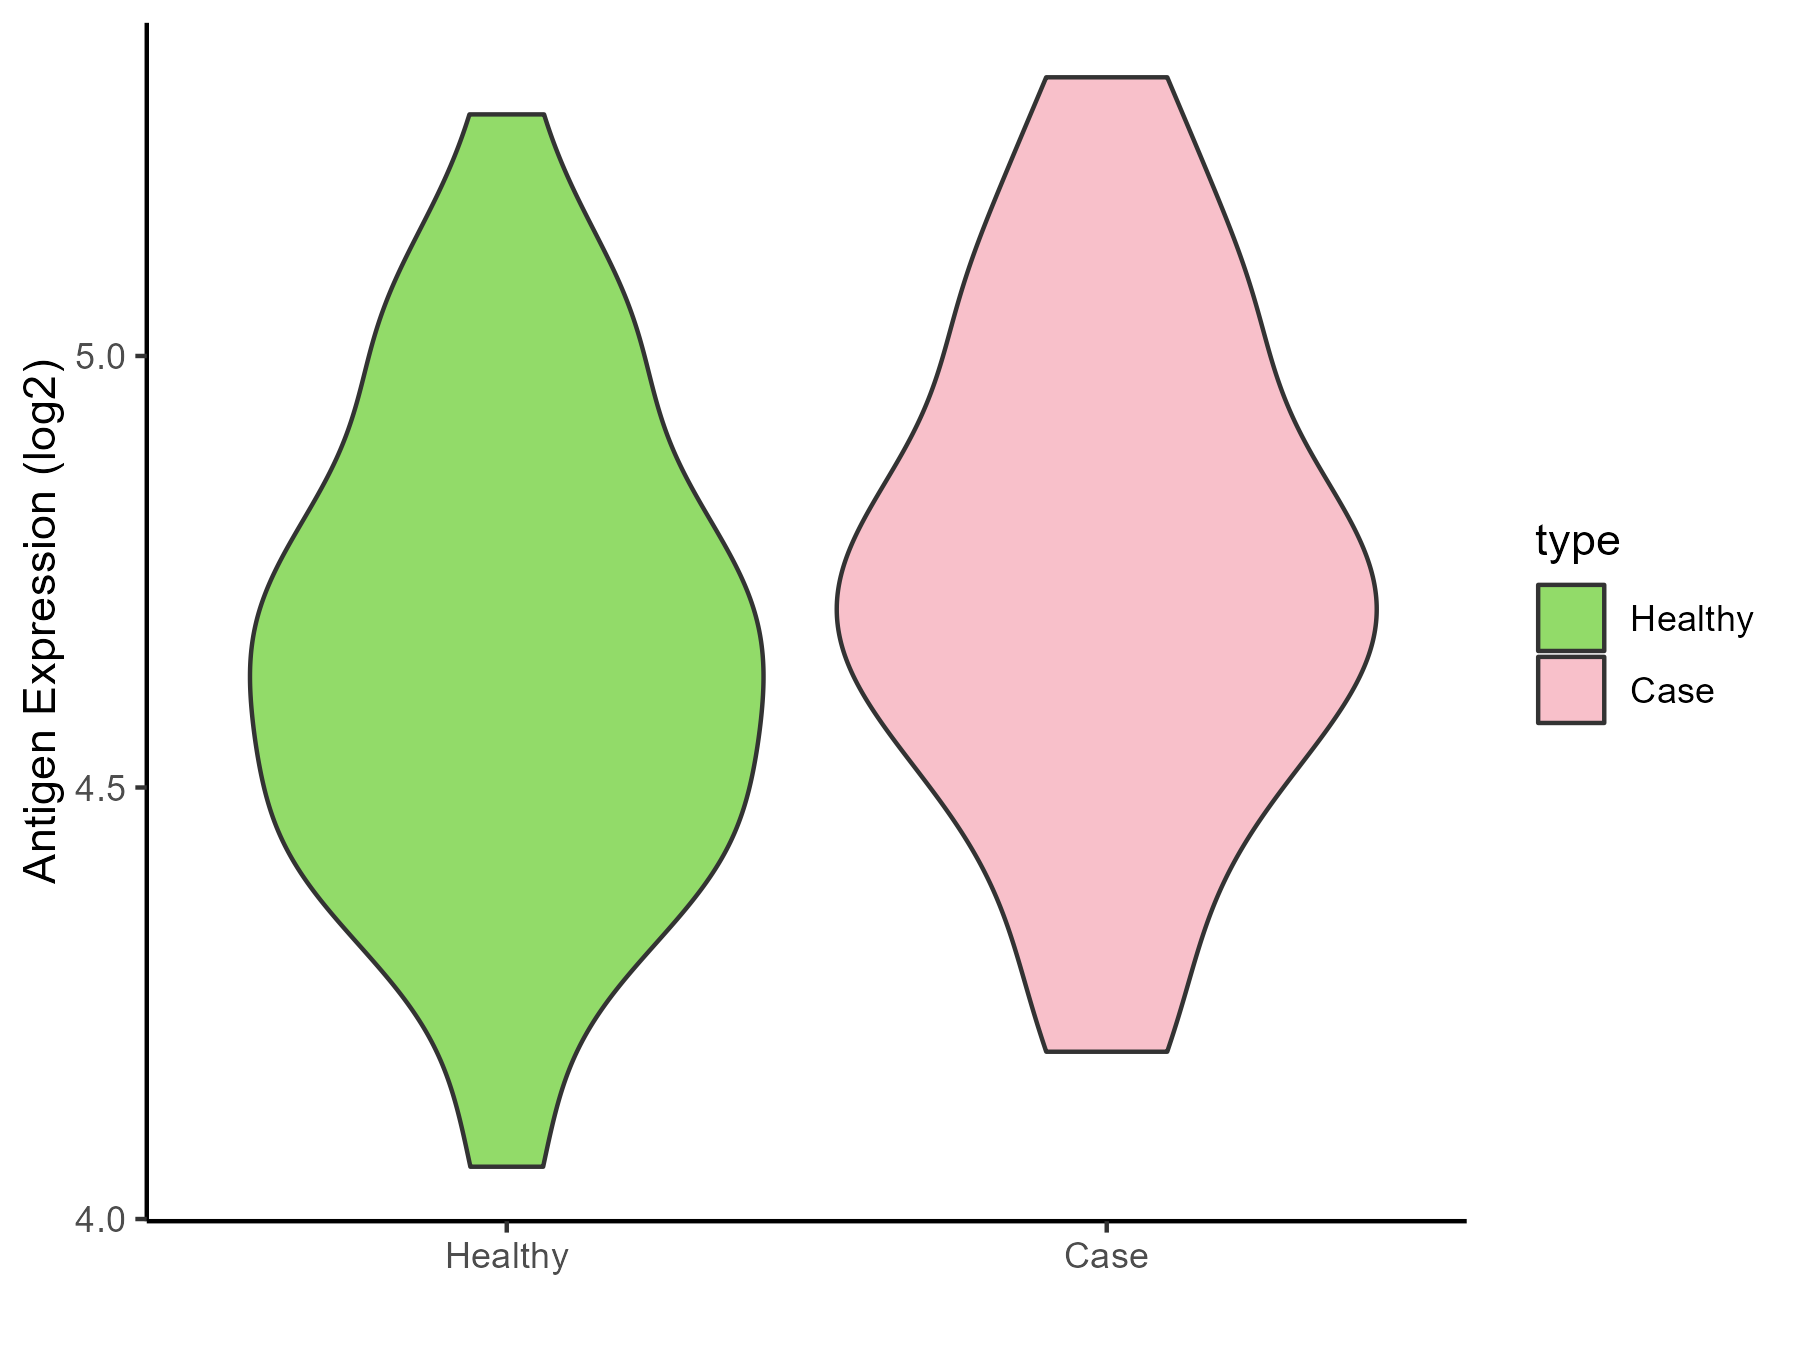
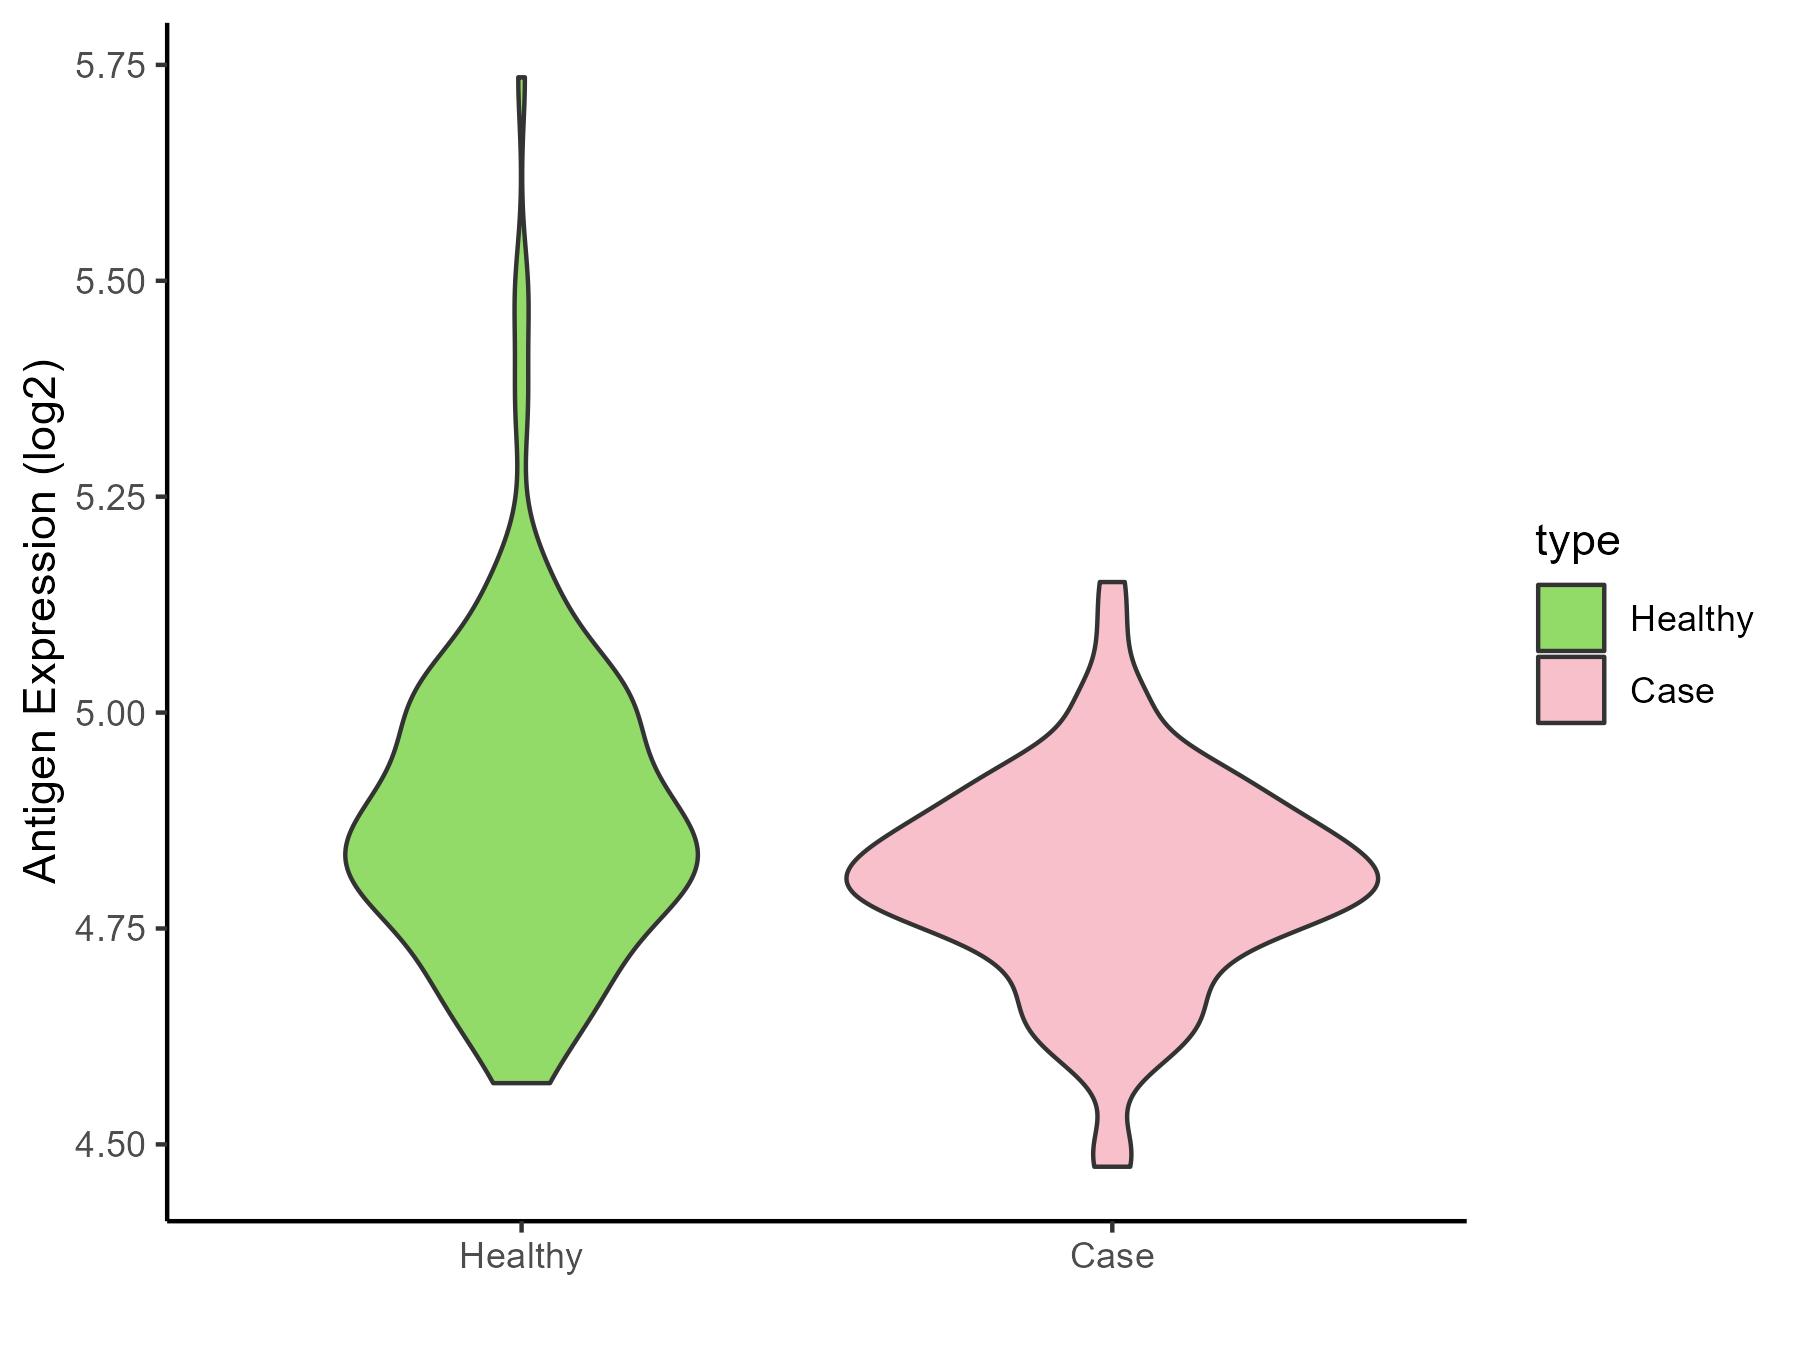
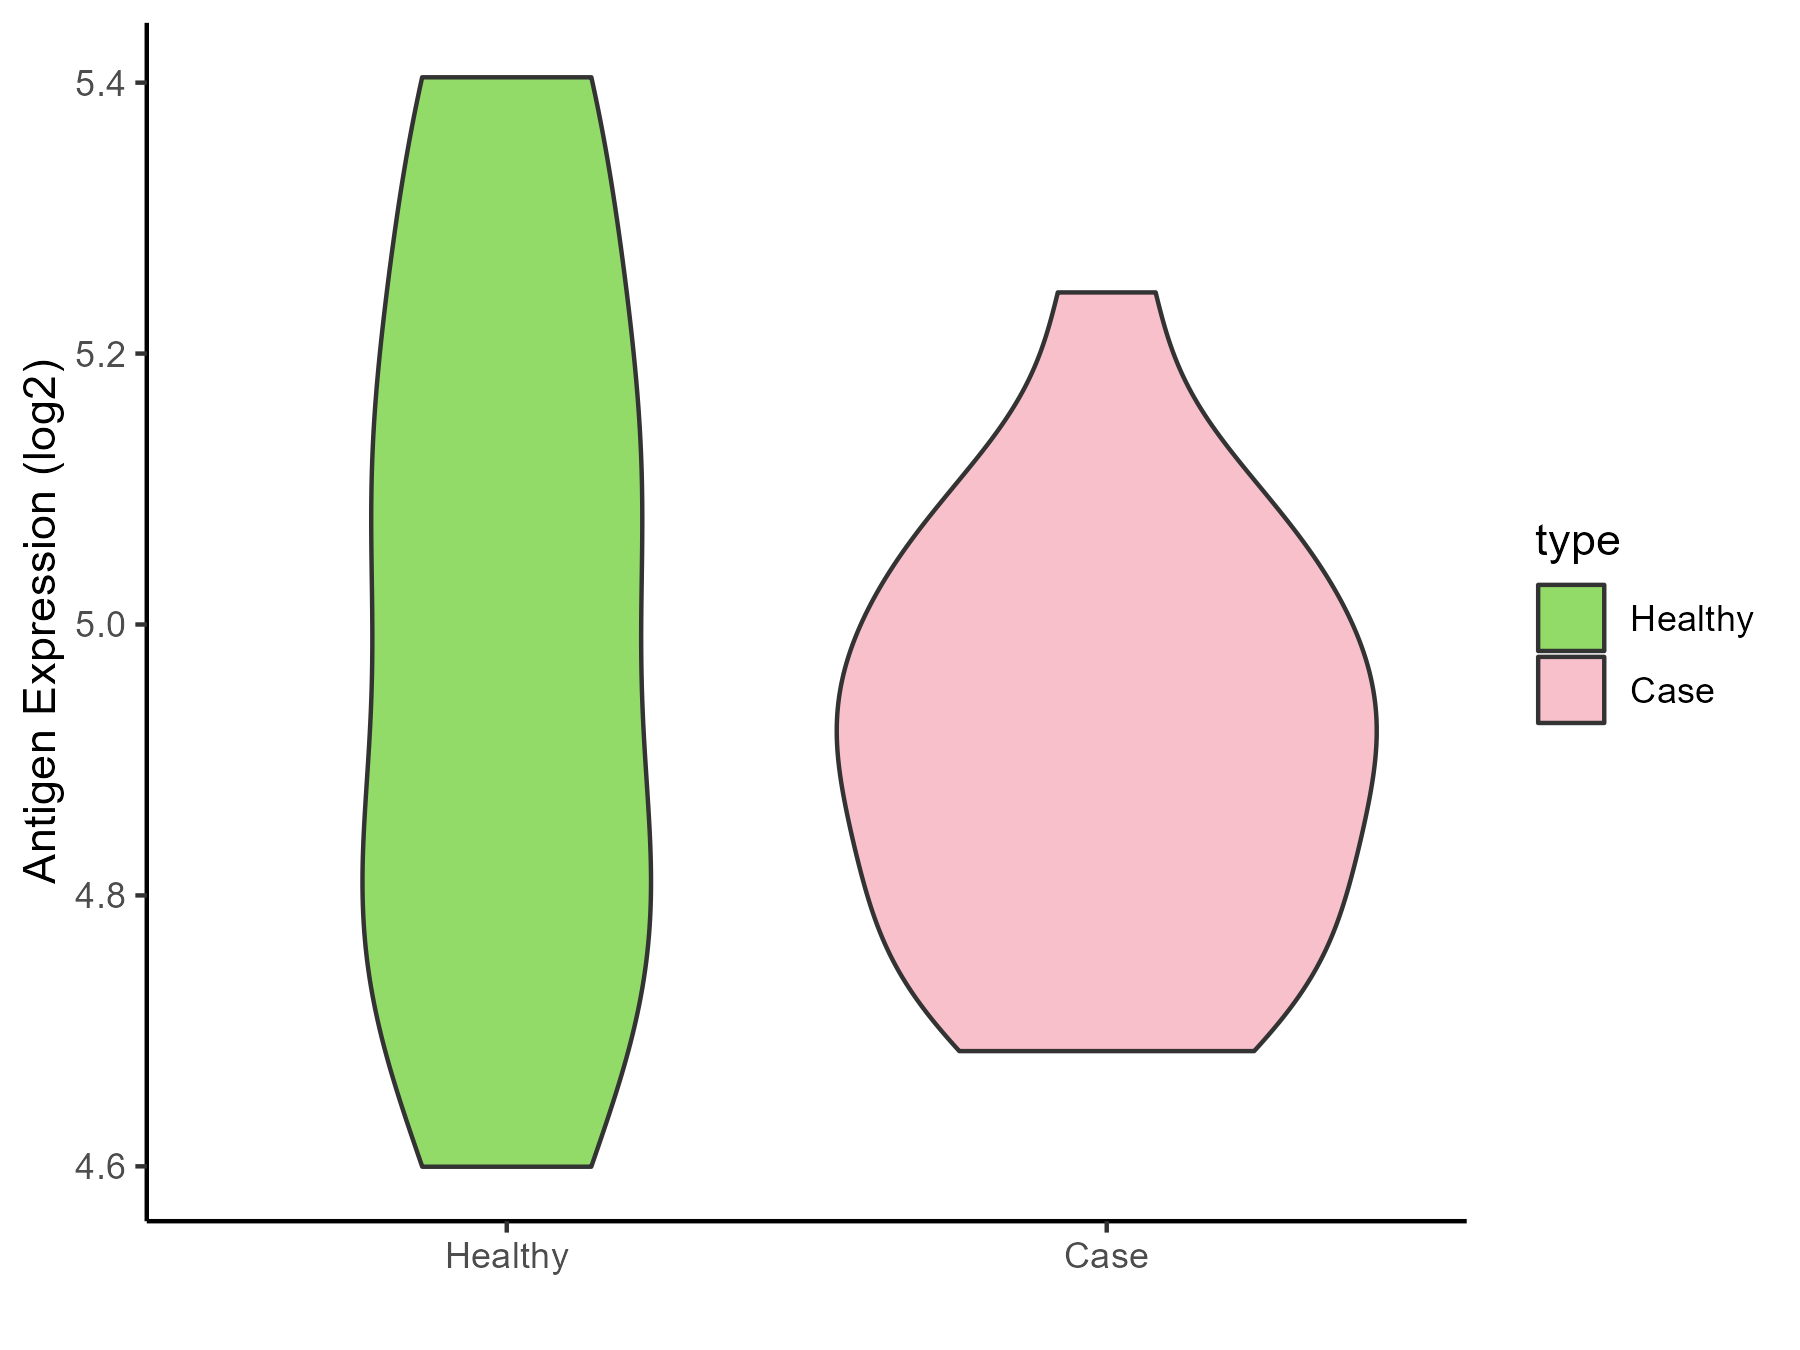
| Differential expression pattern of antigen in diseases | ||
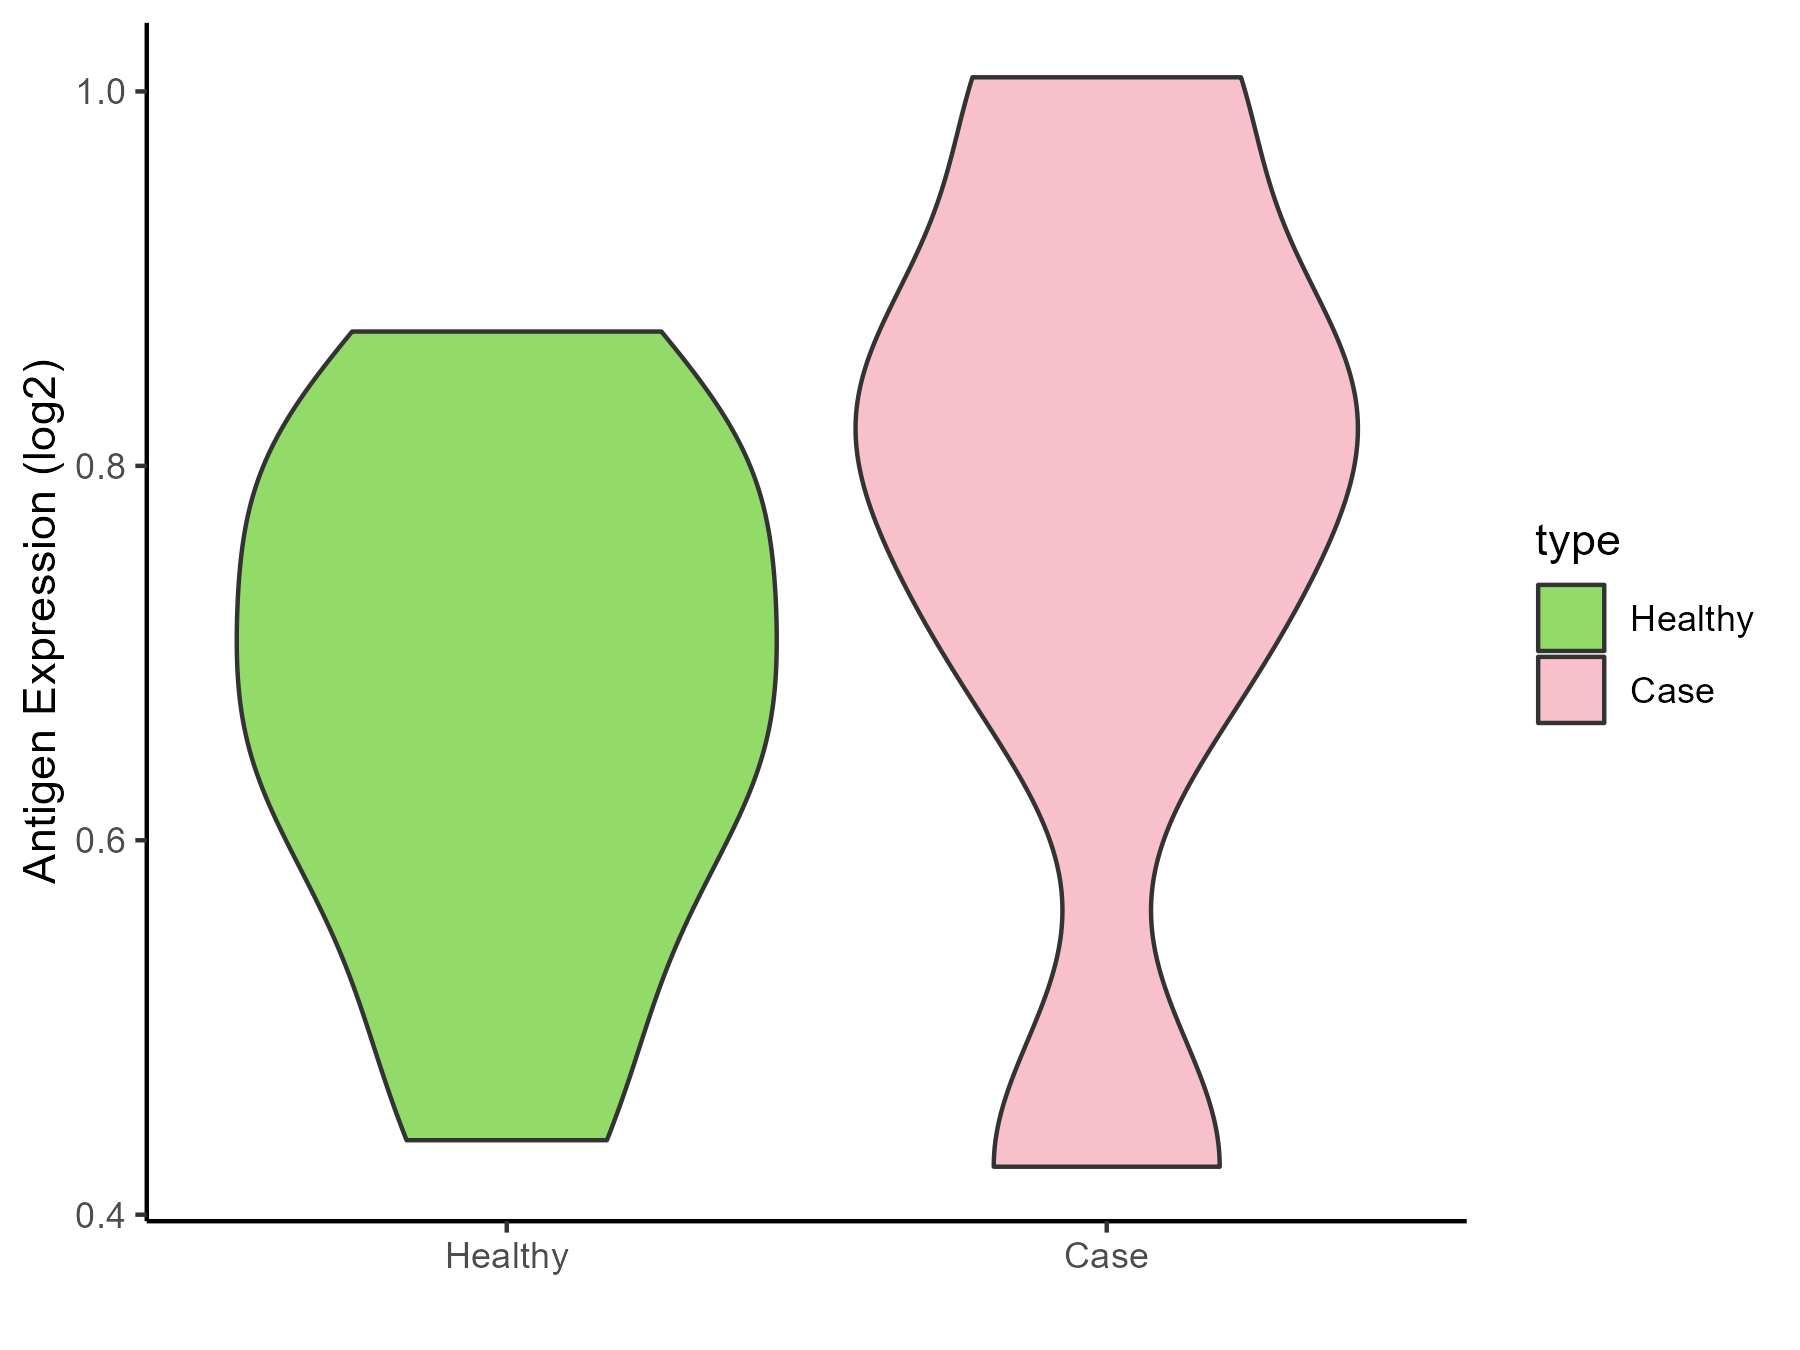
| The Studied Tissue | Gingival | |
| The Specific Disease | Bacterial infection of gingival | |
| The Expression Level of Disease Section Compare with the Healthy Individual Tissue | p-value: 0.646003732; Fold-change: 0.02005813; Z-score: 0.104342136 | |
| Disease-specific Antigen Abundances |
|
Click to View the Clearer Original Diagram |
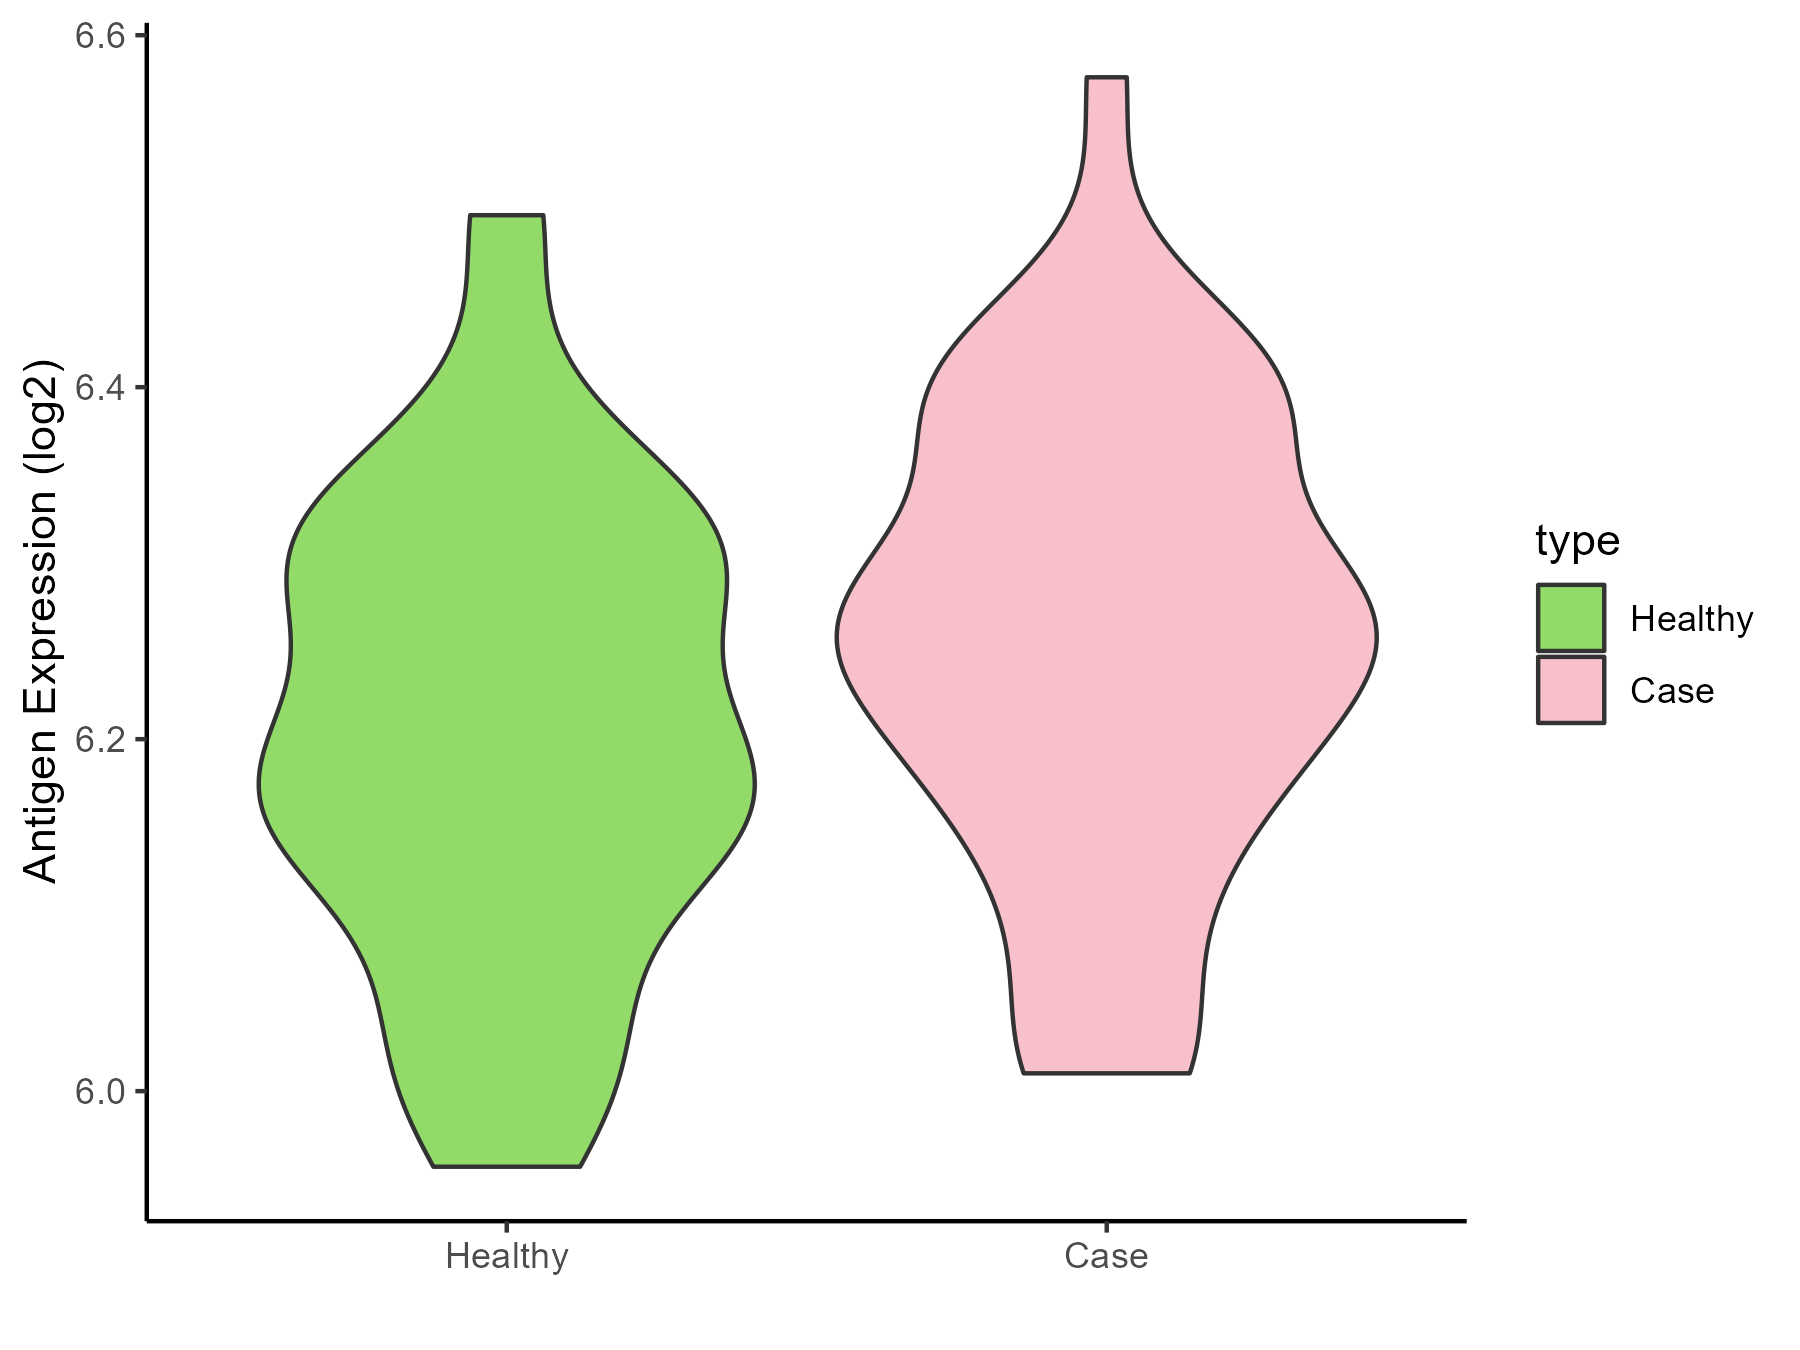
ICD Disease Classification 02
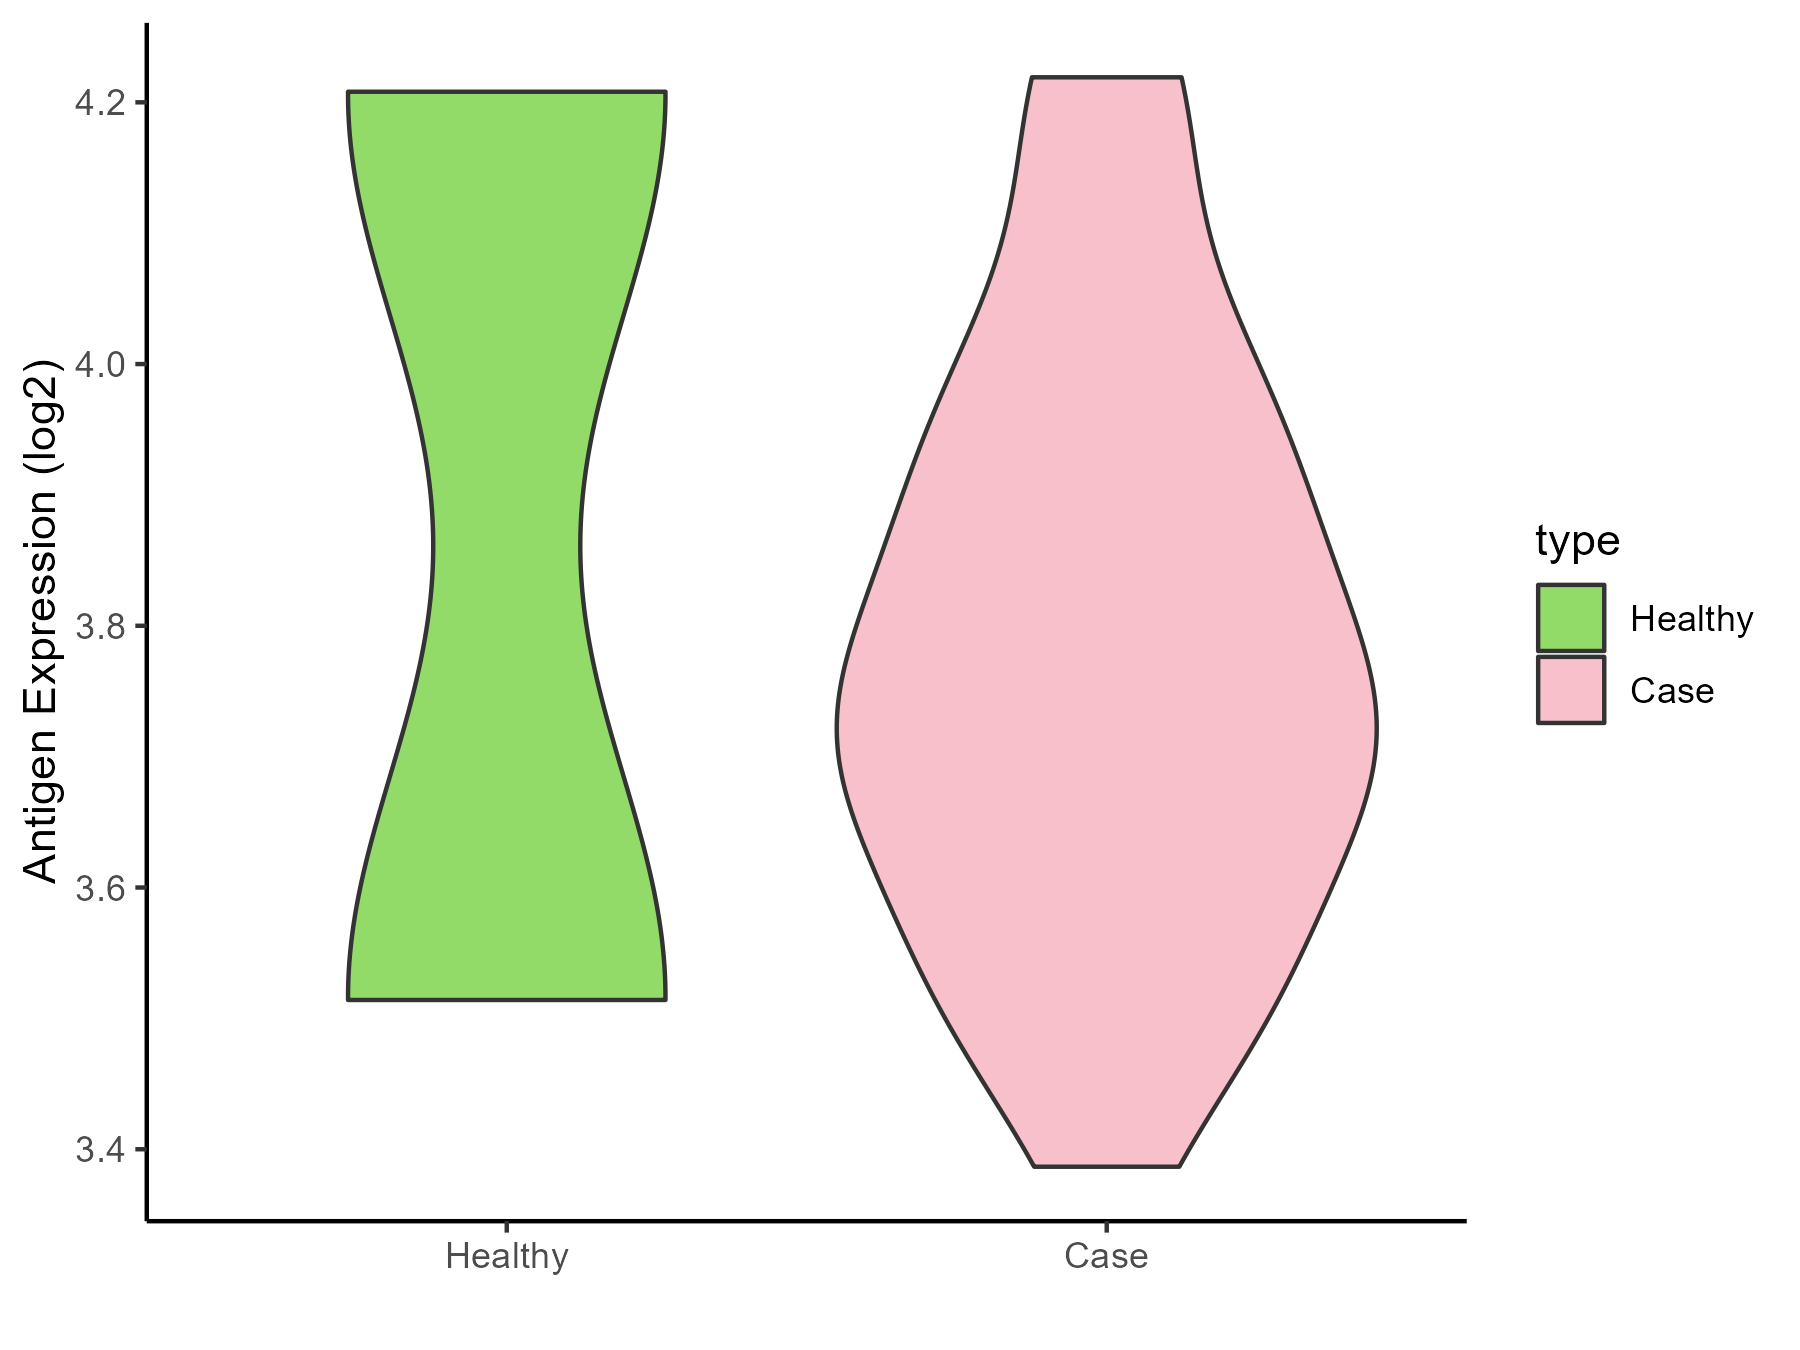
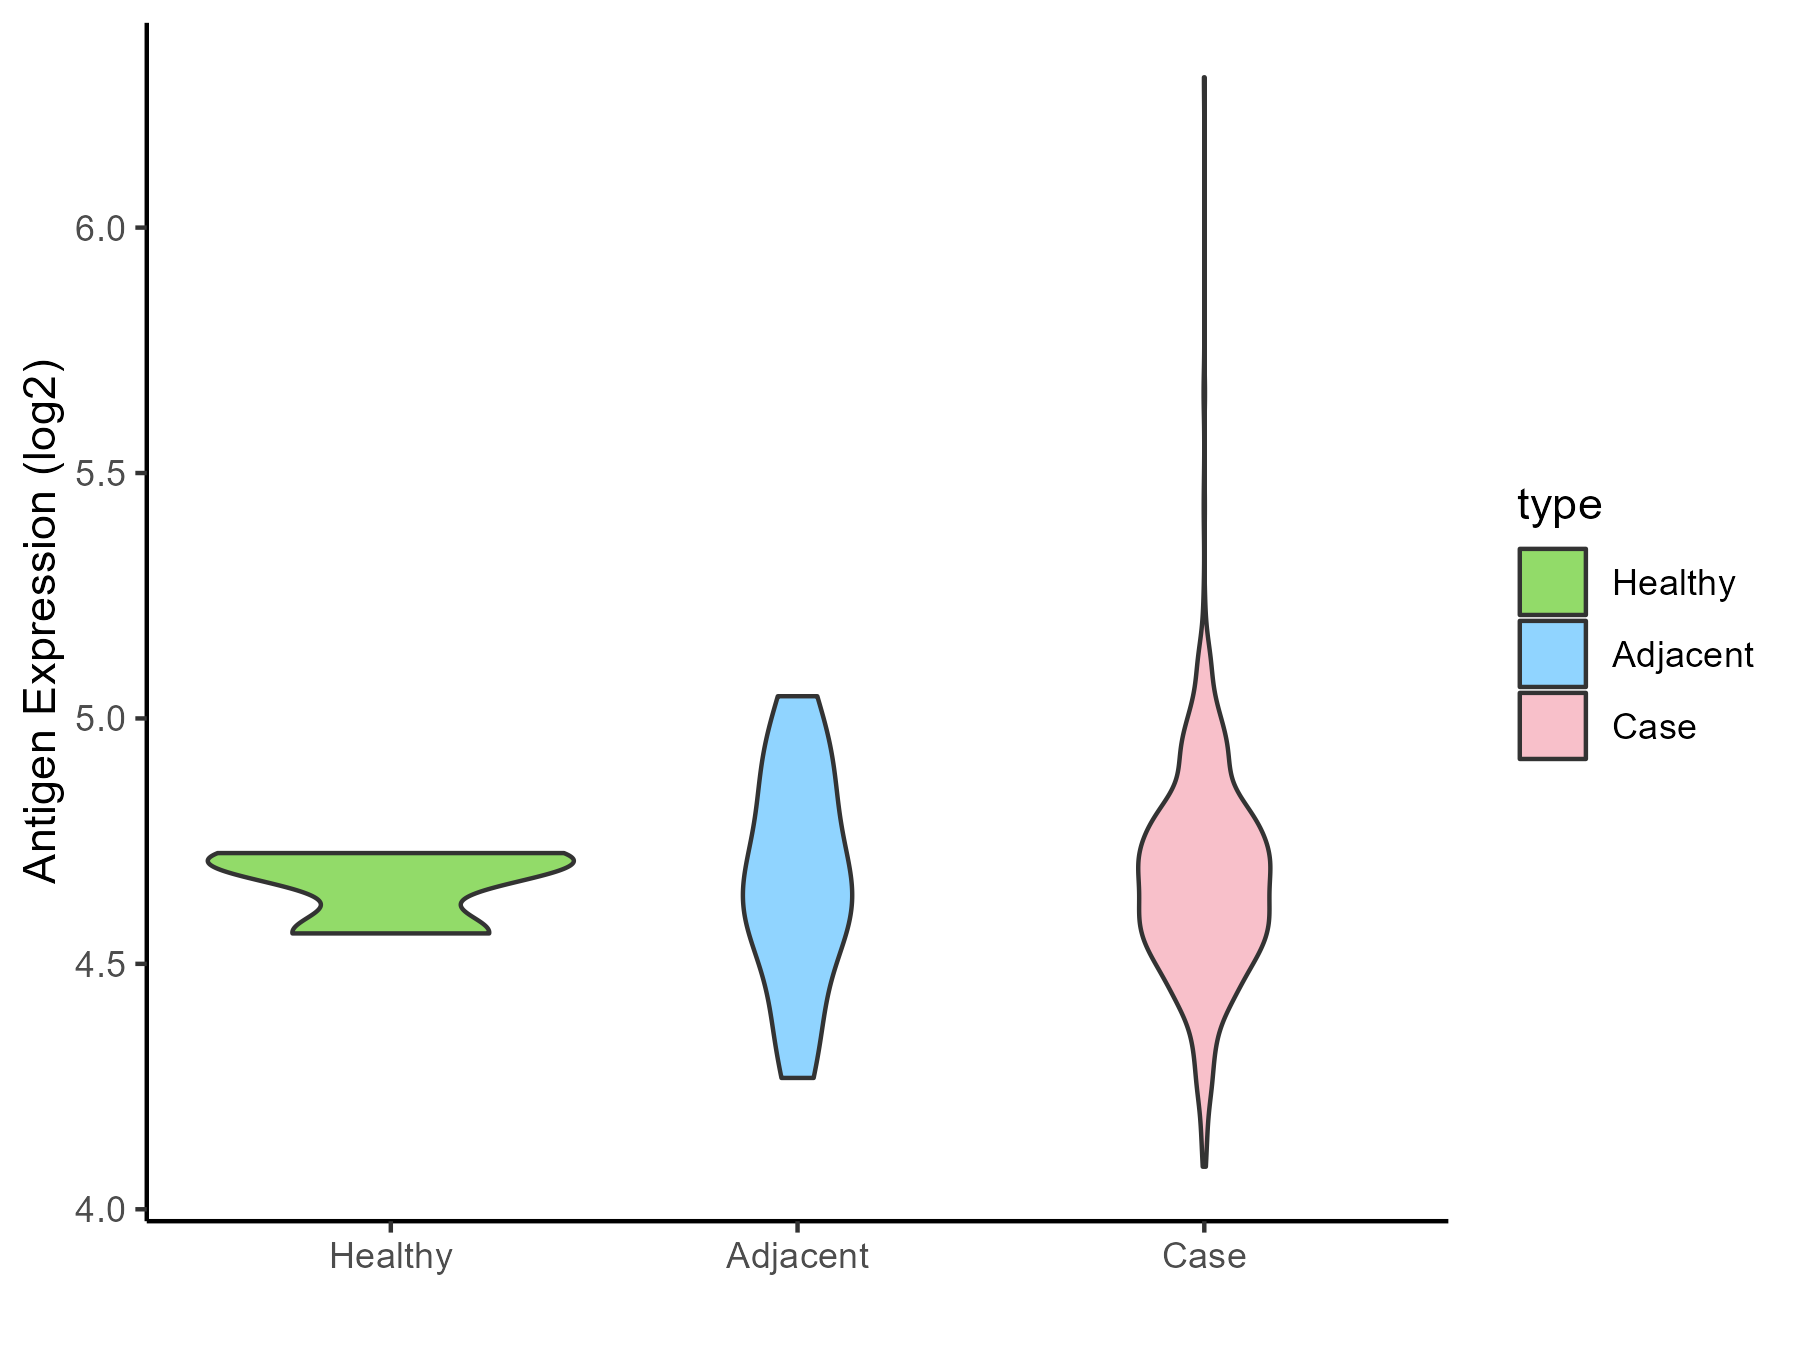
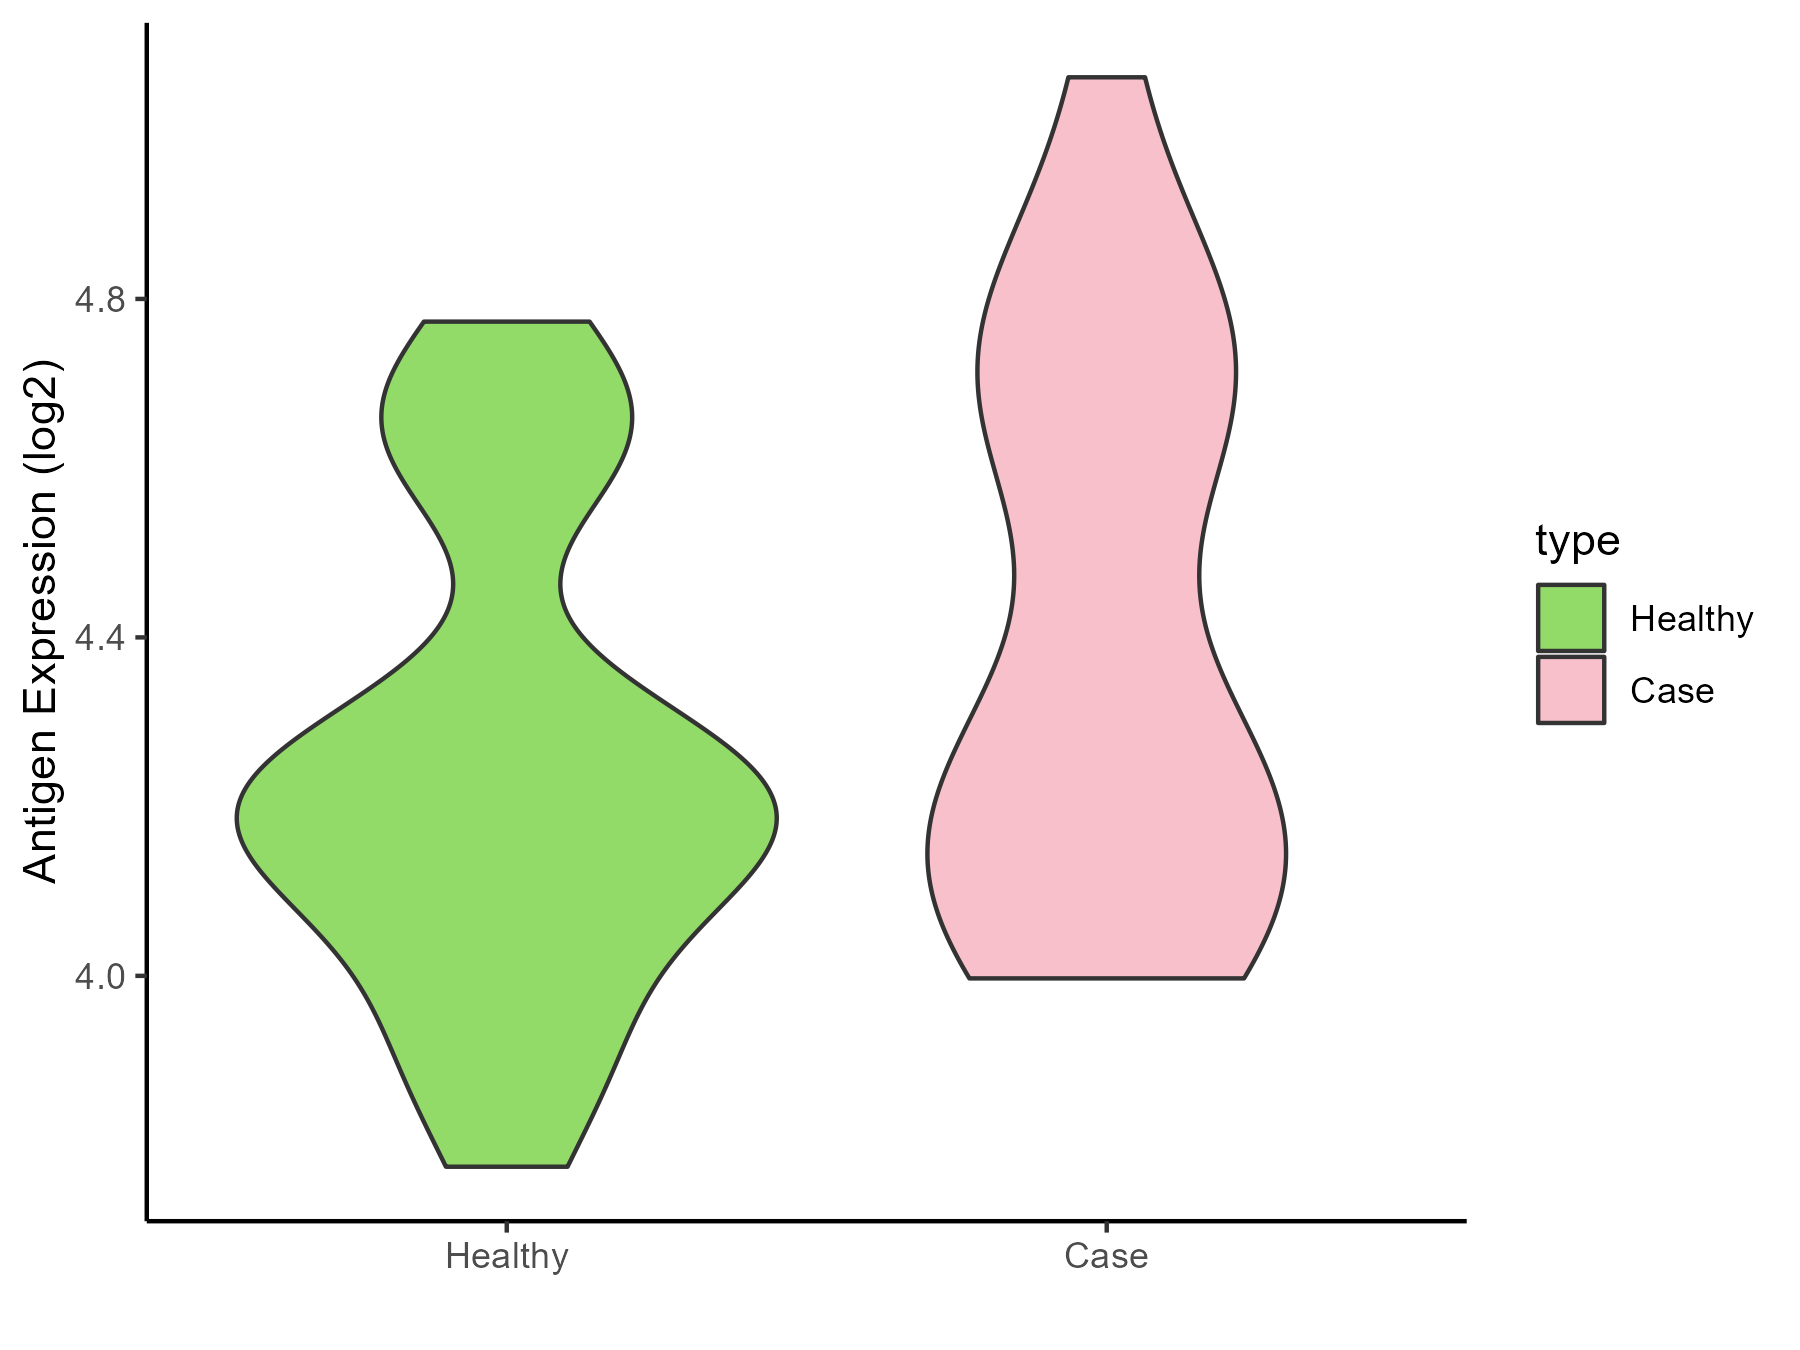
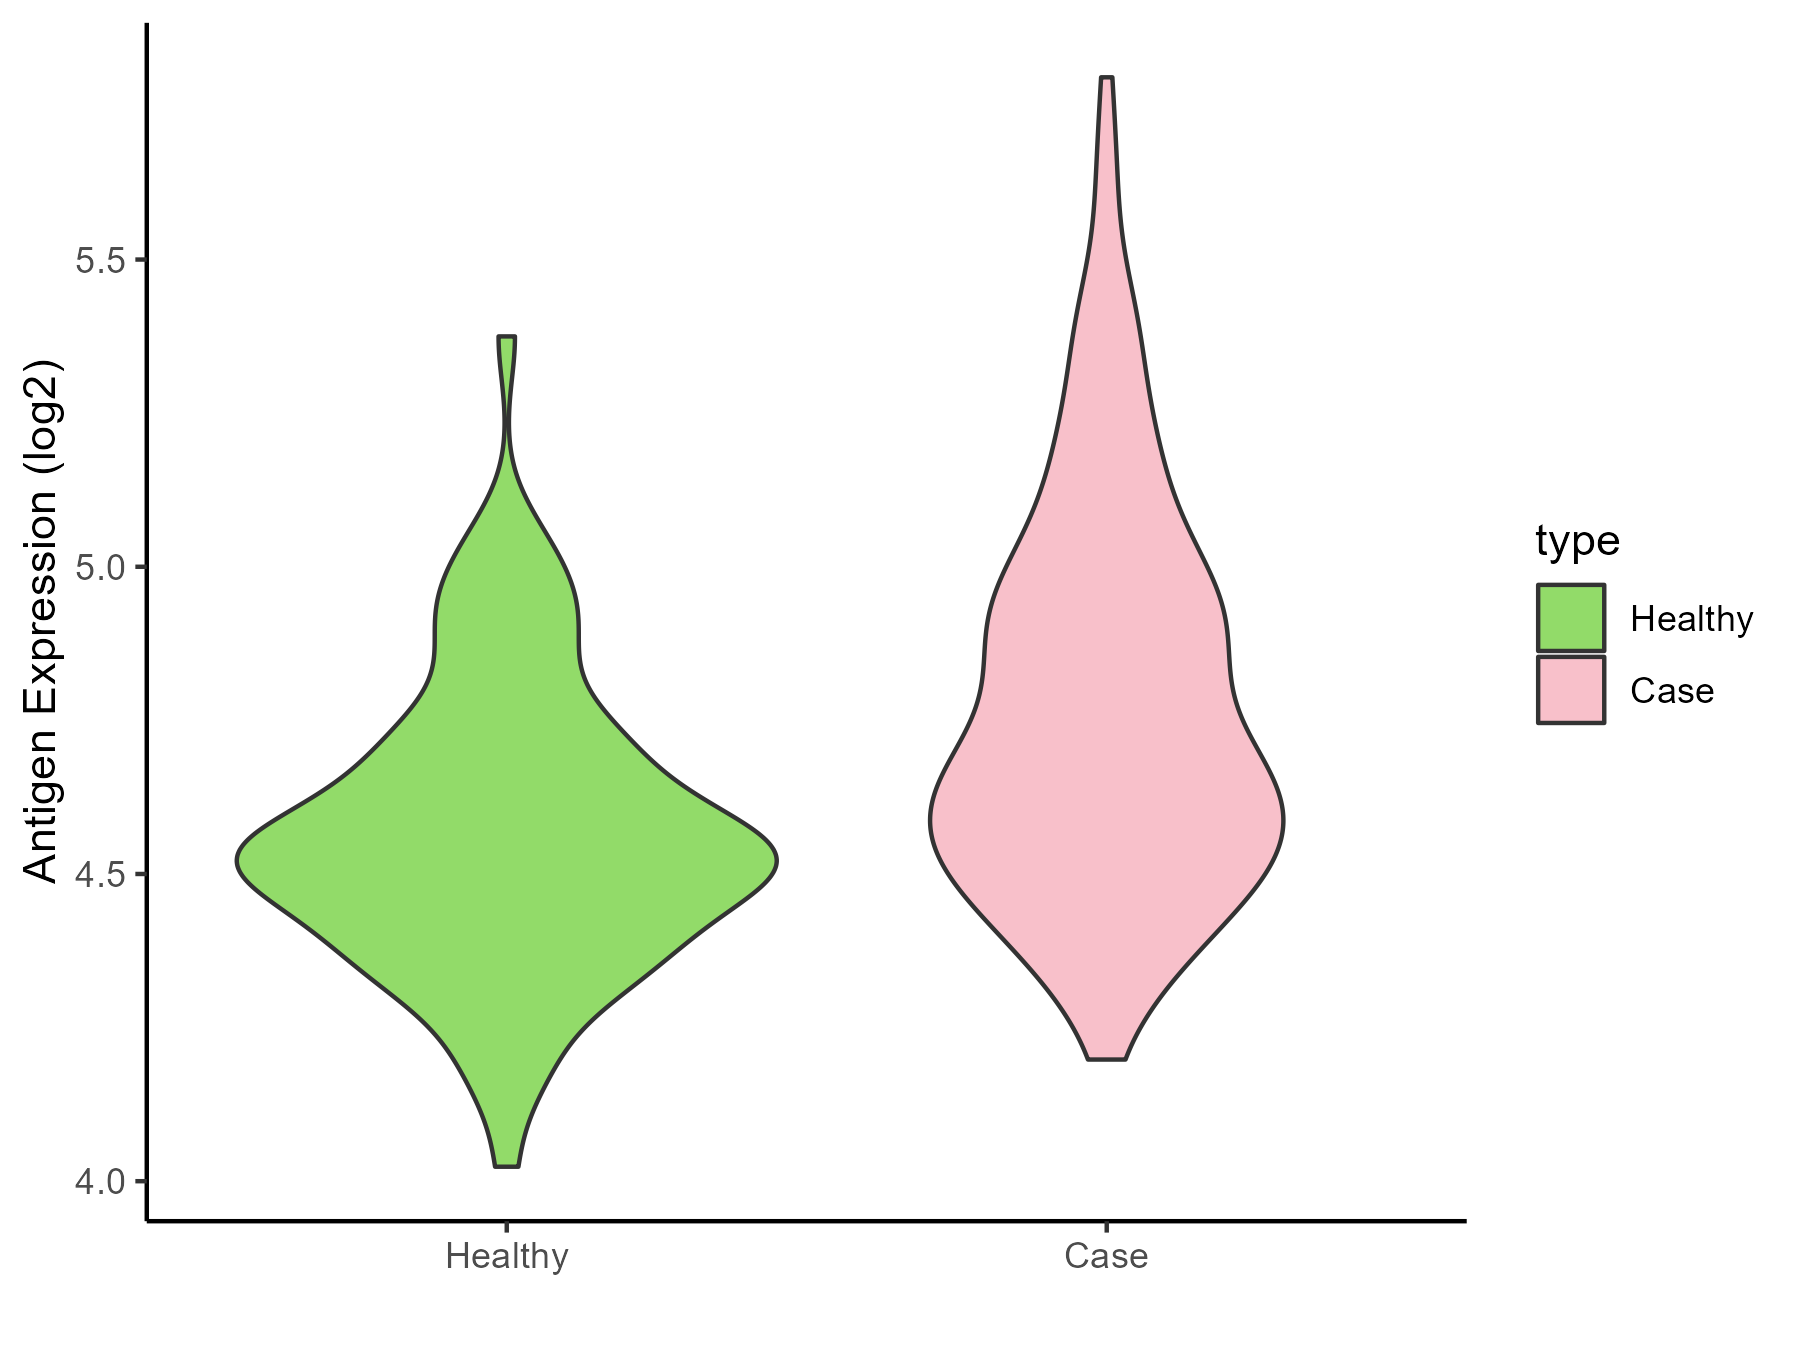
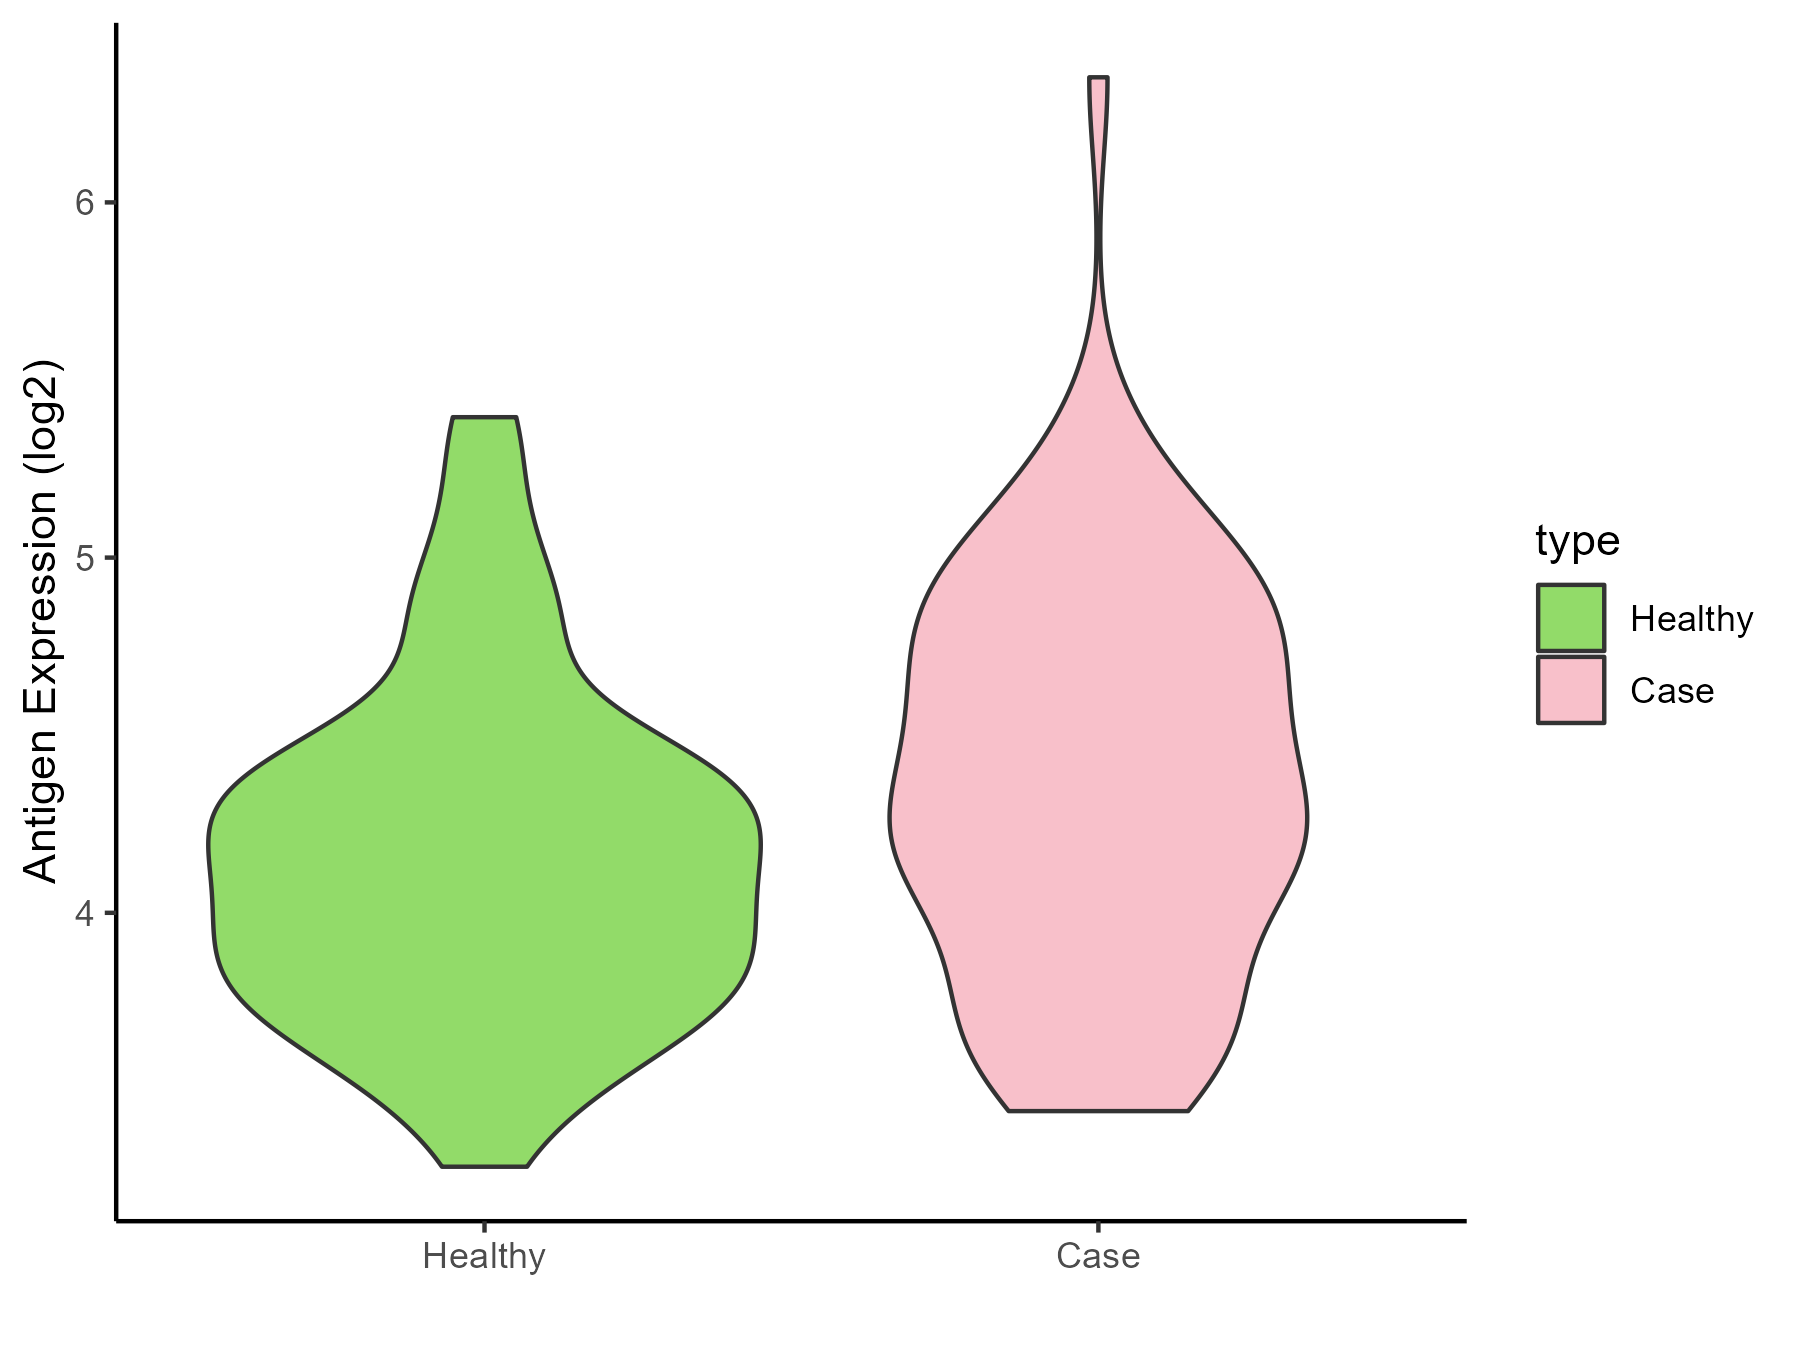
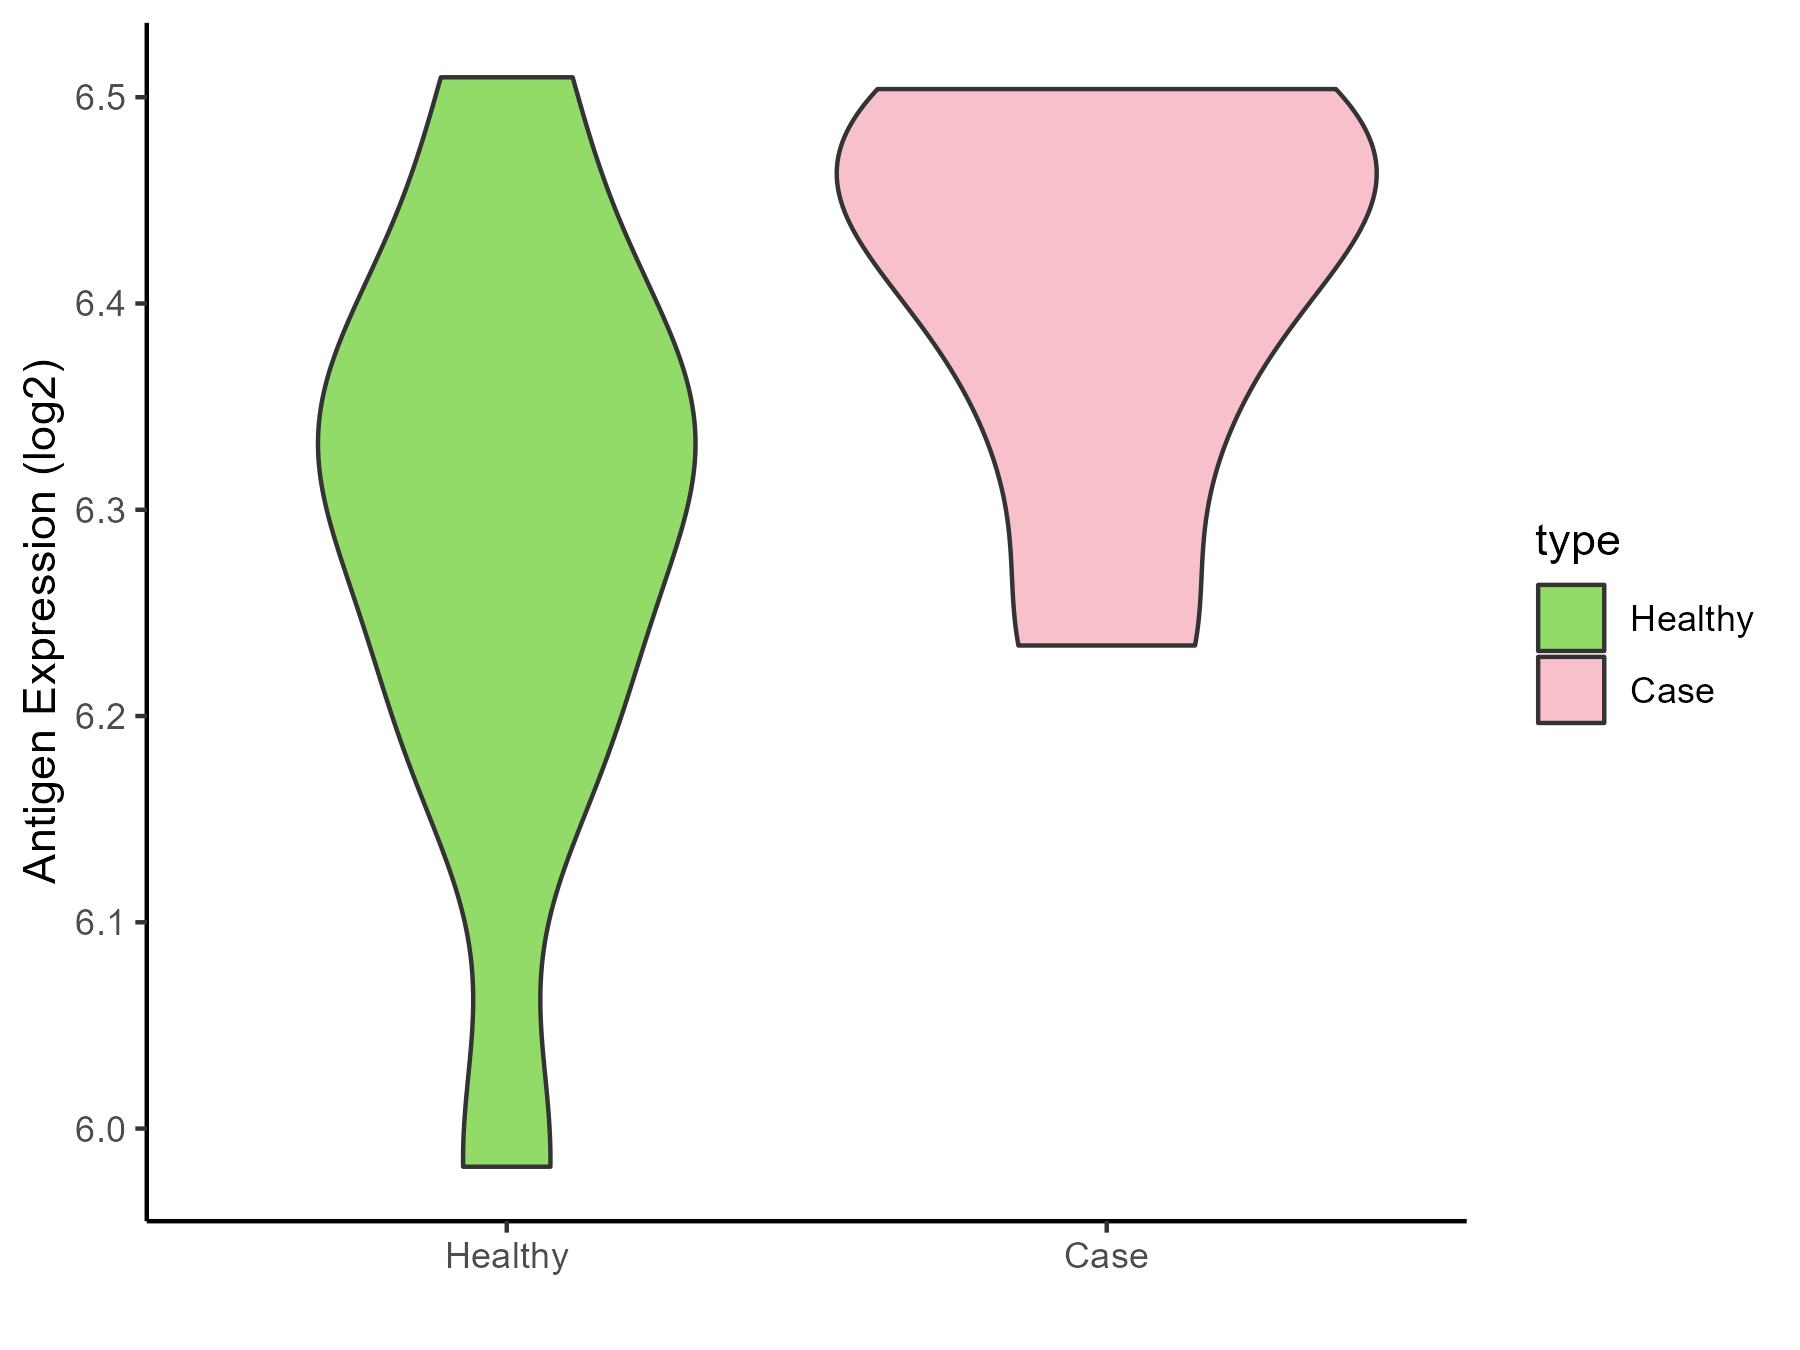
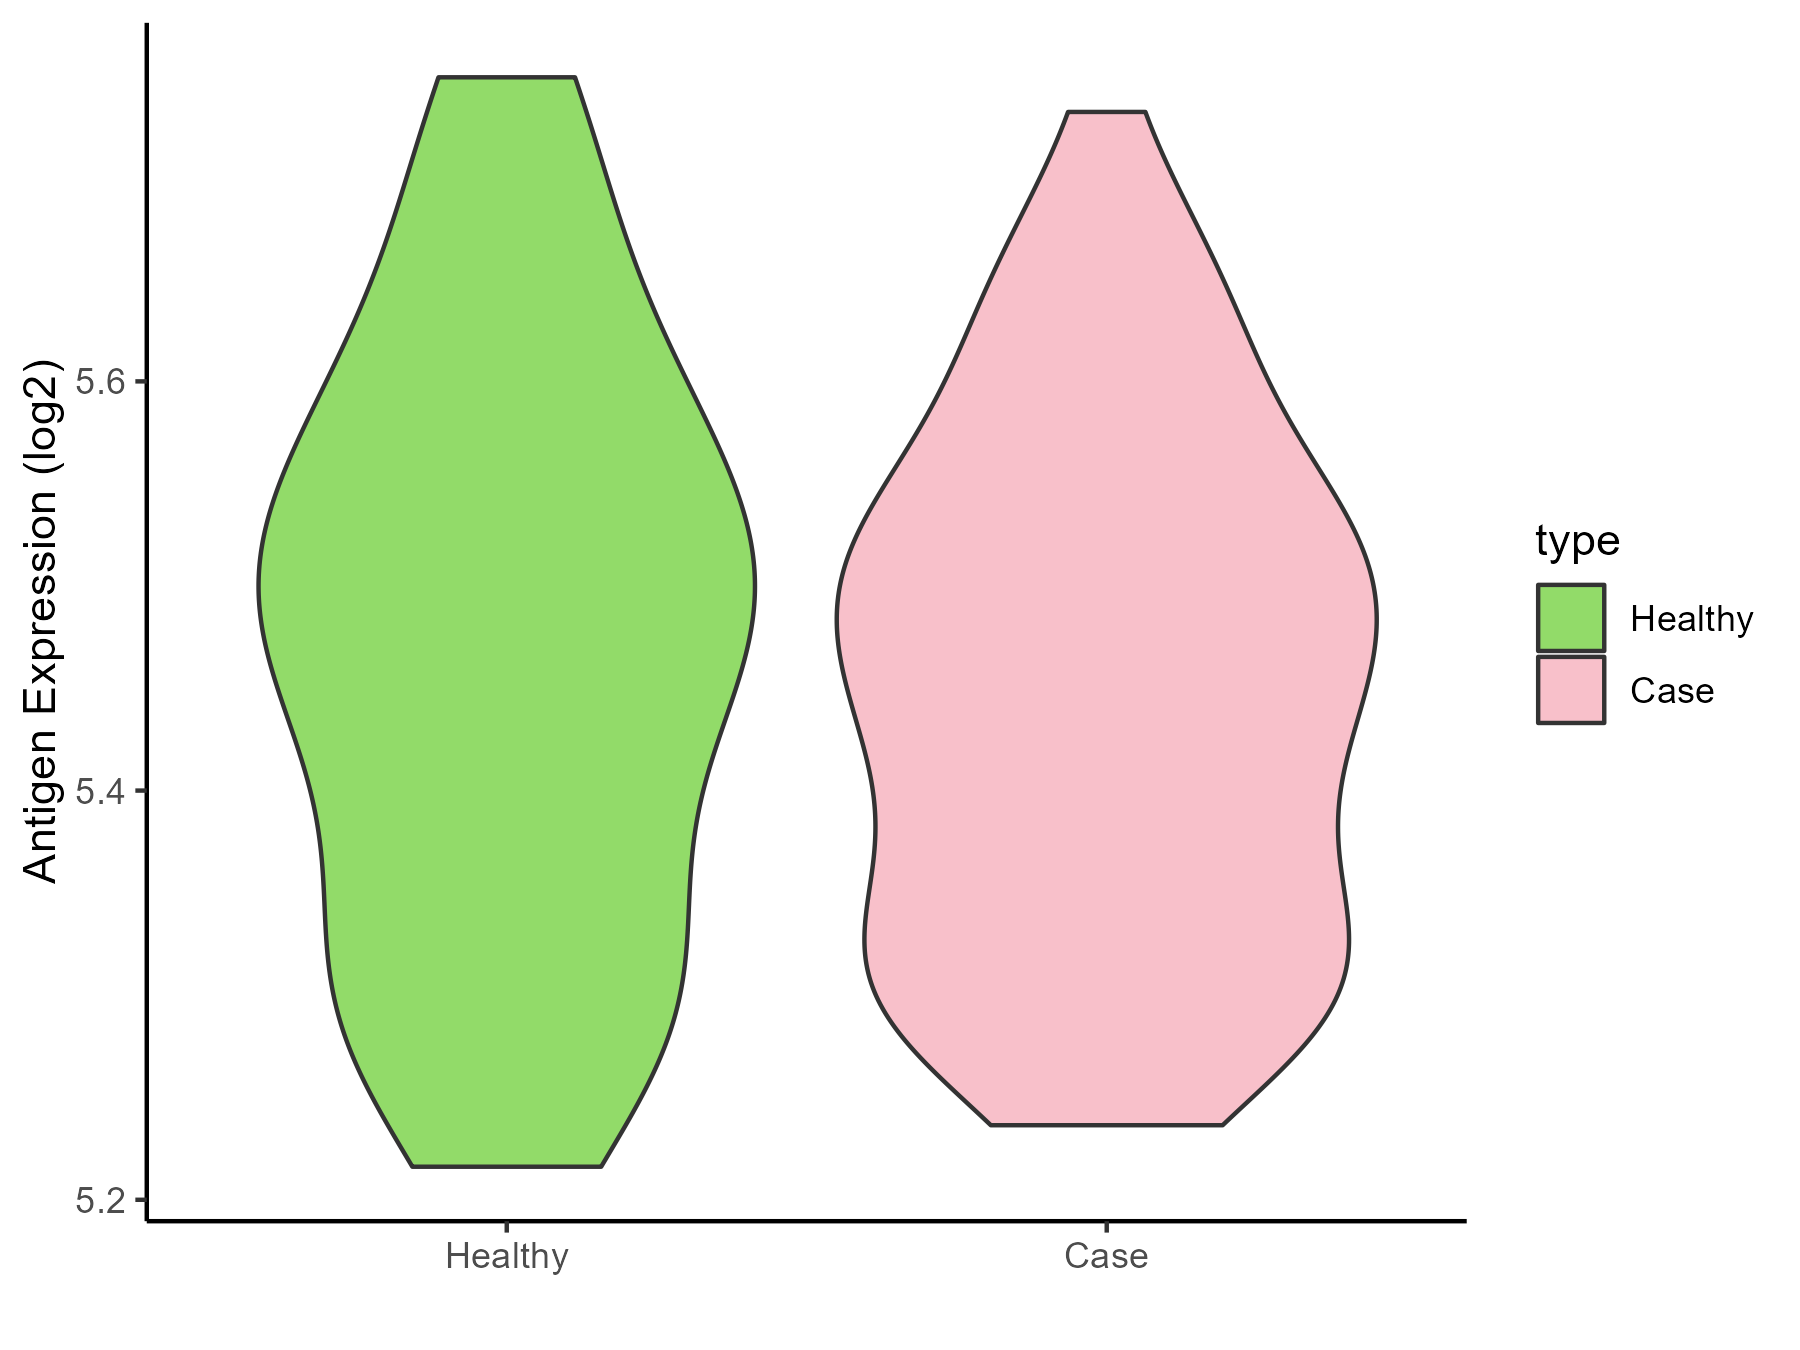
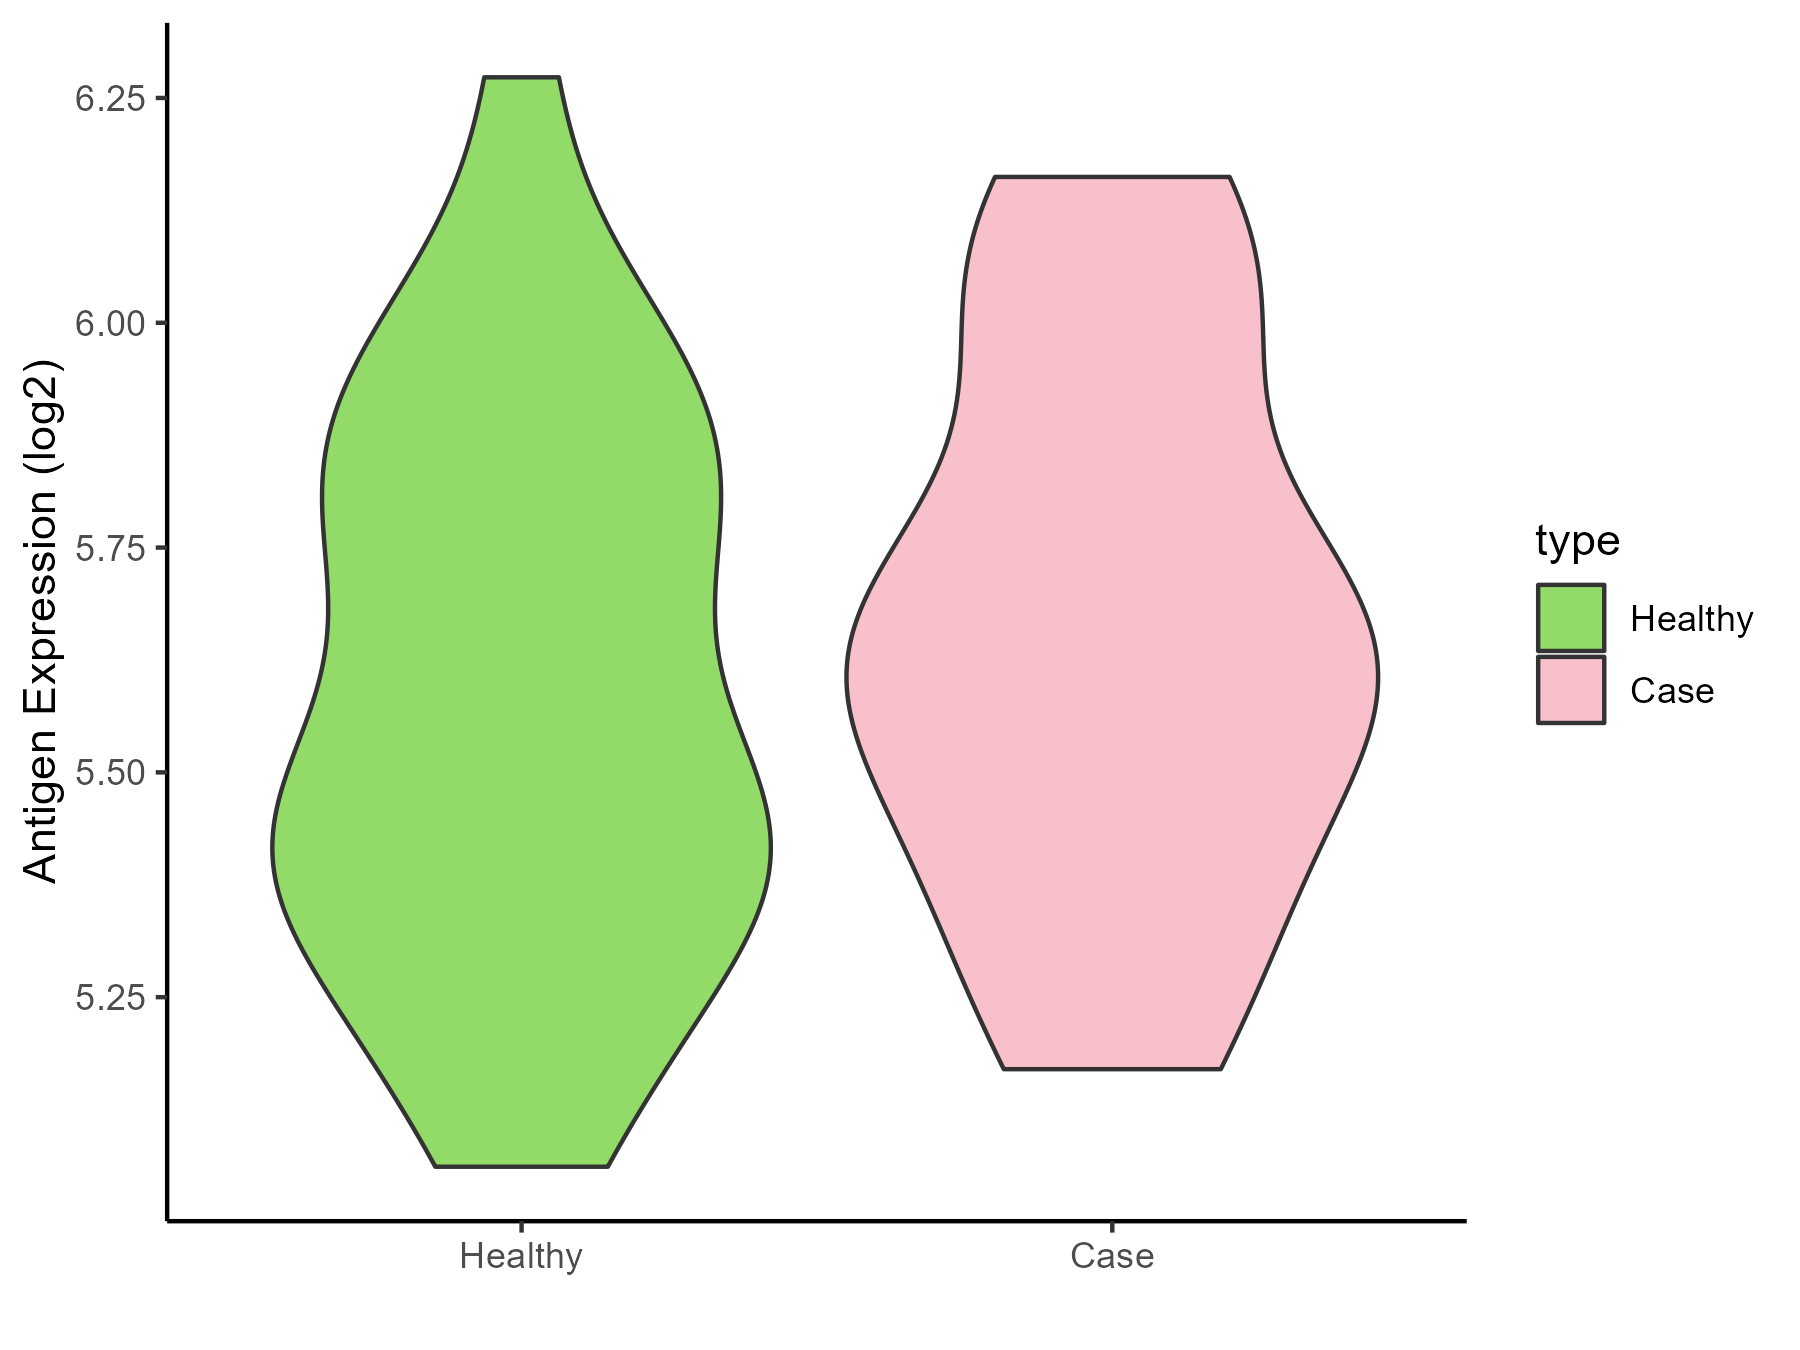
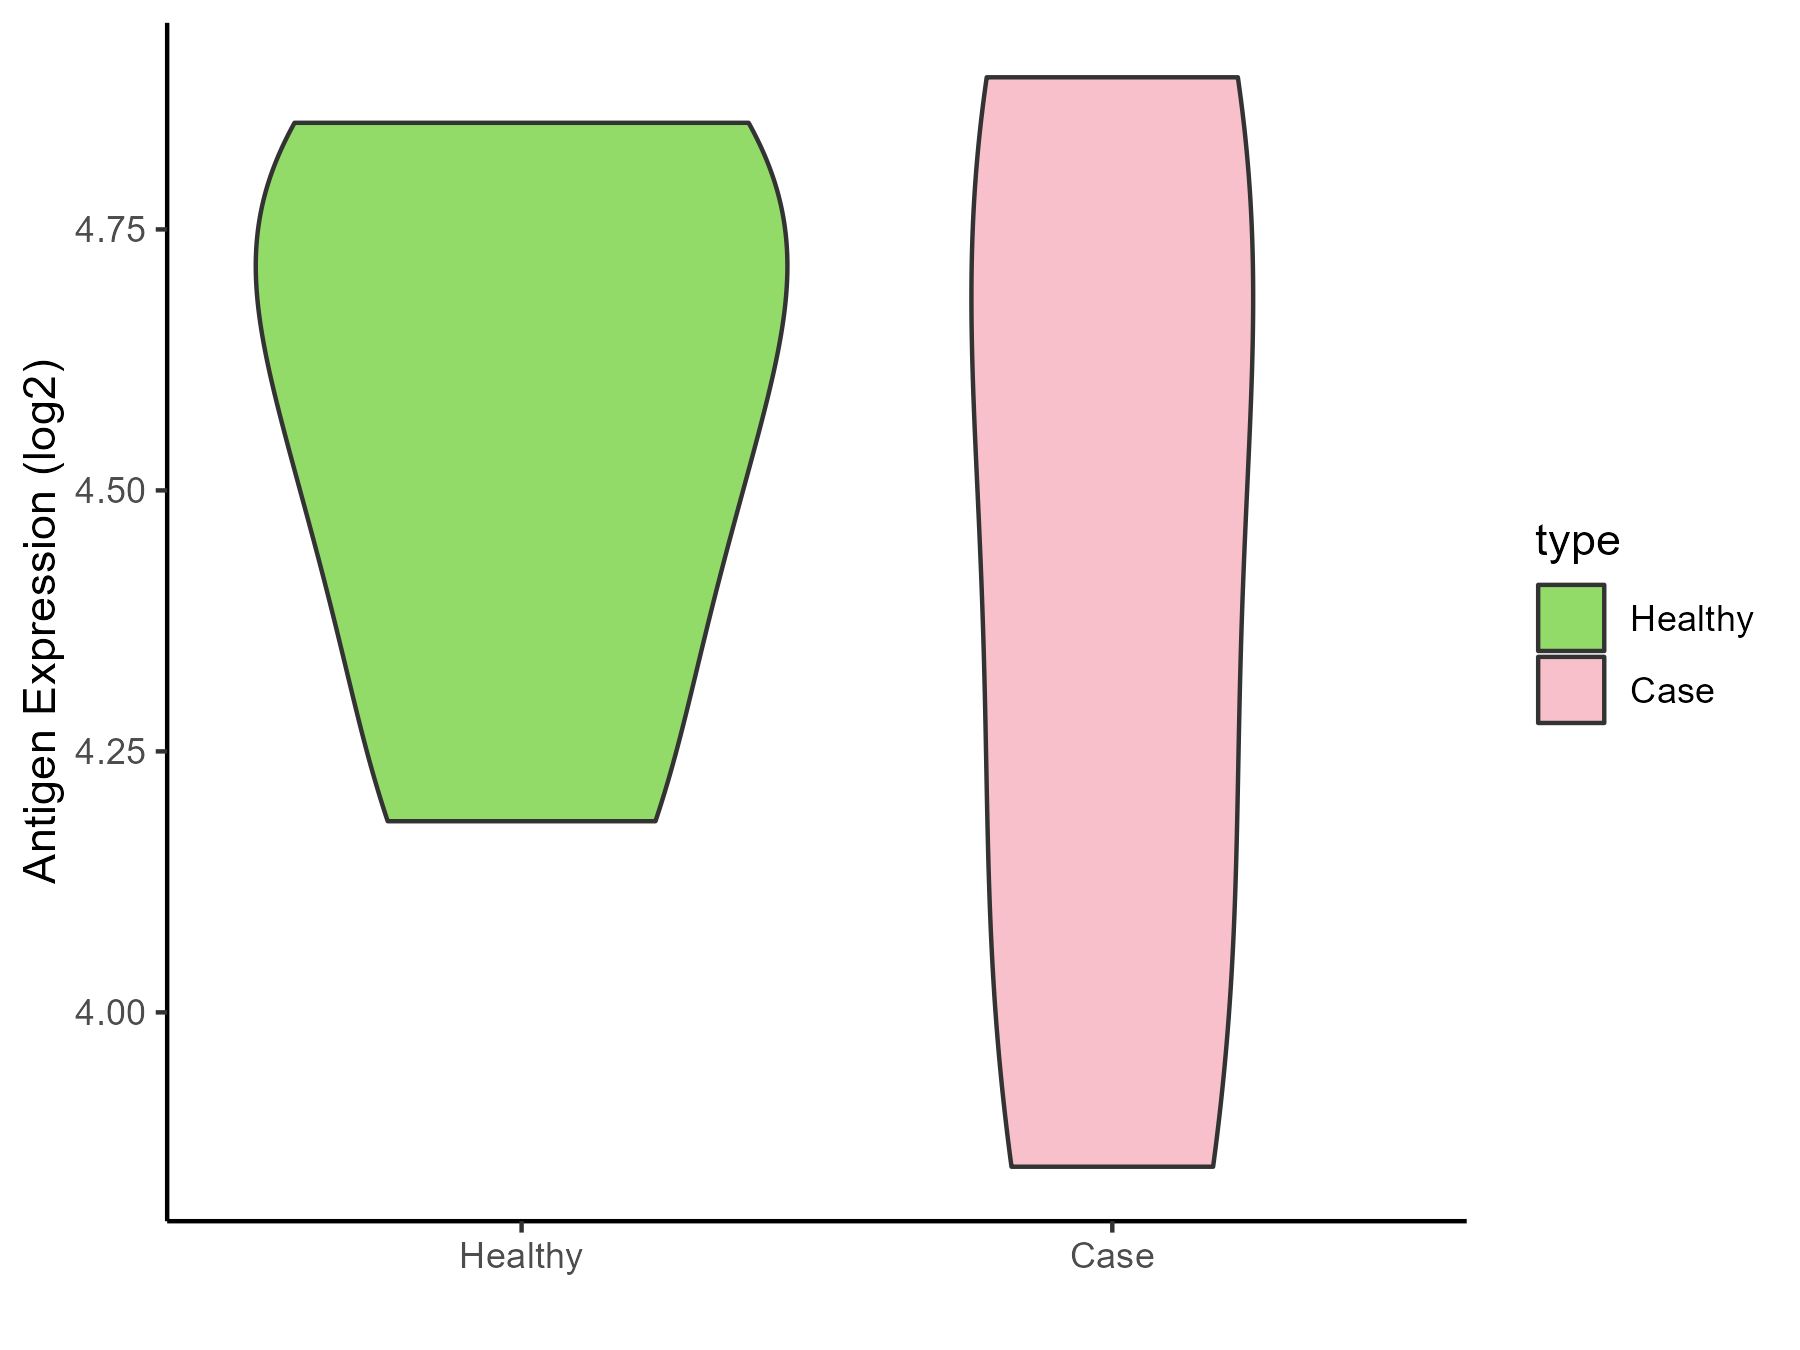
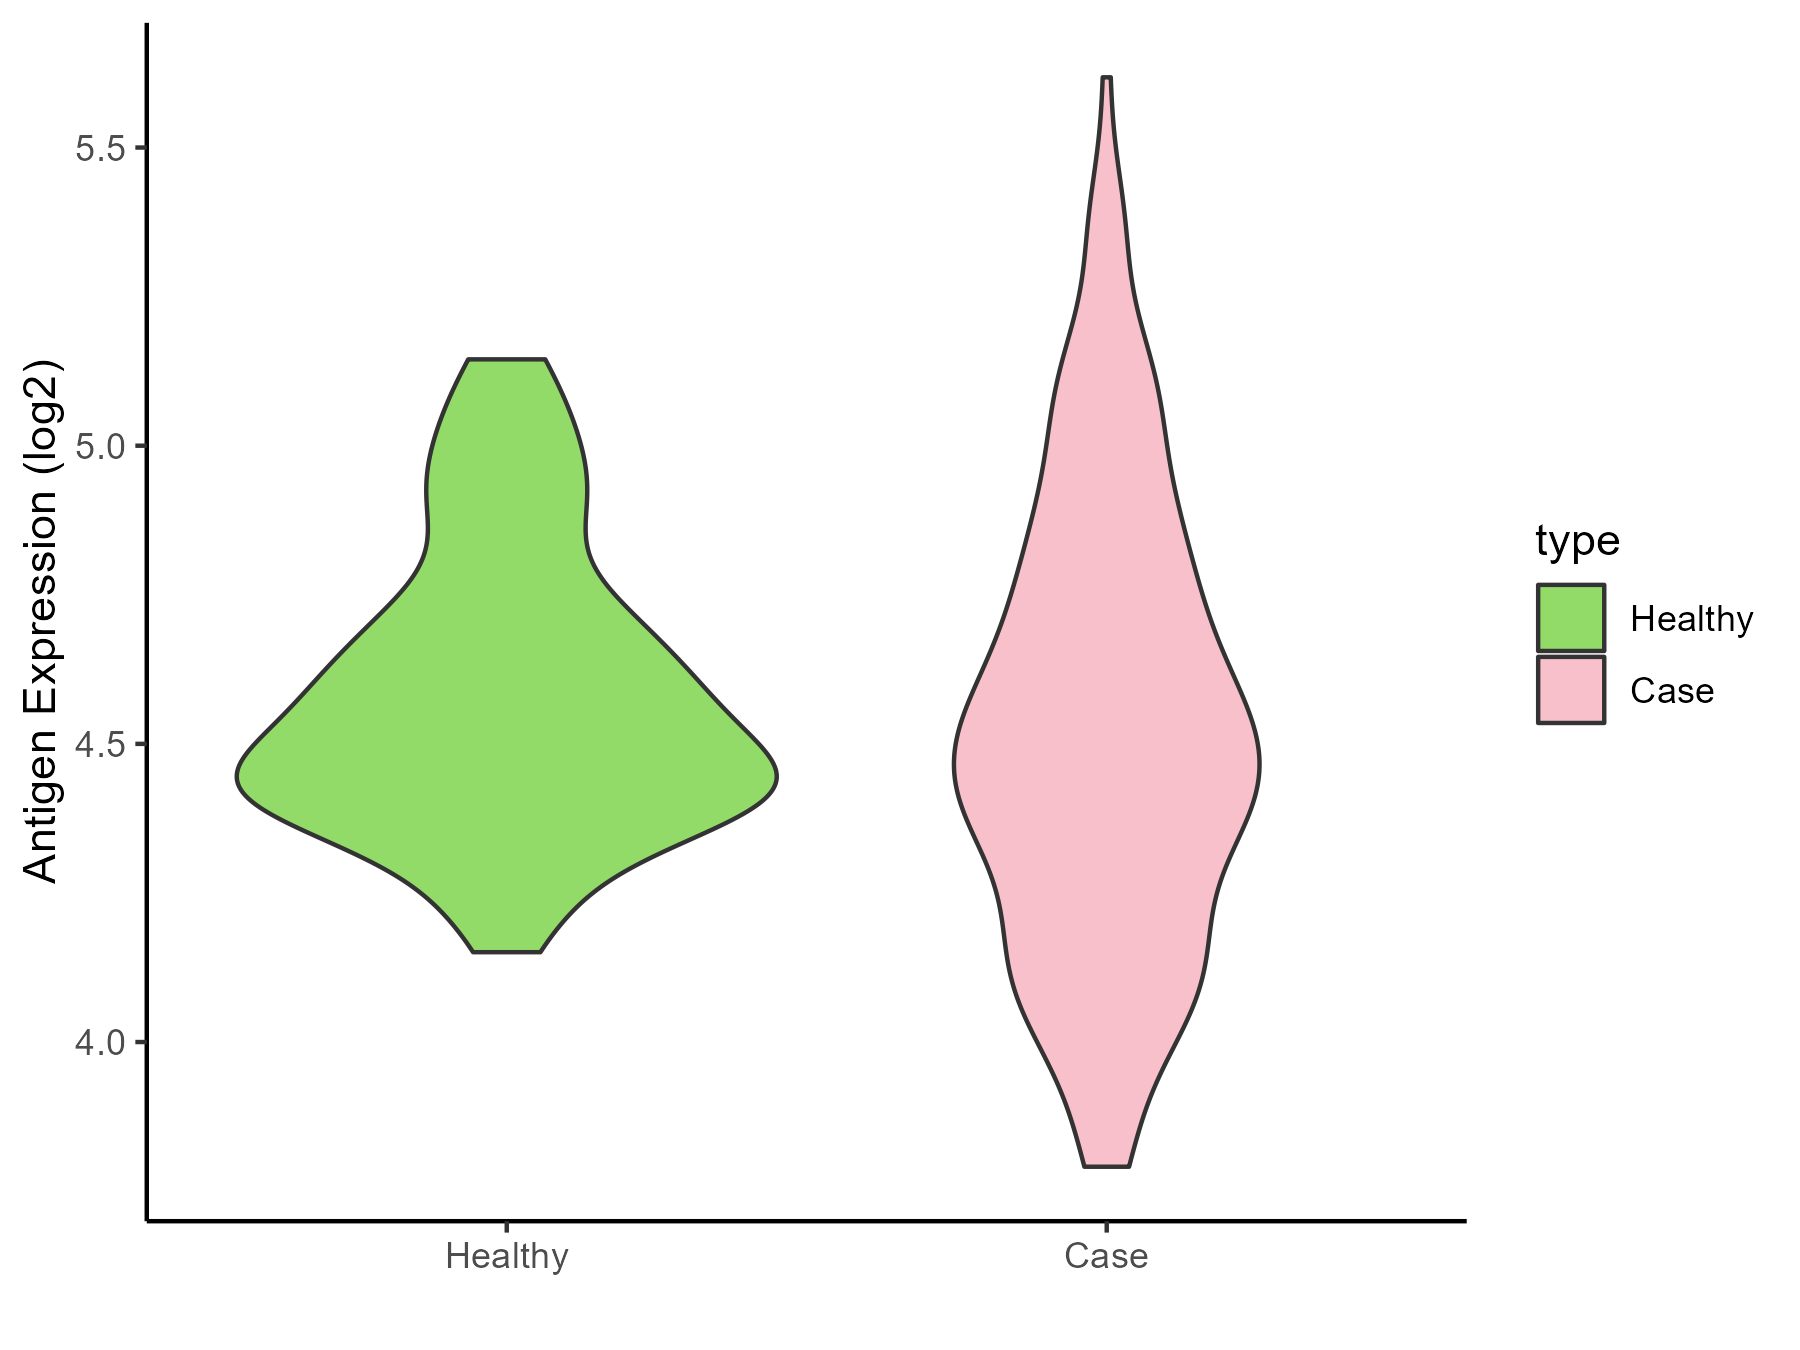
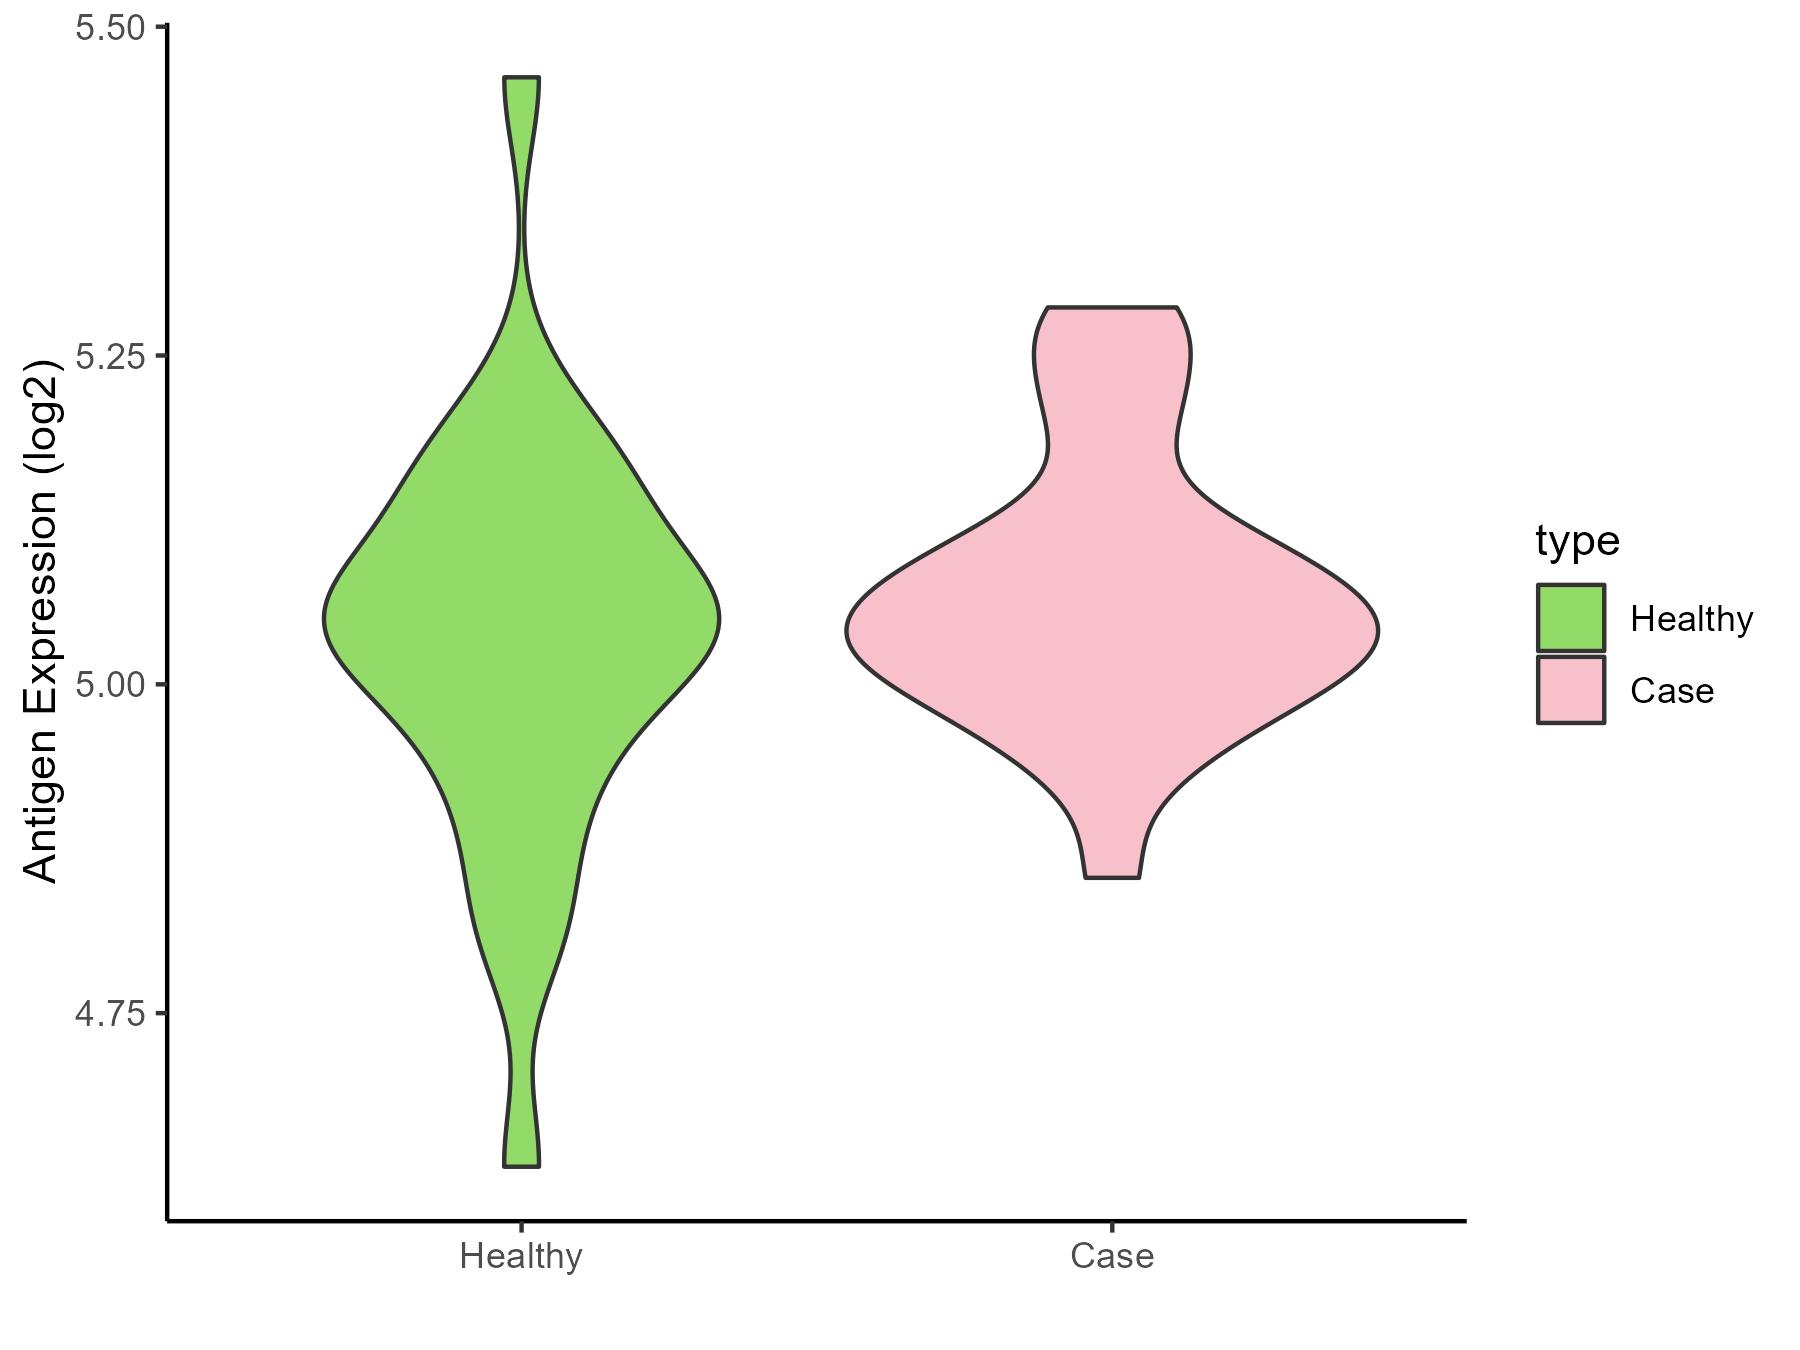
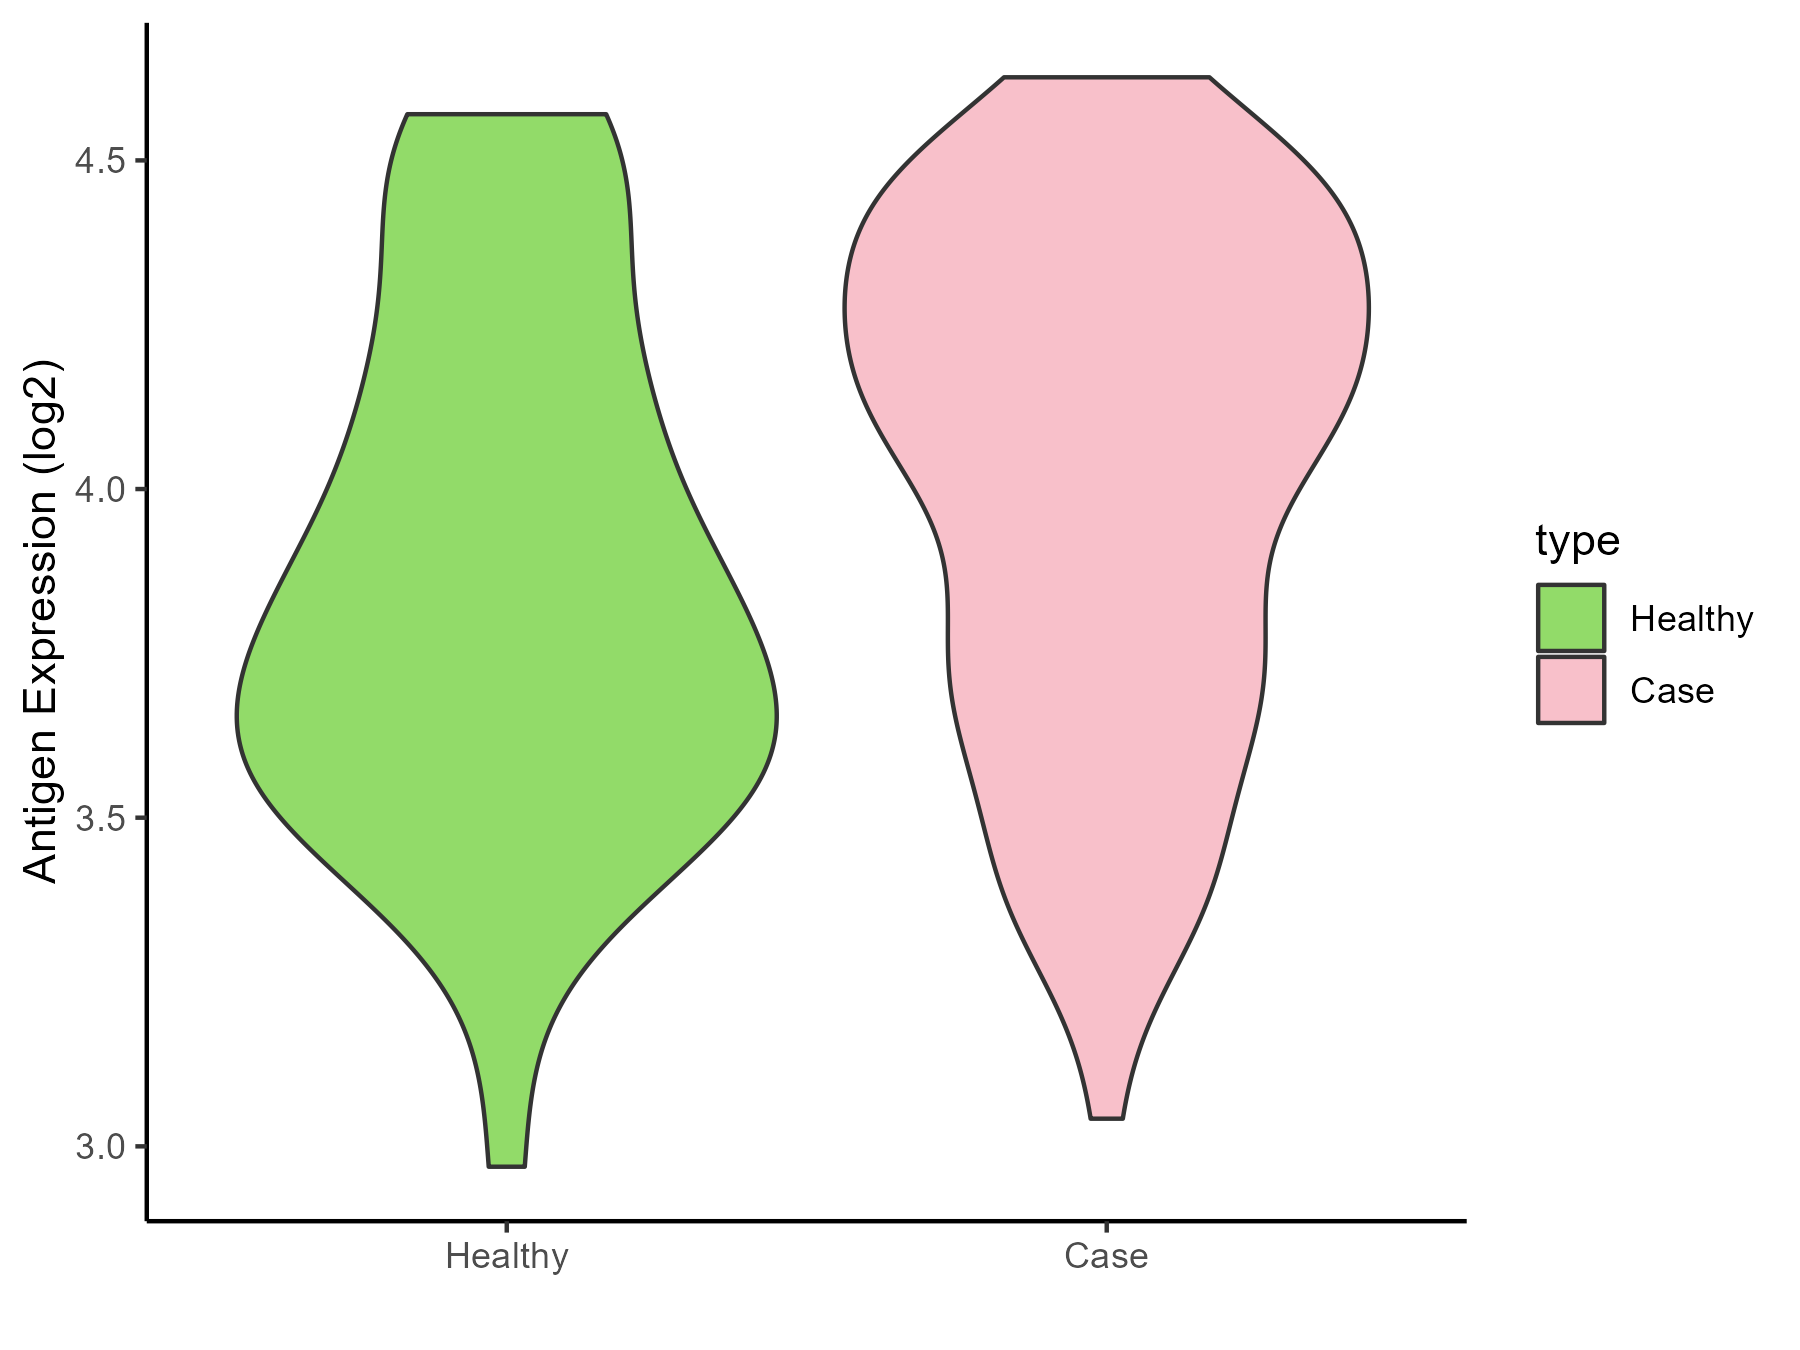
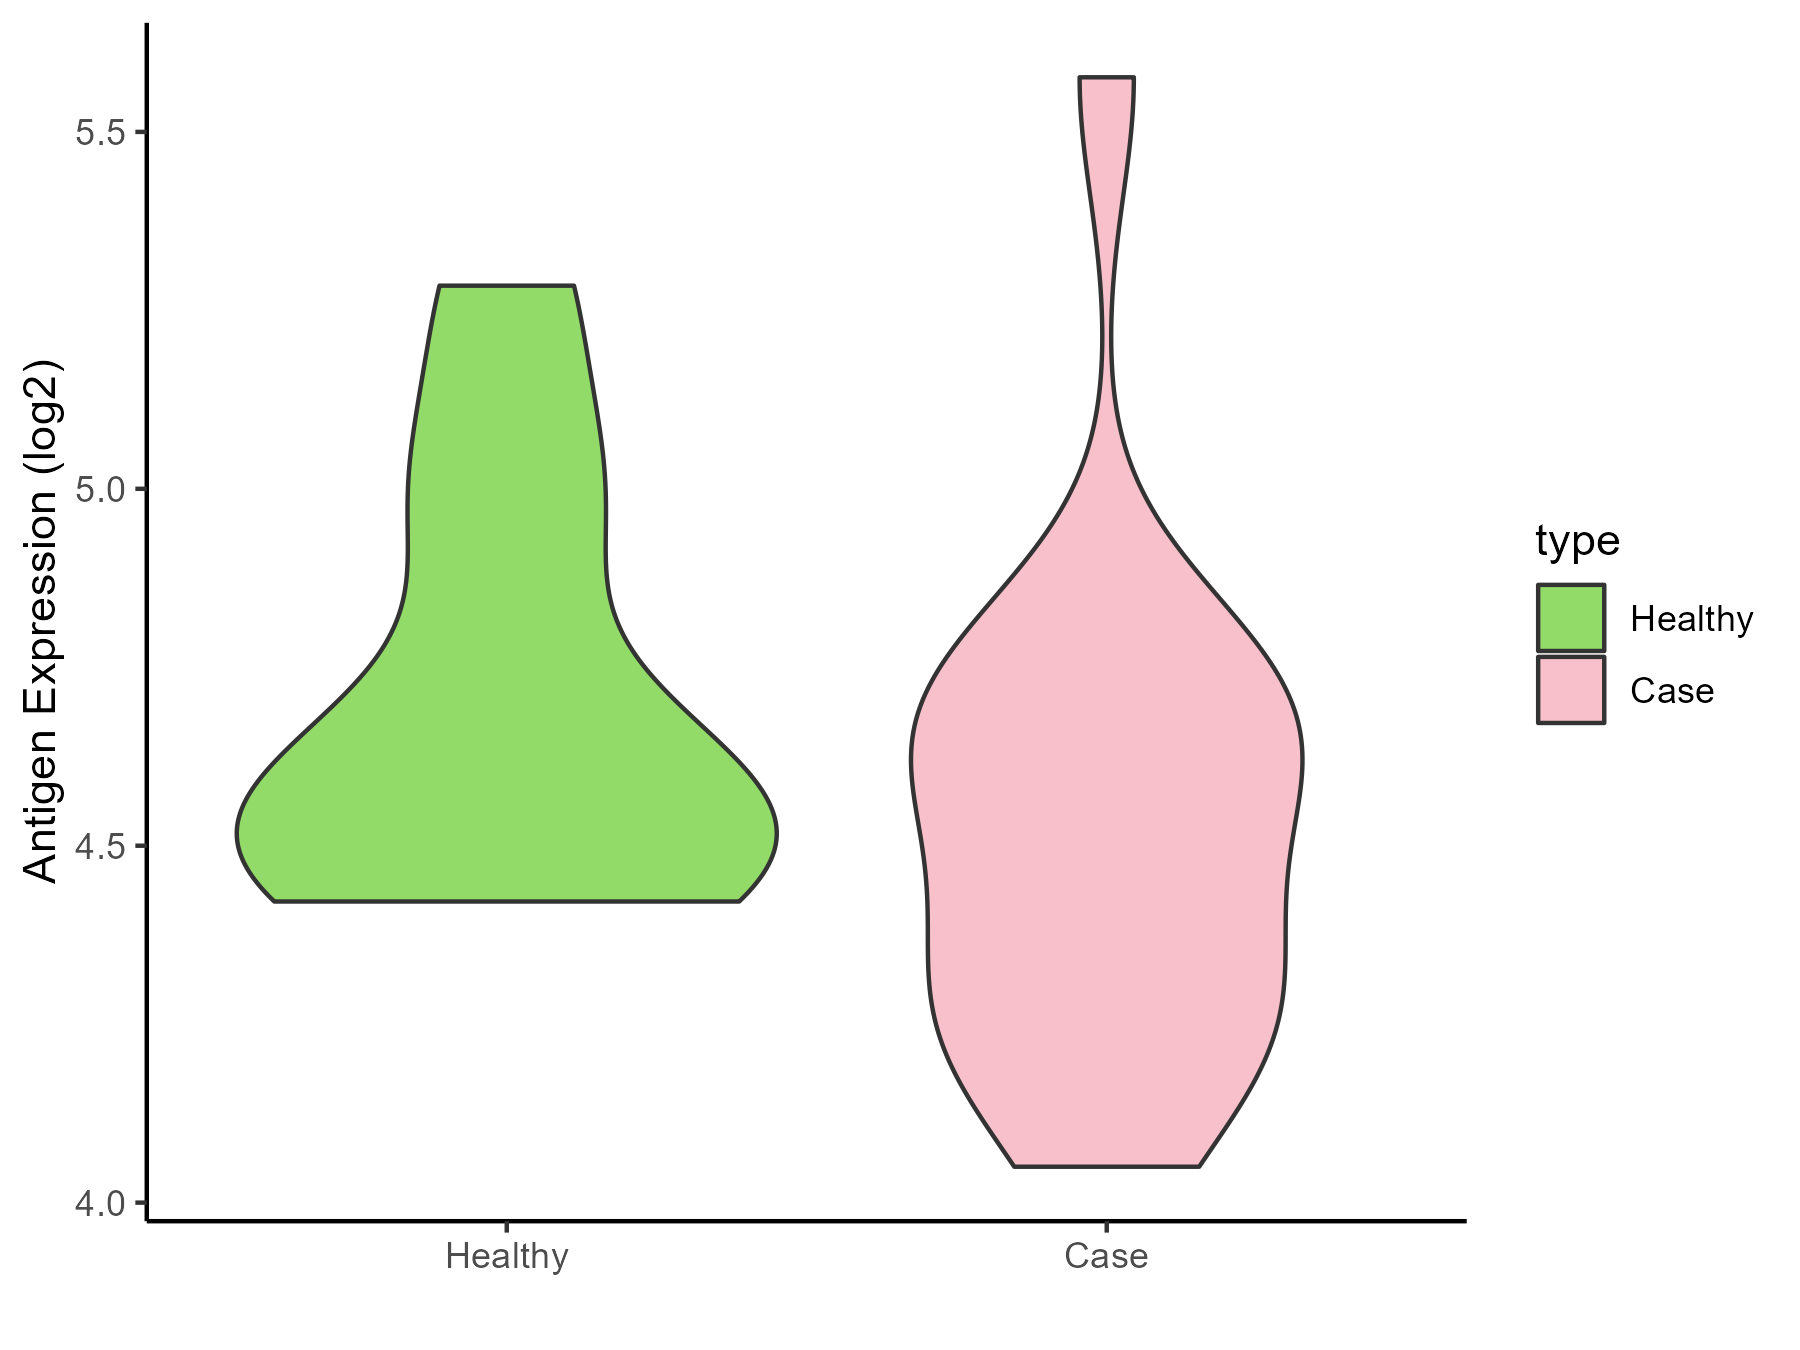
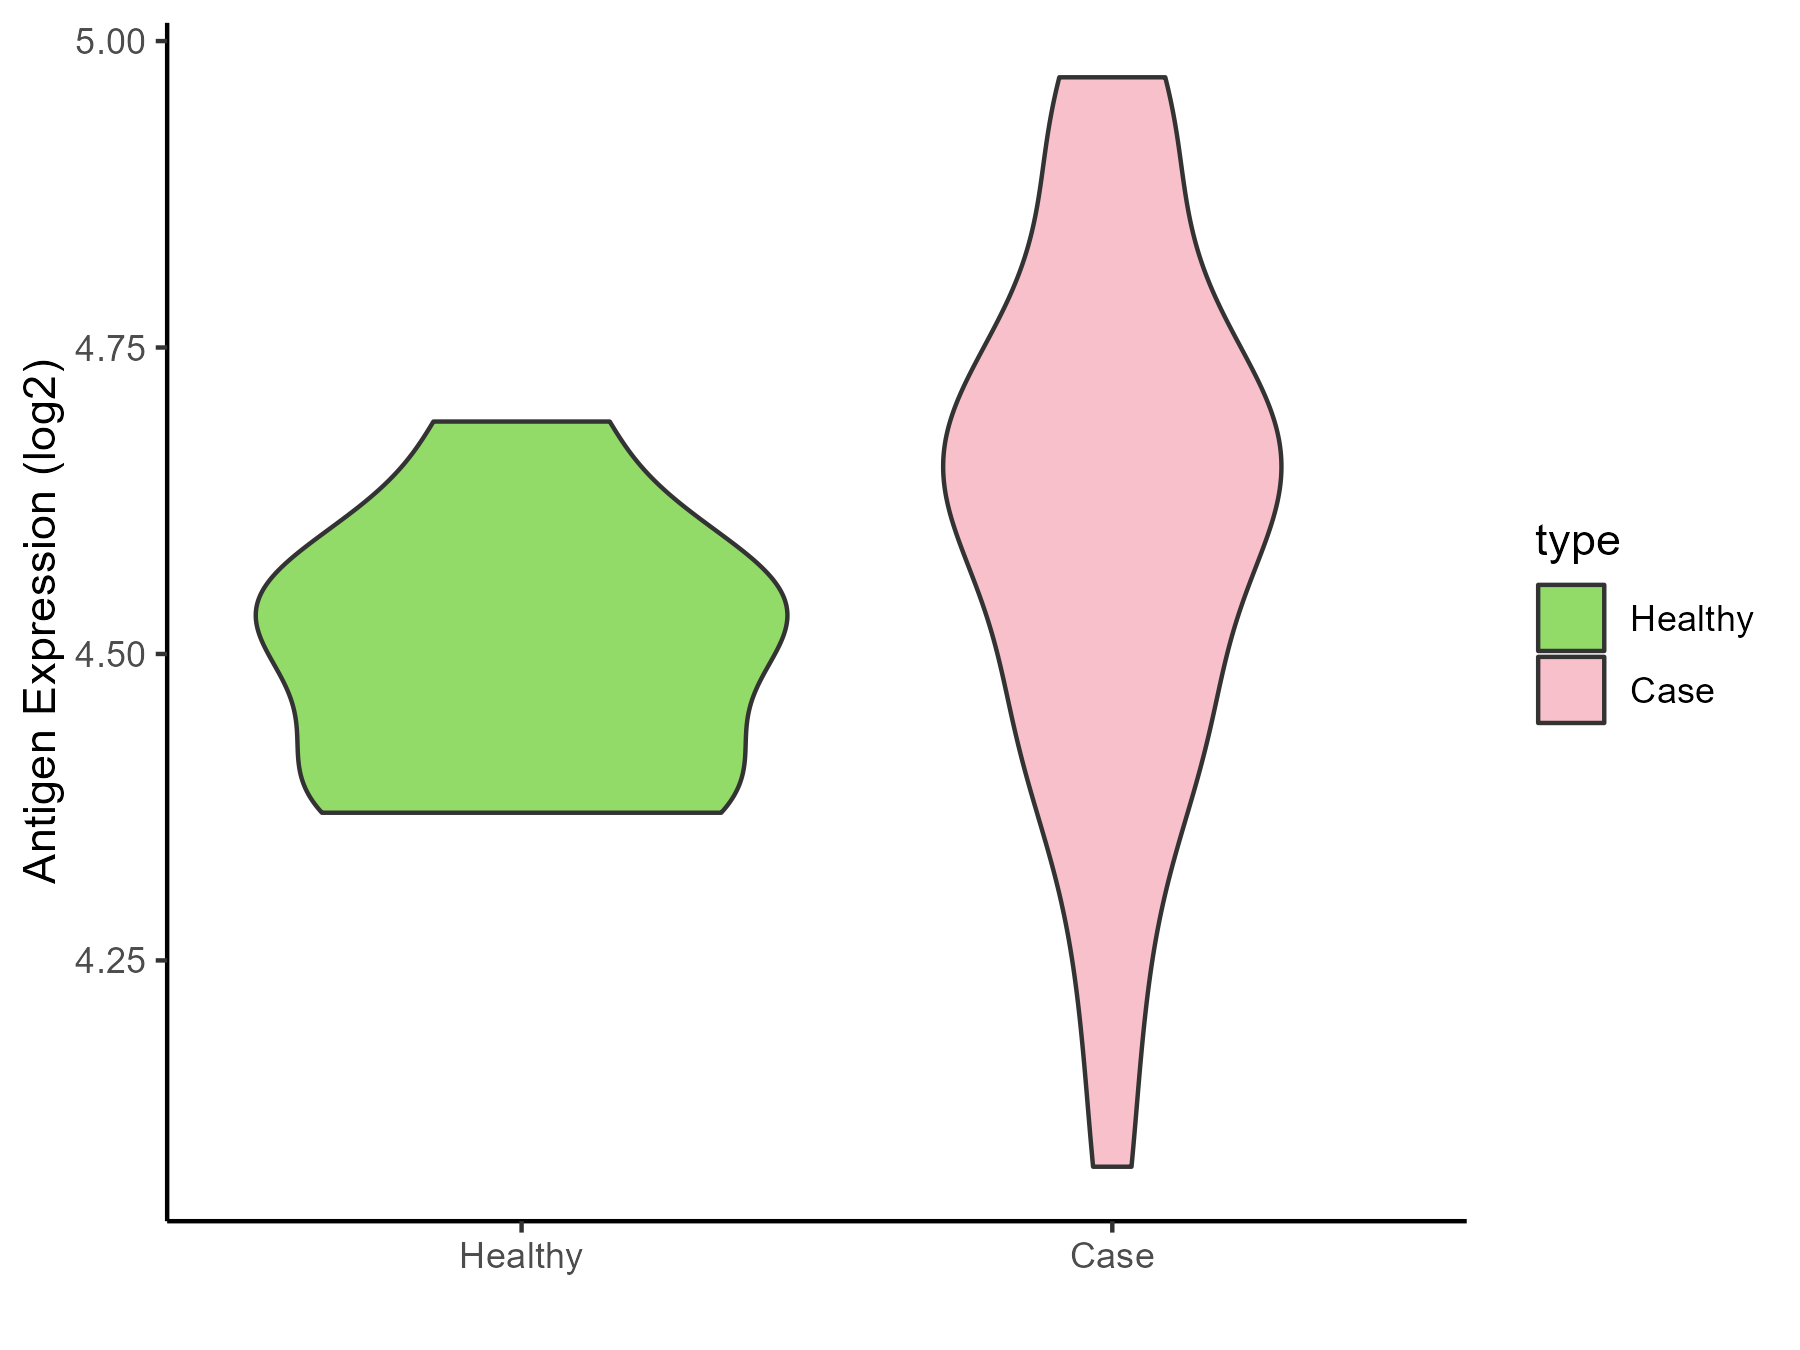
| Differential expression pattern of antigen in diseases | ||
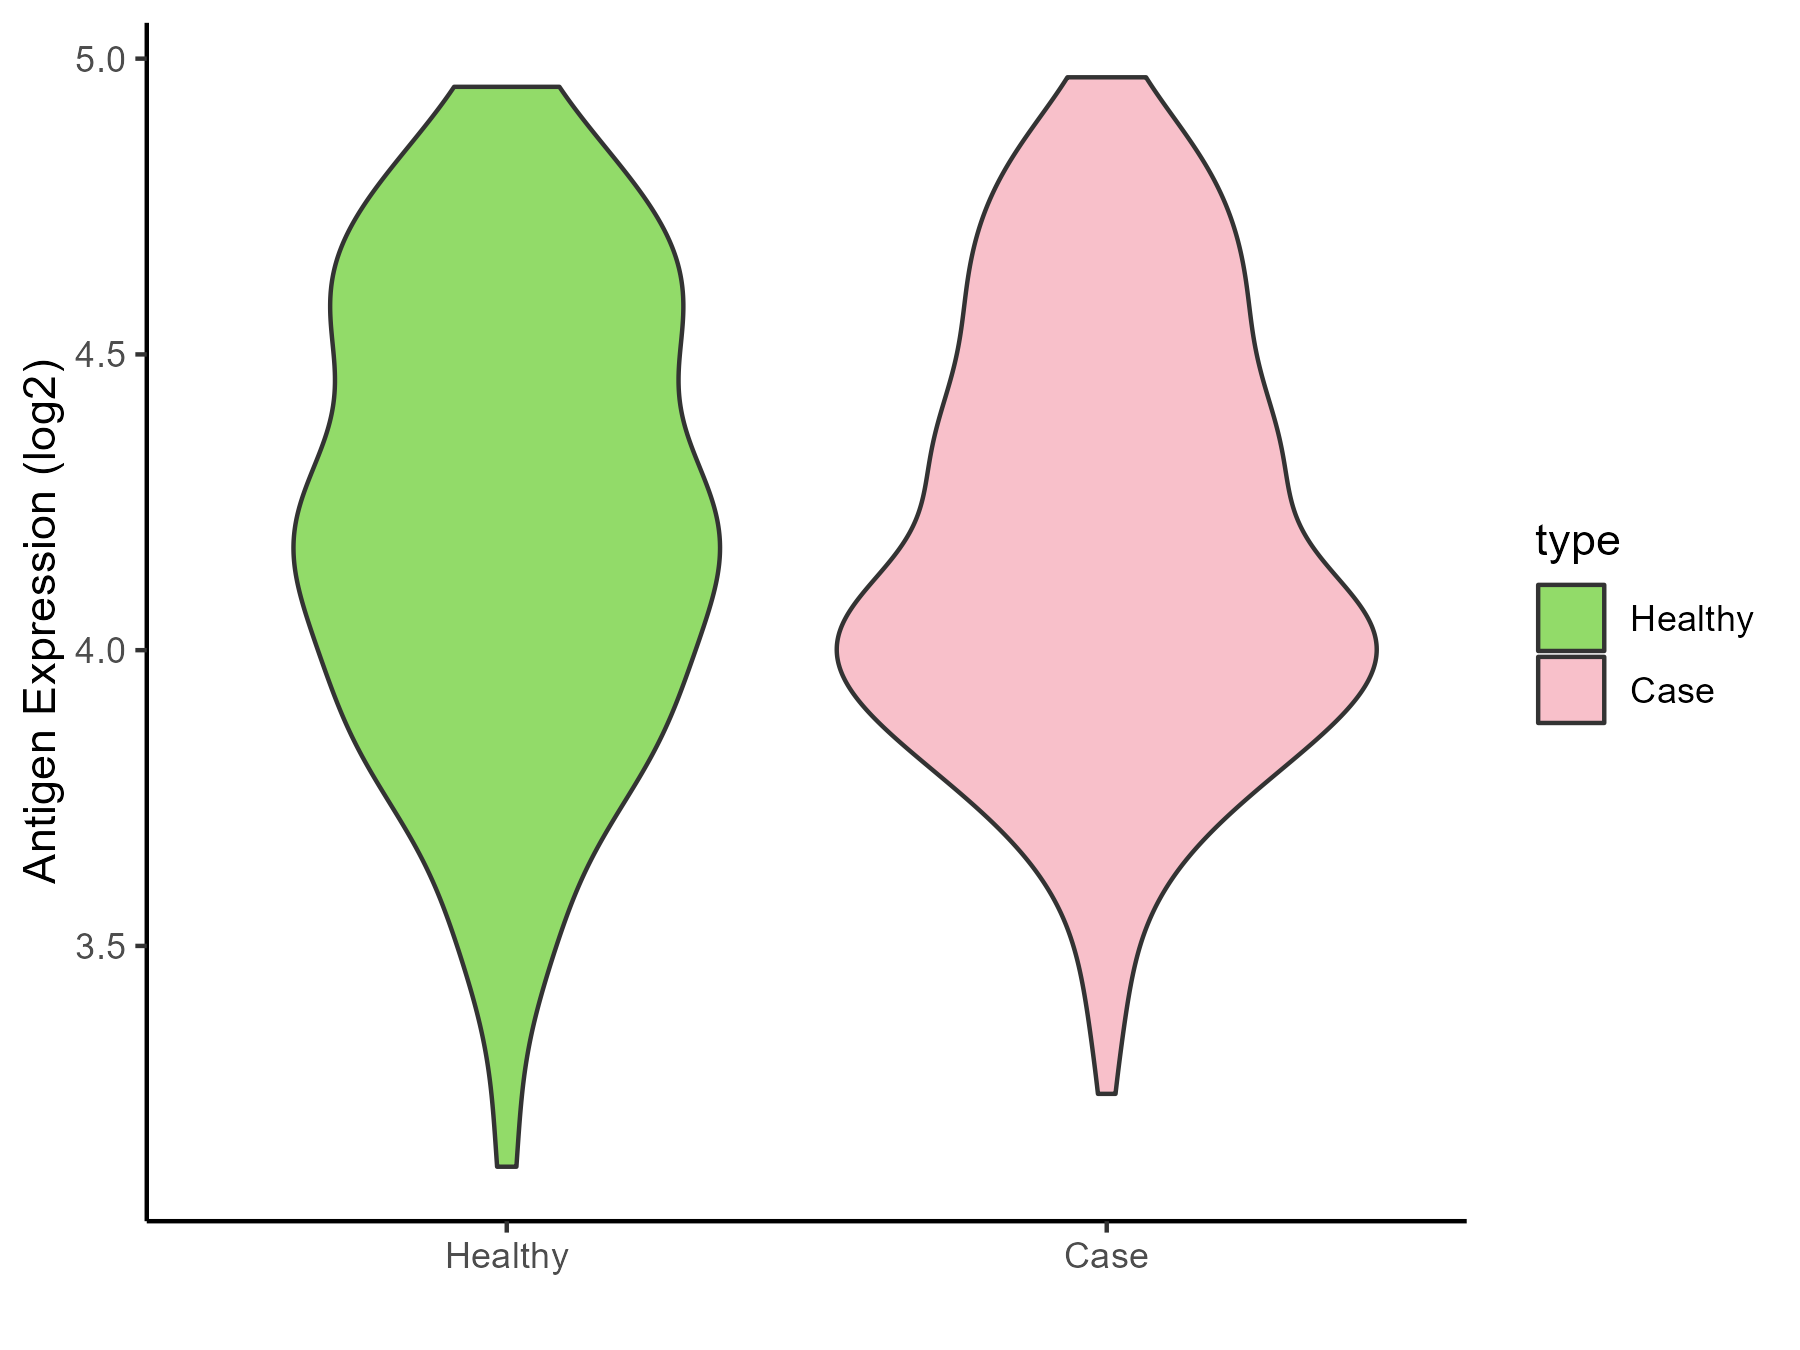
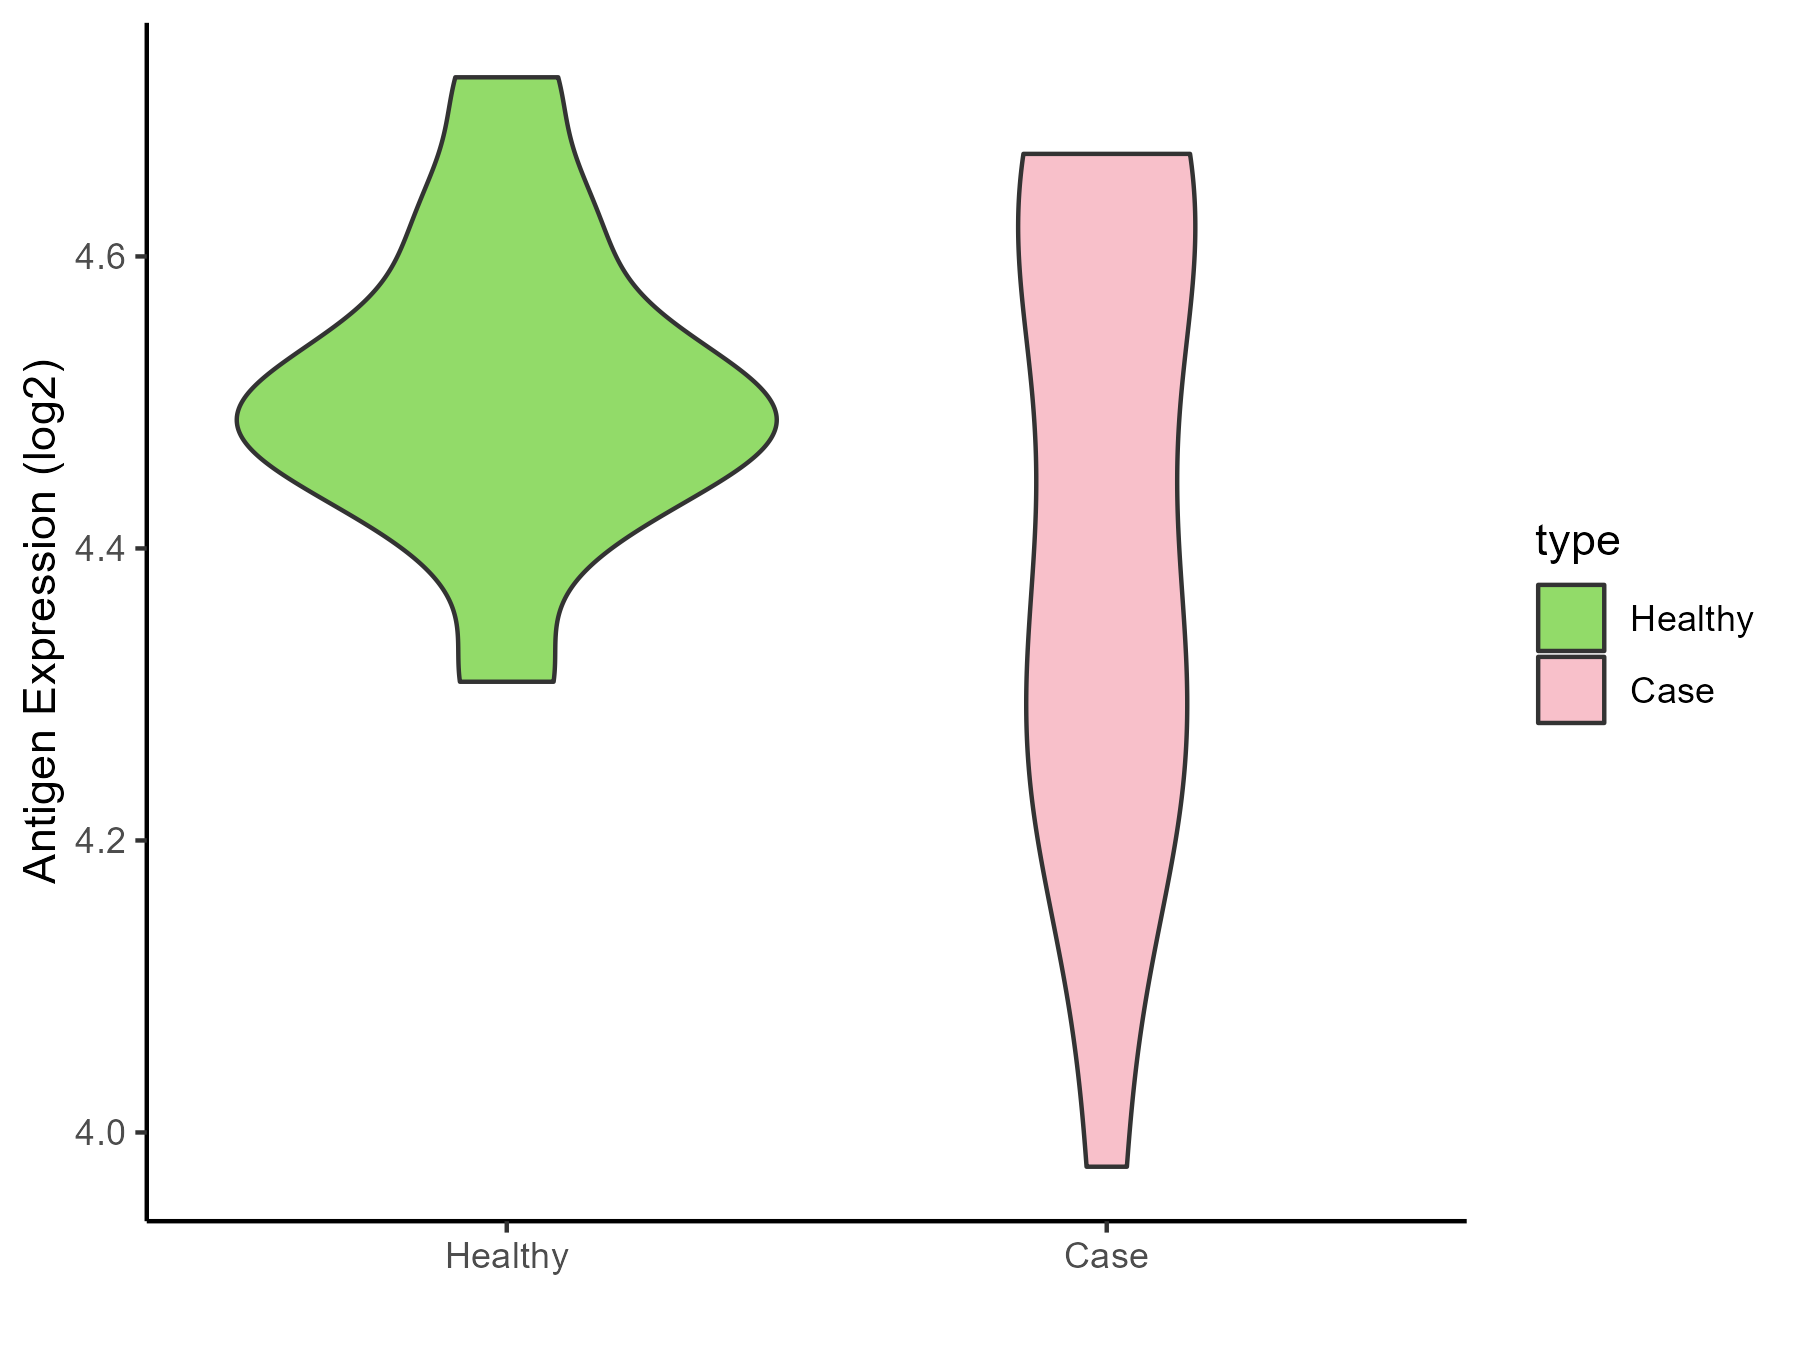
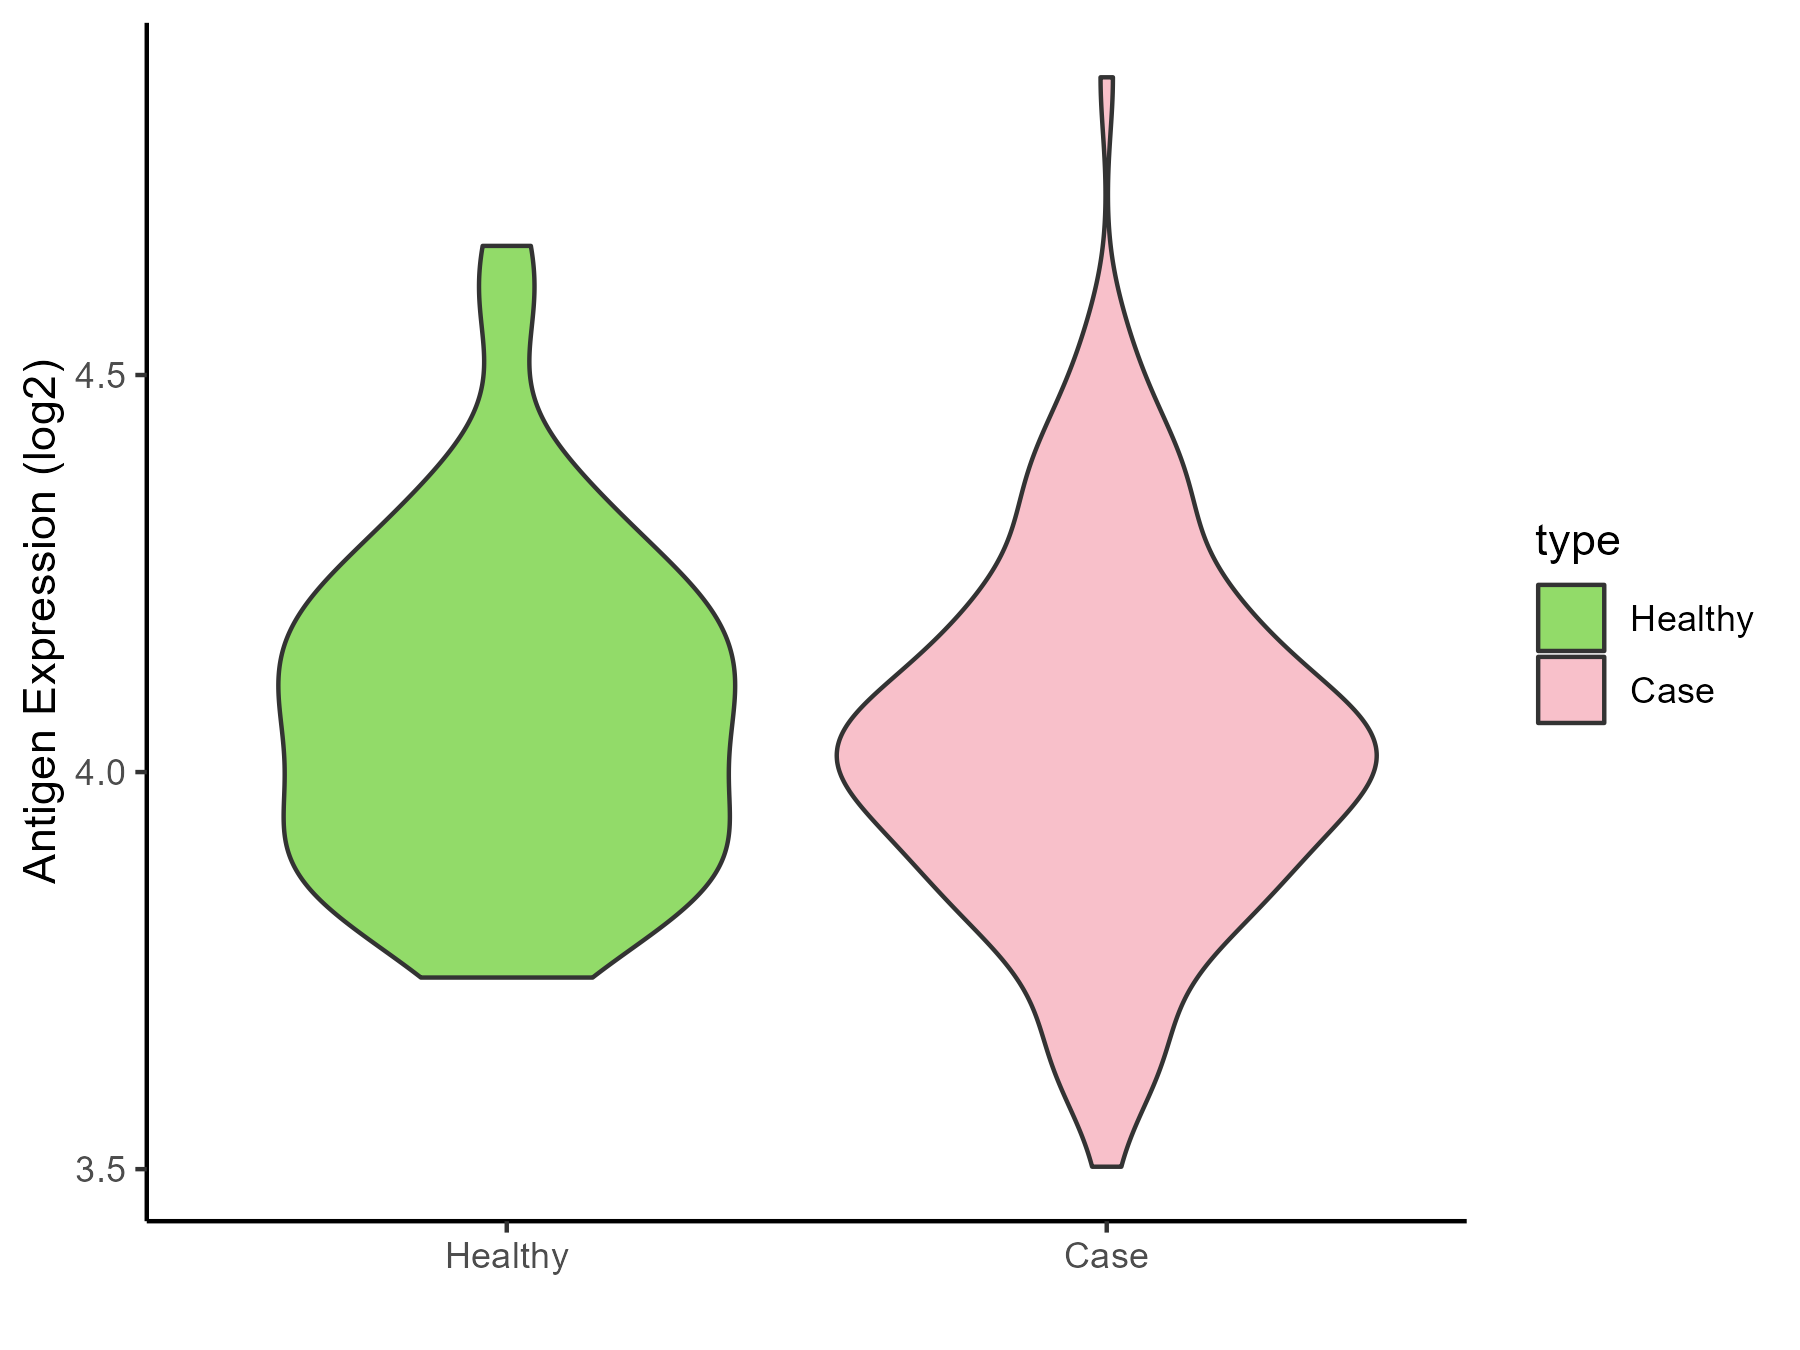
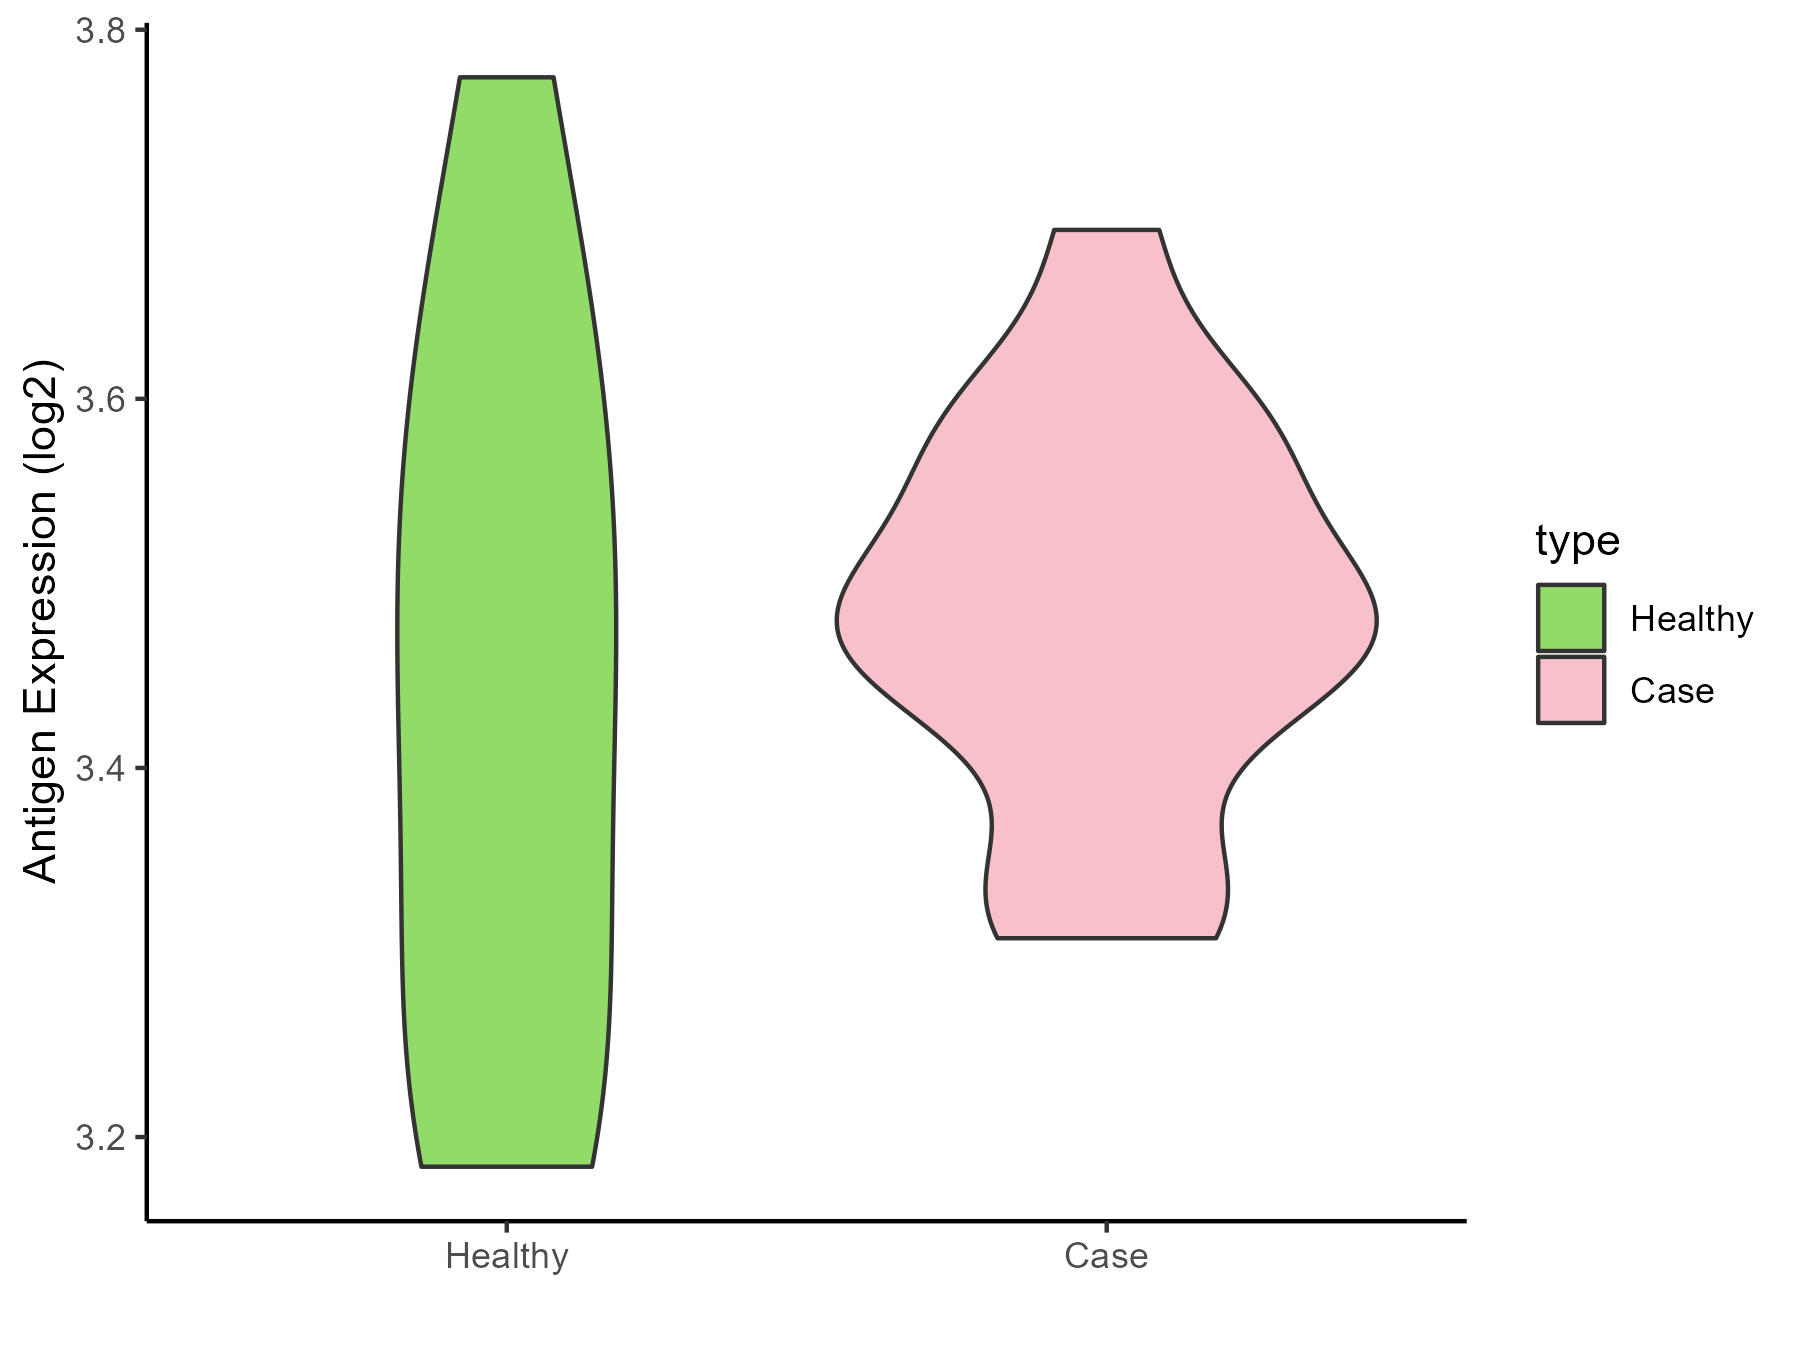
| The Studied Tissue | Brainstem | |
| The Specific Disease | Glioma | |
| The Expression Level of Disease Section Compare with the Healthy Individual Tissue | p-value: 0.860929017; Fold-change: -0.121771864; Z-score: -0.248138211 | |
| Disease-specific Antigen Abundances |
|
Click to View the Clearer Original Diagram |
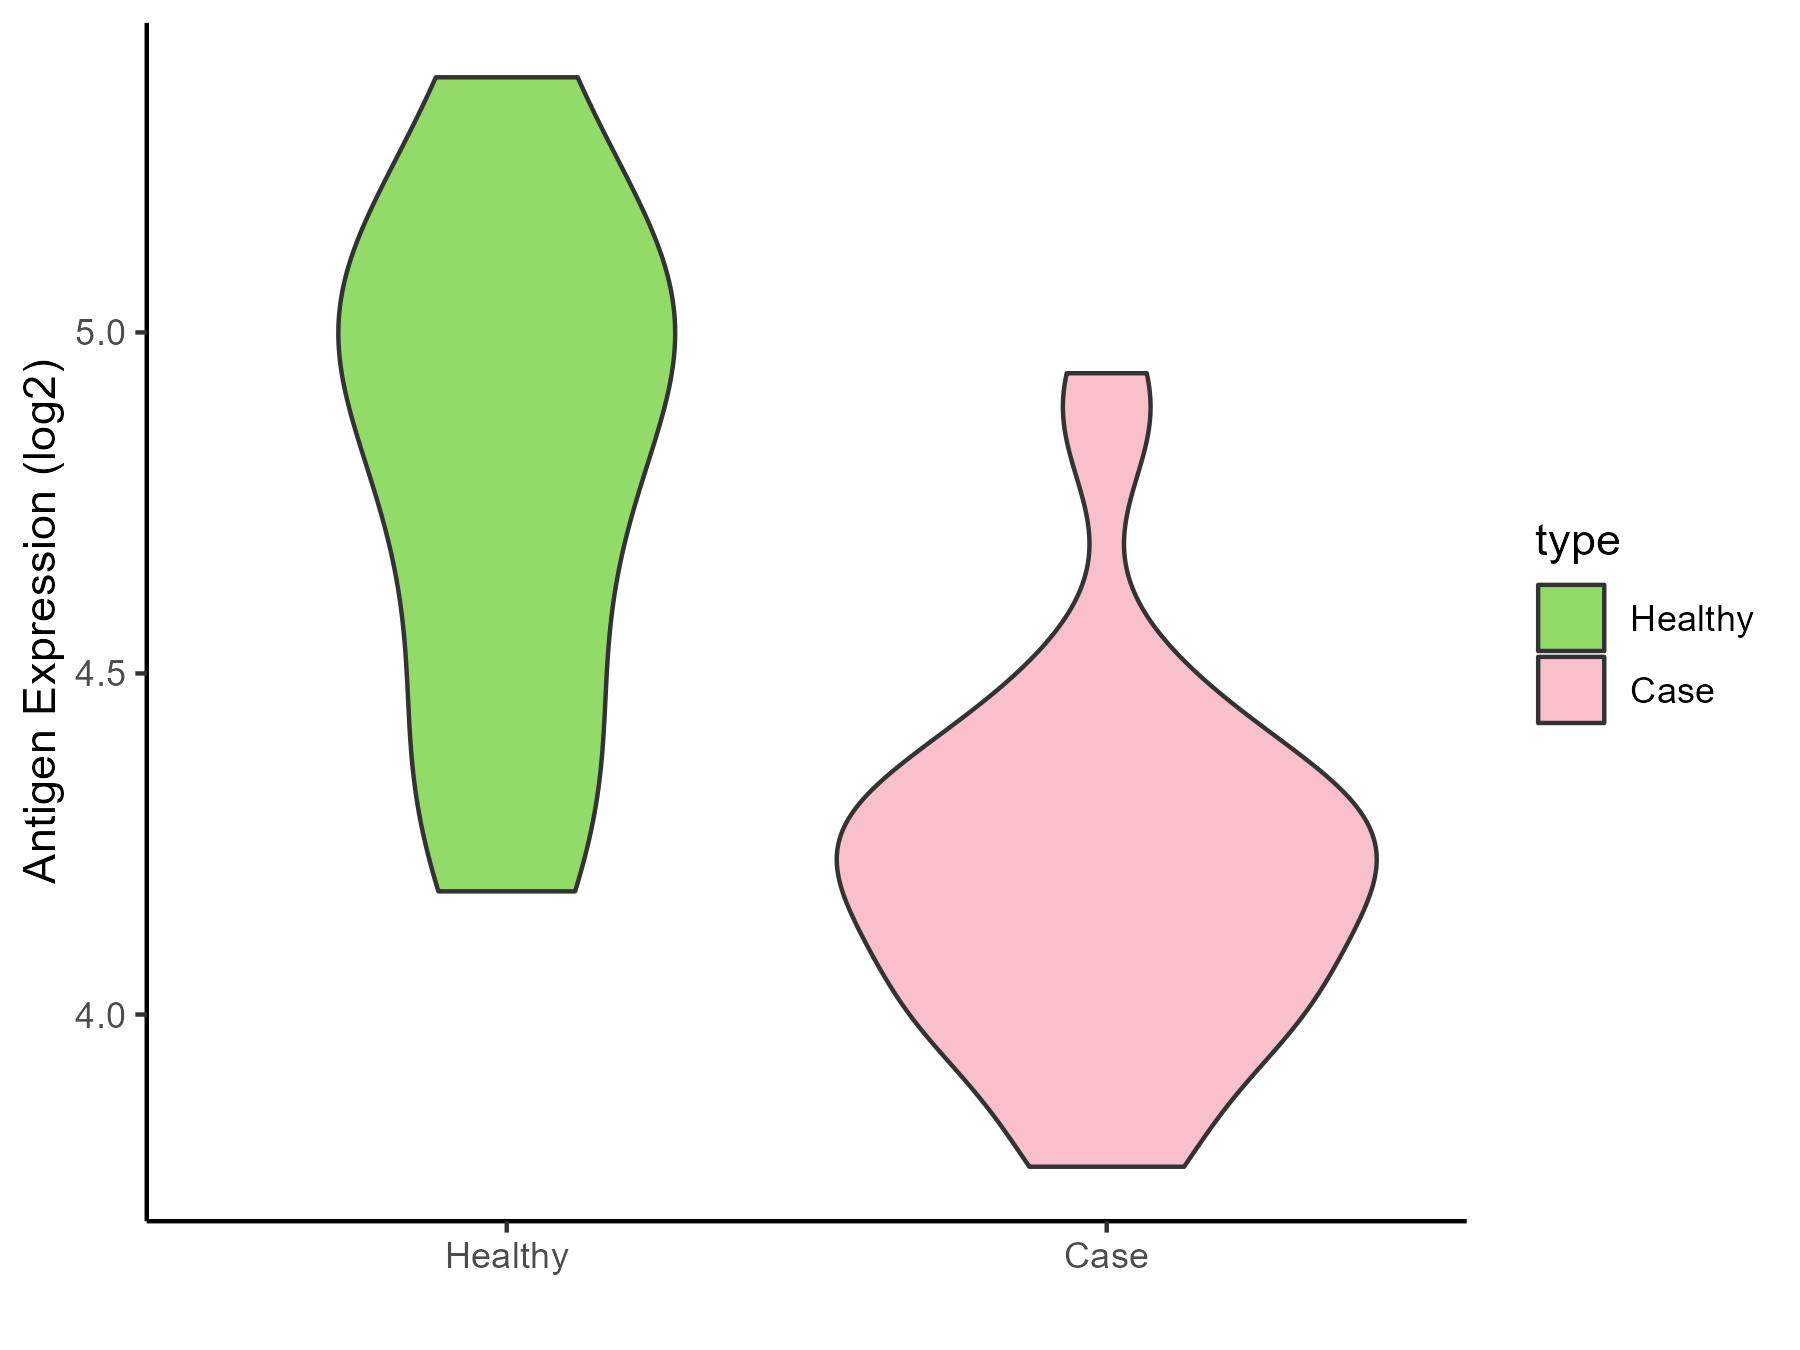
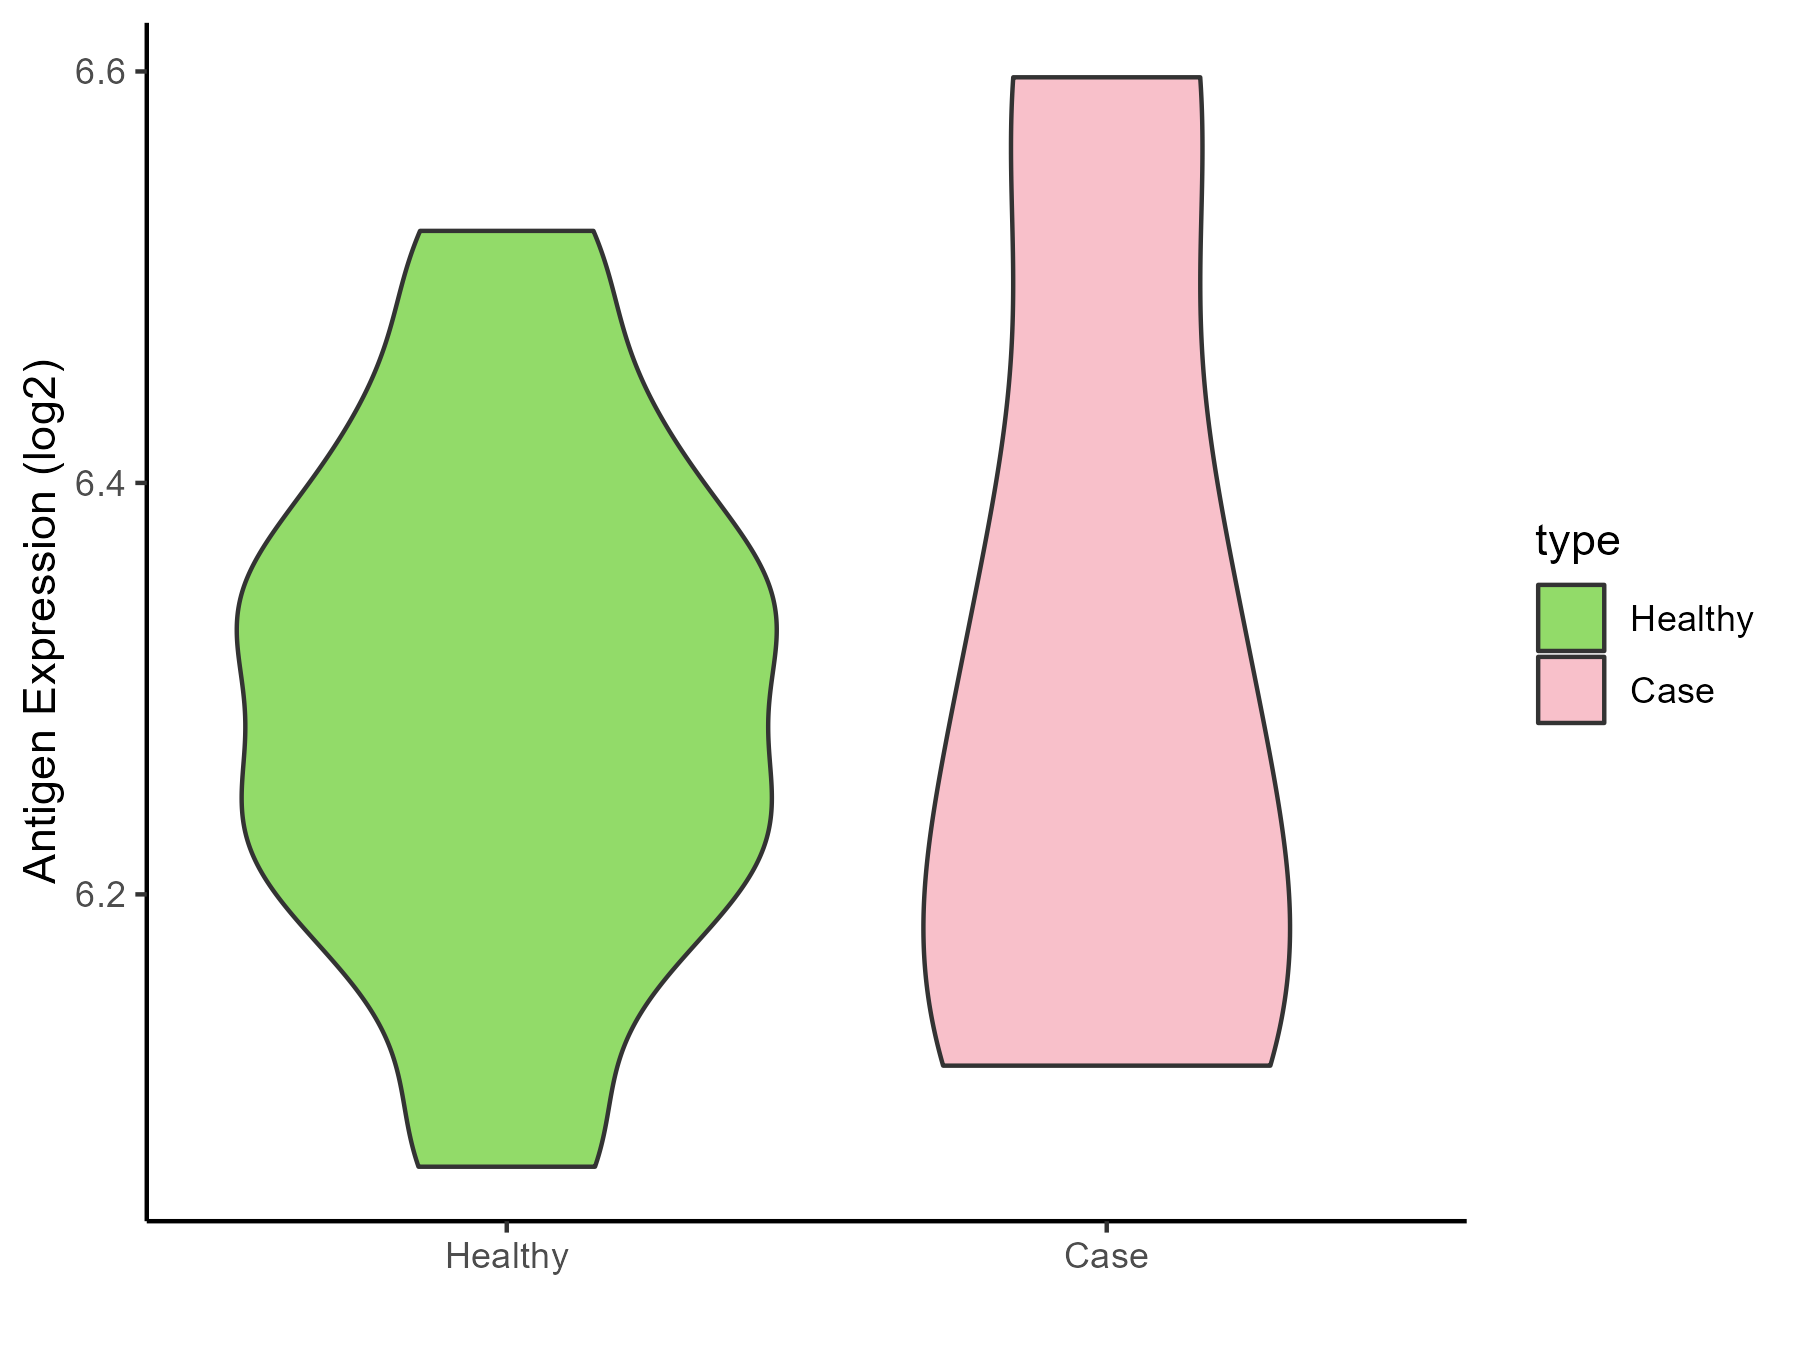
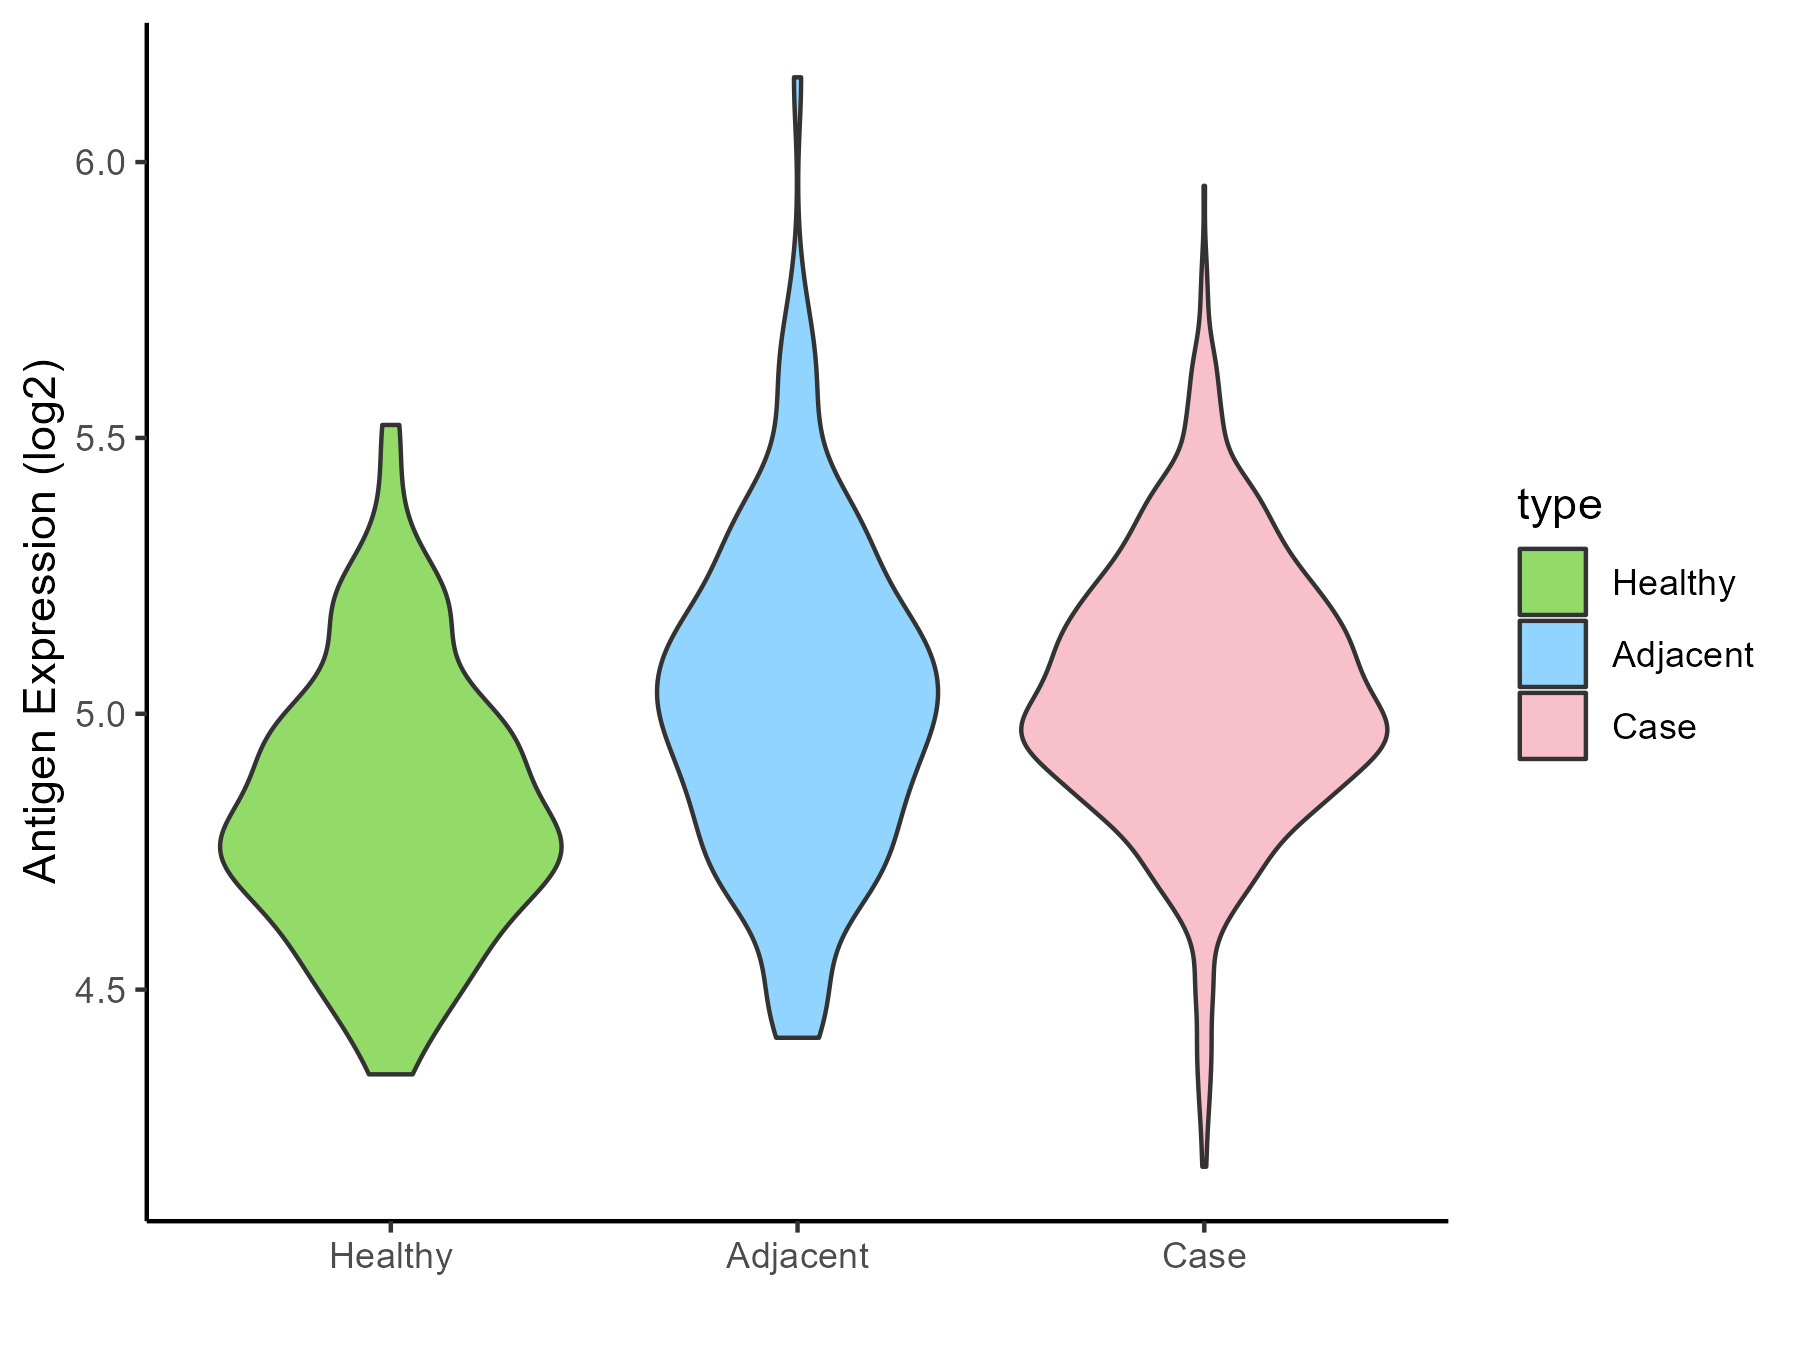
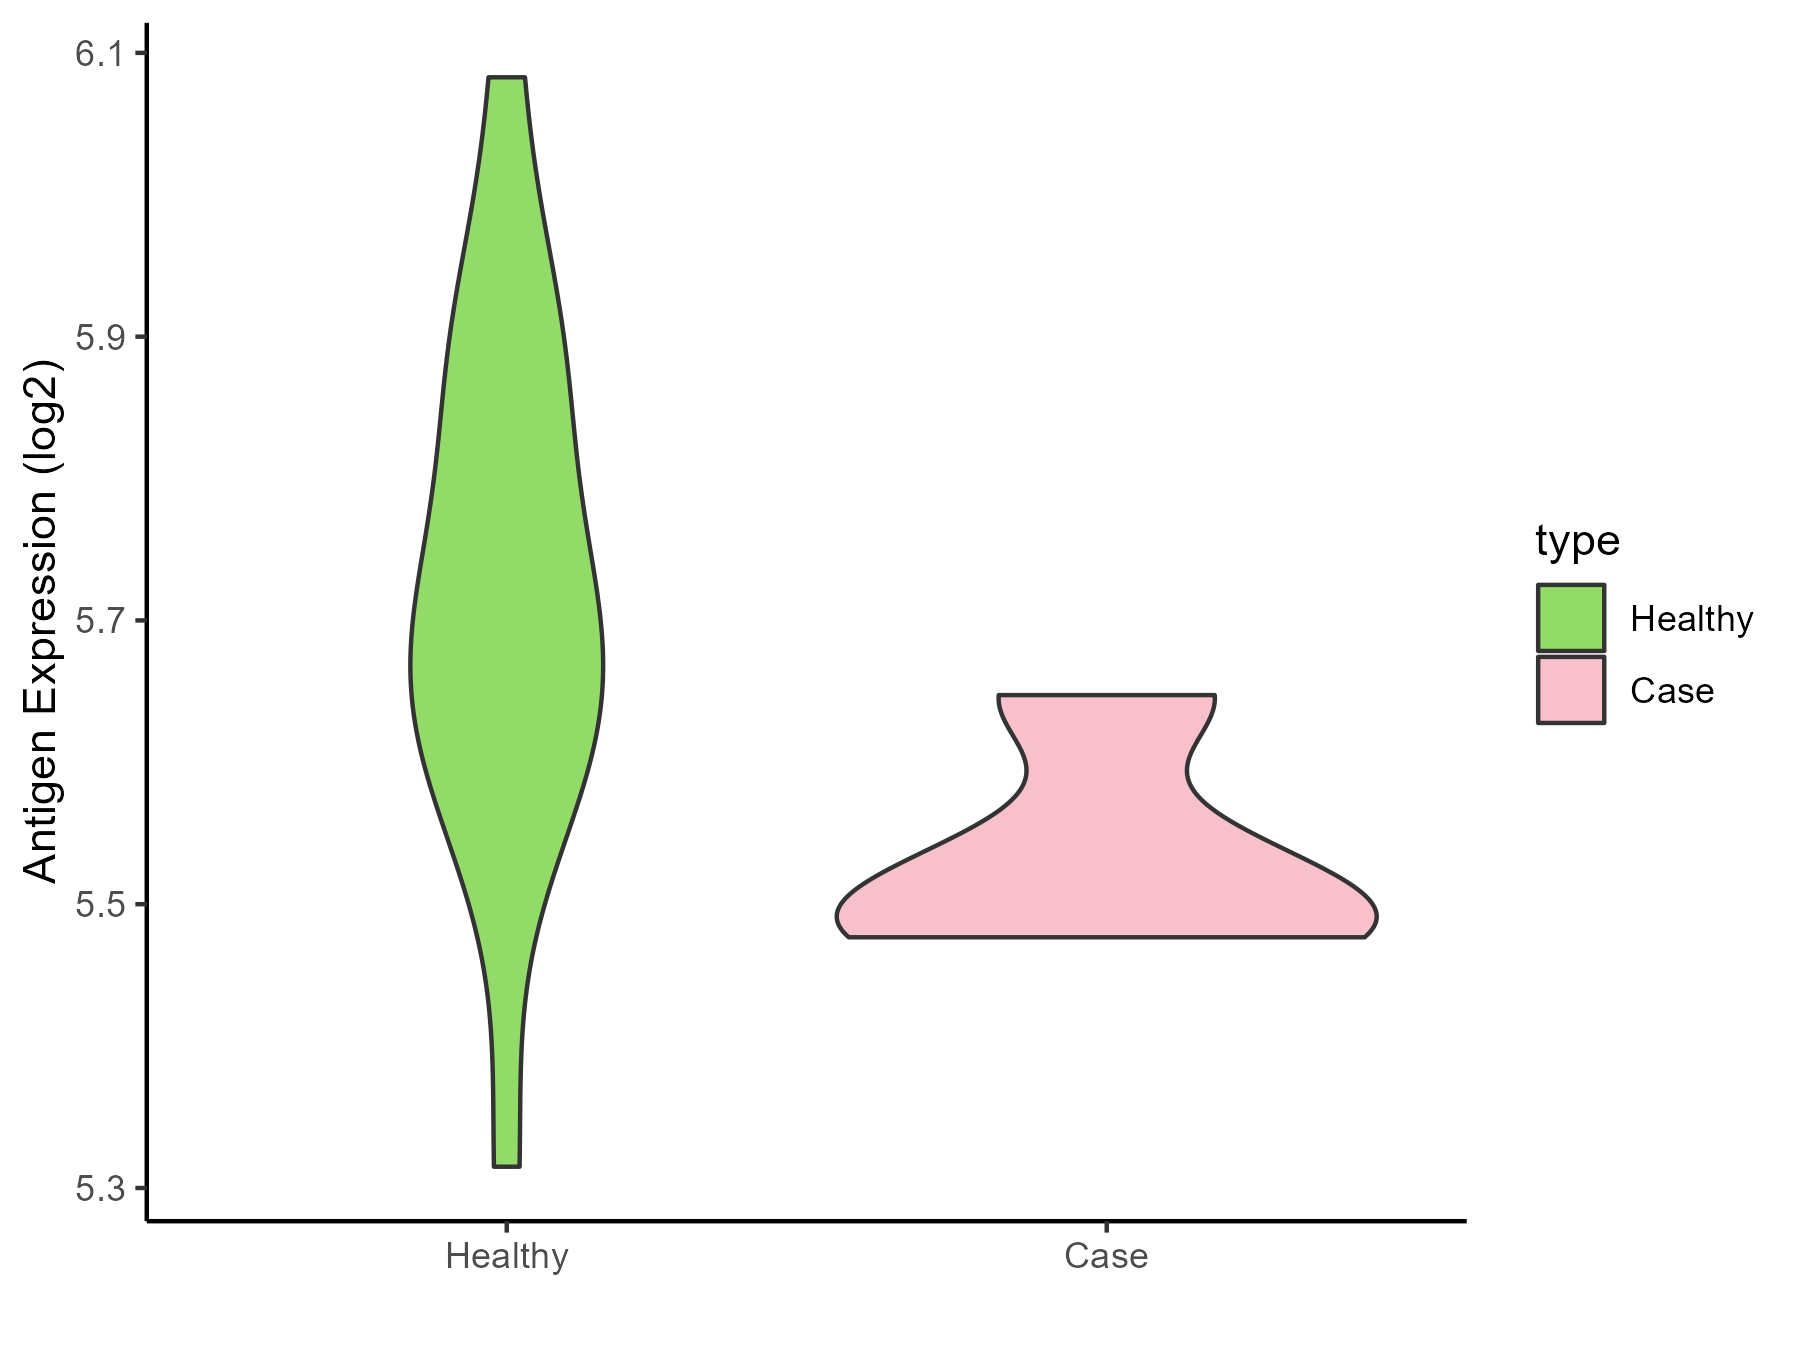
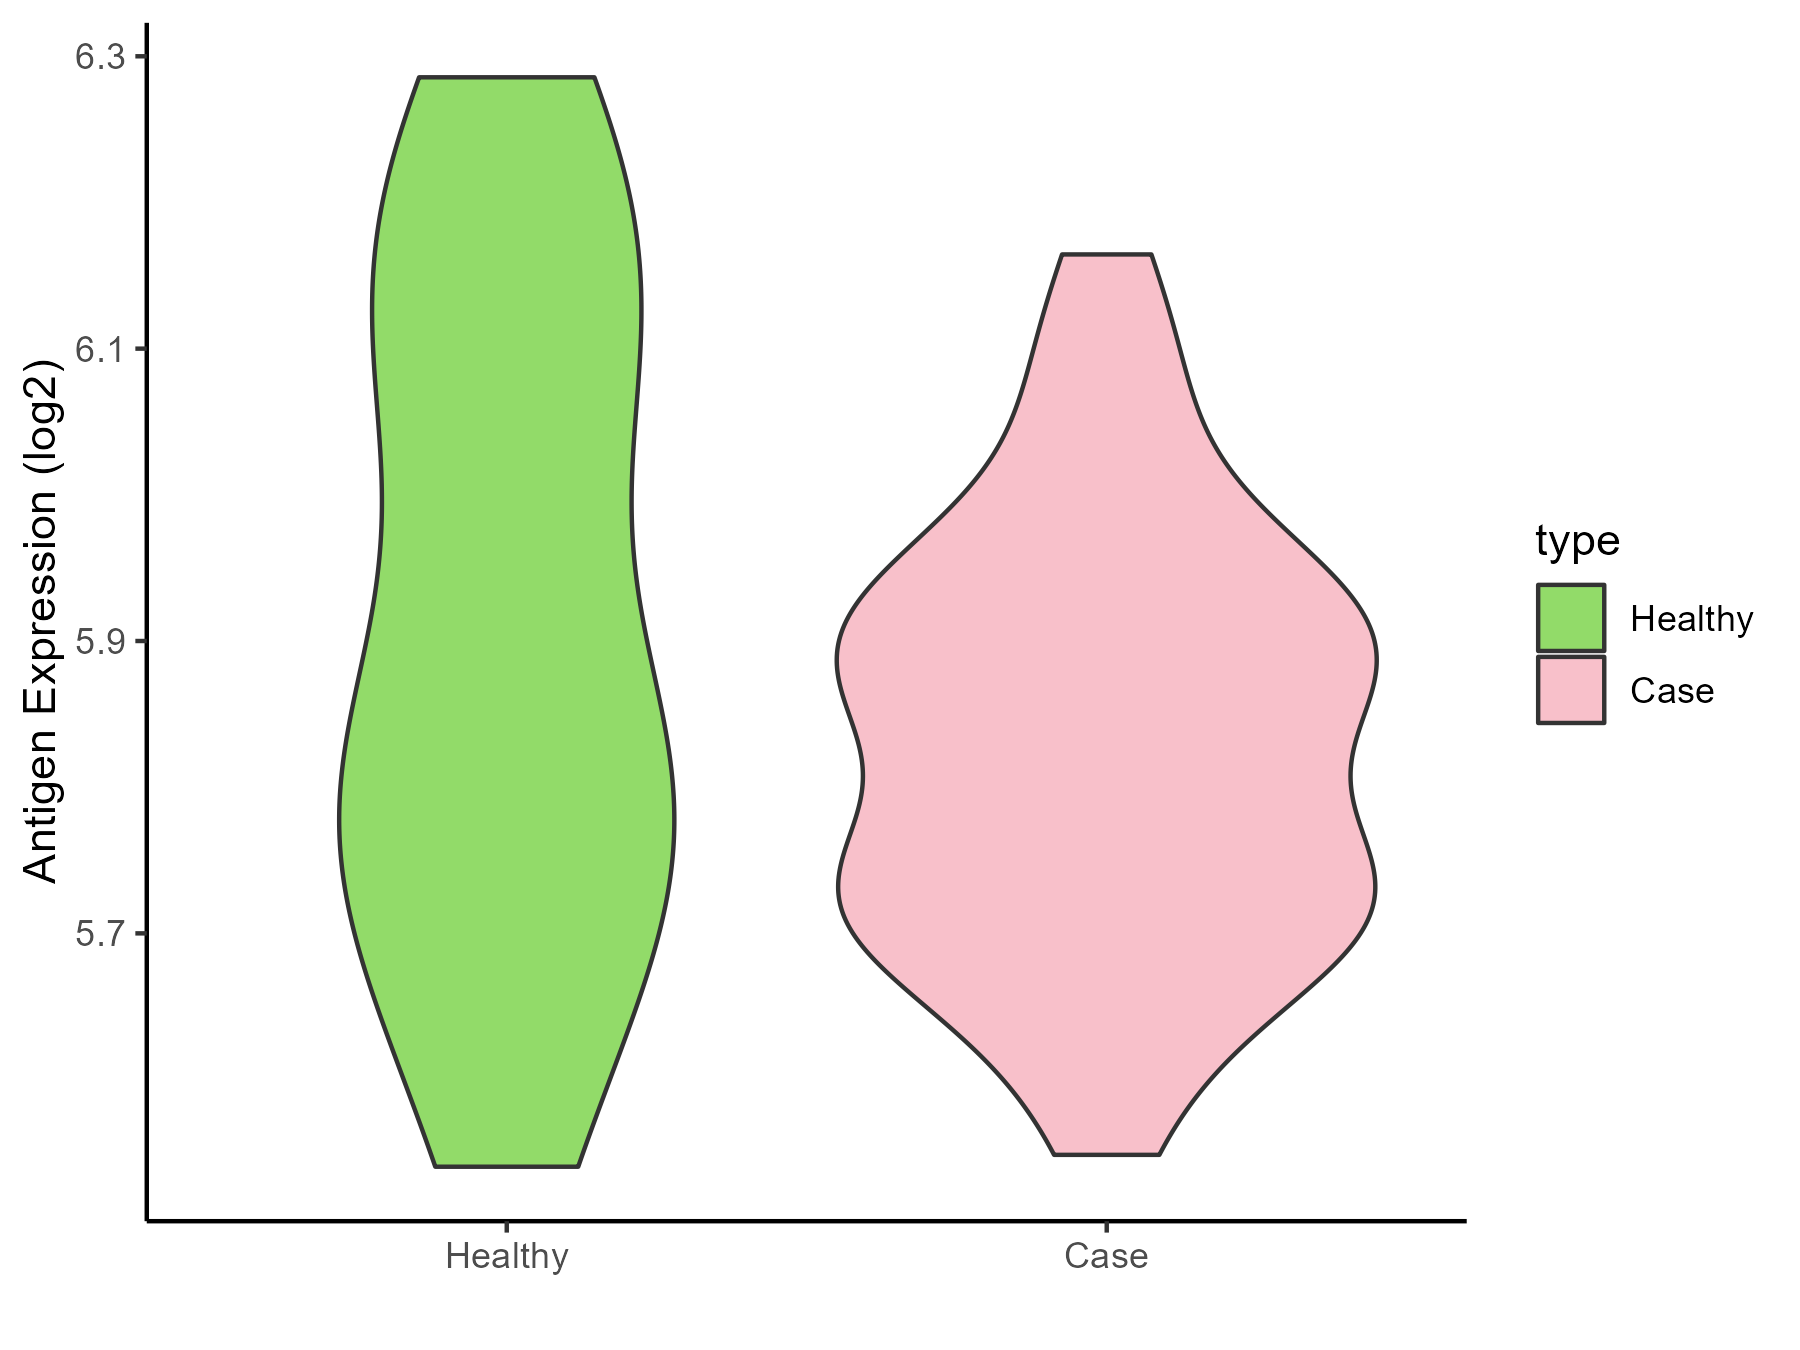
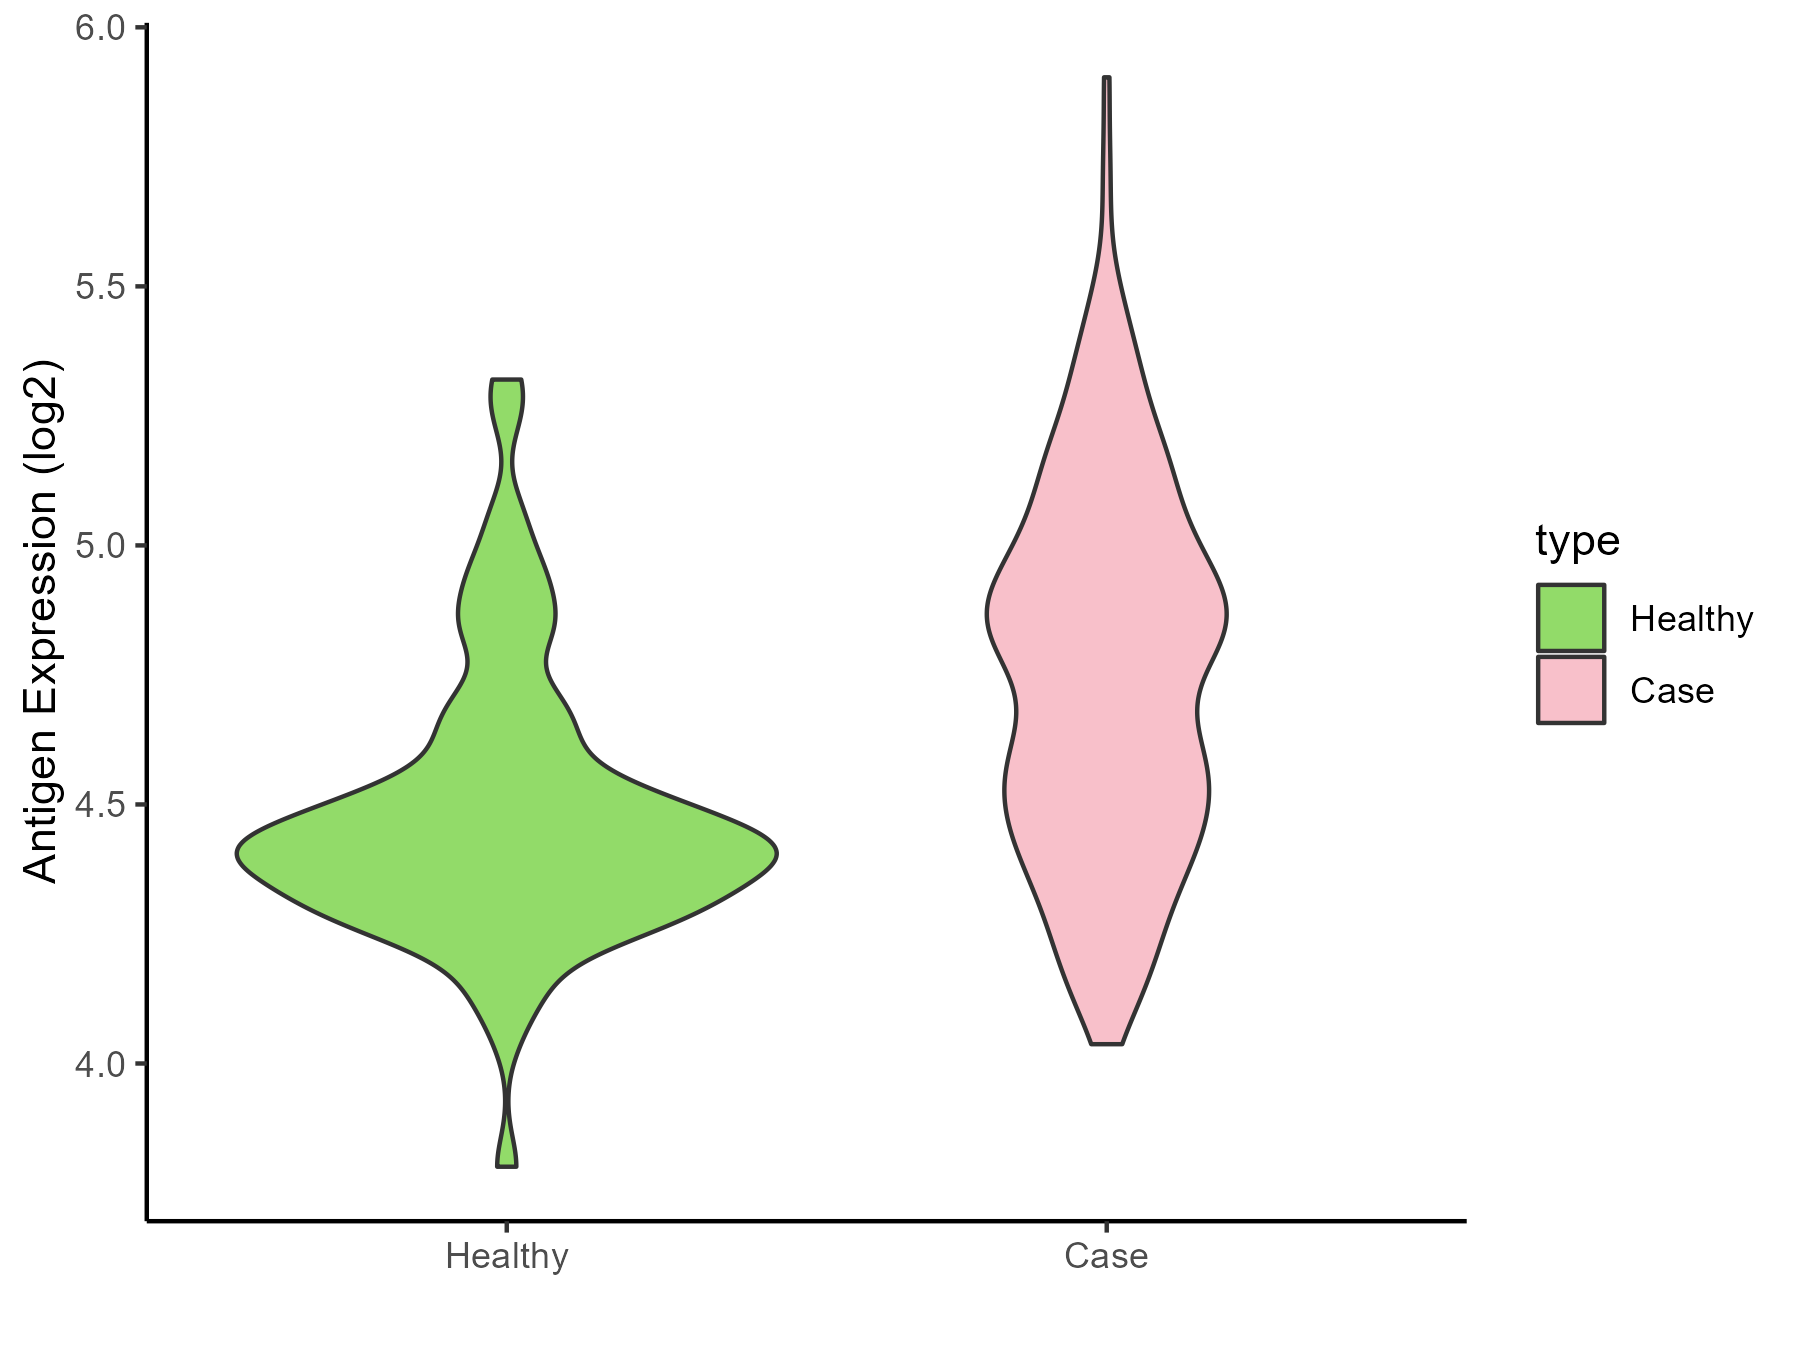
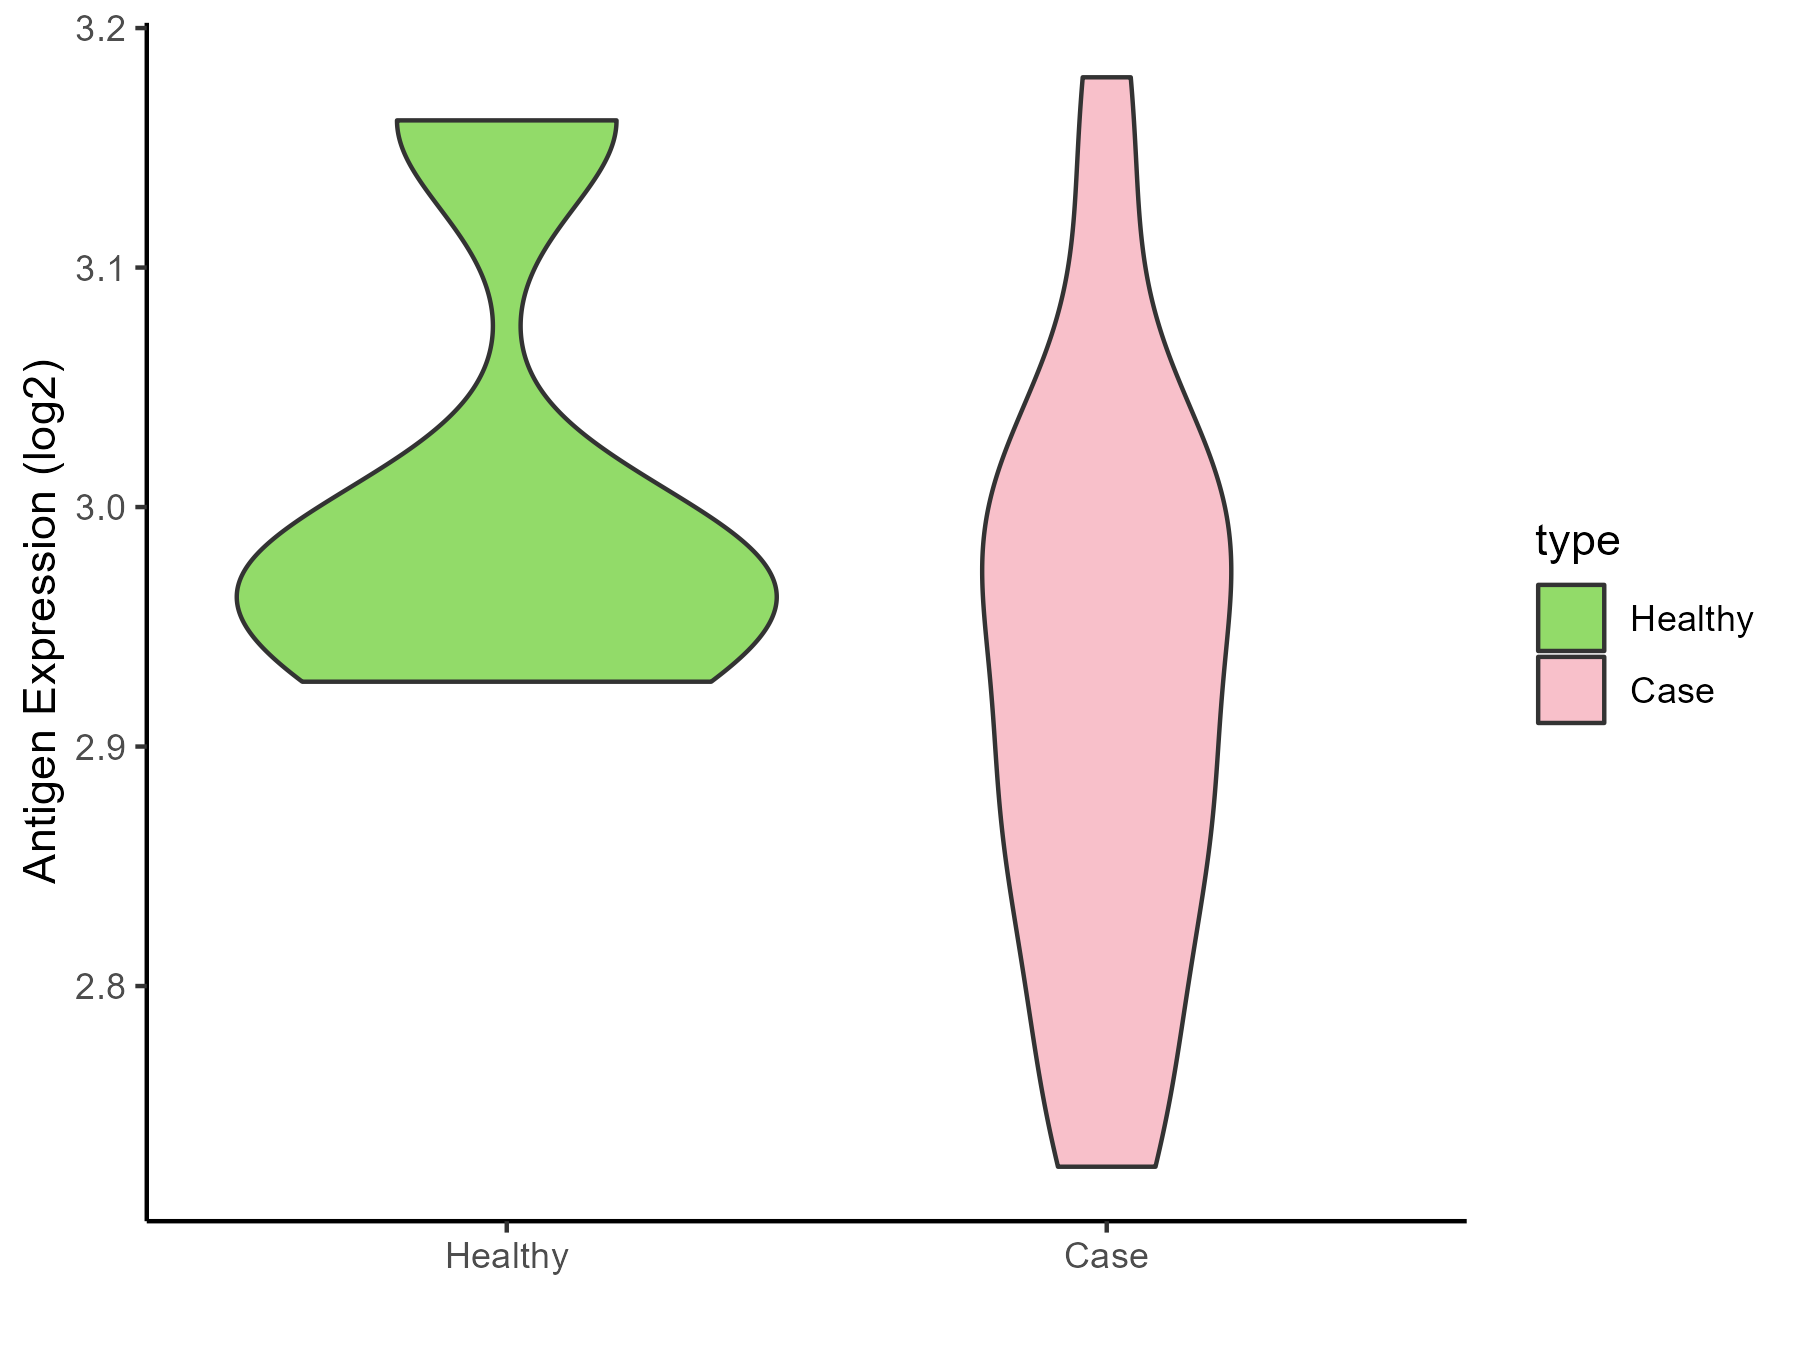
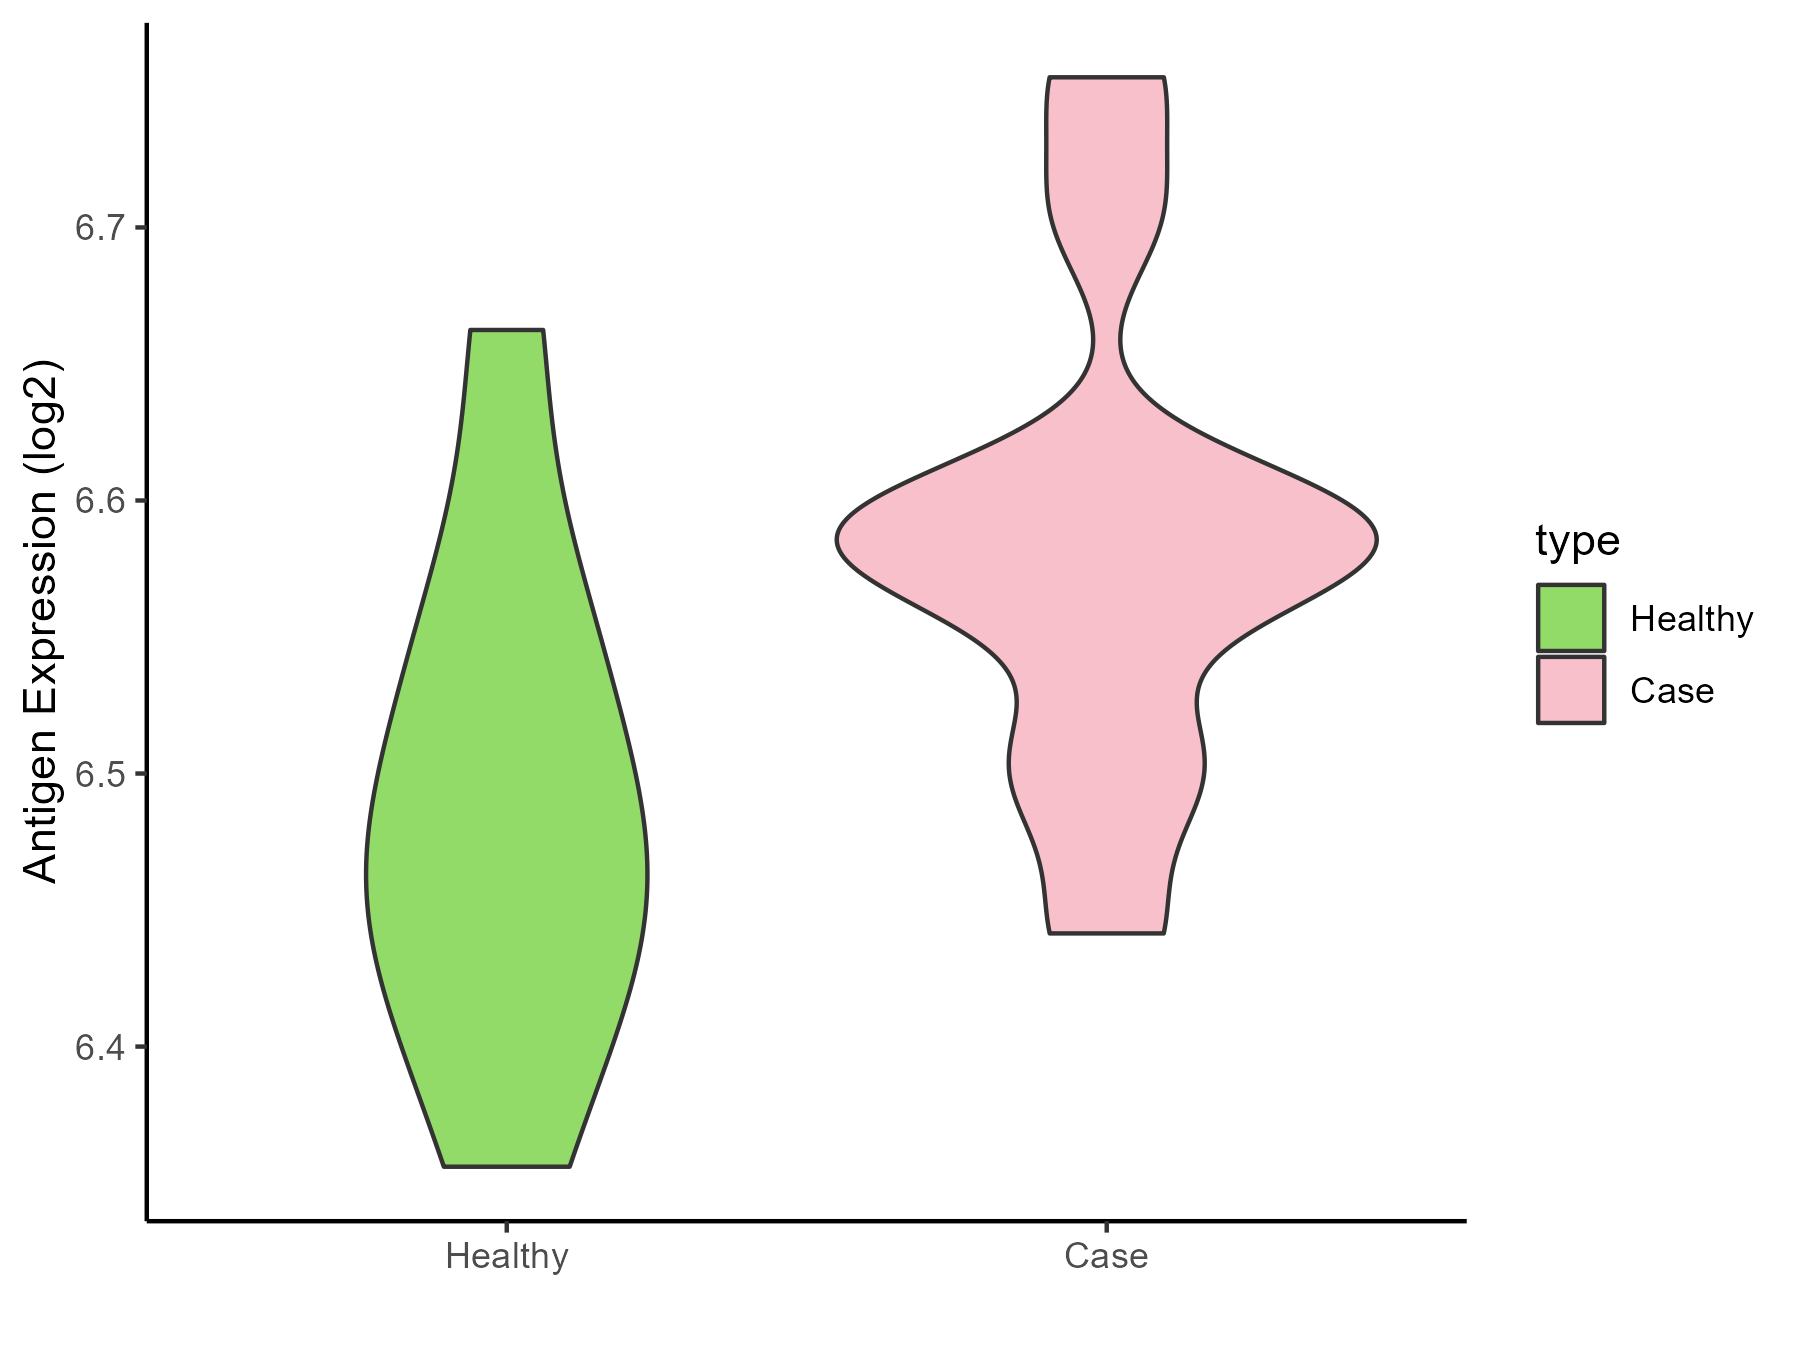
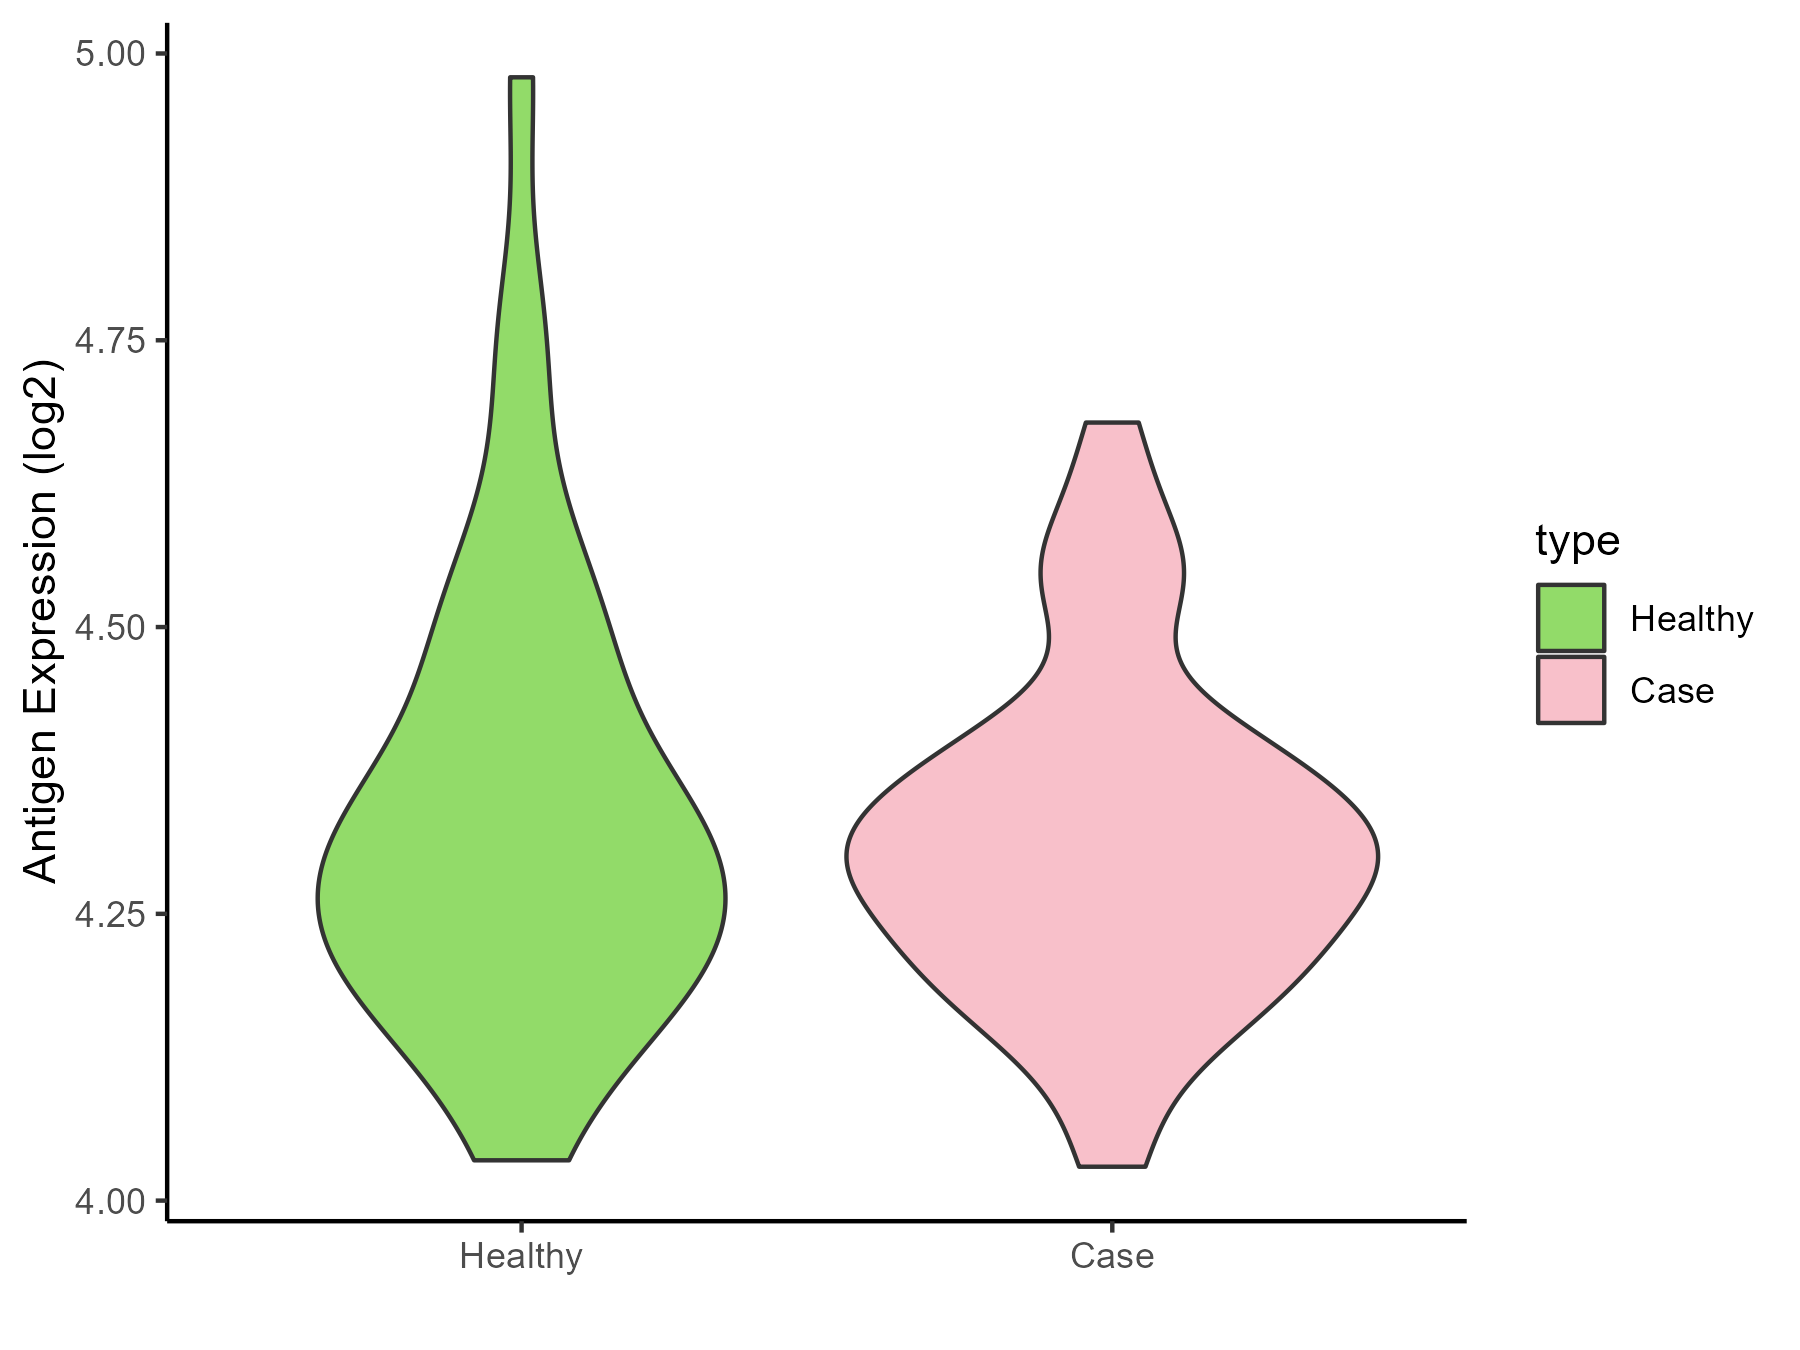
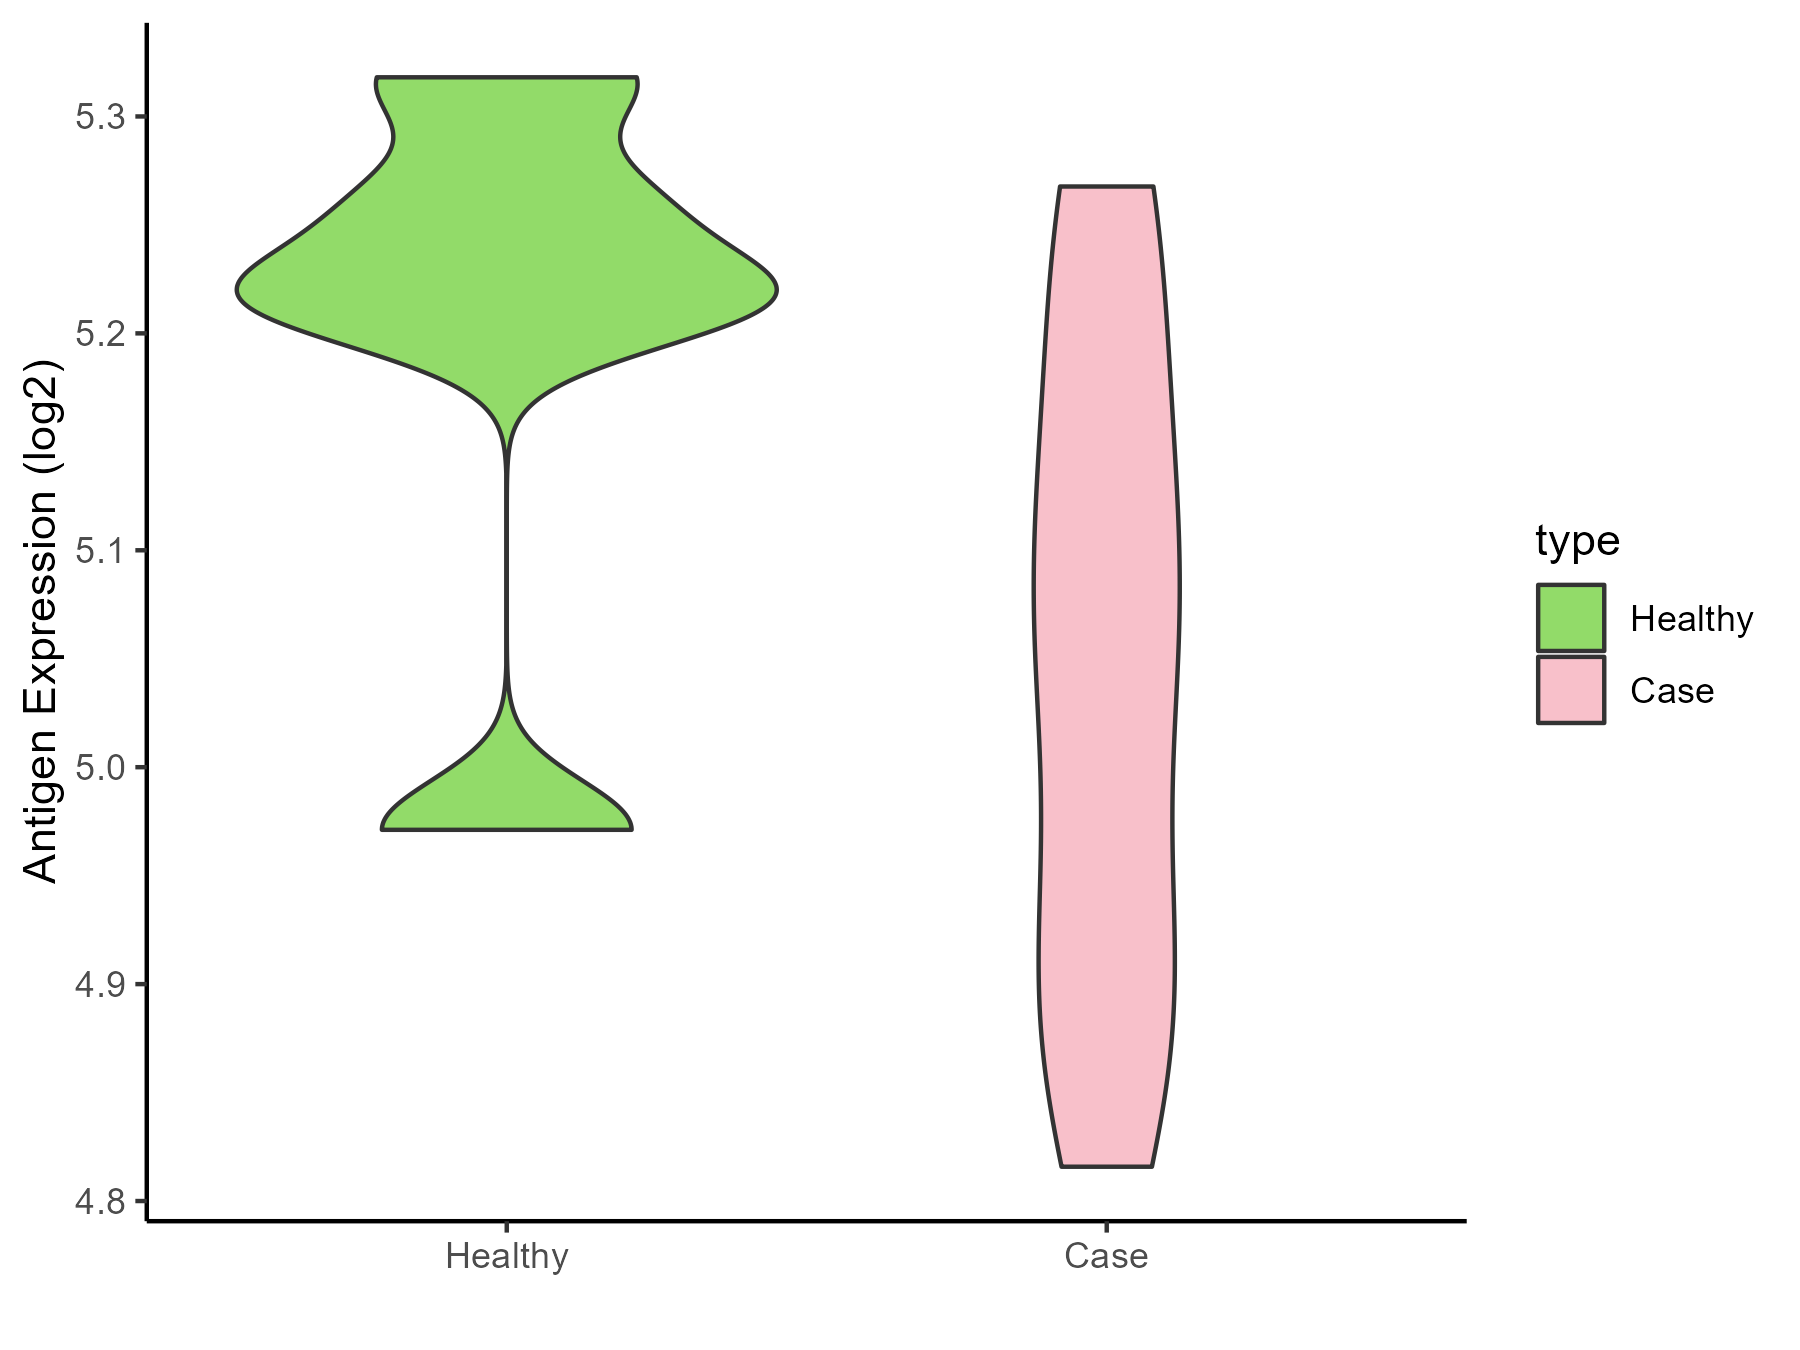
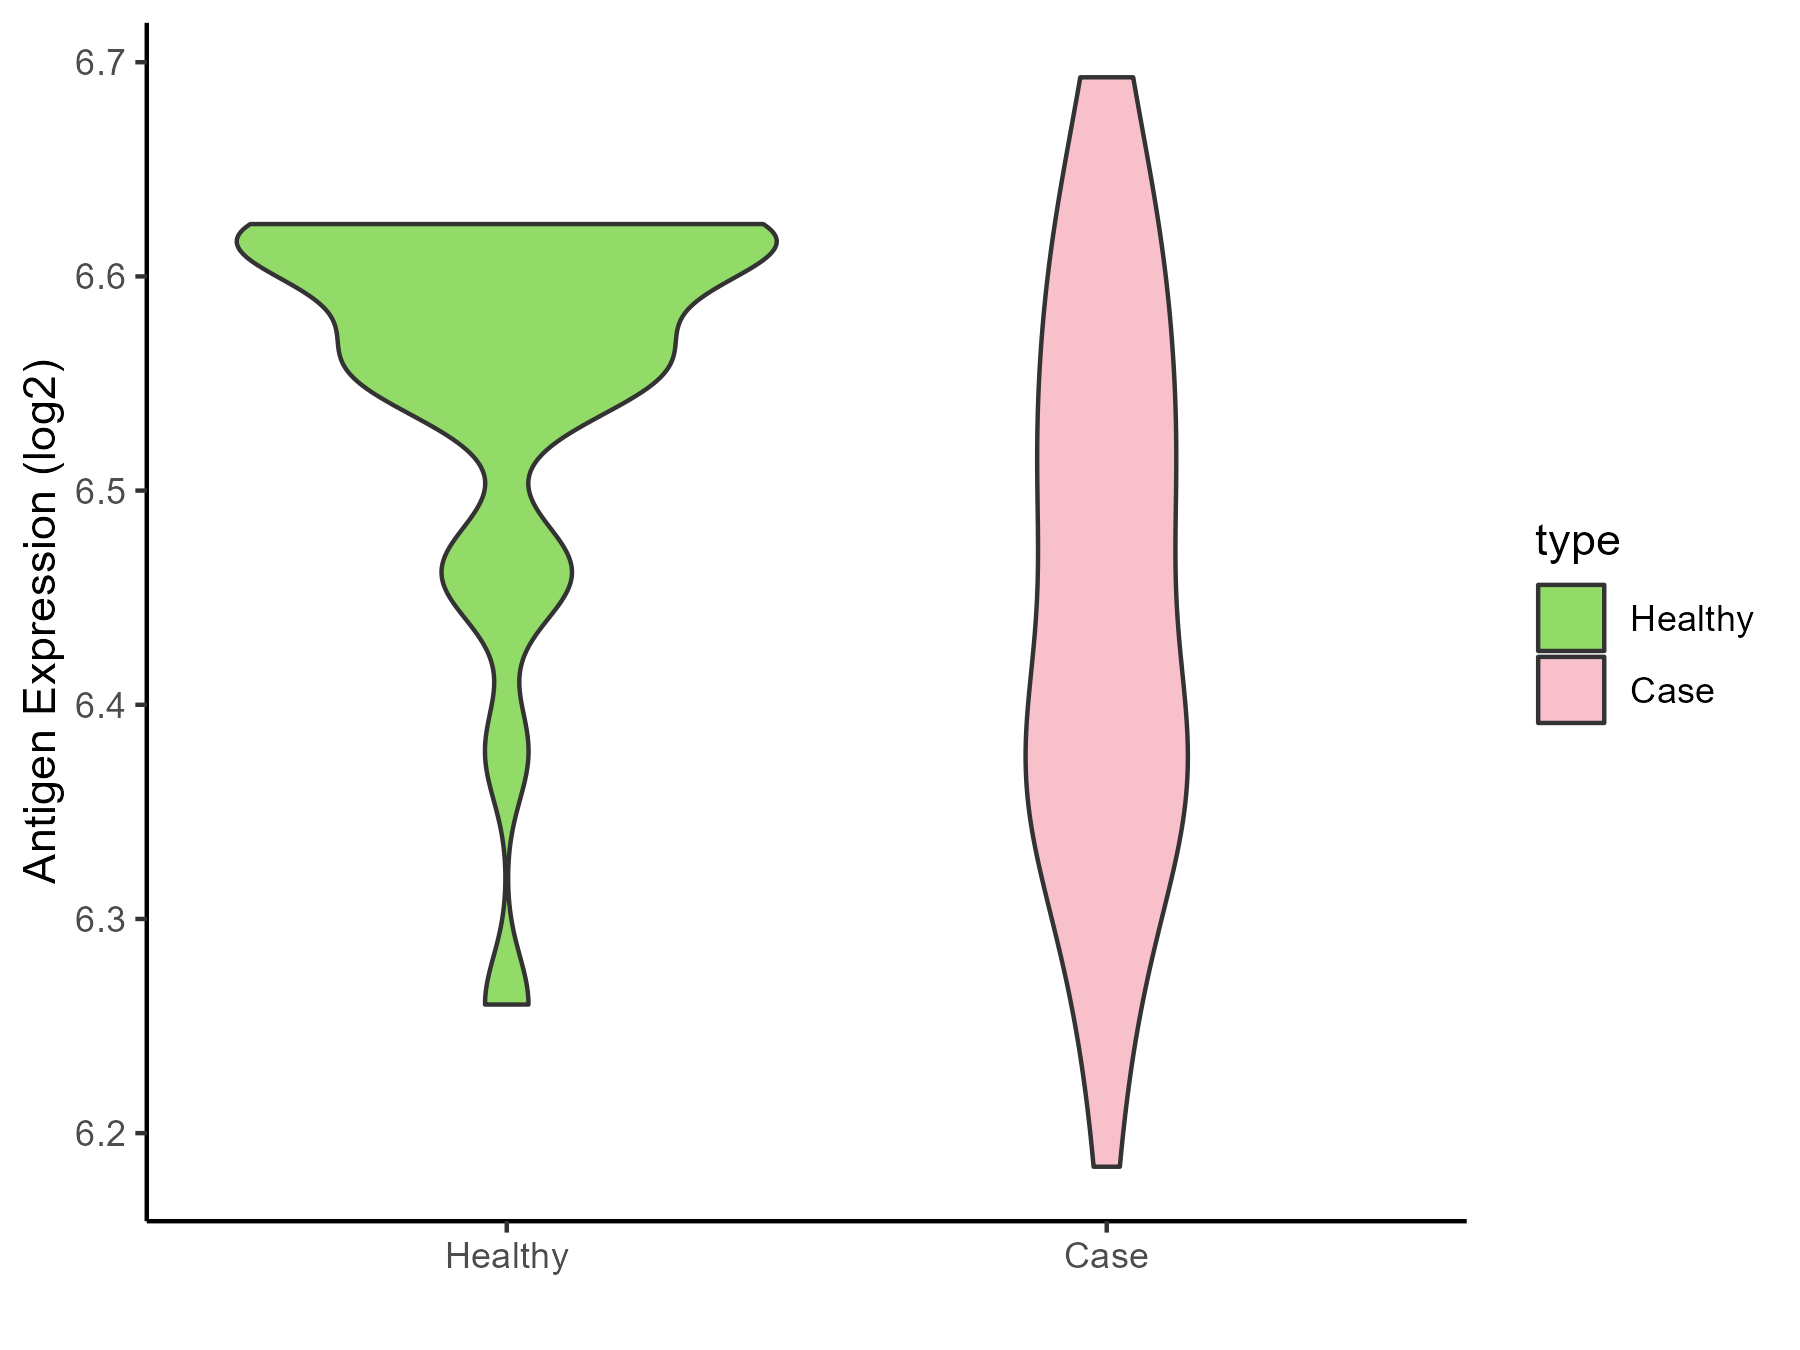
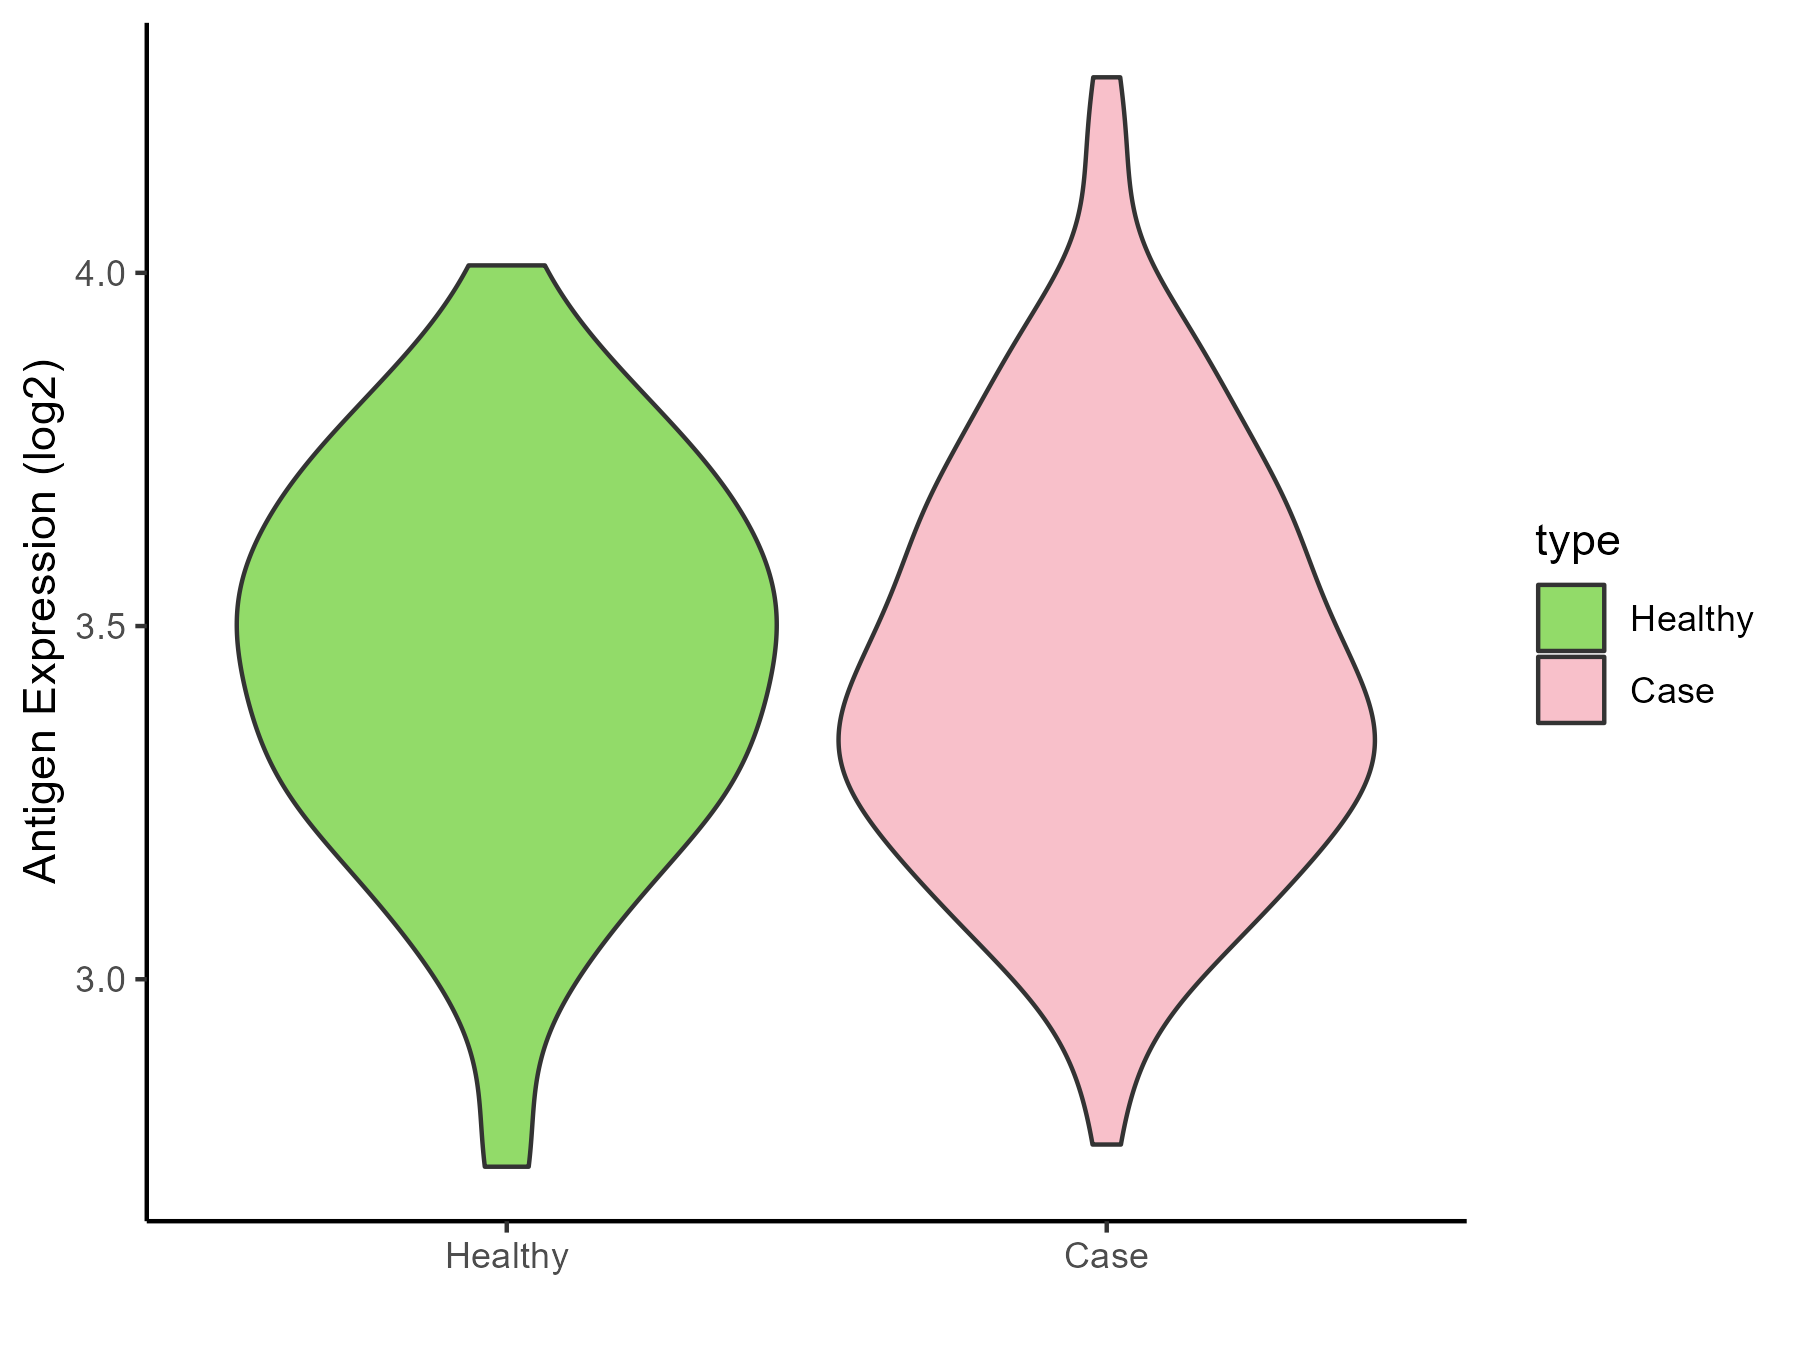
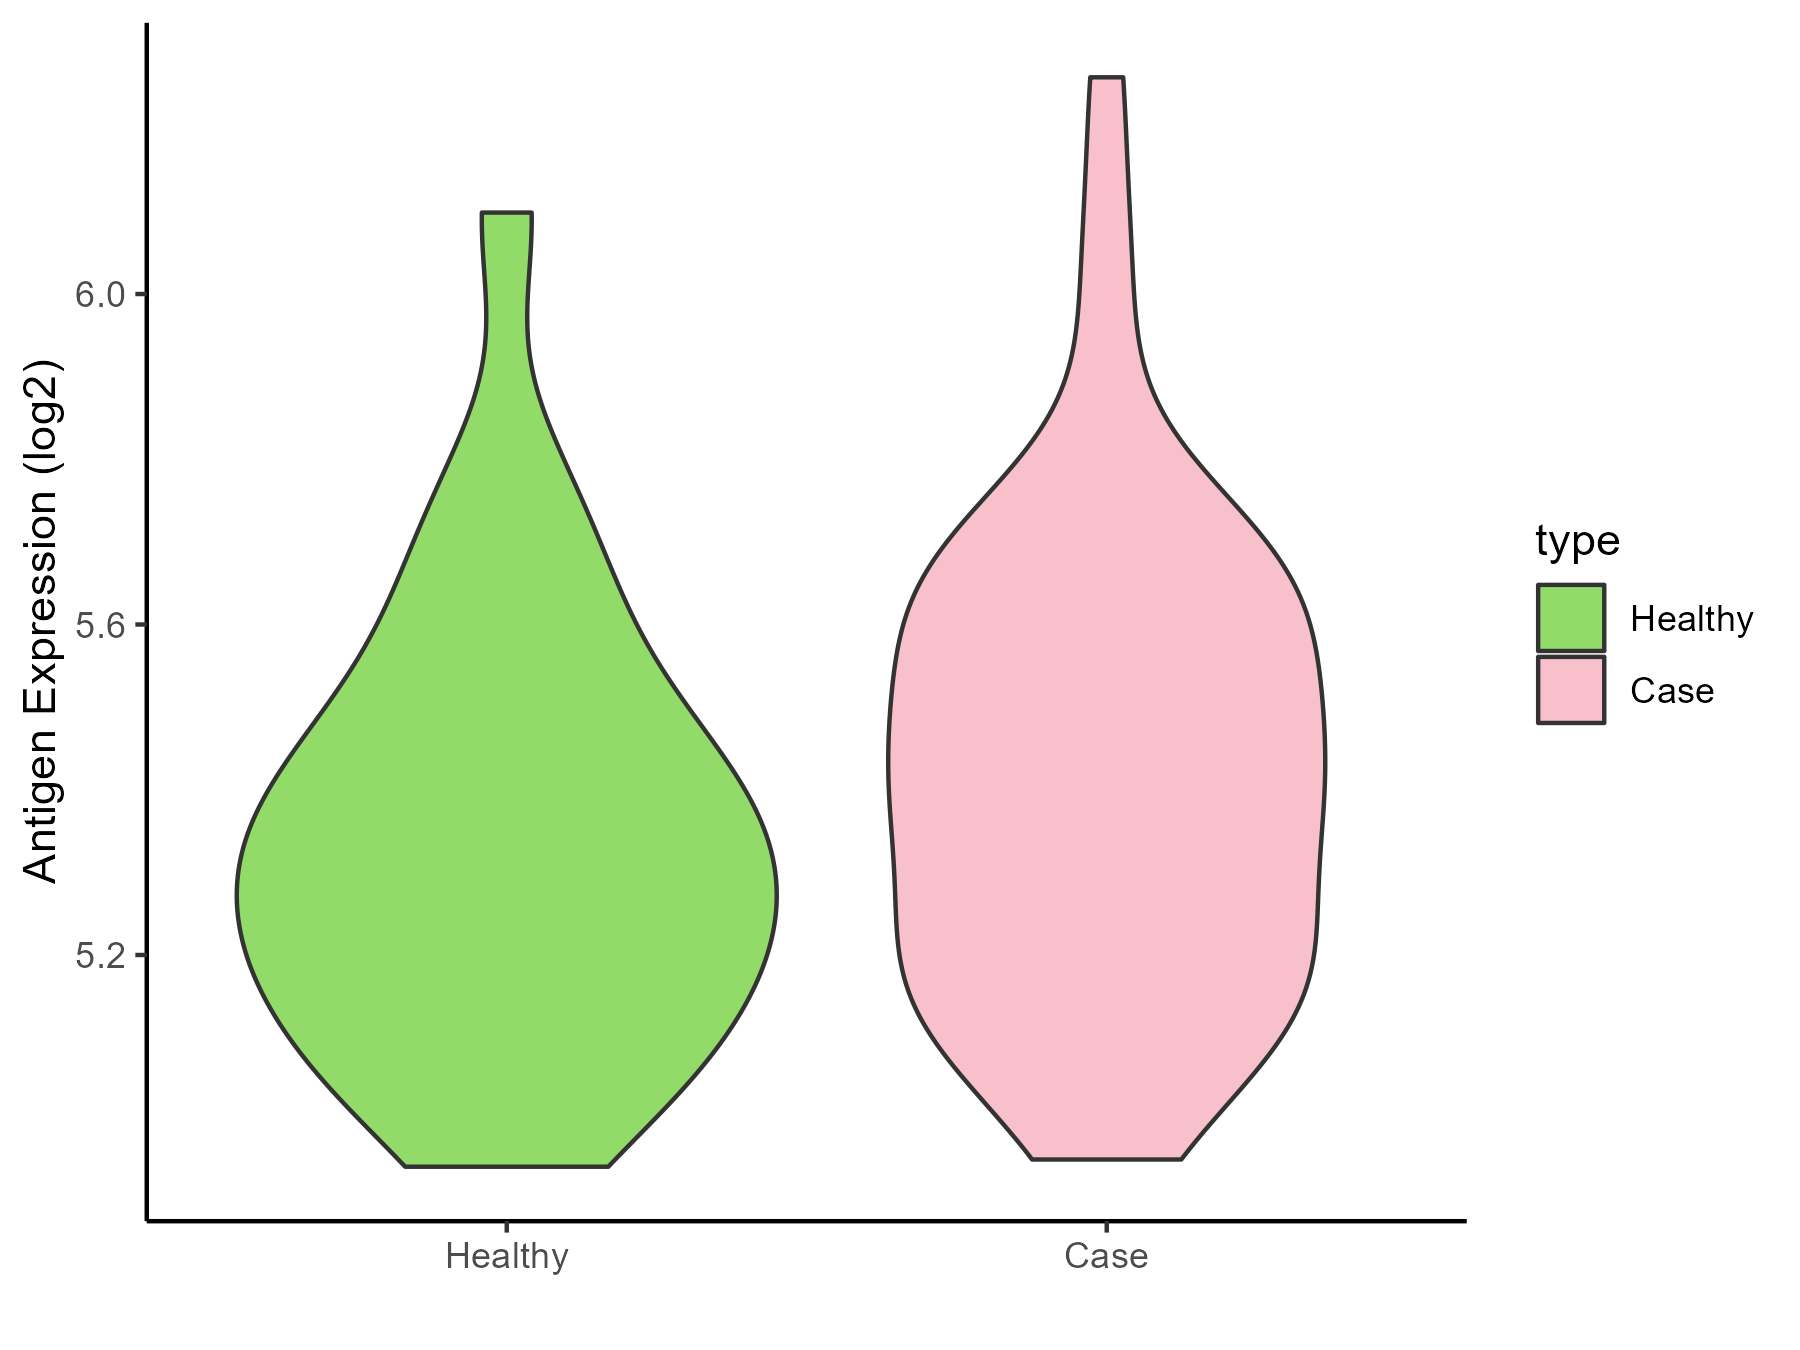
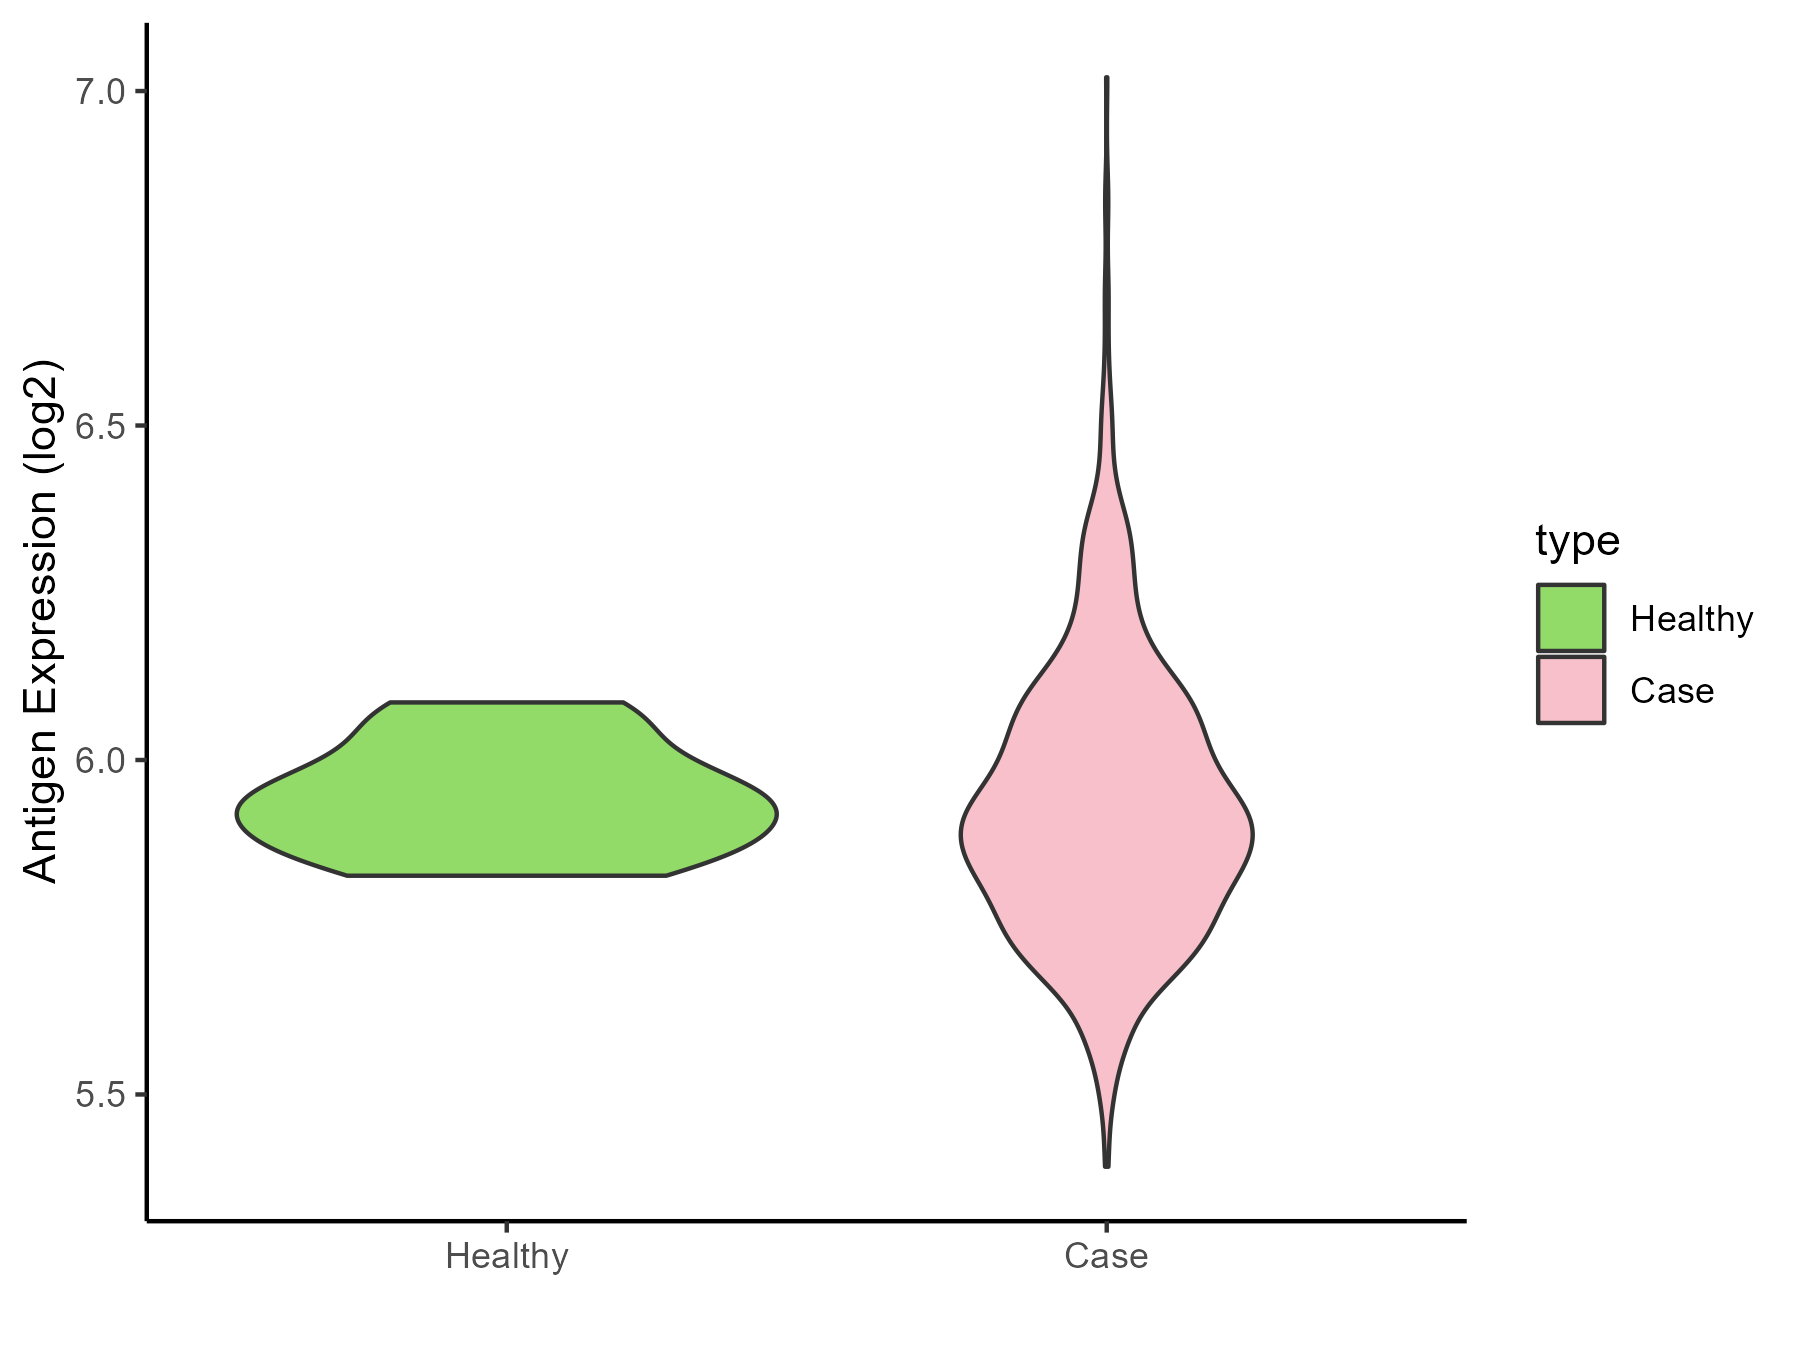
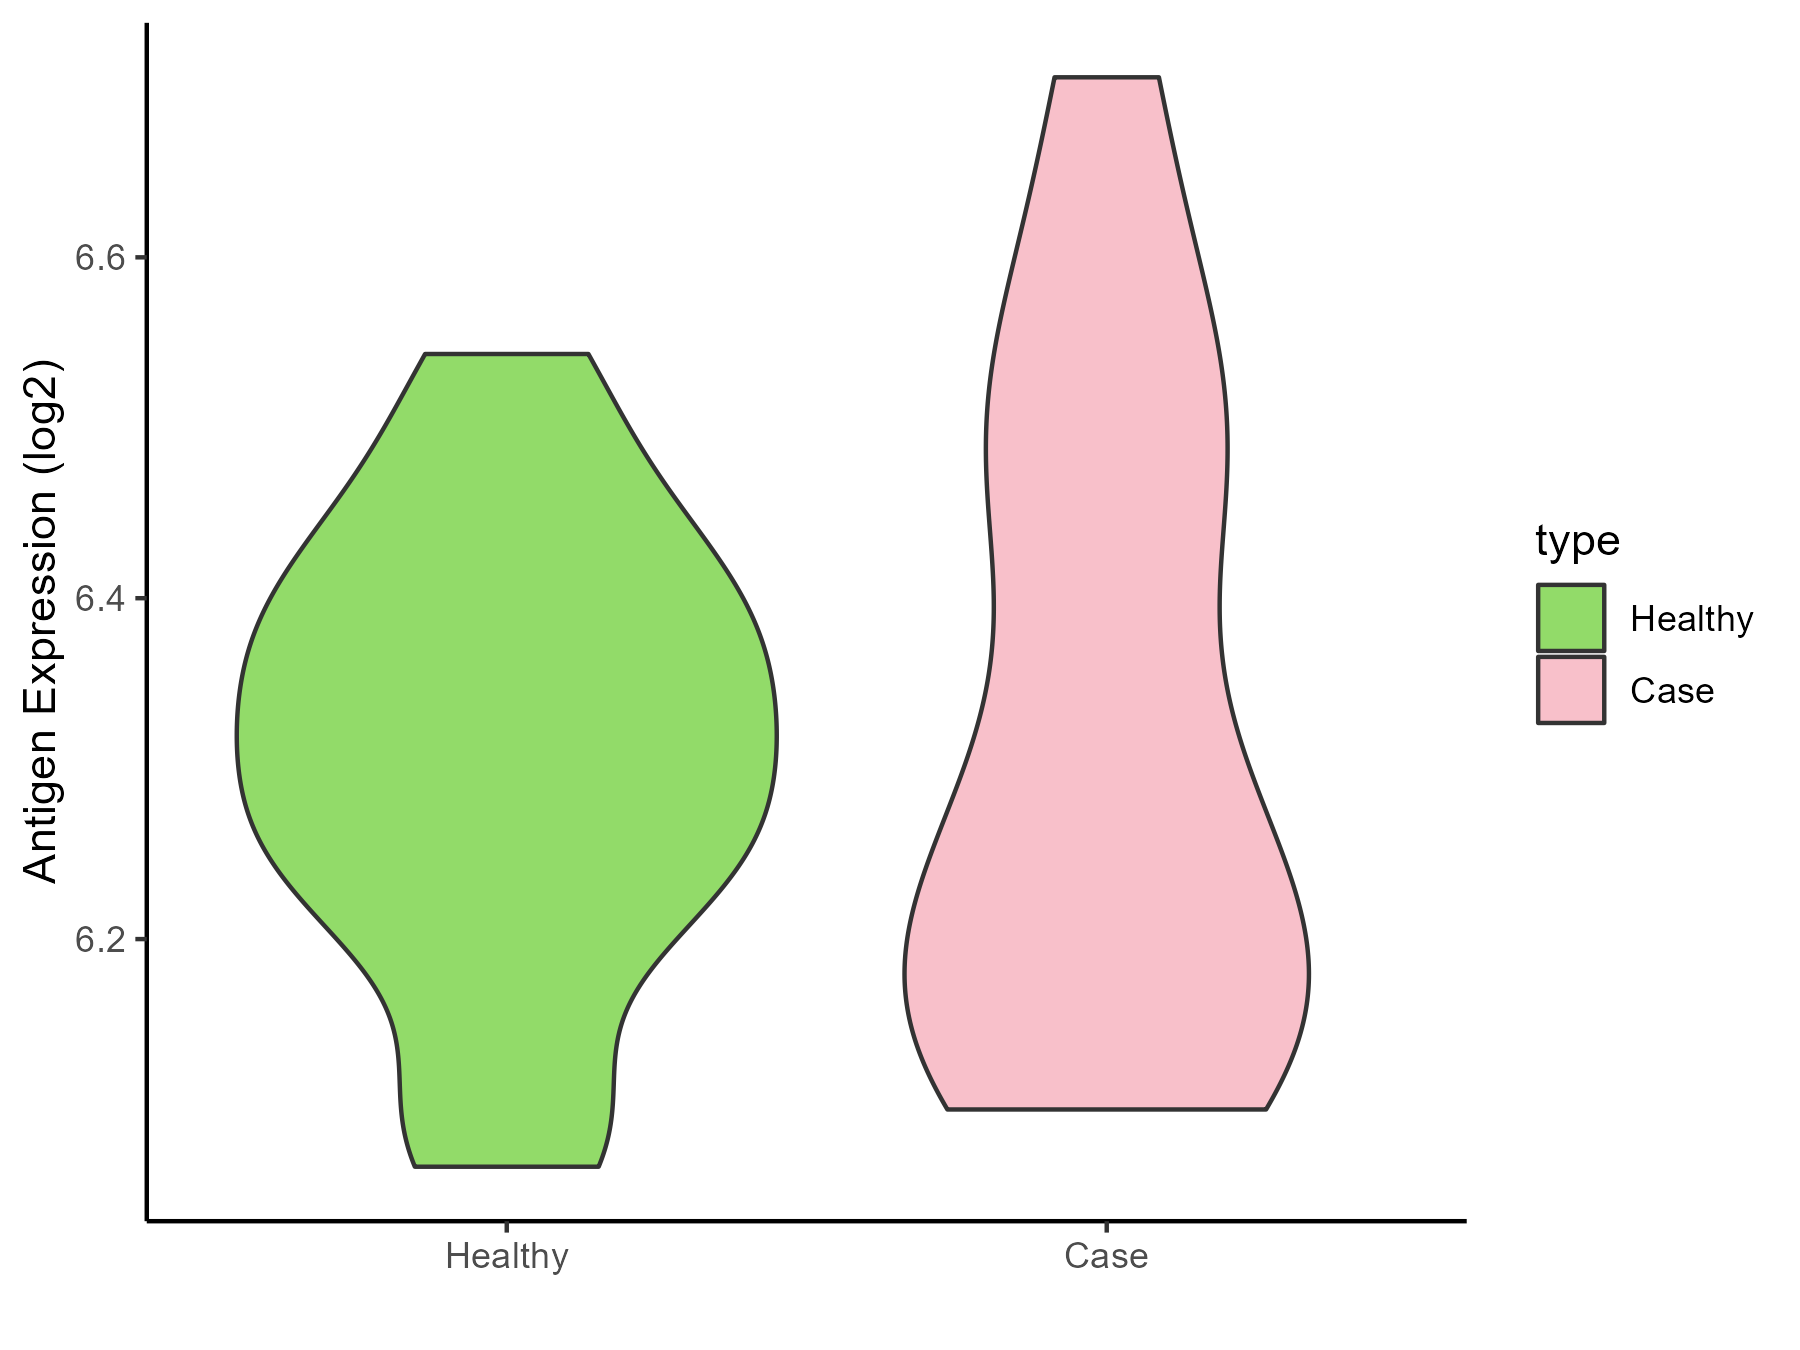
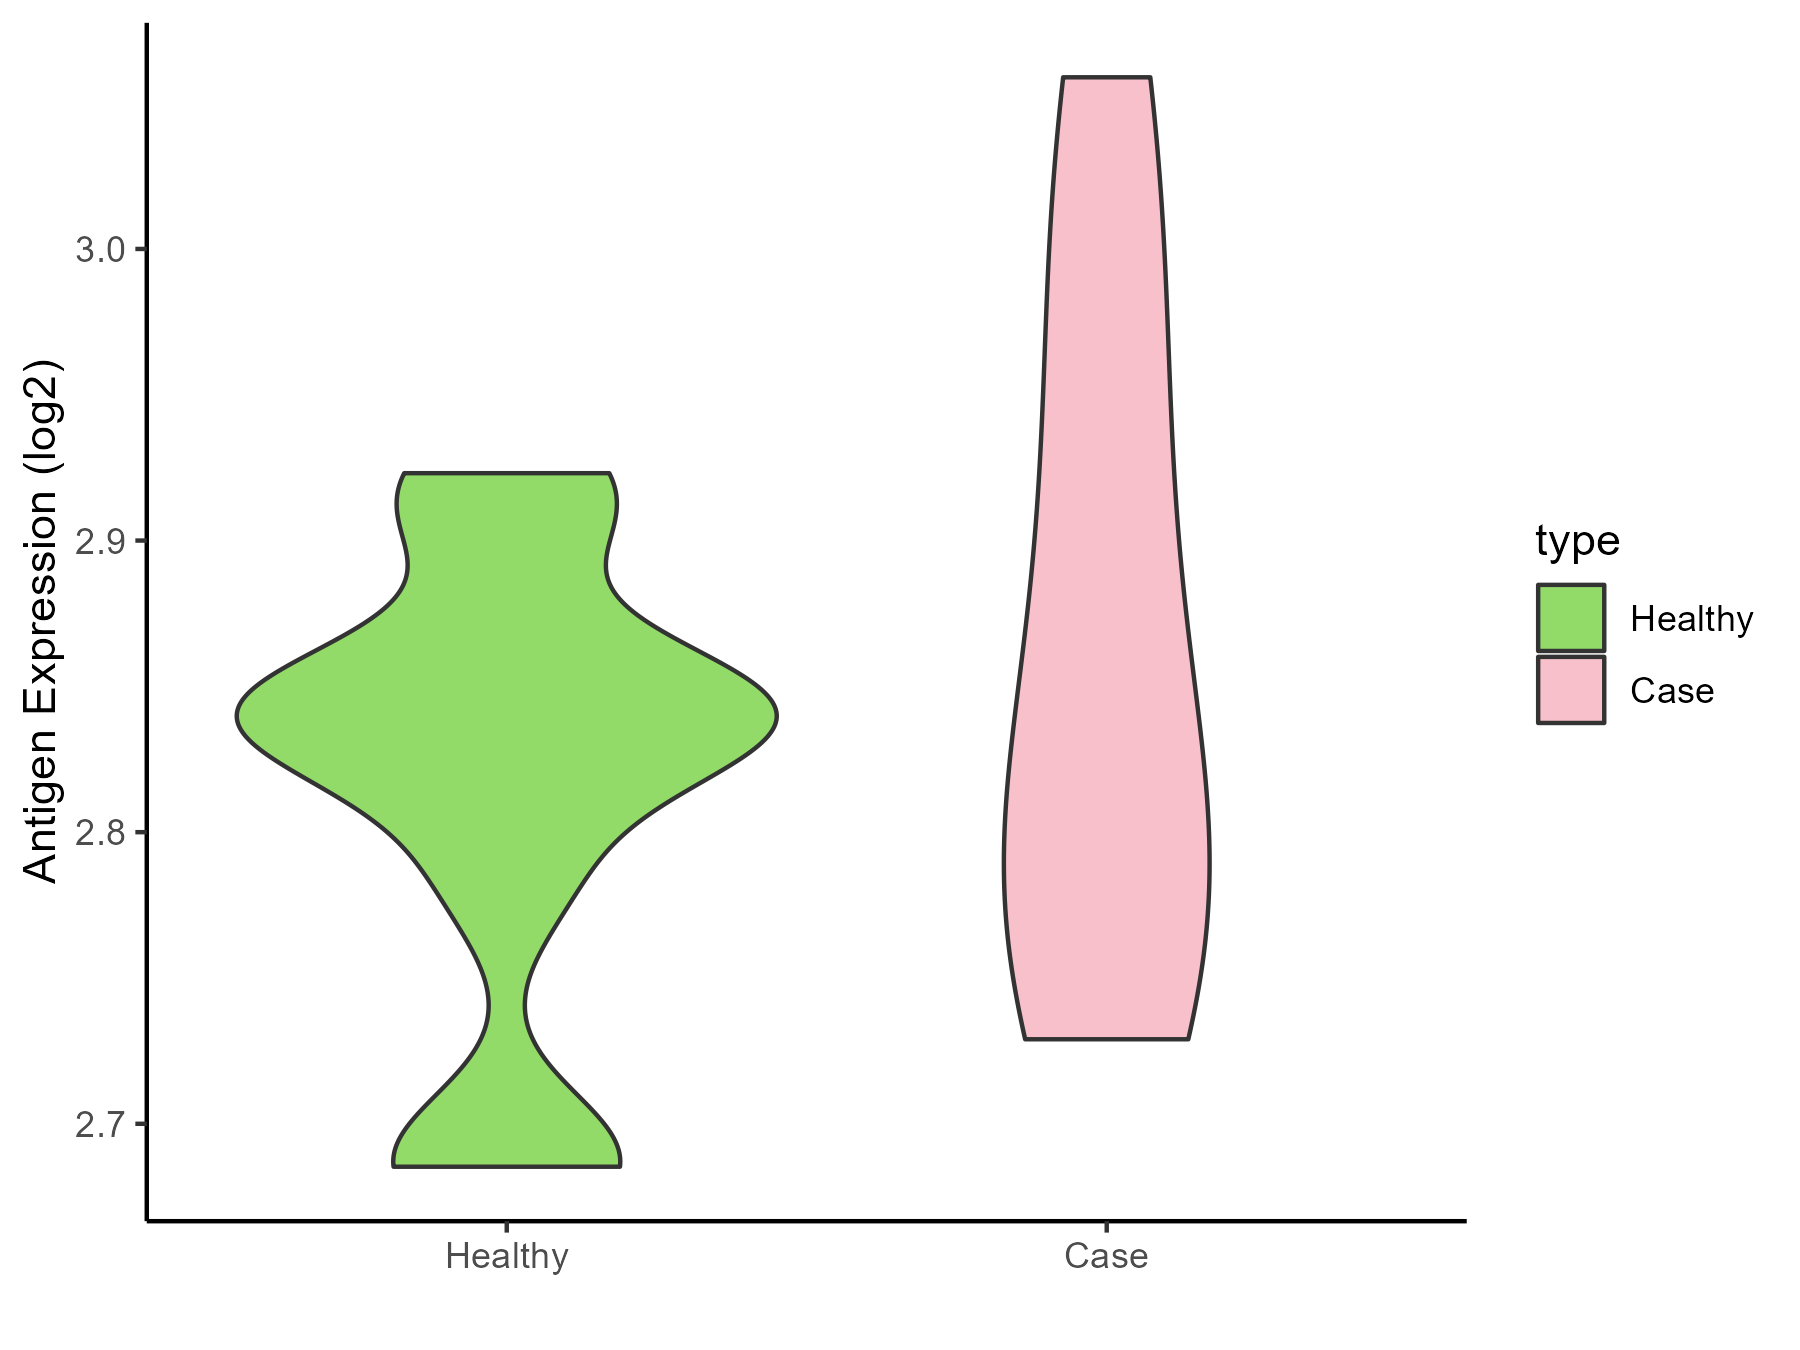
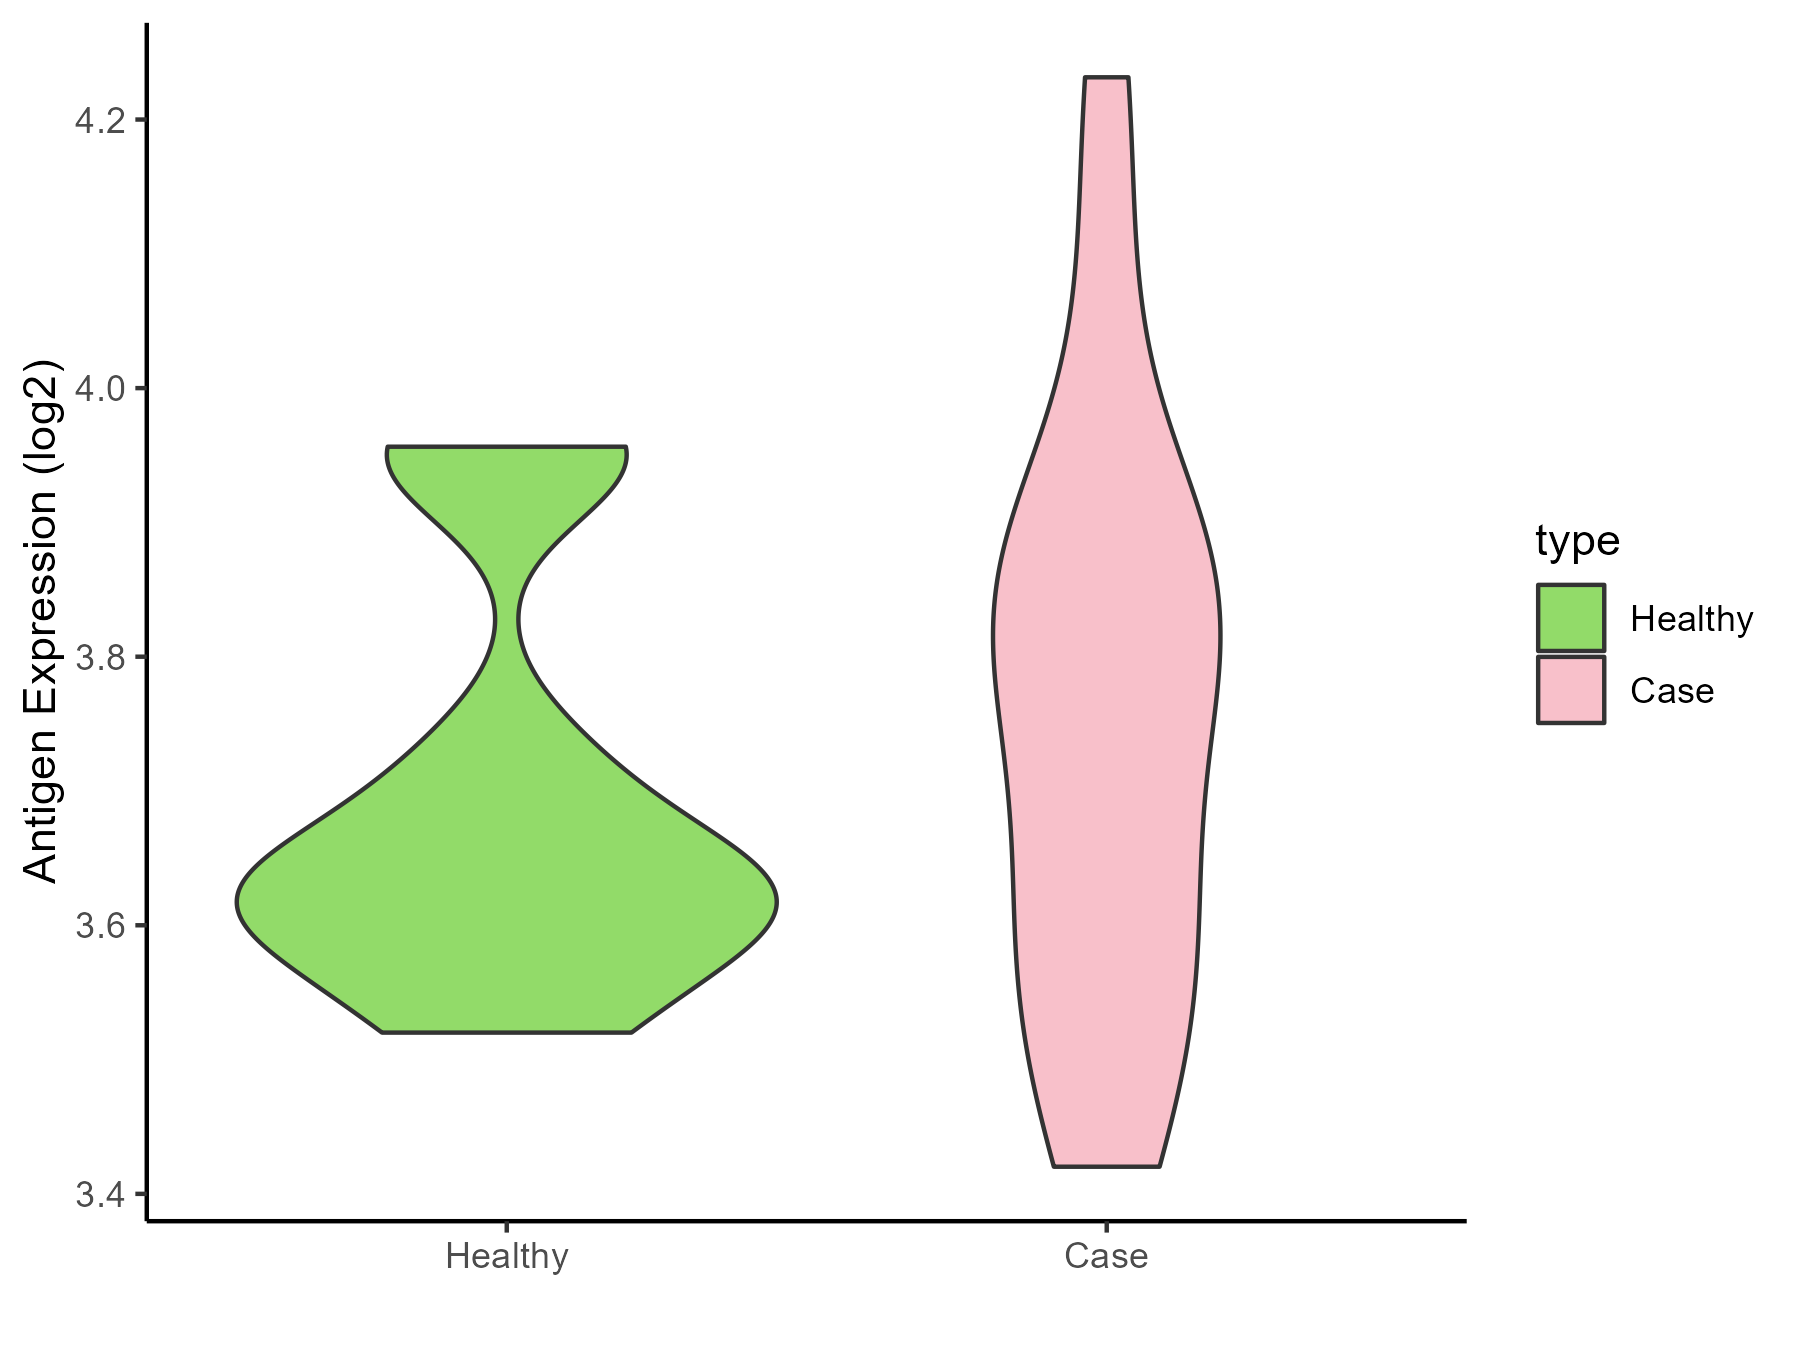
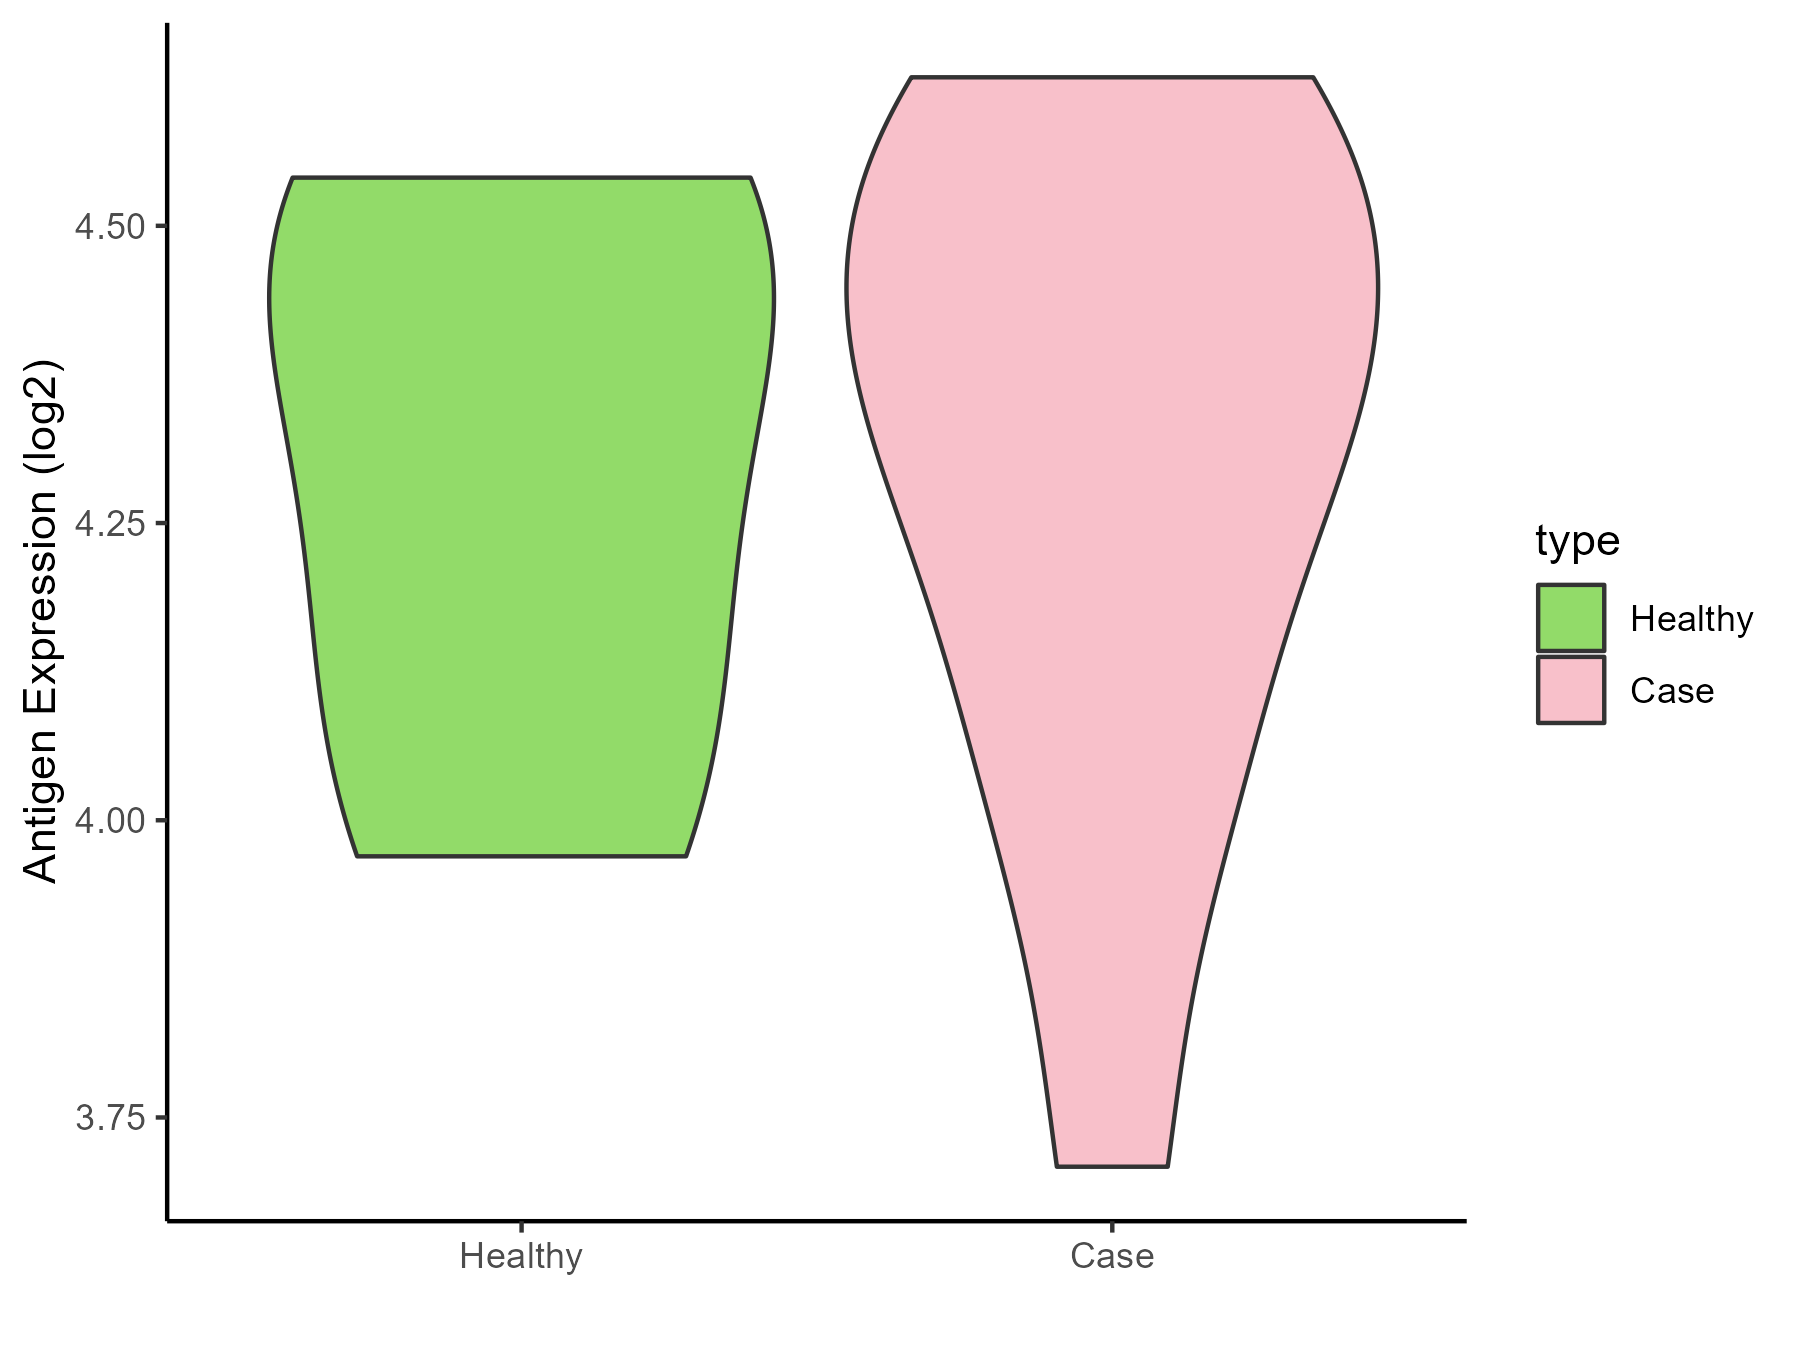
| The Studied Tissue | White matter | |
| The Specific Disease | Glioma | |
| The Expression Level of Disease Section Compare with the Healthy Individual Tissue | p-value: 0.000246098; Fold-change: -0.757520251; Z-score: -2.034875933 | |
| Disease-specific Antigen Abundances |
|
Click to View the Clearer Original Diagram |
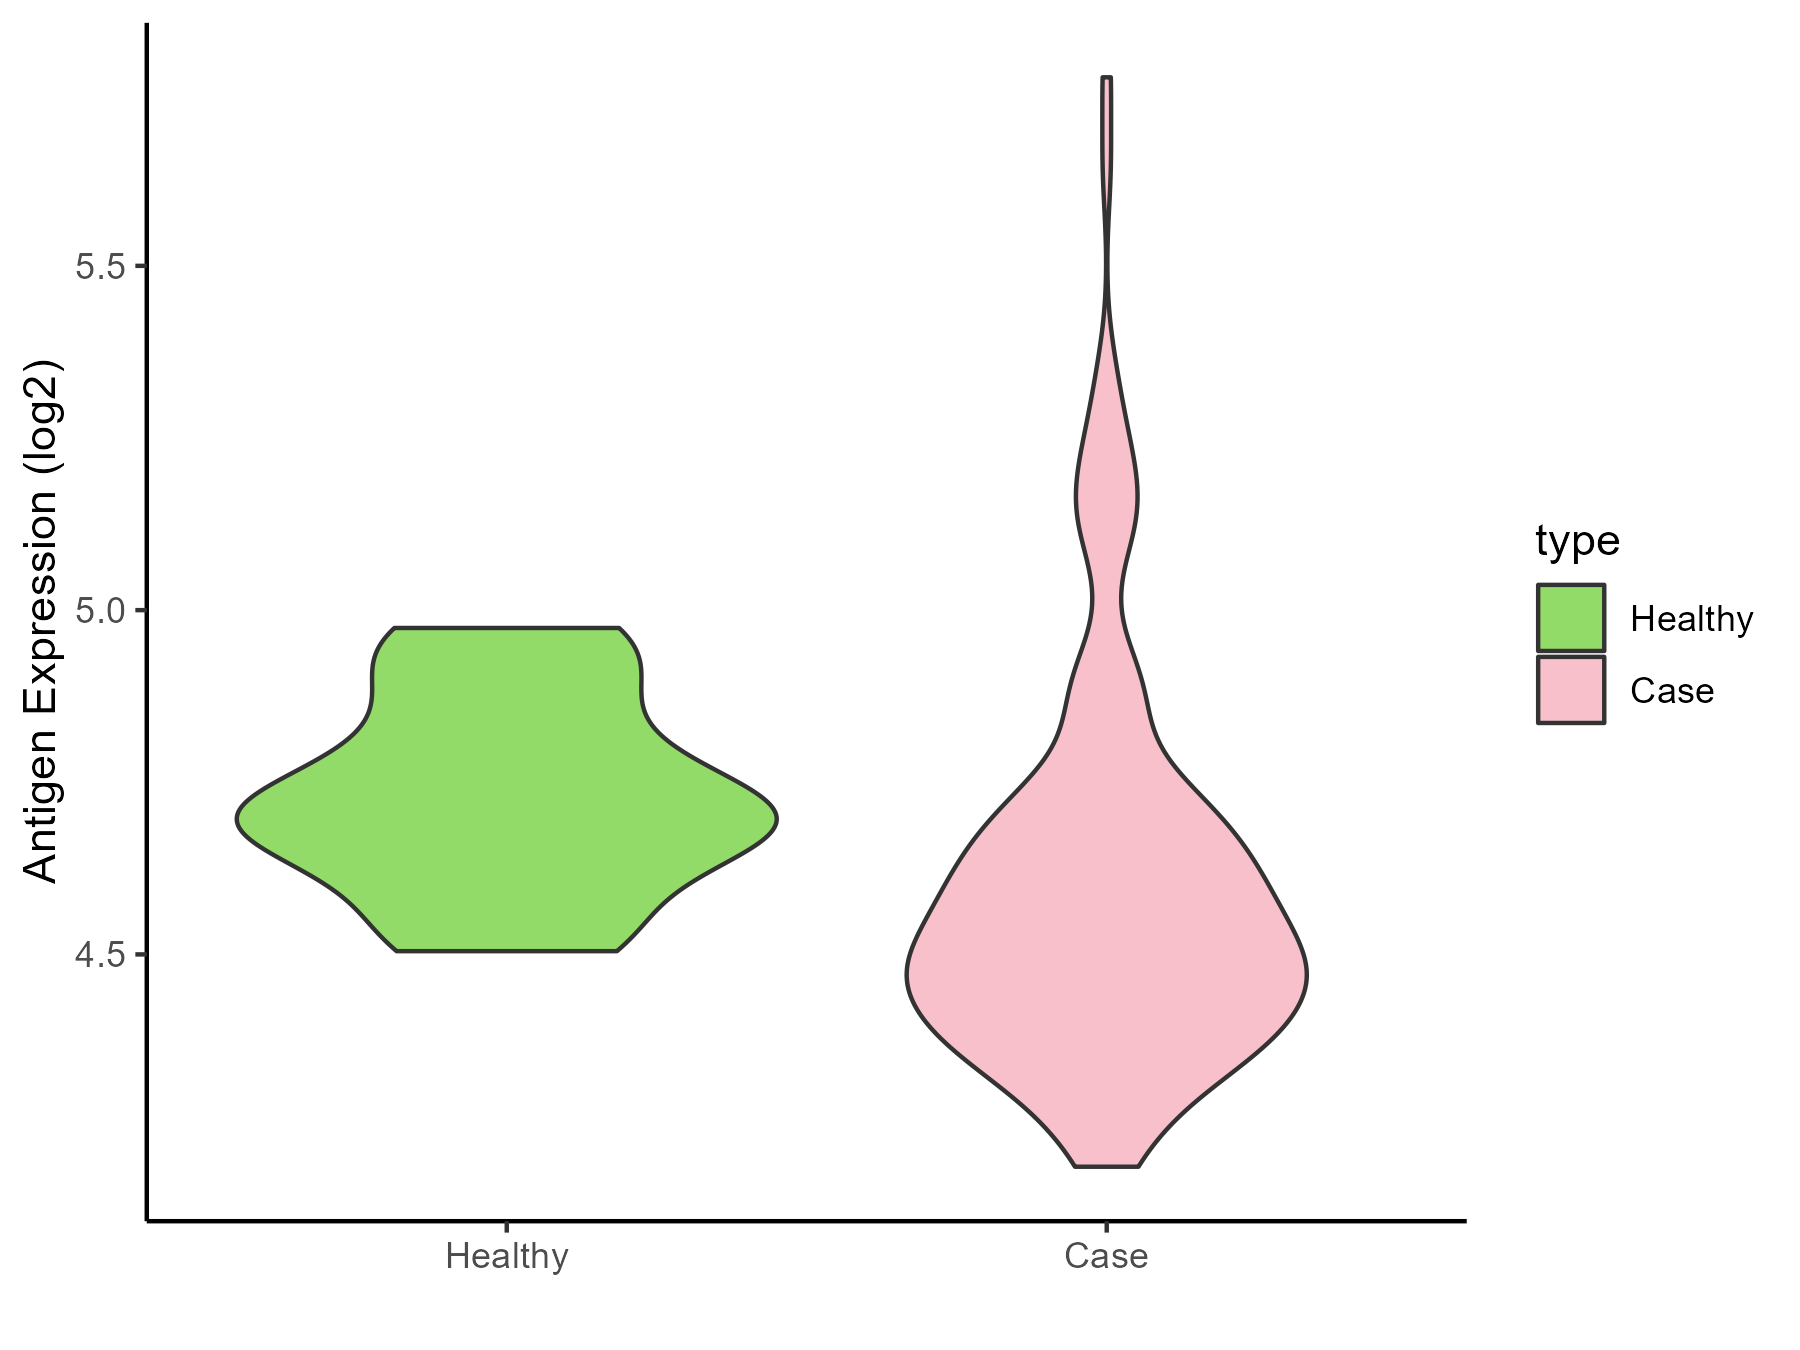
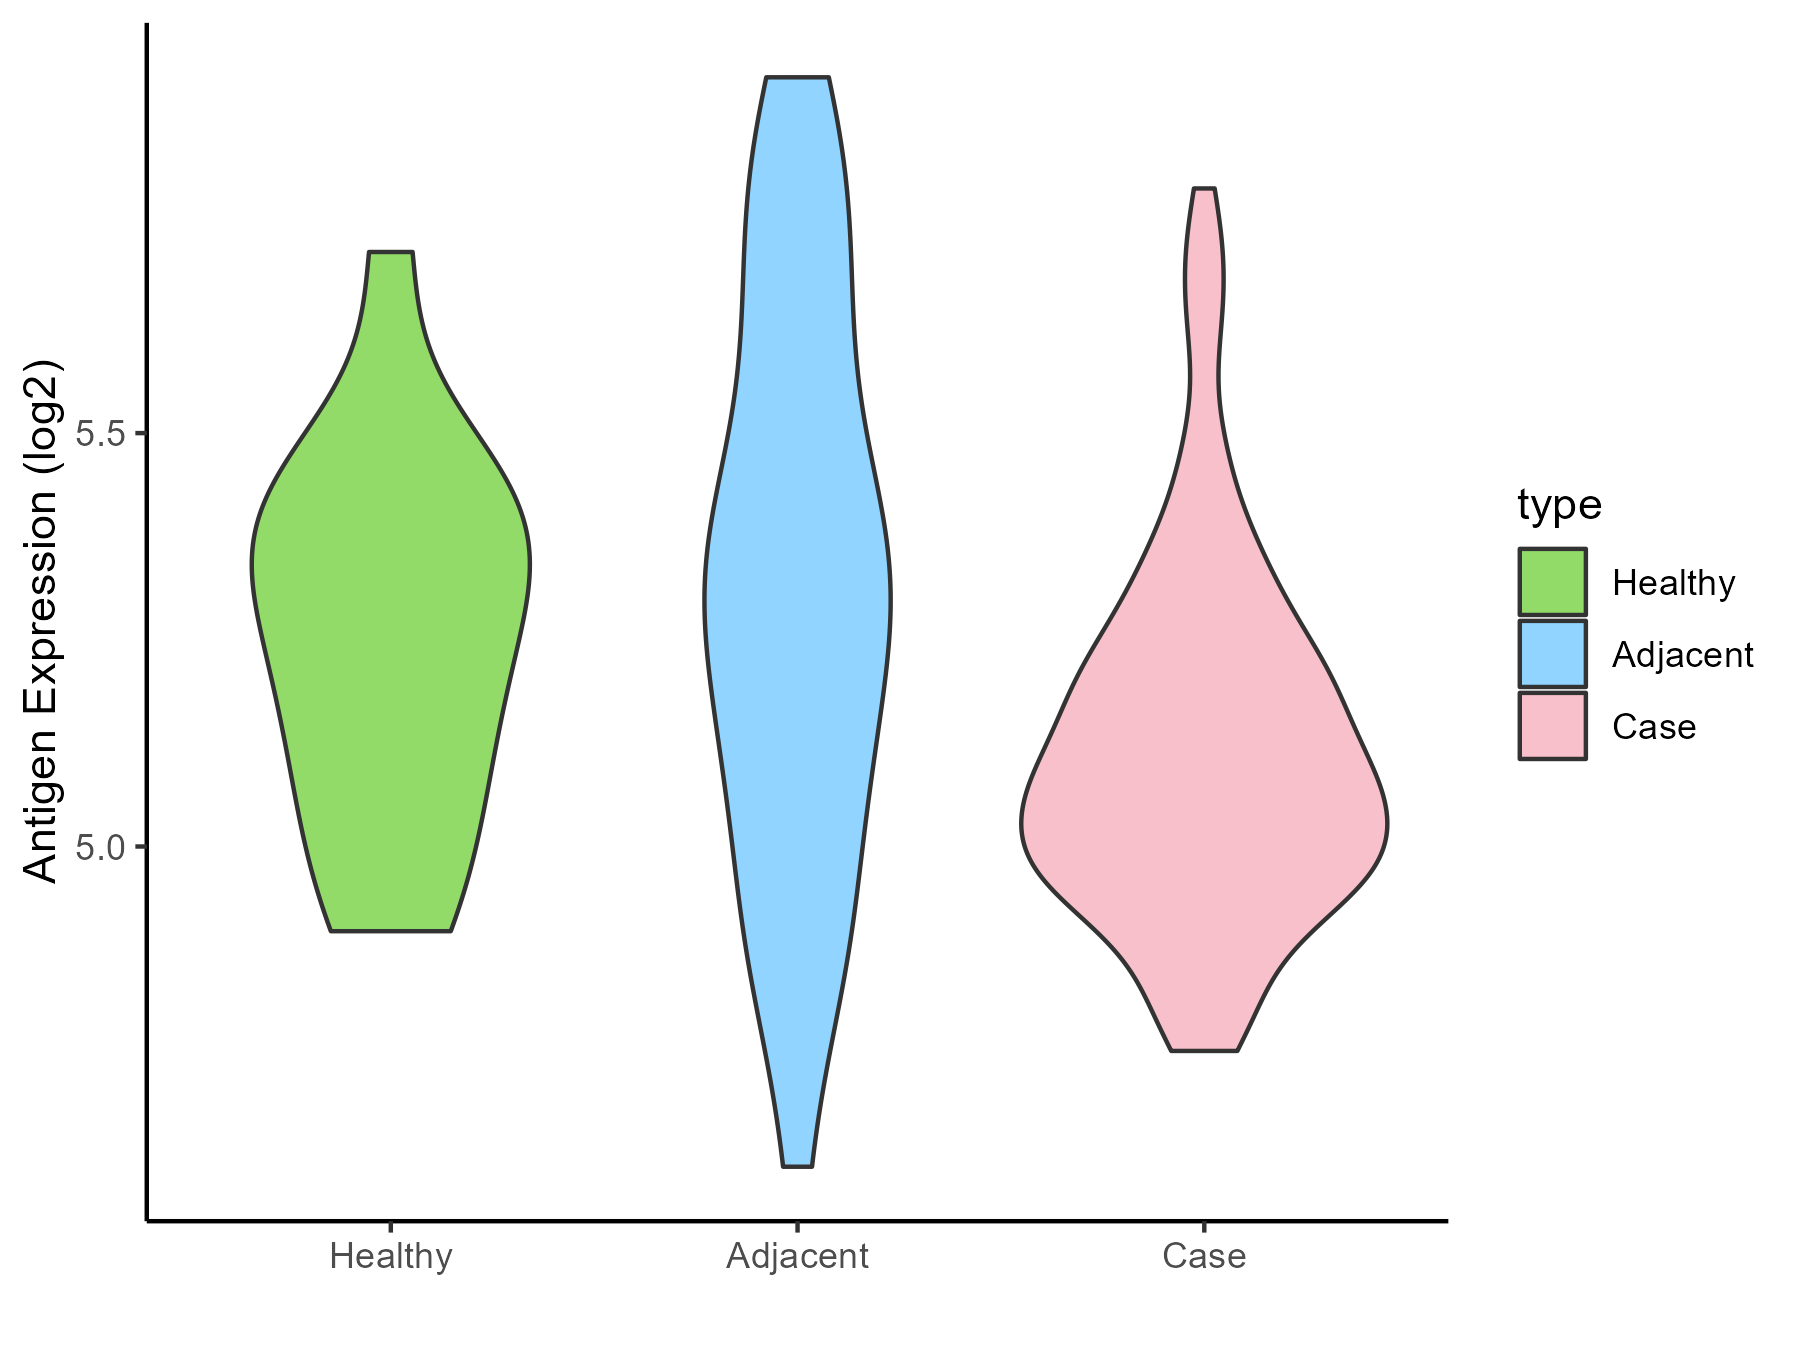
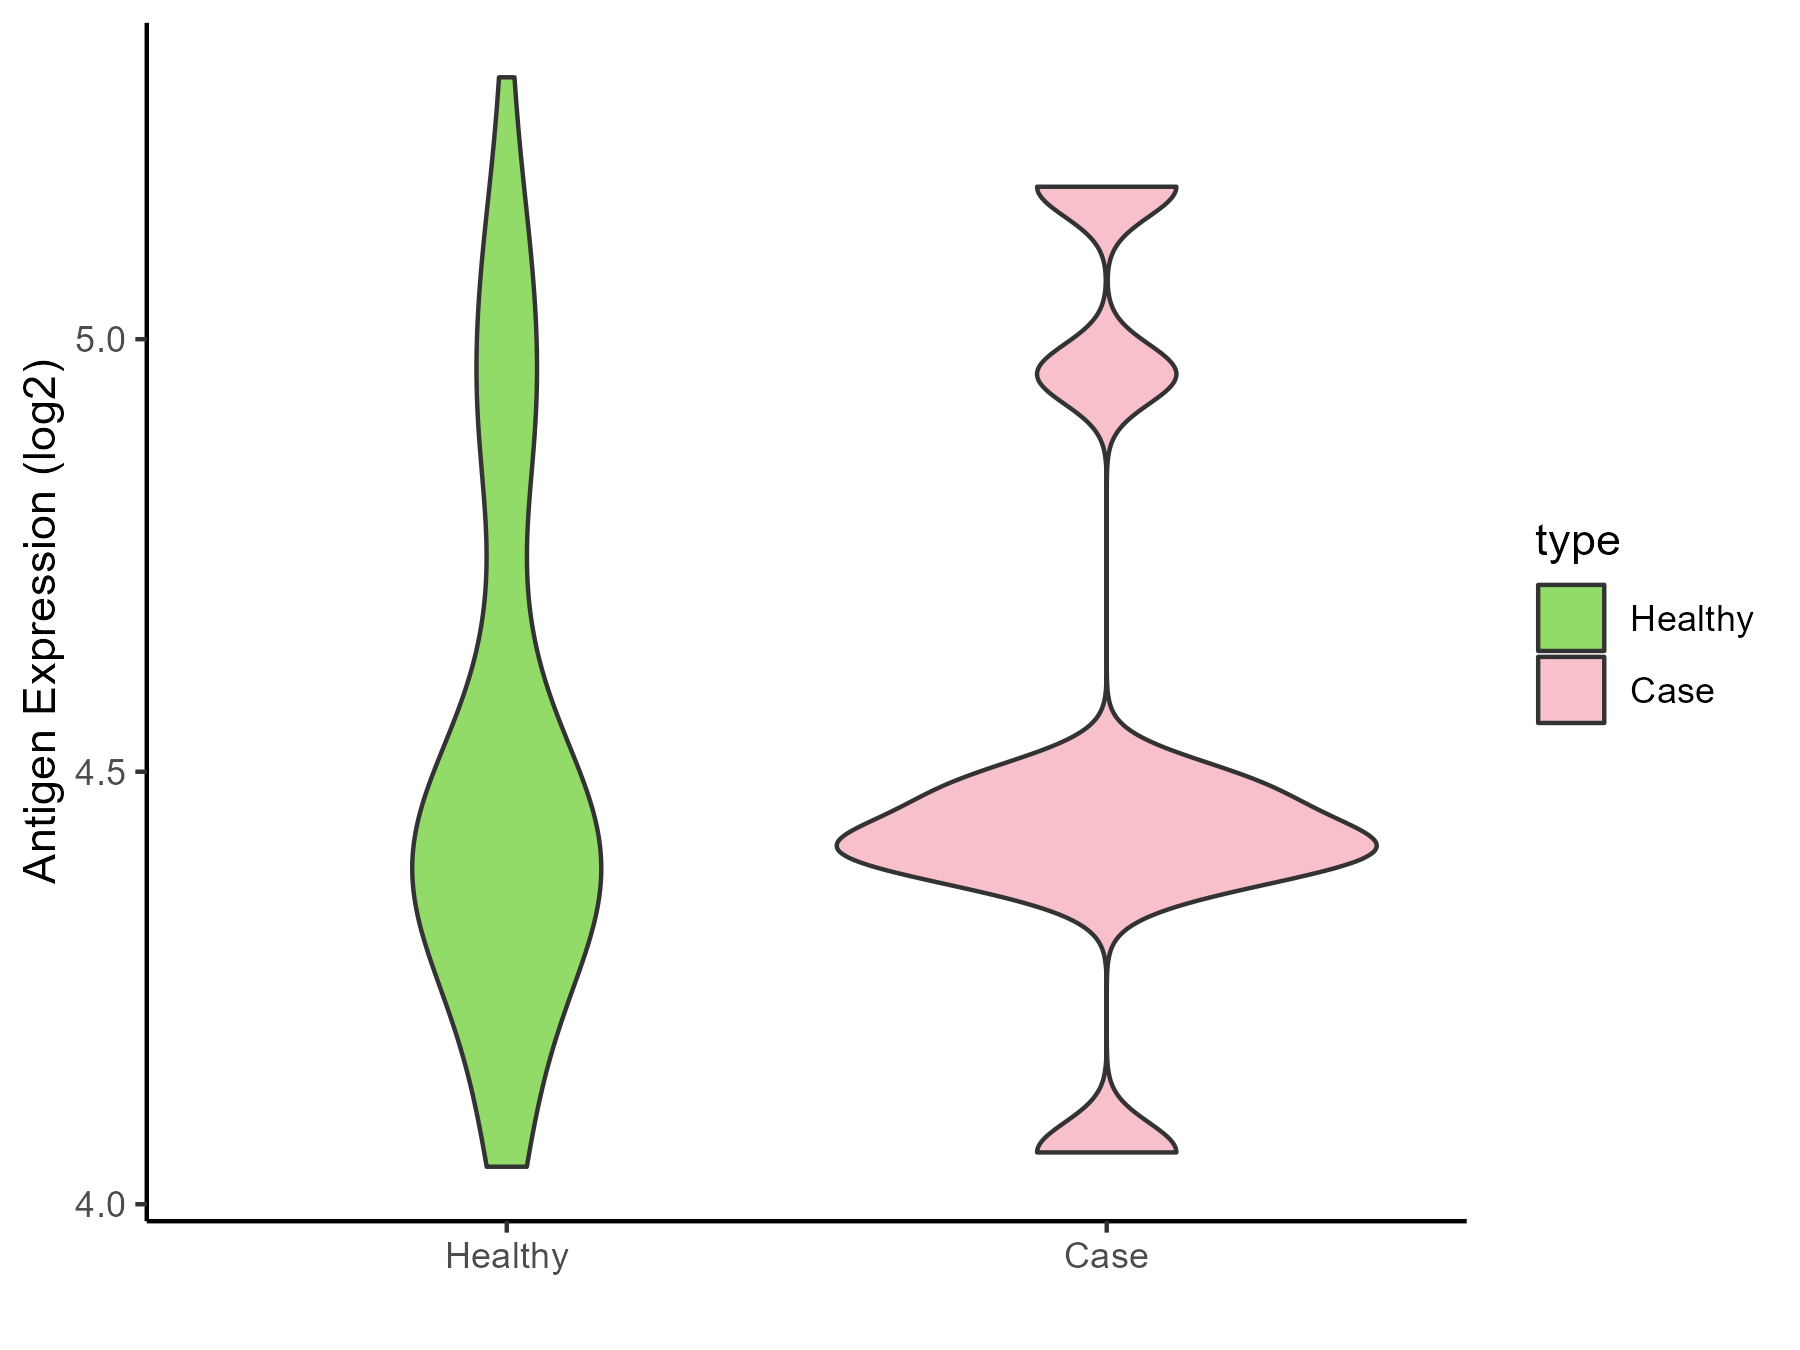
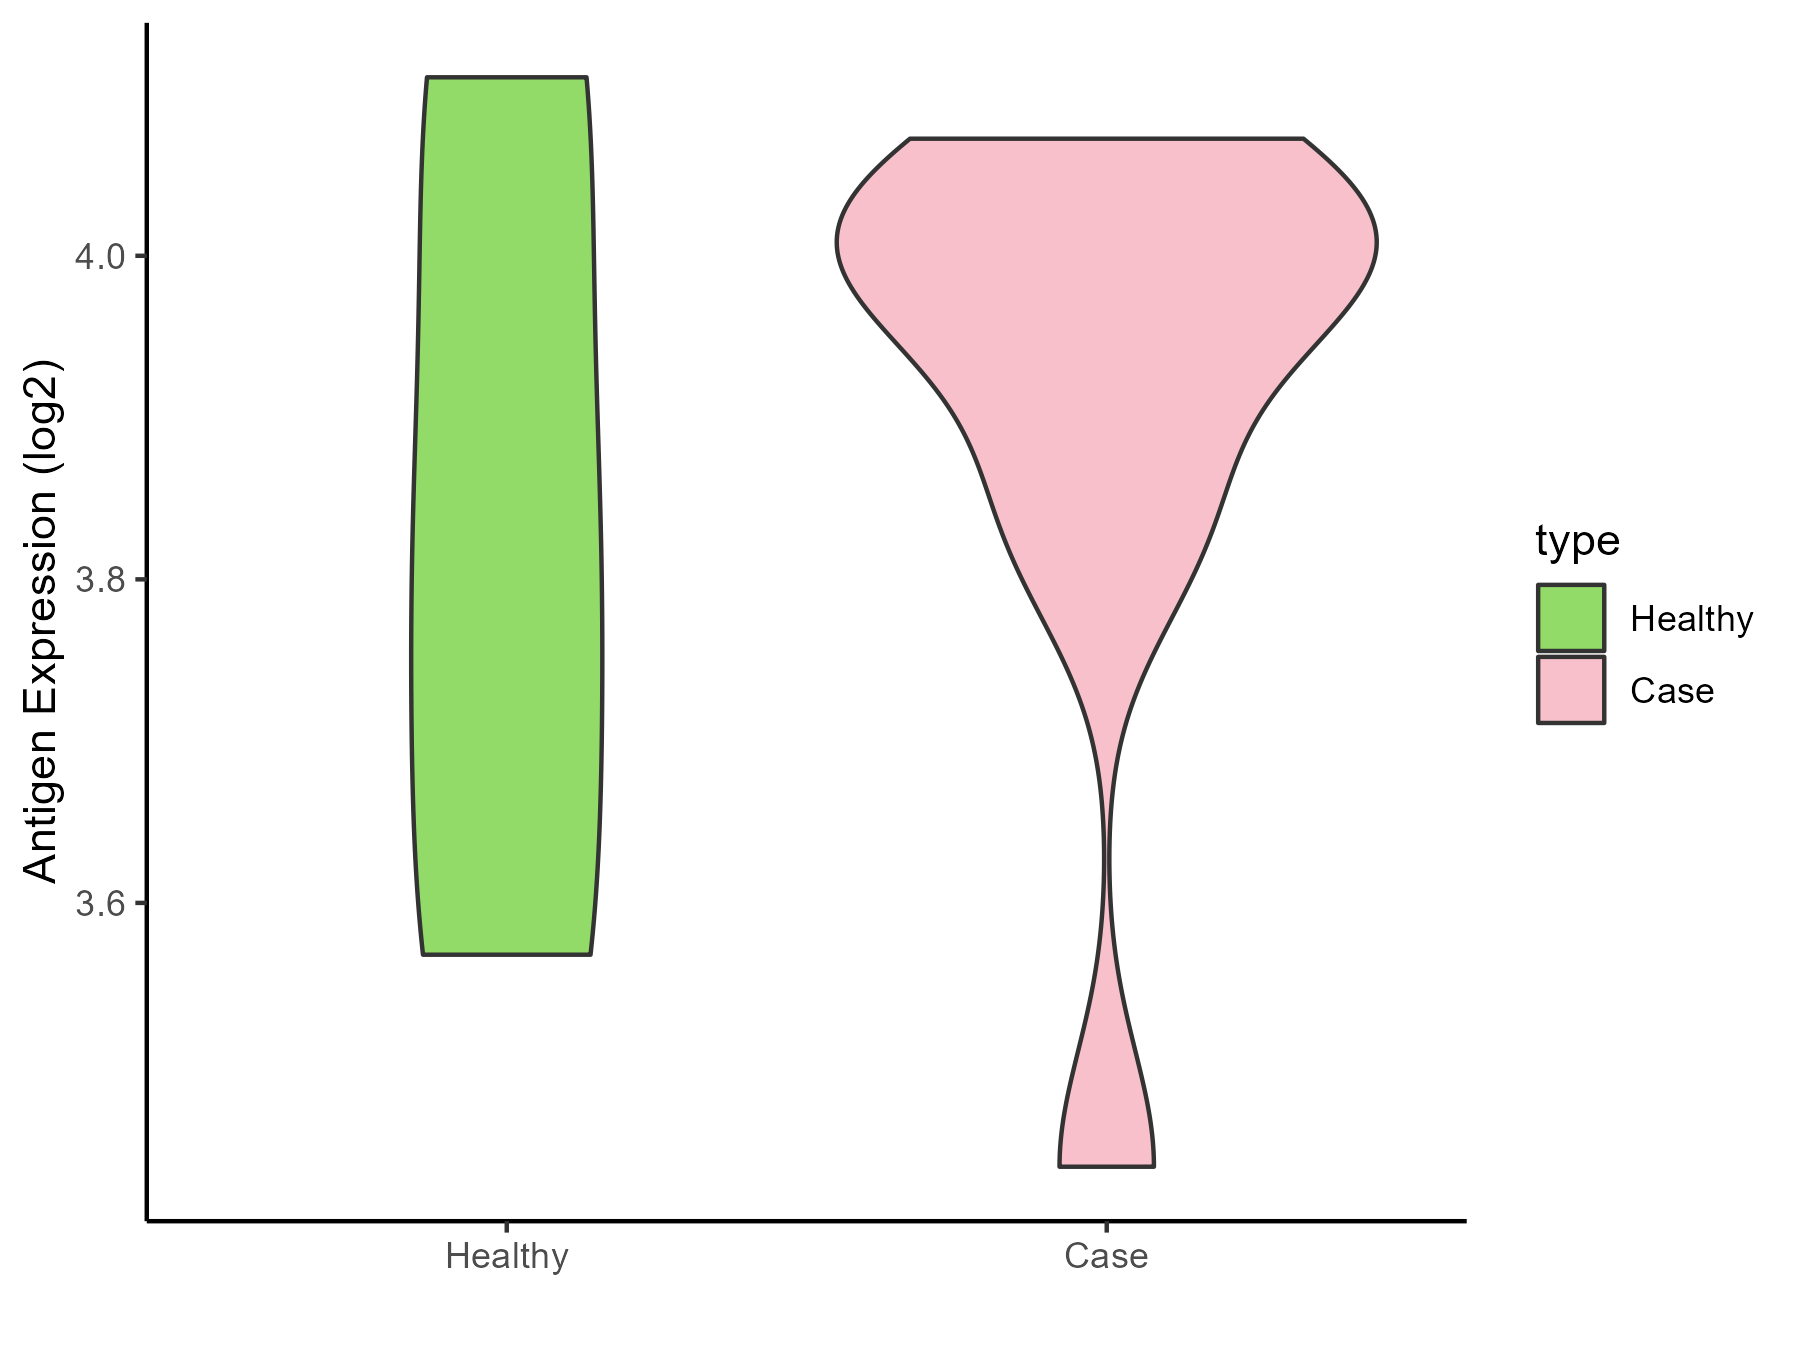
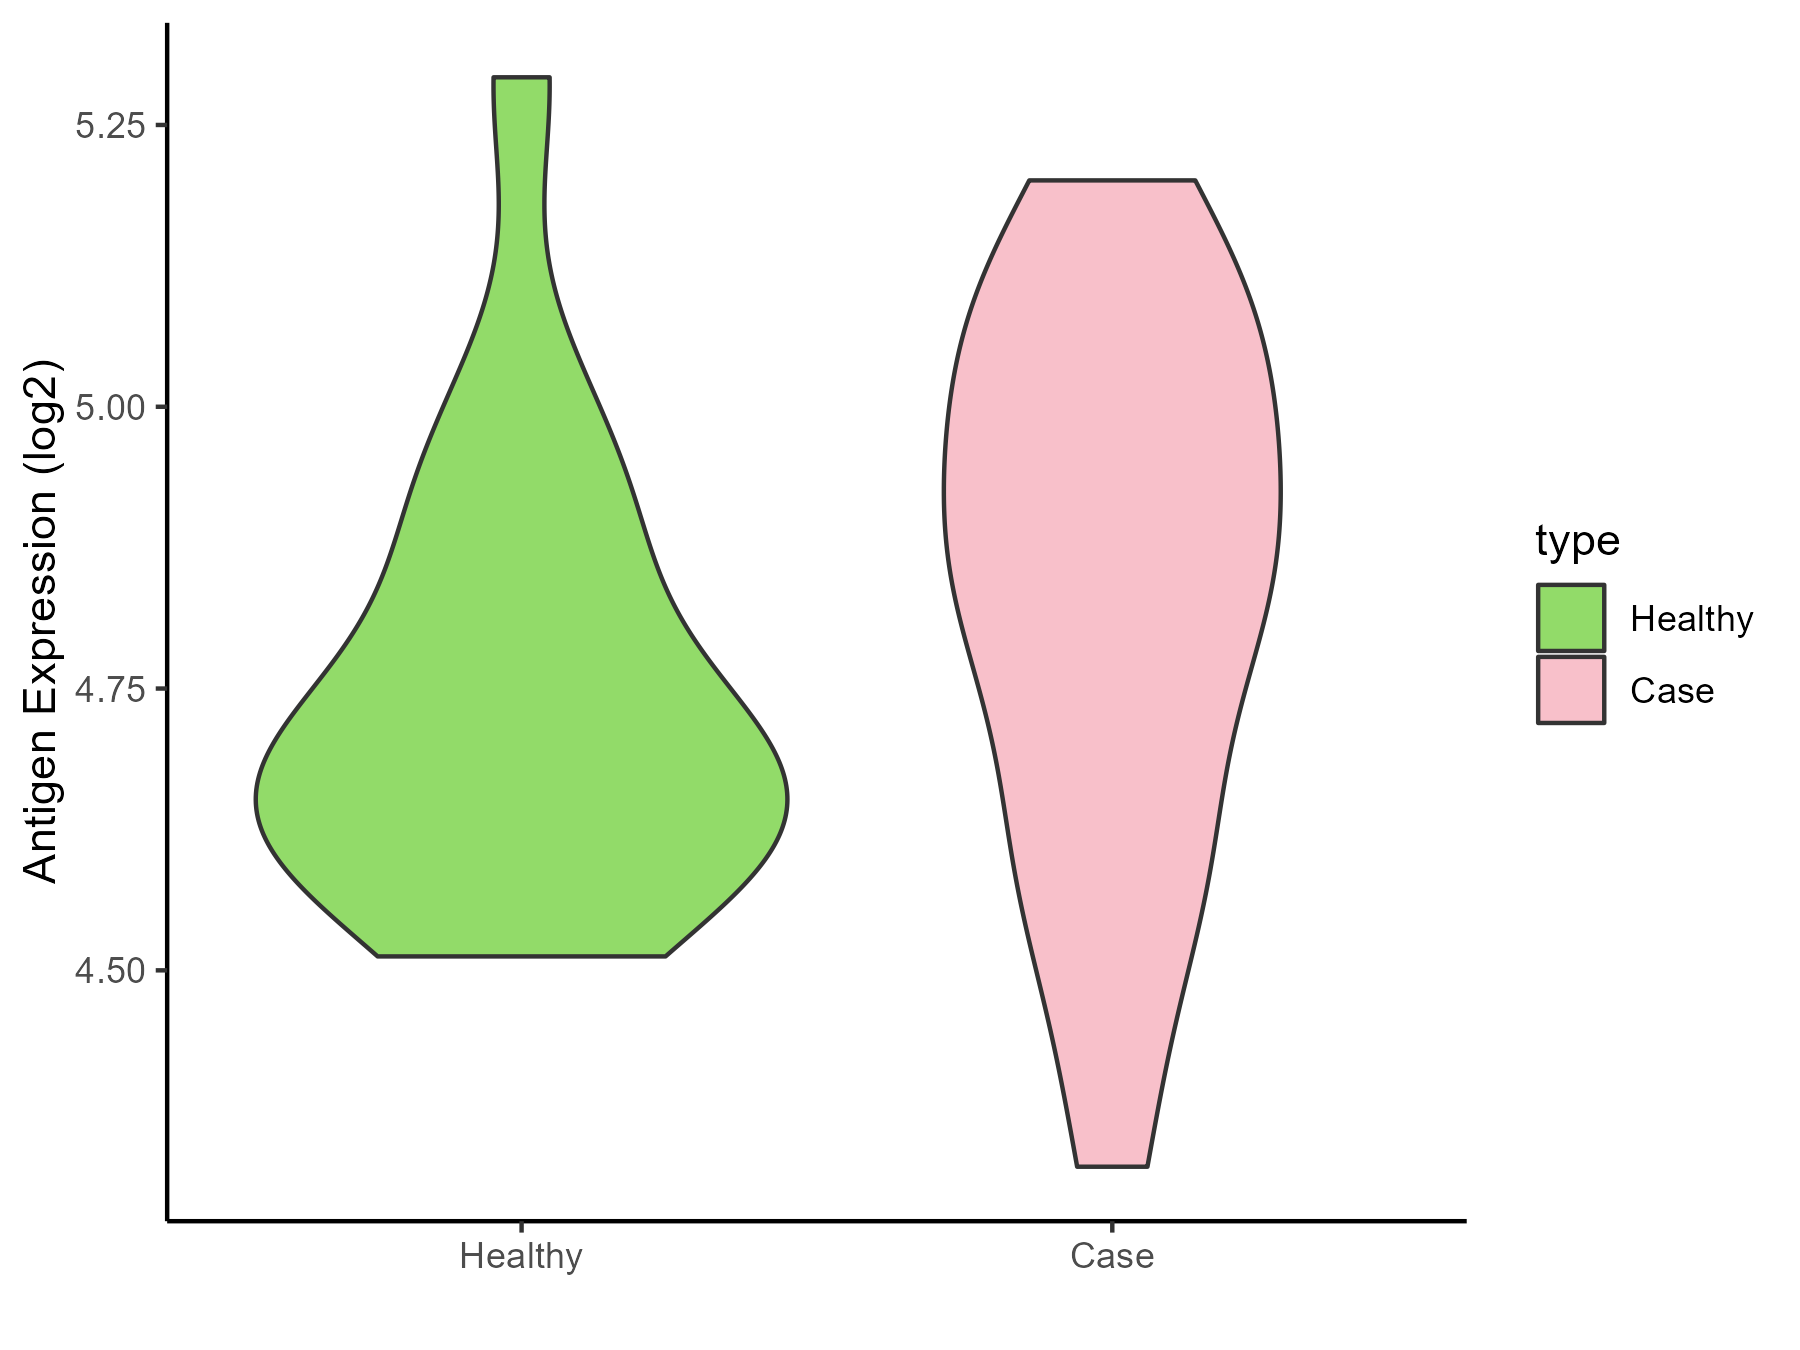
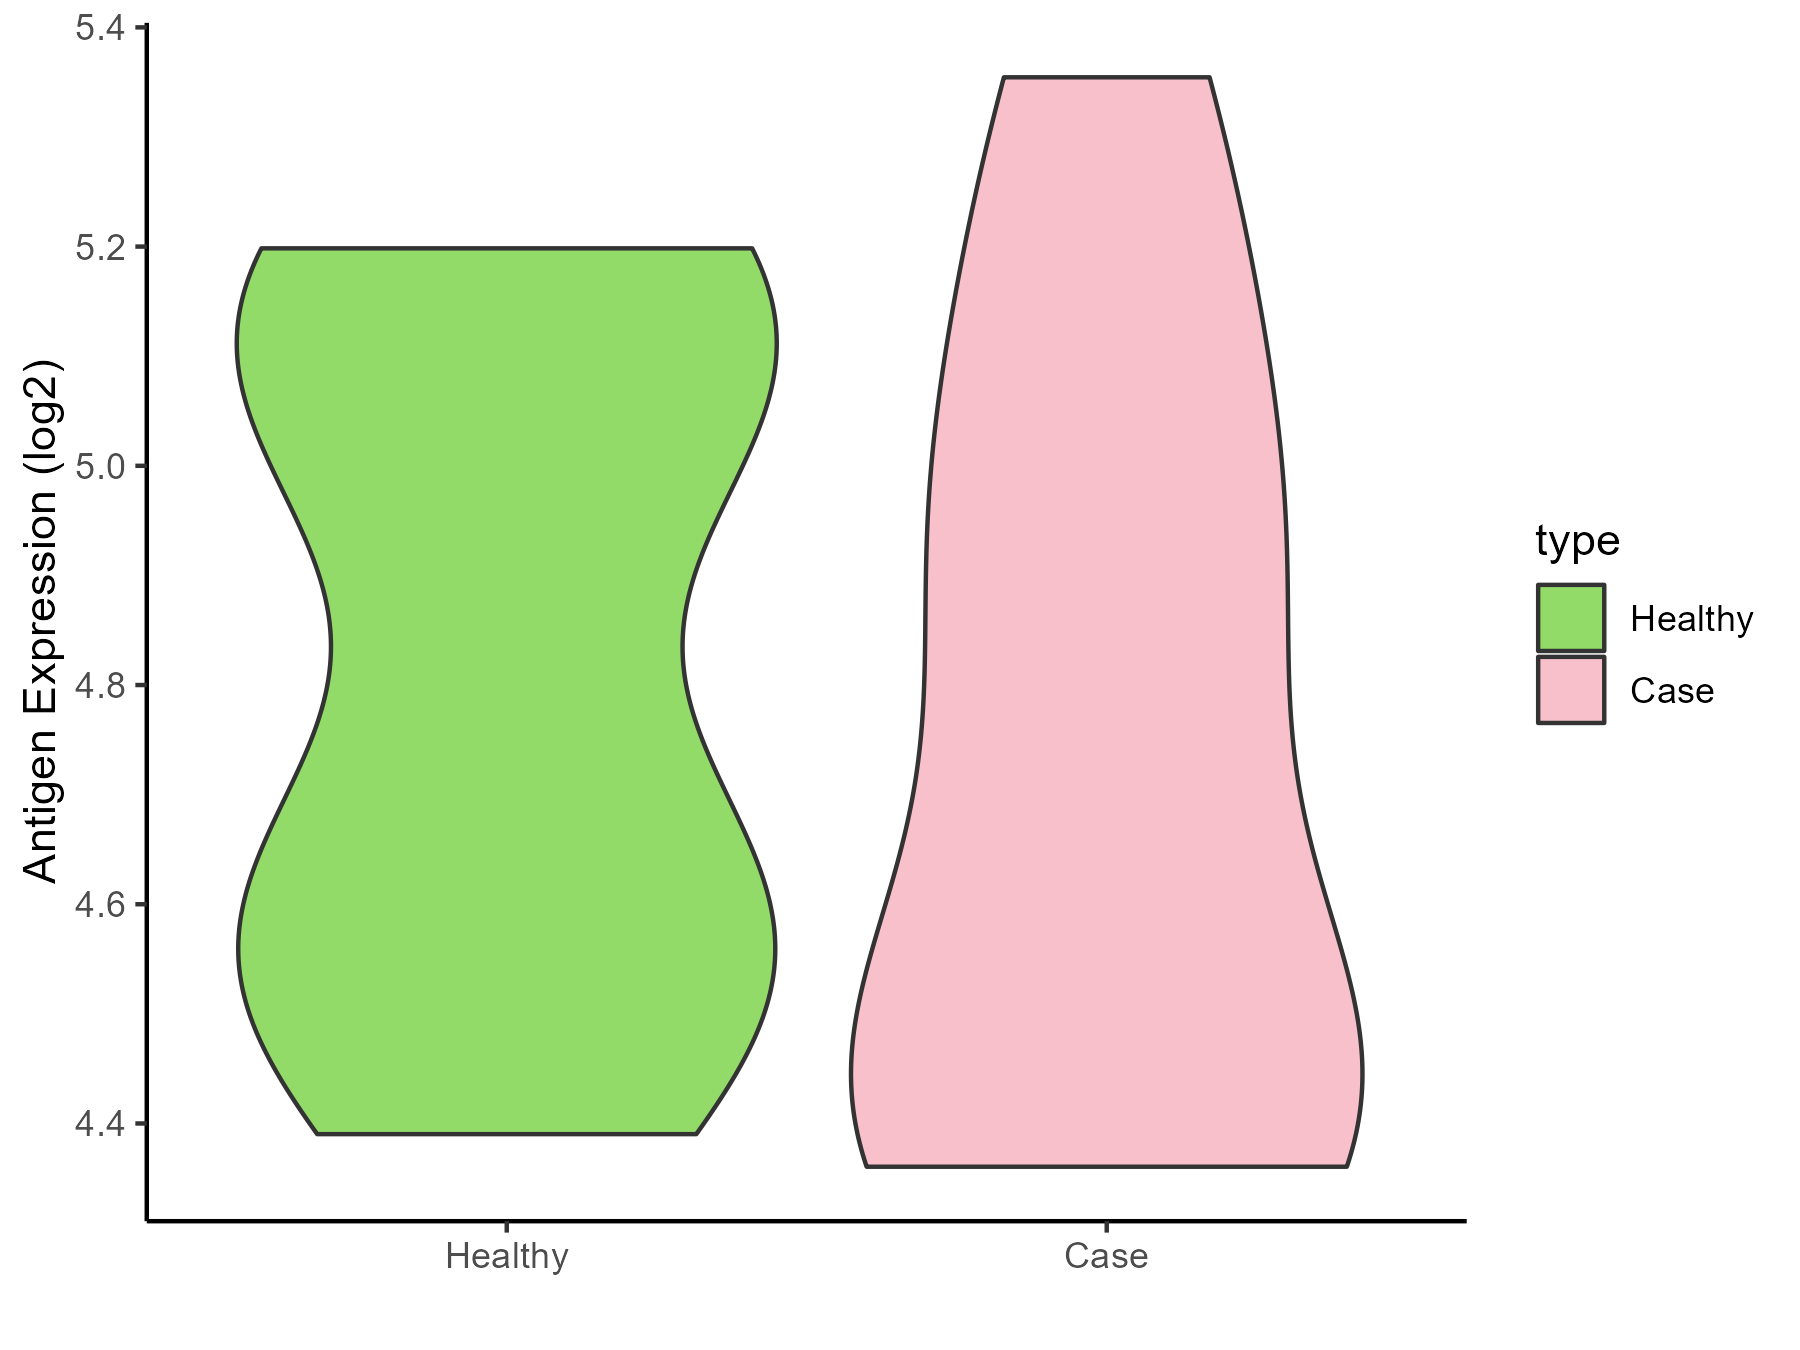
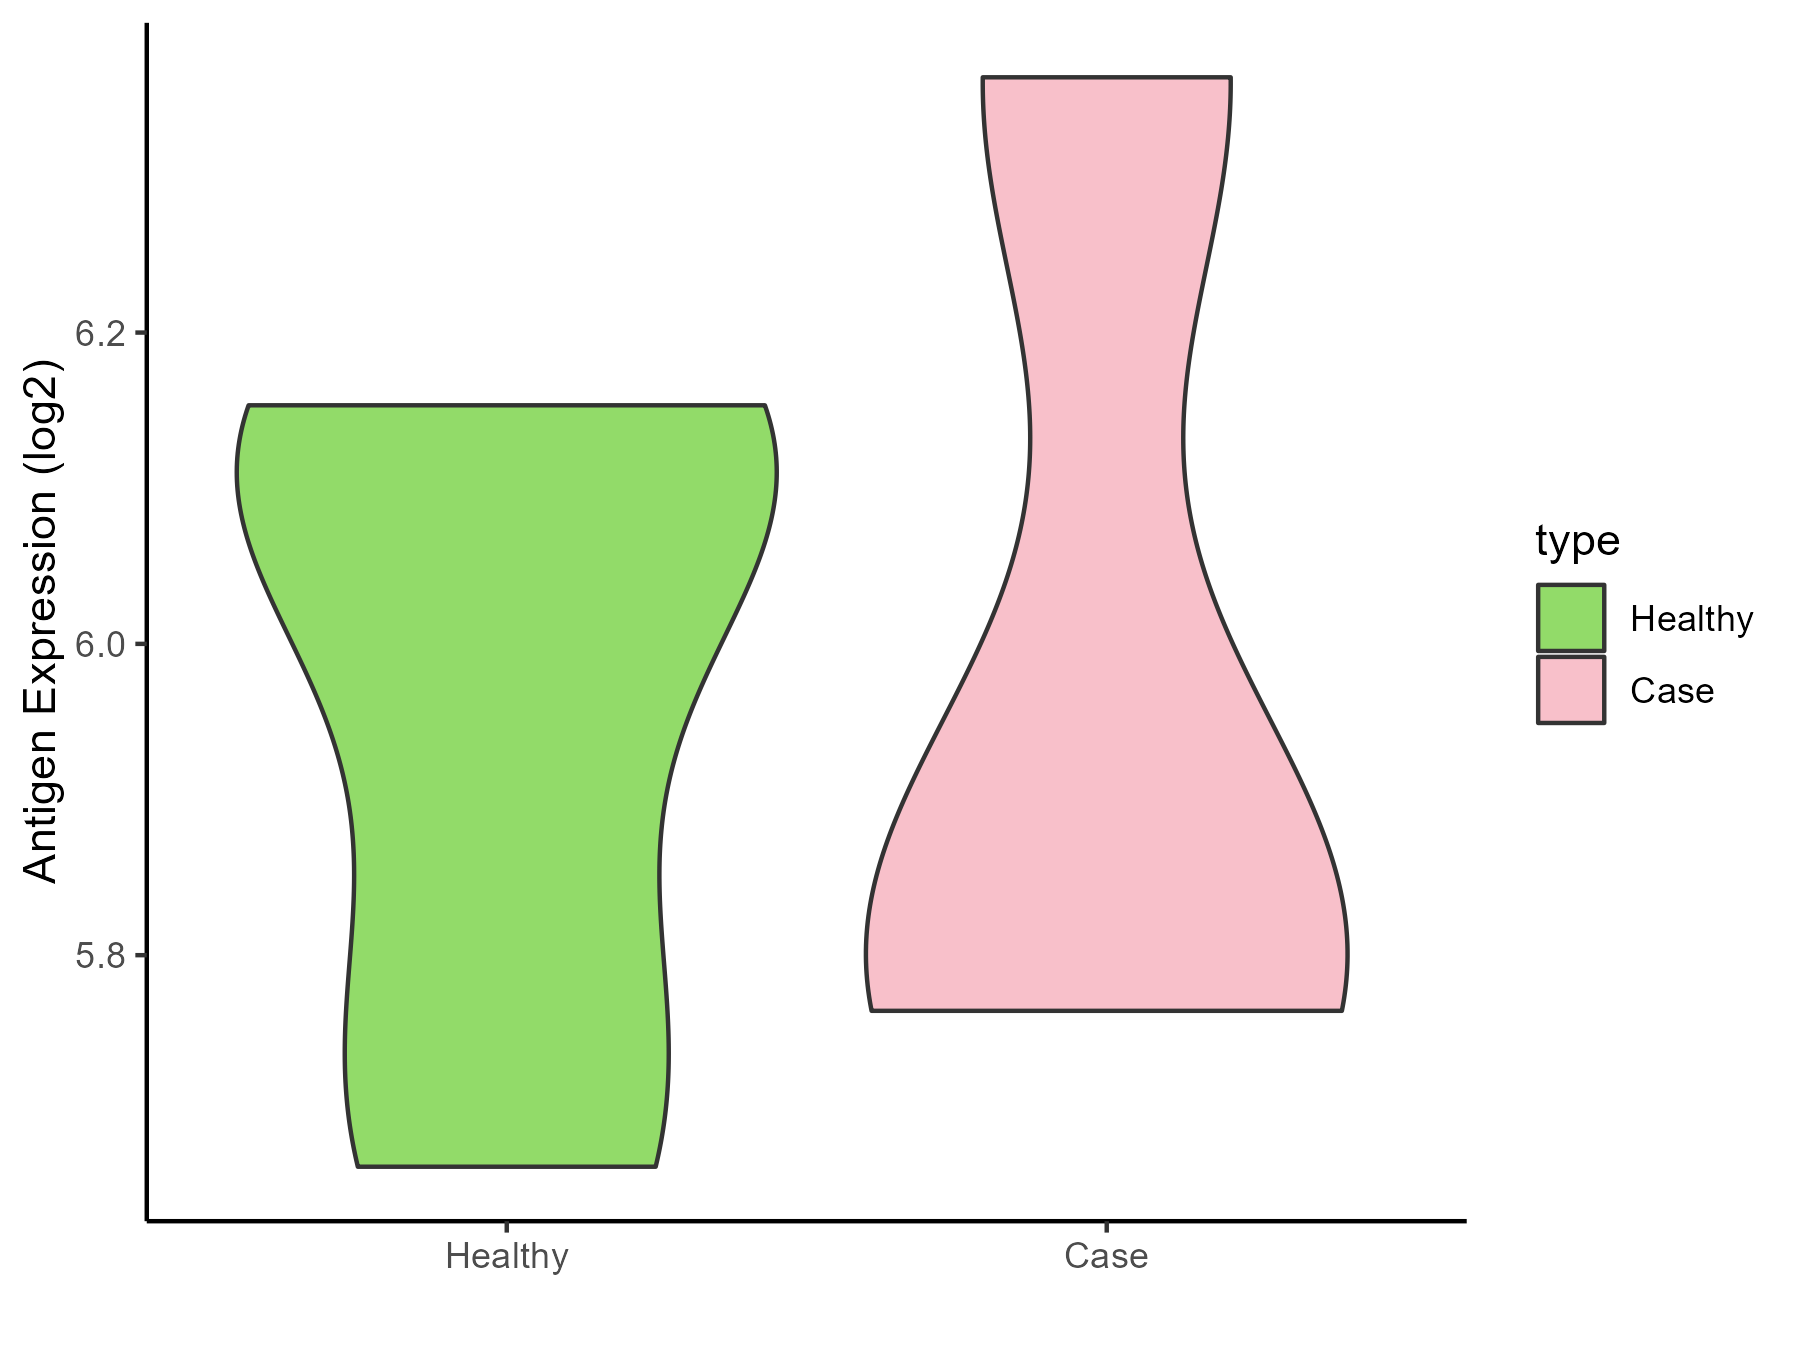
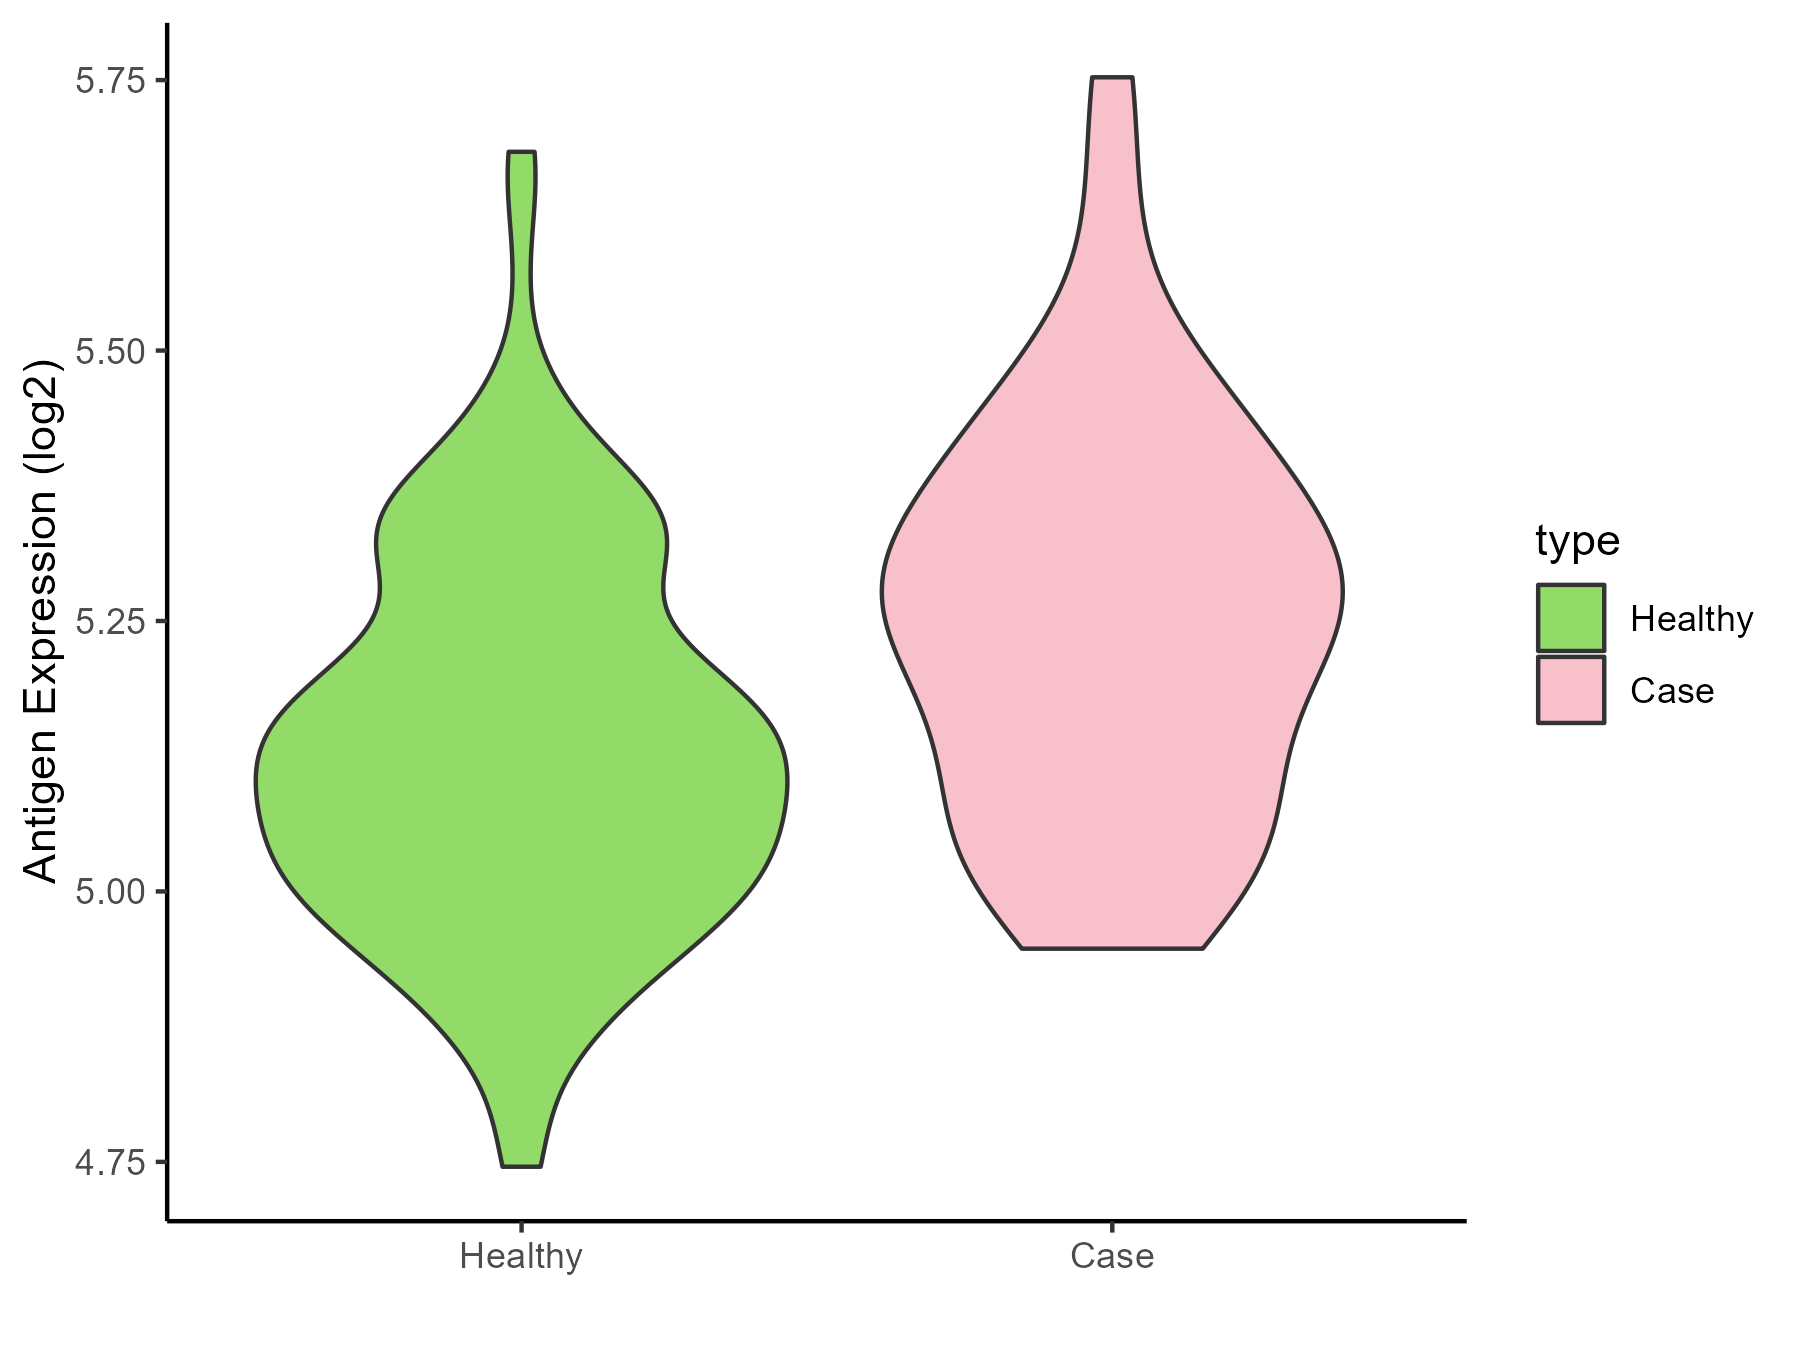
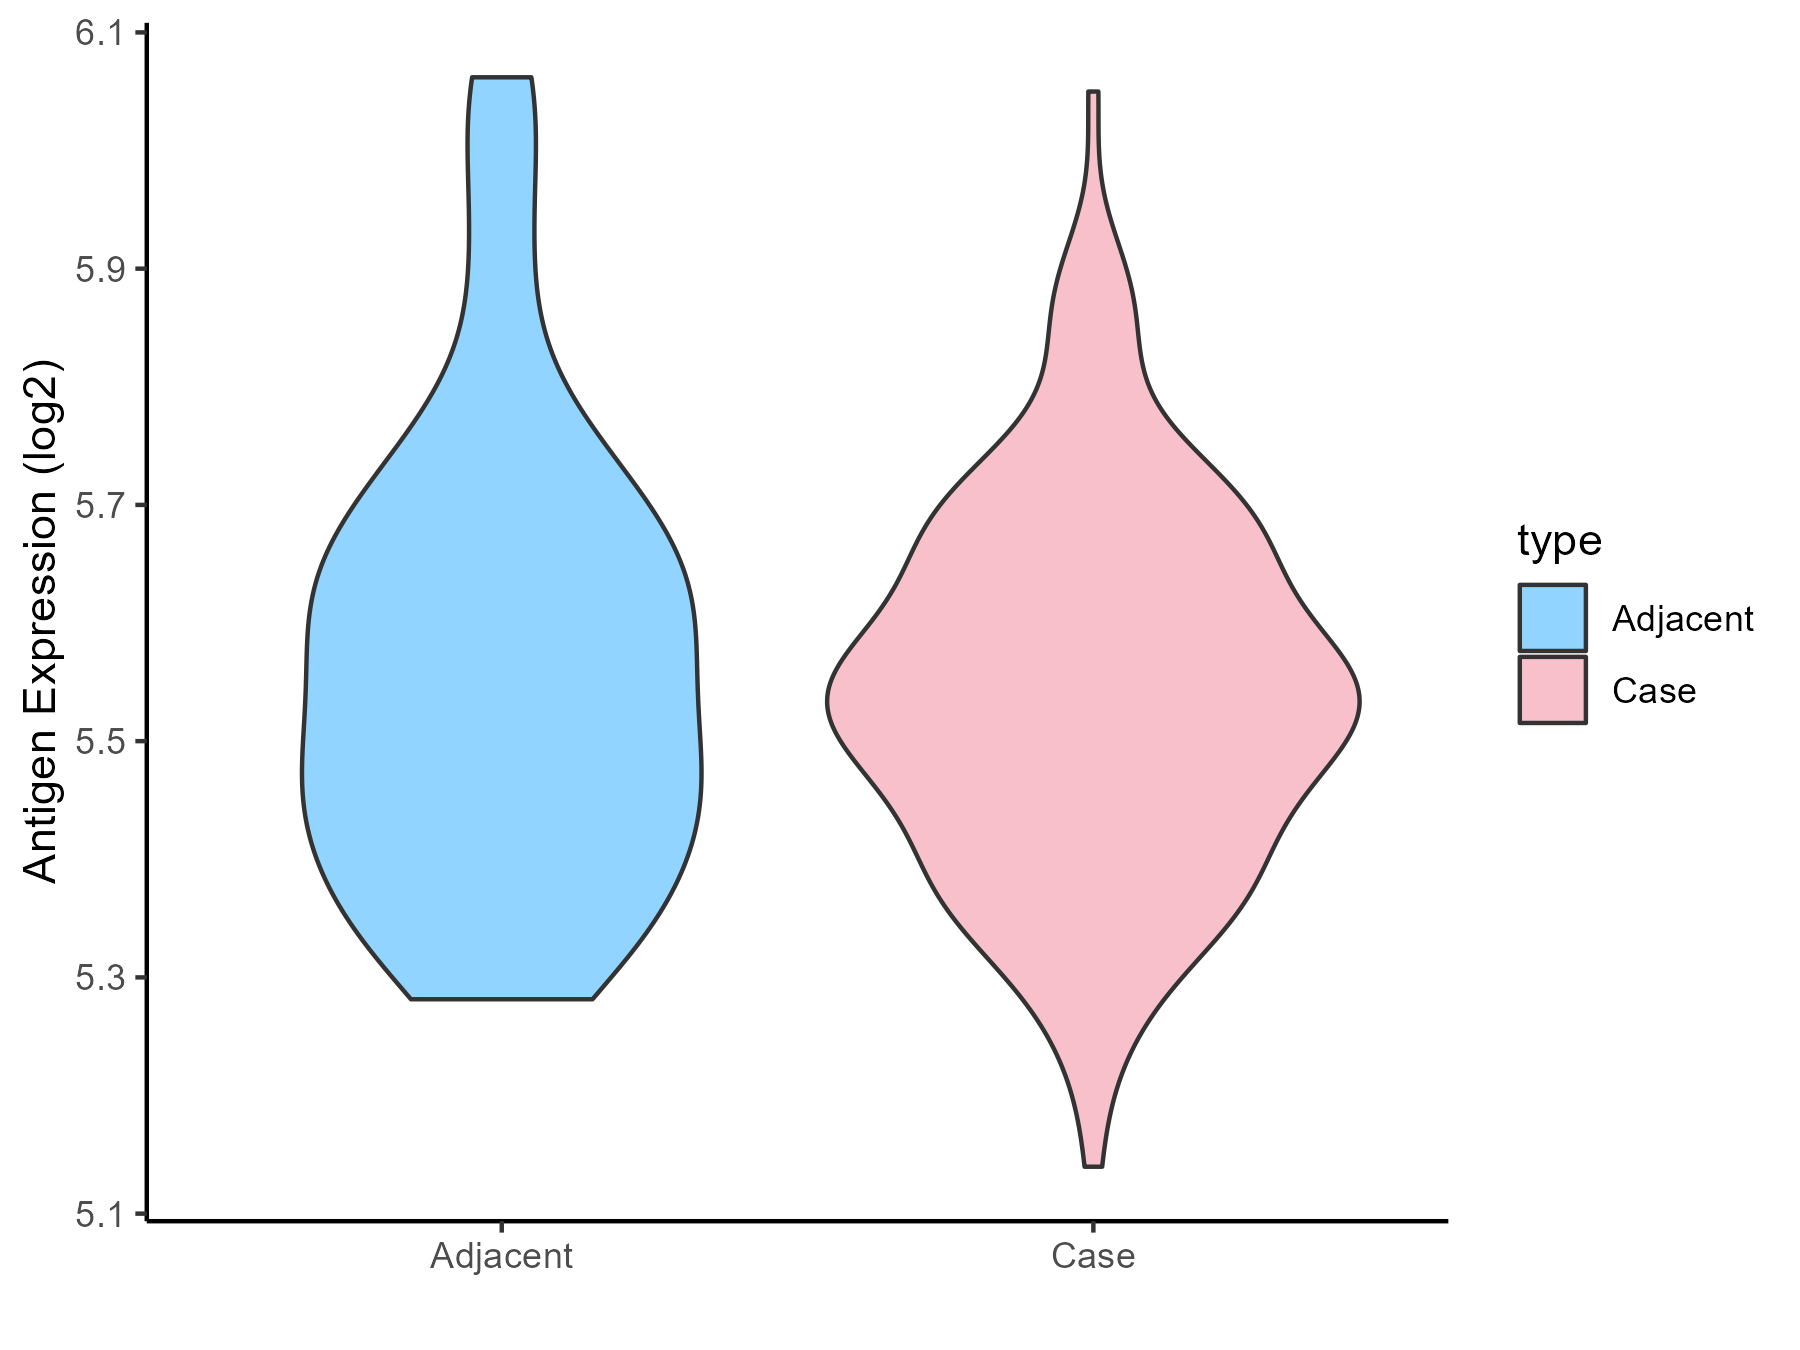
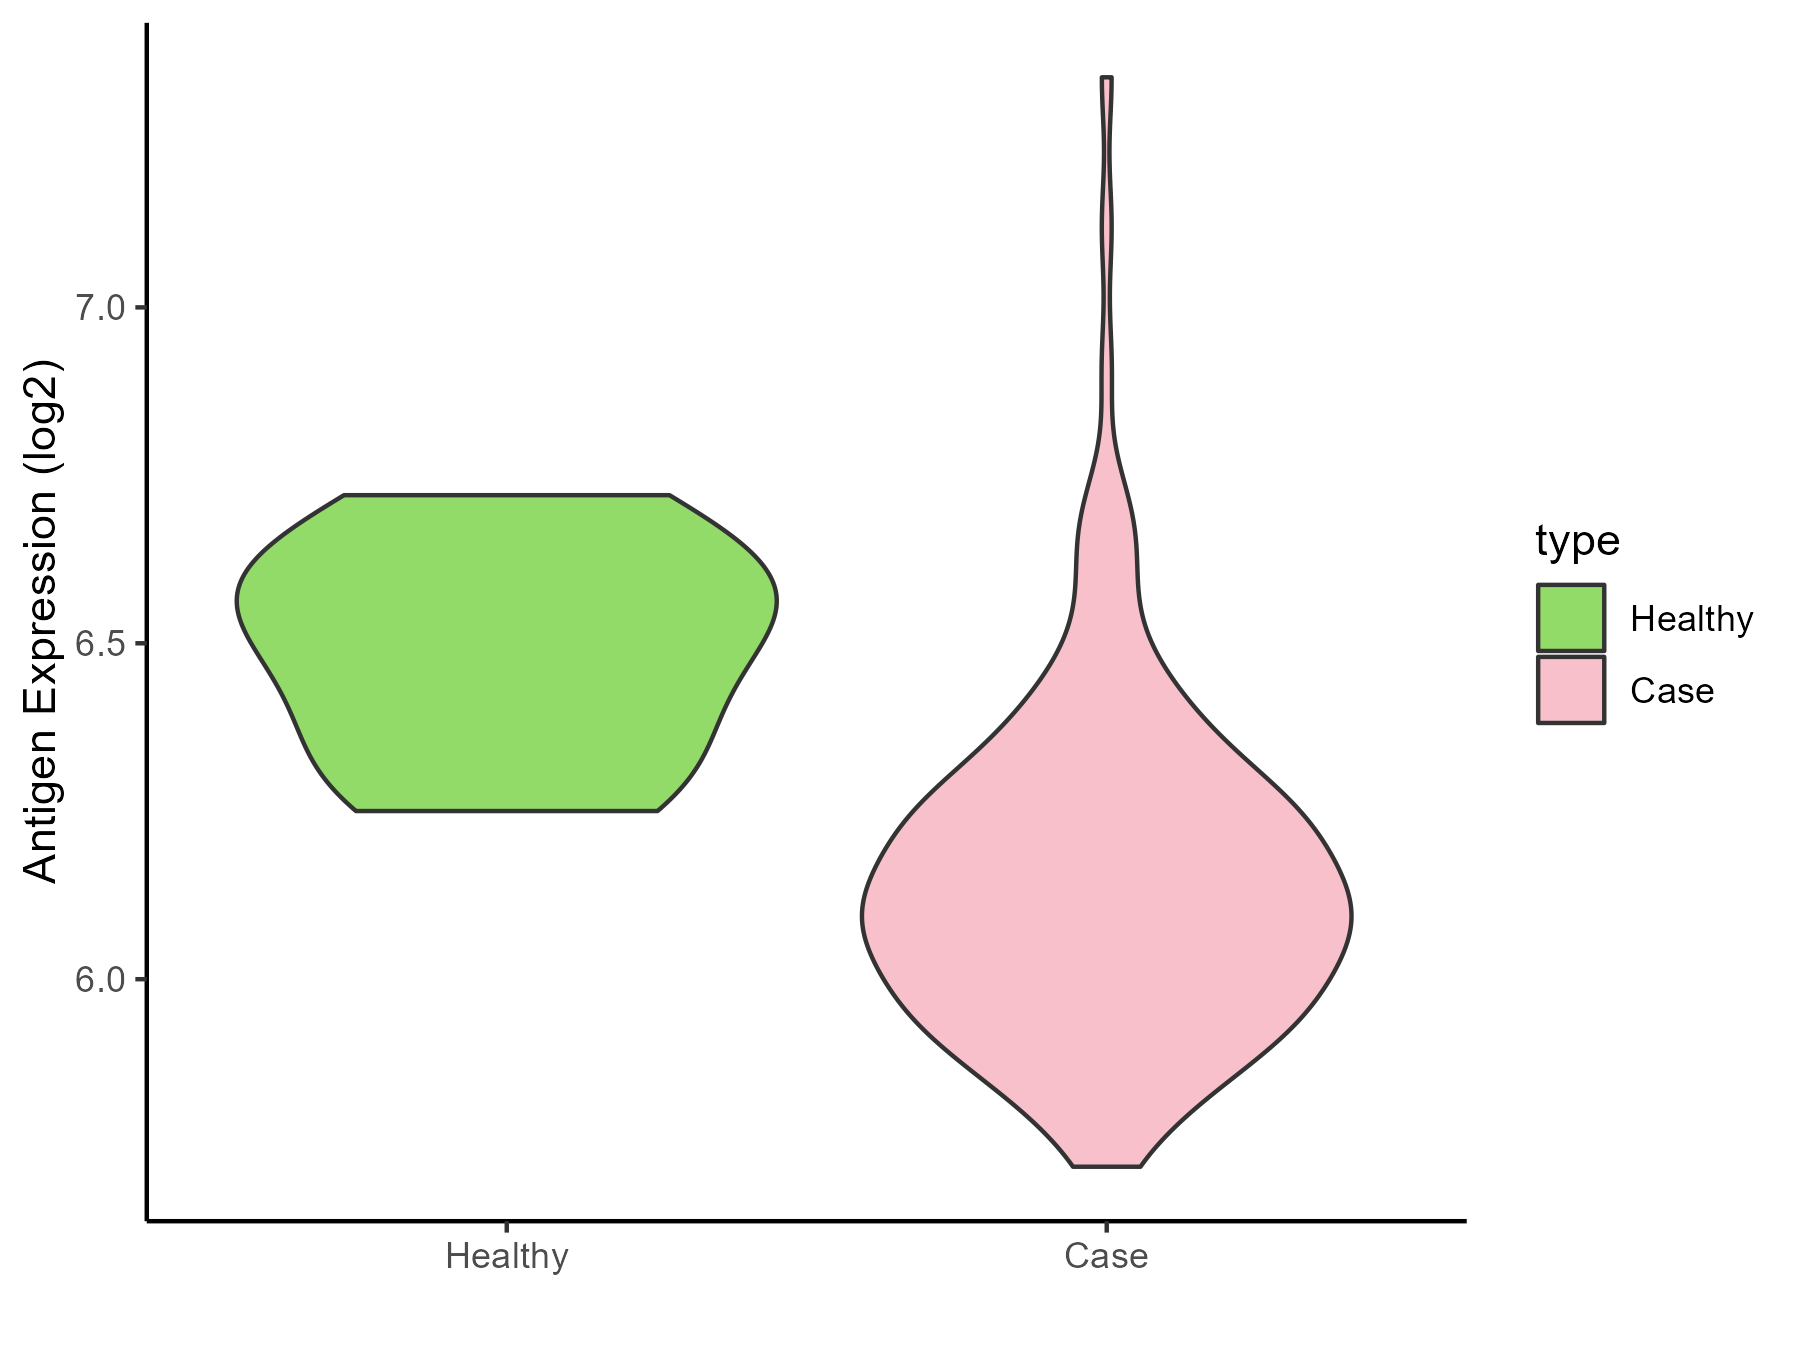
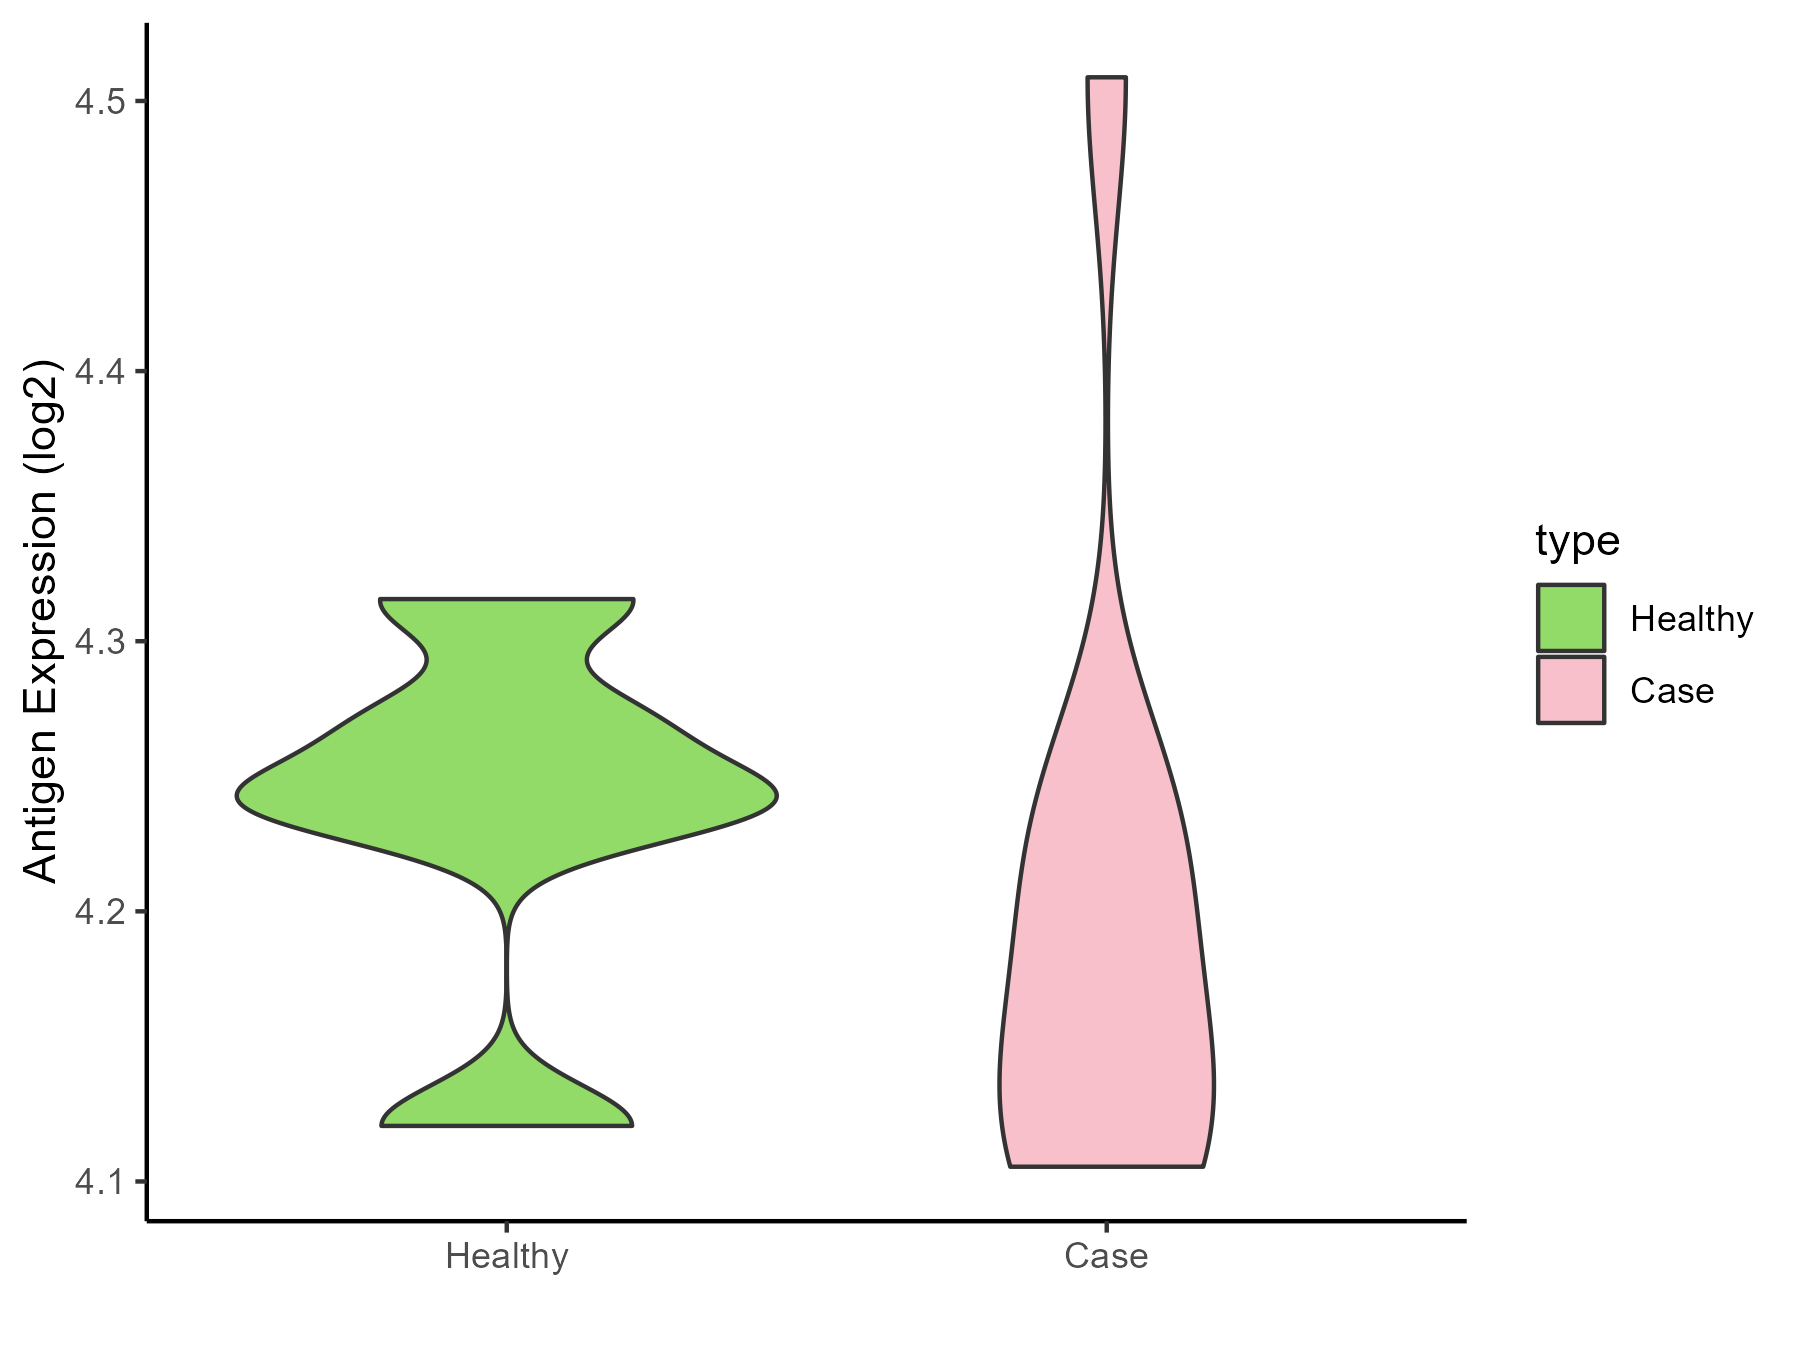
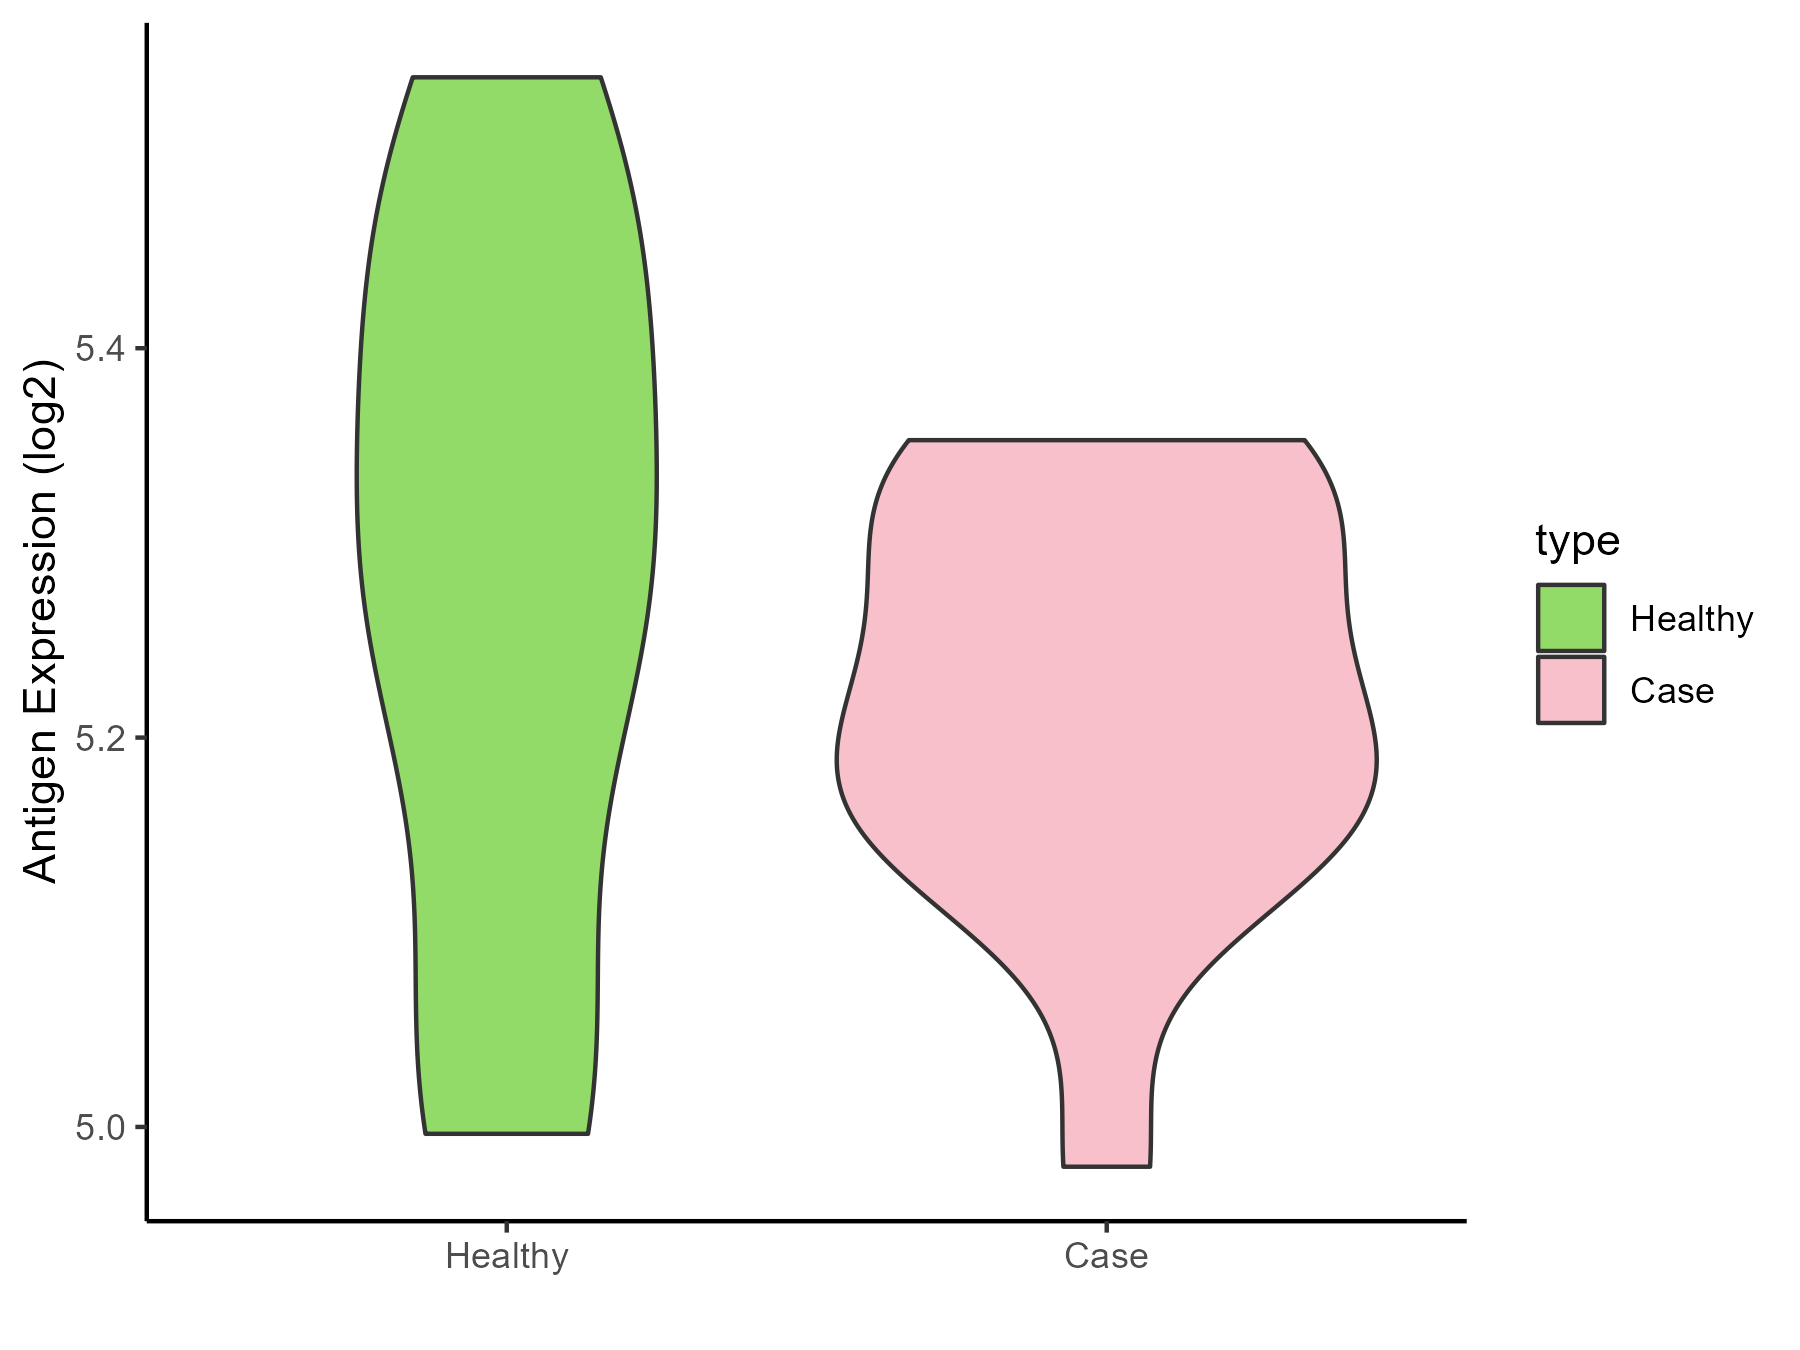
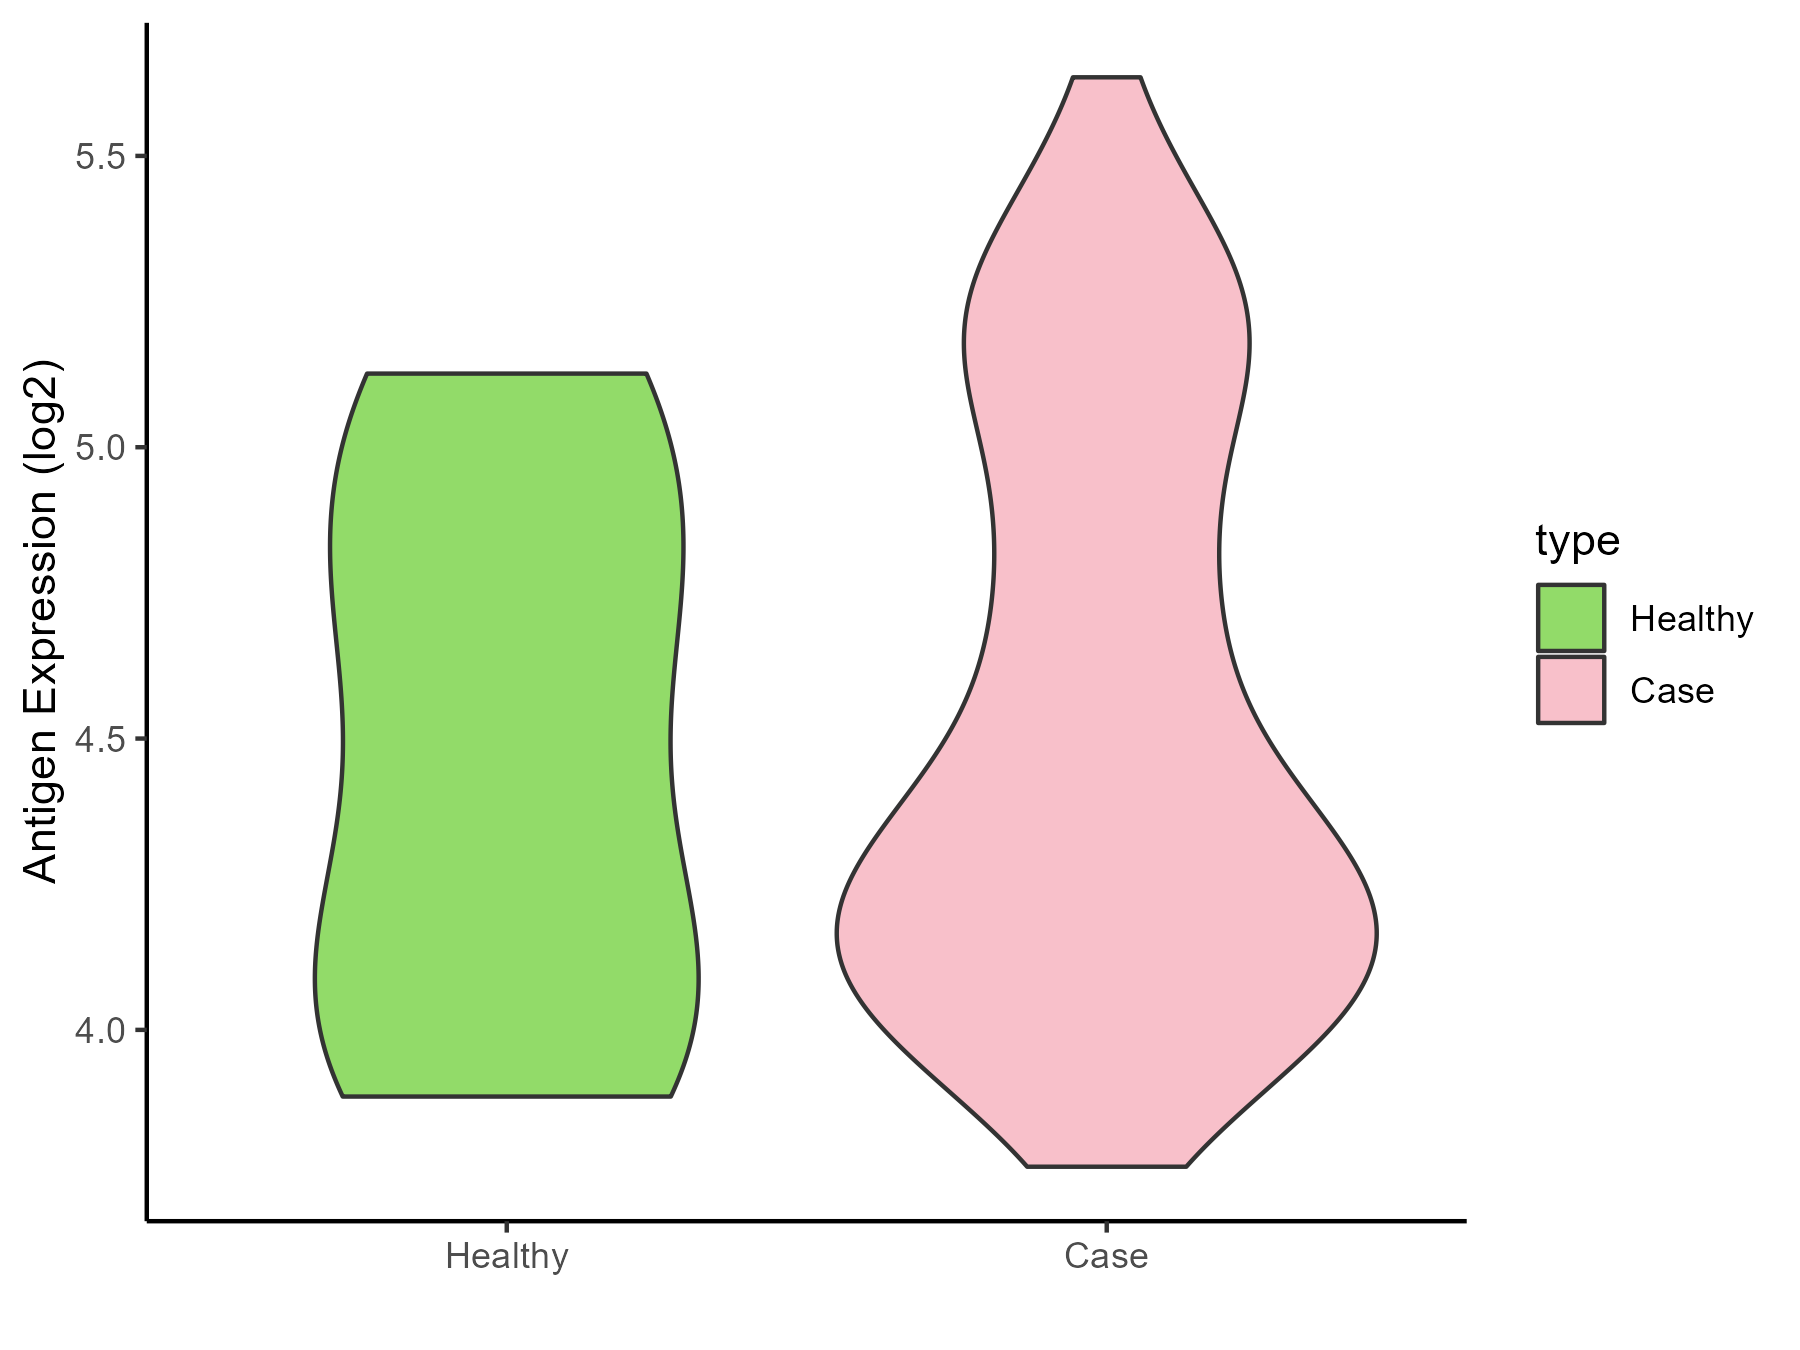
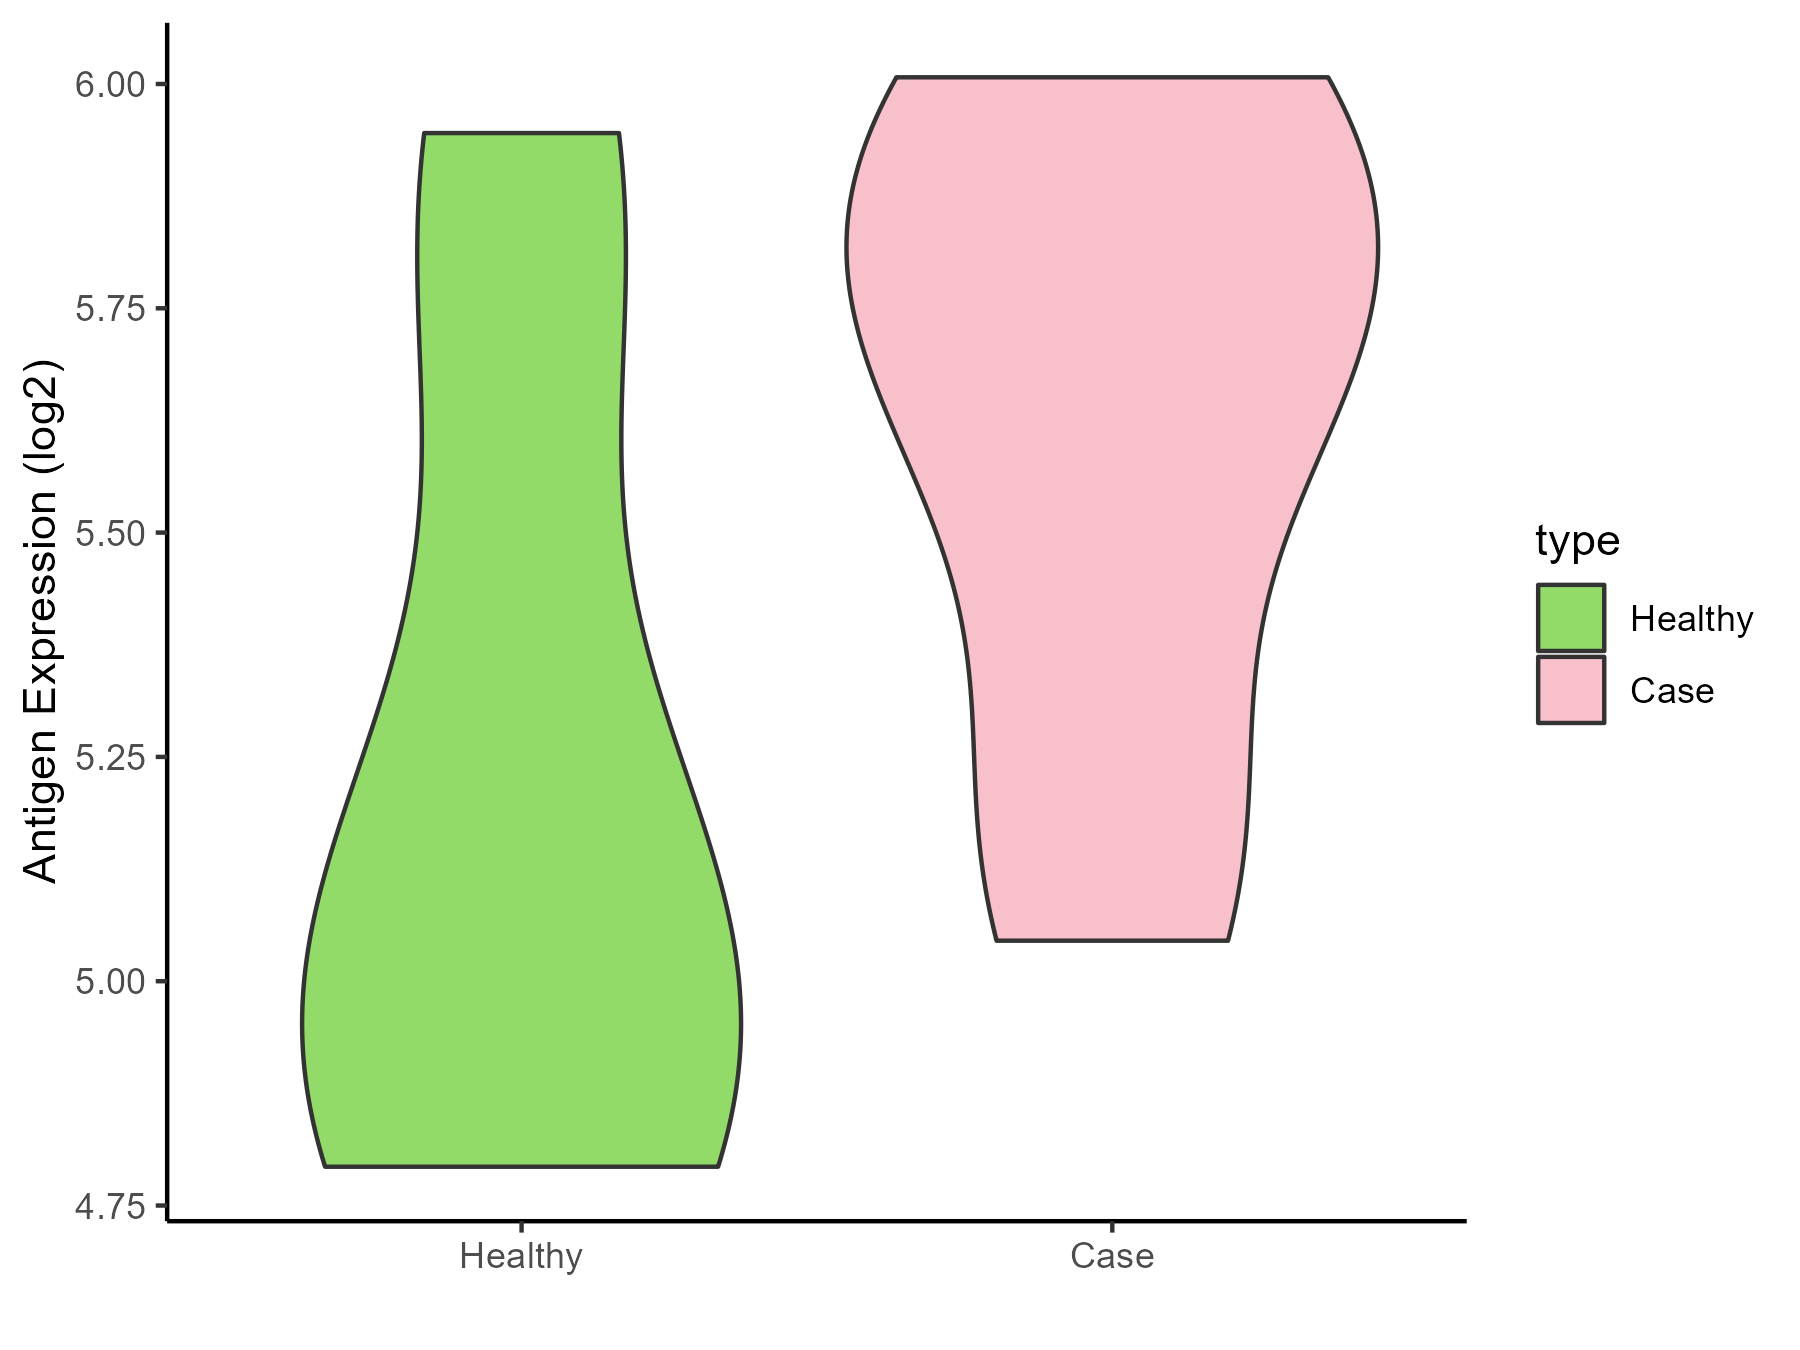
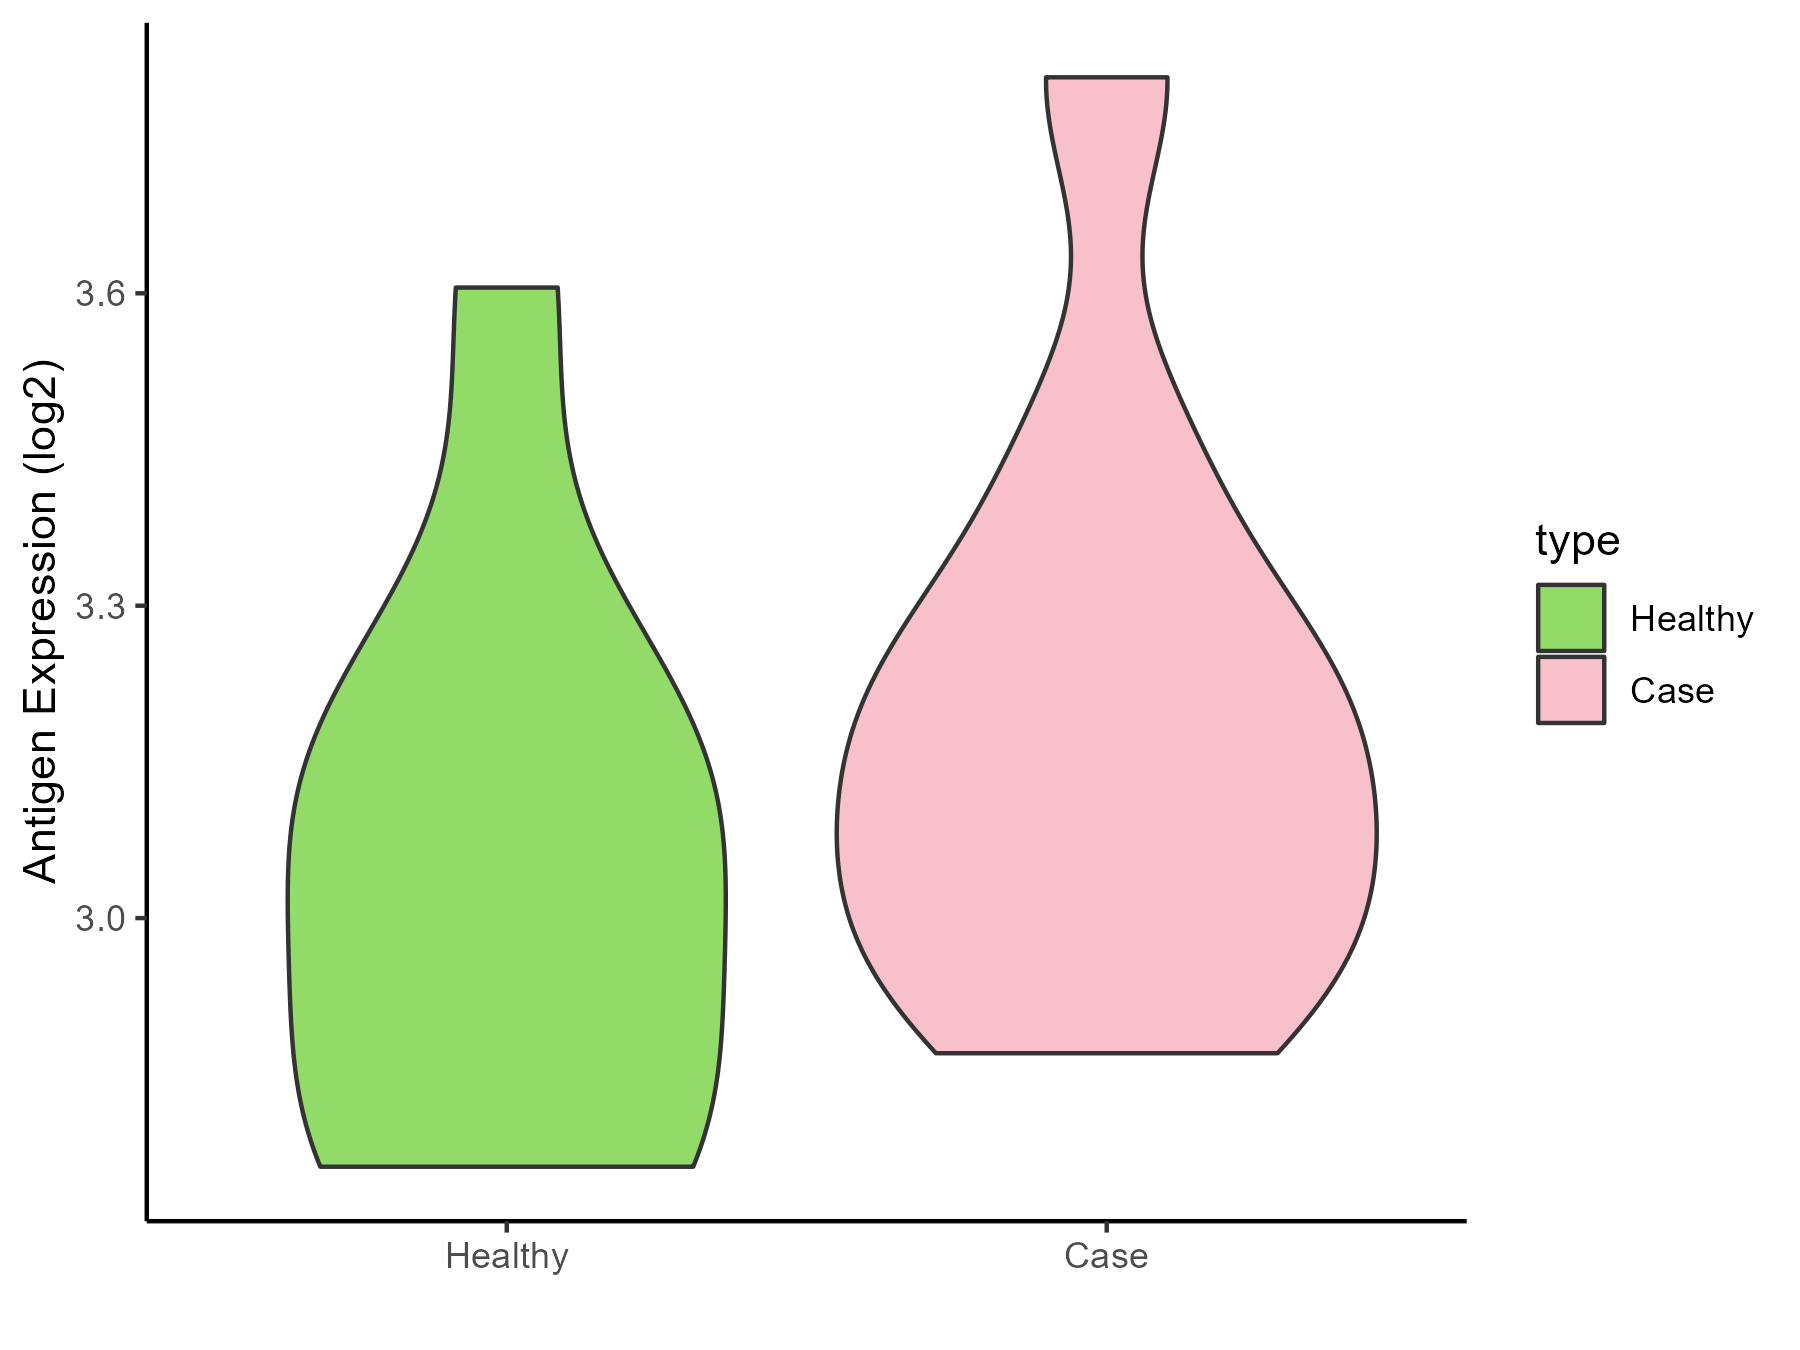
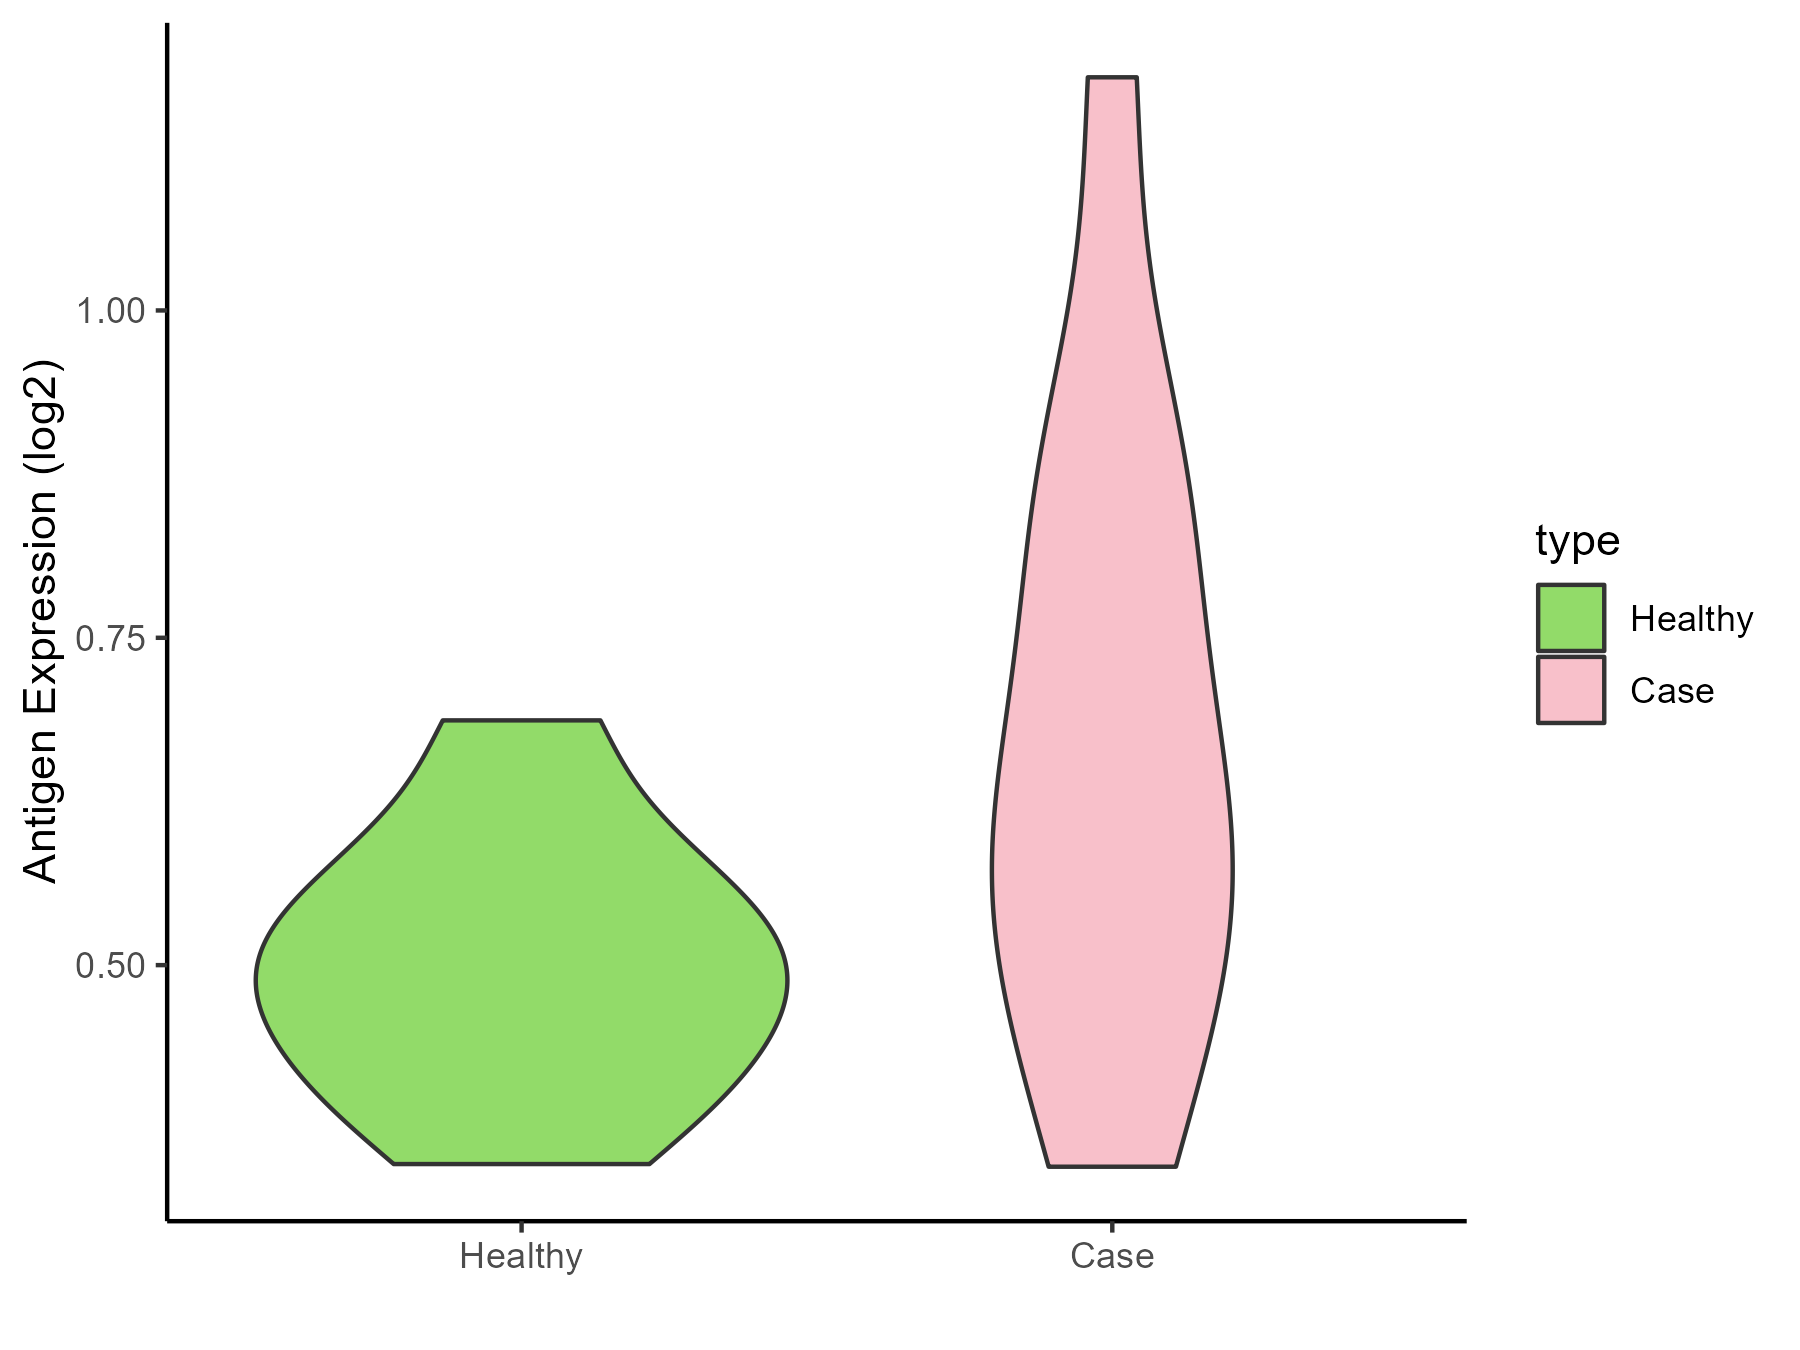
| The Studied Tissue | Brainstem | |
| The Specific Disease | Neuroectodermal tumor | |
| The Expression Level of Disease Section Compare with the Healthy Individual Tissue | p-value: 0.02147792; Fold-change: -0.177238287; Z-score: -1.182758318 | |
| Disease-specific Antigen Abundances |
|
Click to View the Clearer Original Diagram |
| The Studied Tissue | Nervous | |
| The Specific Disease | Brain cancer | |
| The Expression Level of Disease Section Compare with the Healthy Individual Tissue | p-value: 5.31E-20; Fold-change: -0.120295595; Z-score: -0.607883179 | |
| Disease-specific Antigen Abundances |
|
Click to View the Clearer Original Diagram |
| Differential expression pattern of antigen in diseases | ||
| The Studied Tissue | Whole blood | |
| The Specific Disease | Polycythemia vera | |
| The Expression Level of Disease Section Compare with the Healthy Individual Tissue | p-value: 0.045121825; Fold-change: 0.0769918; Z-score: 0.577978813 | |
| Disease-specific Antigen Abundances |
|
Click to View the Clearer Original Diagram |
| The Studied Tissue | Whole blood | |
| The Specific Disease | Myelofibrosis | |
| The Expression Level of Disease Section Compare with the Healthy Individual Tissue | p-value: 0.786287453; Fold-change: -0.019383026; Z-score: -0.156995689 | |
| Disease-specific Antigen Abundances |
|
Click to View the Clearer Original Diagram |
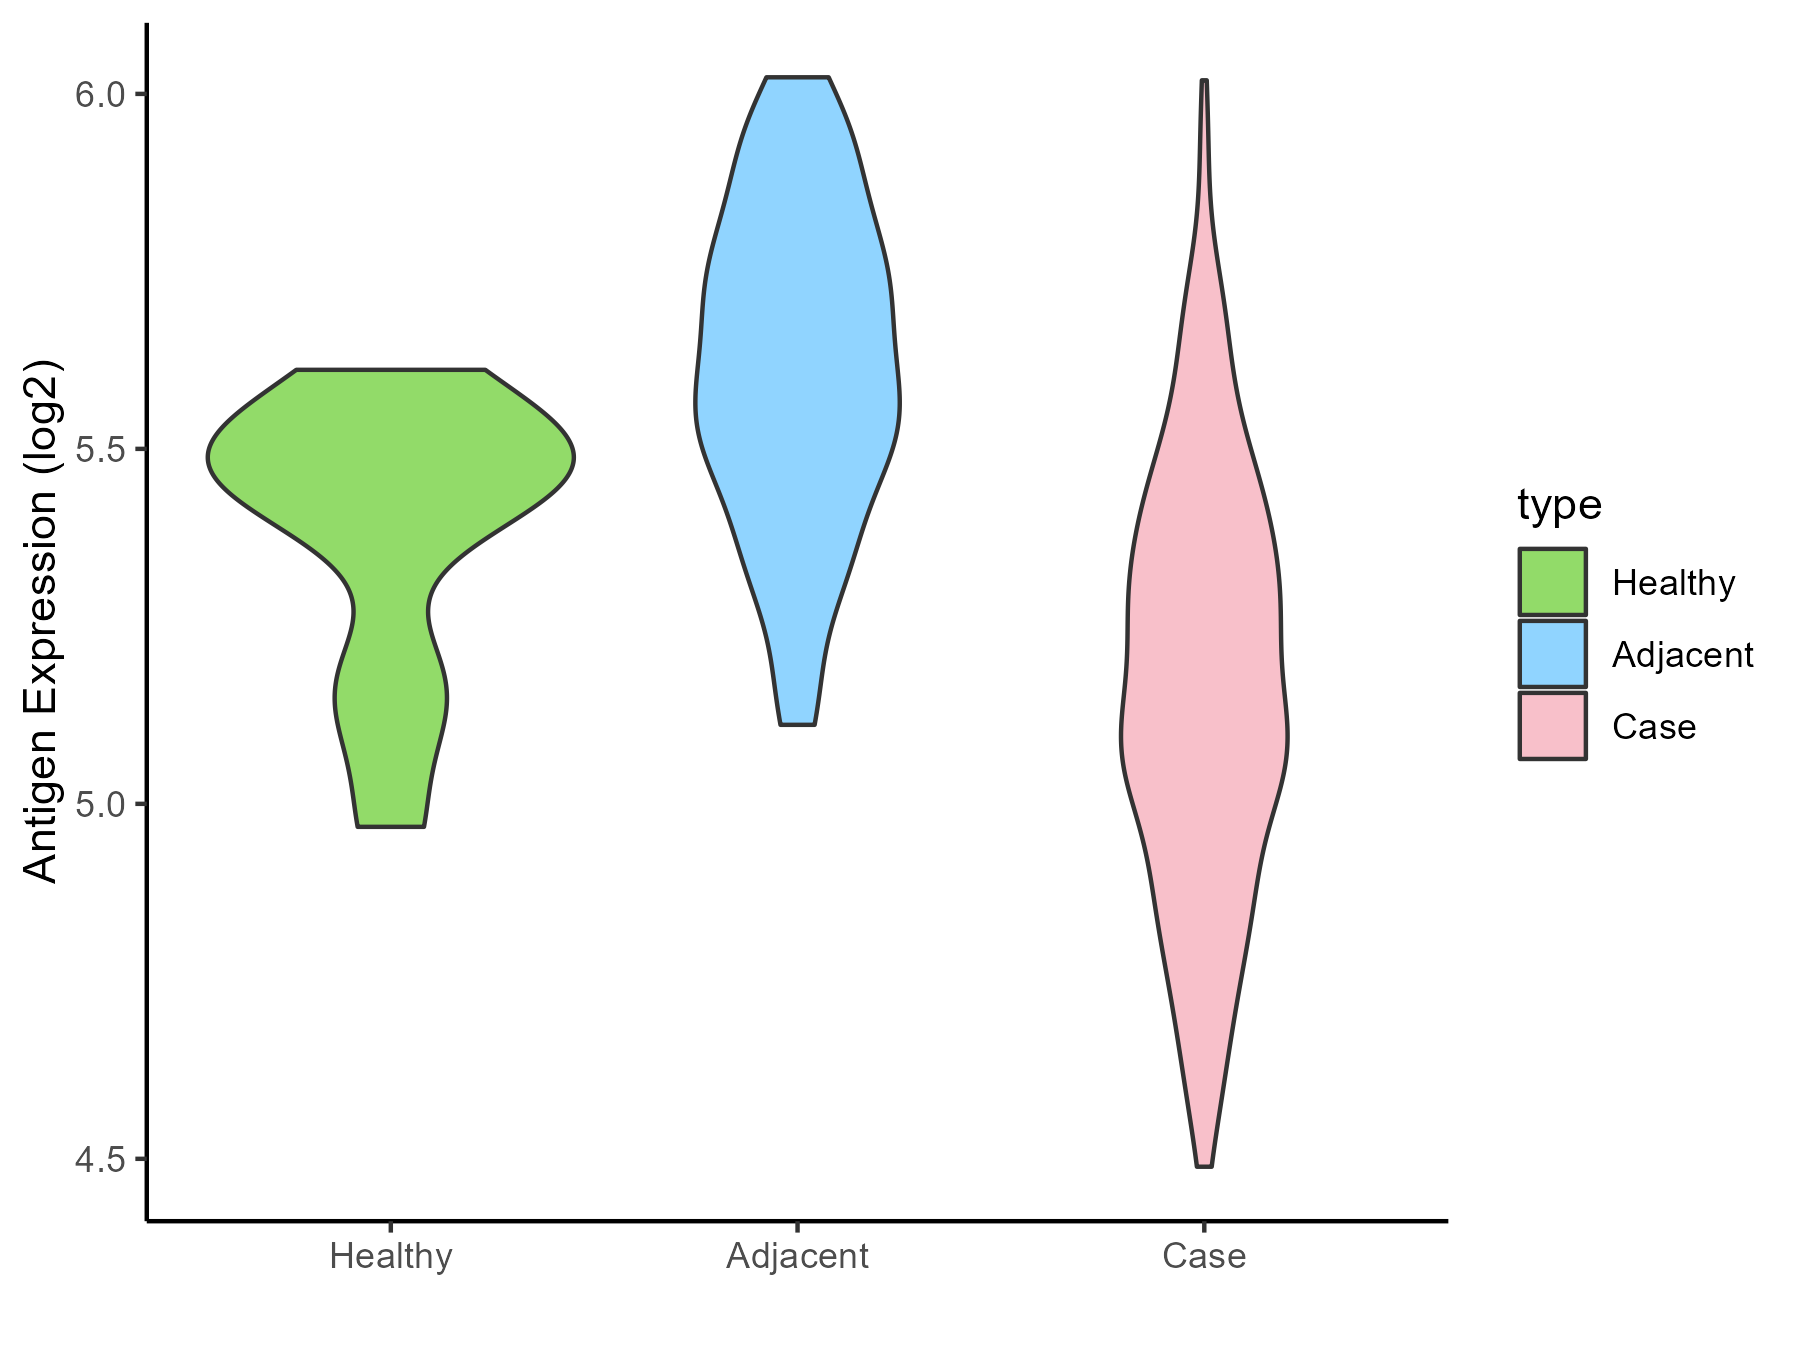
| Differential expression pattern of antigen in diseases | ||
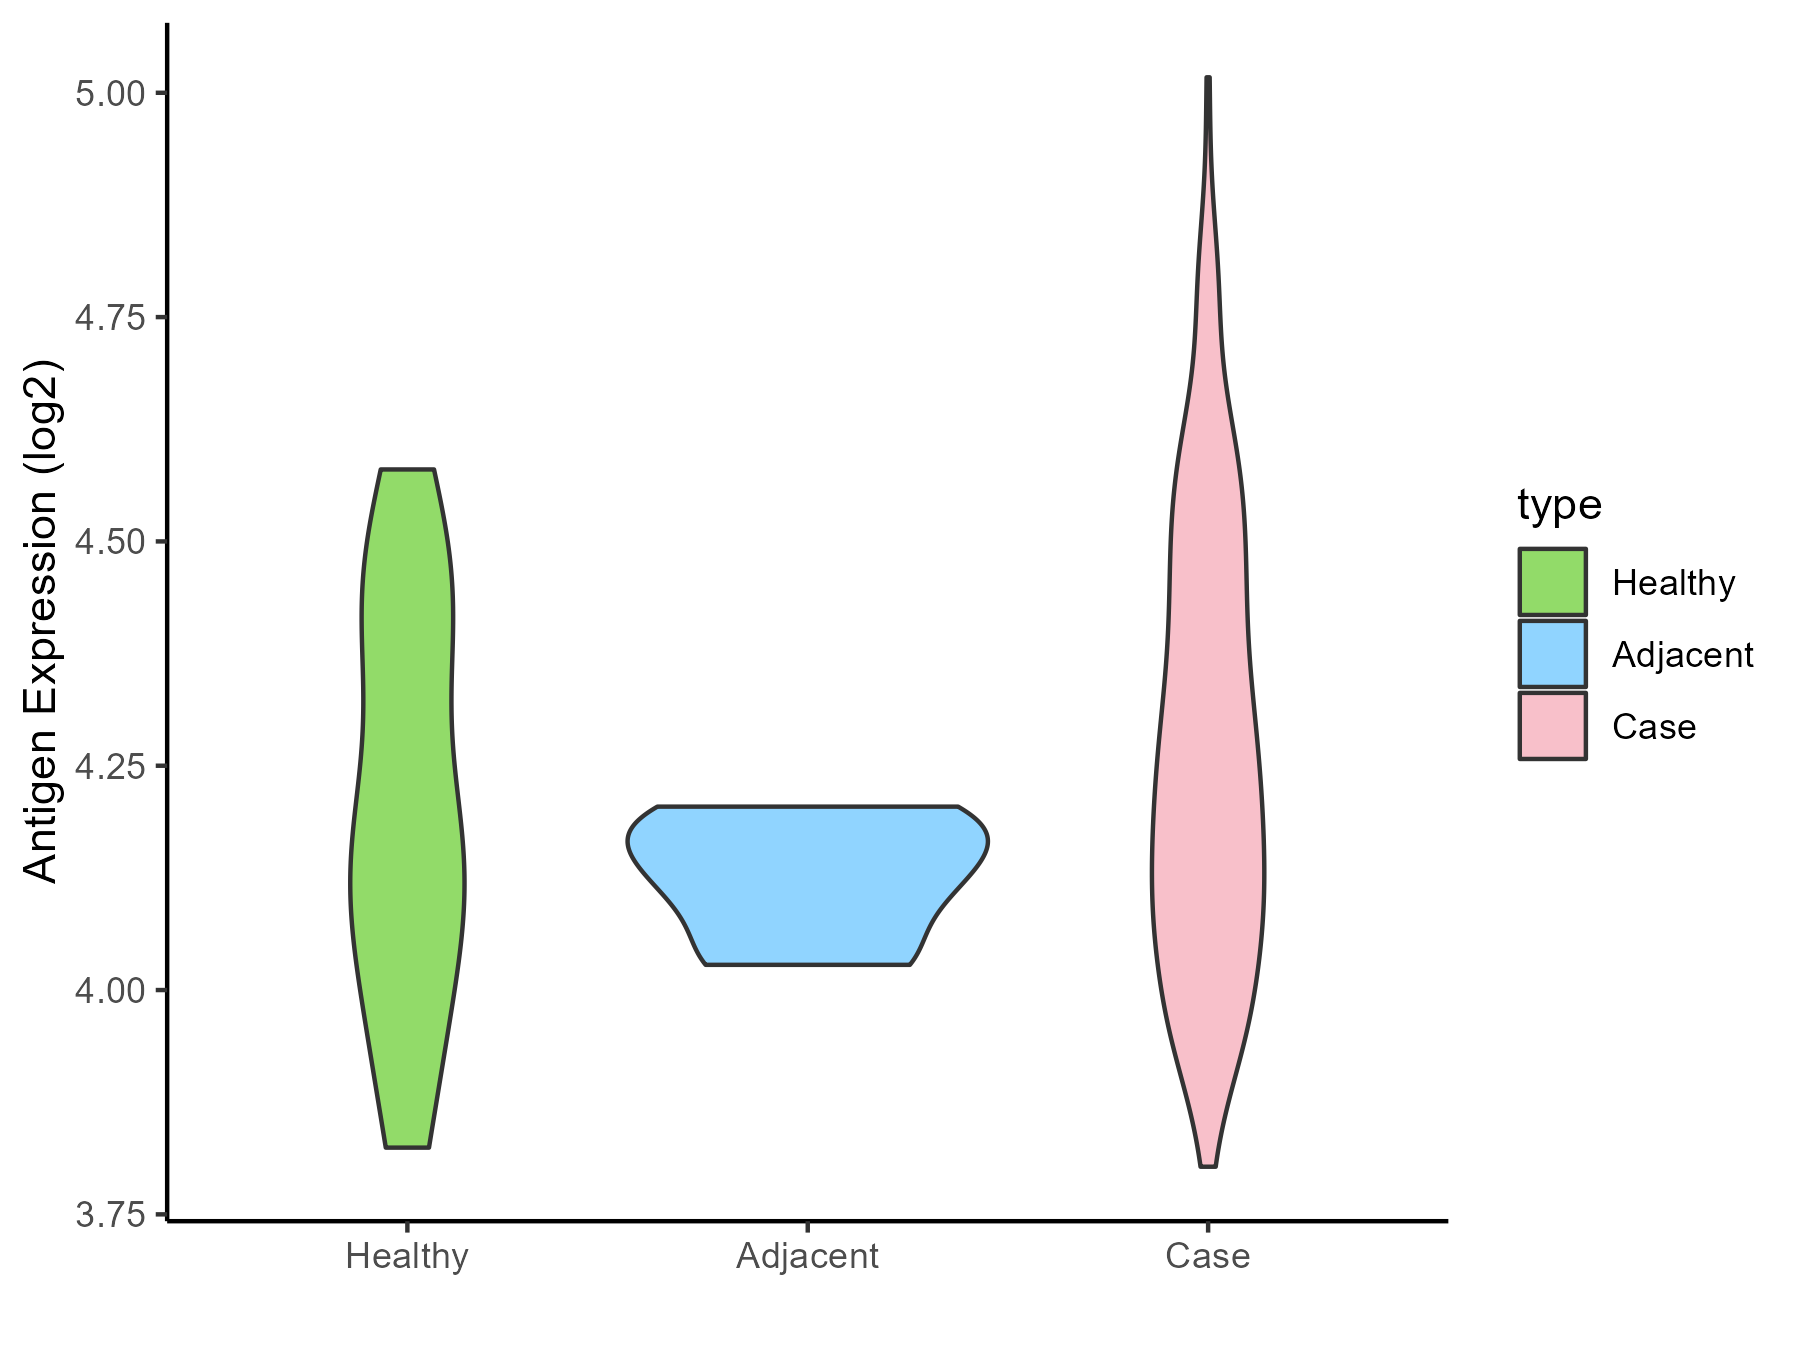
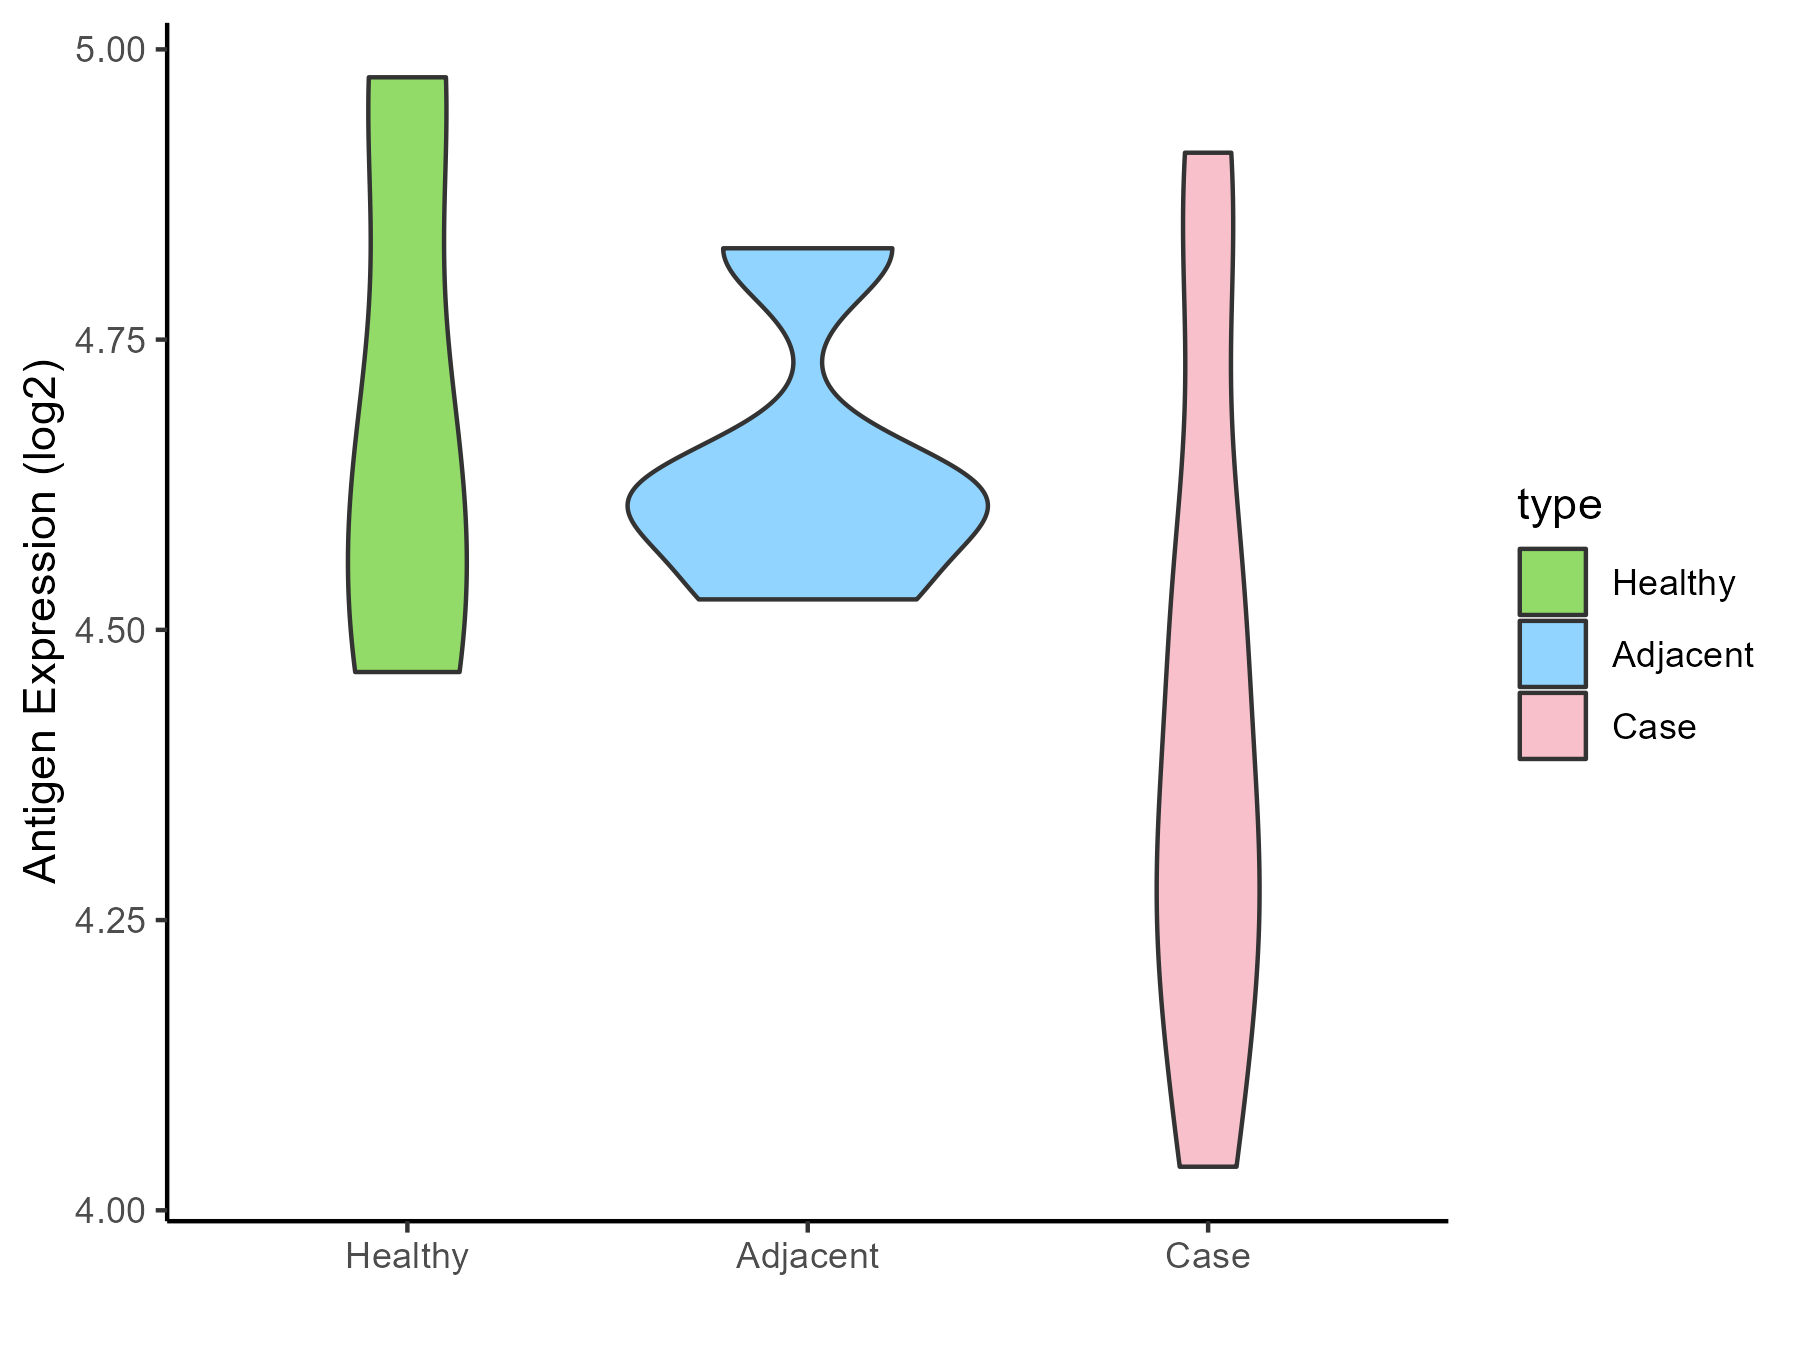
| The Studied Tissue | Bone marrow | |
| The Specific Disease | Myelodysplastic syndromes | |
| The Expression Level of Disease Section Compare with the Healthy Individual Tissue | p-value: 0.153912727; Fold-change: 0.069573148; Z-score: 0.311027408 | |
| The Expression Level of Disease Section Compare with the Adjacent Tissue | p-value: 0.02344139; Fold-change: 0.099187066; Z-score: 1.295646269 | |
| Disease-specific Antigen Abundances |
|
Click to View the Clearer Original Diagram |
| Differential expression pattern of antigen in diseases | ||
| The Studied Tissue | Tonsil | |
| The Specific Disease | Lymphoma | |
| The Expression Level of Disease Section Compare with the Healthy Individual Tissue | p-value: 0.747715931; Fold-change: -0.064636806; Z-score: -0.532557963 | |
| Disease-specific Antigen Abundances |
|
Click to View the Clearer Original Diagram |
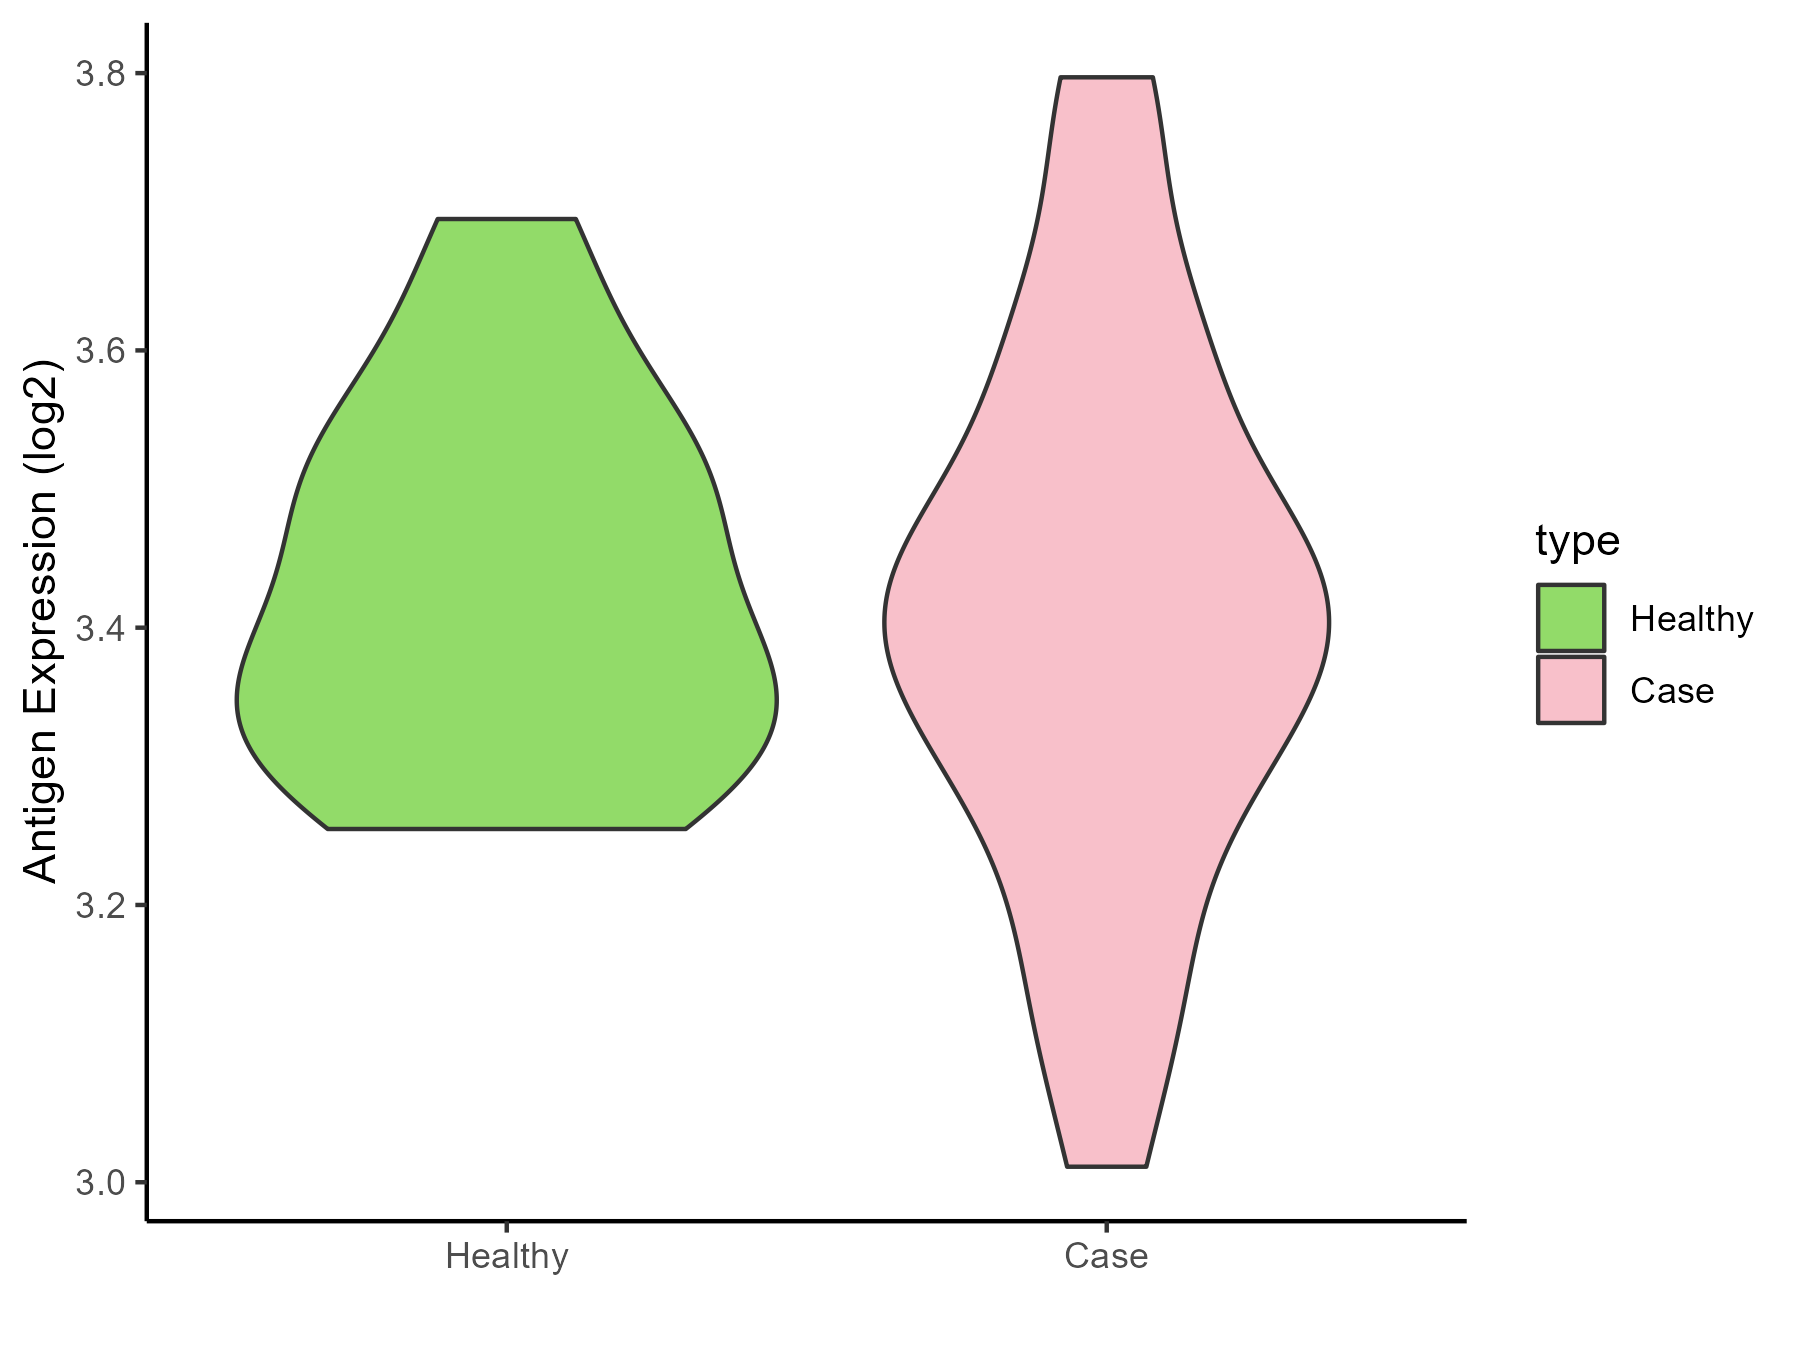
| Differential expression pattern of antigen in diseases | ||
| The Studied Tissue | Gastric | |
| The Specific Disease | Gastric cancer | |
| The Expression Level of Disease Section Compare with the Healthy Individual Tissue | p-value: 0.860965989; Fold-change: -0.031569624; Z-score: -0.363157552 | |
| The Expression Level of Disease Section Compare with the Adjacent Tissue | p-value: 0.983354219; Fold-change: 0.012789259; Z-score: 0.05877818 | |
| Disease-specific Antigen Abundances |
|
Click to View the Clearer Original Diagram |
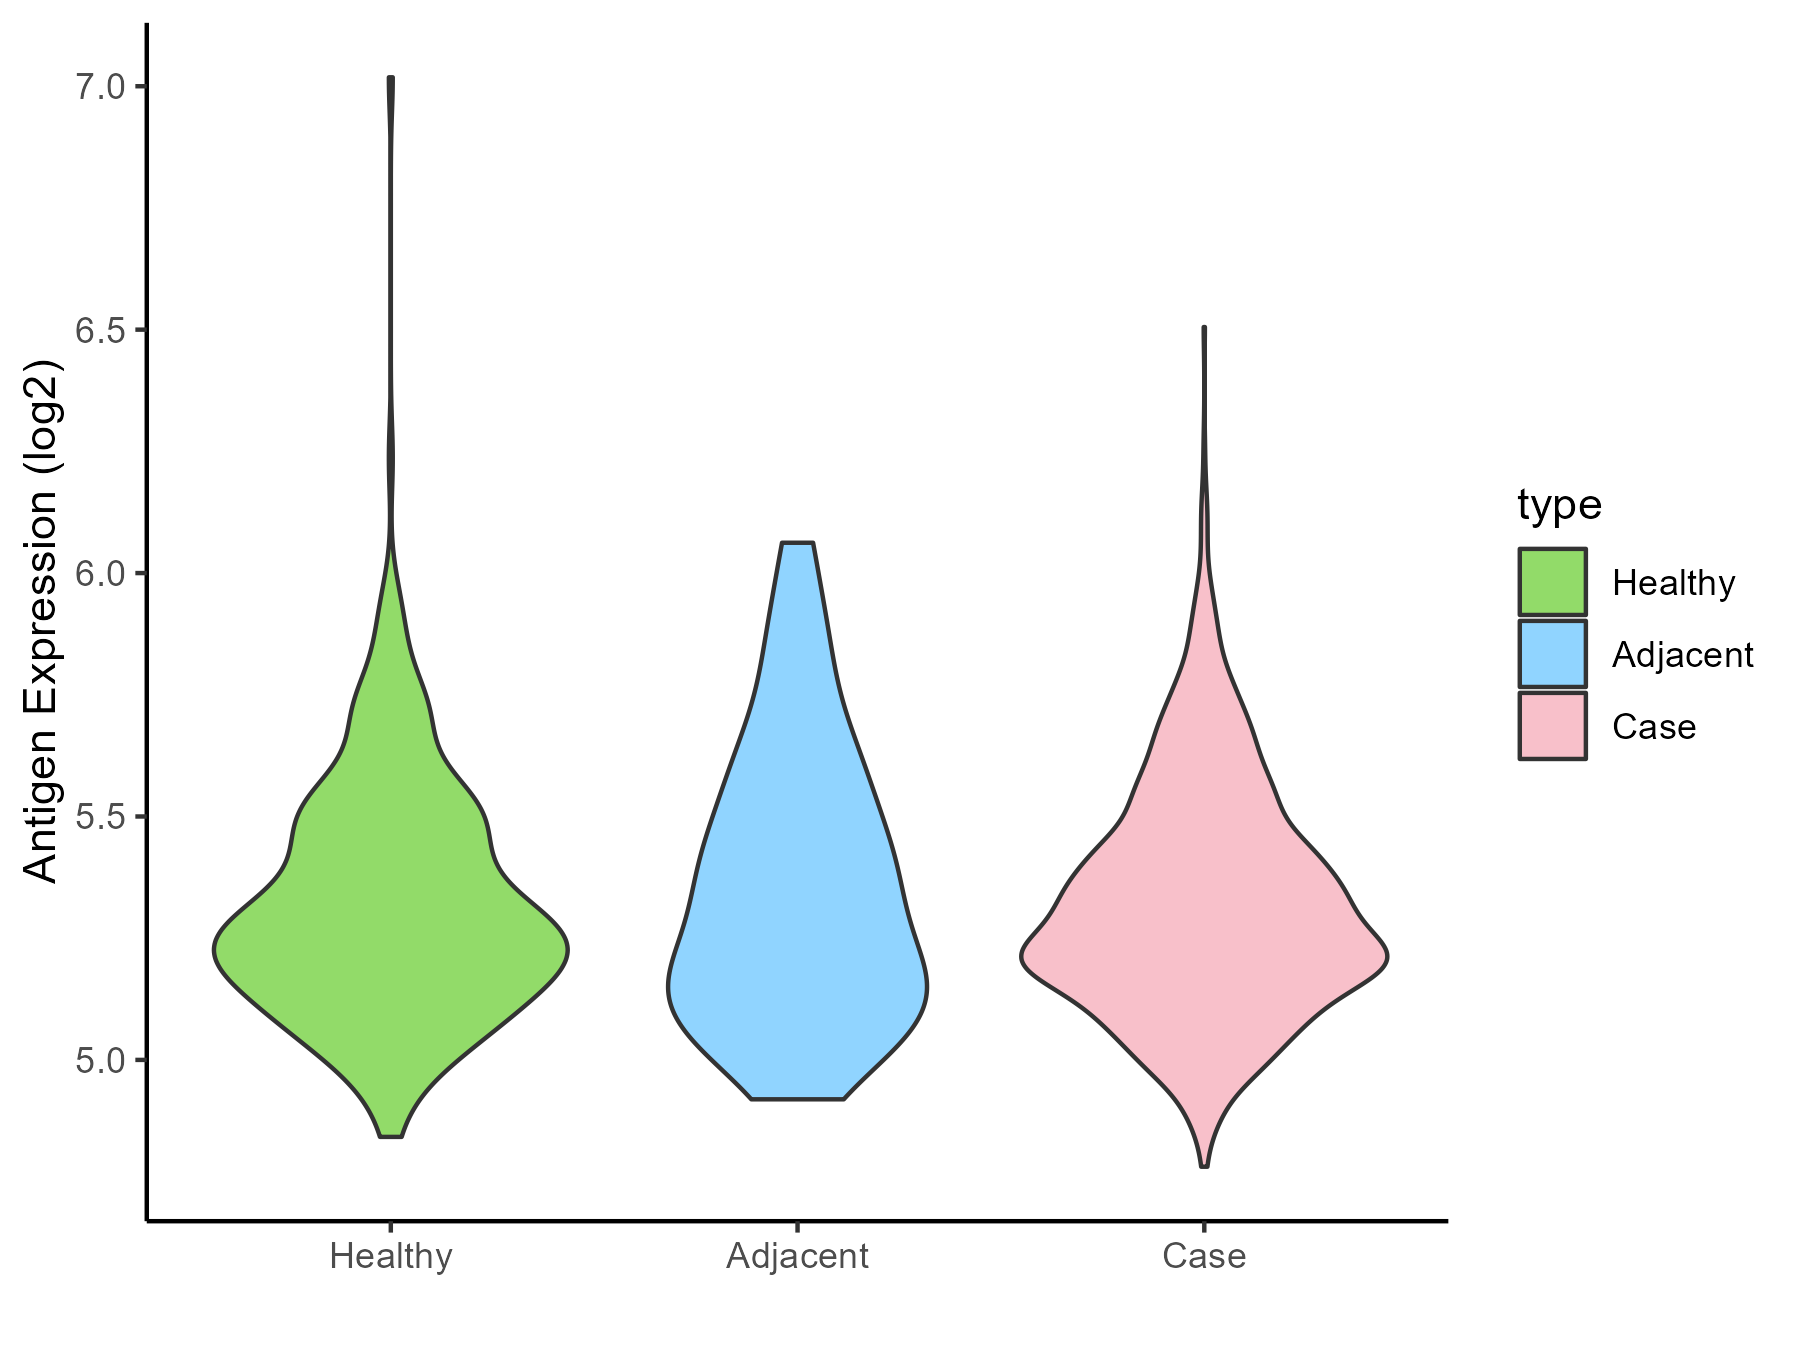
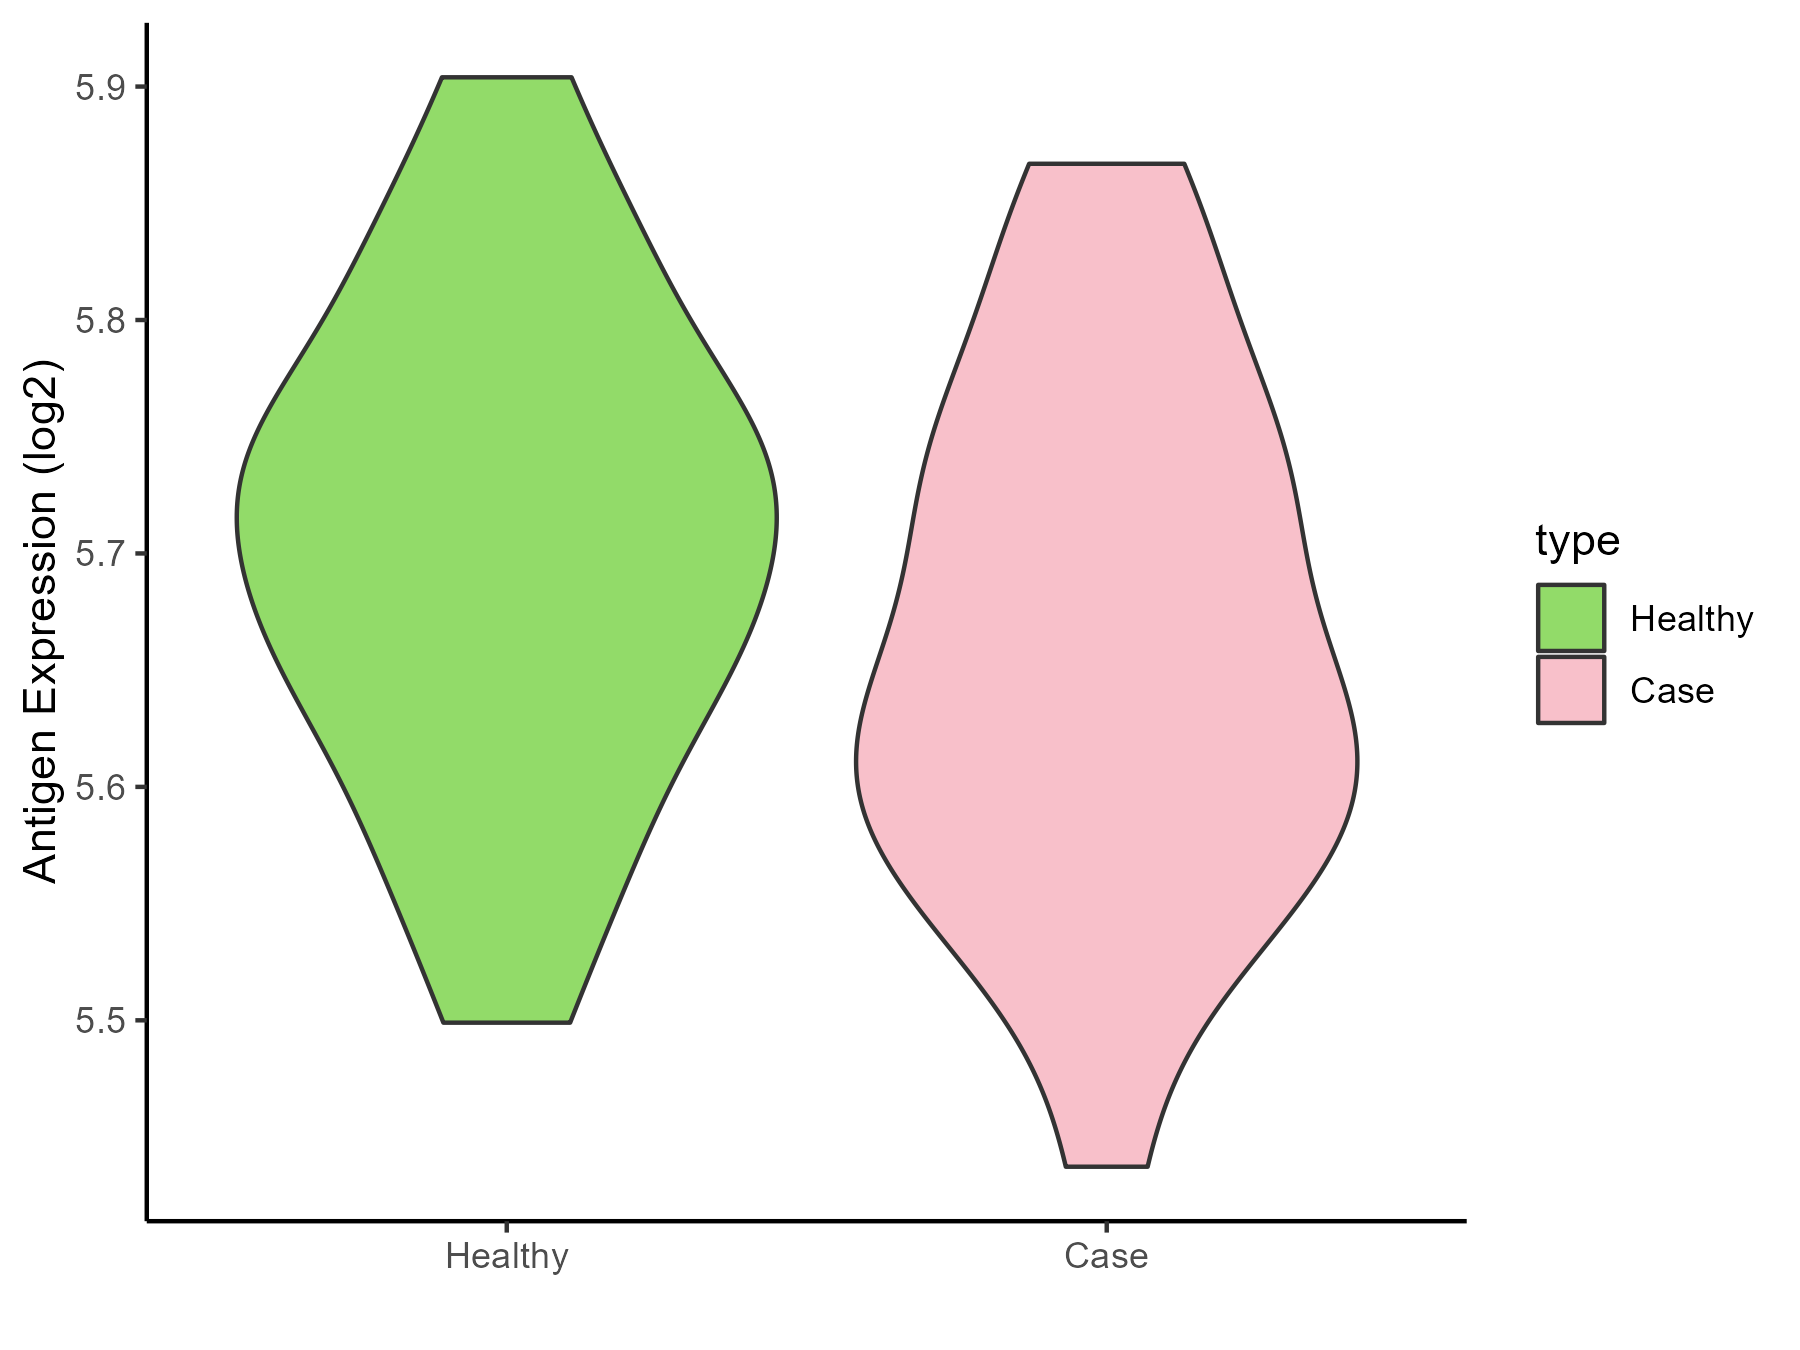
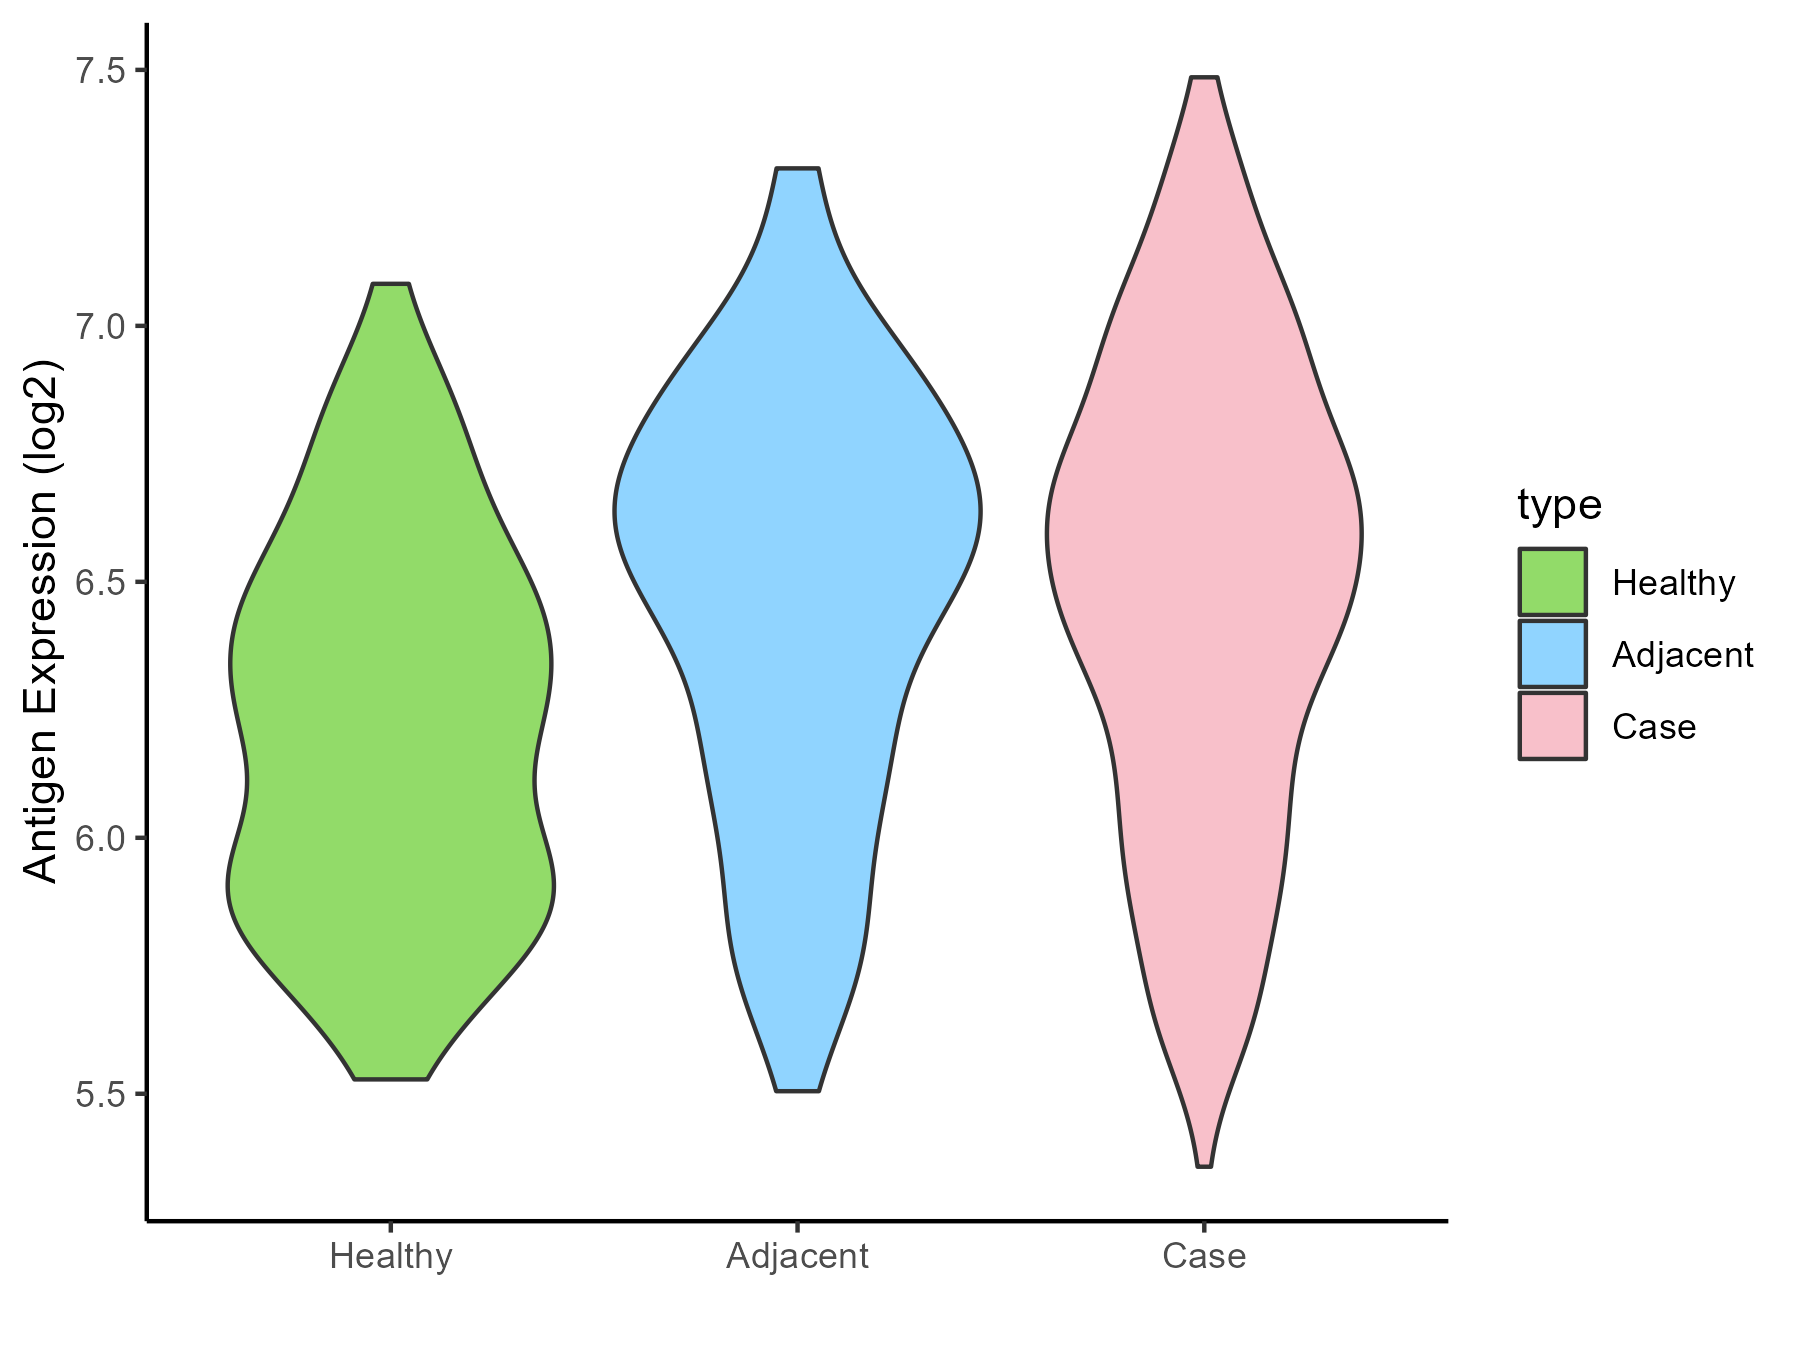
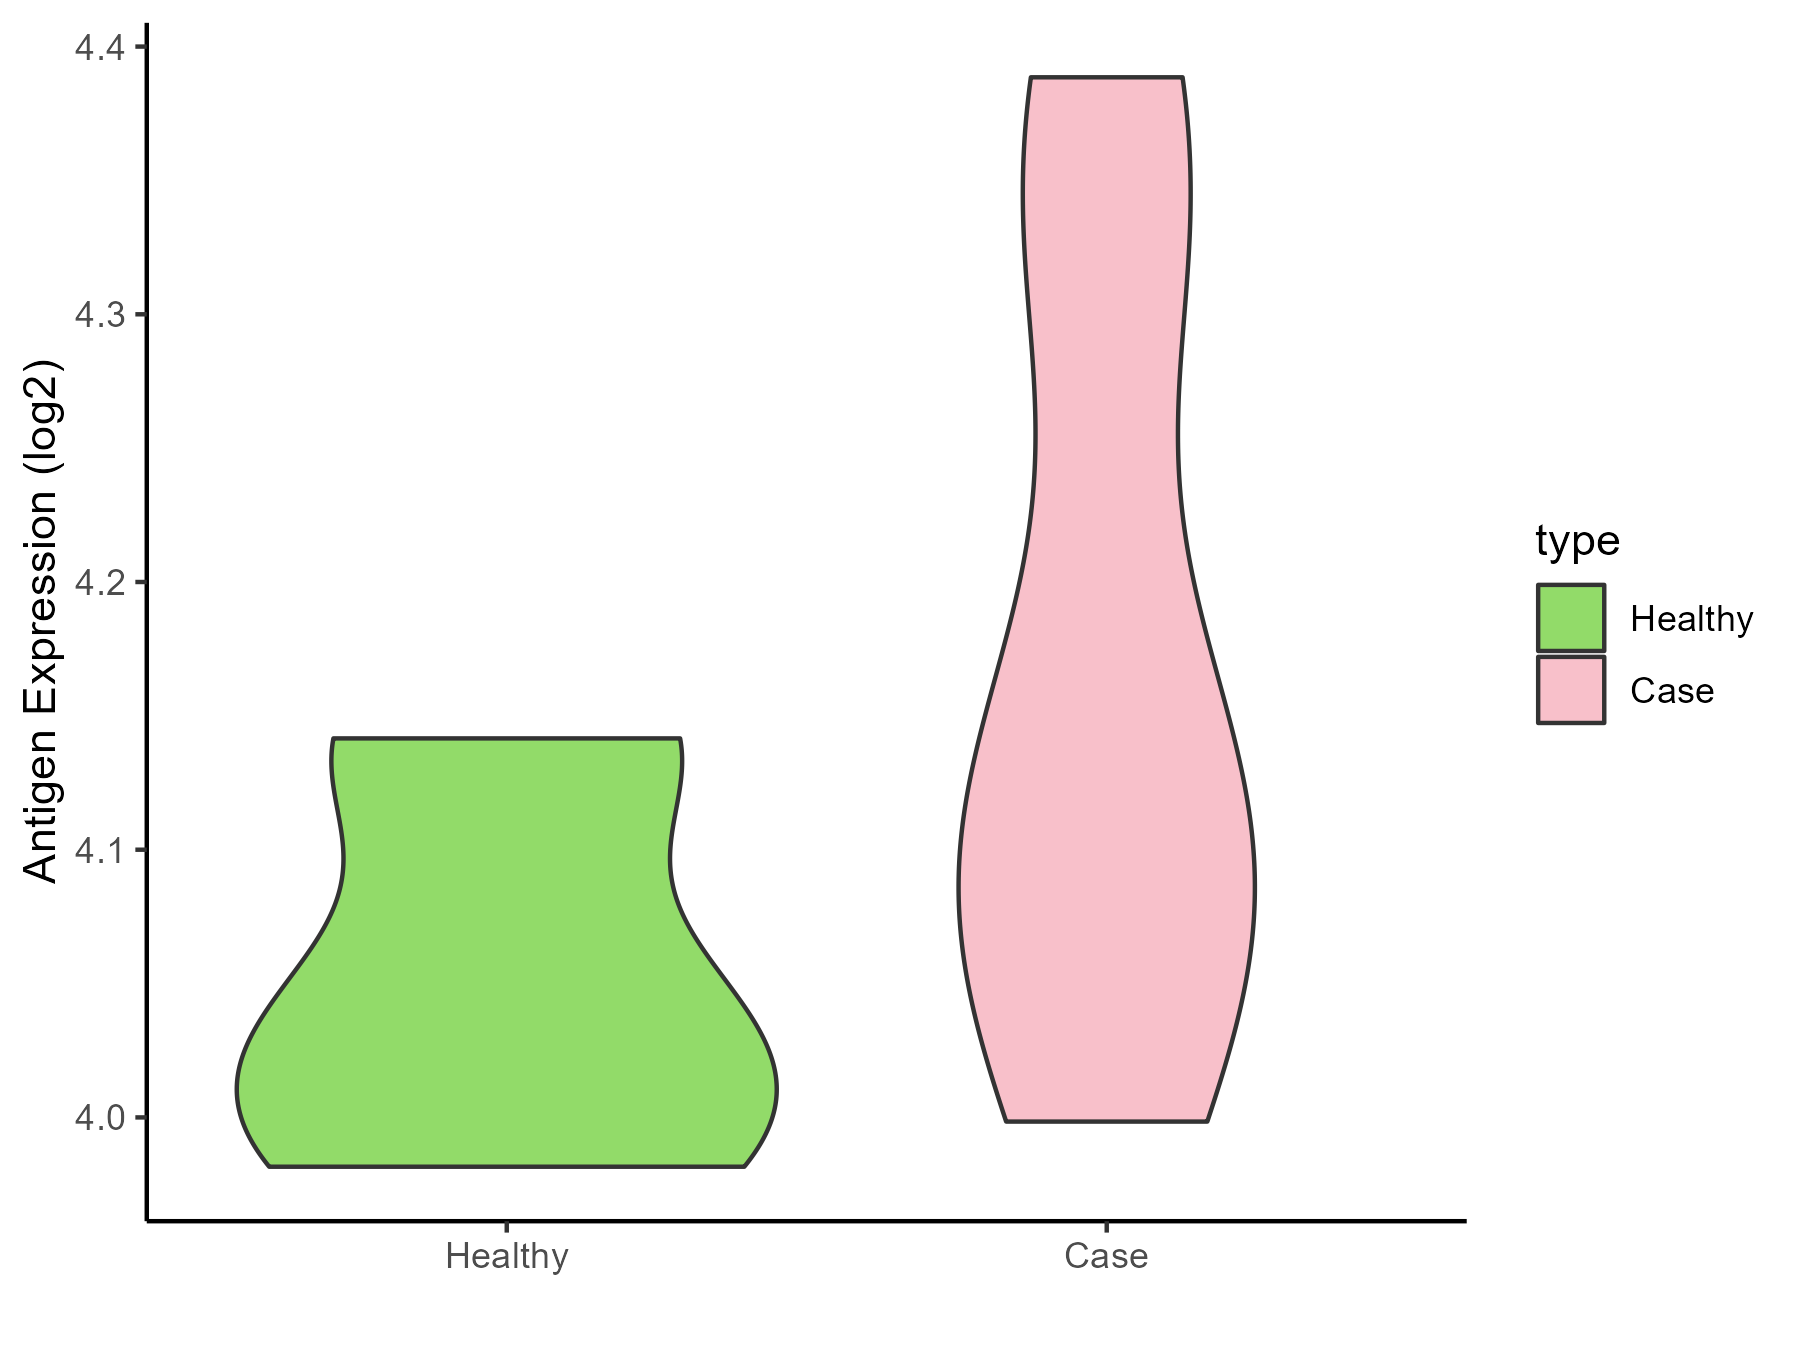
| Differential expression pattern of antigen in diseases | ||
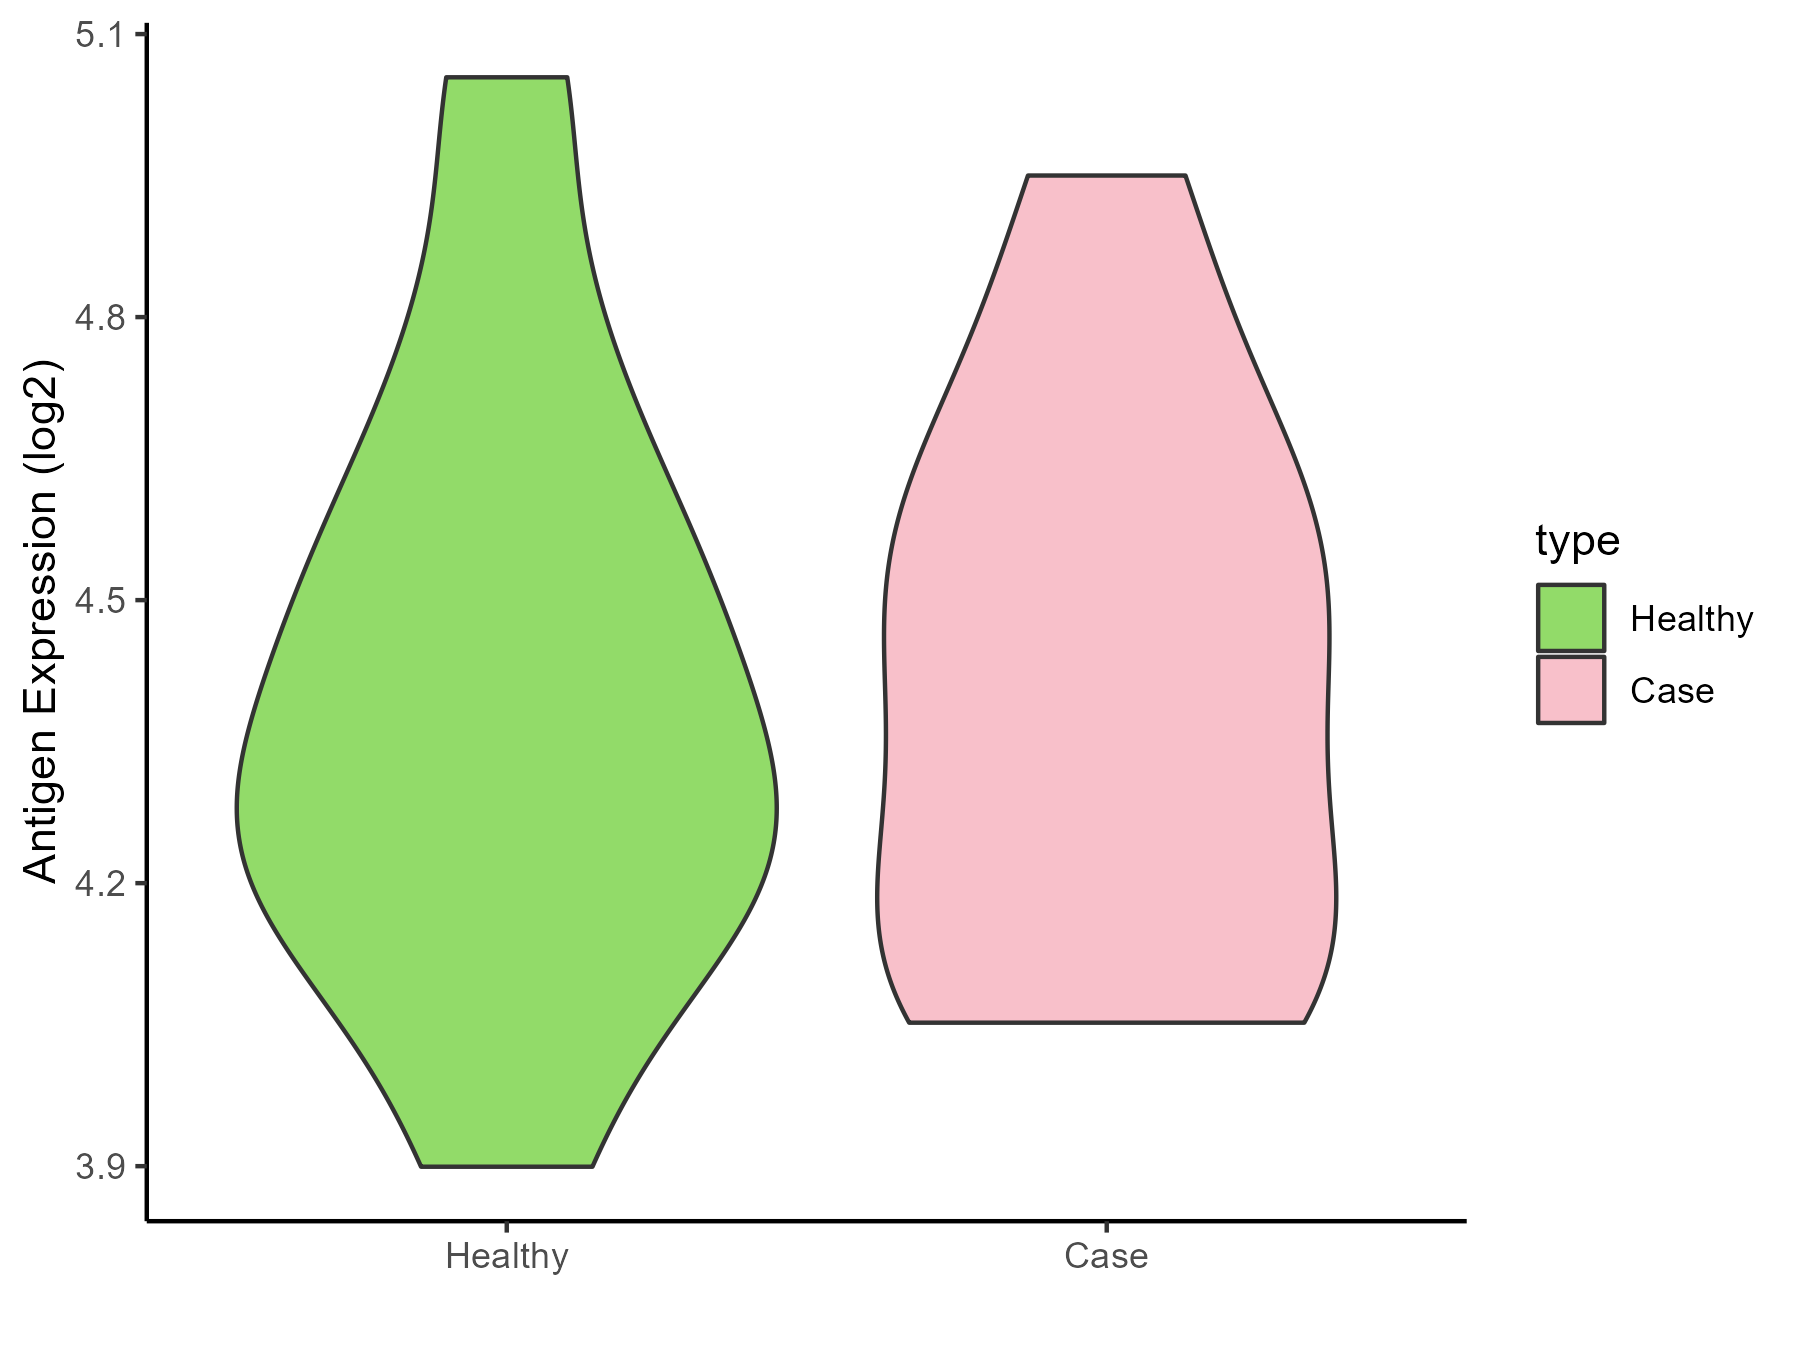
| The Studied Tissue | Colon | |
| The Specific Disease | Colon cancer | |
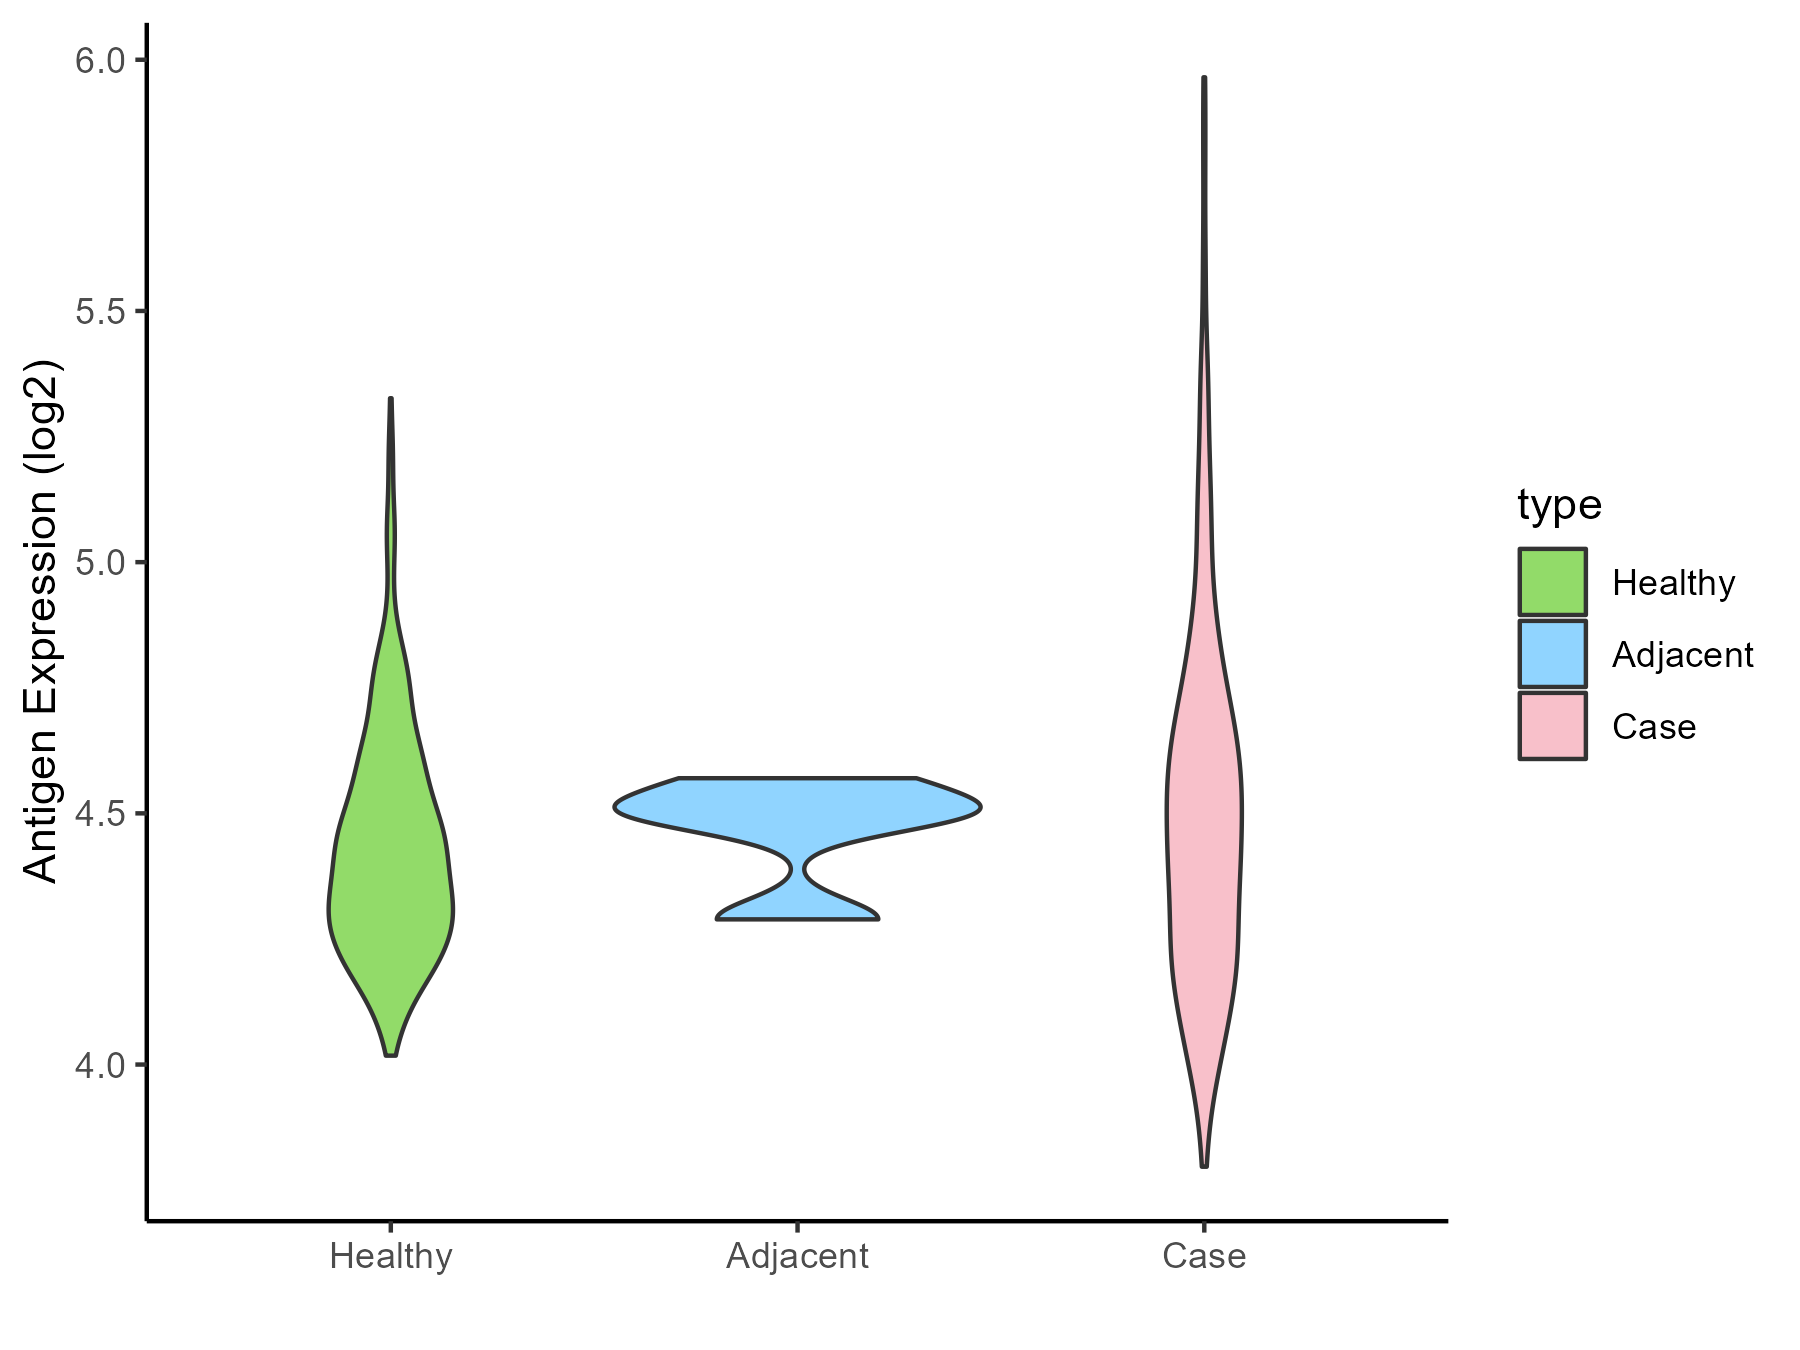
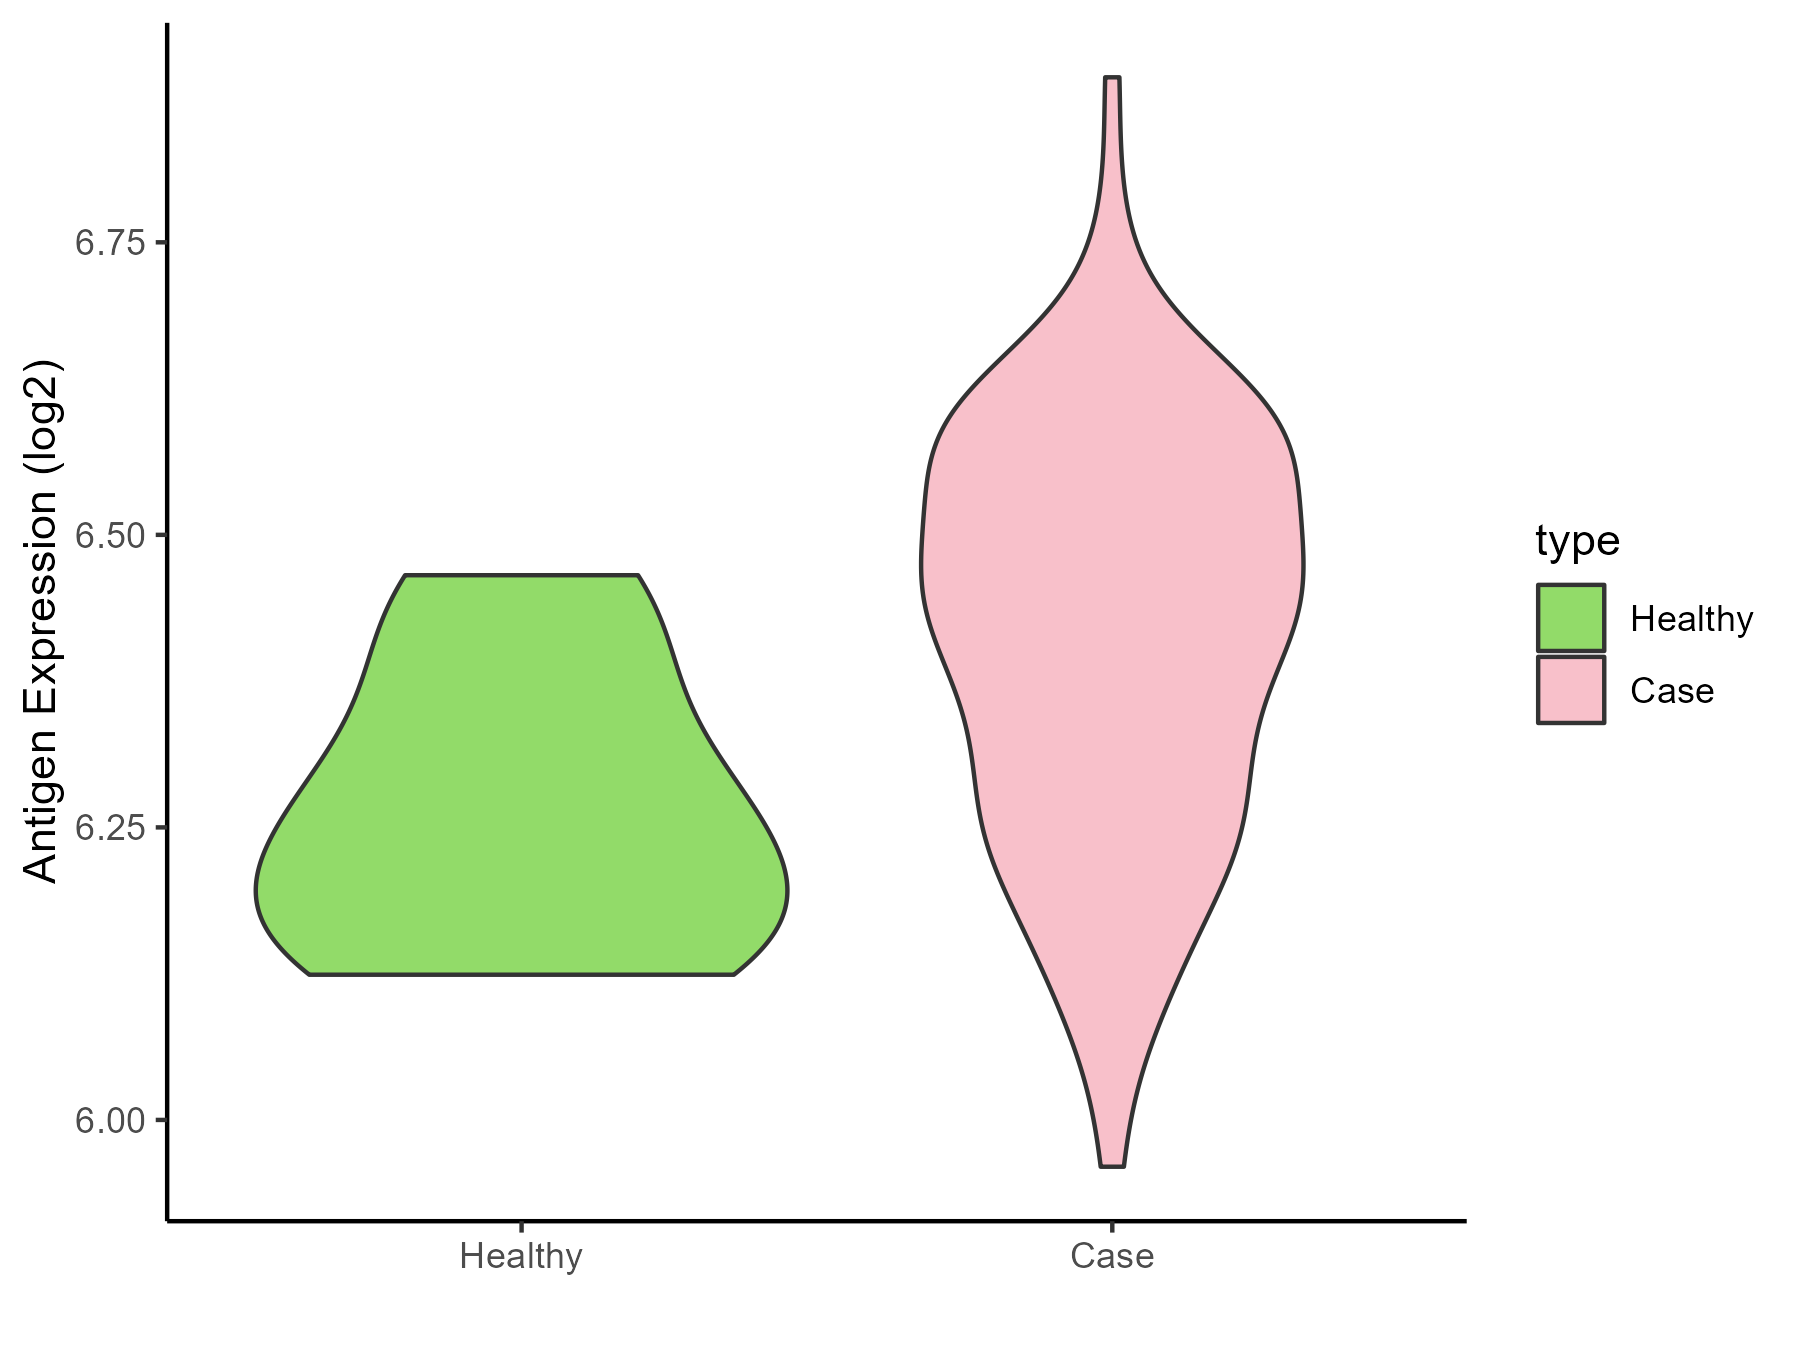
| The Expression Level of Disease Section Compare with the Healthy Individual Tissue | p-value: 1.16E-19; Fold-change: 0.234394083; Z-score: 0.976617871 | |
| The Expression Level of Disease Section Compare with the Adjacent Tissue | p-value: 0.454131877; Fold-change: 0.017840273; Z-score: 0.060252076 | |
| Disease-specific Antigen Abundances |
|
Click to View the Clearer Original Diagram |
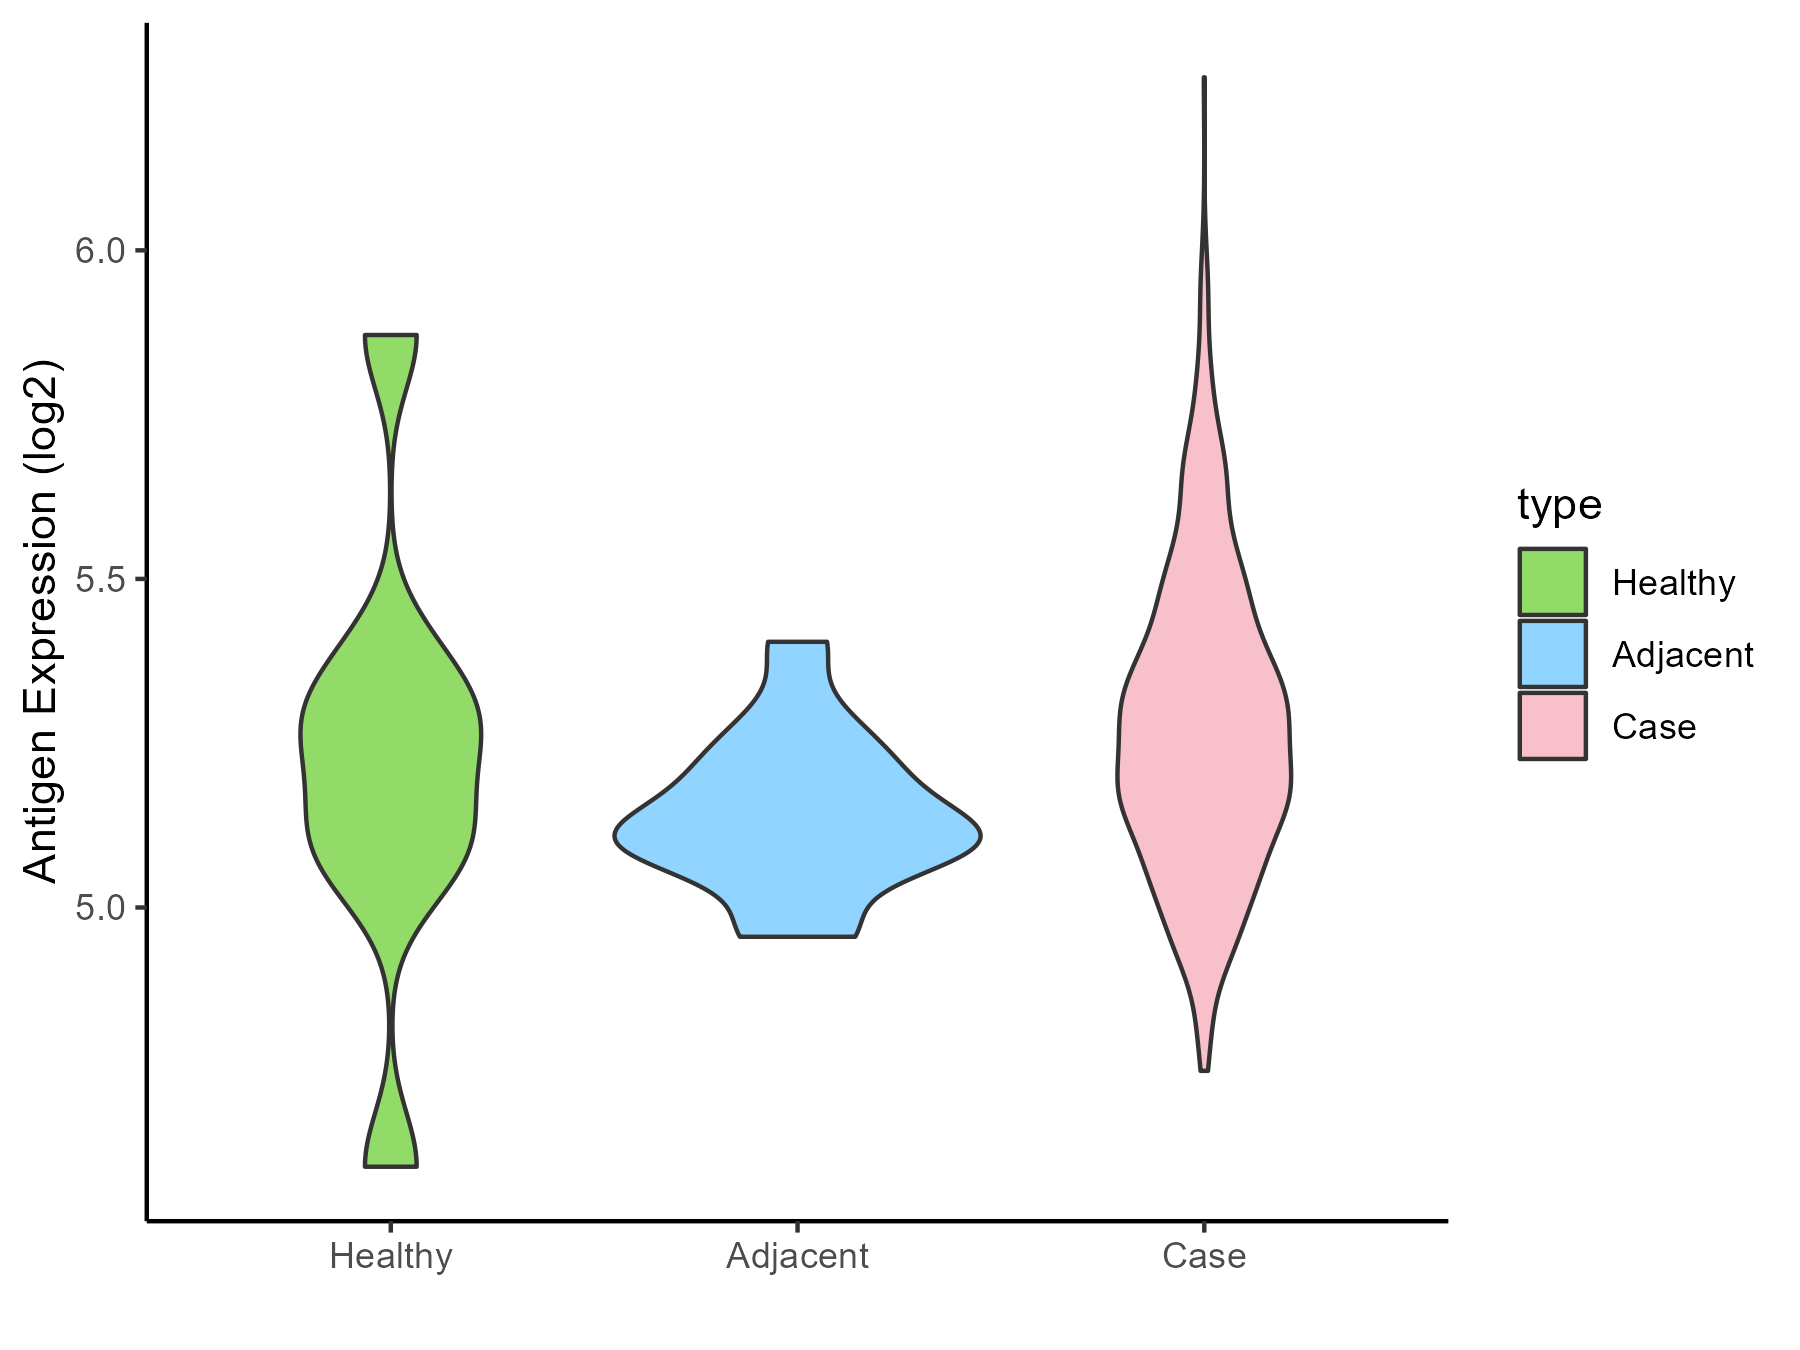
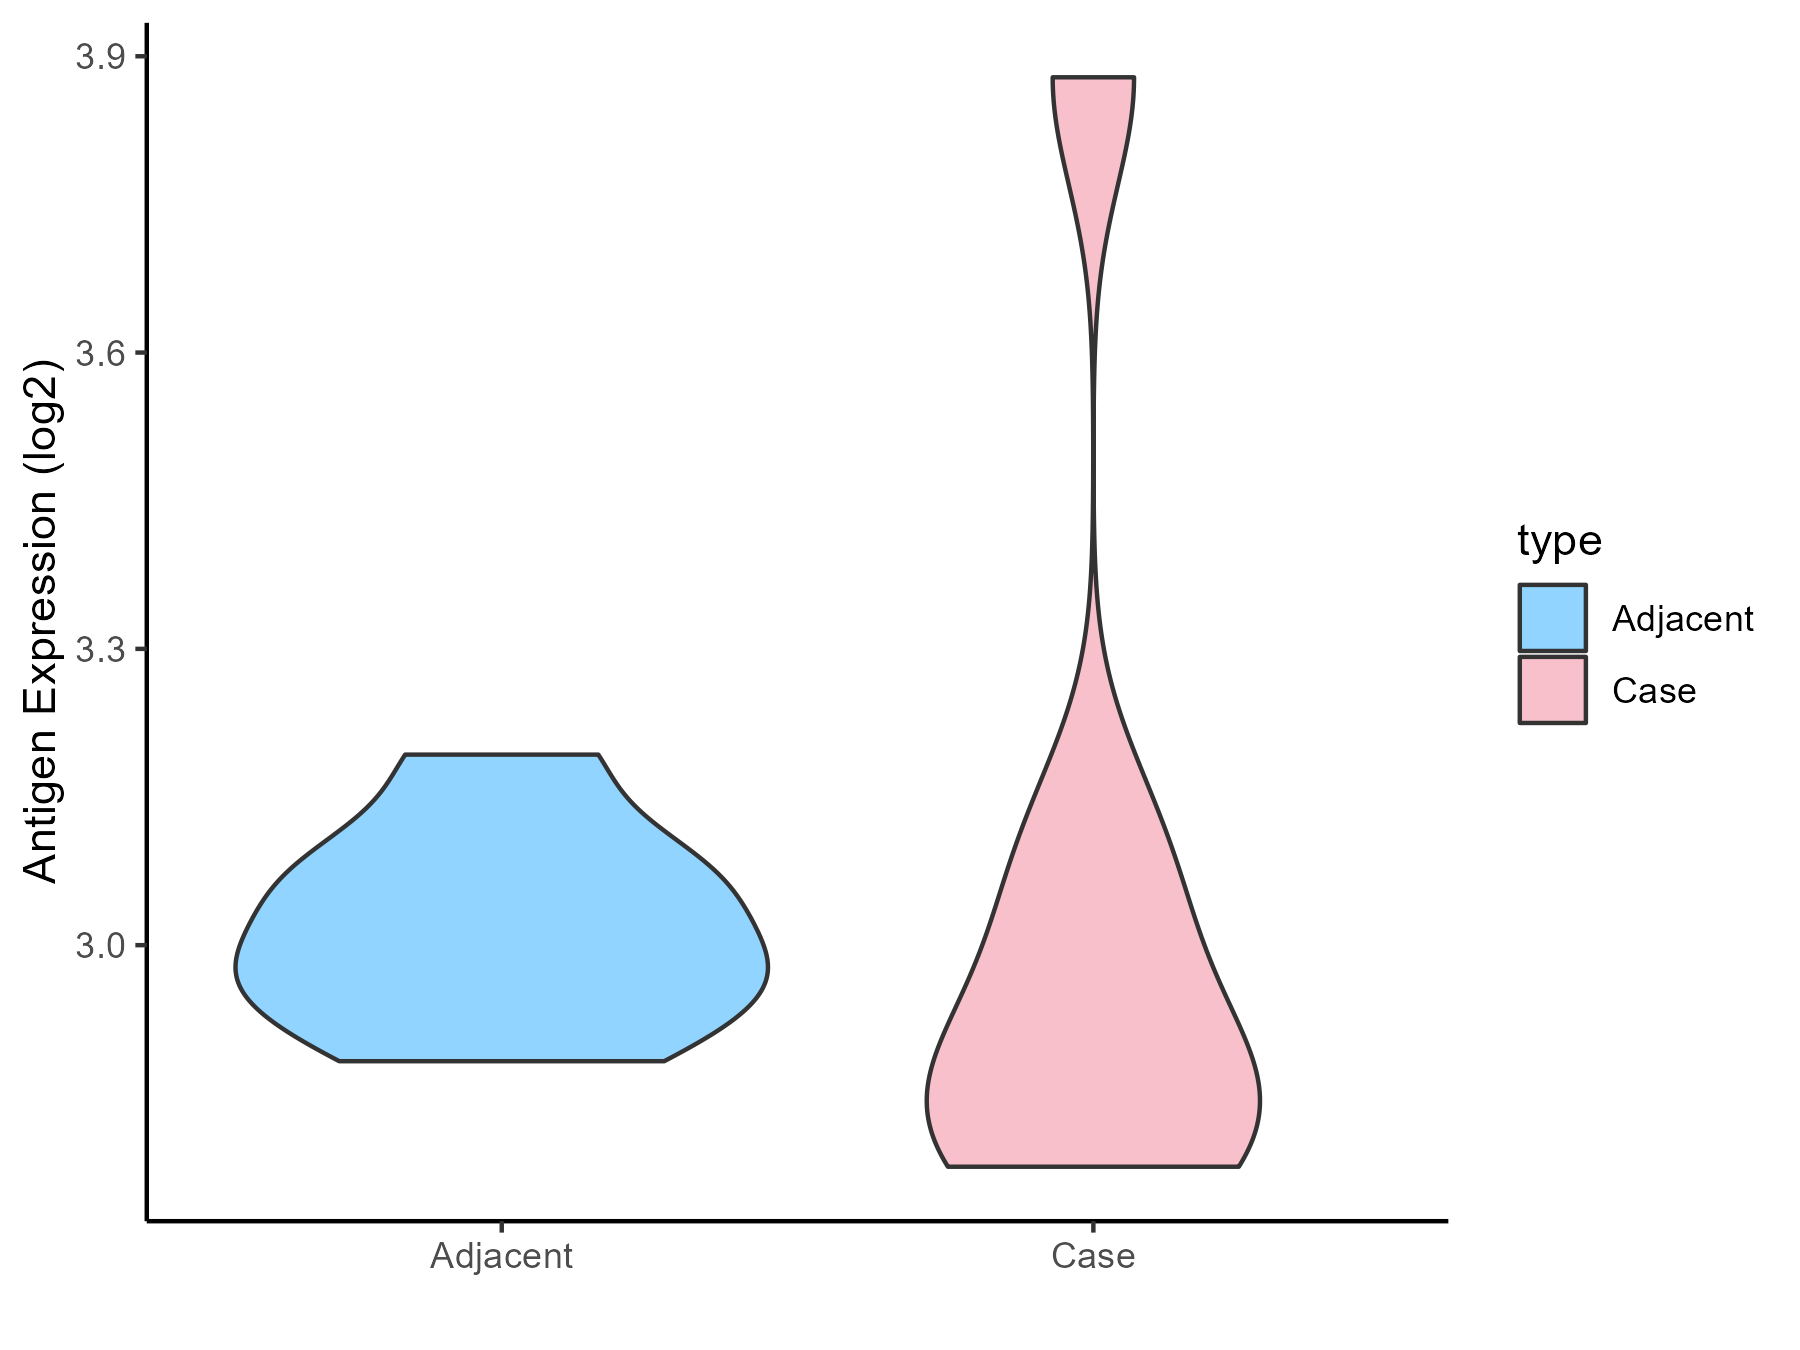
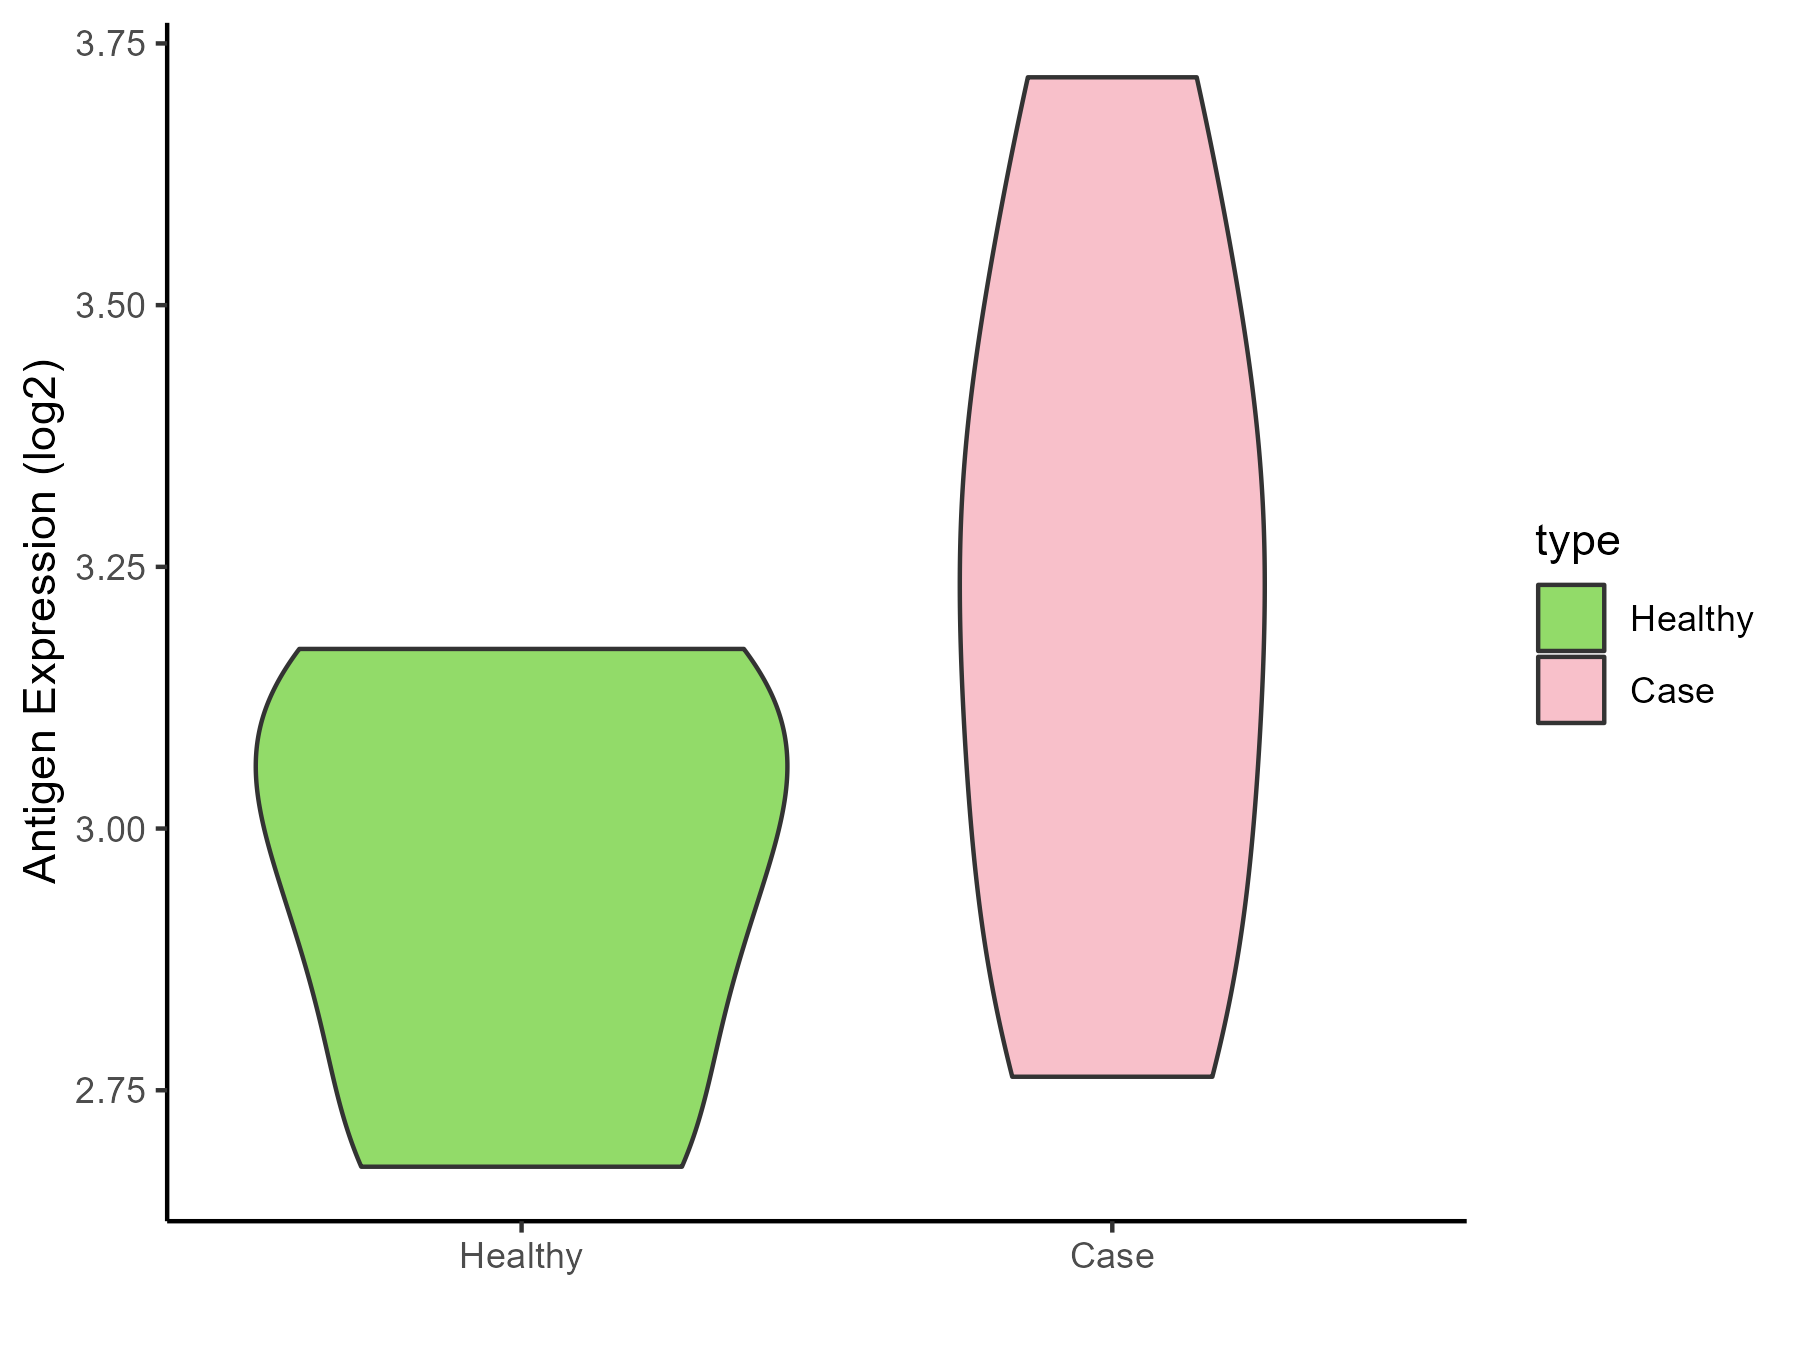
| Differential expression pattern of antigen in diseases | ||
| The Studied Tissue | Pancreas | |
| The Specific Disease | Pancreatic cancer | |
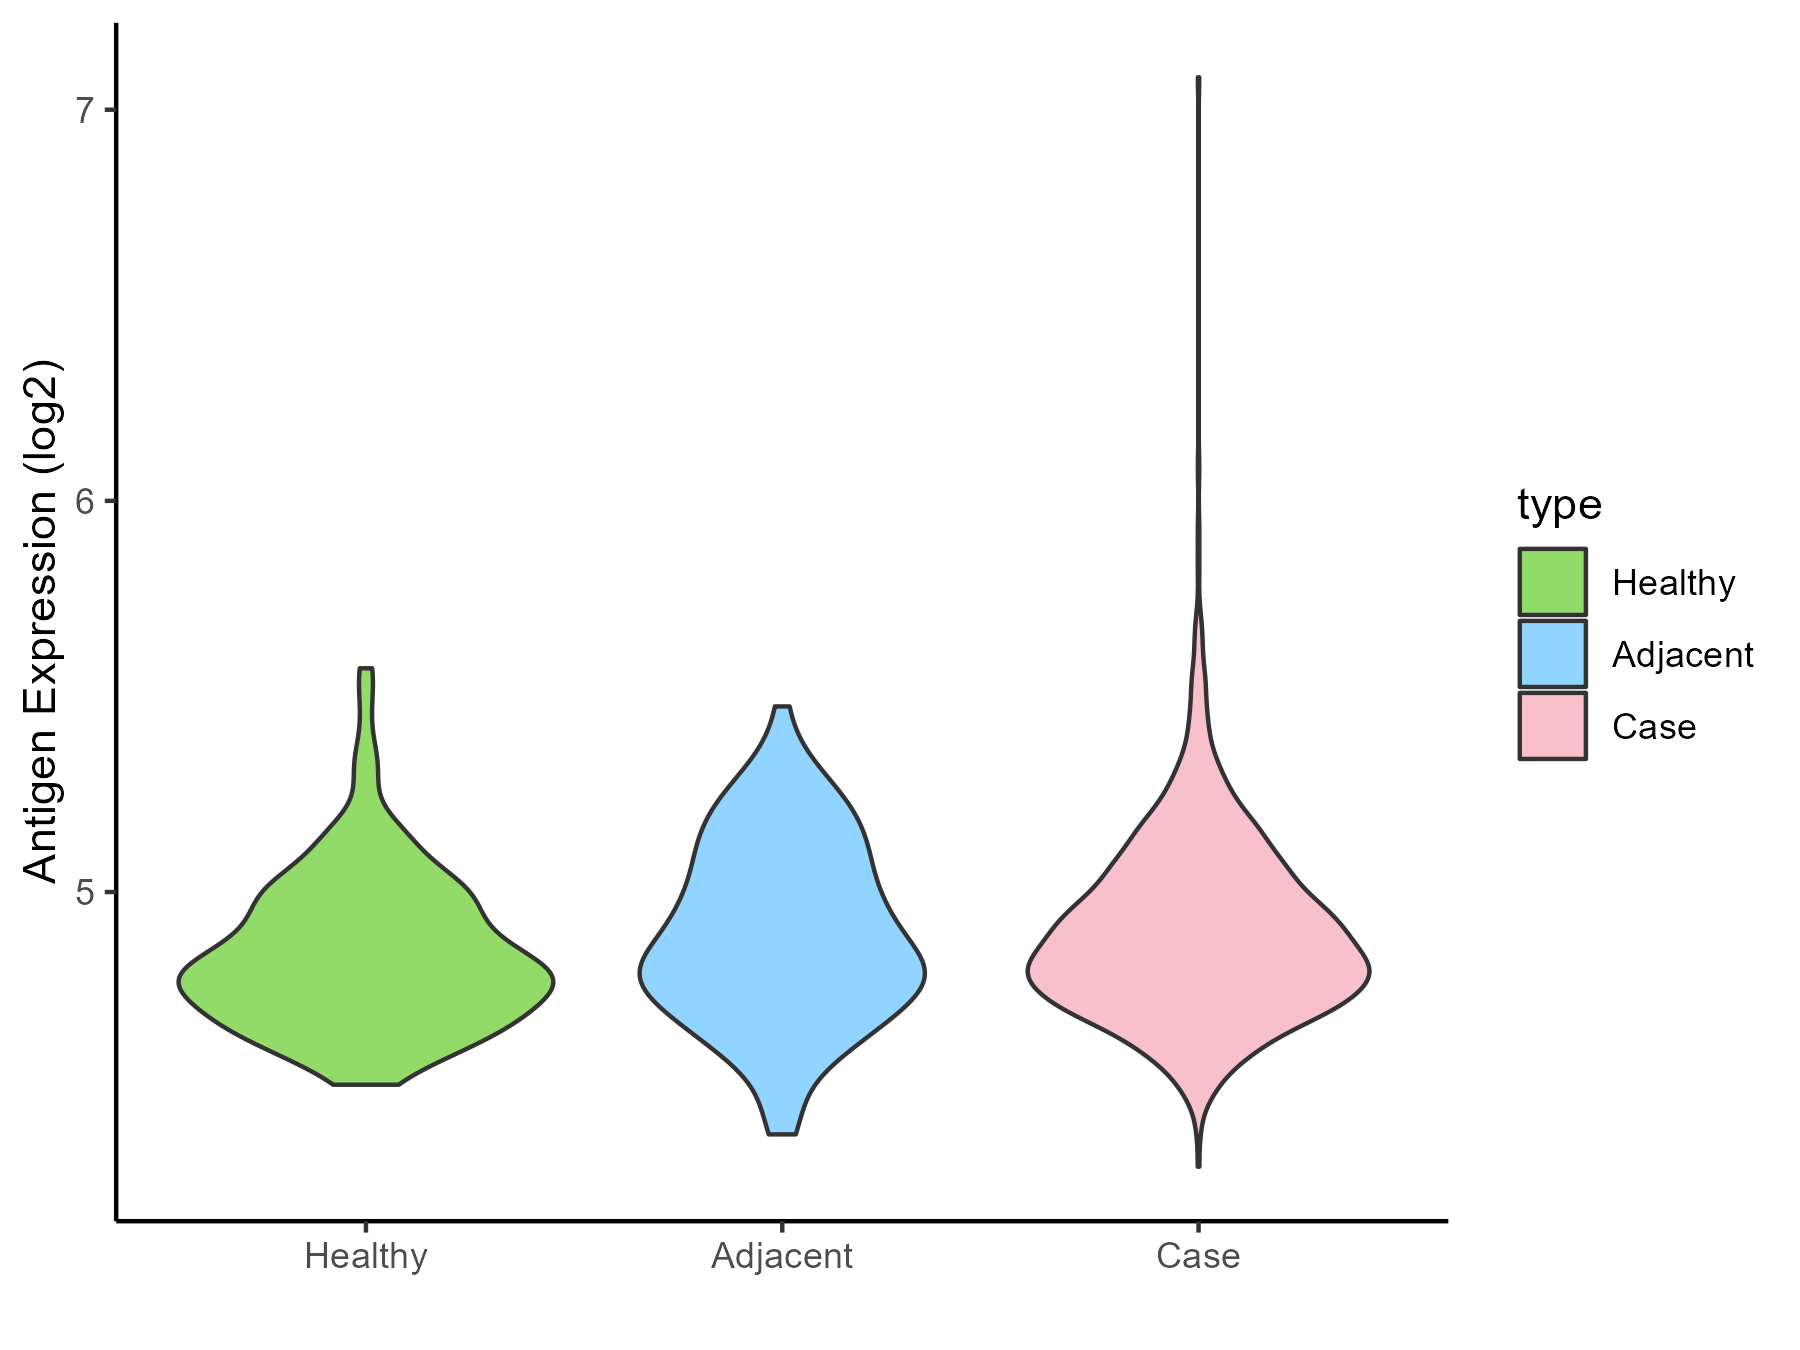
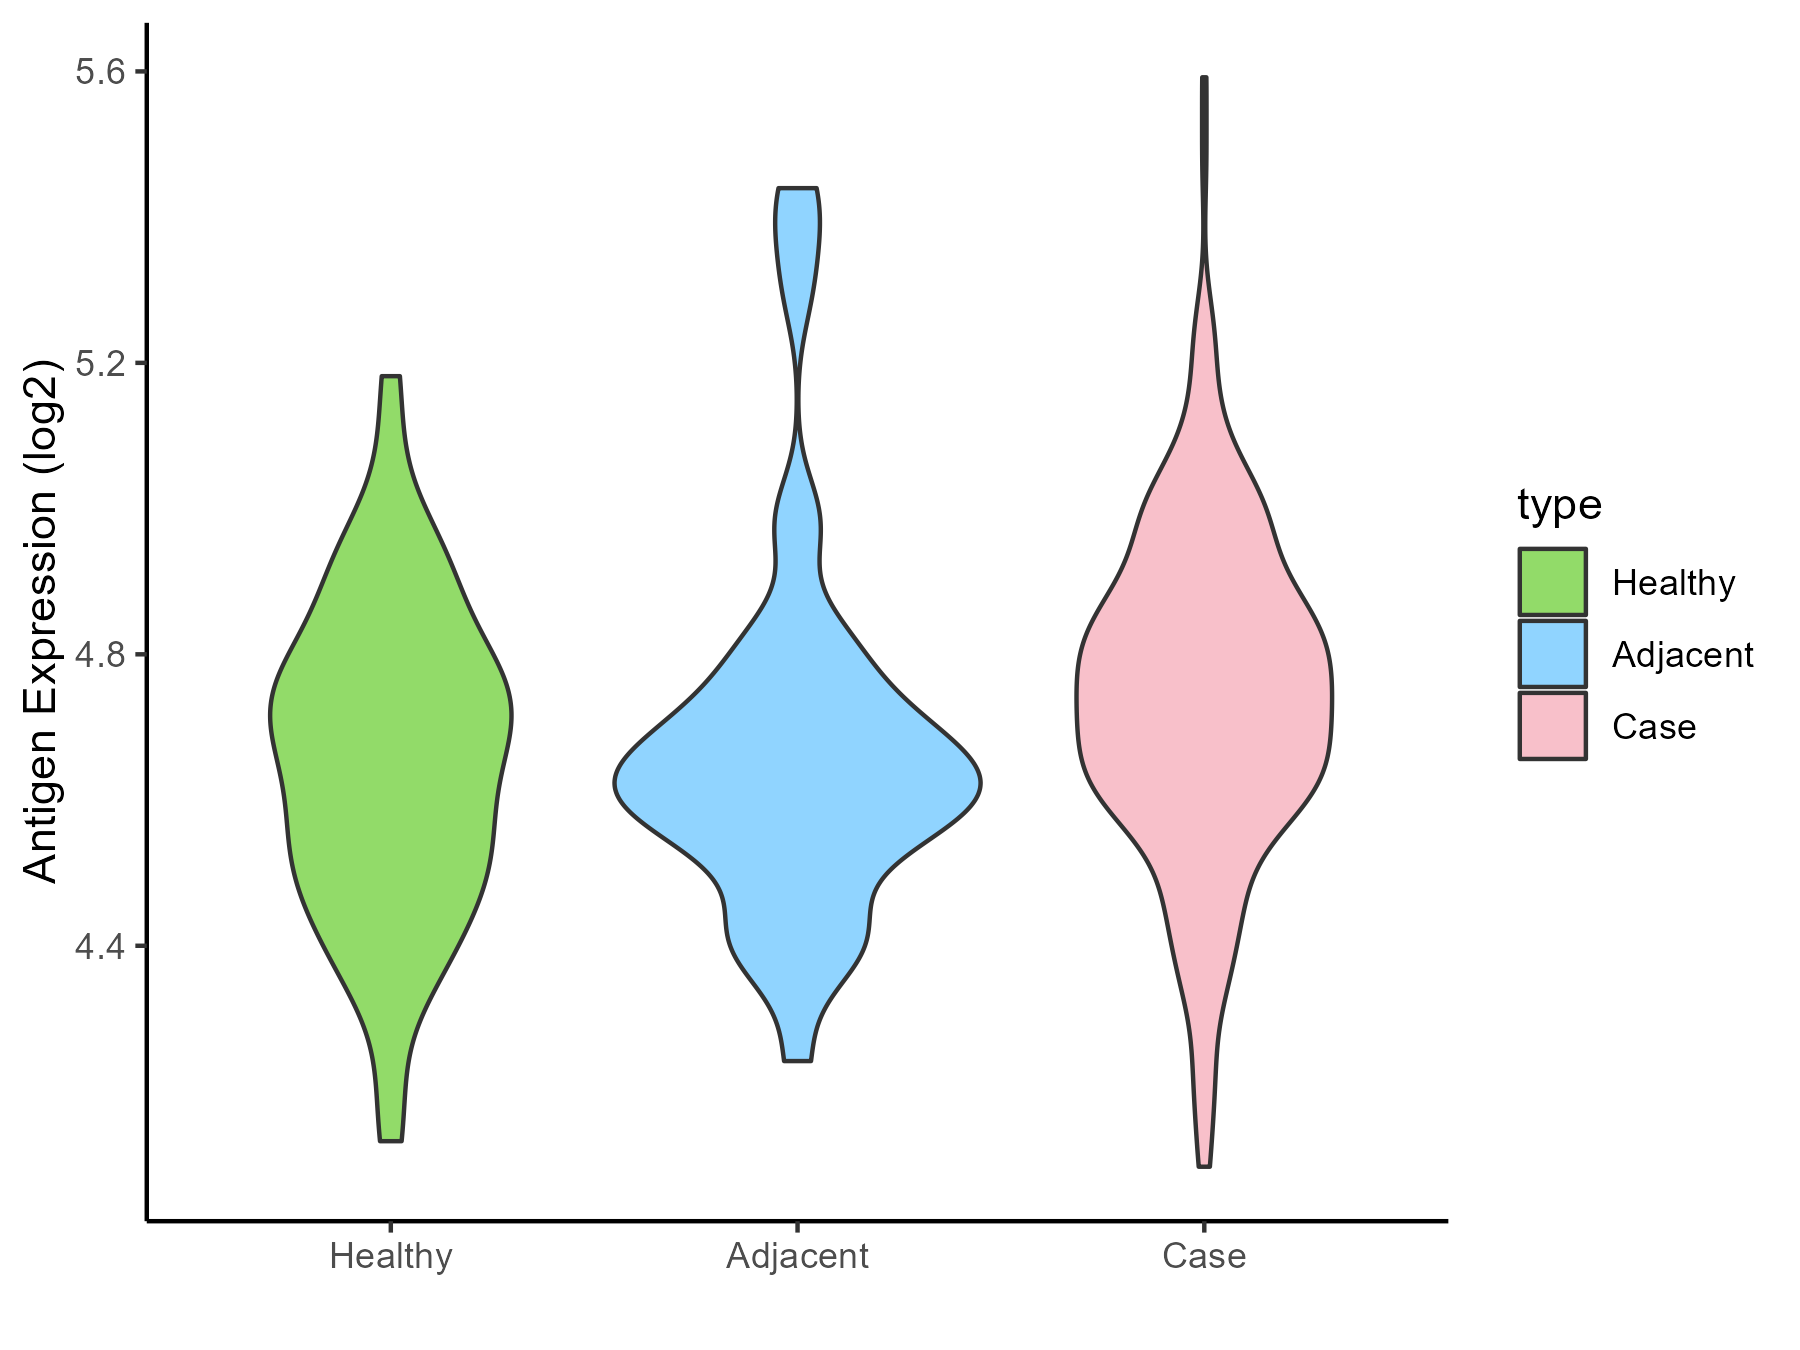
| The Expression Level of Disease Section Compare with the Healthy Individual Tissue | p-value: 0.032162447; Fold-change: -0.191004657; Z-score: -0.863191043 | |
| The Expression Level of Disease Section Compare with the Adjacent Tissue | p-value: 9.44E-05; Fold-change: -0.245019937; Z-score: -0.731956798 | |
| Disease-specific Antigen Abundances |
|
Click to View the Clearer Original Diagram |
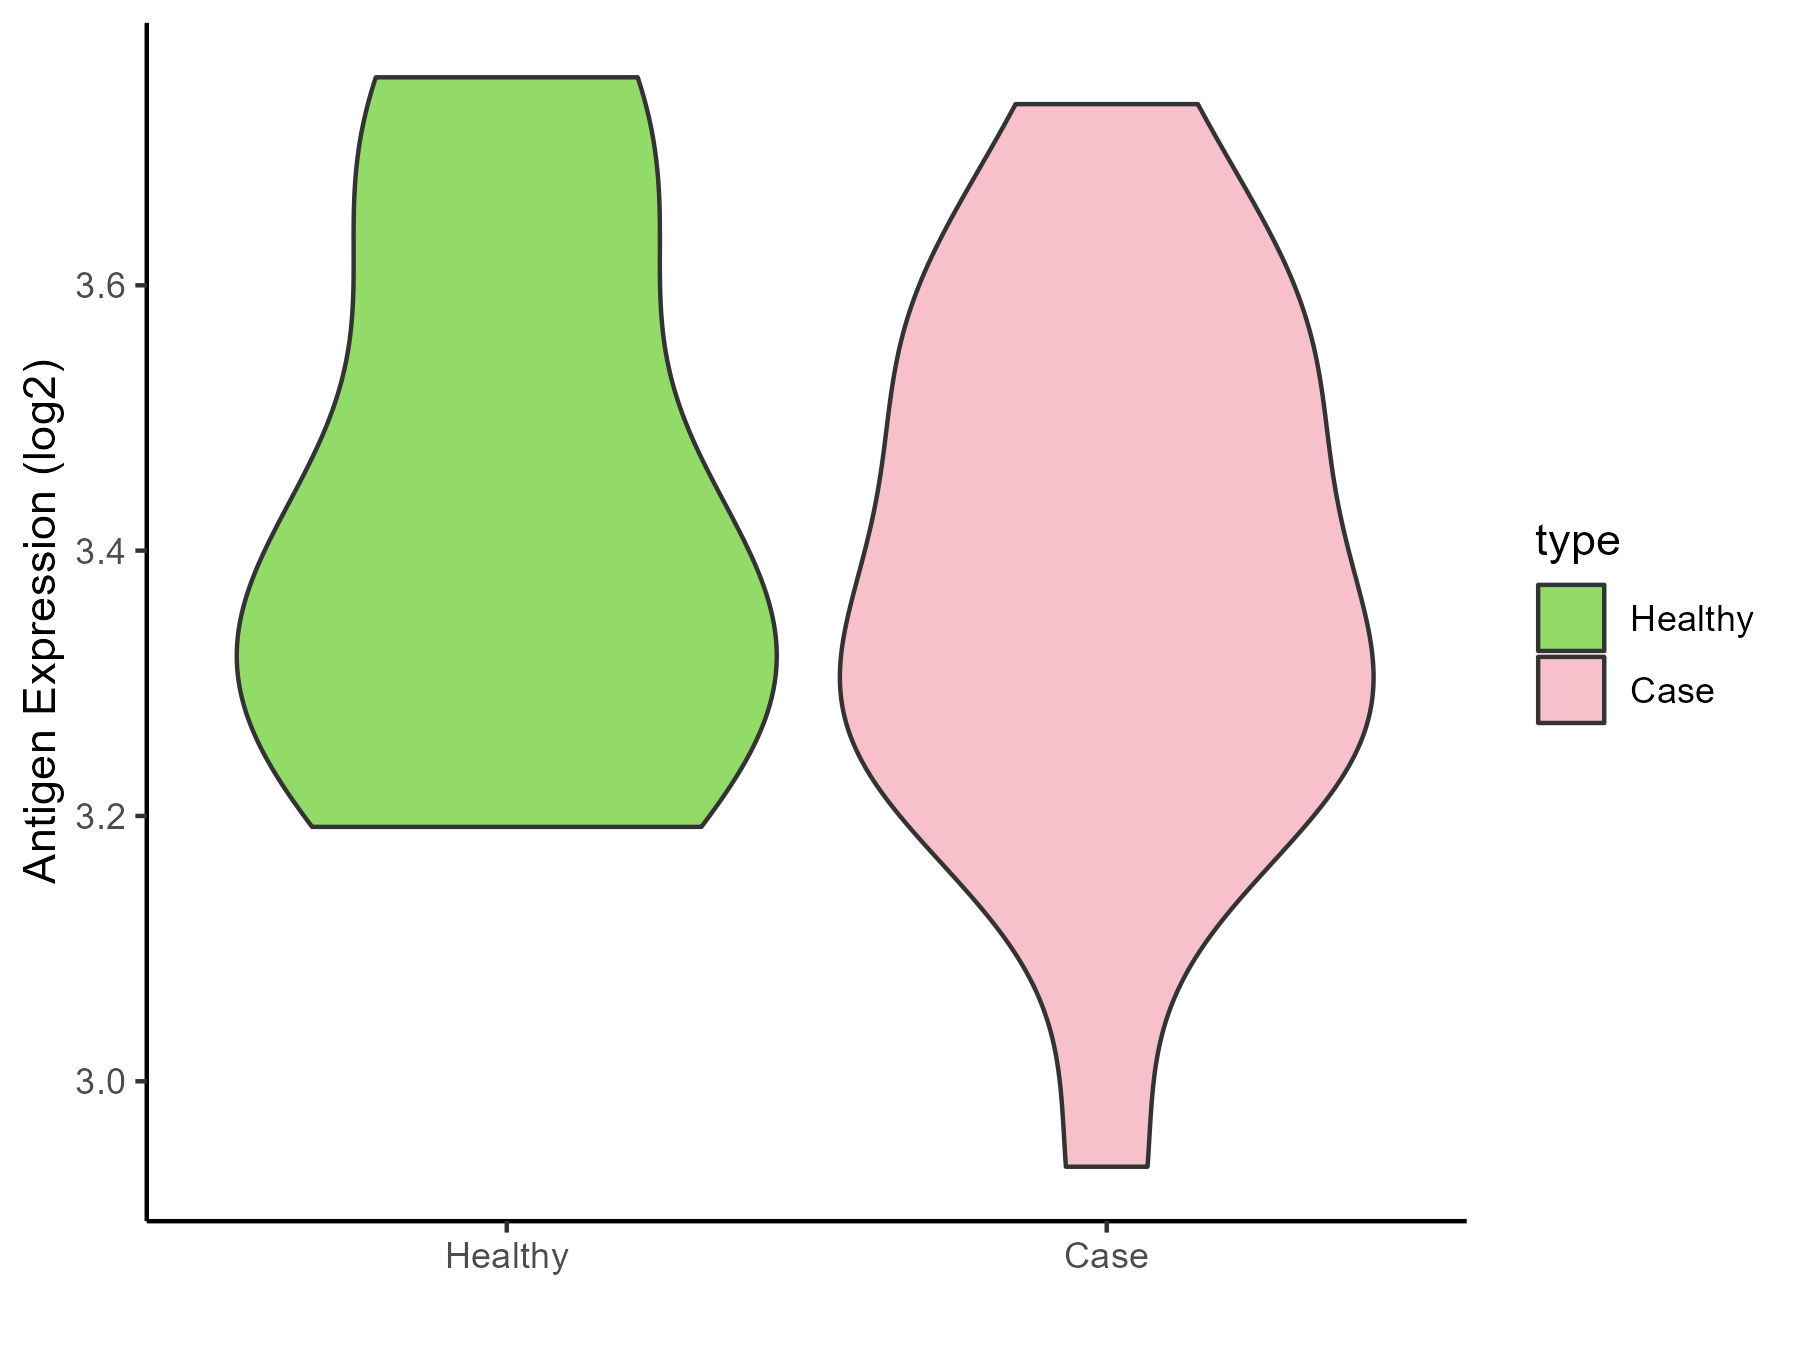
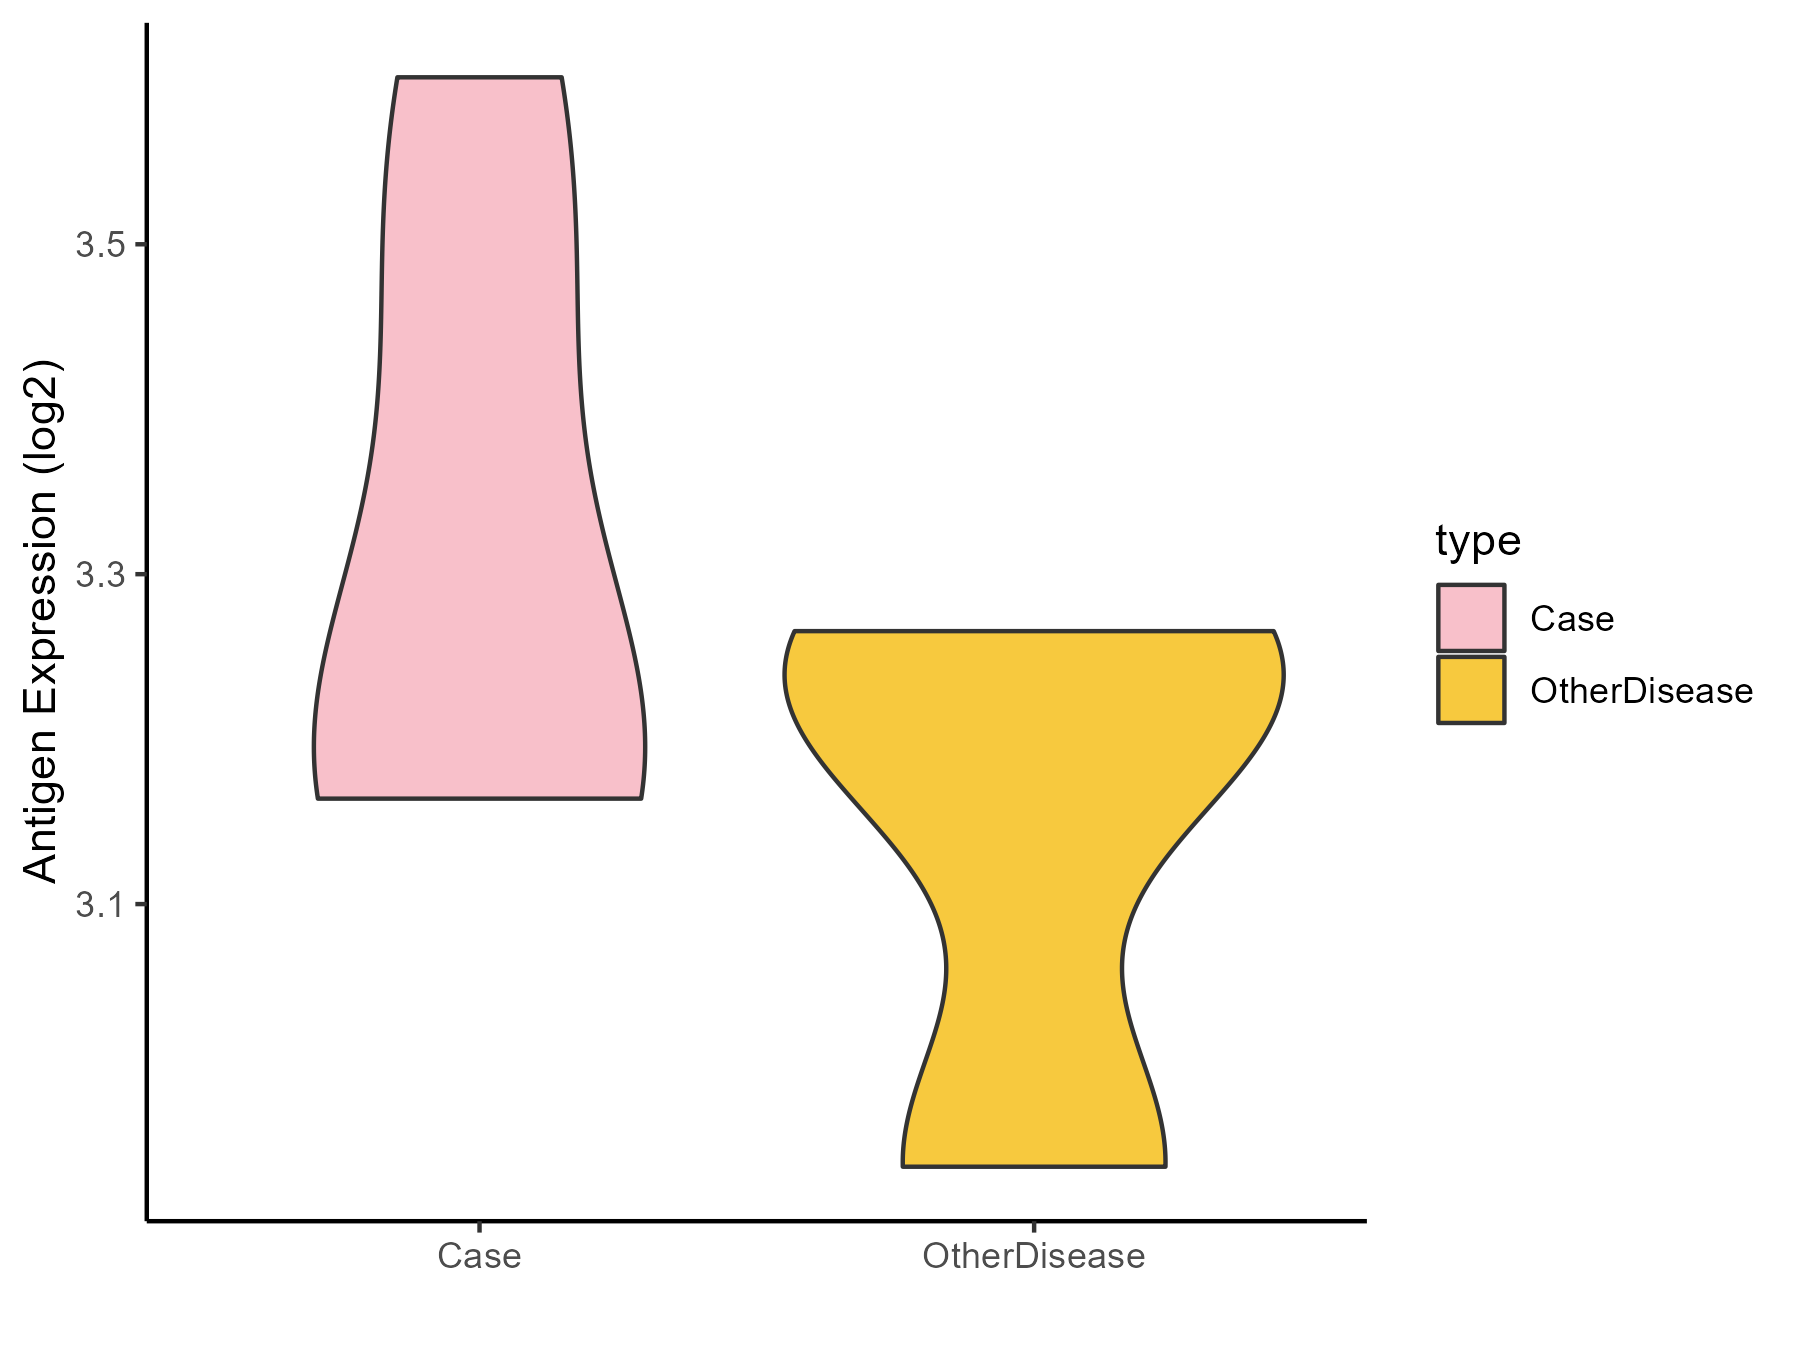
| Differential expression pattern of antigen in diseases | ||
| The Studied Tissue | Liver | |
| The Specific Disease | Liver cancer | |
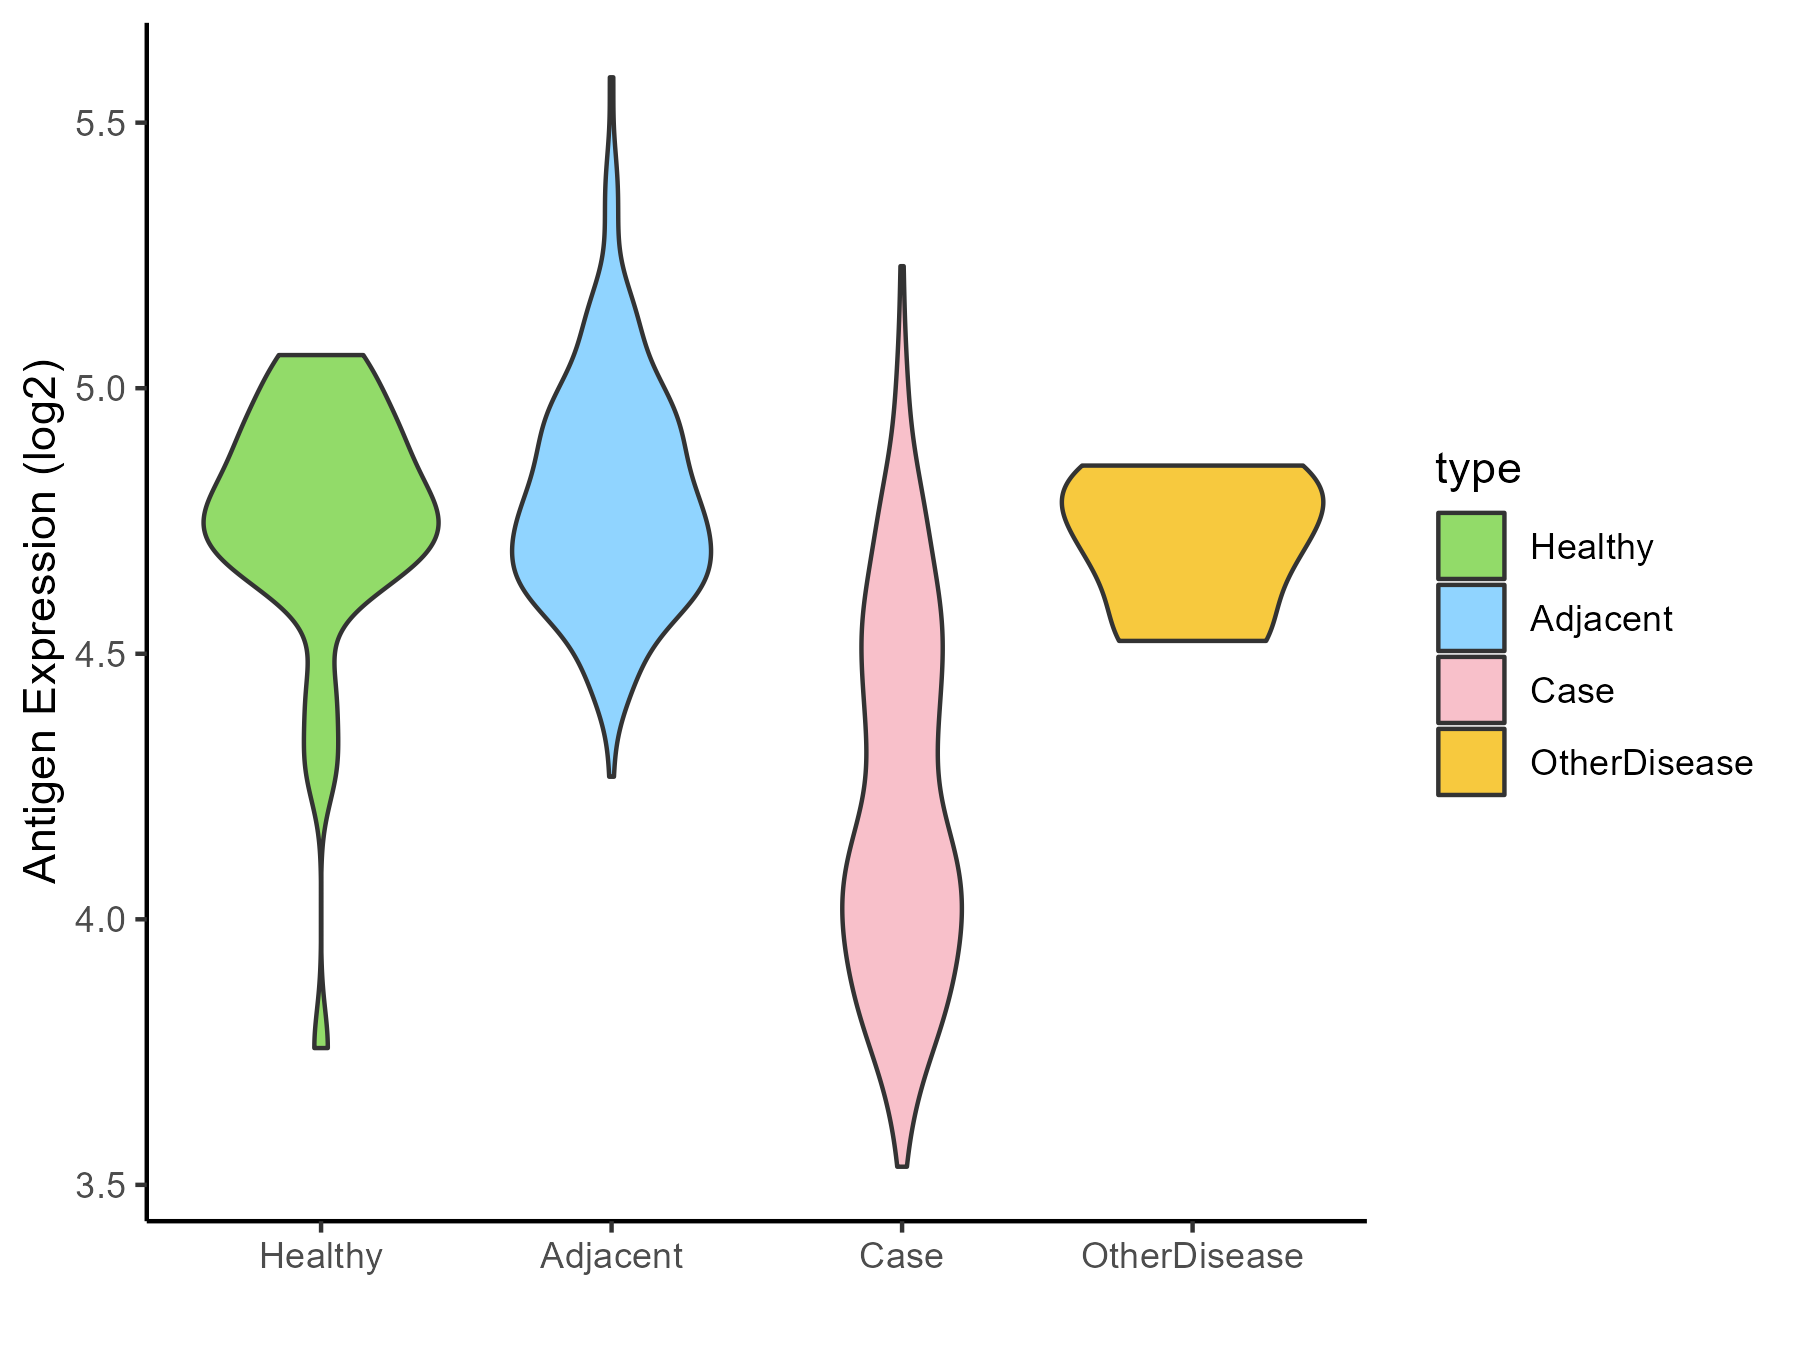
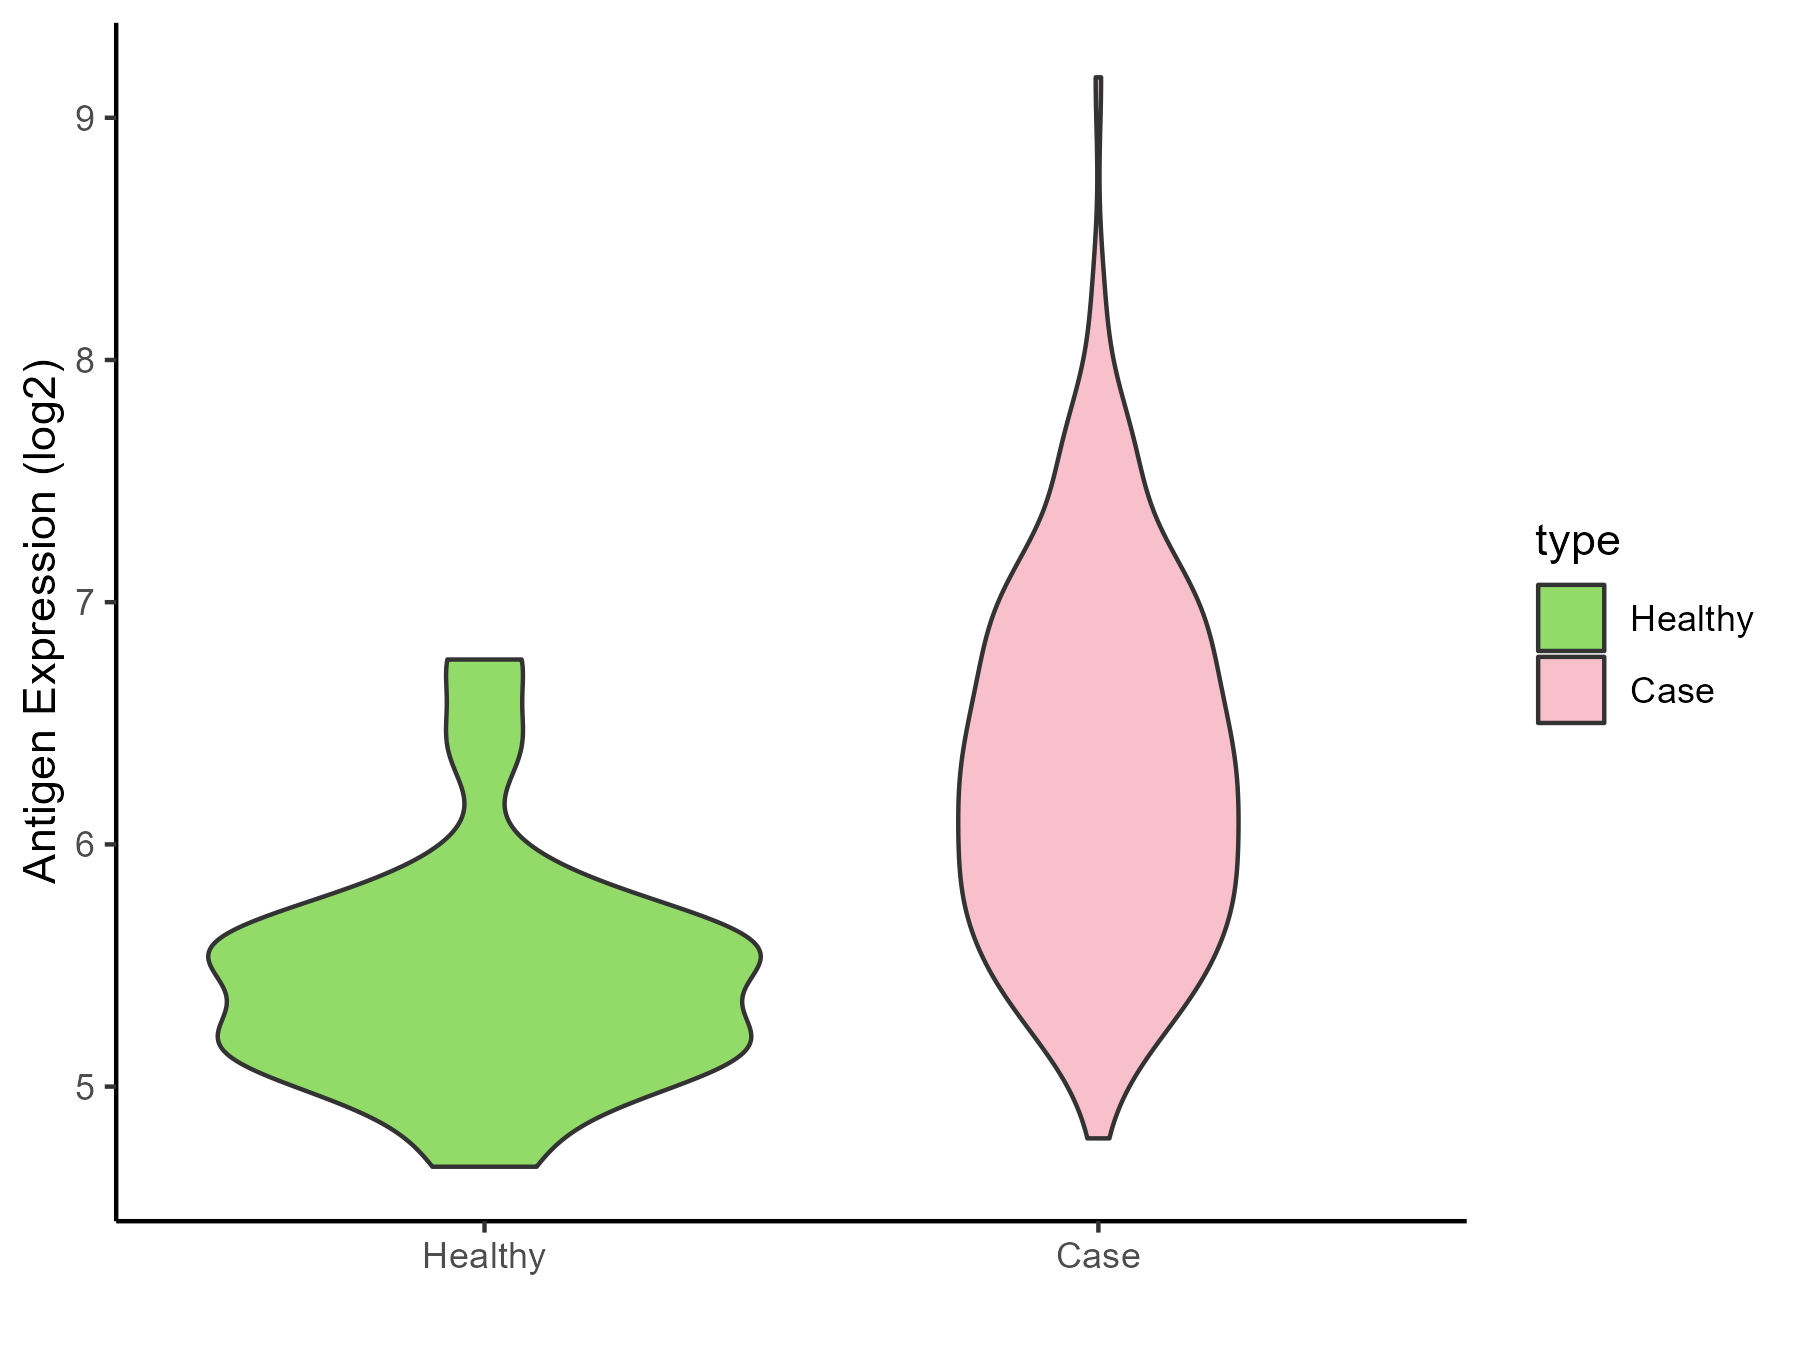
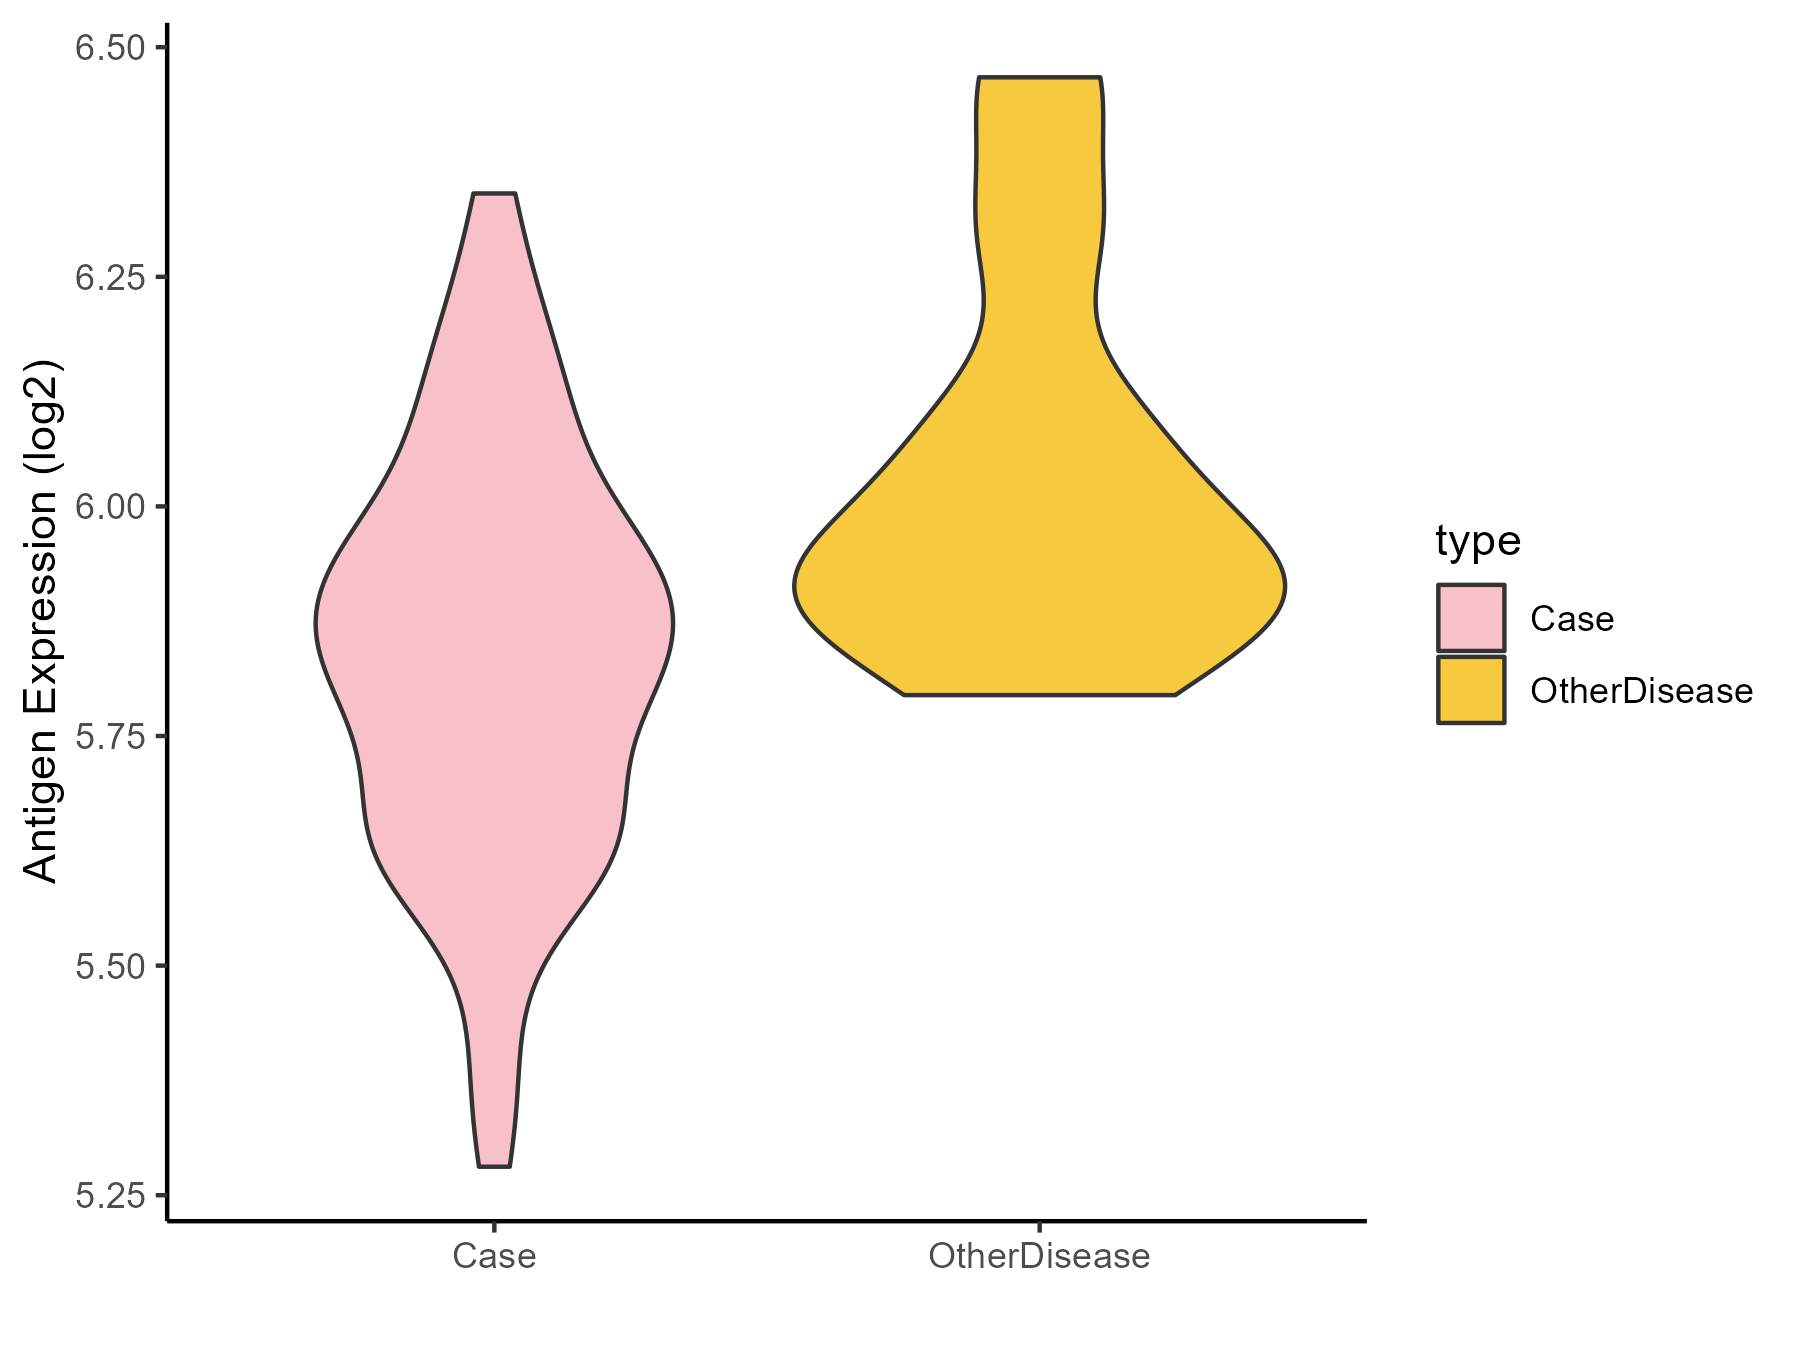
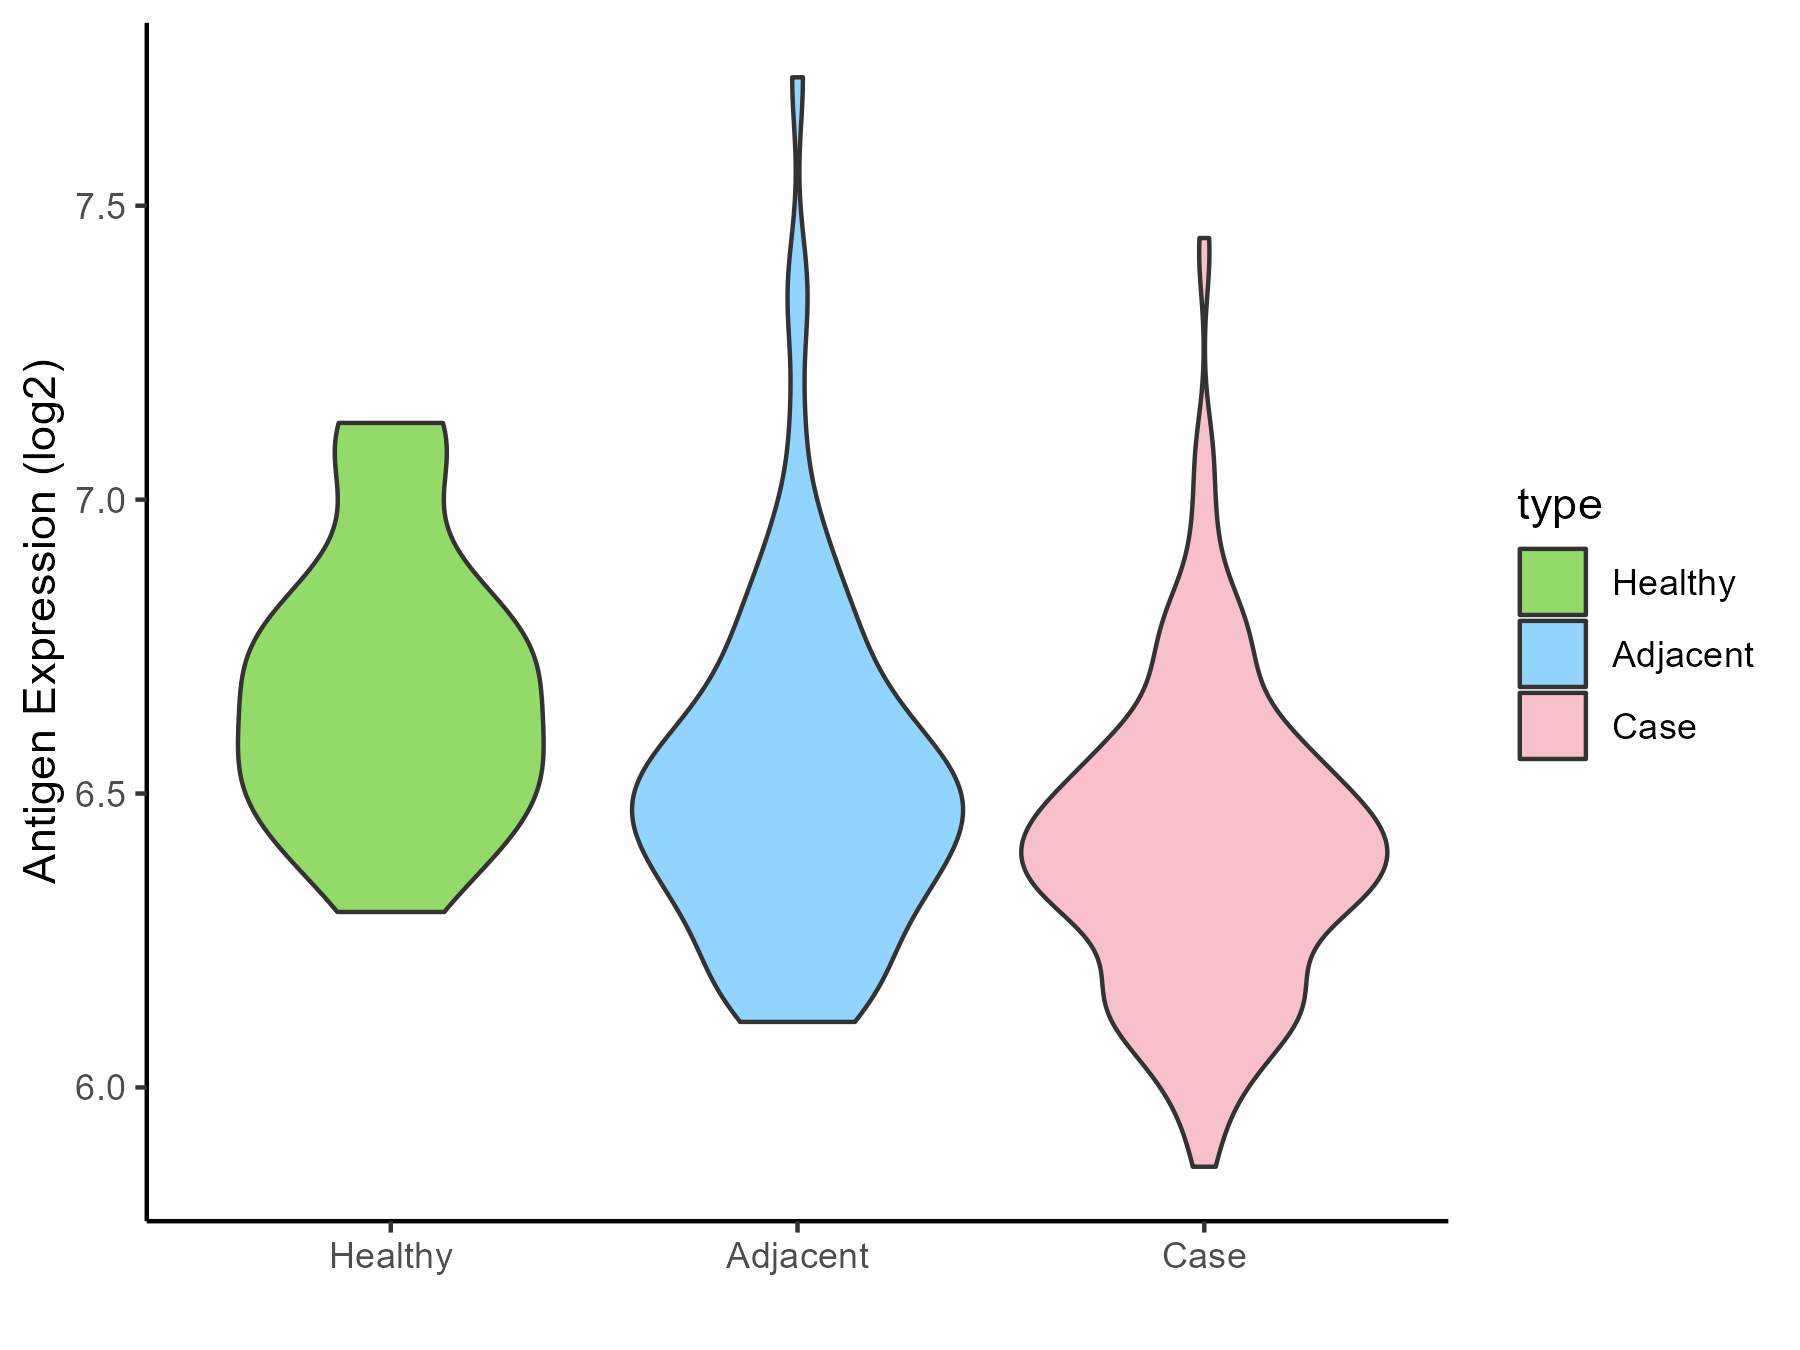
| The Expression Level of Disease Section Compare with the Healthy Individual Tissue | p-value: 1.87E-18; Fold-change: -0.608712001; Z-score: -2.505996726 | |
| The Expression Level of Disease Section Compare with the Adjacent Tissue | p-value: 4.06E-88; Fold-change: -0.610862193; Z-score: -2.858492514 | |
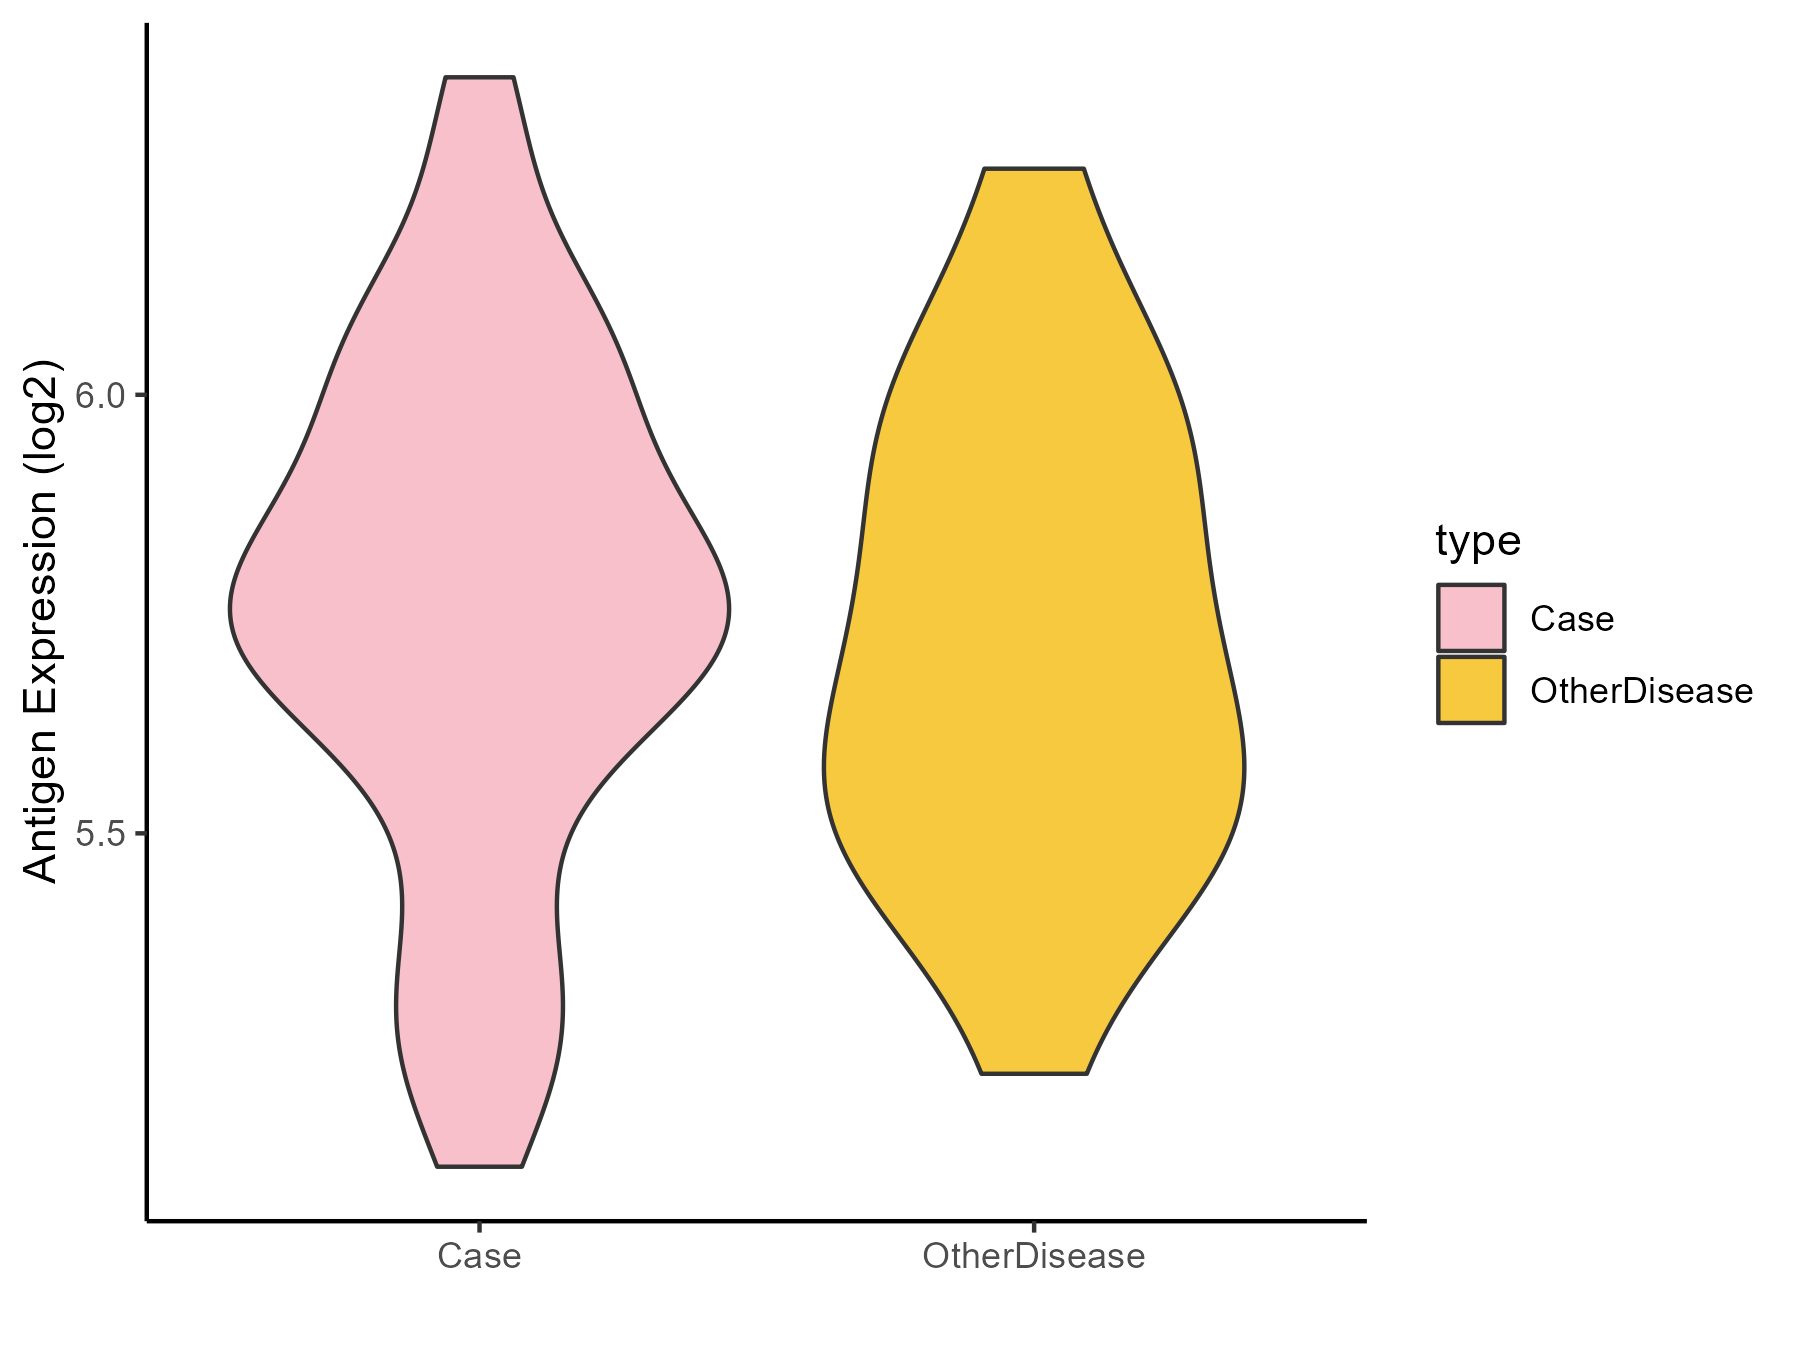
| The Expression Level of Disease Section Compare with the Other Disease Section | p-value: 0.00528615; Fold-change: -0.570033126; Z-score: -3.96108538 | |
| Disease-specific Antigen Abundances |
|
Click to View the Clearer Original Diagram |
| Differential expression pattern of antigen in diseases | ||
| The Studied Tissue | Lung | |
| The Specific Disease | Lung cancer | |
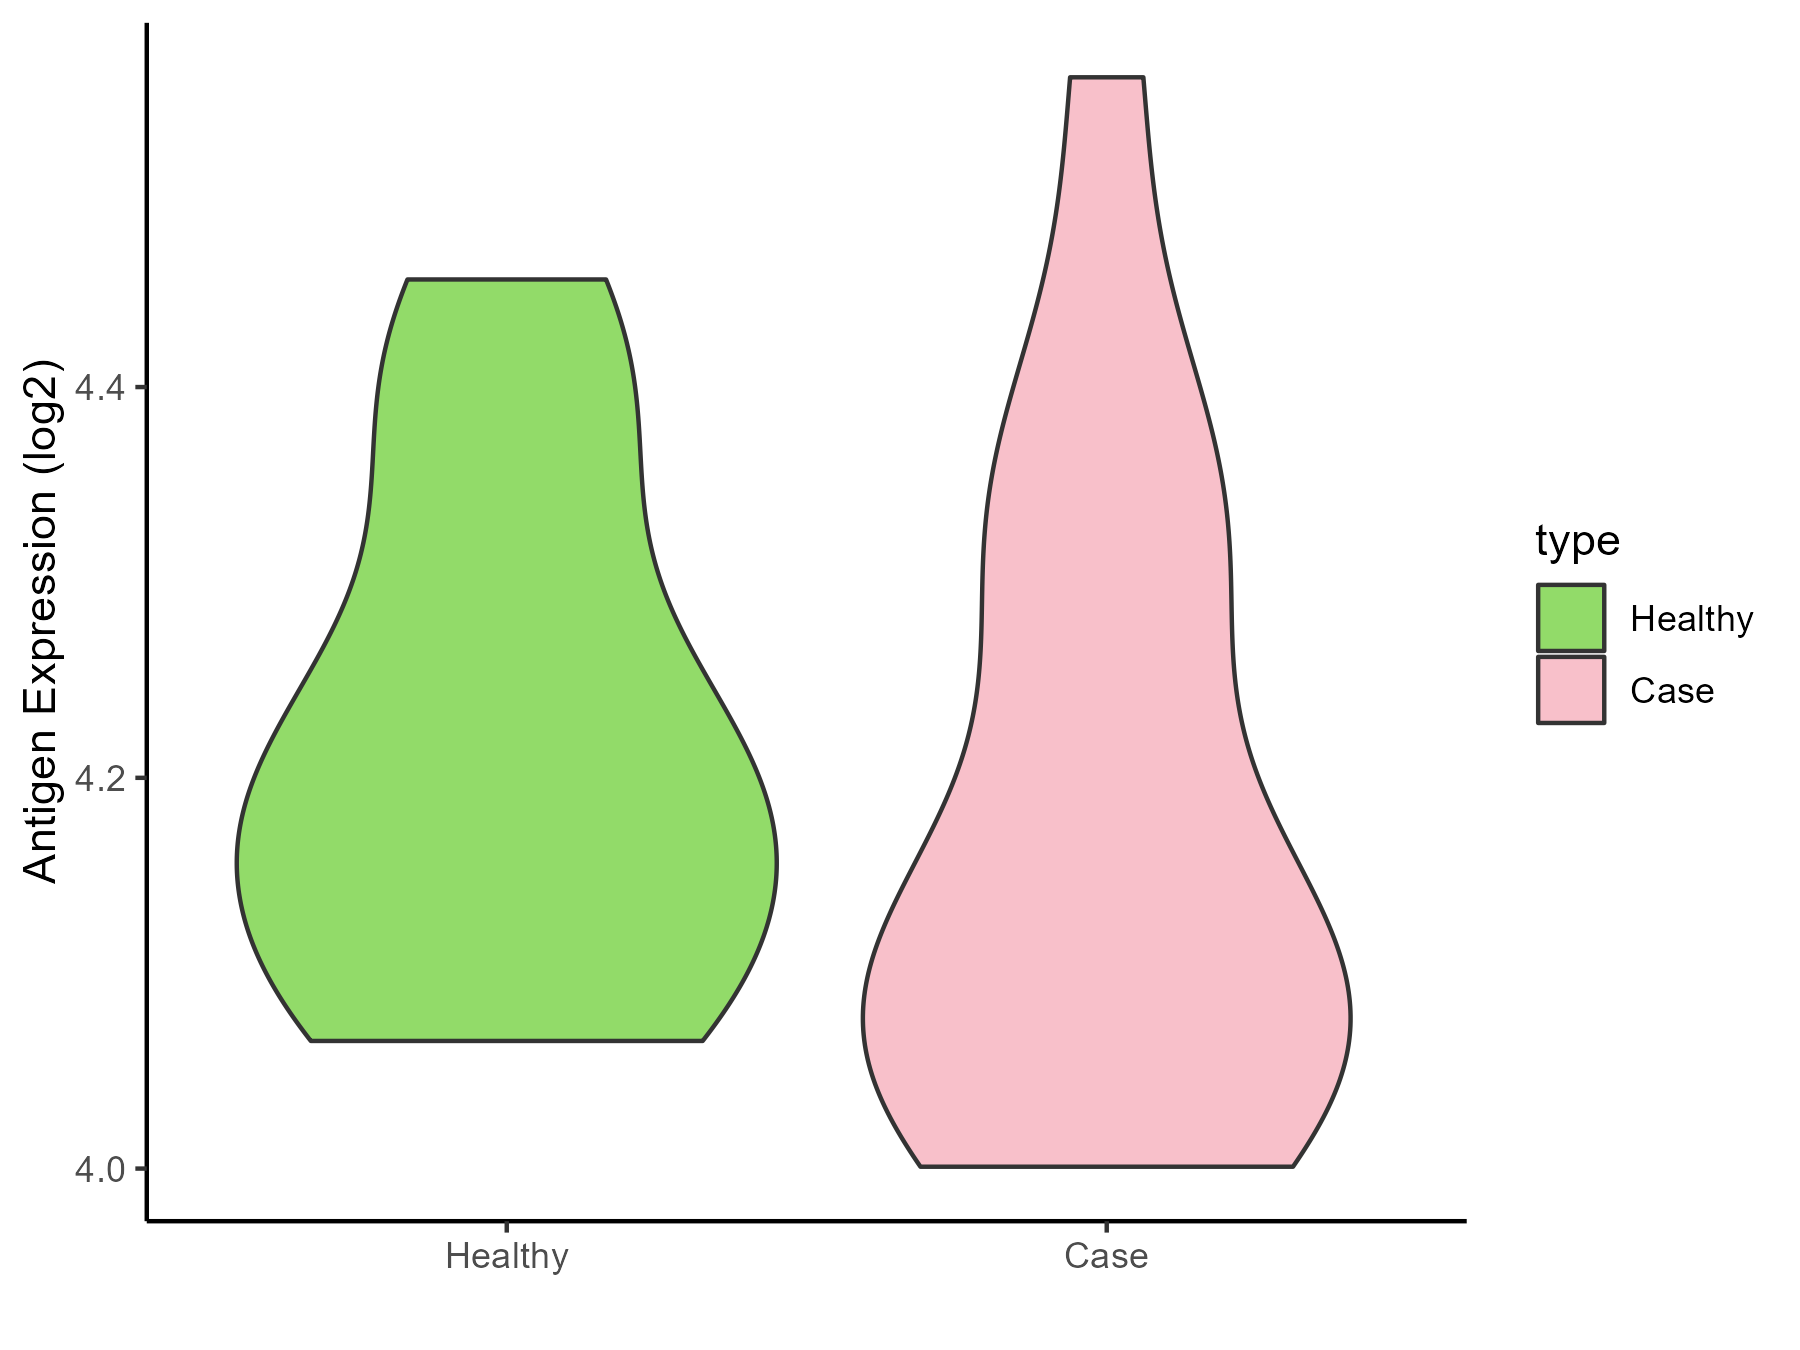
| The Expression Level of Disease Section Compare with the Healthy Individual Tissue | p-value: 0.00055185; Fold-change: 0.060675065; Z-score: 0.31092763 | |
| The Expression Level of Disease Section Compare with the Adjacent Tissue | p-value: 0.904195475; Fold-change: -0.00021585; Z-score: -0.000945757 | |
| Disease-specific Antigen Abundances |
|
Click to View the Clearer Original Diagram |
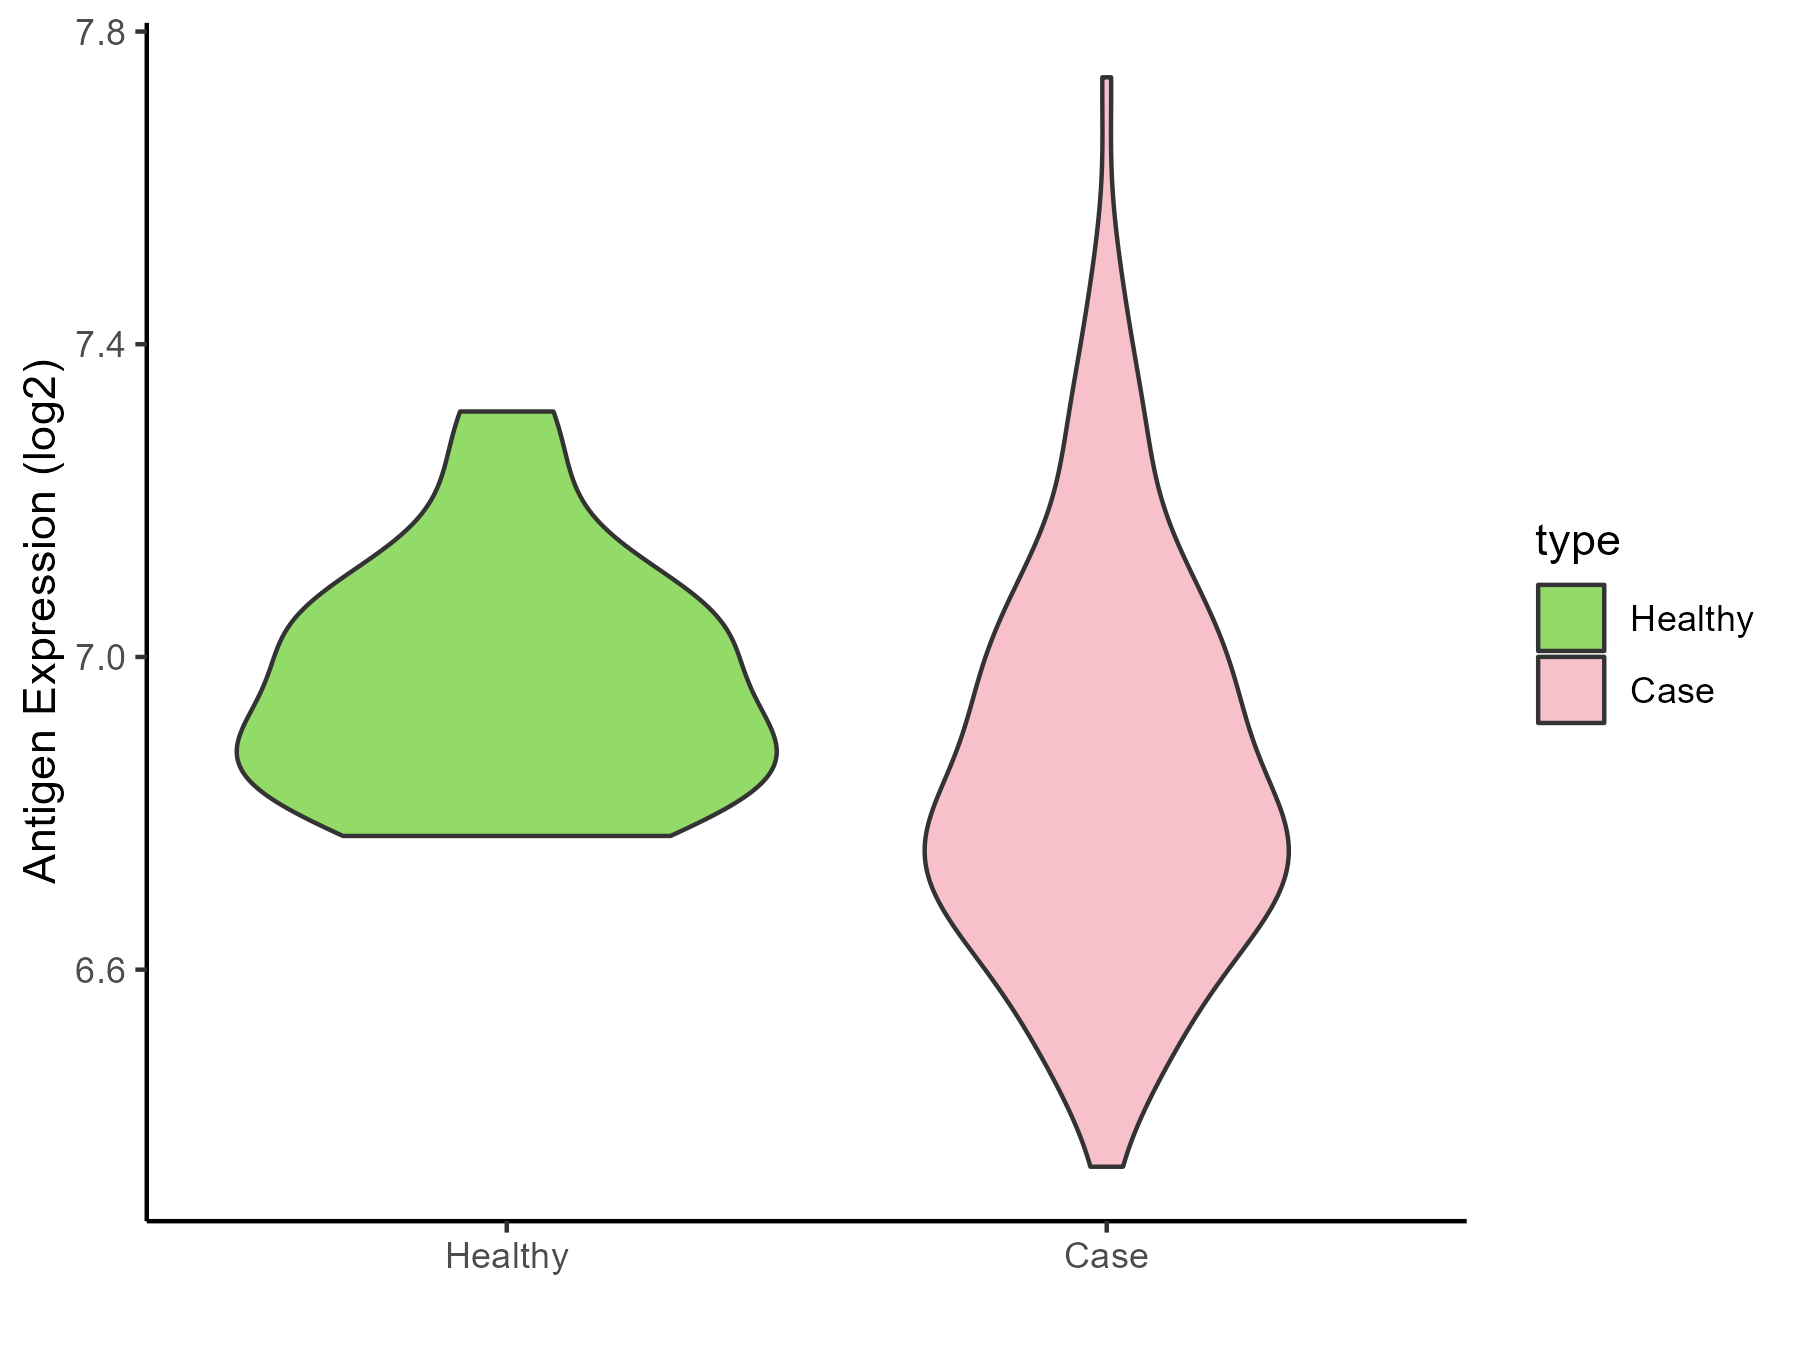
| Differential expression pattern of antigen in diseases | ||
| The Studied Tissue | Skin | |
| The Specific Disease | Melanoma | |
| The Expression Level of Disease Section Compare with the Healthy Individual Tissue | p-value: 0.00155708; Fold-change: -0.400040853; Z-score: -0.820529974 | |
| Disease-specific Antigen Abundances |
|
Click to View the Clearer Original Diagram |
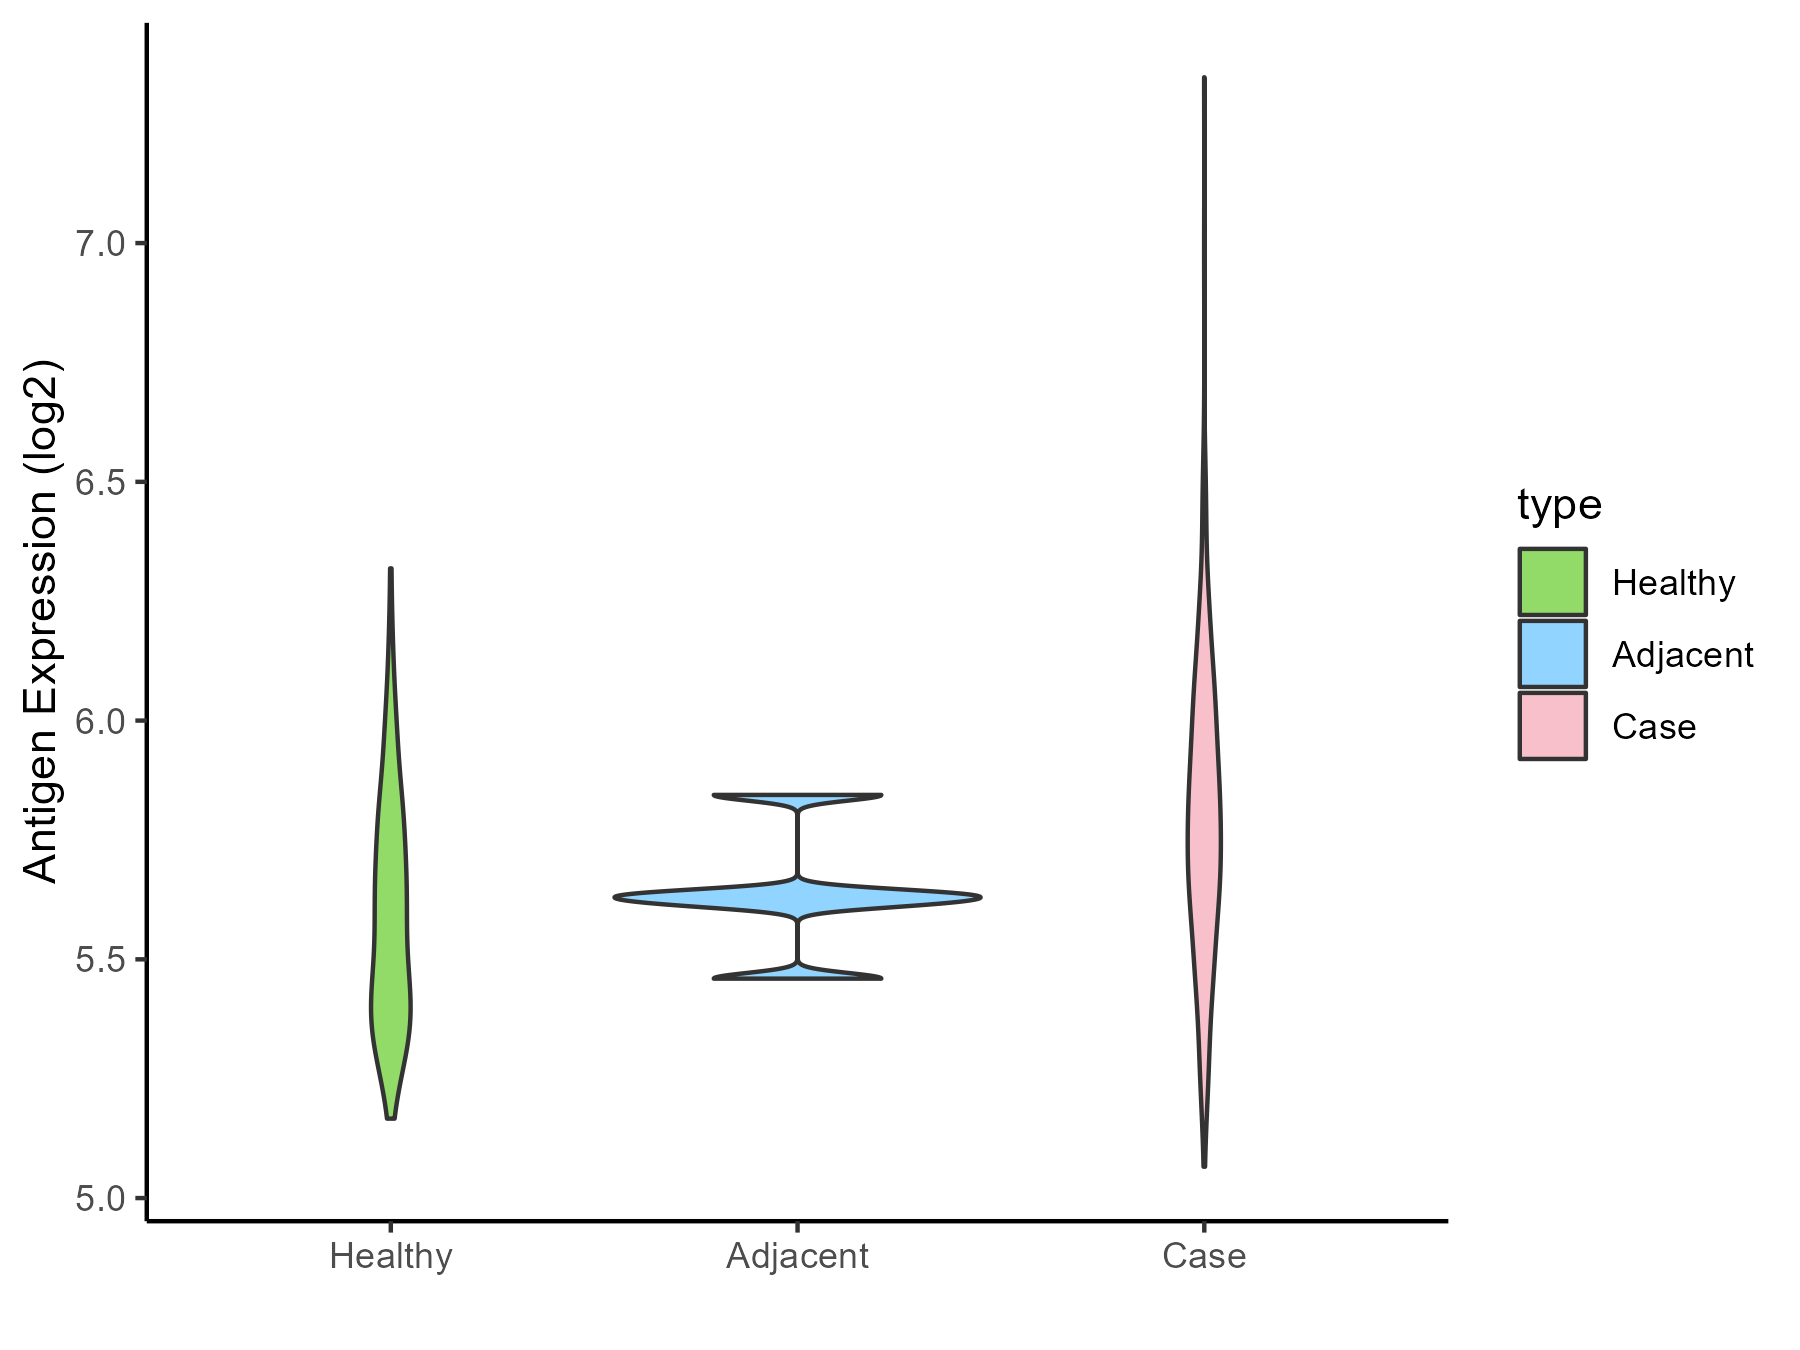
| Differential expression pattern of antigen in diseases | ||
| The Studied Tissue | Muscle | |
| The Specific Disease | Sarcoma | |
| The Expression Level of Disease Section Compare with the Healthy Individual Tissue | p-value: 0.000261883; Fold-change: 0.058912068; Z-score: 0.261989945 | |
| The Expression Level of Disease Section Compare with the Adjacent Tissue | p-value: 0.566217999; Fold-change: -0.033960636; Z-score: -0.278110988 | |
| Disease-specific Antigen Abundances |
|
Click to View the Clearer Original Diagram |
| Differential expression pattern of antigen in diseases | ||
| The Studied Tissue | Breast | |
| The Specific Disease | Breast cancer | |
| The Expression Level of Disease Section Compare with the Healthy Individual Tissue | p-value: 0.848801339; Fold-change: 0.01049881; Z-score: 0.041504994 | |
| The Expression Level of Disease Section Compare with the Adjacent Tissue | p-value: 0.430283007; Fold-change: -0.043752942; Z-score: -0.155416008 | |
| Disease-specific Antigen Abundances |
|
Click to View the Clearer Original Diagram |
| Differential expression pattern of antigen in diseases | ||
| The Studied Tissue | Ovarian | |
| The Specific Disease | Ovarian cancer | |
| The Expression Level of Disease Section Compare with the Healthy Individual Tissue | p-value: 0.599278238; Fold-change: 0.03145742; Z-score: 0.093963239 | |
| The Expression Level of Disease Section Compare with the Adjacent Tissue | p-value: 0.000895596; Fold-change: 0.142403641; Z-score: 1.187750535 | |
| Disease-specific Antigen Abundances |
|
Click to View the Clearer Original Diagram |
| Differential expression pattern of antigen in diseases | ||
| The Studied Tissue | Cervical | |
| The Specific Disease | Cervical cancer | |
| The Expression Level of Disease Section Compare with the Healthy Individual Tissue | p-value: 0.01257321; Fold-change: -0.121305273; Z-score: -0.820775723 | |
| Disease-specific Antigen Abundances |
|
Click to View the Clearer Original Diagram |
| Differential expression pattern of antigen in diseases | ||
| The Studied Tissue | Endometrium | |
| The Specific Disease | Uterine cancer | |
| The Expression Level of Disease Section Compare with the Healthy Individual Tissue | p-value: 1.47E-11; Fold-change: 0.197743186; Z-score: 0.81638737 | |
| The Expression Level of Disease Section Compare with the Adjacent Tissue | p-value: 0.063727968; Fold-change: 0.145029655; Z-score: 1.059202896 | |
| Disease-specific Antigen Abundances |
|
Click to View the Clearer Original Diagram |
| Differential expression pattern of antigen in diseases | ||
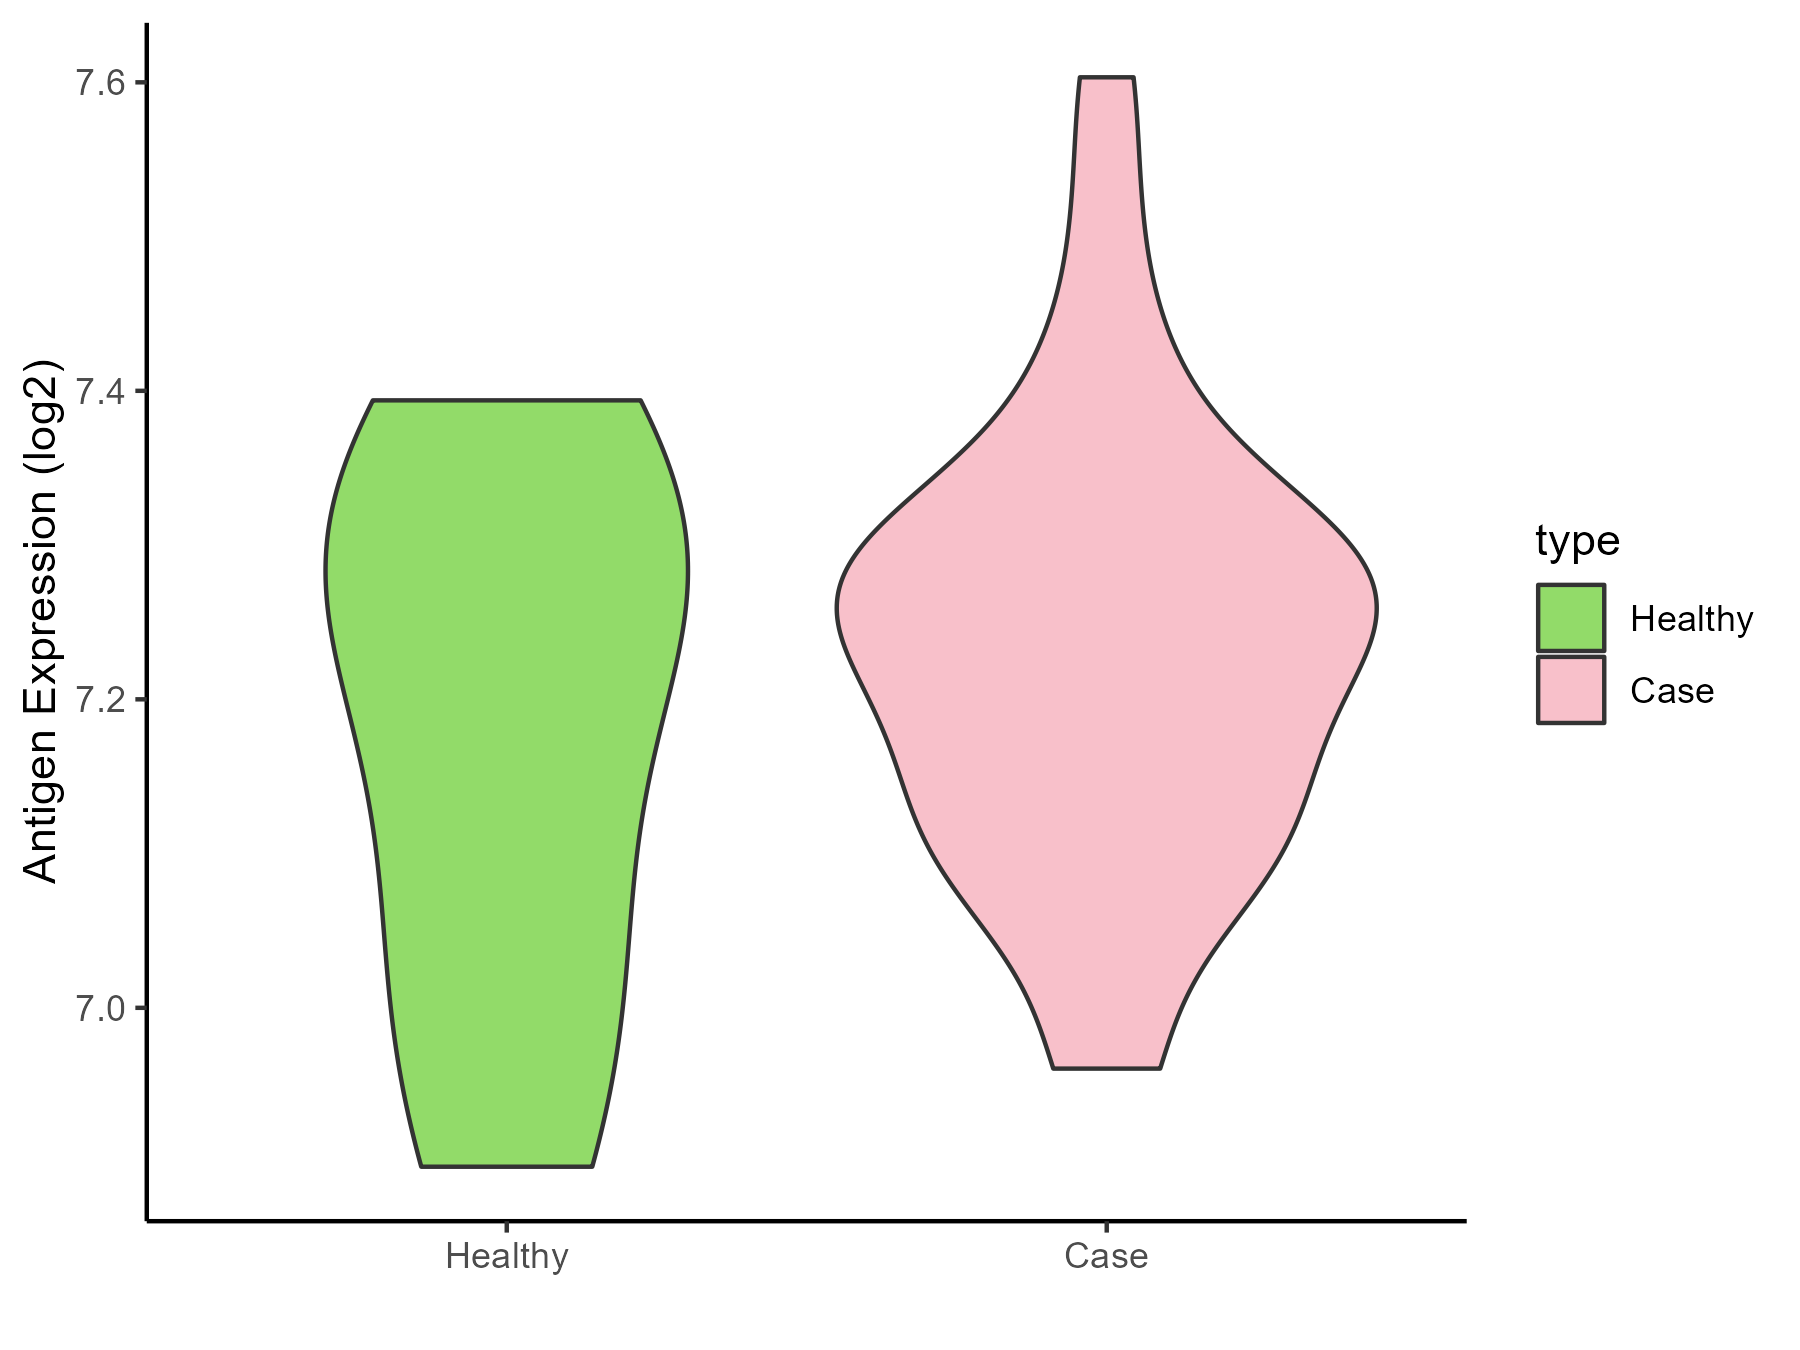
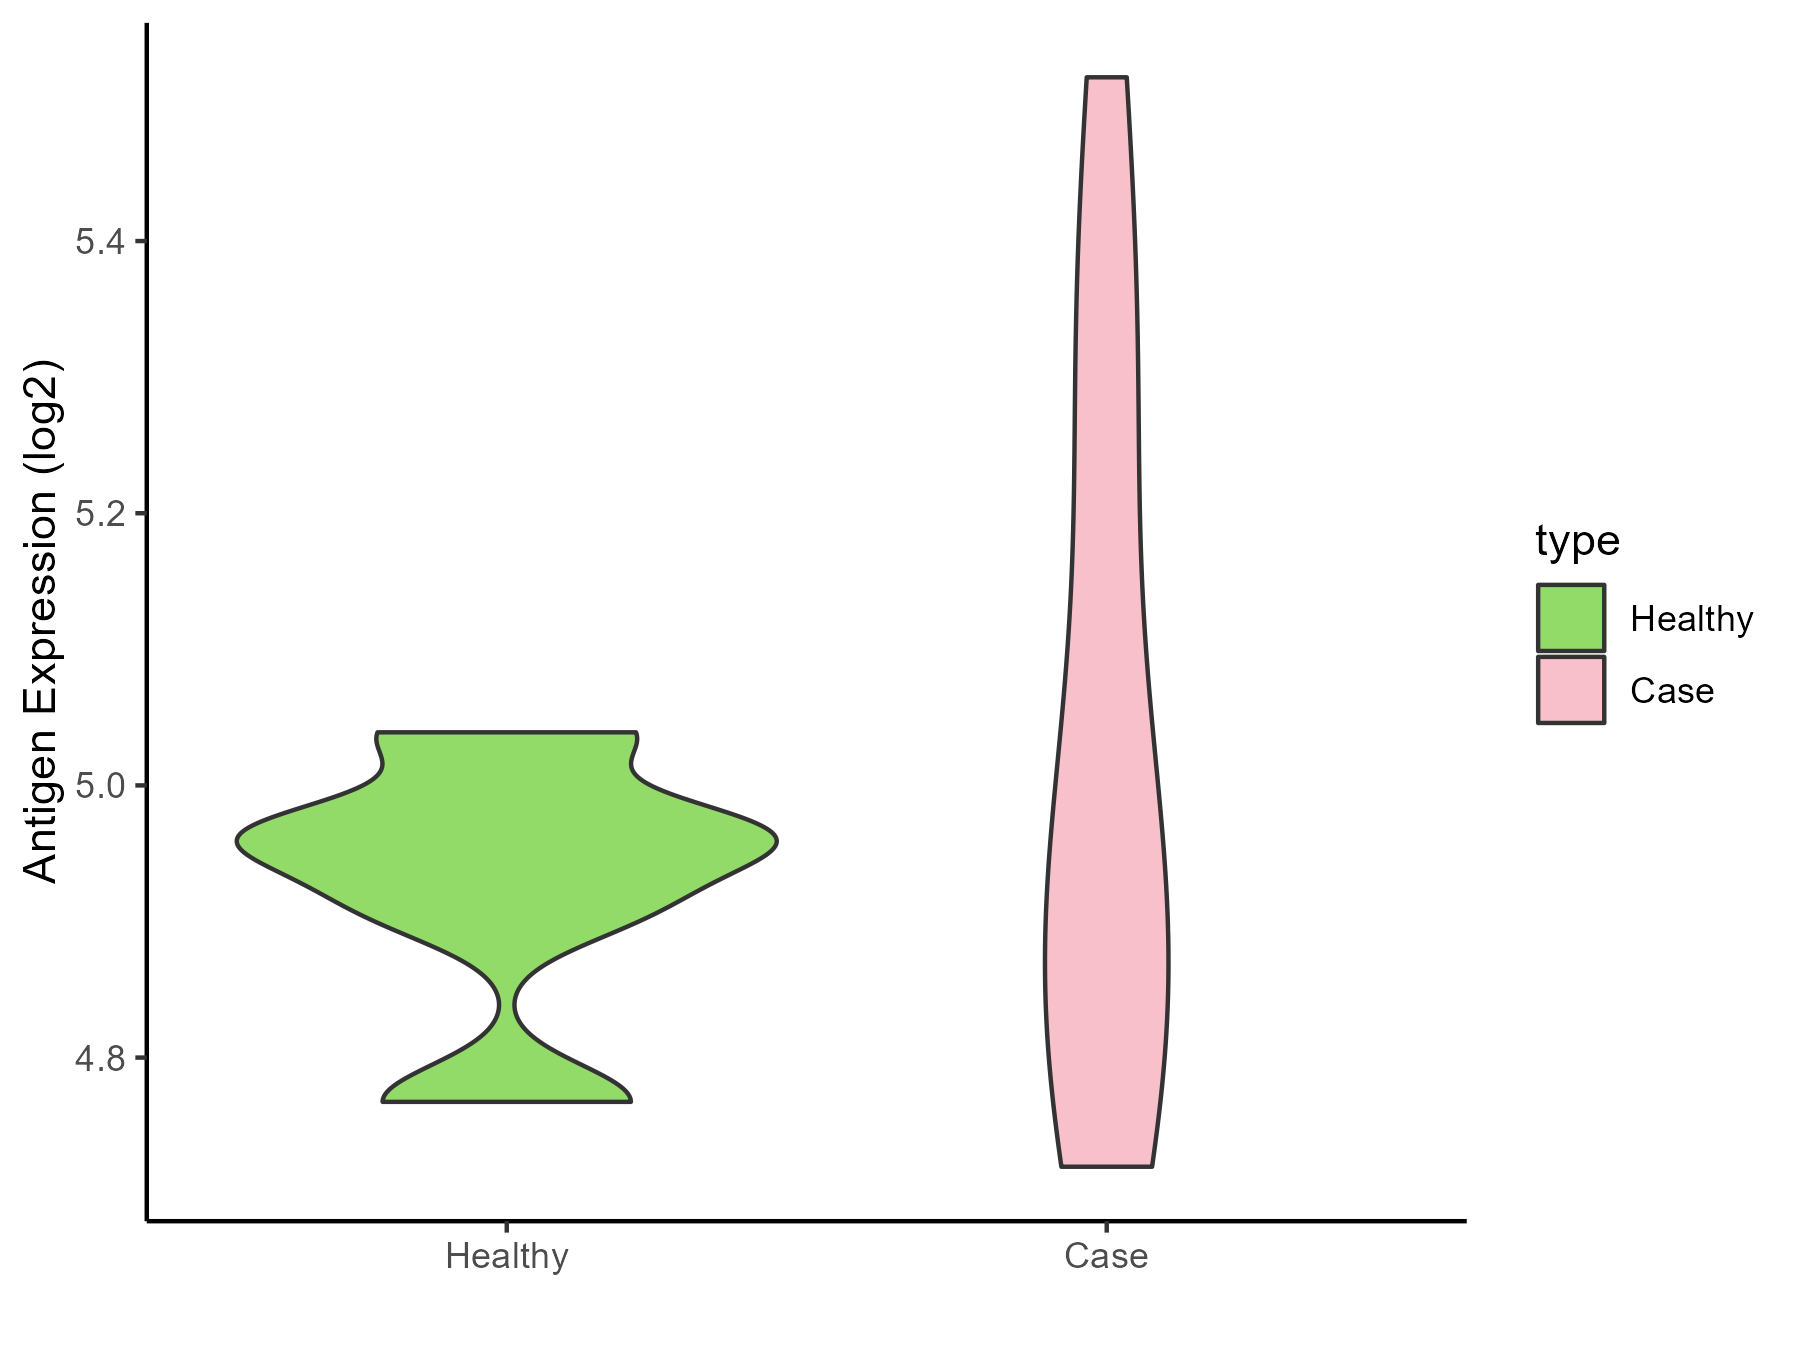
| The Studied Tissue | Prostate | |
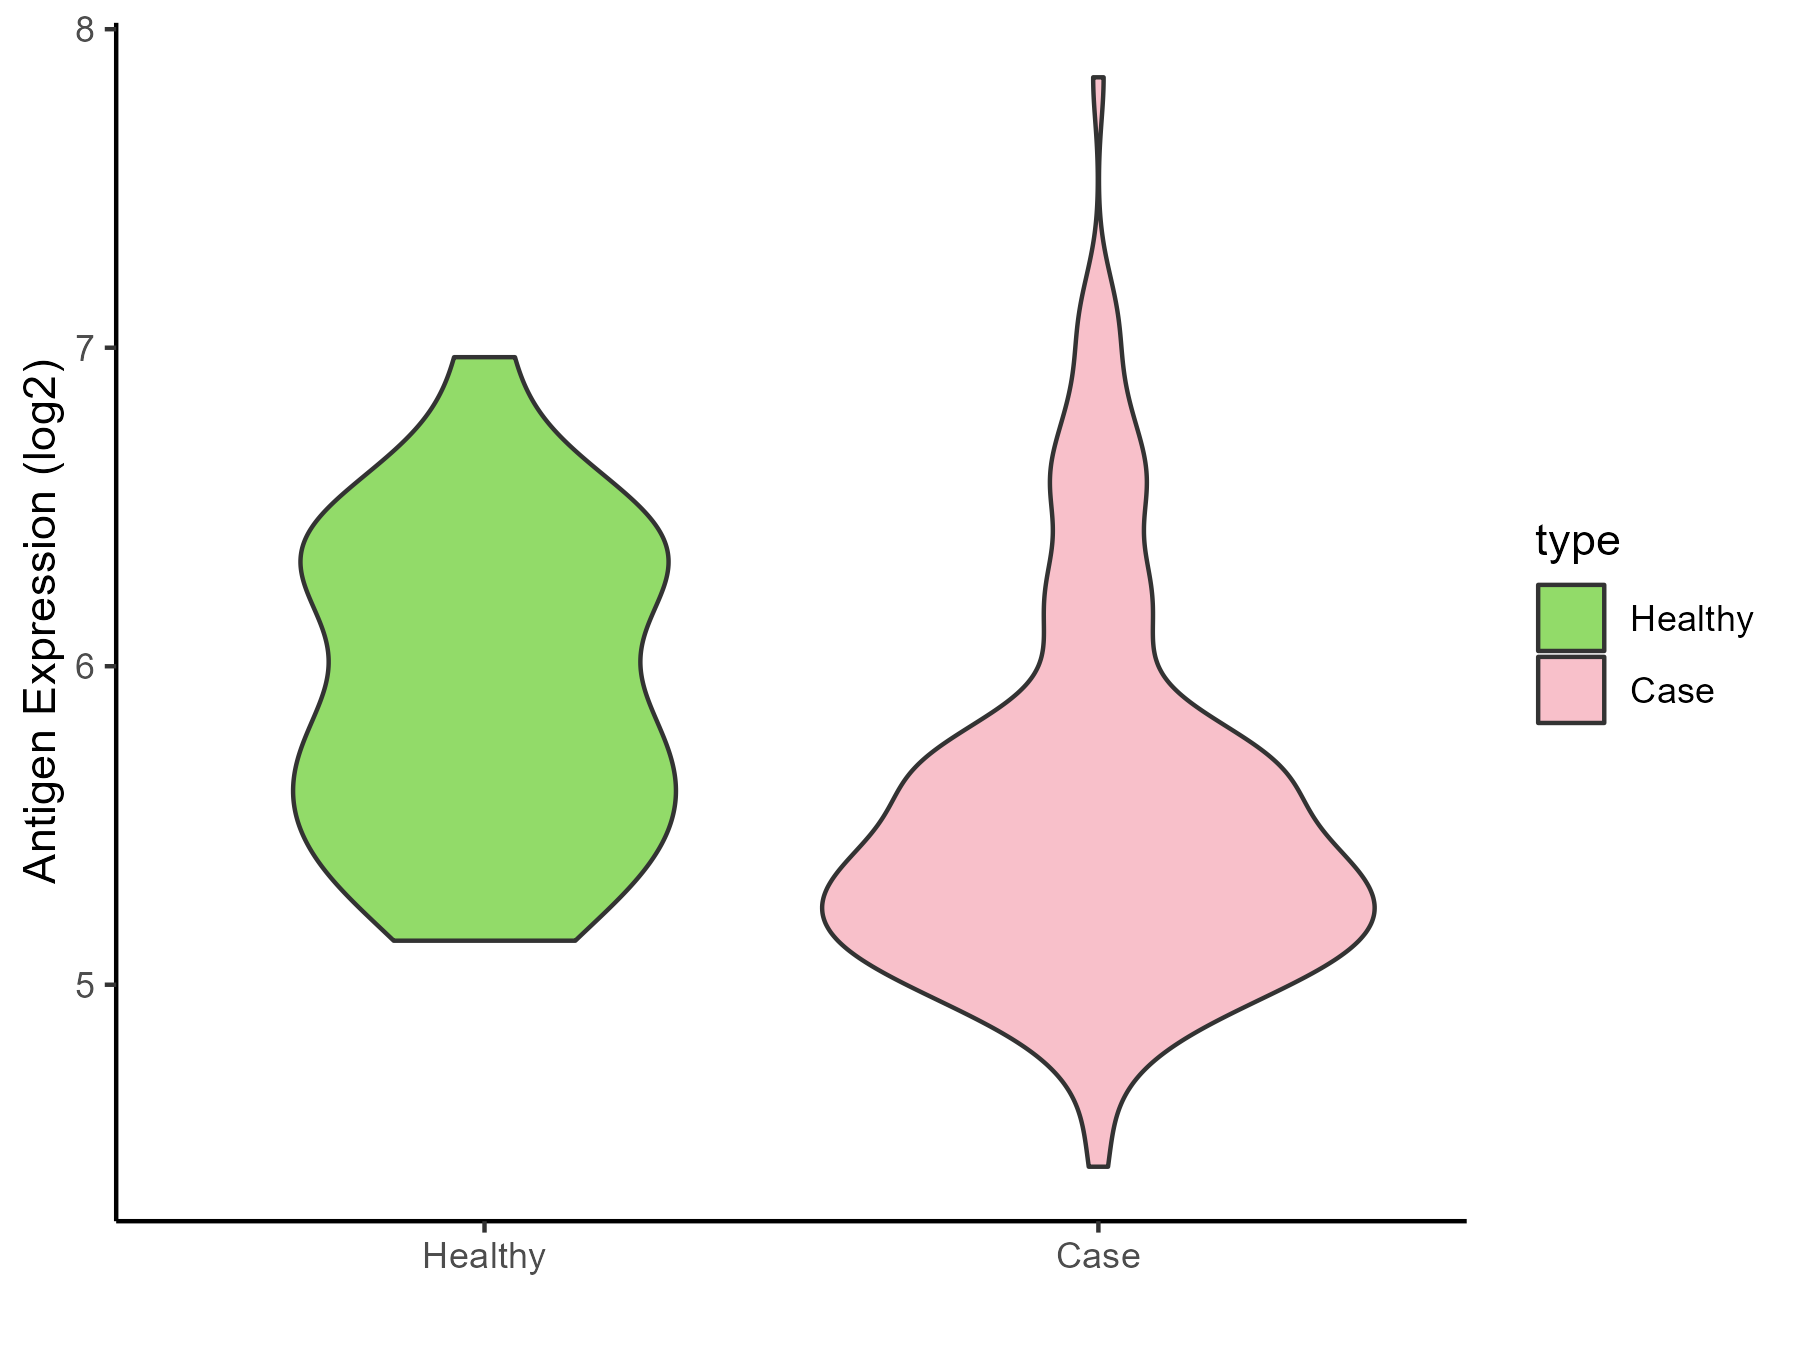
| The Specific Disease | Prostate cancer | |
| The Expression Level of Disease Section Compare with the Healthy Individual Tissue | p-value: 2.22E-08; Fold-change: 0.826805512; Z-score: 1.72169731 | |
| Disease-specific Antigen Abundances |
|
Click to View the Clearer Original Diagram |
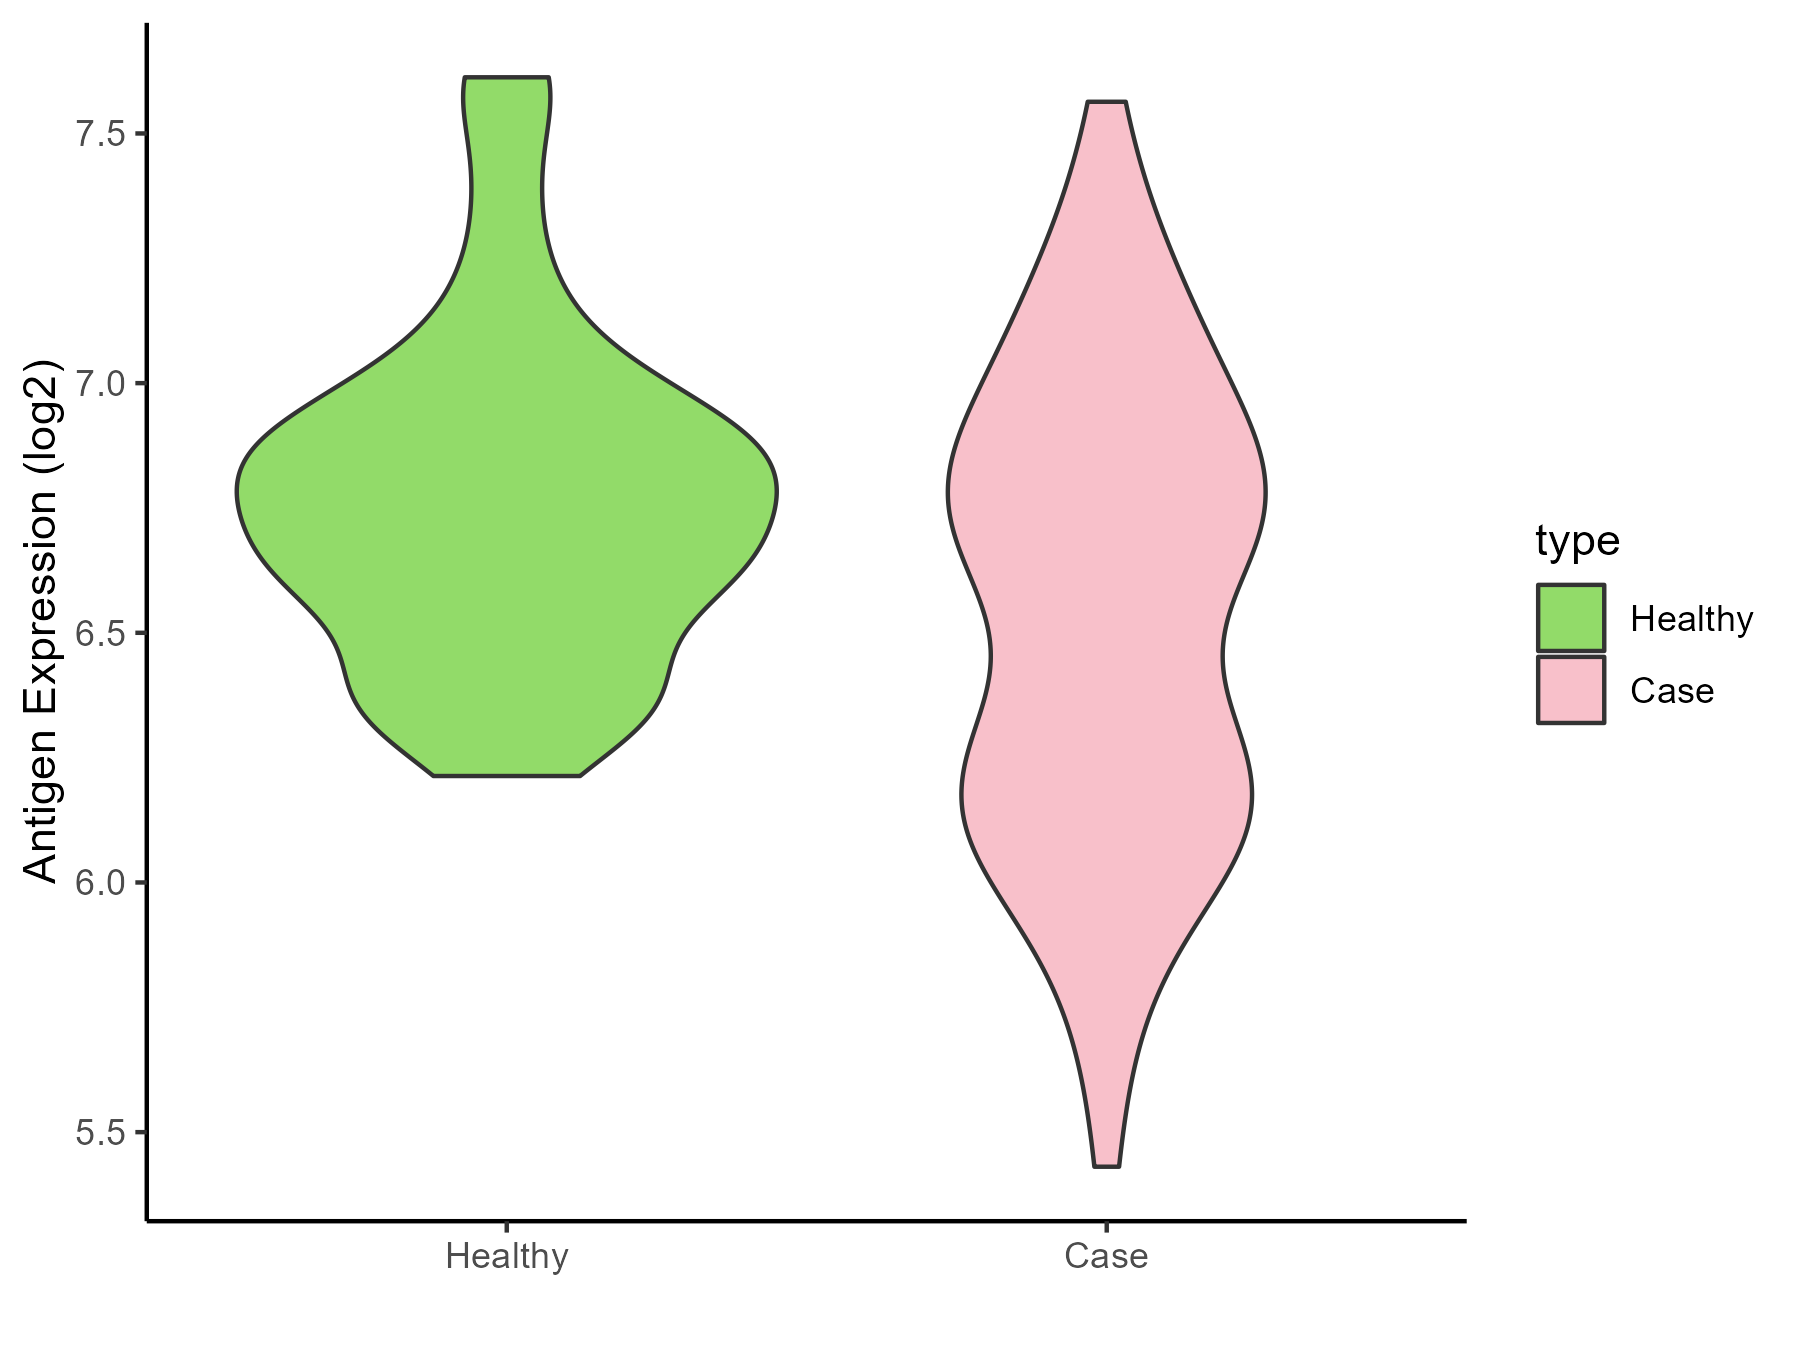
| Differential expression pattern of antigen in diseases | ||
| The Studied Tissue | Bladder | |
| The Specific Disease | Bladder cancer | |
| The Expression Level of Disease Section Compare with the Healthy Individual Tissue | p-value: 0.017547574; Fold-change: 0.177486888; Z-score: 1.415257041 | |
| Disease-specific Antigen Abundances |
|
Click to View the Clearer Original Diagram |
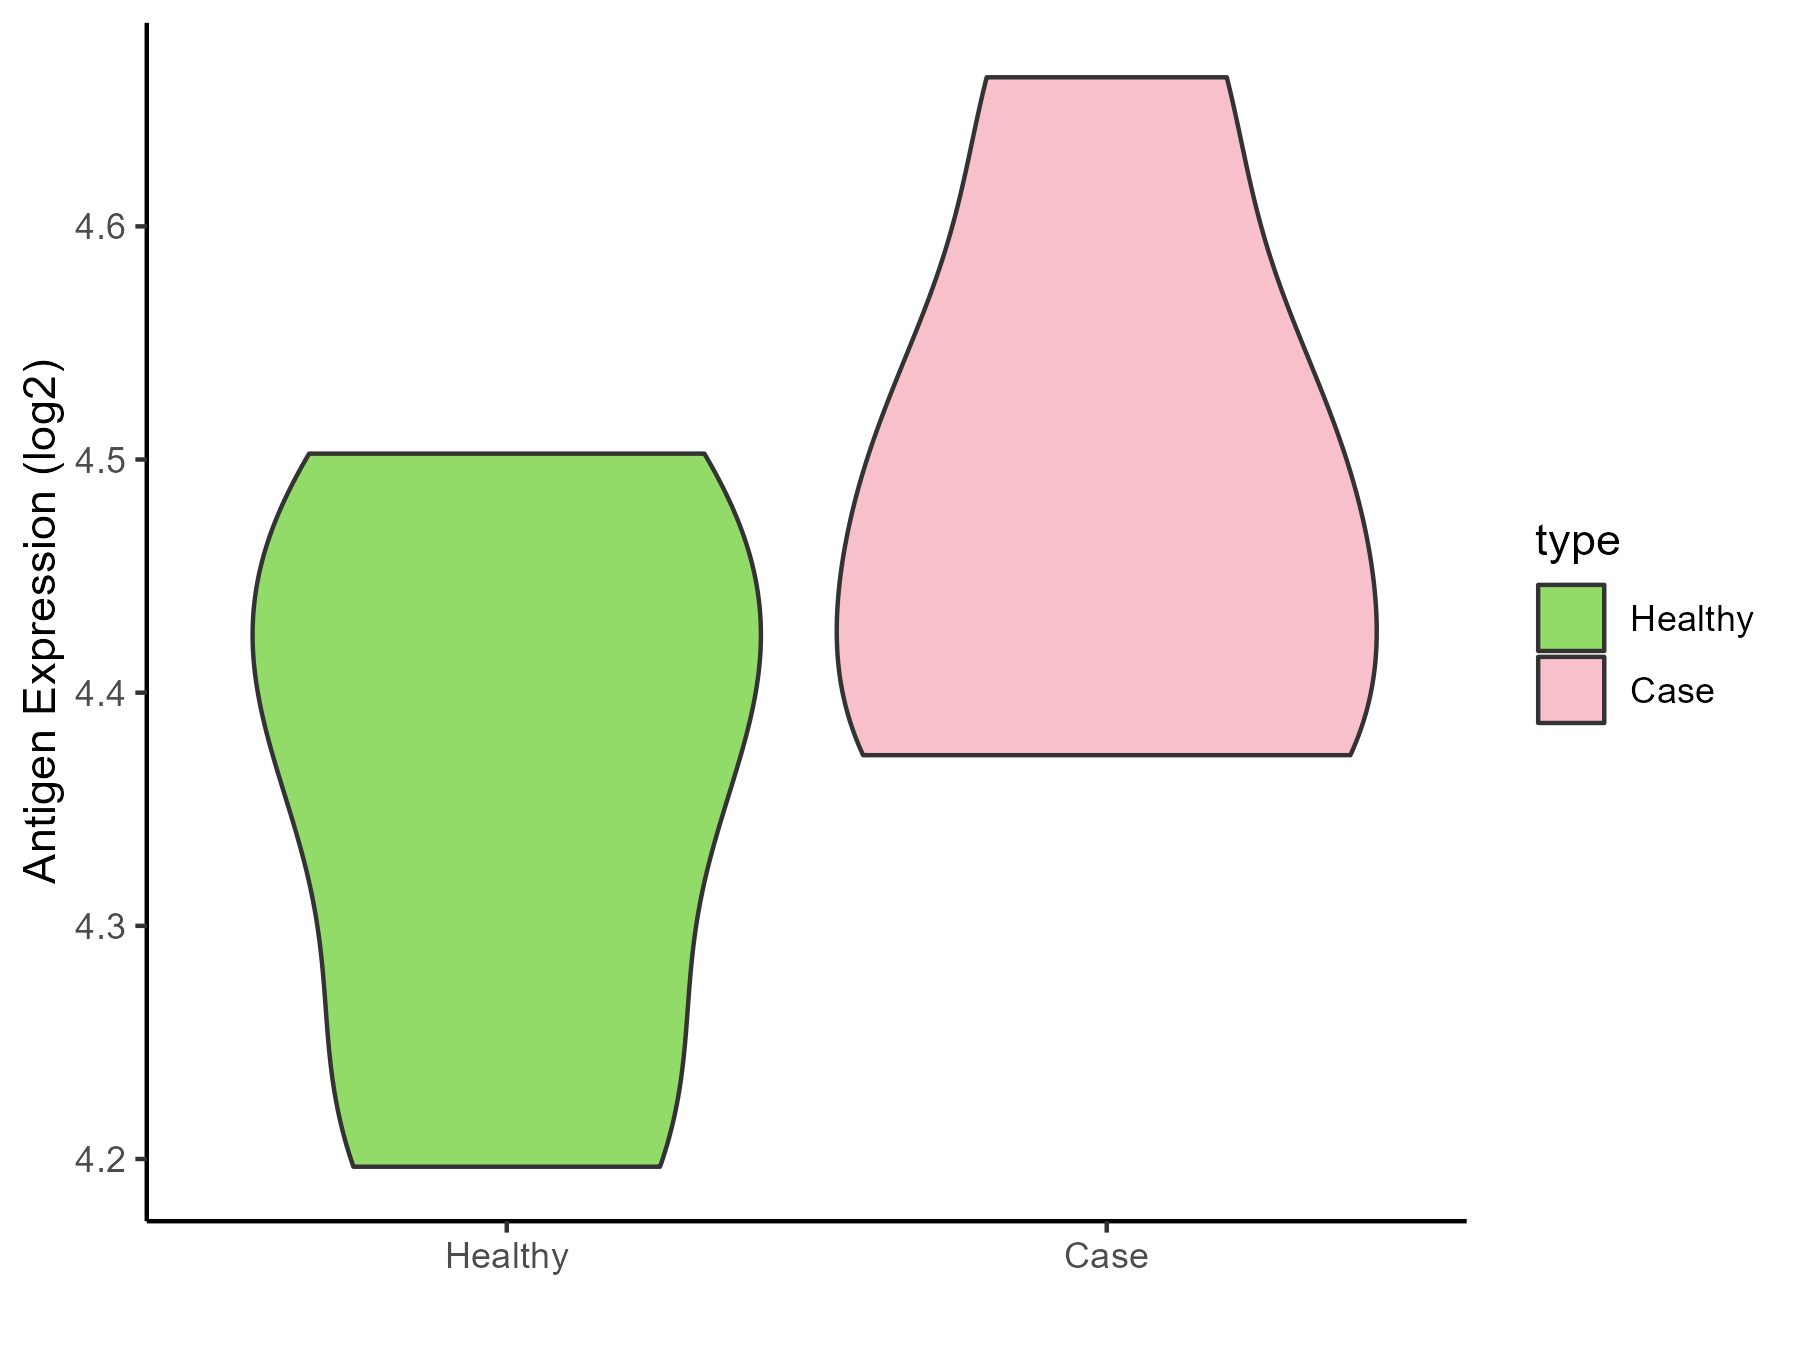
| Differential expression pattern of antigen in diseases | ||
| The Studied Tissue | Uvea | |
| The Specific Disease | Retinoblastoma tumor | |
| The Expression Level of Disease Section Compare with the Healthy Individual Tissue | p-value: 0.525036887; Fold-change: -0.080833151; Z-score: -0.616793808 | |
| Disease-specific Antigen Abundances |
|
Click to View the Clearer Original Diagram |
| Differential expression pattern of antigen in diseases | ||
| The Studied Tissue | Thyroid | |
| The Specific Disease | Thyroid cancer | |
| The Expression Level of Disease Section Compare with the Healthy Individual Tissue | p-value: 0.000655815; Fold-change: 0.062278488; Z-score: 0.294286473 | |
| The Expression Level of Disease Section Compare with the Adjacent Tissue | p-value: 0.118167386; Fold-change: 0.112127674; Z-score: 0.445768548 | |
| Disease-specific Antigen Abundances |
|
Click to View the Clearer Original Diagram |
| Differential expression pattern of antigen in diseases | ||
| The Studied Tissue | Adrenal cortex | |
| The Specific Disease | Adrenocortical carcinoma | |
| The Expression Level of Disease Section Compare with the Other Disease Section | p-value: 0.001281225; Fold-change: -0.099728738; Z-score: -0.468852749 | |
| Disease-specific Antigen Abundances |
|
Click to View the Clearer Original Diagram |
| Differential expression pattern of antigen in diseases | ||
| The Studied Tissue | Head and neck | |
| The Specific Disease | Head and neck cancer | |
| The Expression Level of Disease Section Compare with the Healthy Individual Tissue | p-value: 0.033873507; Fold-change: -0.043109712; Z-score: -0.187280283 | |
| Disease-specific Antigen Abundances |
|
Click to View the Clearer Original Diagram |
| Differential expression pattern of antigen in diseases | ||
| The Studied Tissue | Pituitary | |
| The Specific Disease | Pituitary gonadotrope tumor | |
| The Expression Level of Disease Section Compare with the Healthy Individual Tissue | p-value: 0.937995389; Fold-change: 0.020318056; Z-score: 0.2198227 | |
| Disease-specific Antigen Abundances |
|
Click to View the Clearer Original Diagram |
| The Studied Tissue | Pituitary | |
| The Specific Disease | Pituitary cancer | |
| The Expression Level of Disease Section Compare with the Healthy Individual Tissue | p-value: 0.089959363; Fold-change: 0.062078978; Z-score: 0.486864118 | |
| Disease-specific Antigen Abundances |
|
Click to View the Clearer Original Diagram |
ICD Disease Classification 03
| Differential expression pattern of antigen in diseases | ||
| The Studied Tissue | Whole blood | |
| The Specific Disease | Thrombocytopenia | |
| The Expression Level of Disease Section Compare with the Healthy Individual Tissue | p-value: 0.466524531; Fold-change: 0.135191888; Z-score: 0.99910311 | |
| Disease-specific Antigen Abundances |
|
Click to View the Clearer Original Diagram |
ICD Disease Classification 04
| Differential expression pattern of antigen in diseases | ||
| The Studied Tissue | Whole blood | |
| The Specific Disease | Lupus erythematosus | |
| The Expression Level of Disease Section Compare with the Healthy Individual Tissue | p-value: 0.4657422; Fold-change: -0.091897705; Z-score: -0.234721636 | |
| Disease-specific Antigen Abundances |
|
Click to View the Clearer Original Diagram |
| Differential expression pattern of antigen in diseases | ||
| The Studied Tissue | Peripheral monocyte | |
| The Specific Disease | Autoimmune uveitis | |
| The Expression Level of Disease Section Compare with the Healthy Individual Tissue | p-value: 0.009963869; Fold-change: -0.201762636; Z-score: -1.098354132 | |
| Disease-specific Antigen Abundances |
|
Click to View the Clearer Original Diagram |
ICD Disease Classification 05
| Differential expression pattern of antigen in diseases | ||
| The Studied Tissue | Whole blood | |
| The Specific Disease | Familial hypercholesterolemia | |
| The Expression Level of Disease Section Compare with the Healthy Individual Tissue | p-value: 0.959433282; Fold-change: -0.018777131; Z-score: -0.060103424 | |
| Disease-specific Antigen Abundances |
|
Click to View the Clearer Original Diagram |
ICD Disease Classification 06
| Differential expression pattern of antigen in diseases | ||
| The Studied Tissue | Superior temporal cortex | |
| The Specific Disease | Schizophrenia | |
| The Expression Level of Disease Section Compare with the Healthy Individual Tissue | p-value: 0.205354038; Fold-change: -0.05651575; Z-score: -0.537465229 | |
| Disease-specific Antigen Abundances |
|
Click to View the Clearer Original Diagram |
ICD Disease Classification 08
| Differential expression pattern of antigen in diseases | ||
| The Studied Tissue | Spinal cord | |
| The Specific Disease | Multiple sclerosis | |
| The Expression Level of Disease Section Compare with the Adjacent Tissue | p-value: 0.874623063; Fold-change: -0.123054734; Z-score: -1.181671231 | |
| Disease-specific Antigen Abundances |
|
Click to View the Clearer Original Diagram |
| The Studied Tissue | Plasmacytoid dendritic cells | |
| The Specific Disease | Multiple sclerosis | |
| The Expression Level of Disease Section Compare with the Healthy Individual Tissue | p-value: 0.619291188; Fold-change: 0.020810969; Z-score: 0.09683439 | |
| Disease-specific Antigen Abundances |
|
Click to View the Clearer Original Diagram |
| Differential expression pattern of antigen in diseases | ||
| The Studied Tissue | Peritumoral cortex | |
| The Specific Disease | Epilepsy | |
| The Expression Level of Disease Section Compare with the Other Disease Section | p-value: 0.235364418; Fold-change: -0.01802855; Z-score: -0.103354409 | |
| Disease-specific Antigen Abundances |
|
Click to View the Clearer Original Diagram |
| Differential expression pattern of antigen in diseases | ||
| The Studied Tissue | Whole blood | |
| The Specific Disease | Cardioembolic Stroke | |
| The Expression Level of Disease Section Compare with the Healthy Individual Tissue | p-value: 0.015177009; Fold-change: 0.231597676; Z-score: 0.721031236 | |
| Disease-specific Antigen Abundances |
|
Click to View the Clearer Original Diagram |
| The Studied Tissue | Peripheral blood | |
| The Specific Disease | Ischemic stroke | |
| The Expression Level of Disease Section Compare with the Healthy Individual Tissue | p-value: 0.13507681; Fold-change: 0.053476596; Z-score: 0.18935571 | |
| Disease-specific Antigen Abundances |
|
Click to View the Clearer Original Diagram |
ICD Disease Classification 1
| Differential expression pattern of antigen in diseases | ||
| The Studied Tissue | White matter | |
| The Specific Disease | HIV | |
| The Expression Level of Disease Section Compare with the Healthy Individual Tissue | p-value: 0.183644388; Fold-change: -0.011078298; Z-score: -0.048035772 | |
| Disease-specific Antigen Abundances |
|
Click to View the Clearer Original Diagram |
| Differential expression pattern of antigen in diseases | ||
| The Studied Tissue | Whole blood | |
| The Specific Disease | Influenza | |
| The Expression Level of Disease Section Compare with the Healthy Individual Tissue | p-value: 0.68302535; Fold-change: 0.166100001; Z-score: 0.612290876 | |
| Disease-specific Antigen Abundances |
|
Click to View the Clearer Original Diagram |
| Differential expression pattern of antigen in diseases | ||
| The Studied Tissue | Whole blood | |
| The Specific Disease | Chronic hepatitis C | |
| The Expression Level of Disease Section Compare with the Healthy Individual Tissue | p-value: 0.592682113; Fold-change: 0.017226339; Z-score: 0.181984871 | |
| Disease-specific Antigen Abundances |
|
Click to View the Clearer Original Diagram |
| Differential expression pattern of antigen in diseases | ||
| The Studied Tissue | Whole blood | |
| The Specific Disease | Sepsis | |
| The Expression Level of Disease Section Compare with the Healthy Individual Tissue | p-value: 1.23E-08; Fold-change: 0.158915165; Z-score: 0.683076848 | |
| Disease-specific Antigen Abundances |
|
Click to View the Clearer Original Diagram |
| Differential expression pattern of antigen in diseases | ||
| The Studied Tissue | Whole blood | |
| The Specific Disease | Septic shock | |
| The Expression Level of Disease Section Compare with the Healthy Individual Tissue | p-value: 9.68E-25; Fold-change: 0.358246066; Z-score: 1.397439169 | |
| Disease-specific Antigen Abundances |
|
Click to View the Clearer Original Diagram |
| Differential expression pattern of antigen in diseases | ||
| The Studied Tissue | Peripheral blood | |
| The Specific Disease | Pediatric respiratory syncytial virus infection | |
| The Expression Level of Disease Section Compare with the Healthy Individual Tissue | p-value: 0.19488862; Fold-change: 0.158527747; Z-score: 0.798212051 | |
| Disease-specific Antigen Abundances |
|
Click to View the Clearer Original Diagram |
ICD Disease Classification 11
| Differential expression pattern of antigen in diseases | ||
| The Studied Tissue | Peripheral blood | |
| The Specific Disease | Essential hypertension | |
| The Expression Level of Disease Section Compare with the Healthy Individual Tissue | p-value: 0.967678461; Fold-change: 0.113411252; Z-score: 3.521072561 | |
| Disease-specific Antigen Abundances |
|
Click to View the Clearer Original Diagram |
| Differential expression pattern of antigen in diseases | ||
| The Studied Tissue | Peripheral blood | |
| The Specific Disease | Myocardial infarction | |
| The Expression Level of Disease Section Compare with the Healthy Individual Tissue | p-value: 0.020199876; Fold-change: 0.220375809; Z-score: 0.474346434 | |
| Disease-specific Antigen Abundances |
|
Click to View the Clearer Original Diagram |
| Differential expression pattern of antigen in diseases | ||
| The Studied Tissue | Peripheral blood | |
| The Specific Disease | Coronary artery disease | |
| The Expression Level of Disease Section Compare with the Healthy Individual Tissue | p-value: 0.211195737; Fold-change: -0.052552312; Z-score: -0.505916764 | |
| Disease-specific Antigen Abundances |
|
Click to View the Clearer Original Diagram |
| Differential expression pattern of antigen in diseases | ||
| The Studied Tissue | Calcified aortic valve | |
| The Specific Disease | Aortic stenosis | |
| The Expression Level of Disease Section Compare with the Healthy Individual Tissue | p-value: 0.548670066; Fold-change: -0.149540921; Z-score: -0.478661794 | |
| Disease-specific Antigen Abundances |
|
Click to View the Clearer Original Diagram |
| Differential expression pattern of antigen in diseases | ||
| The Studied Tissue | Peripheral blood | |
| The Specific Disease | Arteriosclerosis | |
| The Expression Level of Disease Section Compare with the Healthy Individual Tissue | p-value: 0.864890603; Fold-change: -0.019731596; Z-score: -0.076530094 | |
| Disease-specific Antigen Abundances |
|
Click to View the Clearer Original Diagram |
| Differential expression pattern of antigen in diseases | ||
| The Studied Tissue | Intracranial artery | |
| The Specific Disease | Aneurysm | |
| The Expression Level of Disease Section Compare with the Healthy Individual Tissue | p-value: 0.20242167; Fold-change: -0.072310084; Z-score: -0.68167151 | |
| Disease-specific Antigen Abundances |
|
Click to View the Clearer Original Diagram |
ICD Disease Classification 12
| Differential expression pattern of antigen in diseases | ||
| The Studied Tissue | Peripheral blood | |
| The Specific Disease | Immunodeficiency | |
| The Expression Level of Disease Section Compare with the Healthy Individual Tissue | p-value: 0.031816868; Fold-change: 0.106330694; Z-score: 1.158559696 | |
| Disease-specific Antigen Abundances |
|
Click to View the Clearer Original Diagram |
| Differential expression pattern of antigen in diseases | ||
| The Studied Tissue | Hyperplastic tonsil | |
| The Specific Disease | Apnea | |
| The Expression Level of Disease Section Compare with the Healthy Individual Tissue | p-value: 0.90178899; Fold-change: -0.263636723; Z-score: -1.23697409 | |
| Disease-specific Antigen Abundances |
|
Click to View the Clearer Original Diagram |
| Differential expression pattern of antigen in diseases | ||
| The Studied Tissue | Peripheral blood | |
| The Specific Disease | Olive pollen allergy | |
| The Expression Level of Disease Section Compare with the Healthy Individual Tissue | p-value: 0.34853716; Fold-change: 0.10169276; Z-score: 0.407916442 | |
| Disease-specific Antigen Abundances |
|
Click to View the Clearer Original Diagram |
| Differential expression pattern of antigen in diseases | ||
| The Studied Tissue | Sinus mucosa | |
| The Specific Disease | Chronic rhinosinusitis | |
| The Expression Level of Disease Section Compare with the Healthy Individual Tissue | p-value: 0.097056368; Fold-change: 0.120899246; Z-score: 0.788816175 | |
| Disease-specific Antigen Abundances |
|
Click to View the Clearer Original Diagram |
| Differential expression pattern of antigen in diseases | ||
| The Studied Tissue | Lung | |
| The Specific Disease | Chronic obstructive pulmonary disease | |
| The Expression Level of Disease Section Compare with the Healthy Individual Tissue | p-value: 0.461457902; Fold-change: -0.01082863; Z-score: -0.054646571 | |
| Disease-specific Antigen Abundances |
|
Click to View the Clearer Original Diagram |
| The Studied Tissue | Small airway epithelium | |
| The Specific Disease | Chronic obstructive pulmonary disease | |
| The Expression Level of Disease Section Compare with the Healthy Individual Tissue | p-value: 0.000786034; Fold-change: 0.146735236; Z-score: 0.849639215 | |
| Disease-specific Antigen Abundances |
|
Click to View the Clearer Original Diagram |
| Differential expression pattern of antigen in diseases | ||
| The Studied Tissue | Nasal and bronchial airway | |
| The Specific Disease | Asthma | |
| The Expression Level of Disease Section Compare with the Healthy Individual Tissue | p-value: 0.070361966; Fold-change: 0.382843432; Z-score: 0.430802637 | |
| Disease-specific Antigen Abundances |
|
Click to View the Clearer Original Diagram |
| Differential expression pattern of antigen in diseases | ||
| The Studied Tissue | Nasal Epithelium | |
| The Specific Disease | Human rhinovirus infection | |
| The Expression Level of Disease Section Compare with the Healthy Individual Tissue | p-value: 0.480486248; Fold-change: -0.017291686; Z-score: -0.119182819 | |
| Disease-specific Antigen Abundances |
|
Click to View the Clearer Original Diagram |
| Differential expression pattern of antigen in diseases | ||
| The Studied Tissue | Lung | |
| The Specific Disease | Idiopathic pulmonary fibrosis | |
| The Expression Level of Disease Section Compare with the Healthy Individual Tissue | p-value: 0.066611112; Fold-change: -0.157101714; Z-score: -1.183812052 | |
| Disease-specific Antigen Abundances |
|
Click to View the Clearer Original Diagram |
ICD Disease Classification 13
| Differential expression pattern of antigen in diseases | ||
| The Studied Tissue | Gingival | |
| The Specific Disease | Periodontal disease | |
| The Expression Level of Disease Section Compare with the Adjacent Tissue | p-value: 0.443421089; Fold-change: -0.027619194; Z-score: -0.145580093 | |
| Disease-specific Antigen Abundances |
|
Click to View the Clearer Original Diagram |
| Differential expression pattern of antigen in diseases | ||
| The Studied Tissue | Gastric antrum | |
| The Specific Disease | Eosinophilic gastritis | |
| The Expression Level of Disease Section Compare with the Adjacent Tissue | p-value: 0.170953924; Fold-change: 0.116475104; Z-score: 1.094063062 | |
| Disease-specific Antigen Abundances |

|
Click to View the Clearer Original Diagram |
| Differential expression pattern of antigen in diseases | ||
| The Studied Tissue | Liver | |
| The Specific Disease | Liver failure | |
| The Expression Level of Disease Section Compare with the Healthy Individual Tissue | p-value: 0.421809104; Fold-change: 0.002833709; Z-score: 0.0175548 | |
| Disease-specific Antigen Abundances |
|
Click to View the Clearer Original Diagram |
| Differential expression pattern of antigen in diseases | ||
| The Studied Tissue | Colon mucosal | |
| The Specific Disease | Ulcerative colitis | |
| The Expression Level of Disease Section Compare with the Adjacent Tissue | p-value: 0.635855799; Fold-change: 0.065278367; Z-score: 0.242126494 | |
| Disease-specific Antigen Abundances |
|
Click to View the Clearer Original Diagram |
| Differential expression pattern of antigen in diseases | ||
| The Studied Tissue | Rectal colon | |
| The Specific Disease | Irritable bowel syndrome | |
| The Expression Level of Disease Section Compare with the Healthy Individual Tissue | p-value: 0.259773766; Fold-change: -0.037337221; Z-score: -0.181666724 | |
| Disease-specific Antigen Abundances |
|
Click to View the Clearer Original Diagram |
ICD Disease Classification 14
| Differential expression pattern of antigen in diseases | ||
| The Studied Tissue | Skin | |
| The Specific Disease | Atopic dermatitis | |
| The Expression Level of Disease Section Compare with the Healthy Individual Tissue | p-value: 0.000623516; Fold-change: -0.116117804; Z-score: -1.288980192 | |
| Disease-specific Antigen Abundances |
|
Click to View the Clearer Original Diagram |
| Differential expression pattern of antigen in diseases | ||
| The Studied Tissue | Skin | |
| The Specific Disease | Psoriasis | |
| The Expression Level of Disease Section Compare with the Healthy Individual Tissue | p-value: 9.62E-08; Fold-change: 0.293996088; Z-score: 0.801657998 | |
| The Expression Level of Disease Section Compare with the Adjacent Tissue | p-value: 0.75268022; Fold-change: -0.01739102; Z-score: -0.042207256 | |
| Disease-specific Antigen Abundances |
|
Click to View the Clearer Original Diagram |
| Differential expression pattern of antigen in diseases | ||
| The Studied Tissue | Skin | |
| The Specific Disease | Vitiligo | |
| The Expression Level of Disease Section Compare with the Healthy Individual Tissue | p-value: 0.488409745; Fold-change: -0.013237104; Z-score: -0.073336526 | |
| Disease-specific Antigen Abundances |
|
Click to View the Clearer Original Diagram |
| Differential expression pattern of antigen in diseases | ||
| The Studied Tissue | Skin from scalp | |
| The Specific Disease | Alopecia | |
| The Expression Level of Disease Section Compare with the Healthy Individual Tissue | p-value: 0.003007082; Fold-change: -0.168749204; Z-score: -0.506585611 | |
| Disease-specific Antigen Abundances |
|
Click to View the Clearer Original Diagram |
| Differential expression pattern of antigen in diseases | ||
| The Studied Tissue | Skin | |
| The Specific Disease | Sensitive skin | |
| The Expression Level of Disease Section Compare with the Healthy Individual Tissue | p-value: 0.134101564; Fold-change: 0.094520679; Z-score: 0.77941183 | |
| Disease-specific Antigen Abundances |
|
Click to View the Clearer Original Diagram |
ICD Disease Classification 15
| Differential expression pattern of antigen in diseases | ||
| The Studied Tissue | Synovial | |
| The Specific Disease | Osteoarthritis | |
| The Expression Level of Disease Section Compare with the Healthy Individual Tissue | p-value: 0.178042747; Fold-change: -0.084085503; Z-score: -0.383245002 | |
| Disease-specific Antigen Abundances |
|
Click to View the Clearer Original Diagram |
| Differential expression pattern of antigen in diseases | ||
| The Studied Tissue | Peripheral blood | |
| The Specific Disease | Arthropathy | |
| The Expression Level of Disease Section Compare with the Healthy Individual Tissue | p-value: 0.521321498; Fold-change: 0.129542698; Z-score: 0.416118973 | |
| Disease-specific Antigen Abundances |
|
Click to View the Clearer Original Diagram |
| Differential expression pattern of antigen in diseases | ||
| The Studied Tissue | Peripheral blood | |
| The Specific Disease | Arthritis | |
| The Expression Level of Disease Section Compare with the Healthy Individual Tissue | p-value: 0.852167133; Fold-change: -0.073314329; Z-score: -0.273773561 | |
| Disease-specific Antigen Abundances |
|
Click to View the Clearer Original Diagram |
| Differential expression pattern of antigen in diseases | ||
| The Studied Tissue | Synovial | |
| The Specific Disease | Rheumatoid arthritis | |
| The Expression Level of Disease Section Compare with the Healthy Individual Tissue | p-value: 0.001154467; Fold-change: -0.403906279; Z-score: -2.428000076 | |
| Disease-specific Antigen Abundances |
|
Click to View the Clearer Original Diagram |
| Differential expression pattern of antigen in diseases | ||
| The Studied Tissue | Pheripheral blood | |
| The Specific Disease | Ankylosing spondylitis | |
| The Expression Level of Disease Section Compare with the Healthy Individual Tissue | p-value: 0.121041237; Fold-change: -0.048218715; Z-score: -0.448595181 | |
| Disease-specific Antigen Abundances |
|
Click to View the Clearer Original Diagram |
| Differential expression pattern of antigen in diseases | ||
| The Studied Tissue | Bone marrow | |
| The Specific Disease | Osteoporosis | |
| The Expression Level of Disease Section Compare with the Healthy Individual Tissue | p-value: 0.582699634; Fold-change: -0.152244985; Z-score: -0.560662269 | |
| Disease-specific Antigen Abundances |
|
Click to View the Clearer Original Diagram |
ICD Disease Classification 16
| Differential expression pattern of antigen in diseases | ||
| The Studied Tissue | Endometrium | |
| The Specific Disease | Endometriosis | |
| The Expression Level of Disease Section Compare with the Healthy Individual Tissue | p-value: 0.237972269; Fold-change: 0.103723969; Z-score: 0.390020876 | |
| Disease-specific Antigen Abundances |
|
Click to View the Clearer Original Diagram |
| Differential expression pattern of antigen in diseases | ||
| The Studied Tissue | Bladder | |
| The Specific Disease | Interstitial cystitis | |
| The Expression Level of Disease Section Compare with the Healthy Individual Tissue | p-value: 0.449841987; Fold-change: -0.078865333; Z-score: -1.092104911 | |
| Disease-specific Antigen Abundances |
|
Click to View the Clearer Original Diagram |
ICD Disease Classification 19
| Differential expression pattern of antigen in diseases | ||
| The Studied Tissue | Myometrium | |
| The Specific Disease | Preterm birth | |
| The Expression Level of Disease Section Compare with the Healthy Individual Tissue | p-value: 0.755964768; Fold-change: -0.051468298; Z-score: -0.251055381 | |
| Disease-specific Antigen Abundances |
|
Click to View the Clearer Original Diagram |
ICD Disease Classification 2
| Differential expression pattern of antigen in diseases | ||
| The Studied Tissue | Bone marrow | |
| The Specific Disease | Acute myelocytic leukemia | |
| The Expression Level of Disease Section Compare with the Healthy Individual Tissue | p-value: 0.035929484; Fold-change: -0.017973558; Z-score: -0.075712205 | |
| Disease-specific Antigen Abundances |
|
Click to View the Clearer Original Diagram |
| Differential expression pattern of antigen in diseases | ||
| The Studied Tissue | Bone marrow | |
| The Specific Disease | Myeloma | |
| The Expression Level of Disease Section Compare with the Healthy Individual Tissue | p-value: 0.754692186; Fold-change: -0.029477216; Z-score: -0.339215688 | |
| Disease-specific Antigen Abundances |
|
Click to View the Clearer Original Diagram |
| The Studied Tissue | Peripheral blood | |
| The Specific Disease | Myeloma | |
| The Expression Level of Disease Section Compare with the Healthy Individual Tissue | p-value: 0.331931739; Fold-change: -0.04968298; Z-score: -0.269897304 | |
| Disease-specific Antigen Abundances |
|
Click to View the Clearer Original Diagram |
| Differential expression pattern of antigen in diseases | ||
| The Studied Tissue | Oral | |
| The Specific Disease | Oral cancer | |
| The Expression Level of Disease Section Compare with the Healthy Individual Tissue | p-value: 2.63E-06; Fold-change: -0.296823023; Z-score: -1.275806007 | |
| The Expression Level of Disease Section Compare with the Adjacent Tissue | p-value: 0.002042436; Fold-change: -0.084873377; Z-score: -0.294510313 | |
| Disease-specific Antigen Abundances |
|
Click to View the Clearer Original Diagram |
| Differential expression pattern of antigen in diseases | ||
| The Studied Tissue | Esophagus | |
| The Specific Disease | Esophagal cancer | |
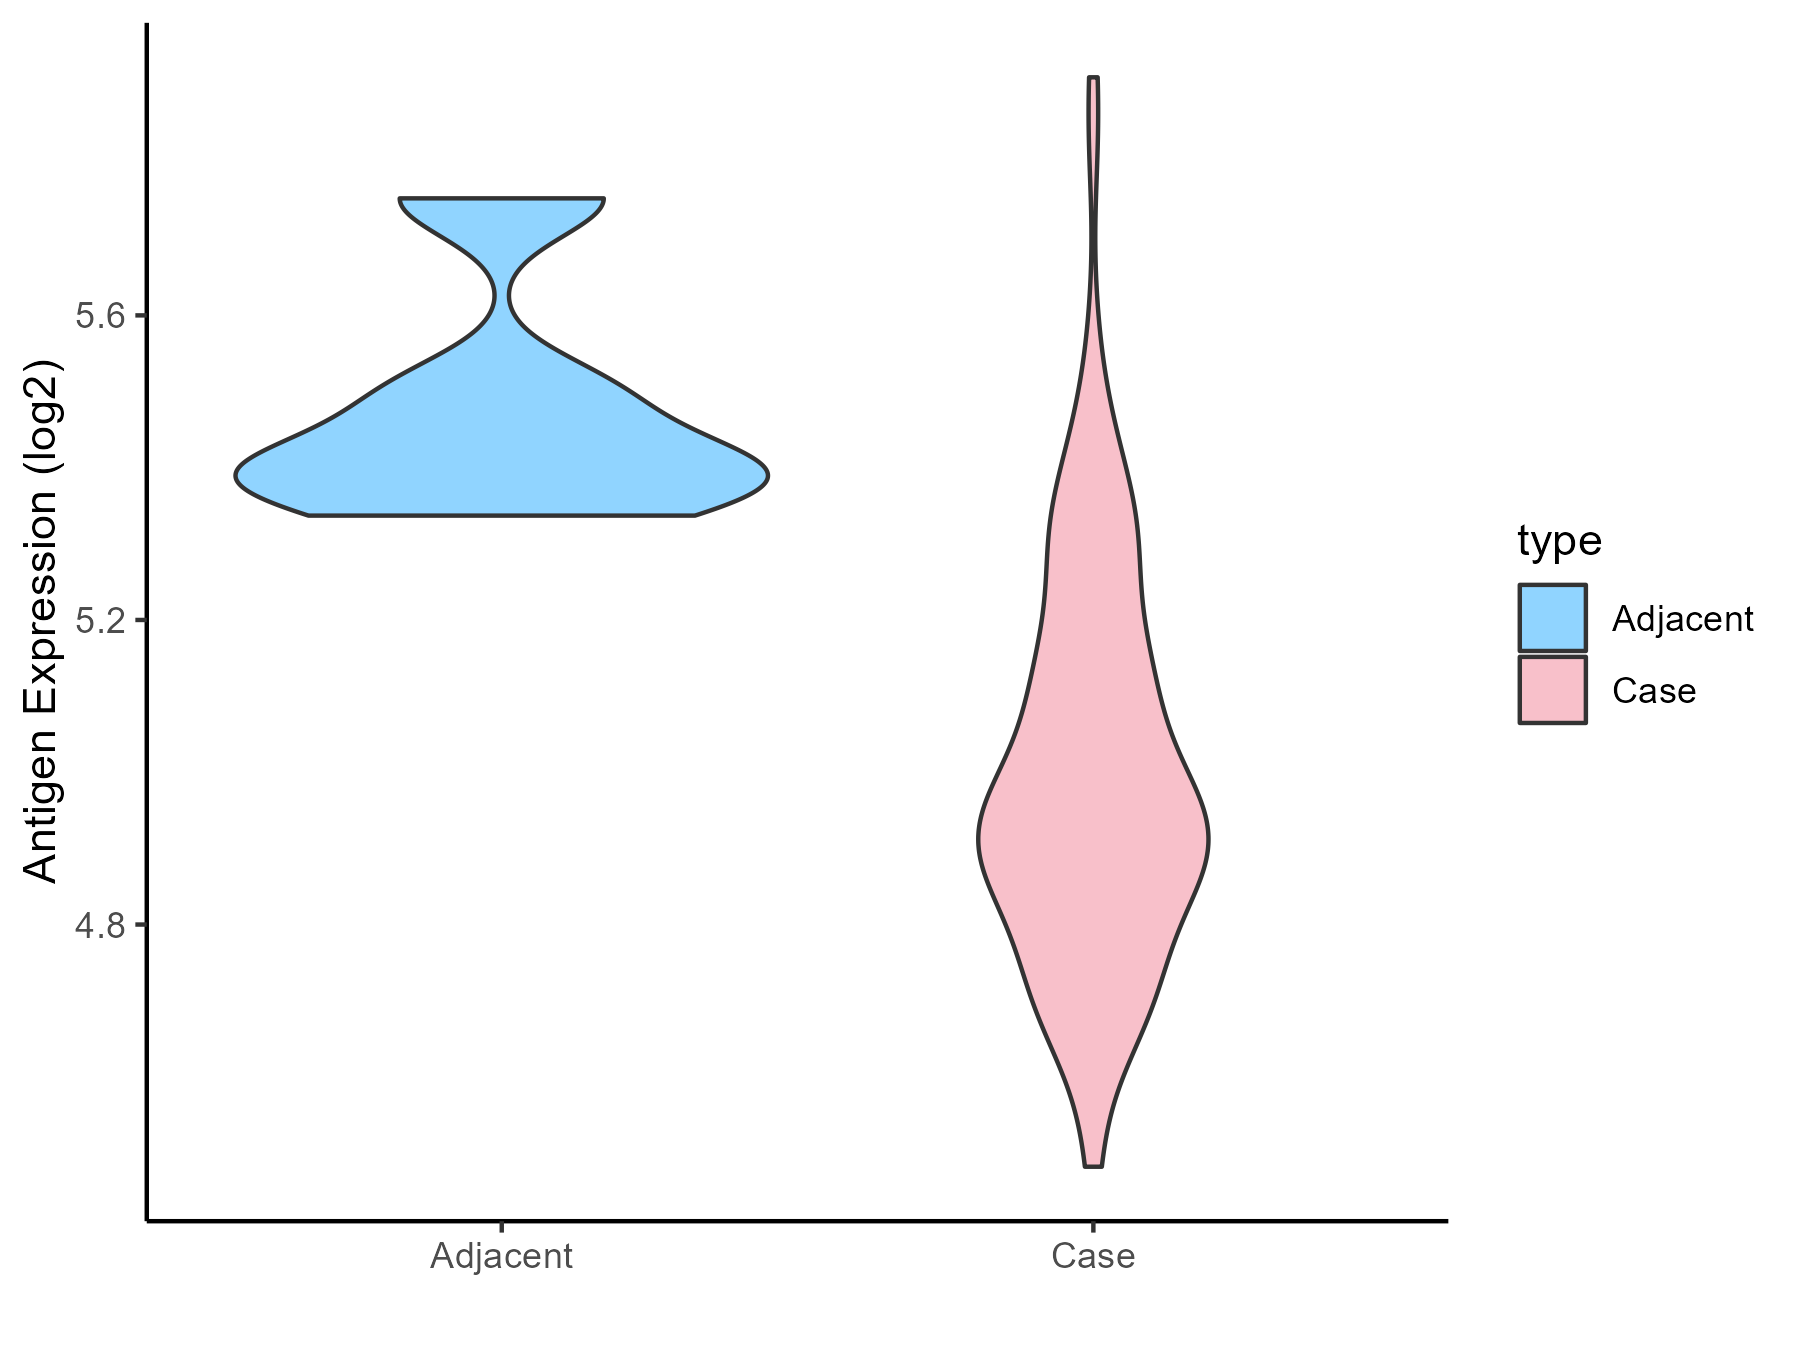
| The Expression Level of Disease Section Compare with the Adjacent Tissue | p-value: 0.001701951; Fold-change: -0.463484352; Z-score: -2.814378182 | |
| Disease-specific Antigen Abundances |
|
Click to View the Clearer Original Diagram |
| Differential expression pattern of antigen in diseases | ||
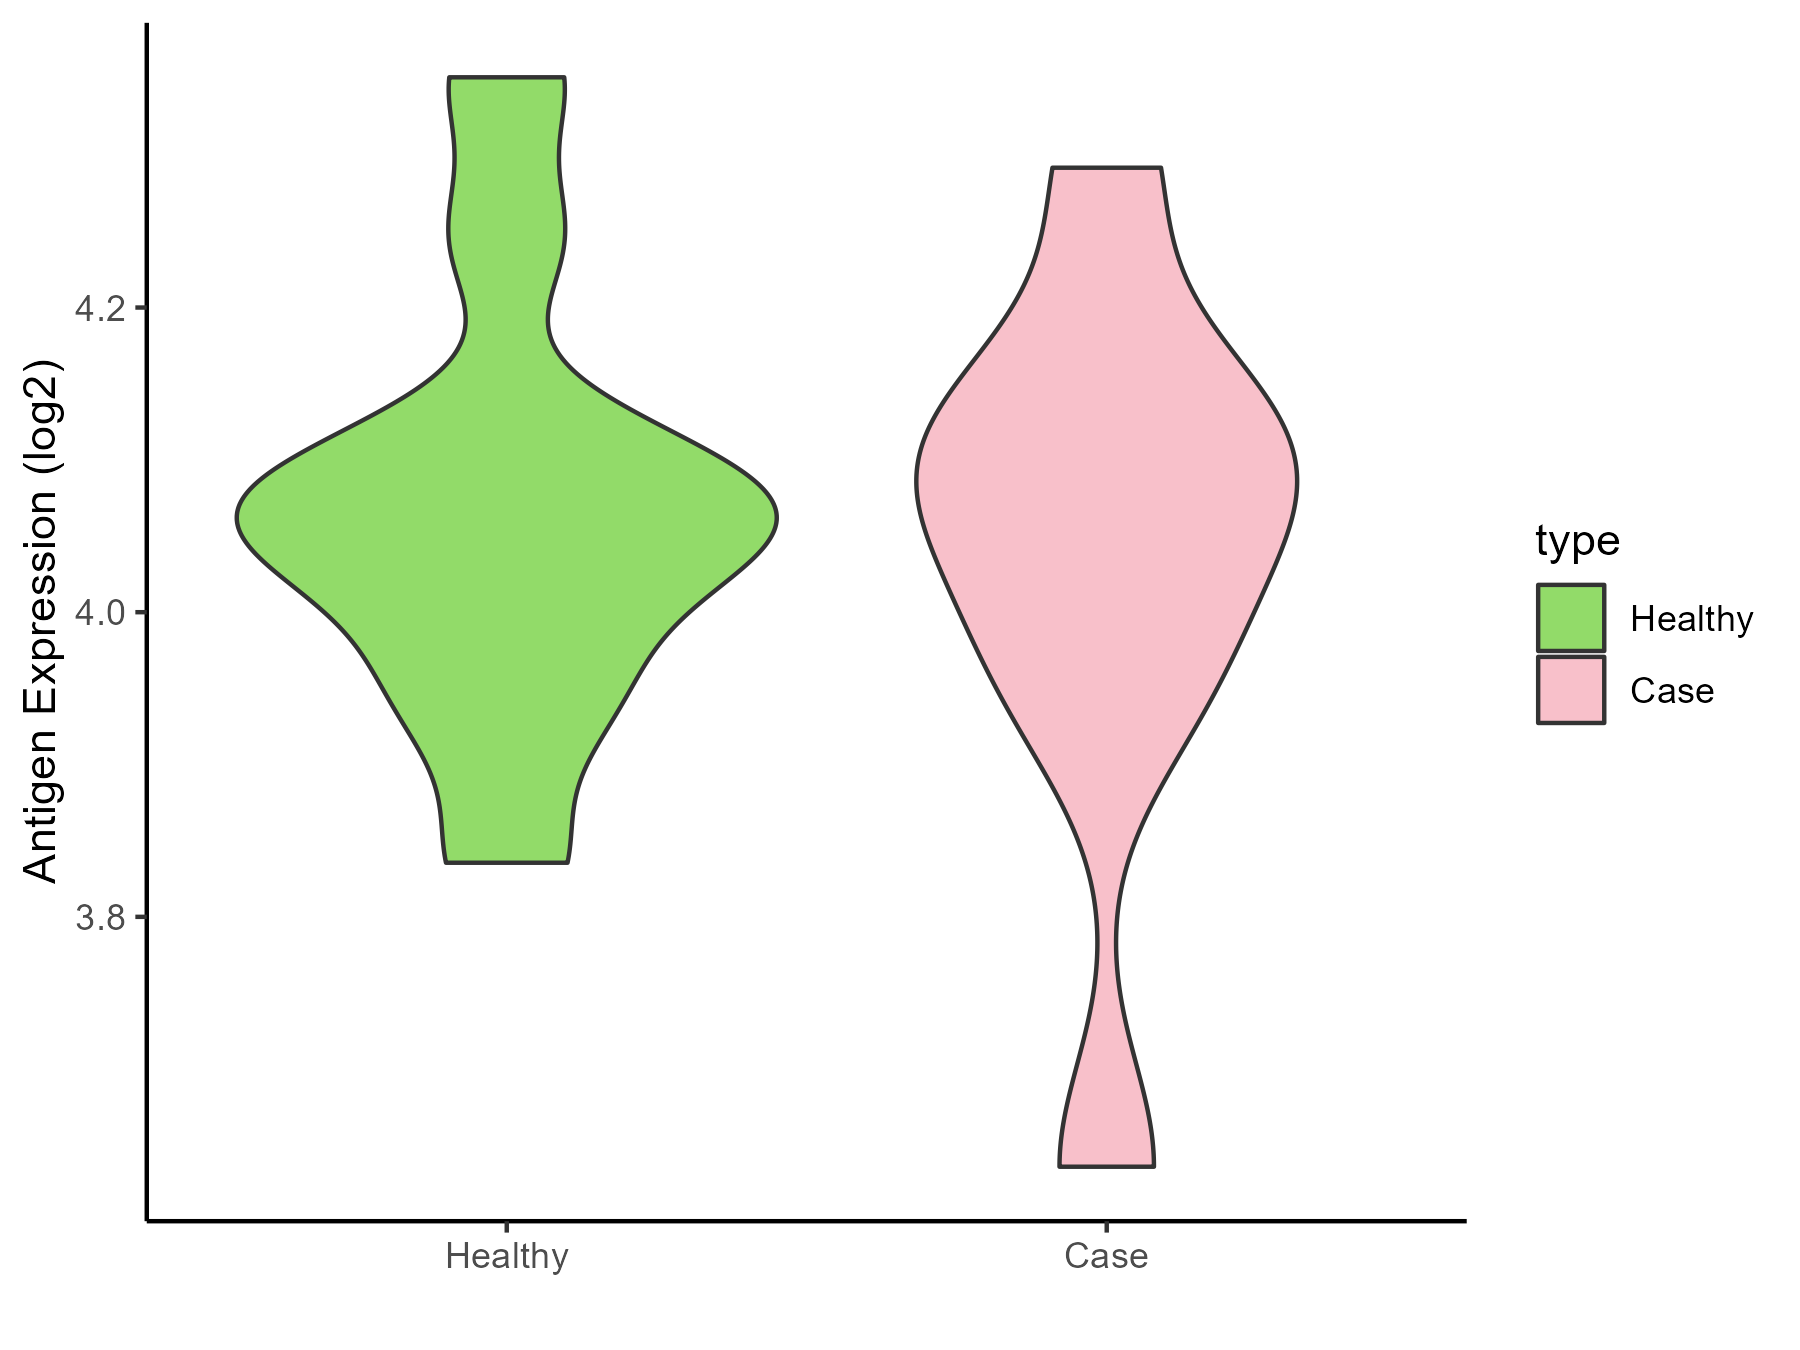
| The Studied Tissue | Rectal colon | |
| The Specific Disease | Rectal cancer | |
| The Expression Level of Disease Section Compare with the Healthy Individual Tissue | p-value: 0.207515955; Fold-change: 0.198736903; Z-score: 0.96681527 | |
| The Expression Level of Disease Section Compare with the Adjacent Tissue | p-value: 0.914503668; Fold-change: 0.024889823; Z-score: 0.080401531 | |
| Disease-specific Antigen Abundances |
|
Click to View the Clearer Original Diagram |
| Differential expression pattern of antigen in diseases | ||
| The Studied Tissue | Skin | |
| The Specific Disease | Skin cancer | |
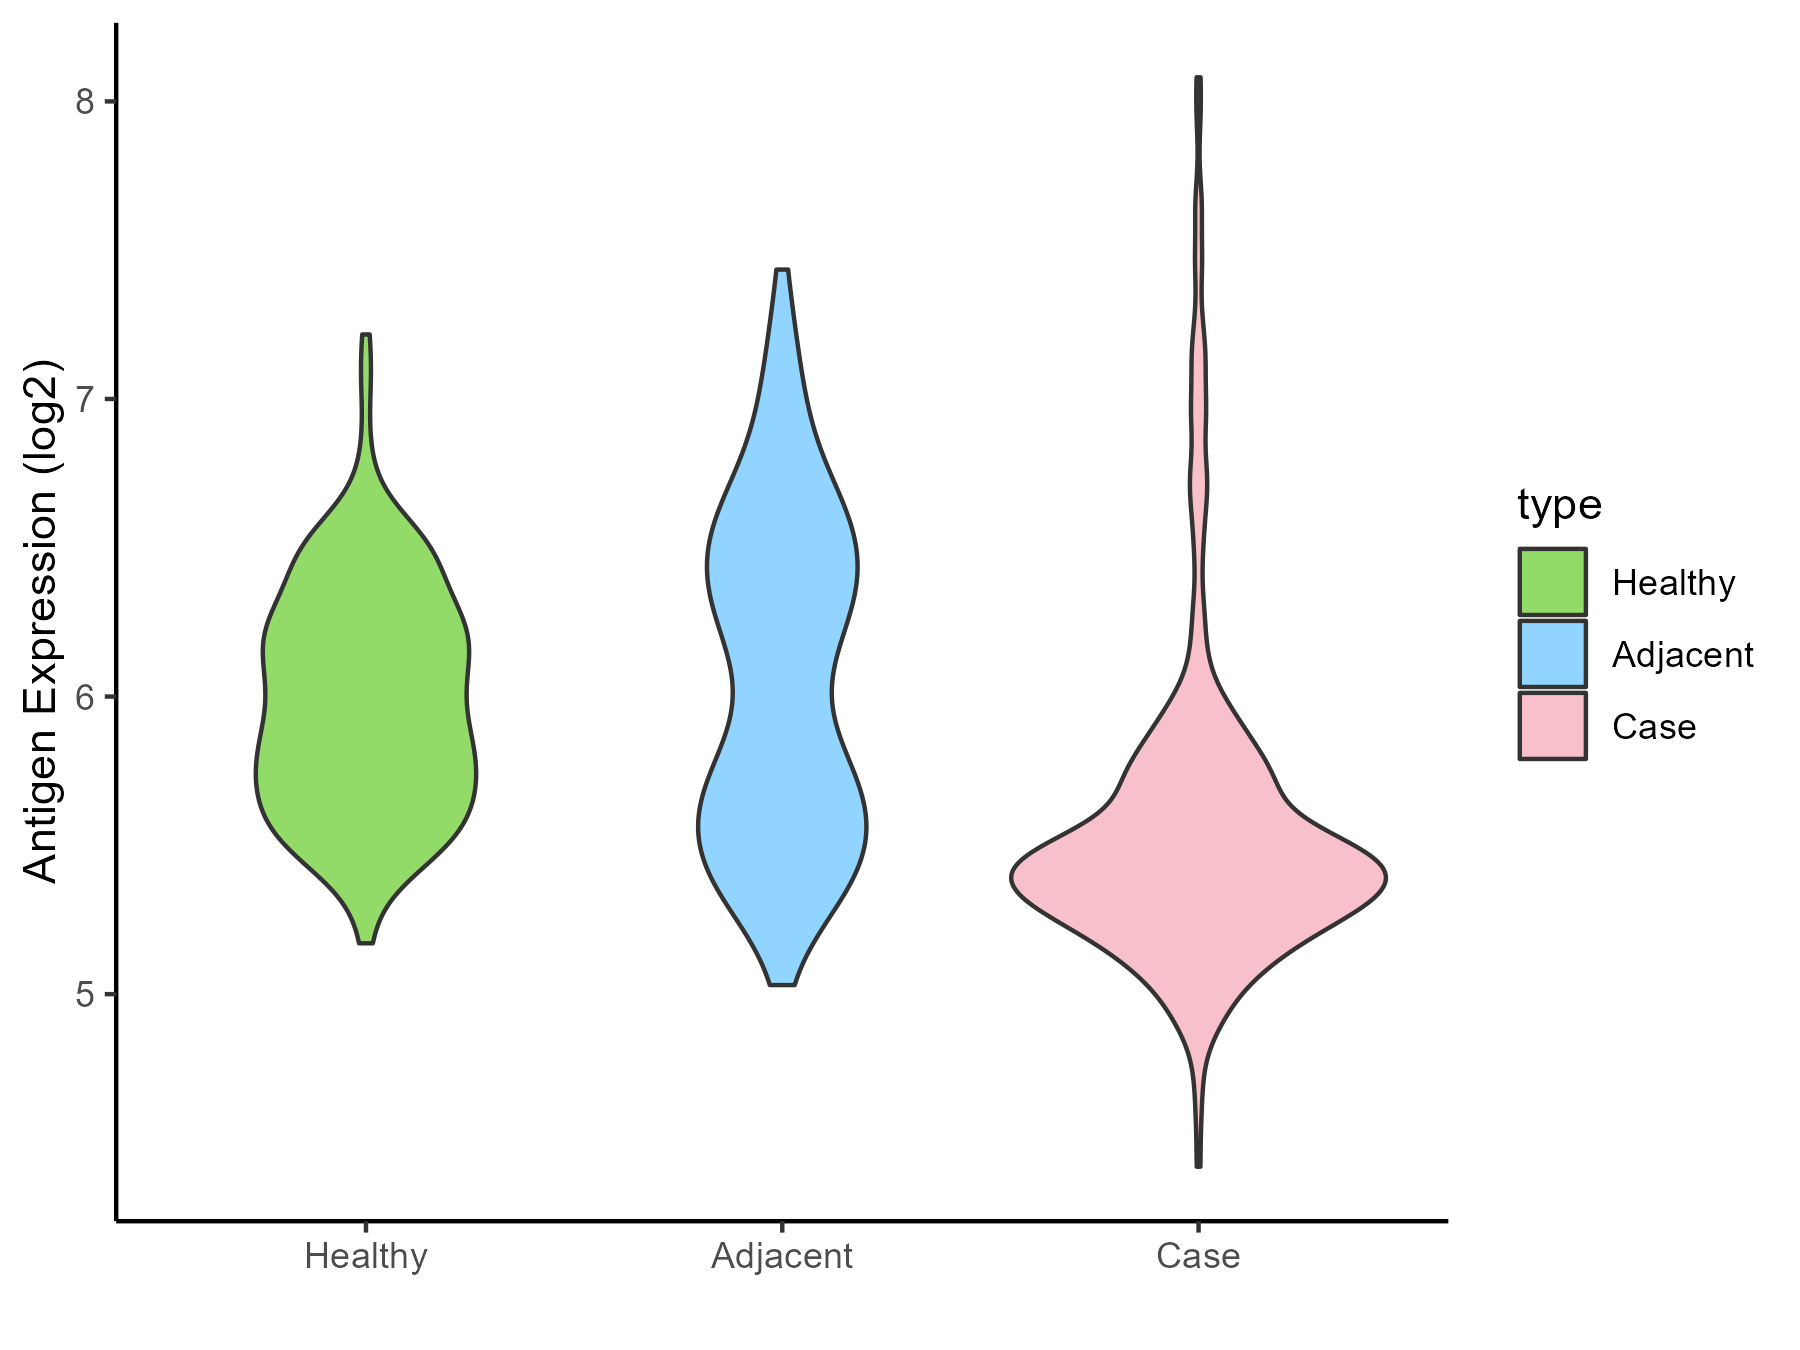
| The Expression Level of Disease Section Compare with the Healthy Individual Tissue | p-value: 3.55E-31; Fold-change: -0.537265817; Z-score: -1.432572789 | |
| The Expression Level of Disease Section Compare with the Adjacent Tissue | p-value: 1.11E-23; Fold-change: -0.627952675; Z-score: -1.132475425 | |
| Disease-specific Antigen Abundances |
|
Click to View the Clearer Original Diagram |
| Differential expression pattern of antigen in diseases | ||
| The Studied Tissue | Kidney | |
| The Specific Disease | Renal cancer | |
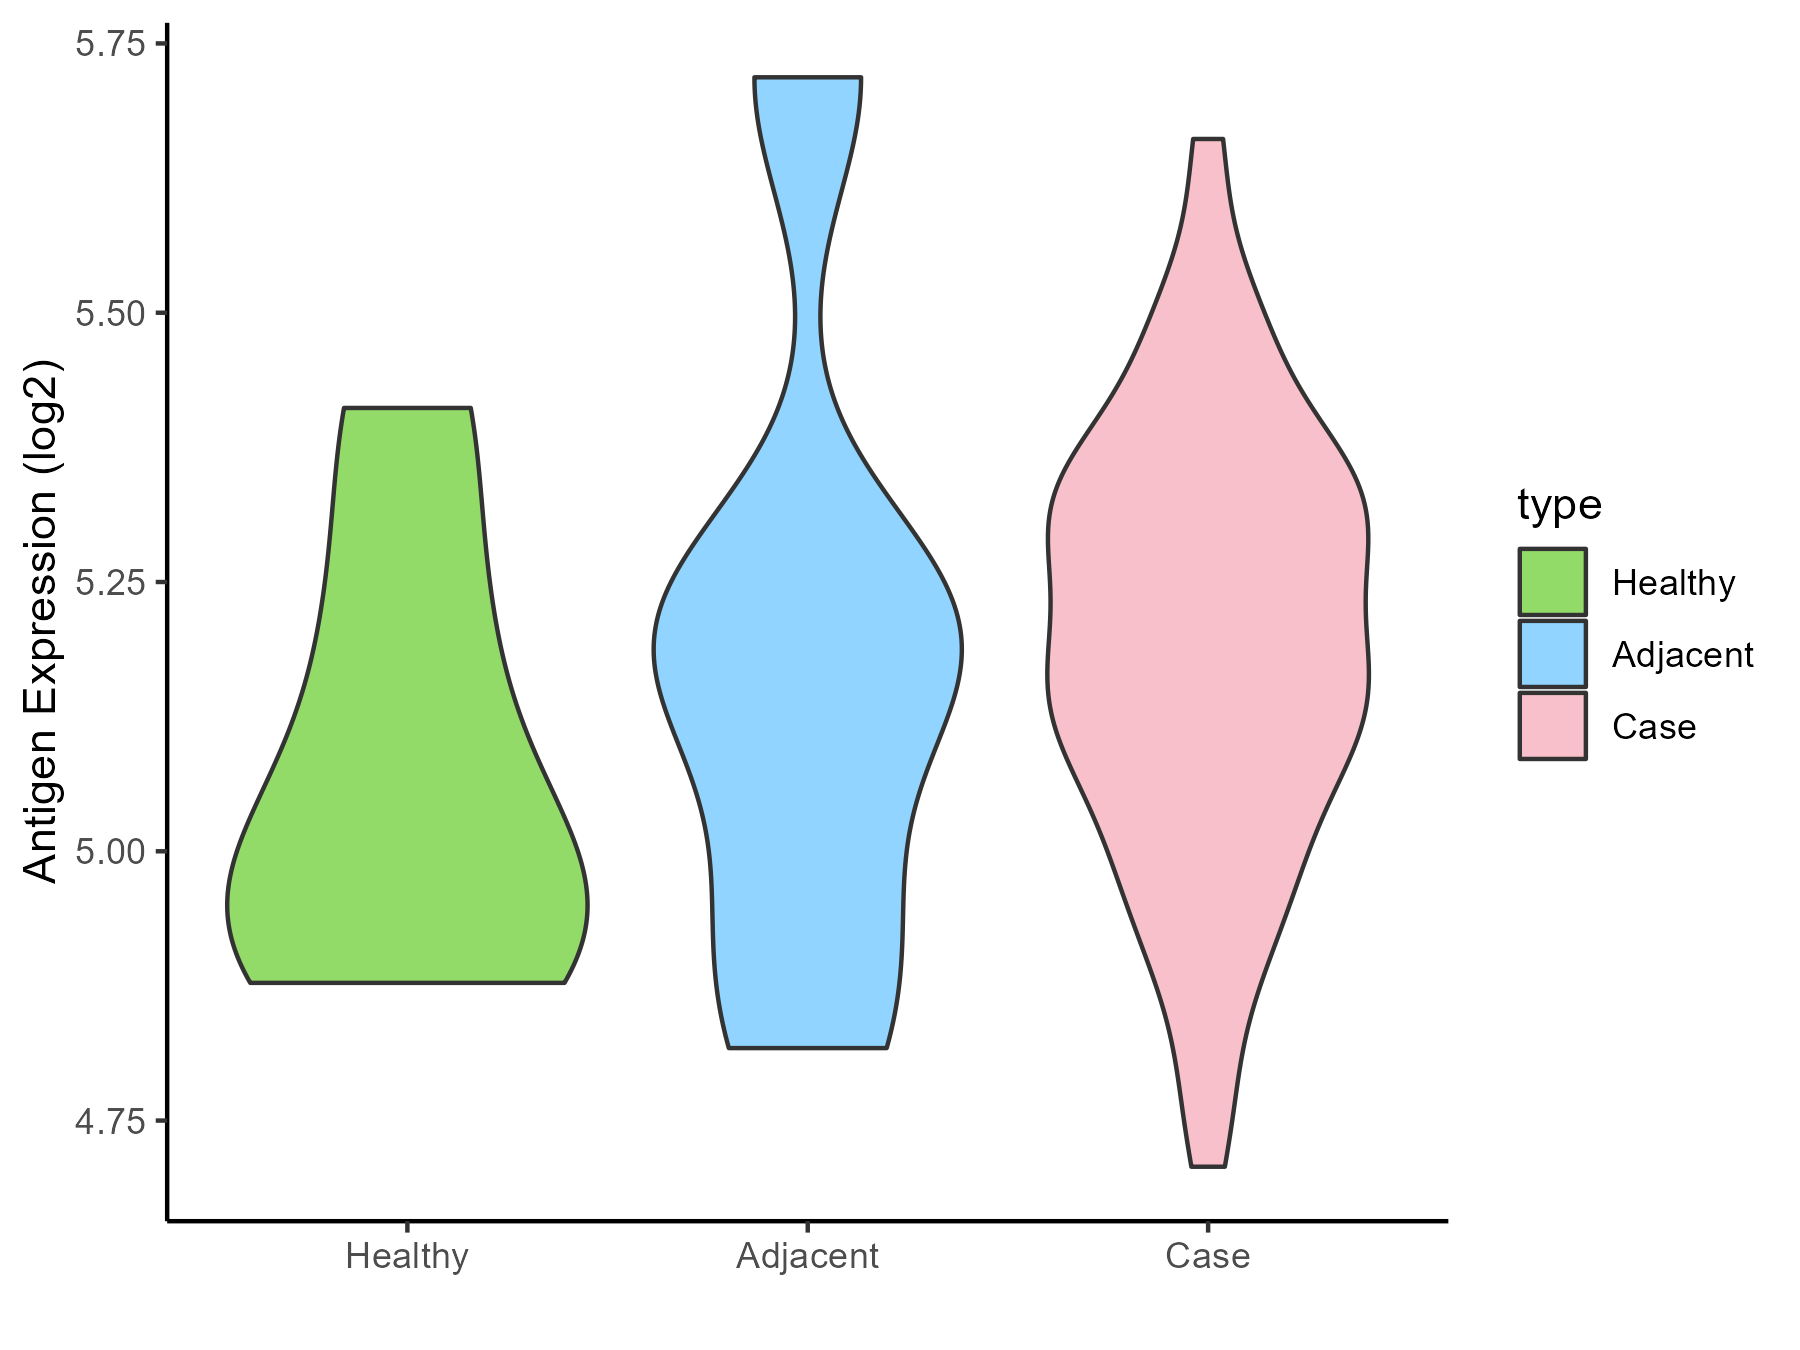
| The Expression Level of Disease Section Compare with the Healthy Individual Tissue | p-value: 0.00483207; Fold-change: -0.309130357; Z-score: -1.532039343 | |
| The Expression Level of Disease Section Compare with the Adjacent Tissue | p-value: 7.19E-28; Fold-change: -0.453385437; Z-score: -2.020541088 | |
| Disease-specific Antigen Abundances |
|
Click to View the Clearer Original Diagram |
| Differential expression pattern of antigen in diseases | ||
| The Studied Tissue | Urothelium | |
| The Specific Disease | Ureter cancer | |
| The Expression Level of Disease Section Compare with the Healthy Individual Tissue | p-value: 0.685295868; Fold-change: 0.011574557; Z-score: 0.08755066 | |
| Disease-specific Antigen Abundances |
|
Click to View the Clearer Original Diagram |
ICD Disease Classification 20
| Differential expression pattern of antigen in diseases | ||
| The Studied Tissue | Adipose | |
| The Specific Disease | Simpson golabi behmel syndrome | |
| The Expression Level of Disease Section Compare with the Healthy Individual Tissue | p-value: 0.12293909; Fold-change: 0.071545773; Z-score: 0.880288148 | |
| Disease-specific Antigen Abundances |
|
Click to View the Clearer Original Diagram |
| Differential expression pattern of antigen in diseases | ||
| The Studied Tissue | Perituberal | |
| The Specific Disease | Tuberous sclerosis complex | |
| The Expression Level of Disease Section Compare with the Healthy Individual Tissue | p-value: 0.16344363; Fold-change: 0.251185468; Z-score: 1.167433398 | |
| Disease-specific Antigen Abundances |
|
Click to View the Clearer Original Diagram |
ICD Disease Classification 3
| Differential expression pattern of antigen in diseases | ||
| The Studied Tissue | Bone marrow | |
| The Specific Disease | Anemia | |
| The Expression Level of Disease Section Compare with the Healthy Individual Tissue | p-value: 0.713856233; Fold-change: 0.046770081; Z-score: 0.226070042 | |
| Disease-specific Antigen Abundances |
|
Click to View the Clearer Original Diagram |
| Differential expression pattern of antigen in diseases | ||
| The Studied Tissue | Peripheral blood | |
| The Specific Disease | Sickle cell disease | |
| The Expression Level of Disease Section Compare with the Healthy Individual Tissue | p-value: 0.481139088; Fold-change: 0.070283558; Z-score: 0.356491361 | |
| Disease-specific Antigen Abundances |
|
Click to View the Clearer Original Diagram |
| Differential expression pattern of antigen in diseases | ||
| The Studied Tissue | Whole blood | |
| The Specific Disease | Thrombocythemia | |
| The Expression Level of Disease Section Compare with the Healthy Individual Tissue | p-value: 0.685824948; Fold-change: -0.030142767; Z-score: -0.23211535 | |
| Disease-specific Antigen Abundances |
|
Click to View the Clearer Original Diagram |
ICD Disease Classification 4
| Differential expression pattern of antigen in diseases | ||
| The Studied Tissue | Whole blood | |
| The Specific Disease | Scleroderma | |
| The Expression Level of Disease Section Compare with the Healthy Individual Tissue | p-value: 0.727161659; Fold-change: -0.075131185; Z-score: -0.156485899 | |
| Disease-specific Antigen Abundances |
|
Click to View the Clearer Original Diagram |
| Differential expression pattern of antigen in diseases | ||
| The Studied Tissue | Salivary gland | |
| The Specific Disease | Sjogren syndrome | |
| The Expression Level of Disease Section Compare with the Healthy Individual Tissue | p-value: 0.205944381; Fold-change: -0.321823967; Z-score: -1.238248636 | |
| The Expression Level of Disease Section Compare with the Adjacent Tissue | p-value: 0.0360331; Fold-change: -0.293650716; Z-score: -2.280971814 | |
| Disease-specific Antigen Abundances |
|
Click to View the Clearer Original Diagram |
| Differential expression pattern of antigen in diseases | ||
| The Studied Tissue | Peripheral blood | |
| The Specific Disease | Behcet disease | |
| The Expression Level of Disease Section Compare with the Healthy Individual Tissue | p-value: 0.977293134; Fold-change: 0.02692613; Z-score: 0.084008119 | |
| Disease-specific Antigen Abundances |
|
Click to View the Clearer Original Diagram |
| Differential expression pattern of antigen in diseases | ||
| The Studied Tissue | Whole blood | |
| The Specific Disease | Autosomal dominant monocytopenia | |
| The Expression Level of Disease Section Compare with the Healthy Individual Tissue | p-value: 0.686444908; Fold-change: 0.010956123; Z-score: 0.077316942 | |
| Disease-specific Antigen Abundances |
|
Click to View the Clearer Original Diagram |
ICD Disease Classification 5
| Differential expression pattern of antigen in diseases | ||
| The Studied Tissue | Liver | |
| The Specific Disease | Type 2 diabetes | |
| The Expression Level of Disease Section Compare with the Healthy Individual Tissue | p-value: 0.312088257; Fold-change: -0.025965167; Z-score: -0.256695555 | |
| Disease-specific Antigen Abundances |
|
Click to View the Clearer Original Diagram |
| Differential expression pattern of antigen in diseases | ||
| The Studied Tissue | Vastus lateralis muscle | |
| The Specific Disease | Polycystic ovary syndrome | |
| The Expression Level of Disease Section Compare with the Healthy Individual Tissue | p-value: 0.352269551; Fold-change: 0.080417634; Z-score: 0.693726536 | |
| Disease-specific Antigen Abundances |
|
Click to View the Clearer Original Diagram |
| Differential expression pattern of antigen in diseases | ||
| The Studied Tissue | Subcutaneous Adipose | |
| The Specific Disease | Obesity | |
| The Expression Level of Disease Section Compare with the Healthy Individual Tissue | p-value: 0.371508991; Fold-change: -0.000305341; Z-score: -0.001936737 | |
| Disease-specific Antigen Abundances |
|
Click to View the Clearer Original Diagram |
| Differential expression pattern of antigen in diseases | ||
| The Studied Tissue | Biceps muscle | |
| The Specific Disease | Pompe disease | |
| The Expression Level of Disease Section Compare with the Healthy Individual Tissue | p-value: 0.374784036; Fold-change: -0.012090491; Z-score: -0.151685242 | |
| Disease-specific Antigen Abundances |
|
Click to View the Clearer Original Diagram |
| Differential expression pattern of antigen in diseases | ||
| The Studied Tissue | Whole blood | |
| The Specific Disease | Batten disease | |
| The Expression Level of Disease Section Compare with the Healthy Individual Tissue | p-value: 0.096807504; Fold-change: 0.646134778; Z-score: 1.37762977 | |
| Disease-specific Antigen Abundances |
|
Click to View the Clearer Original Diagram |
ICD Disease Classification 6
| Differential expression pattern of antigen in diseases | ||
| The Studied Tissue | Whole blood | |
| The Specific Disease | Autism | |
| The Expression Level of Disease Section Compare with the Healthy Individual Tissue | p-value: 0.186814943; Fold-change: 0.083428594; Z-score: 0.298093773 | |
| Disease-specific Antigen Abundances |
|
Click to View the Clearer Original Diagram |
| Differential expression pattern of antigen in diseases | ||
| The Studied Tissue | Whole blood | |
| The Specific Disease | Anxiety disorder | |
| The Expression Level of Disease Section Compare with the Healthy Individual Tissue | p-value: 0.030404127; Fold-change: 0.309518825; Z-score: 0.796949303 | |
| Disease-specific Antigen Abundances |
|
Click to View the Clearer Original Diagram |
ICD Disease Classification 8
| Differential expression pattern of antigen in diseases | ||
| The Studied Tissue | Substantia nigra | |
| The Specific Disease | Parkinson disease | |
| The Expression Level of Disease Section Compare with the Healthy Individual Tissue | p-value: 0.412309285; Fold-change: 0.149830631; Z-score: 0.954388748 | |
| Disease-specific Antigen Abundances |
|
Click to View the Clearer Original Diagram |
| Differential expression pattern of antigen in diseases | ||
| The Studied Tissue | Whole blood | |
| The Specific Disease | Huntington disease | |
| The Expression Level of Disease Section Compare with the Healthy Individual Tissue | p-value: 0.253668926; Fold-change: 0.080115972; Z-score: 0.290992463 | |
| Disease-specific Antigen Abundances |
|
Click to View the Clearer Original Diagram |
| Differential expression pattern of antigen in diseases | ||
| The Studied Tissue | Entorhinal cortex | |
| The Specific Disease | Alzheimer disease | |
| The Expression Level of Disease Section Compare with the Healthy Individual Tissue | p-value: 9.46E-05; Fold-change: -0.049002687; Z-score: -0.275235133 | |
| Disease-specific Antigen Abundances |
|
Click to View the Clearer Original Diagram |
| Differential expression pattern of antigen in diseases | ||
| The Studied Tissue | Whole blood | |
| The Specific Disease | Seizure | |
| The Expression Level of Disease Section Compare with the Healthy Individual Tissue | p-value: 0.182658001; Fold-change: -0.008784825; Z-score: -0.029543633 | |
| Disease-specific Antigen Abundances |
|
Click to View the Clearer Original Diagram |
| Differential expression pattern of antigen in diseases | ||
| The Studied Tissue | Skin | |
| The Specific Disease | Lateral sclerosis | |
| The Expression Level of Disease Section Compare with the Healthy Individual Tissue | p-value: 0.908428841; Fold-change: 0.038060892; Z-score: 0.146849167 | |
| Disease-specific Antigen Abundances |
|
Click to View the Clearer Original Diagram |
| The Studied Tissue | Cervical spinal cord | |
| The Specific Disease | Lateral sclerosis | |
| The Expression Level of Disease Section Compare with the Healthy Individual Tissue | p-value: 0.046919751; Fold-change: 0.112954517; Z-score: 1.09880085 | |
| Disease-specific Antigen Abundances |
|
Click to View the Clearer Original Diagram |
| Differential expression pattern of antigen in diseases | ||
| The Studied Tissue | Muscle | |
| The Specific Disease | Muscular atrophy | |
| The Expression Level of Disease Section Compare with the Healthy Individual Tissue | p-value: 0.297465848; Fold-change: -0.14429818; Z-score: -0.54405598 | |
| Disease-specific Antigen Abundances |
|
Click to View the Clearer Original Diagram |
| Differential expression pattern of antigen in diseases | ||
| The Studied Tissue | Muscle | |
| The Specific Disease | Myopathy | |
| The Expression Level of Disease Section Compare with the Healthy Individual Tissue | p-value: 0.069433026; Fold-change: 0.125000643; Z-score: 1.145116703 | |
| Disease-specific Antigen Abundances |
|
Click to View the Clearer Original Diagram |
References