Antigen Information
General Information of This Antigen
| Antigen ID | TAR0EIAGD |
|||||
|---|---|---|---|---|---|---|
| Antigen Name | Piezo-type mechanosensitive ion channel component 1 (PIEZO1) |
|||||
| Gene Name | PIEZO1 |
|||||
| Gene ID | ||||||
| Synonym | FAM38A; KIAA0233; Membrane protein induced by beta-amyloid treatment;Protein FAM38A |
|||||
| Sequence |
MEPHVLGAVLYWLLLPCALLAACLLRFSGLSLVYLLFLLLLPWFPGPTRCGLQGHTGRLL
RALLGLSLLFLVAHLALQICLHIVPRLDQLLGPSCSRWETLSRHIGVTRLDLKDIPNAIR LVAPDLGILVVSSVCLGICGRLARNTRQSPHPRELDDDERDVDASPTAGLQEAATLAPTR RSRLAARFRVTAHWLLVAAGRVLAVTLLALAGIAHPSALSSVYLLLFLALCTWWACHFPI STRGFSRLCVAVGCFGAGHLICLYCYQMPLAQALLPPAGIWARVLGLKDFVGPTNCSSPH ALVLNTGLDWPVYASPGVLLLLCYATASLRKLRAYRPSGQRKEAAKGYEARELELAELDQ WPQERESDQHVVPTAPDTEADNCIVHELTGQSSVLRRPVRPKRAEPREASPLHSLGHLIM DQSYVCALIAMMVWSITYHSWLTFVLLLWACLIWTVRSRHQLAMLCSPCILLYGMTLCCL RYVWAMDLRPELPTTLGPVSLRQLGLEHTRYPCLDLGAMLLYTLTFWLLLRQFVKEKLLK WAESPAALTEVTVADTEPTRTQTLLQSLGELVKGVYAKYWIYVCAGMFIVVSFAGRLVVY KIVYMFLFLLCLTLFQVYYSLWRKLLKAFWWLVVAYTMLVLIAVYTFQFQDFPAYWRNLT GFTDEQLGDLGLEQFSVSELFSSILVPGFFLLACILQLHYFHRPFMQLTDMEHVSLPGTR LPRWAHRQDAVSGTPLLREEQQEHQQQQQEEEEEEEDSRDEGLGVATPHQATQVPEGAAK WGLVAERLLELAAGFSDVLSRVQVFLRRLLELHVFKLVALYTVWVALKEVSVMNLLLVVL WAFALPYPRFRPMASCLSTVWTCVIIVCKMLYQLKVVNPQEYSSNCTEPFPNSTNLLPTE ISQSLLYRGPVDPANWFGVRKGFPNLGYIQNHLQVLLLLVFEAIVYRRQEHYRRQHQLAP LPAQAVFASGTRQQLDQDLLGCLKYFINFFFYKFGLEICFLMAVNVIGQRMNFLVTLHGC WLVAILTRRHRQAIARLWPNYCLFLALFLLYQYLLCLGMPPALCIDYPWRWSRAVPMNSA LIKWLYLPDFFRAPNSTNLISDFLLLLCASQQWQVFSAERTEEWQRMAGVNTDRLEPLRG EPNPVPNFIHCRSYLDMLKVAVFRYLFWLVLVVVFVTGATRISIFGLGYLLACFYLLLFG TALLQRDTRARLVLWDCLILYNVTVIISKNMLSLLACVFVEQMQTGFCWVIQLFSLVCTV KGYYDPKEMMDRDQDCLLPVEEAGIIWDSVCFFFLLLQRRVFLSHYYLHVRADLQATALL ASRGFALYNAANLKSIDFHRRIEEKSLAQLKRQMERIRAKQEKHRQGRVDRSRPQDTLGP KDPGLEPGPDSPGGSSPPRRQWWRPWLDHATVIHSGDYFLFESDSEEEEEAVPEDPRPSA QSAFQLAYQAWVTNAQAVLRRRQQEQEQARQEQAGQLPTGGGPSQEVEPAEGPEEAAAGR SHVVQRVLSTAQFLWMLGQALVDELTRWLQEFTRHHGTMSDVLRAERYLLTQELLQGGEV HRGVLDQLYTSQAEATLPGPTEAPNAPSTVSSGLGAEEPLSSMTDDMGSPLSTGYHTRSG SEEAVTDPGEREAGASLYQGLMRTASELLLDRRLRIPELEEAELFAEGQGRALRLLRAVY QCVAAHSELLCYFIIILNHMVTASAGSLVLPVLVFLWAMLSIPRPSKRFWMTAIVFTEIA VVVKYLFQFGFFPWNSHVVLRRYENKPYFPPRILGLEKTDGYIKYDLVQLMALFFHRSQL LCYGLWDHEEDSPSKEHDKSGEEEQGAEEGPGVPAATTEDHIQVEARVGPTDGTPEPQVE LRPRDTRRISLRFRRRKKEGPARKGAAAIEAEDREEEEGEEEKEAPTGREKRPSRSGGRV RAAGRRLQGFCLSLAQGTYRPLRRFFHDILHTKYRAATDVYALMFLADVVDFIIIIFGFW AFGKHSAATDITSSLSDDQVPEAFLVMLLIQFSTMVVDRALYLRKTVLGKLAFQVALVLA IHLWMFFILPAVTERMFNQNVVAQLWYFVKCIYFALSAYQIRCGYPTRILGNFLTKKYNH LNLFLFQGFRLVPFLVELRAVMDWVWTDTTLSLSSWMCVEDIYANIFIIKCSRETEKKYP QPKGQKKKKIVKYGMGGLIILFLIAIIWFPLLFMSLVRSVVGVVNQPIDVTVTLKLGGYE PLFTMSAQQPSIIPFTAQAYEELSRQFDPQPLAMQFISQYSPEDIVTAQIEGSSGALWRI SPPSRAQMKRELYNGTADITLRFTWNFQRDLAKGGTVEYANEKHMLALAPNS.RQLASLL EGTSDQSVVIPNLFPKYIRAPNGPEANPVKQLQPNEEADYLGVRIQLRREQGAGATGFLE WWVIELQECRTDCNLLPMVIFSDKVSPPSLGFLAGYGIMGLYVSIVLVIGKFVRGFFSEI SHSIMFEELPCVDRILKLCQDIFLVRETRELELEEELYAKLIFLYRSPETMIKWTREKE Click to Show/Hide
|
|||||
| Family | Phosphoethanolamine transferase family |
|||||
| Function |
Pore-forming subunit of a mechanosensitive non-specific cation channel. Generates currents characterized by a linear current-voltage relationship that are sensitive to ruthenium red and gadolinium. Plays a key role in epithelial cell adhesion by maintaining integrin activation through R- Ras recruitment to the ER, most probably in its activated state, and subsequent stimulation of calpain signaling. In the kidney, may contribute to the detection of intraluminal pressure changes and to urine flow sensing. Acts as shear-stress sensor that promotes endothelial cell organization and alignment in the direction of blood flow through calpain activation. Plays a key role in blood vessel formation and vascular structure in both development and adult physiology. Acts as sensor of phosphatidylserine (PS) flipping at the plasma membrane and governs morphogenesis of muscle cells. In myoblasts, flippase-mediated PS enrichment at the inner leaflet of plasma membrane triggers channel activation and Ca2+ influx followed by Rho GTPases signal transduction, leading to assembly of cortical actomyosin fibers and myotube formation.
Click to Show/Hide
|
|||||
| Uniprot Entry | ||||||
| HGNC ID | ||||||
| KEGG ID | ||||||
Each Antibody-drug Conjuate AND It's Component Related to This Antigen
Full List of The ADC Related to This Antigen
Anti-PIEZO1 mAb
| ADC Info | ADC Name | Payload | Target | Linker | Ref |
|---|---|---|---|---|---|
Anti-PIEZO1-MMAE |
Monomethyl auristatin E |
Microtubule (MT) |
Mc-Val-Cit-PABC |
[1] |
Tissue/Disease specific Abundances of This Antigen
Tissue specific Abundances of This Antigen
ICD Disease Classification 01
| Differential expression pattern of antigen in diseases | ||
| The Studied Tissue | Gingival | |
| The Specific Disease | Bacterial infection of gingival | |
| The Expression Level of Disease Section Compare with the Healthy Individual Tissue | p-value: 0.562757636; Fold-change: 0.075099429; Z-score: 0.27419559 | |
| Disease-specific Antigen Abundances |
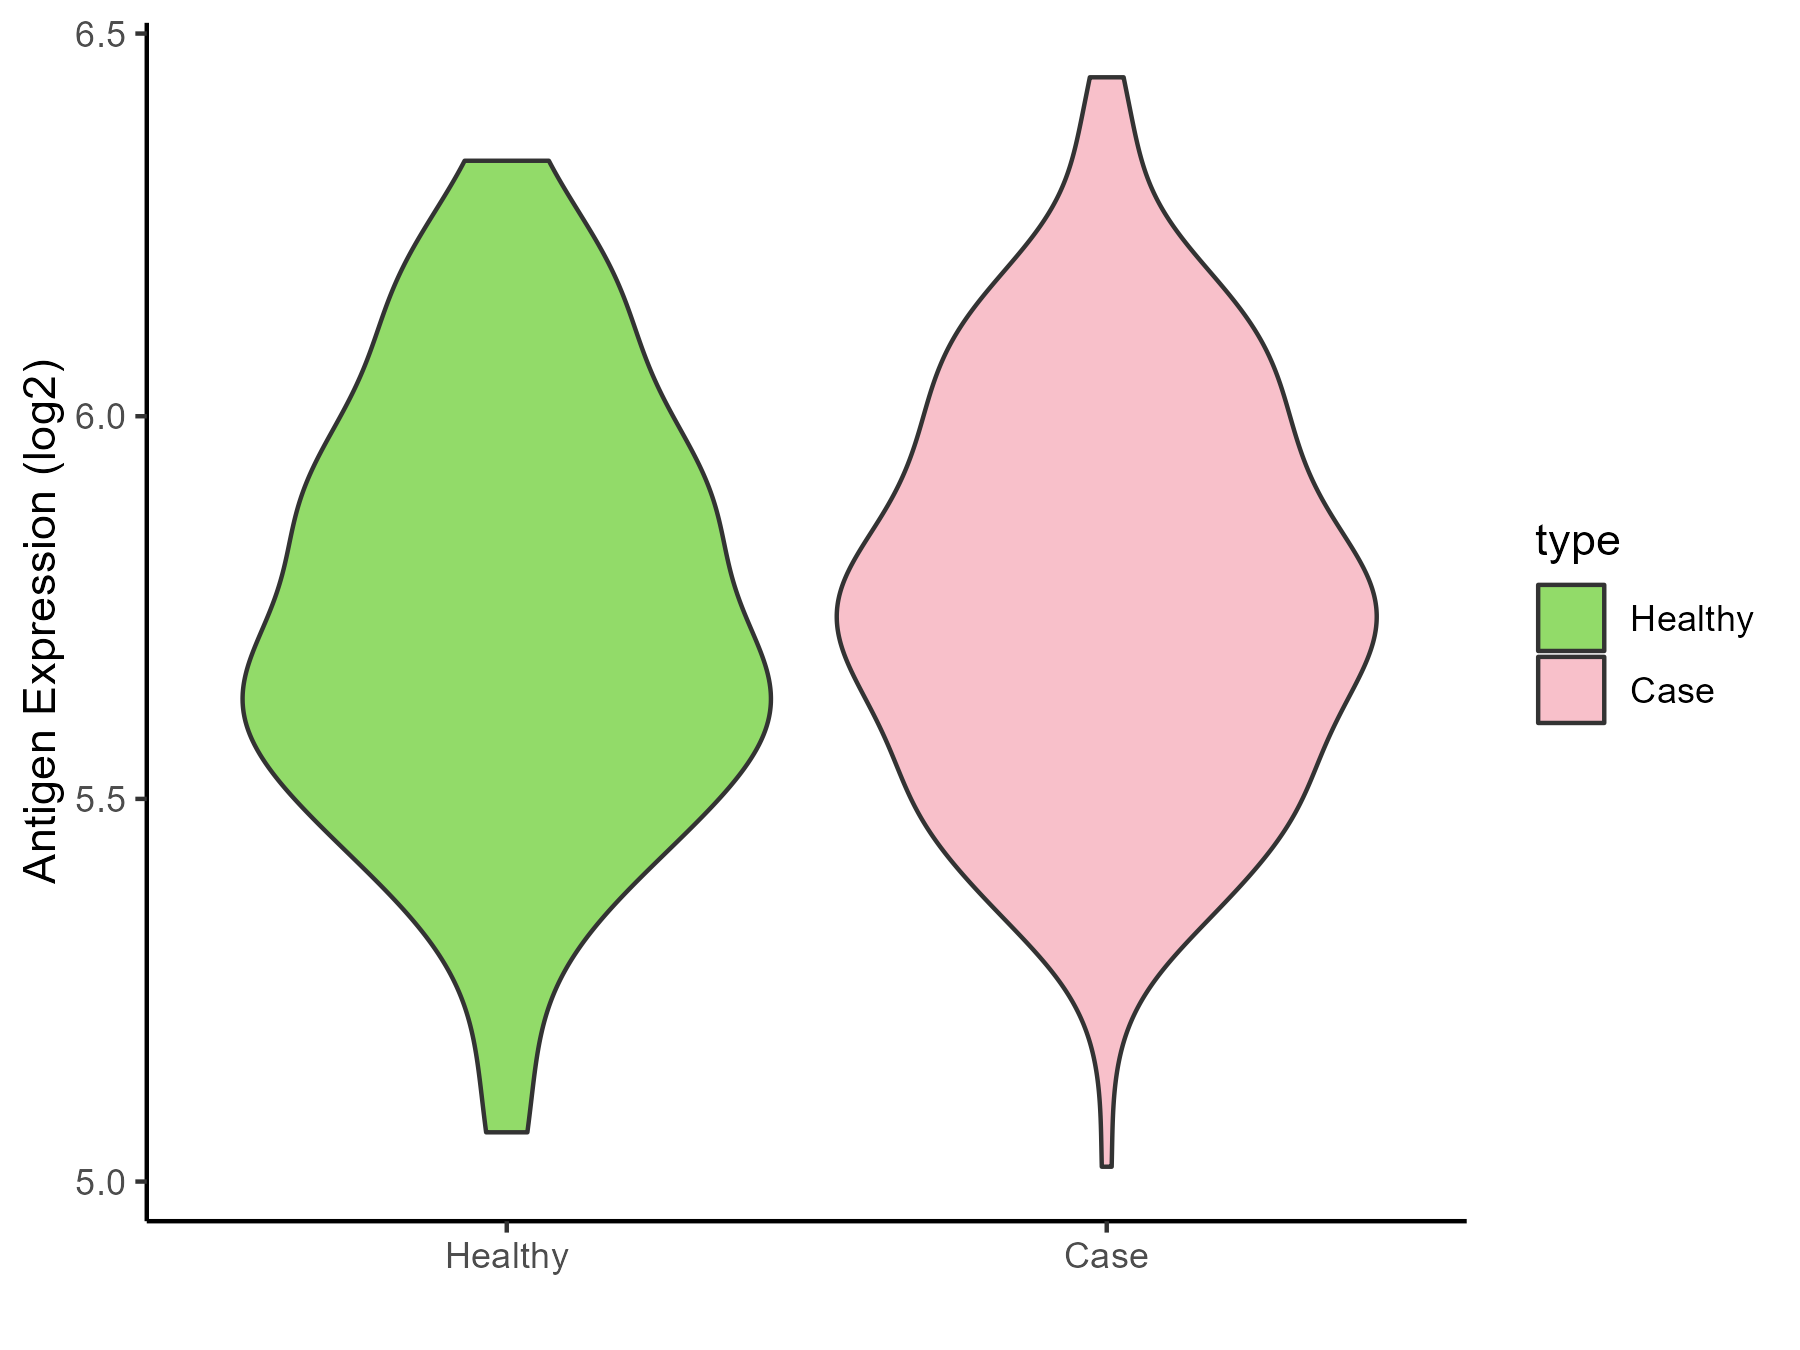
|
Click to View the Clearer Original Diagram |
ICD Disease Classification 02
| Differential expression pattern of antigen in diseases | ||
| The Studied Tissue | Brainstem | |
| The Specific Disease | Glioma | |
| The Expression Level of Disease Section Compare with the Healthy Individual Tissue | p-value: 0.391192904; Fold-change: -0.409436556; Z-score: -1.332852936 | |
| Disease-specific Antigen Abundances |
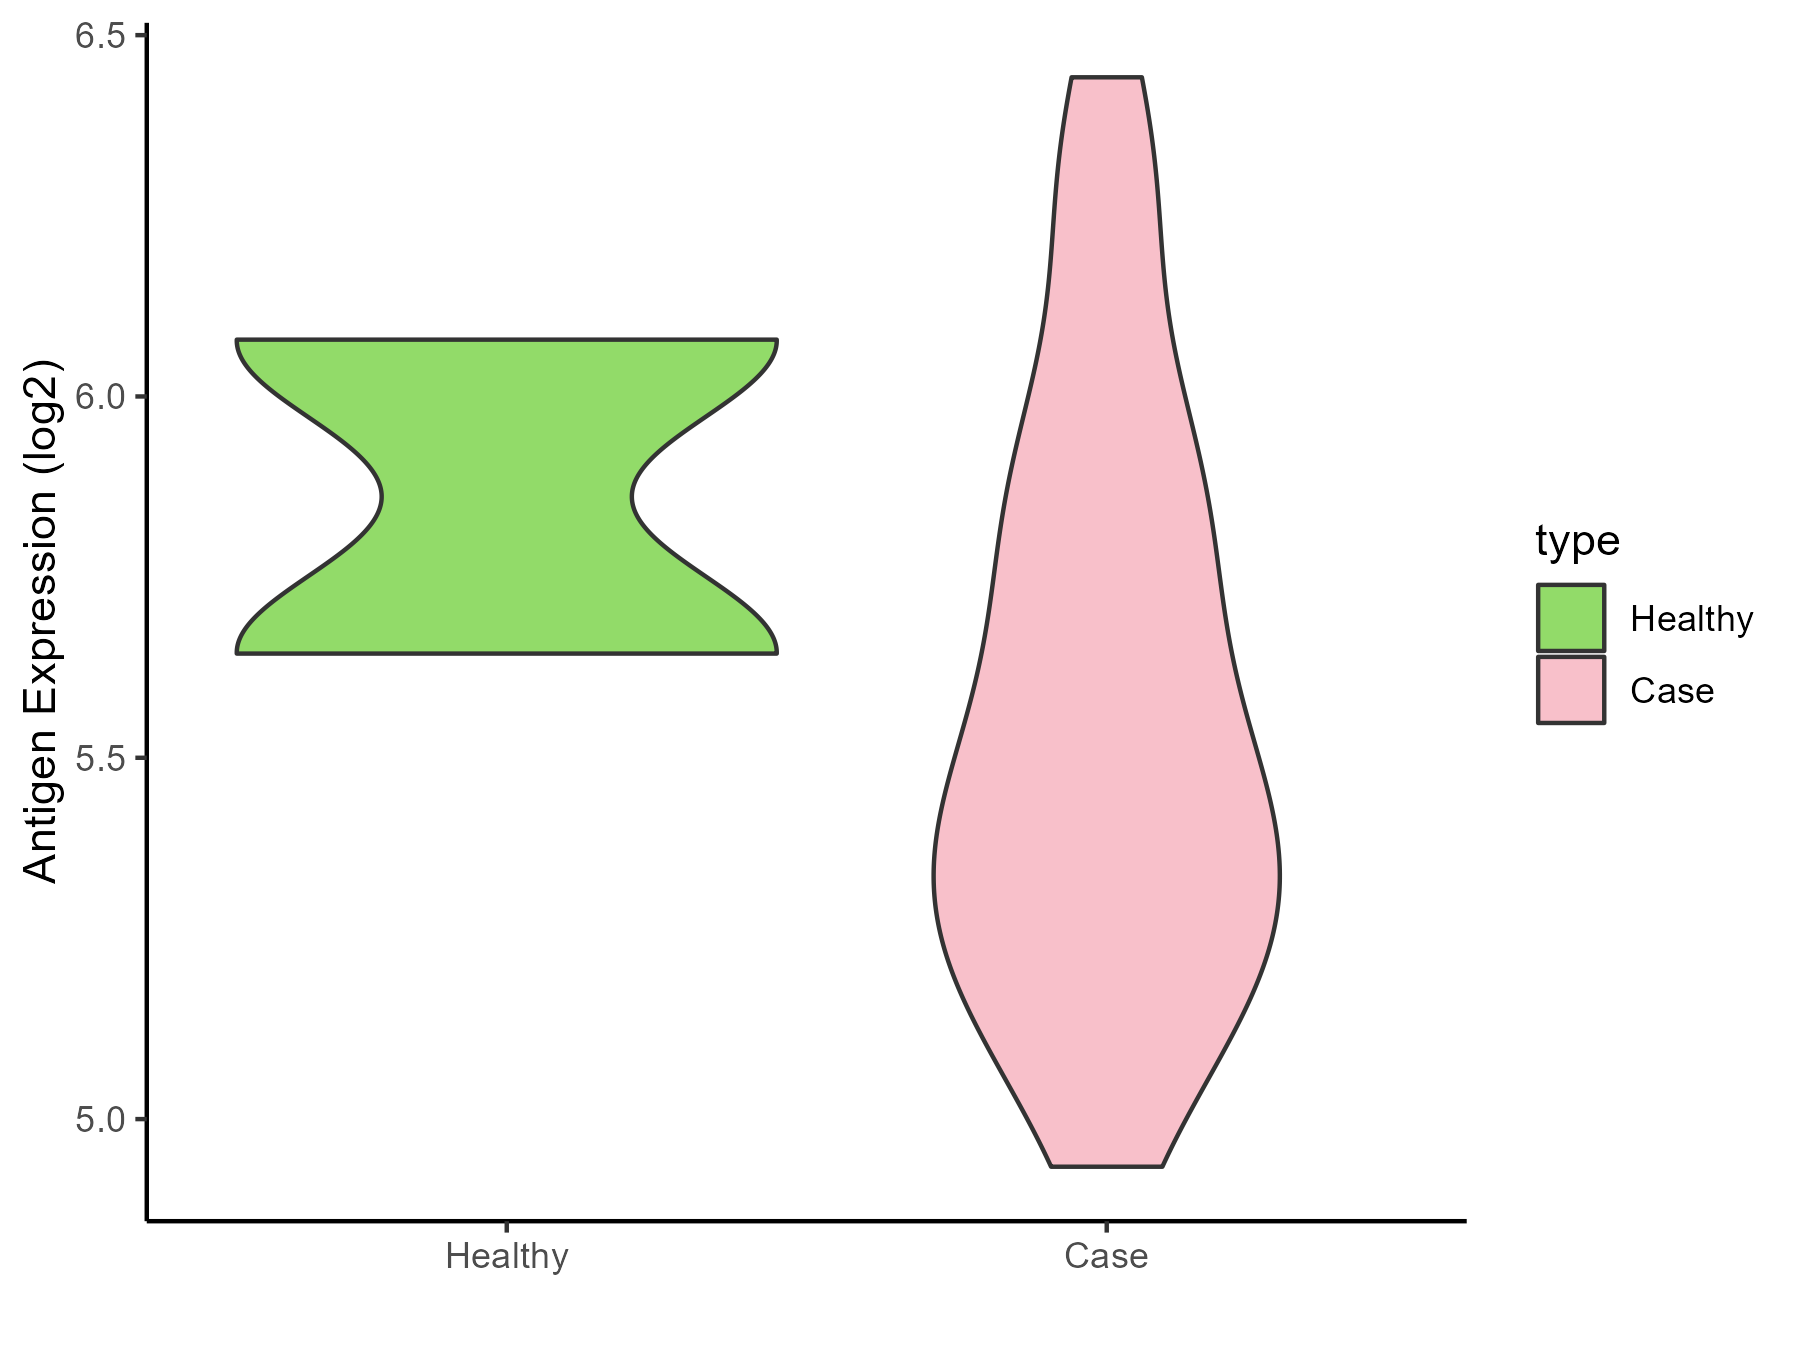
|
Click to View the Clearer Original Diagram |
| The Studied Tissue | White matter | |
| The Specific Disease | Glioma | |
| The Expression Level of Disease Section Compare with the Healthy Individual Tissue | p-value: 0.004587199; Fold-change: -0.216177325; Z-score: -0.740559074 | |
| Disease-specific Antigen Abundances |
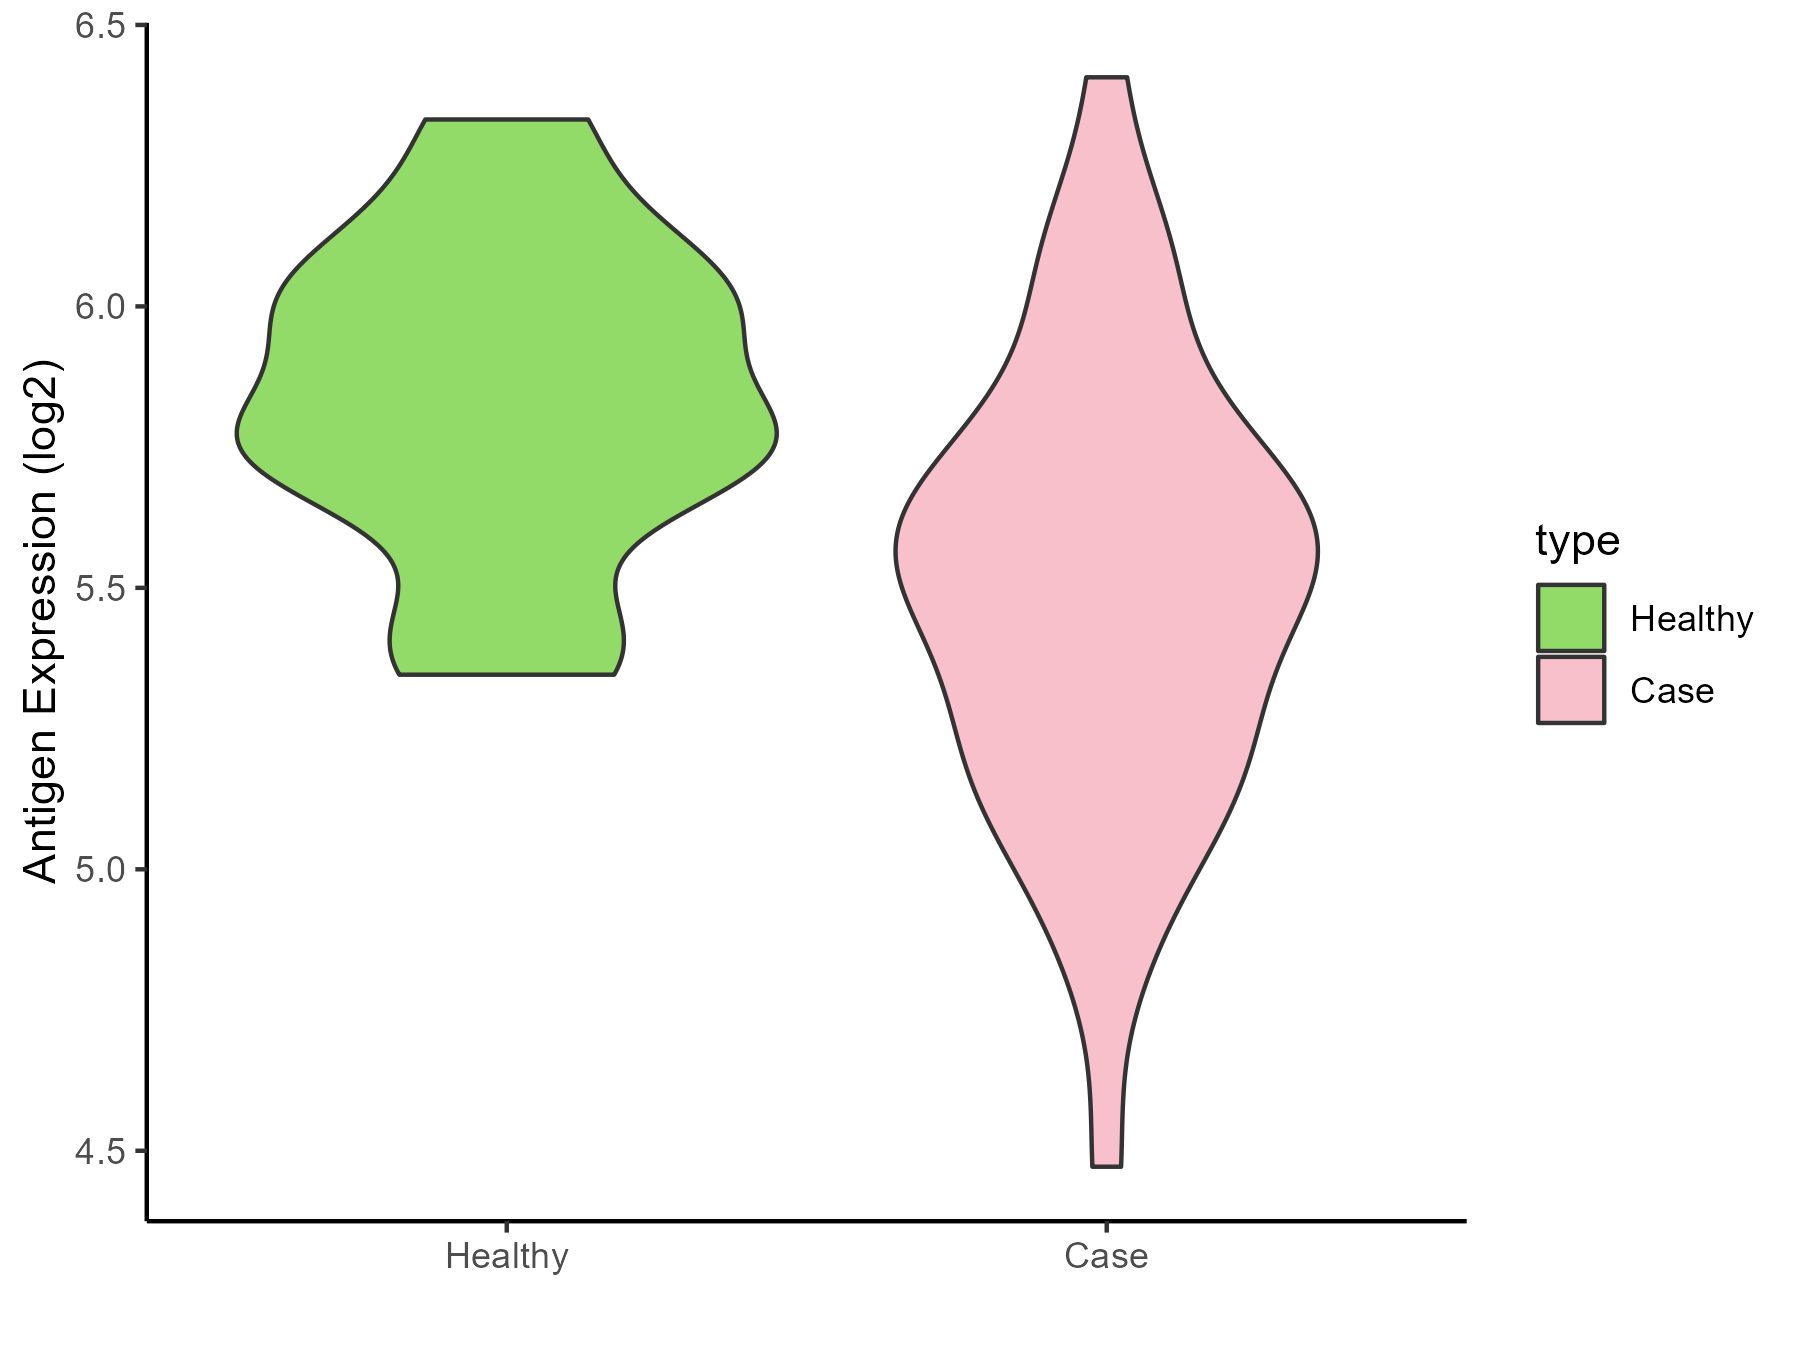
|
Click to View the Clearer Original Diagram |
| The Studied Tissue | Brainstem | |
| The Specific Disease | Neuroectodermal tumor | |
| The Expression Level of Disease Section Compare with the Healthy Individual Tissue | p-value: 0.001667592; Fold-change: -0.476686491; Z-score: -1.253939586 | |
| Disease-specific Antigen Abundances |
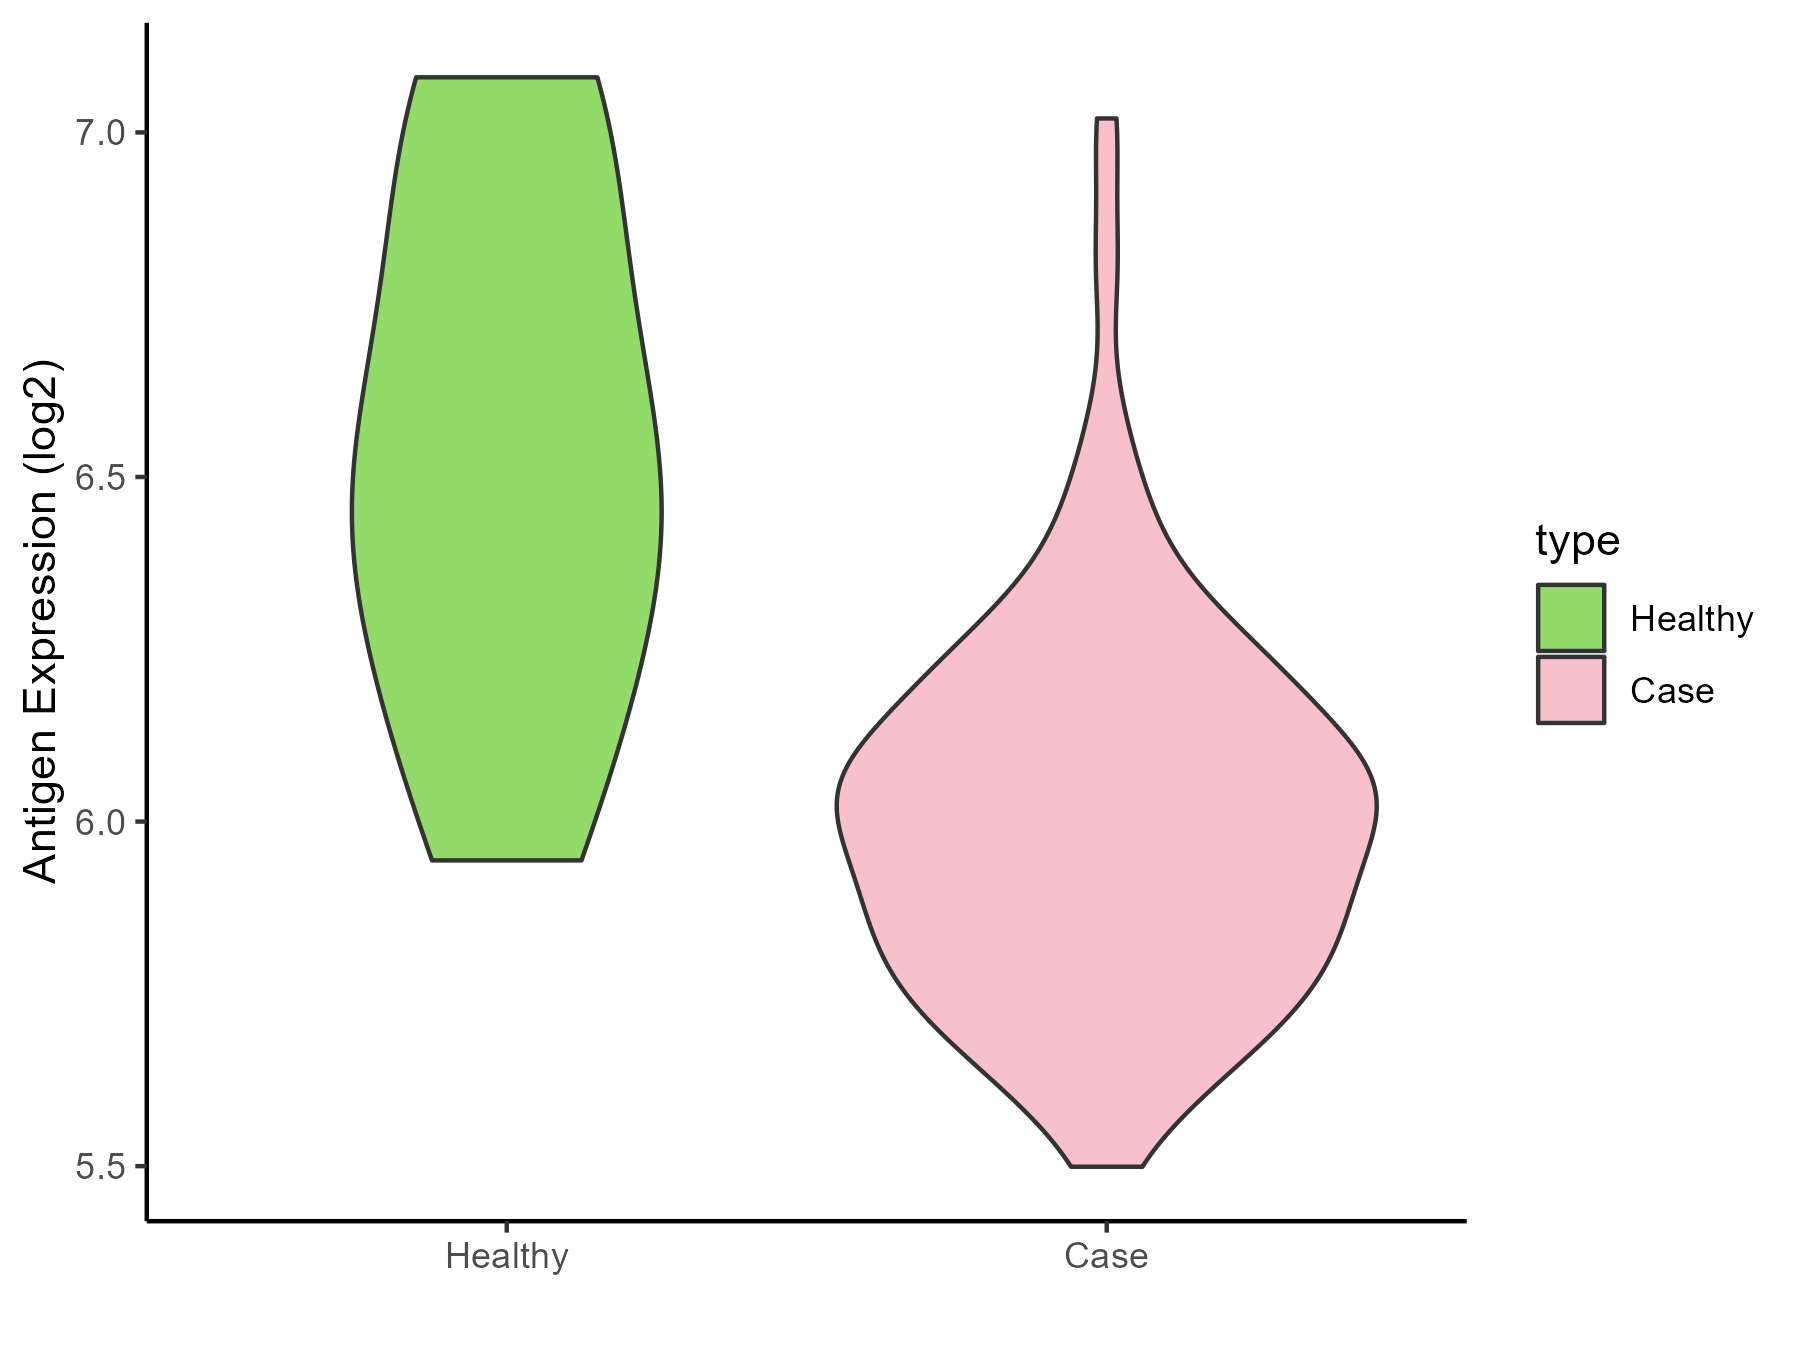
|
Click to View the Clearer Original Diagram |
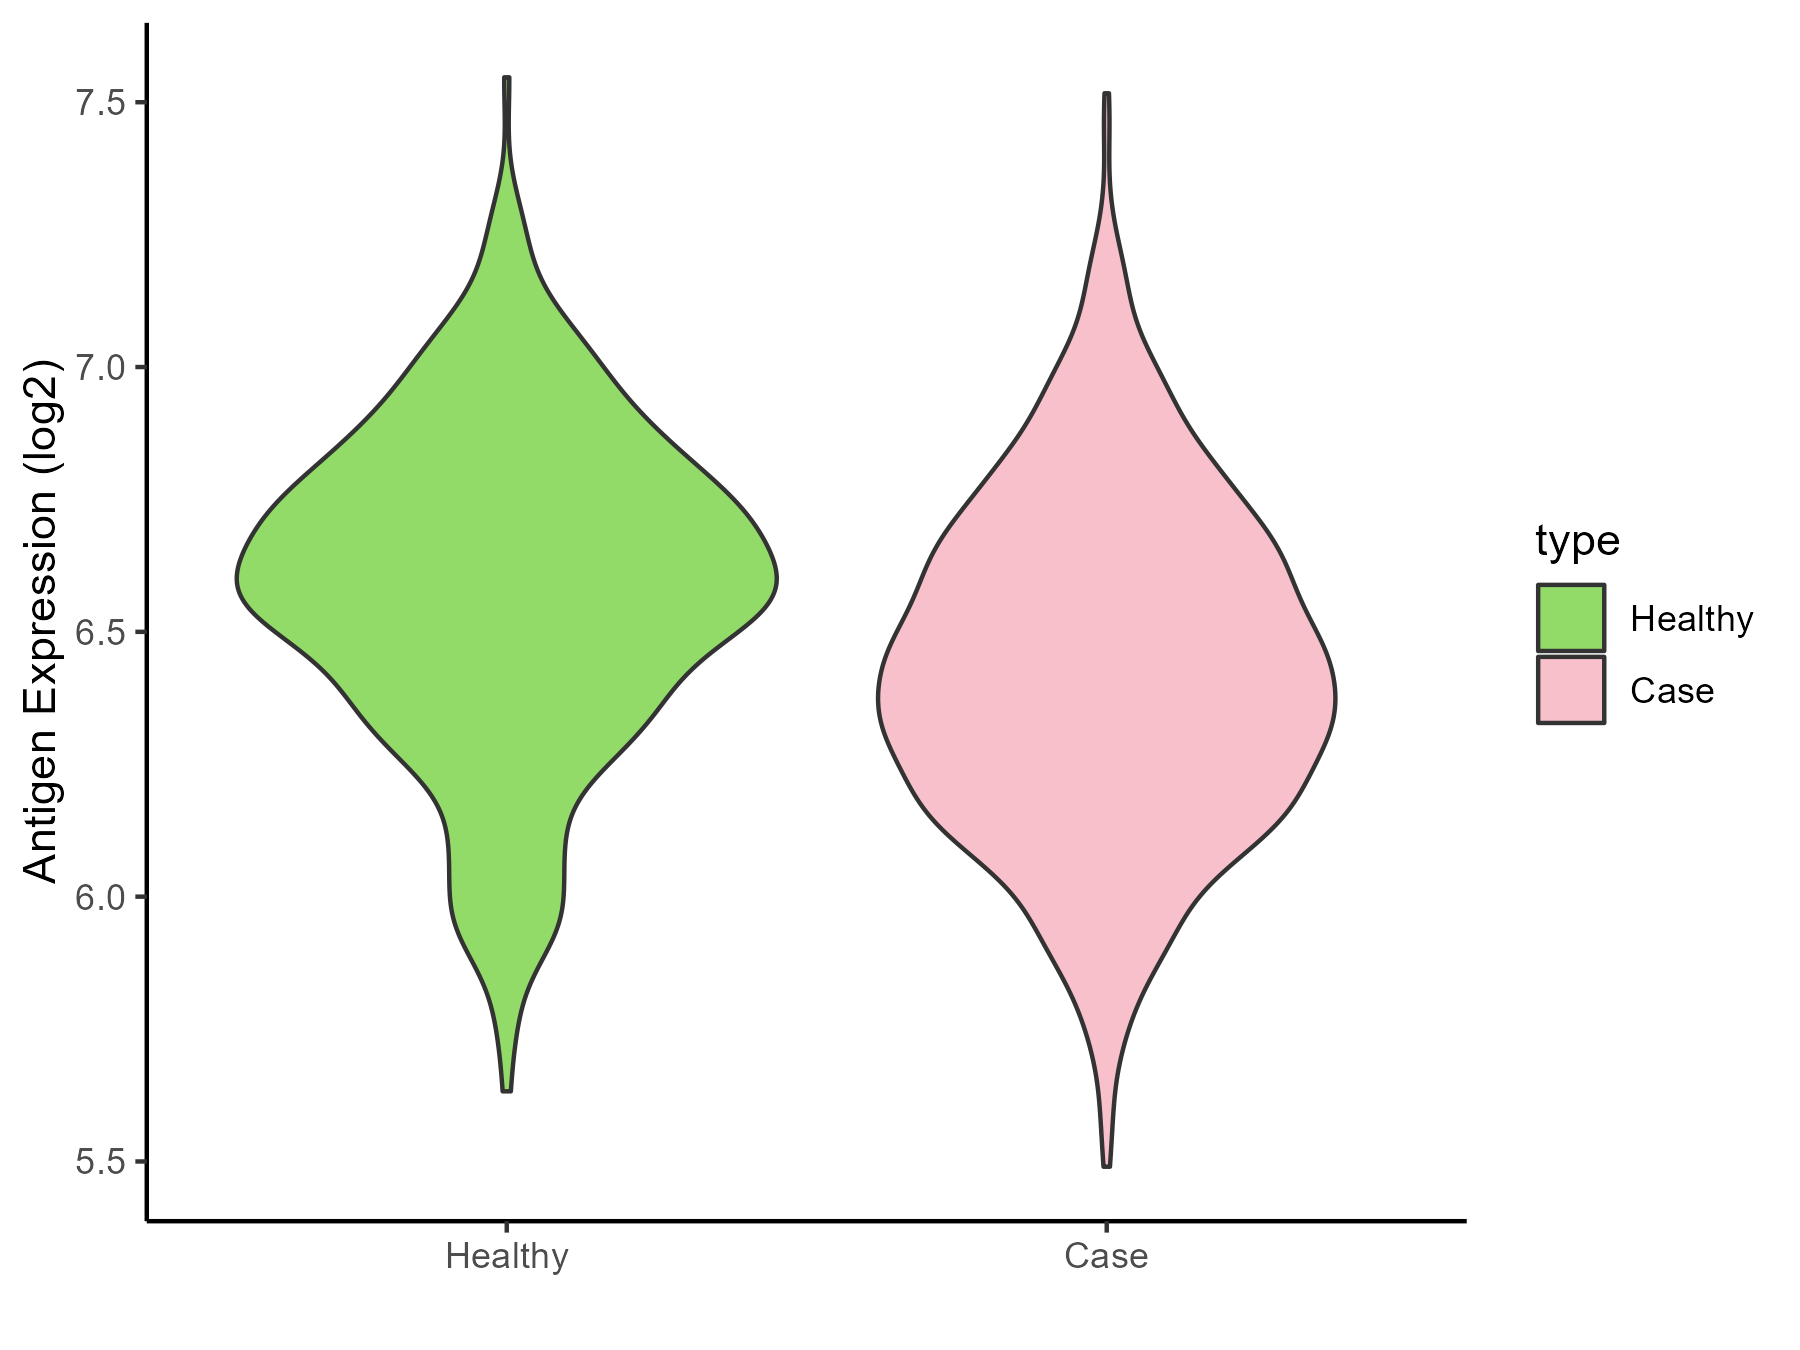
| The Studied Tissue | Nervous | |
| The Specific Disease | Brain cancer | |
| The Expression Level of Disease Section Compare with the Healthy Individual Tissue | p-value: 5.49E-16; Fold-change: -0.177497073; Z-score: -0.580344297 | |
| Disease-specific Antigen Abundances |
|
Click to View the Clearer Original Diagram |
| Differential expression pattern of antigen in diseases | ||
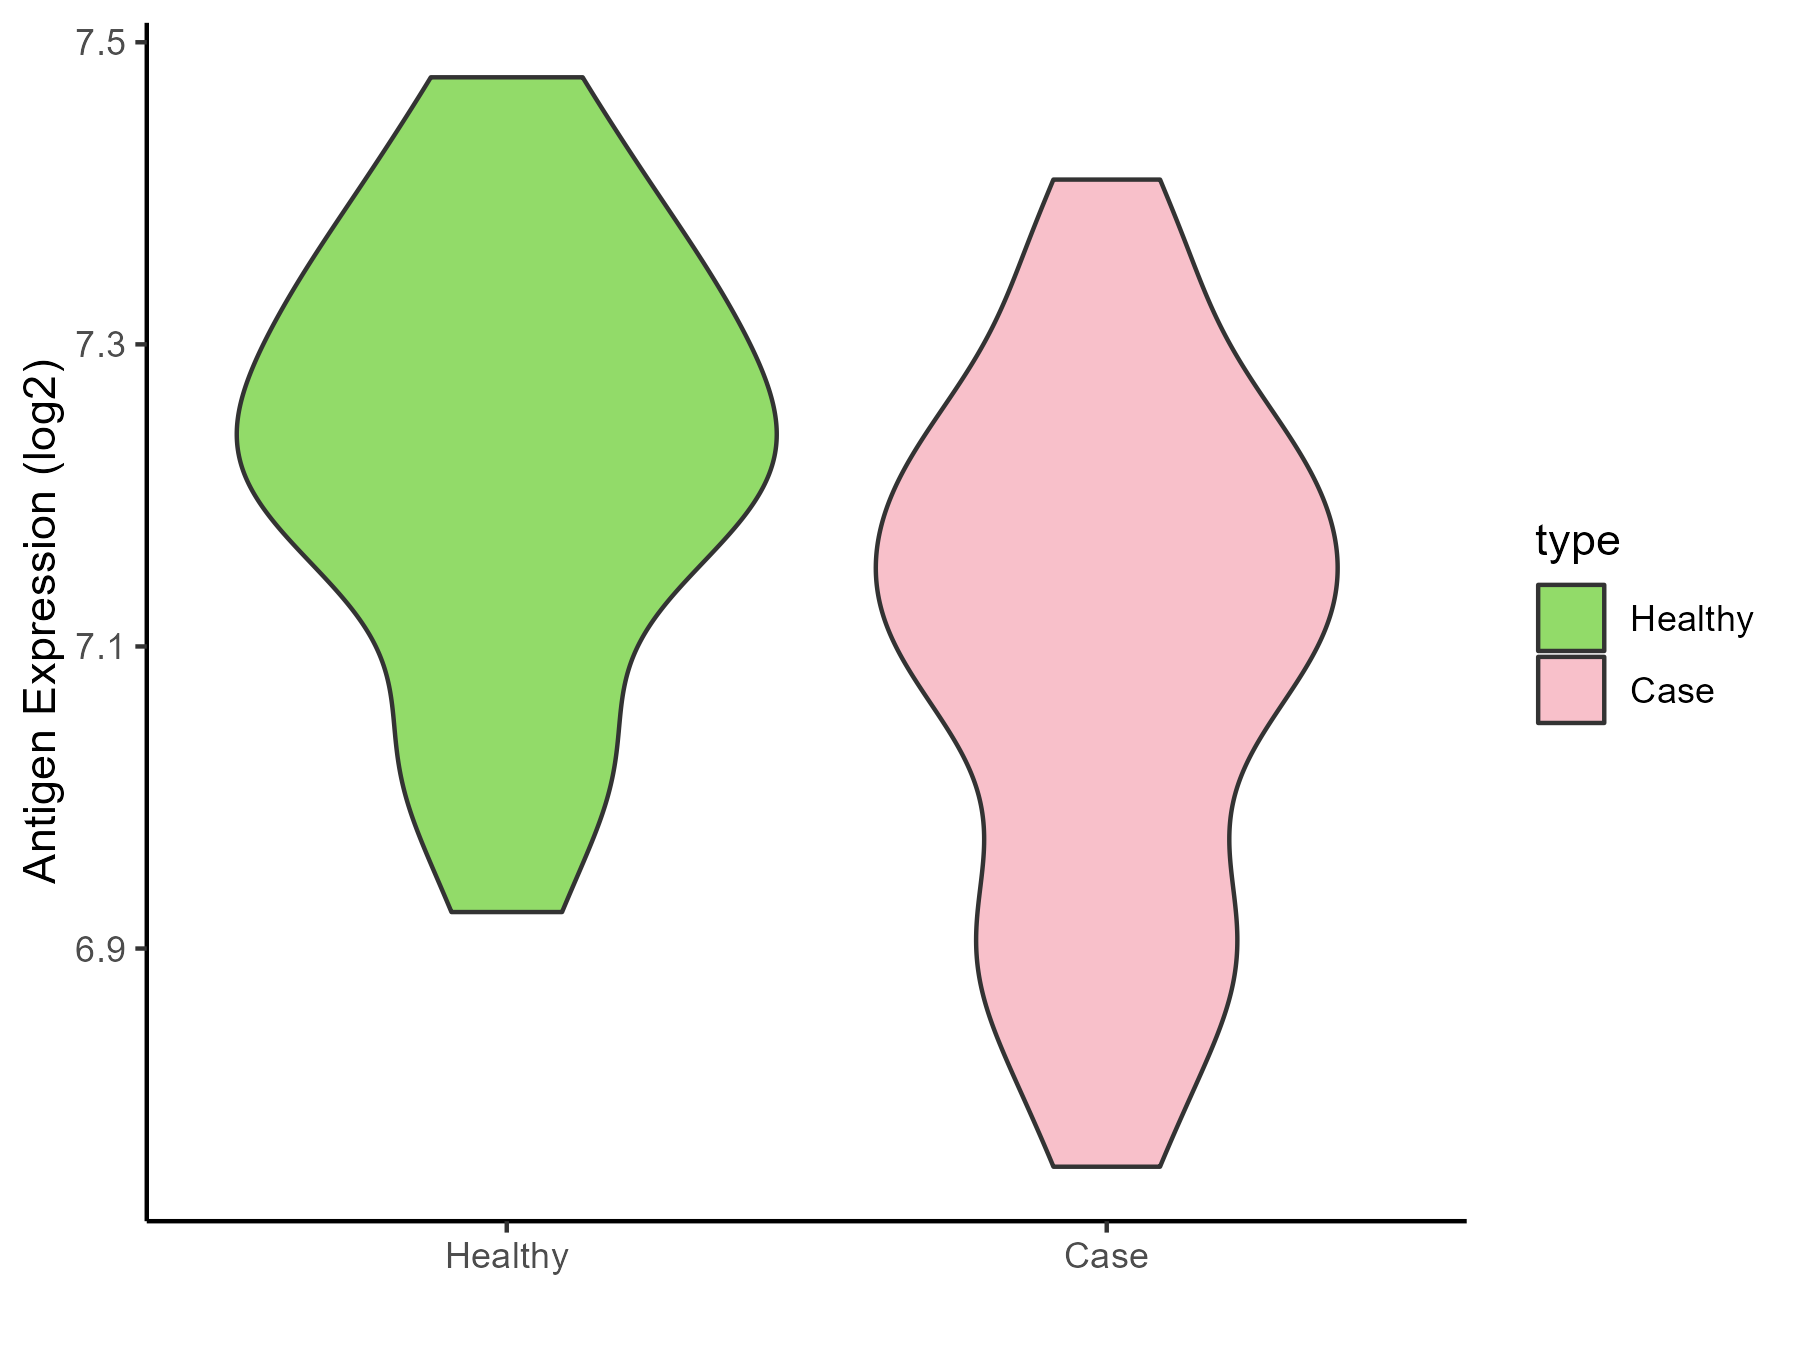
| The Studied Tissue | Whole blood | |
| The Specific Disease | Polycythemia vera | |
| The Expression Level of Disease Section Compare with the Healthy Individual Tissue | p-value: 2.06E-05; Fold-change: -0.108693254; Z-score: -0.762060863 | |
| Disease-specific Antigen Abundances |
|
Click to View the Clearer Original Diagram |
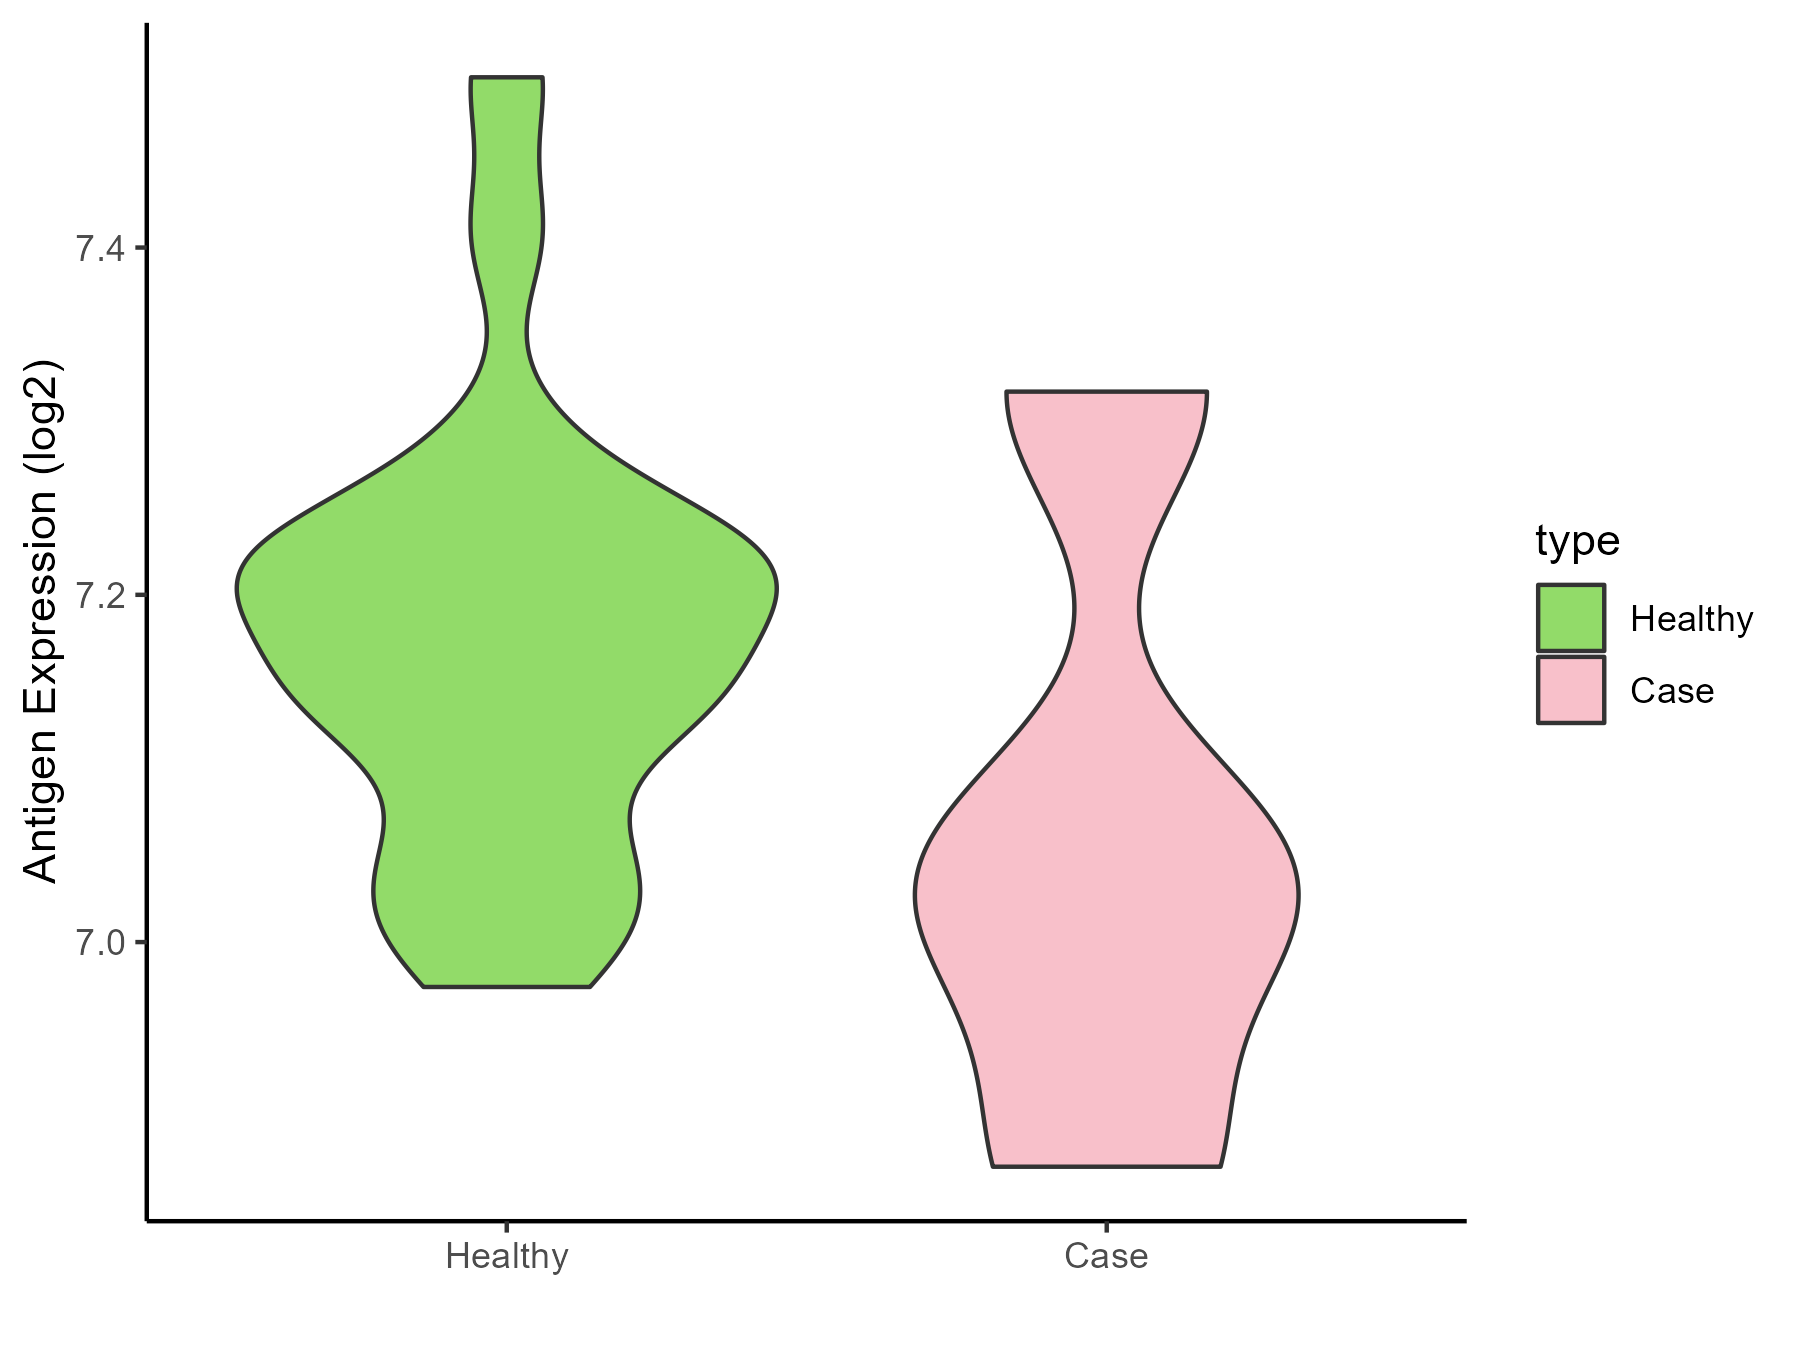
| The Studied Tissue | Whole blood | |
| The Specific Disease | Myelofibrosis | |
| The Expression Level of Disease Section Compare with the Healthy Individual Tissue | p-value: 0.116301226; Fold-change: -0.145677494; Z-score: -1.166012995 | |
| Disease-specific Antigen Abundances |
|
Click to View the Clearer Original Diagram |
| Differential expression pattern of antigen in diseases | ||
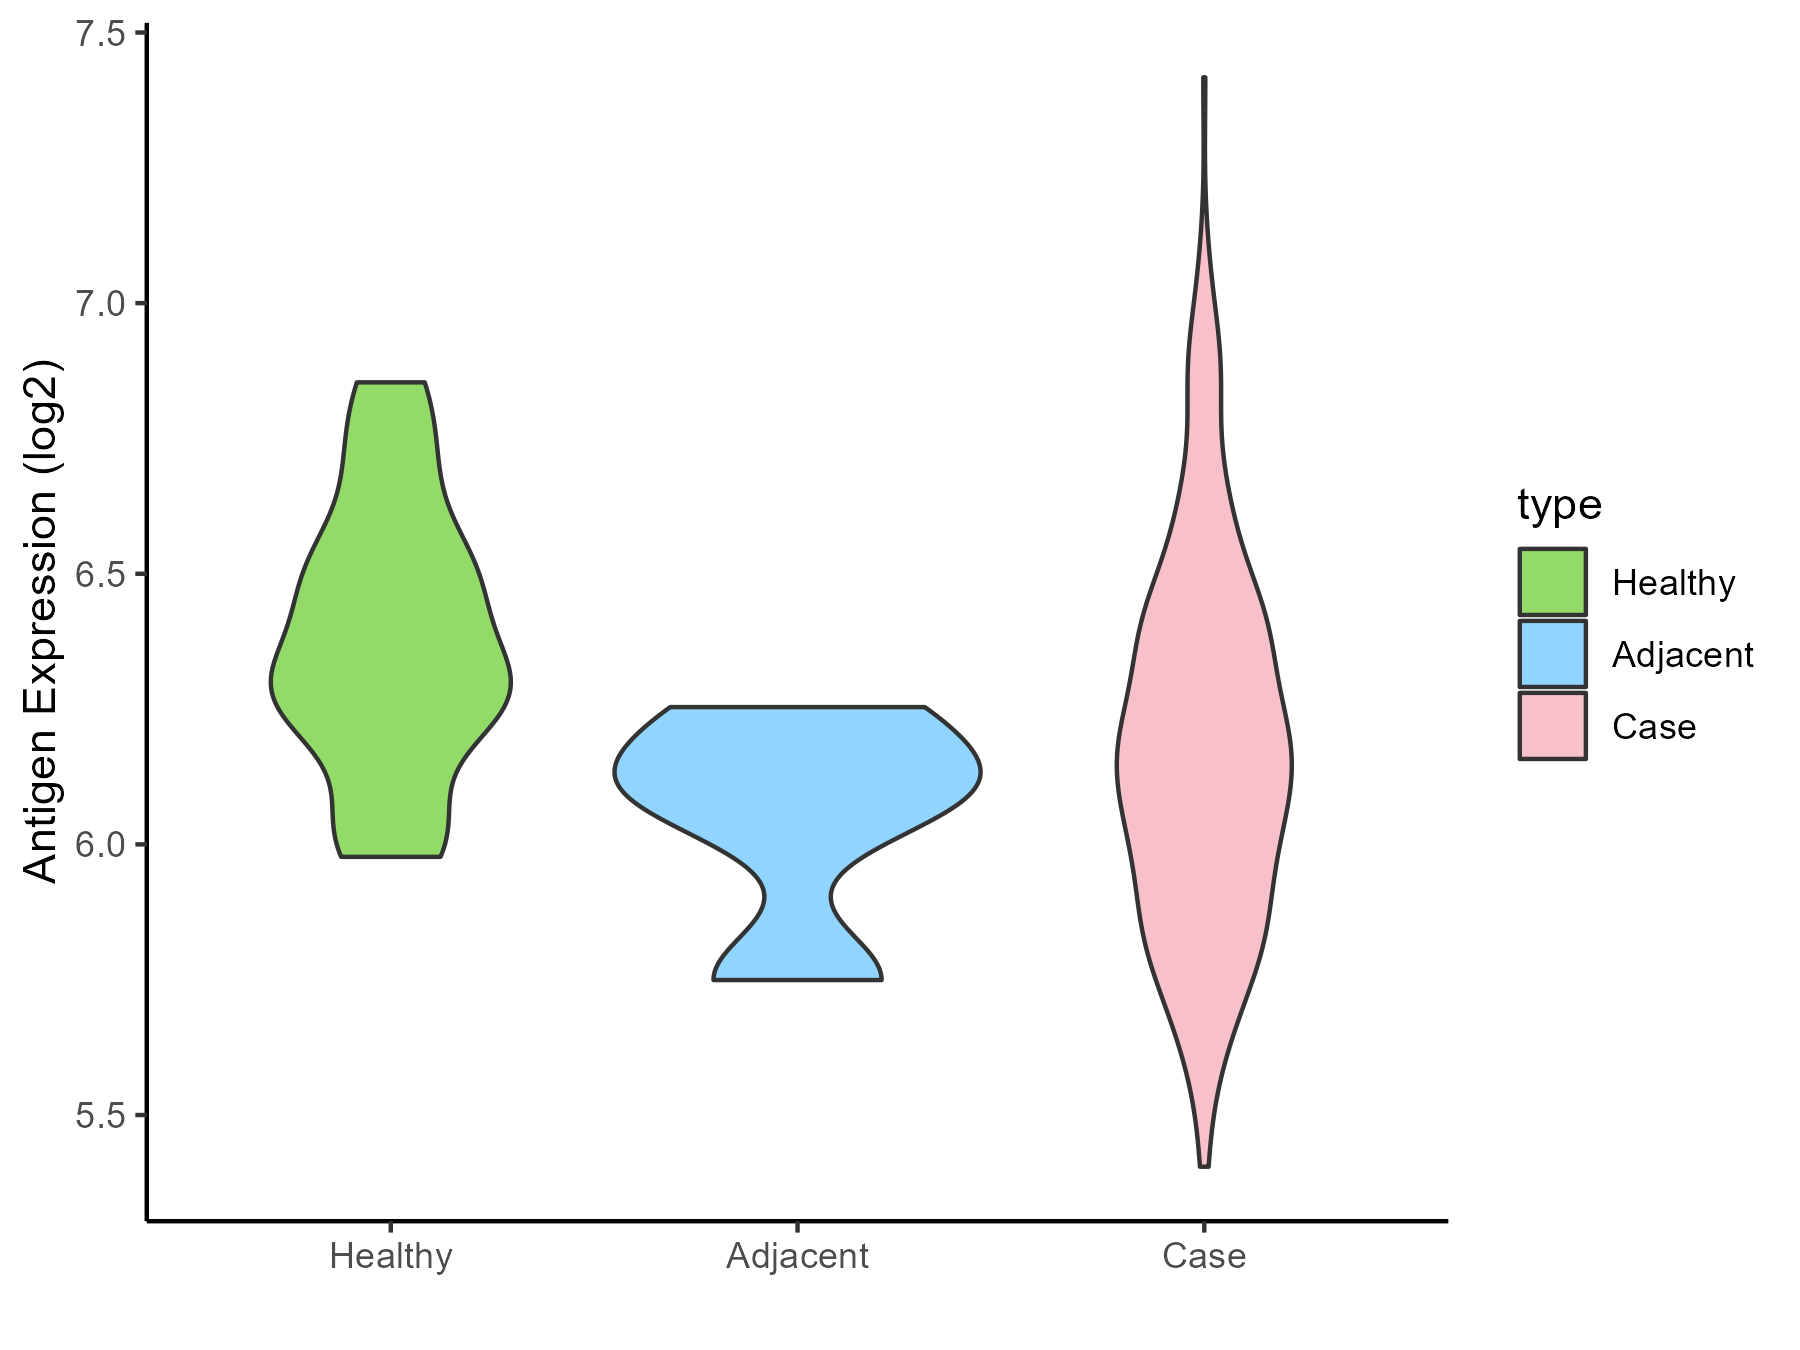
| The Studied Tissue | Bone marrow | |
| The Specific Disease | Myelodysplastic syndromes | |
| The Expression Level of Disease Section Compare with the Healthy Individual Tissue | p-value: 0.000445229; Fold-change: -0.150717719; Z-score: -0.603610214 | |
| The Expression Level of Disease Section Compare with the Adjacent Tissue | p-value: 0.324180926; Fold-change: 0.060898301; Z-score: 0.282402172 | |
| Disease-specific Antigen Abundances |
|
Click to View the Clearer Original Diagram |
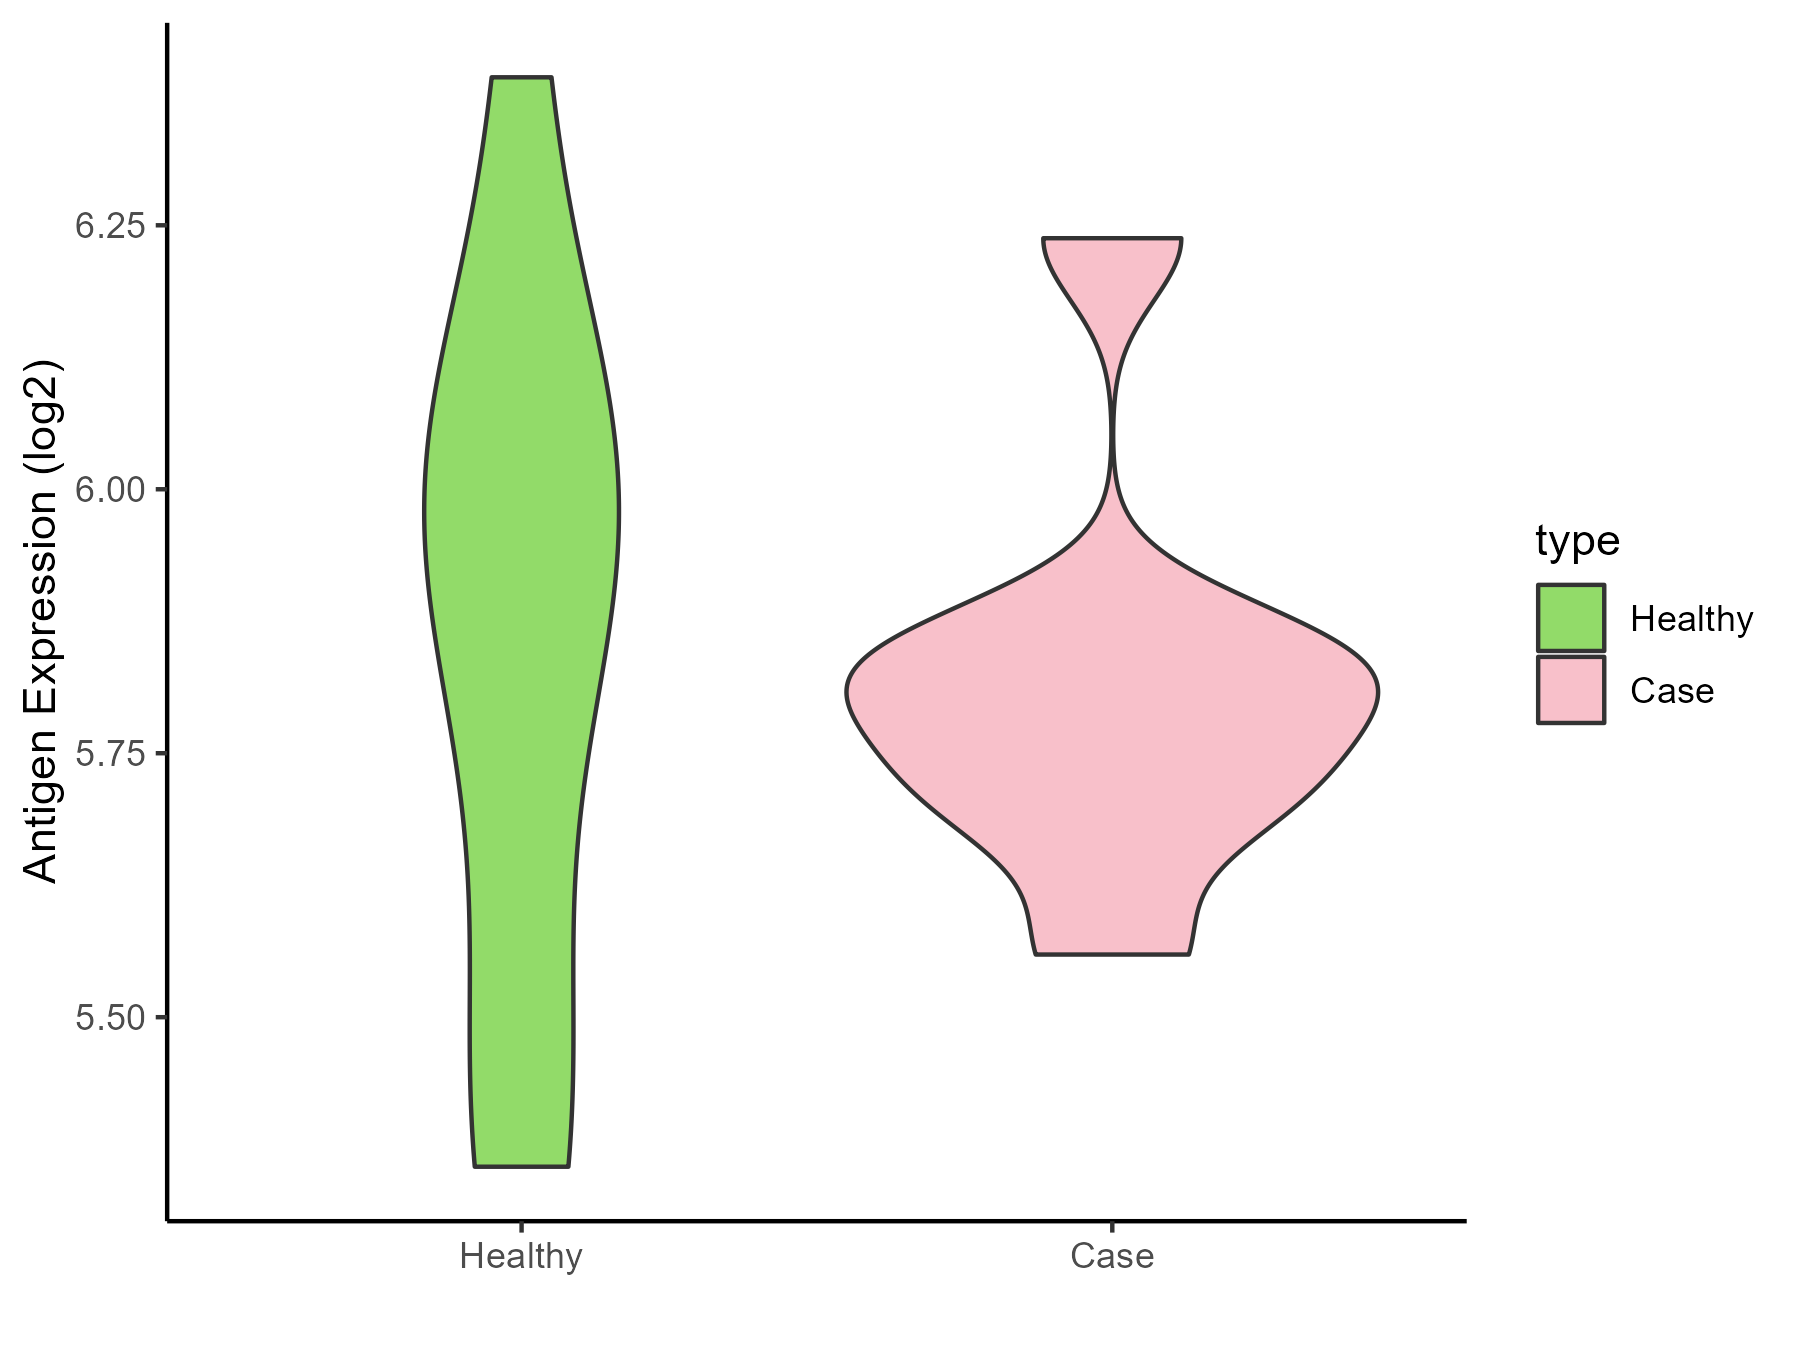
| Differential expression pattern of antigen in diseases | ||
| The Studied Tissue | Tonsil | |
| The Specific Disease | Lymphoma | |
| The Expression Level of Disease Section Compare with the Healthy Individual Tissue | p-value: 0.743566479; Fold-change: -0.119083528; Z-score: -0.360379374 | |
| Disease-specific Antigen Abundances |
|
Click to View the Clearer Original Diagram |
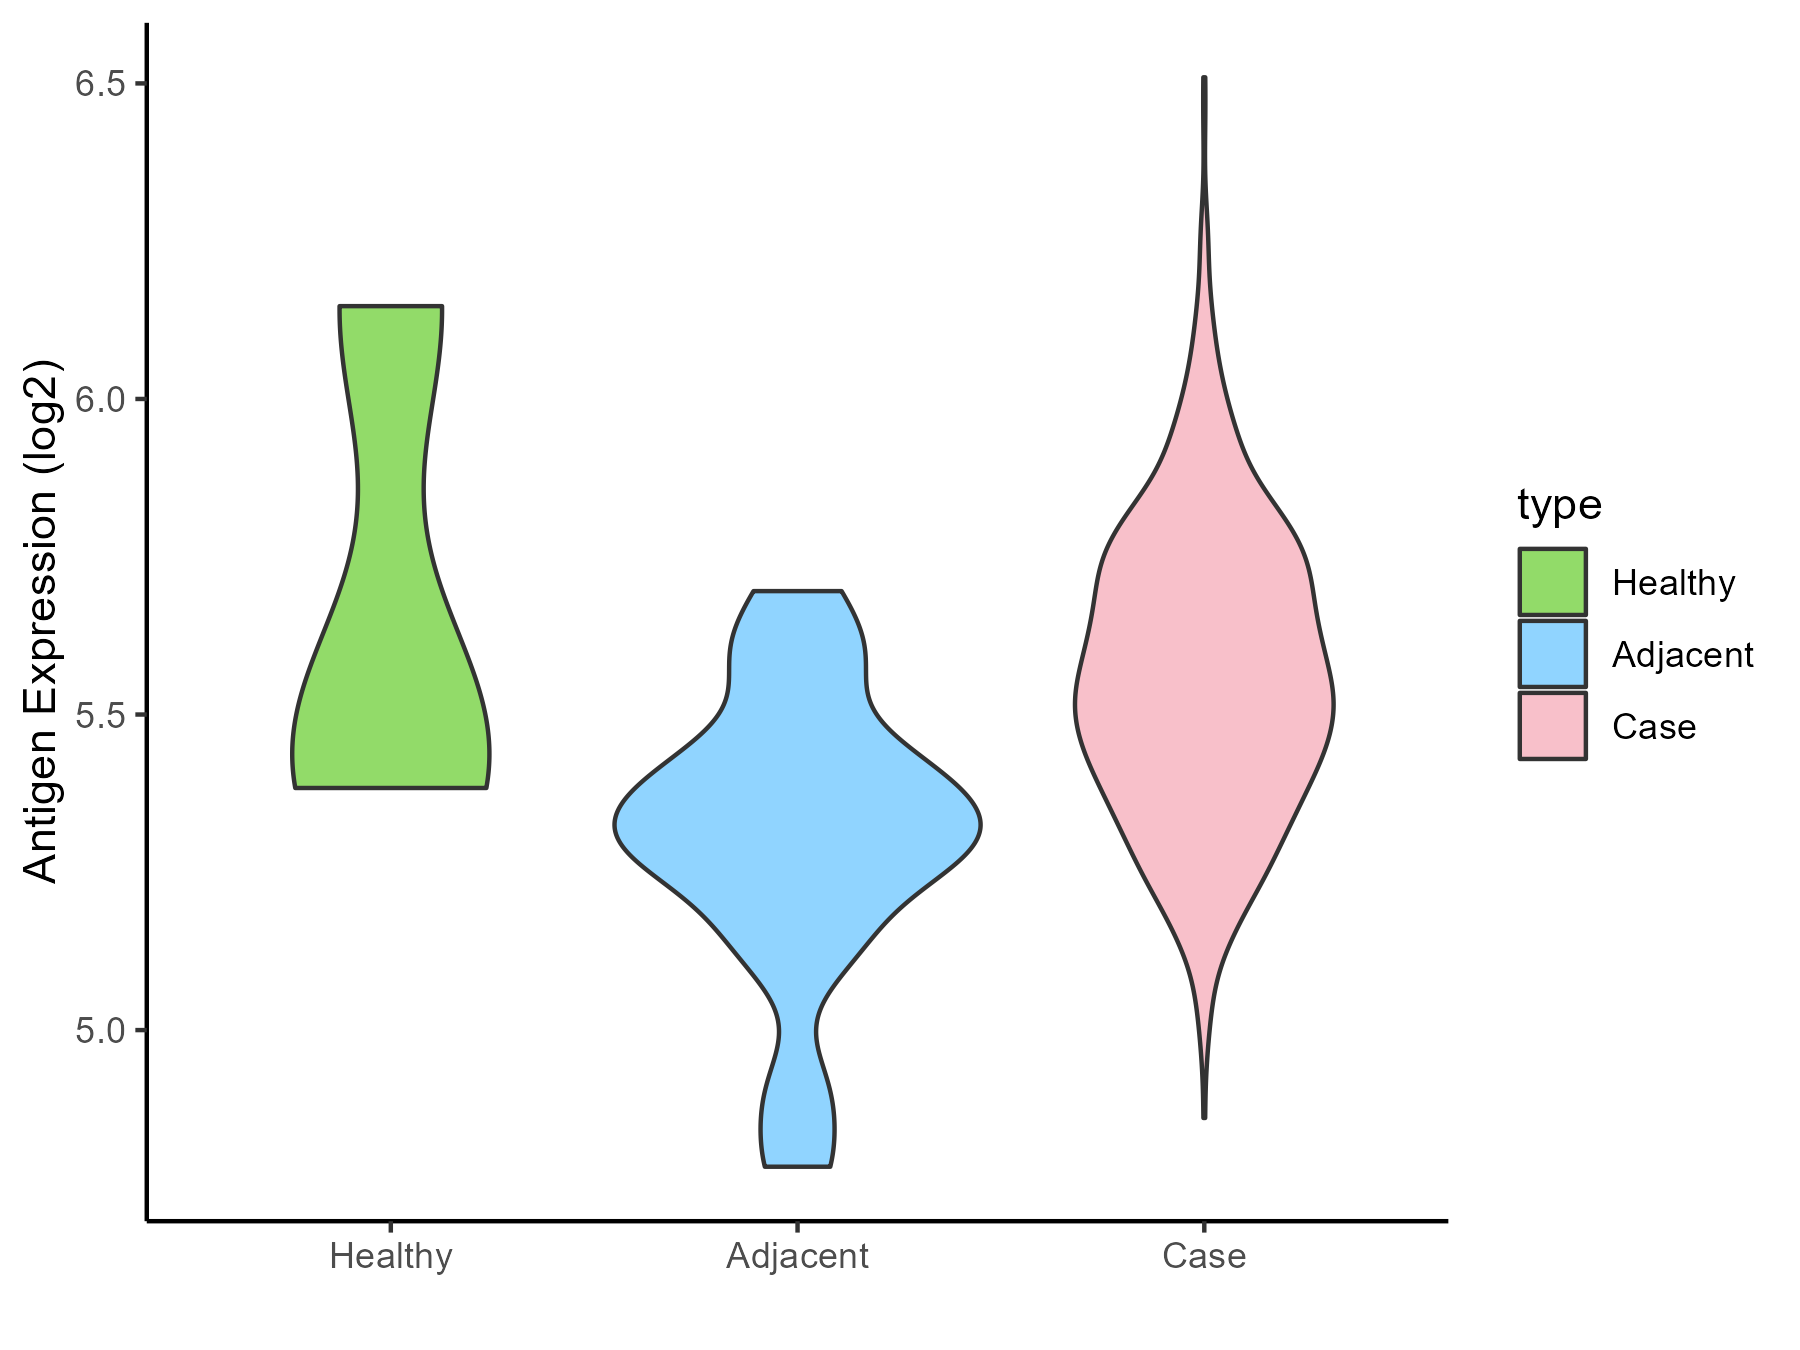
| Differential expression pattern of antigen in diseases | ||
| The Studied Tissue | Gastric | |
| The Specific Disease | Gastric cancer | |
| The Expression Level of Disease Section Compare with the Healthy Individual Tissue | p-value: 0.697074987; Fold-change: 0.065692351; Z-score: 0.158801561 | |
| The Expression Level of Disease Section Compare with the Adjacent Tissue | p-value: 0.000327555; Fold-change: 0.23238246; Z-score: 0.998782881 | |
| Disease-specific Antigen Abundances |
|
Click to View the Clearer Original Diagram |
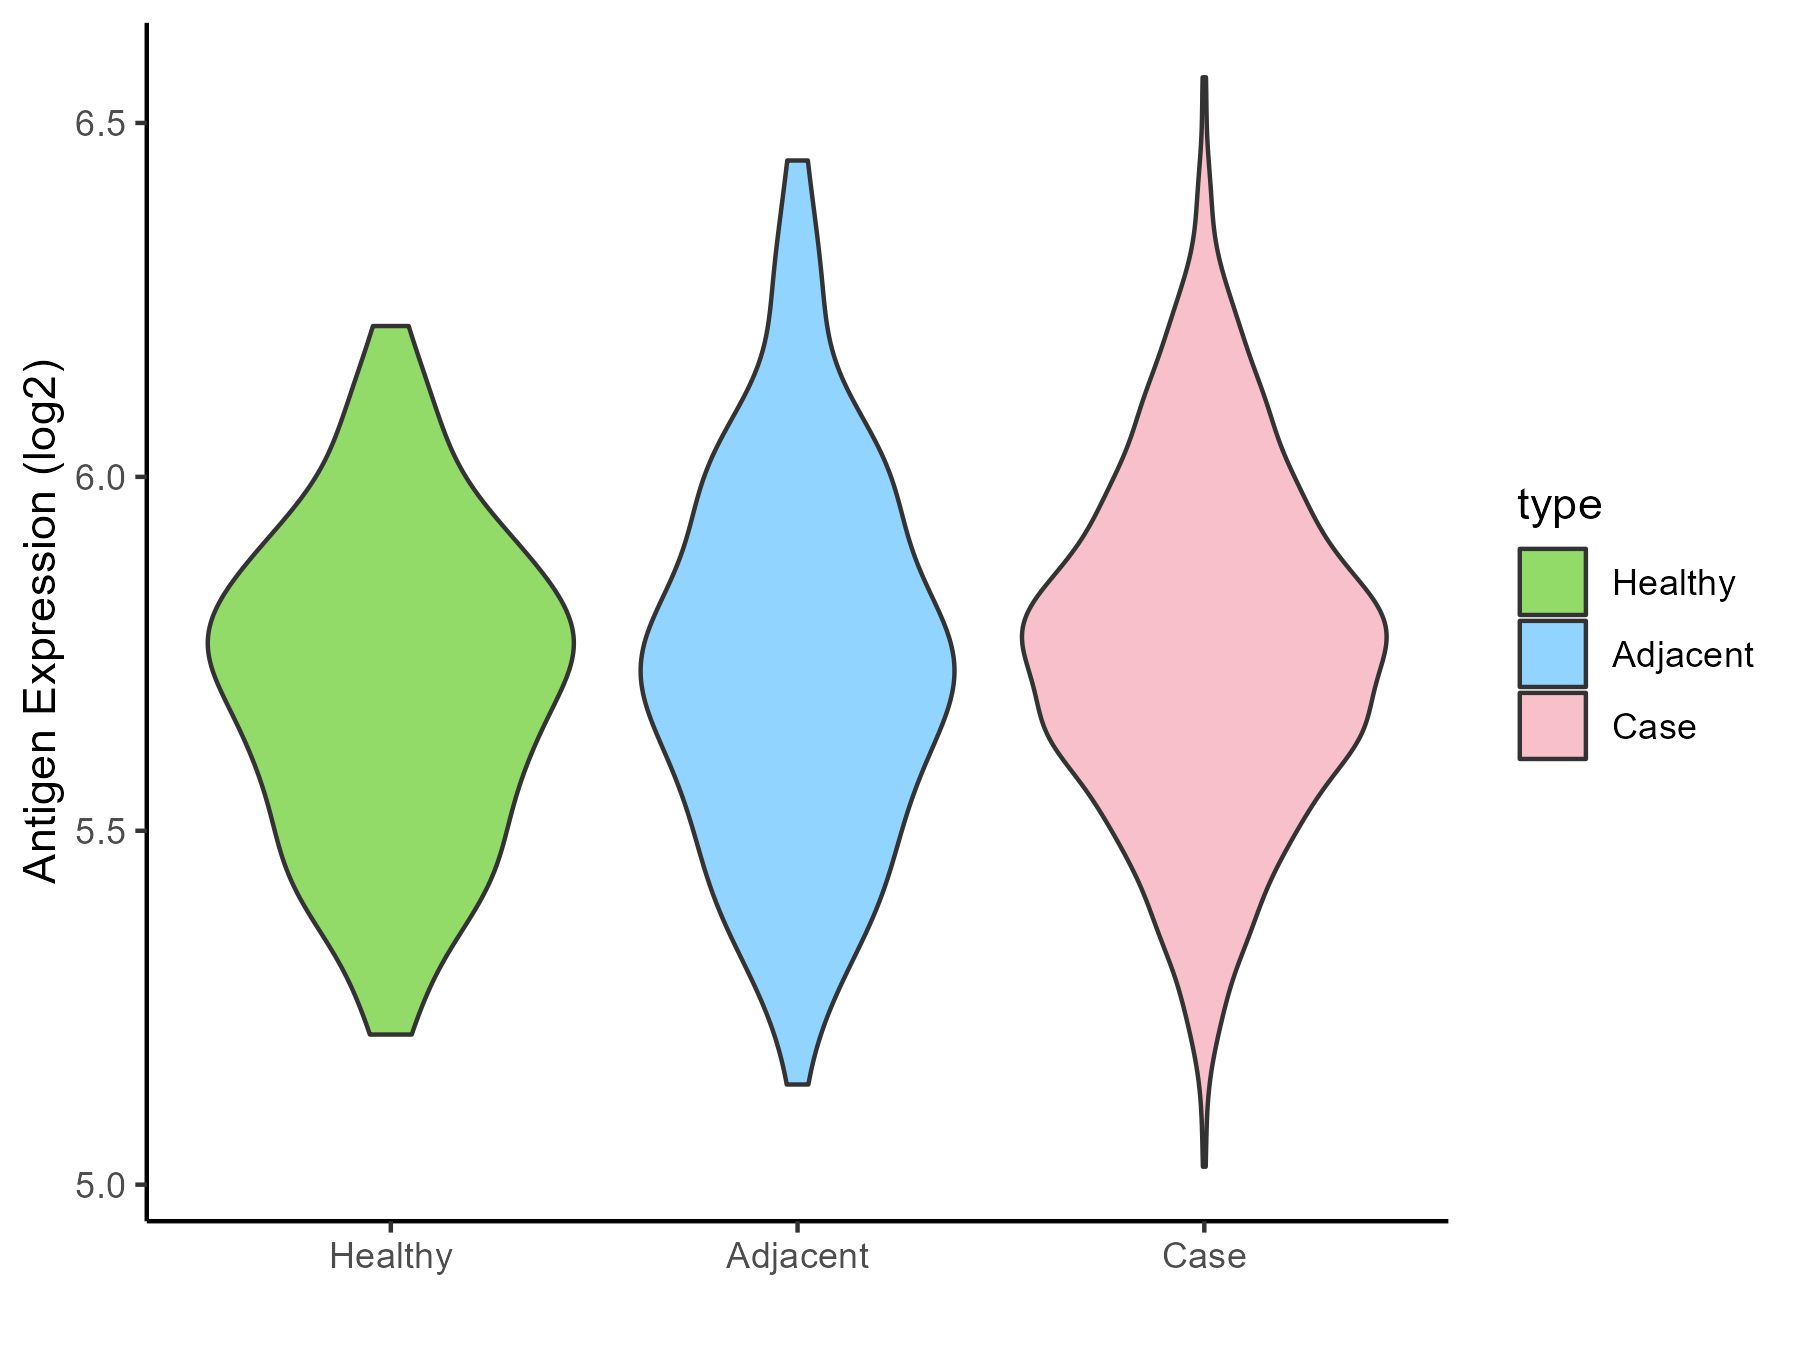
| Differential expression pattern of antigen in diseases | ||
| The Studied Tissue | Colon | |
| The Specific Disease | Colon cancer | |
| The Expression Level of Disease Section Compare with the Healthy Individual Tissue | p-value: 0.003893284; Fold-change: 0.02662654; Z-score: 0.121658064 | |
| The Expression Level of Disease Section Compare with the Adjacent Tissue | p-value: 0.417294789; Fold-change: 0.029968103; Z-score: 0.114124645 | |
| Disease-specific Antigen Abundances |
|
Click to View the Clearer Original Diagram |
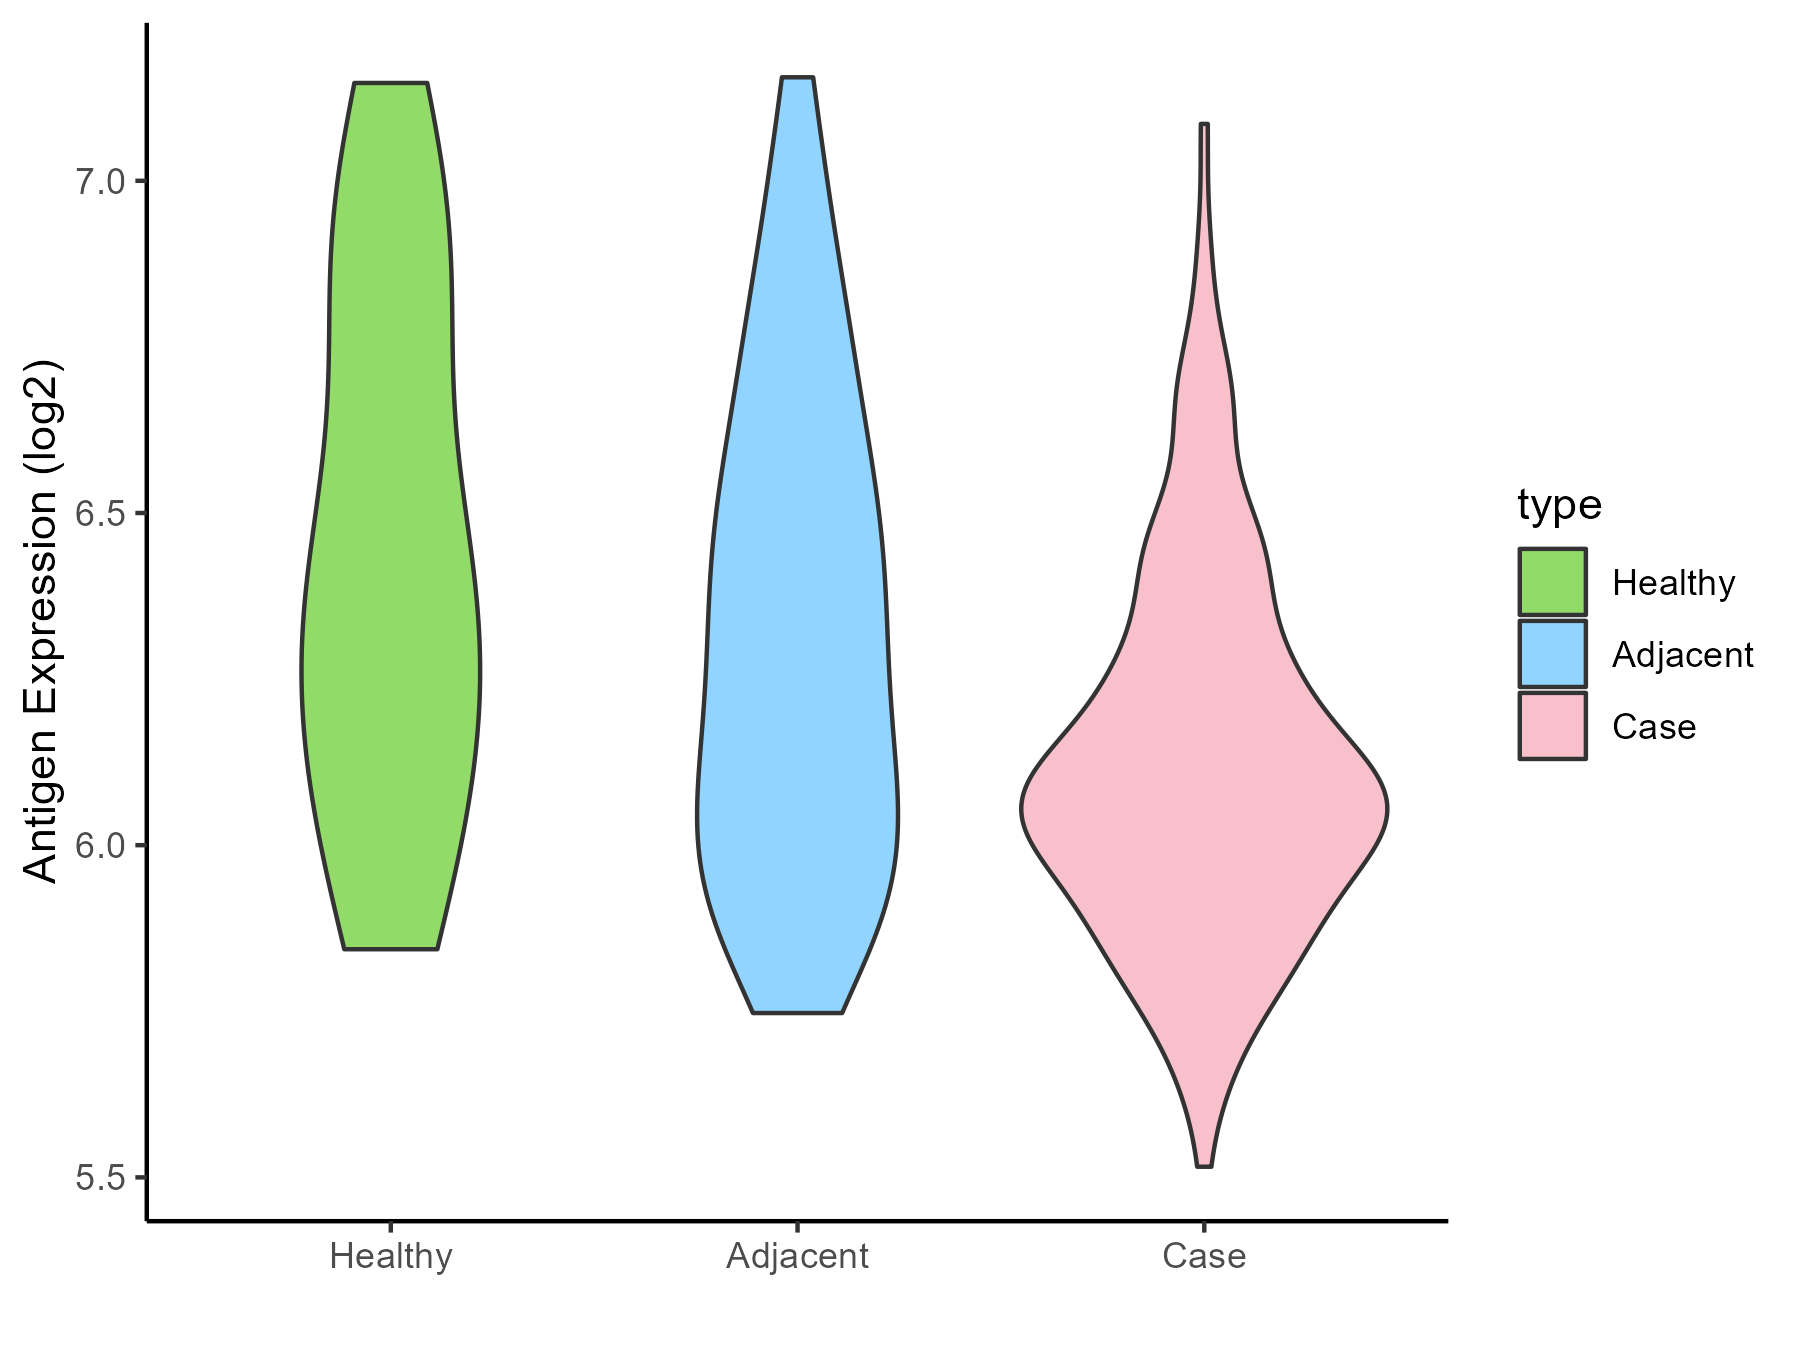
| Differential expression pattern of antigen in diseases | ||
| The Studied Tissue | Pancreas | |
| The Specific Disease | Pancreatic cancer | |
| The Expression Level of Disease Section Compare with the Healthy Individual Tissue | p-value: 0.006721027; Fold-change: -0.296646887; Z-score: -0.737498811 | |
| The Expression Level of Disease Section Compare with the Adjacent Tissue | p-value: 0.000316334; Fold-change: -0.219803265; Z-score: -0.608445021 | |
| Disease-specific Antigen Abundances |
|
Click to View the Clearer Original Diagram |
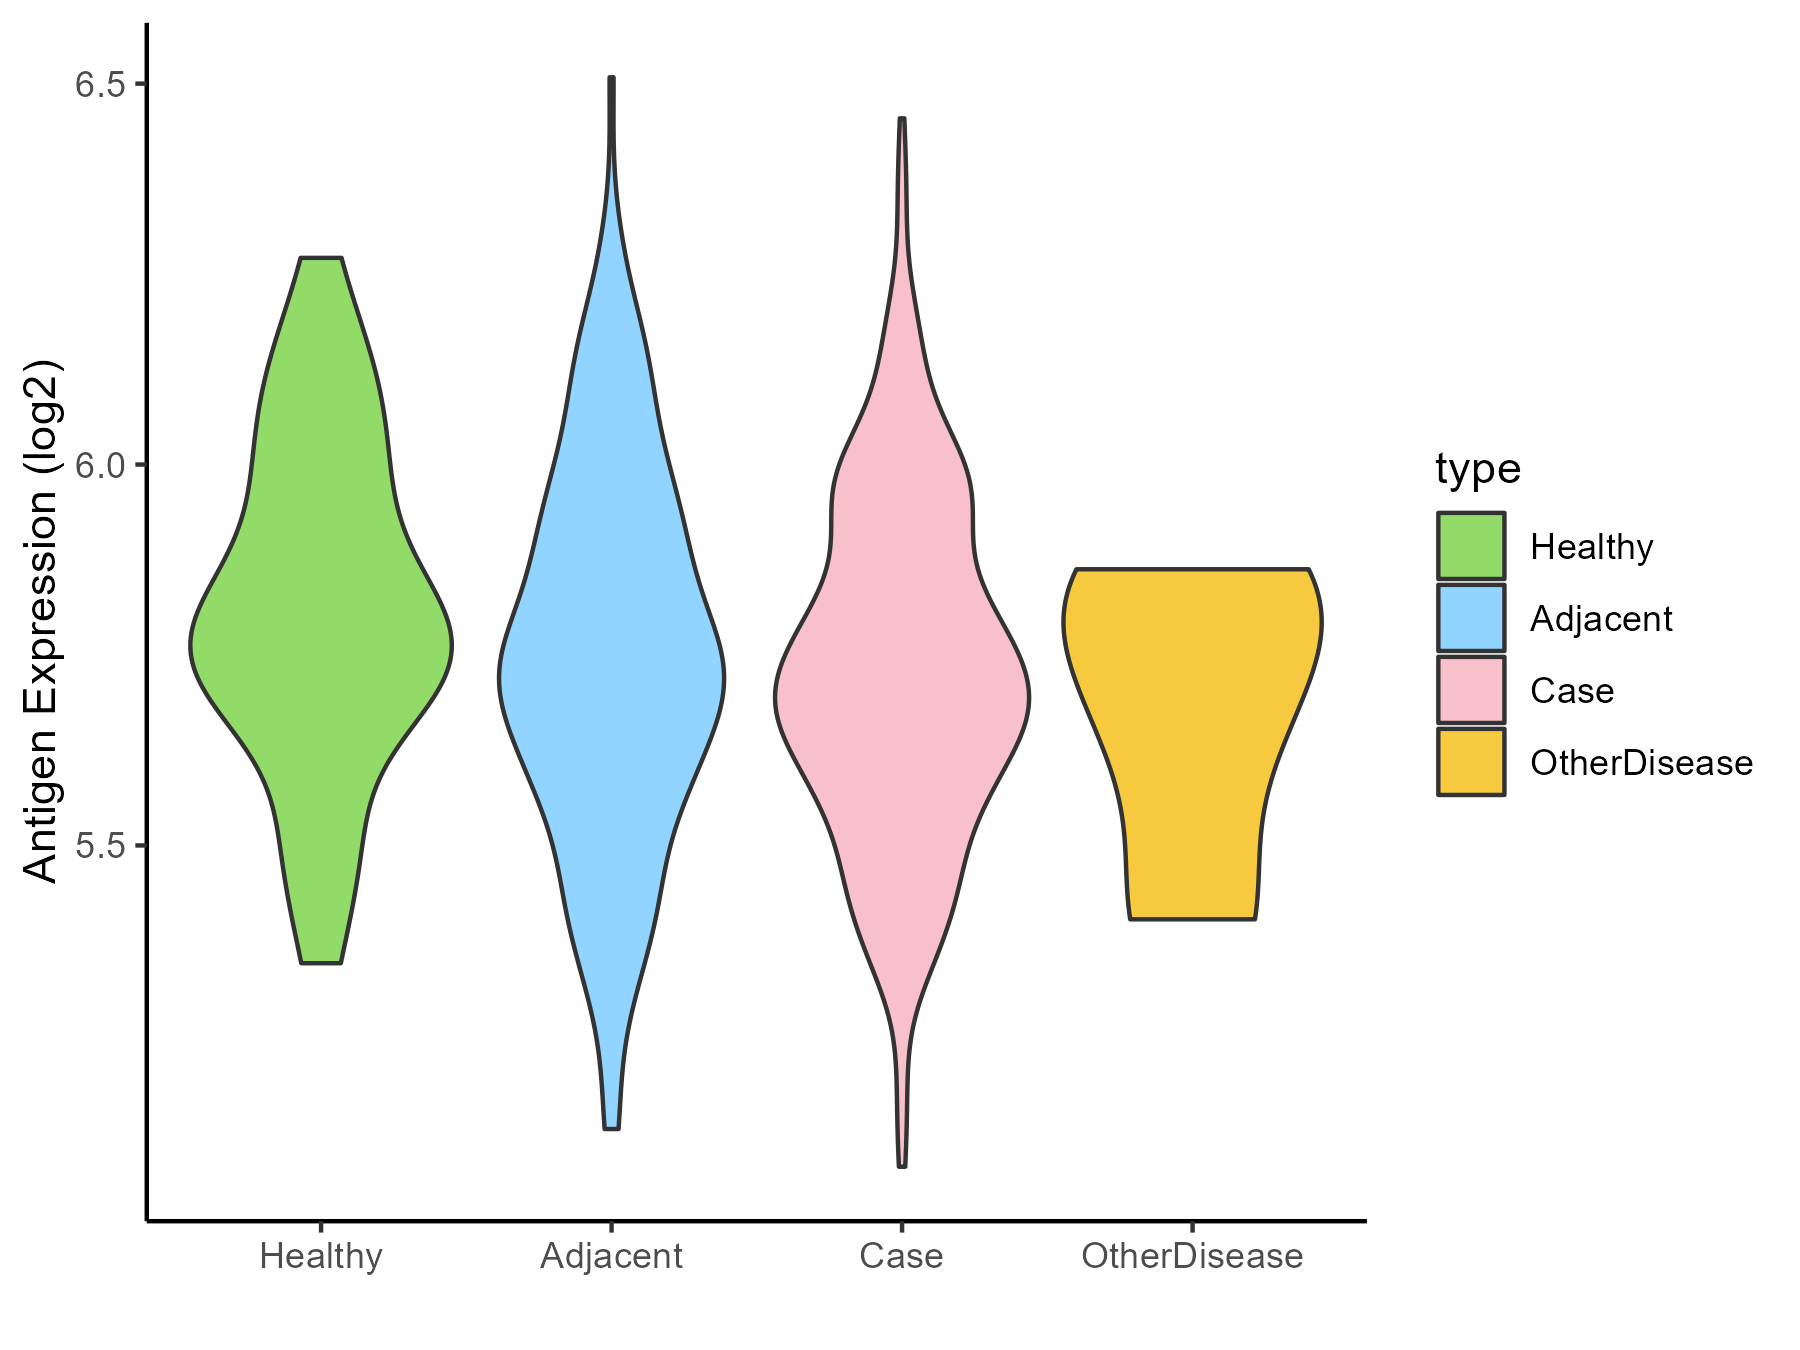
| Differential expression pattern of antigen in diseases | ||
| The Studied Tissue | Liver | |
| The Specific Disease | Liver cancer | |
| The Expression Level of Disease Section Compare with the Healthy Individual Tissue | p-value: 0.019743318; Fold-change: -0.077930472; Z-score: -0.356832163 | |
| The Expression Level of Disease Section Compare with the Adjacent Tissue | p-value: 0.35473498; Fold-change: -0.022706922; Z-score: -0.091066609 | |
| The Expression Level of Disease Section Compare with the Other Disease Section | p-value: 0.676231138; Fold-change: -0.014165621; Z-score: -0.06896786 | |
| Disease-specific Antigen Abundances |
|
Click to View the Clearer Original Diagram |
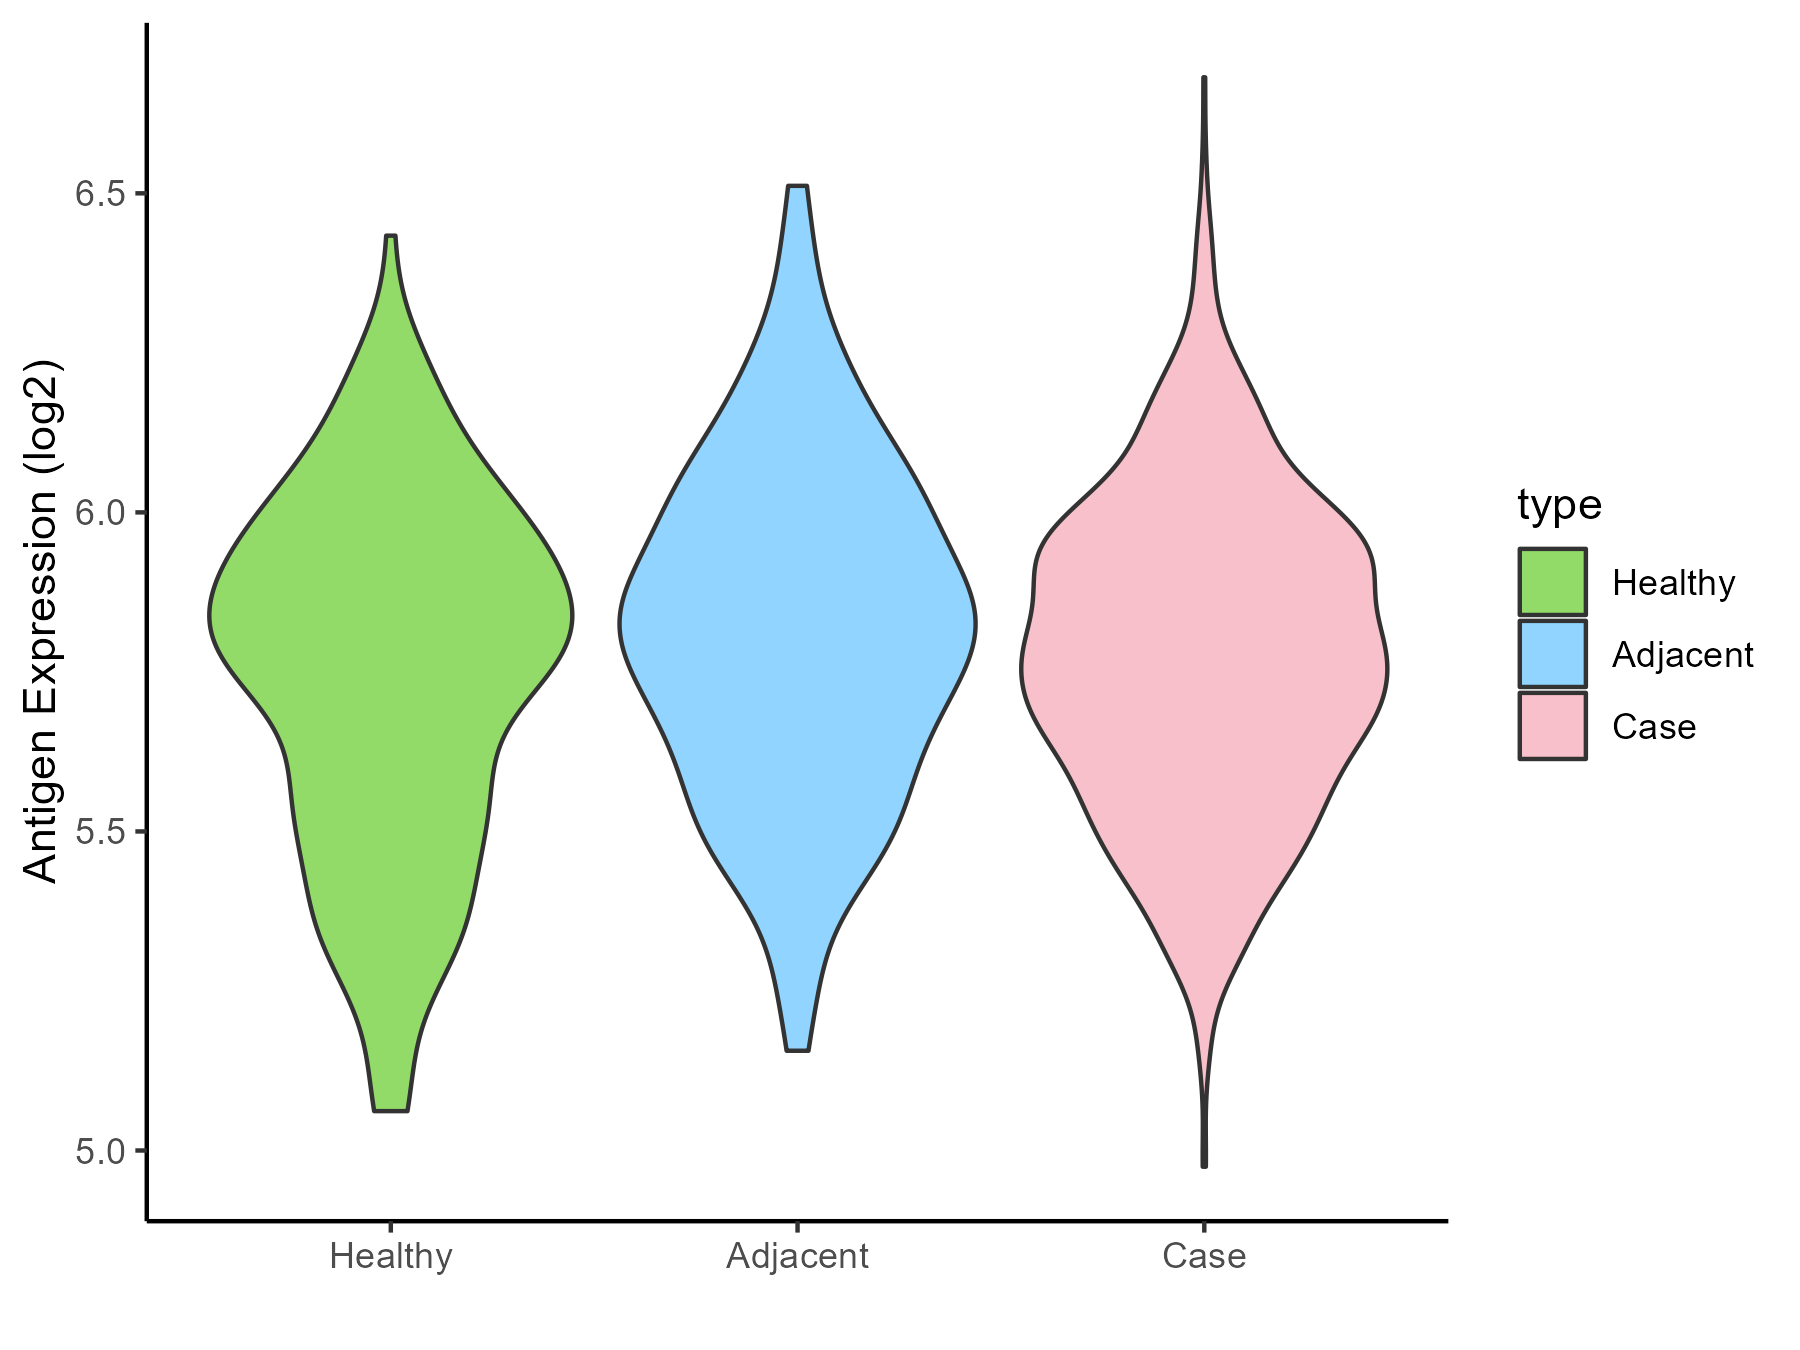
| Differential expression pattern of antigen in diseases | ||
| The Studied Tissue | Lung | |
| The Specific Disease | Lung cancer | |
| The Expression Level of Disease Section Compare with the Healthy Individual Tissue | p-value: 0.196889534; Fold-change: -0.009001836; Z-score: -0.032435457 | |
| The Expression Level of Disease Section Compare with the Adjacent Tissue | p-value: 0.114805565; Fold-change: -0.05688644; Z-score: -0.217688845 | |
| Disease-specific Antigen Abundances |
|
Click to View the Clearer Original Diagram |
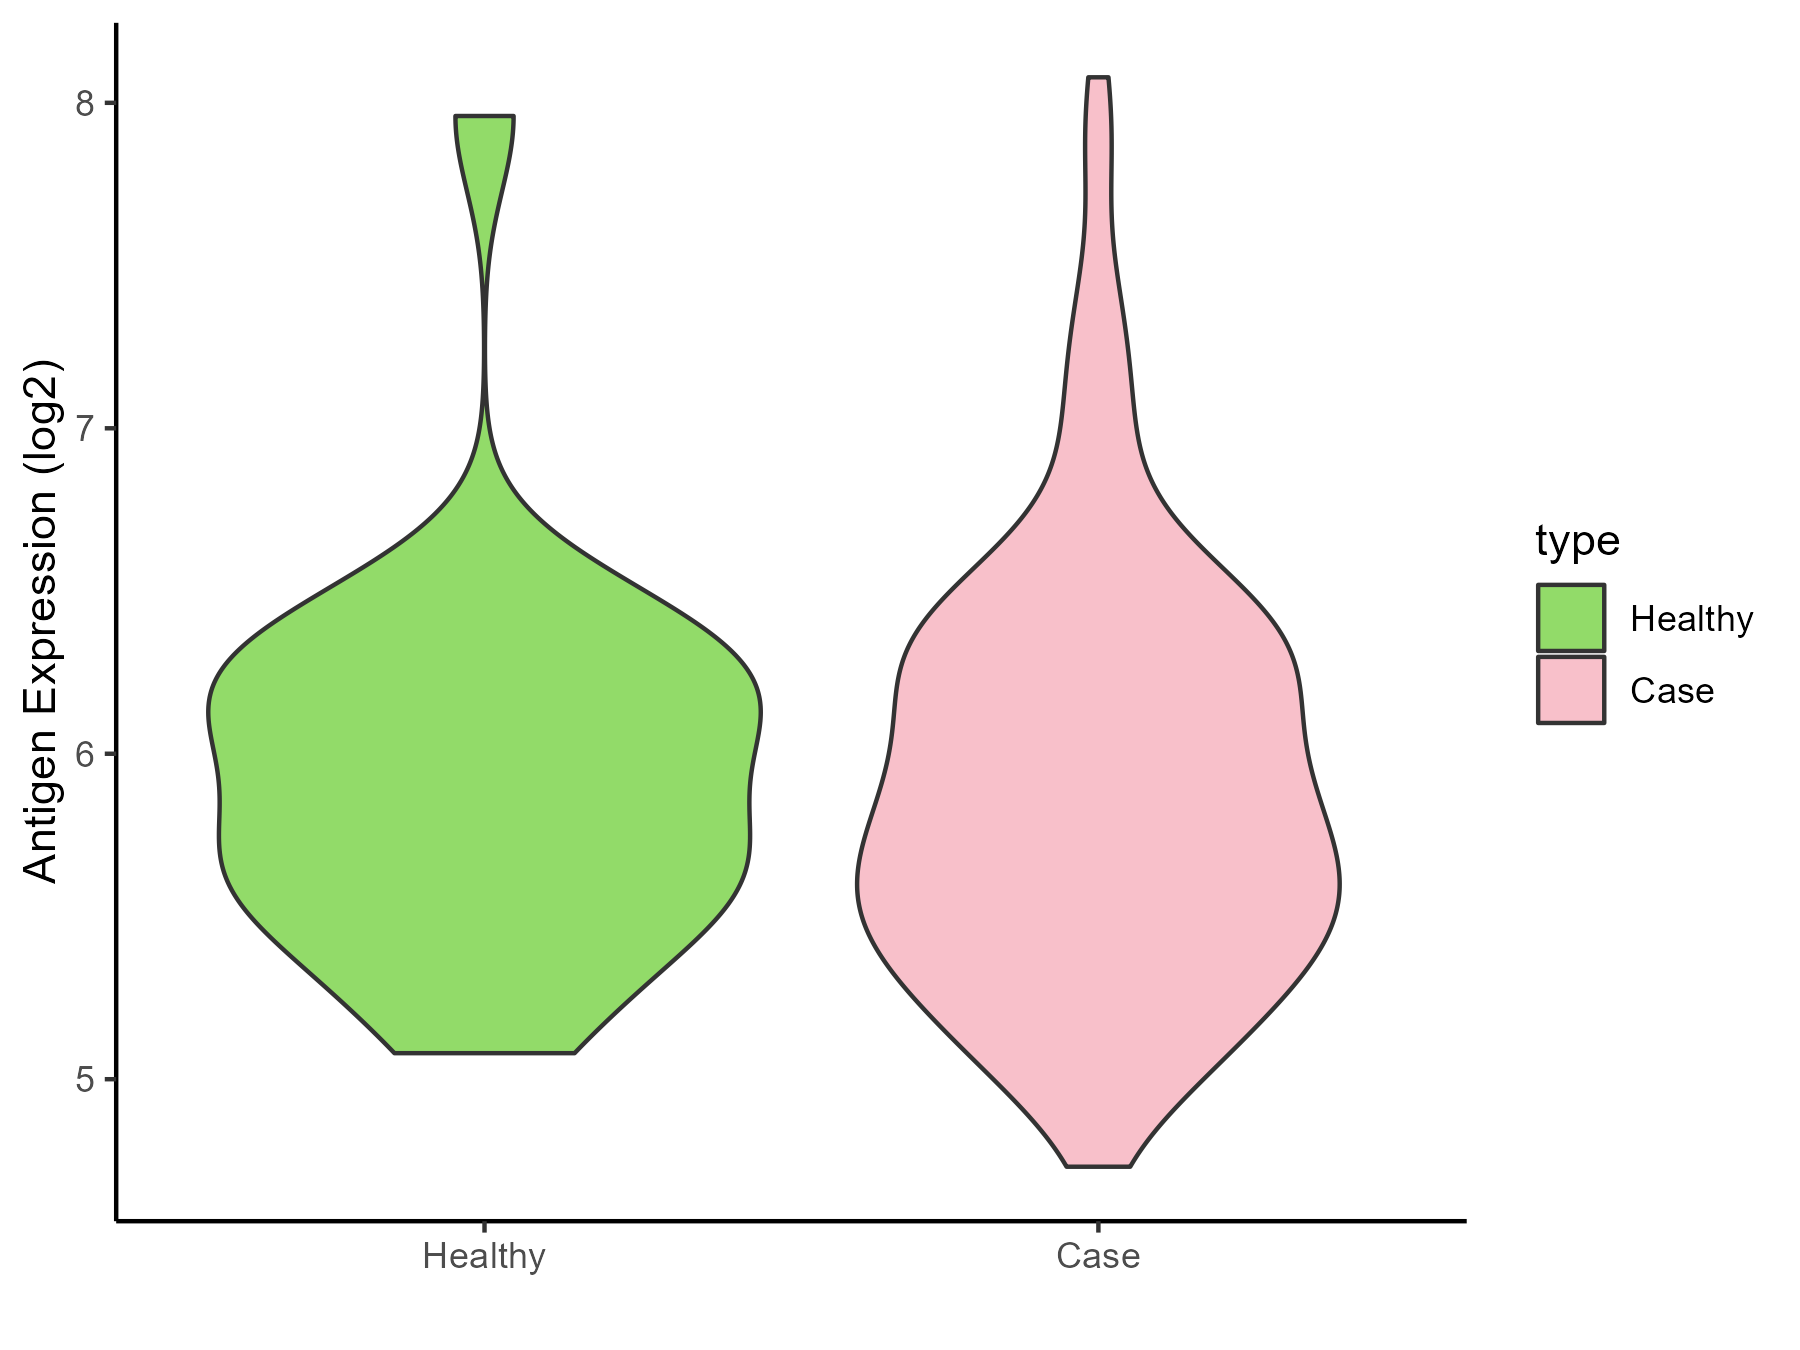
| Differential expression pattern of antigen in diseases | ||
| The Studied Tissue | Skin | |
| The Specific Disease | Melanoma | |
| The Expression Level of Disease Section Compare with the Healthy Individual Tissue | p-value: 0.727136716; Fold-change: -0.027419967; Z-score: -0.046351788 | |
| Disease-specific Antigen Abundances |
|
Click to View the Clearer Original Diagram |
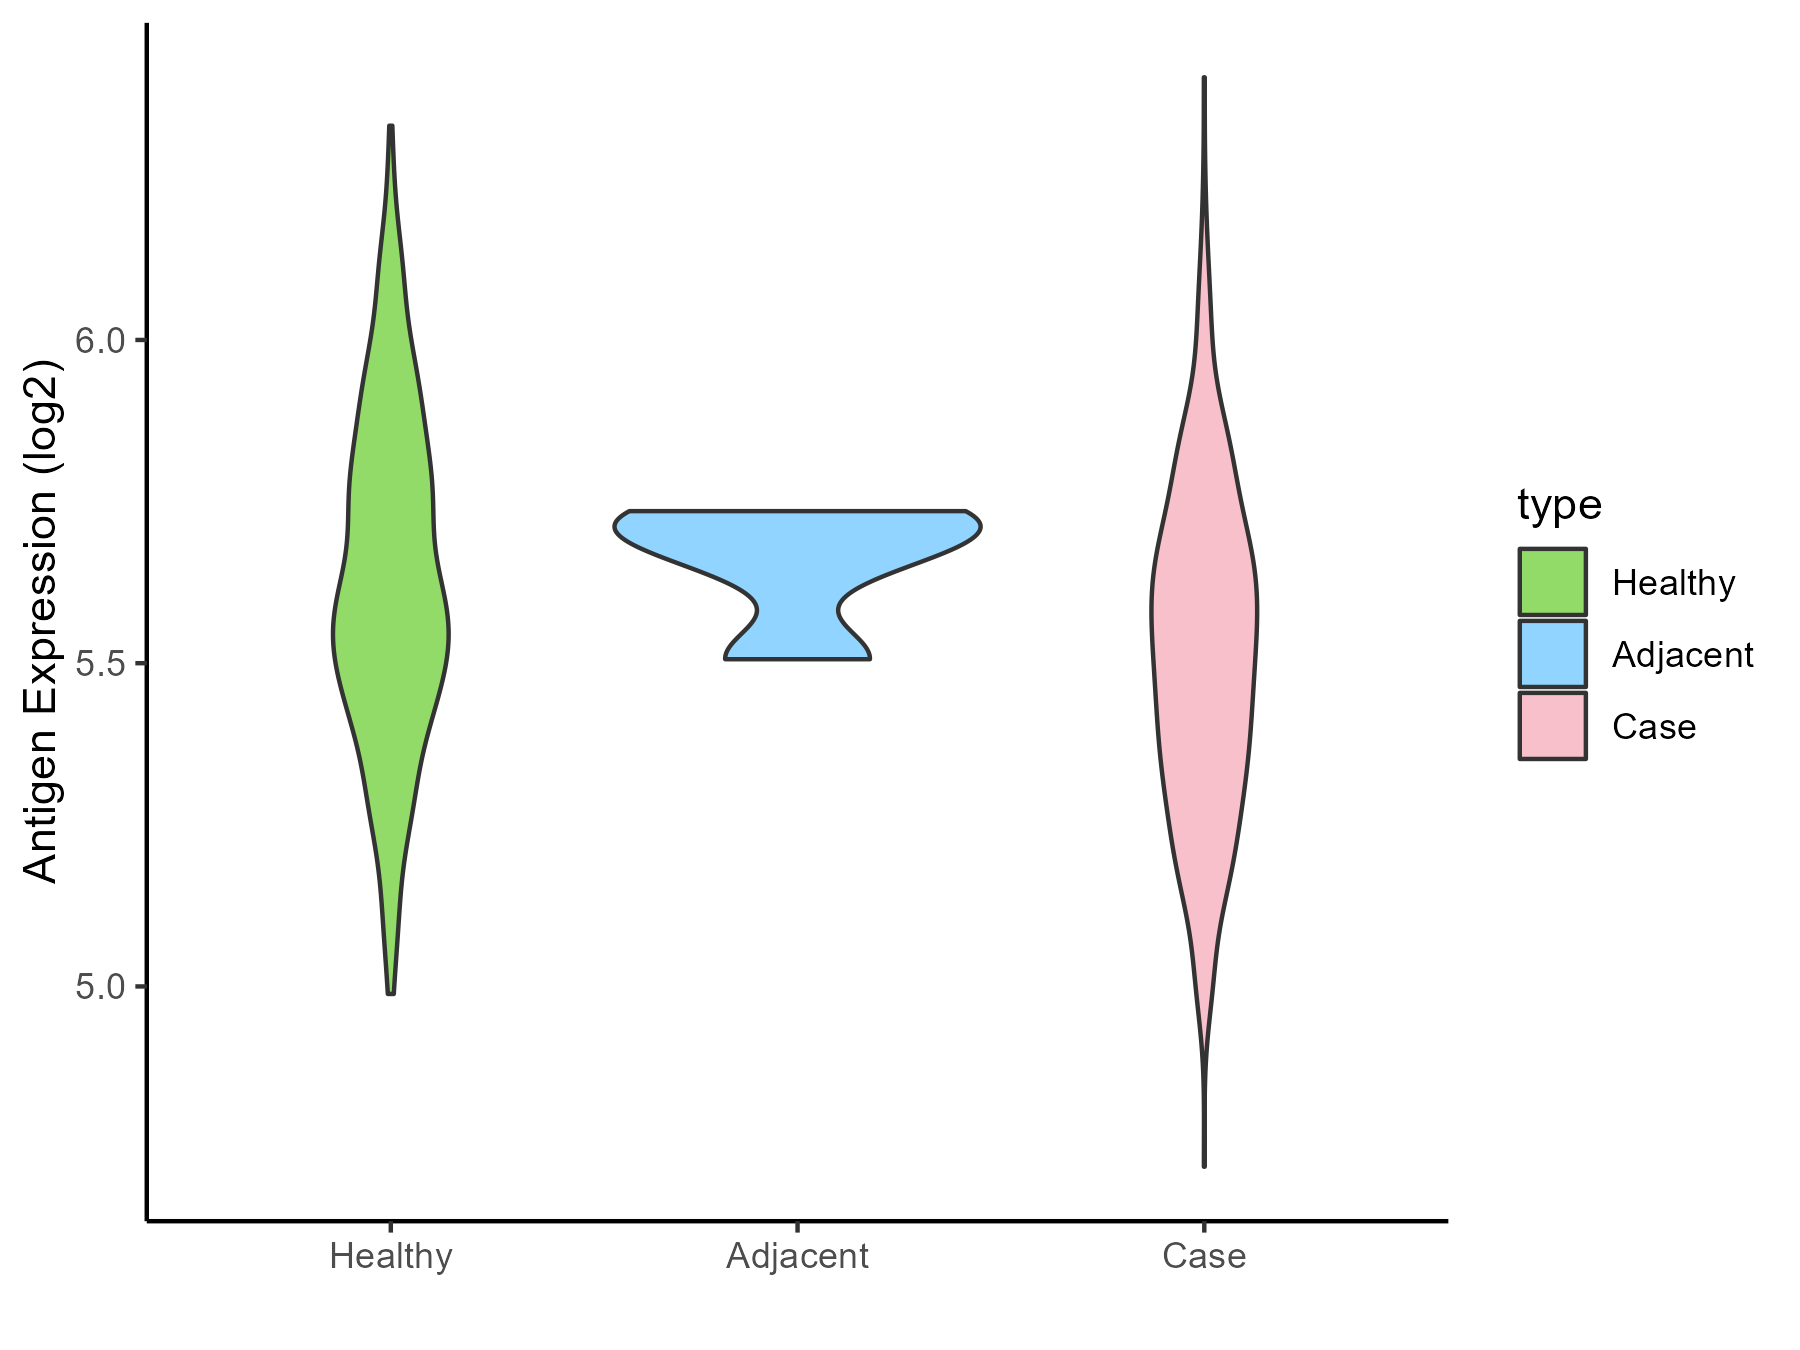
| Differential expression pattern of antigen in diseases | ||
| The Studied Tissue | Muscle | |
| The Specific Disease | Sarcoma | |
| The Expression Level of Disease Section Compare with the Healthy Individual Tissue | p-value: 2.70E-12; Fold-change: -0.081836579; Z-score: -0.319486323 | |
| The Expression Level of Disease Section Compare with the Adjacent Tissue | p-value: 0.069780575; Fold-change: -0.175344359; Z-score: -1.674181705 | |
| Disease-specific Antigen Abundances |
|
Click to View the Clearer Original Diagram |
| Differential expression pattern of antigen in diseases | ||
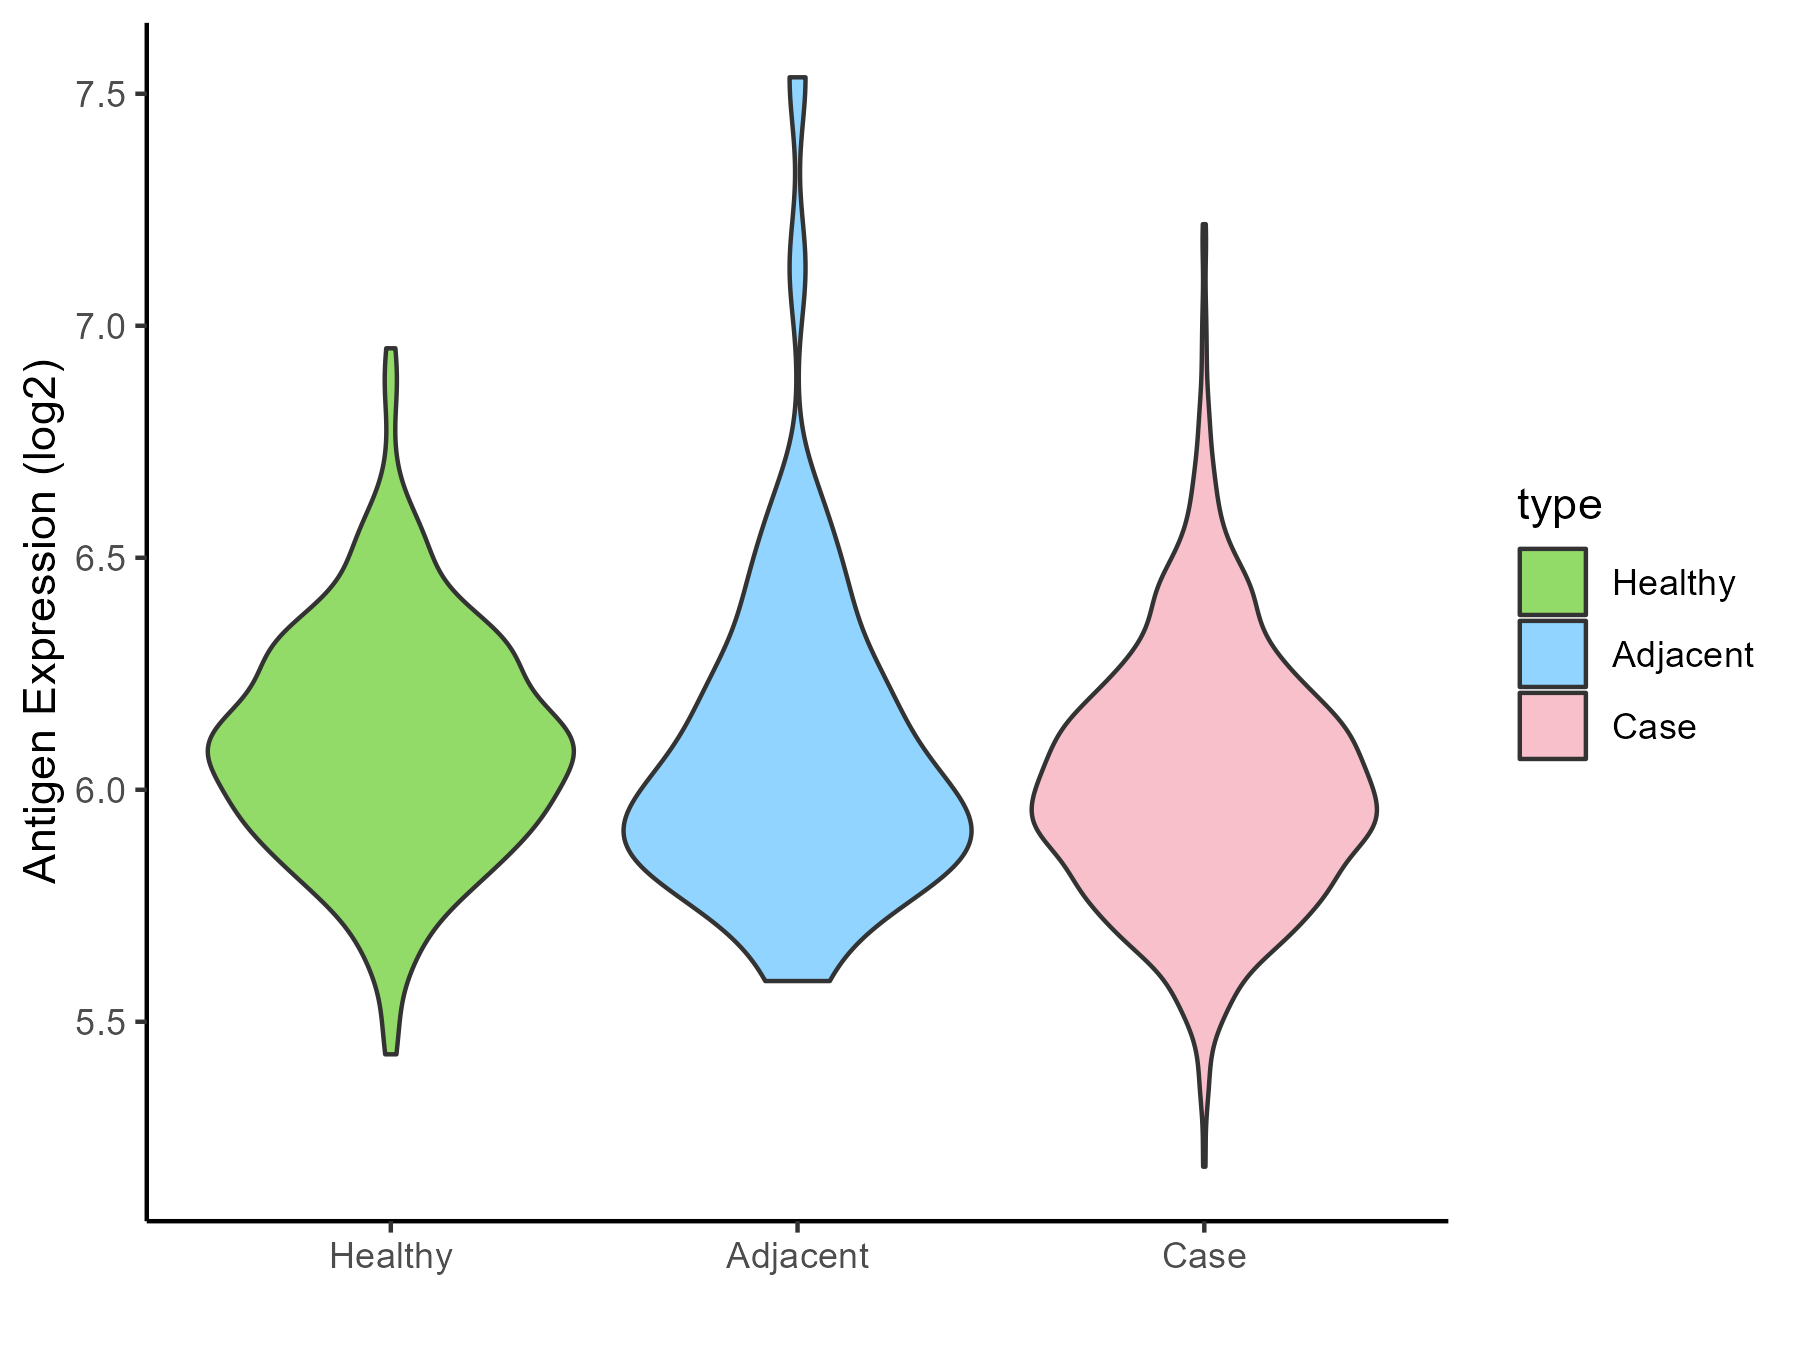
| The Studied Tissue | Breast | |
| The Specific Disease | Breast cancer | |
| The Expression Level of Disease Section Compare with the Healthy Individual Tissue | p-value: 2.88E-06; Fold-change: -0.092084836; Z-score: -0.377908202 | |
| The Expression Level of Disease Section Compare with the Adjacent Tissue | p-value: 0.186914339; Fold-change: -0.003690454; Z-score: -0.010396404 | |
| Disease-specific Antigen Abundances |
|
Click to View the Clearer Original Diagram |
| Differential expression pattern of antigen in diseases | ||
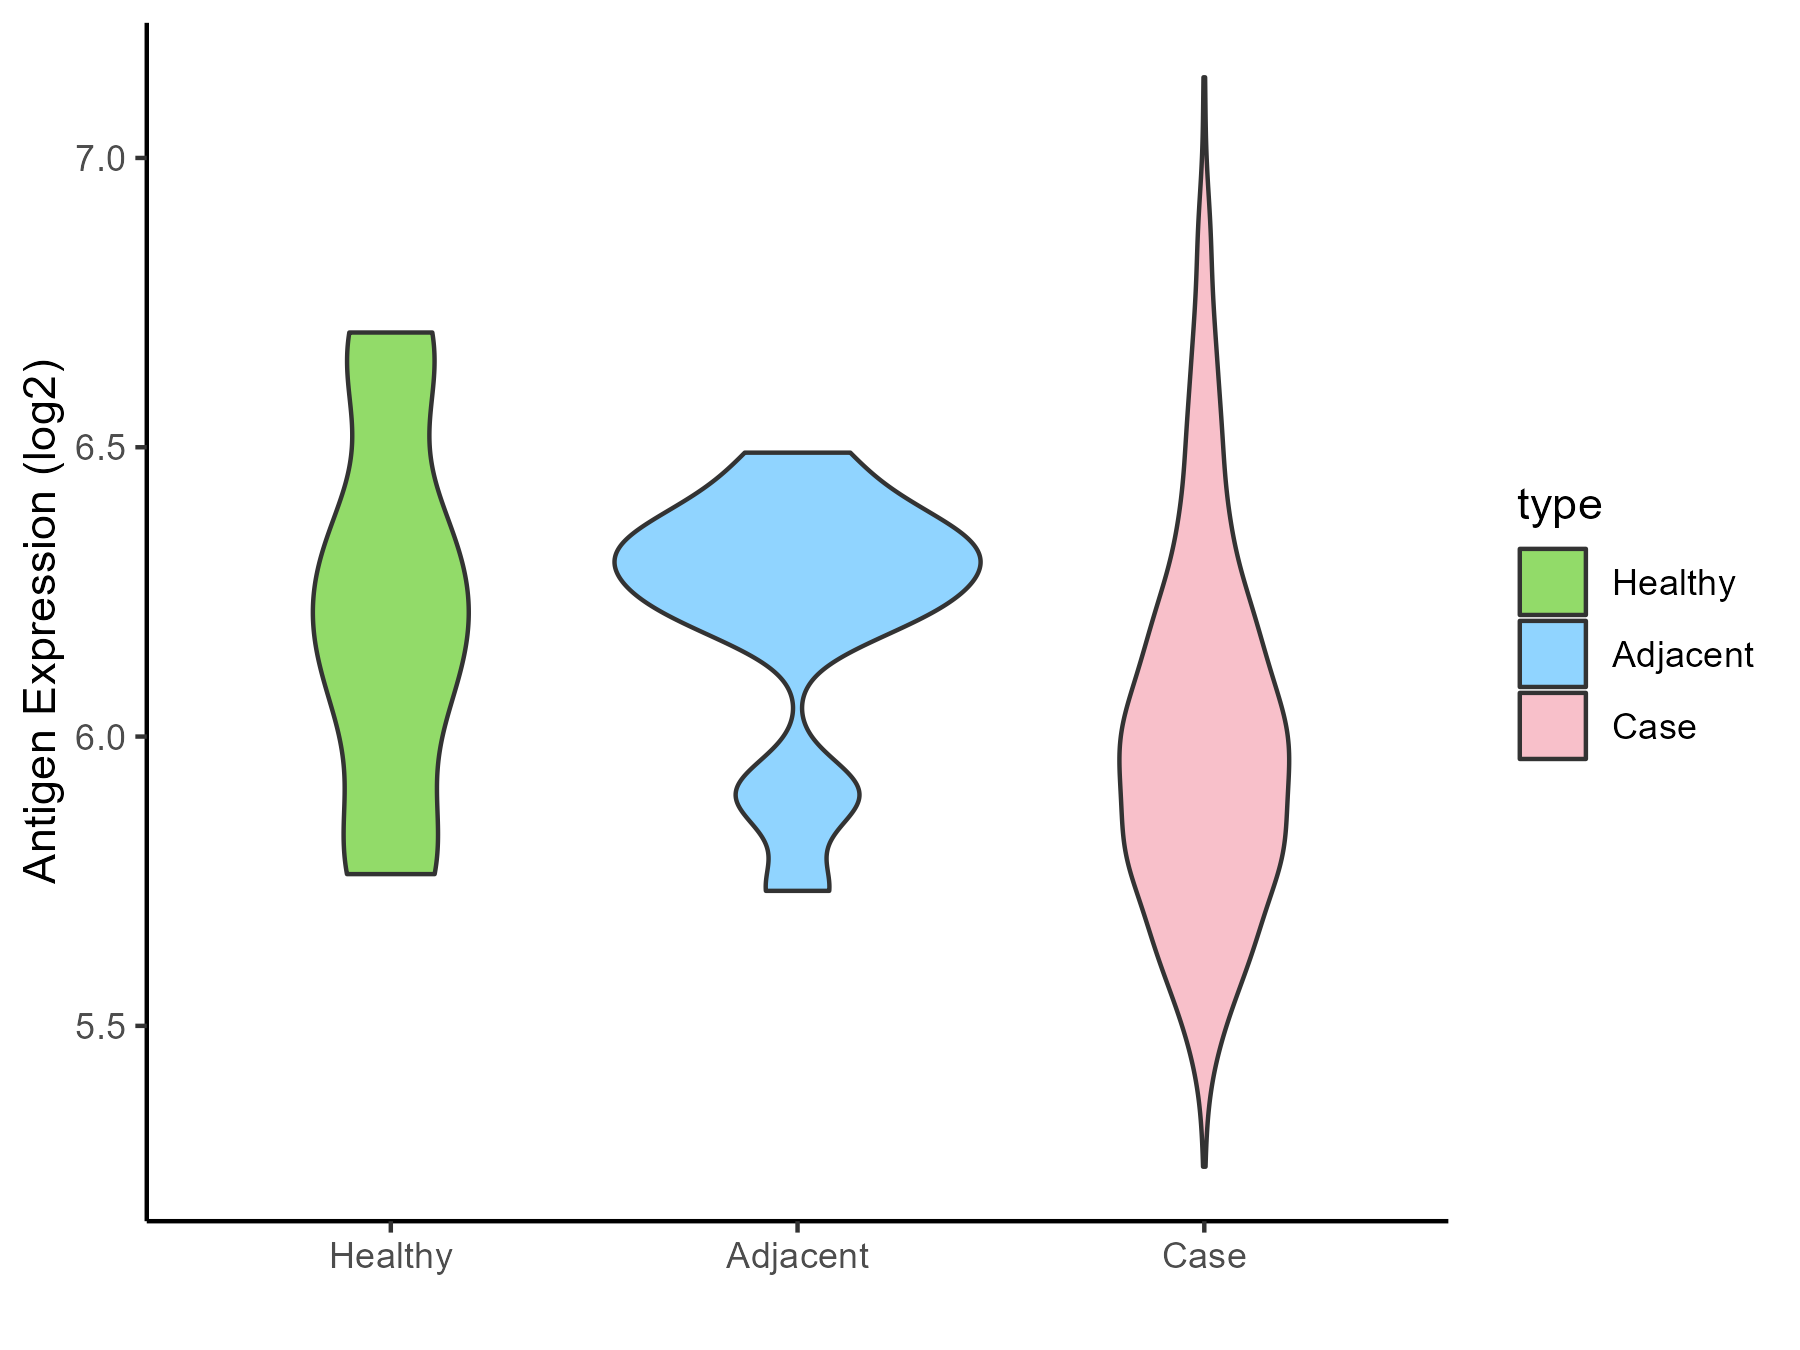
| The Studied Tissue | Ovarian | |
| The Specific Disease | Ovarian cancer | |
| The Expression Level of Disease Section Compare with the Healthy Individual Tissue | p-value: 0.081536891; Fold-change: -0.22543667; Z-score: -0.697945024 | |
| The Expression Level of Disease Section Compare with the Adjacent Tissue | p-value: 0.003072367; Fold-change: -0.315180058; Z-score: -1.437849959 | |
| Disease-specific Antigen Abundances |
|
Click to View the Clearer Original Diagram |
| Differential expression pattern of antigen in diseases | ||
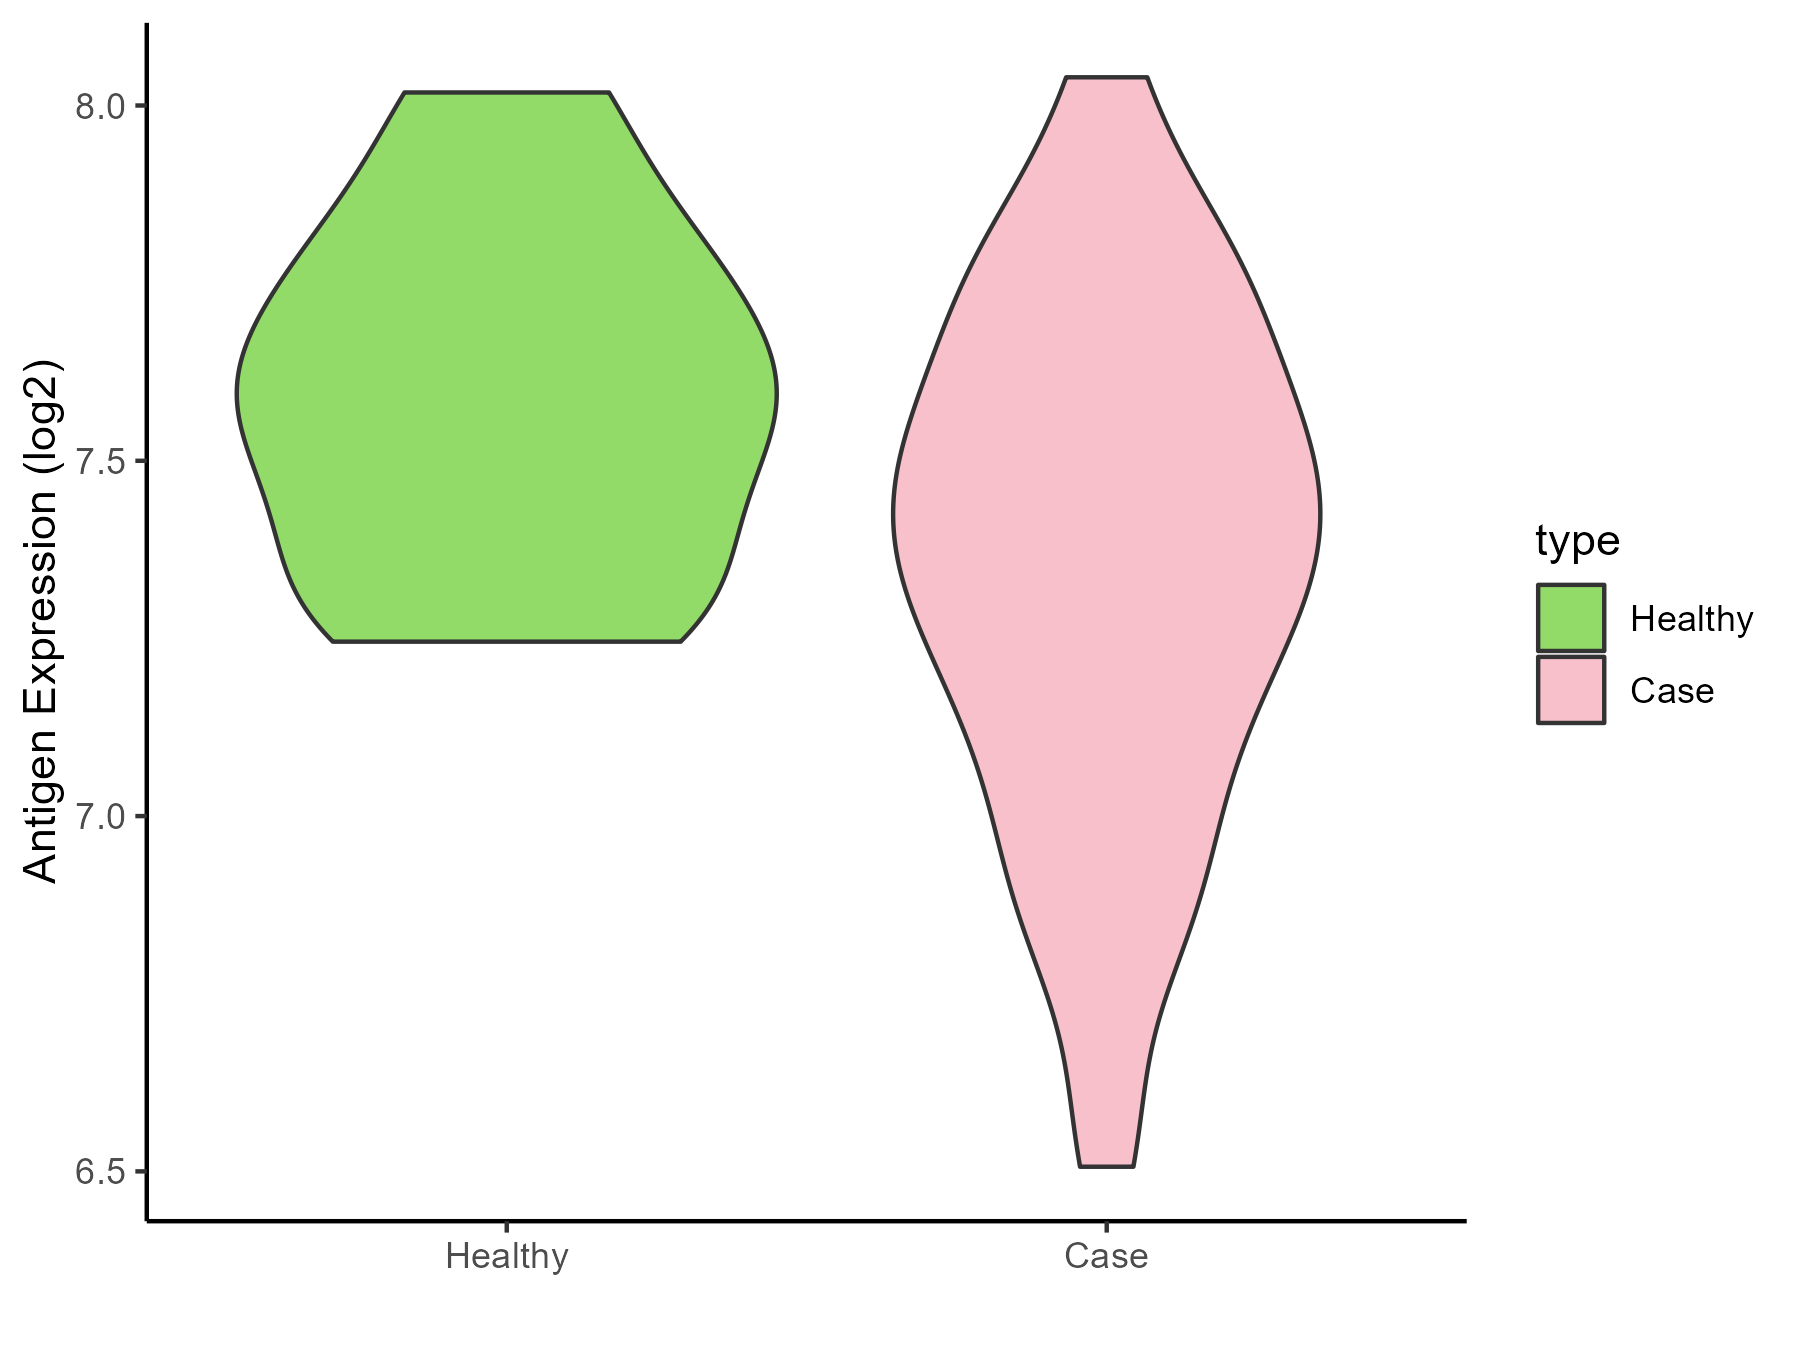
| The Studied Tissue | Cervical | |
| The Specific Disease | Cervical cancer | |
| The Expression Level of Disease Section Compare with the Healthy Individual Tissue | p-value: 0.001667735; Fold-change: -0.194399363; Z-score: -0.794287664 | |
| Disease-specific Antigen Abundances |
|
Click to View the Clearer Original Diagram |
| Differential expression pattern of antigen in diseases | ||
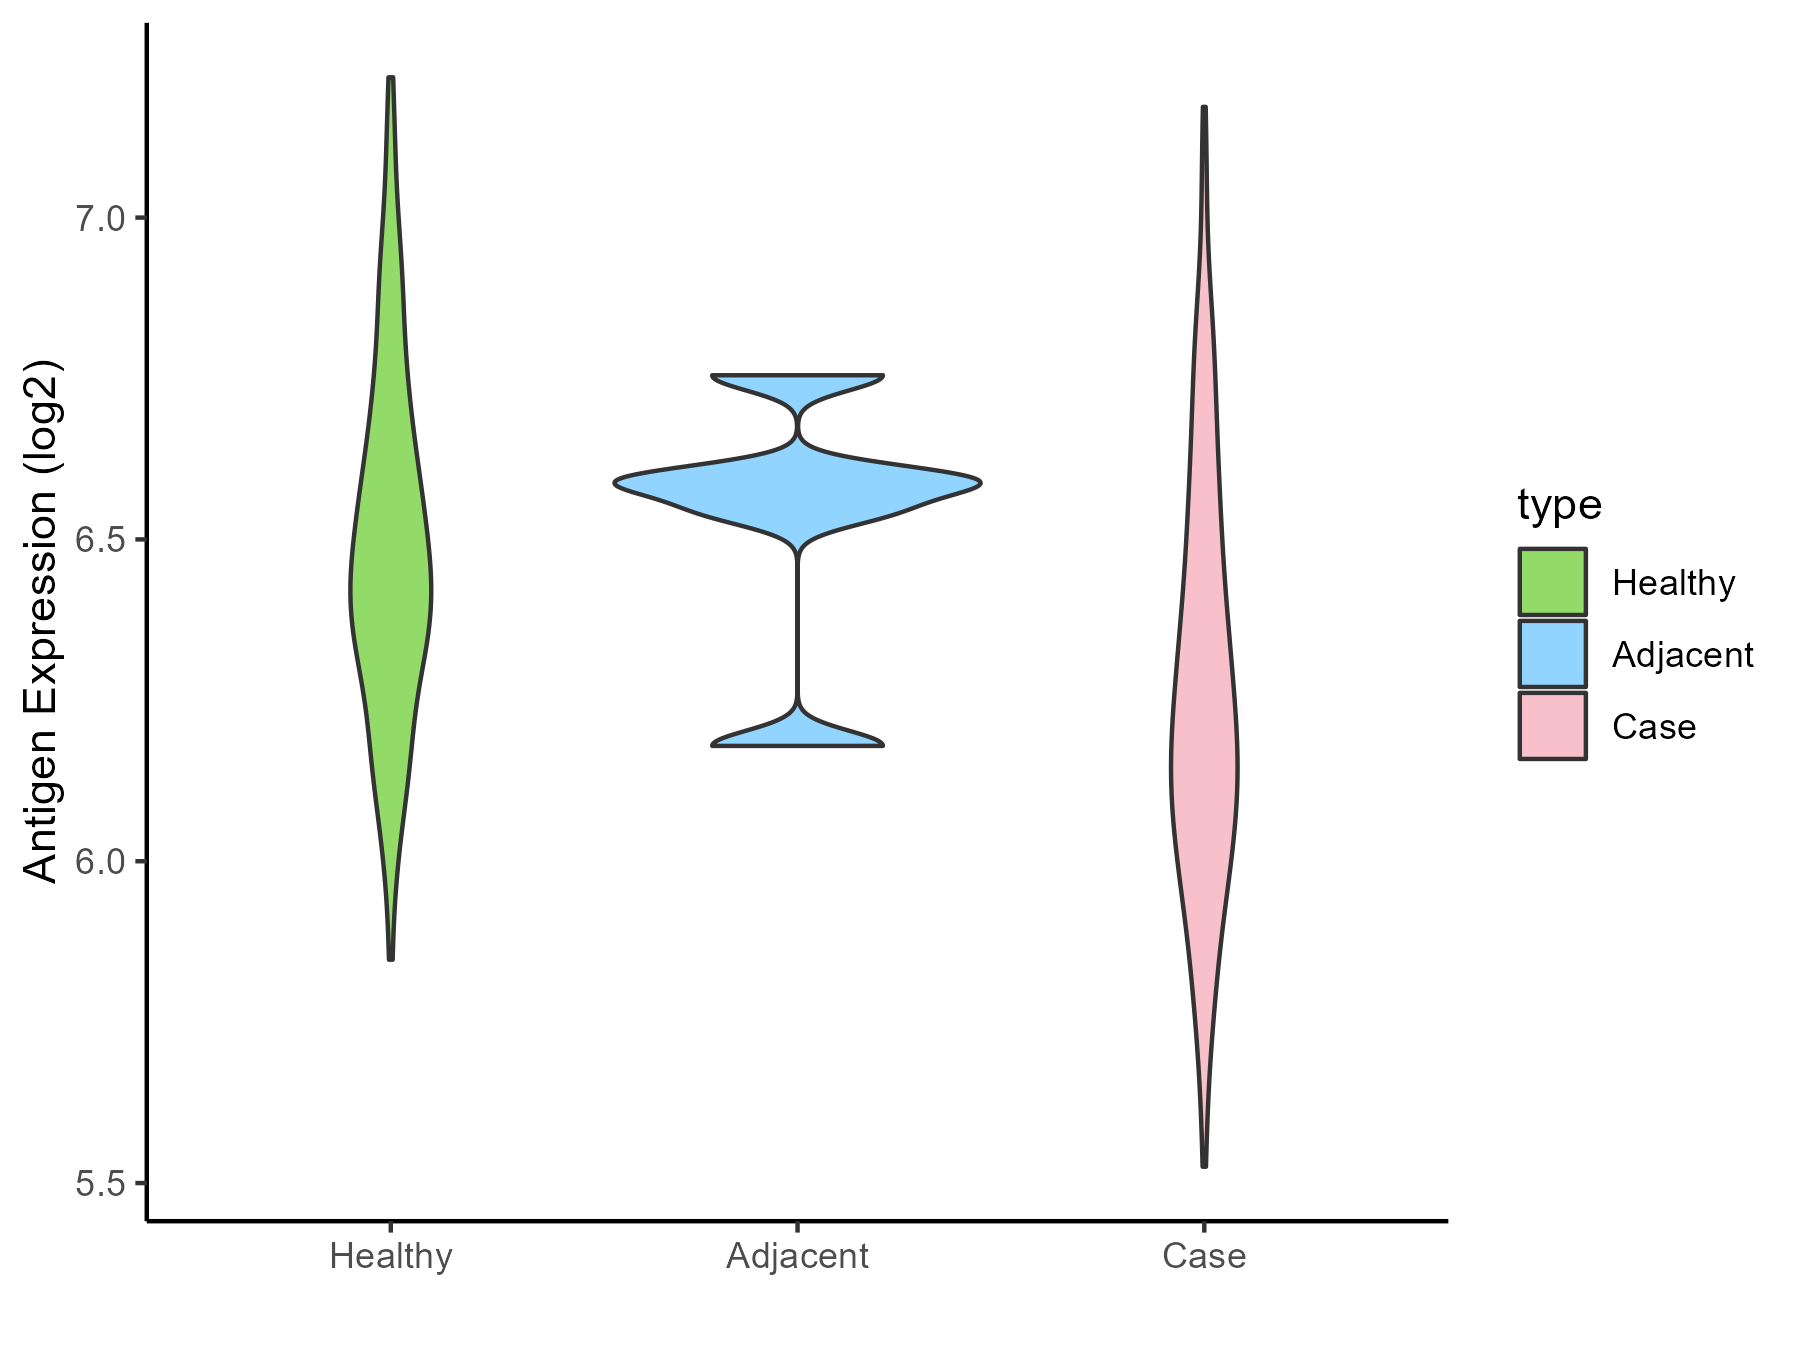
| The Studied Tissue | Endometrium | |
| The Specific Disease | Uterine cancer | |
| The Expression Level of Disease Section Compare with the Healthy Individual Tissue | p-value: 2.47E-12; Fold-change: -0.254130927; Z-score: -0.943826875 | |
| The Expression Level of Disease Section Compare with the Adjacent Tissue | p-value: 0.044931755; Fold-change: -0.386039154; Z-score: -1.81255194 | |
| Disease-specific Antigen Abundances |
|
Click to View the Clearer Original Diagram |
| Differential expression pattern of antigen in diseases | ||
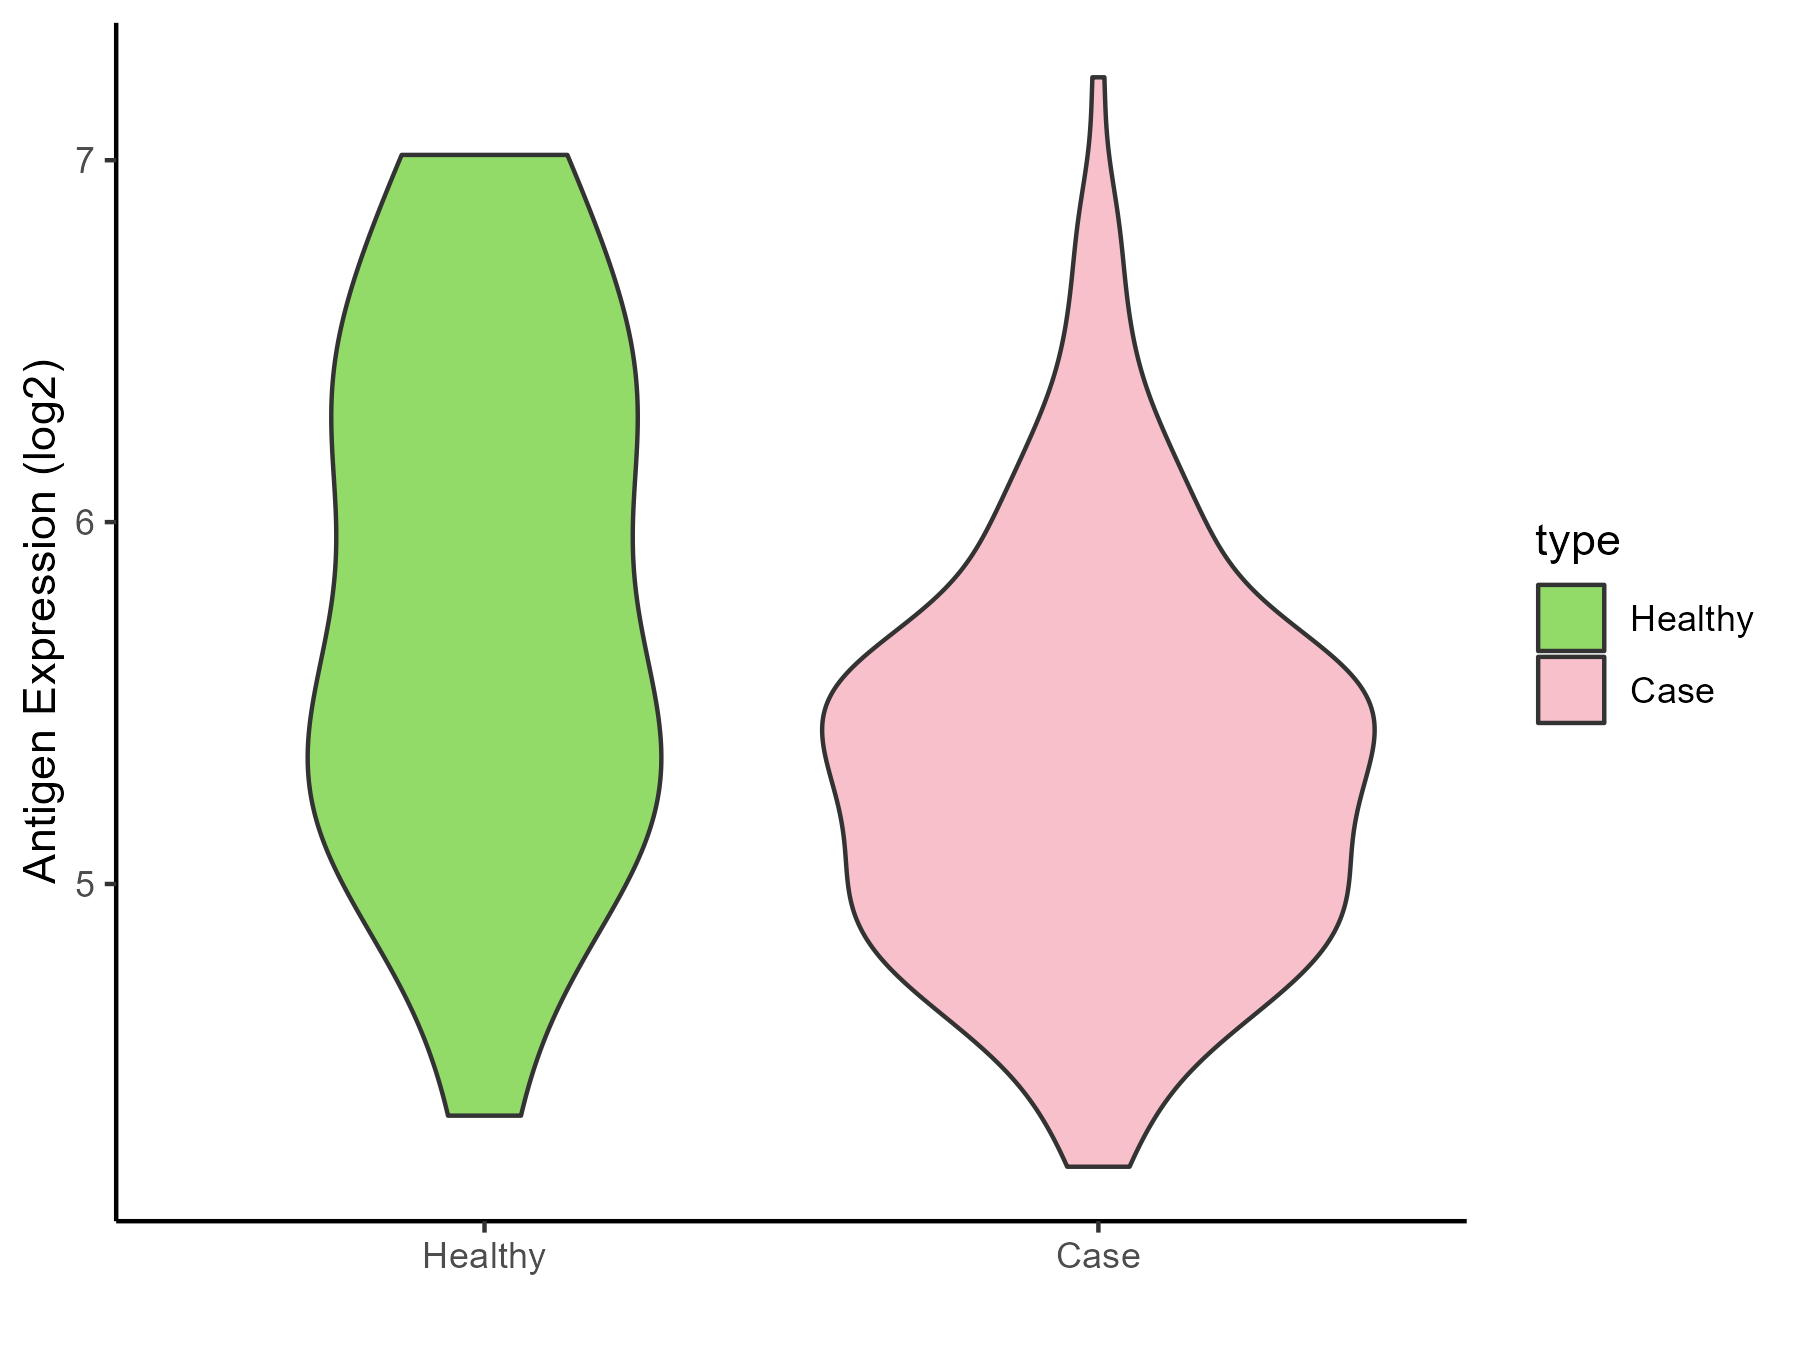
| The Studied Tissue | Prostate | |
| The Specific Disease | Prostate cancer | |
| The Expression Level of Disease Section Compare with the Healthy Individual Tissue | p-value: 0.008779175; Fold-change: -0.432060189; Z-score: -0.586325741 | |
| Disease-specific Antigen Abundances |
|
Click to View the Clearer Original Diagram |
| Differential expression pattern of antigen in diseases | ||
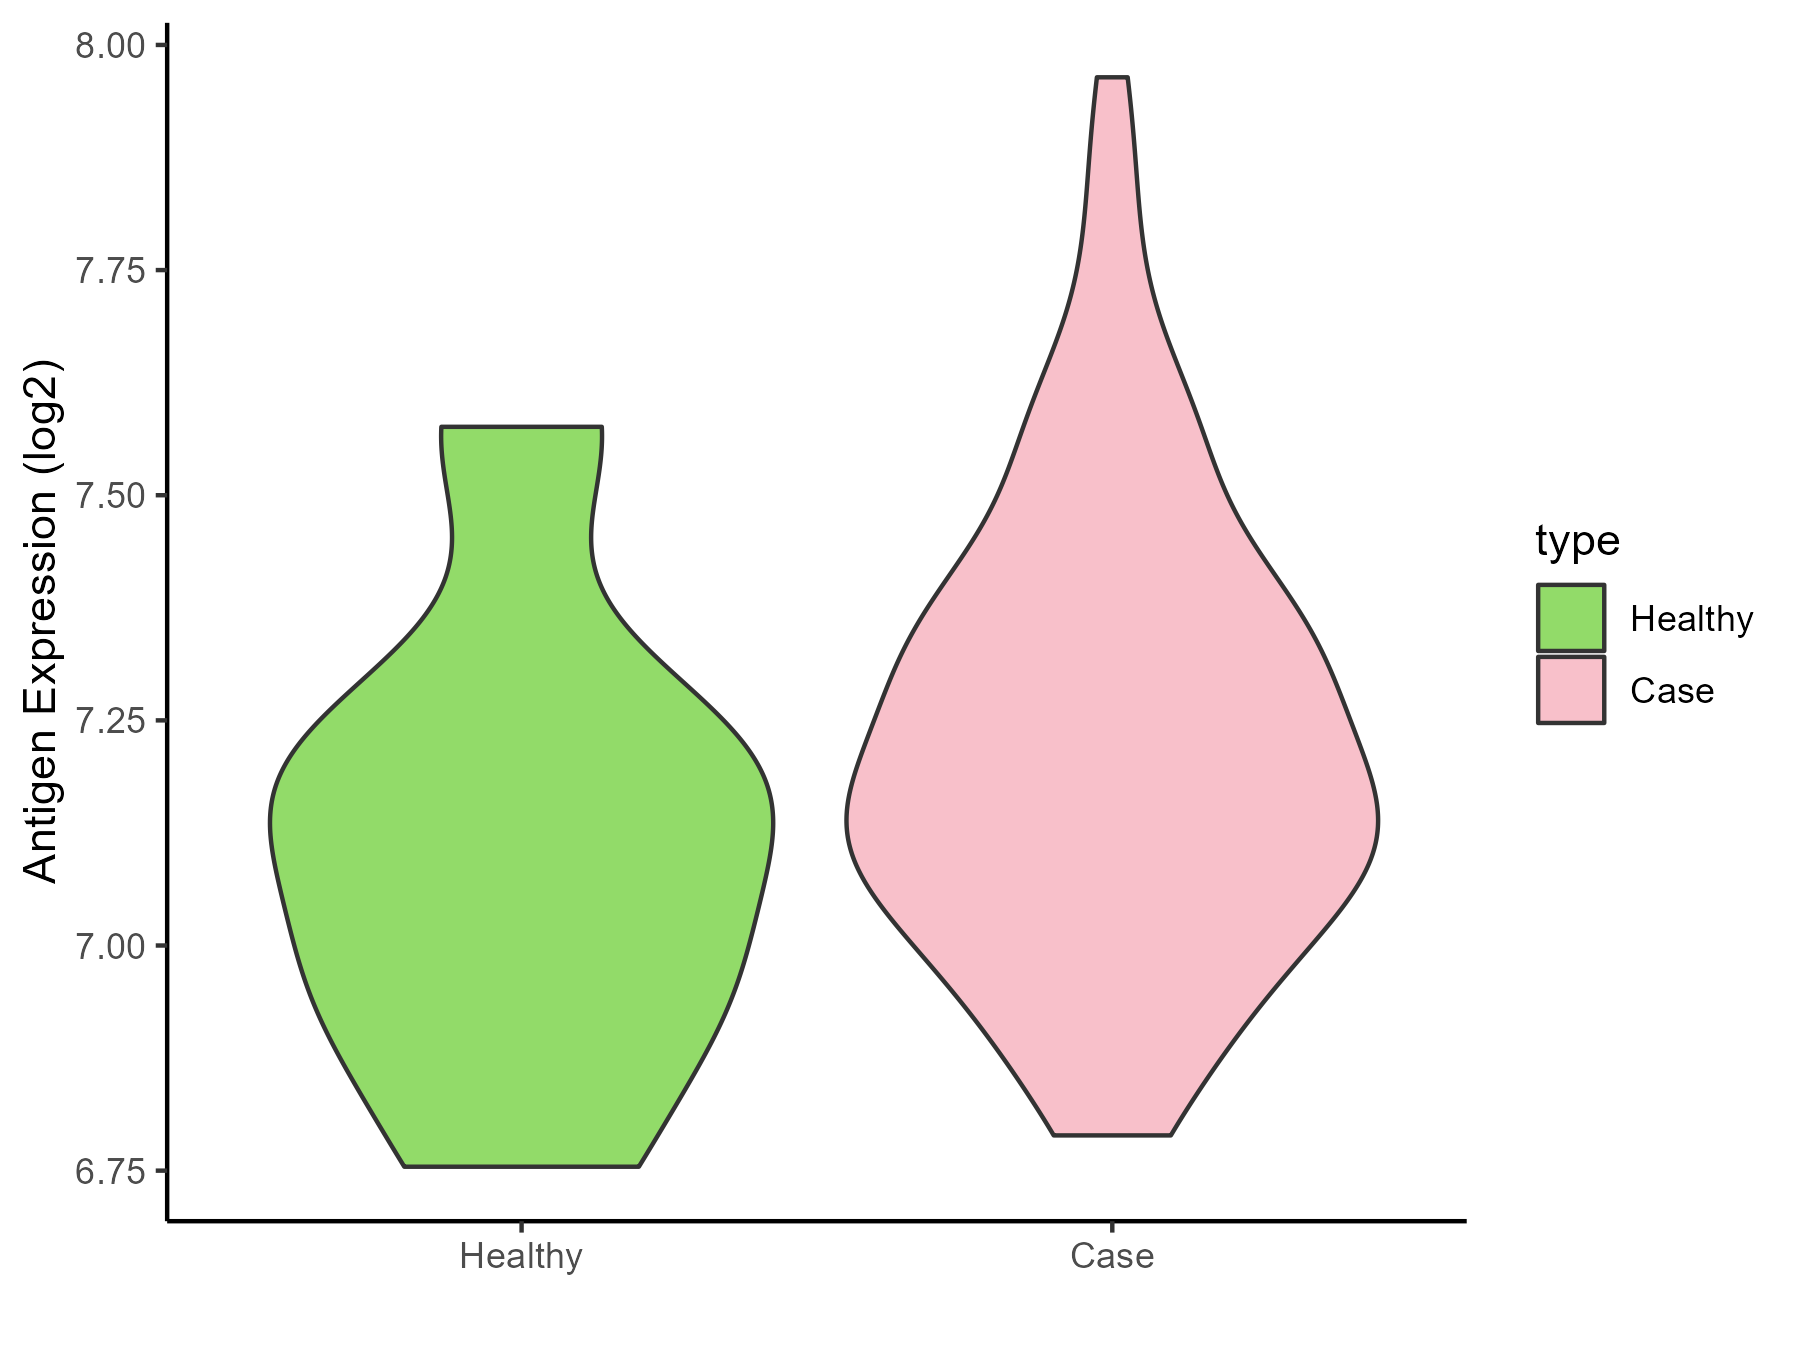
| The Studied Tissue | Bladder | |
| The Specific Disease | Bladder cancer | |
| The Expression Level of Disease Section Compare with the Healthy Individual Tissue | p-value: 0.294227132; Fold-change: 0.069791335; Z-score: 0.264917641 | |
| Disease-specific Antigen Abundances |
|
Click to View the Clearer Original Diagram |
| Differential expression pattern of antigen in diseases | ||
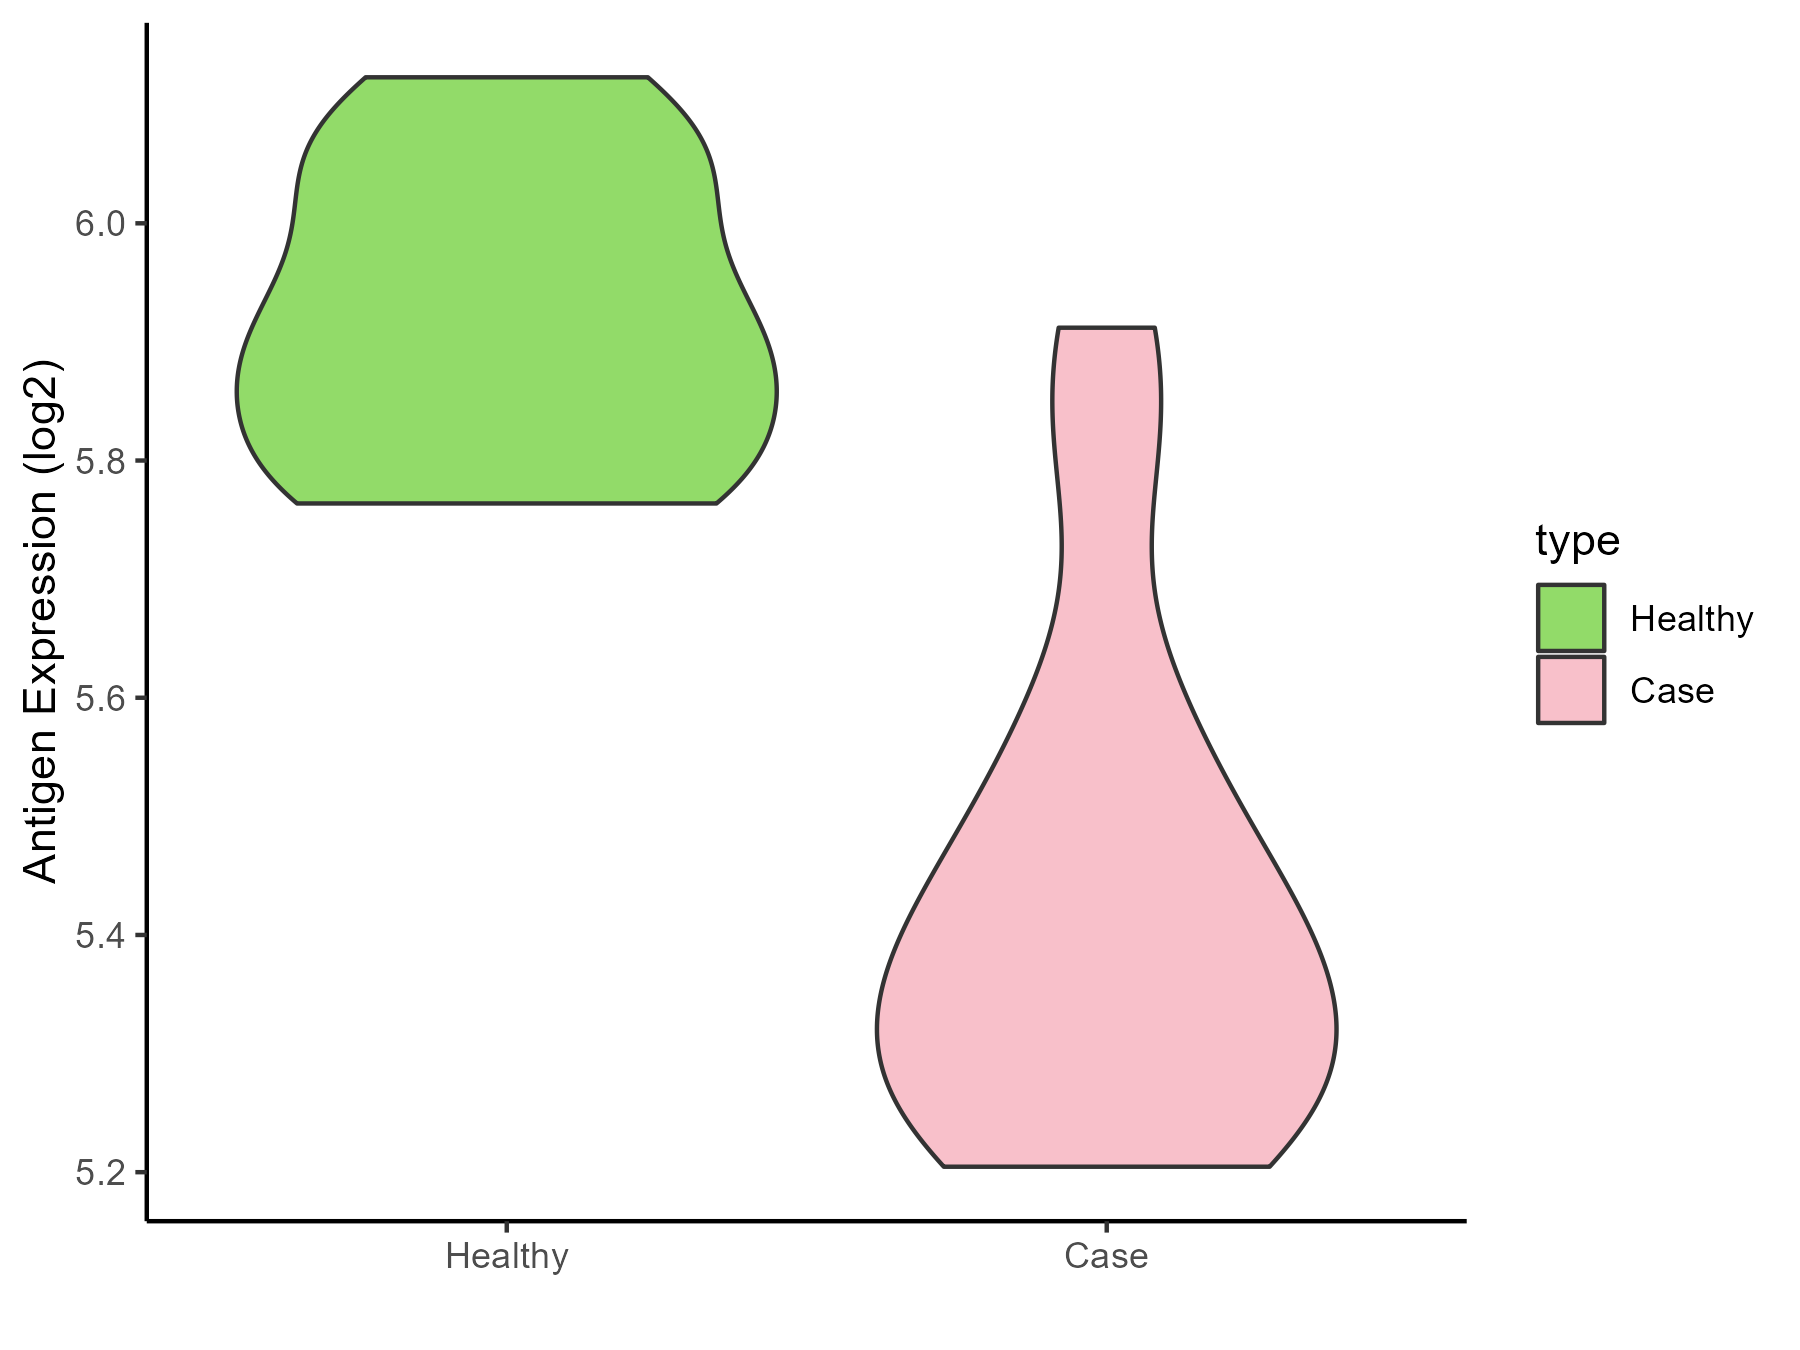
| The Studied Tissue | Uvea | |
| The Specific Disease | Retinoblastoma tumor | |
| The Expression Level of Disease Section Compare with the Healthy Individual Tissue | p-value: 3.76E-07; Fold-change: -0.535419778; Z-score: -4.271685841 | |
| Disease-specific Antigen Abundances |
|
Click to View the Clearer Original Diagram |
| Differential expression pattern of antigen in diseases | ||
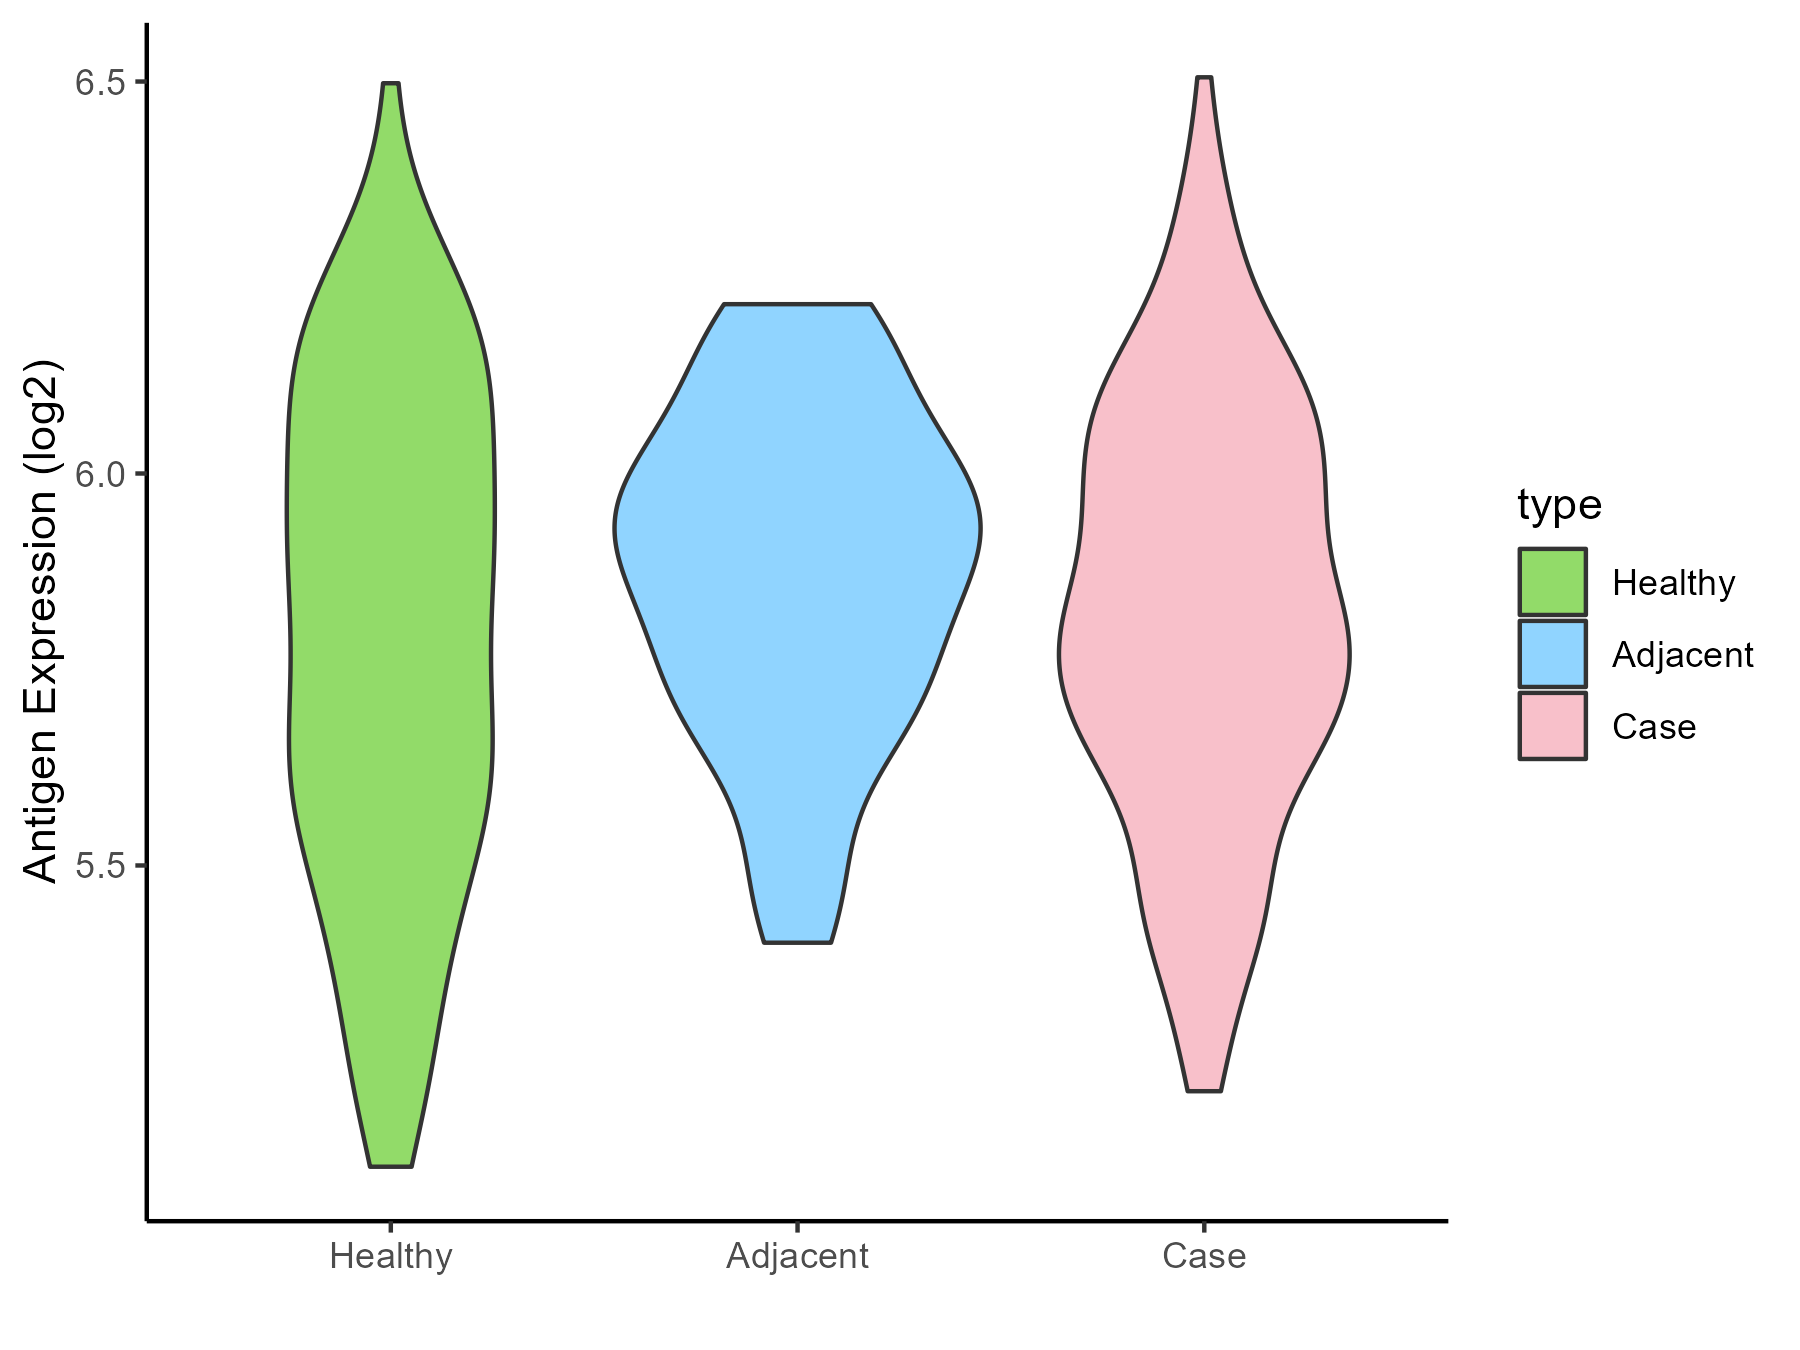
| The Studied Tissue | Thyroid | |
| The Specific Disease | Thyroid cancer | |
| The Expression Level of Disease Section Compare with the Healthy Individual Tissue | p-value: 0.388296677; Fold-change: 0.024378583; Z-score: 0.077173913 | |
| The Expression Level of Disease Section Compare with the Adjacent Tissue | p-value: 0.191466999; Fold-change: -0.092470395; Z-score: -0.438799784 | |
| Disease-specific Antigen Abundances |
|
Click to View the Clearer Original Diagram |
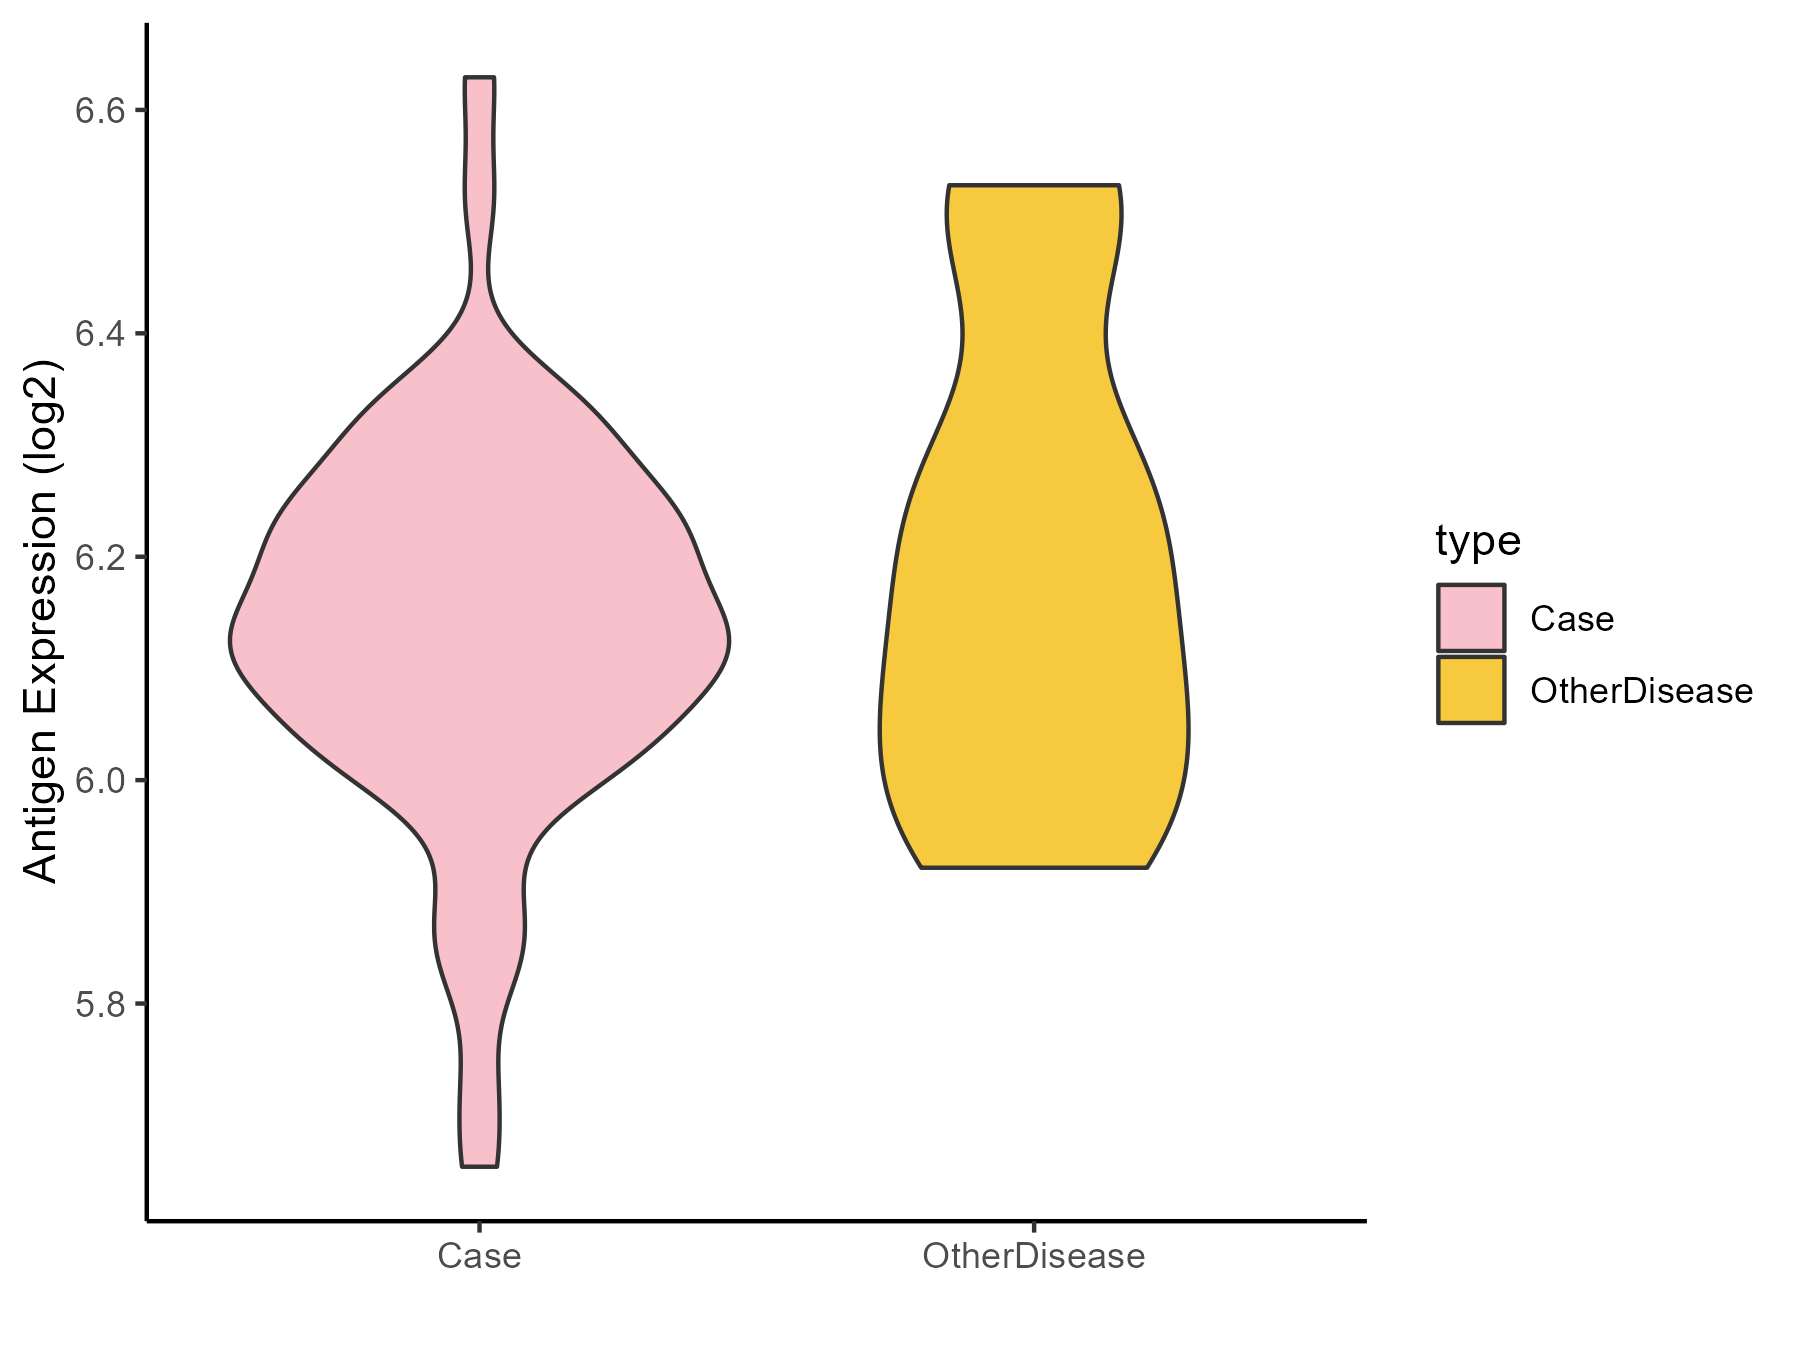
| Differential expression pattern of antigen in diseases | ||
| The Studied Tissue | Adrenal cortex | |
| The Specific Disease | Adrenocortical carcinoma | |
| The Expression Level of Disease Section Compare with the Other Disease Section | p-value: 0.319347224; Fold-change: -0.020011698; Z-score: -0.094401087 | |
| Disease-specific Antigen Abundances |
|
Click to View the Clearer Original Diagram |
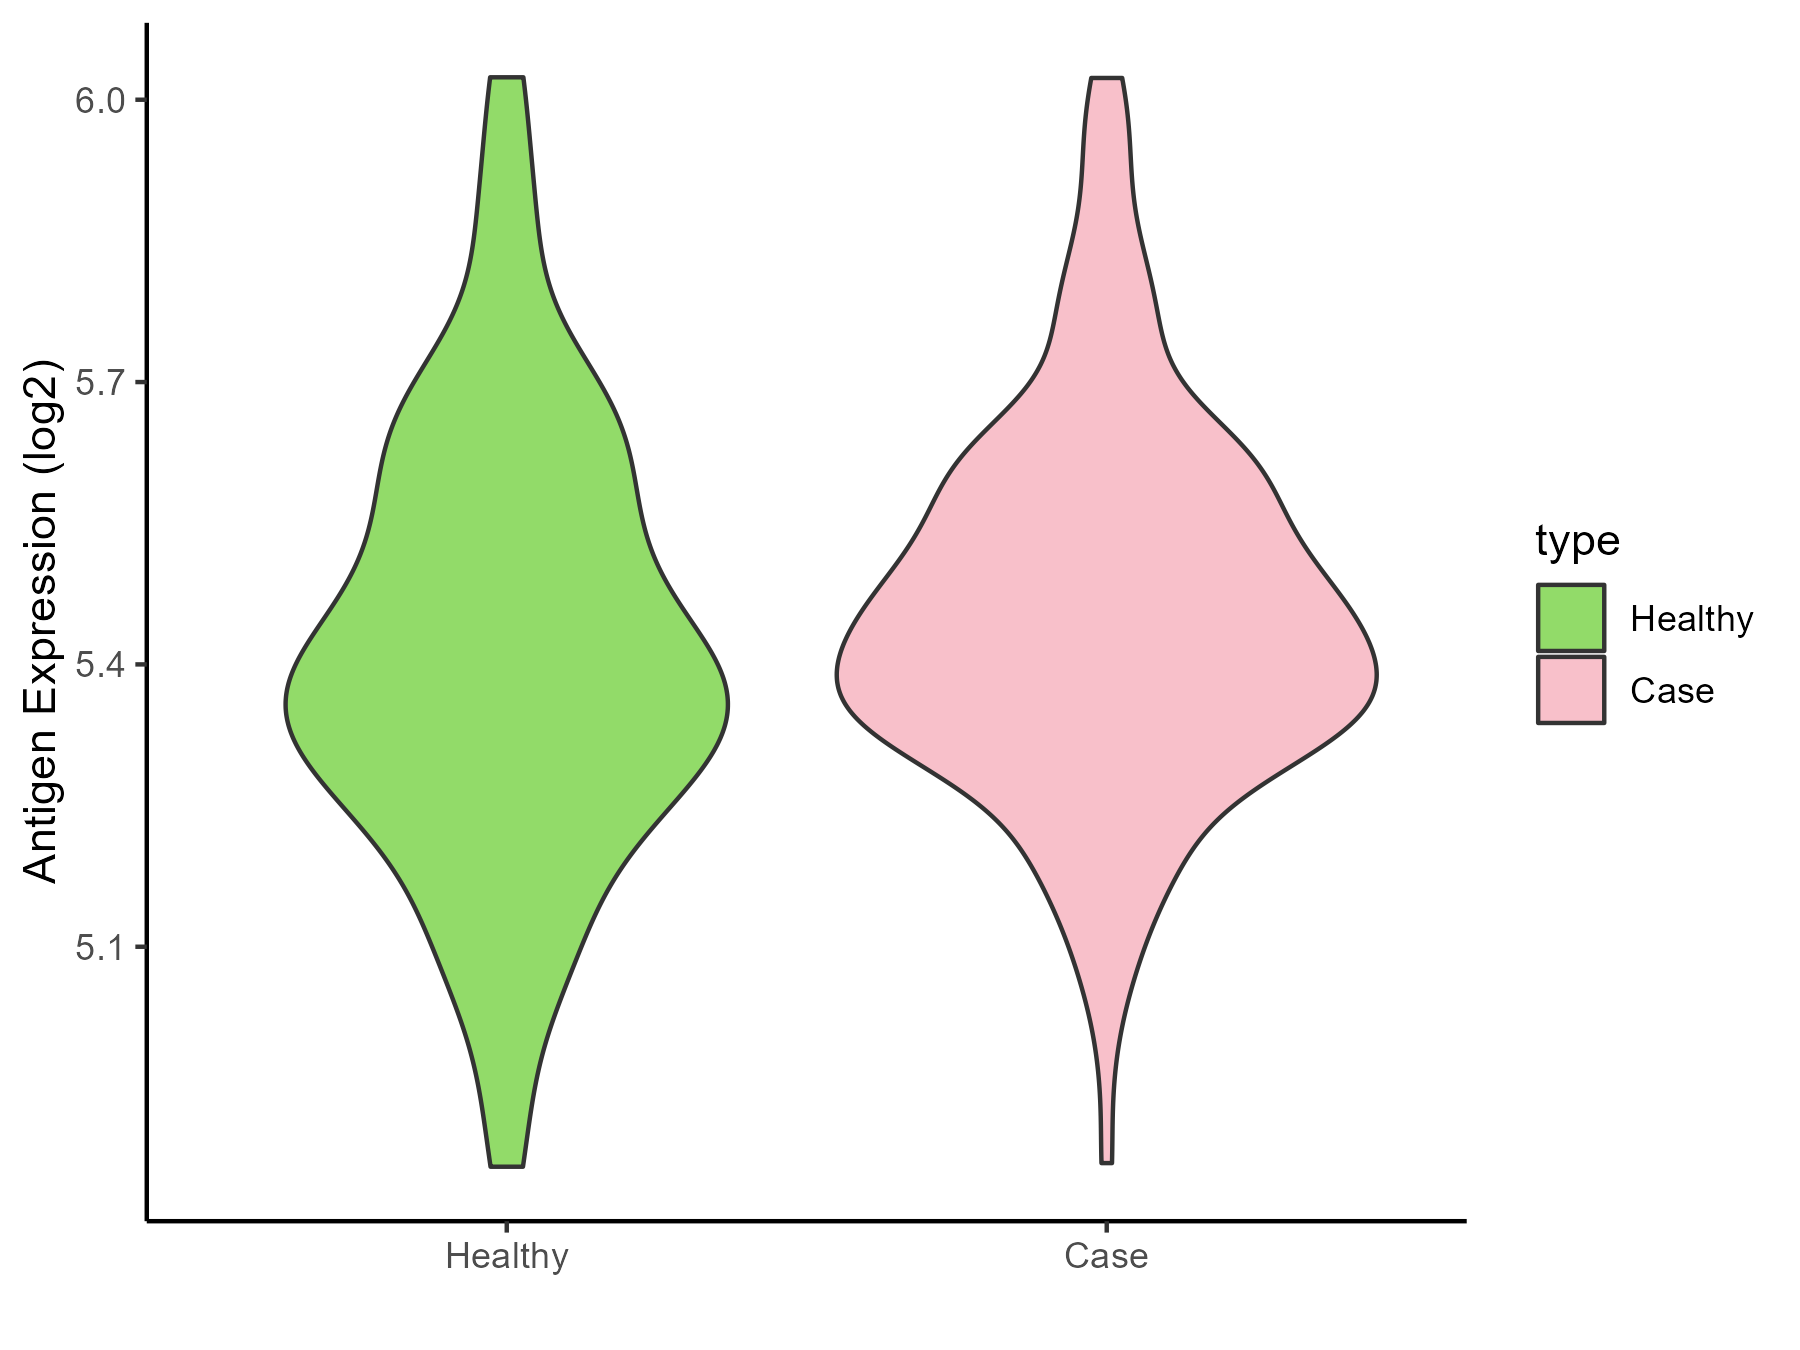
| Differential expression pattern of antigen in diseases | ||
| The Studied Tissue | Head and neck | |
| The Specific Disease | Head and neck cancer | |
| The Expression Level of Disease Section Compare with the Healthy Individual Tissue | p-value: 0.166634253; Fold-change: 0.056248048; Z-score: 0.243150603 | |
| Disease-specific Antigen Abundances |
|
Click to View the Clearer Original Diagram |
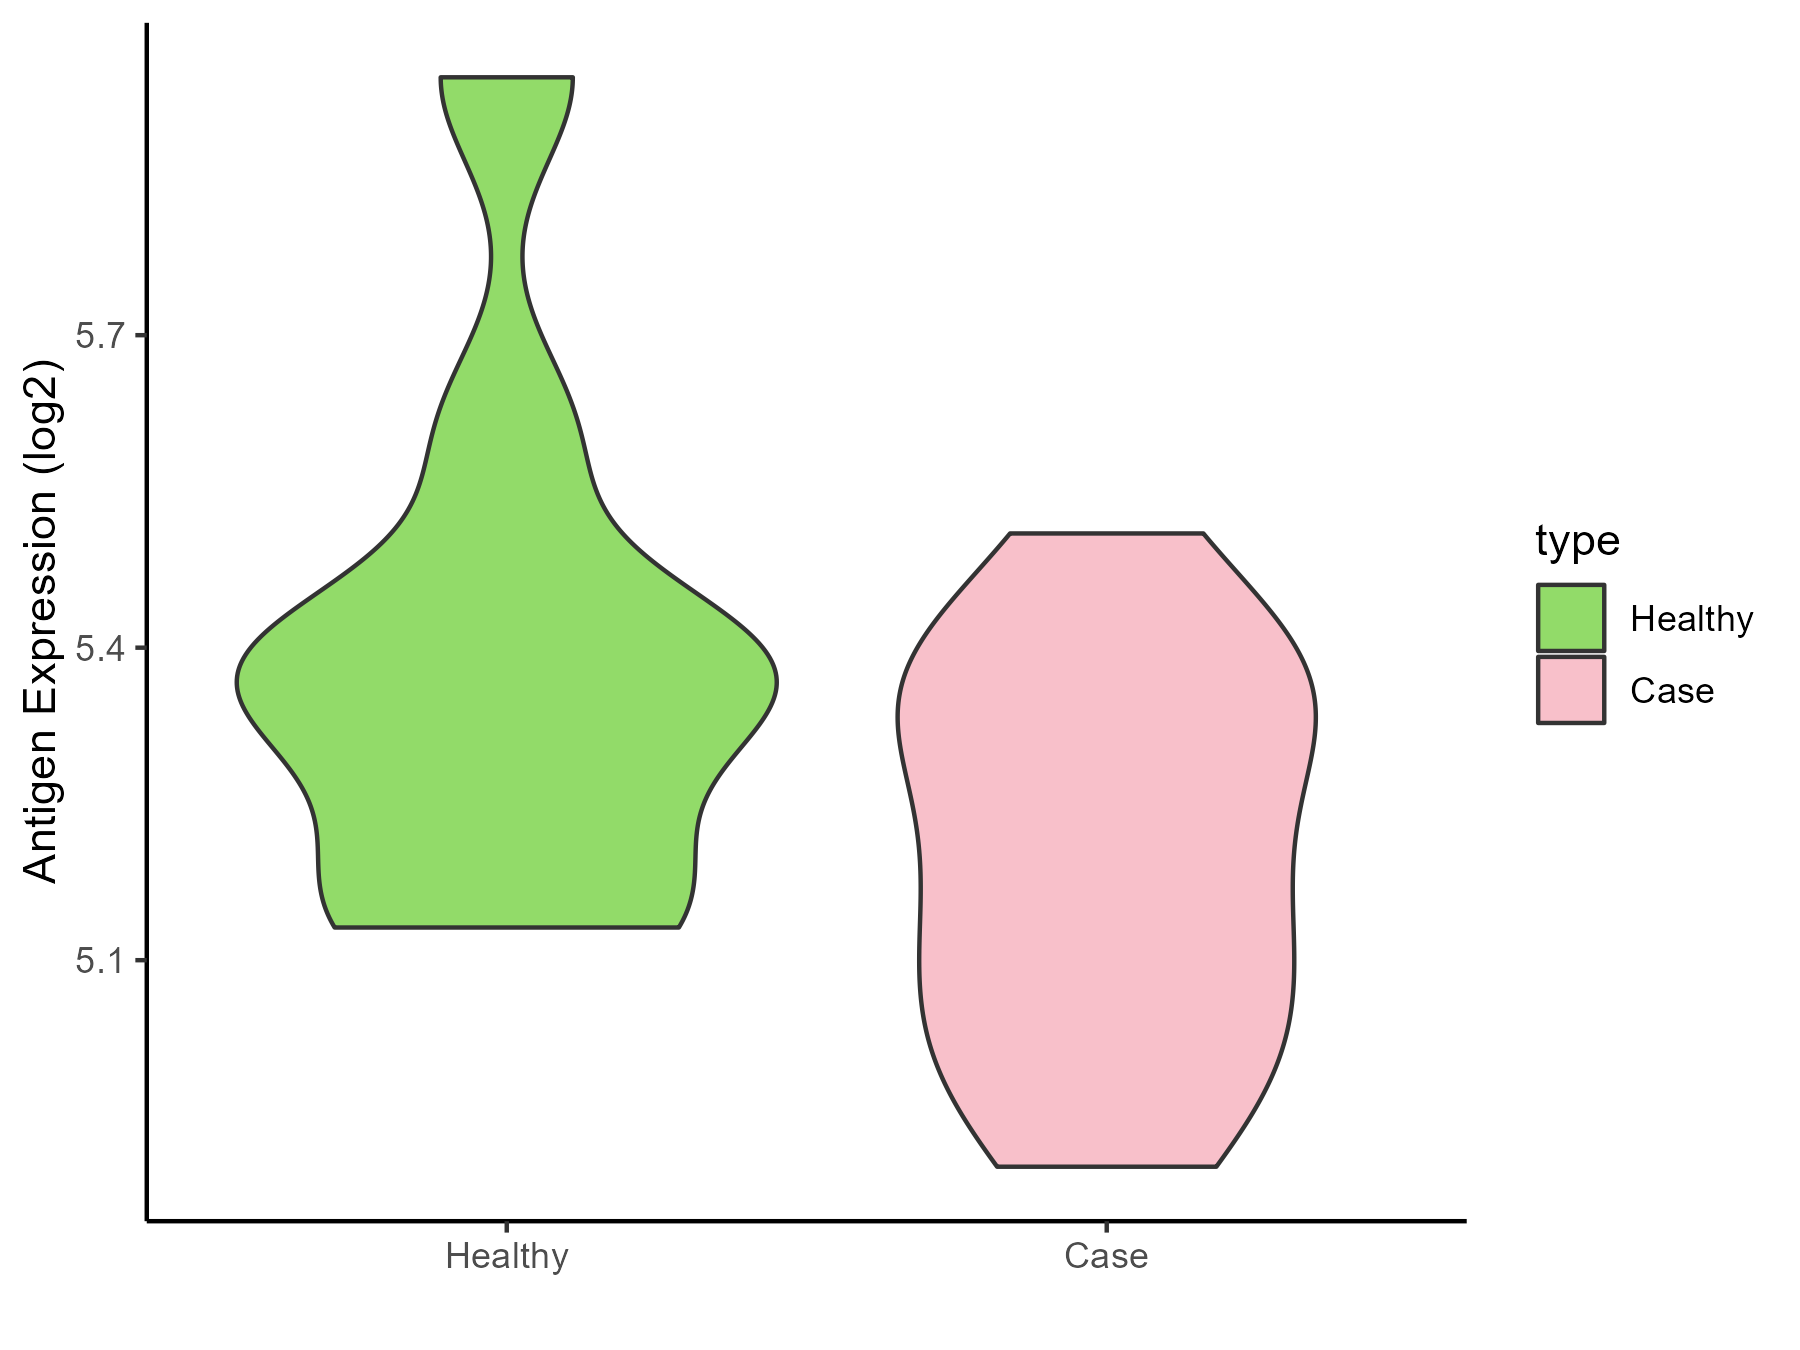
| Differential expression pattern of antigen in diseases | ||
| The Studied Tissue | Pituitary | |
| The Specific Disease | Pituitary gonadotrope tumor | |
| The Expression Level of Disease Section Compare with the Healthy Individual Tissue | p-value: 0.07284104; Fold-change: -0.1701268; Z-score: -0.667136117 | |
| Disease-specific Antigen Abundances |
|
Click to View the Clearer Original Diagram |
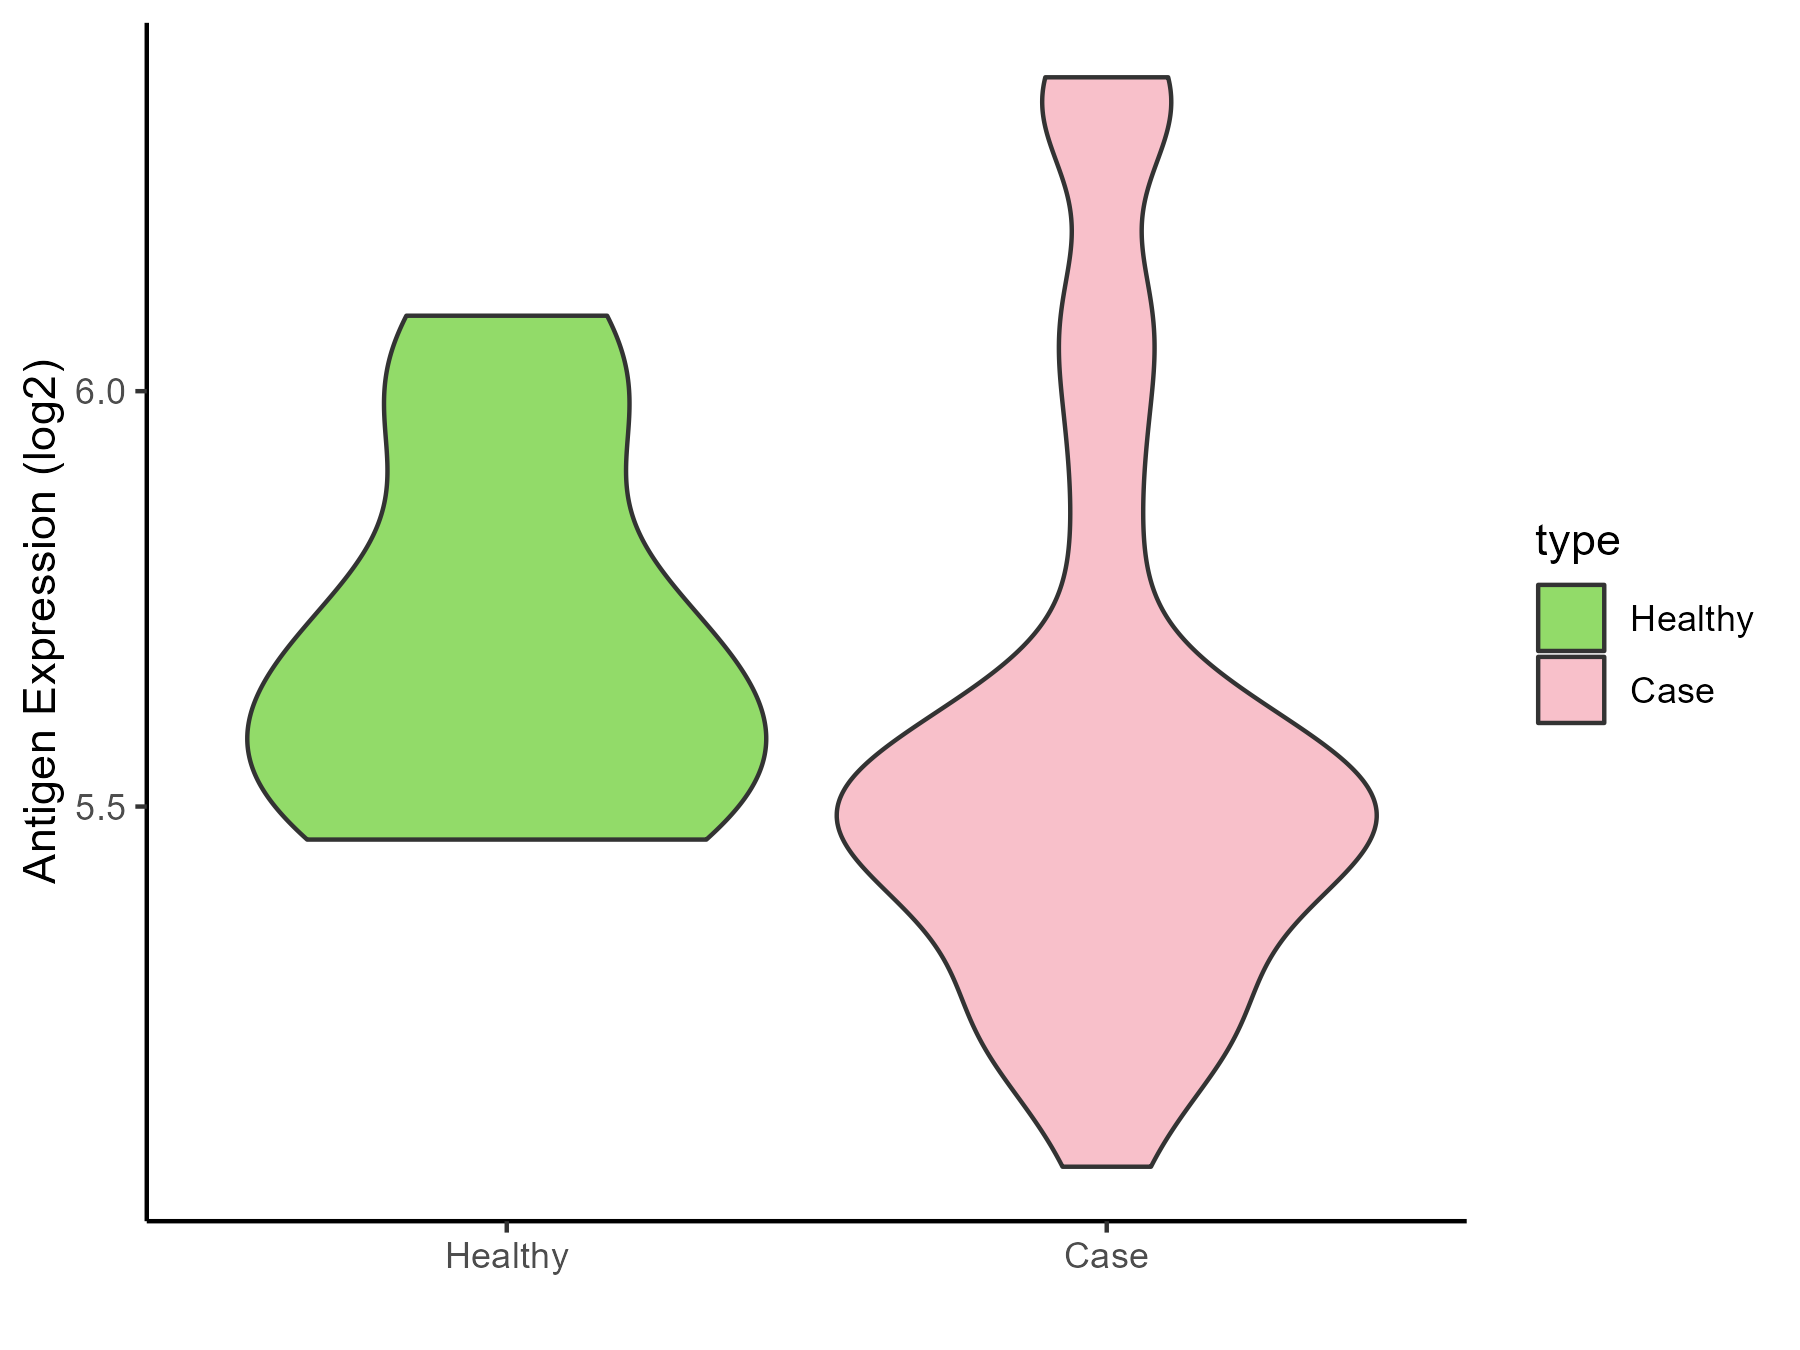
| The Studied Tissue | Pituitary | |
| The Specific Disease | Pituitary cancer | |
| The Expression Level of Disease Section Compare with the Healthy Individual Tissue | p-value: 0.203540944; Fold-change: -0.178082615; Z-score: -0.81054955 | |
| Disease-specific Antigen Abundances |
|
Click to View the Clearer Original Diagram |
ICD Disease Classification 03
| Differential expression pattern of antigen in diseases | ||
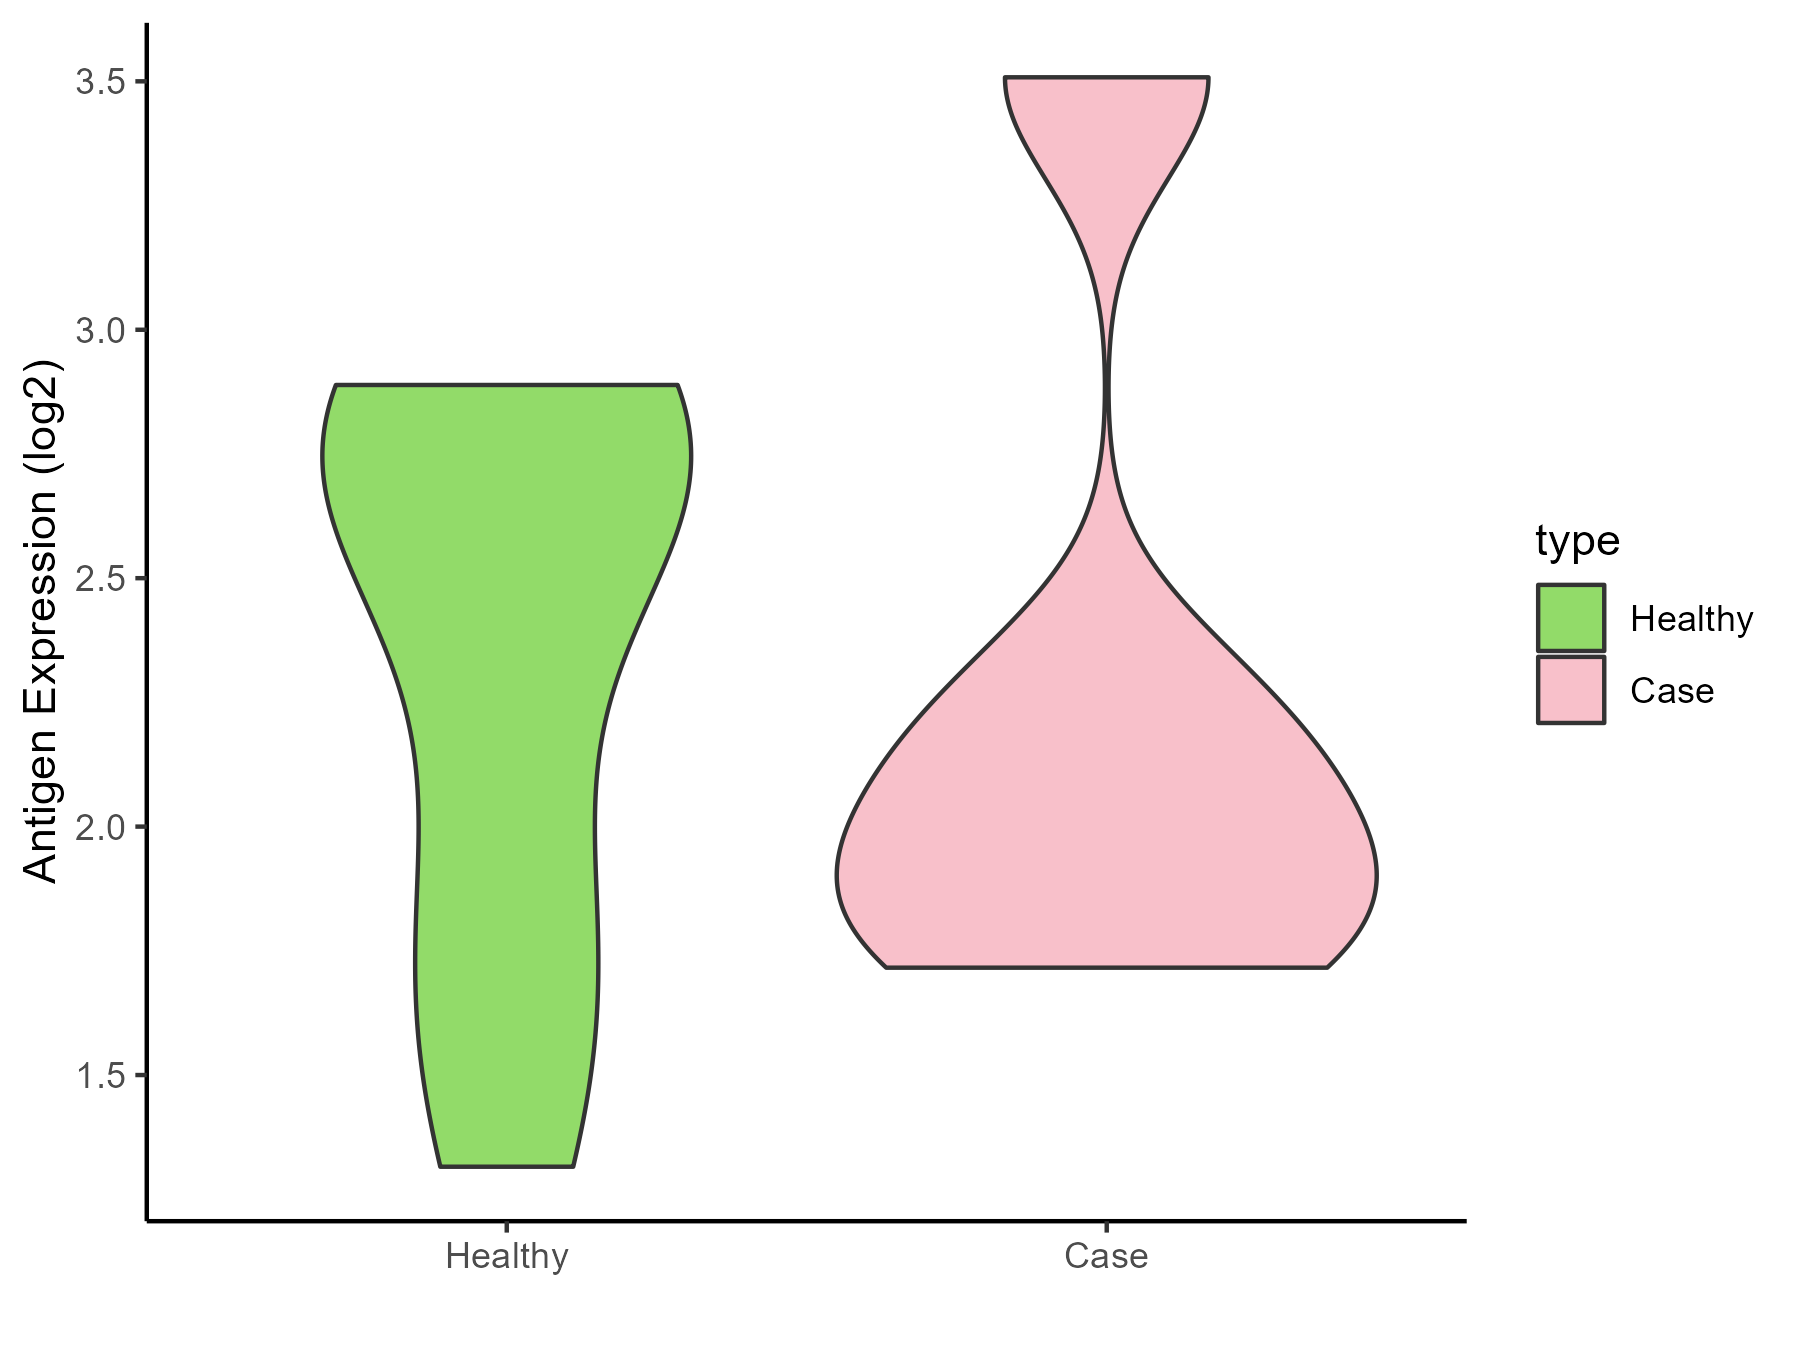
| The Studied Tissue | Whole blood | |
| The Specific Disease | Thrombocytopenia | |
| The Expression Level of Disease Section Compare with the Healthy Individual Tissue | p-value: 0.854198927; Fold-change: -0.651823518; Z-score: -1.106144295 | |
| Disease-specific Antigen Abundances |
|
Click to View the Clearer Original Diagram |
ICD Disease Classification 04
| Differential expression pattern of antigen in diseases | ||
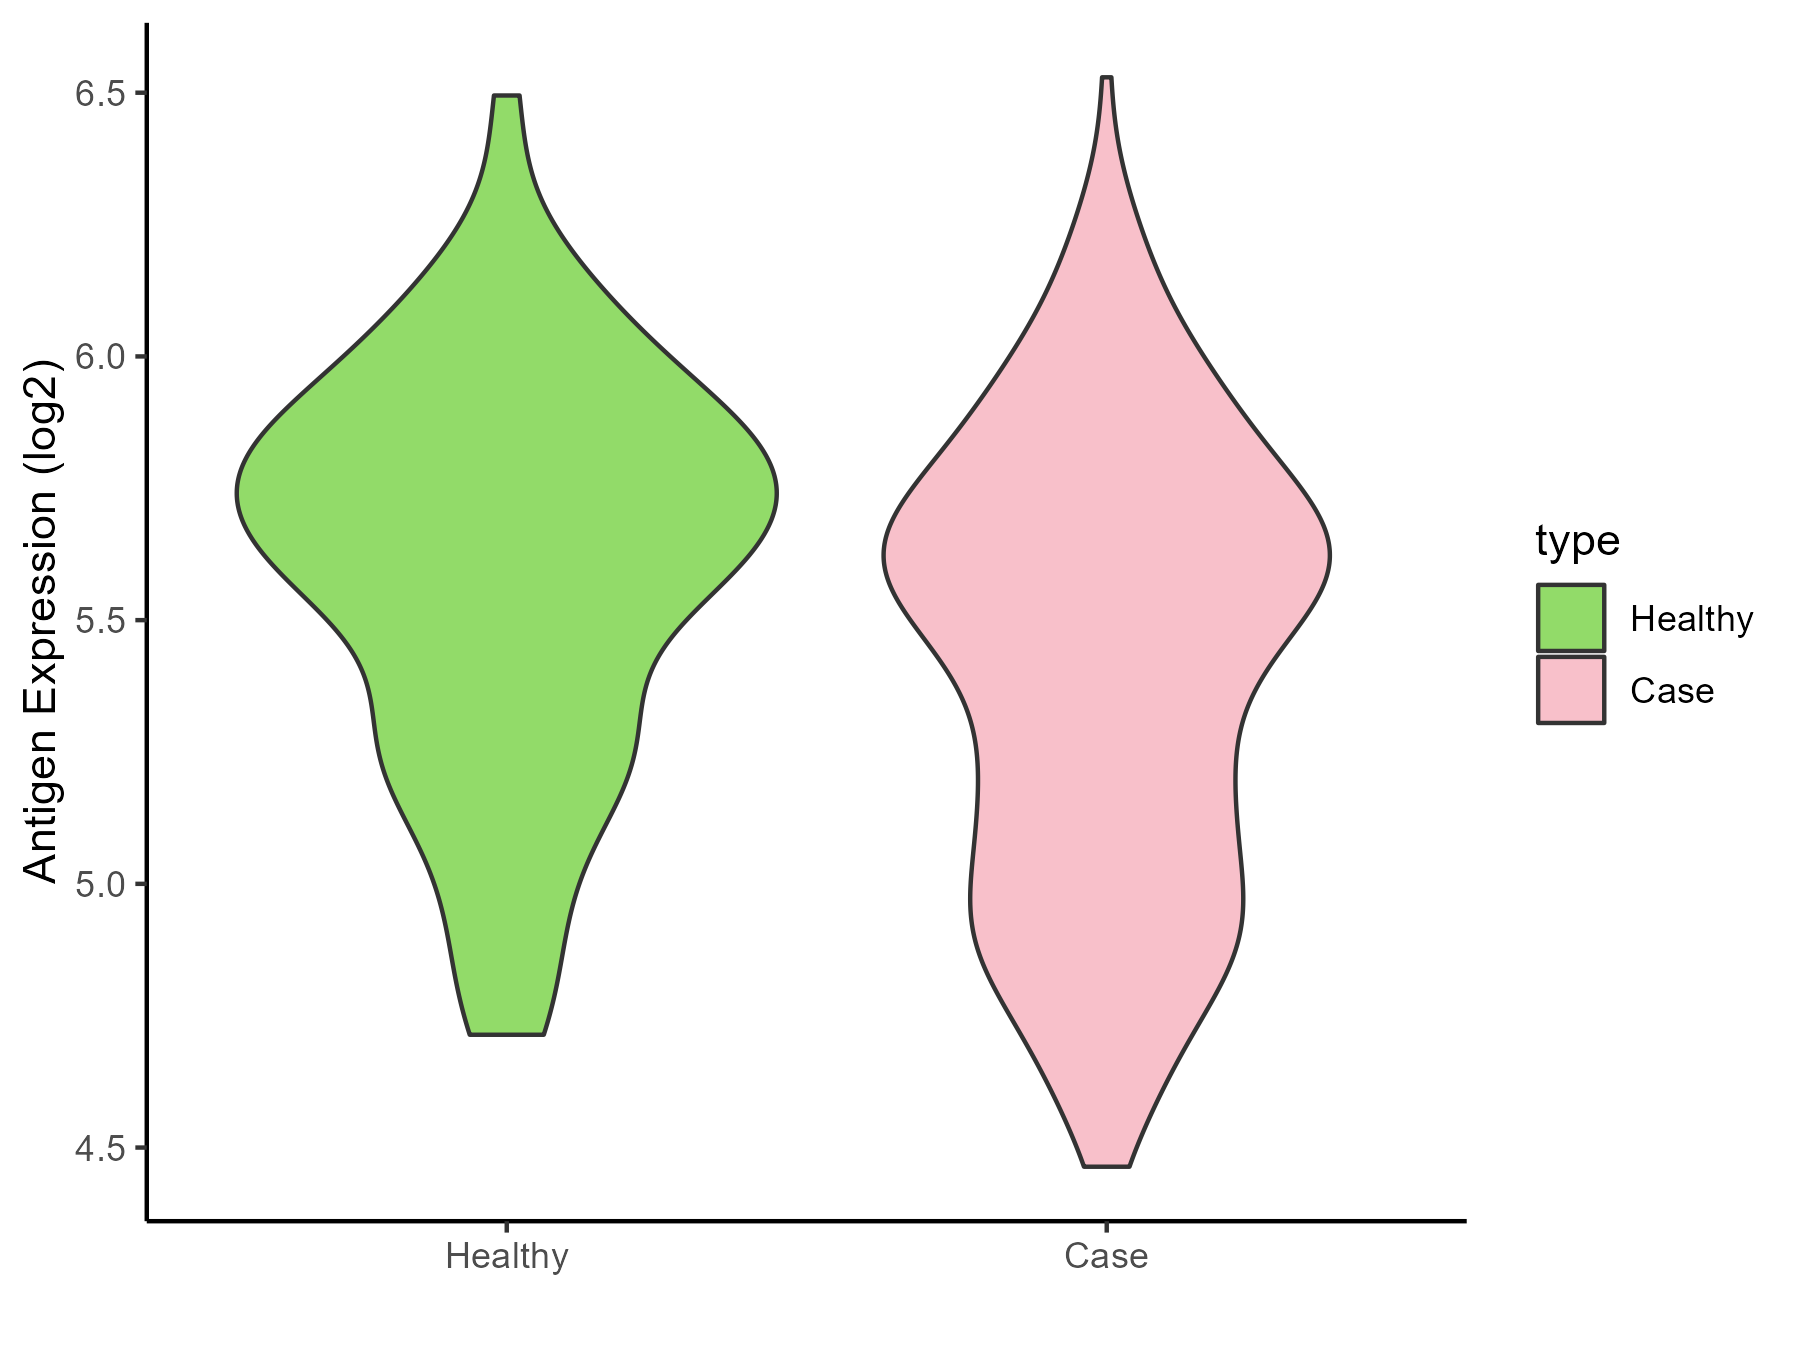
| The Studied Tissue | Whole blood | |
| The Specific Disease | Lupus erythematosus | |
| The Expression Level of Disease Section Compare with the Healthy Individual Tissue | p-value: 3.45E-05; Fold-change: -0.165366369; Z-score: -0.440244143 | |
| Disease-specific Antigen Abundances |
|
Click to View the Clearer Original Diagram |
| Differential expression pattern of antigen in diseases | ||
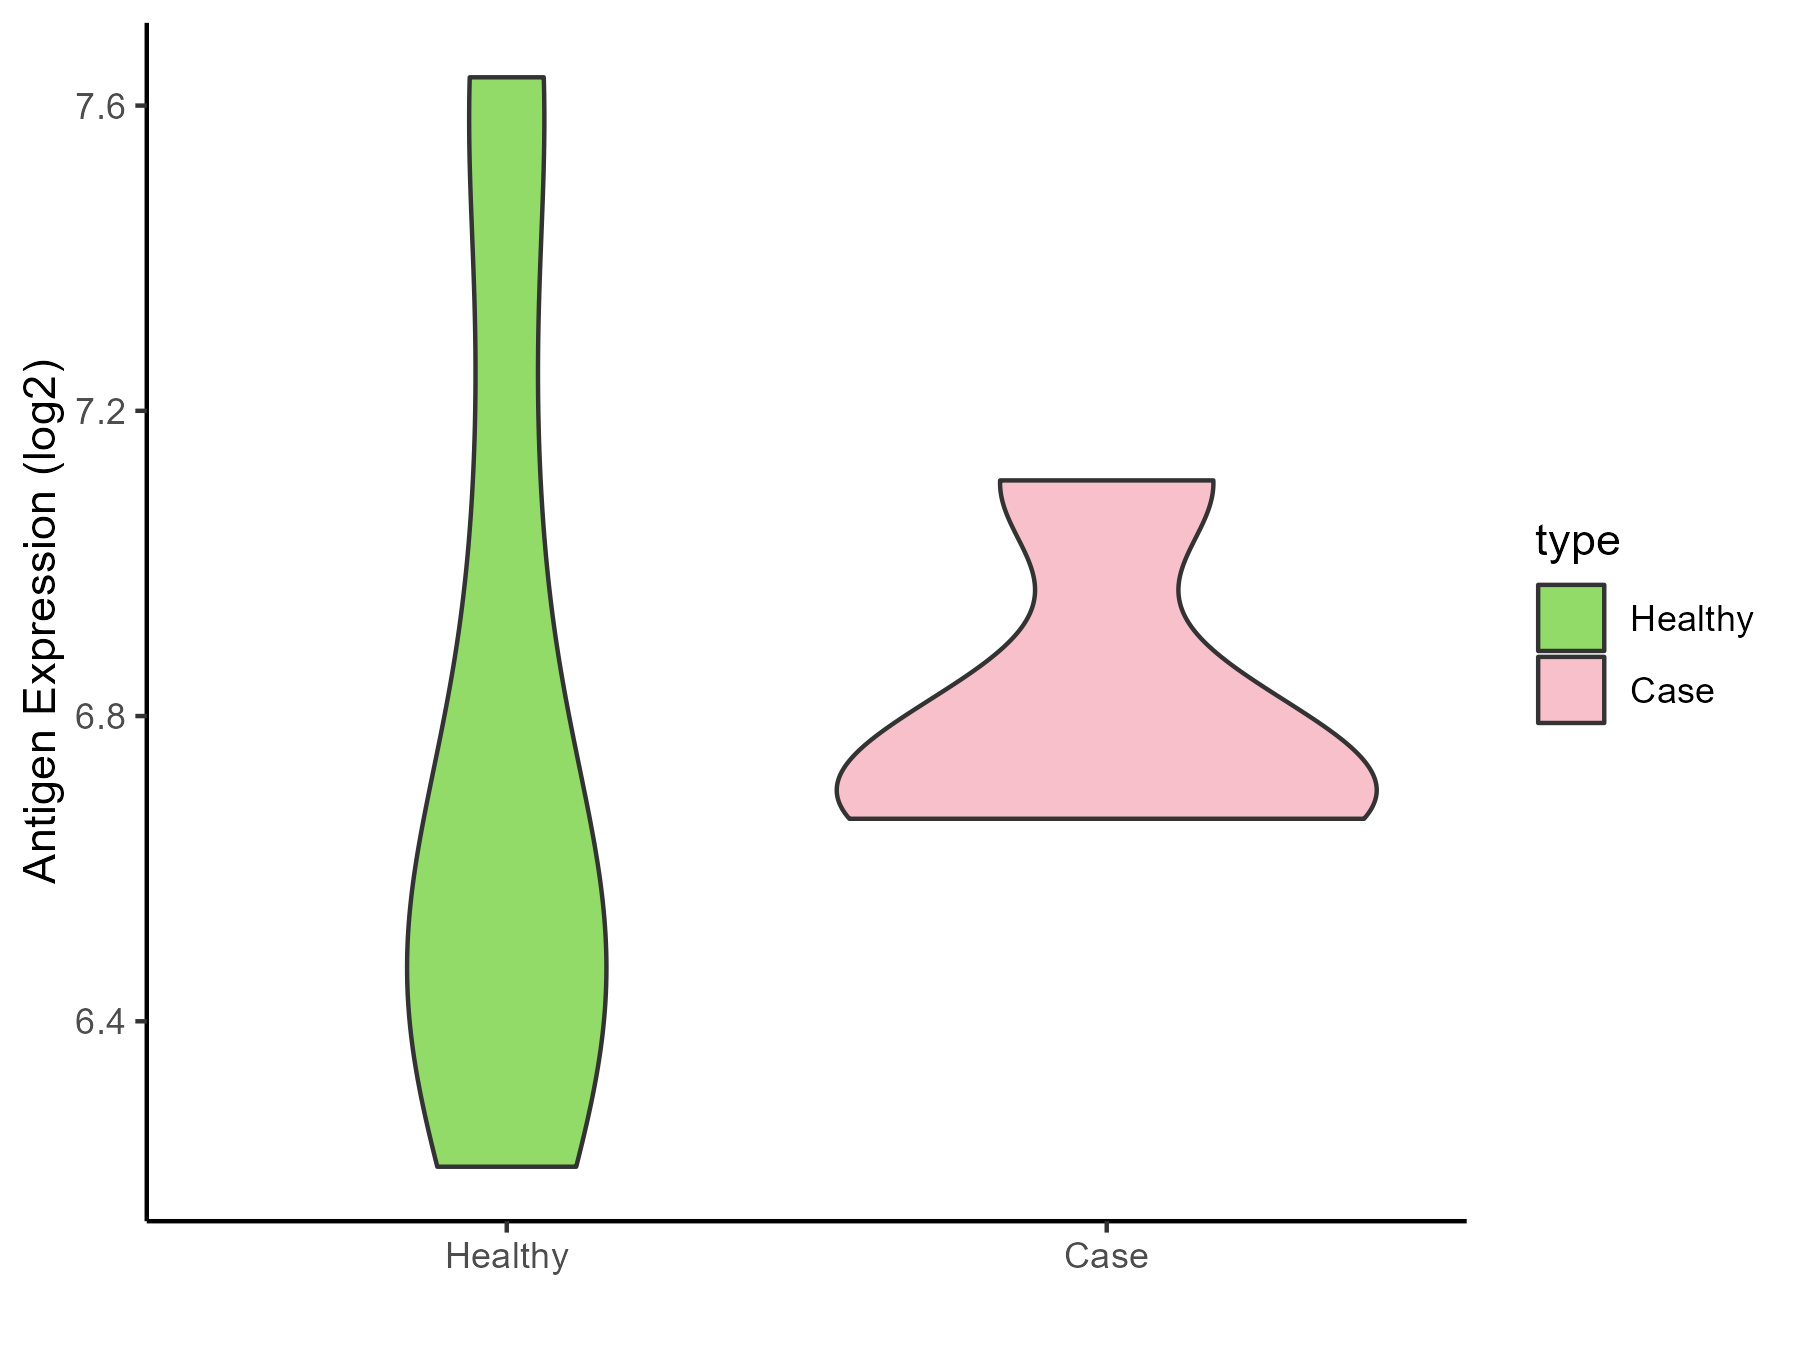
| The Studied Tissue | Peripheral monocyte | |
| The Specific Disease | Autoimmune uveitis | |
| The Expression Level of Disease Section Compare with the Healthy Individual Tissue | p-value: 0.82378219; Fold-change: 0.183549321; Z-score: 0.357852439 | |
| Disease-specific Antigen Abundances |
|
Click to View the Clearer Original Diagram |
ICD Disease Classification 05
| Differential expression pattern of antigen in diseases | ||
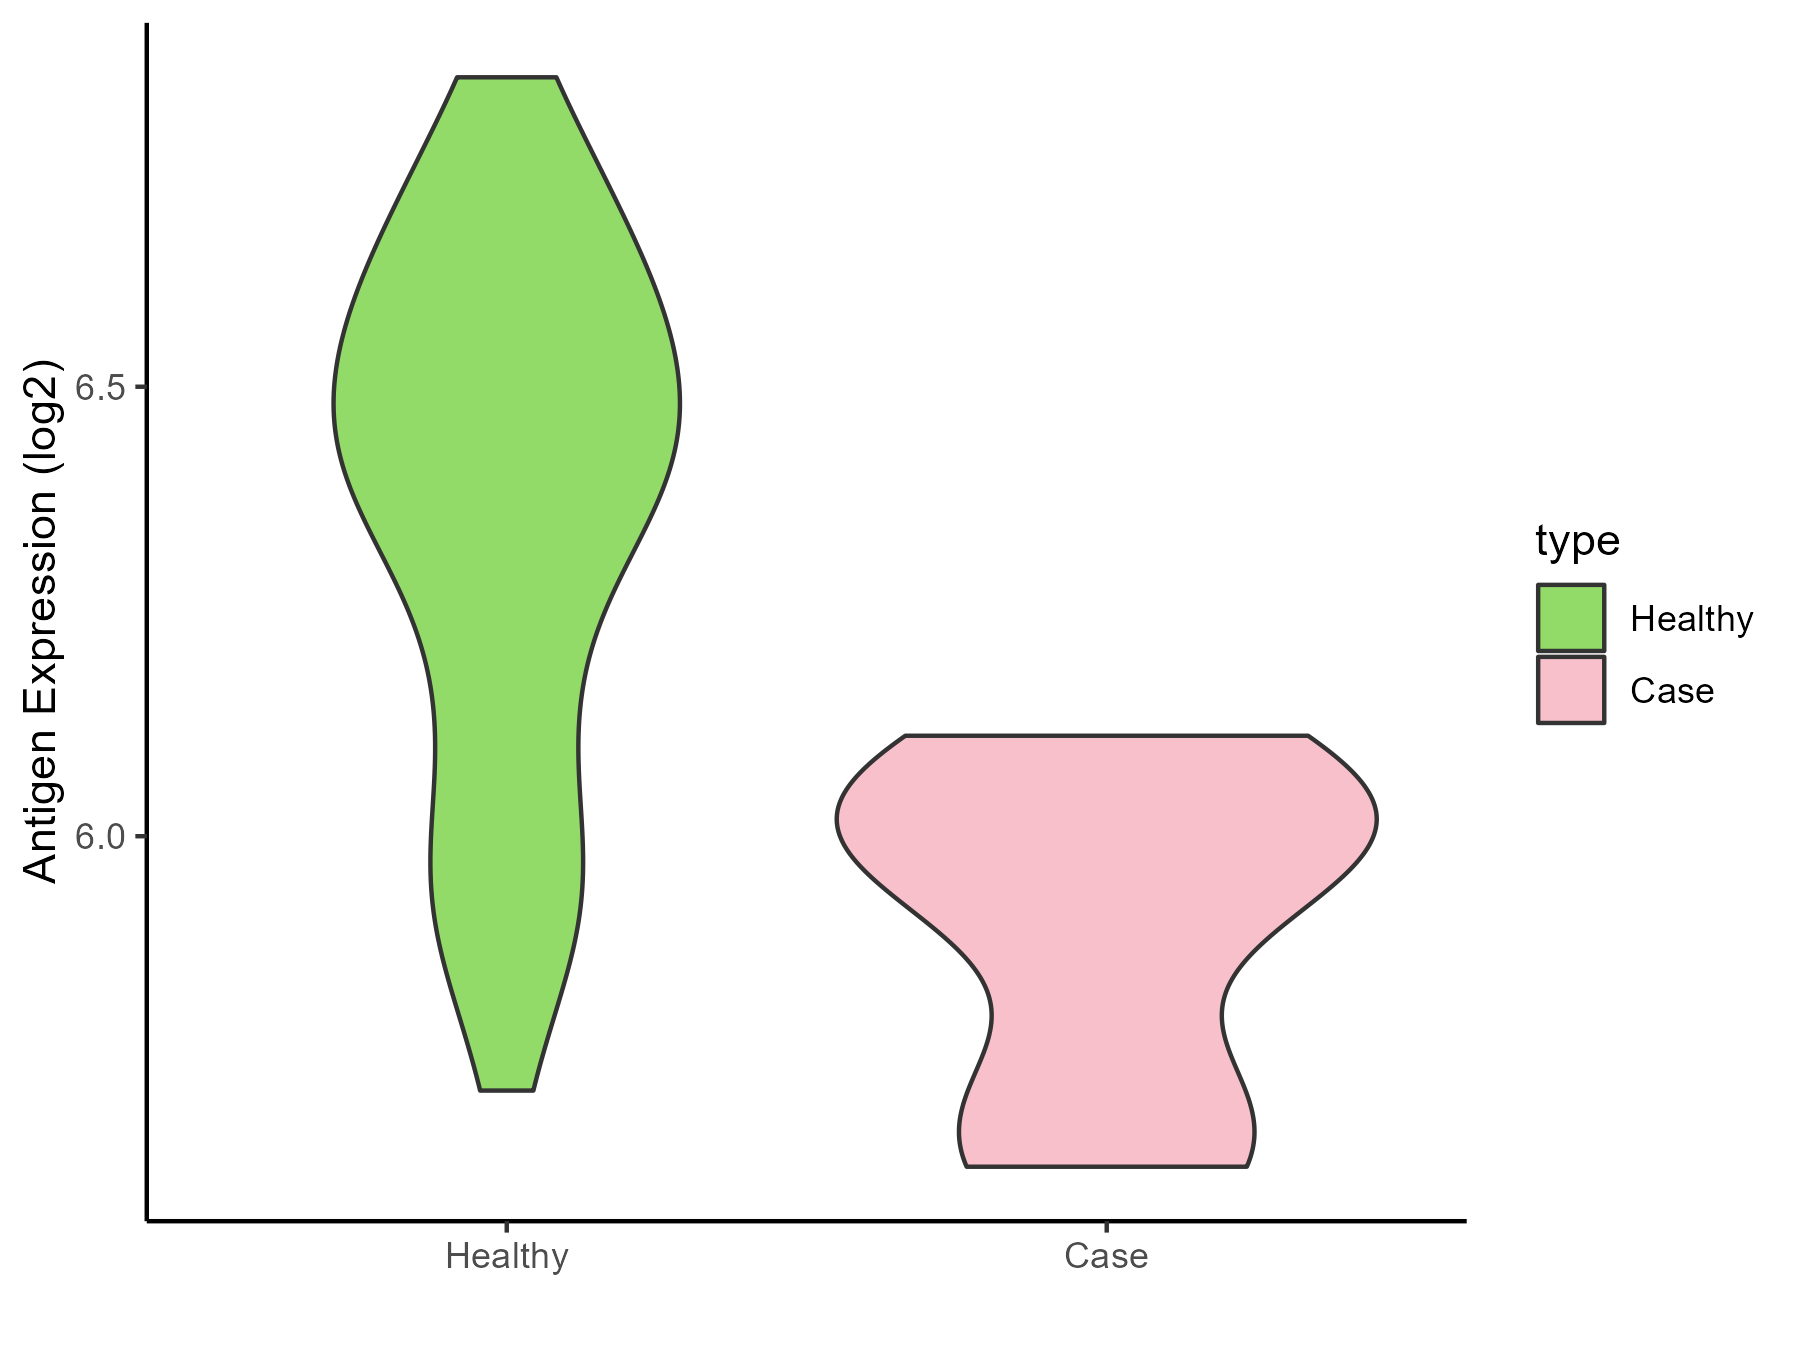
| The Studied Tissue | Whole blood | |
| The Specific Disease | Familial hypercholesterolemia | |
| The Expression Level of Disease Section Compare with the Healthy Individual Tissue | p-value: 1.17E-05; Fold-change: -0.42590562; Z-score: -1.478299674 | |
| Disease-specific Antigen Abundances |
|
Click to View the Clearer Original Diagram |
ICD Disease Classification 06
| Differential expression pattern of antigen in diseases | ||
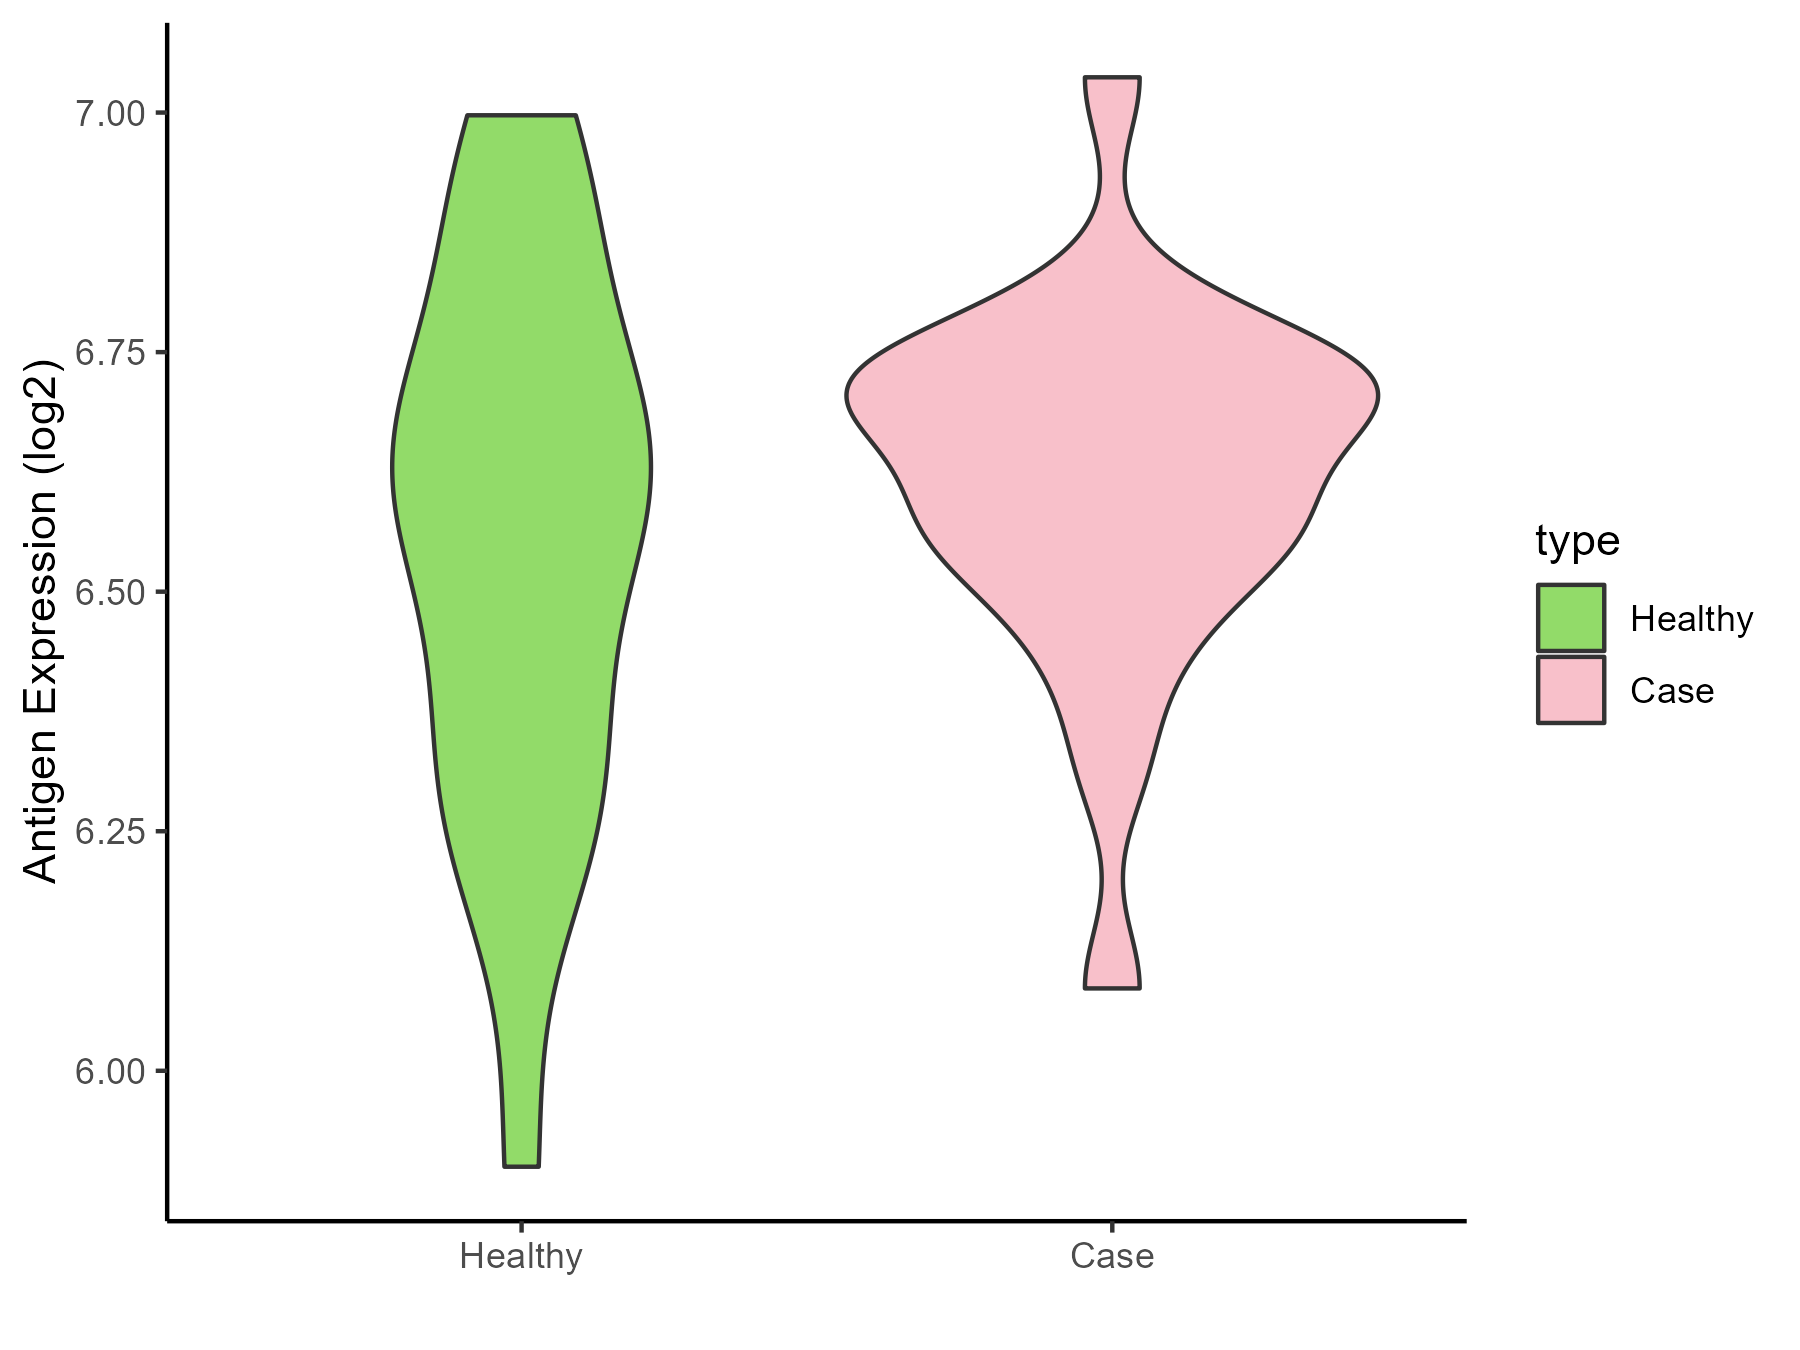
| The Studied Tissue | Superior temporal cortex | |
| The Specific Disease | Schizophrenia | |
| The Expression Level of Disease Section Compare with the Healthy Individual Tissue | p-value: 0.42820511; Fold-change: 0.062376261; Z-score: 0.219272386 | |
| Disease-specific Antigen Abundances |
|
Click to View the Clearer Original Diagram |
ICD Disease Classification 08
| Differential expression pattern of antigen in diseases | ||
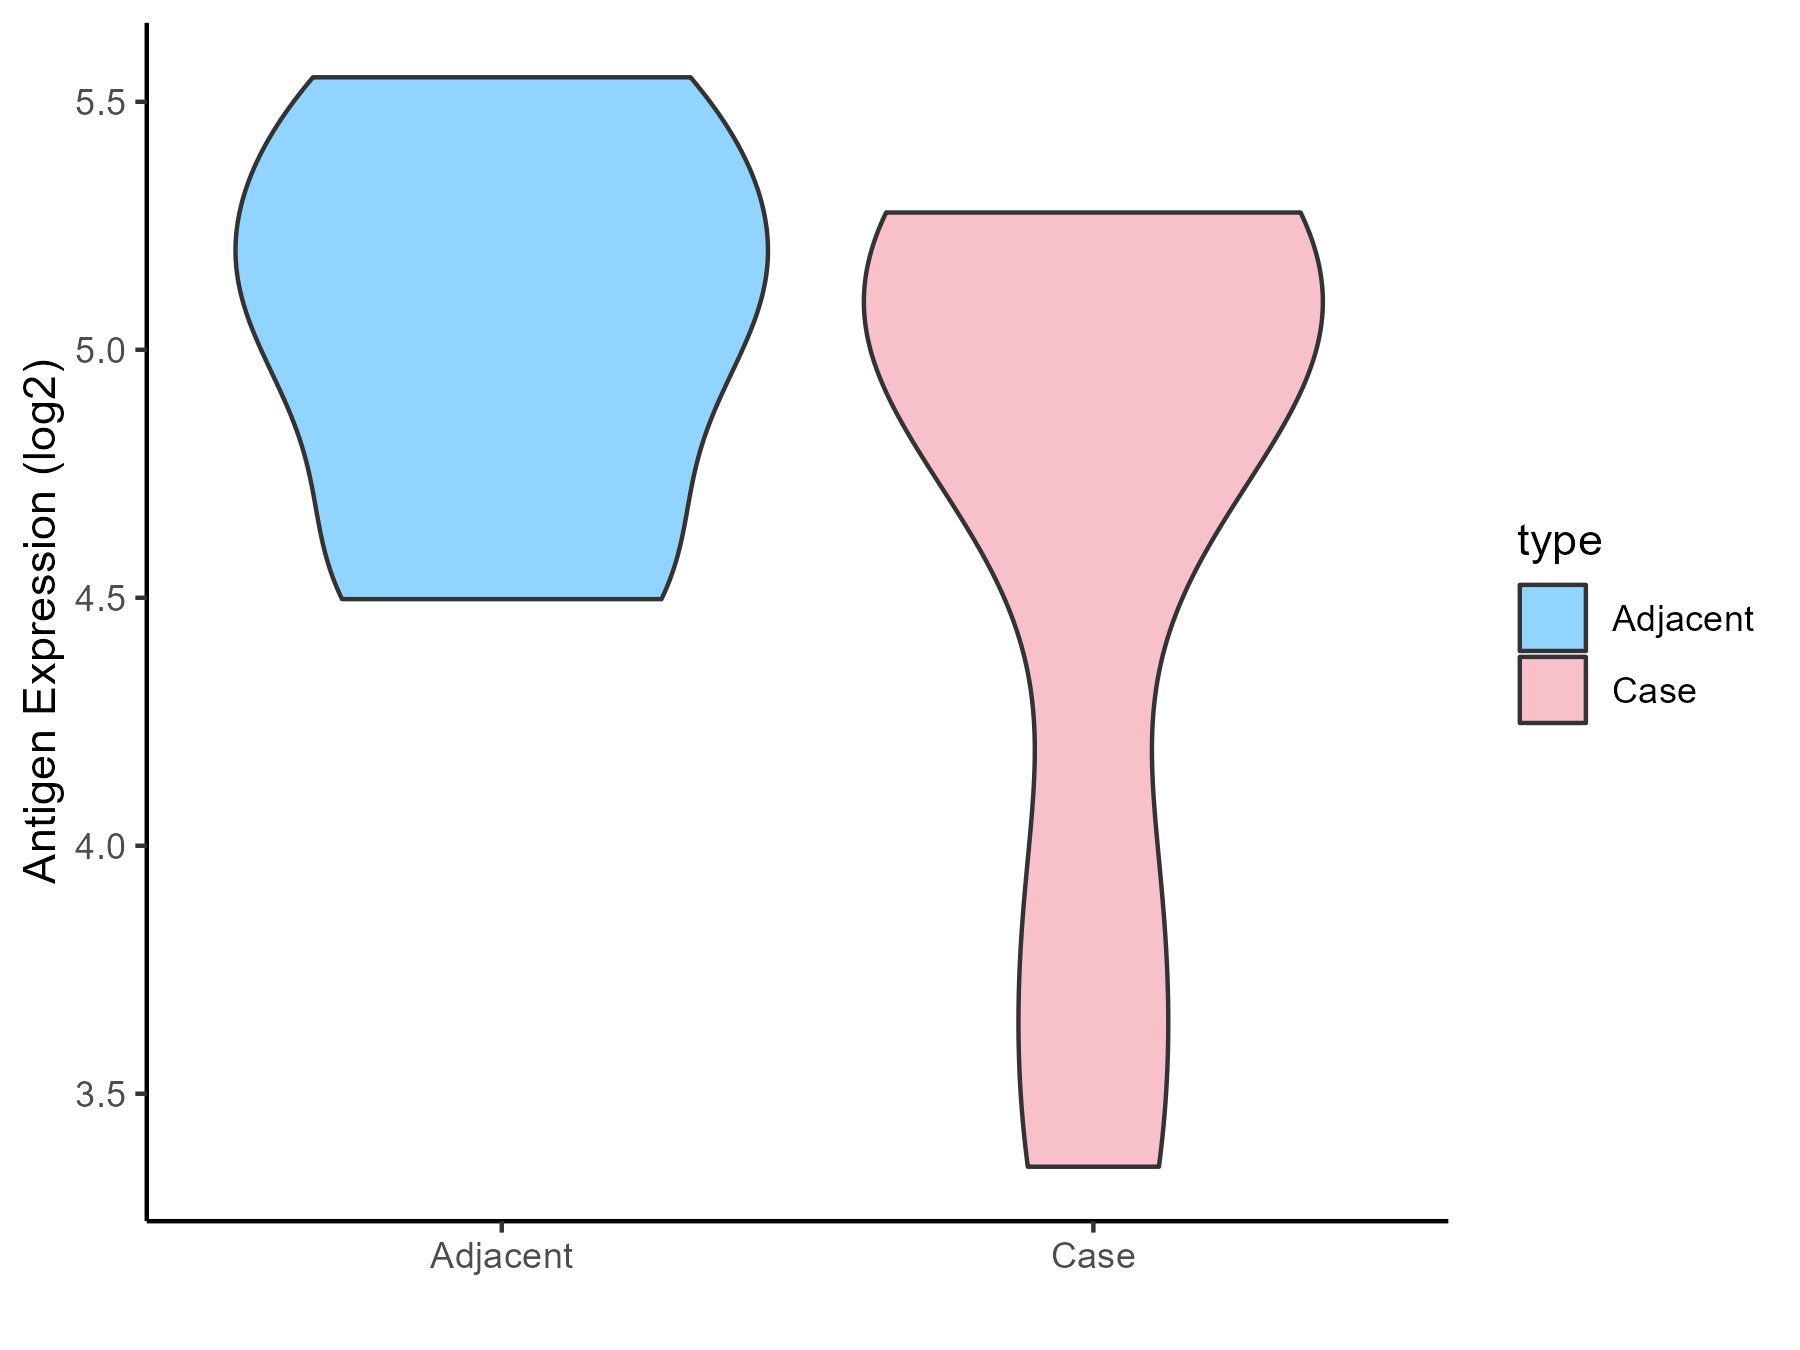
| The Studied Tissue | Spinal cord | |
| The Specific Disease | Multiple sclerosis | |
| The Expression Level of Disease Section Compare with the Adjacent Tissue | p-value: 0.265753229; Fold-change: -0.086548337; Z-score: -0.215584352 | |
| Disease-specific Antigen Abundances |
|
Click to View the Clearer Original Diagram |
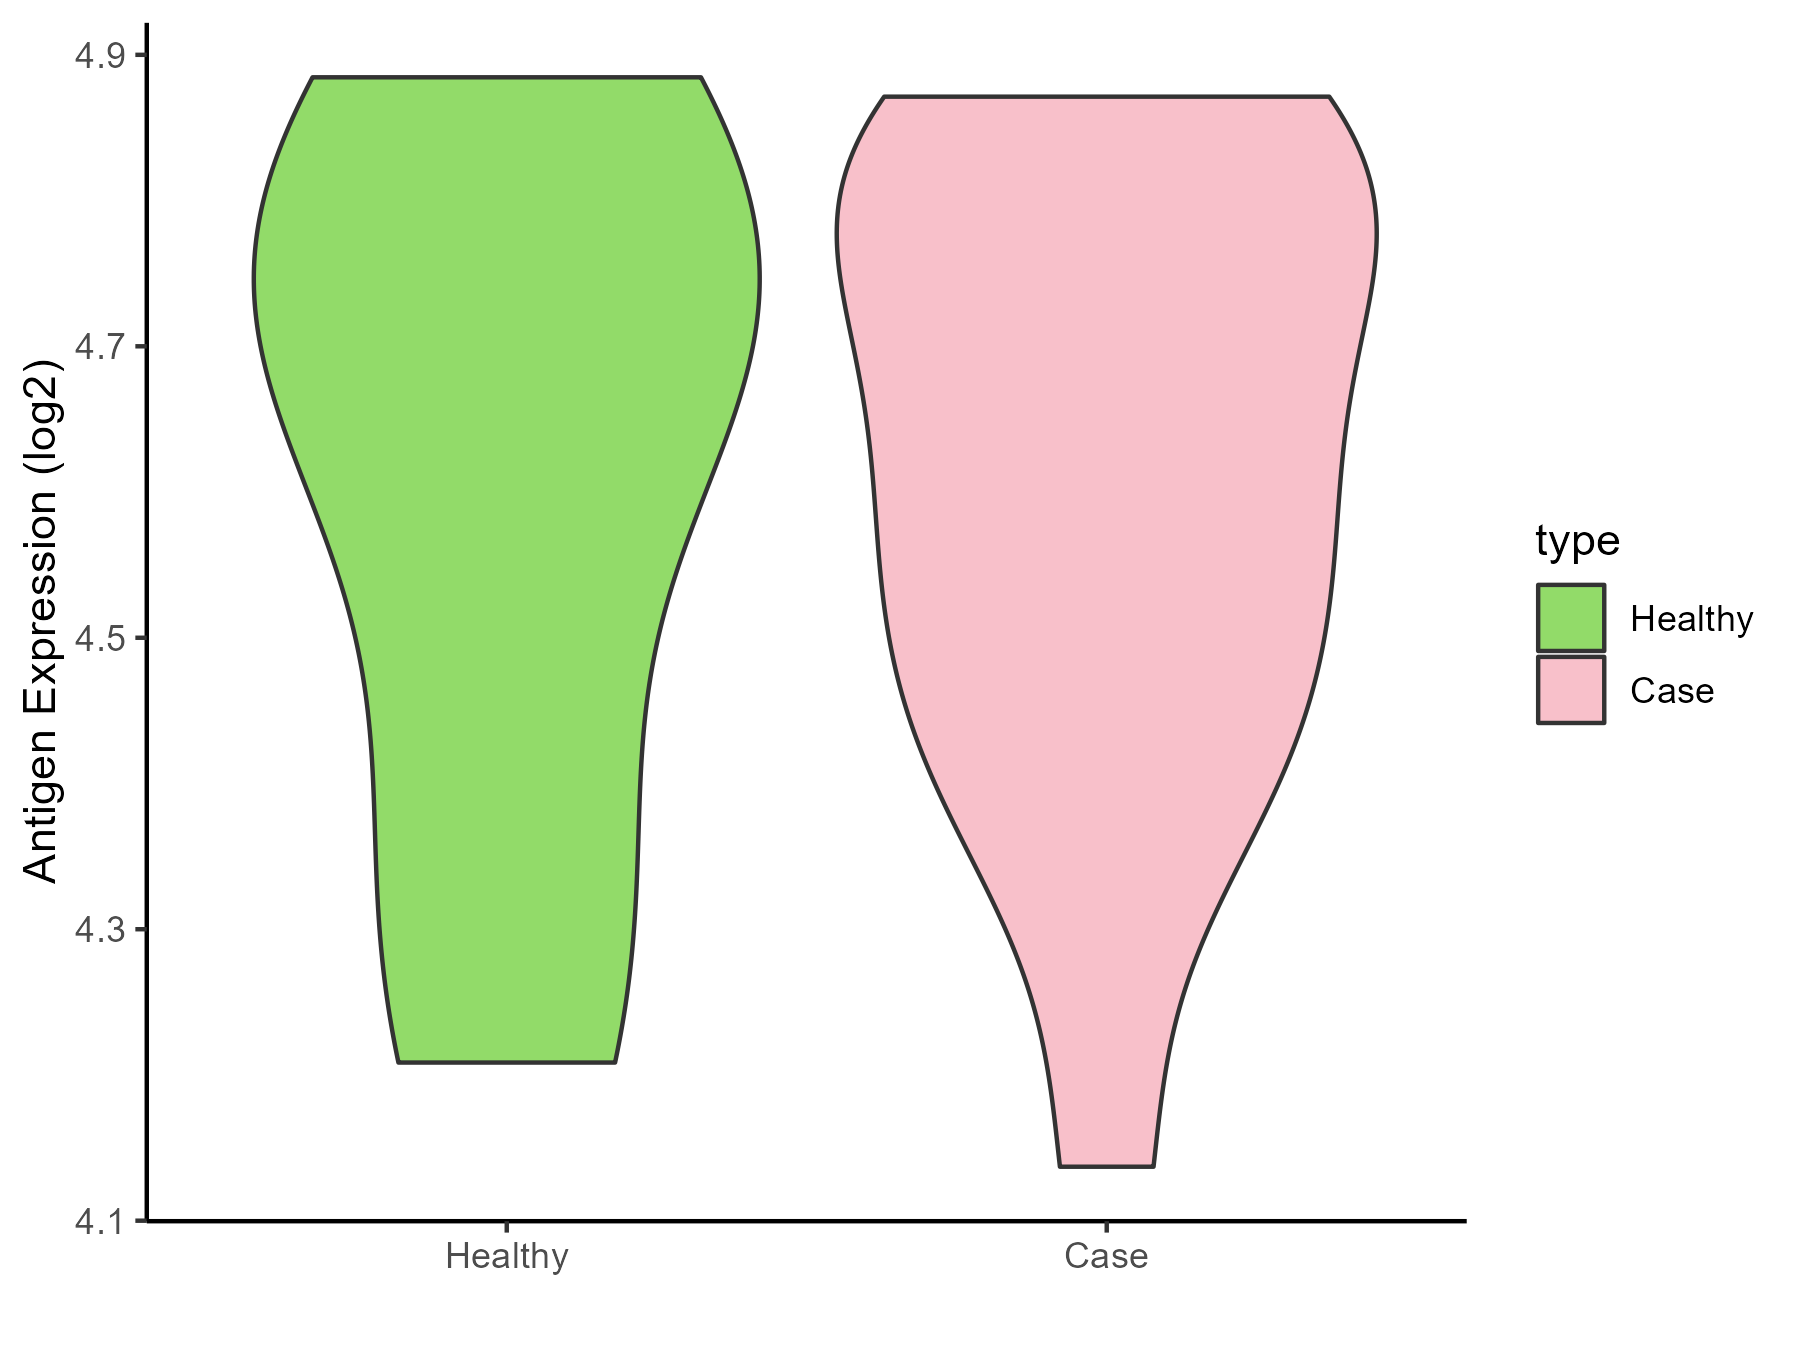
| The Studied Tissue | Plasmacytoid dendritic cells | |
| The Specific Disease | Multiple sclerosis | |
| The Expression Level of Disease Section Compare with the Healthy Individual Tissue | p-value: 0.944551821; Fold-change: -0.051315461; Z-score: -0.199581418 | |
| Disease-specific Antigen Abundances |
|
Click to View the Clearer Original Diagram |
| Differential expression pattern of antigen in diseases | ||
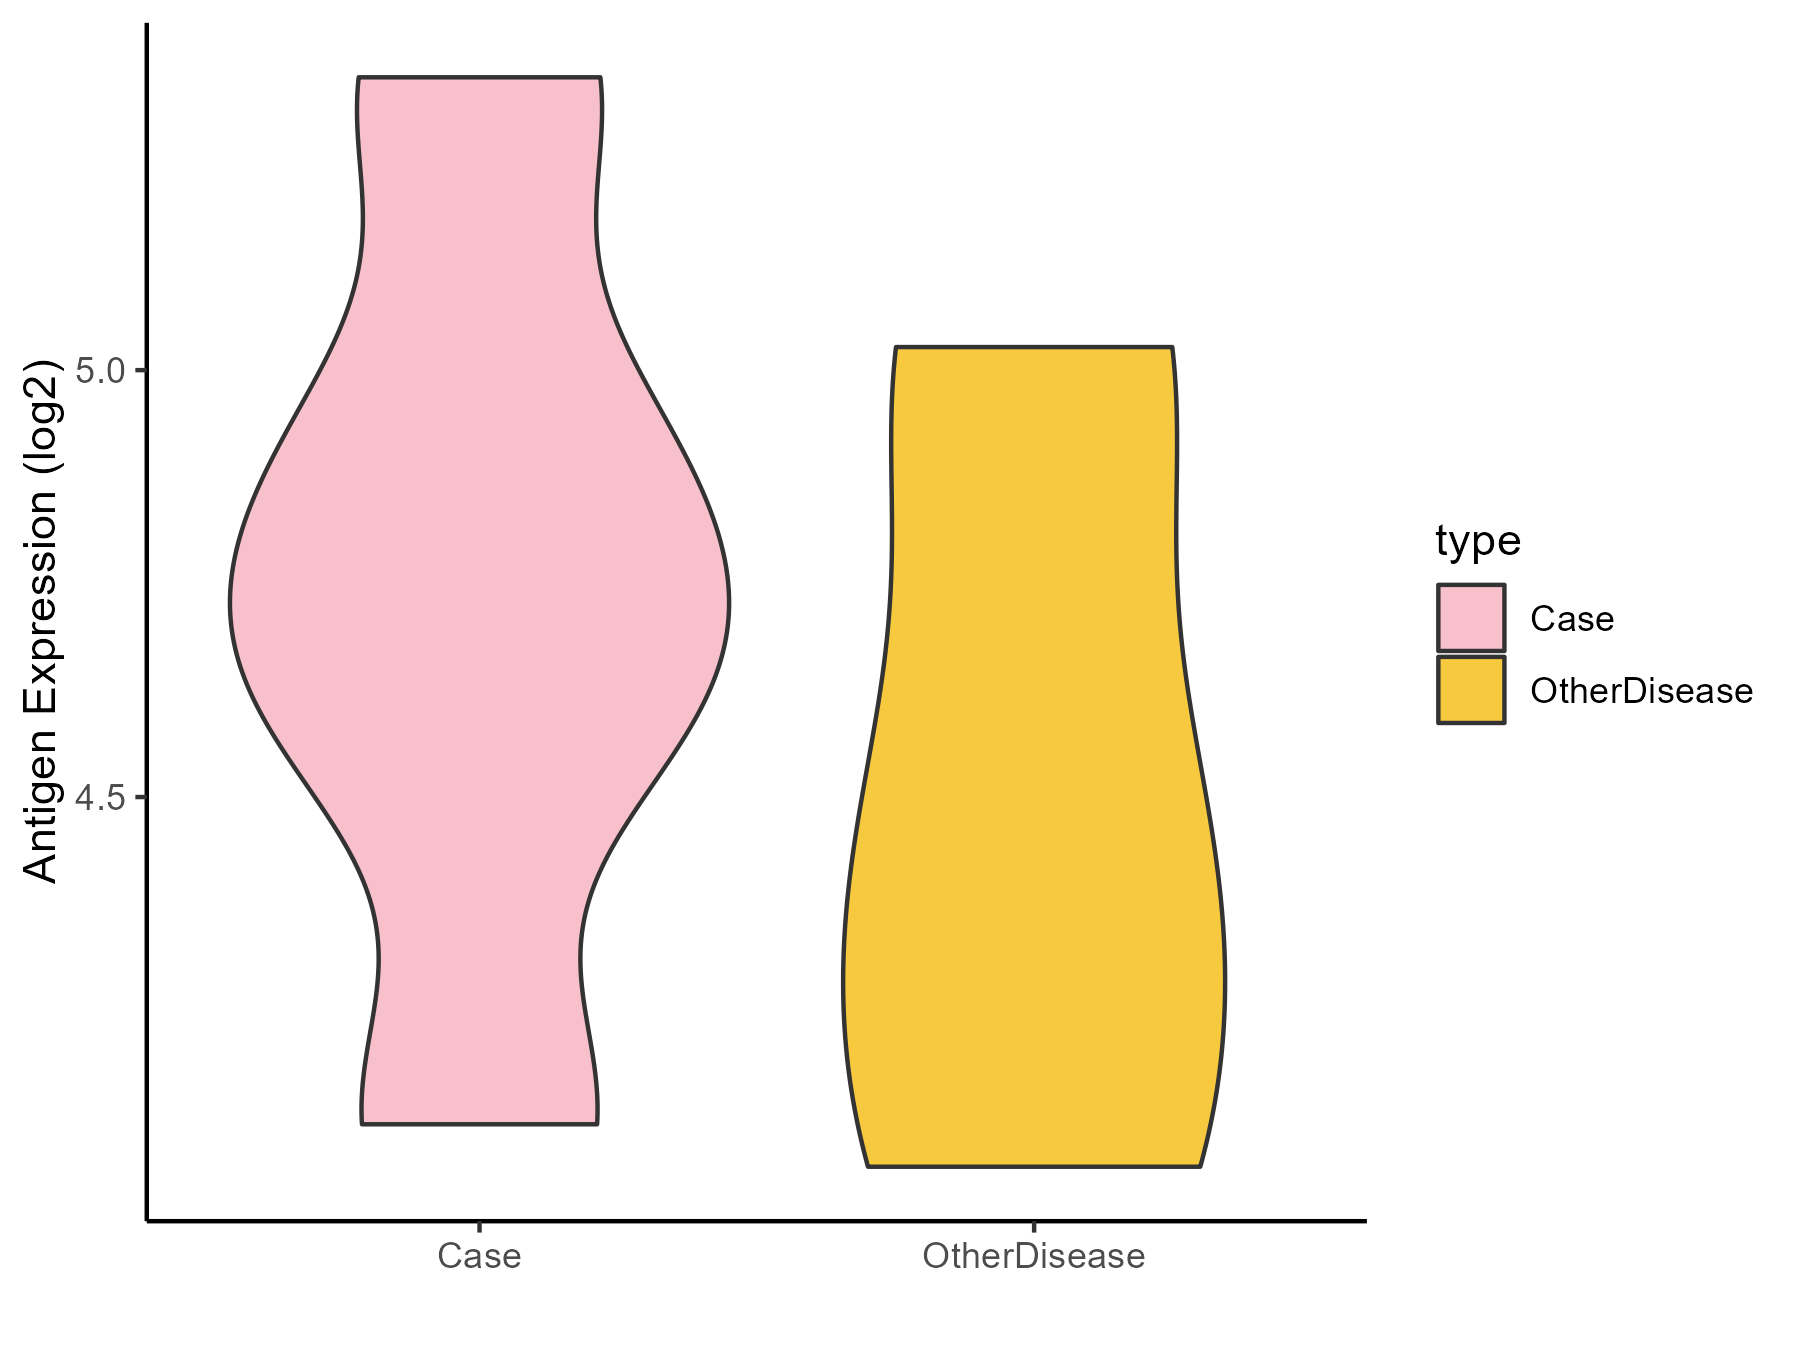
| The Studied Tissue | Peritumoral cortex | |
| The Specific Disease | Epilepsy | |
| The Expression Level of Disease Section Compare with the Other Disease Section | p-value: 0.555163492; Fold-change: 0.267571194; Z-score: 0.554519227 | |
| Disease-specific Antigen Abundances |
|
Click to View the Clearer Original Diagram |
| Differential expression pattern of antigen in diseases | ||
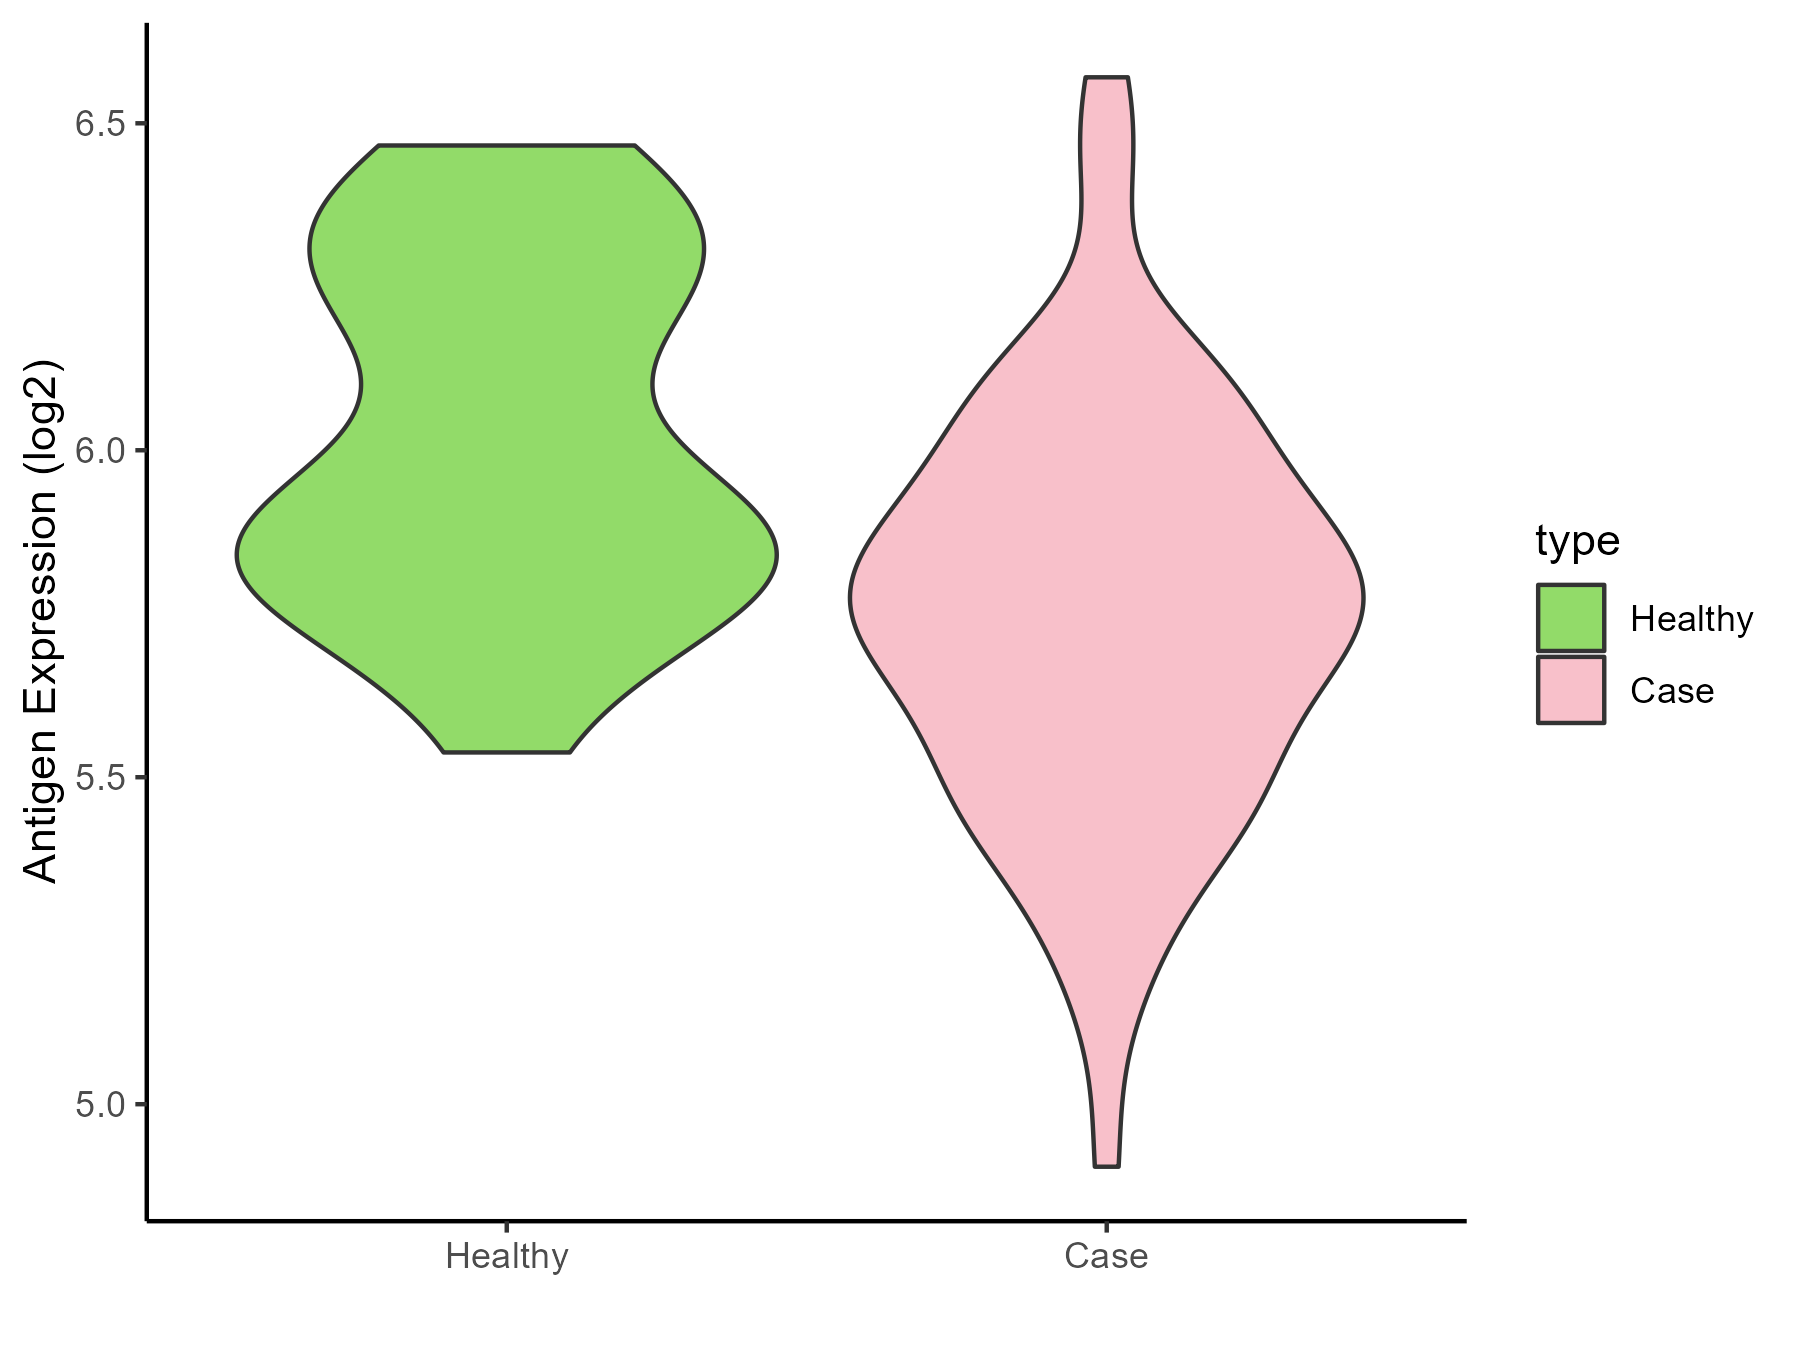
| The Studied Tissue | Whole blood | |
| The Specific Disease | Cardioembolic Stroke | |
| The Expression Level of Disease Section Compare with the Healthy Individual Tissue | p-value: 0.000398307; Fold-change: -0.156819914; Z-score: -0.575537227 | |
| Disease-specific Antigen Abundances |
|
Click to View the Clearer Original Diagram |
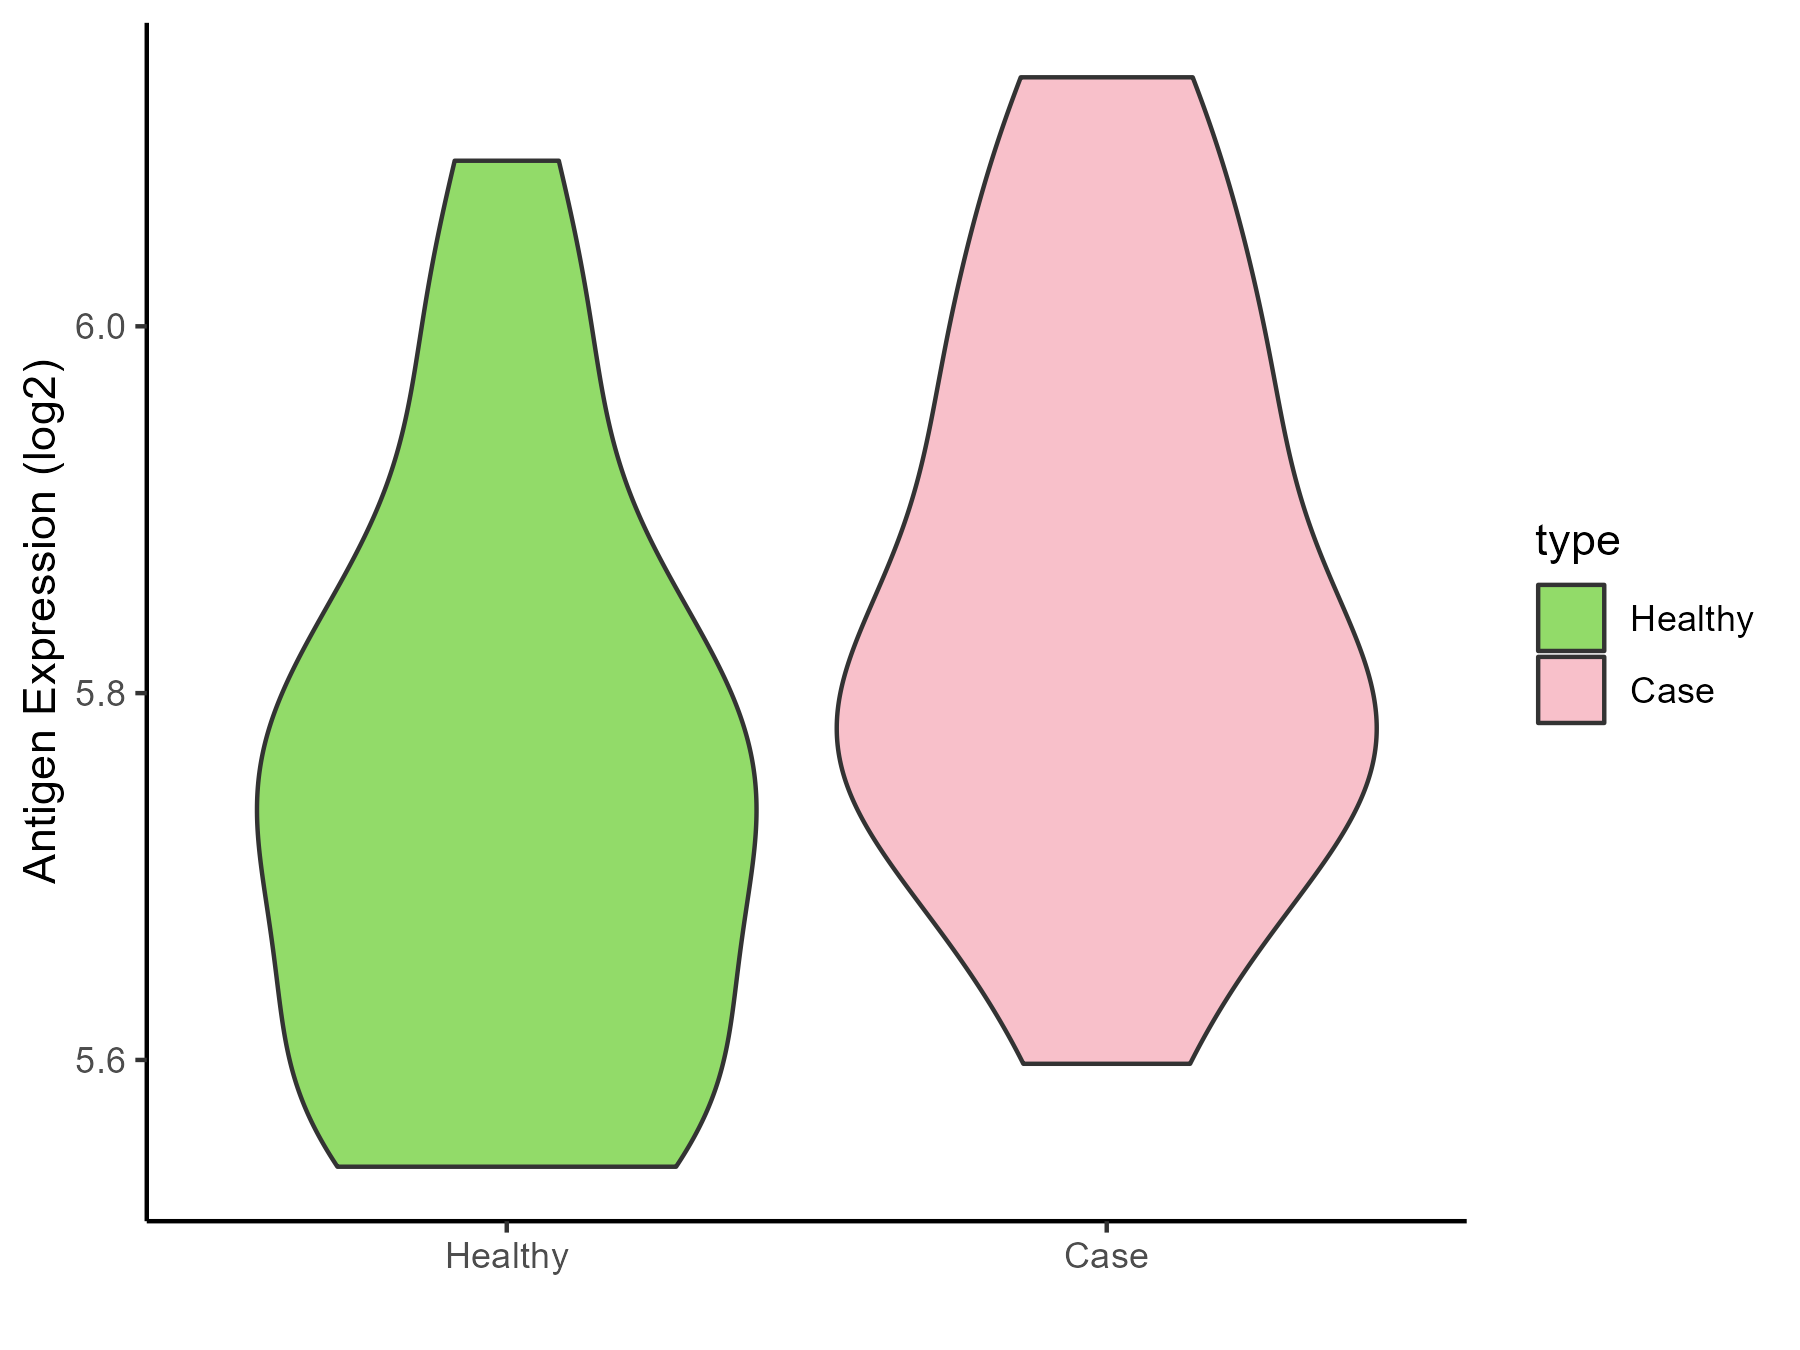
| The Studied Tissue | Peripheral blood | |
| The Specific Disease | Ischemic stroke | |
| The Expression Level of Disease Section Compare with the Healthy Individual Tissue | p-value: 0.035366442; Fold-change: 0.087015424; Z-score: 0.557900877 | |
| Disease-specific Antigen Abundances |
|
Click to View the Clearer Original Diagram |
ICD Disease Classification 1
| Differential expression pattern of antigen in diseases | ||
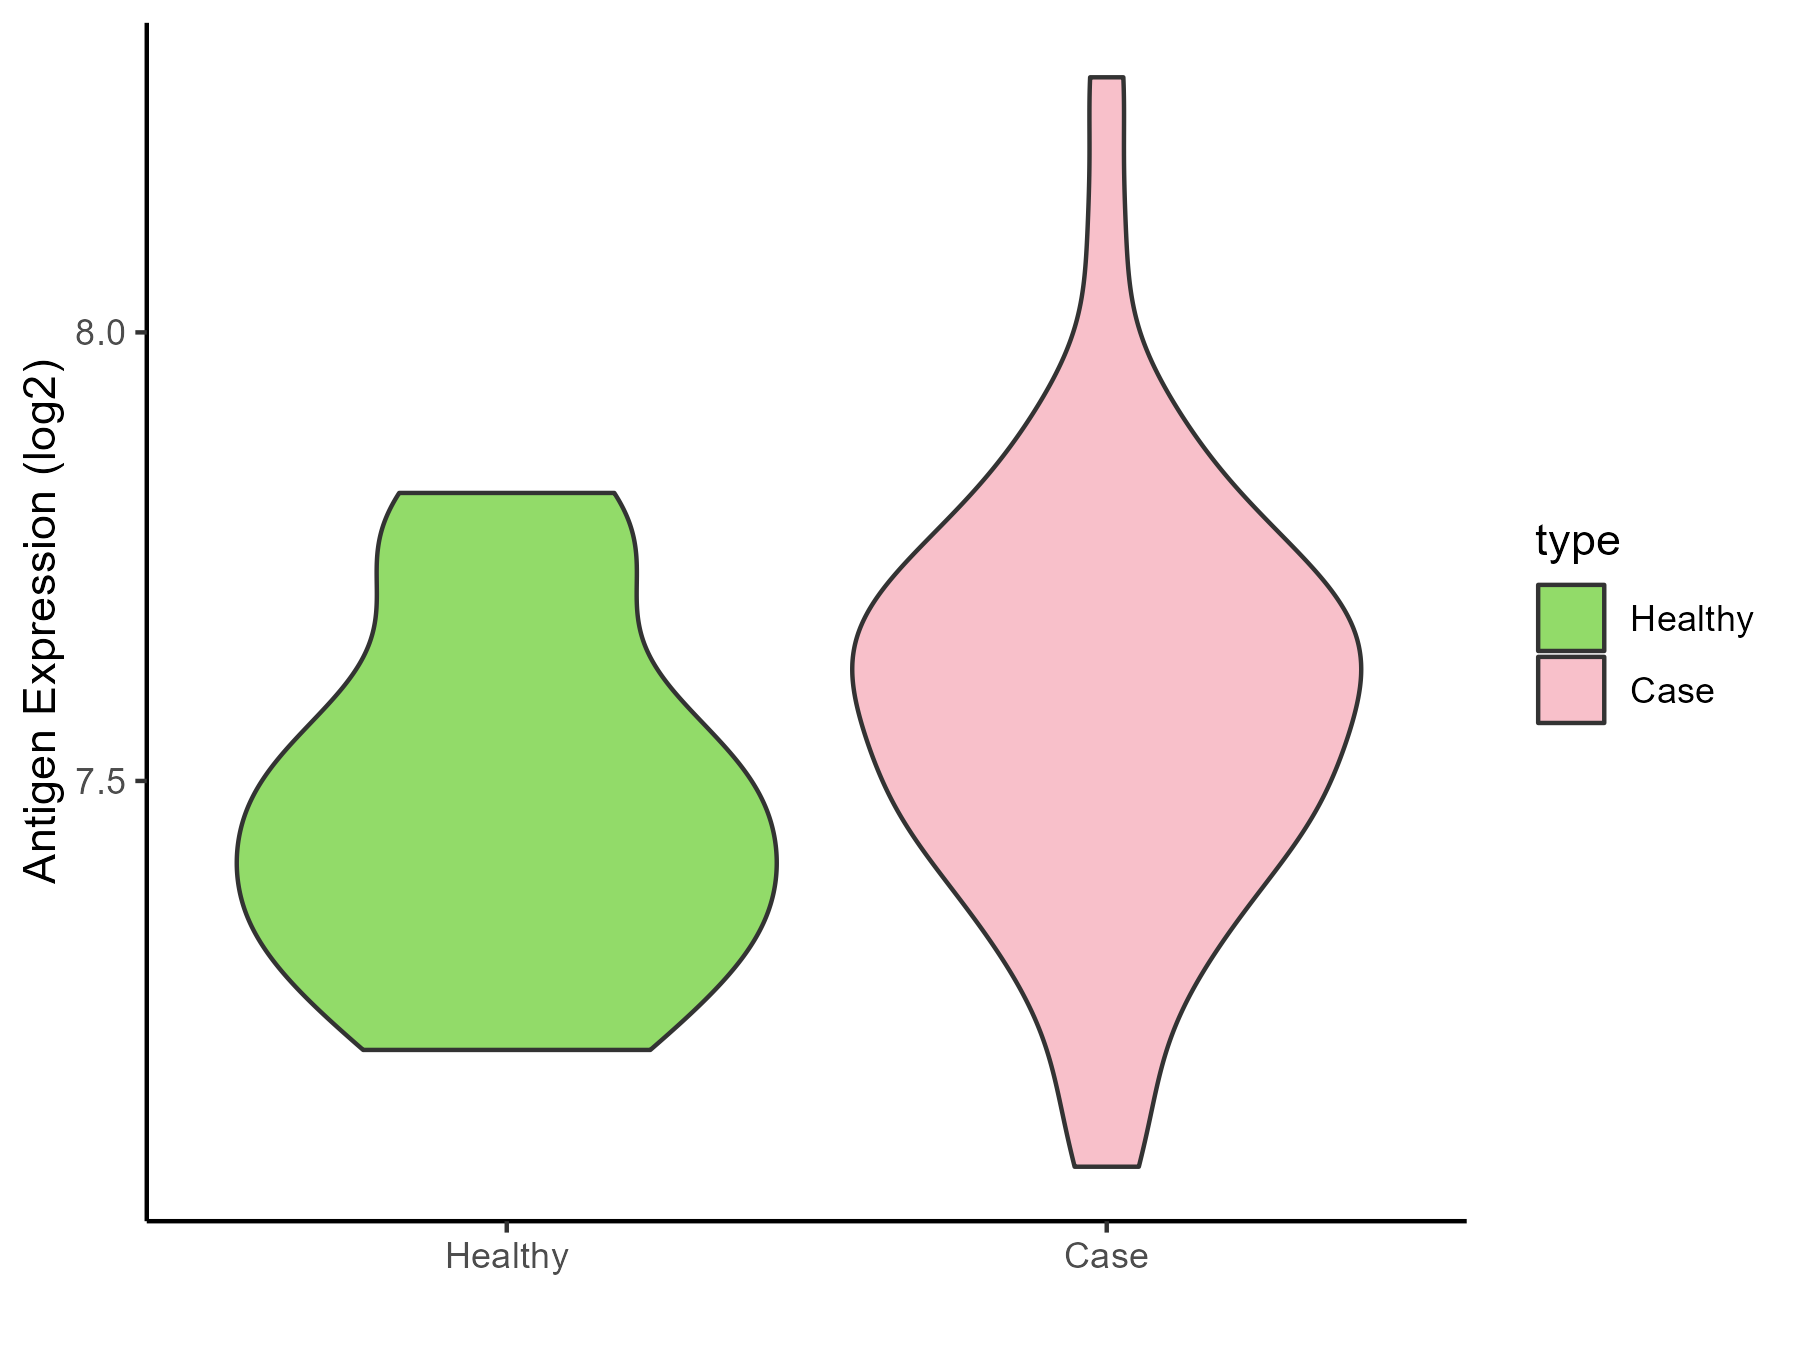
| The Studied Tissue | White matter | |
| The Specific Disease | HIV | |
| The Expression Level of Disease Section Compare with the Healthy Individual Tissue | p-value: 0.063524839; Fold-change: 0.125740166; Z-score: 0.648975088 | |
| Disease-specific Antigen Abundances |
|
Click to View the Clearer Original Diagram |
| Differential expression pattern of antigen in diseases | ||
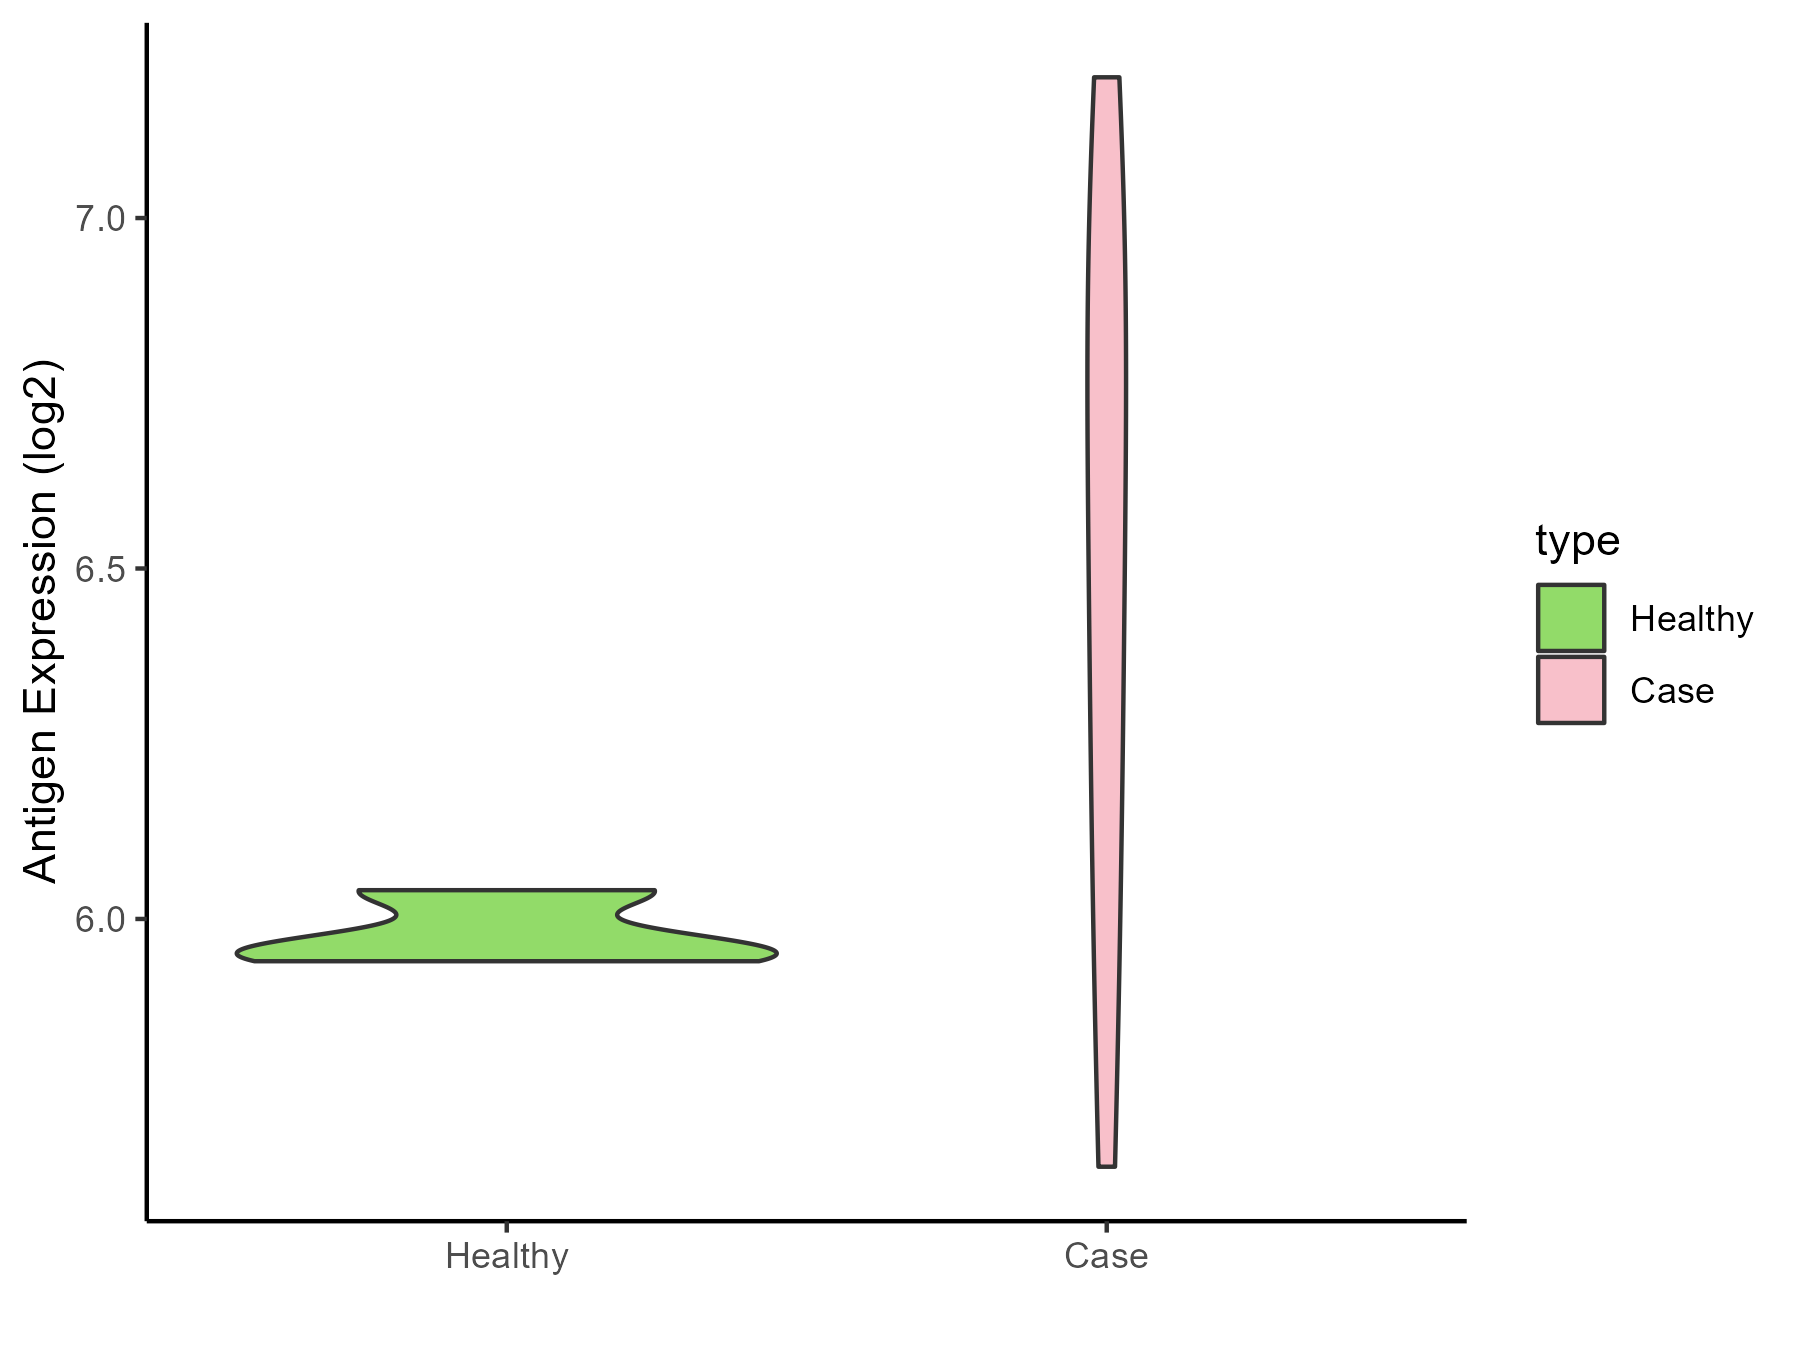
| The Studied Tissue | Whole blood | |
| The Specific Disease | Influenza | |
| The Expression Level of Disease Section Compare with the Healthy Individual Tissue | p-value: 0.015619618; Fold-change: 0.586264225; Z-score: 10.98597357 | |
| Disease-specific Antigen Abundances |
|
Click to View the Clearer Original Diagram |
| Differential expression pattern of antigen in diseases | ||
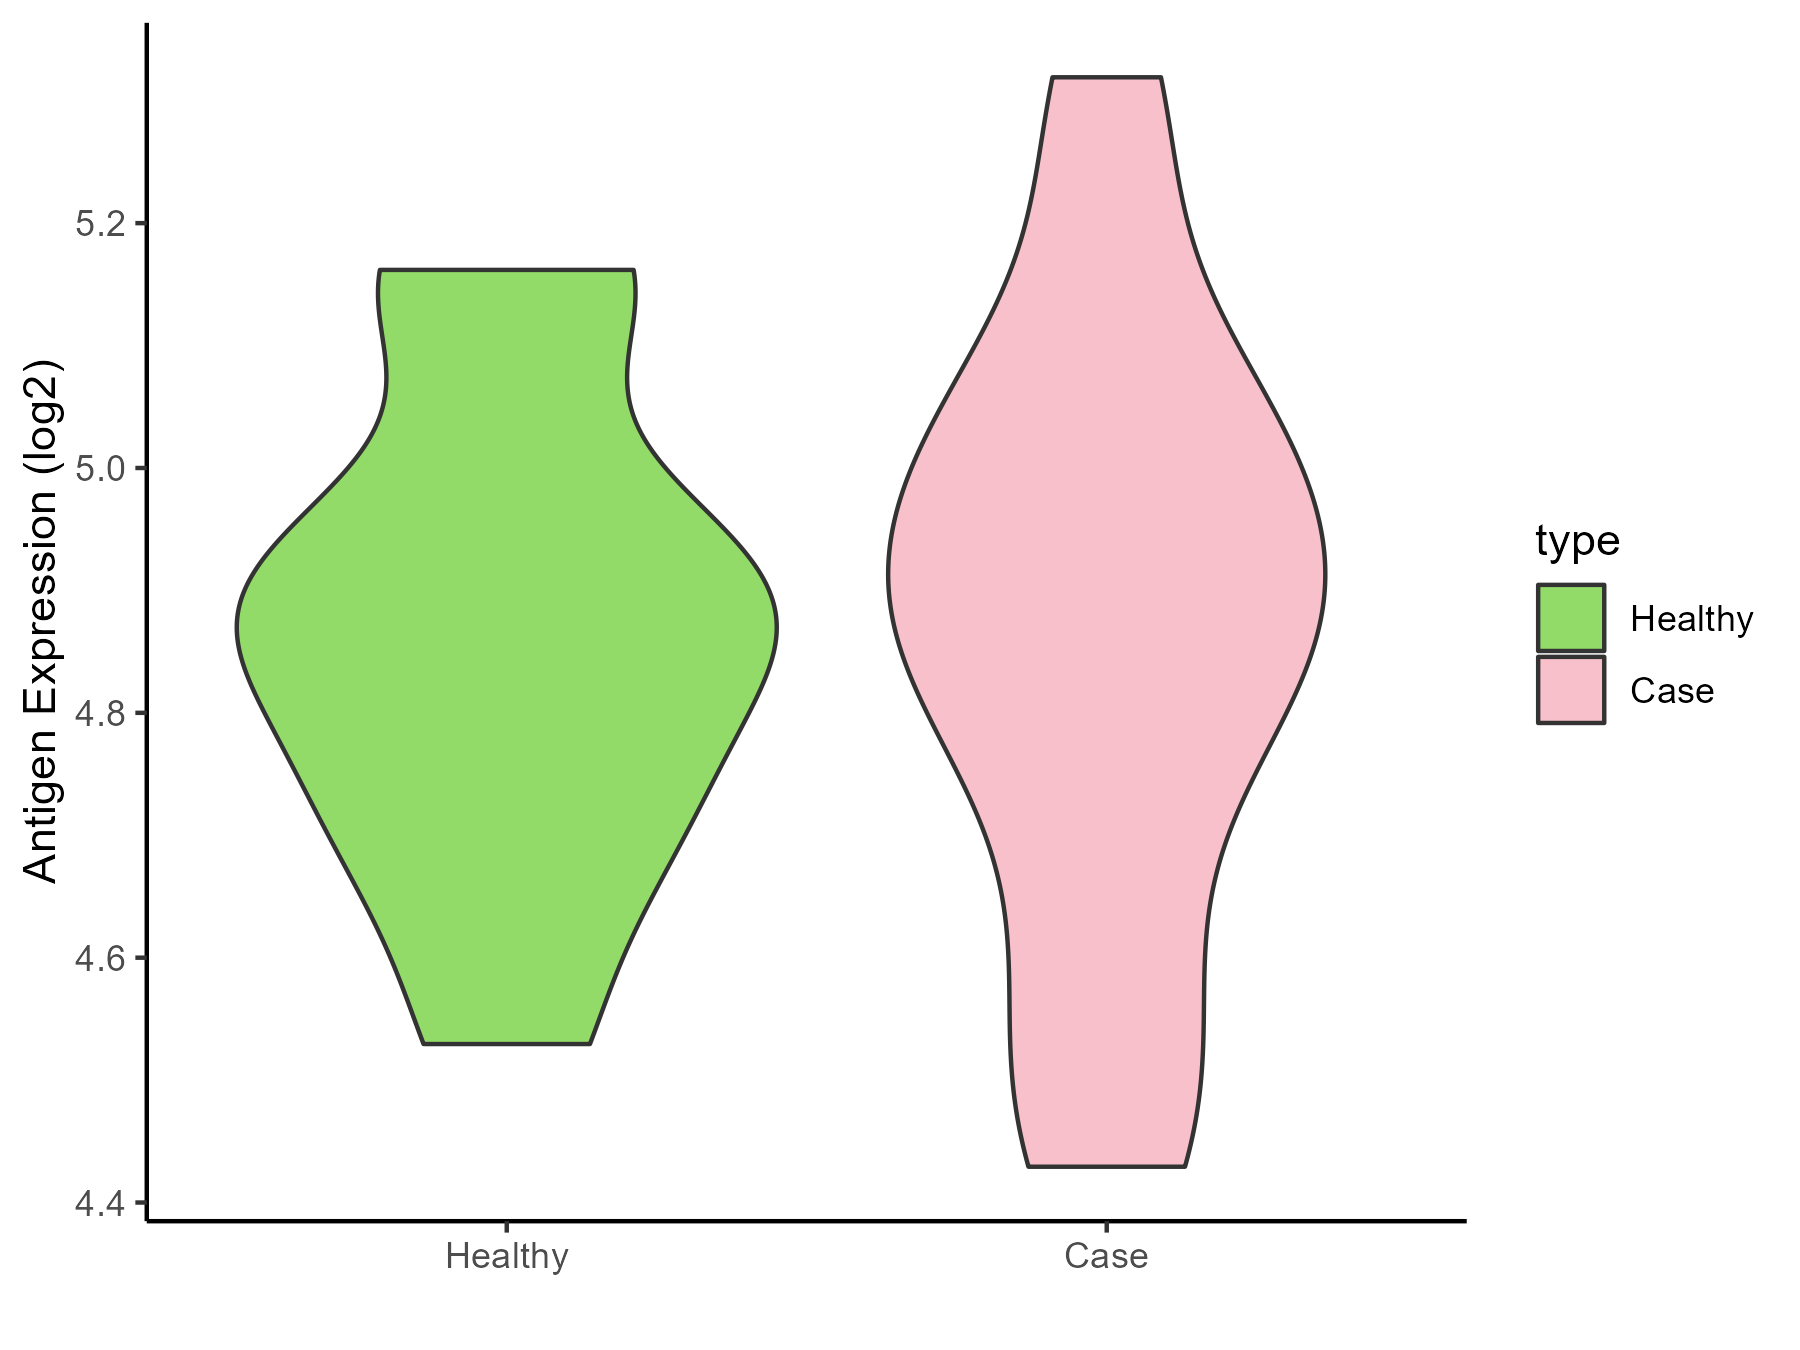
| The Studied Tissue | Whole blood | |
| The Specific Disease | Chronic hepatitis C | |
| The Expression Level of Disease Section Compare with the Healthy Individual Tissue | p-value: 0.989321524; Fold-change: 0.010788361; Z-score: 0.053838801 | |
| Disease-specific Antigen Abundances |
|
Click to View the Clearer Original Diagram |
| Differential expression pattern of antigen in diseases | ||
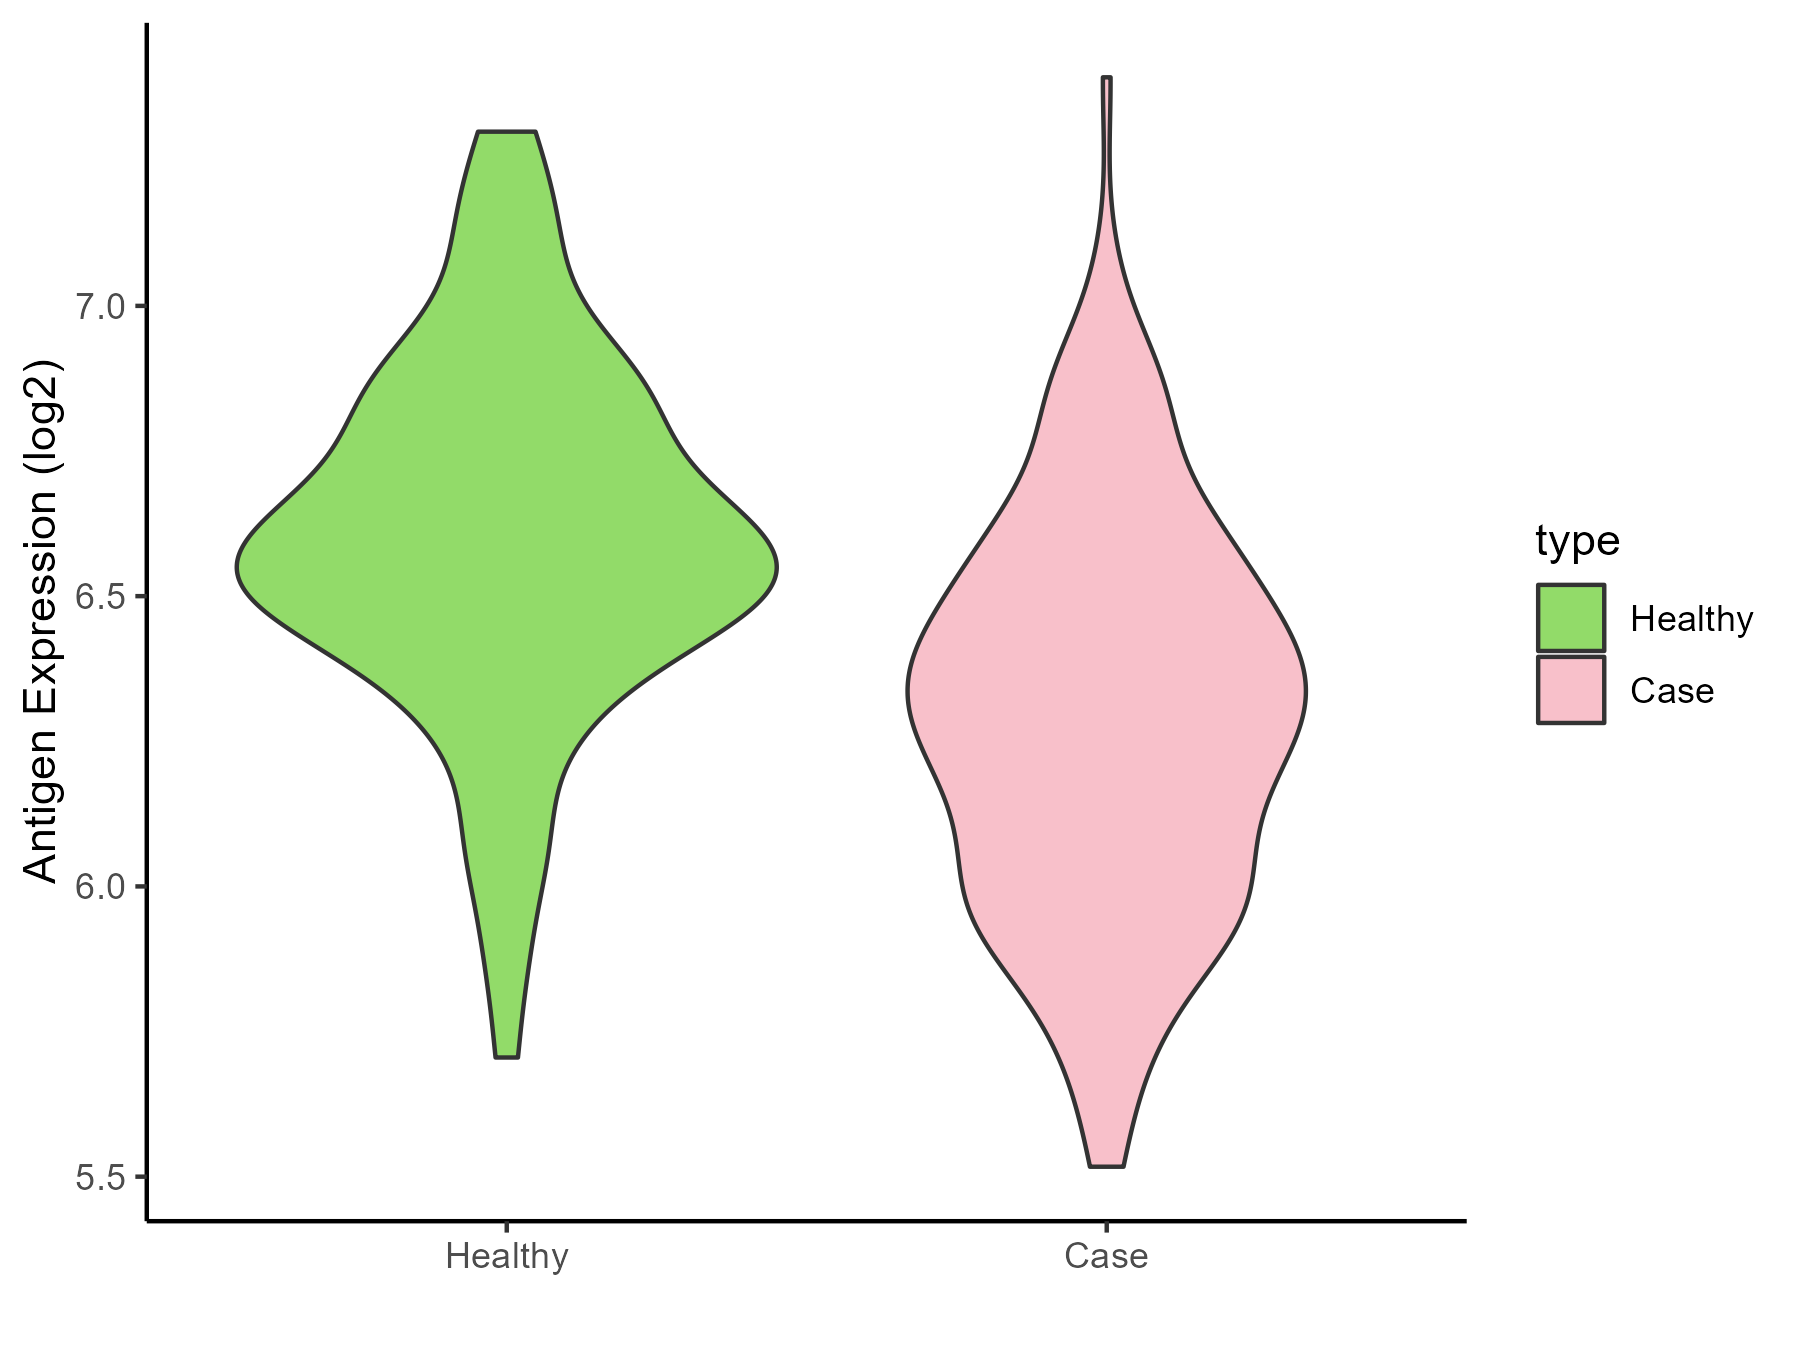
| The Studied Tissue | Whole blood | |
| The Specific Disease | Sepsis | |
| The Expression Level of Disease Section Compare with the Healthy Individual Tissue | p-value: 7.76E-12; Fold-change: -0.264934479; Z-score: -0.859058794 | |
| Disease-specific Antigen Abundances |
|
Click to View the Clearer Original Diagram |
| Differential expression pattern of antigen in diseases | ||
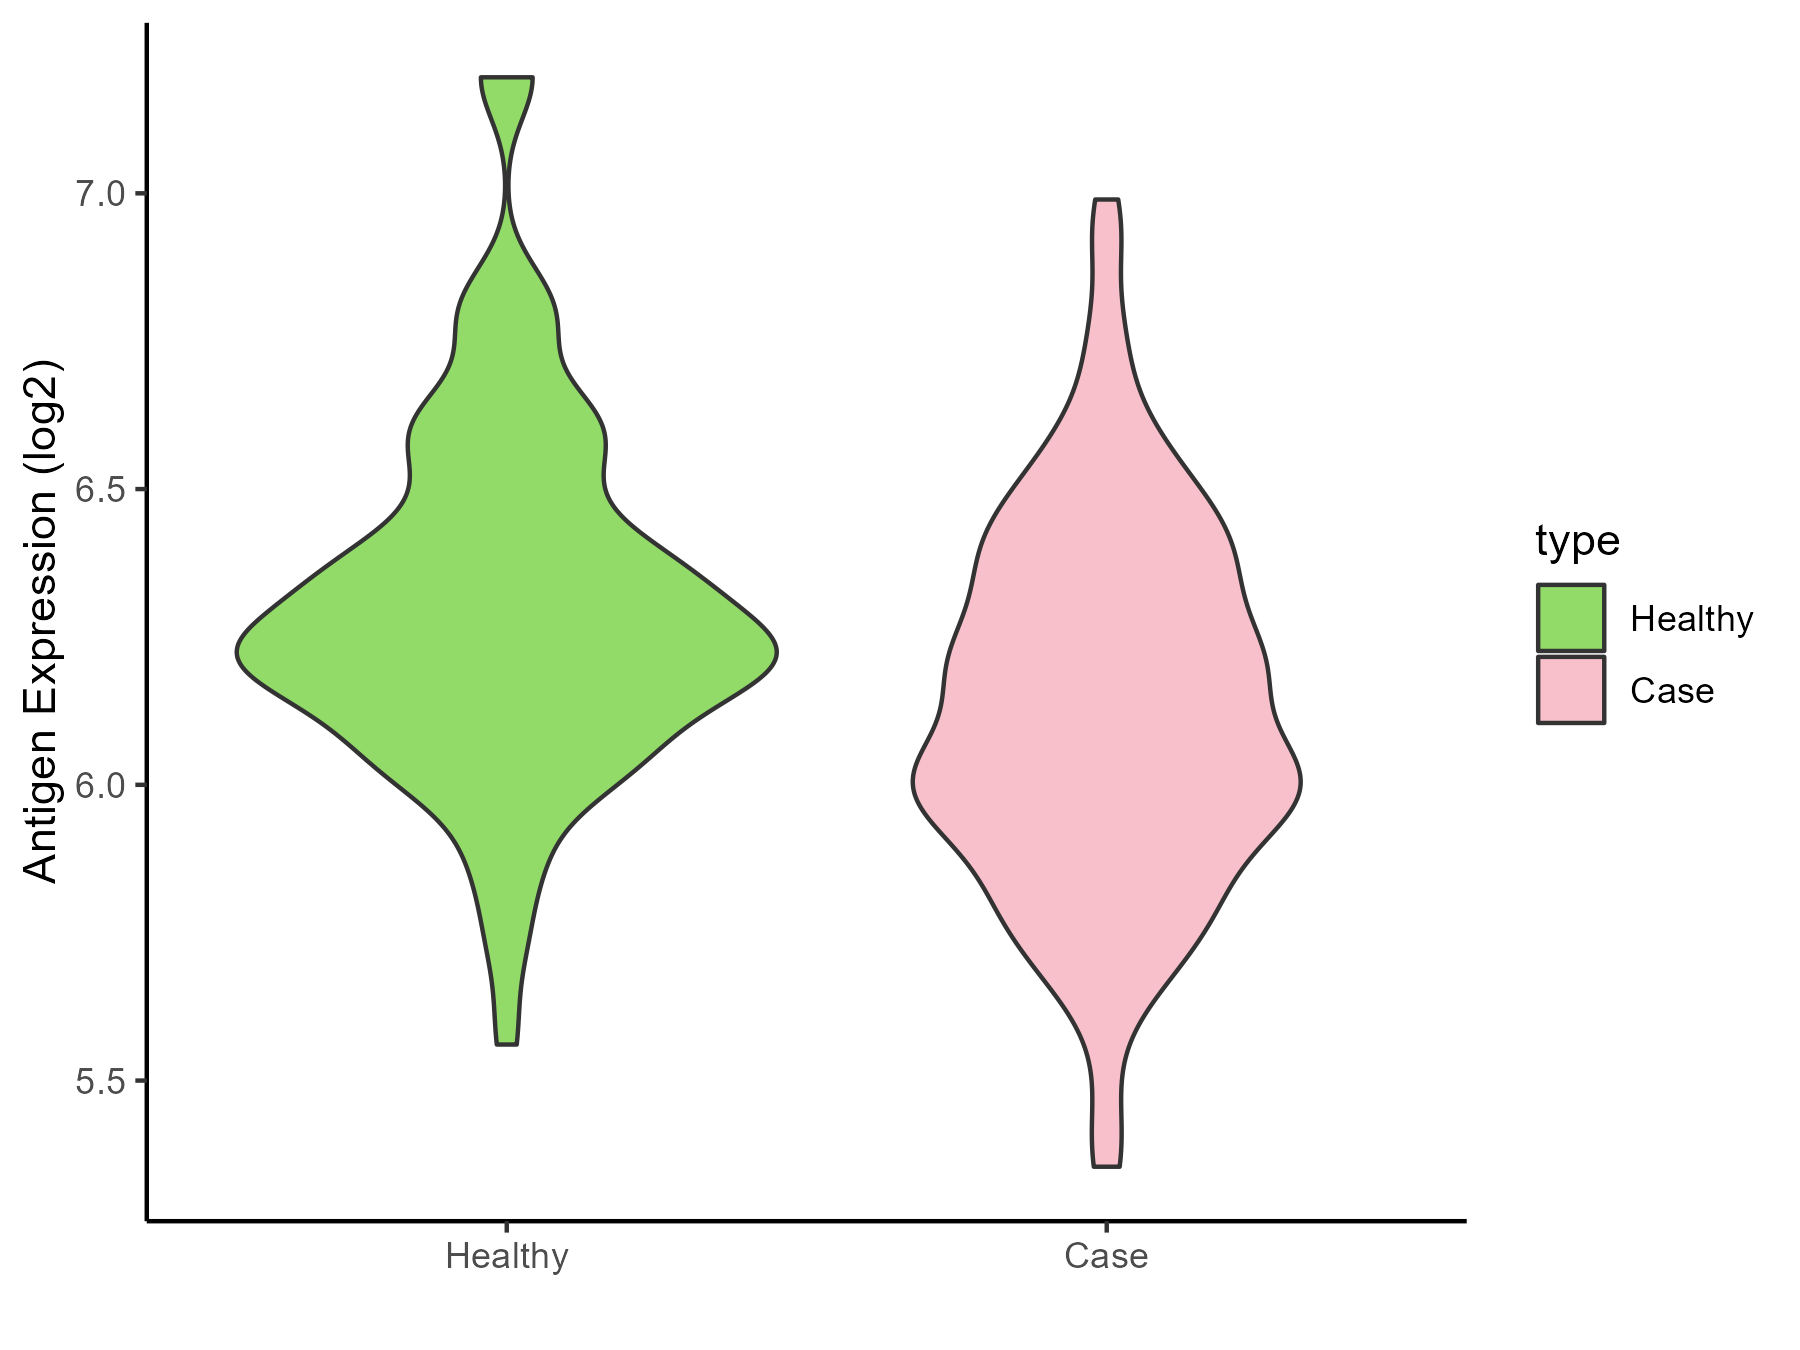
| The Studied Tissue | Whole blood | |
| The Specific Disease | Septic shock | |
| The Expression Level of Disease Section Compare with the Healthy Individual Tissue | p-value: 6.62E-11; Fold-change: -0.141442796; Z-score: -0.477937353 | |
| Disease-specific Antigen Abundances |
|
Click to View the Clearer Original Diagram |
| Differential expression pattern of antigen in diseases | ||
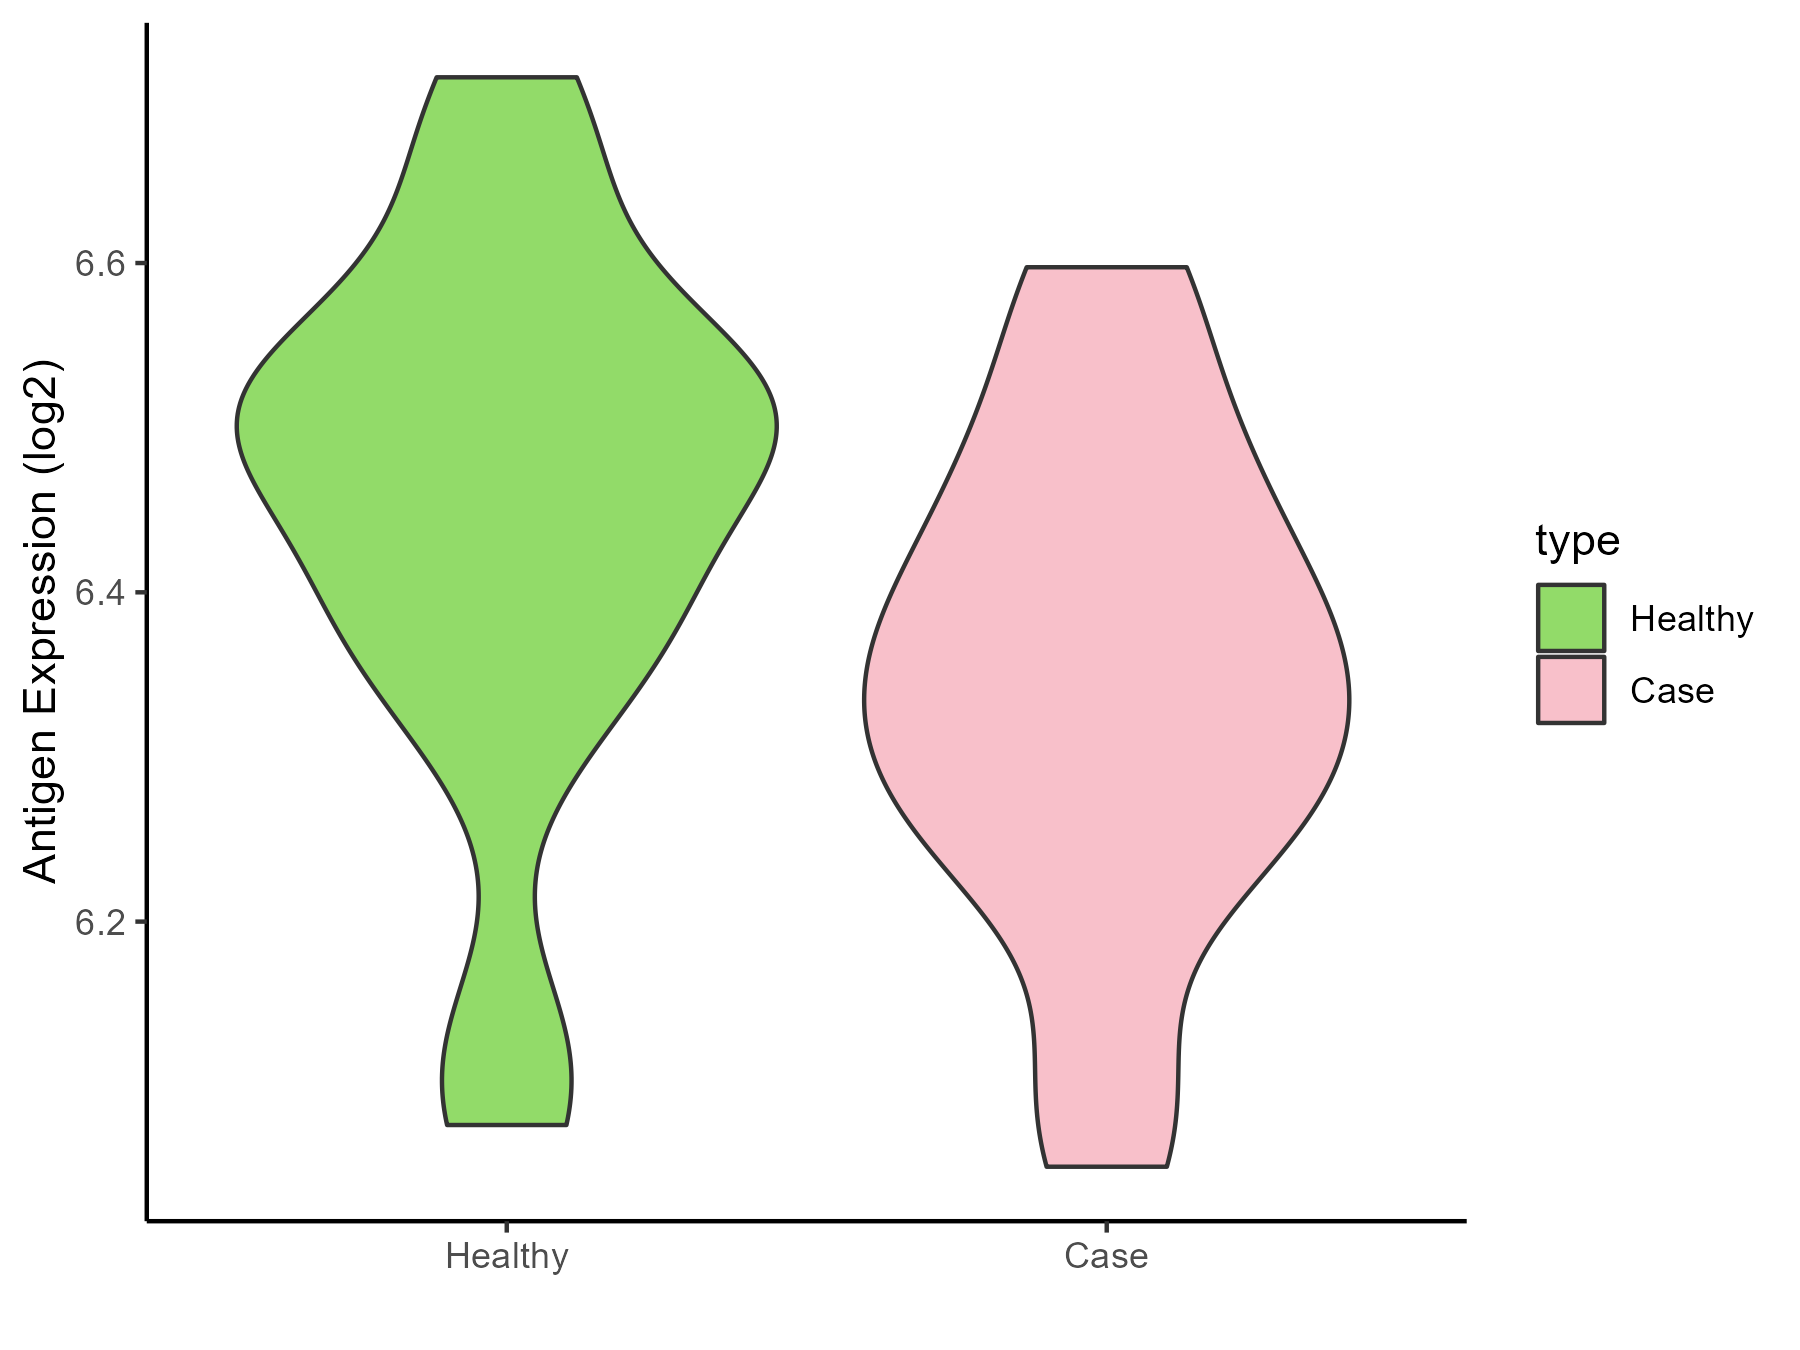
| The Studied Tissue | Peripheral blood | |
| The Specific Disease | Pediatric respiratory syncytial virus infection | |
| The Expression Level of Disease Section Compare with the Healthy Individual Tissue | p-value: 0.046286923; Fold-change: -0.142606952; Z-score: -0.852207846 | |
| Disease-specific Antigen Abundances |
|
Click to View the Clearer Original Diagram |
ICD Disease Classification 11
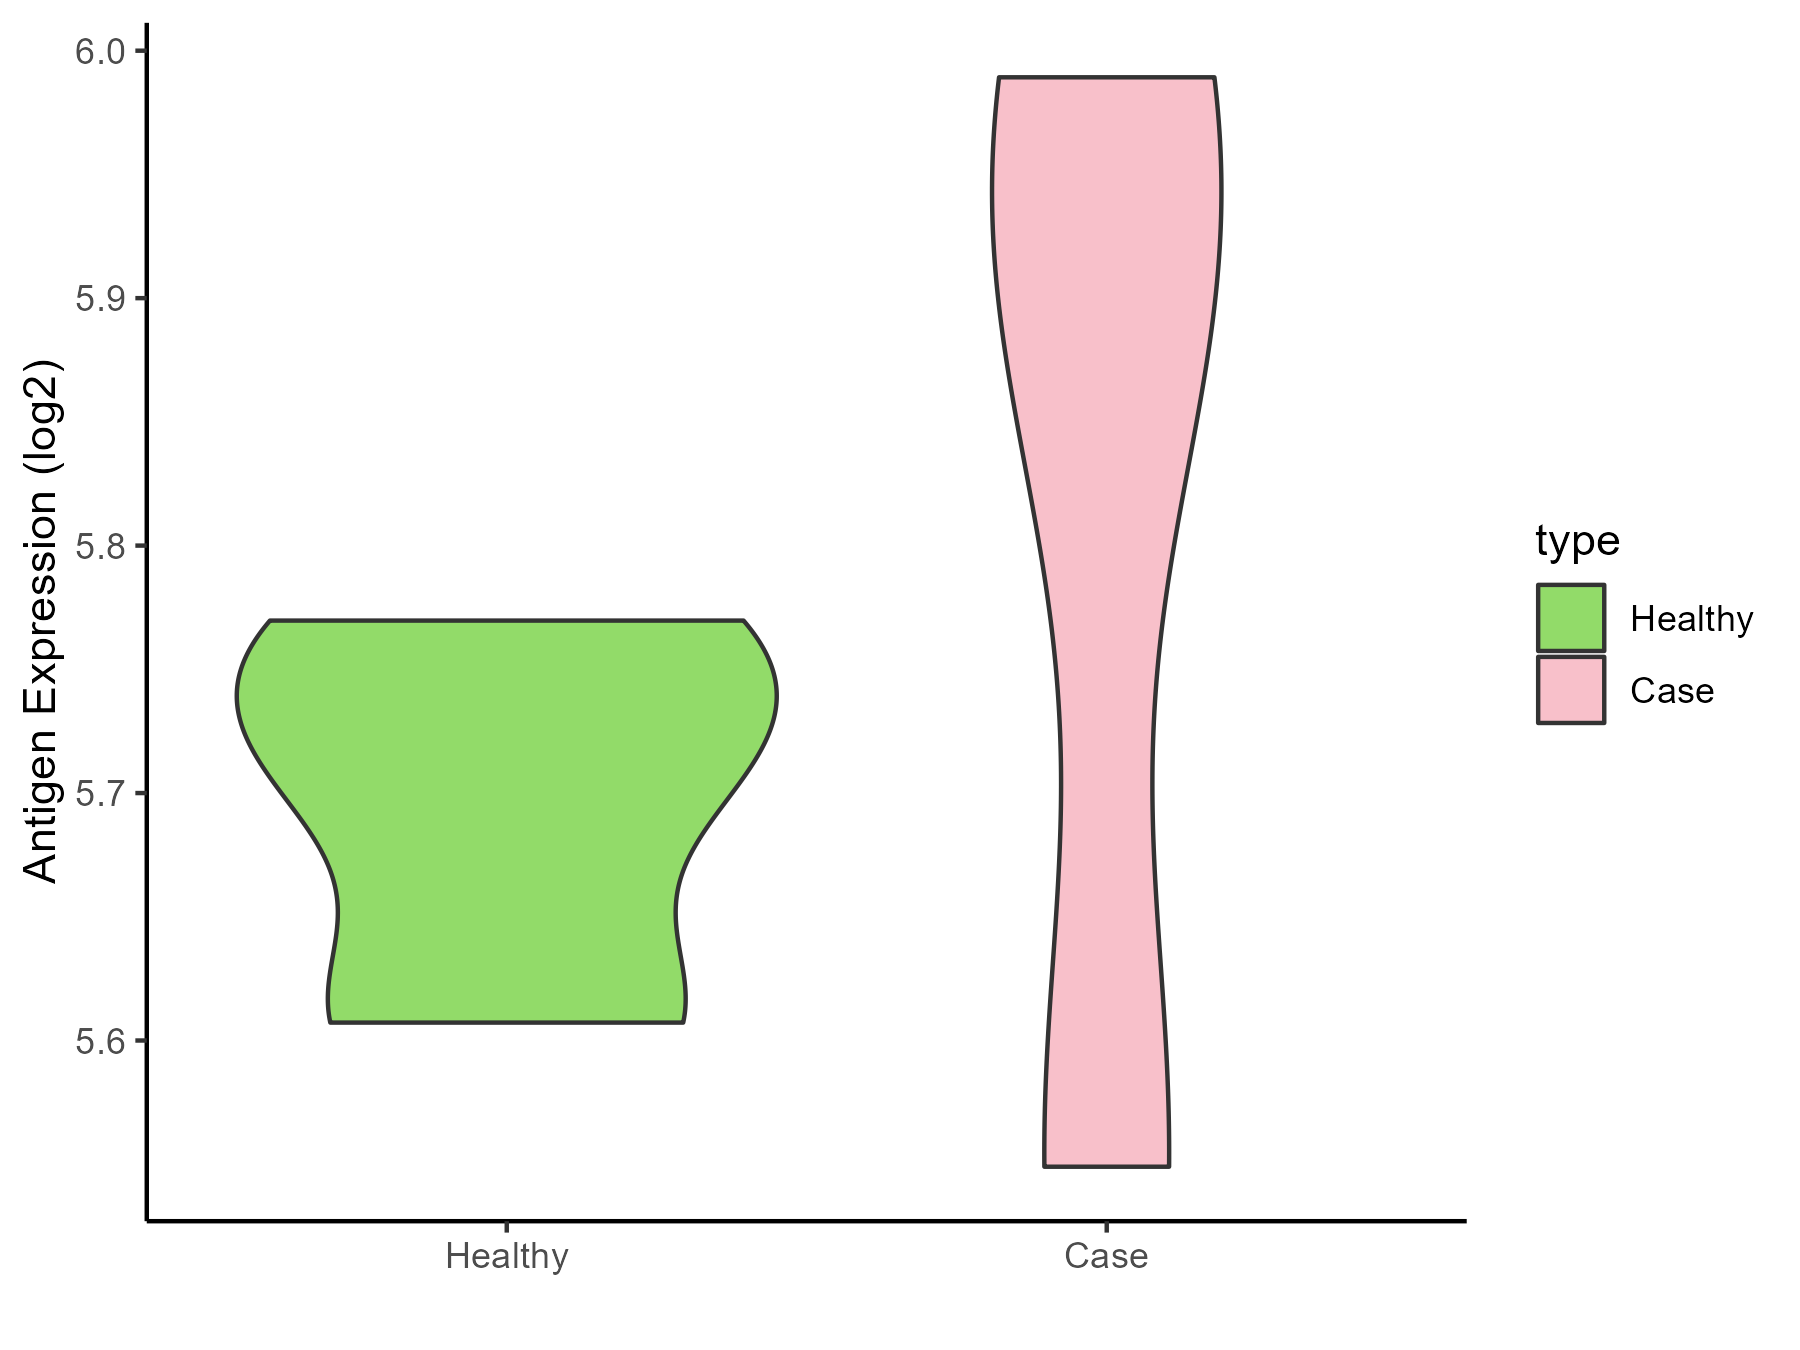
| Differential expression pattern of antigen in diseases | ||
| The Studied Tissue | Peripheral blood | |
| The Specific Disease | Essential hypertension | |
| The Expression Level of Disease Section Compare with the Healthy Individual Tissue | p-value: 0.485347906; Fold-change: 0.18719668; Z-score: 2.273119707 | |
| Disease-specific Antigen Abundances |
|
Click to View the Clearer Original Diagram |
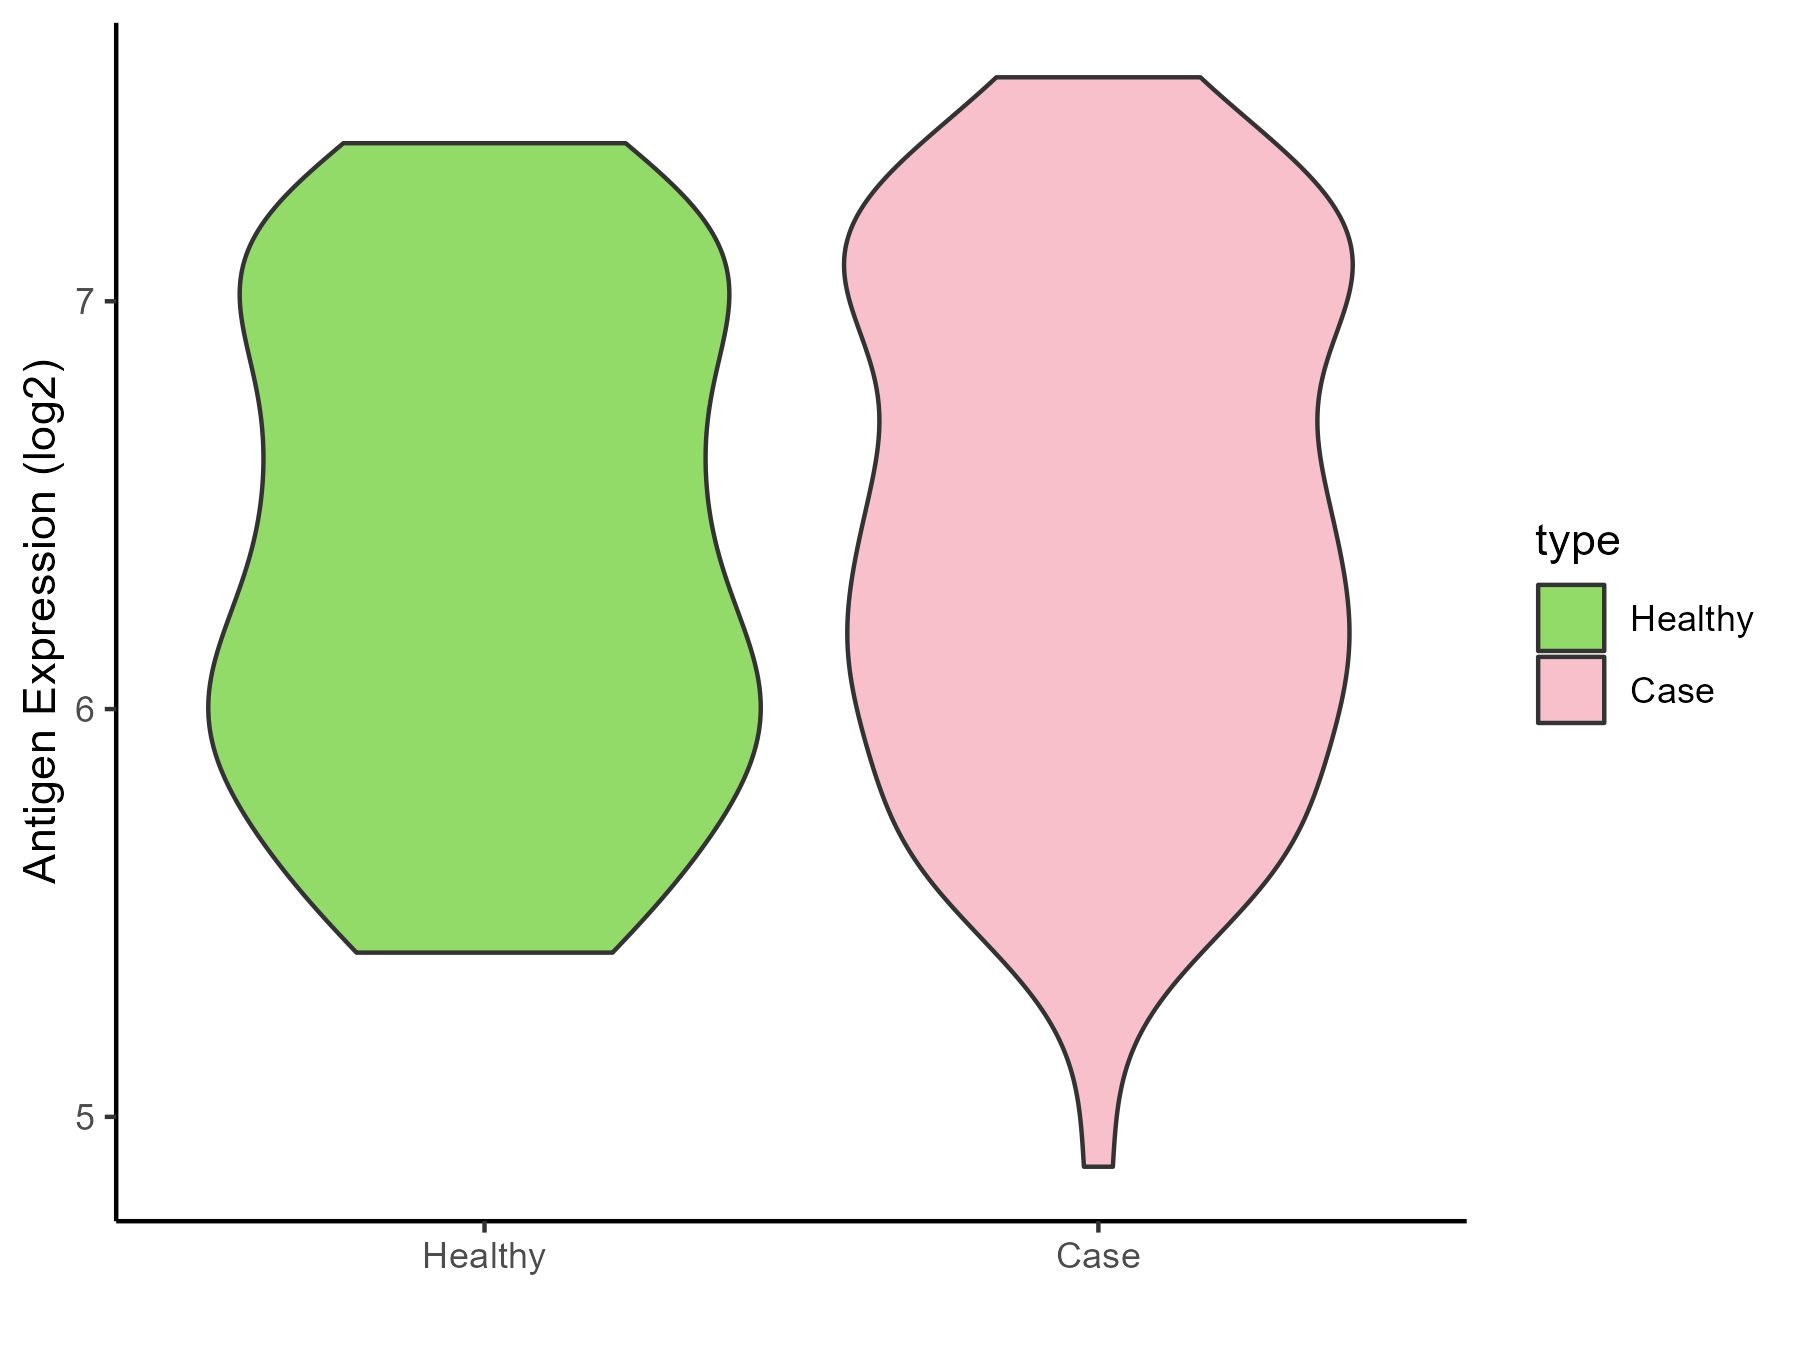
| Differential expression pattern of antigen in diseases | ||
| The Studied Tissue | Peripheral blood | |
| The Specific Disease | Myocardial infarction | |
| The Expression Level of Disease Section Compare with the Healthy Individual Tissue | p-value: 0.518218205; Fold-change: 0.137321999; Z-score: 0.231382235 | |
| Disease-specific Antigen Abundances |
|
Click to View the Clearer Original Diagram |
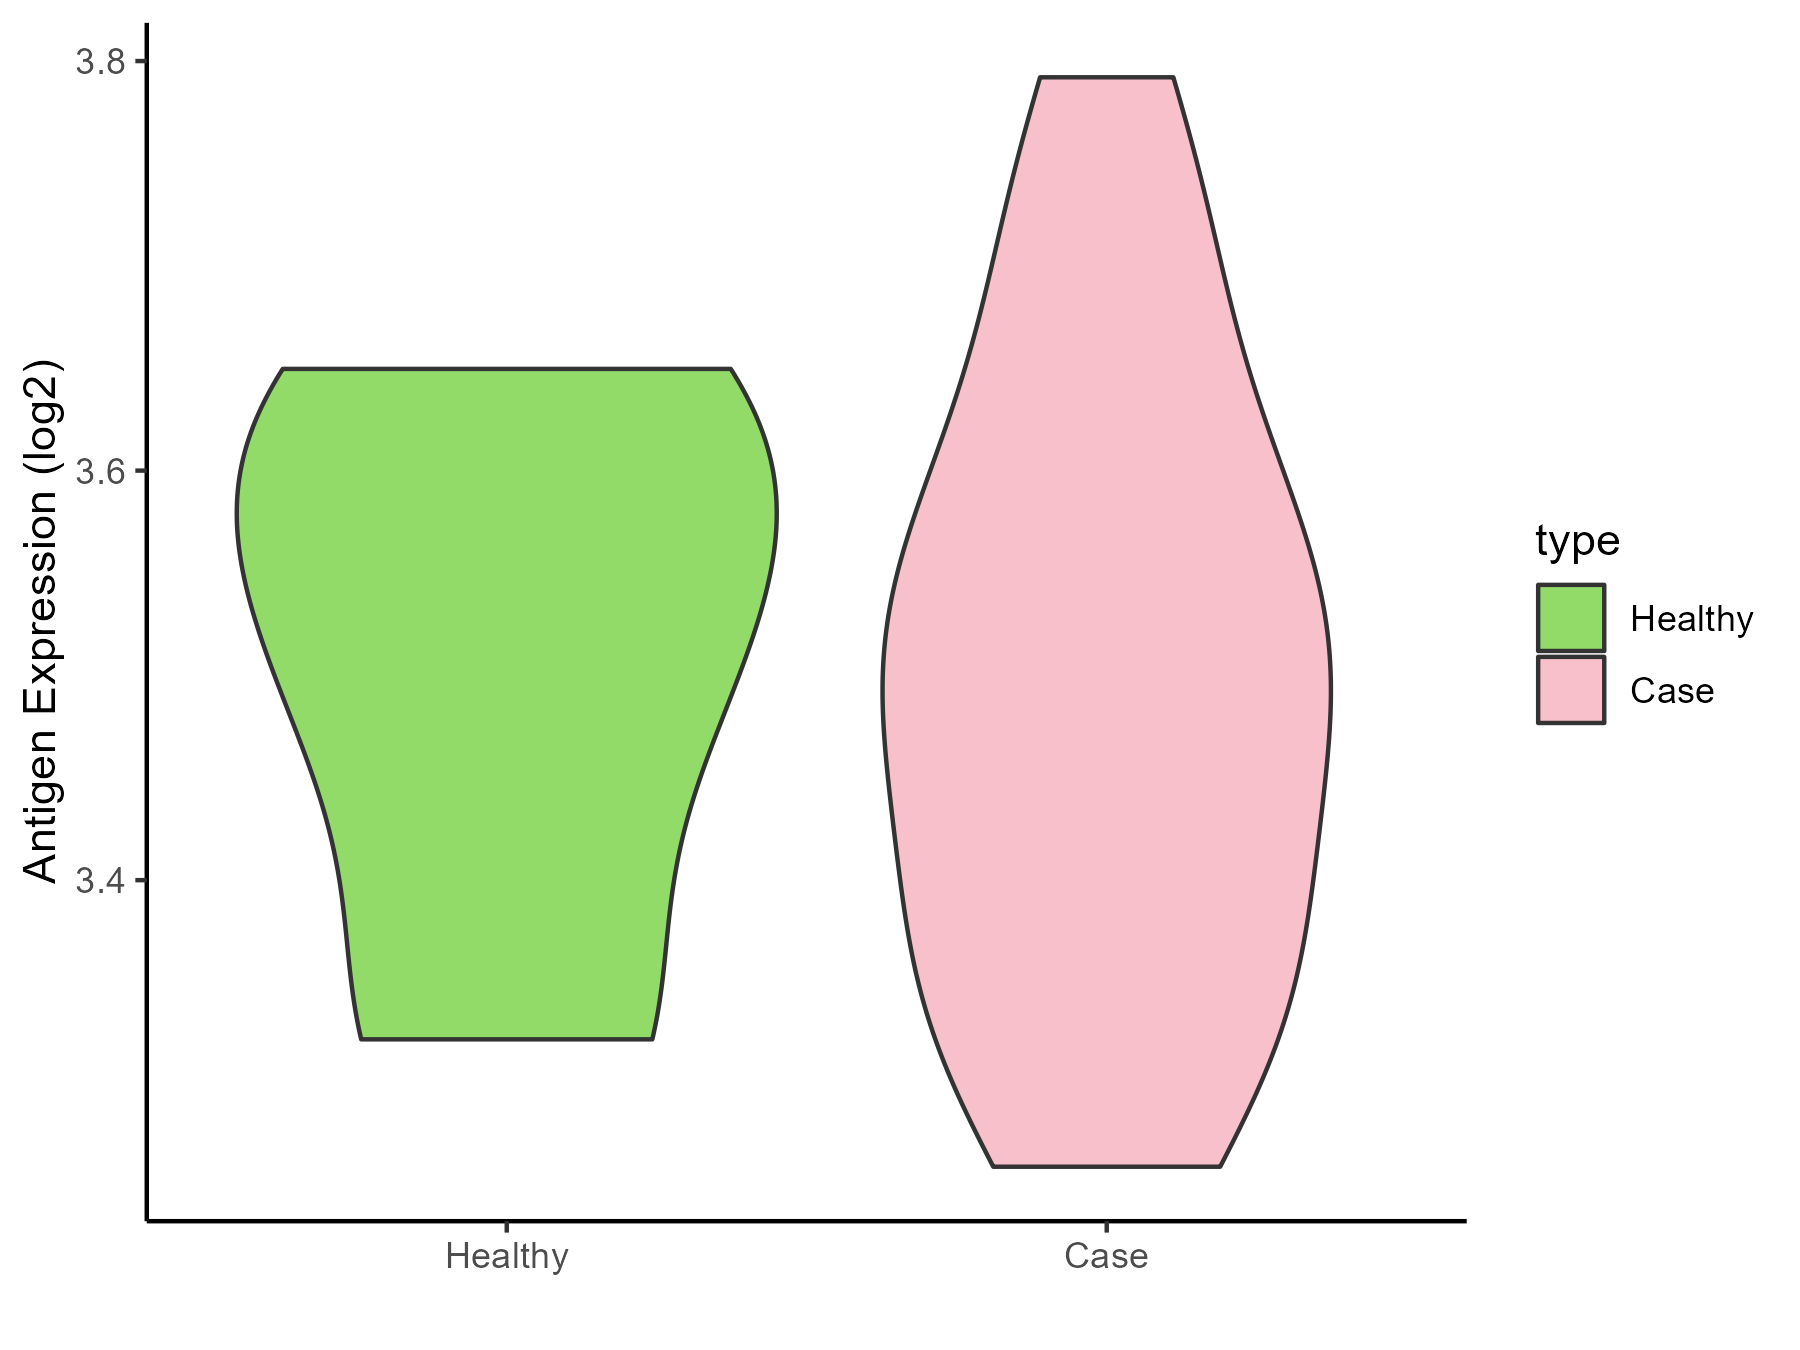
| Differential expression pattern of antigen in diseases | ||
| The Studied Tissue | Peripheral blood | |
| The Specific Disease | Coronary artery disease | |
| The Expression Level of Disease Section Compare with the Healthy Individual Tissue | p-value: 0.883419272; Fold-change: -0.049432186; Z-score: -0.348484705 | |
| Disease-specific Antigen Abundances |
|
Click to View the Clearer Original Diagram |
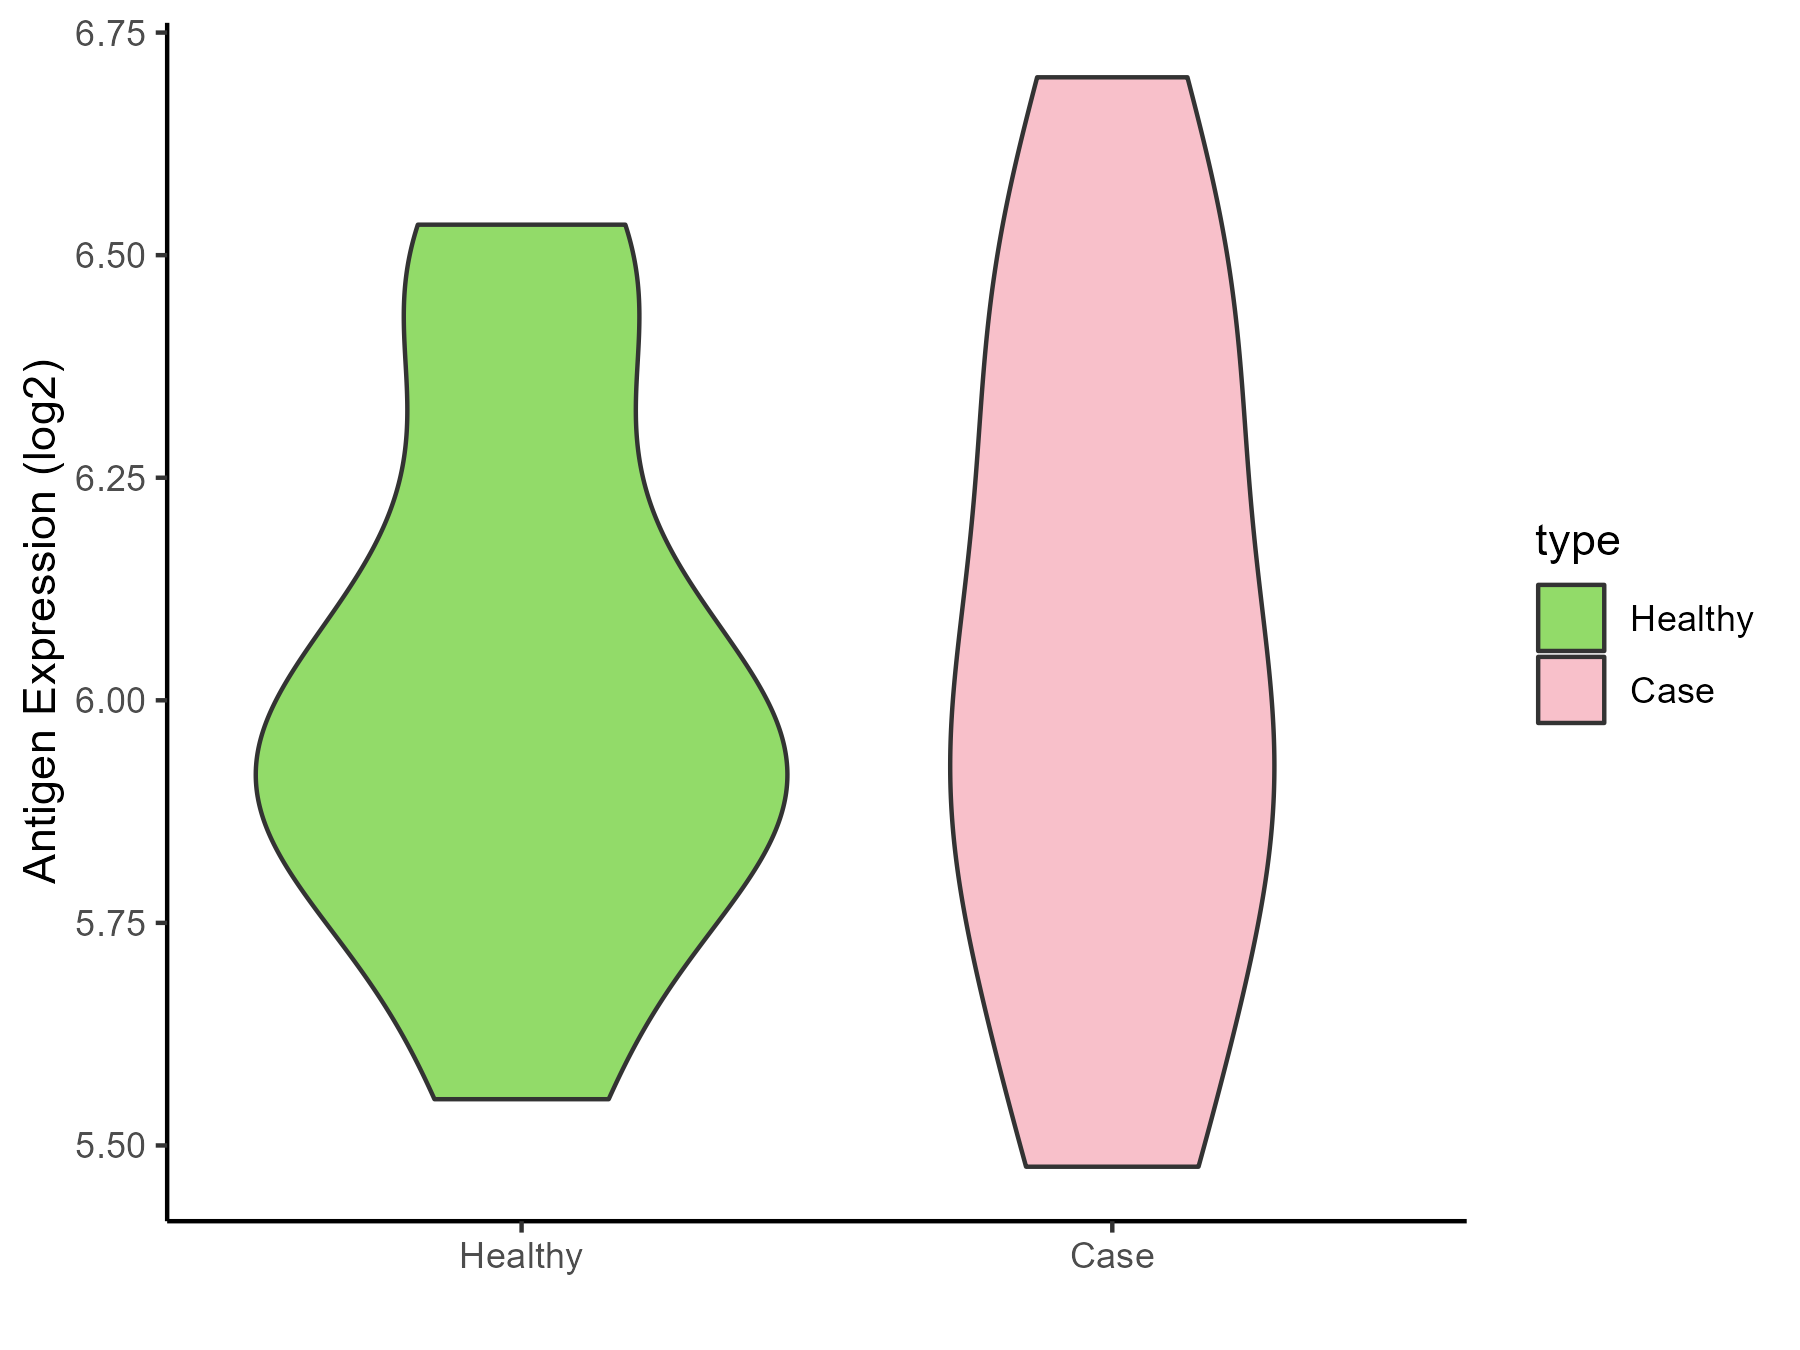
| Differential expression pattern of antigen in diseases | ||
| The Studied Tissue | Calcified aortic valve | |
| The Specific Disease | Aortic stenosis | |
| The Expression Level of Disease Section Compare with the Healthy Individual Tissue | p-value: 0.810096059; Fold-change: 0.017862108; Z-score: 0.058436158 | |
| Disease-specific Antigen Abundances |
|
Click to View the Clearer Original Diagram |
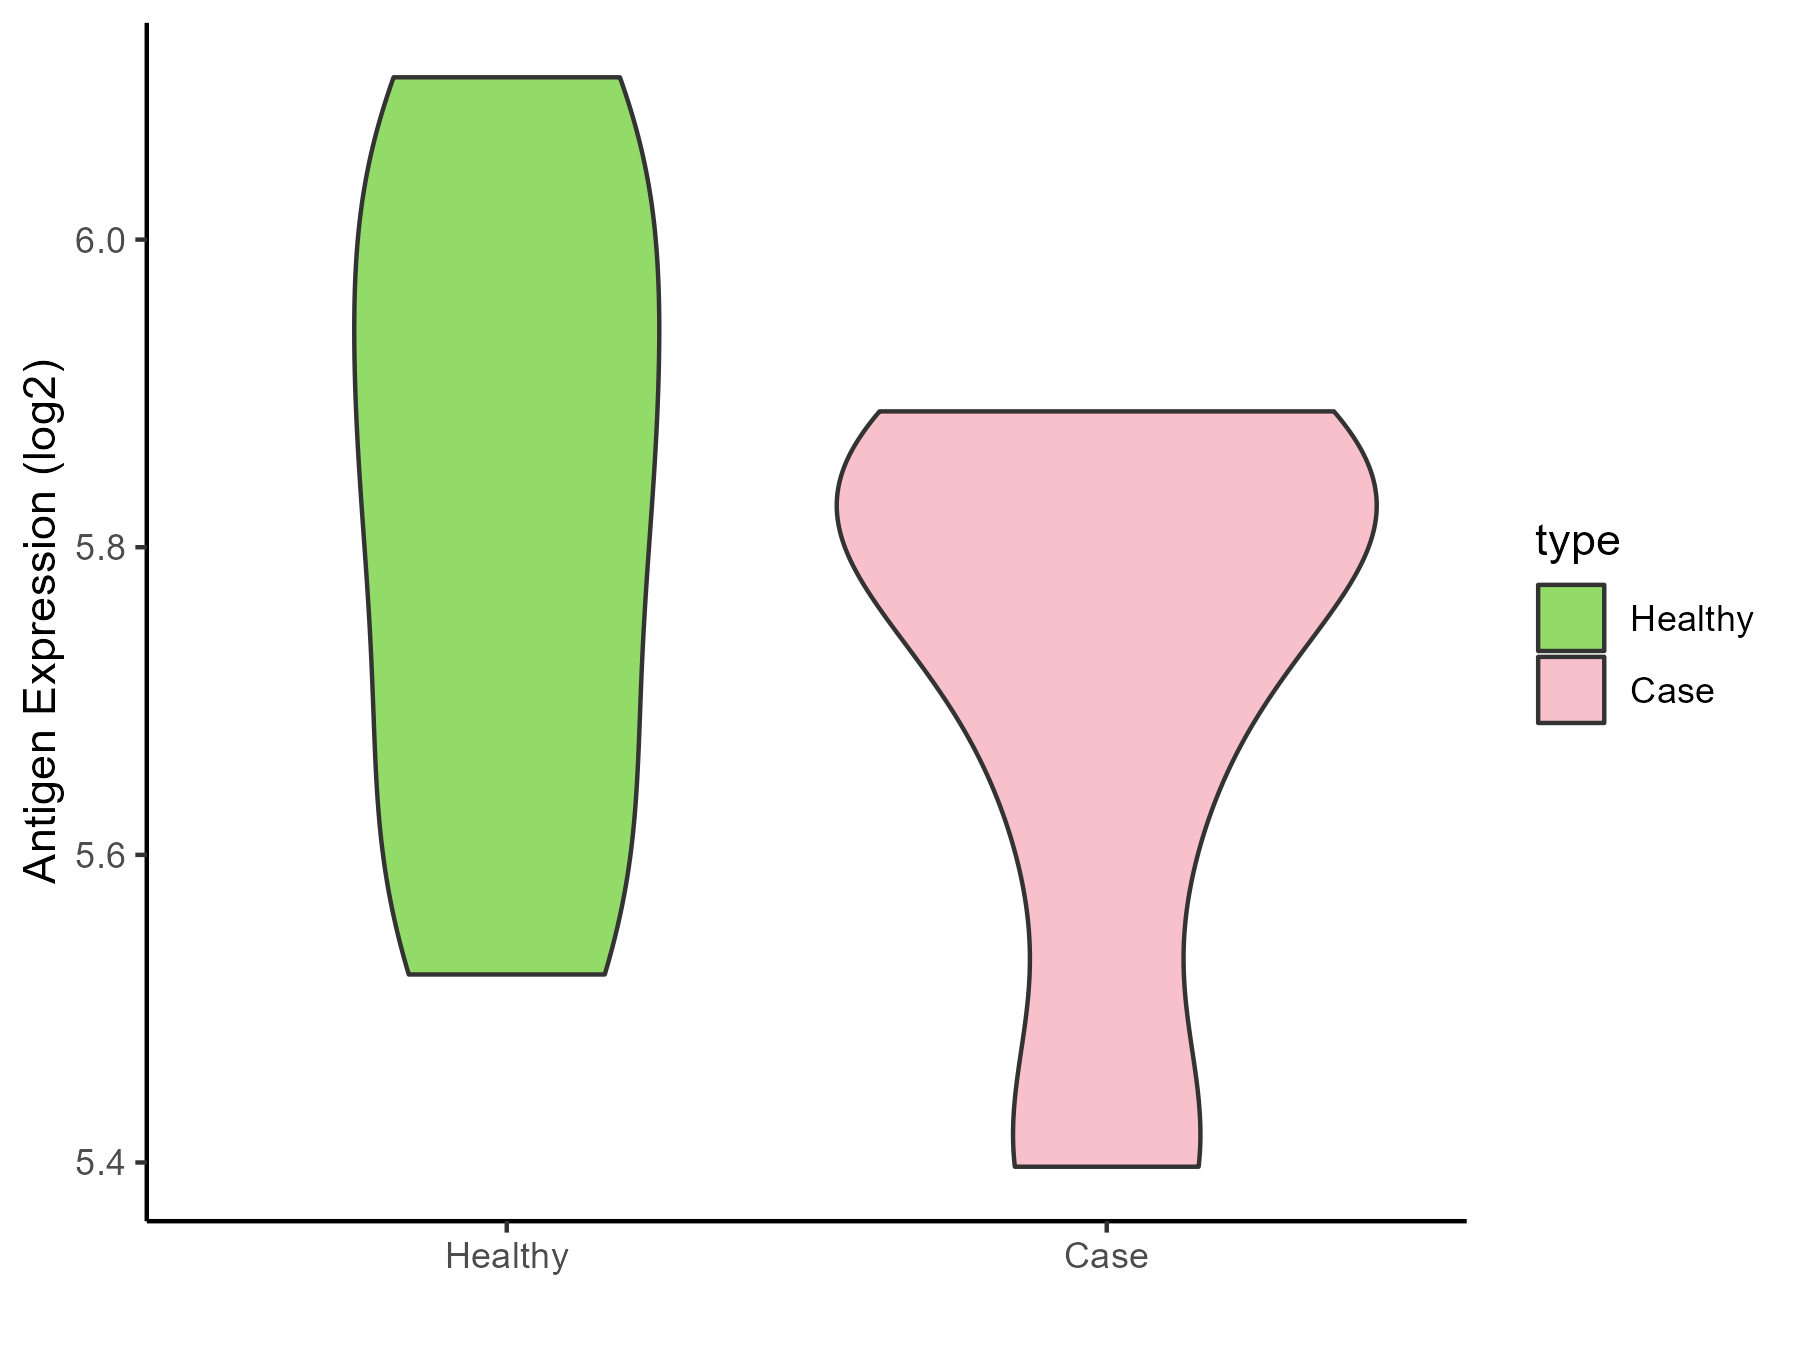
| Differential expression pattern of antigen in diseases | ||
| The Studied Tissue | Peripheral blood | |
| The Specific Disease | Arteriosclerosis | |
| The Expression Level of Disease Section Compare with the Healthy Individual Tissue | p-value: 0.192434434; Fold-change: -0.047198103; Z-score: -0.229483669 | |
| Disease-specific Antigen Abundances |
|
Click to View the Clearer Original Diagram |
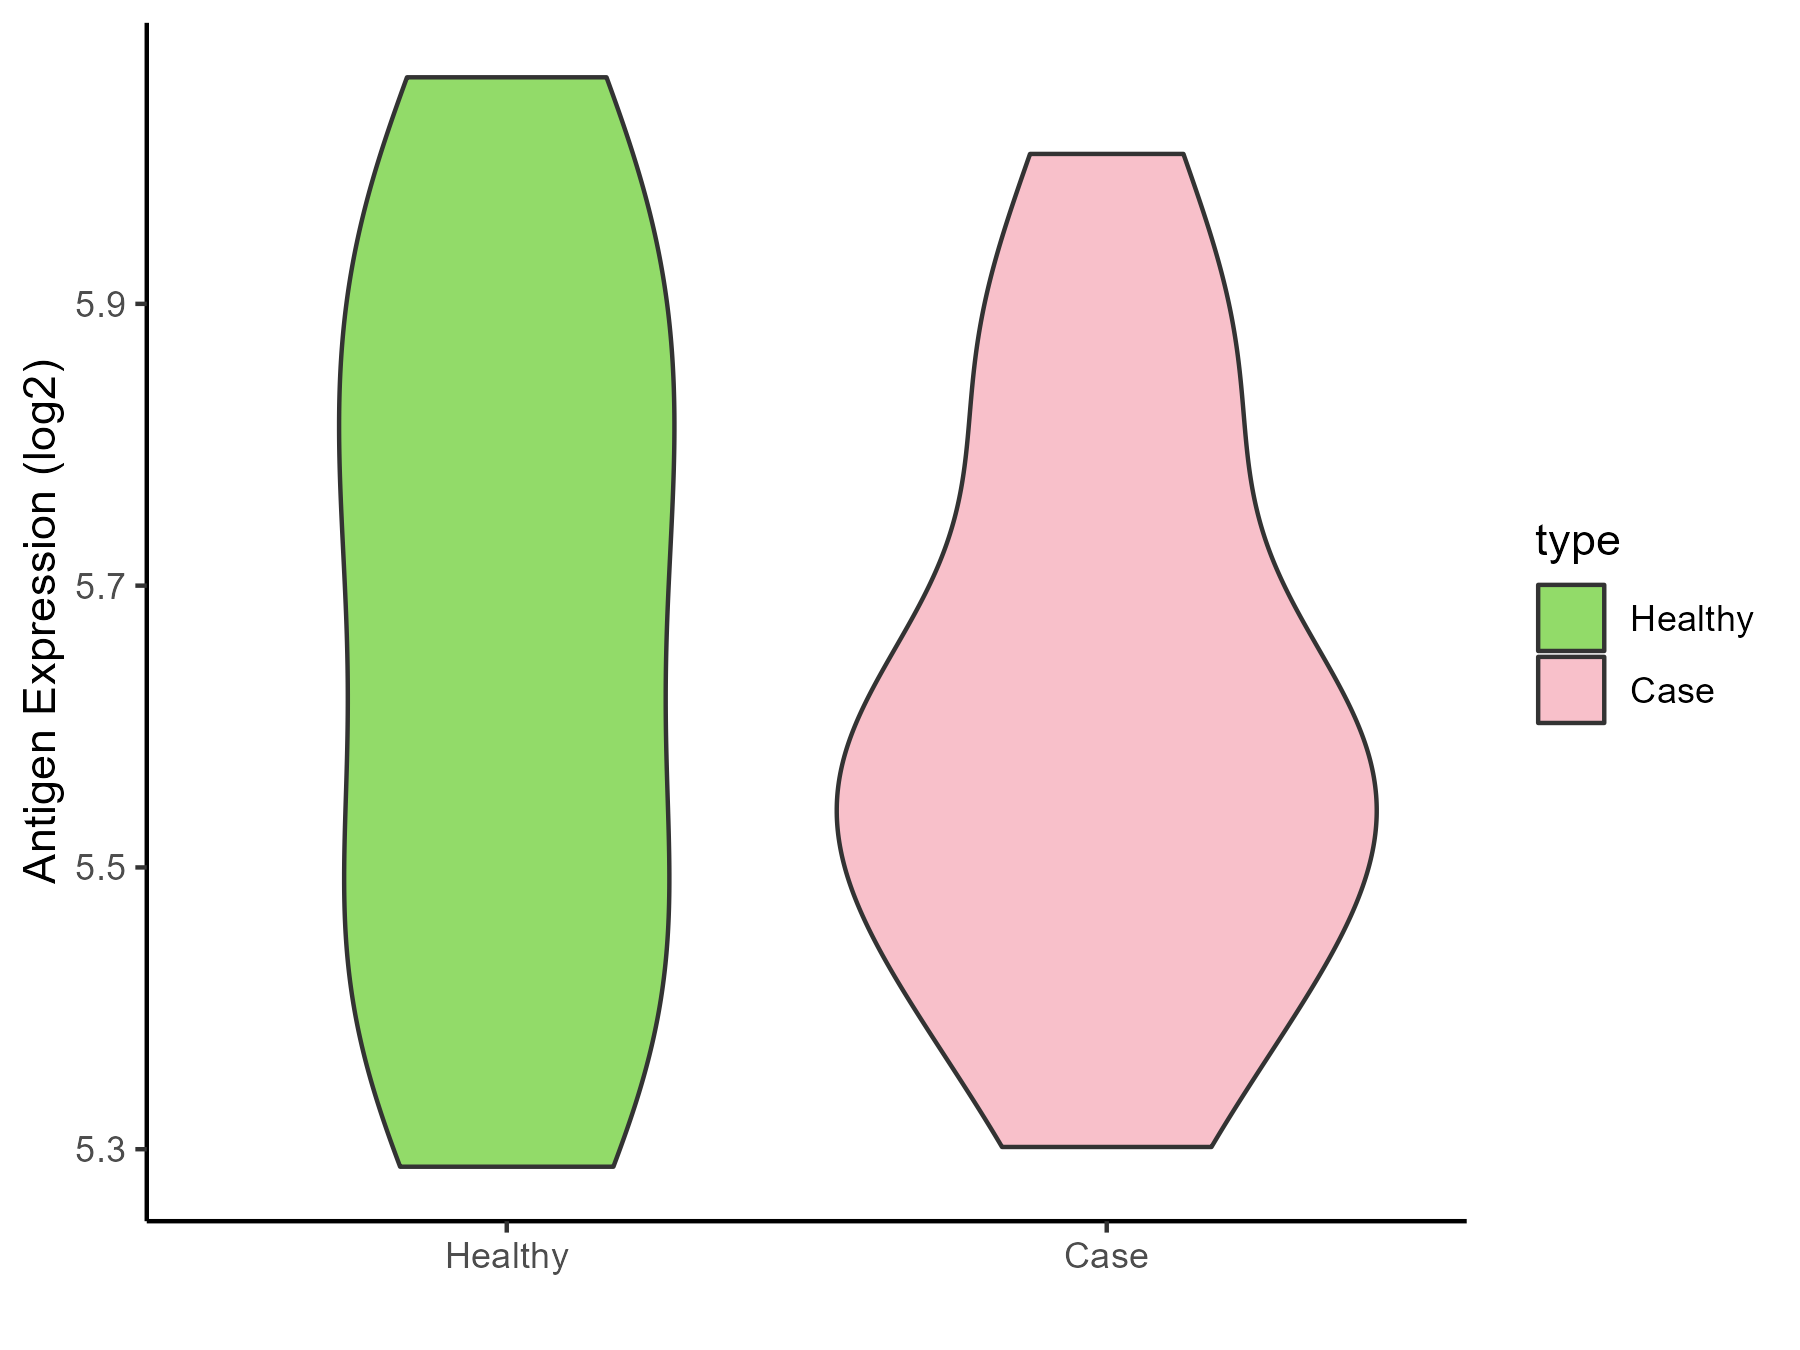
| Differential expression pattern of antigen in diseases | ||
| The Studied Tissue | Intracranial artery | |
| The Specific Disease | Aneurysm | |
| The Expression Level of Disease Section Compare with the Healthy Individual Tissue | p-value: 0.543102982; Fold-change: -0.108966547; Z-score: -0.43151421 | |
| Disease-specific Antigen Abundances |
|
Click to View the Clearer Original Diagram |
ICD Disease Classification 12
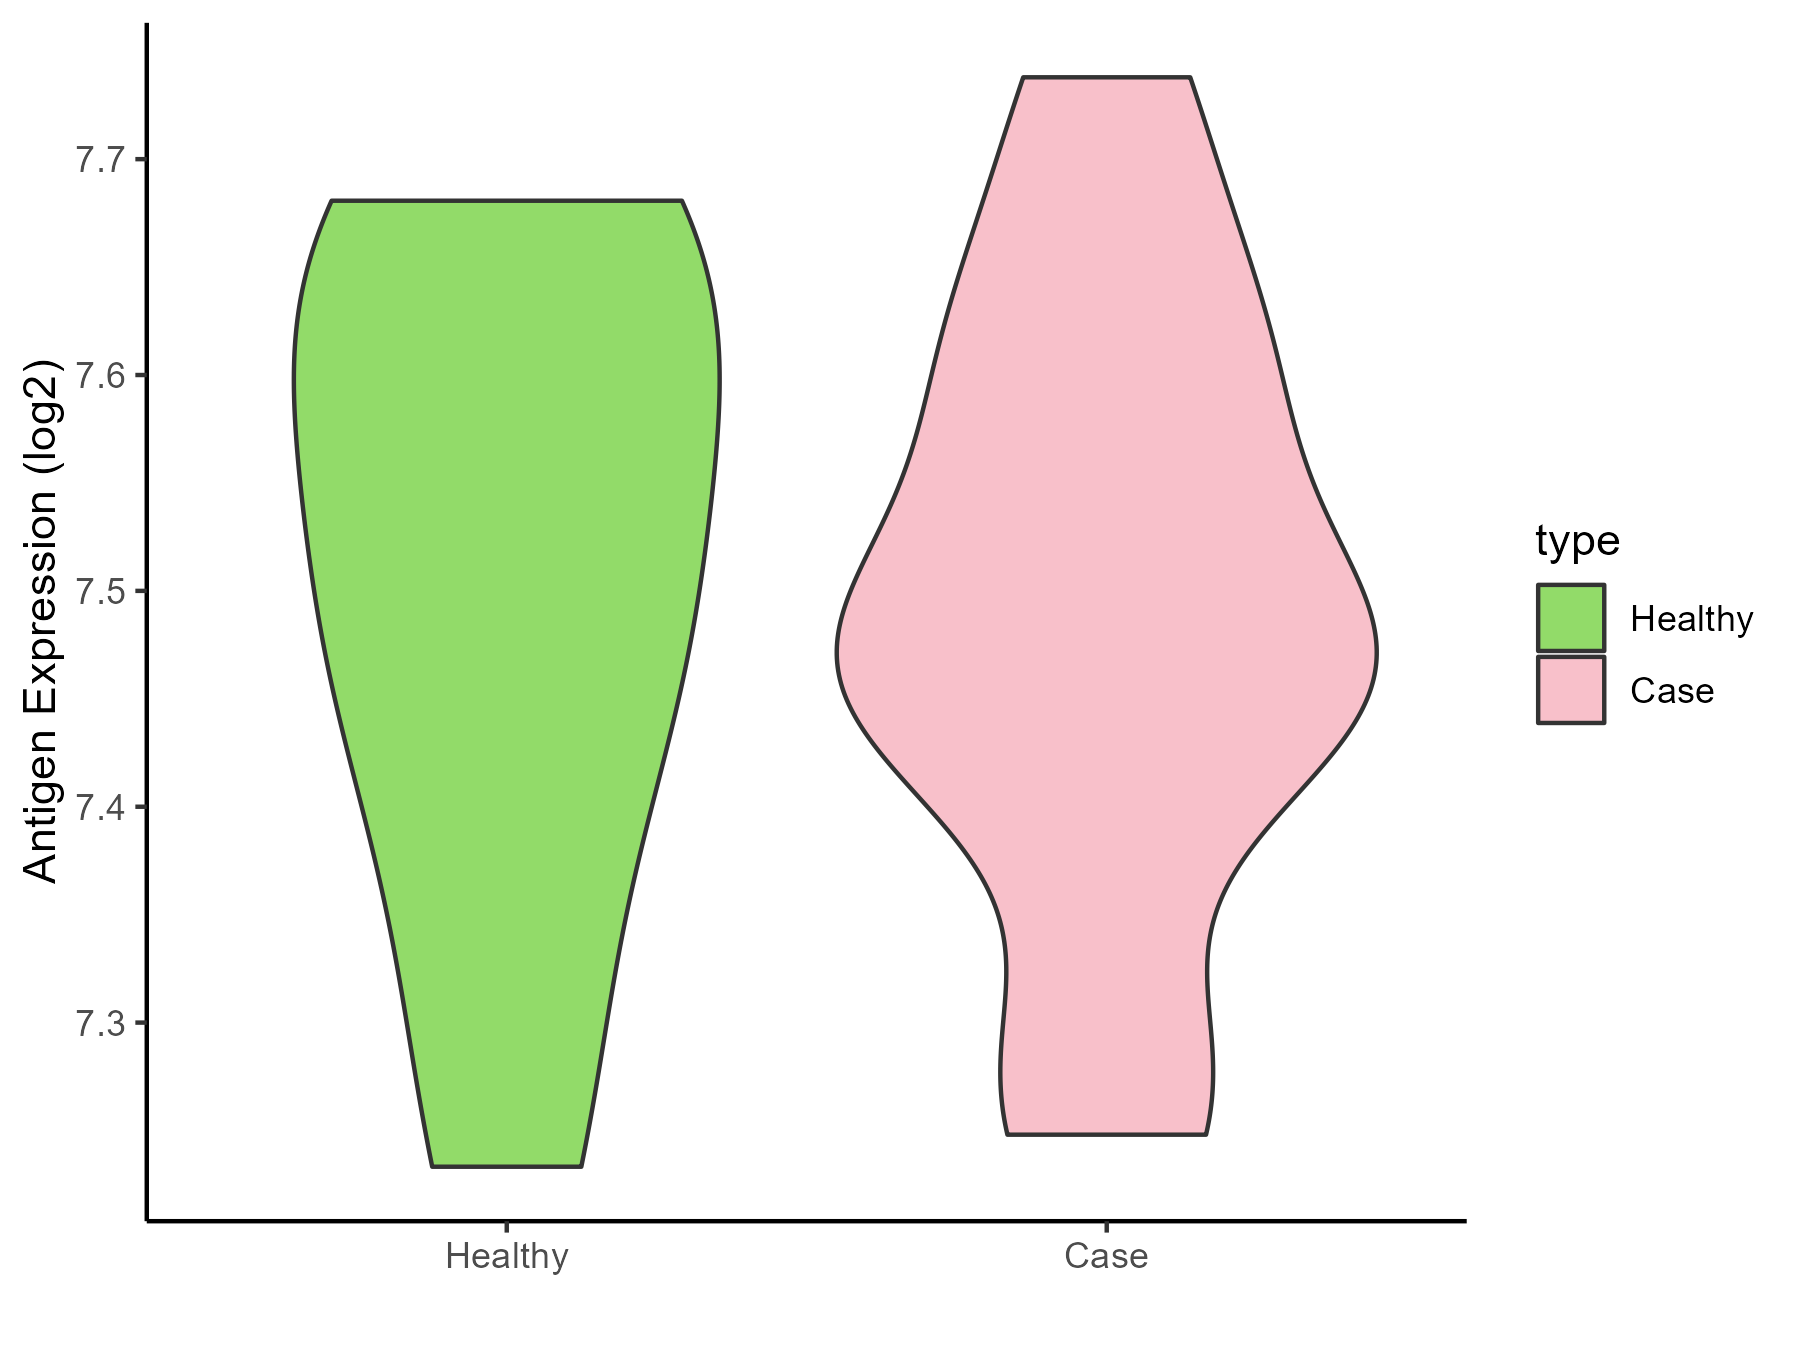
| Differential expression pattern of antigen in diseases | ||
| The Studied Tissue | Peripheral blood | |
| The Specific Disease | Immunodeficiency | |
| The Expression Level of Disease Section Compare with the Healthy Individual Tissue | p-value: 0.820455826; Fold-change: -0.036609194; Z-score: -0.238878752 | |
| Disease-specific Antigen Abundances |
|
Click to View the Clearer Original Diagram |
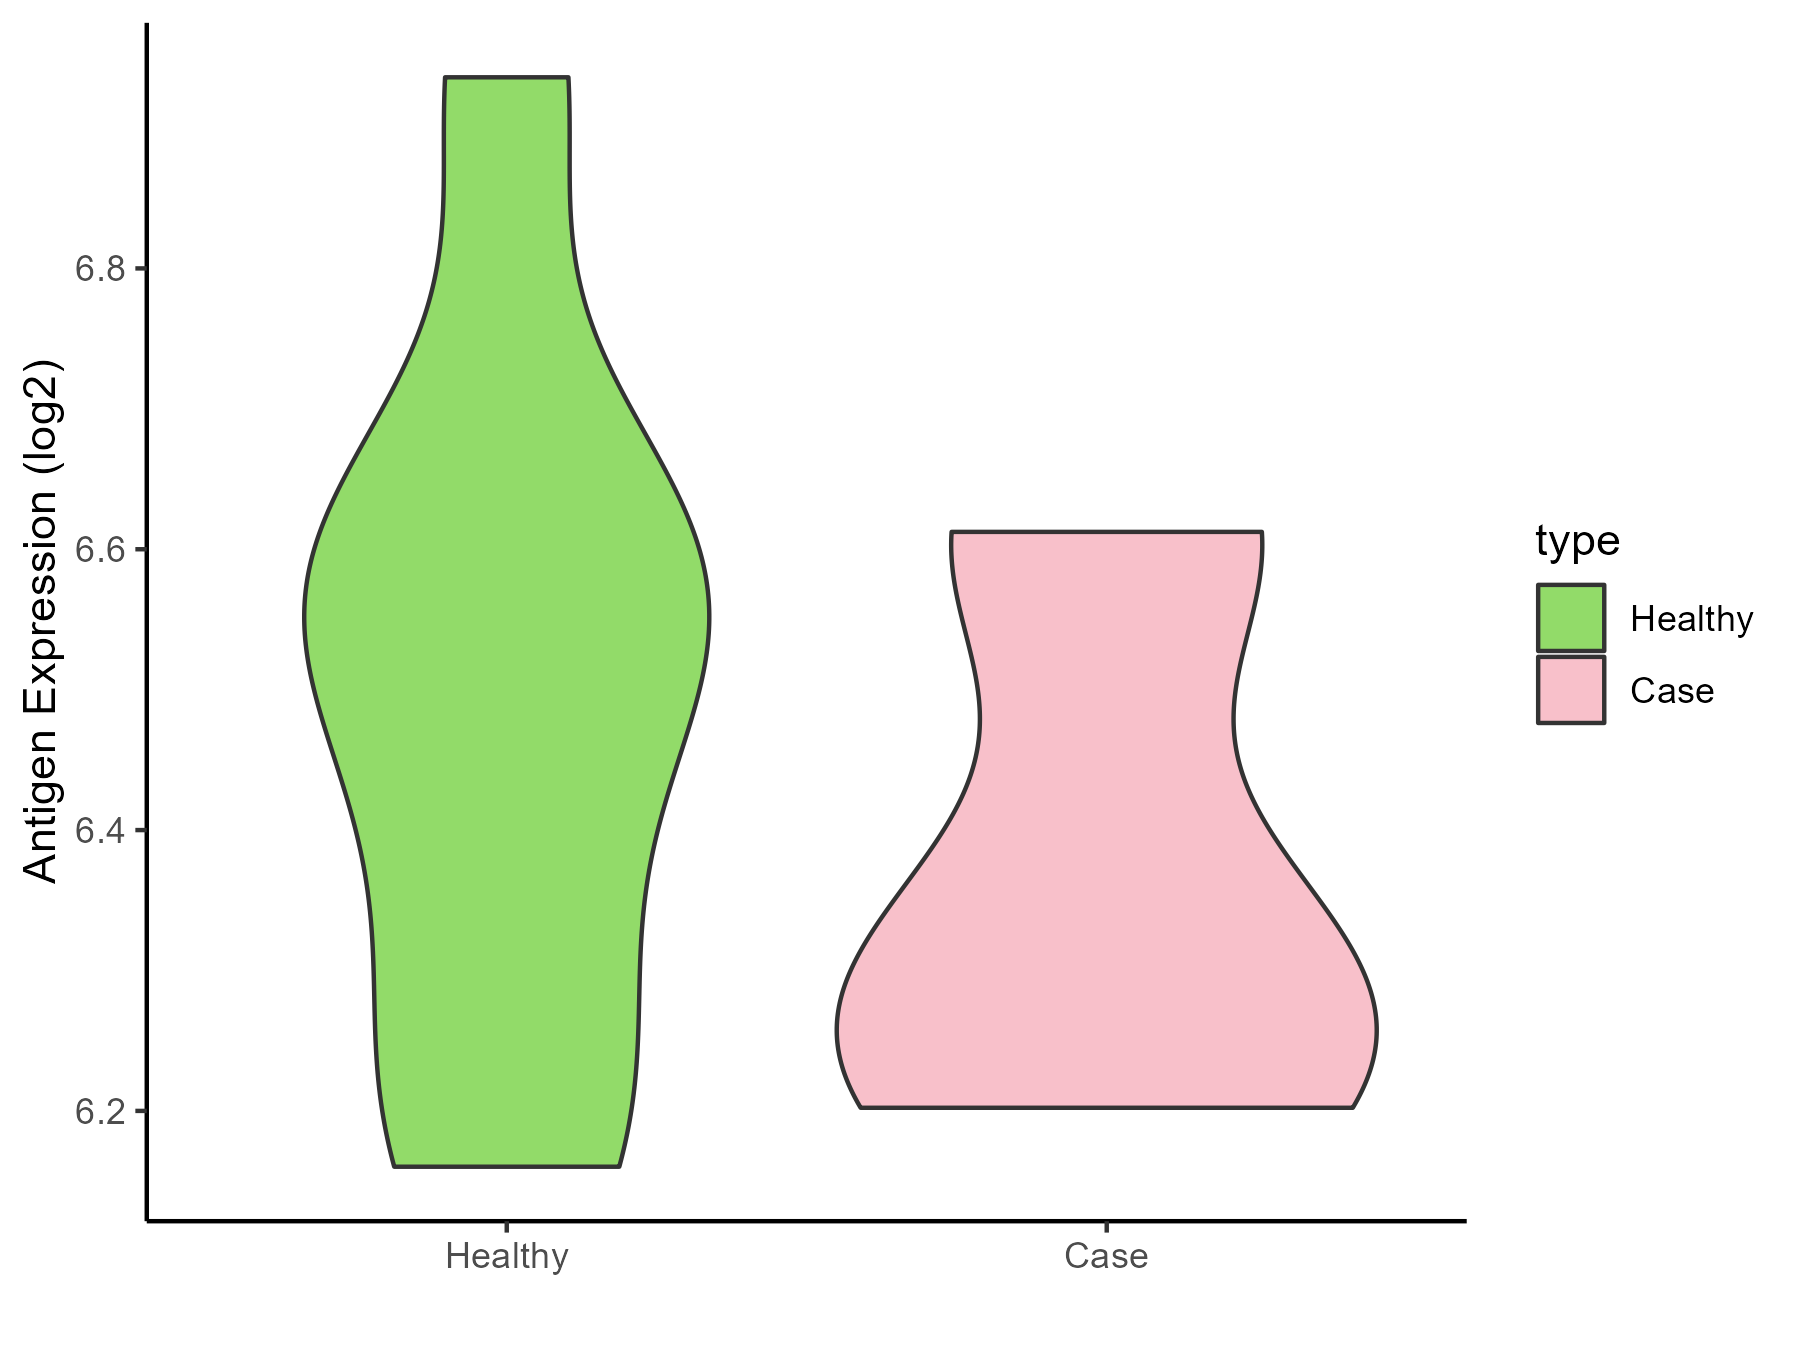
| Differential expression pattern of antigen in diseases | ||
| The Studied Tissue | Hyperplastic tonsil | |
| The Specific Disease | Apnea | |
| The Expression Level of Disease Section Compare with the Healthy Individual Tissue | p-value: 0.461124074; Fold-change: -0.241096014; Z-score: -0.932219155 | |
| Disease-specific Antigen Abundances |
|
Click to View the Clearer Original Diagram |
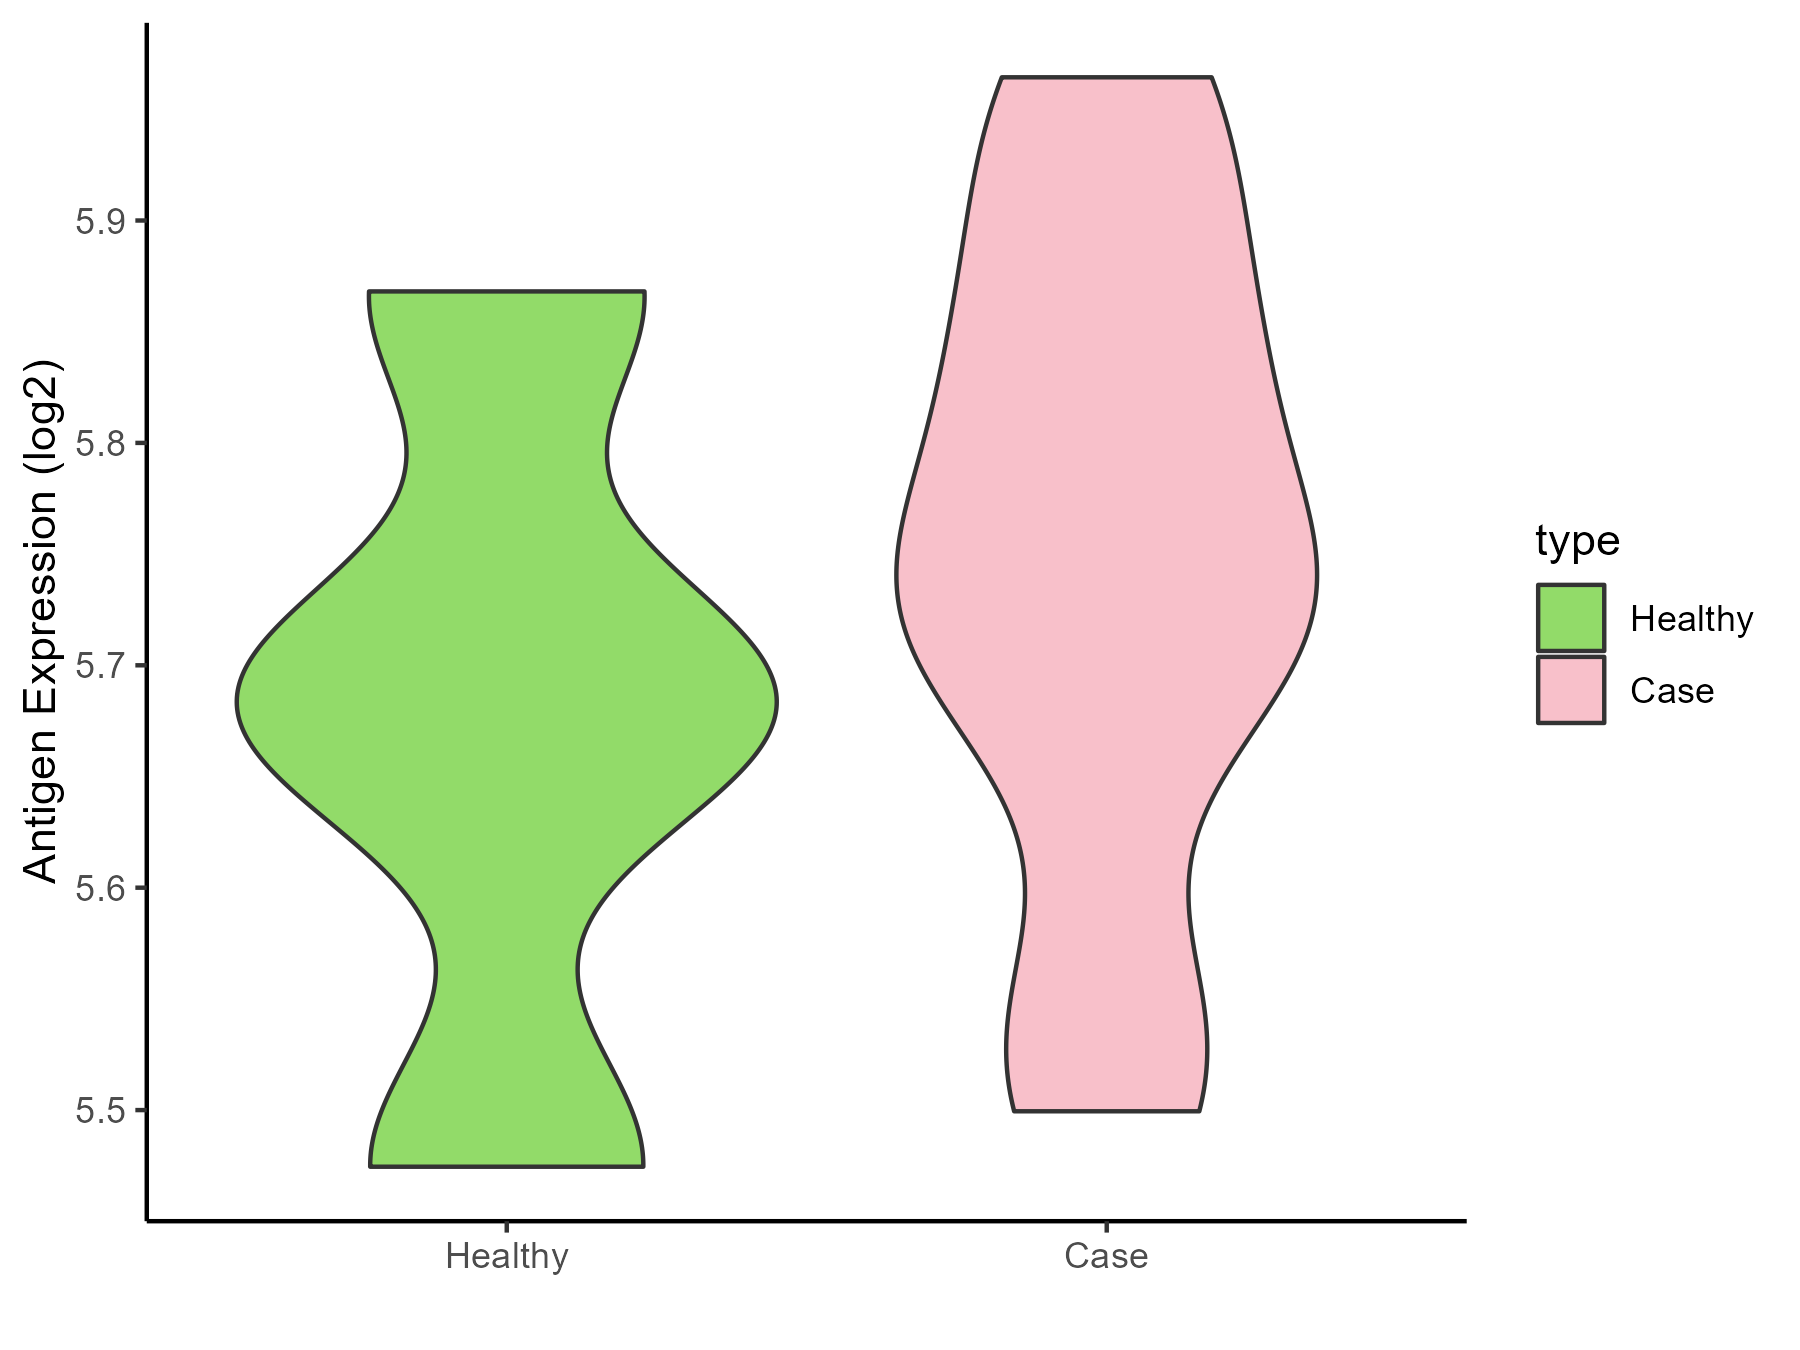
| Differential expression pattern of antigen in diseases | ||
| The Studied Tissue | Peripheral blood | |
| The Specific Disease | Olive pollen allergy | |
| The Expression Level of Disease Section Compare with the Healthy Individual Tissue | p-value: 0.459577301; Fold-change: 0.065030447; Z-score: 0.403951355 | |
| Disease-specific Antigen Abundances |
|
Click to View the Clearer Original Diagram |
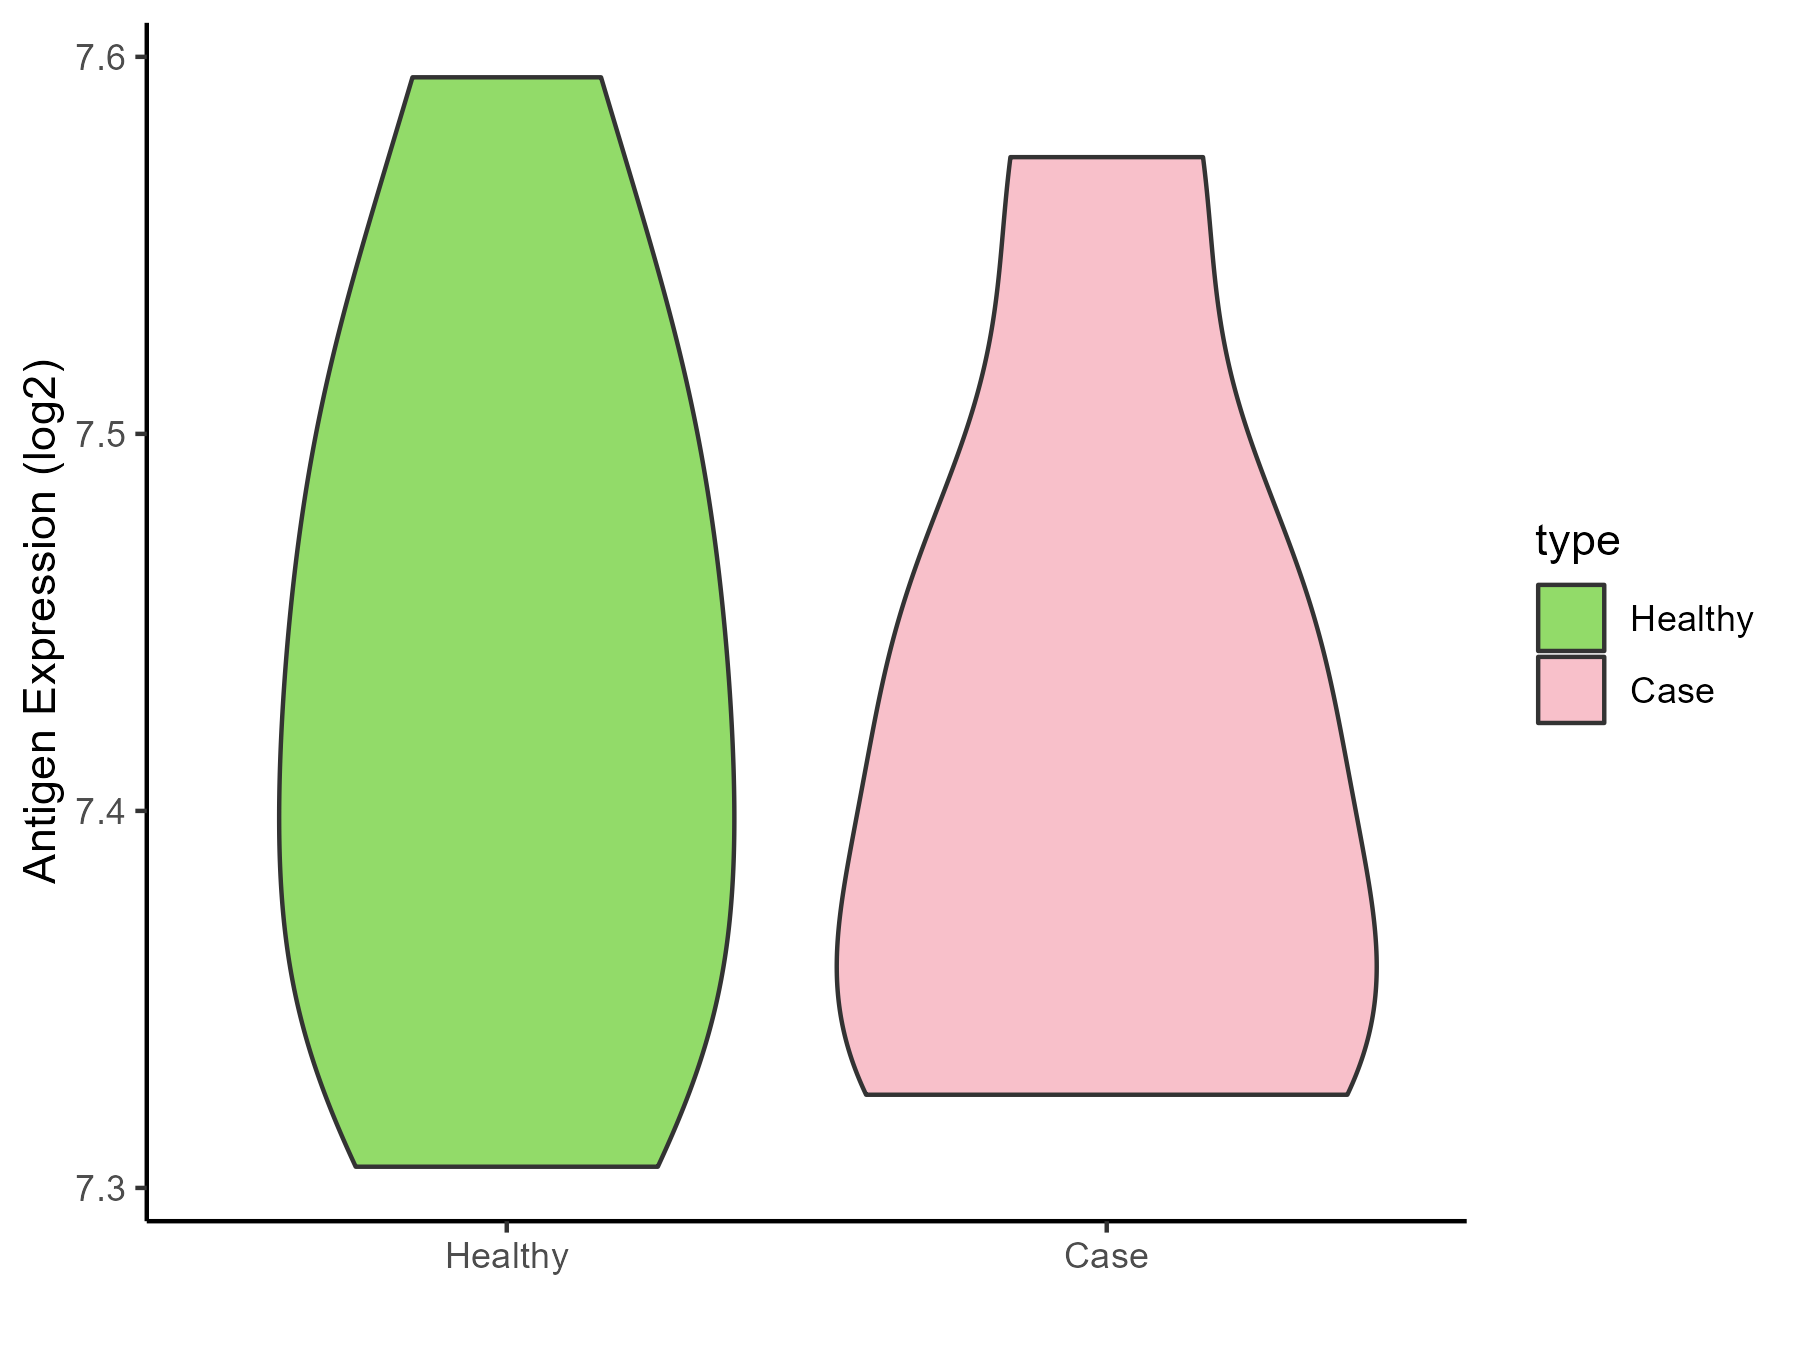
| Differential expression pattern of antigen in diseases | ||
| The Studied Tissue | Sinus mucosa | |
| The Specific Disease | Chronic rhinosinusitis | |
| The Expression Level of Disease Section Compare with the Healthy Individual Tissue | p-value: 0.725465092; Fold-change: -0.027095848; Z-score: -0.286561511 | |
| Disease-specific Antigen Abundances |
|
Click to View the Clearer Original Diagram |
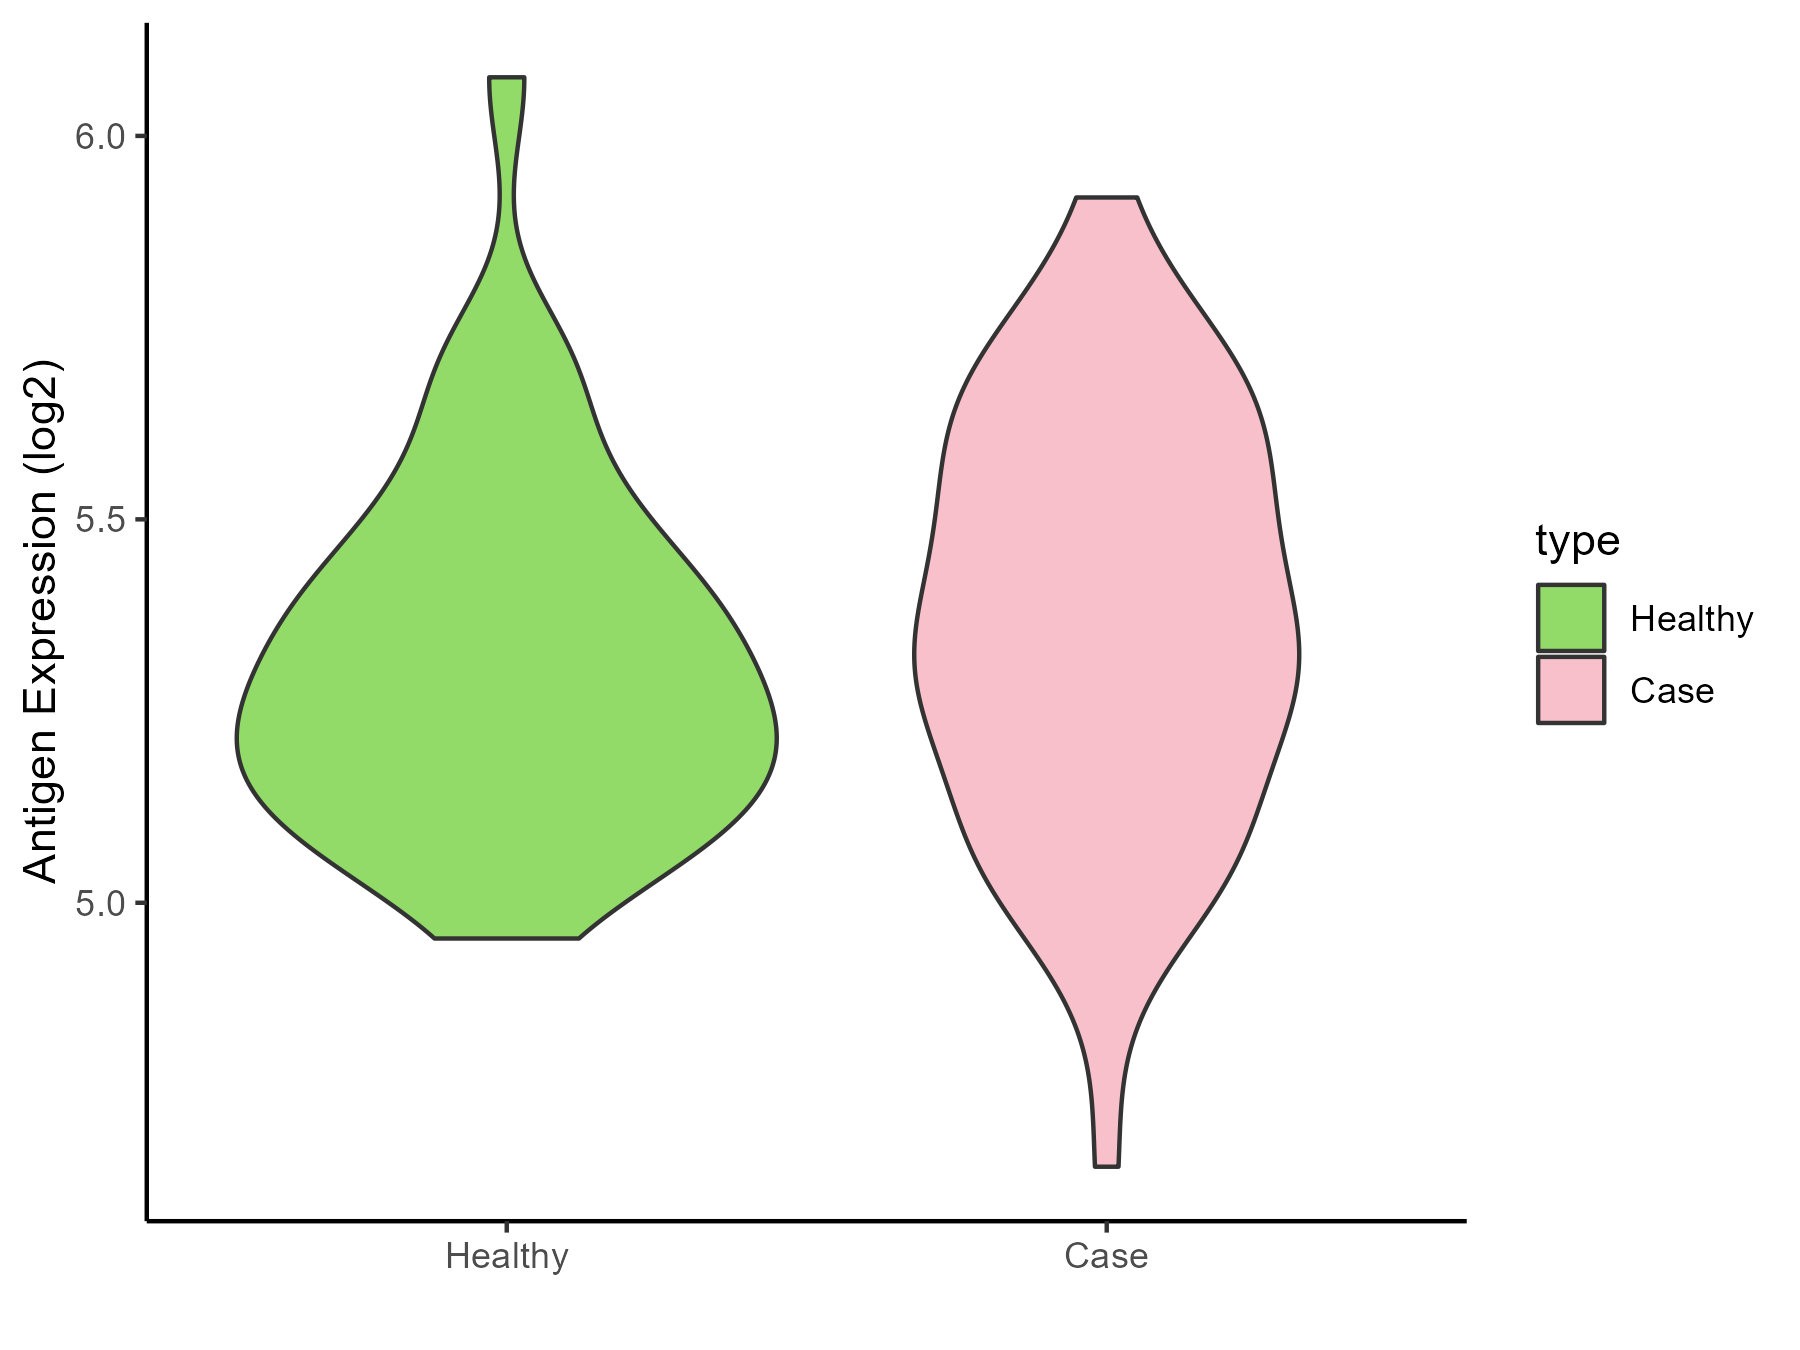
| Differential expression pattern of antigen in diseases | ||
| The Studied Tissue | Lung | |
| The Specific Disease | Chronic obstructive pulmonary disease | |
| The Expression Level of Disease Section Compare with the Healthy Individual Tissue | p-value: 0.409541783; Fold-change: 0.050739725; Z-score: 0.218964659 | |
| Disease-specific Antigen Abundances |
|
Click to View the Clearer Original Diagram |
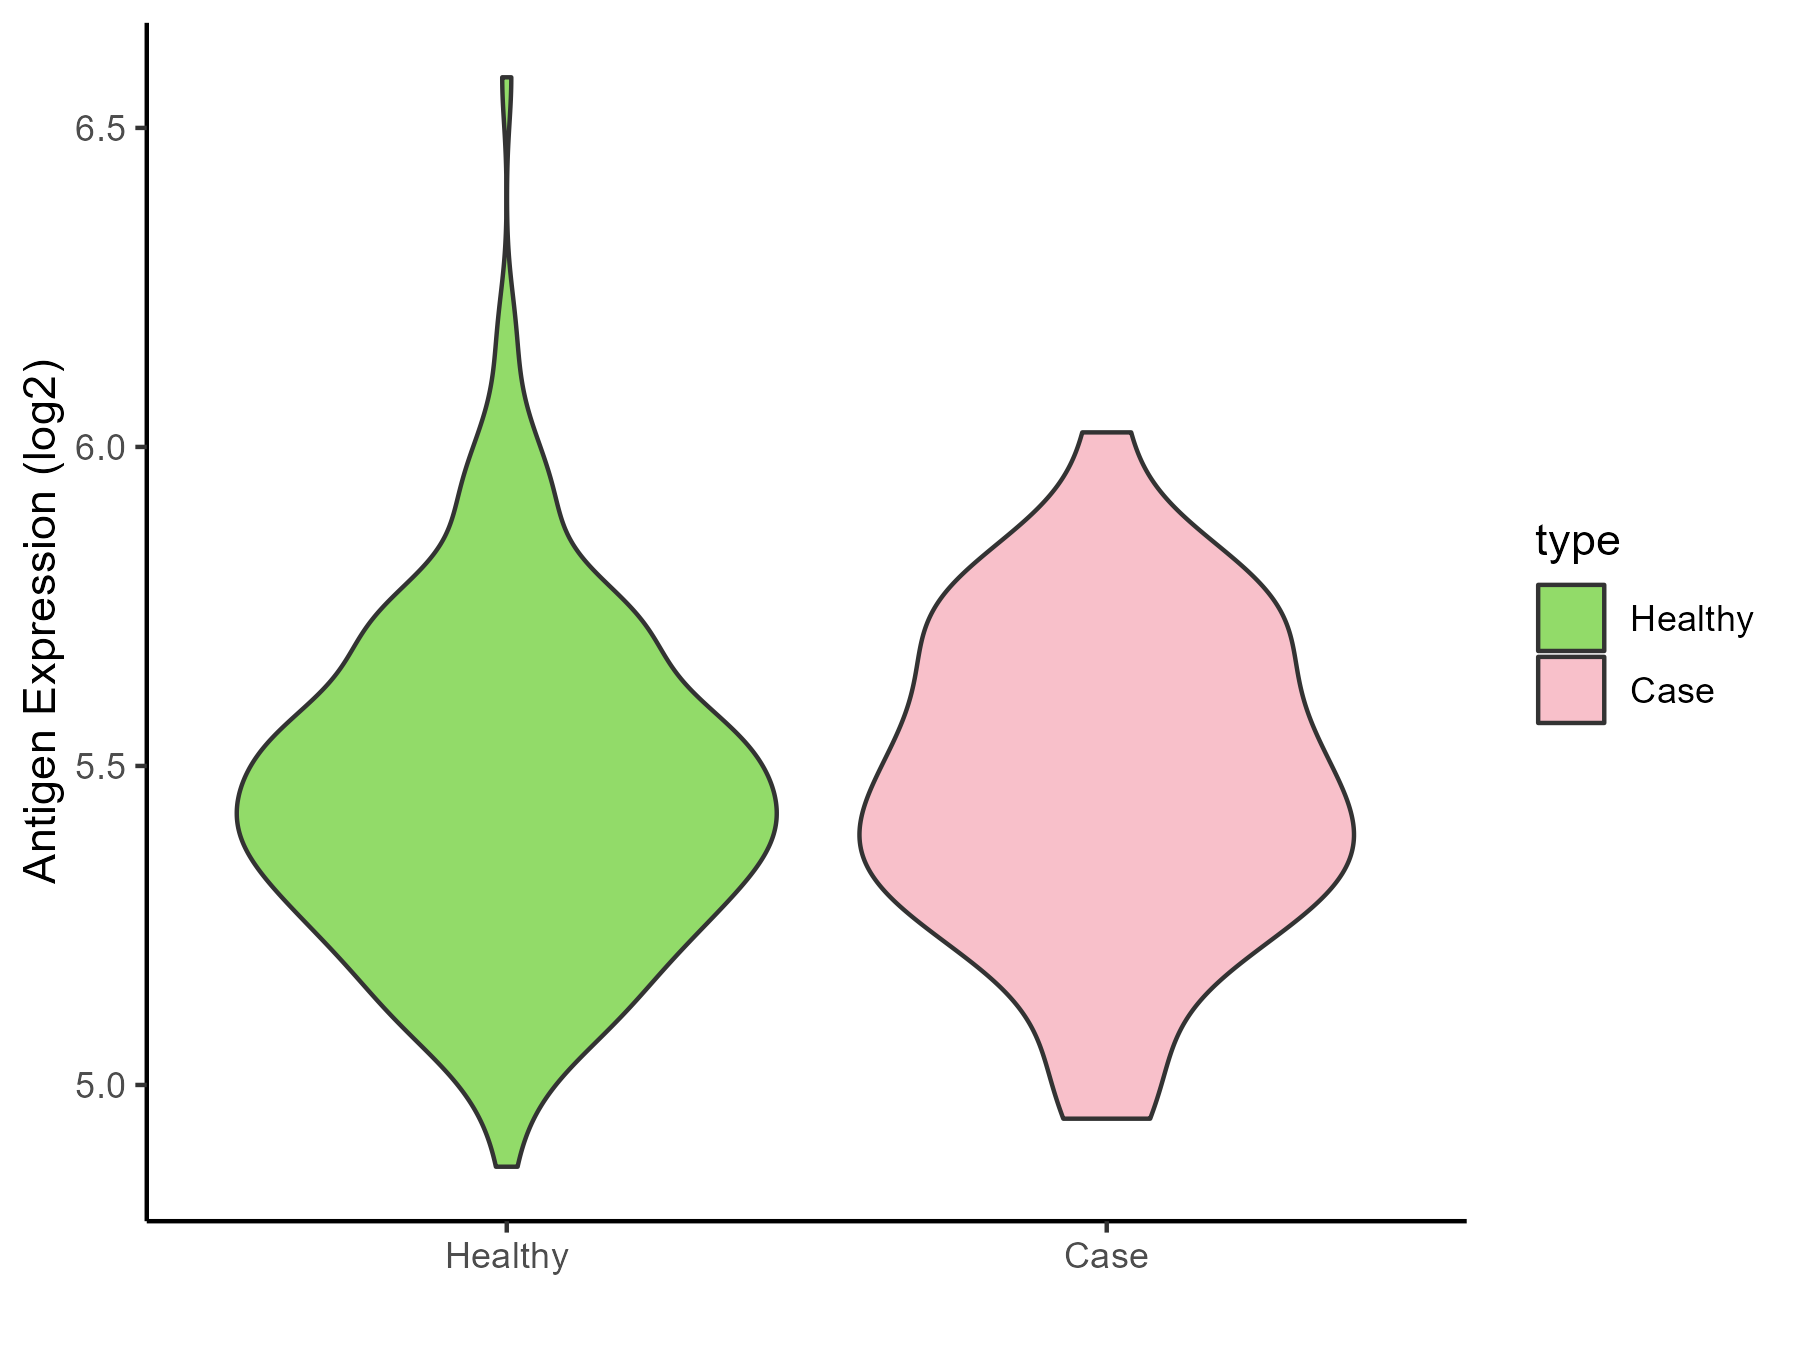
| The Studied Tissue | Small airway epithelium | |
| The Specific Disease | Chronic obstructive pulmonary disease | |
| The Expression Level of Disease Section Compare with the Healthy Individual Tissue | p-value: 0.767032605; Fold-change: 0.028340871; Z-score: 0.111104794 | |
| Disease-specific Antigen Abundances |
|
Click to View the Clearer Original Diagram |
| Differential expression pattern of antigen in diseases | ||
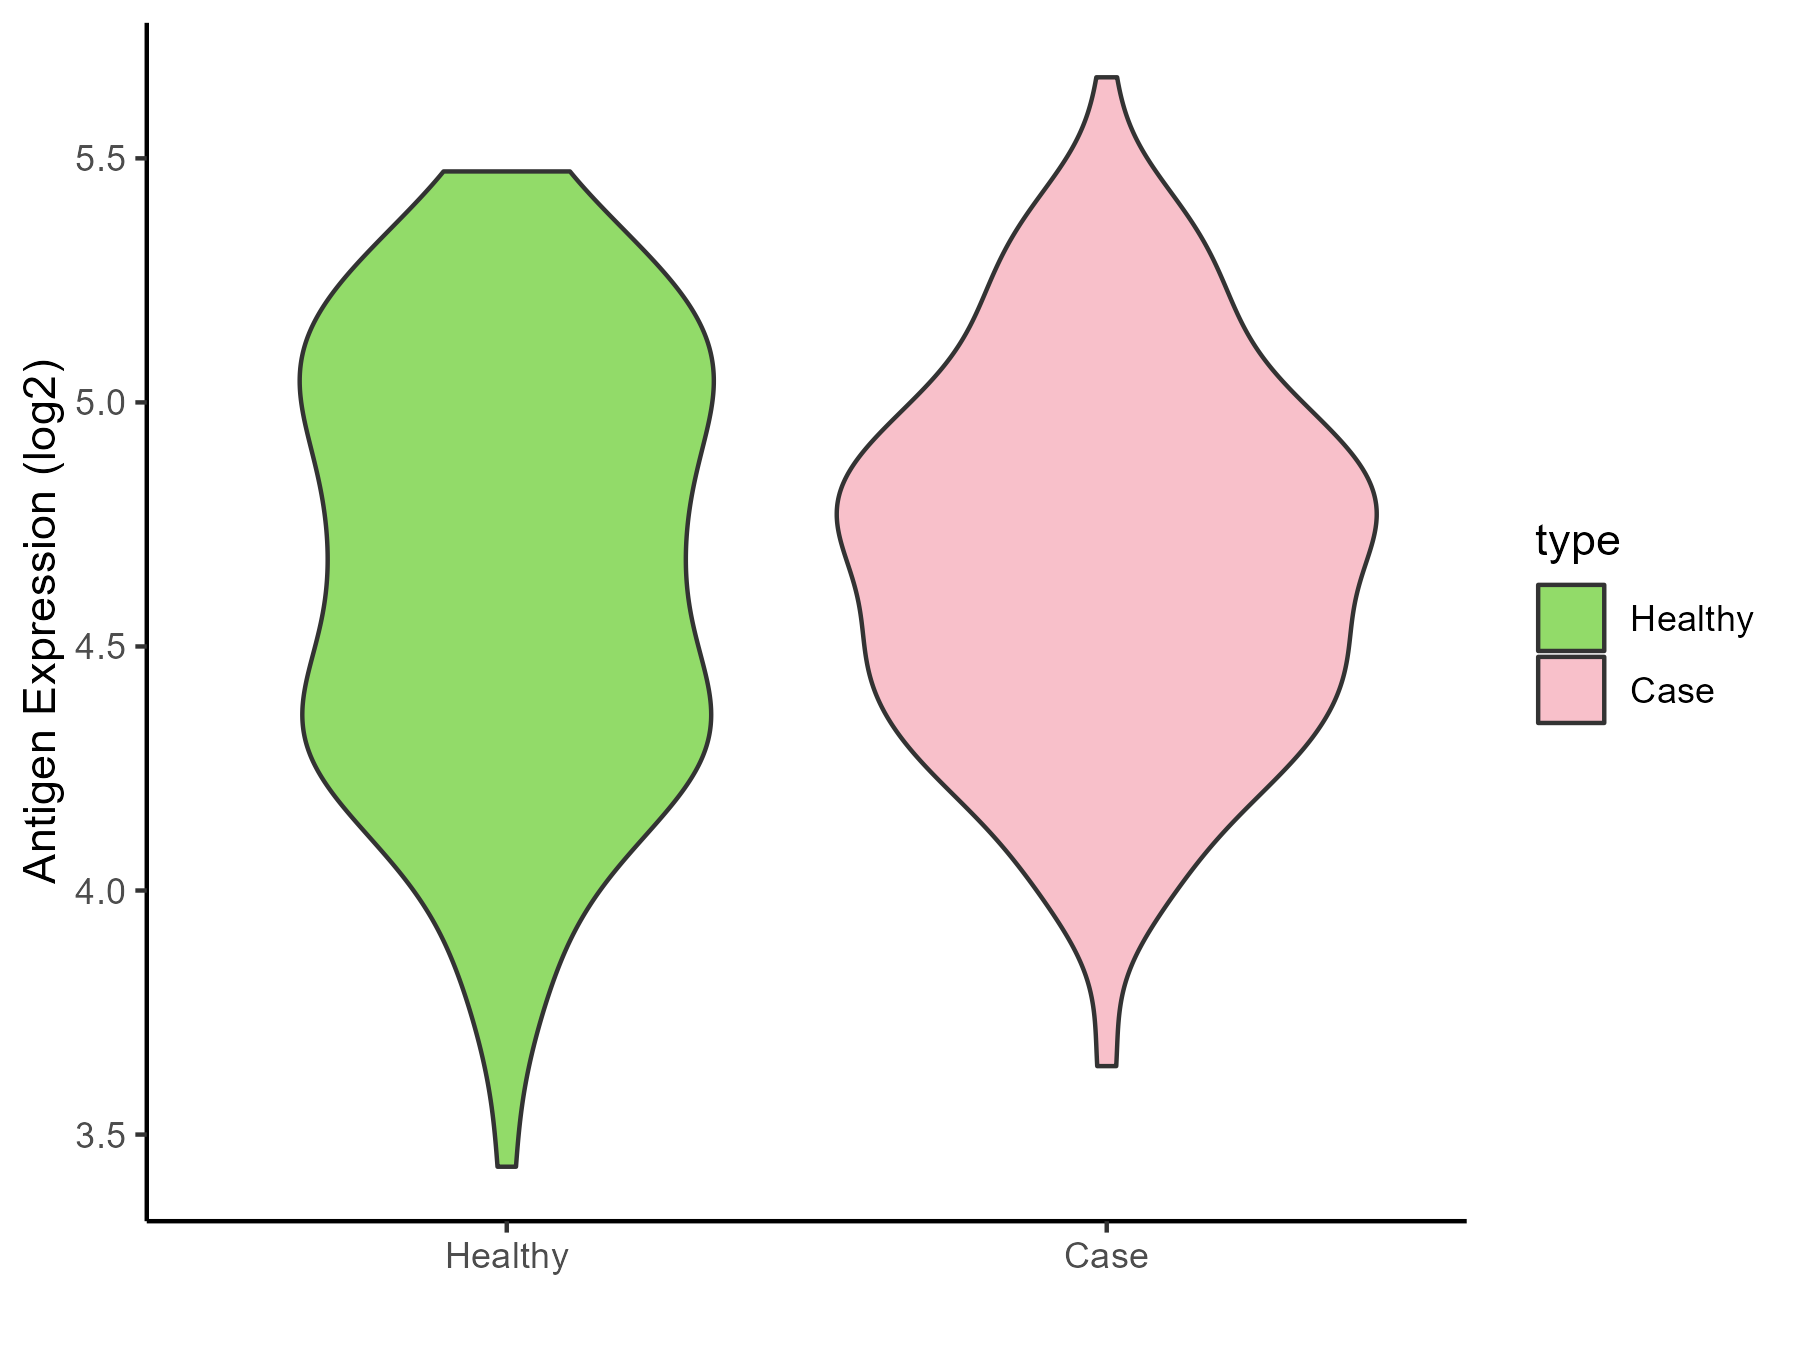
| The Studied Tissue | Nasal and bronchial airway | |
| The Specific Disease | Asthma | |
| The Expression Level of Disease Section Compare with the Healthy Individual Tissue | p-value: 0.795861964; Fold-change: 0.002555898; Z-score: 0.005682764 | |
| Disease-specific Antigen Abundances |
|
Click to View the Clearer Original Diagram |
| Differential expression pattern of antigen in diseases | ||
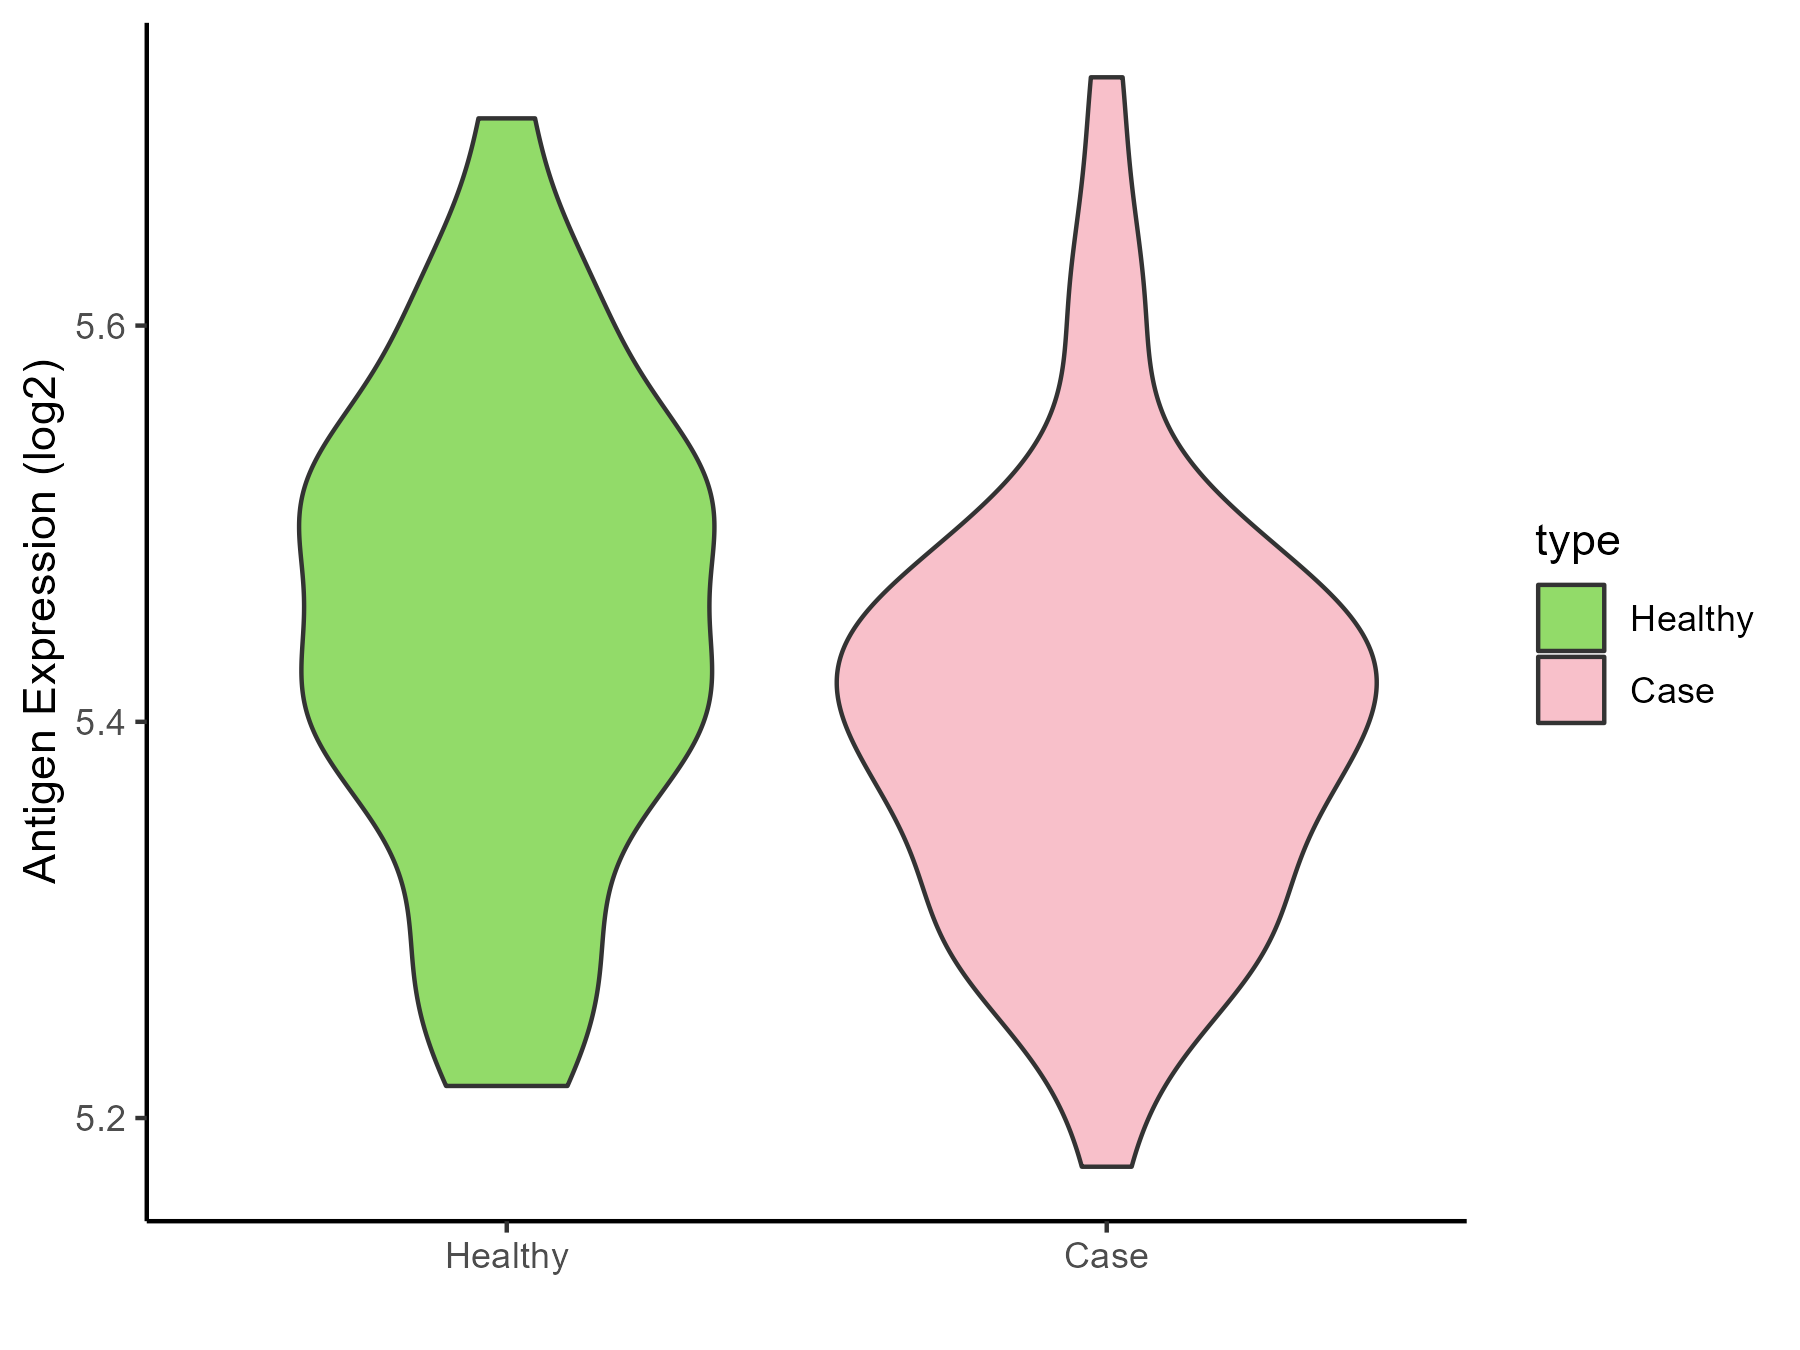
| The Studied Tissue | Nasal Epithelium | |
| The Specific Disease | Human rhinovirus infection | |
| The Expression Level of Disease Section Compare with the Healthy Individual Tissue | p-value: 0.088629293; Fold-change: -0.034489322; Z-score: -0.287586504 | |
| Disease-specific Antigen Abundances |
|
Click to View the Clearer Original Diagram |
| Differential expression pattern of antigen in diseases | ||
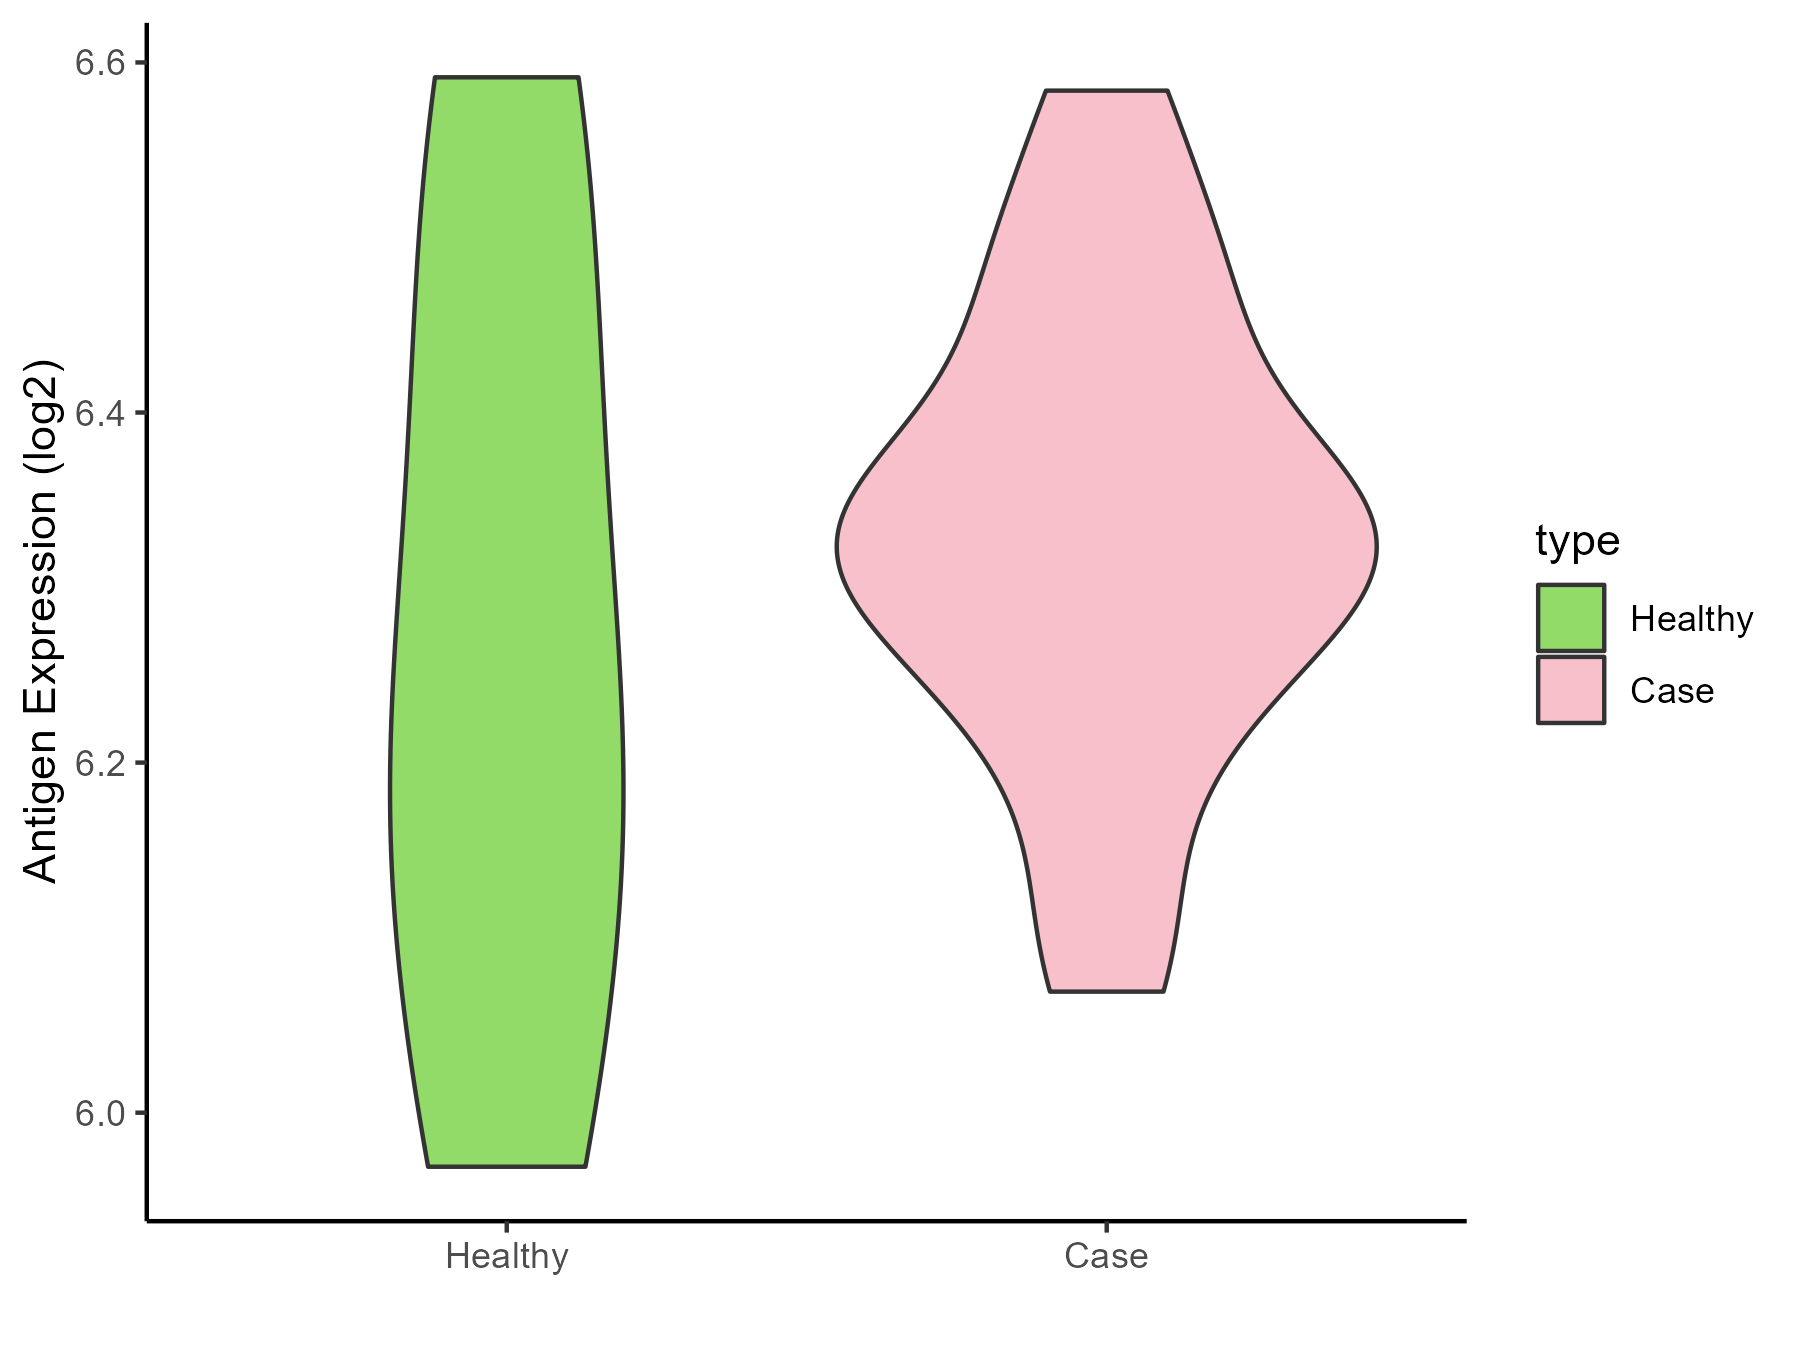
| The Studied Tissue | Lung | |
| The Specific Disease | Idiopathic pulmonary fibrosis | |
| The Expression Level of Disease Section Compare with the Healthy Individual Tissue | p-value: 0.60504086; Fold-change: 0.099644237; Z-score: 0.411523952 | |
| Disease-specific Antigen Abundances |
|
Click to View the Clearer Original Diagram |
ICD Disease Classification 13
| Differential expression pattern of antigen in diseases | ||
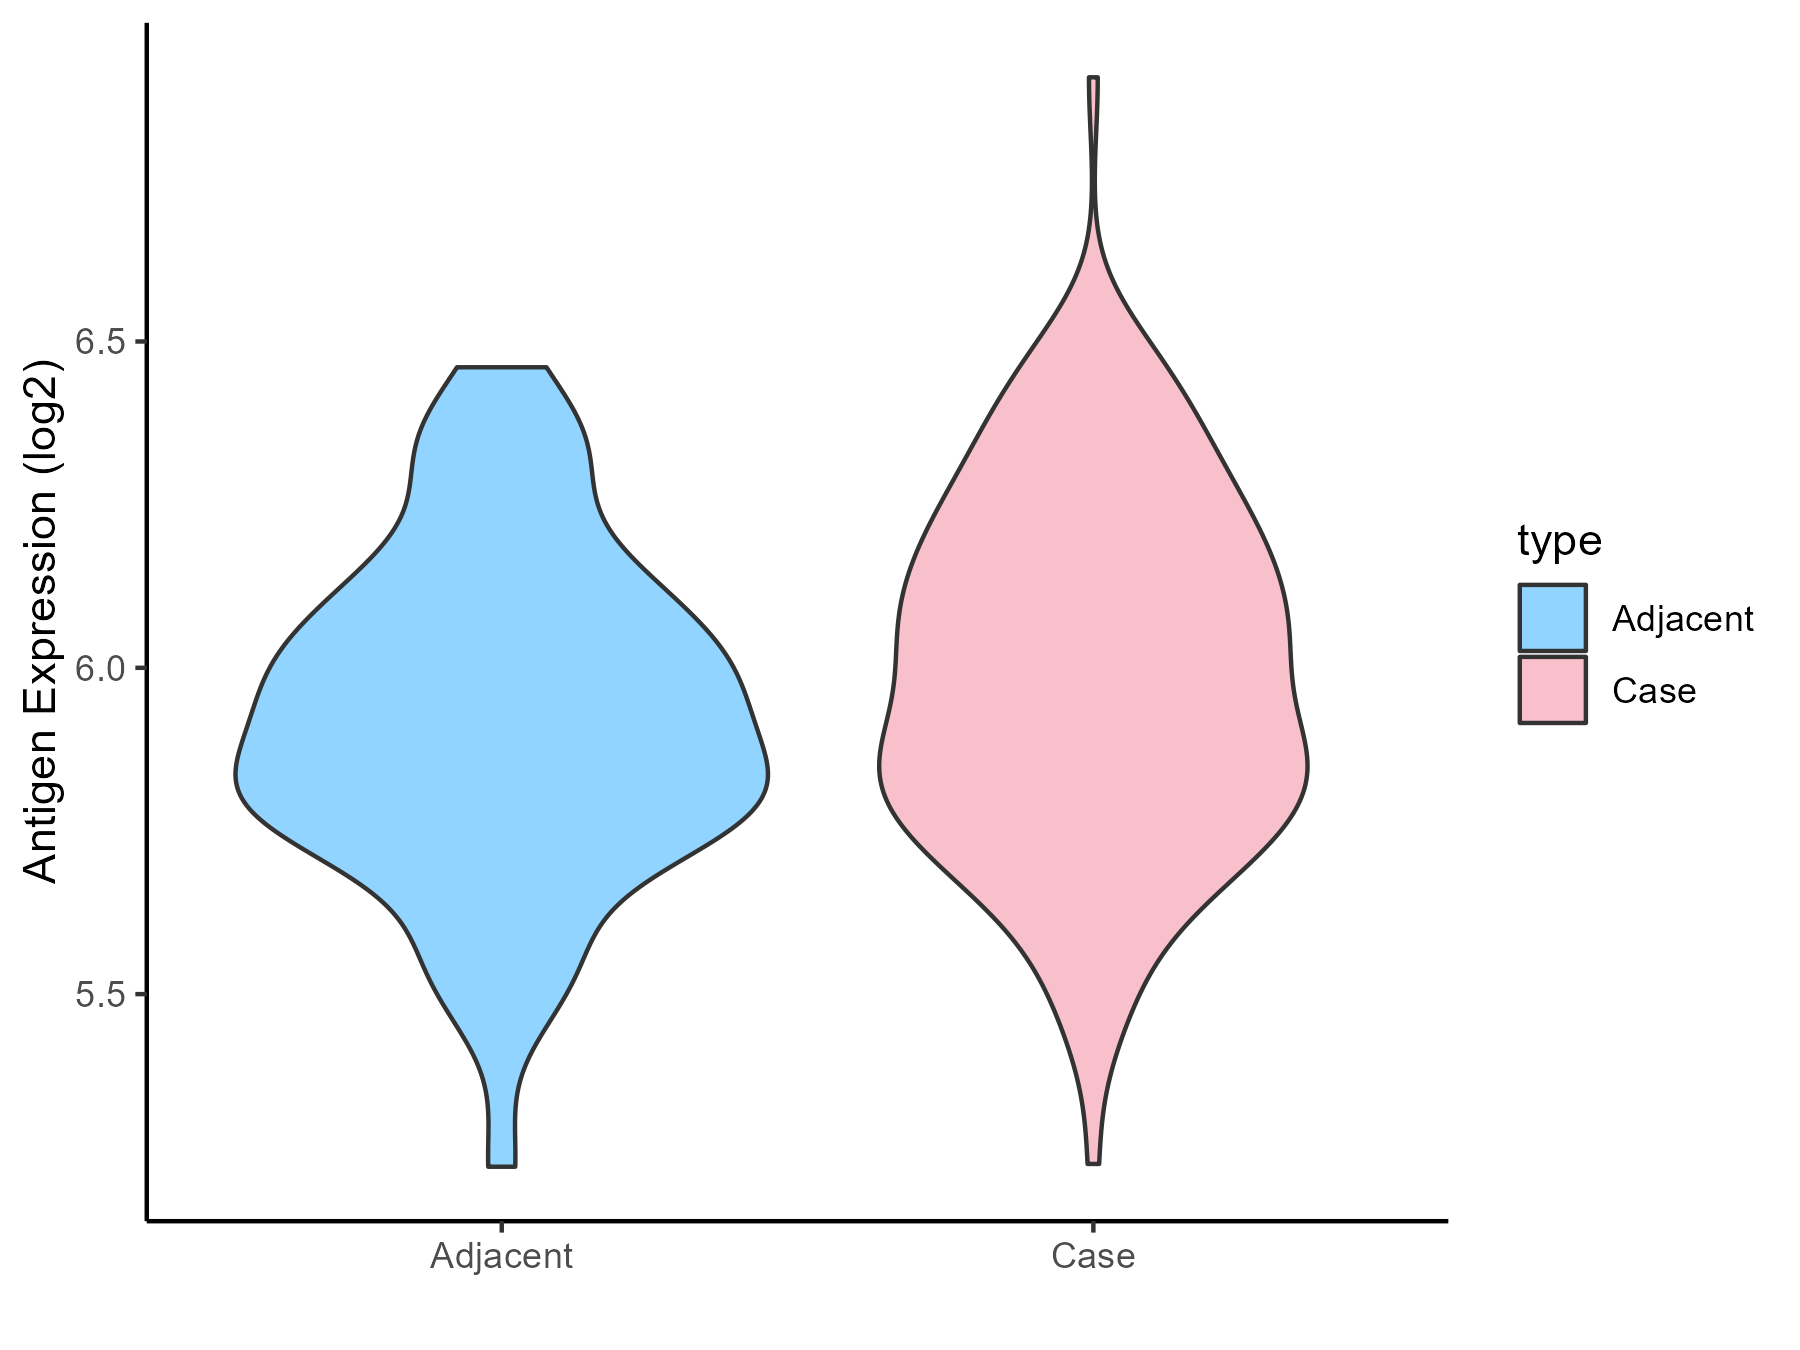
| The Studied Tissue | Gingival | |
| The Specific Disease | Periodontal disease | |
| The Expression Level of Disease Section Compare with the Adjacent Tissue | p-value: 0.070482259; Fold-change: 0.07488174; Z-score: 0.298820148 | |
| Disease-specific Antigen Abundances |
|
Click to View the Clearer Original Diagram |
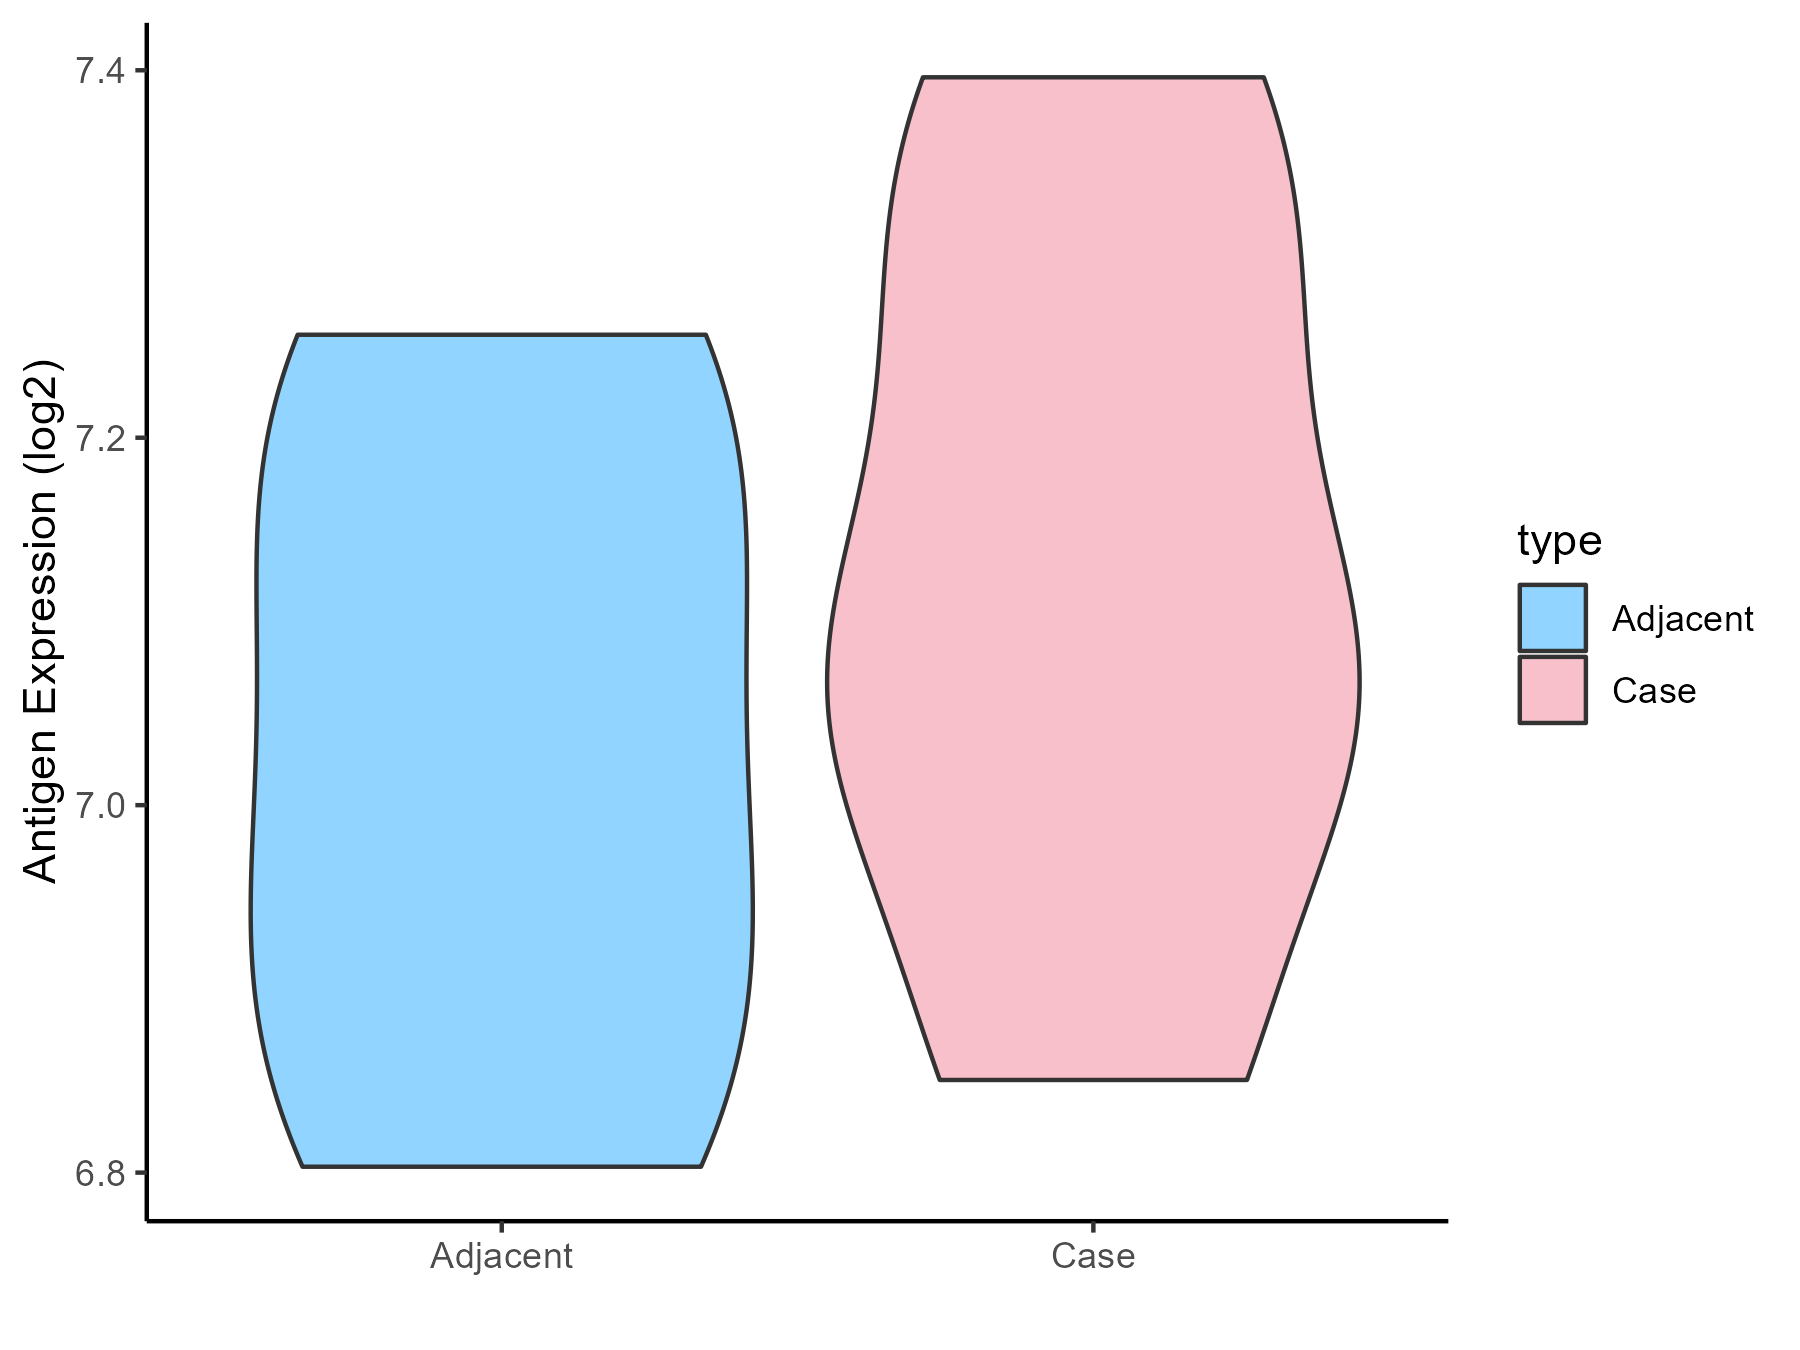
| Differential expression pattern of antigen in diseases | ||
| The Studied Tissue | Gastric antrum | |
| The Specific Disease | Eosinophilic gastritis | |
| The Expression Level of Disease Section Compare with the Adjacent Tissue | p-value: 0.480346298; Fold-change: 0.058298935; Z-score: 0.30941682 | |
| Disease-specific Antigen Abundances |
|
Click to View the Clearer Original Diagram |
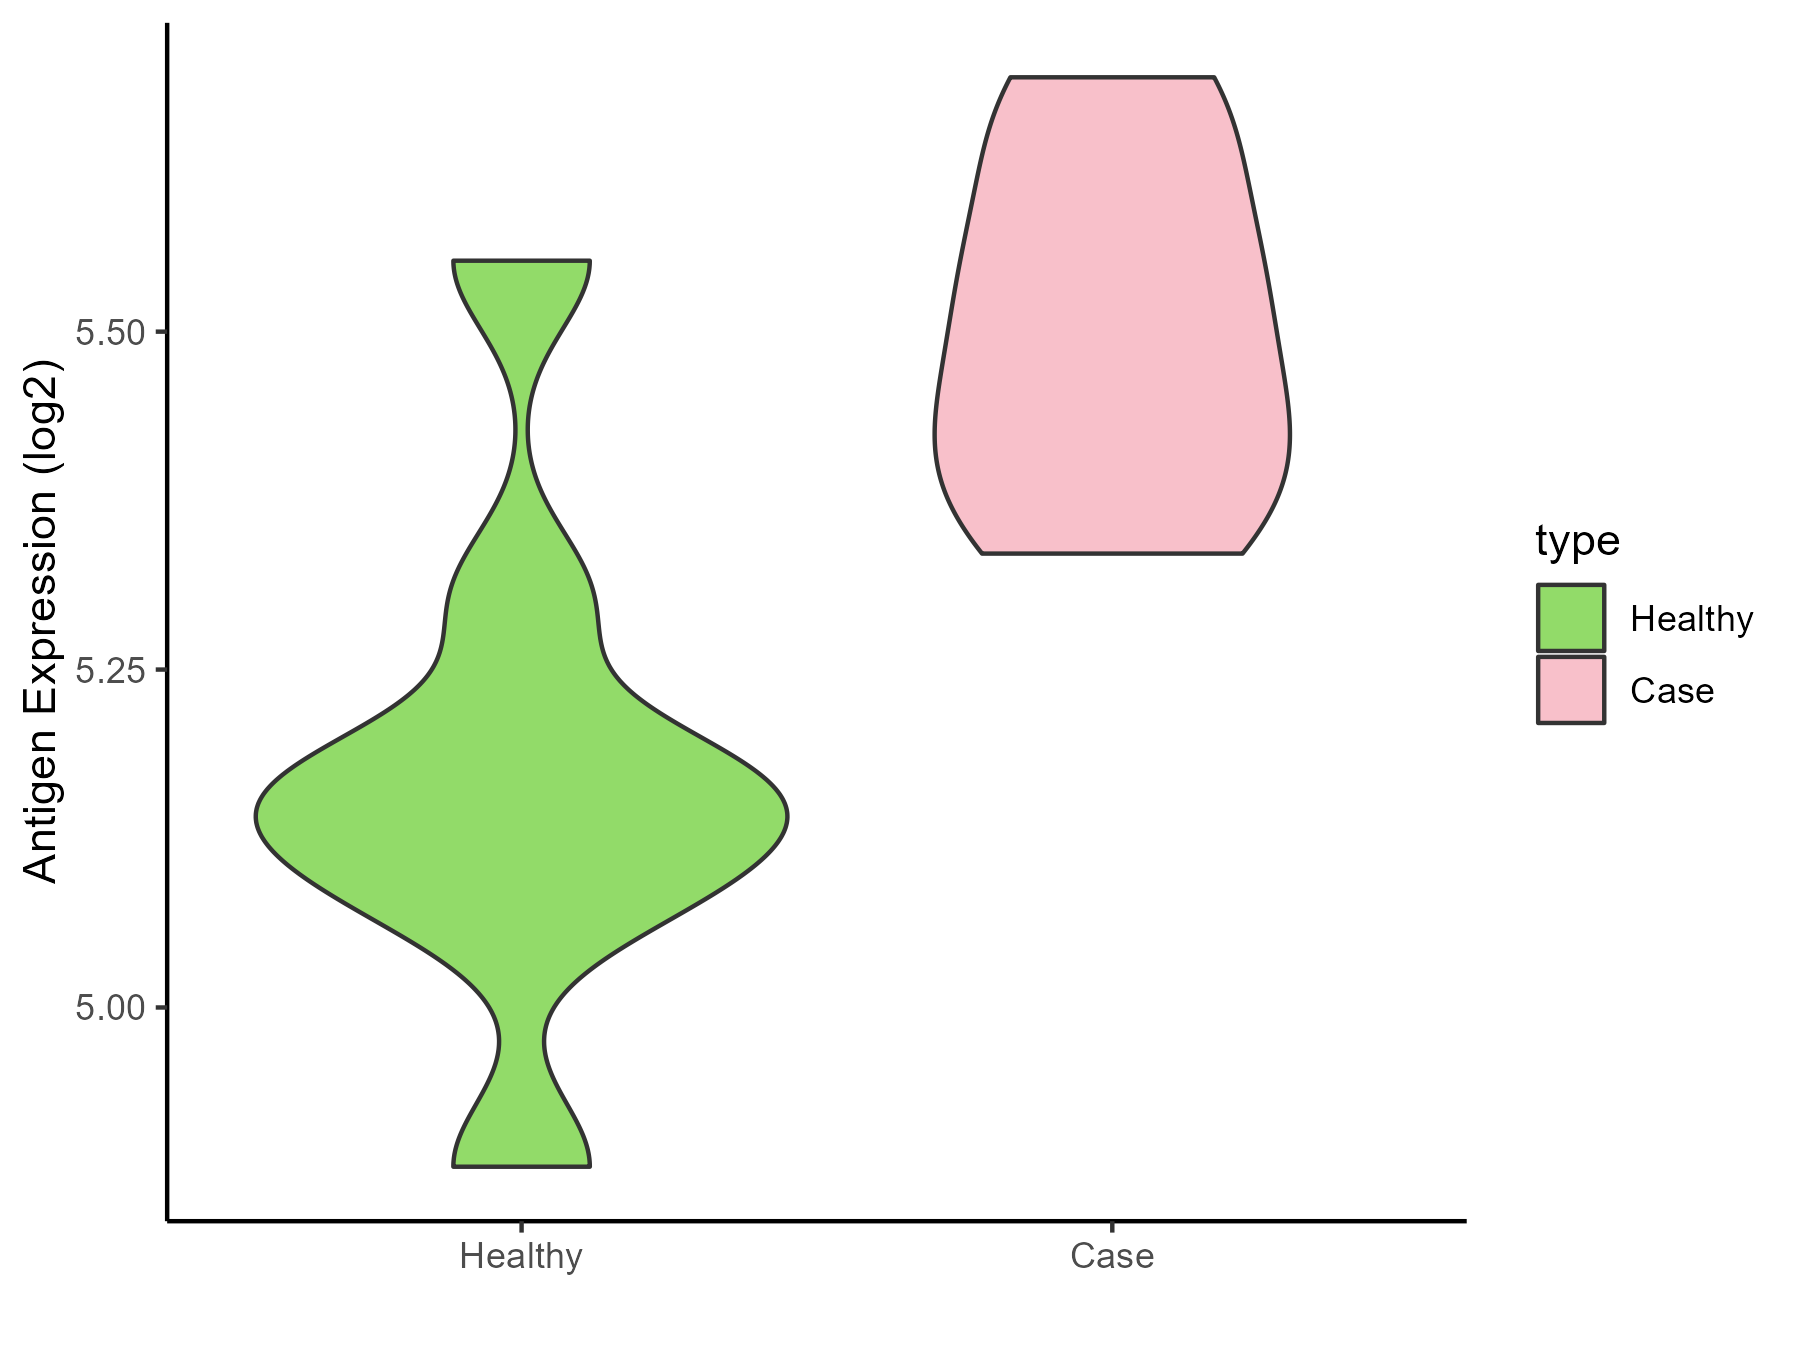
| Differential expression pattern of antigen in diseases | ||
| The Studied Tissue | Liver | |
| The Specific Disease | Liver failure | |
| The Expression Level of Disease Section Compare with the Healthy Individual Tissue | p-value: 0.001852066; Fold-change: 0.33489599; Z-score: 1.740436348 | |
| Disease-specific Antigen Abundances |
|
Click to View the Clearer Original Diagram |
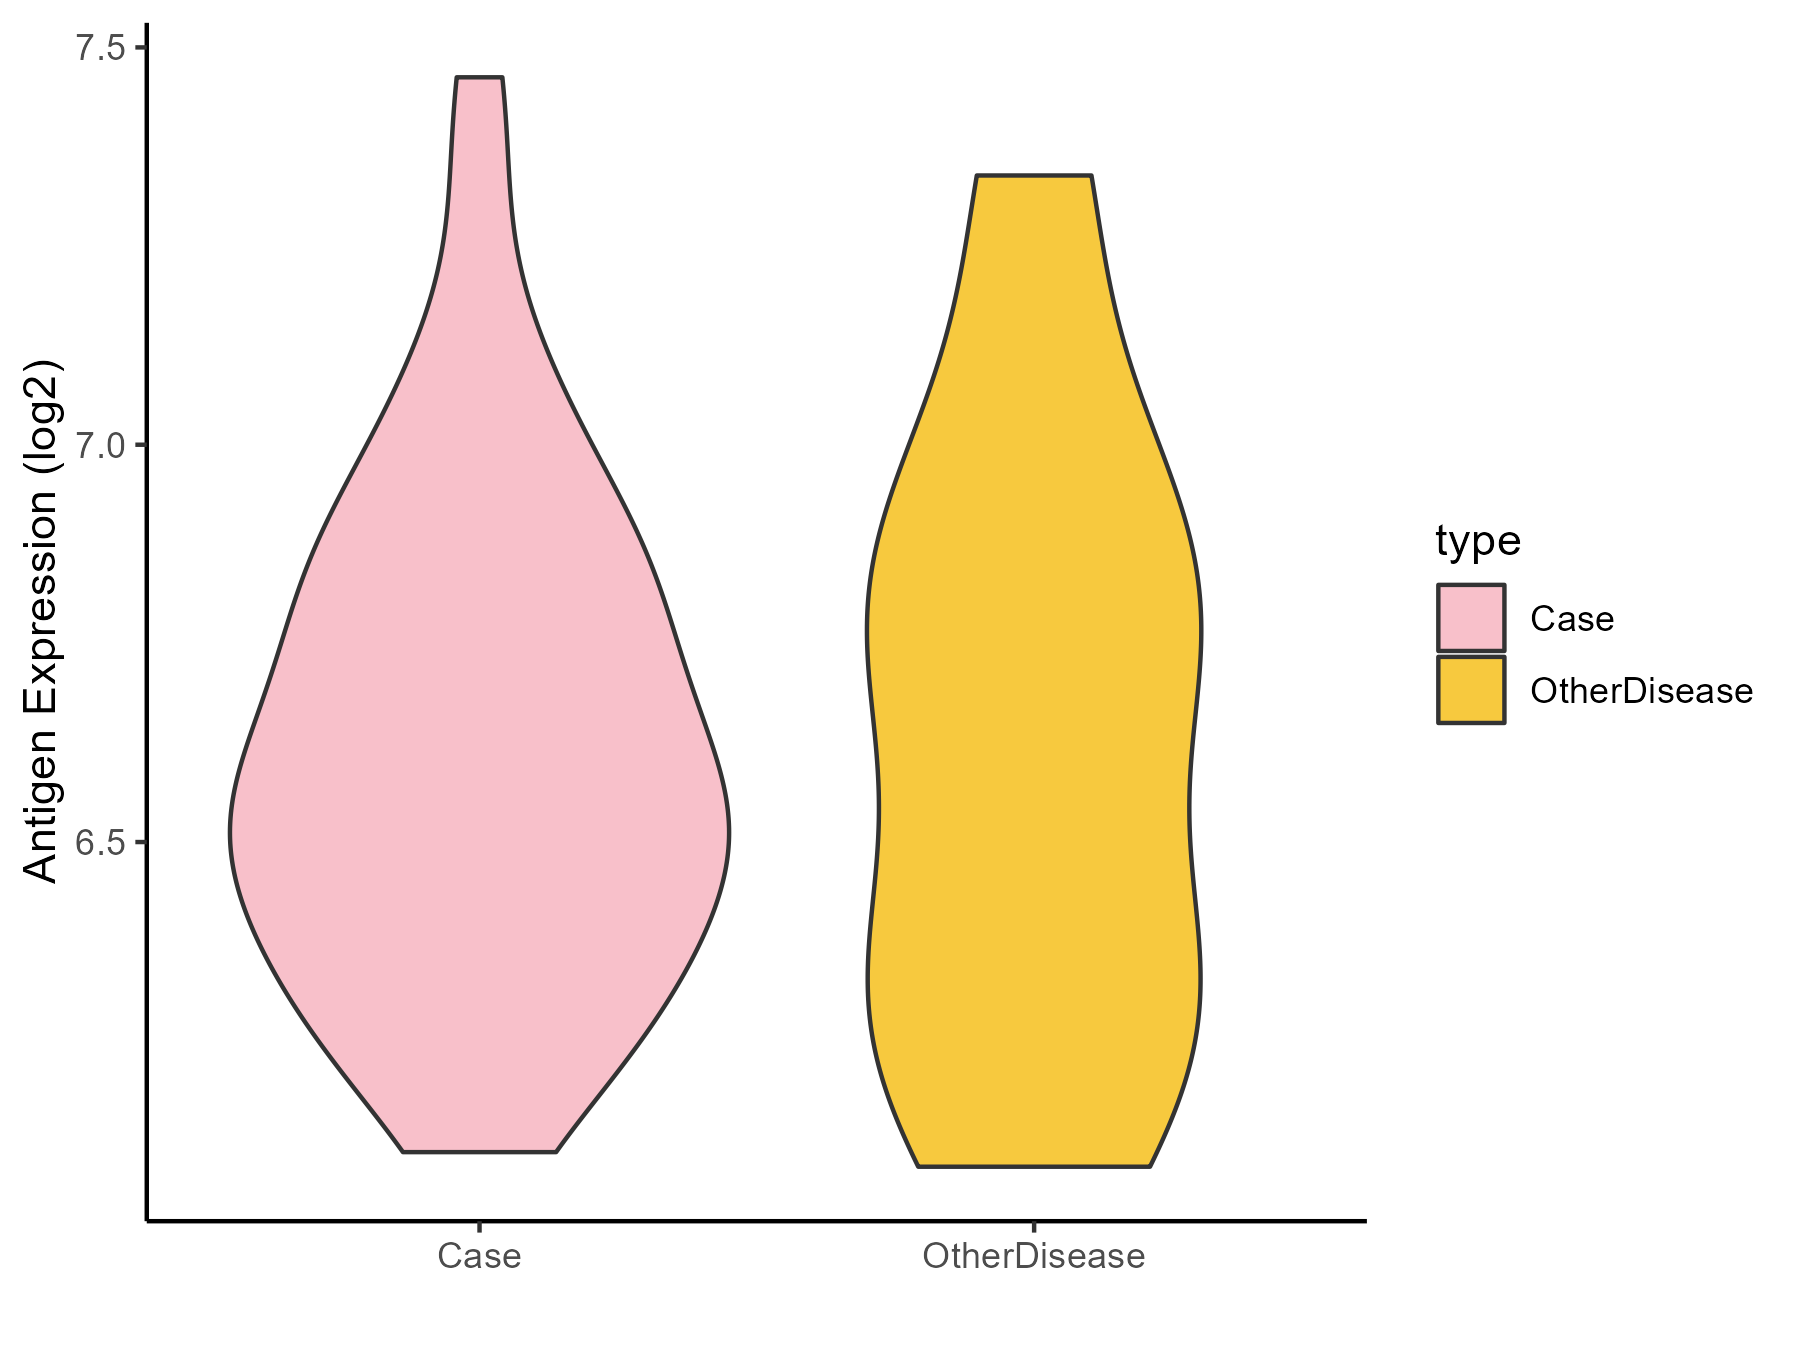
| Differential expression pattern of antigen in diseases | ||
| The Studied Tissue | Colon mucosal | |
| The Specific Disease | Ulcerative colitis | |
| The Expression Level of Disease Section Compare with the Adjacent Tissue | p-value: 0.963667829; Fold-change: -0.113519788; Z-score: -0.294394302 | |
| Disease-specific Antigen Abundances |
|
Click to View the Clearer Original Diagram |
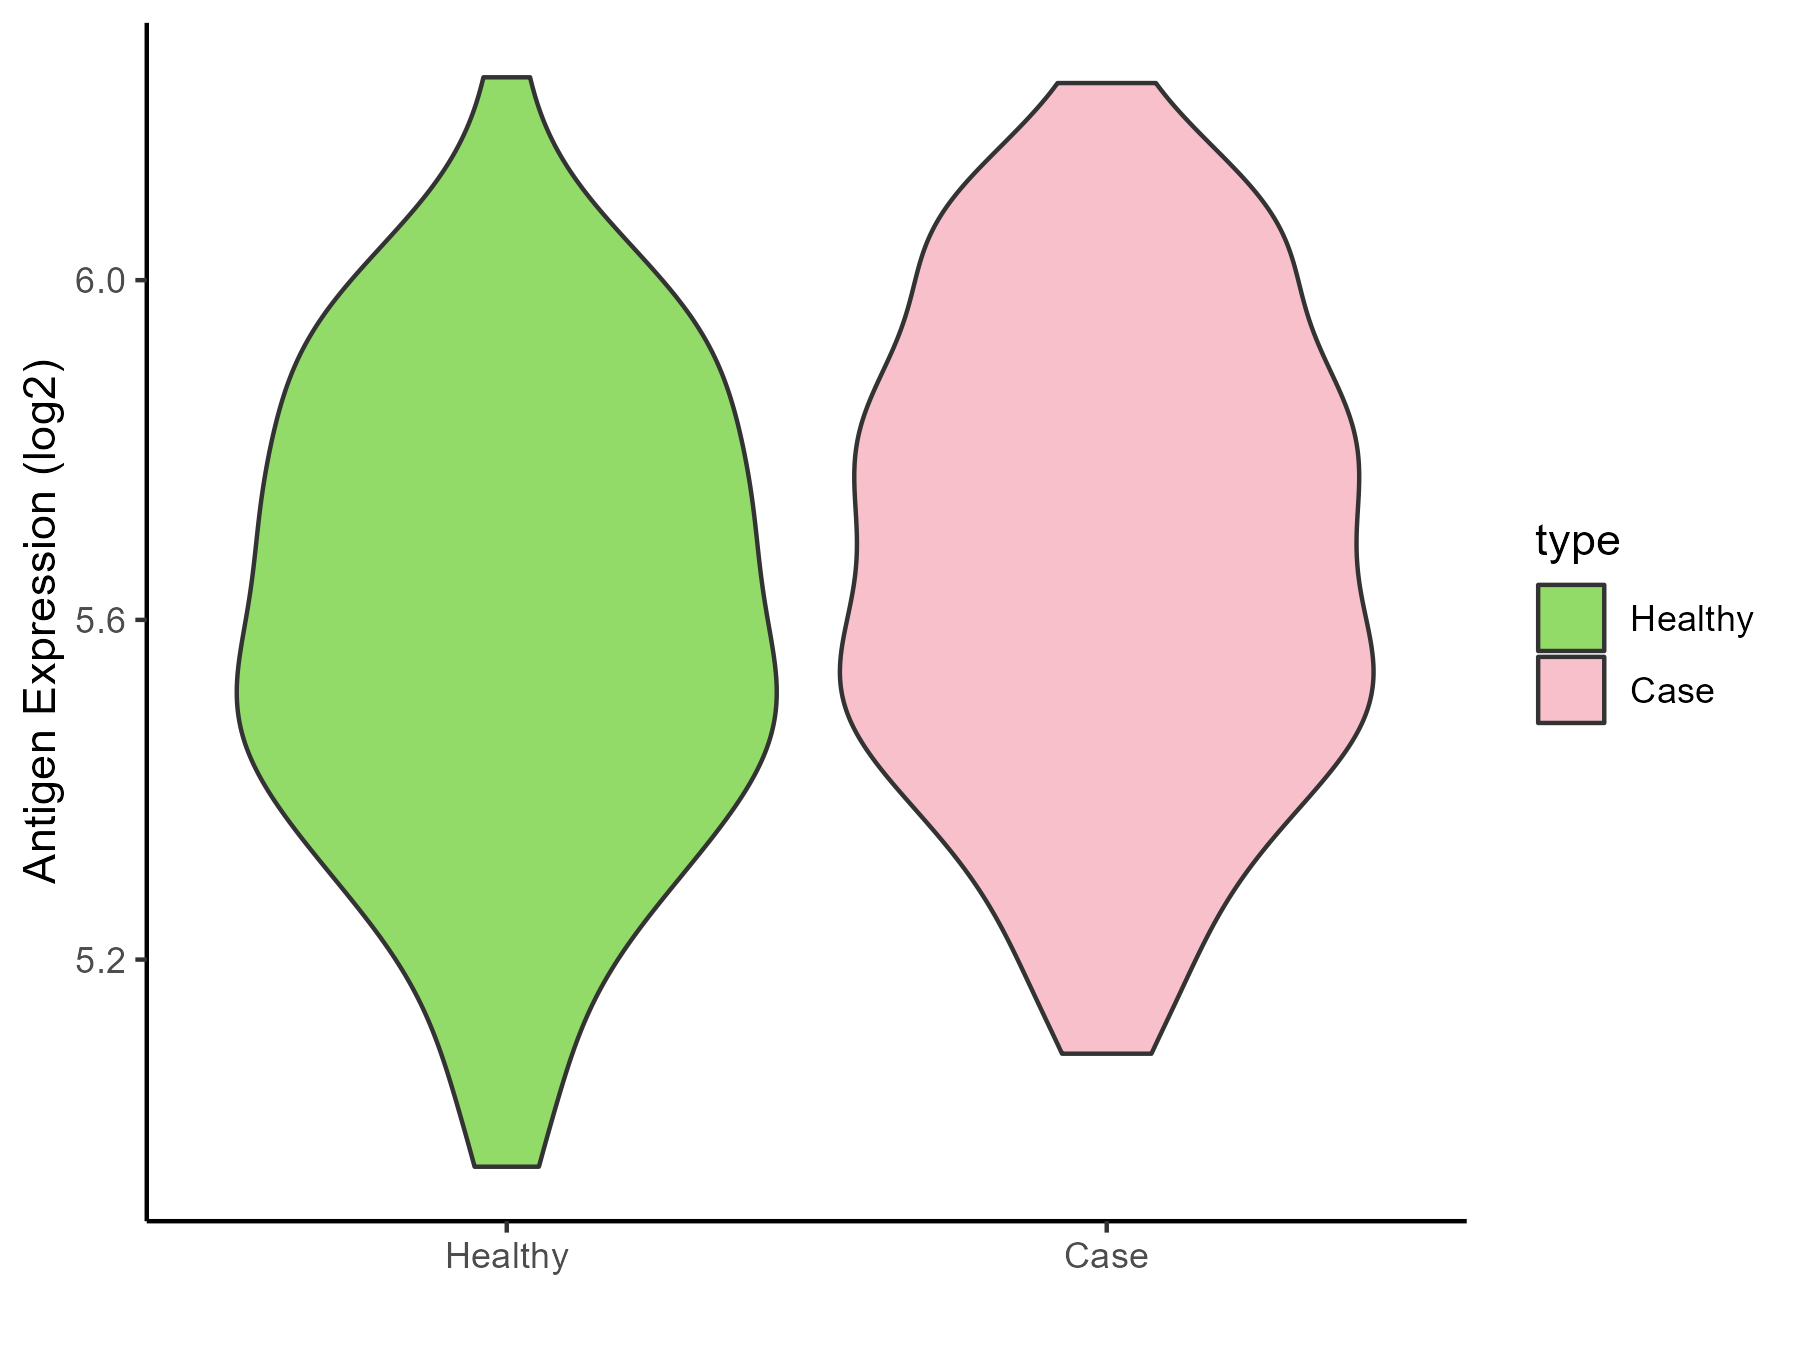
| Differential expression pattern of antigen in diseases | ||
| The Studied Tissue | Rectal colon | |
| The Specific Disease | Irritable bowel syndrome | |
| The Expression Level of Disease Section Compare with the Healthy Individual Tissue | p-value: 0.103869384; Fold-change: 0.077656683; Z-score: 0.280209193 | |
| Disease-specific Antigen Abundances |
|
Click to View the Clearer Original Diagram |
ICD Disease Classification 14
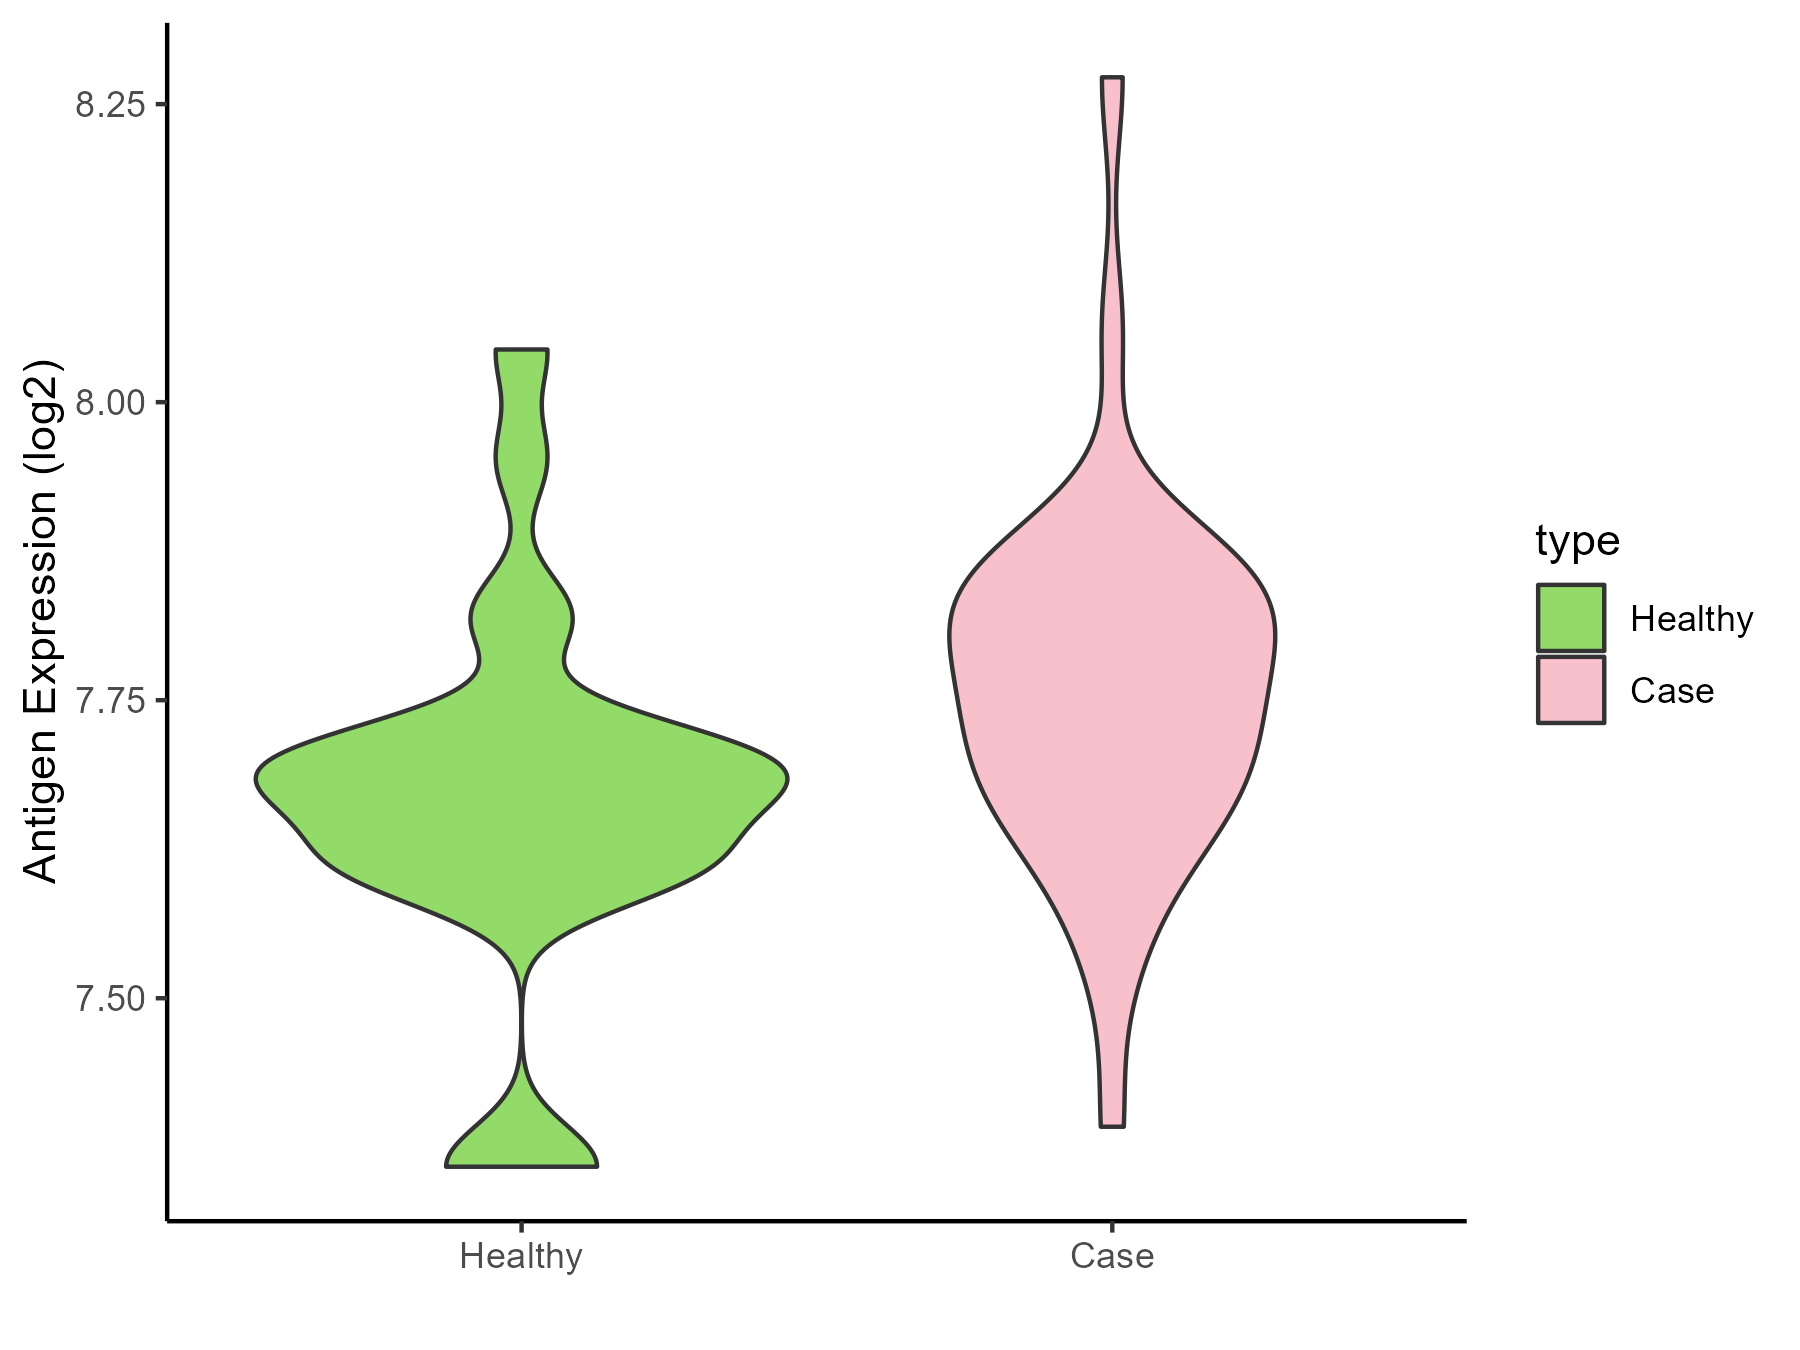
| Differential expression pattern of antigen in diseases | ||
| The Studied Tissue | Skin | |
| The Specific Disease | Atopic dermatitis | |
| The Expression Level of Disease Section Compare with the Healthy Individual Tissue | p-value: 0.021453807; Fold-change: 0.079287502; Z-score: 0.507291874 | |
| Disease-specific Antigen Abundances |
|
Click to View the Clearer Original Diagram |
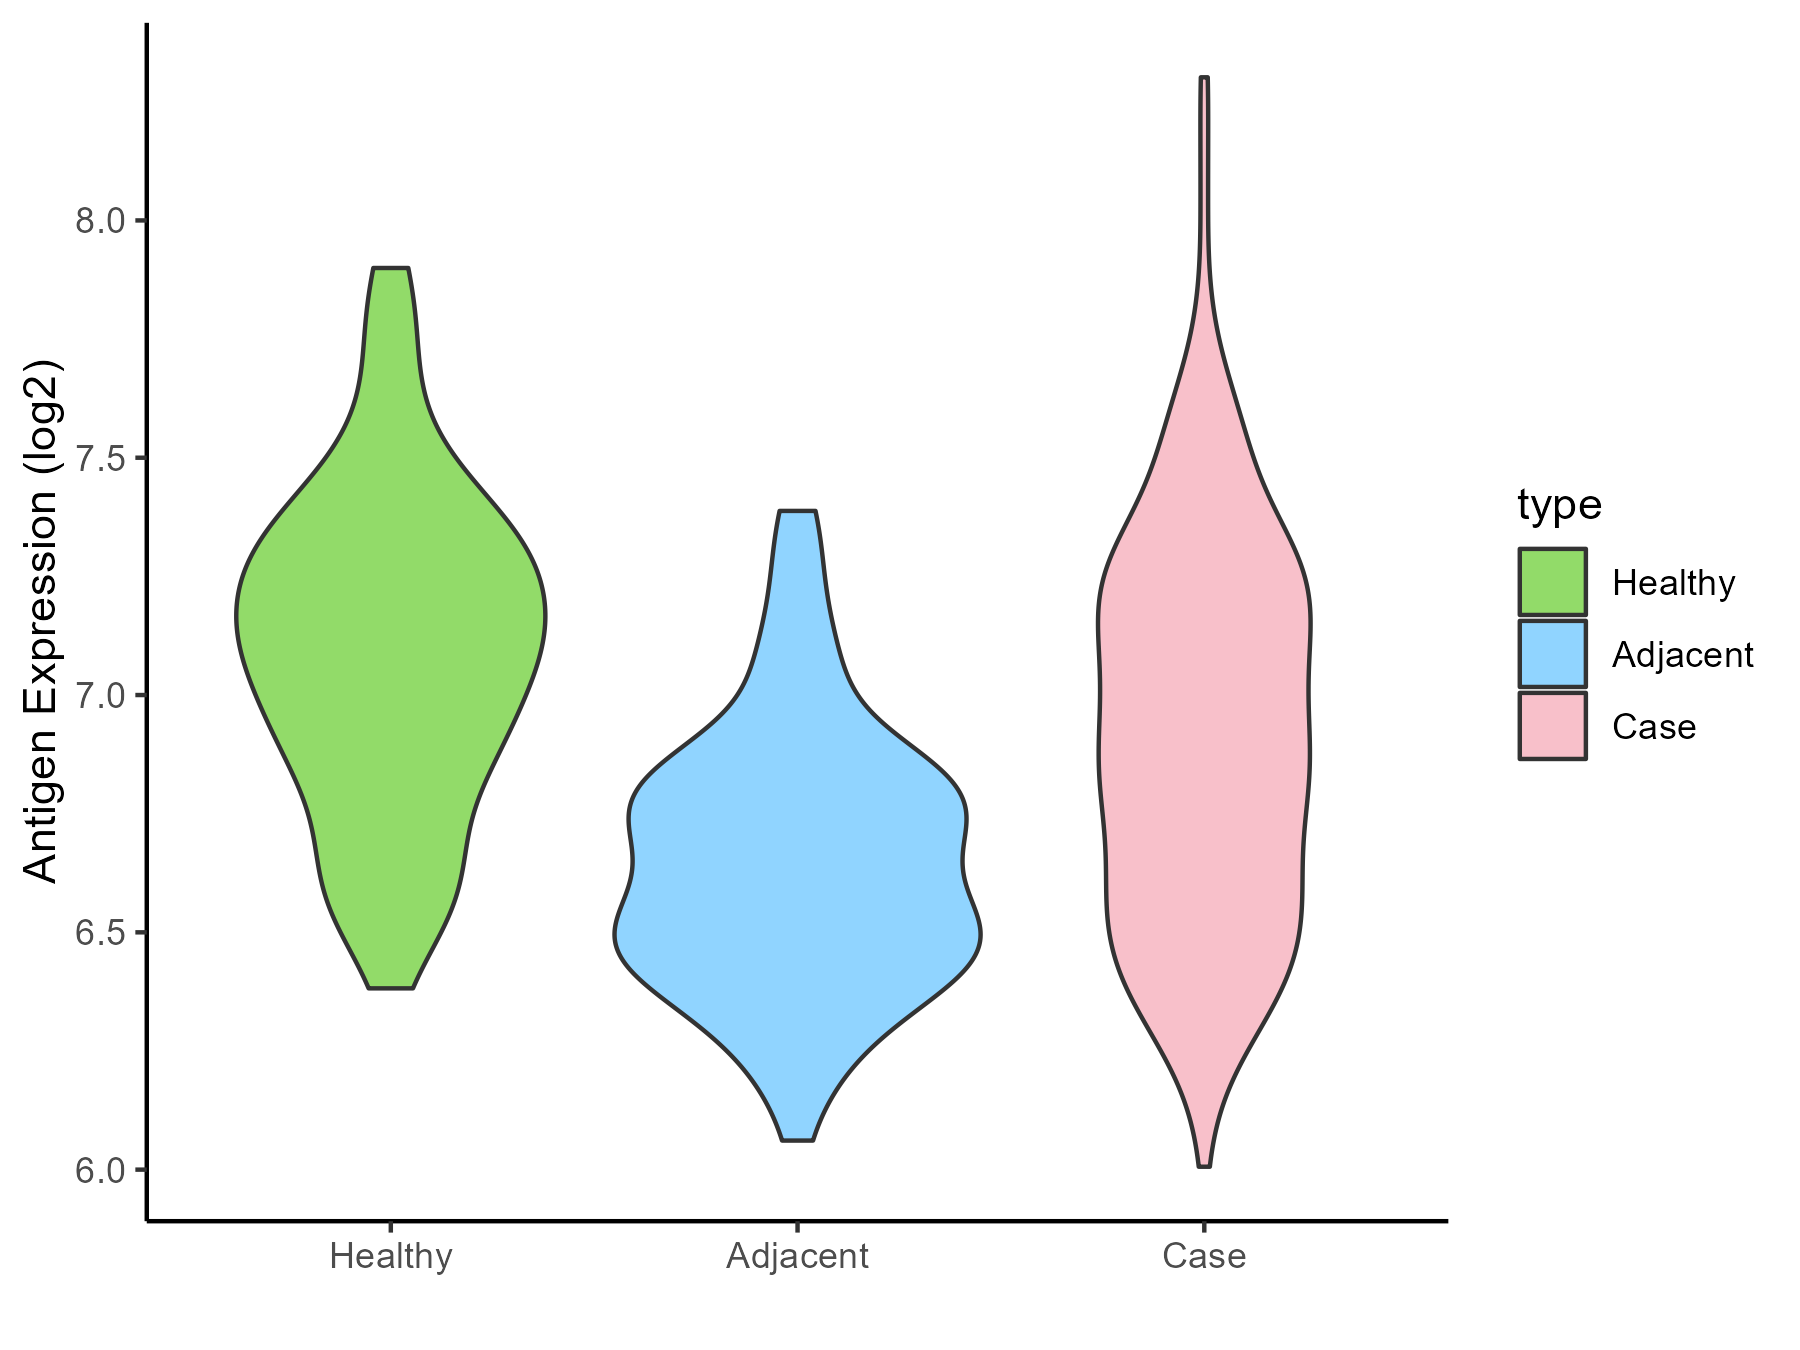
| Differential expression pattern of antigen in diseases | ||
| The Studied Tissue | Skin | |
| The Specific Disease | Psoriasis | |
| The Expression Level of Disease Section Compare with the Healthy Individual Tissue | p-value: 0.00010361; Fold-change: -0.211266628; Z-score: -0.635077201 | |
| The Expression Level of Disease Section Compare with the Adjacent Tissue | p-value: 2.76E-11; Fold-change: 0.261318071; Z-score: 0.957371094 | |
| Disease-specific Antigen Abundances |
|
Click to View the Clearer Original Diagram |
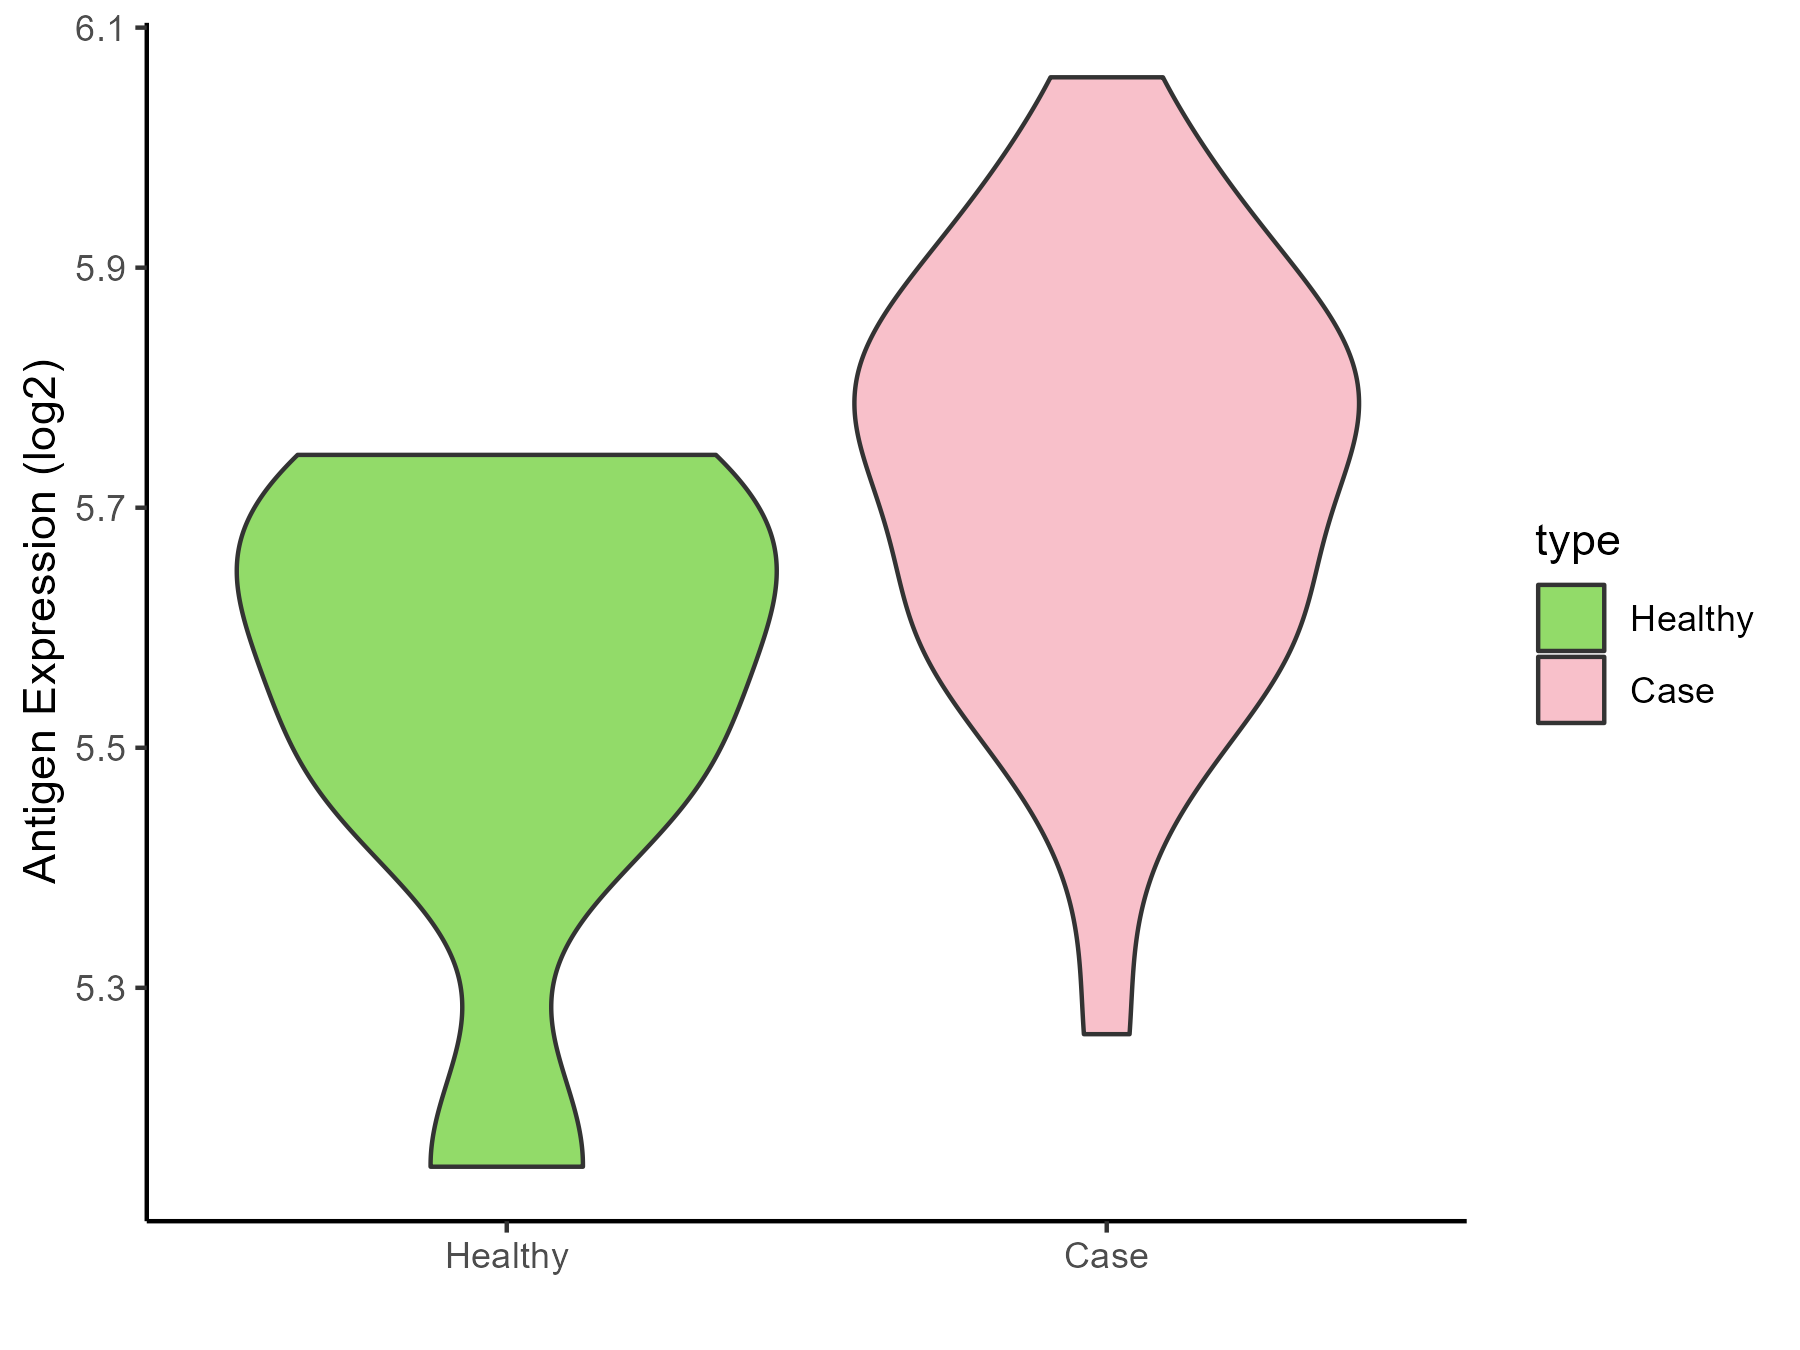
| Differential expression pattern of antigen in diseases | ||
| The Studied Tissue | Skin | |
| The Specific Disease | Vitiligo | |
| The Expression Level of Disease Section Compare with the Healthy Individual Tissue | p-value: 0.055980964; Fold-change: 0.131180695; Z-score: 0.648904886 | |
| Disease-specific Antigen Abundances |
|
Click to View the Clearer Original Diagram |
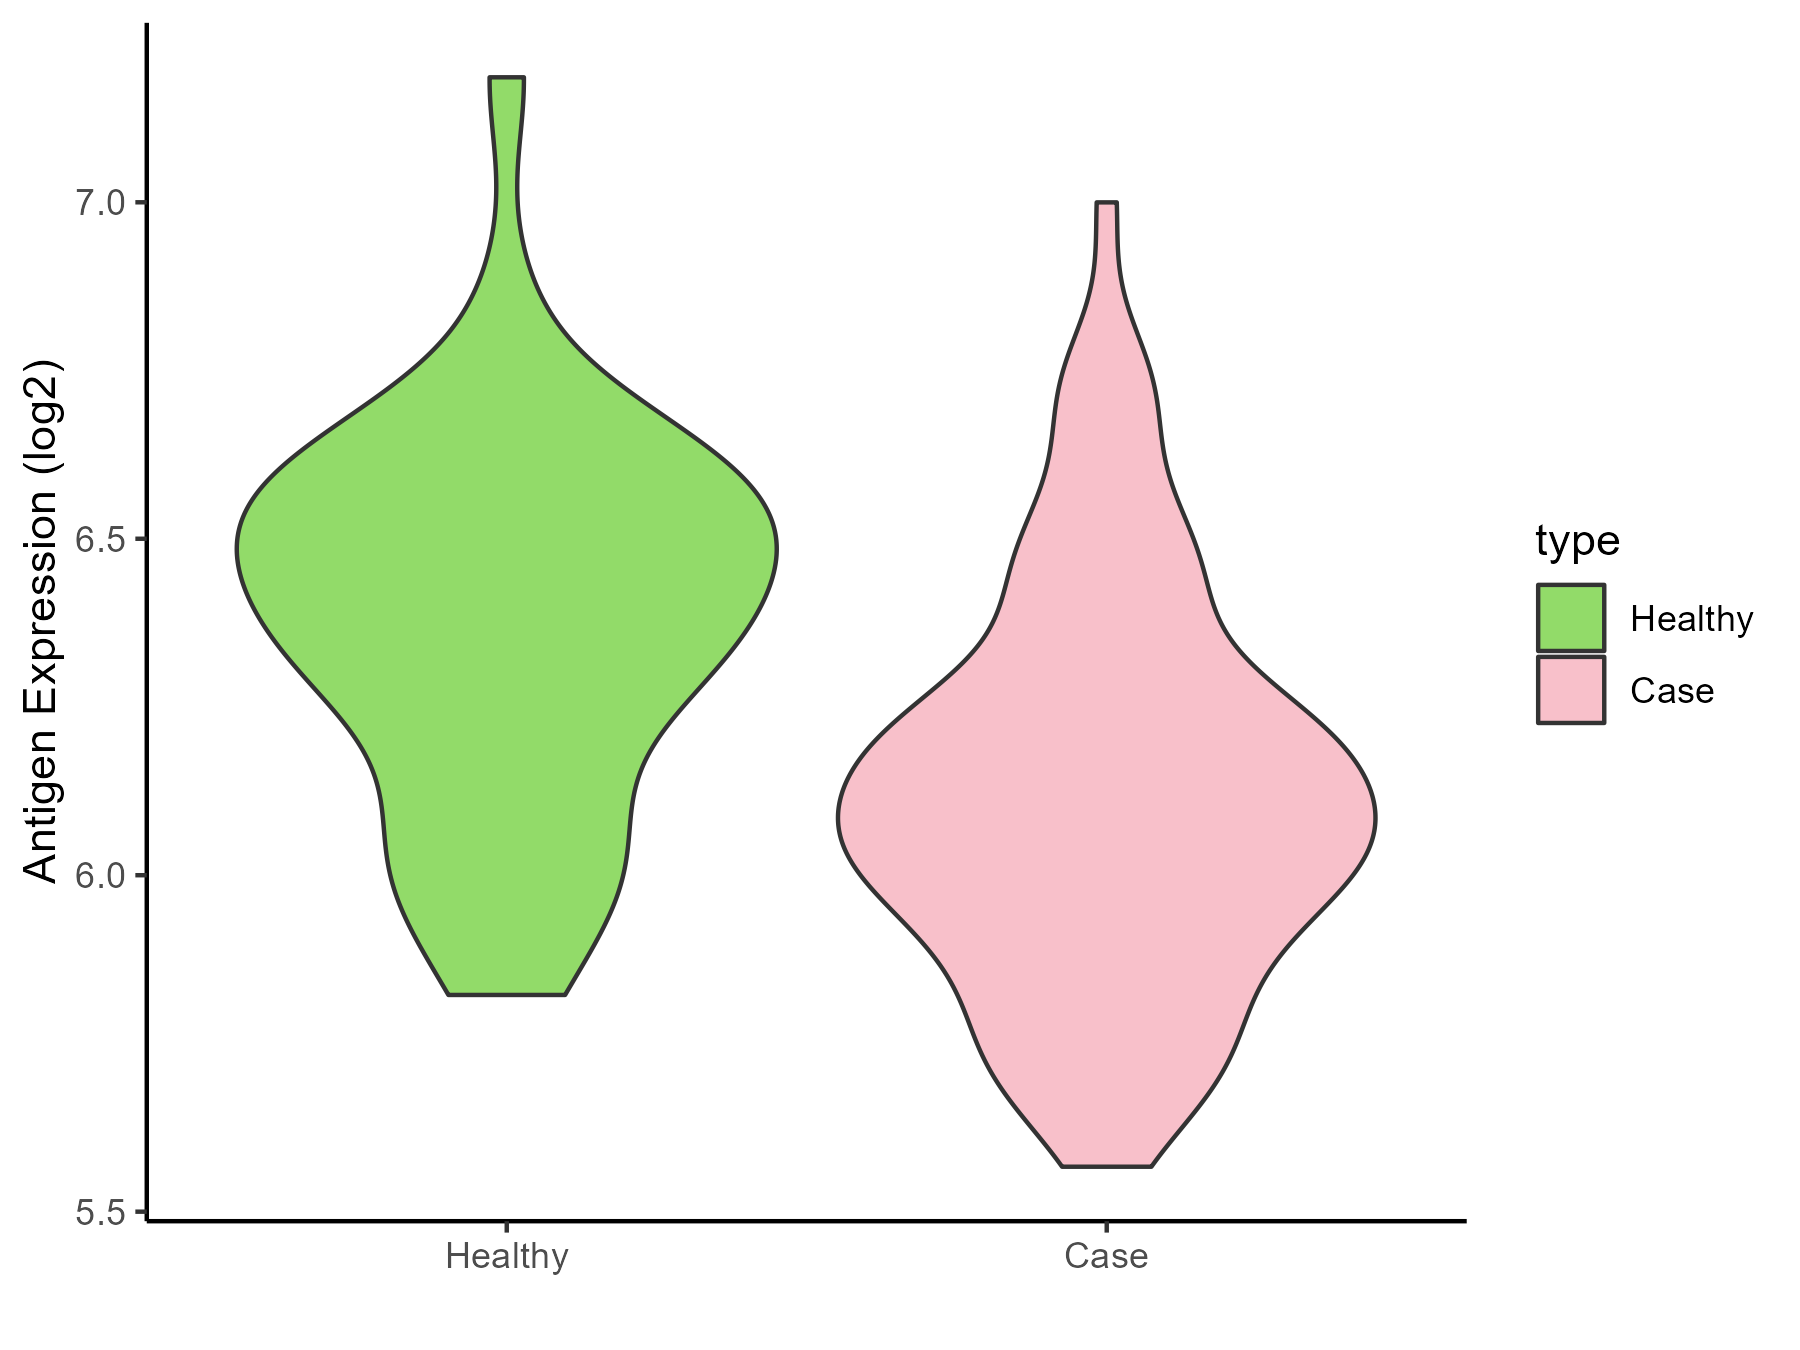
| Differential expression pattern of antigen in diseases | ||
| The Studied Tissue | Skin from scalp | |
| The Specific Disease | Alopecia | |
| The Expression Level of Disease Section Compare with the Healthy Individual Tissue | p-value: 1.30E-05; Fold-change: -0.32231798; Z-score: -1.137790299 | |
| Disease-specific Antigen Abundances |
|
Click to View the Clearer Original Diagram |
| Differential expression pattern of antigen in diseases | ||
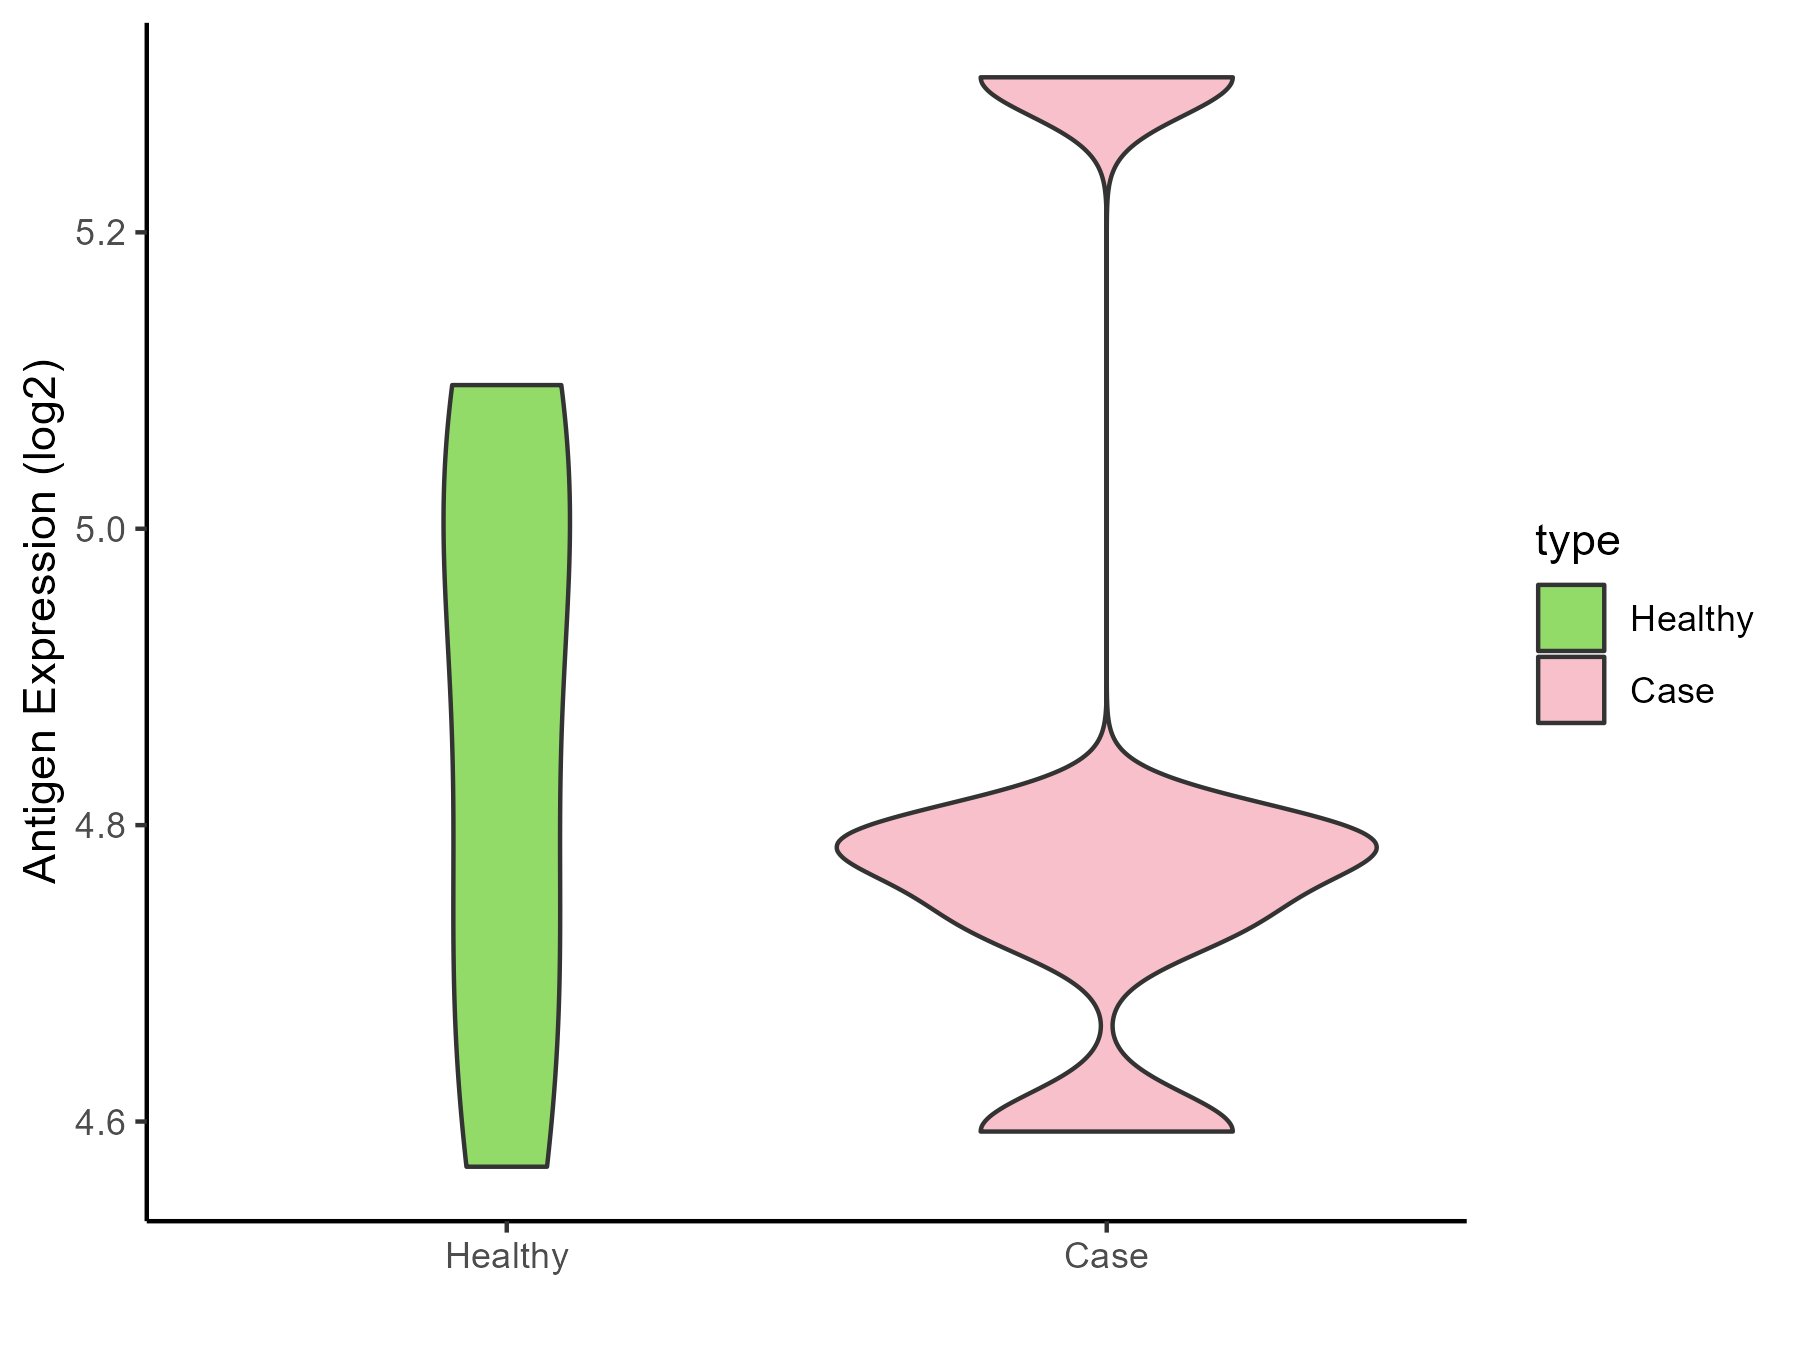
| The Studied Tissue | Skin | |
| The Specific Disease | Sensitive skin | |
| The Expression Level of Disease Section Compare with the Healthy Individual Tissue | p-value: 0.914567395; Fold-change: -0.095097581; Z-score: -0.451925898 | |
| Disease-specific Antigen Abundances |
|
Click to View the Clearer Original Diagram |
ICD Disease Classification 15
| Differential expression pattern of antigen in diseases | ||
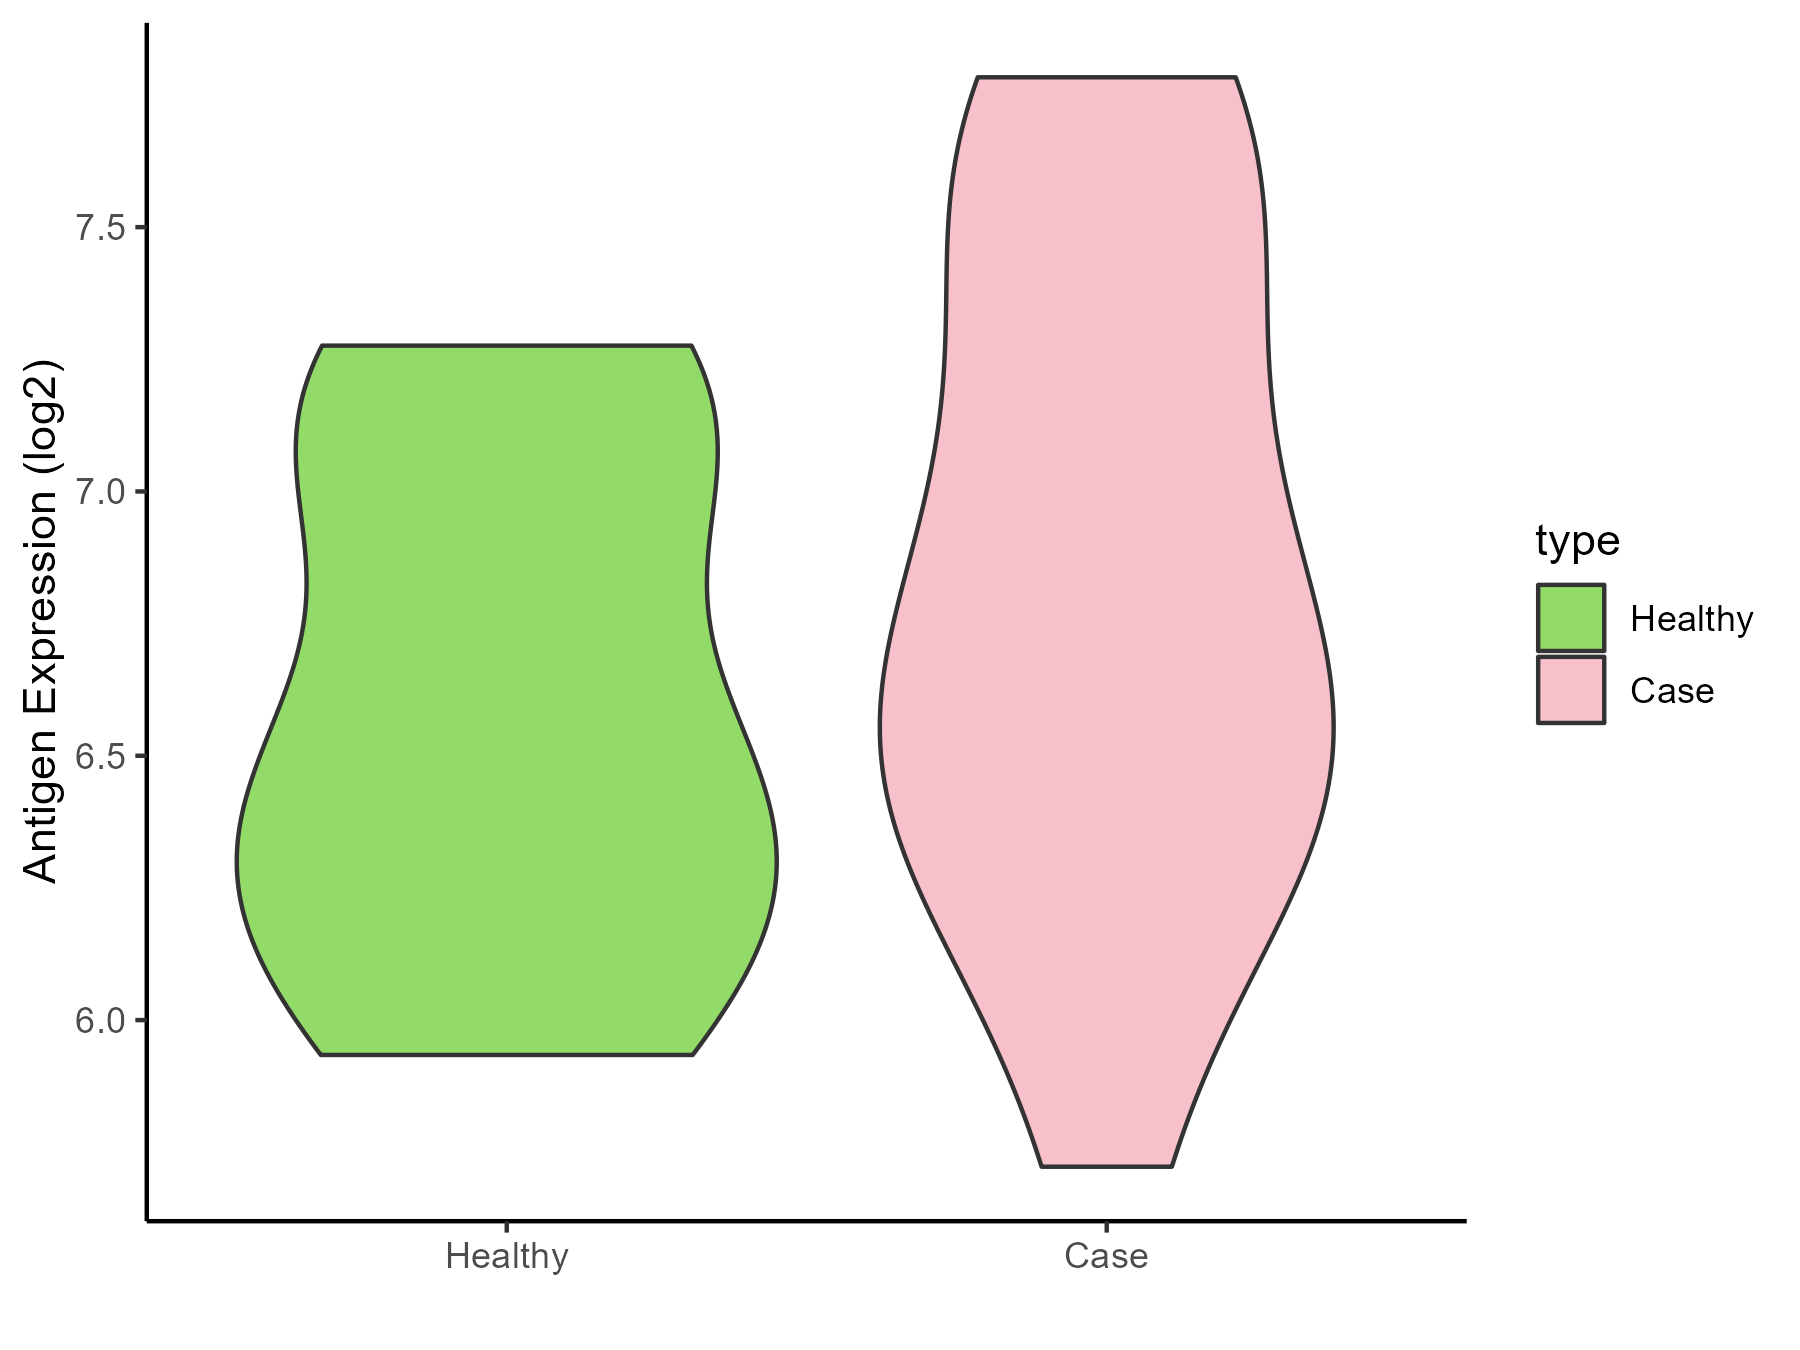
| The Studied Tissue | Synovial | |
| The Specific Disease | Osteoarthritis | |
| The Expression Level of Disease Section Compare with the Healthy Individual Tissue | p-value: 0.307747637; Fold-change: 0.189773615; Z-score: 0.377523897 | |
| Disease-specific Antigen Abundances |
|
Click to View the Clearer Original Diagram |
| Differential expression pattern of antigen in diseases | ||
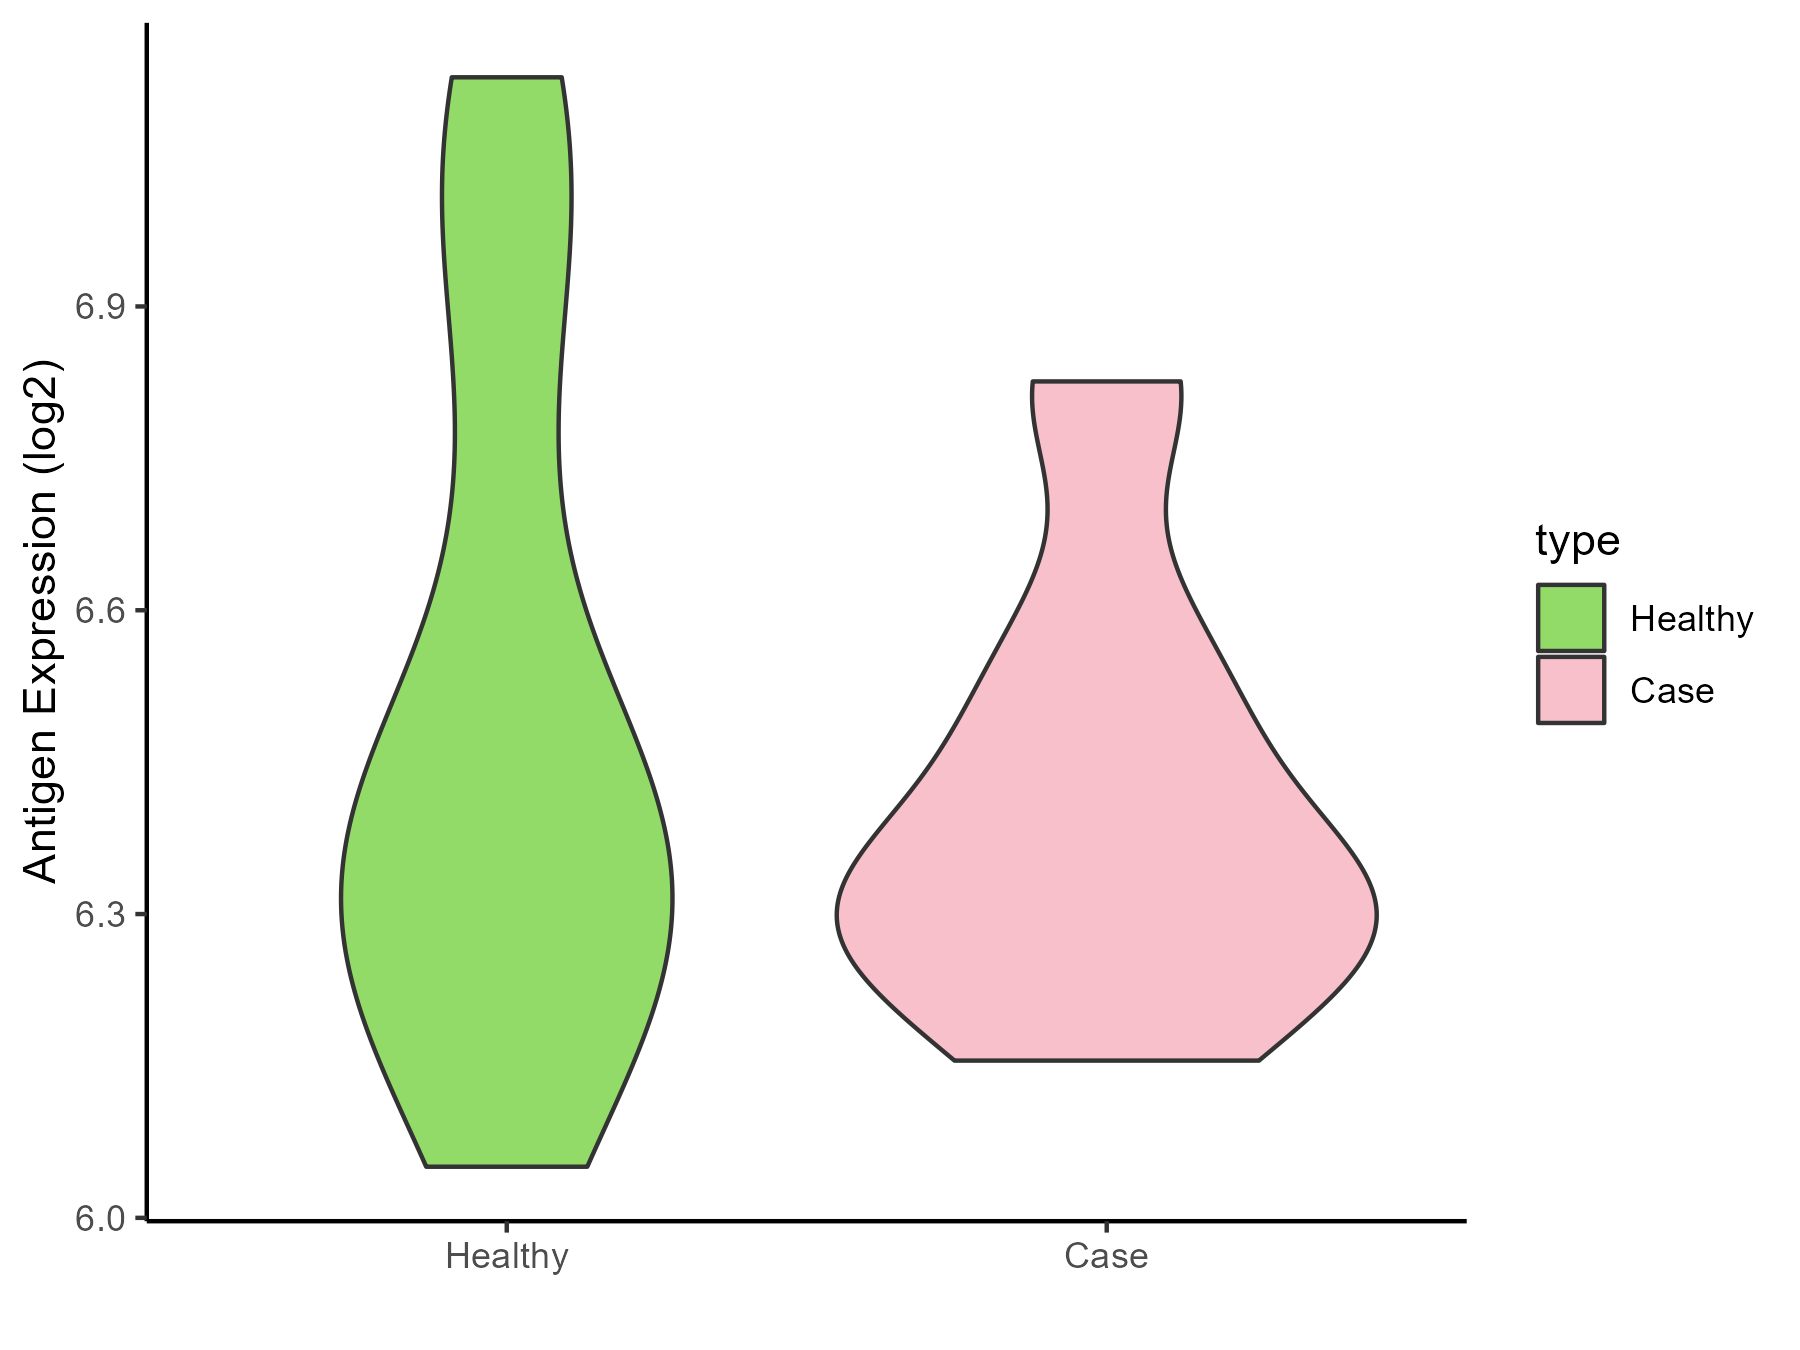
| The Studied Tissue | Peripheral blood | |
| The Specific Disease | Arthropathy | |
| The Expression Level of Disease Section Compare with the Healthy Individual Tissue | p-value: 0.32055066; Fold-change: -0.06647387; Z-score: -0.197552535 | |
| Disease-specific Antigen Abundances |
|
Click to View the Clearer Original Diagram |
| Differential expression pattern of antigen in diseases | ||
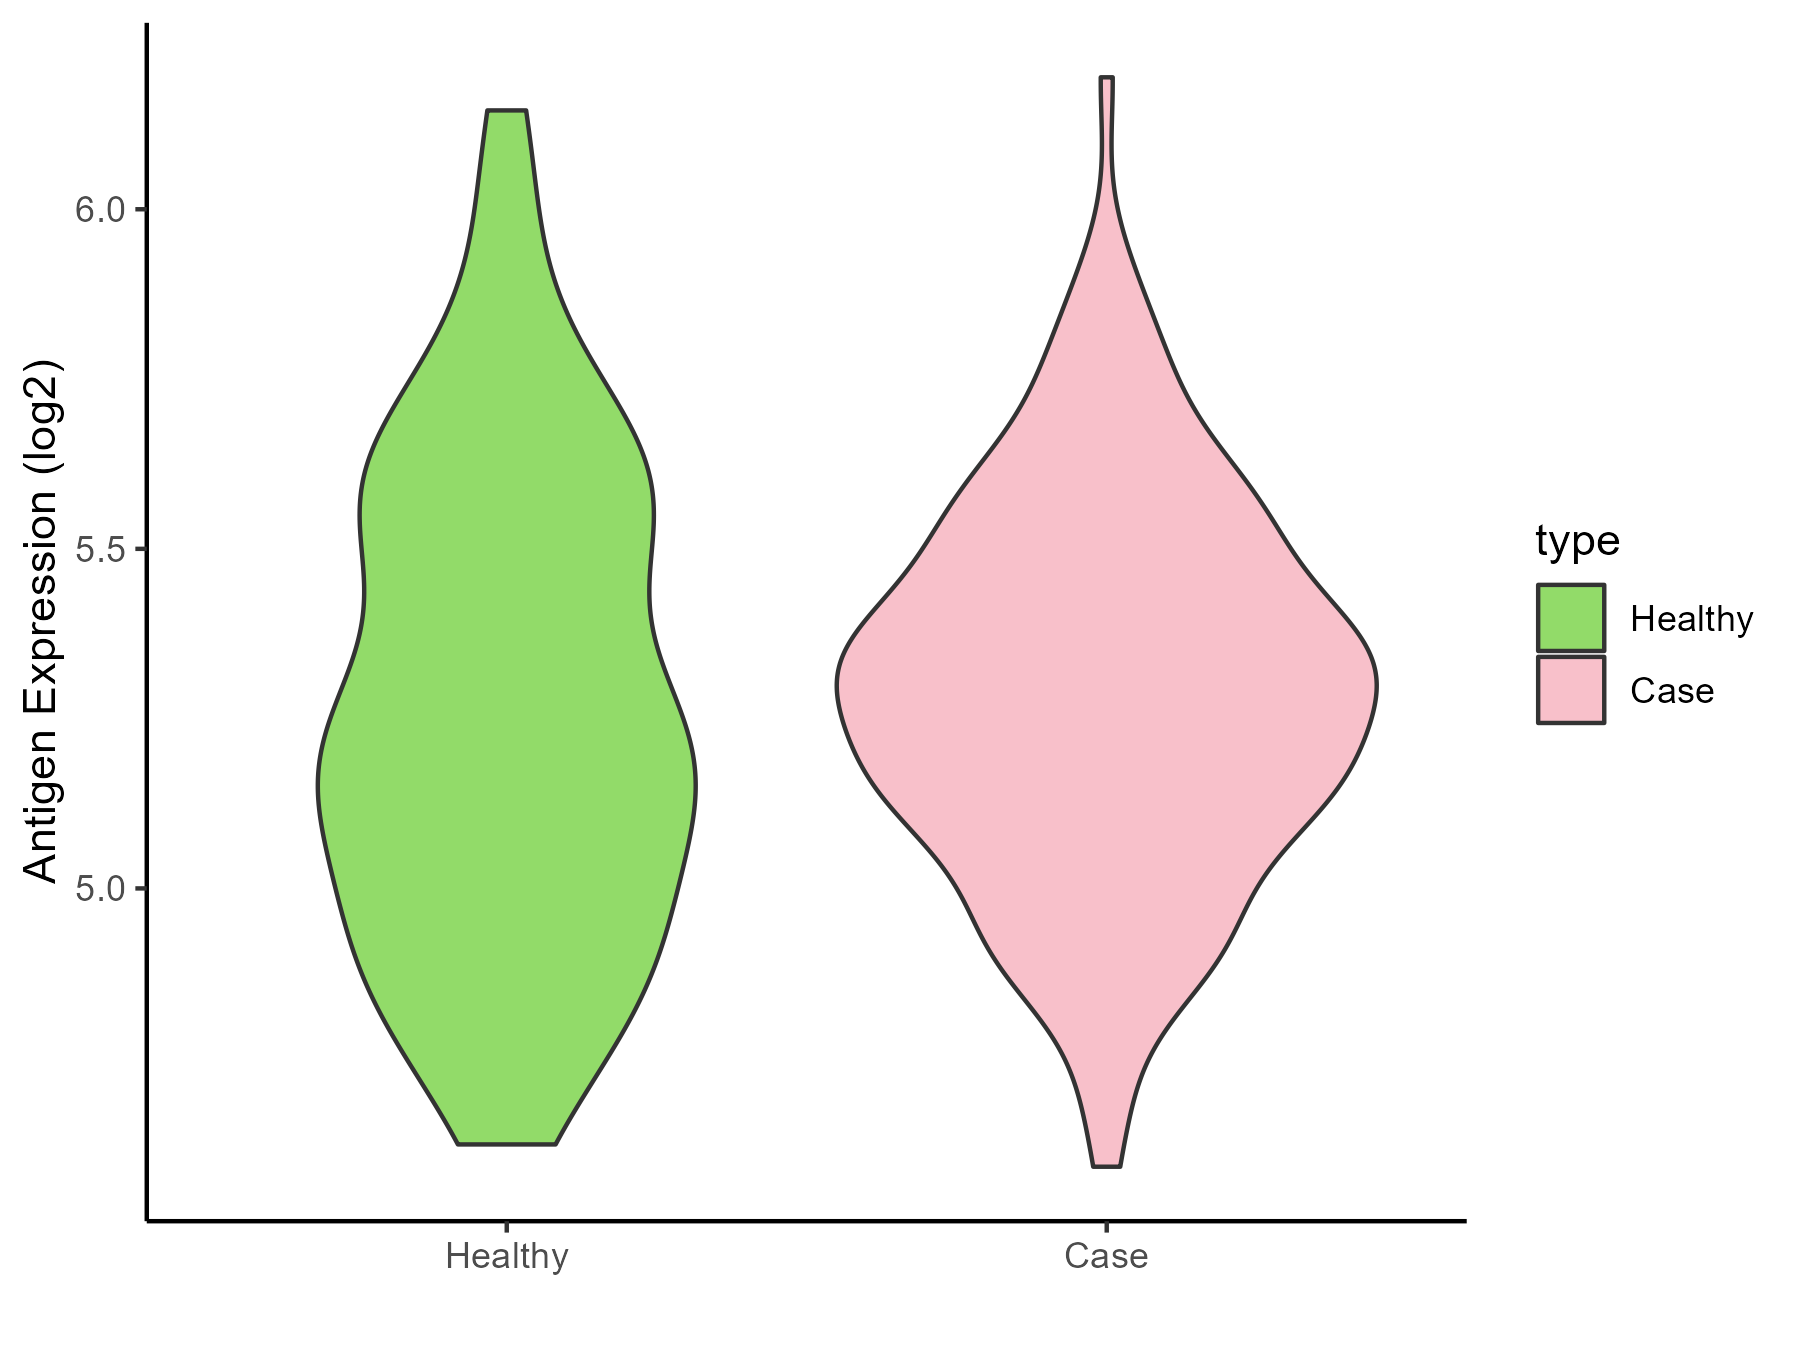
| The Studied Tissue | Peripheral blood | |
| The Specific Disease | Arthritis | |
| The Expression Level of Disease Section Compare with the Healthy Individual Tissue | p-value: 0.602338814; Fold-change: 0.091648877; Z-score: 0.258807842 | |
| Disease-specific Antigen Abundances |
|
Click to View the Clearer Original Diagram |
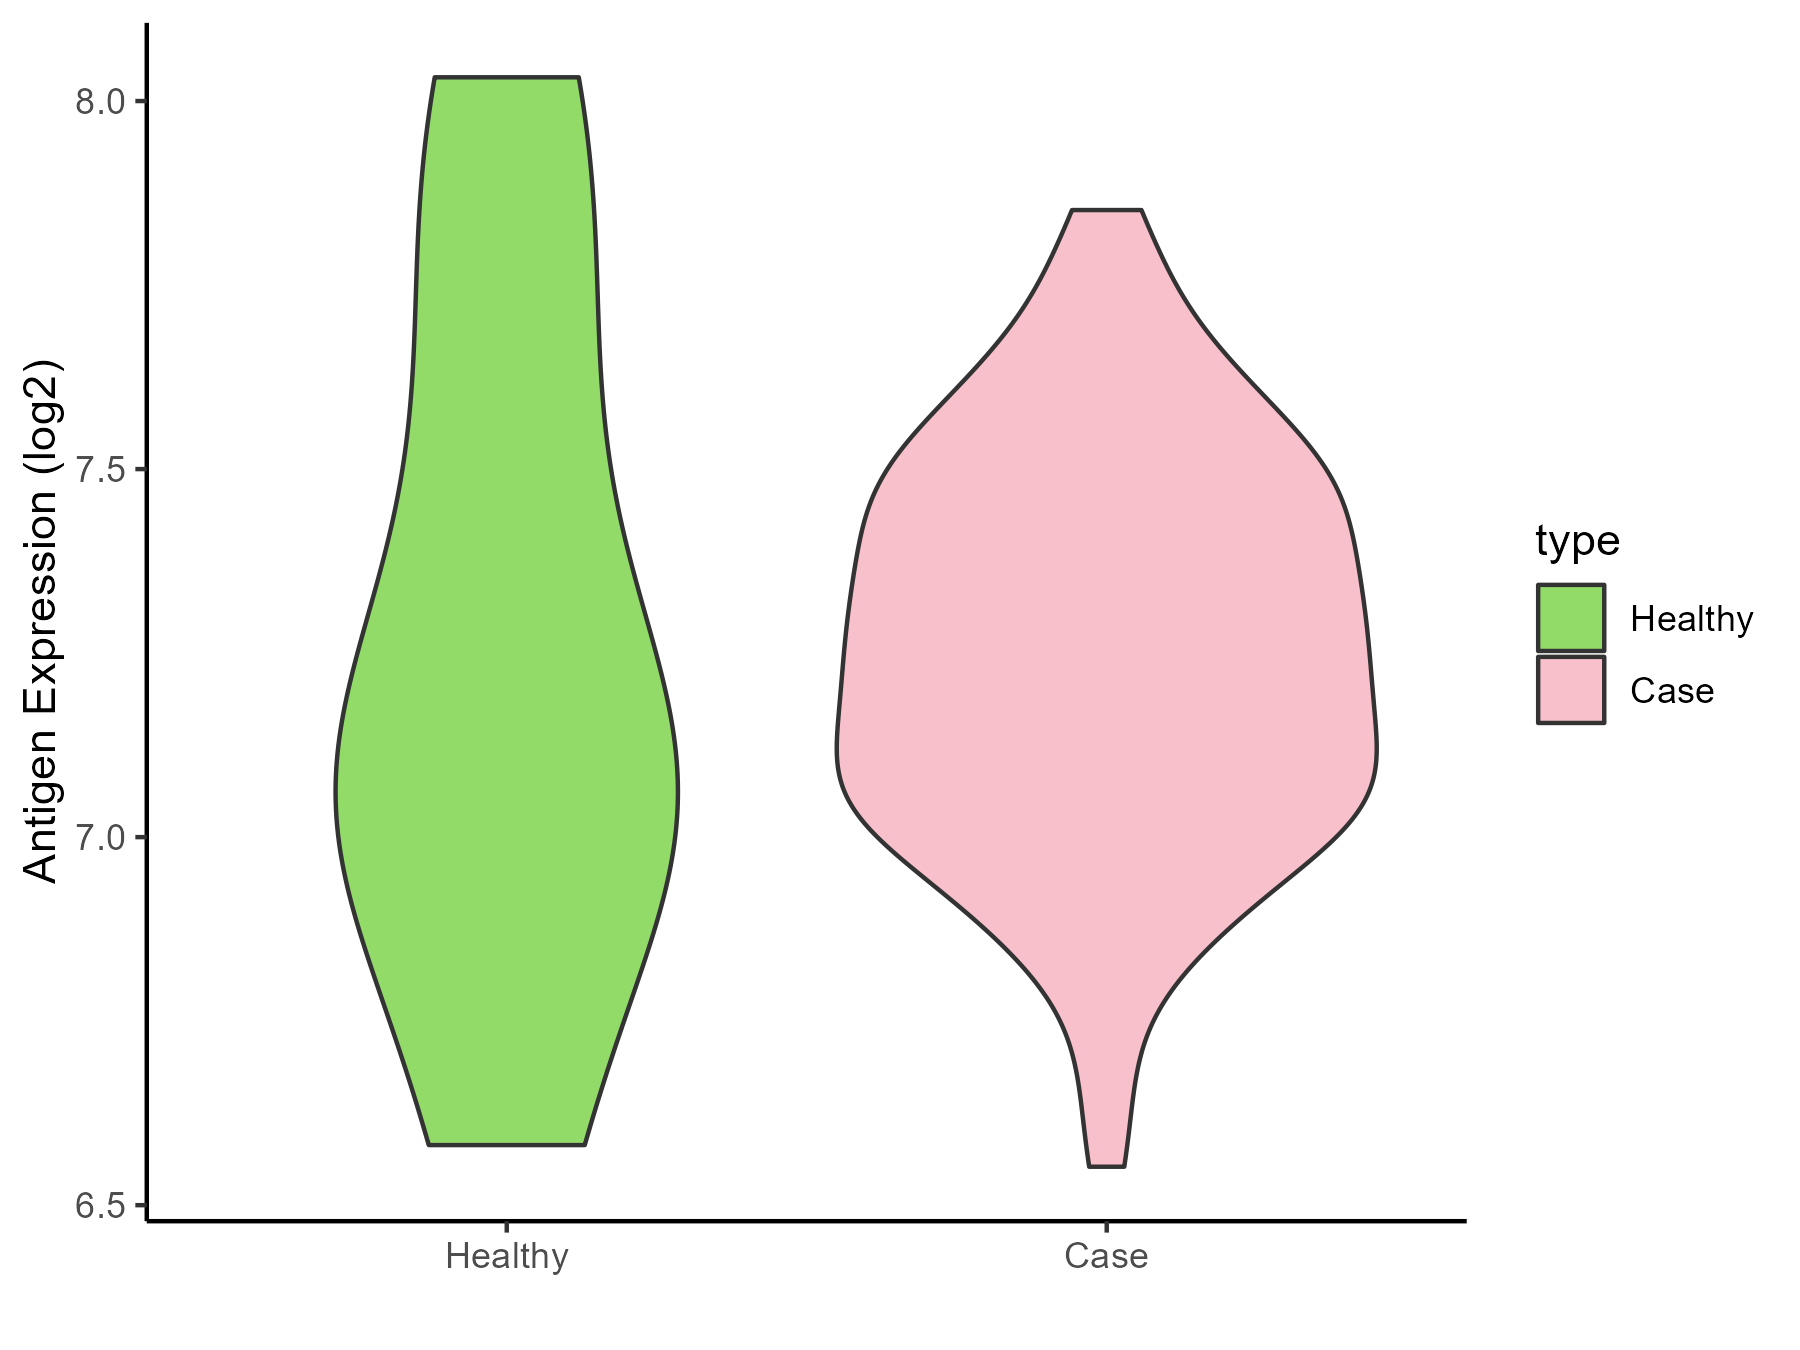
| Differential expression pattern of antigen in diseases | ||
| The Studied Tissue | Synovial | |
| The Specific Disease | Rheumatoid arthritis | |
| The Expression Level of Disease Section Compare with the Healthy Individual Tissue | p-value: 0.990994763; Fold-change: 0.149883952; Z-score: 0.30474606 | |
| Disease-specific Antigen Abundances |
|
Click to View the Clearer Original Diagram |
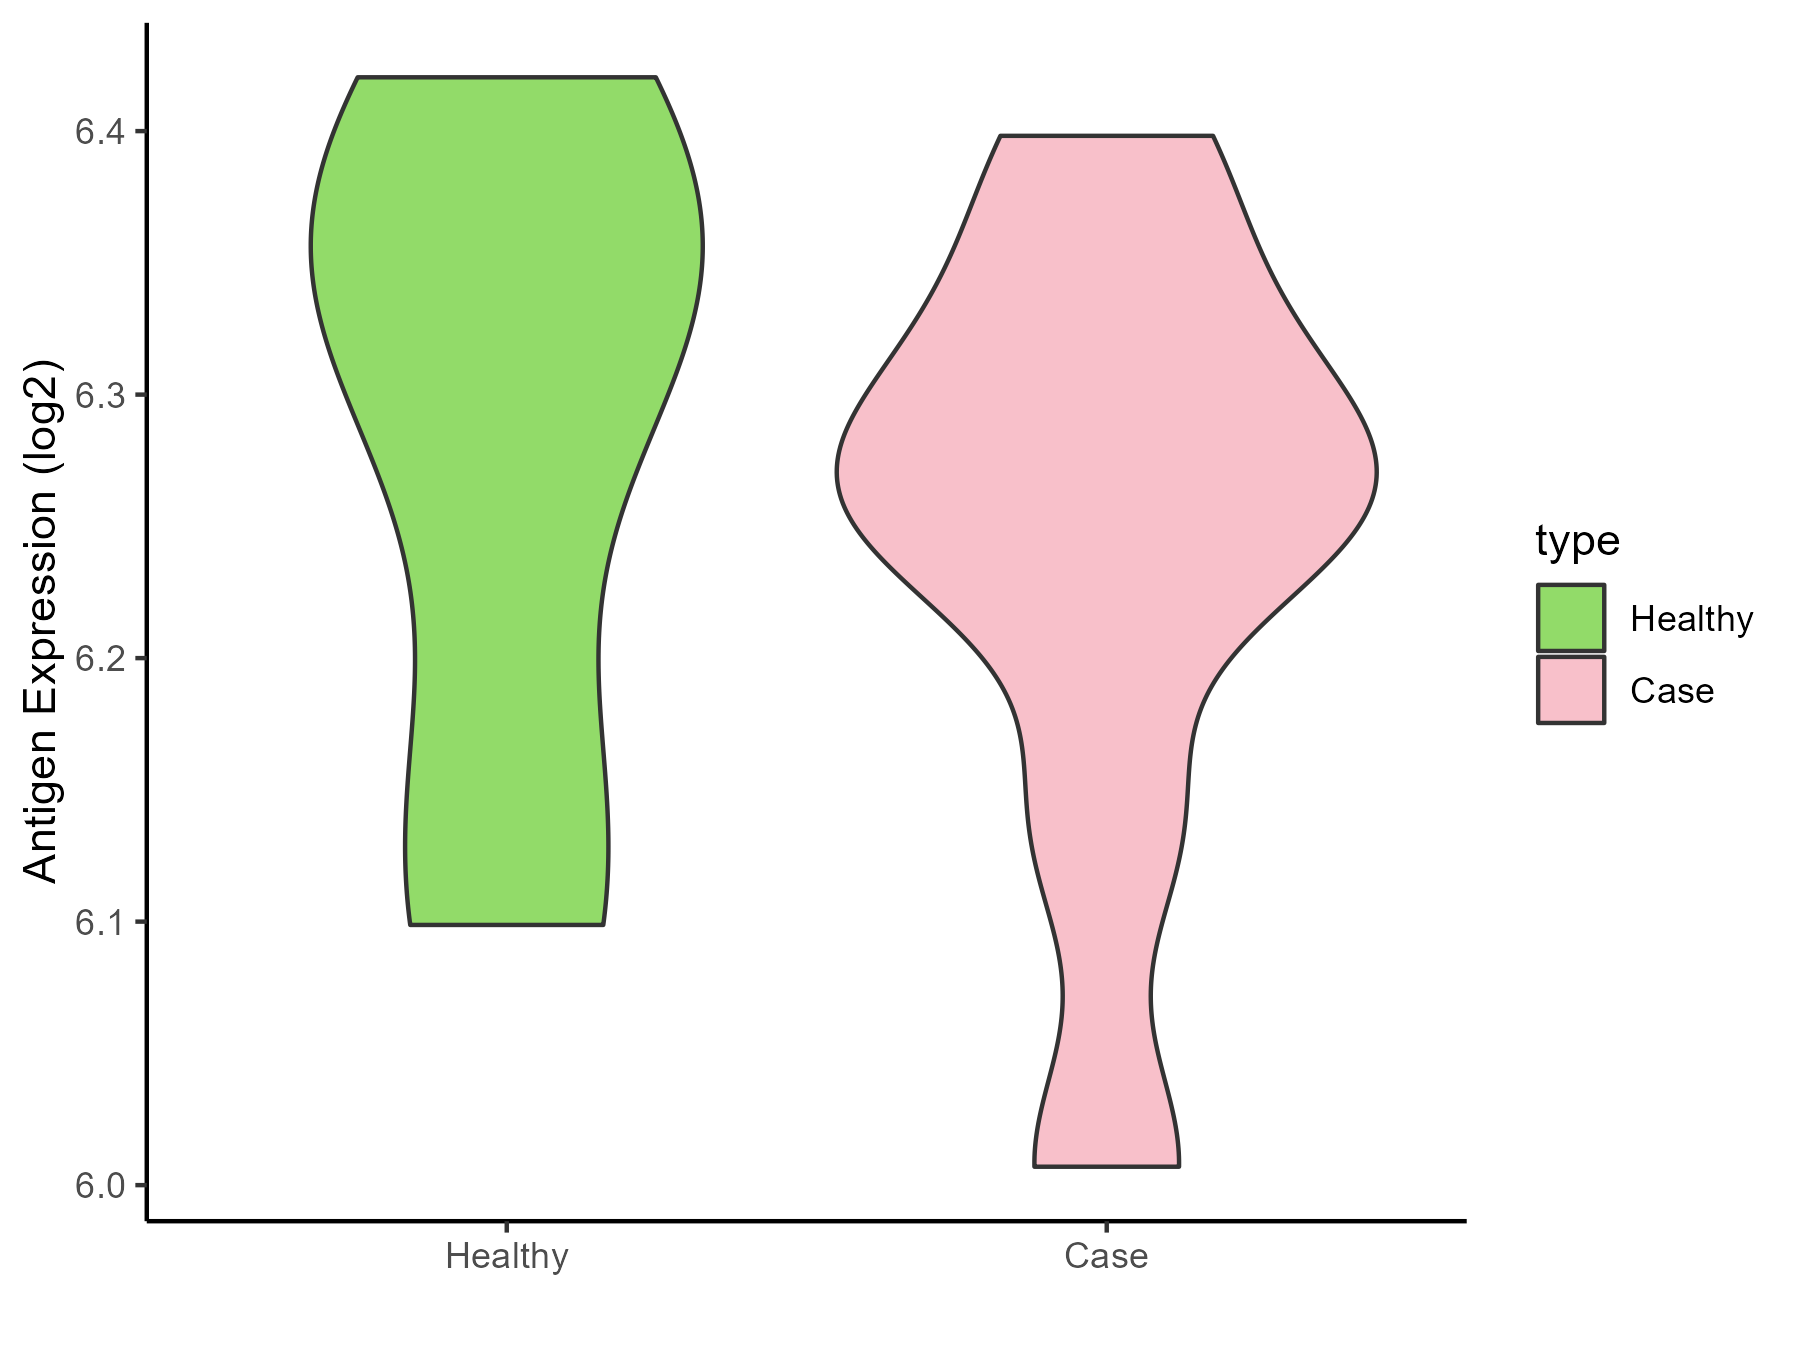
| Differential expression pattern of antigen in diseases | ||
| The Studied Tissue | Pheripheral blood | |
| The Specific Disease | Ankylosing spondylitis | |
| The Expression Level of Disease Section Compare with the Healthy Individual Tissue | p-value: 0.525620251; Fold-change: -0.059965103; Z-score: -0.480151215 | |
| Disease-specific Antigen Abundances |
|
Click to View the Clearer Original Diagram |
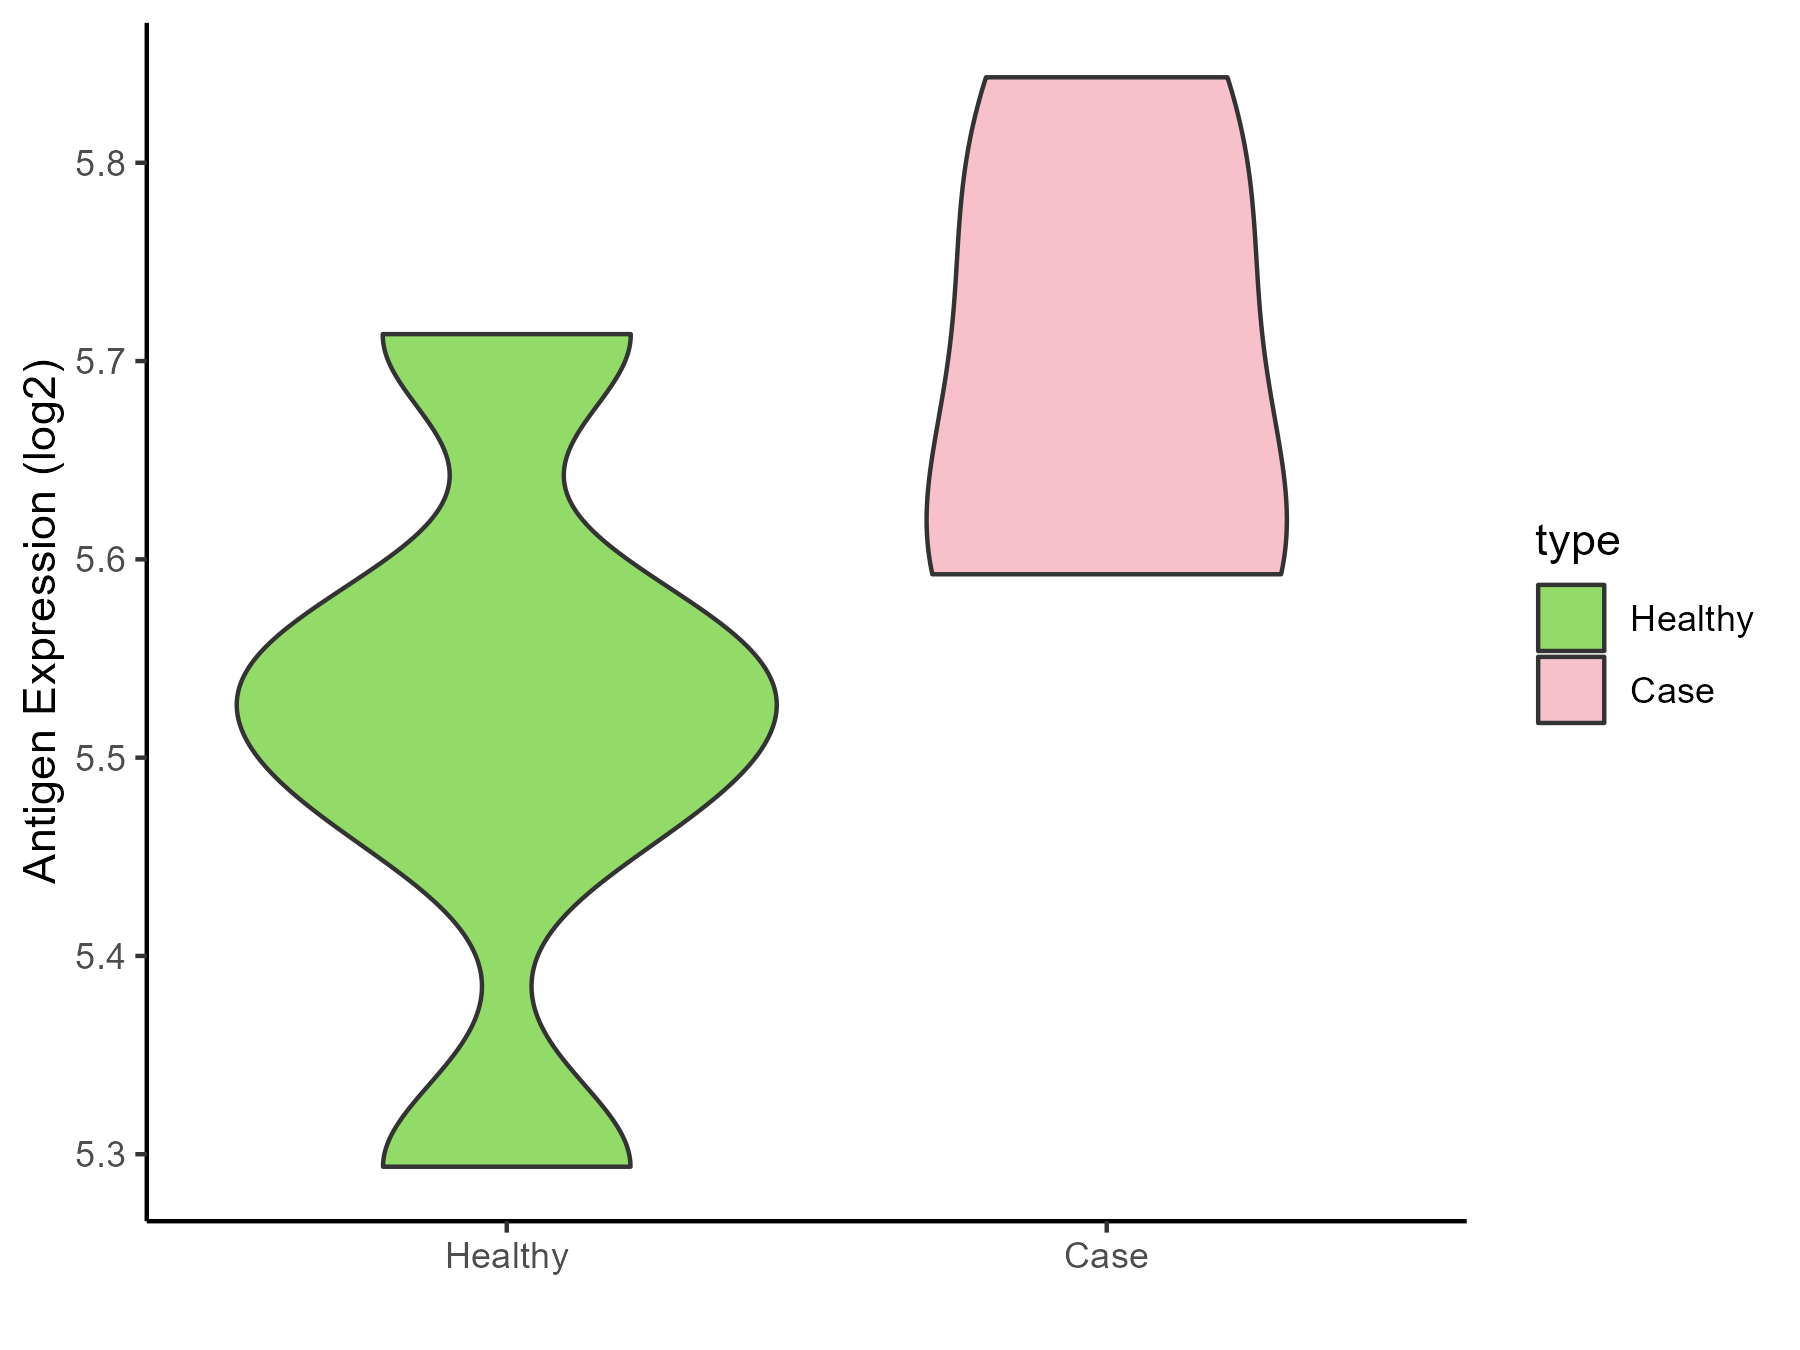
| Differential expression pattern of antigen in diseases | ||
| The Studied Tissue | Bone marrow | |
| The Specific Disease | Osteoporosis | |
| The Expression Level of Disease Section Compare with the Healthy Individual Tissue | p-value: 0.088903393; Fold-change: 0.145791005; Z-score: 0.959094091 | |
| Disease-specific Antigen Abundances |
|
Click to View the Clearer Original Diagram |
ICD Disease Classification 16
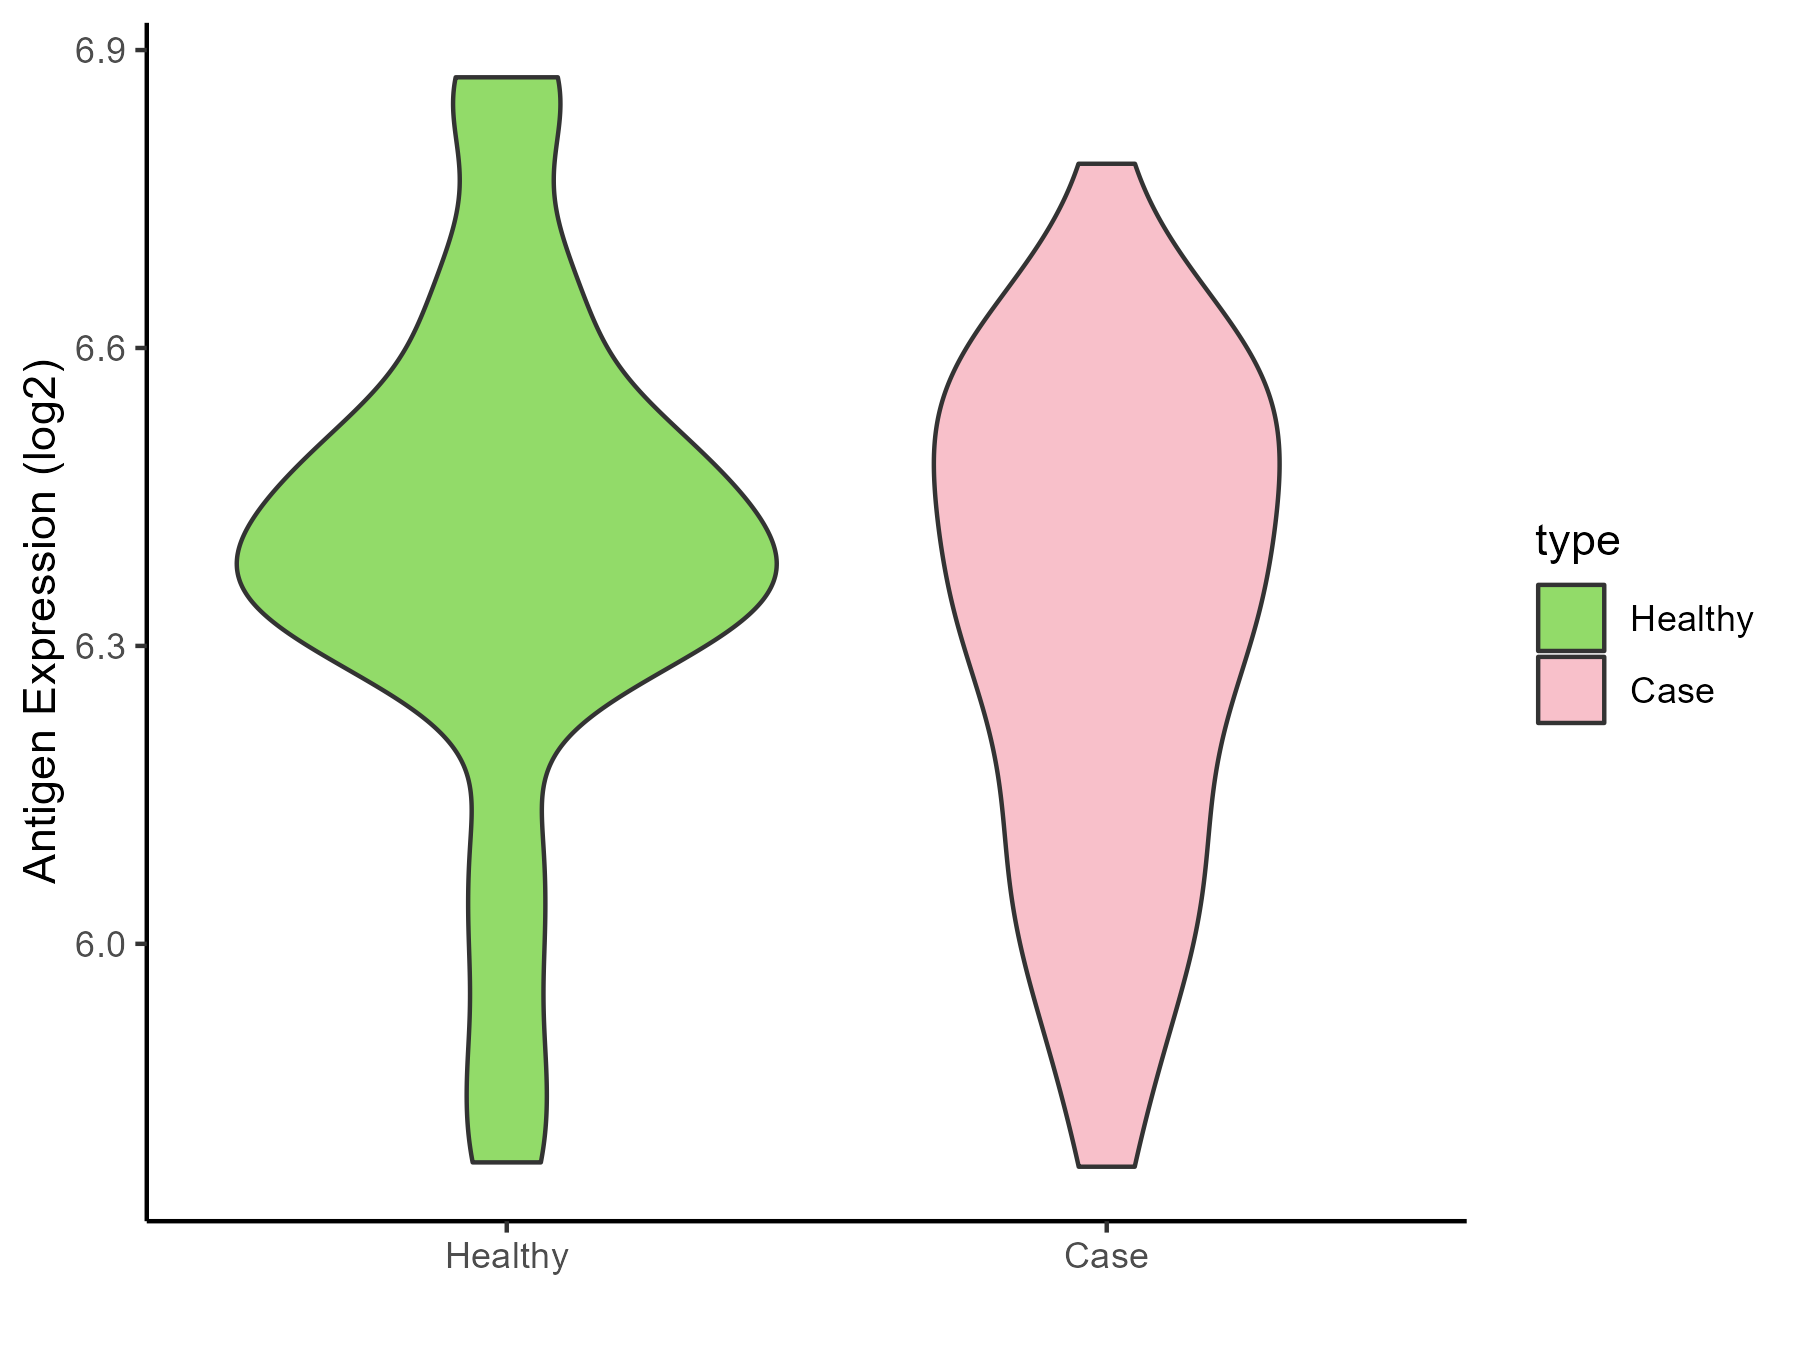
| Differential expression pattern of antigen in diseases | ||
| The Studied Tissue | Endometrium | |
| The Specific Disease | Endometriosis | |
| The Expression Level of Disease Section Compare with the Healthy Individual Tissue | p-value: 0.268064146; Fold-change: -0.049656728; Z-score: -0.195073441 | |
| Disease-specific Antigen Abundances |
|
Click to View the Clearer Original Diagram |
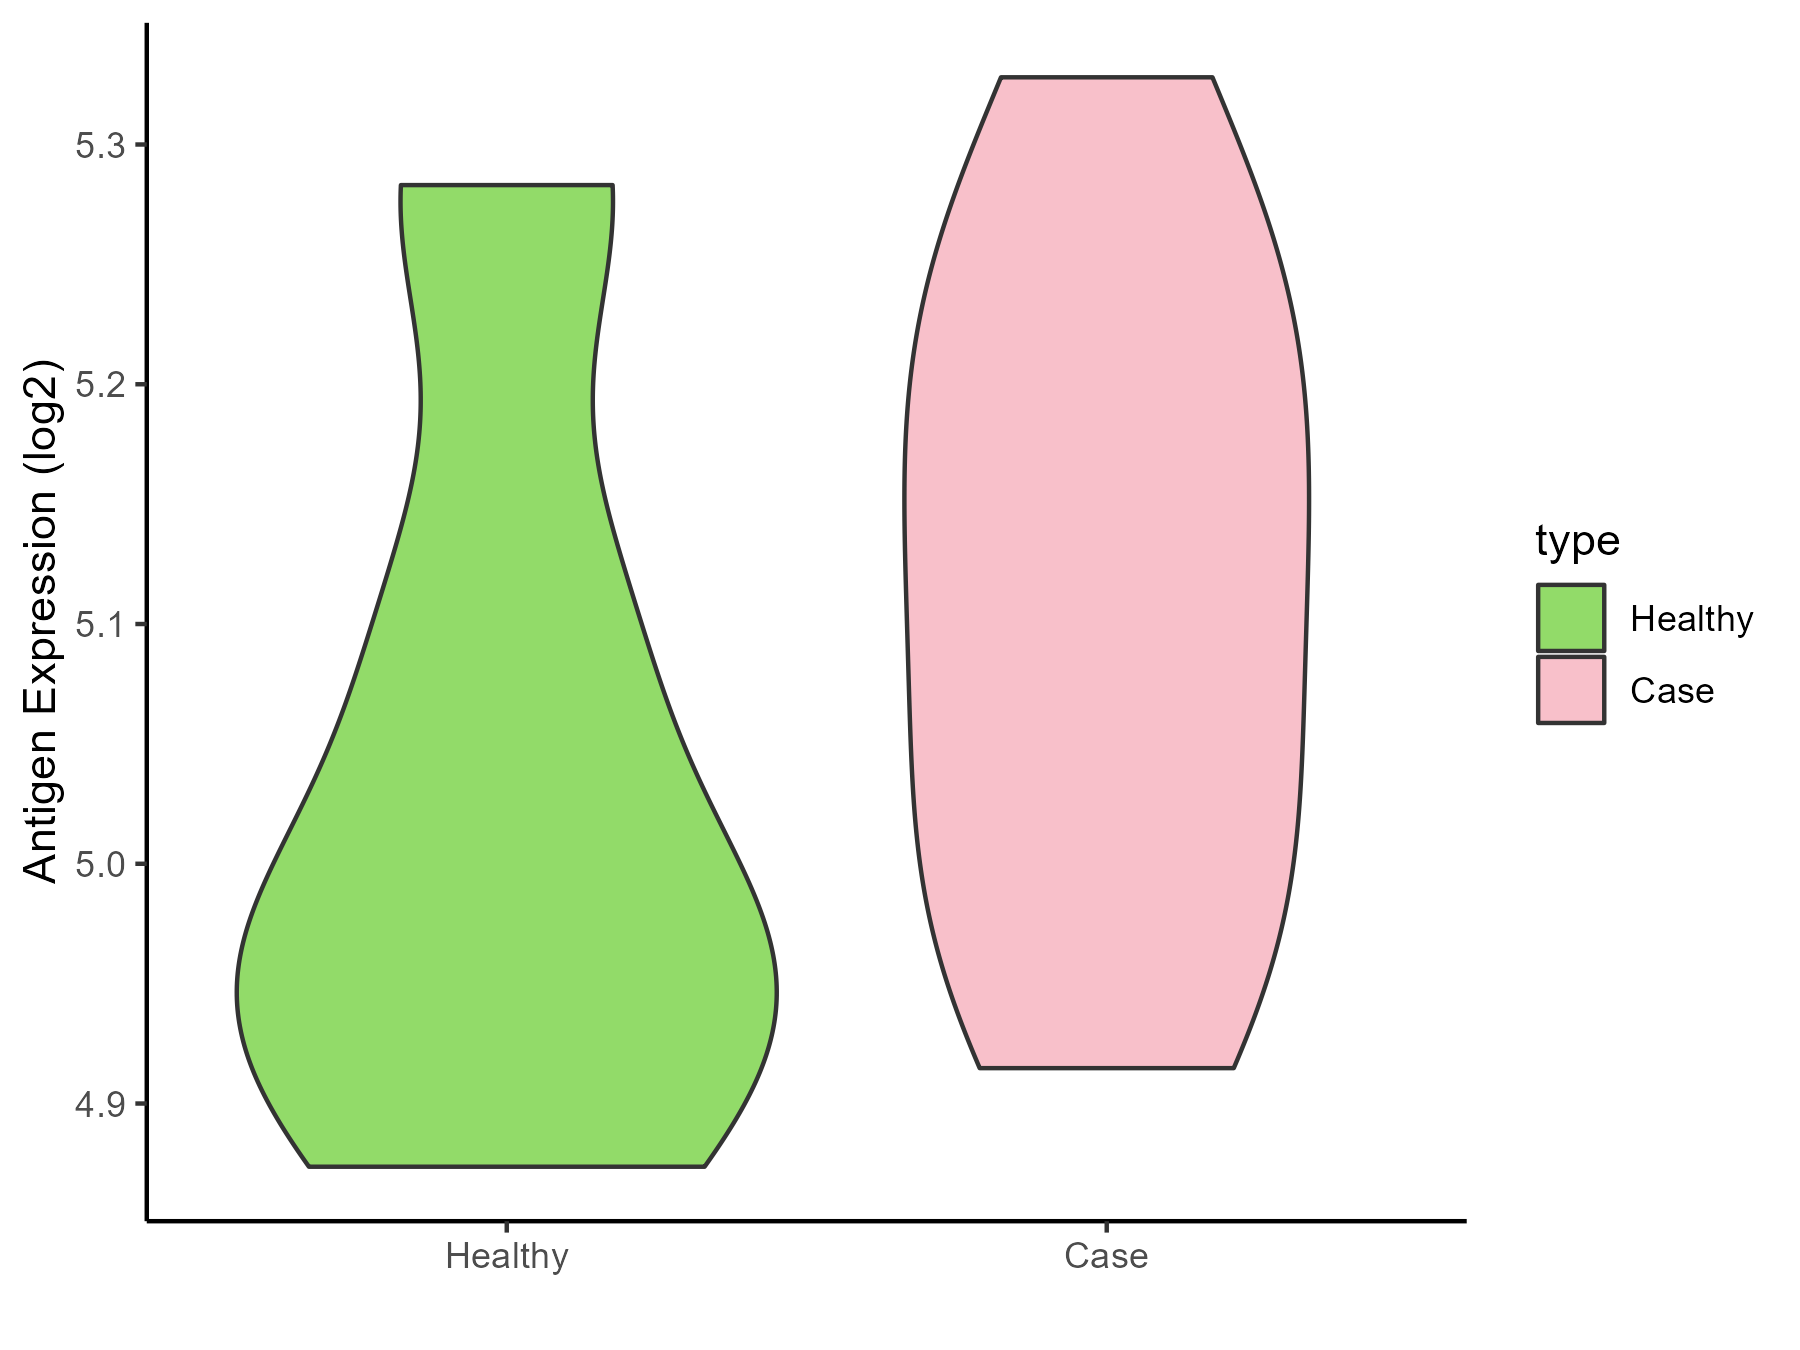
| Differential expression pattern of antigen in diseases | ||
| The Studied Tissue | Bladder | |
| The Specific Disease | Interstitial cystitis | |
| The Expression Level of Disease Section Compare with the Healthy Individual Tissue | p-value: 0.378471921; Fold-change: 0.150705165; Z-score: 0.940933146 | |
| Disease-specific Antigen Abundances |
|
Click to View the Clearer Original Diagram |
ICD Disease Classification 19
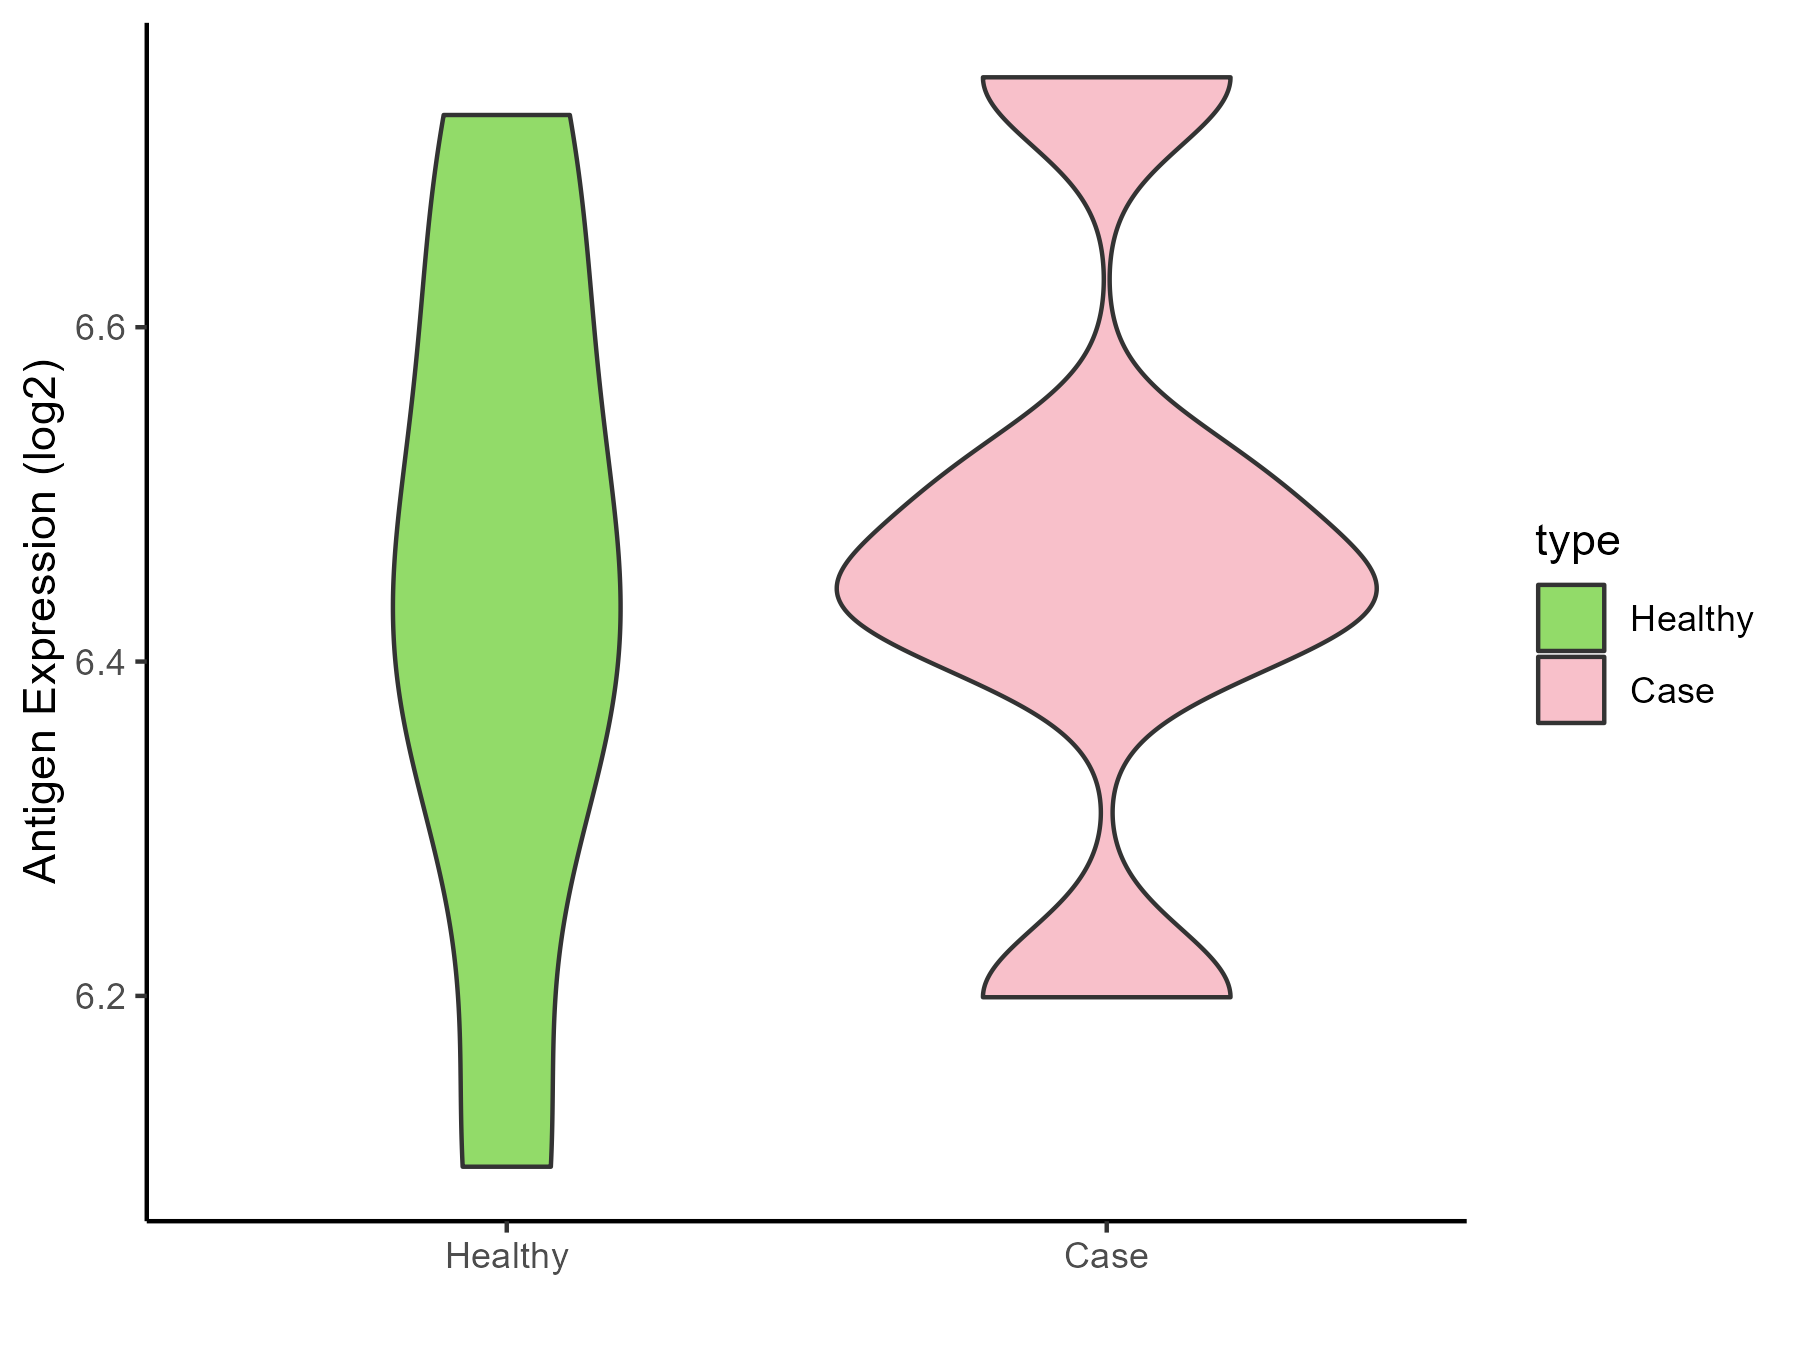
| Differential expression pattern of antigen in diseases | ||
| The Studied Tissue | Myometrium | |
| The Specific Disease | Preterm birth | |
| The Expression Level of Disease Section Compare with the Healthy Individual Tissue | p-value: 0.854826125; Fold-change: 0.000507785; Z-score: 0.002317553 | |
| Disease-specific Antigen Abundances |
|
Click to View the Clearer Original Diagram |
ICD Disease Classification 2
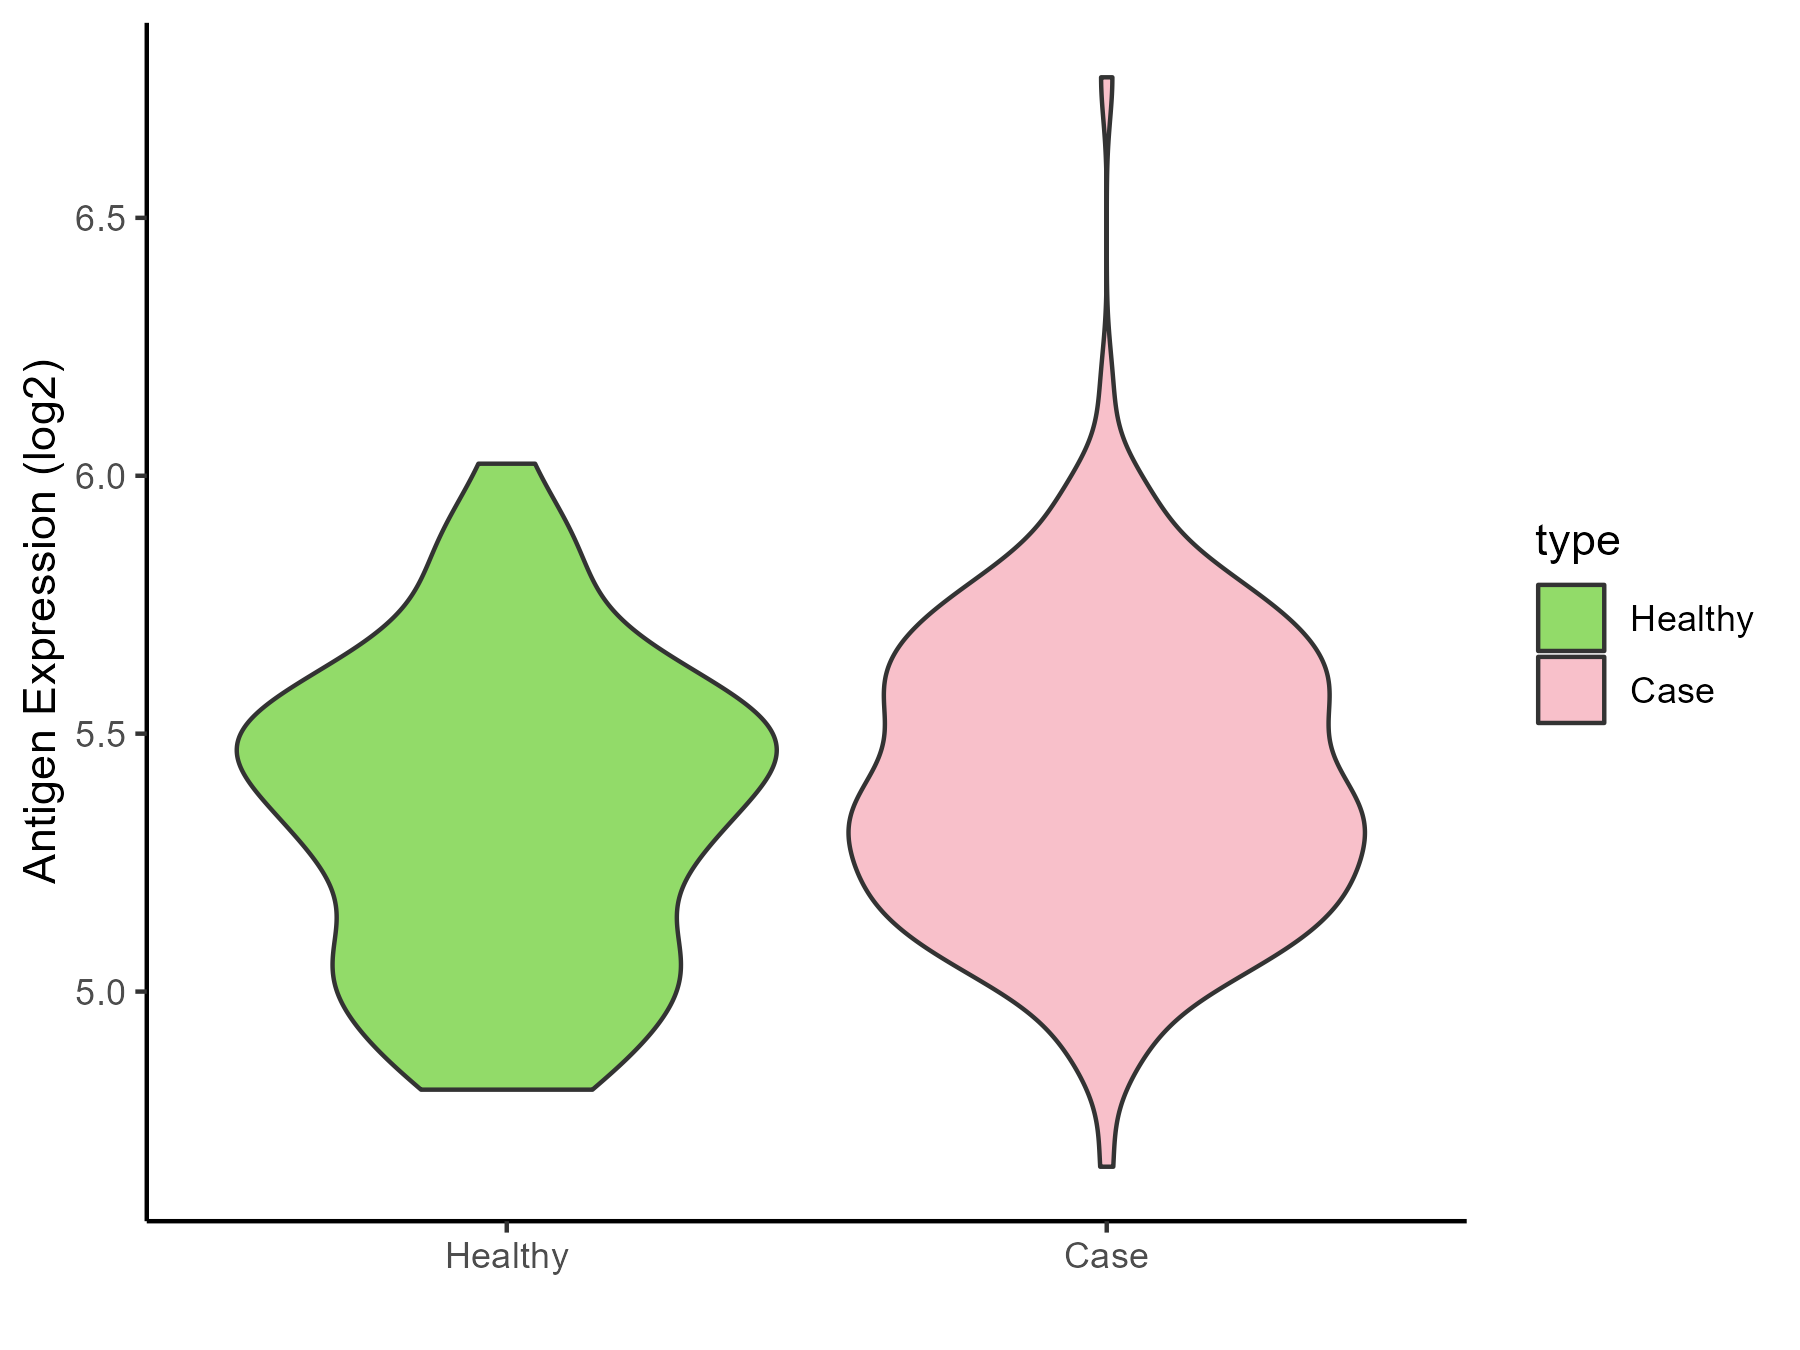
| Differential expression pattern of antigen in diseases | ||
| The Studied Tissue | Bone marrow | |
| The Specific Disease | Acute myelocytic leukemia | |
| The Expression Level of Disease Section Compare with the Healthy Individual Tissue | p-value: 0.011664041; Fold-change: 0.014216243; Z-score: 0.048005398 | |
| Disease-specific Antigen Abundances |
|
Click to View the Clearer Original Diagram |
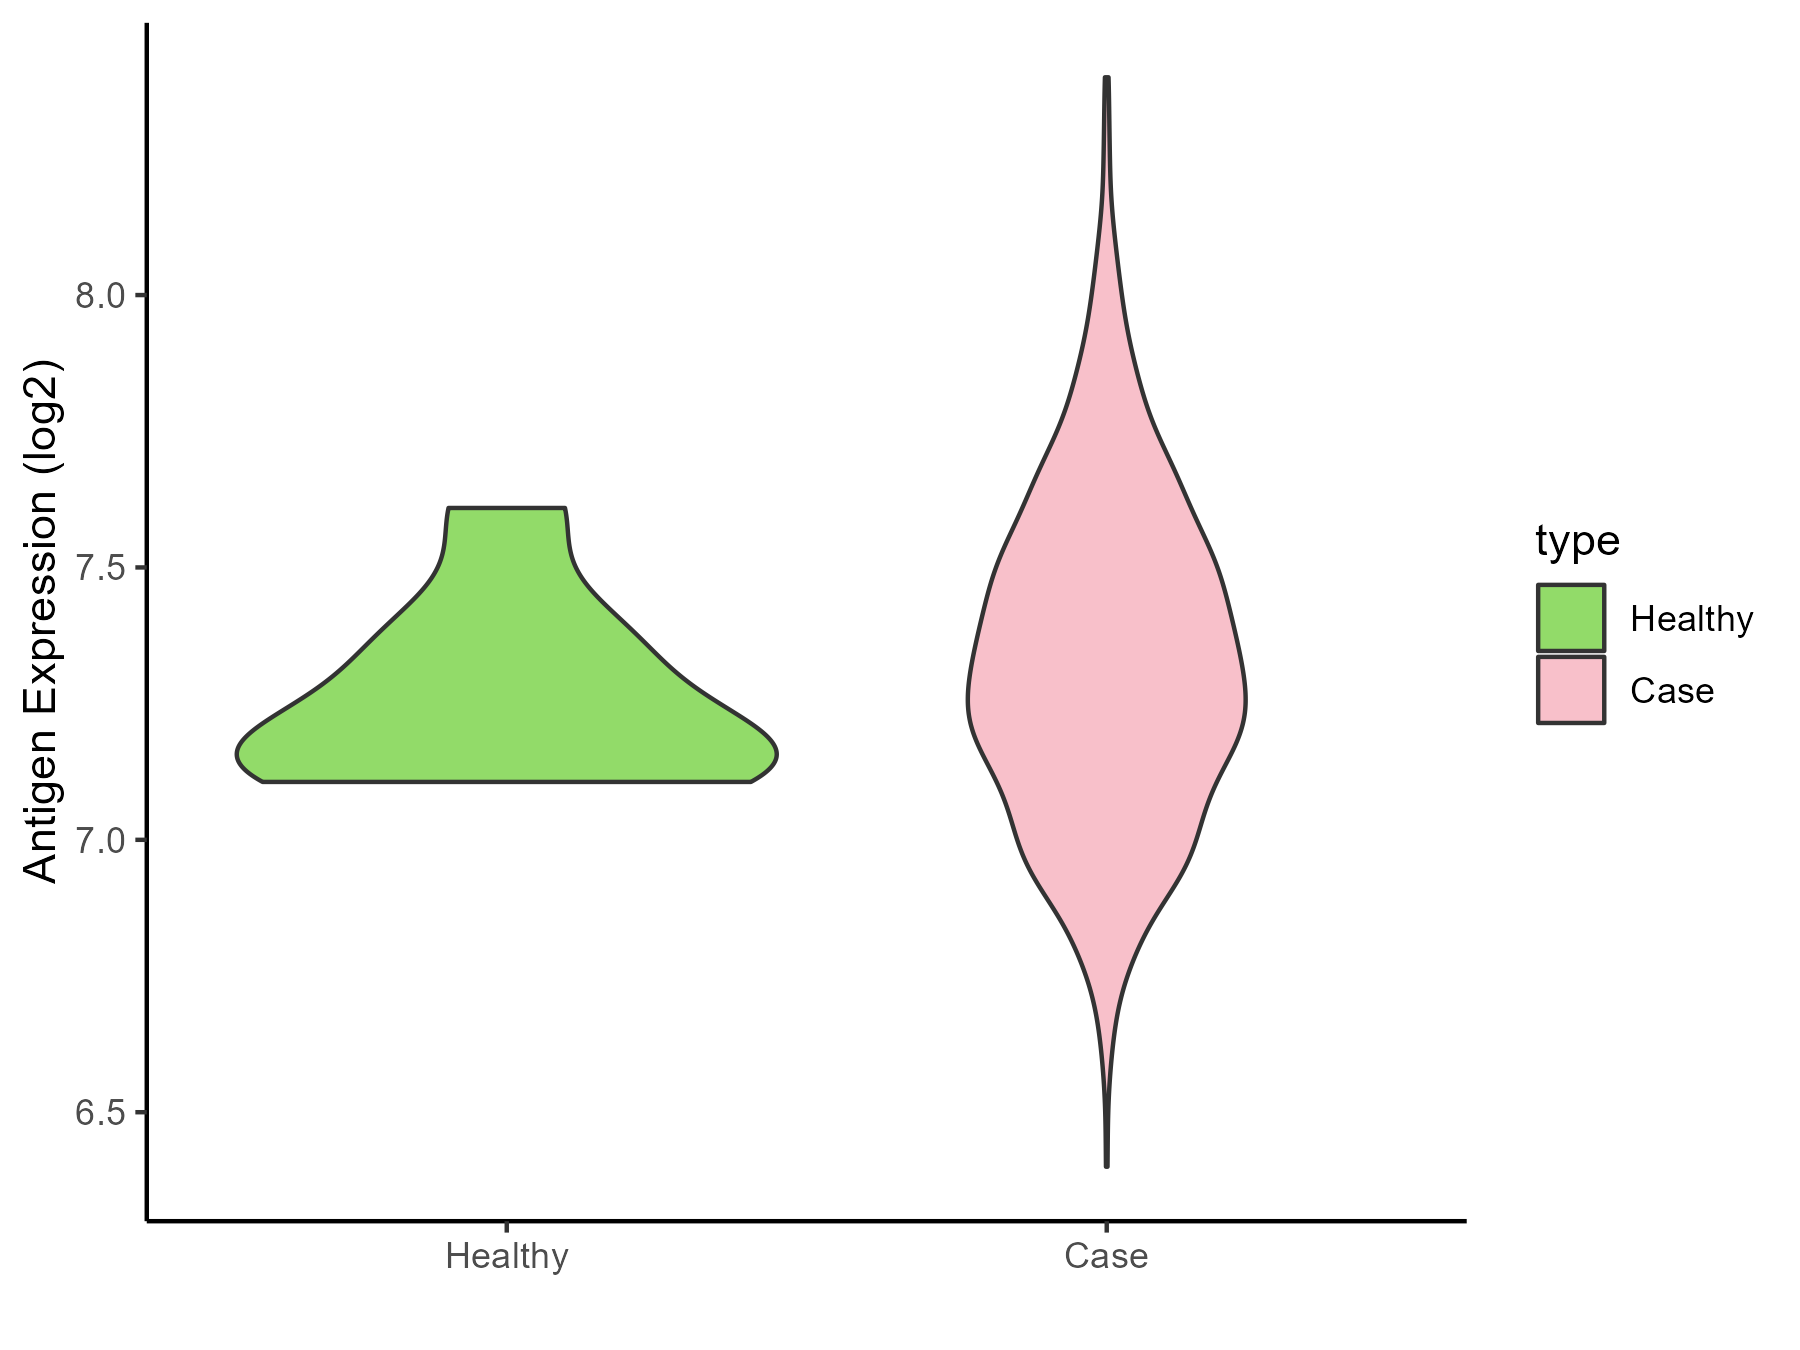
| Differential expression pattern of antigen in diseases | ||
| The Studied Tissue | Bone marrow | |
| The Specific Disease | Myeloma | |
| The Expression Level of Disease Section Compare with the Healthy Individual Tissue | p-value: 0.285742628; Fold-change: 0.132129229; Z-score: 0.761280952 | |
| Disease-specific Antigen Abundances |
|
Click to View the Clearer Original Diagram |
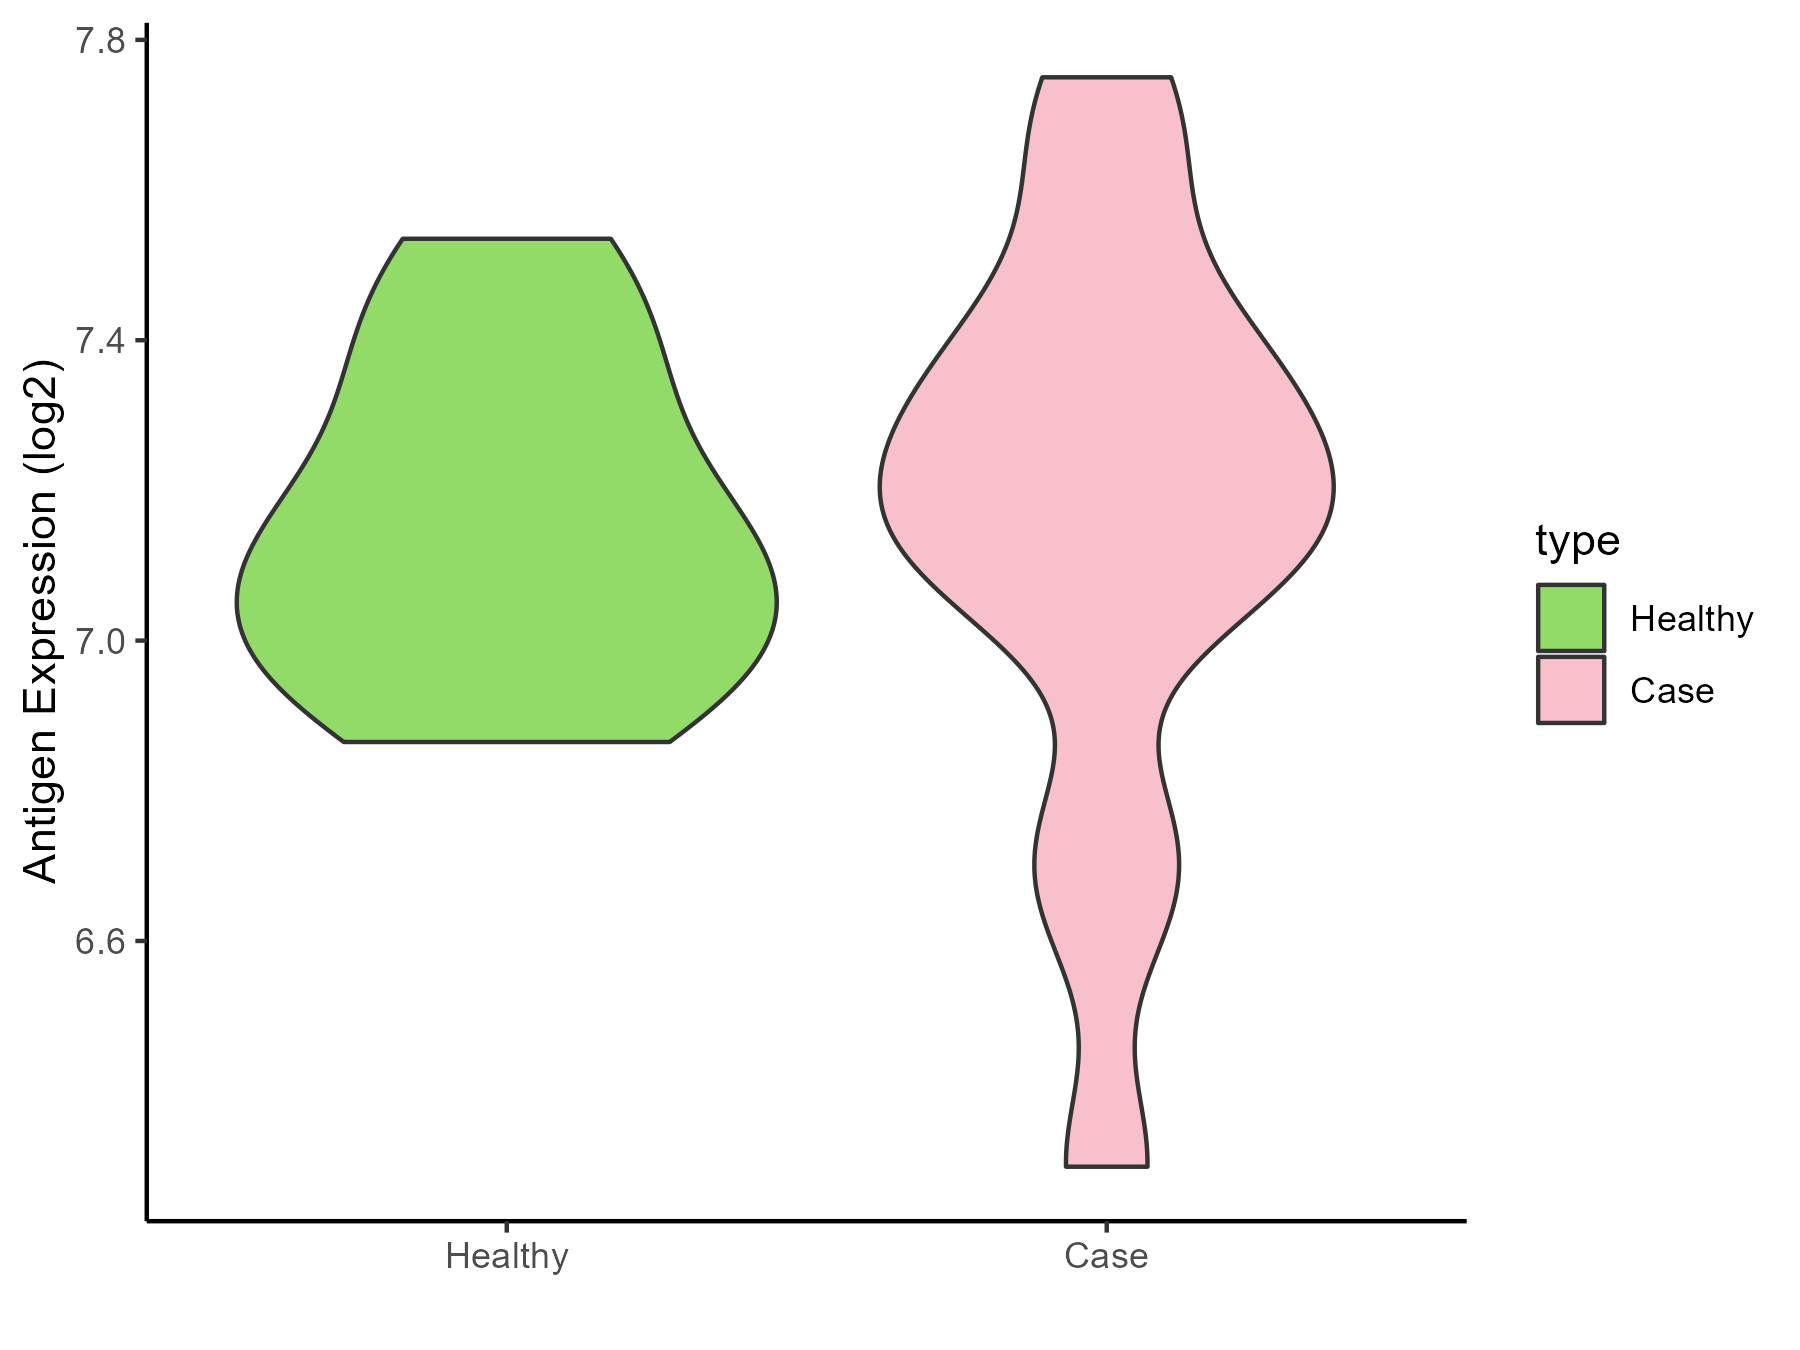
| The Studied Tissue | Peripheral blood | |
| The Specific Disease | Myeloma | |
| The Expression Level of Disease Section Compare with the Healthy Individual Tissue | p-value: 0.987970924; Fold-change: 0.063671707; Z-score: 0.297128094 | |
| Disease-specific Antigen Abundances |
|
Click to View the Clearer Original Diagram |
| Differential expression pattern of antigen in diseases | ||
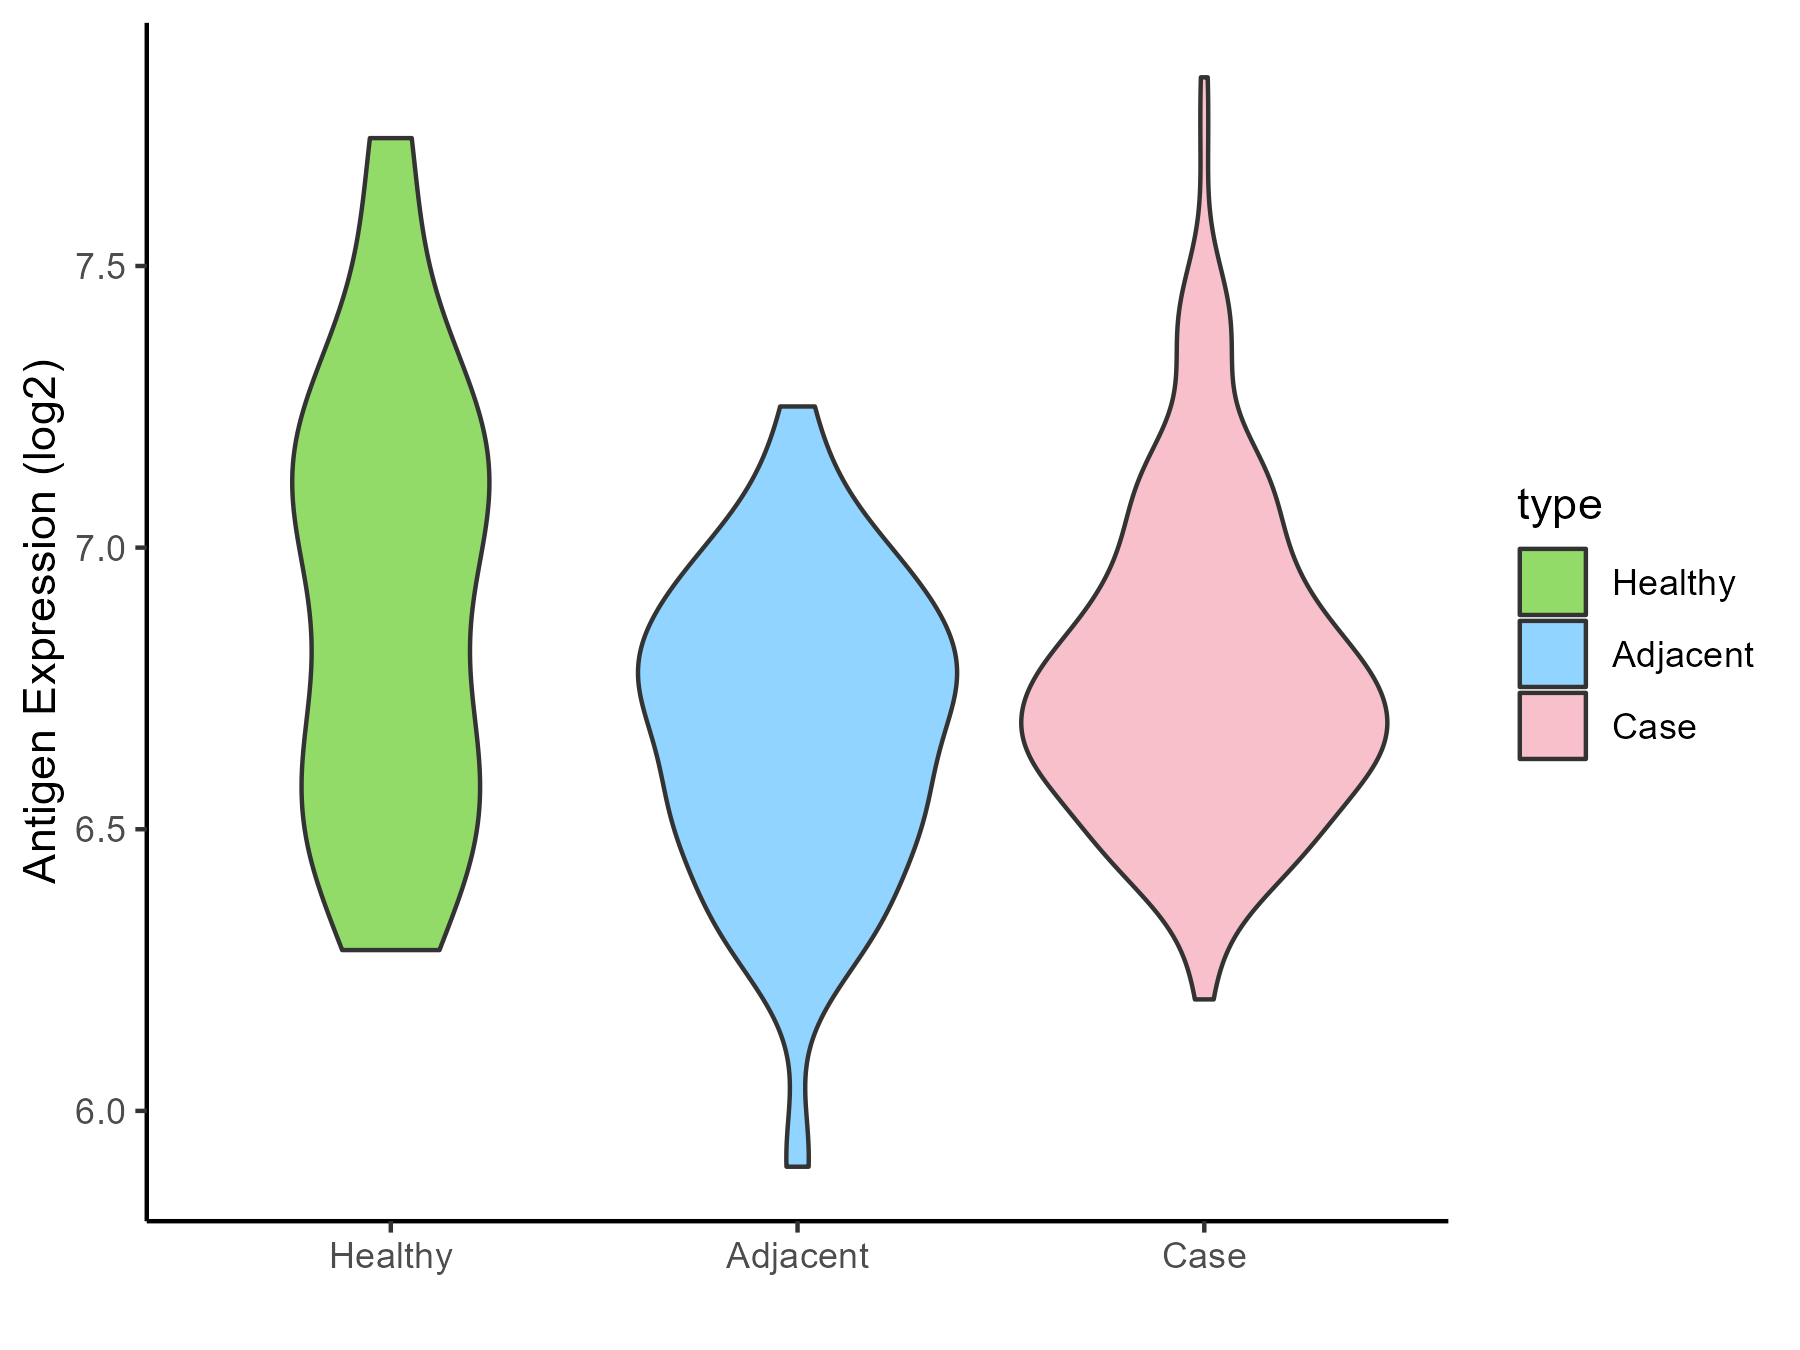
| The Studied Tissue | Oral | |
| The Specific Disease | Oral cancer | |
| The Expression Level of Disease Section Compare with the Healthy Individual Tissue | p-value: 0.122632762; Fold-change: -0.184693739; Z-score: -0.468622867 | |
| The Expression Level of Disease Section Compare with the Adjacent Tissue | p-value: 0.001522656; Fold-change: 0.035982763; Z-score: 0.134206588 | |
| Disease-specific Antigen Abundances |
|
Click to View the Clearer Original Diagram |
| Differential expression pattern of antigen in diseases | ||
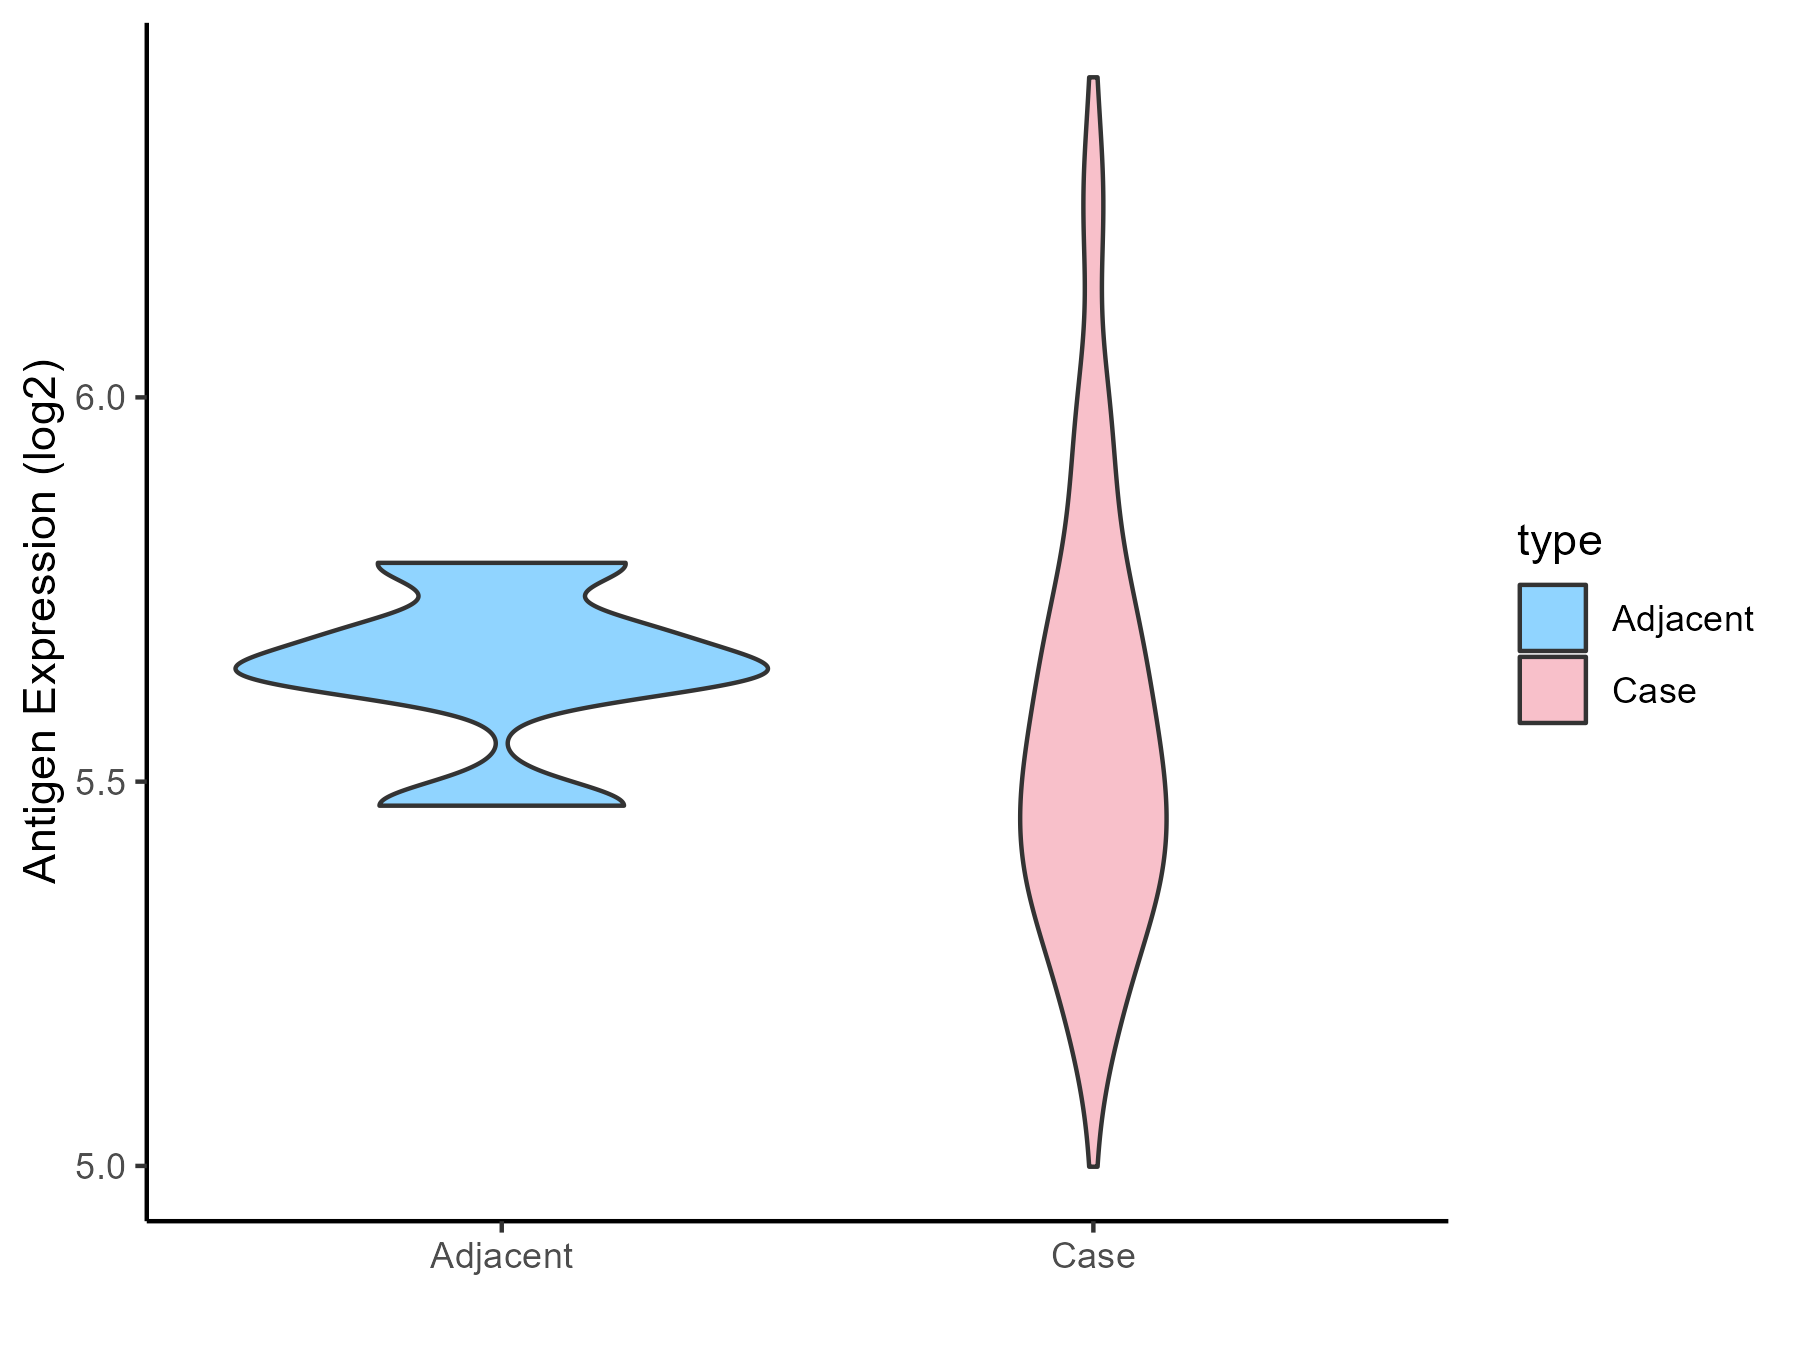
| The Studied Tissue | Esophagus | |
| The Specific Disease | Esophagal cancer | |
| The Expression Level of Disease Section Compare with the Adjacent Tissue | p-value: 0.24369991; Fold-change: -0.128075175; Z-score: -1.109307433 | |
| Disease-specific Antigen Abundances |
|
Click to View the Clearer Original Diagram |
| Differential expression pattern of antigen in diseases | ||
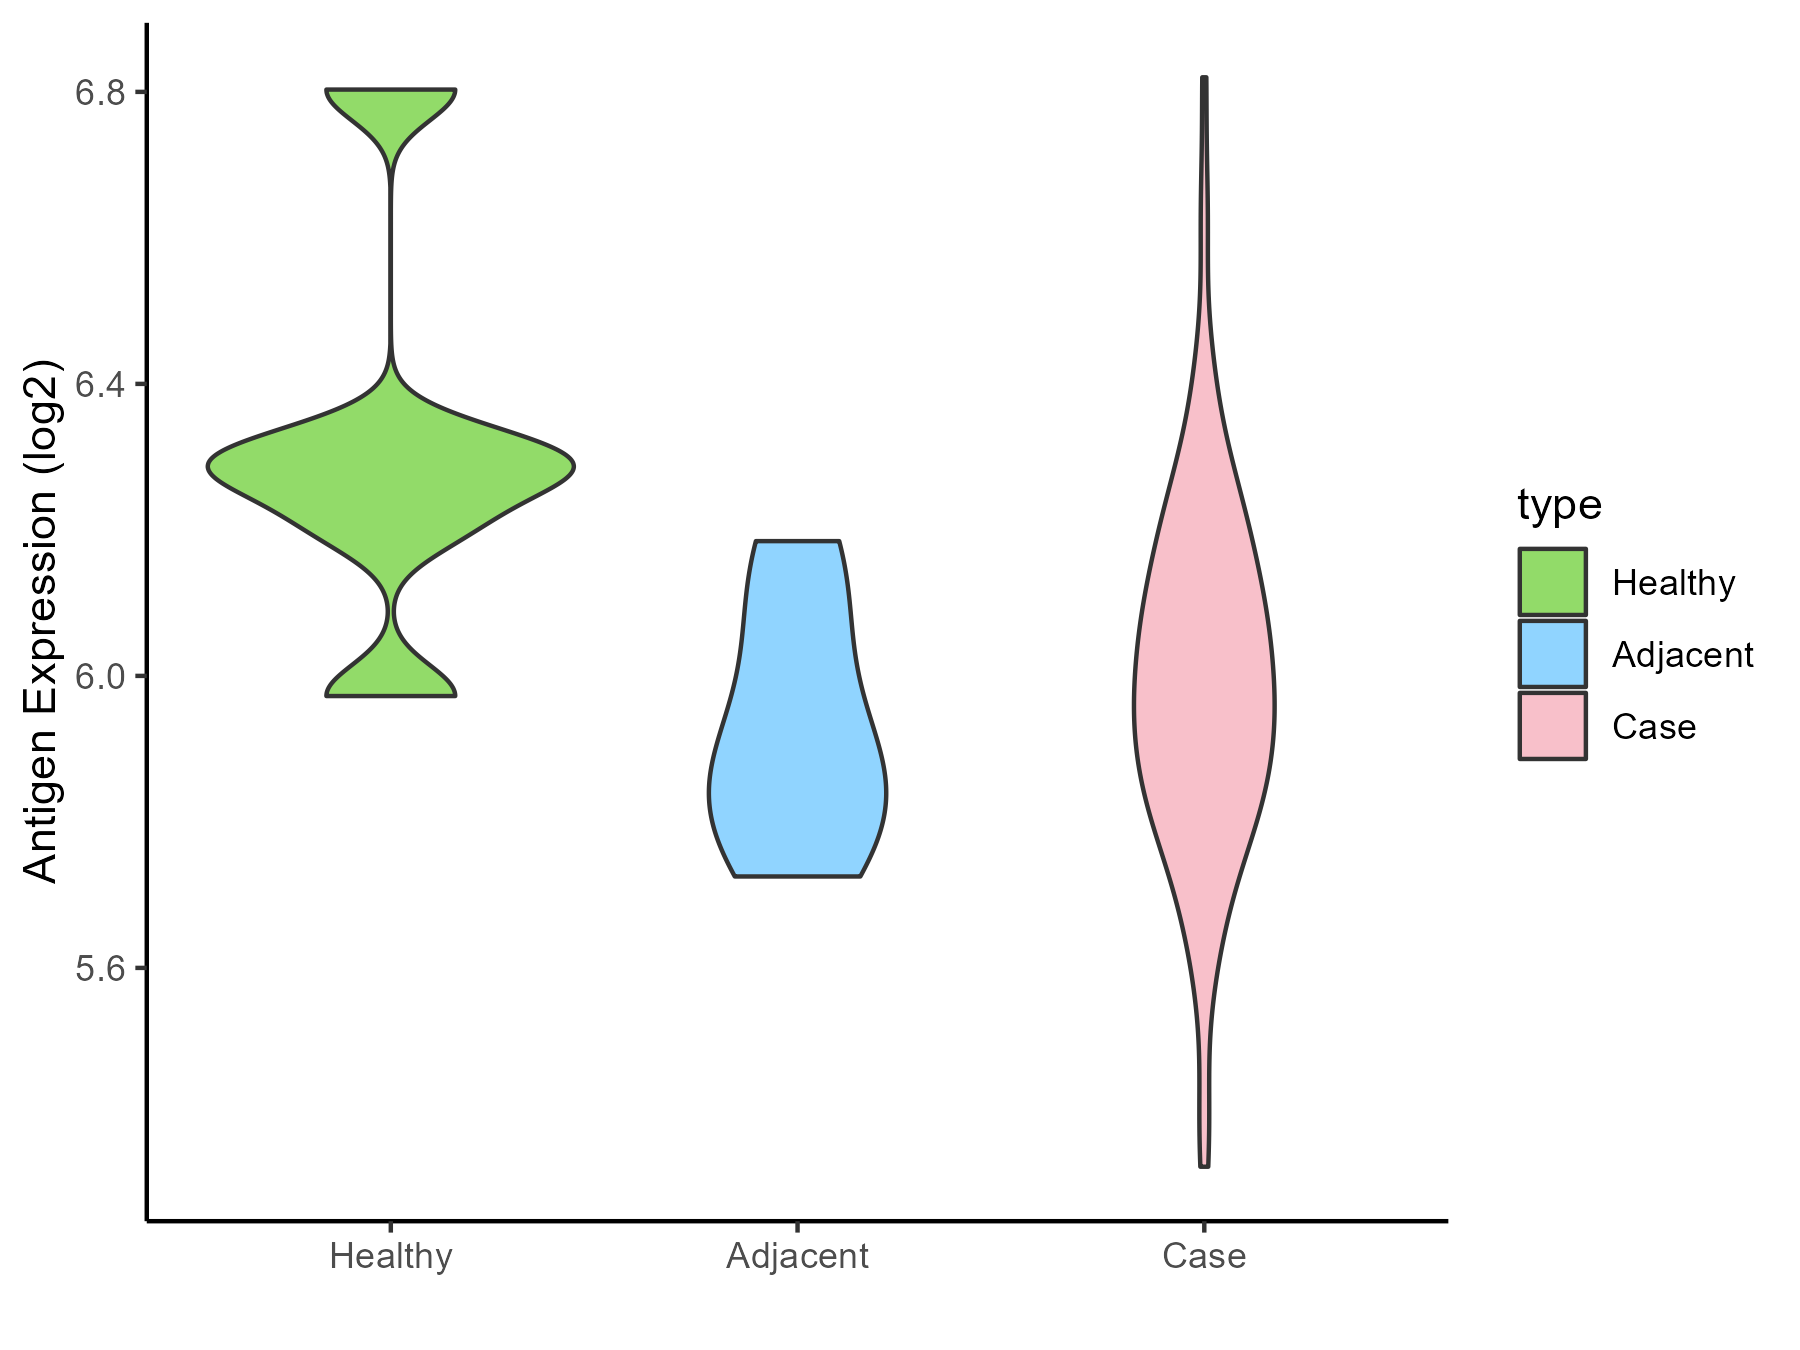
| The Studied Tissue | Rectal colon | |
| The Specific Disease | Rectal cancer | |
| The Expression Level of Disease Section Compare with the Healthy Individual Tissue | p-value: 0.035402891; Fold-change: -0.306622925; Z-score: -1.126676266 | |
| The Expression Level of Disease Section Compare with the Adjacent Tissue | p-value: 0.38942845; Fold-change: 0.085448144; Z-score: 0.500441642 | |
| Disease-specific Antigen Abundances |
|
Click to View the Clearer Original Diagram |
| Differential expression pattern of antigen in diseases | ||
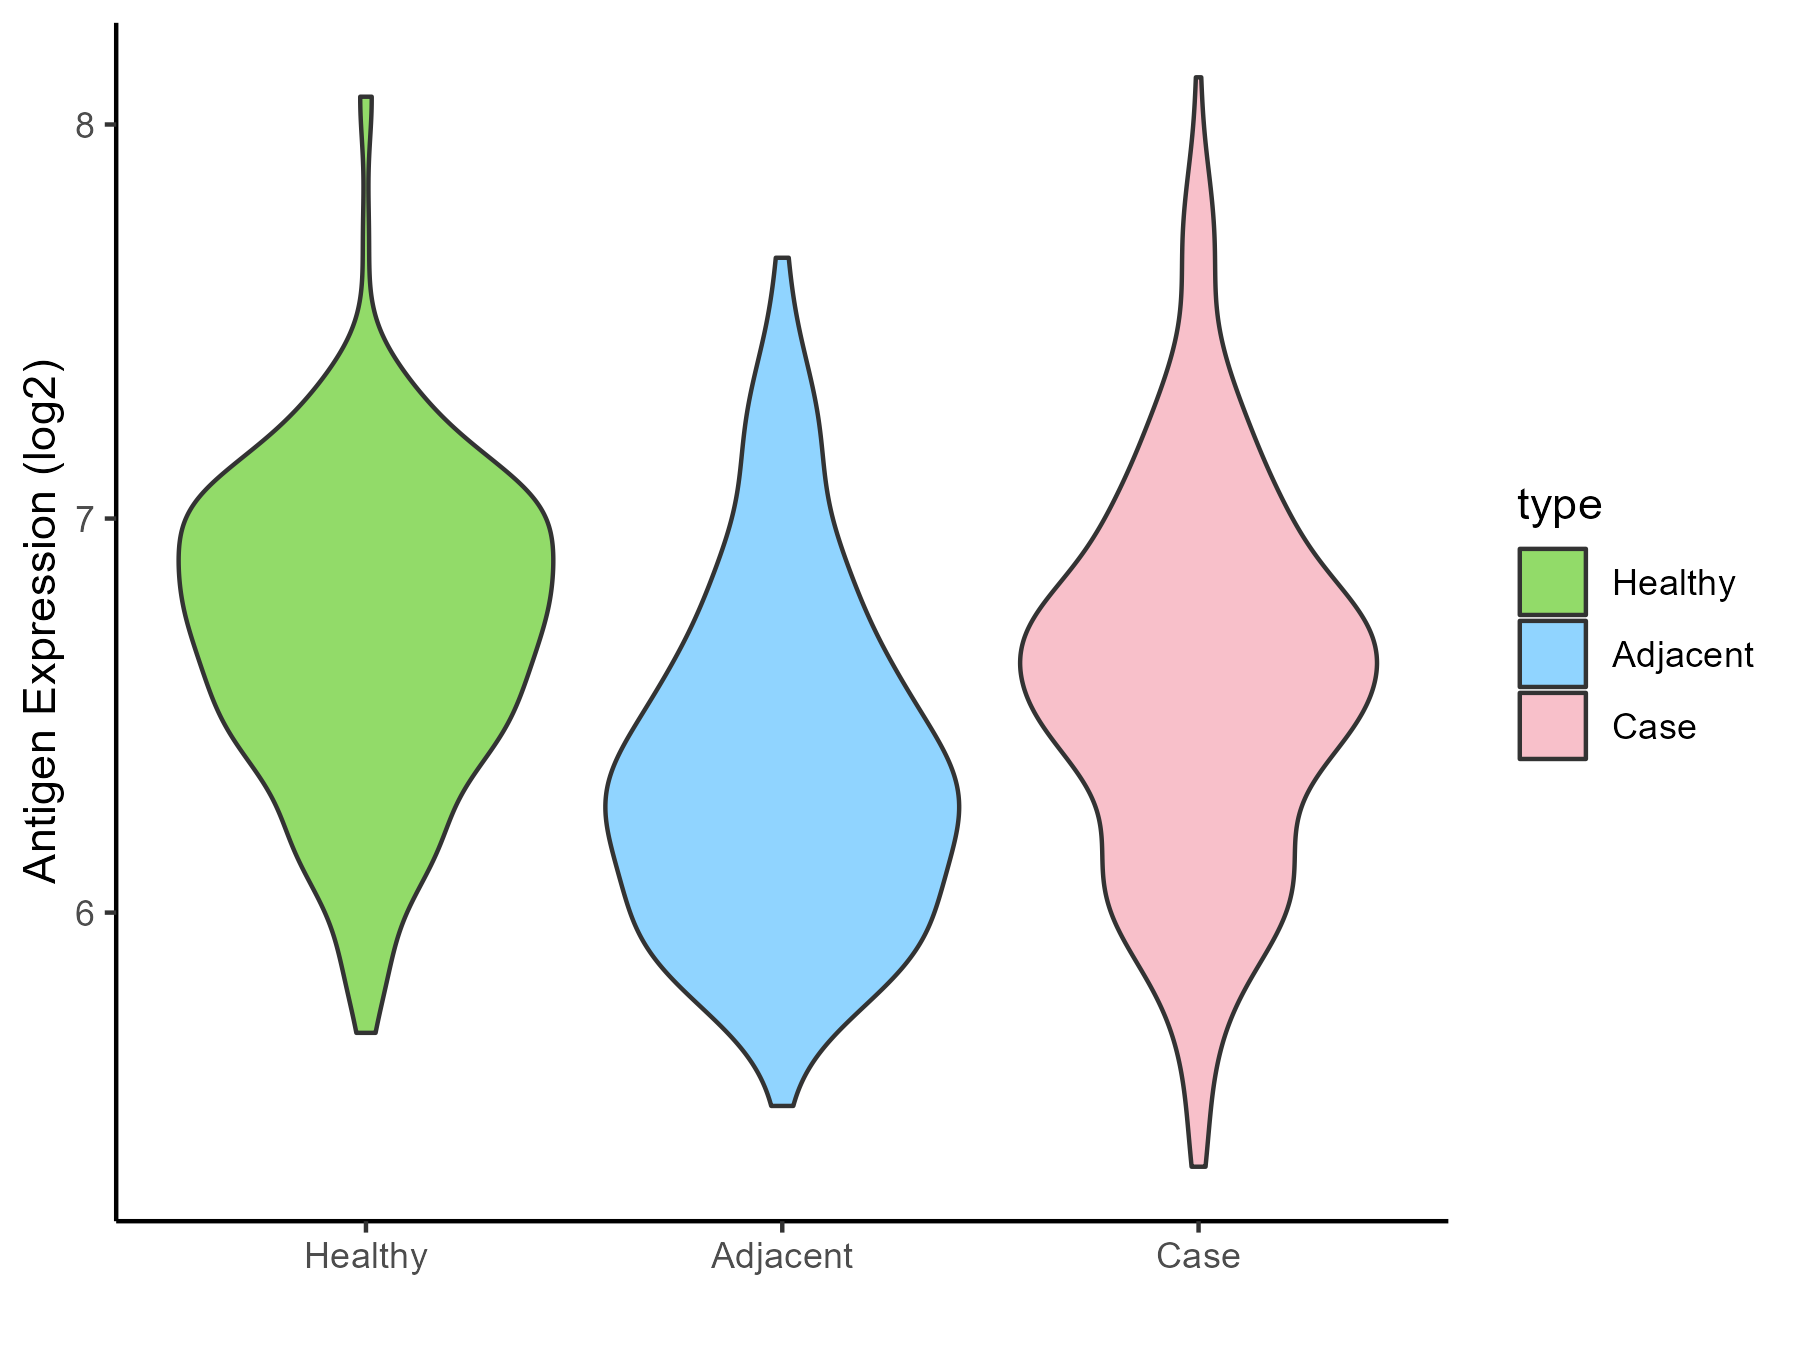
| The Studied Tissue | Skin | |
| The Specific Disease | Skin cancer | |
| The Expression Level of Disease Section Compare with the Healthy Individual Tissue | p-value: 9.67E-05; Fold-change: -0.178262299; Z-score: -0.460923063 | |
| The Expression Level of Disease Section Compare with the Adjacent Tissue | p-value: 3.21E-07; Fold-change: 0.256532956; Z-score: 0.597846083 | |
| Disease-specific Antigen Abundances |
|
Click to View the Clearer Original Diagram |
| Differential expression pattern of antigen in diseases | ||
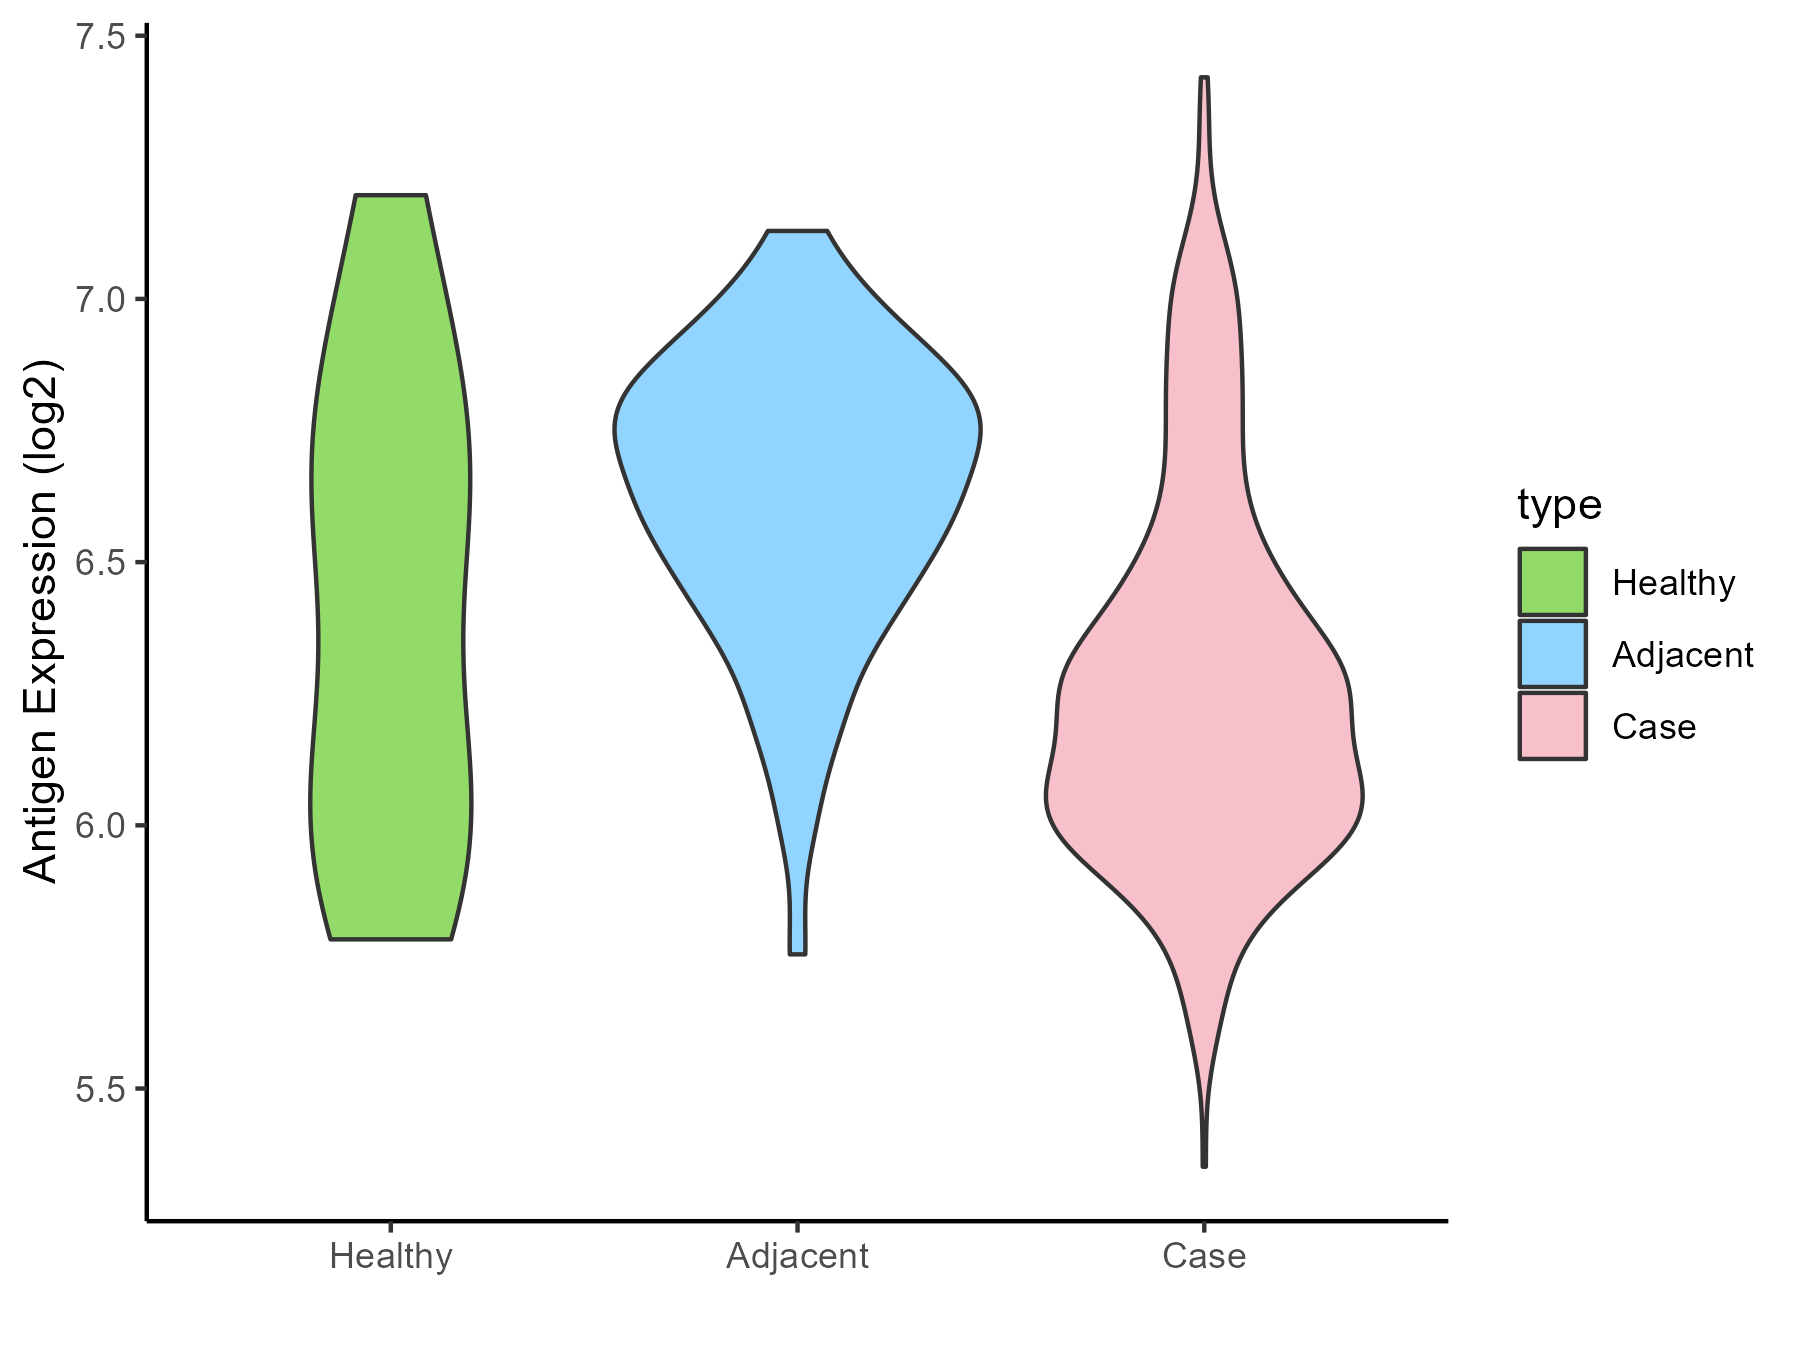
| The Studied Tissue | Kidney | |
| The Specific Disease | Renal cancer | |
| The Expression Level of Disease Section Compare with the Healthy Individual Tissue | p-value: 0.332204845; Fold-change: -0.327638566; Z-score: -0.708350304 | |
| The Expression Level of Disease Section Compare with the Adjacent Tissue | p-value: 2.23E-16; Fold-change: -0.433447426; Z-score: -1.589621537 | |
| Disease-specific Antigen Abundances |
|
Click to View the Clearer Original Diagram |
| Differential expression pattern of antigen in diseases | ||
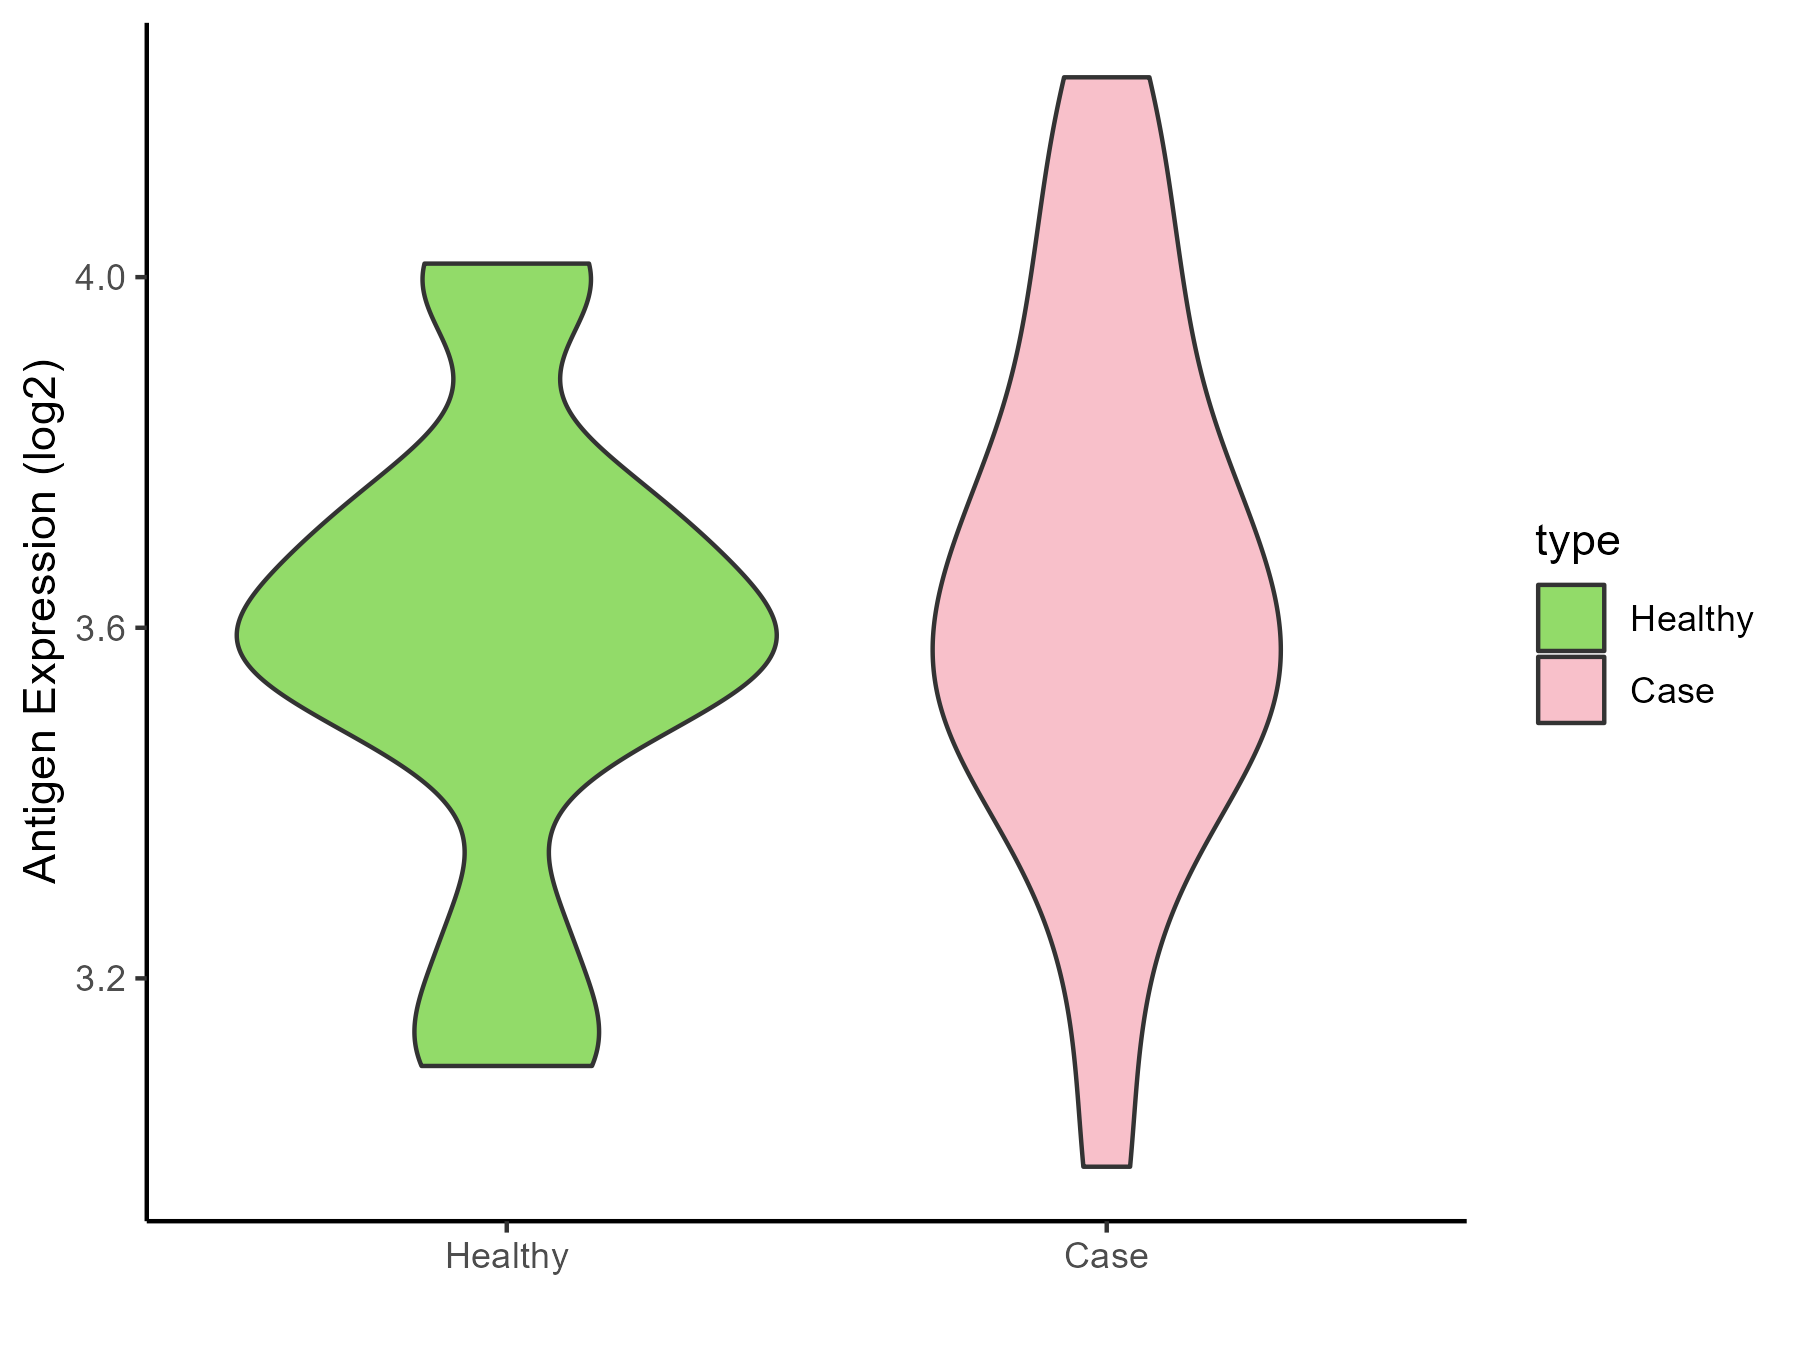
| The Studied Tissue | Urothelium | |
| The Specific Disease | Ureter cancer | |
| The Expression Level of Disease Section Compare with the Healthy Individual Tissue | p-value: 0.464179695; Fold-change: 0.017844978; Z-score: 0.067695207 | |
| Disease-specific Antigen Abundances |
|
Click to View the Clearer Original Diagram |
ICD Disease Classification 20
| Differential expression pattern of antigen in diseases | ||
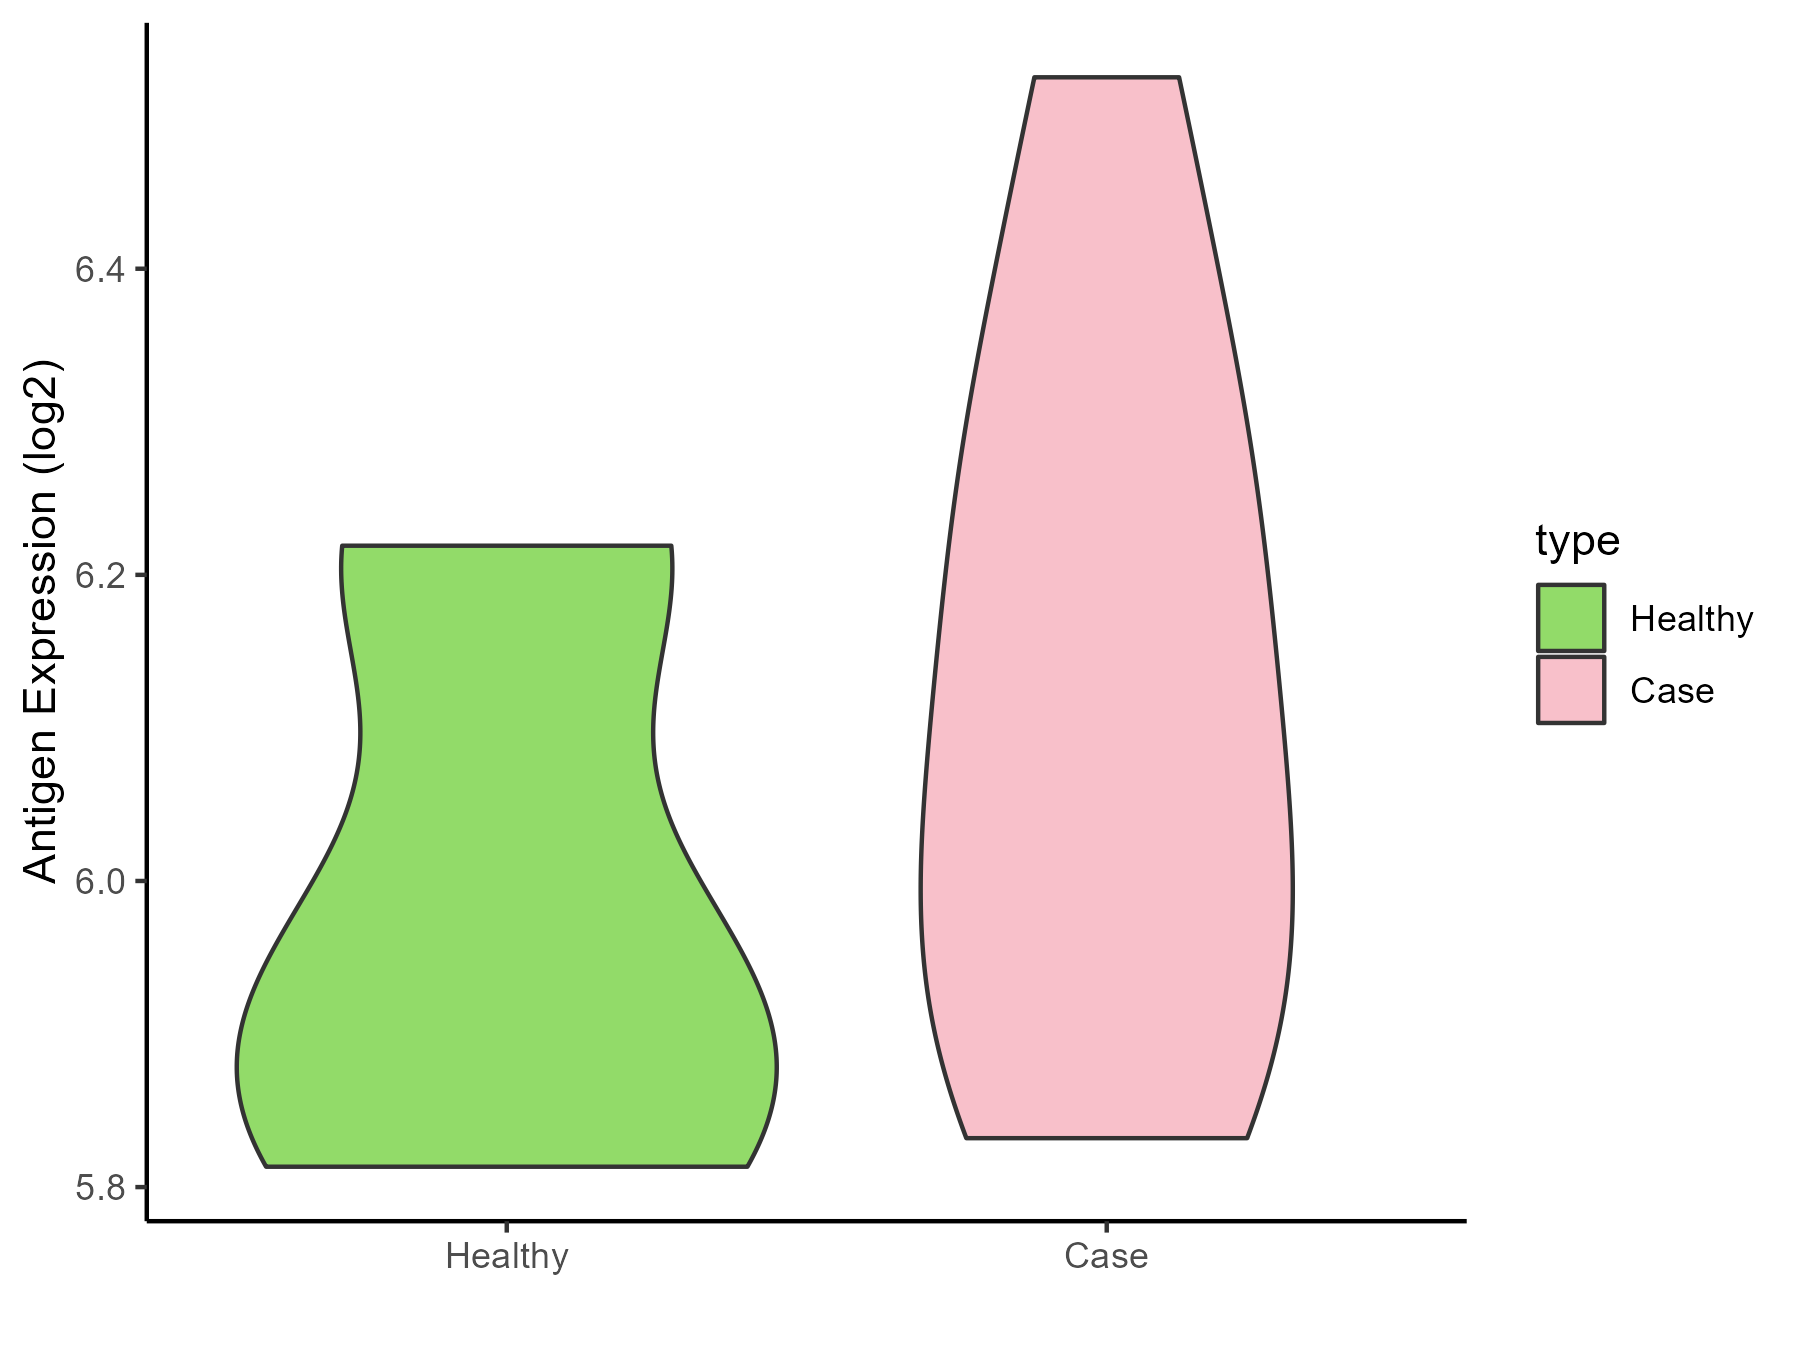
| The Studied Tissue | Adipose | |
| The Specific Disease | Simpson golabi behmel syndrome | |
| The Expression Level of Disease Section Compare with the Healthy Individual Tissue | p-value: 0.413057282; Fold-change: 0.121262979; Z-score: 0.583777355 | |
| Disease-specific Antigen Abundances |
|
Click to View the Clearer Original Diagram |
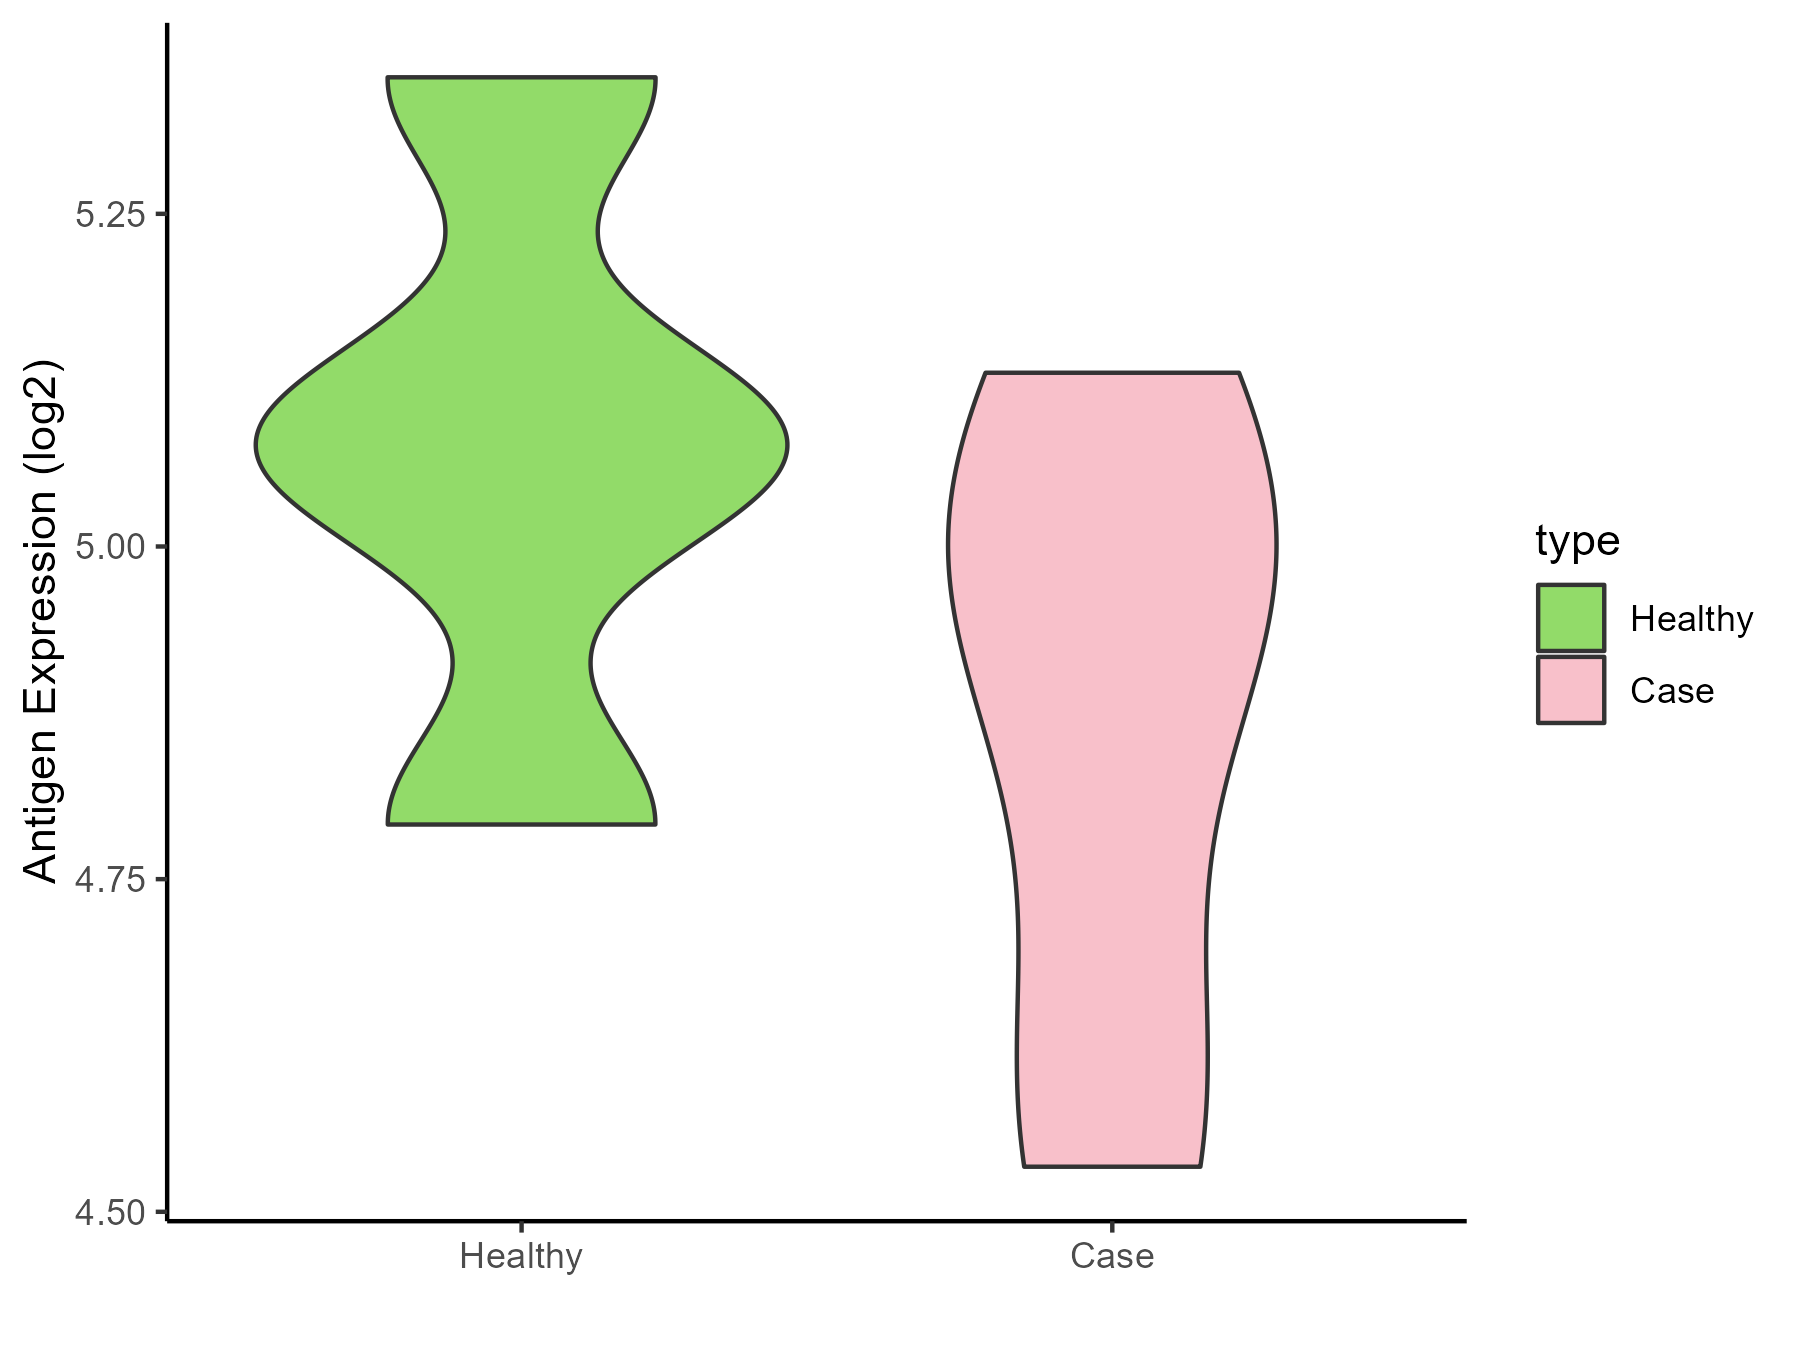
| Differential expression pattern of antigen in diseases | ||
| The Studied Tissue | Perituberal | |
| The Specific Disease | Tuberous sclerosis complex | |
| The Expression Level of Disease Section Compare with the Healthy Individual Tissue | p-value: 0.213594791; Fold-change: -0.131969221; Z-score: -0.575371046 | |
| Disease-specific Antigen Abundances |
|
Click to View the Clearer Original Diagram |
ICD Disease Classification 3
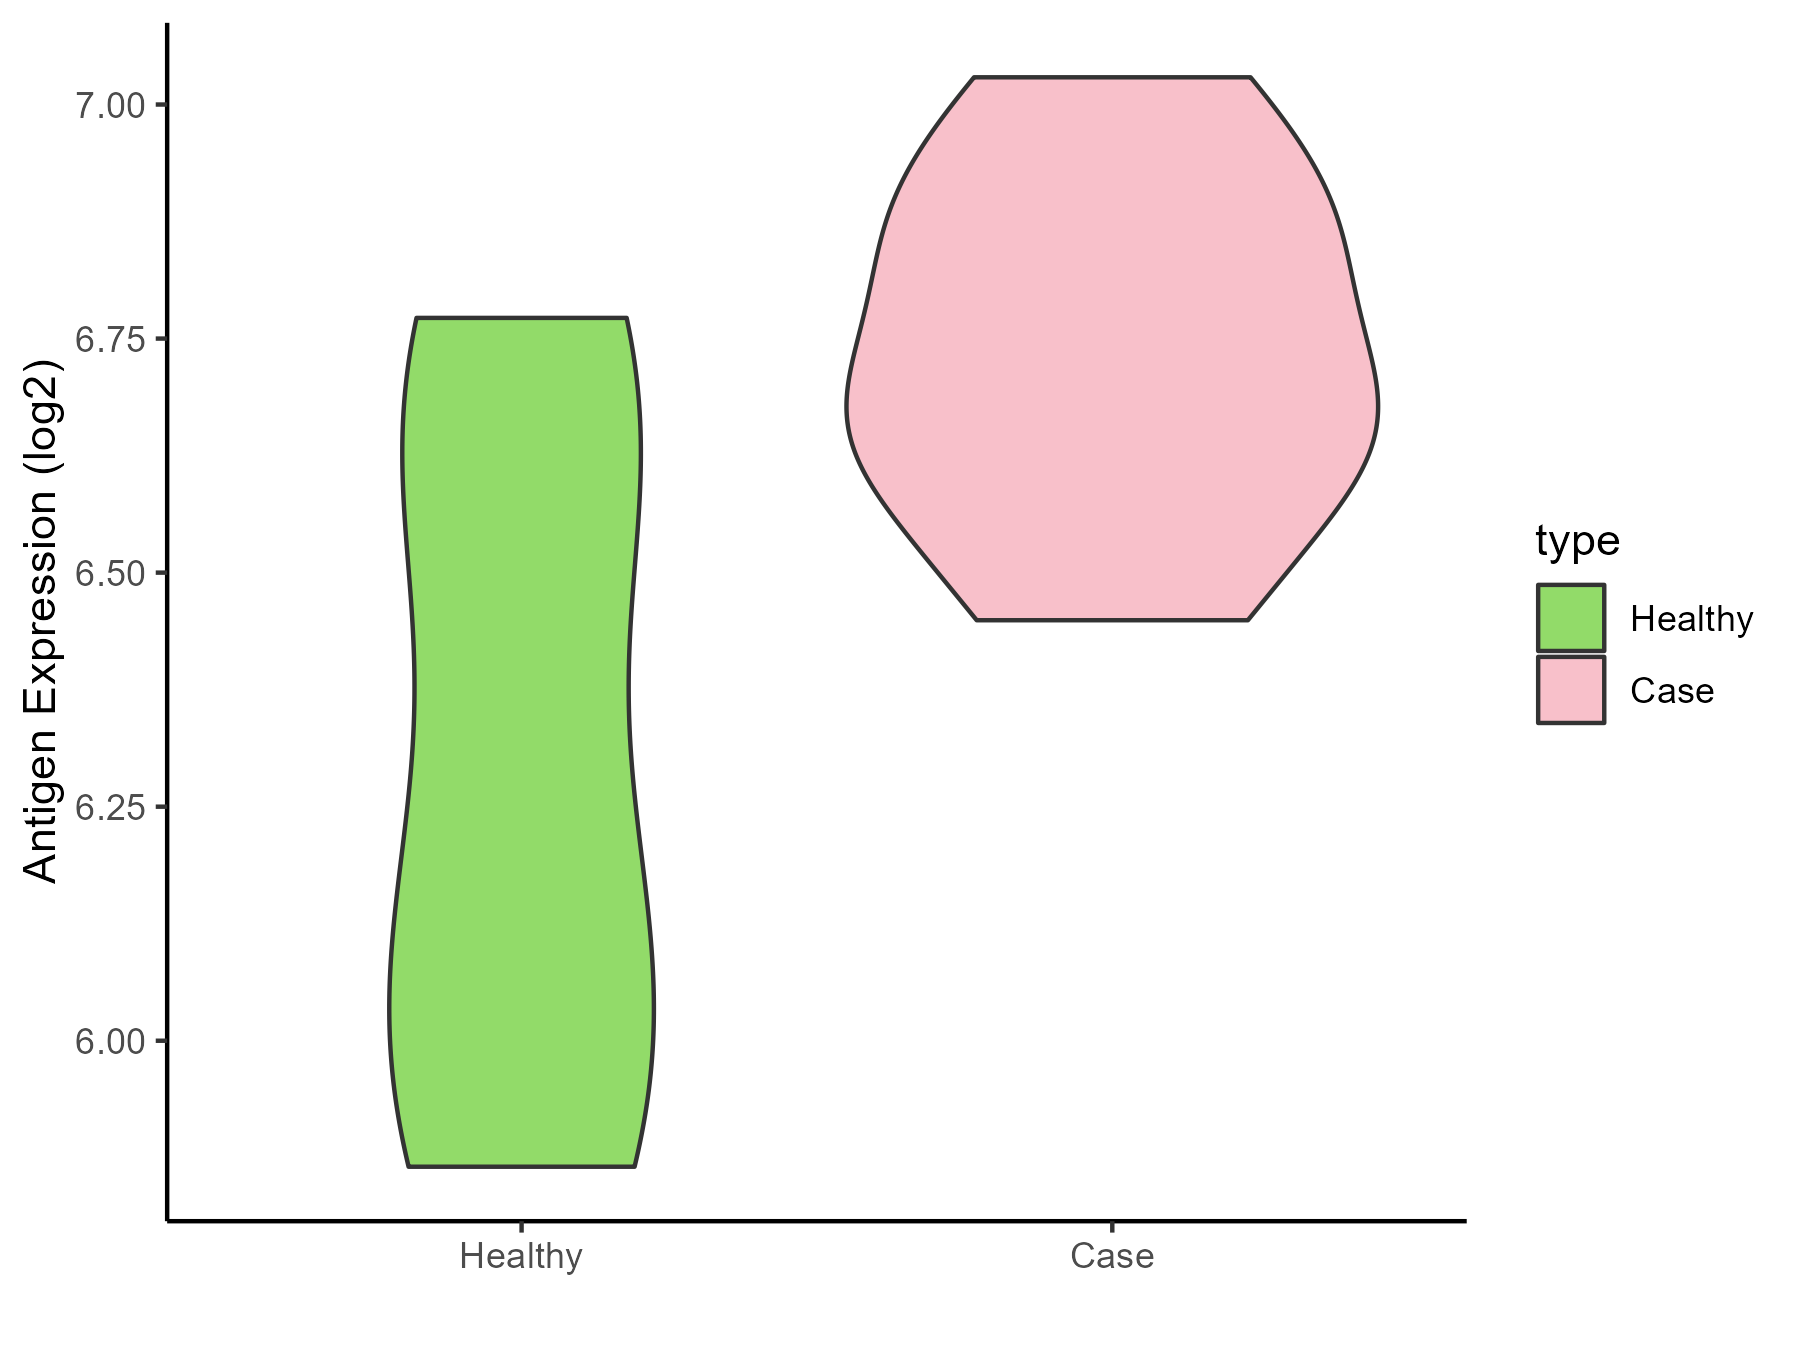
| Differential expression pattern of antigen in diseases | ||
| The Studied Tissue | Bone marrow | |
| The Specific Disease | Anemia | |
| The Expression Level of Disease Section Compare with the Healthy Individual Tissue | p-value: 0.022947124; Fold-change: 0.469168036; Z-score: 1.259668002 | |
| Disease-specific Antigen Abundances |
|
Click to View the Clearer Original Diagram |
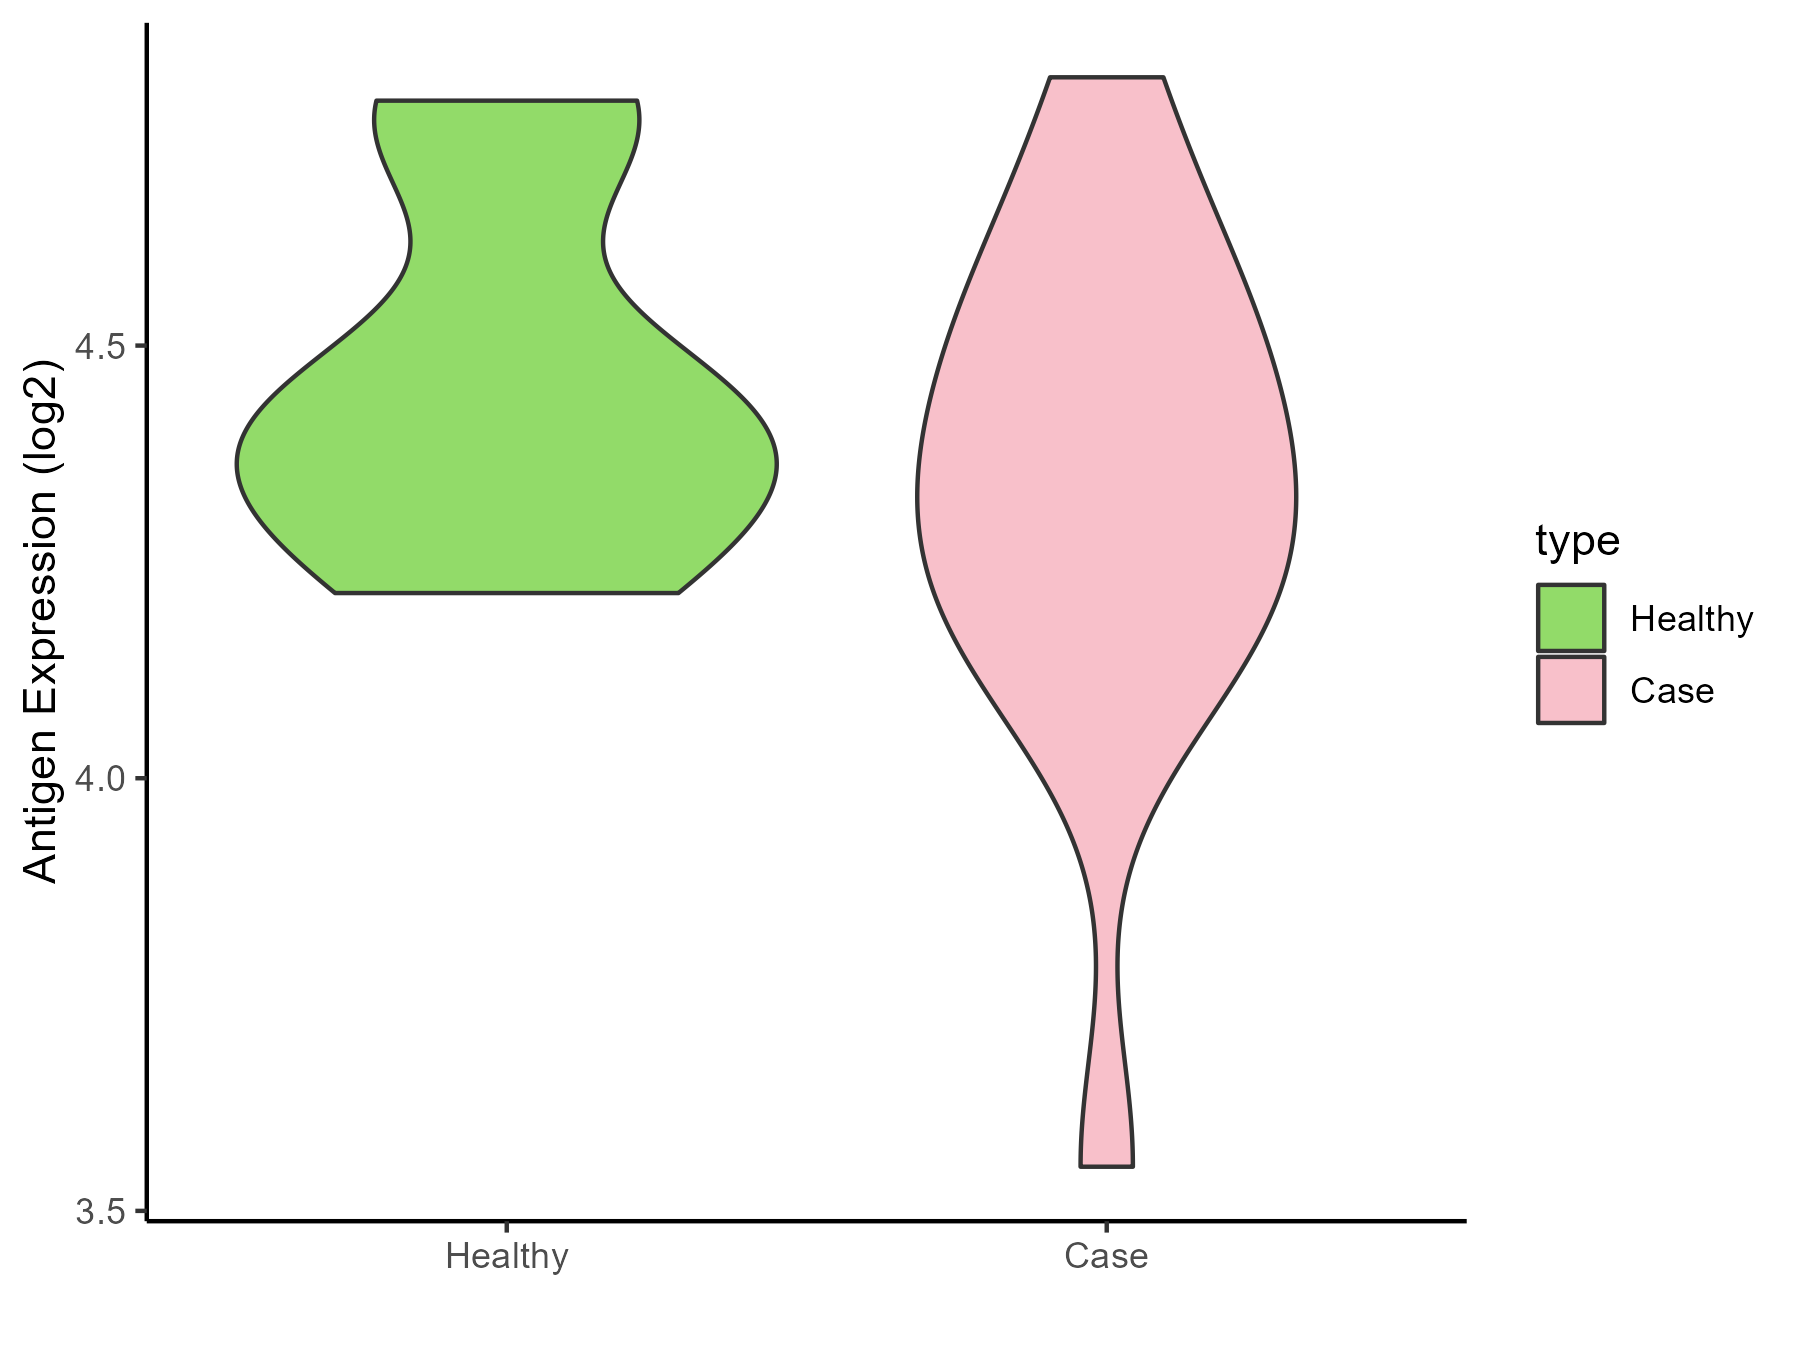
| Differential expression pattern of antigen in diseases | ||
| The Studied Tissue | Peripheral blood | |
| The Specific Disease | Sickle cell disease | |
| The Expression Level of Disease Section Compare with the Healthy Individual Tissue | p-value: 0.211651374; Fold-change: -0.0578628; Z-score: -0.276361017 | |
| Disease-specific Antigen Abundances |
|
Click to View the Clearer Original Diagram |
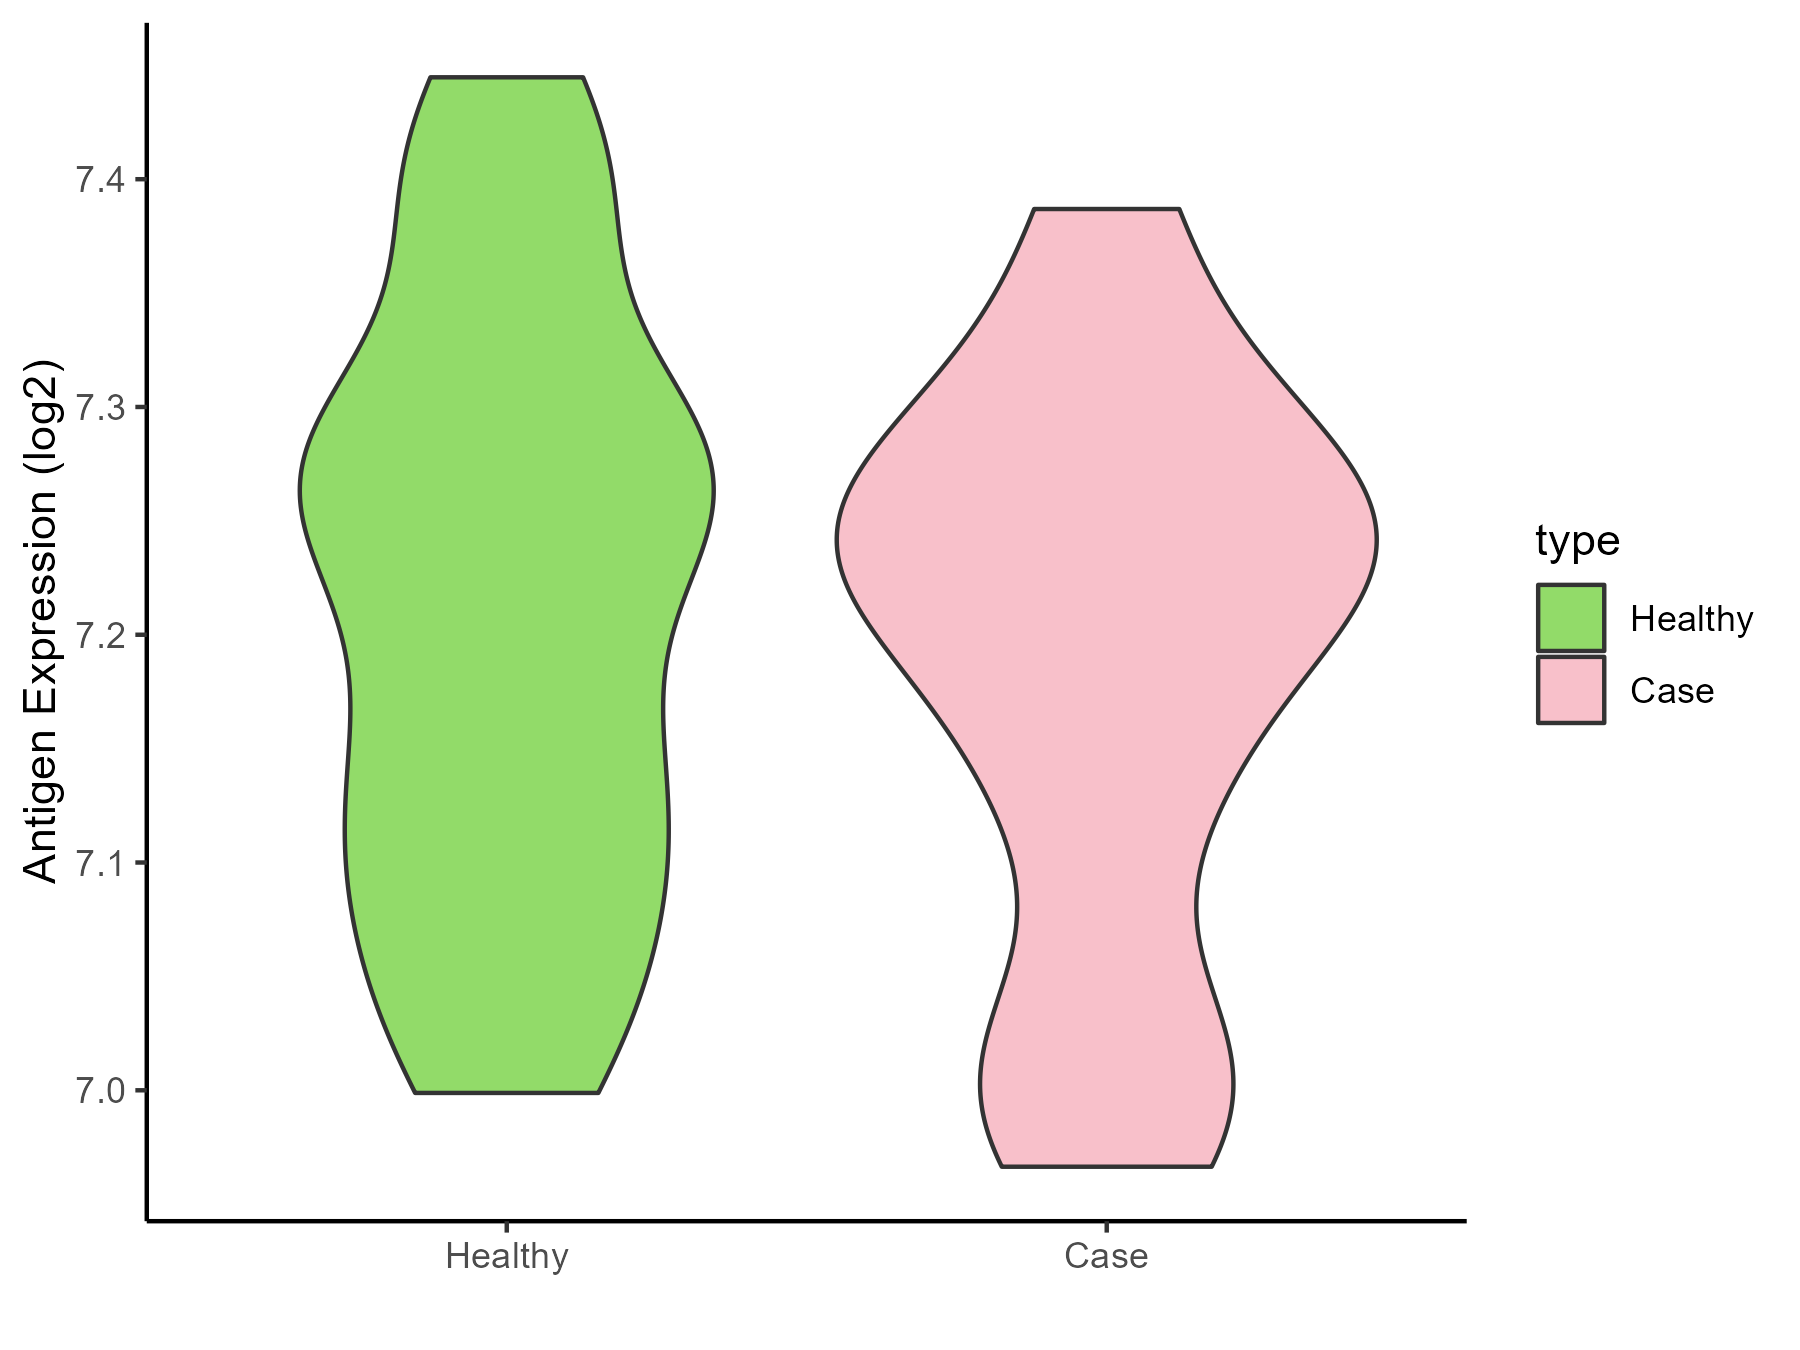
| Differential expression pattern of antigen in diseases | ||
| The Studied Tissue | Whole blood | |
| The Specific Disease | Thrombocythemia | |
| The Expression Level of Disease Section Compare with the Healthy Individual Tissue | p-value: 0.412845802; Fold-change: -0.023420035; Z-score: -0.179964929 | |
| Disease-specific Antigen Abundances |
|
Click to View the Clearer Original Diagram |
ICD Disease Classification 4
| Differential expression pattern of antigen in diseases | ||
| The Studied Tissue | Whole blood | |
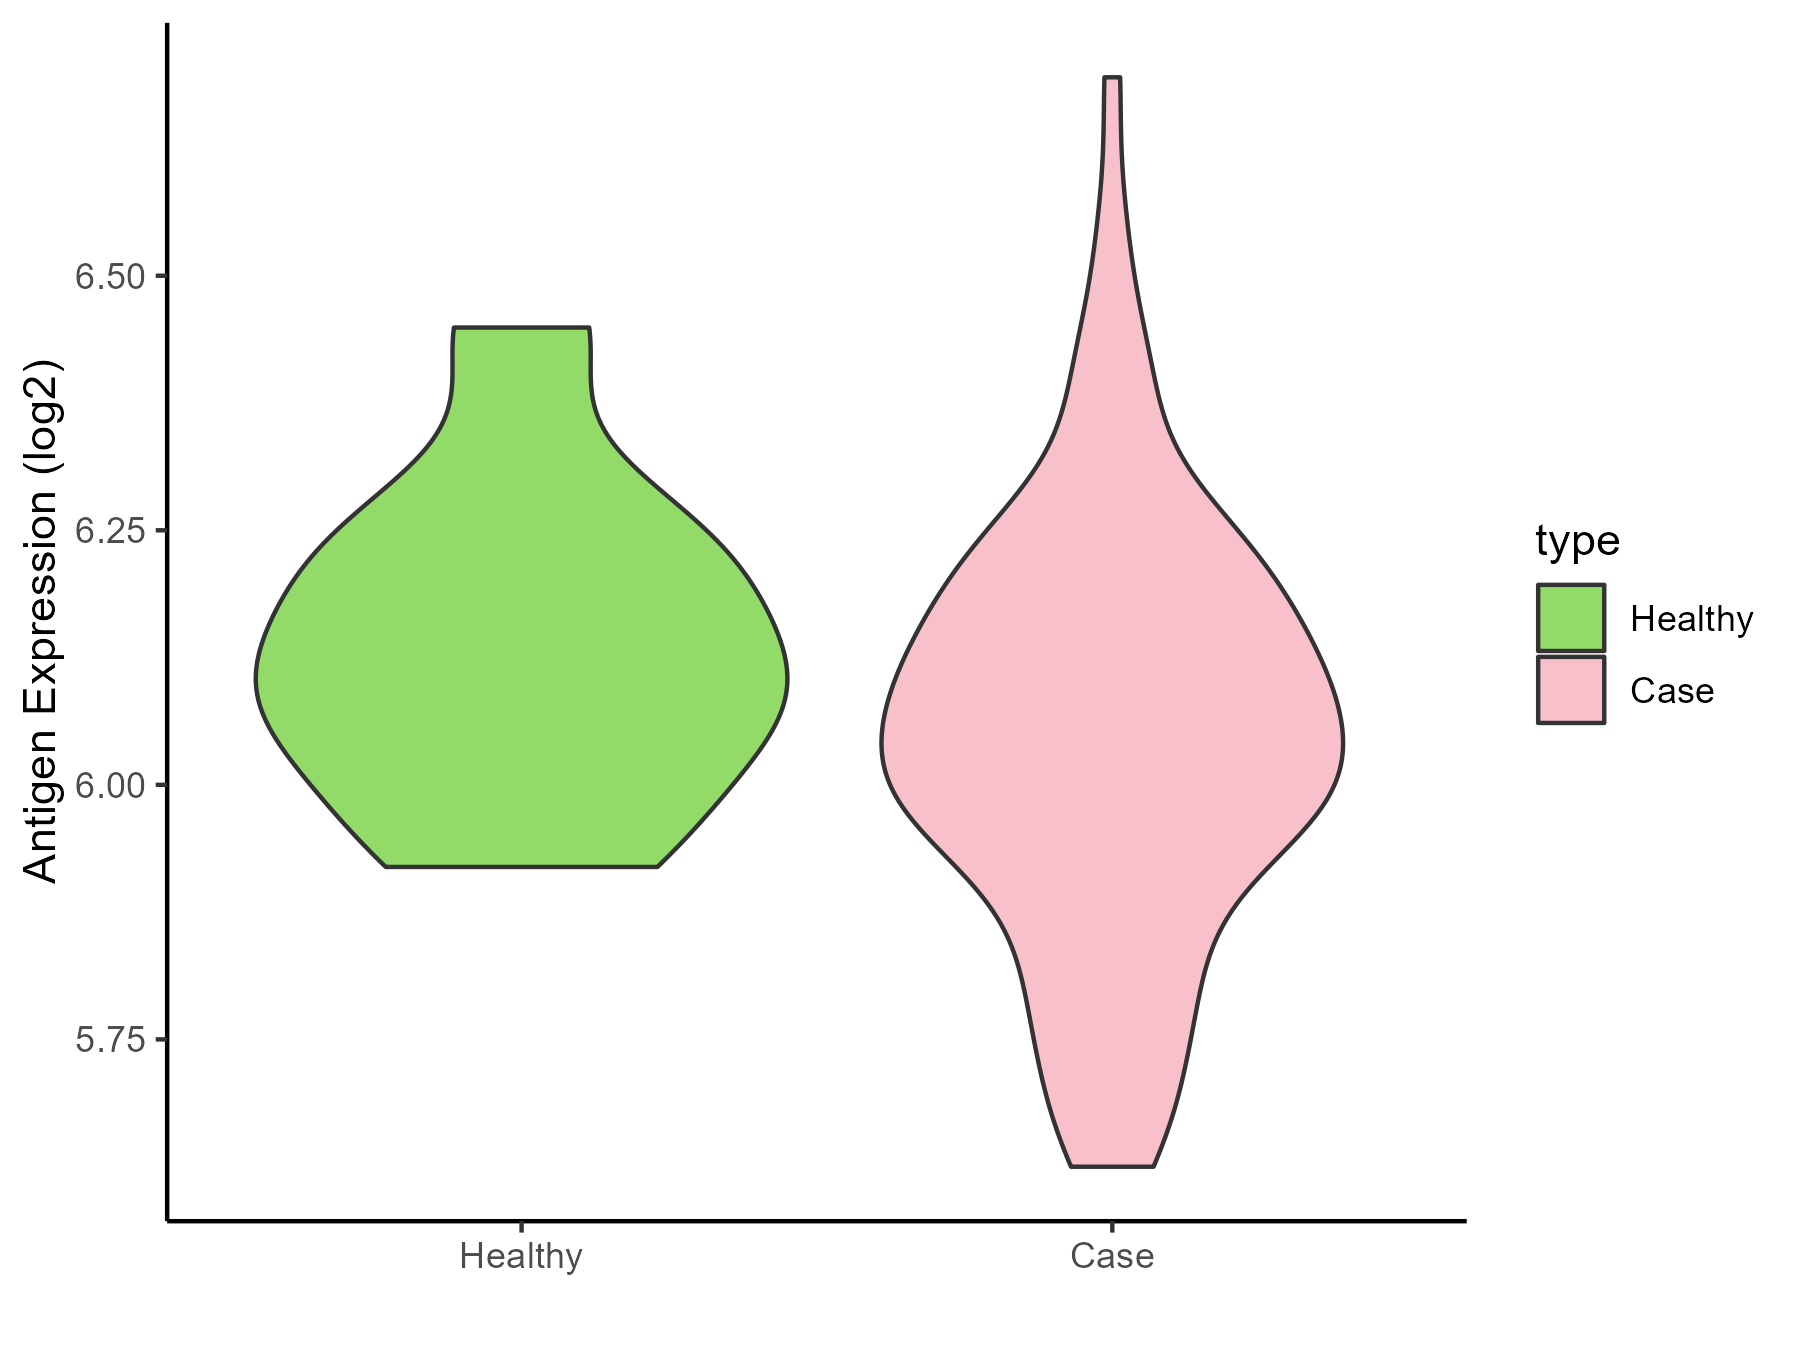
| The Specific Disease | Scleroderma | |
| The Expression Level of Disease Section Compare with the Healthy Individual Tissue | p-value: 0.155362837; Fold-change: -0.056003249; Z-score: -0.349173056 | |
| Disease-specific Antigen Abundances |
|
Click to View the Clearer Original Diagram |
| Differential expression pattern of antigen in diseases | ||
| The Studied Tissue | Salivary gland | |
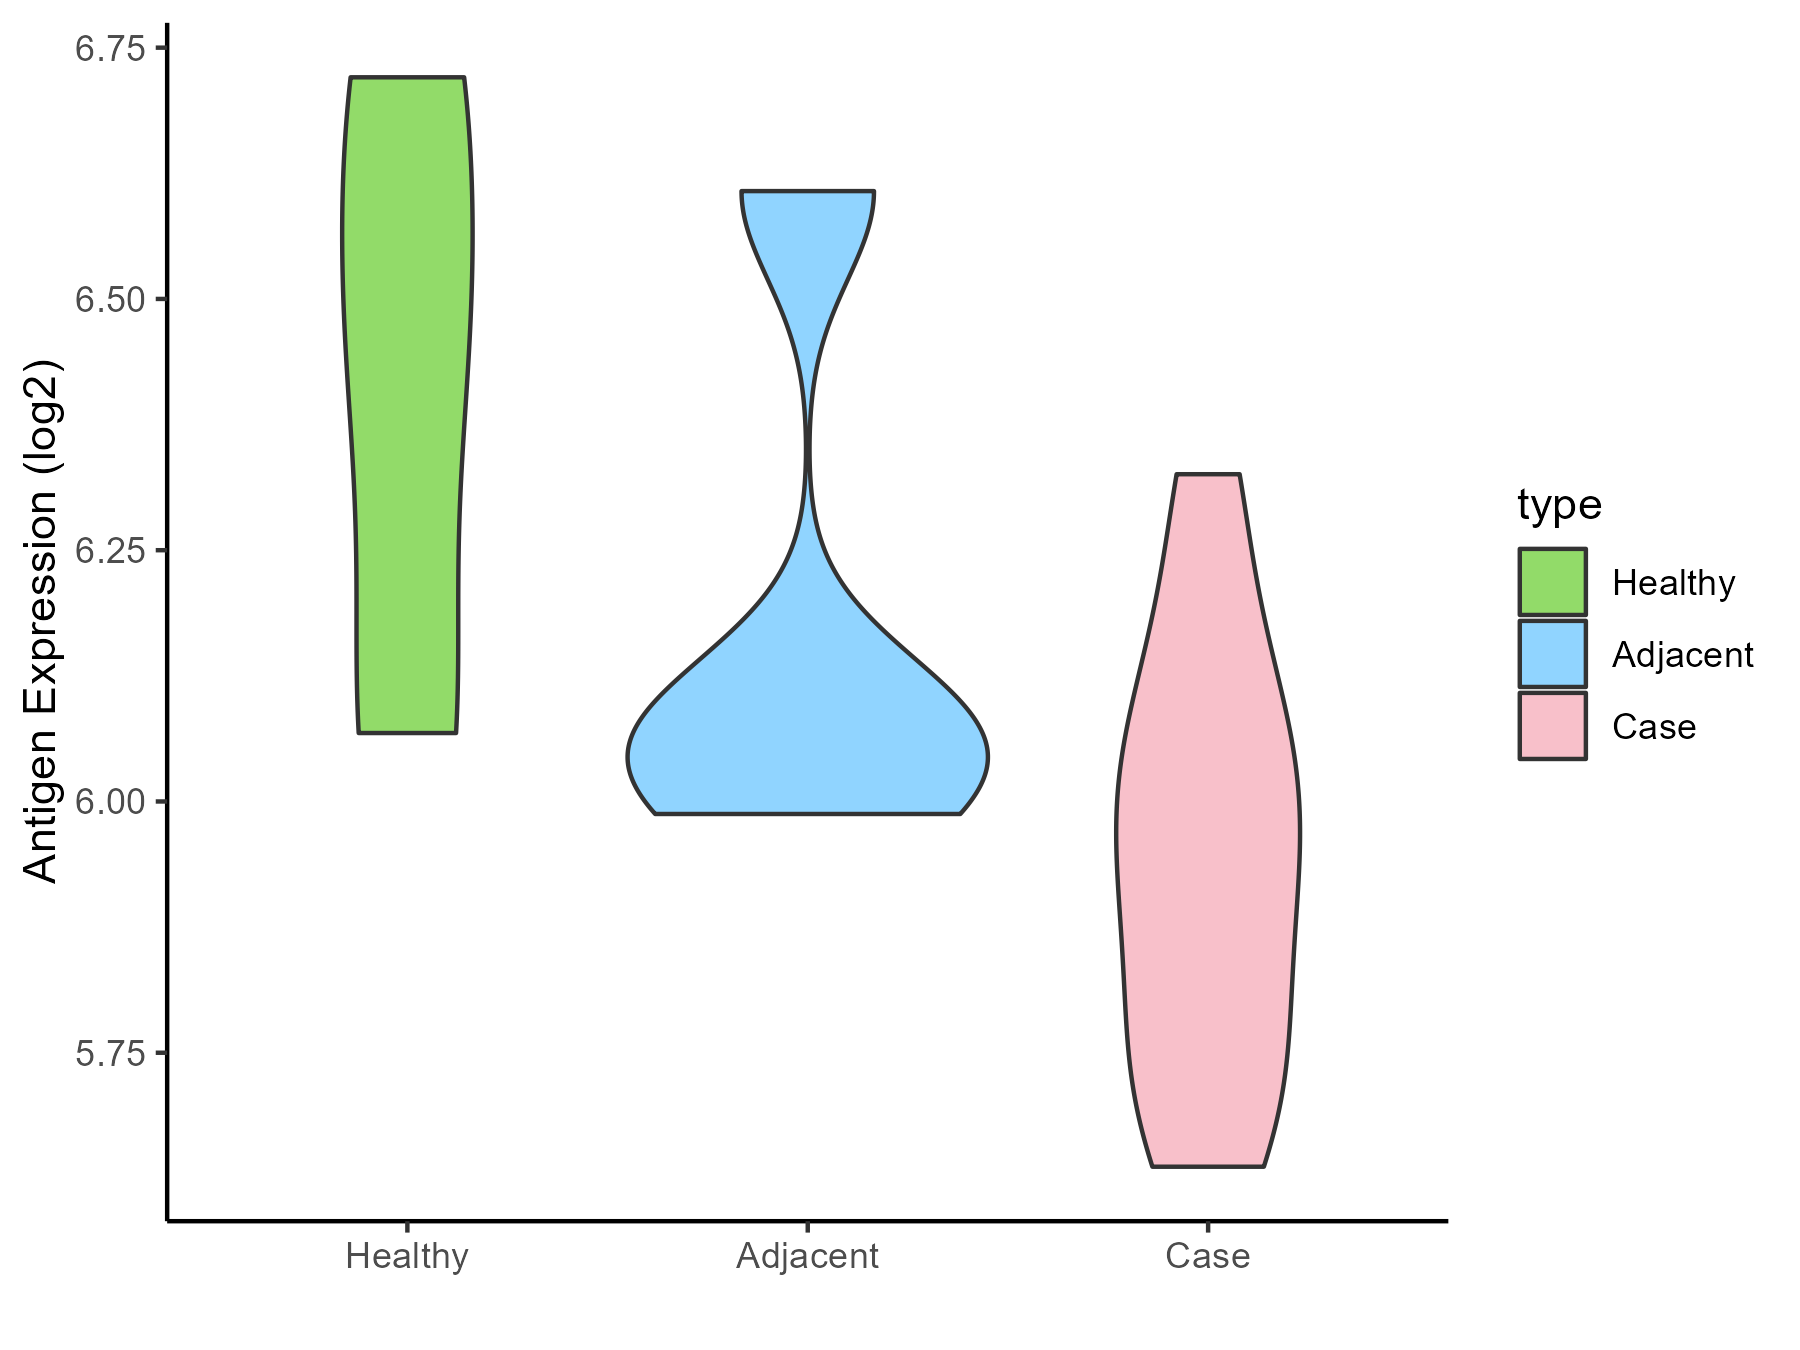
| The Specific Disease | Sjogren syndrome | |
| The Expression Level of Disease Section Compare with the Healthy Individual Tissue | p-value: 0.123331562; Fold-change: -0.479234945; Z-score: -1.463768409 | |
| The Expression Level of Disease Section Compare with the Adjacent Tissue | p-value: 0.189693517; Fold-change: -0.105387193; Z-score: -0.369057488 | |
| Disease-specific Antigen Abundances |
|
Click to View the Clearer Original Diagram |
| Differential expression pattern of antigen in diseases | ||
| The Studied Tissue | Peripheral blood | |
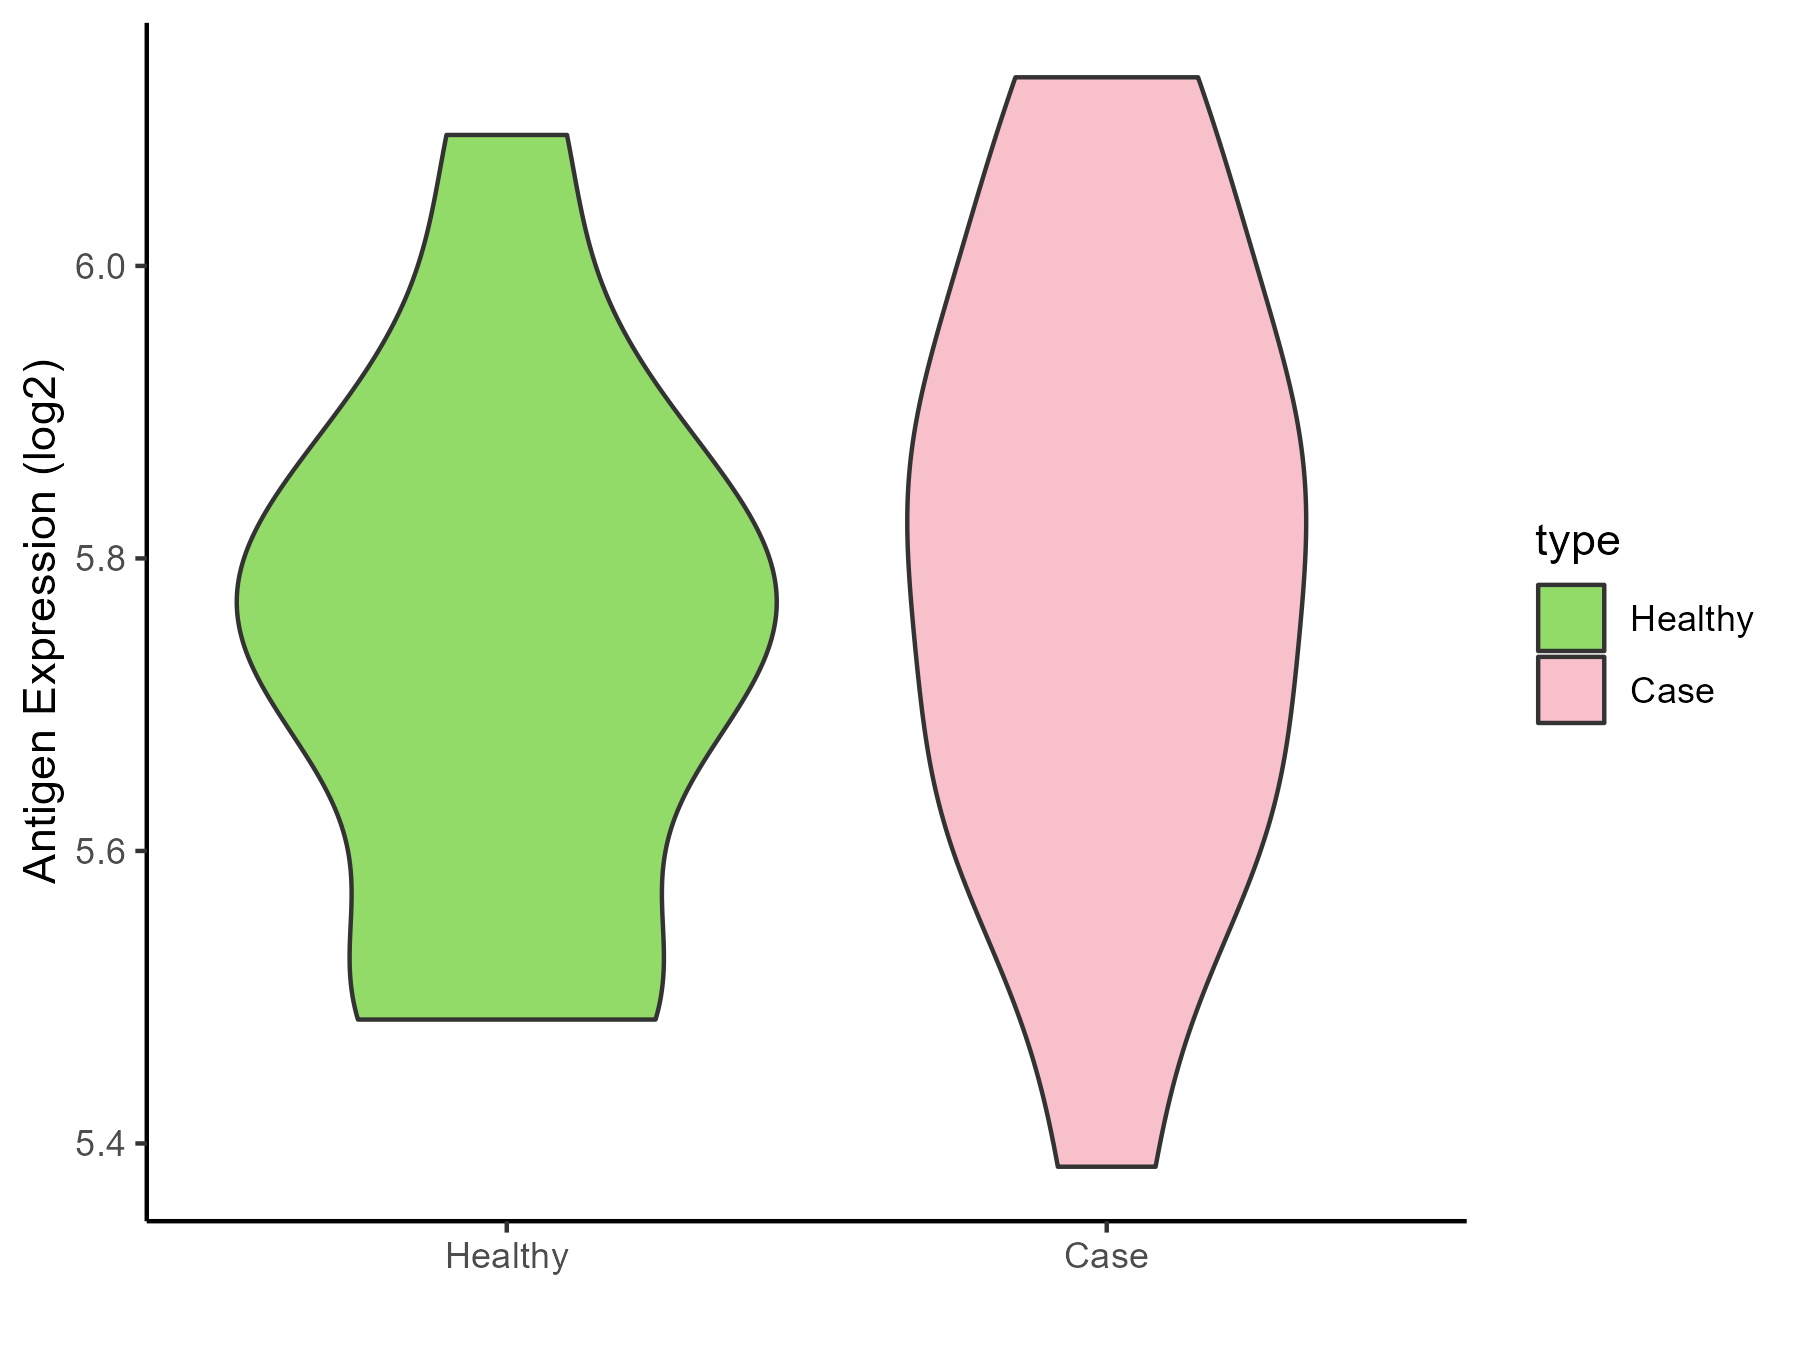
| The Specific Disease | Behcet disease | |
| The Expression Level of Disease Section Compare with the Healthy Individual Tissue | p-value: 0.487002369; Fold-change: 0.073822547; Z-score: 0.400582982 | |
| Disease-specific Antigen Abundances |
|
Click to View the Clearer Original Diagram |
| Differential expression pattern of antigen in diseases | ||
| The Studied Tissue | Whole blood | |
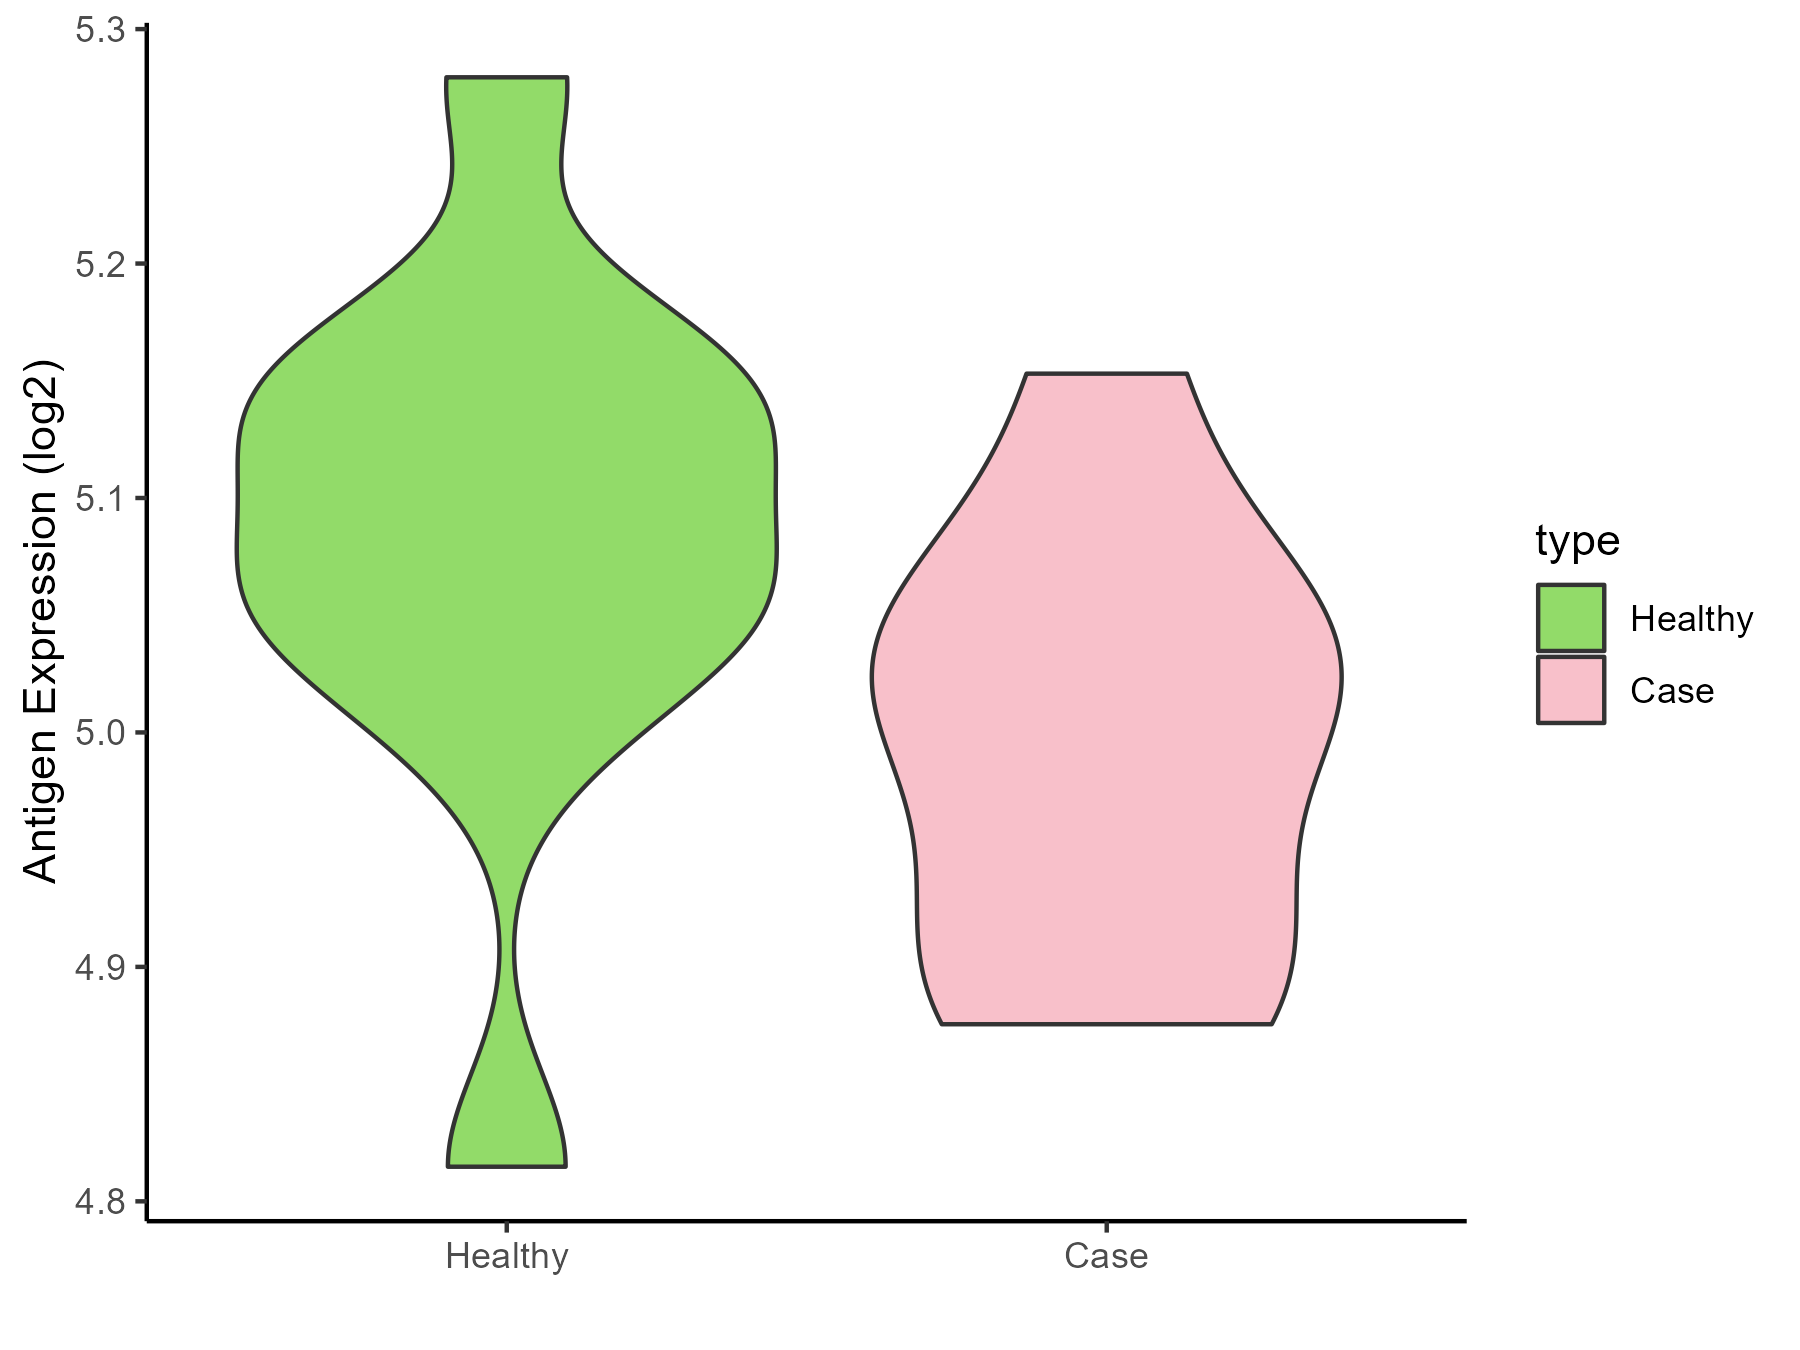
| The Specific Disease | Autosomal dominant monocytopenia | |
| The Expression Level of Disease Section Compare with the Healthy Individual Tissue | p-value: 0.079933529; Fold-change: -0.076891126; Z-score: -0.657591134 | |
| Disease-specific Antigen Abundances |
|
Click to View the Clearer Original Diagram |
ICD Disease Classification 5
| Differential expression pattern of antigen in diseases | ||
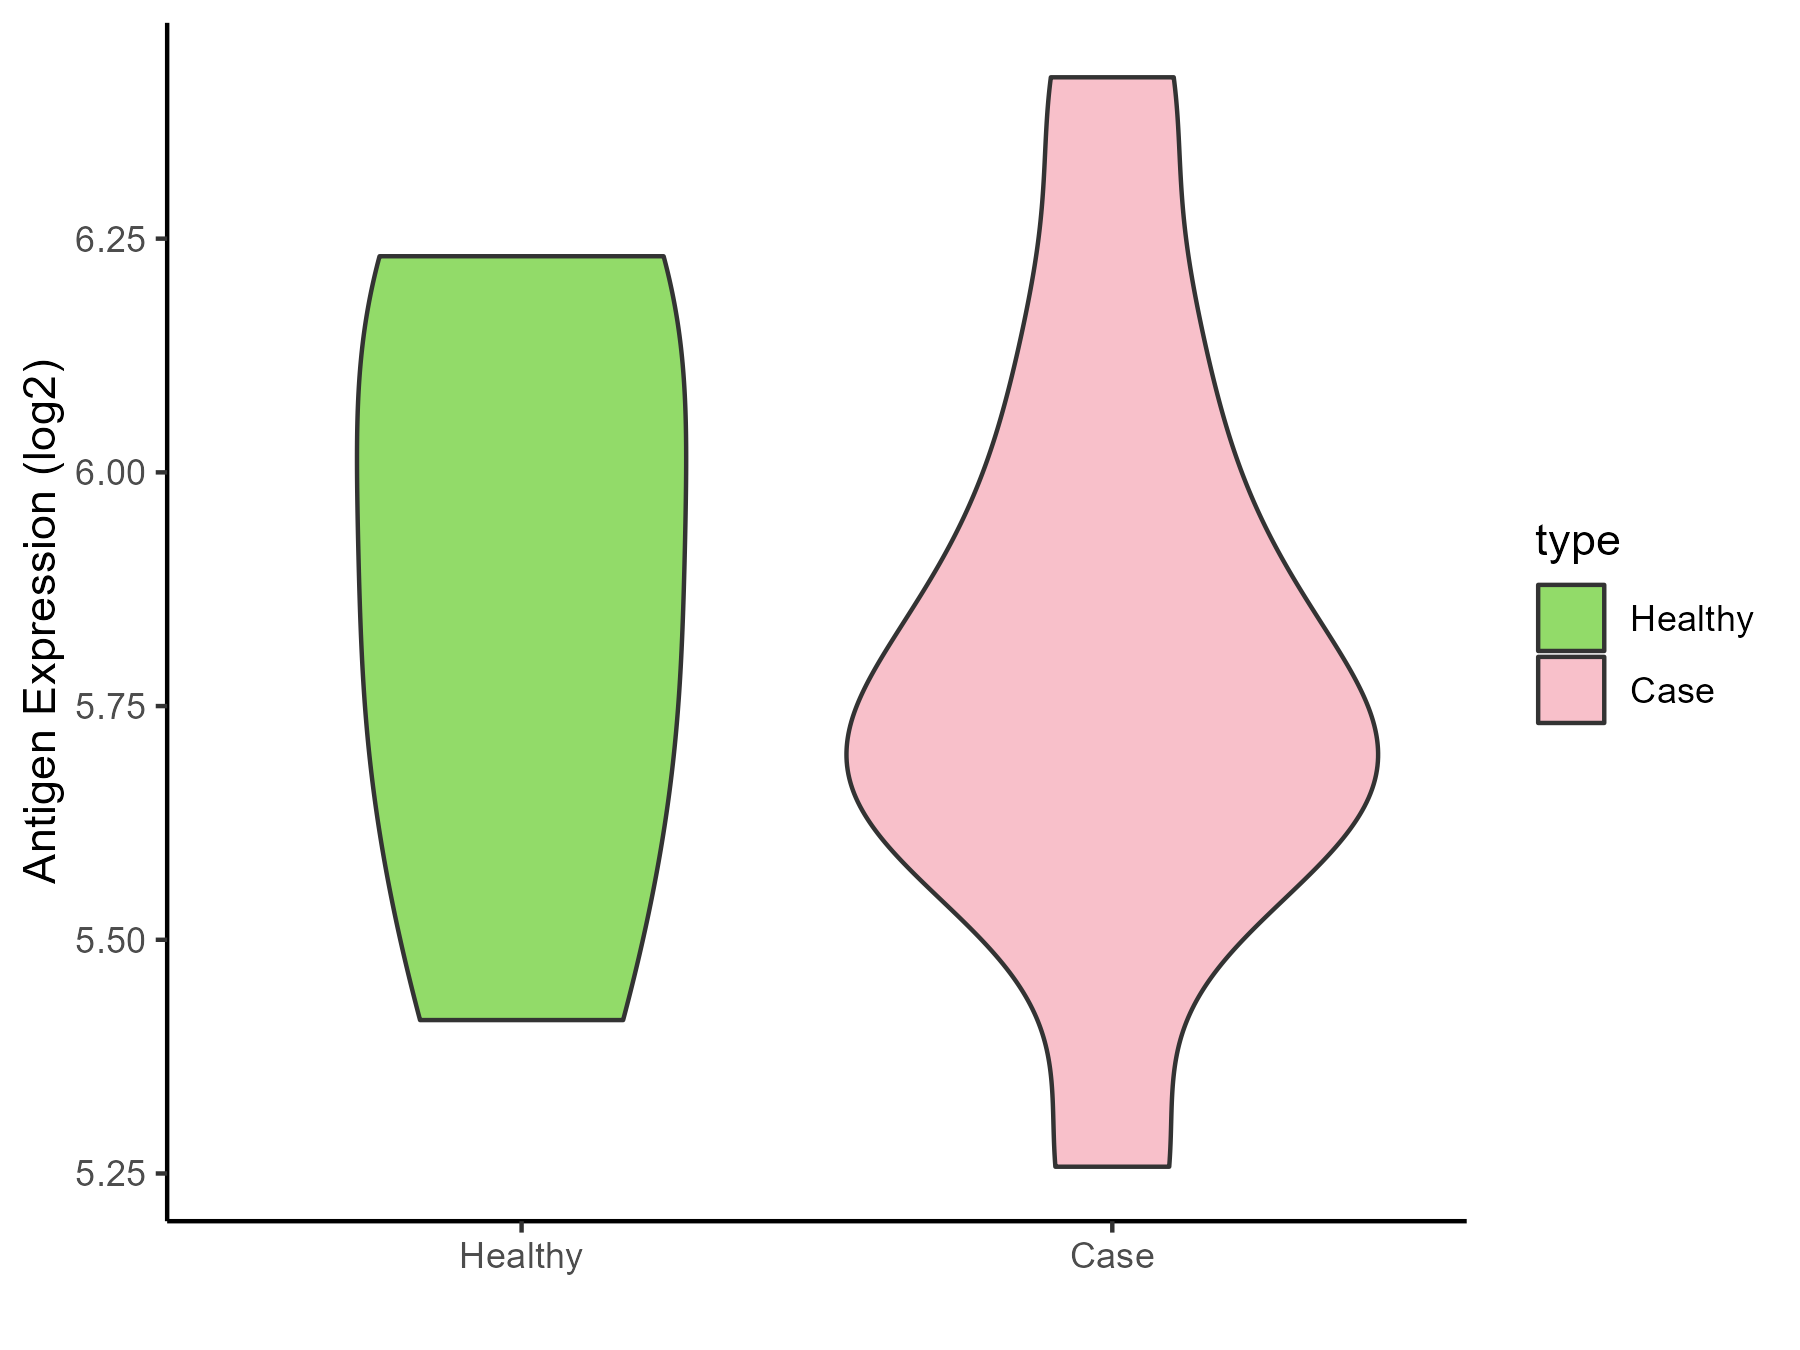
| The Studied Tissue | Liver | |
| The Specific Disease | Type 2 diabetes | |
| The Expression Level of Disease Section Compare with the Healthy Individual Tissue | p-value: 0.741585863; Fold-change: -0.120351874; Z-score: -0.359182405 | |
| Disease-specific Antigen Abundances |
|
Click to View the Clearer Original Diagram |
| Differential expression pattern of antigen in diseases | ||
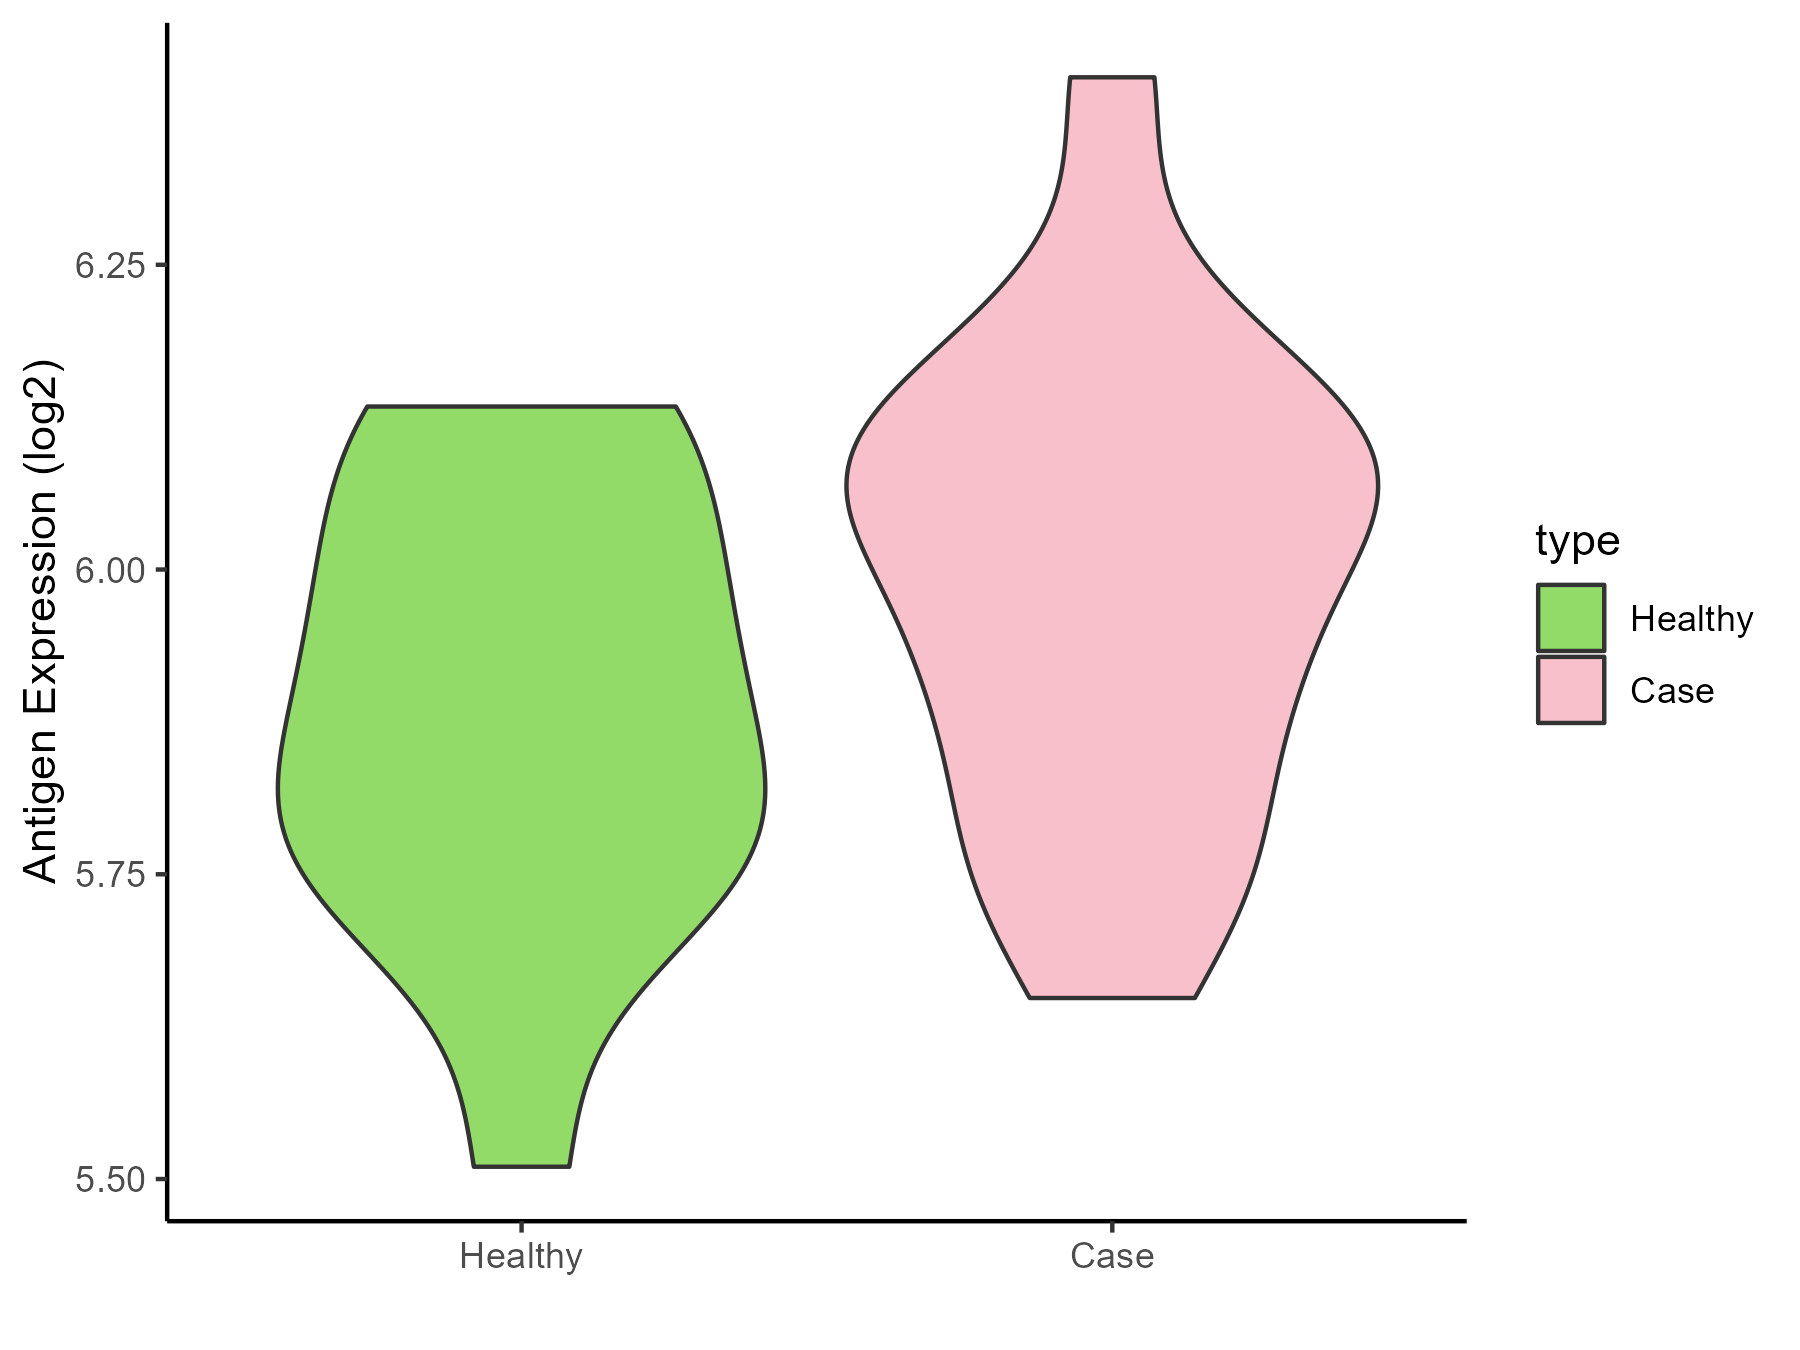
| The Studied Tissue | Vastus lateralis muscle | |
| The Specific Disease | Polycystic ovary syndrome | |
| The Expression Level of Disease Section Compare with the Healthy Individual Tissue | p-value: 0.141915462; Fold-change: 0.119792684; Z-score: 0.654048585 | |
| Disease-specific Antigen Abundances |
|
Click to View the Clearer Original Diagram |
| Differential expression pattern of antigen in diseases | ||
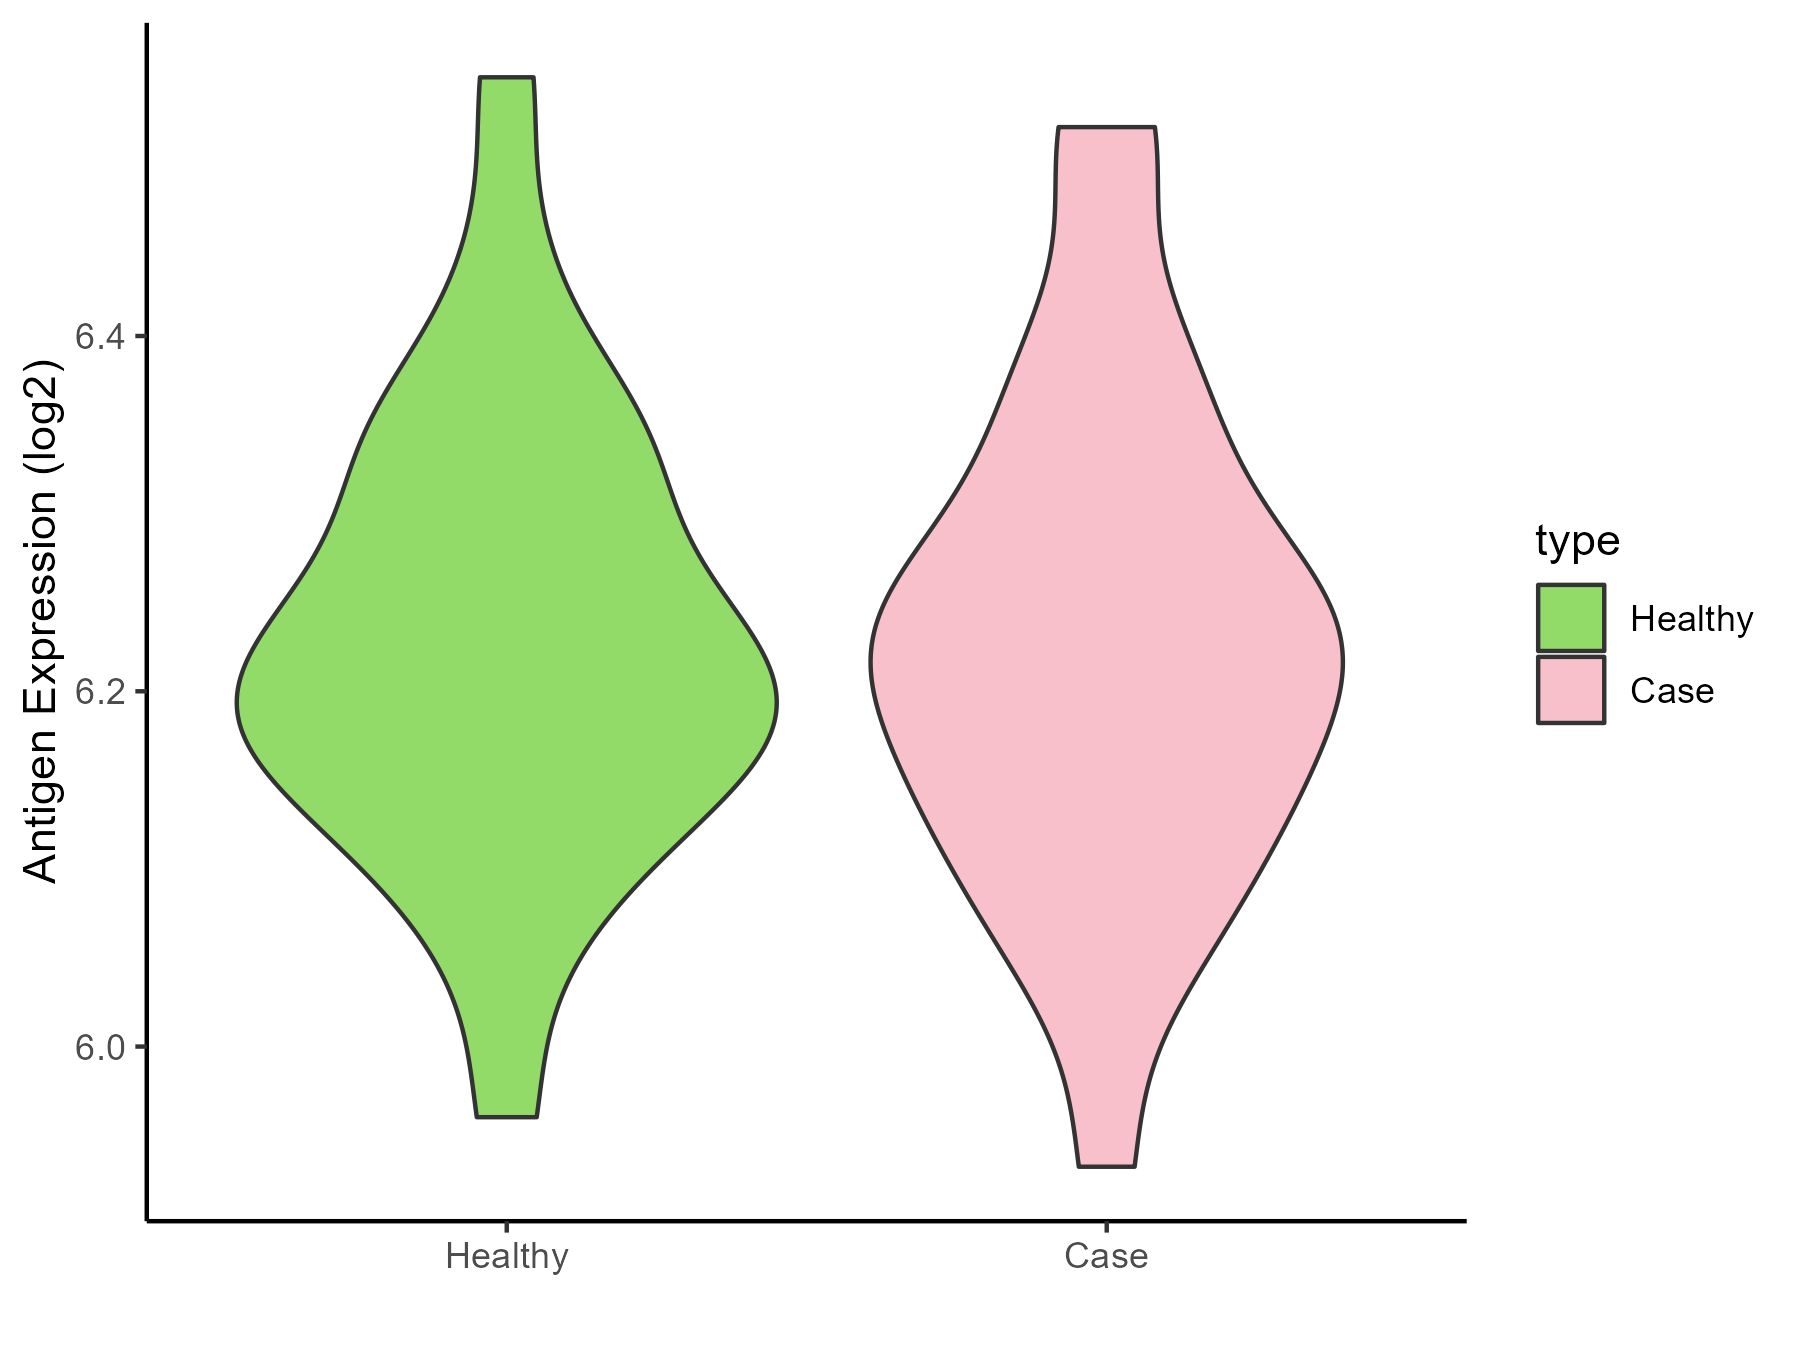
| The Studied Tissue | Subcutaneous Adipose | |
| The Specific Disease | Obesity | |
| The Expression Level of Disease Section Compare with the Healthy Individual Tissue | p-value: 0.913780084; Fold-change: 0.014172451; Z-score: 0.112643518 | |
| Disease-specific Antigen Abundances |
|
Click to View the Clearer Original Diagram |
| Differential expression pattern of antigen in diseases | ||
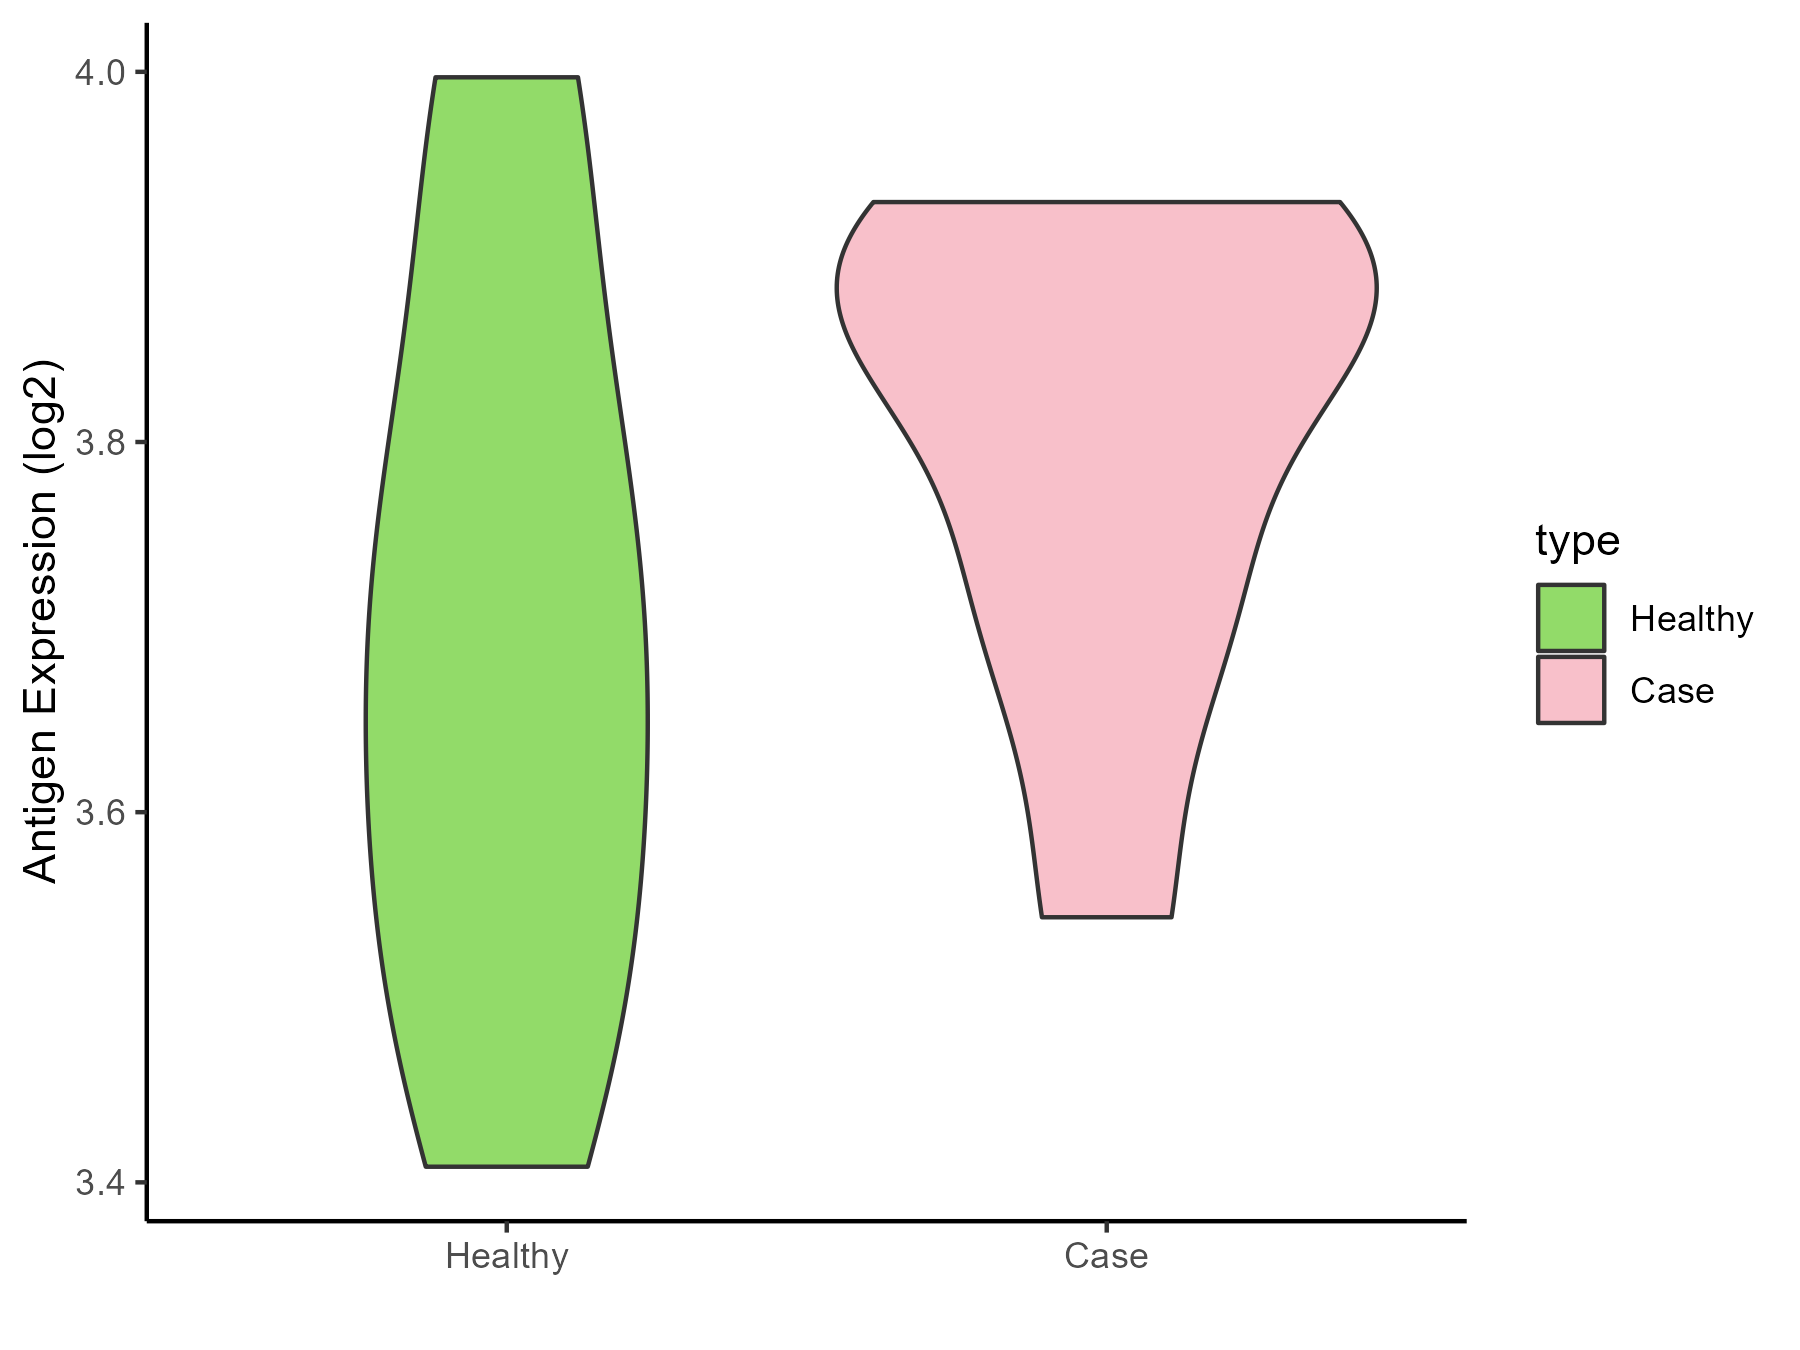
| The Studied Tissue | Biceps muscle | |
| The Specific Disease | Pompe disease | |
| The Expression Level of Disease Section Compare with the Healthy Individual Tissue | p-value: 0.179242198; Fold-change: 0.191067667; Z-score: 0.974620483 | |
| Disease-specific Antigen Abundances |
|
Click to View the Clearer Original Diagram |
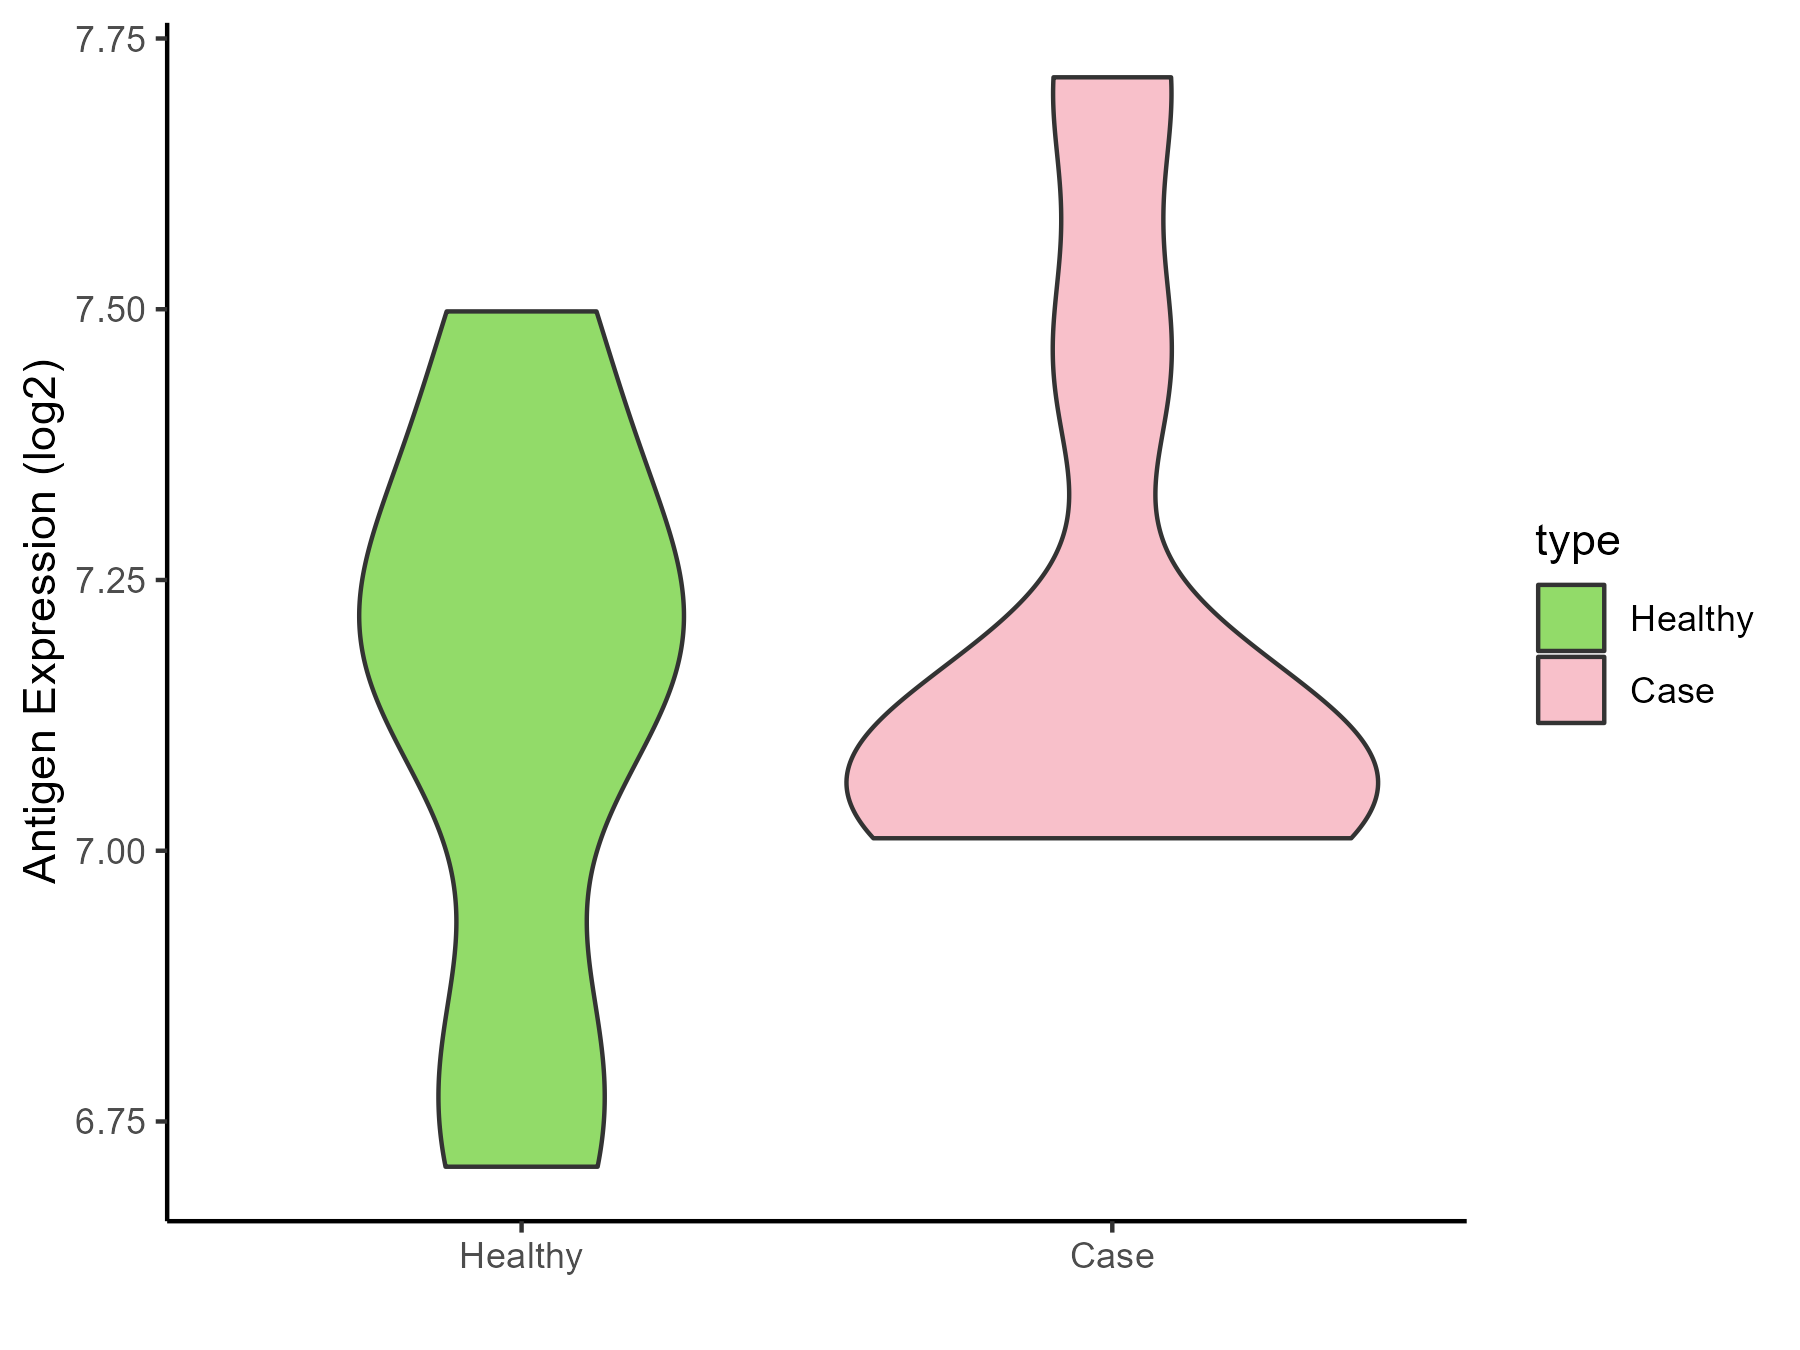
| Differential expression pattern of antigen in diseases | ||
| The Studied Tissue | Whole blood | |
| The Specific Disease | Batten disease | |
| The Expression Level of Disease Section Compare with the Healthy Individual Tissue | p-value: 0.589599053; Fold-change: -0.100462615; Z-score: -0.362331758 | |
| Disease-specific Antigen Abundances |
|
Click to View the Clearer Original Diagram |
ICD Disease Classification 6
| Differential expression pattern of antigen in diseases | ||
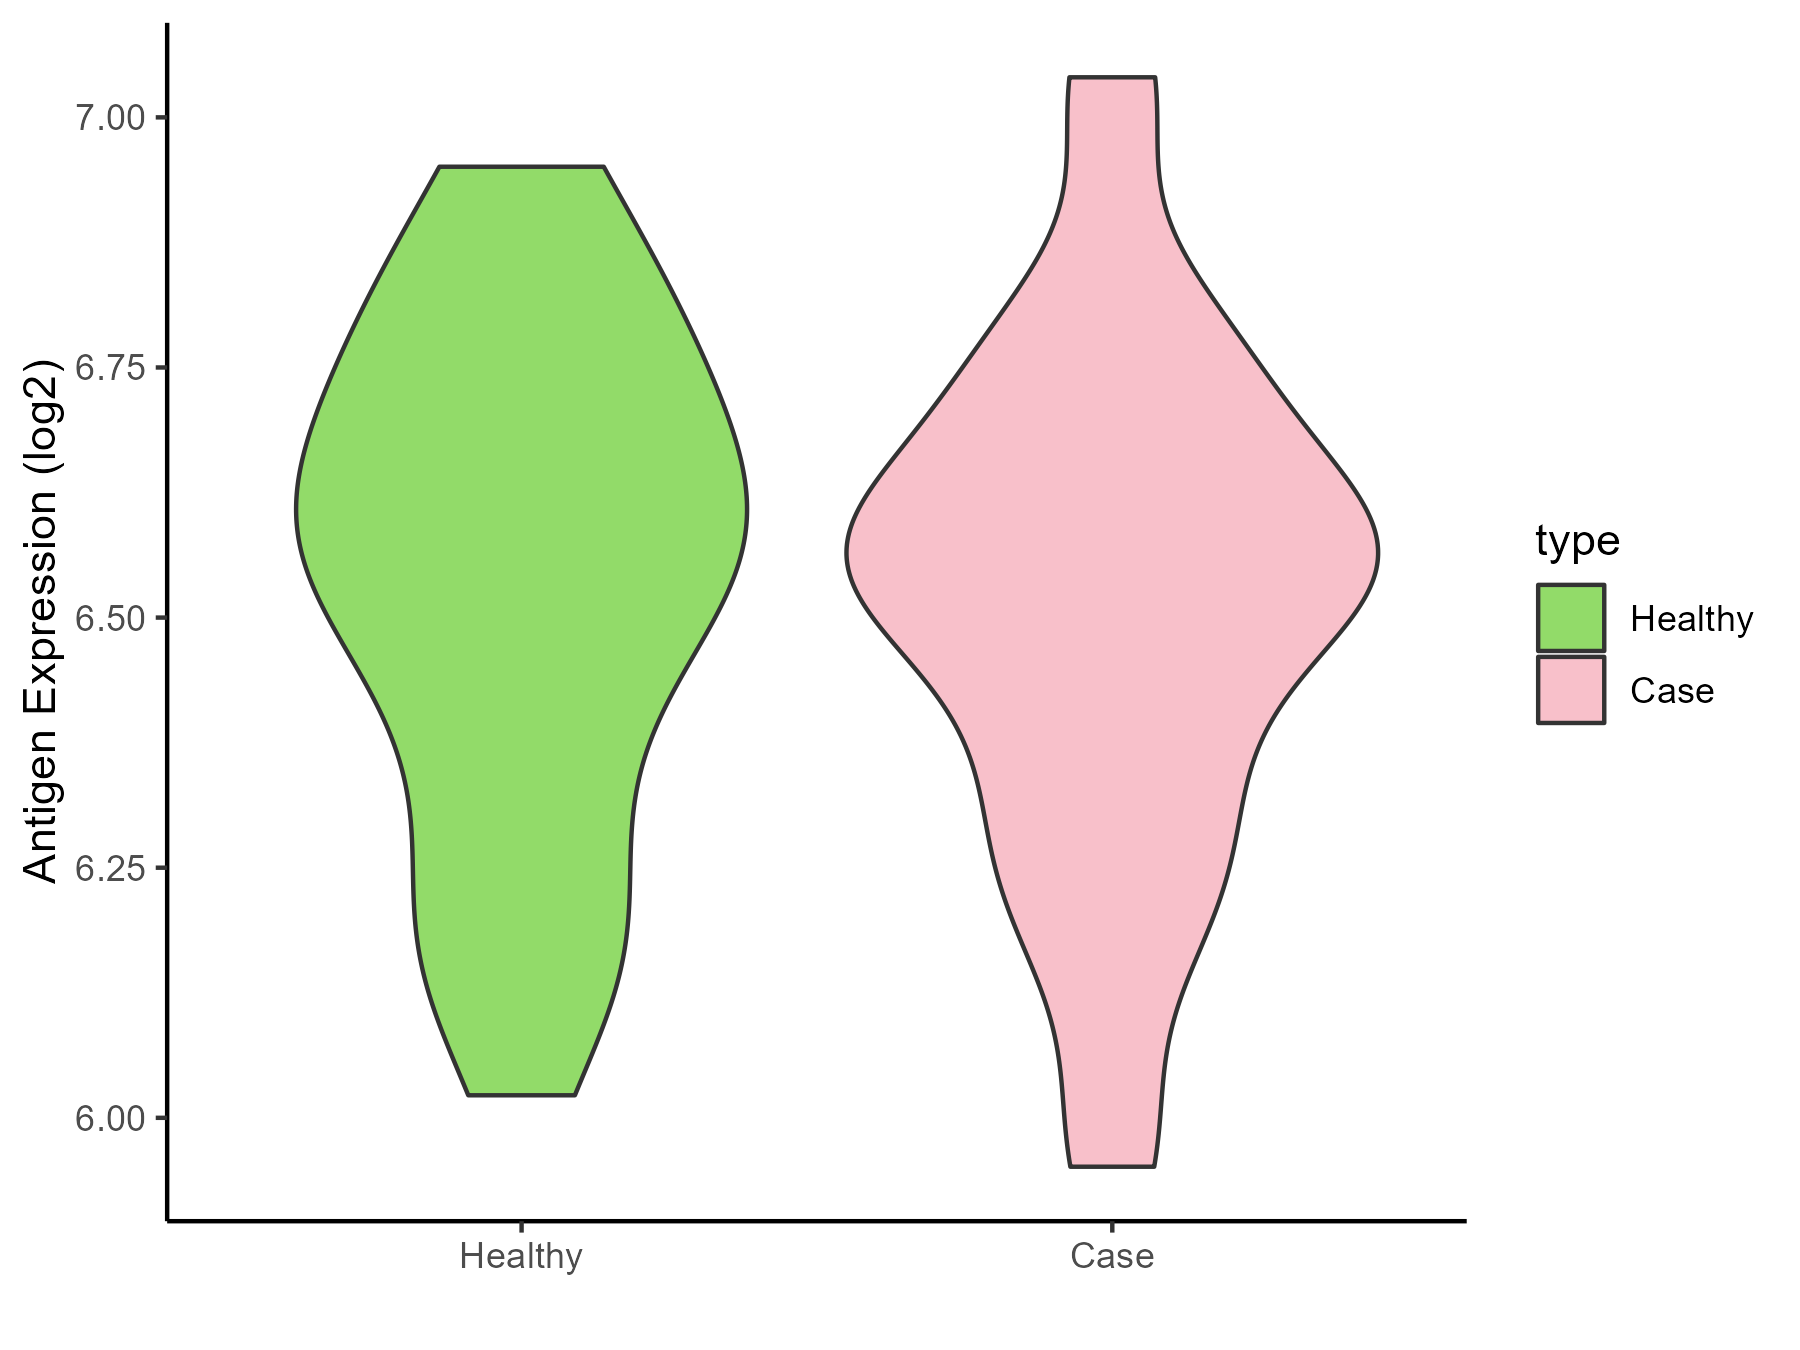
| The Studied Tissue | Whole blood | |
| The Specific Disease | Autism | |
| The Expression Level of Disease Section Compare with the Healthy Individual Tissue | p-value: 0.665357383; Fold-change: -0.012660846; Z-score: -0.050397184 | |
| Disease-specific Antigen Abundances |
|
Click to View the Clearer Original Diagram |
| Differential expression pattern of antigen in diseases | ||
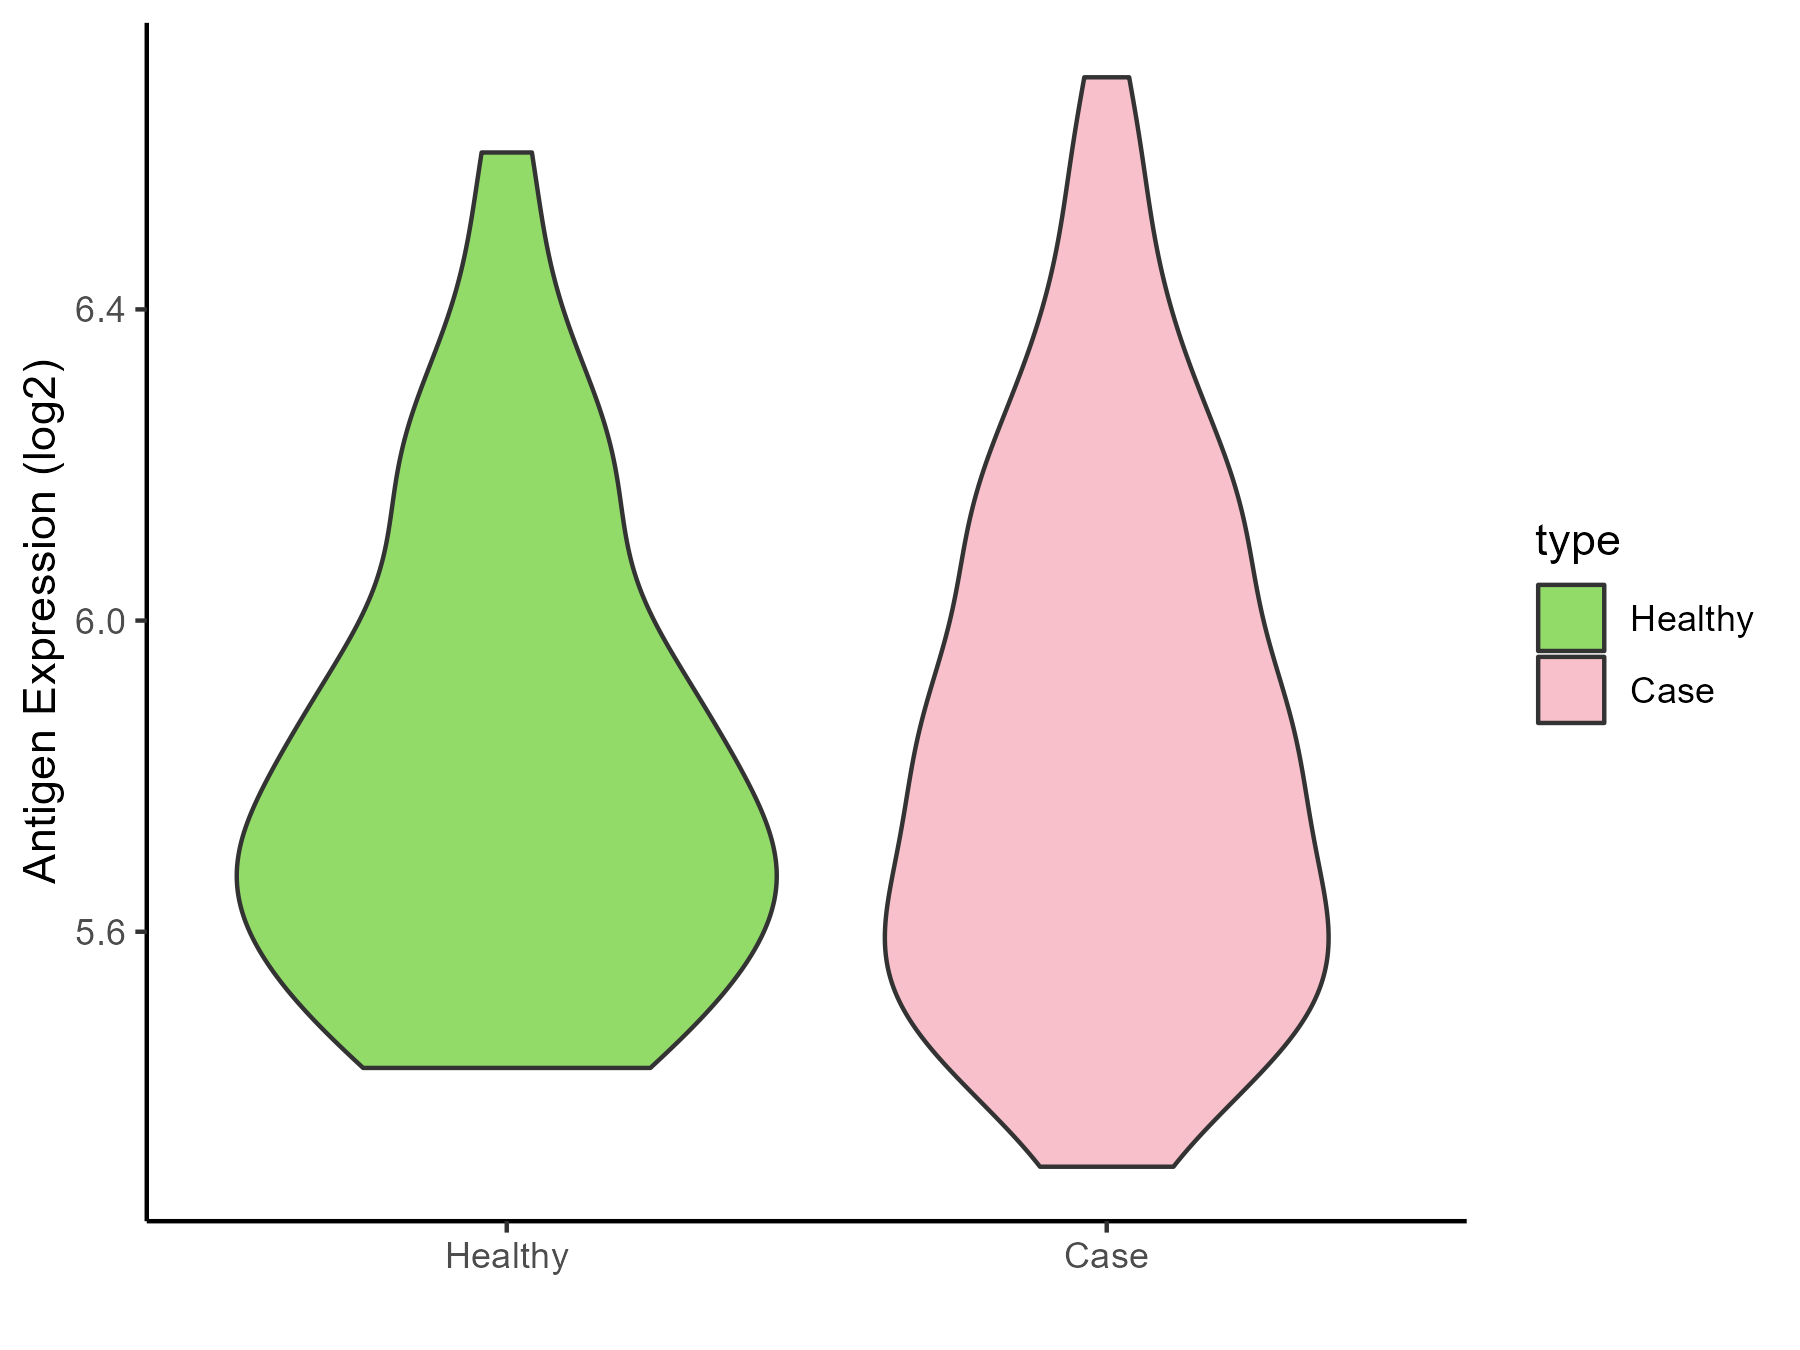
| The Studied Tissue | Whole blood | |
| The Specific Disease | Anxiety disorder | |
| The Expression Level of Disease Section Compare with the Healthy Individual Tissue | p-value: 0.734477809; Fold-change: 0.067851463; Z-score: 0.228799292 | |
| Disease-specific Antigen Abundances |
|
Click to View the Clearer Original Diagram |
ICD Disease Classification 8
| Differential expression pattern of antigen in diseases | ||
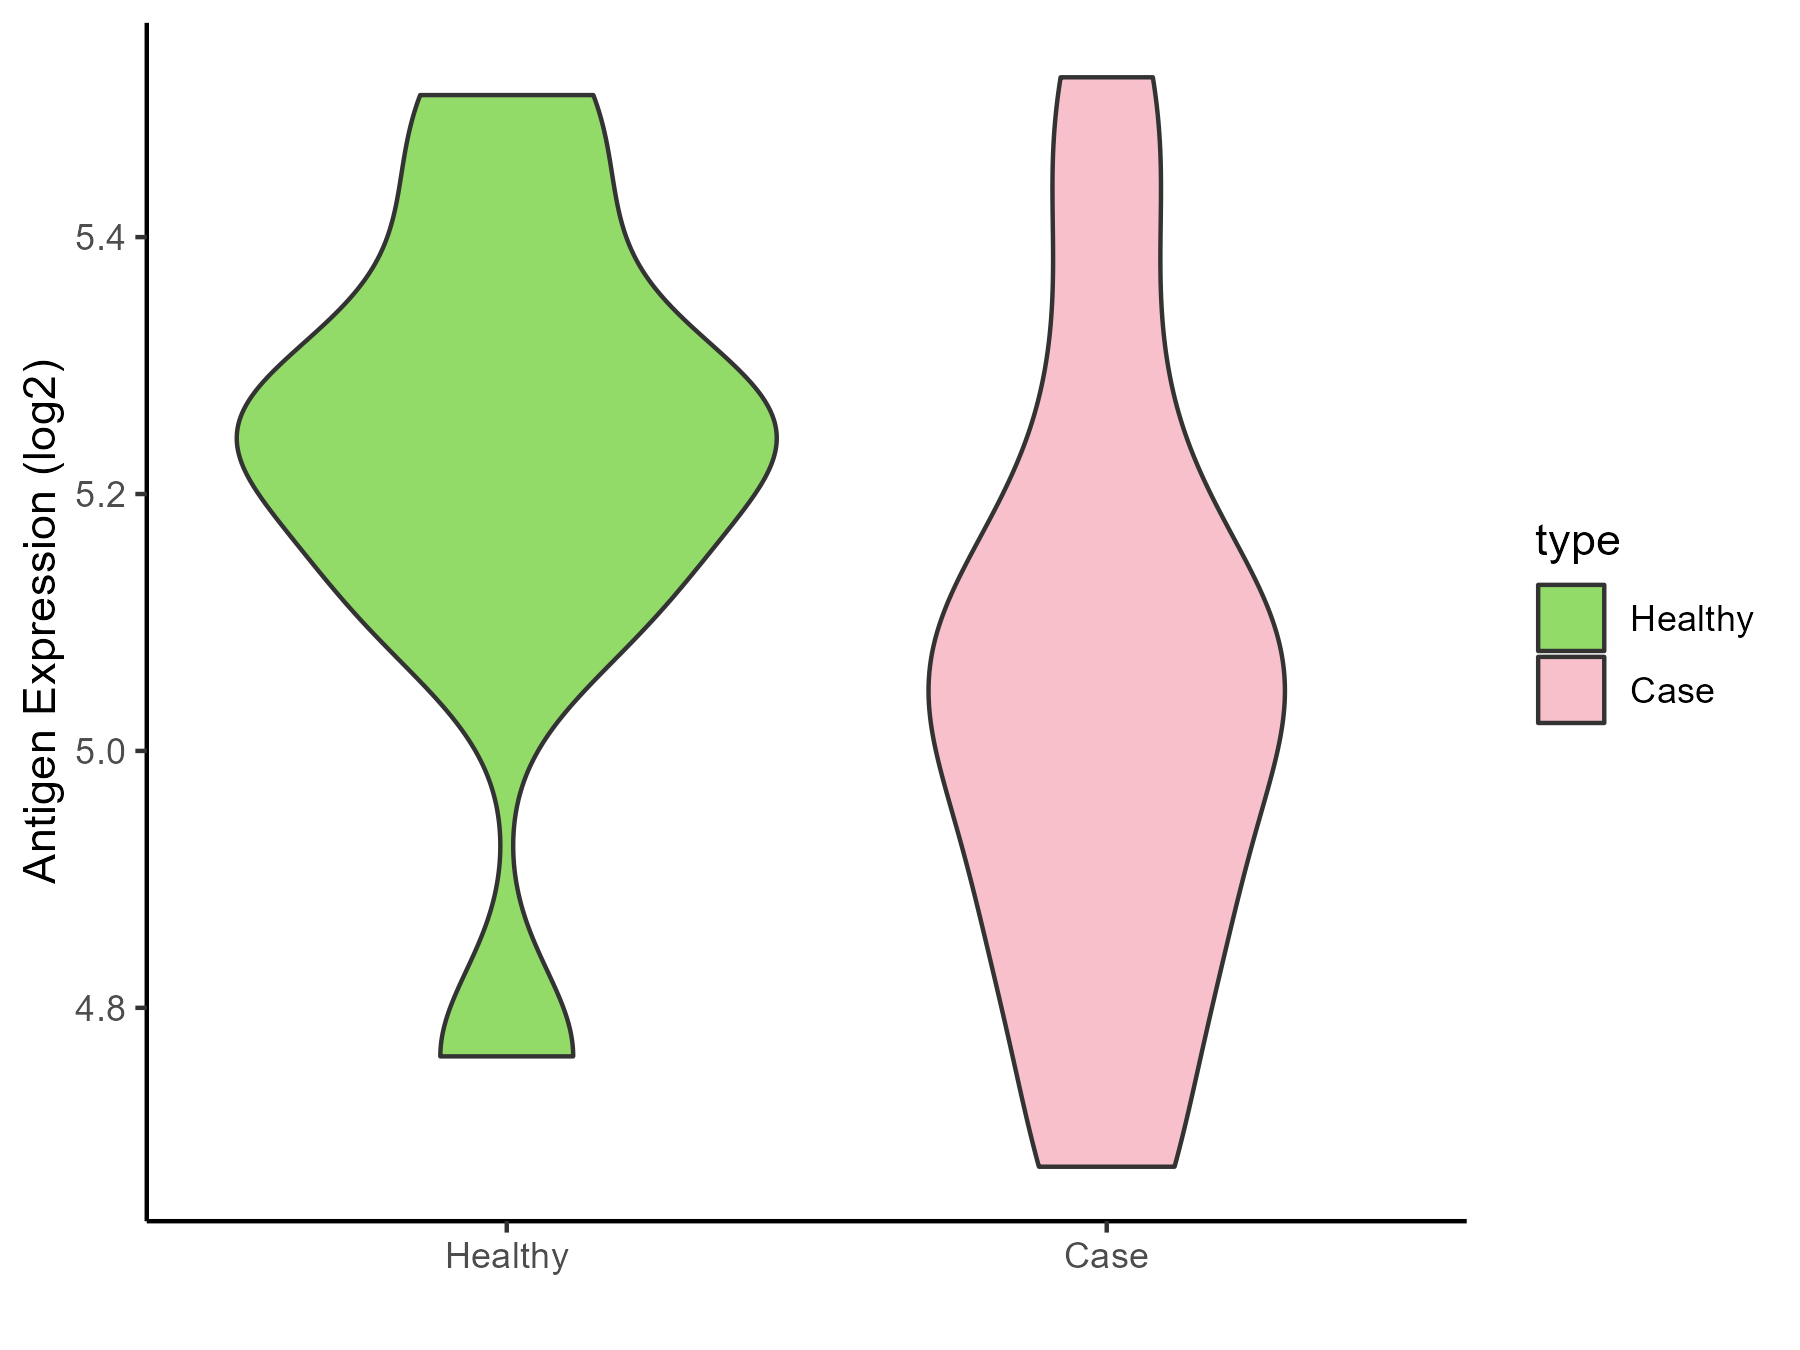
| The Studied Tissue | Substantia nigra | |
| The Specific Disease | Parkinson disease | |
| The Expression Level of Disease Section Compare with the Healthy Individual Tissue | p-value: 0.081424011; Fold-change: -0.204867048; Z-score: -0.967552129 | |
| Disease-specific Antigen Abundances |
|
Click to View the Clearer Original Diagram |
| Differential expression pattern of antigen in diseases | ||
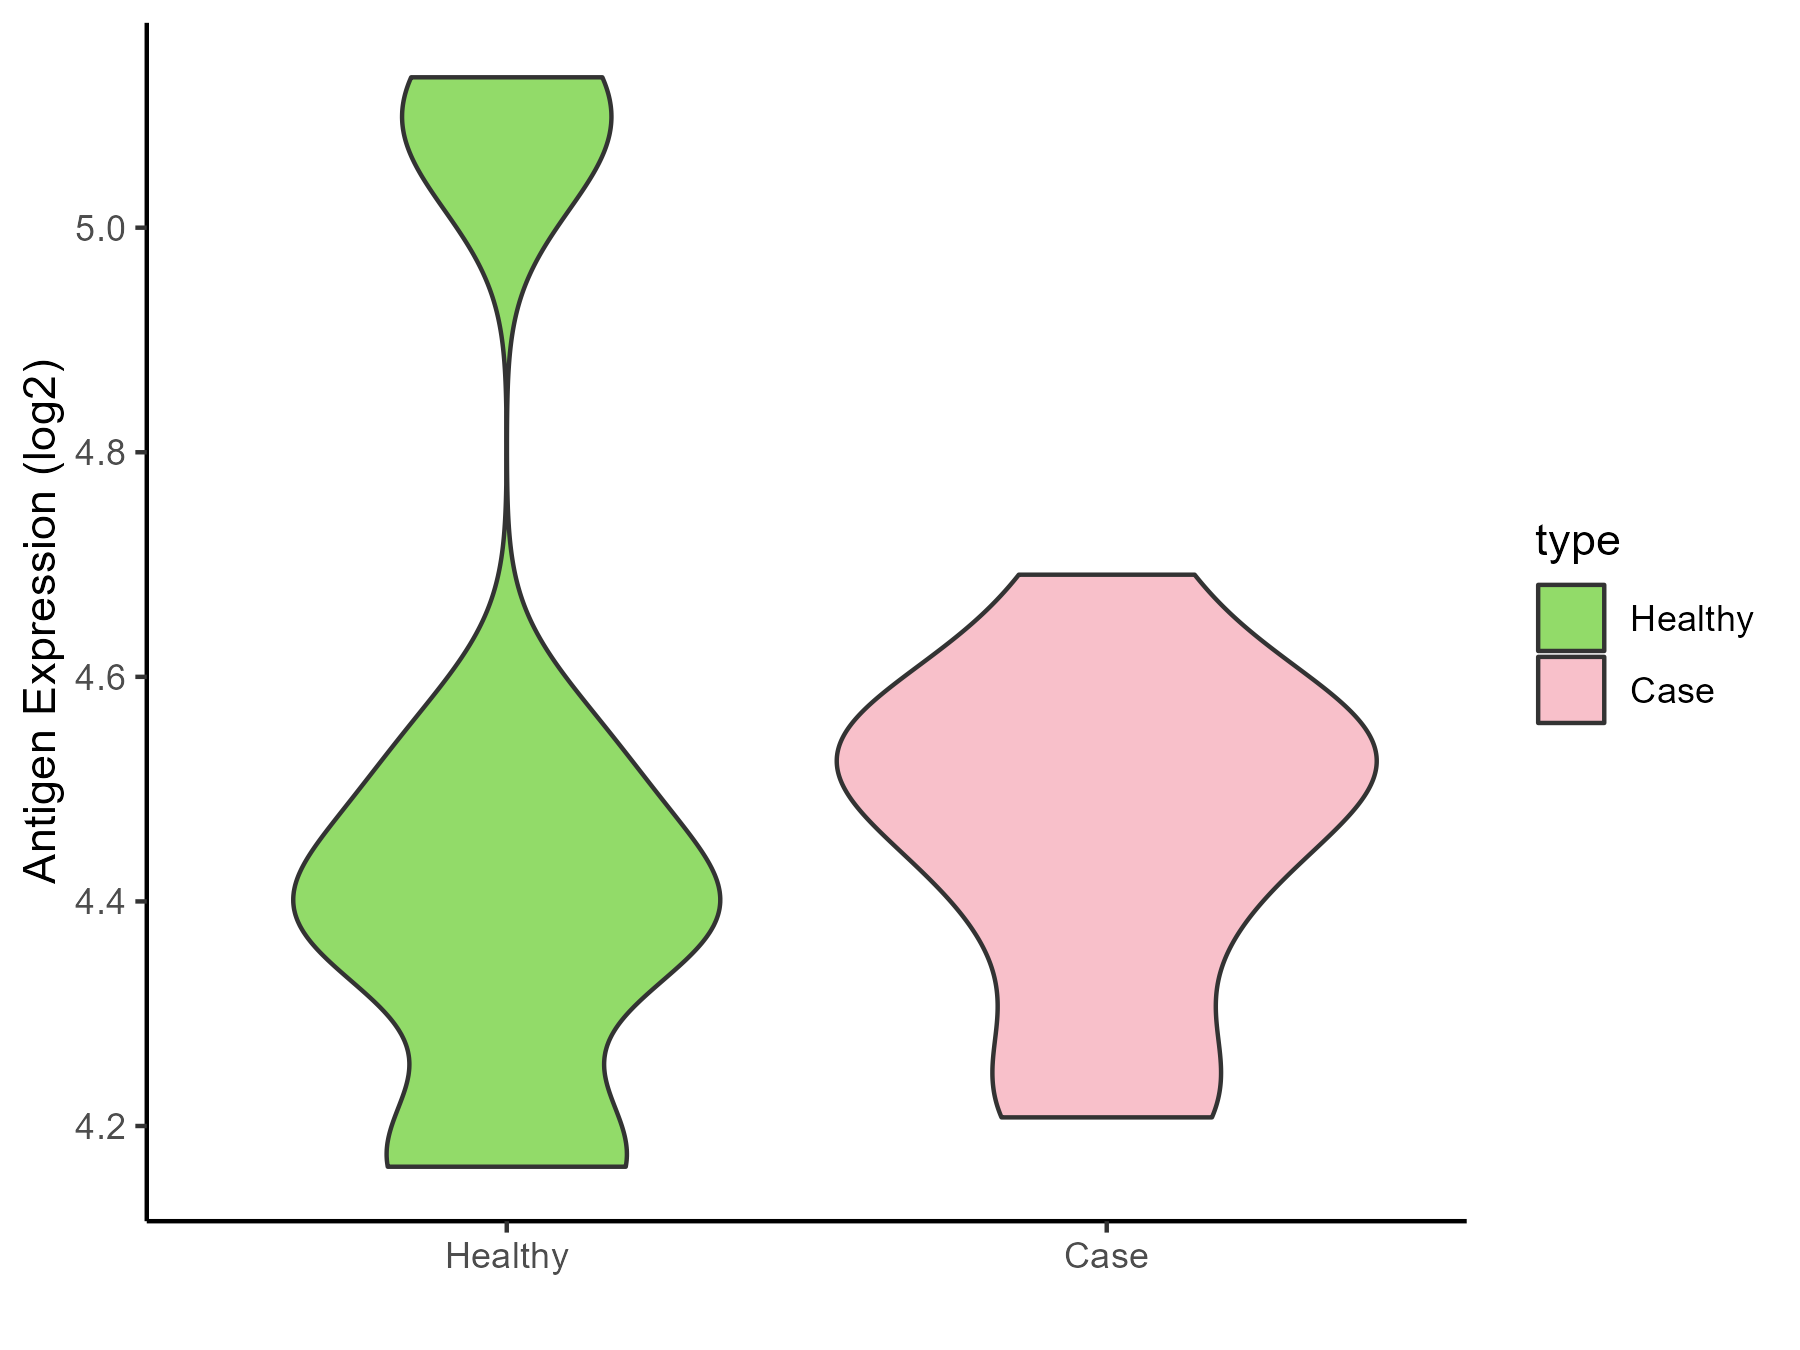
| The Studied Tissue | Whole blood | |
| The Specific Disease | Huntington disease | |
| The Expression Level of Disease Section Compare with the Healthy Individual Tissue | p-value: 0.642888961; Fold-change: 0.124940493; Z-score: 0.357083502 | |
| Disease-specific Antigen Abundances |
|
Click to View the Clearer Original Diagram |
| Differential expression pattern of antigen in diseases | ||
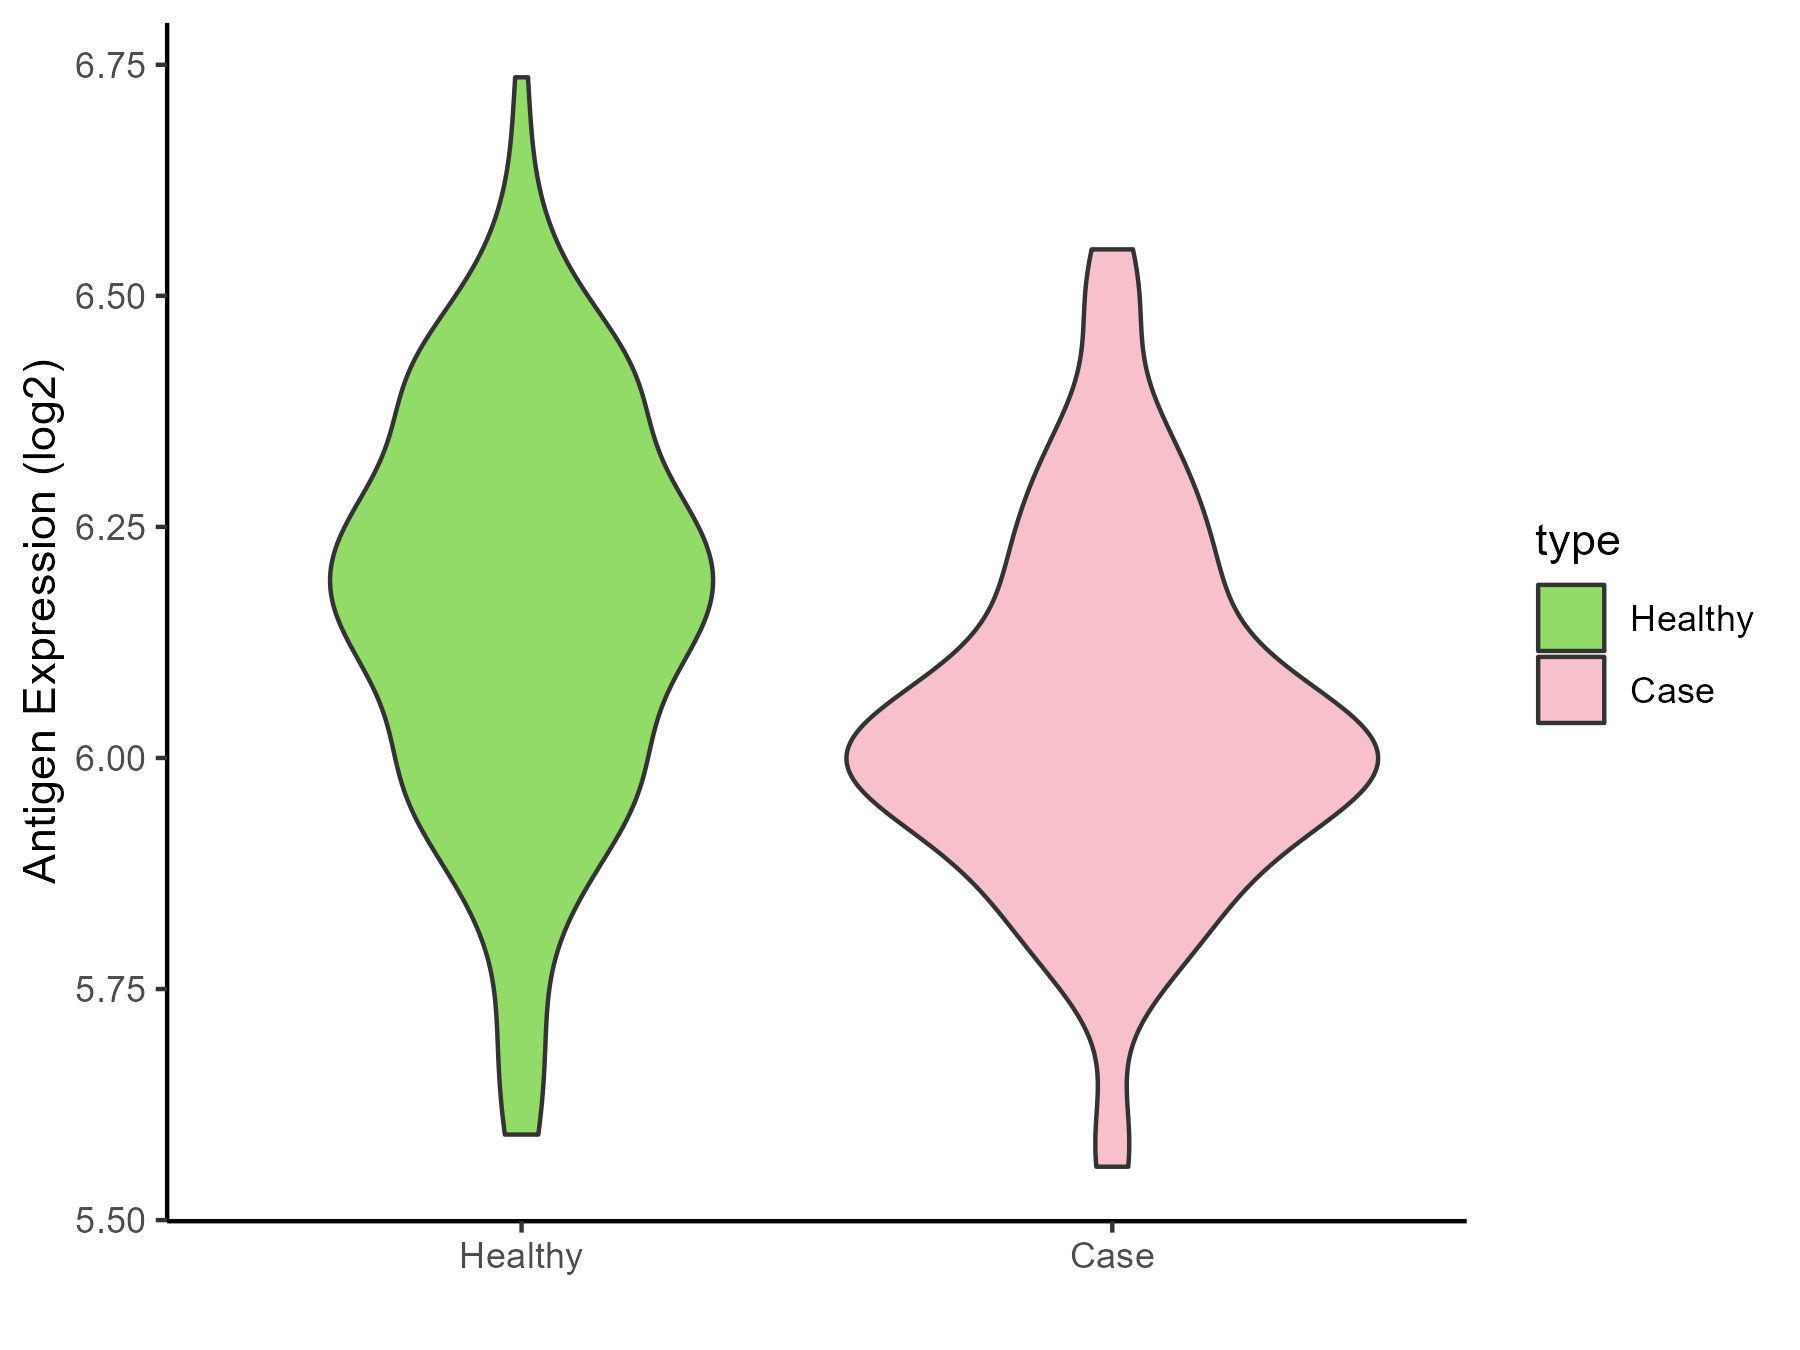
| The Studied Tissue | Entorhinal cortex | |
| The Specific Disease | Alzheimer disease | |
| The Expression Level of Disease Section Compare with the Healthy Individual Tissue | p-value: 3.42E-05; Fold-change: -0.157687658; Z-score: -0.721607722 | |
| Disease-specific Antigen Abundances |
|
Click to View the Clearer Original Diagram |
| Differential expression pattern of antigen in diseases | ||
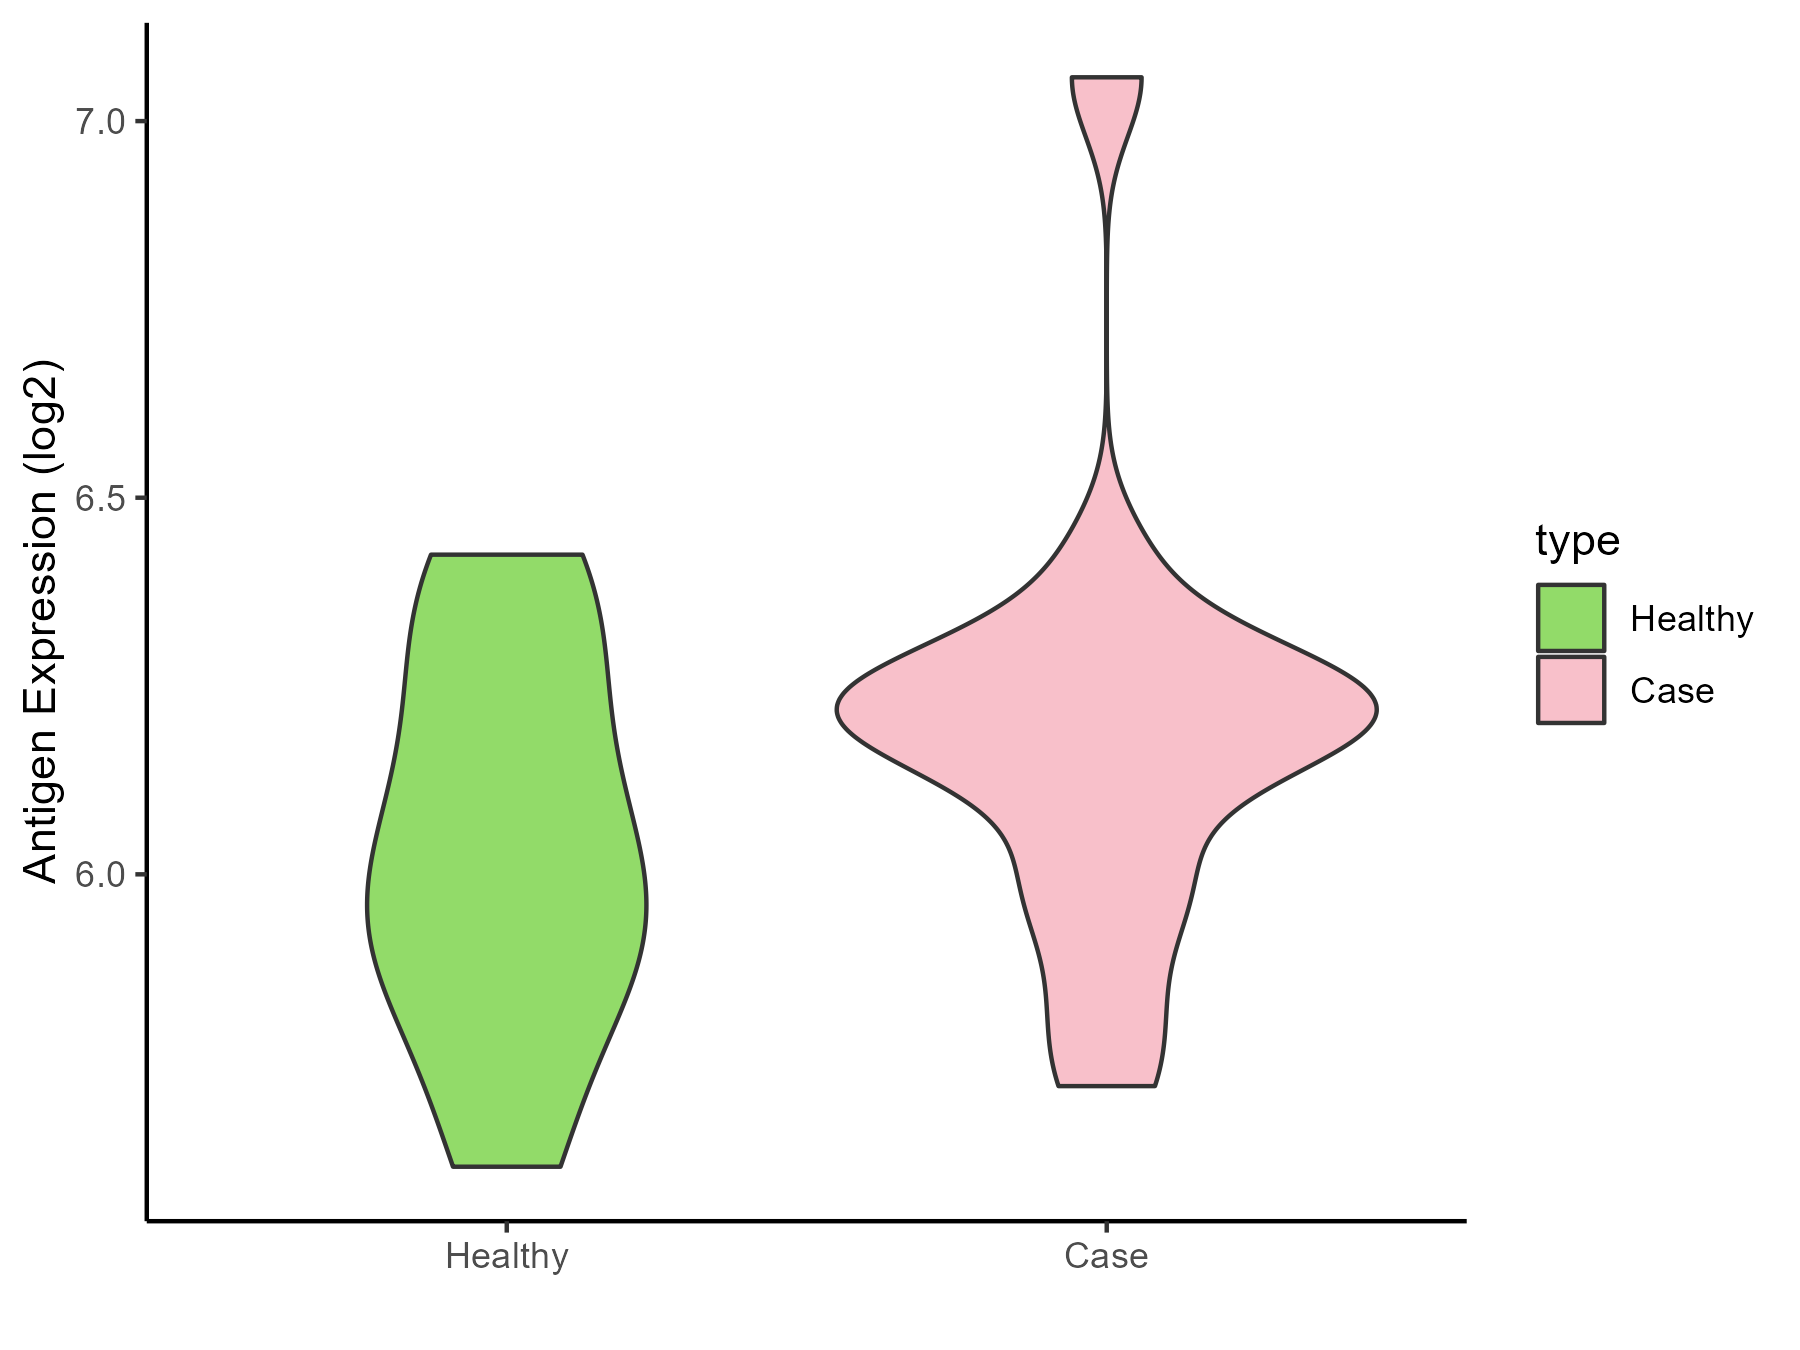
| The Studied Tissue | Whole blood | |
| The Specific Disease | Seizure | |
| The Expression Level of Disease Section Compare with the Healthy Individual Tissue | p-value: 0.13543742; Fold-change: 0.189622394; Z-score: 0.747506123 | |
| Disease-specific Antigen Abundances |
|
Click to View the Clearer Original Diagram |
| Differential expression pattern of antigen in diseases | ||
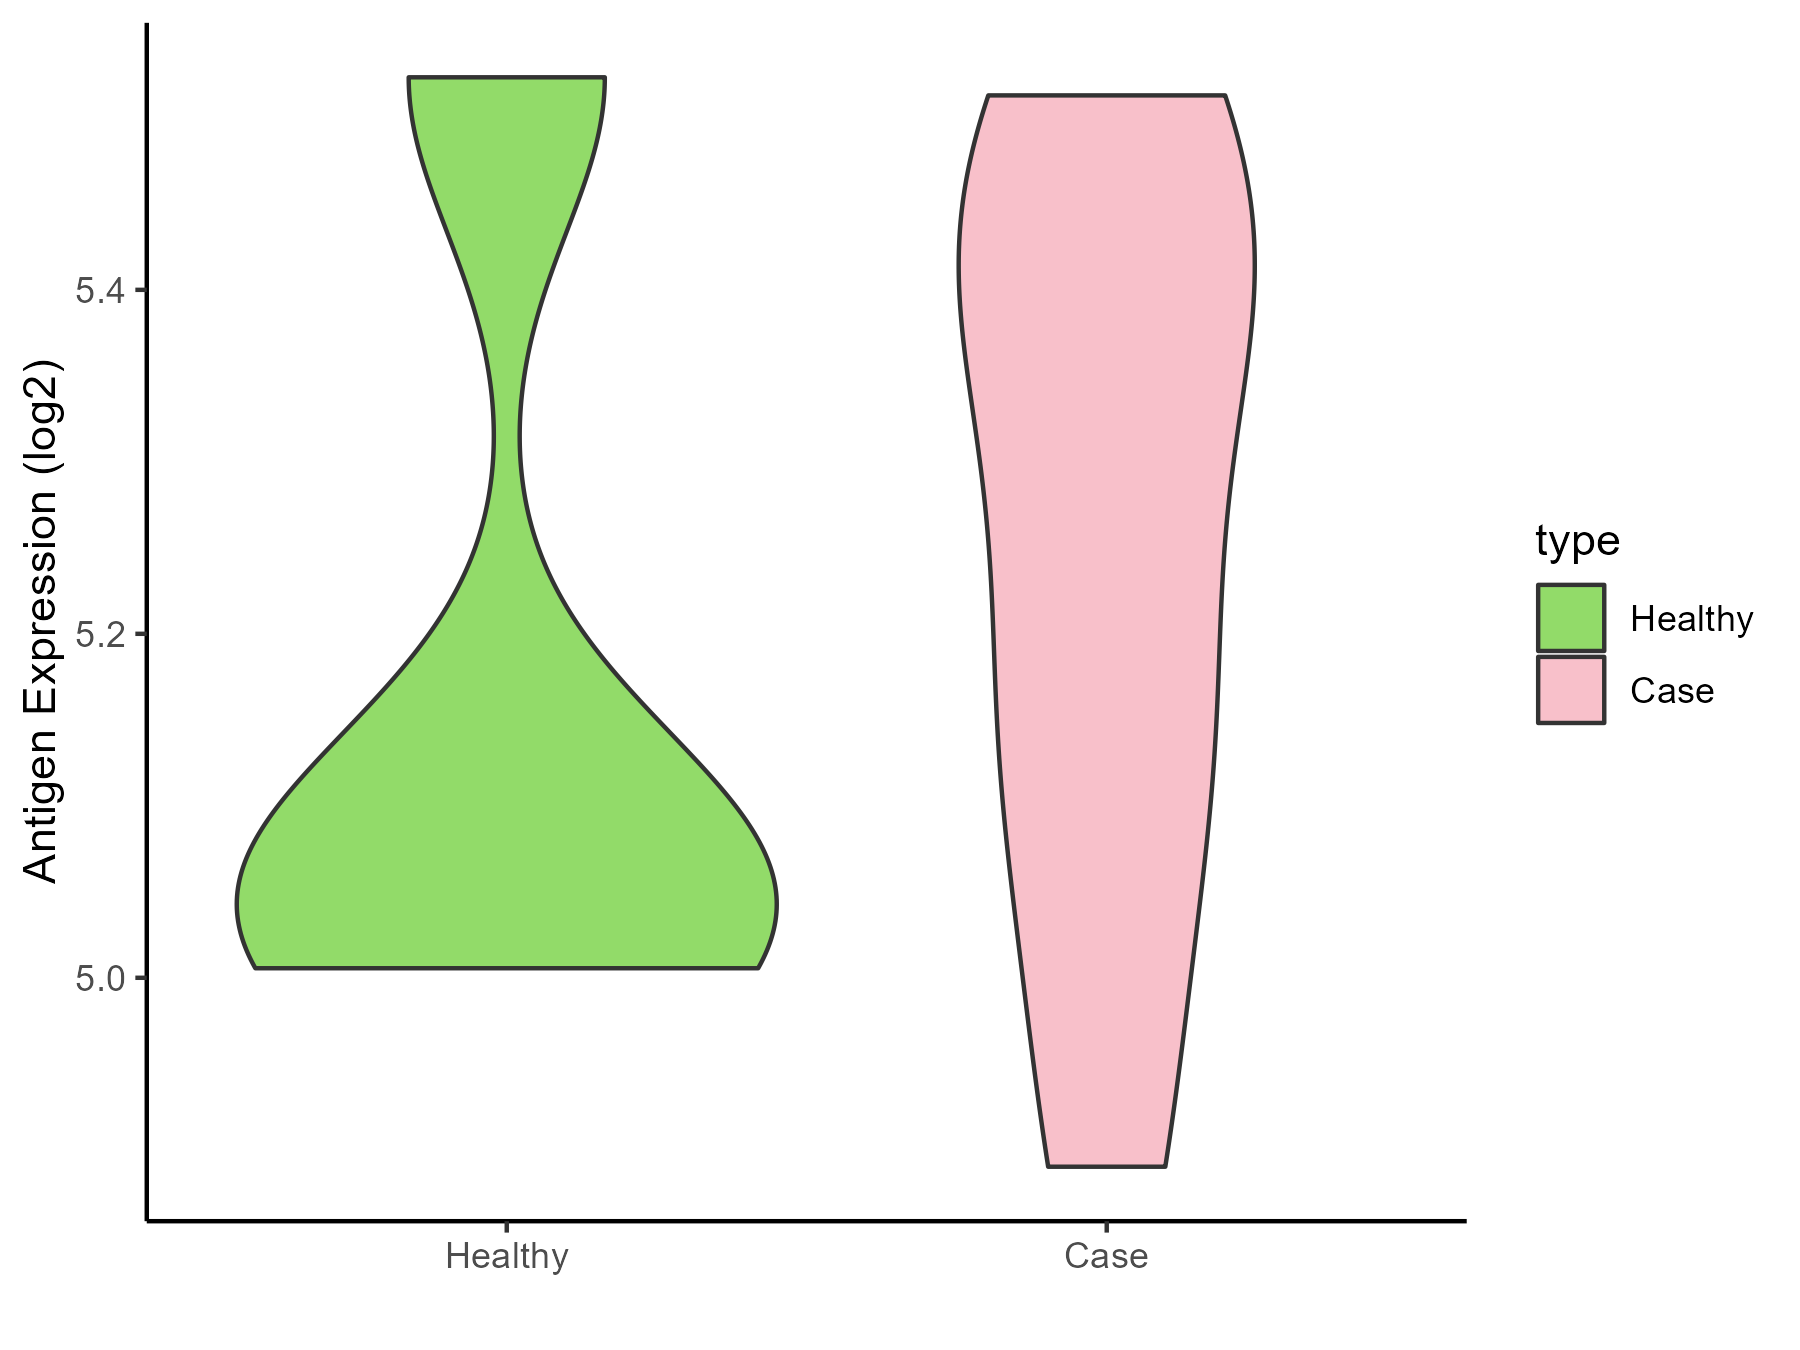
| The Studied Tissue | Skin | |
| The Specific Disease | Lateral sclerosis | |
| The Expression Level of Disease Section Compare with the Healthy Individual Tissue | p-value: 0.527019954; Fold-change: 0.233276737; Z-score: 0.962016913 | |
| Disease-specific Antigen Abundances |
|
Click to View the Clearer Original Diagram |
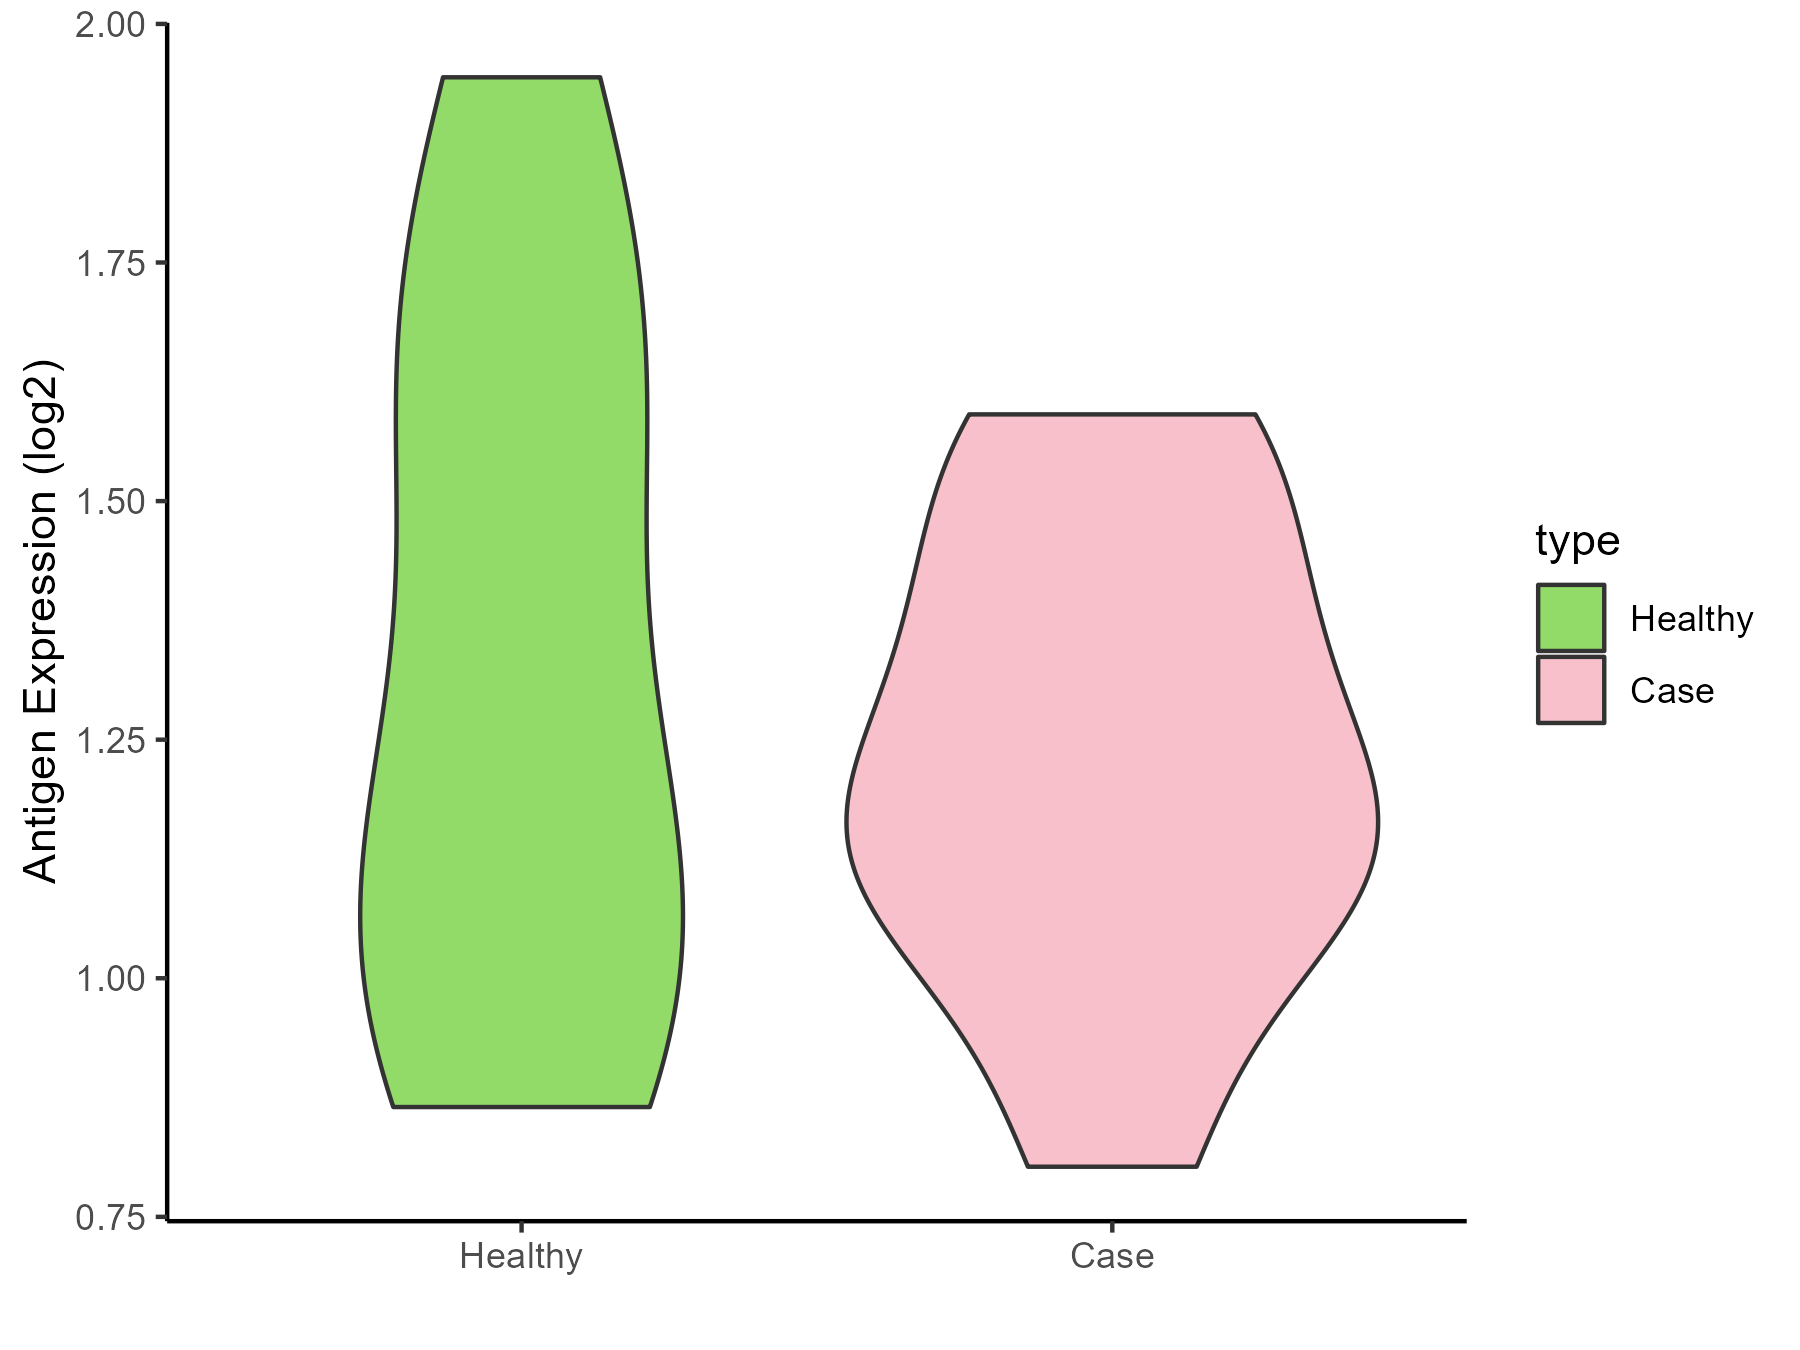
| The Studied Tissue | Cervical spinal cord | |
| The Specific Disease | Lateral sclerosis | |
| The Expression Level of Disease Section Compare with the Healthy Individual Tissue | p-value: 0.517362855; Fold-change: 0.042482346; Z-score: 0.110604357 | |
| Disease-specific Antigen Abundances |
|
Click to View the Clearer Original Diagram |
| Differential expression pattern of antigen in diseases | ||
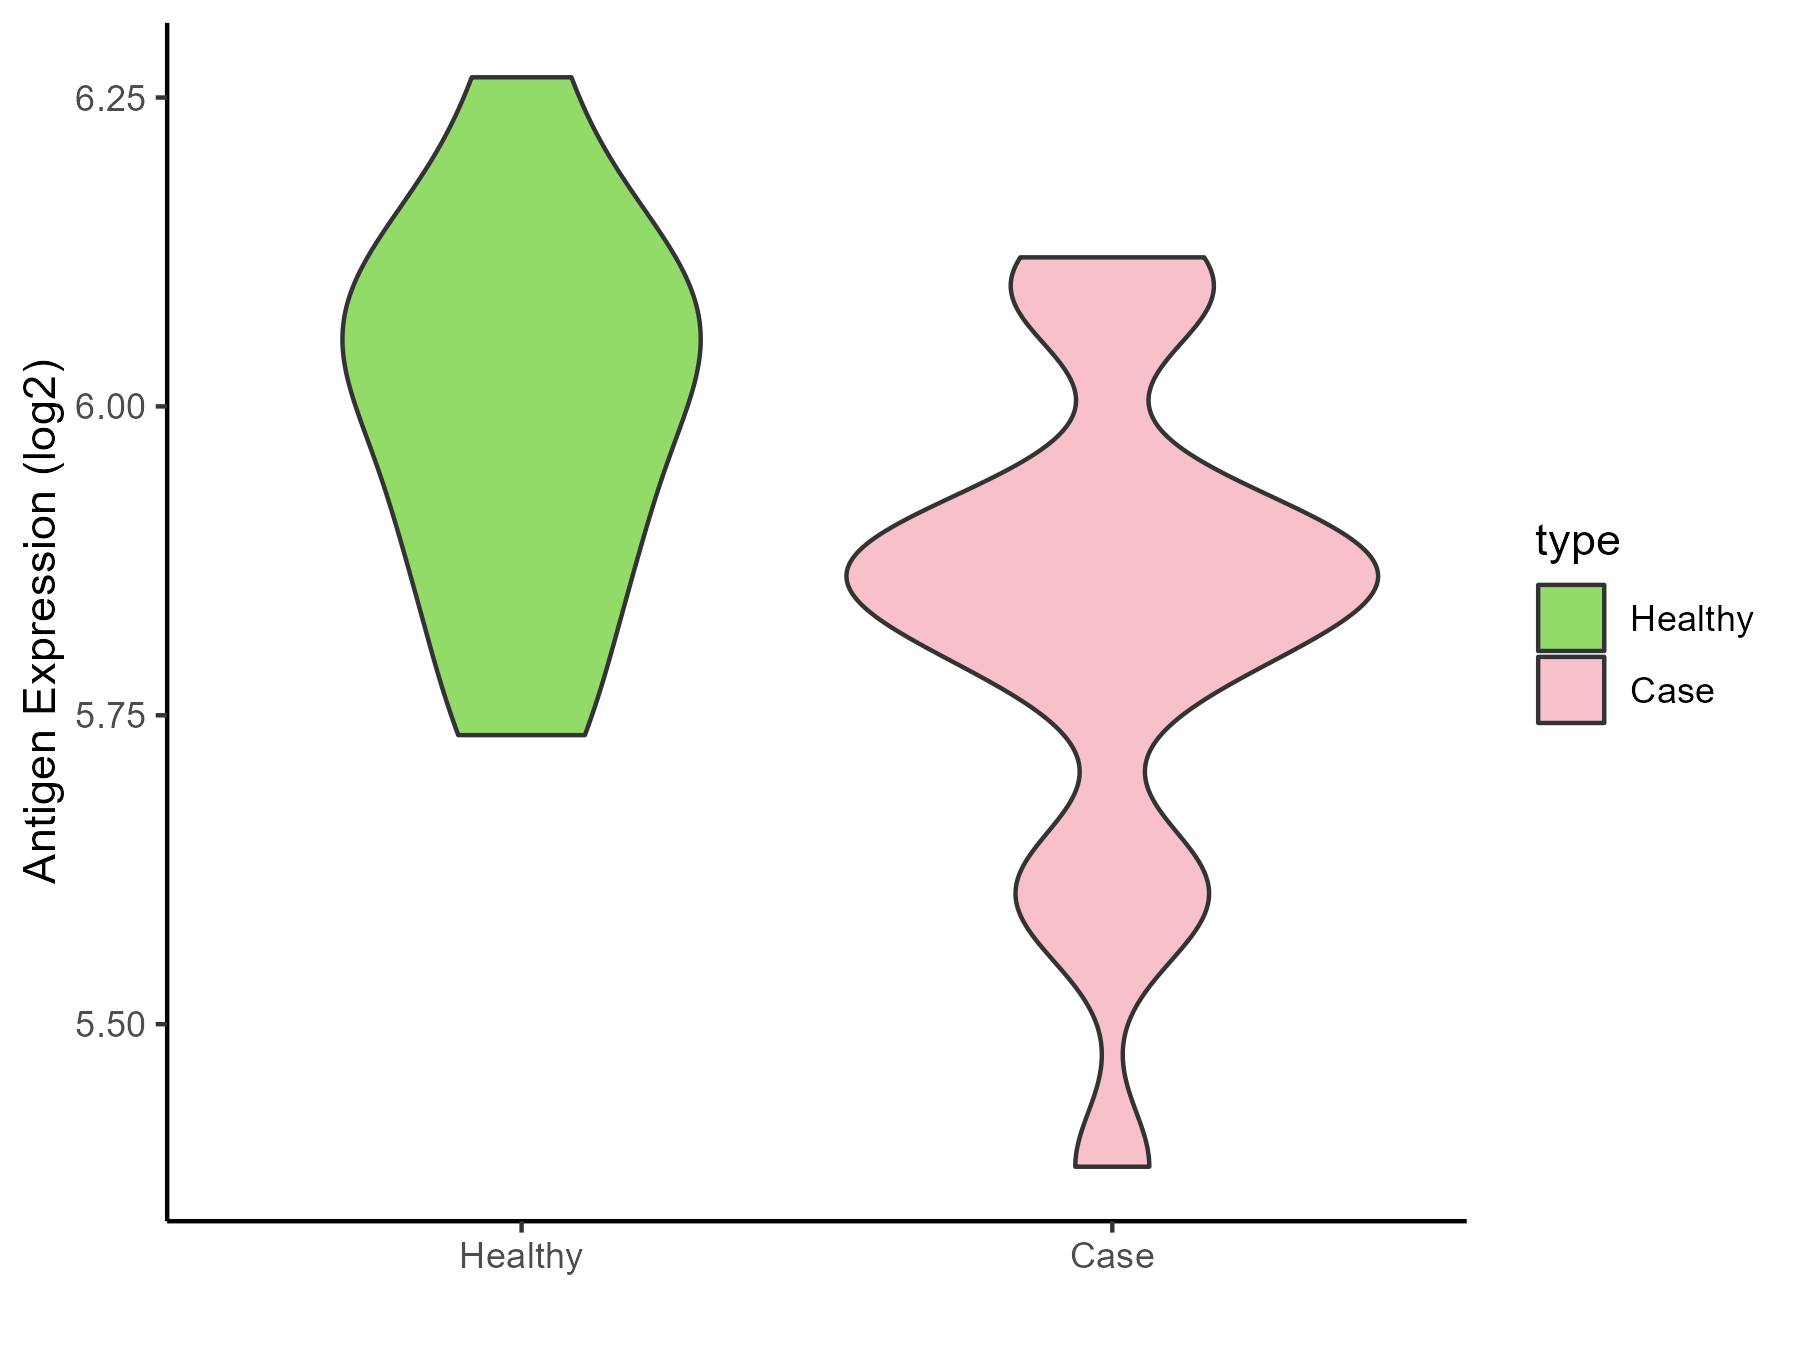
| The Studied Tissue | Muscle | |
| The Specific Disease | Muscular atrophy | |
| The Expression Level of Disease Section Compare with the Healthy Individual Tissue | p-value: 0.010591508; Fold-change: -0.165463911; Z-score: -1.088956541 | |
| Disease-specific Antigen Abundances |
|
Click to View the Clearer Original Diagram |
| Differential expression pattern of antigen in diseases | ||
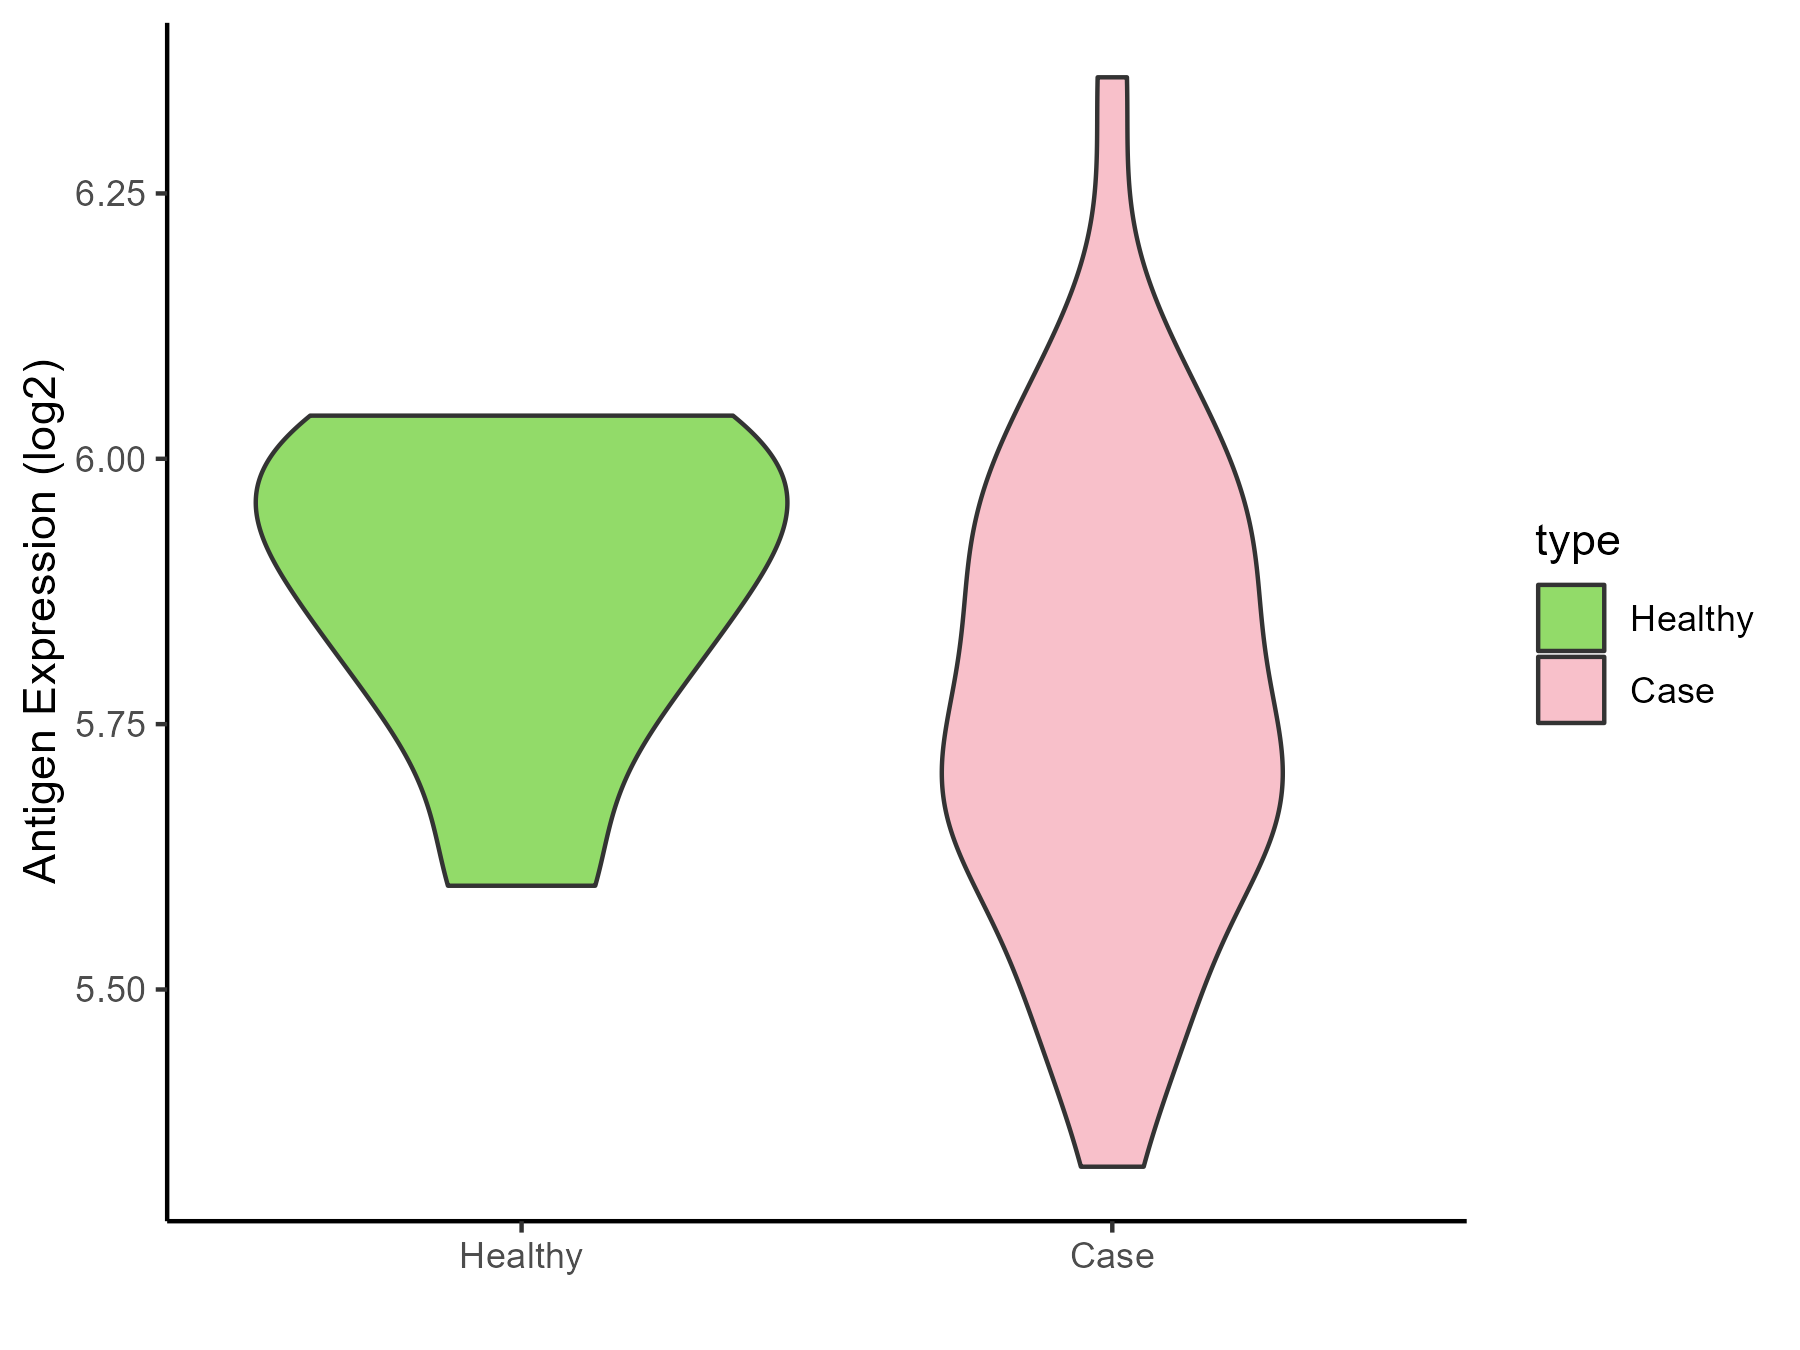
| The Studied Tissue | Muscle | |
| The Specific Disease | Myopathy | |
| The Expression Level of Disease Section Compare with the Healthy Individual Tissue | p-value: 0.146015759; Fold-change: -0.166248057; Z-score: -1.106101765 | |
| Disease-specific Antigen Abundances |
|
Click to View the Clearer Original Diagram |
References
