Tissue specific Abundances of This Antigen
ICD Disease Classification 01
Click to Show/Hide the 1 Disease of This Class
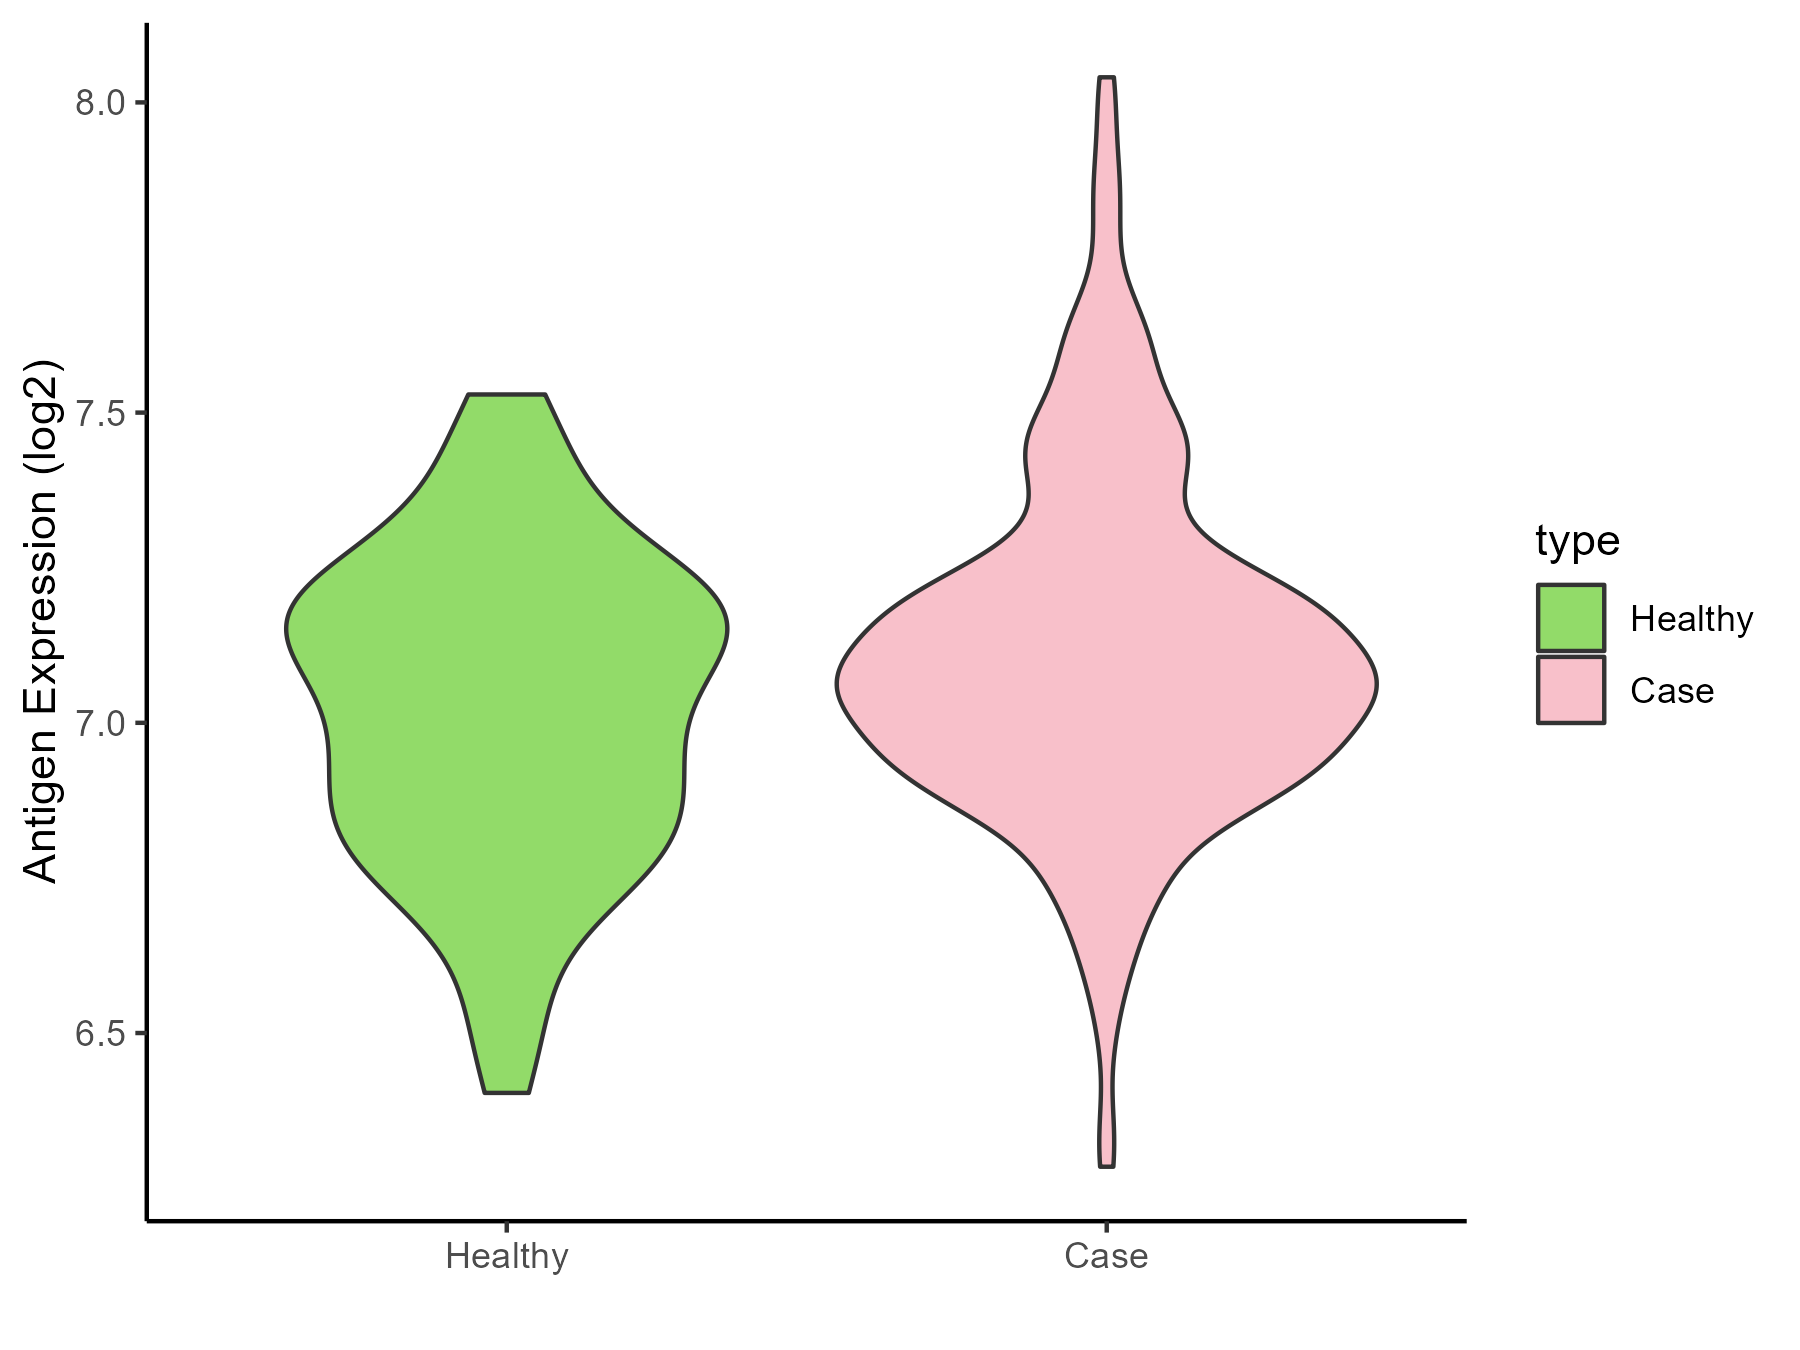
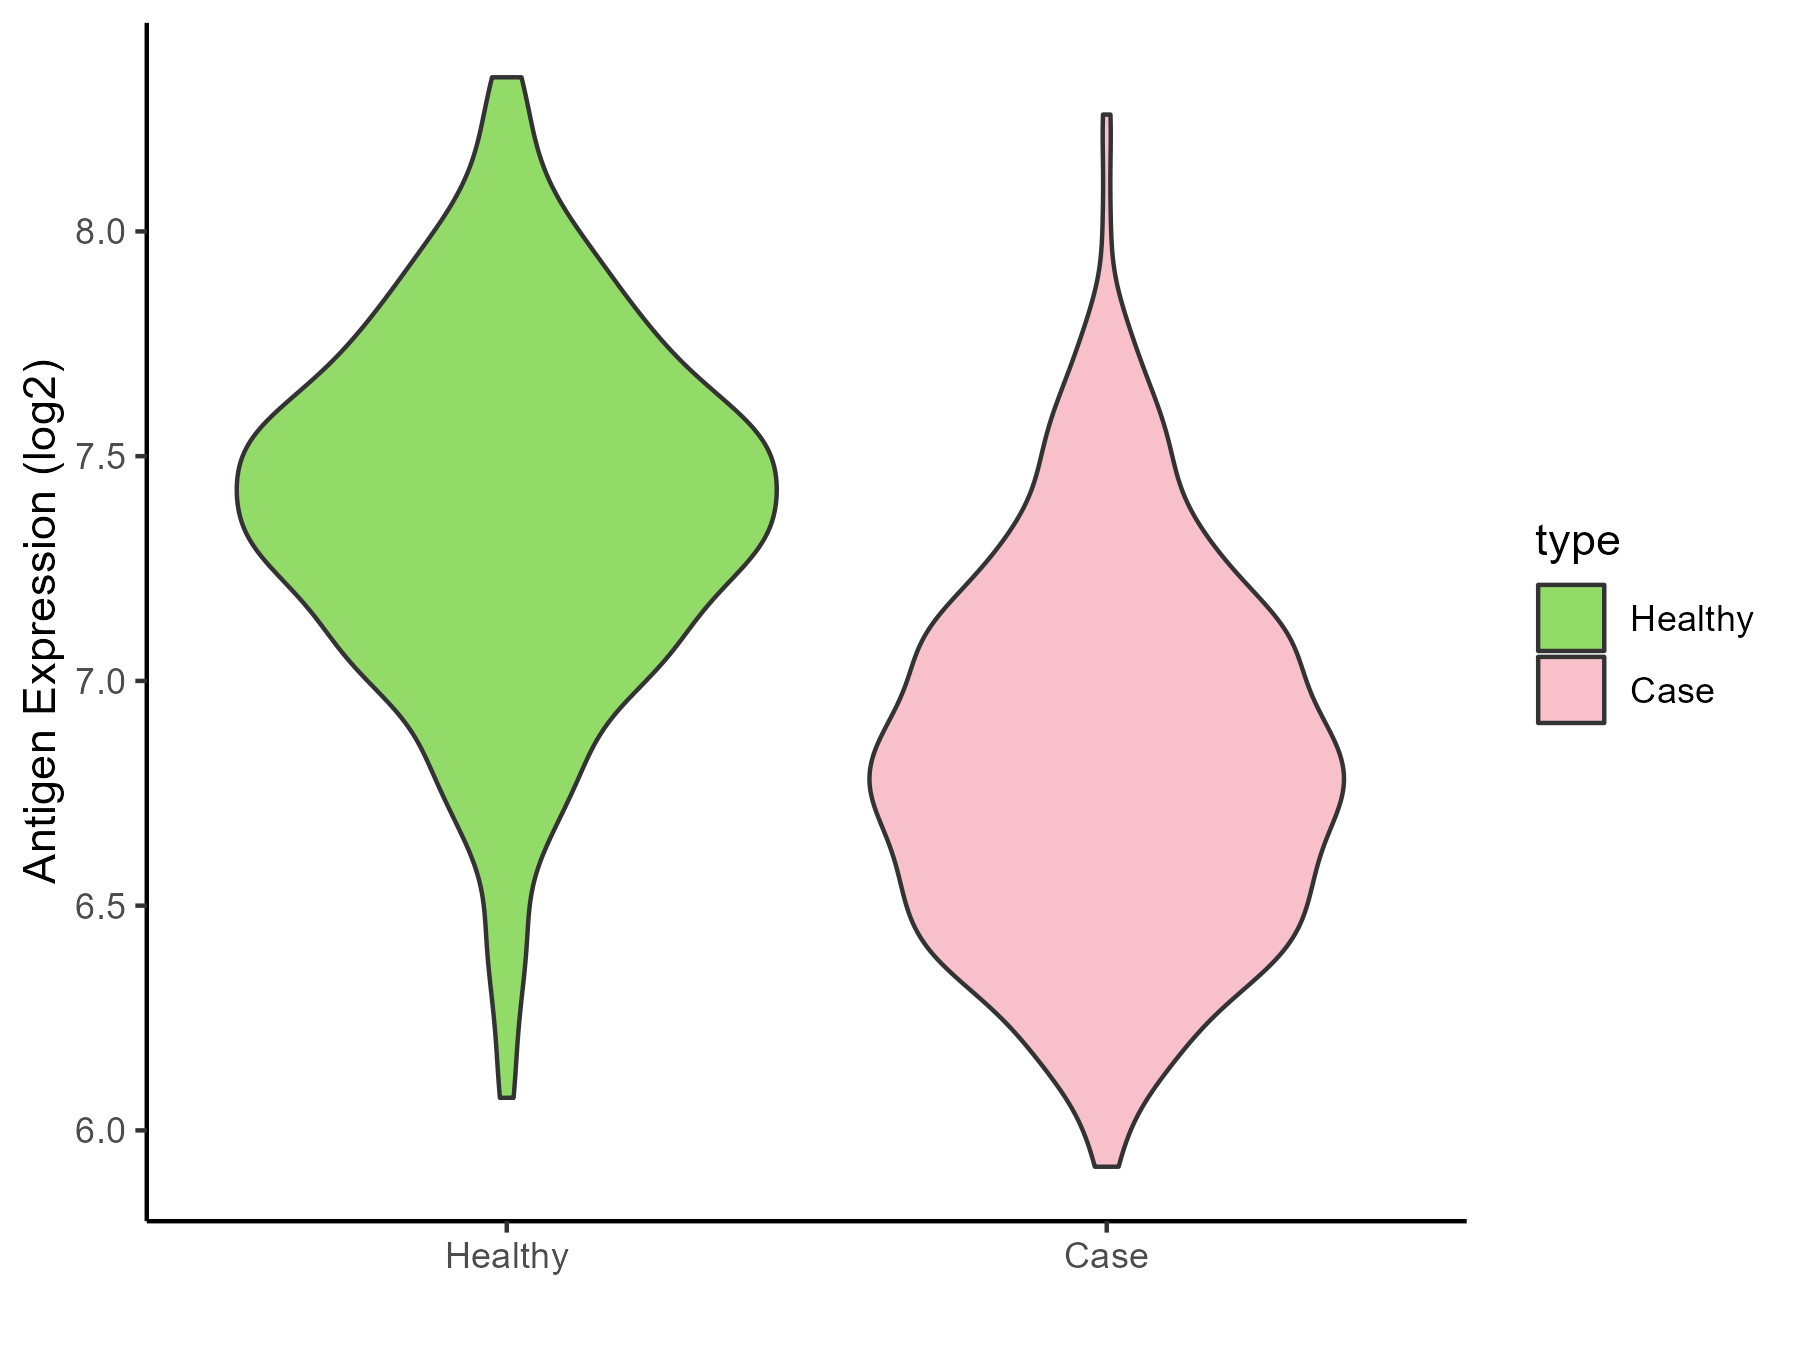
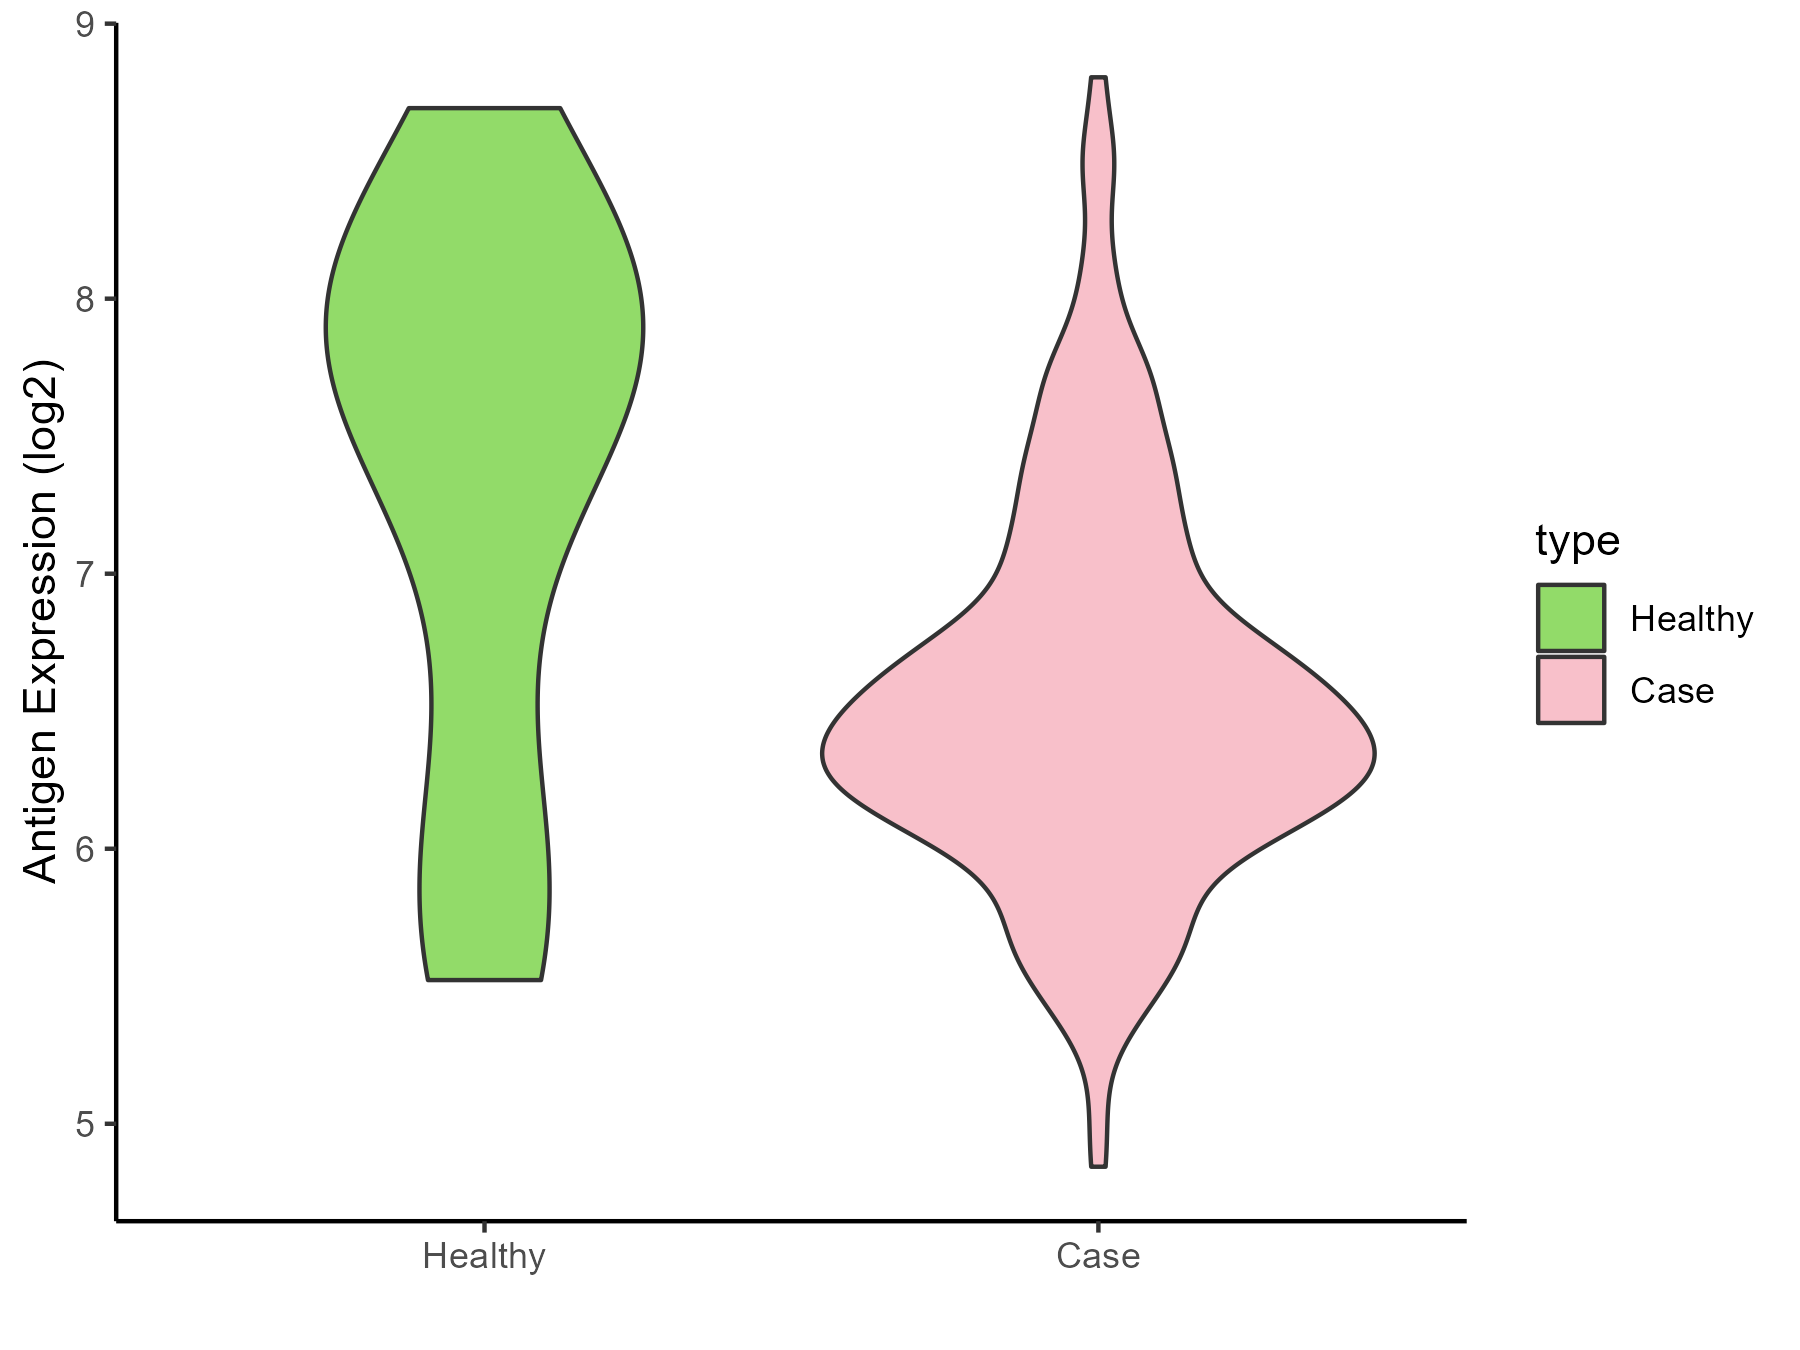
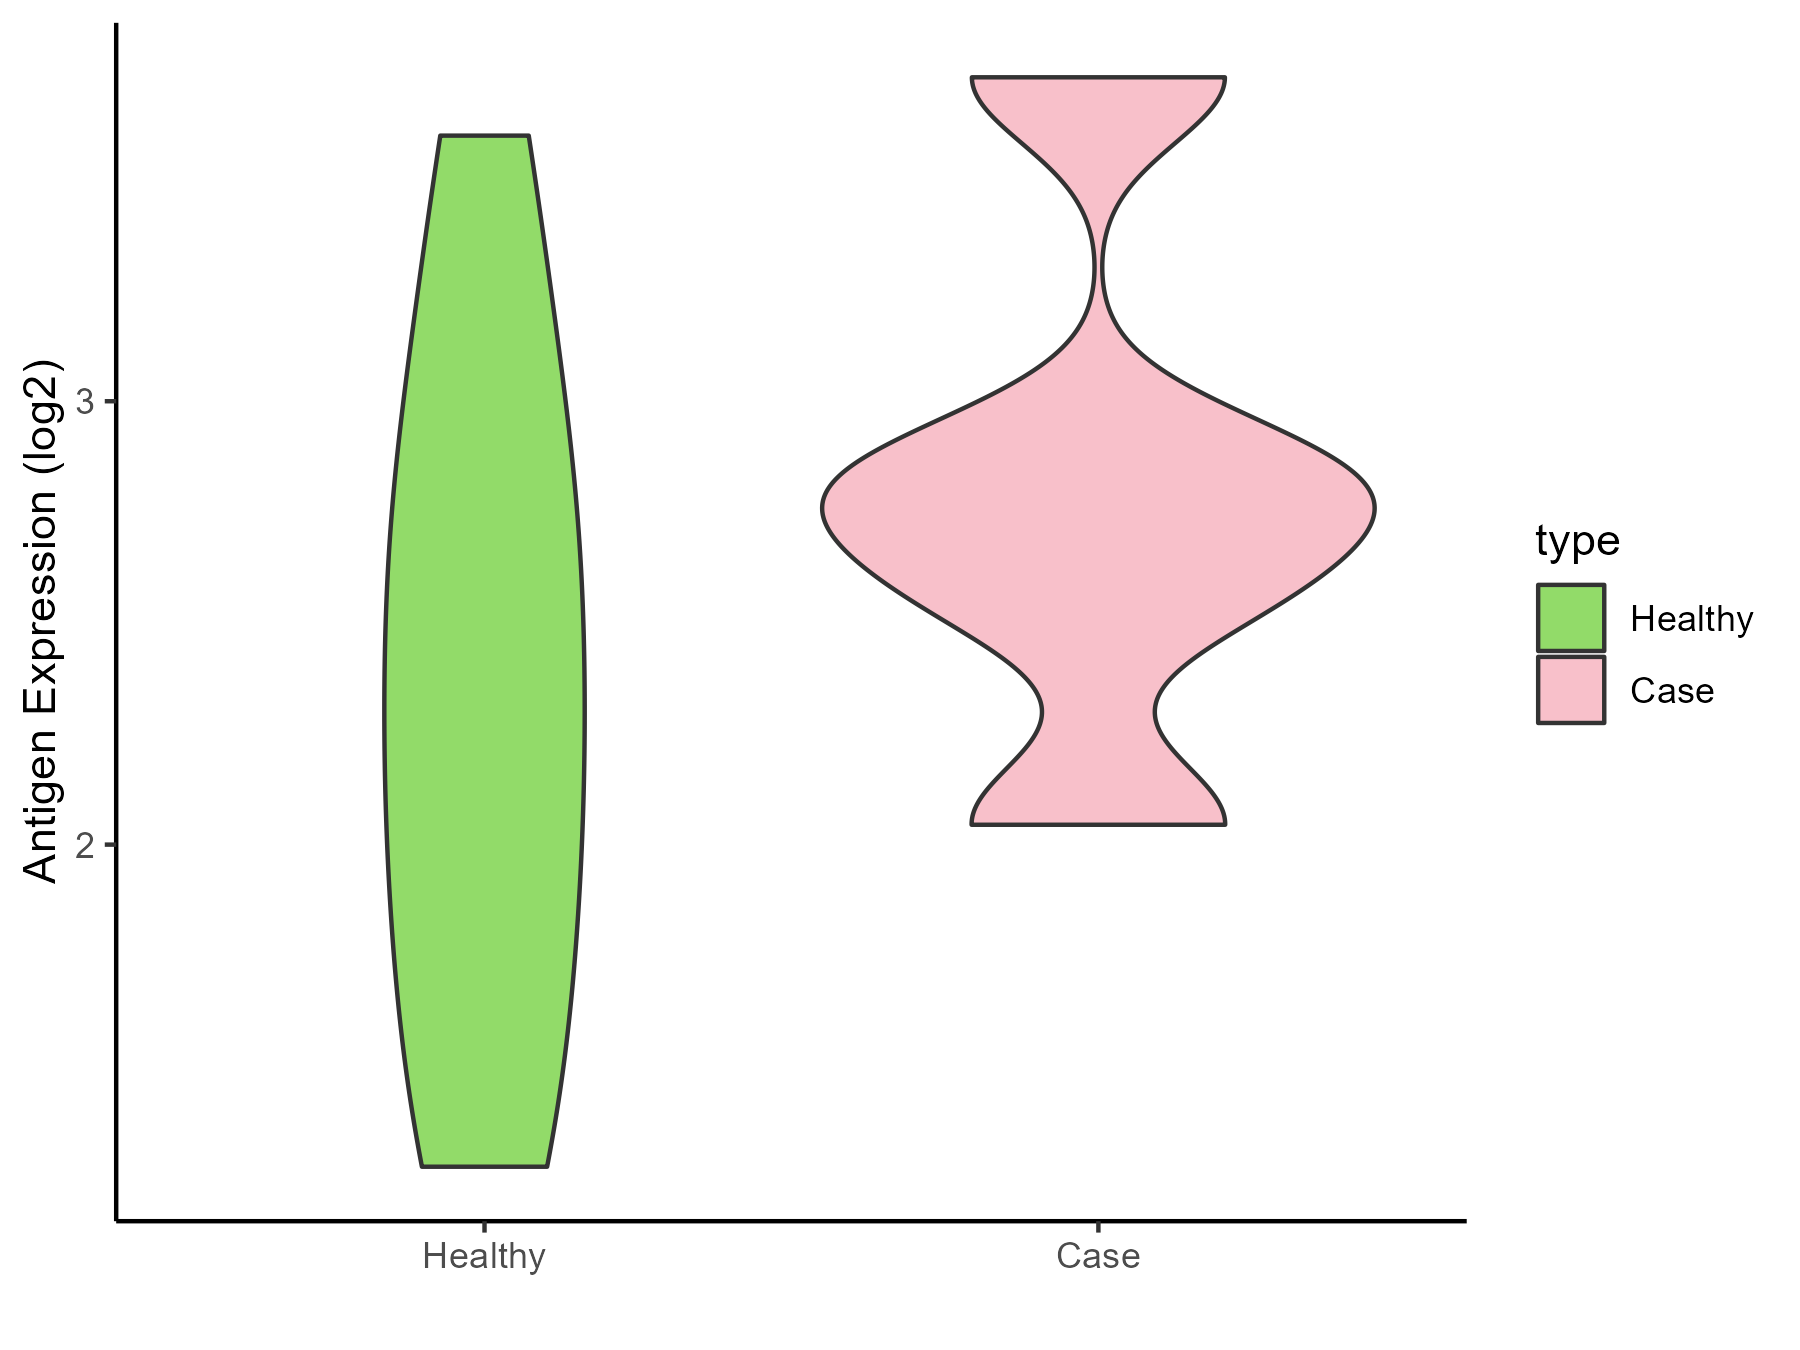
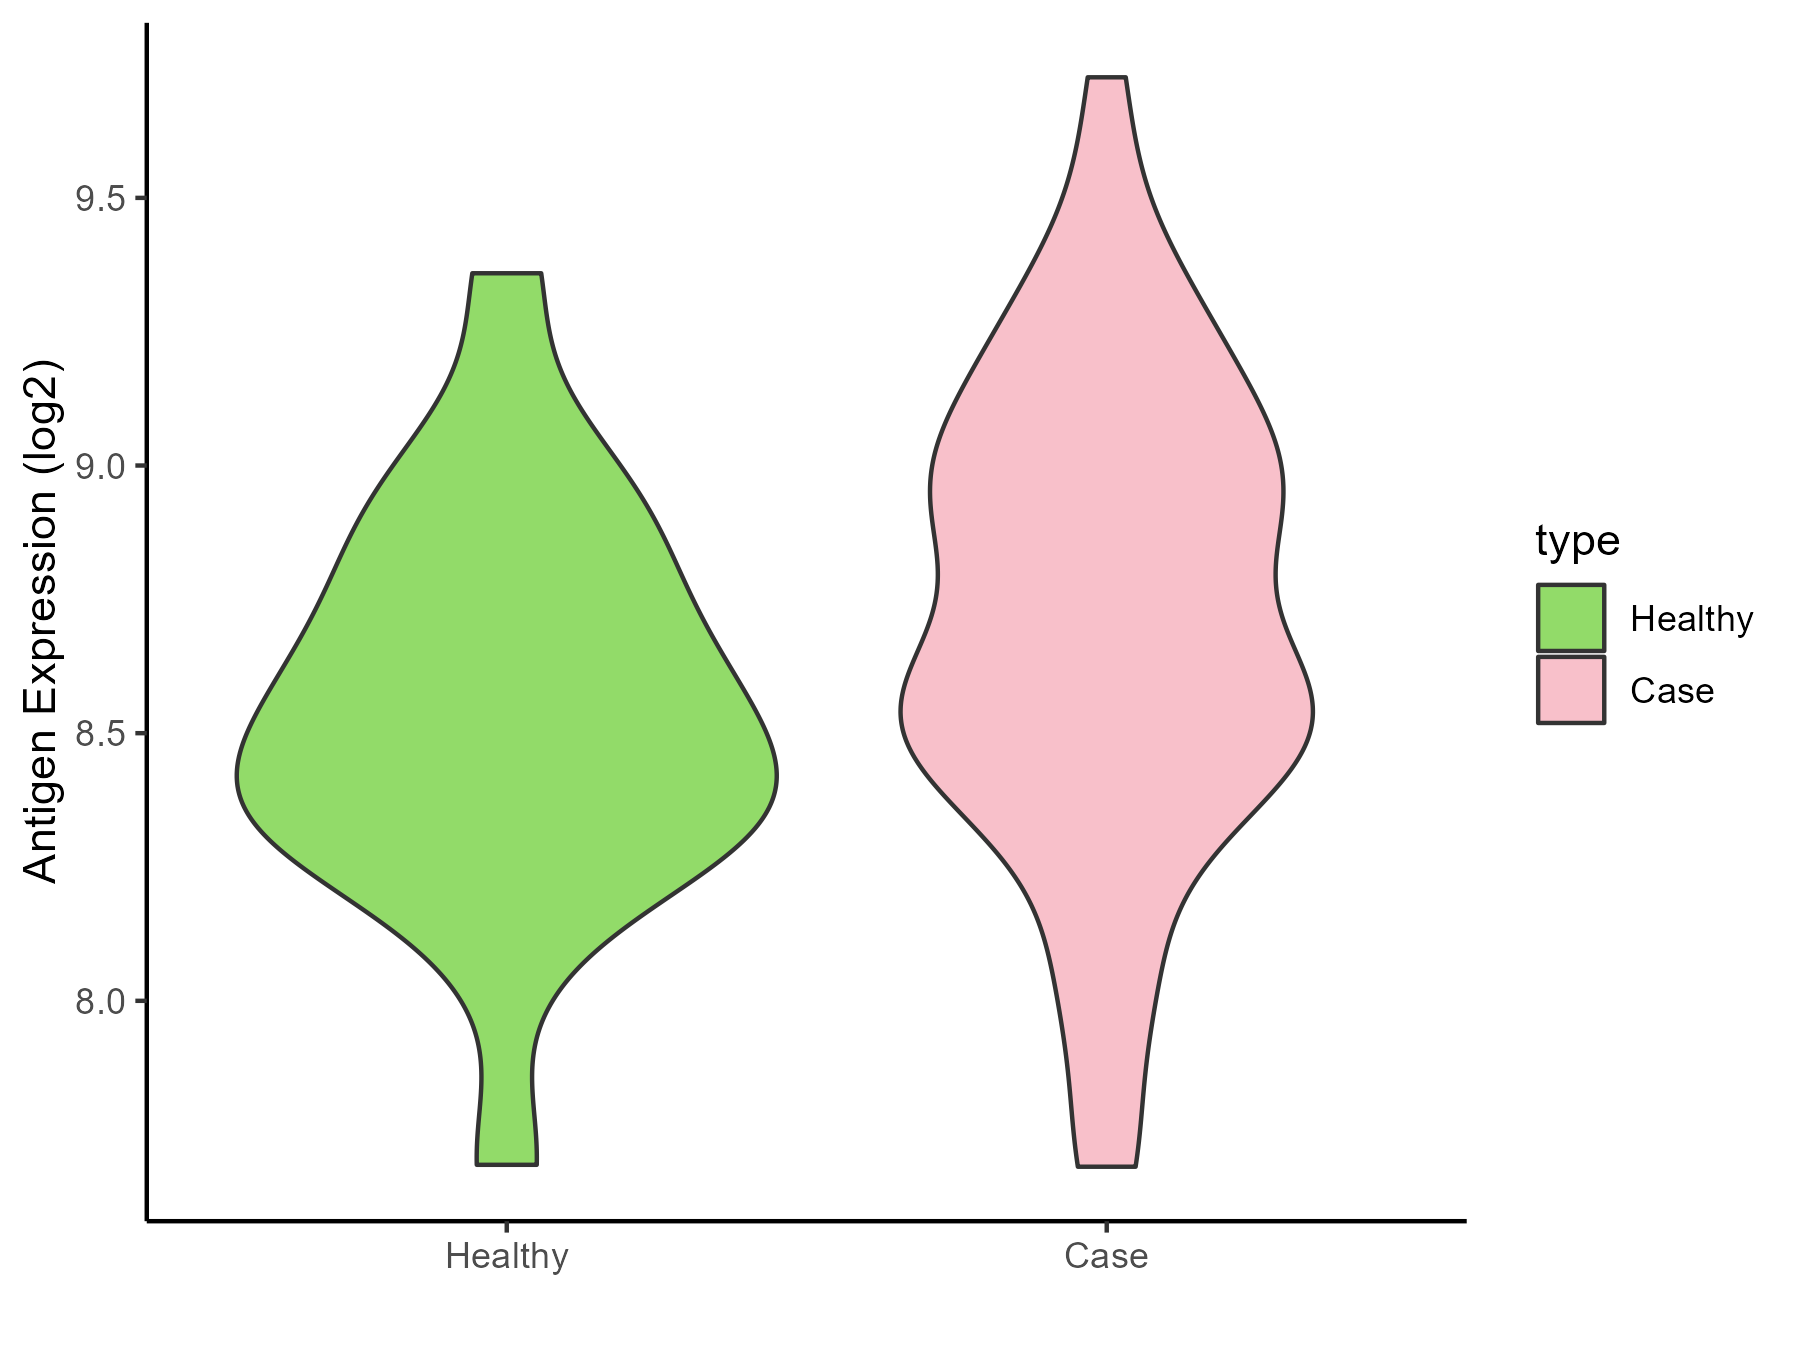
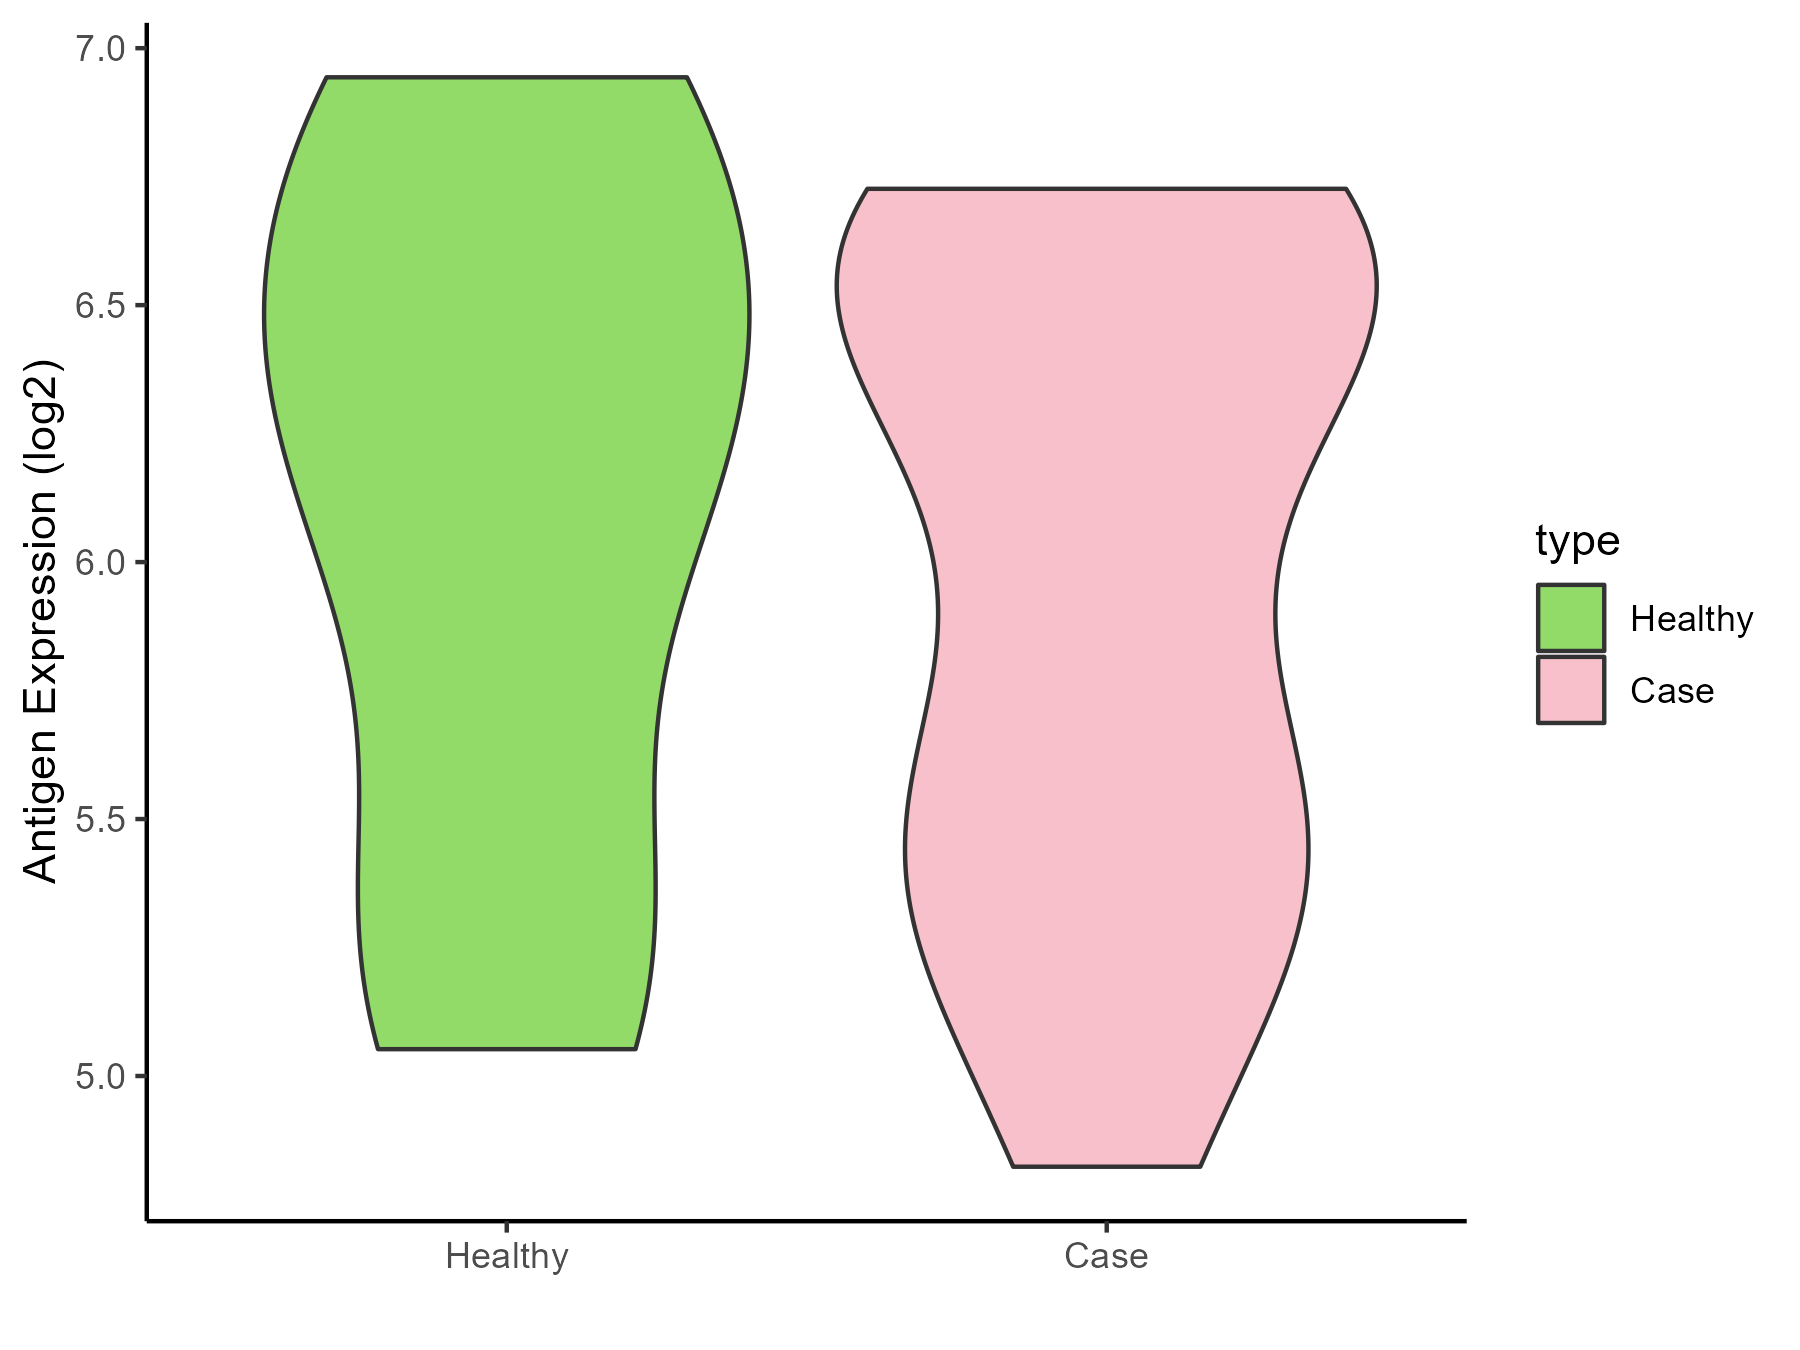
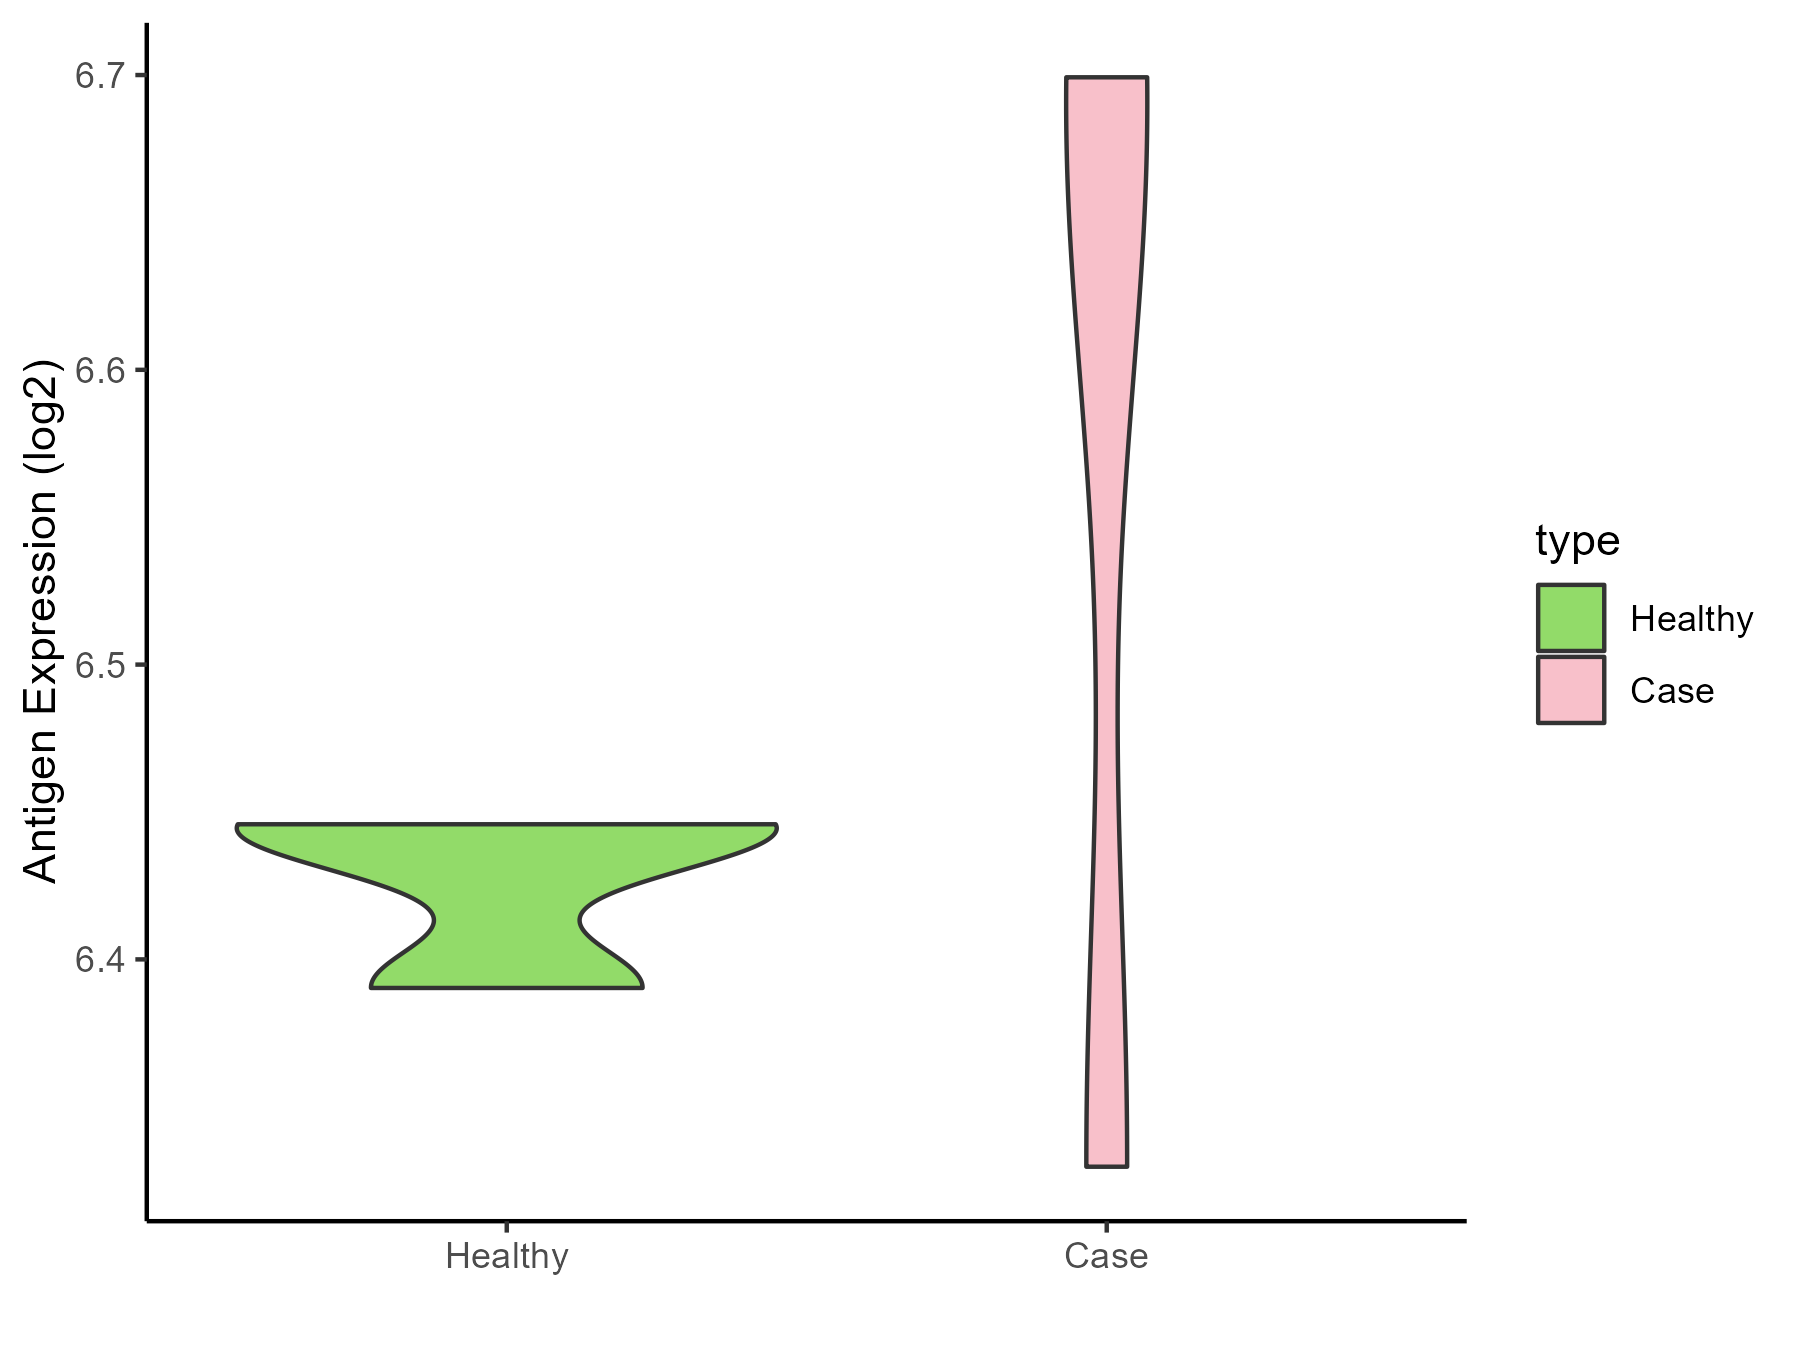
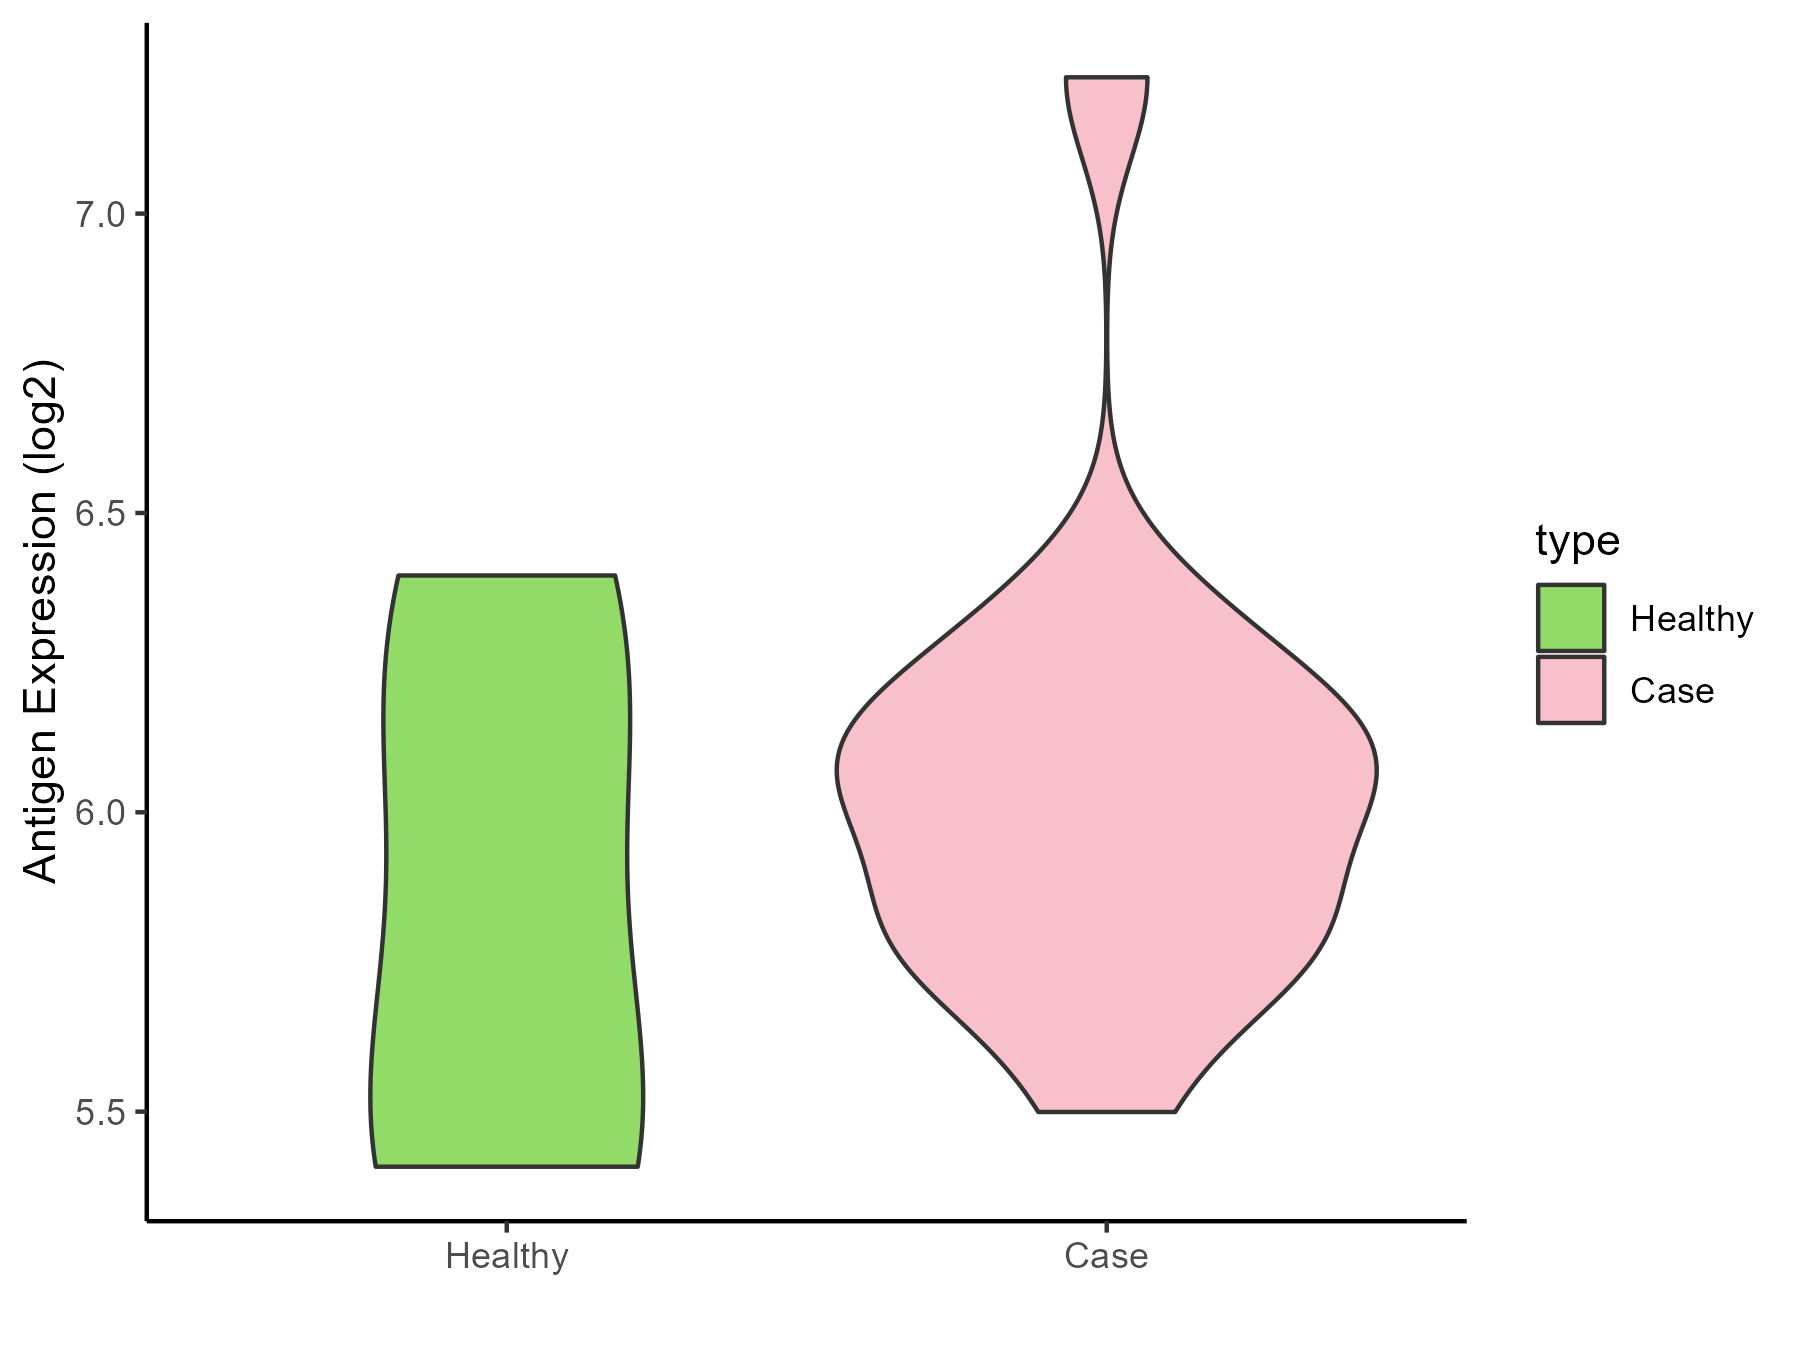
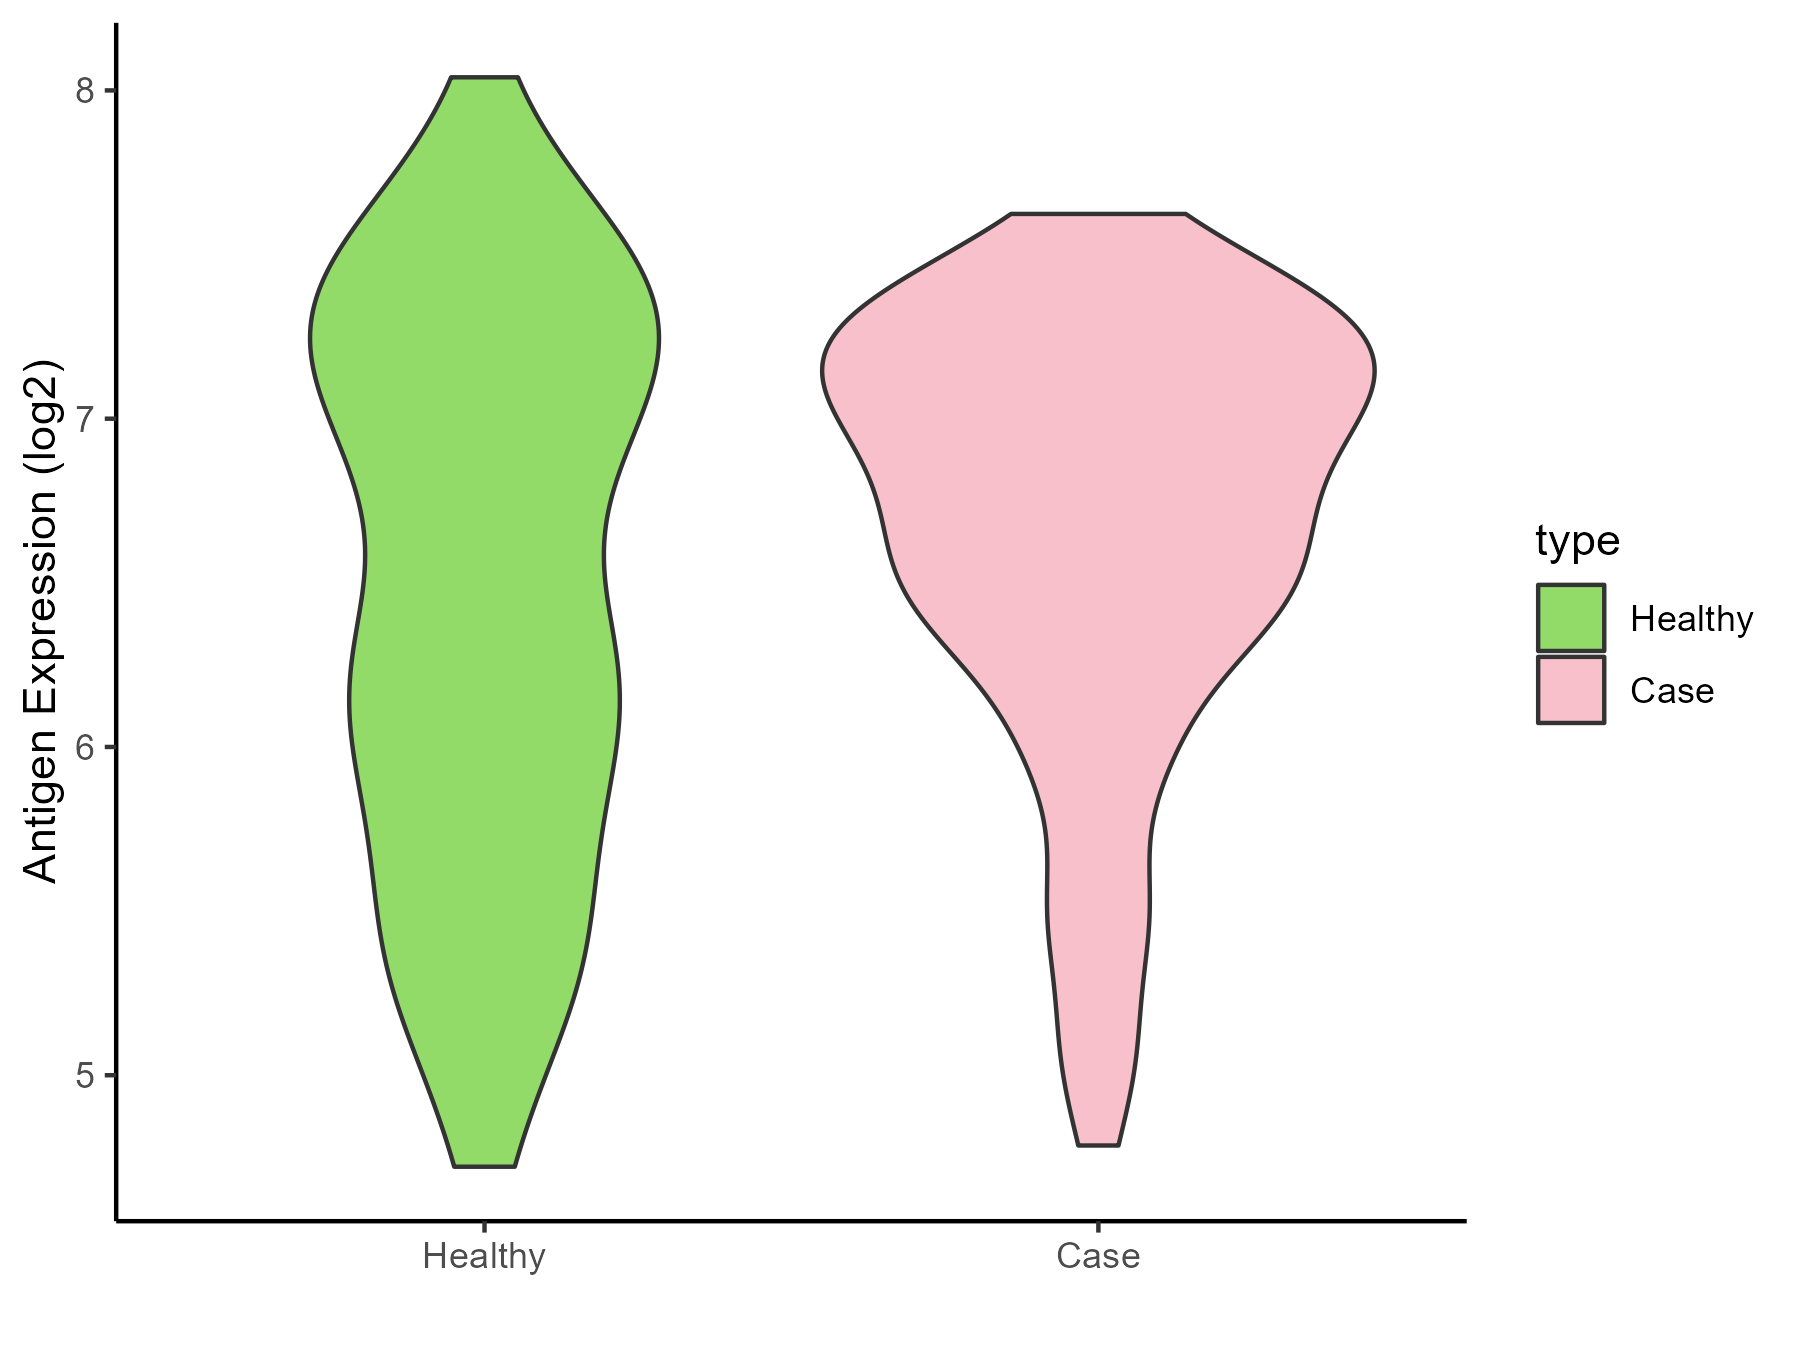
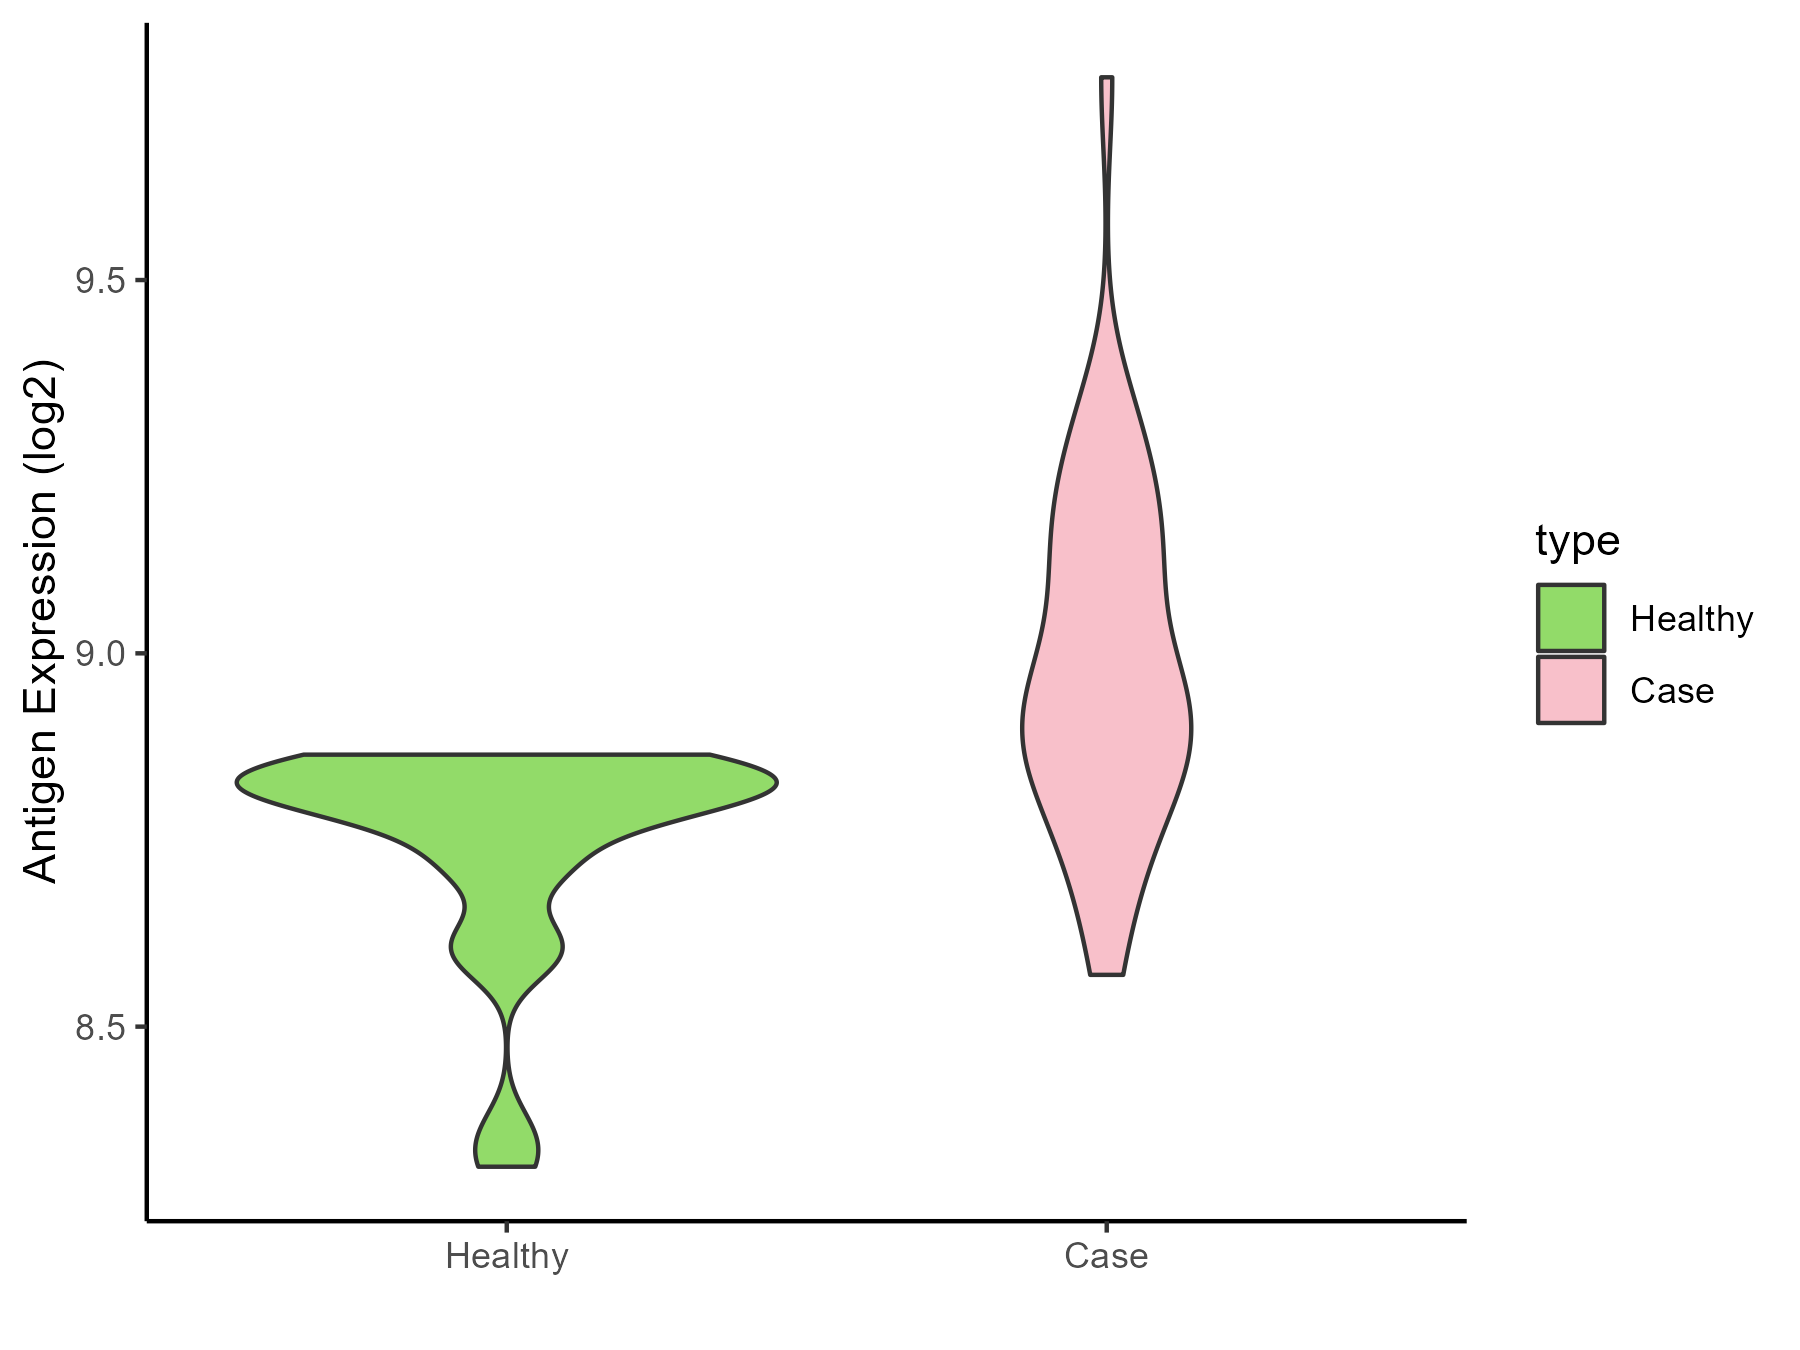
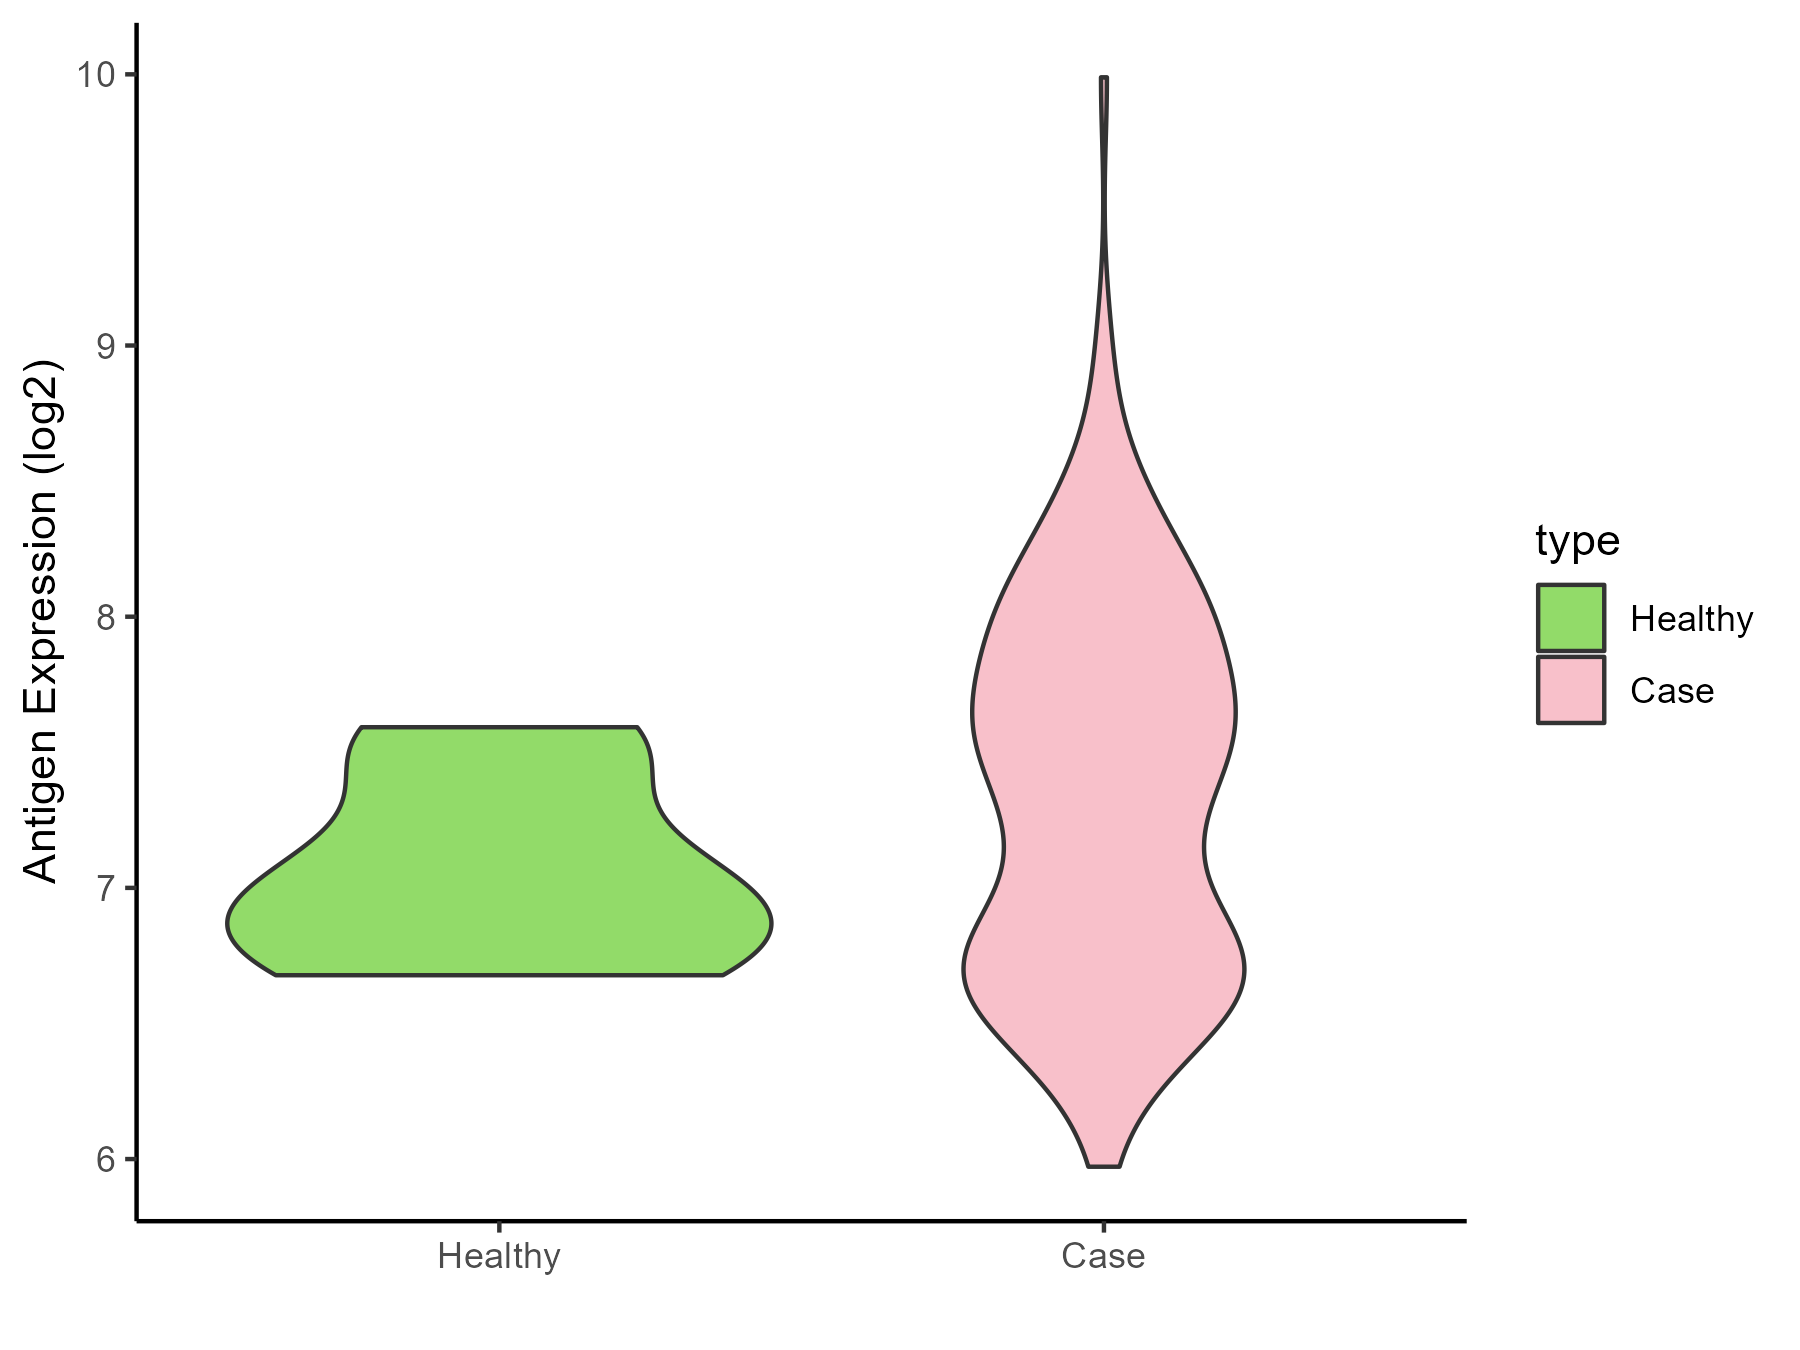
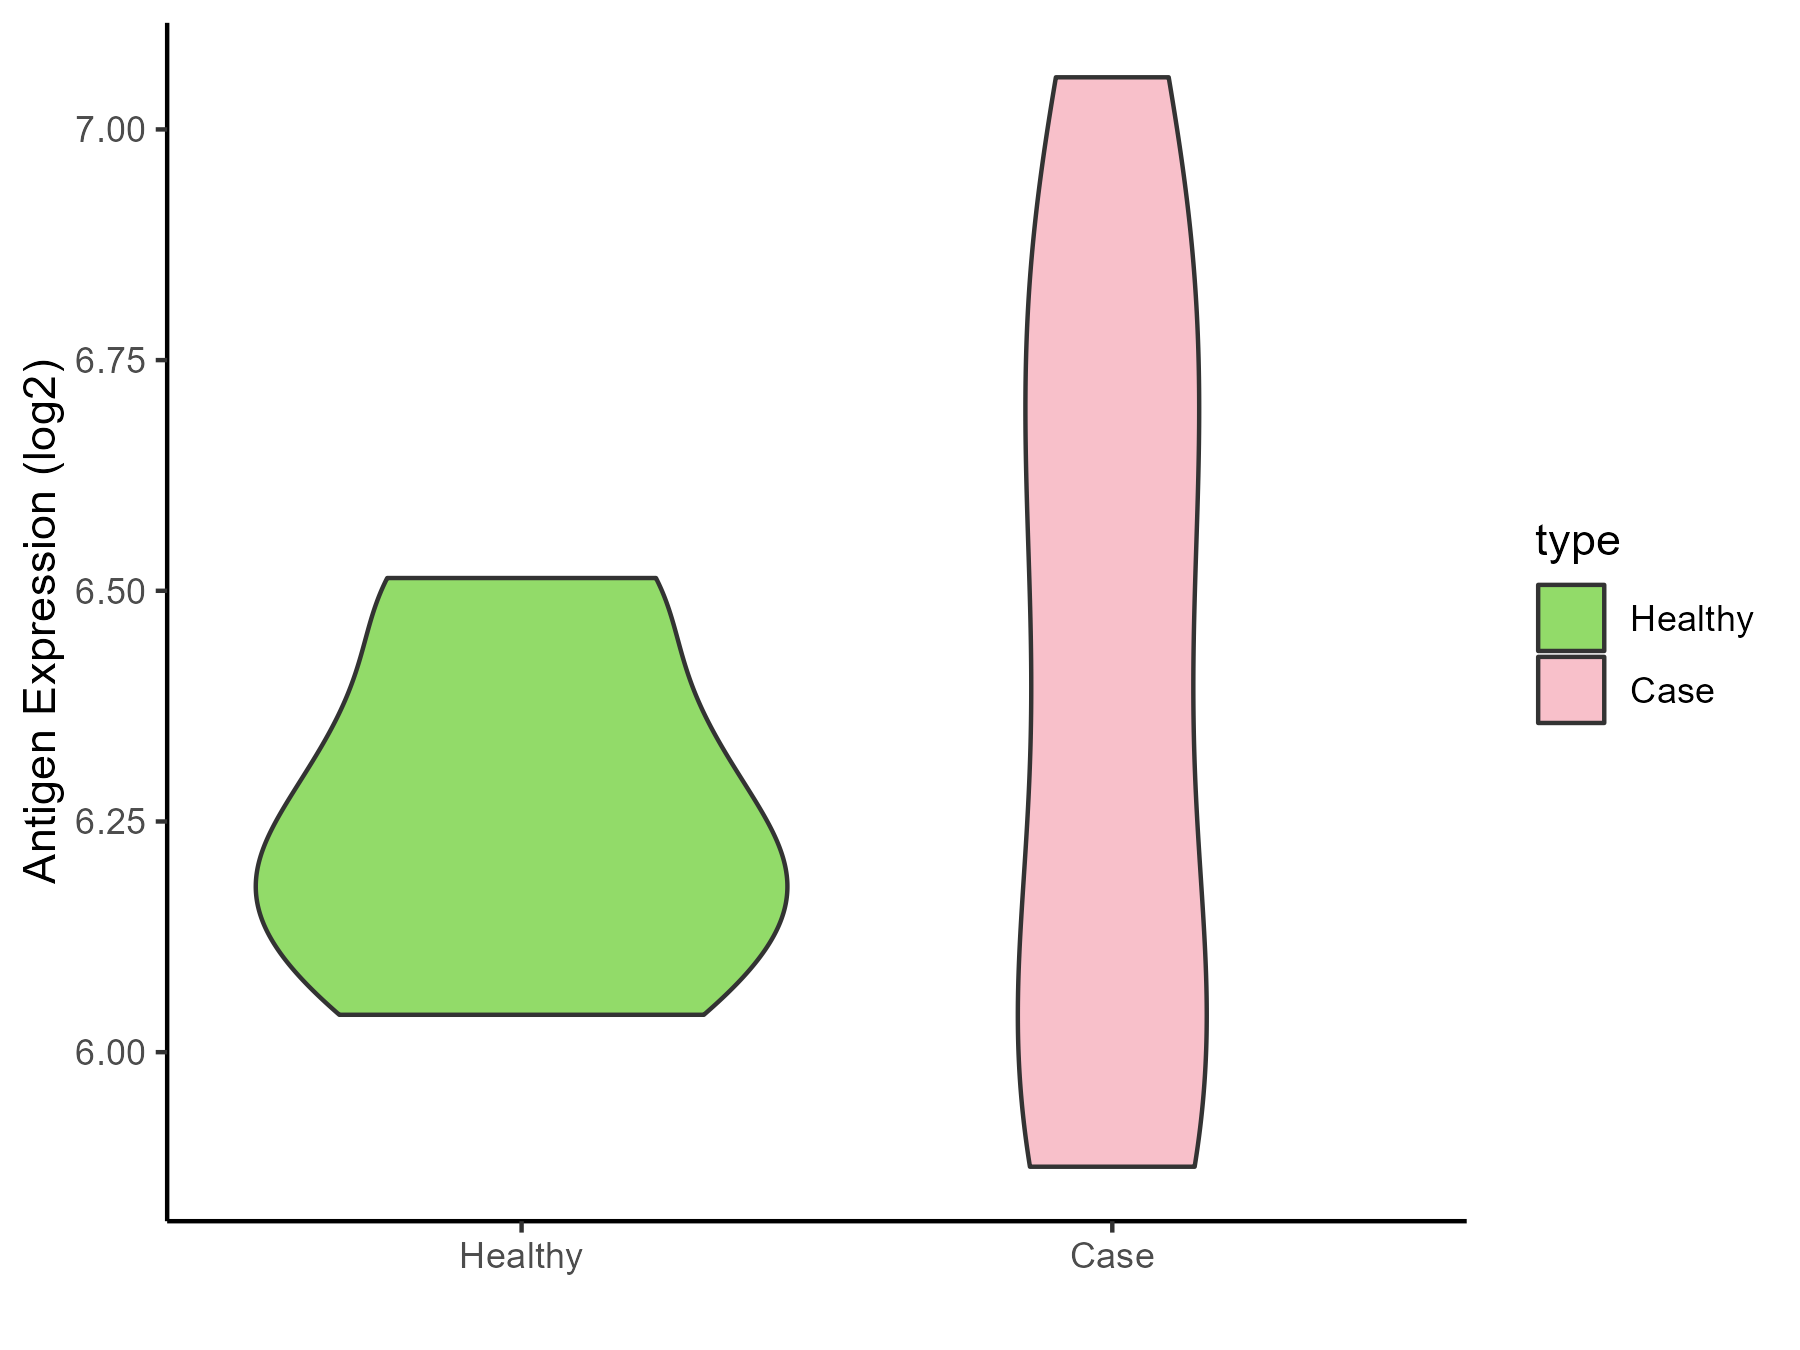
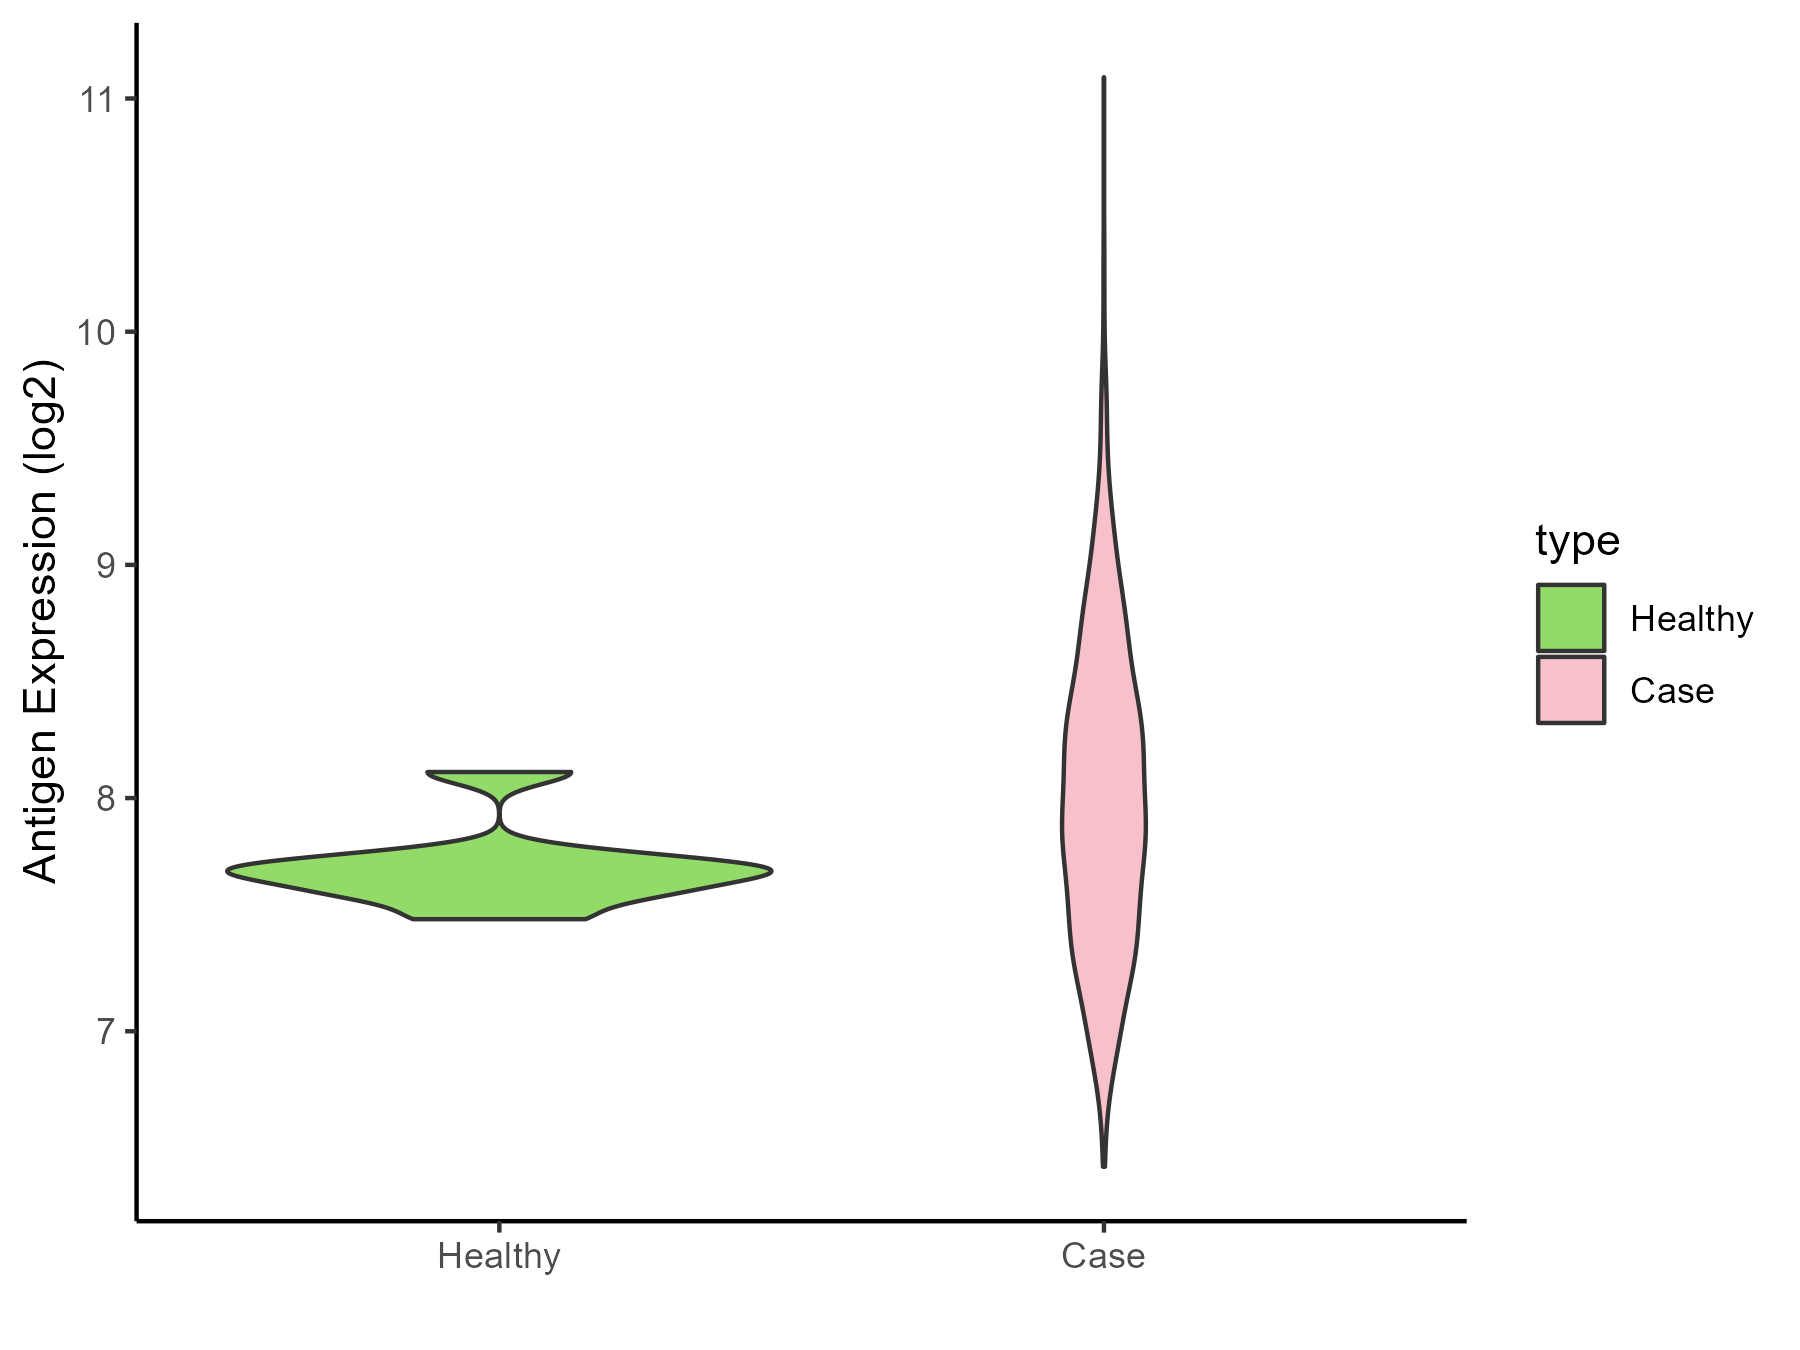
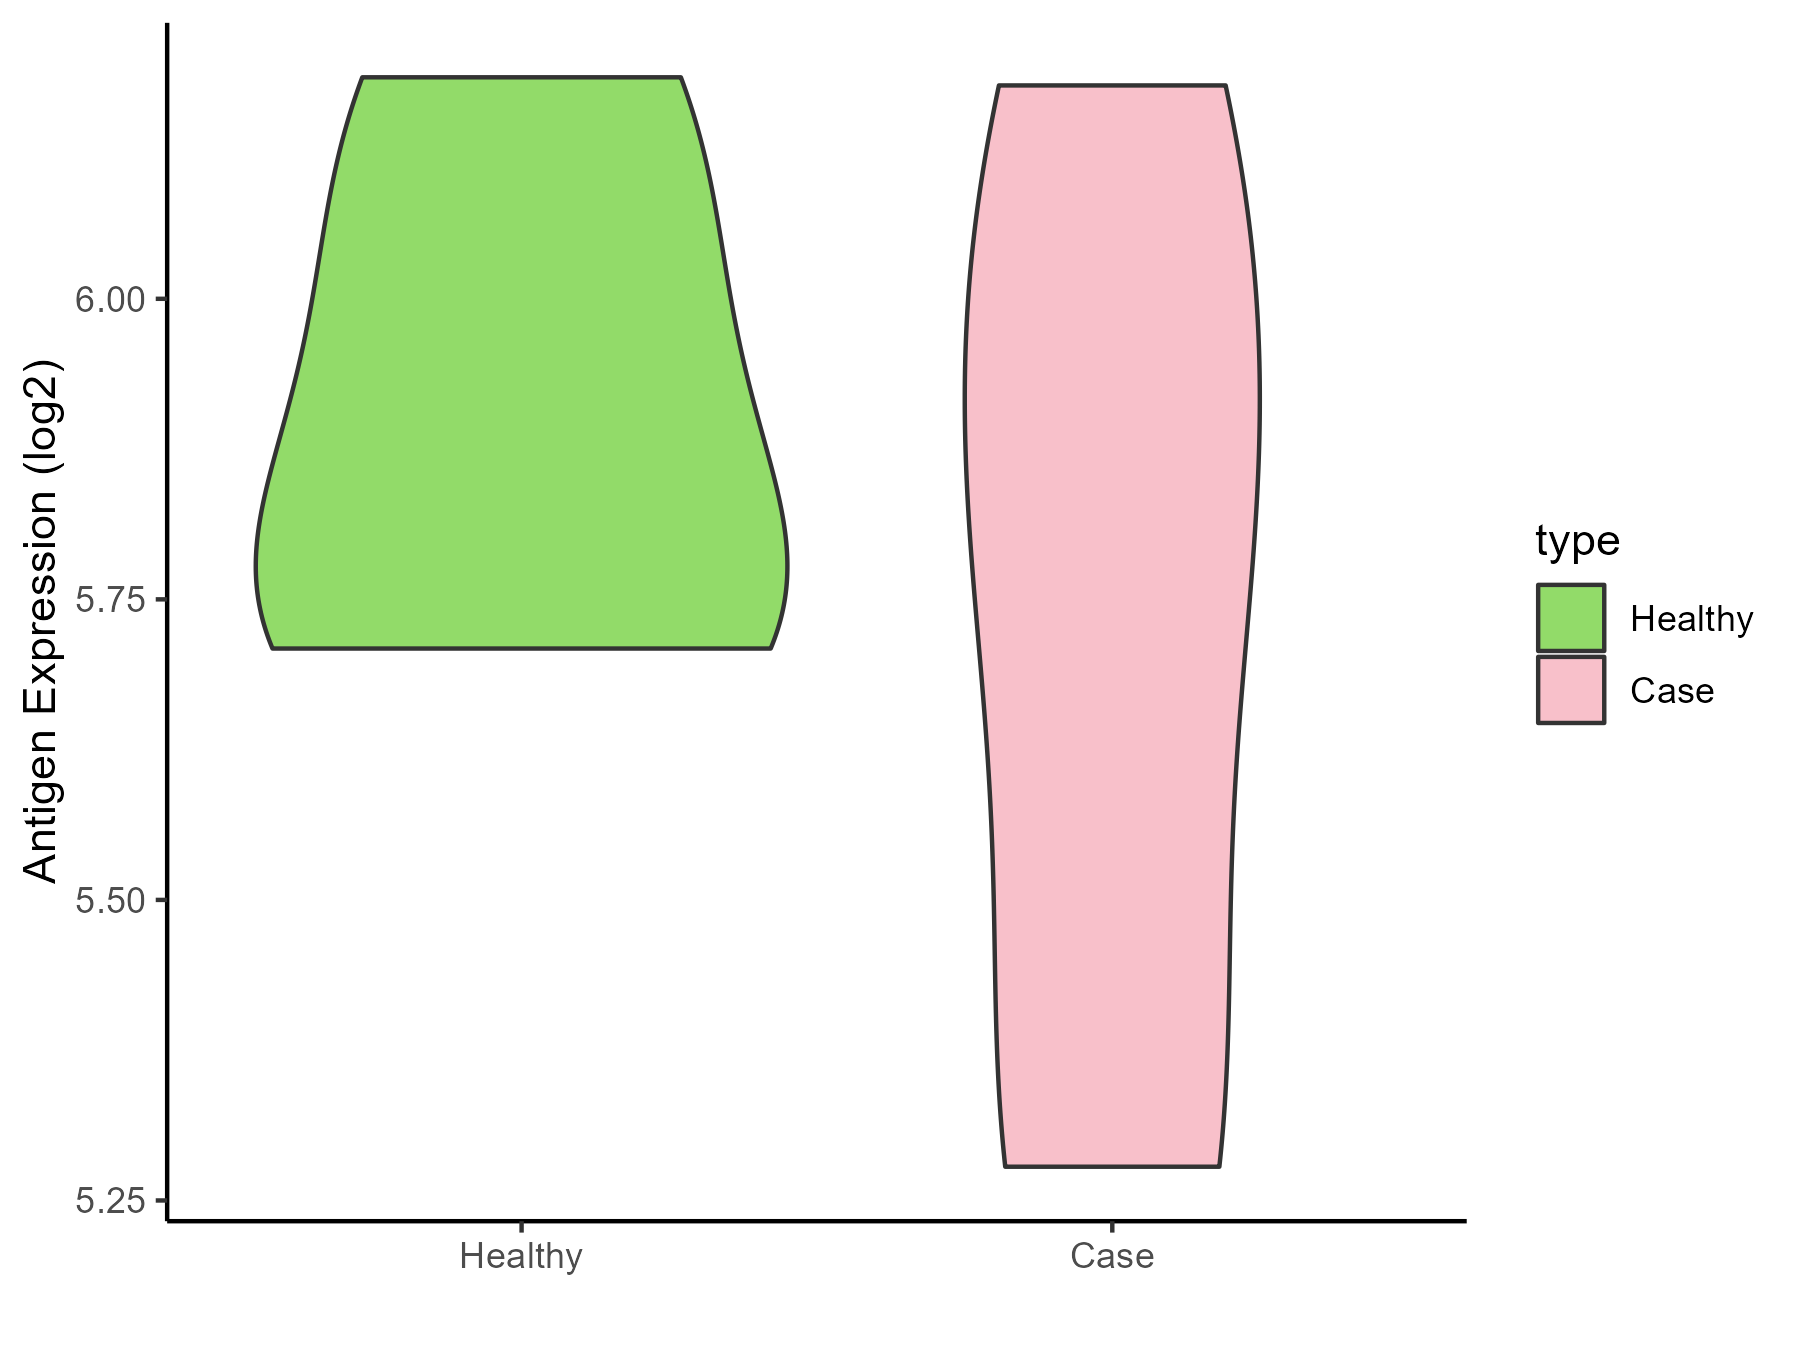
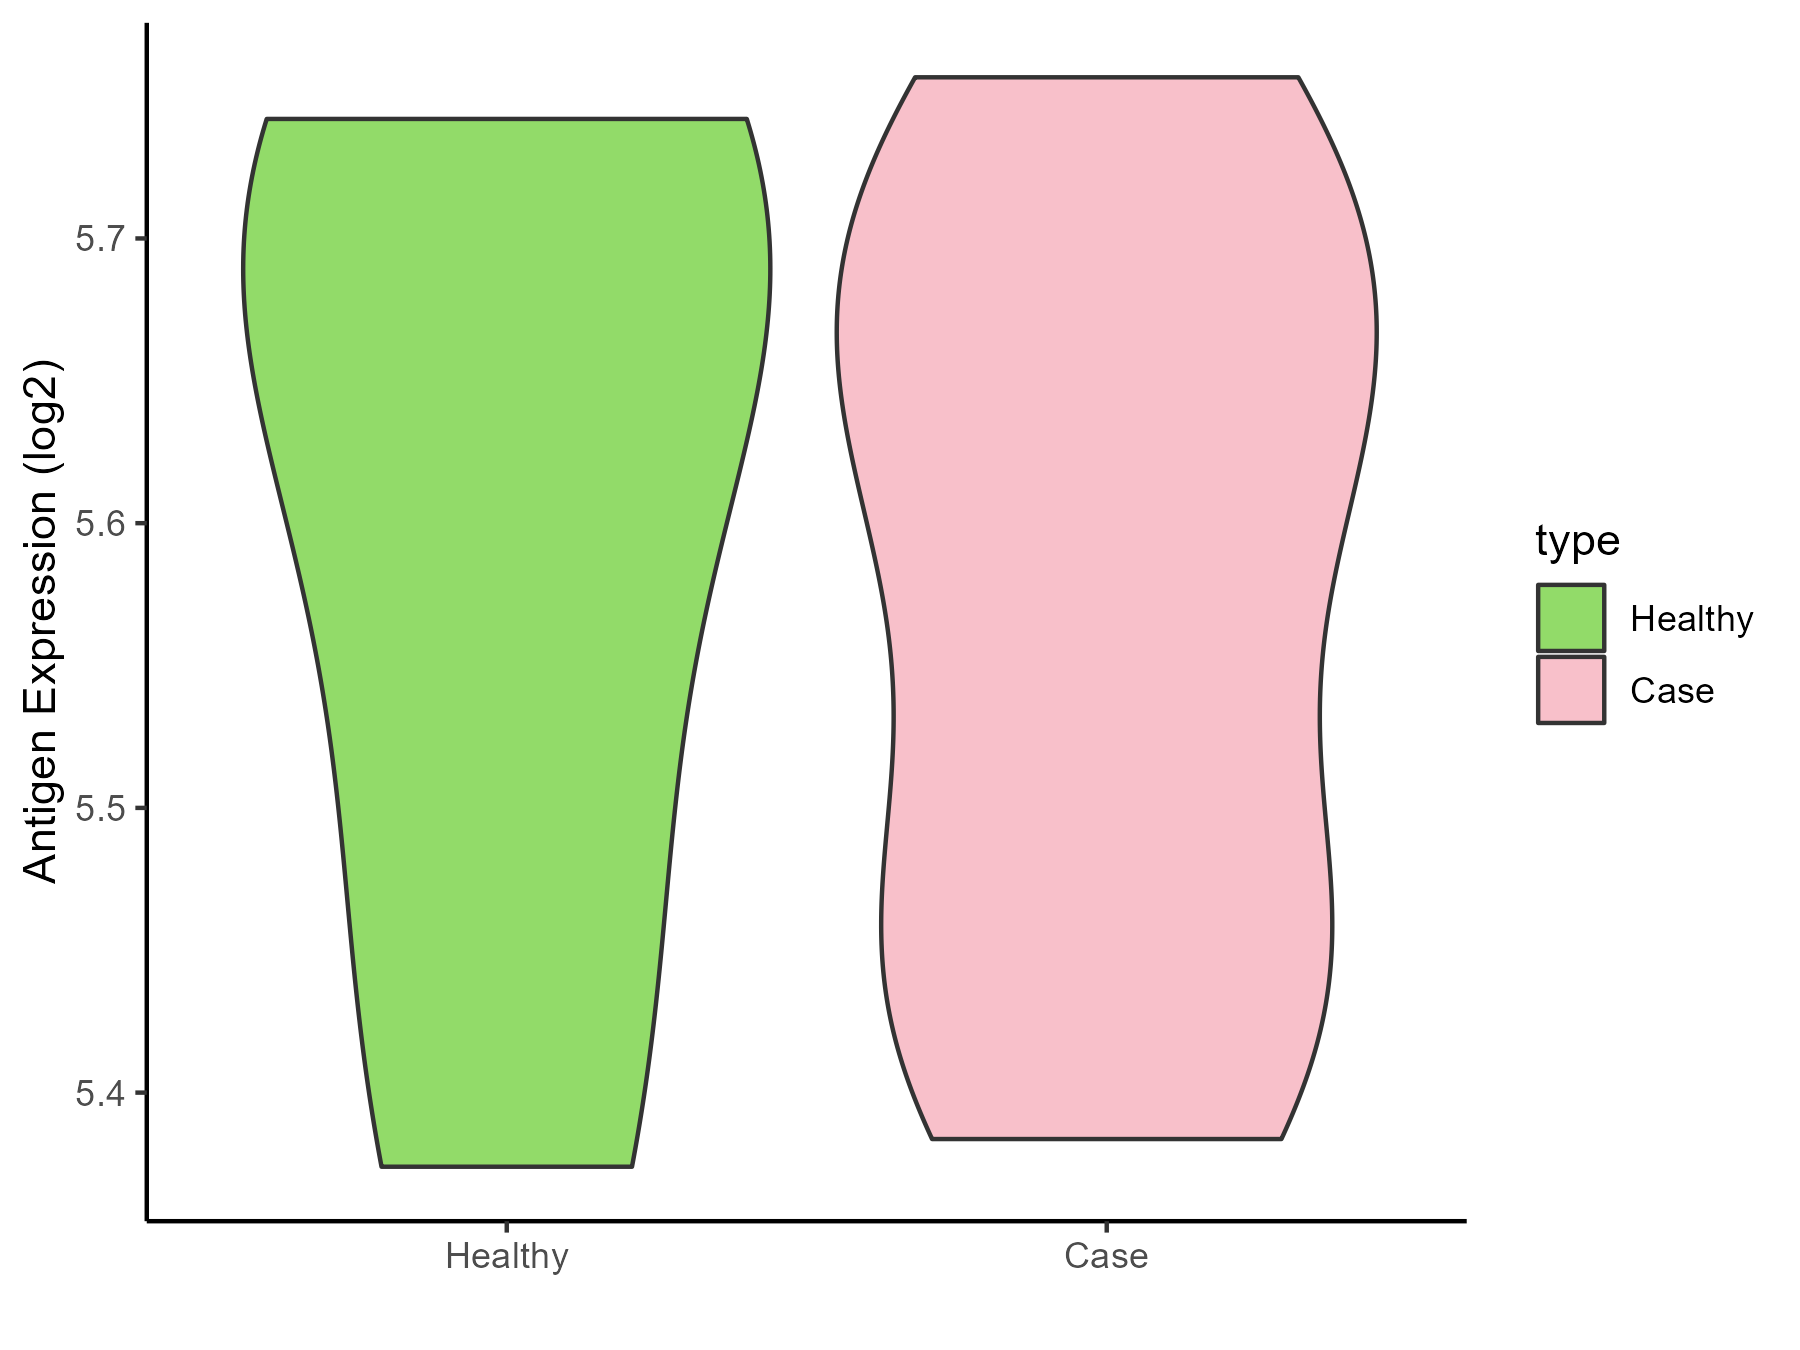
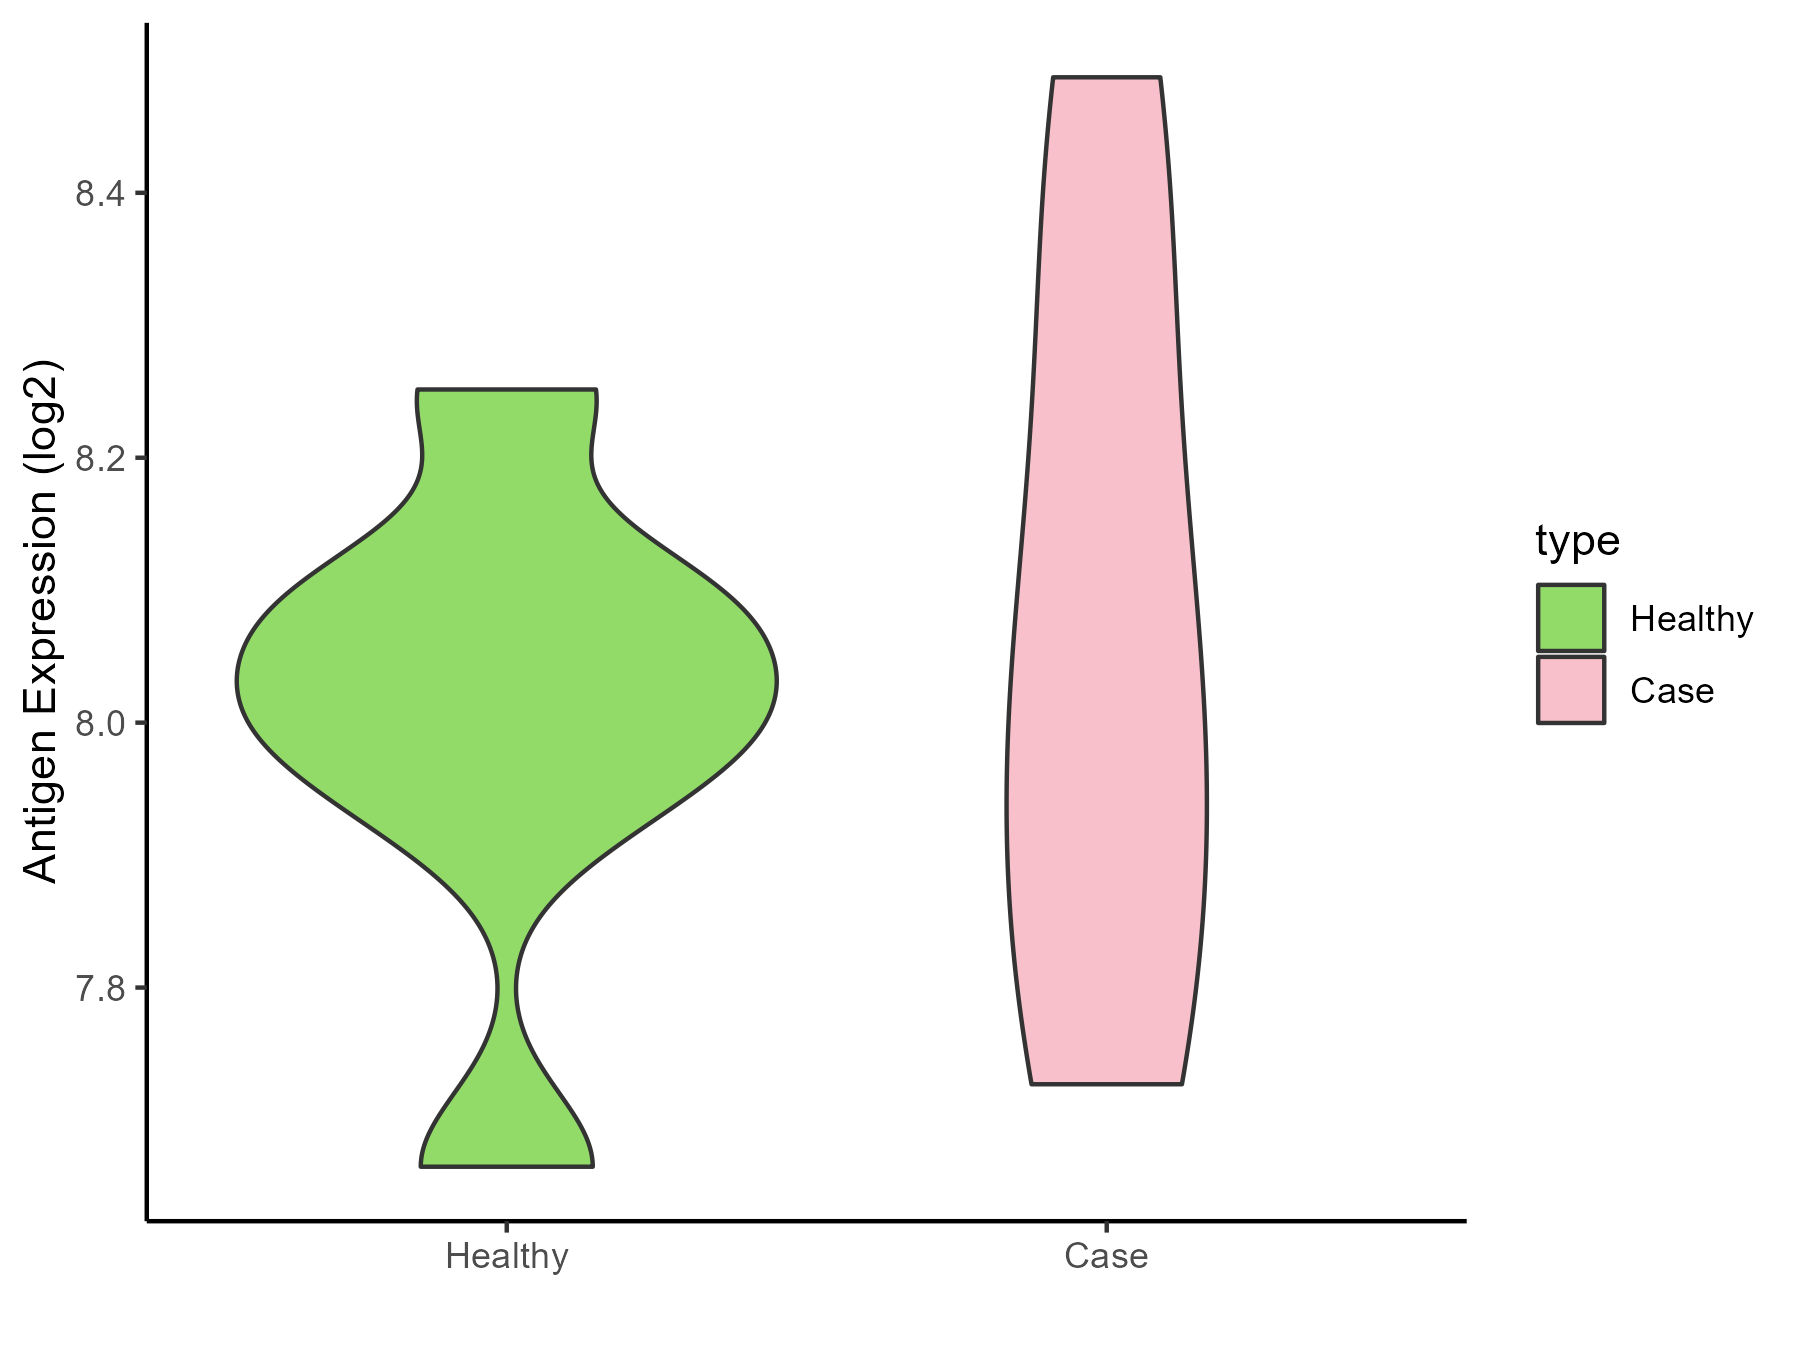
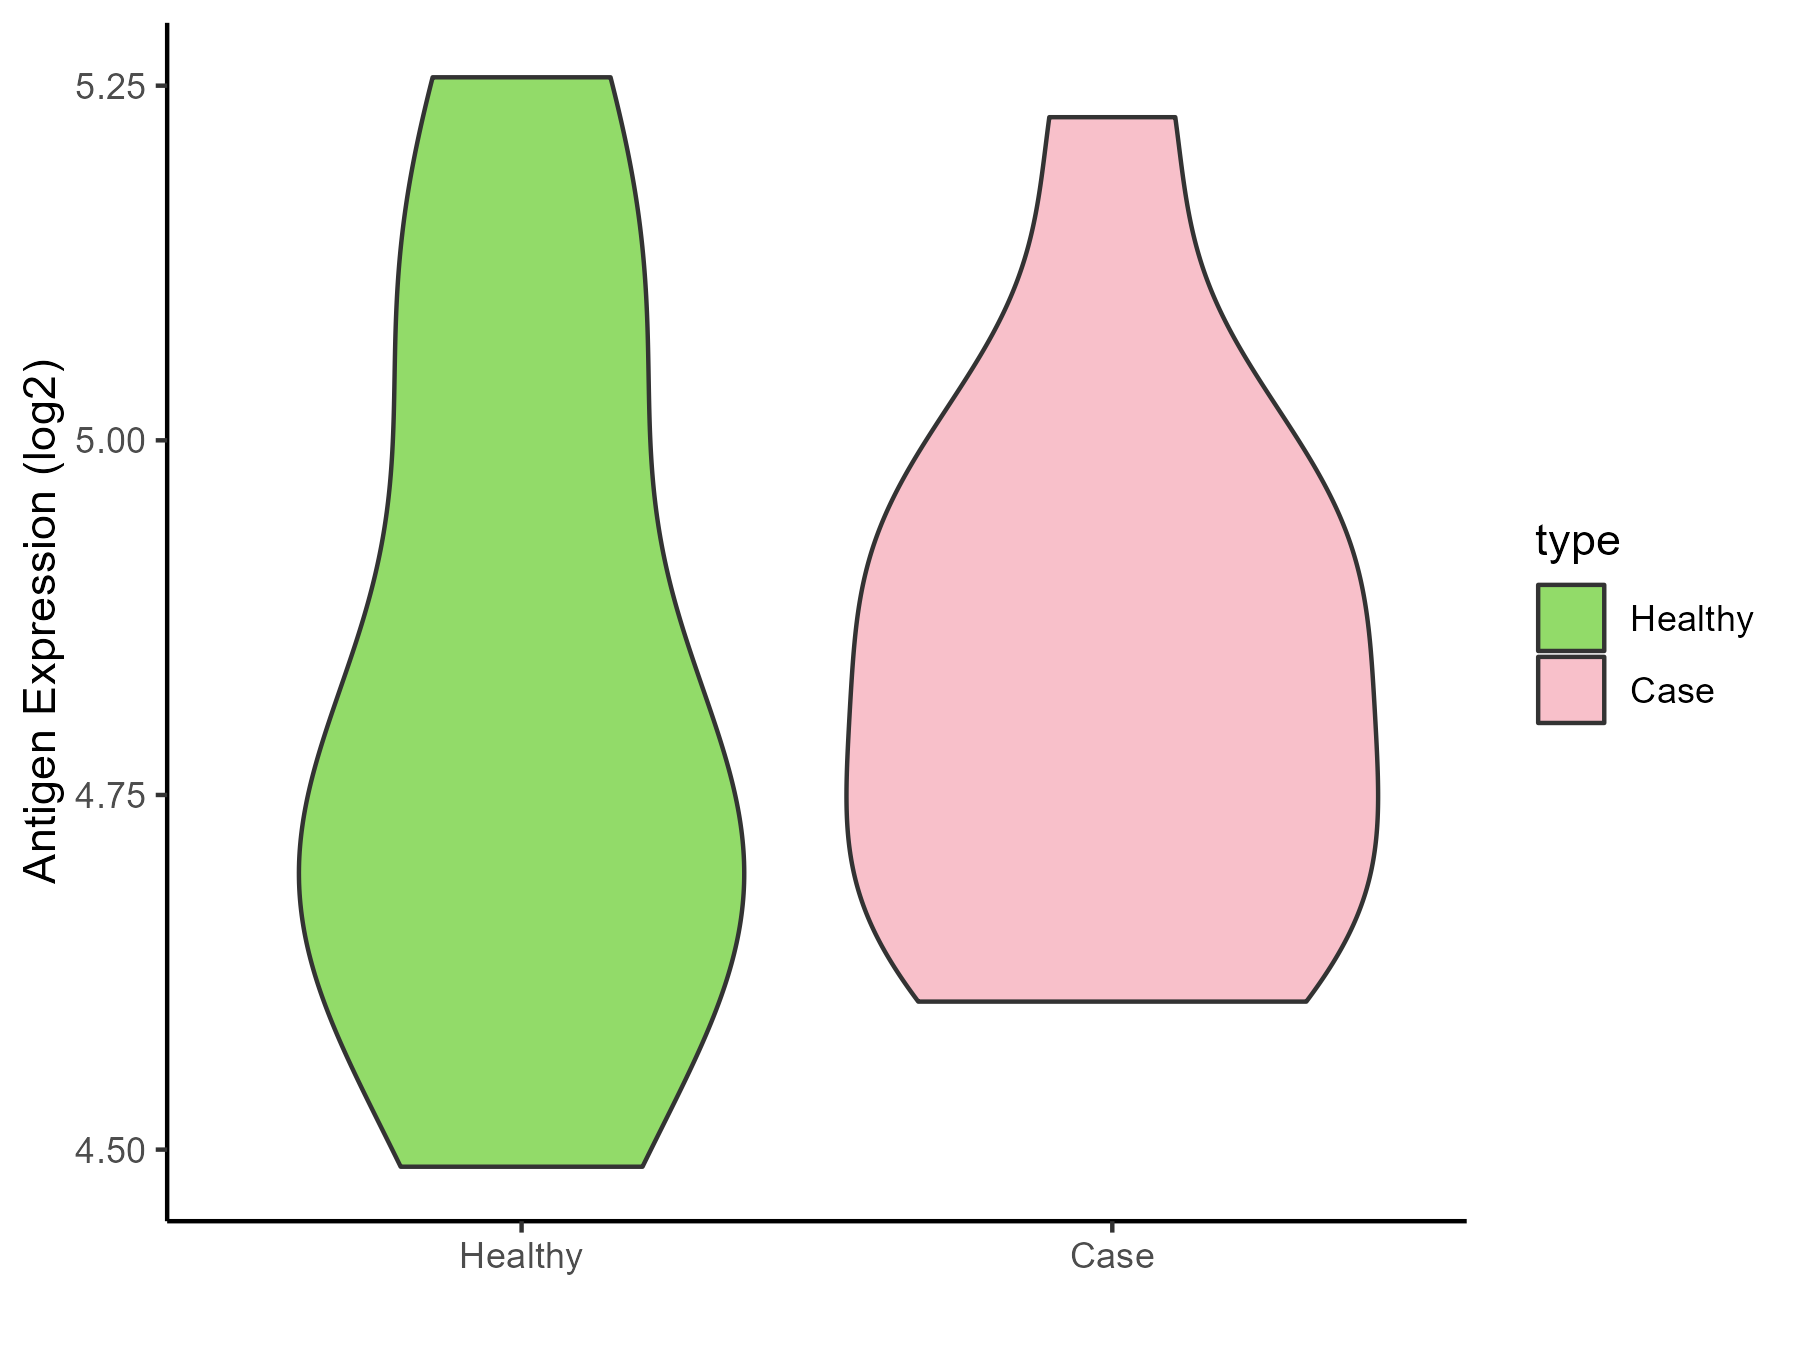
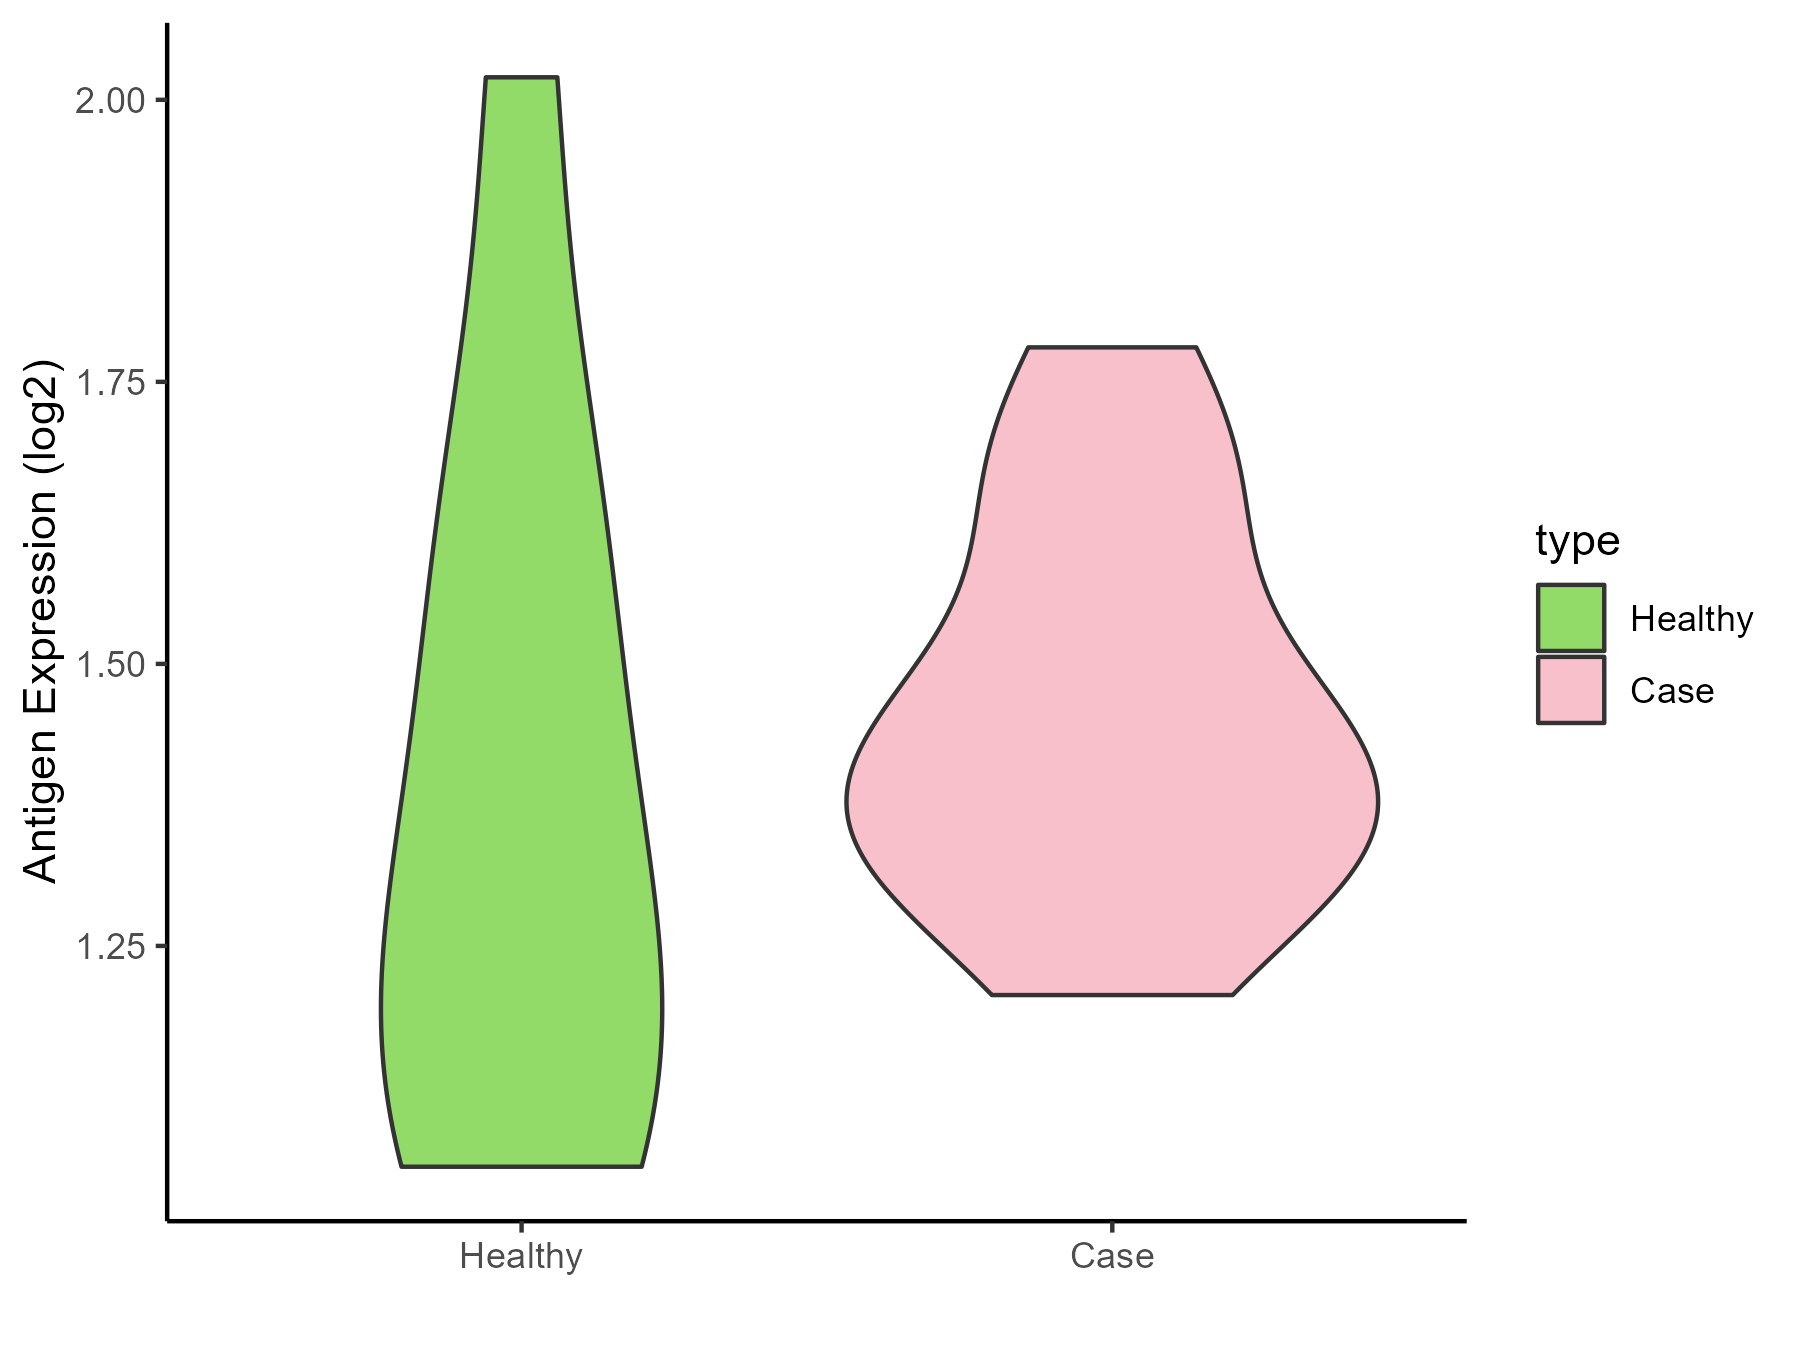
 Bacterial infection [ICD-11: 1A00-1C4Z]
Click to Show/Hide
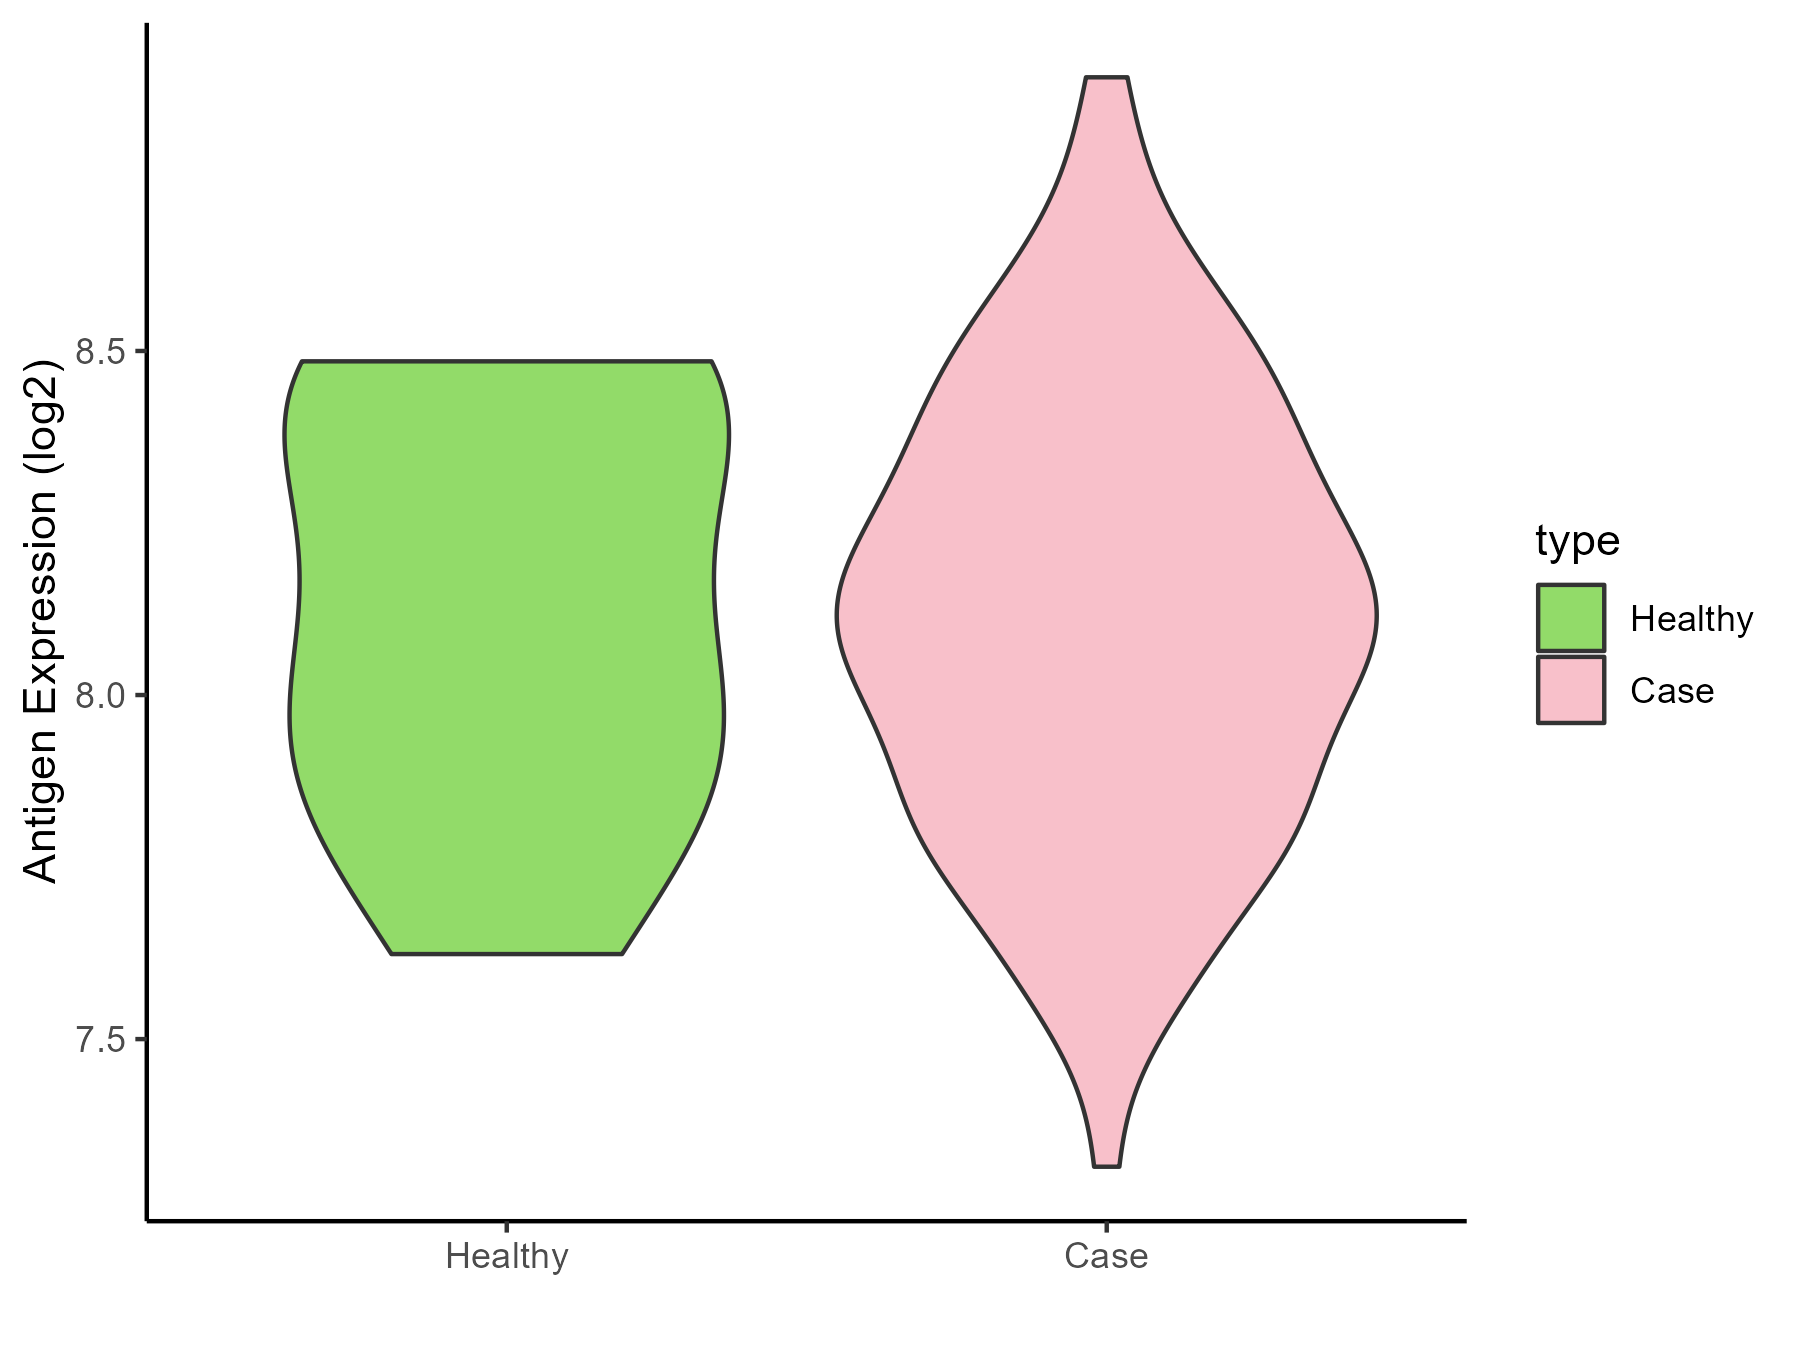
| Differential expression pattern of antigen in diseases |
| The Studied Tissue |
Gingival |
| The Specific Disease |
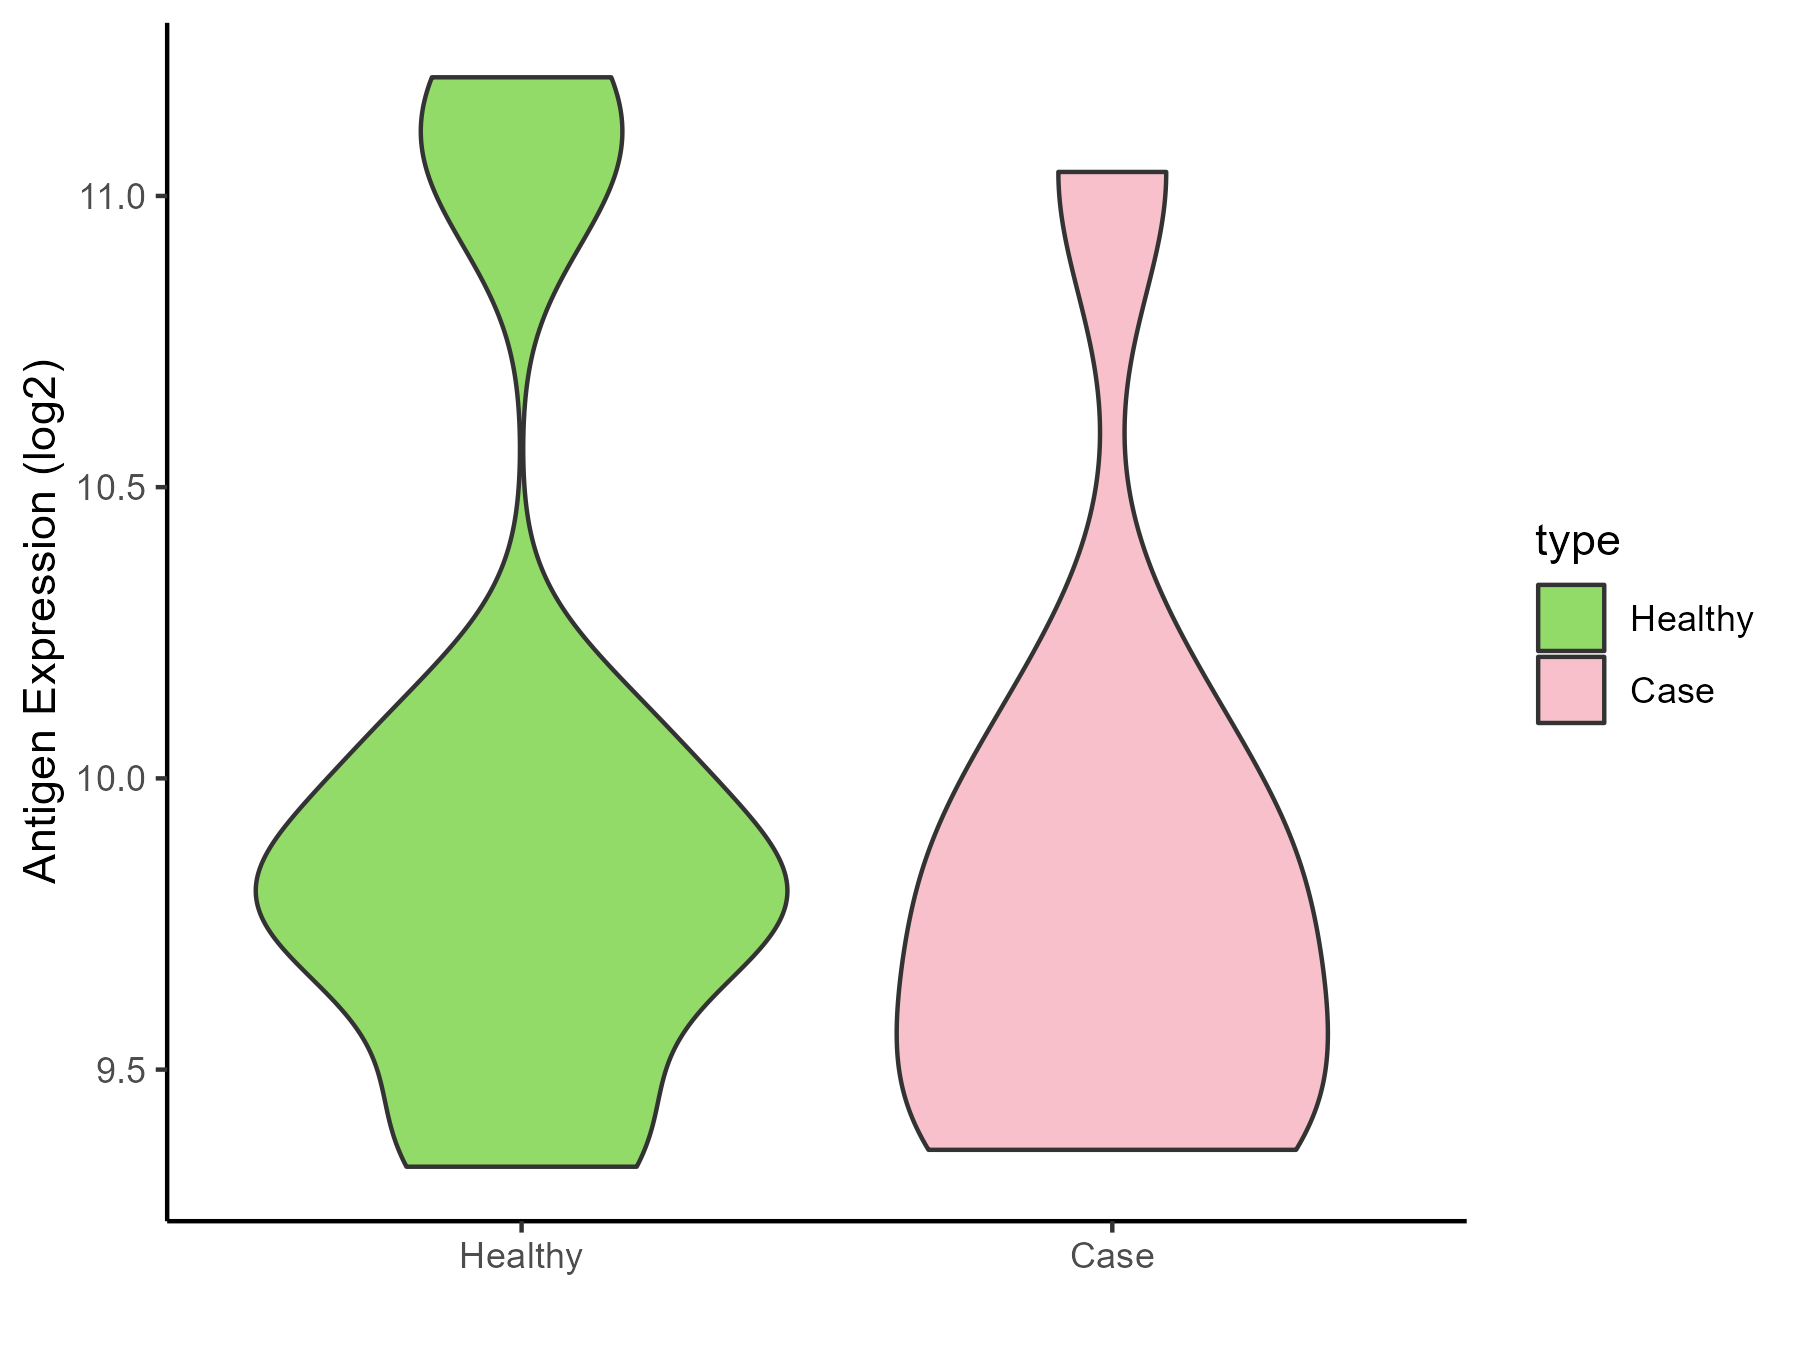
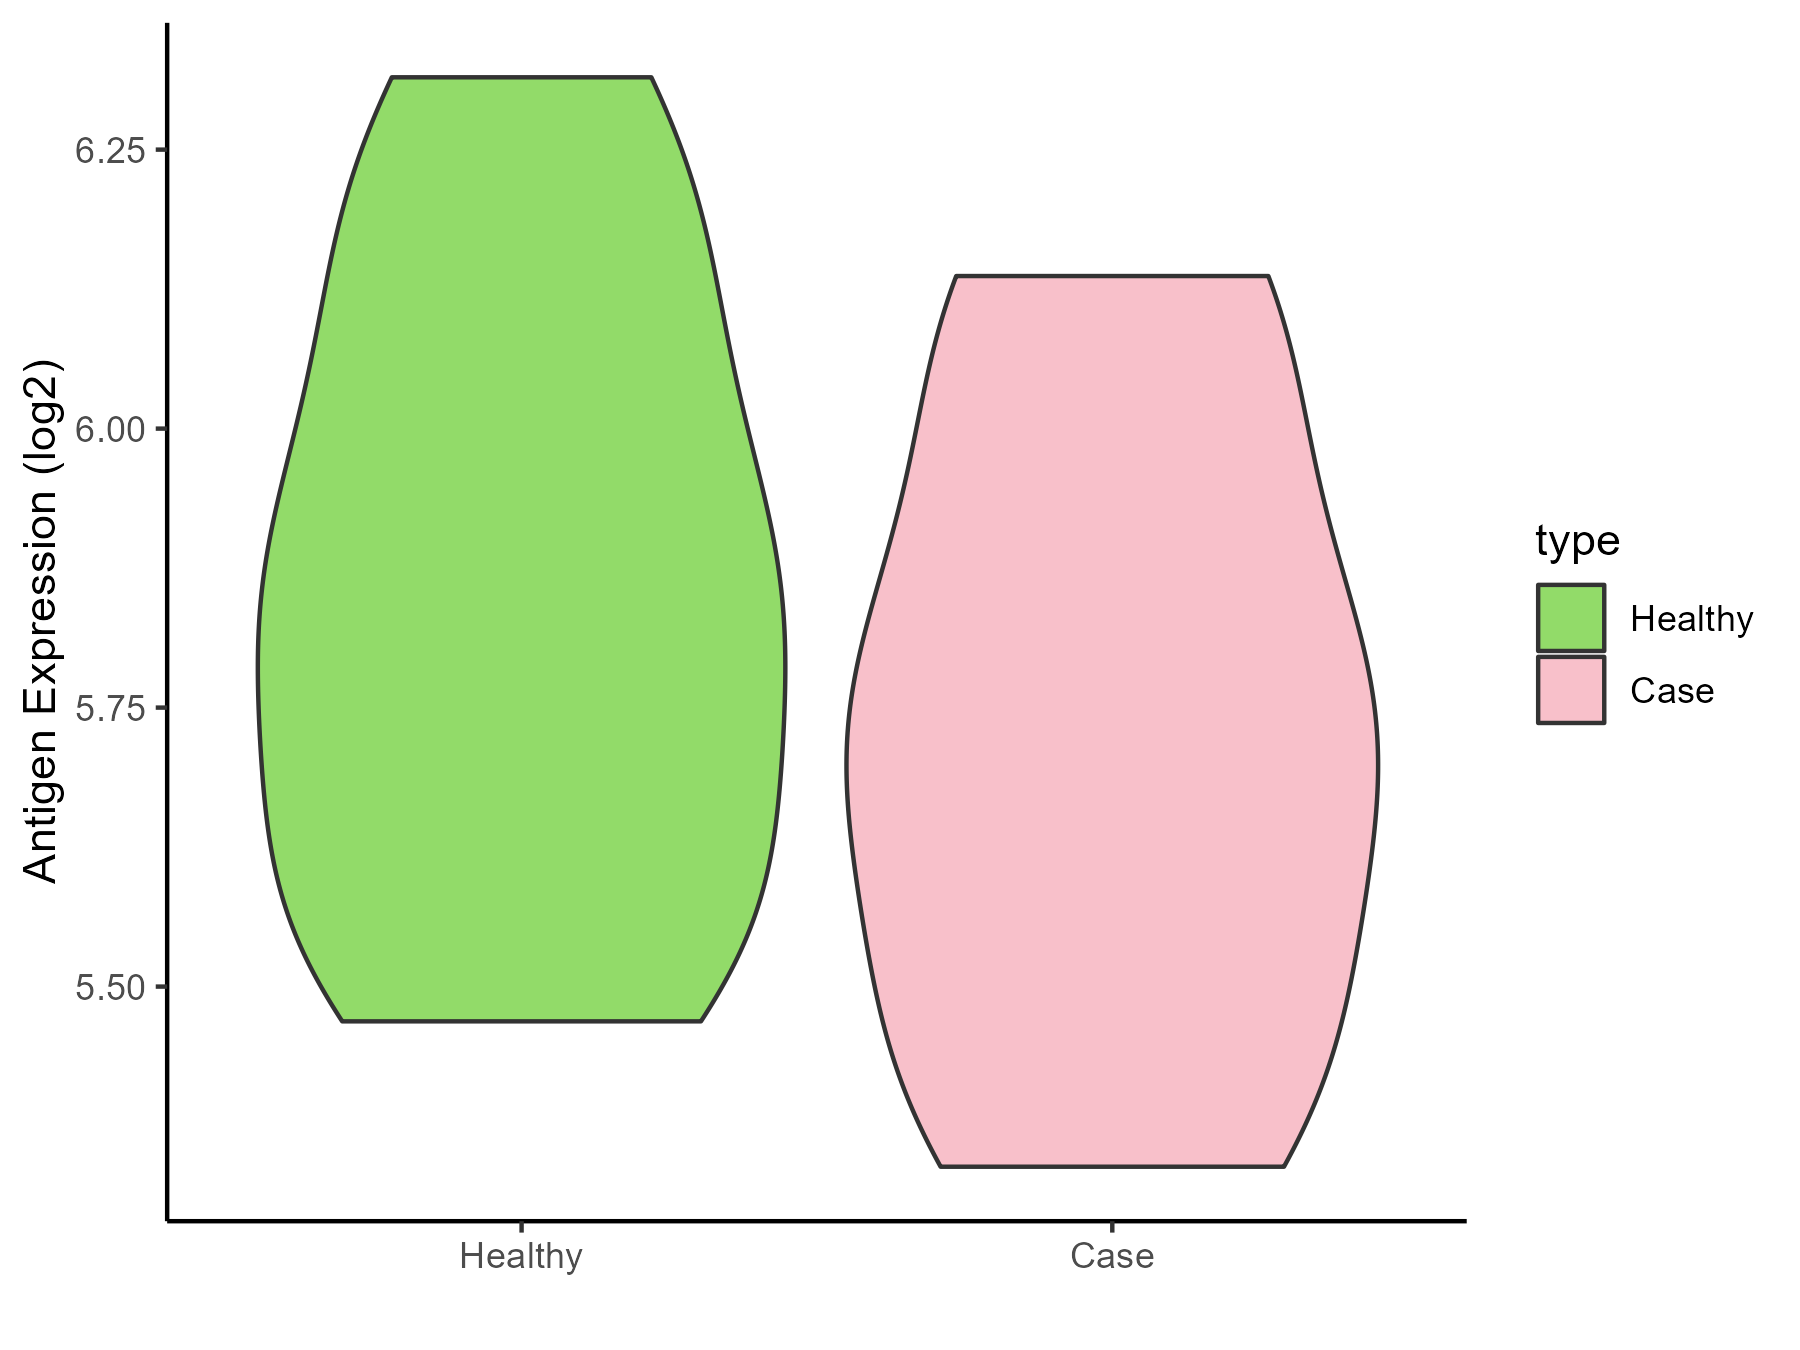
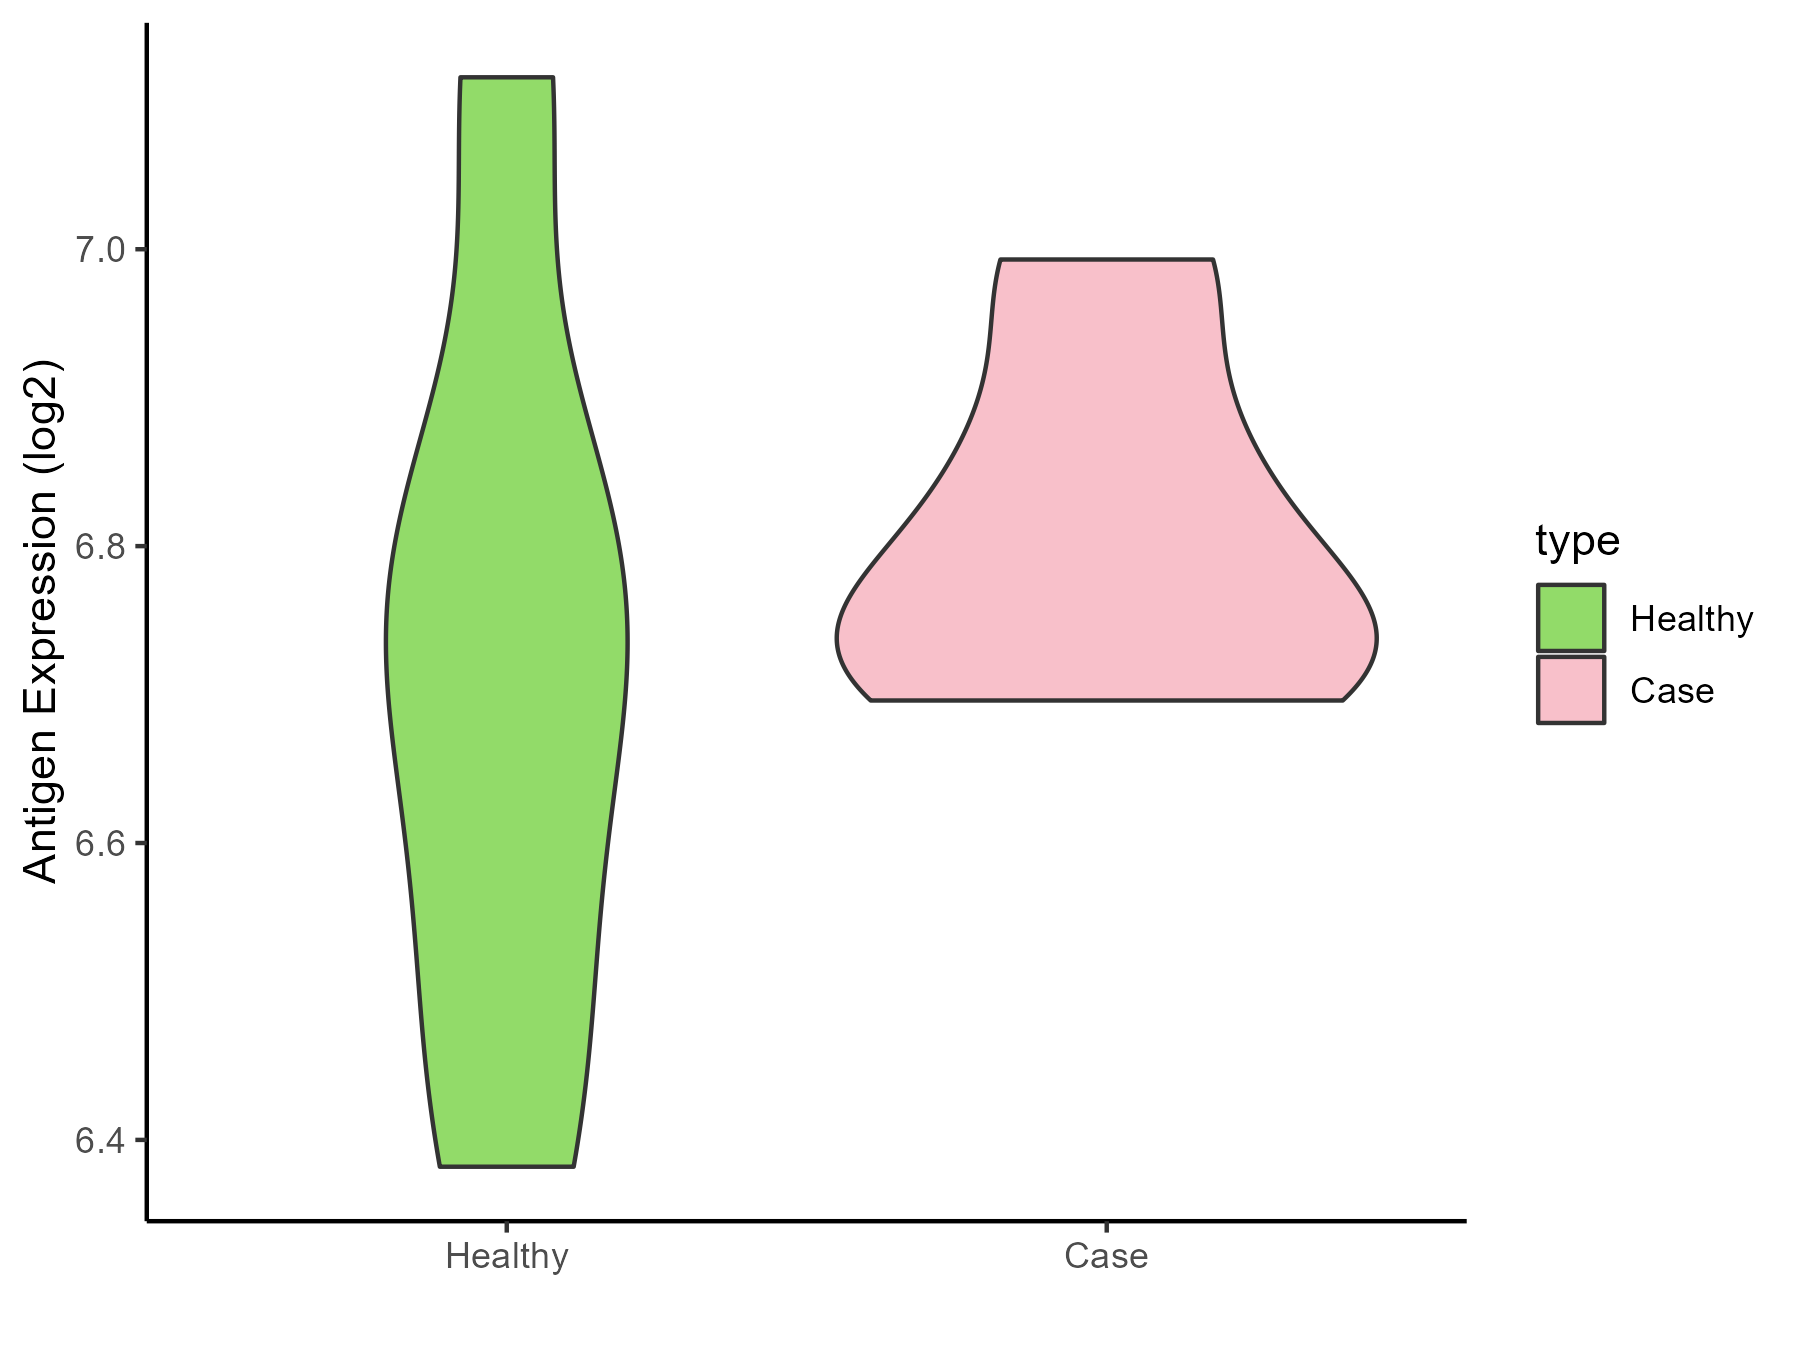
Bacterial infection of gingival |
| The Expression Level of Disease Section Compare with the Healthy Individual Tissue |
p-value: 0.01643497;
Fold-change: 0.016360395;
Z-score: 0.065414084
|
| Disease-specific Antigen Abundances |
|
Click to View the Clearer Original Diagram
|
|
|
ICD Disease Classification 02
Click to Show/Hide the 22 Disease of This Class
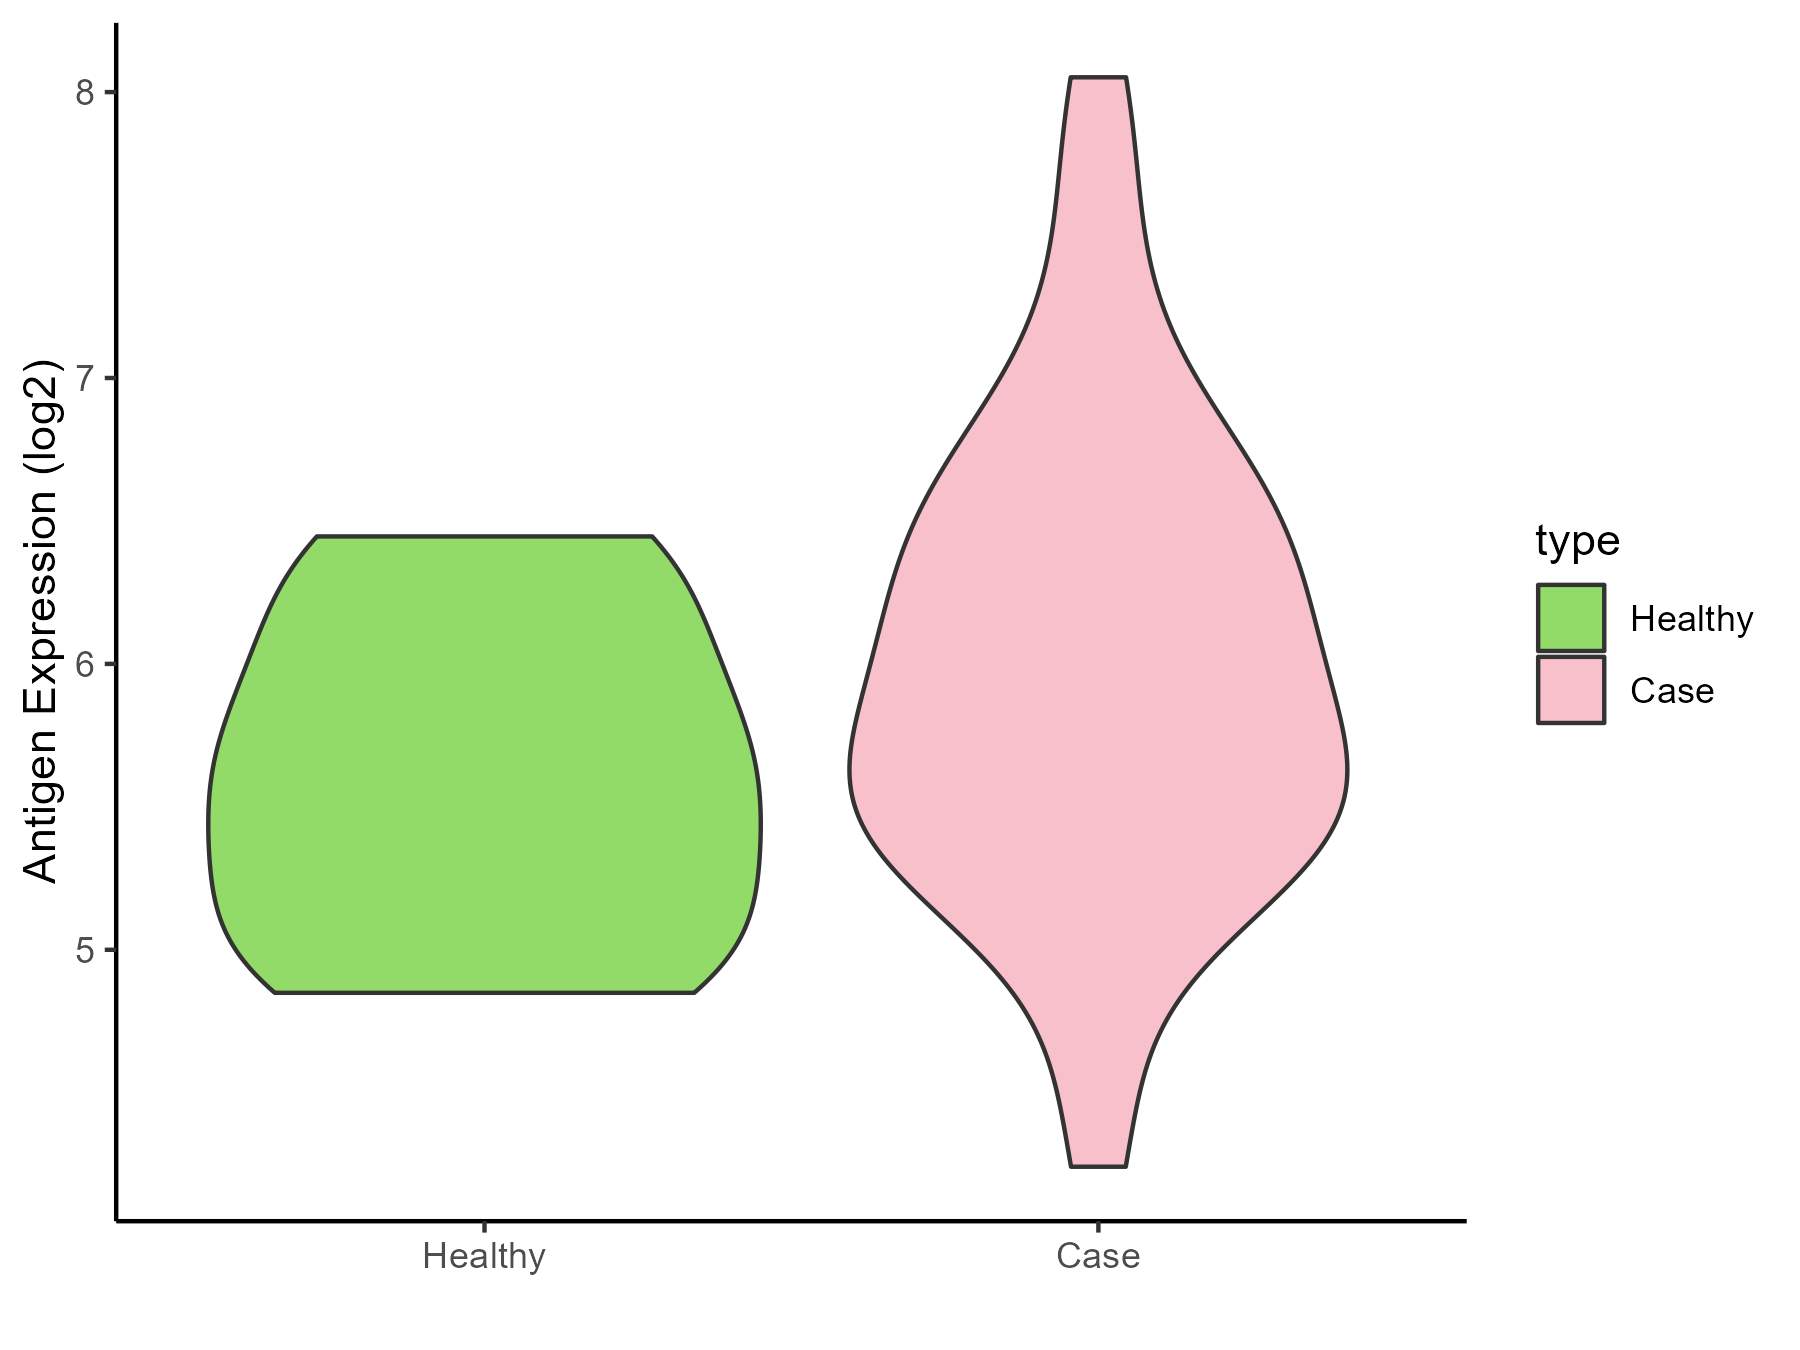
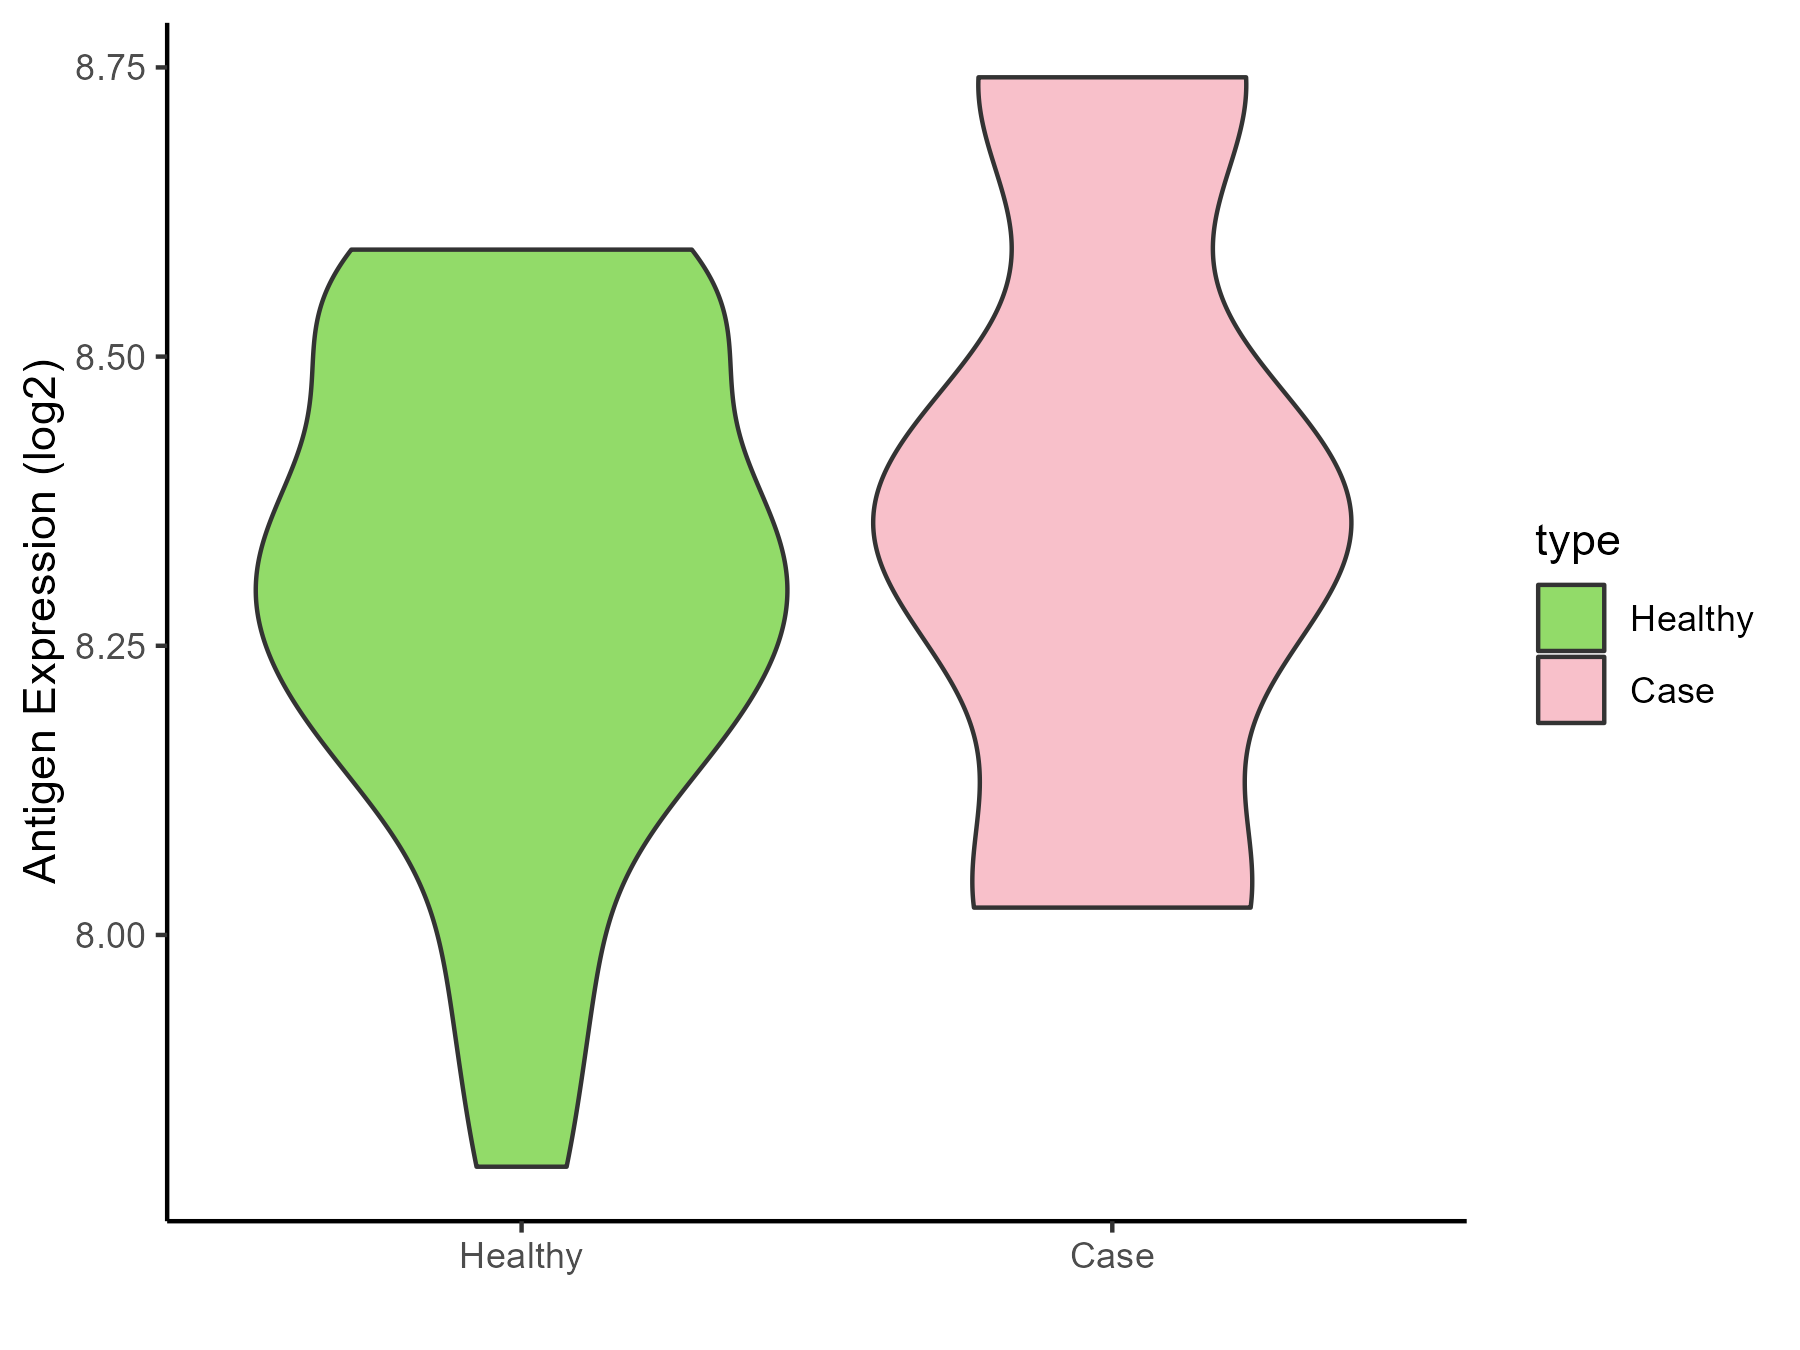
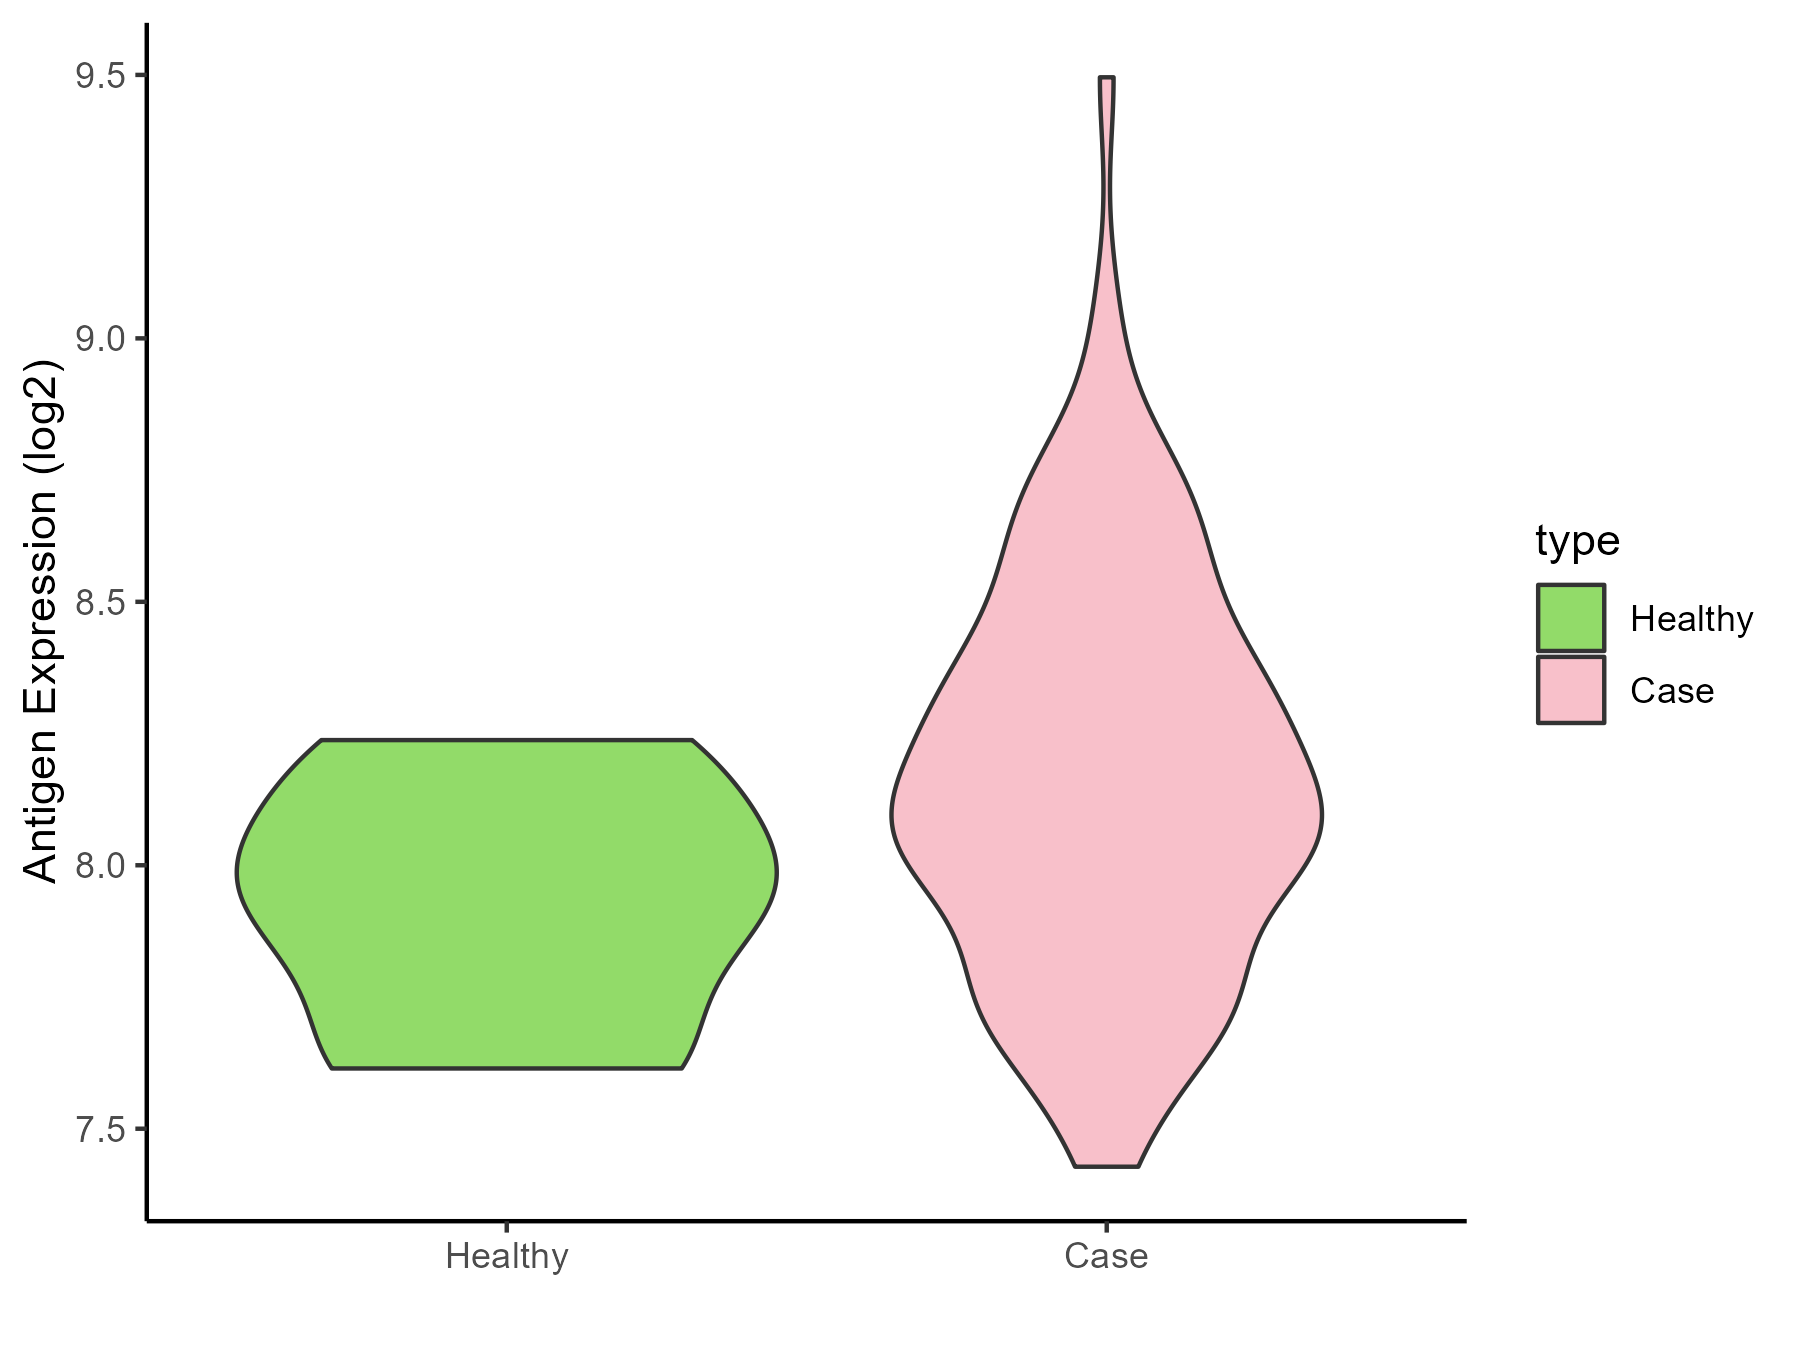
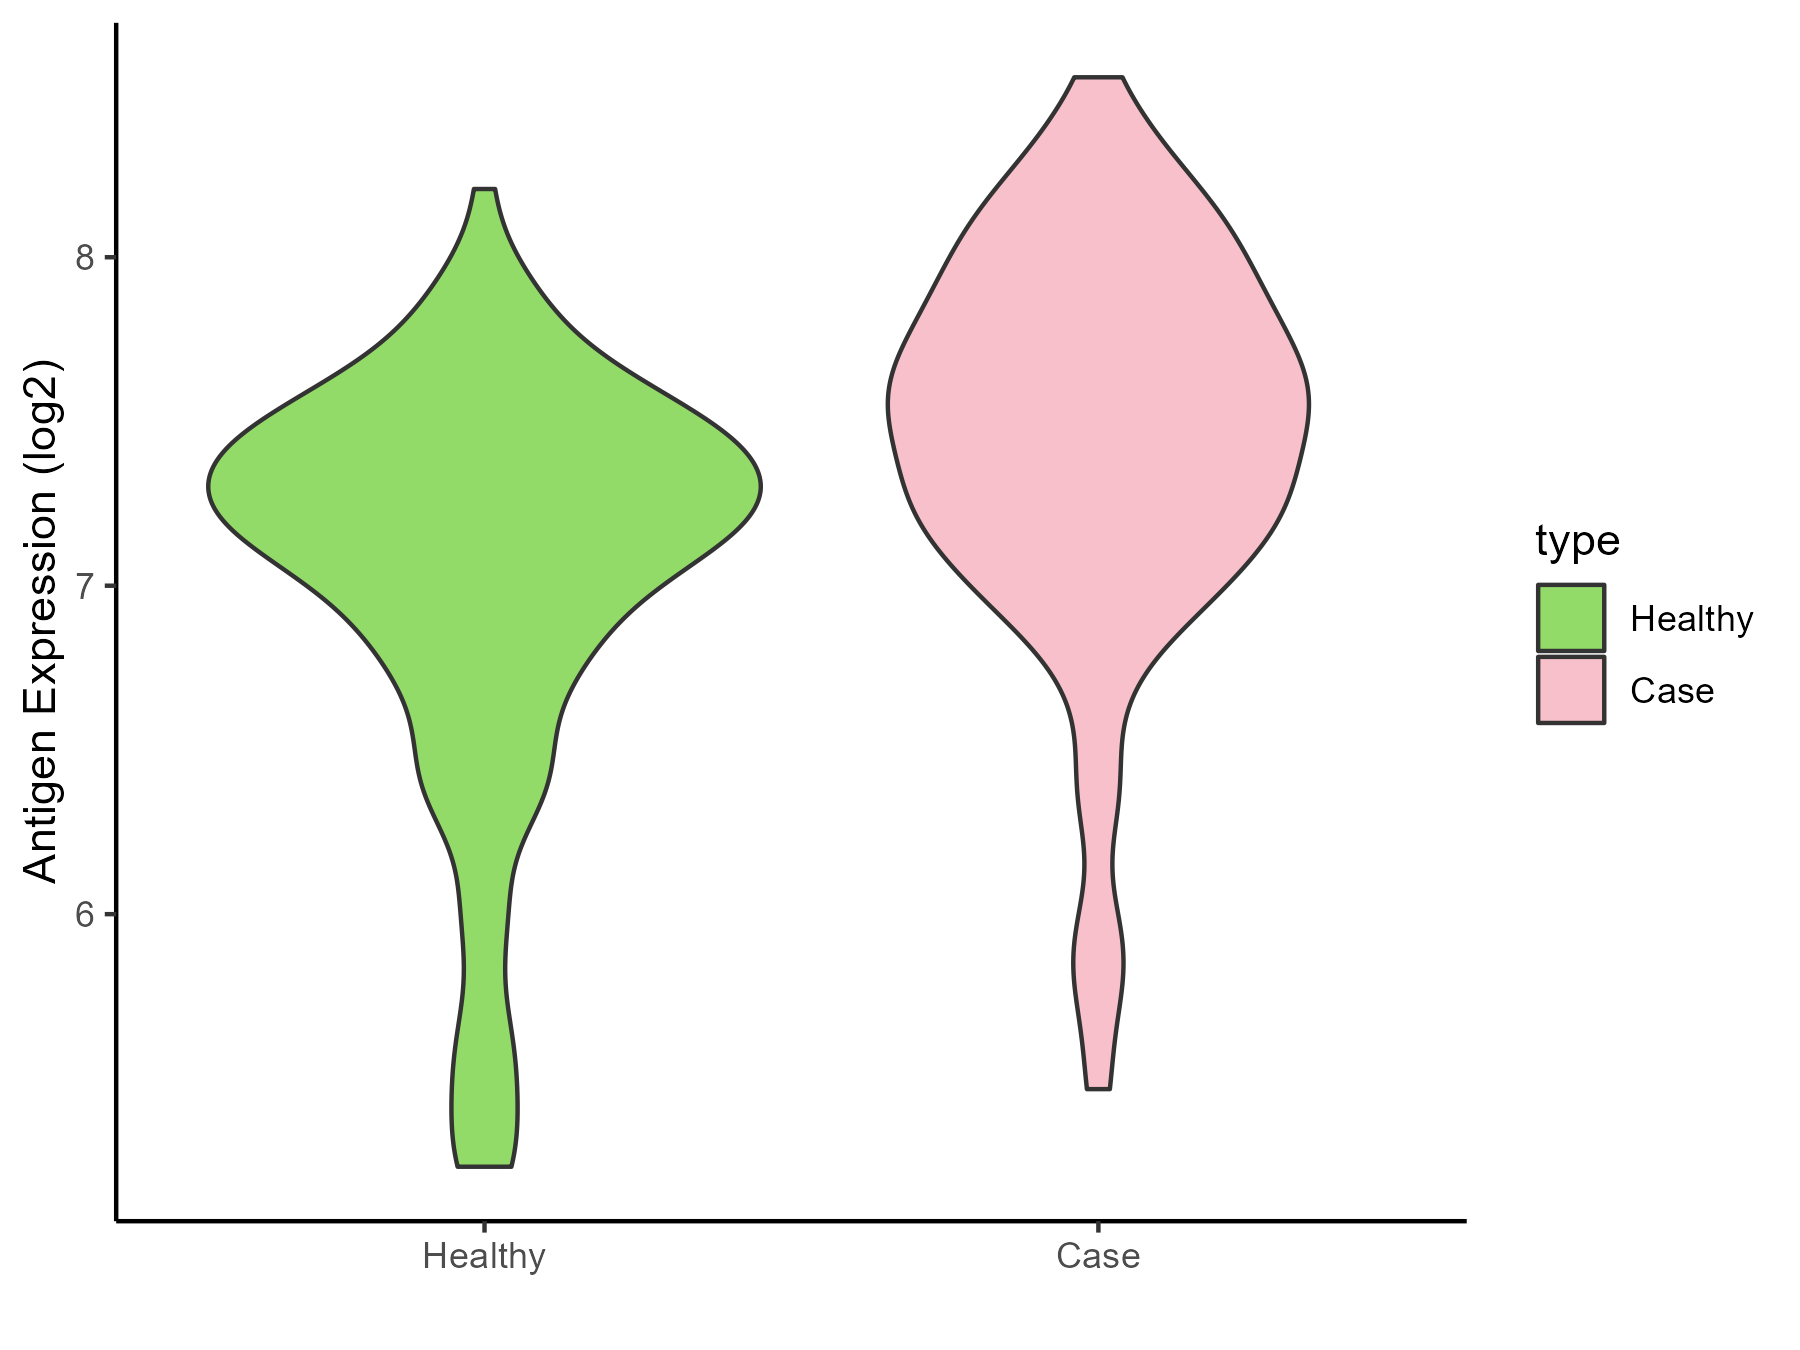
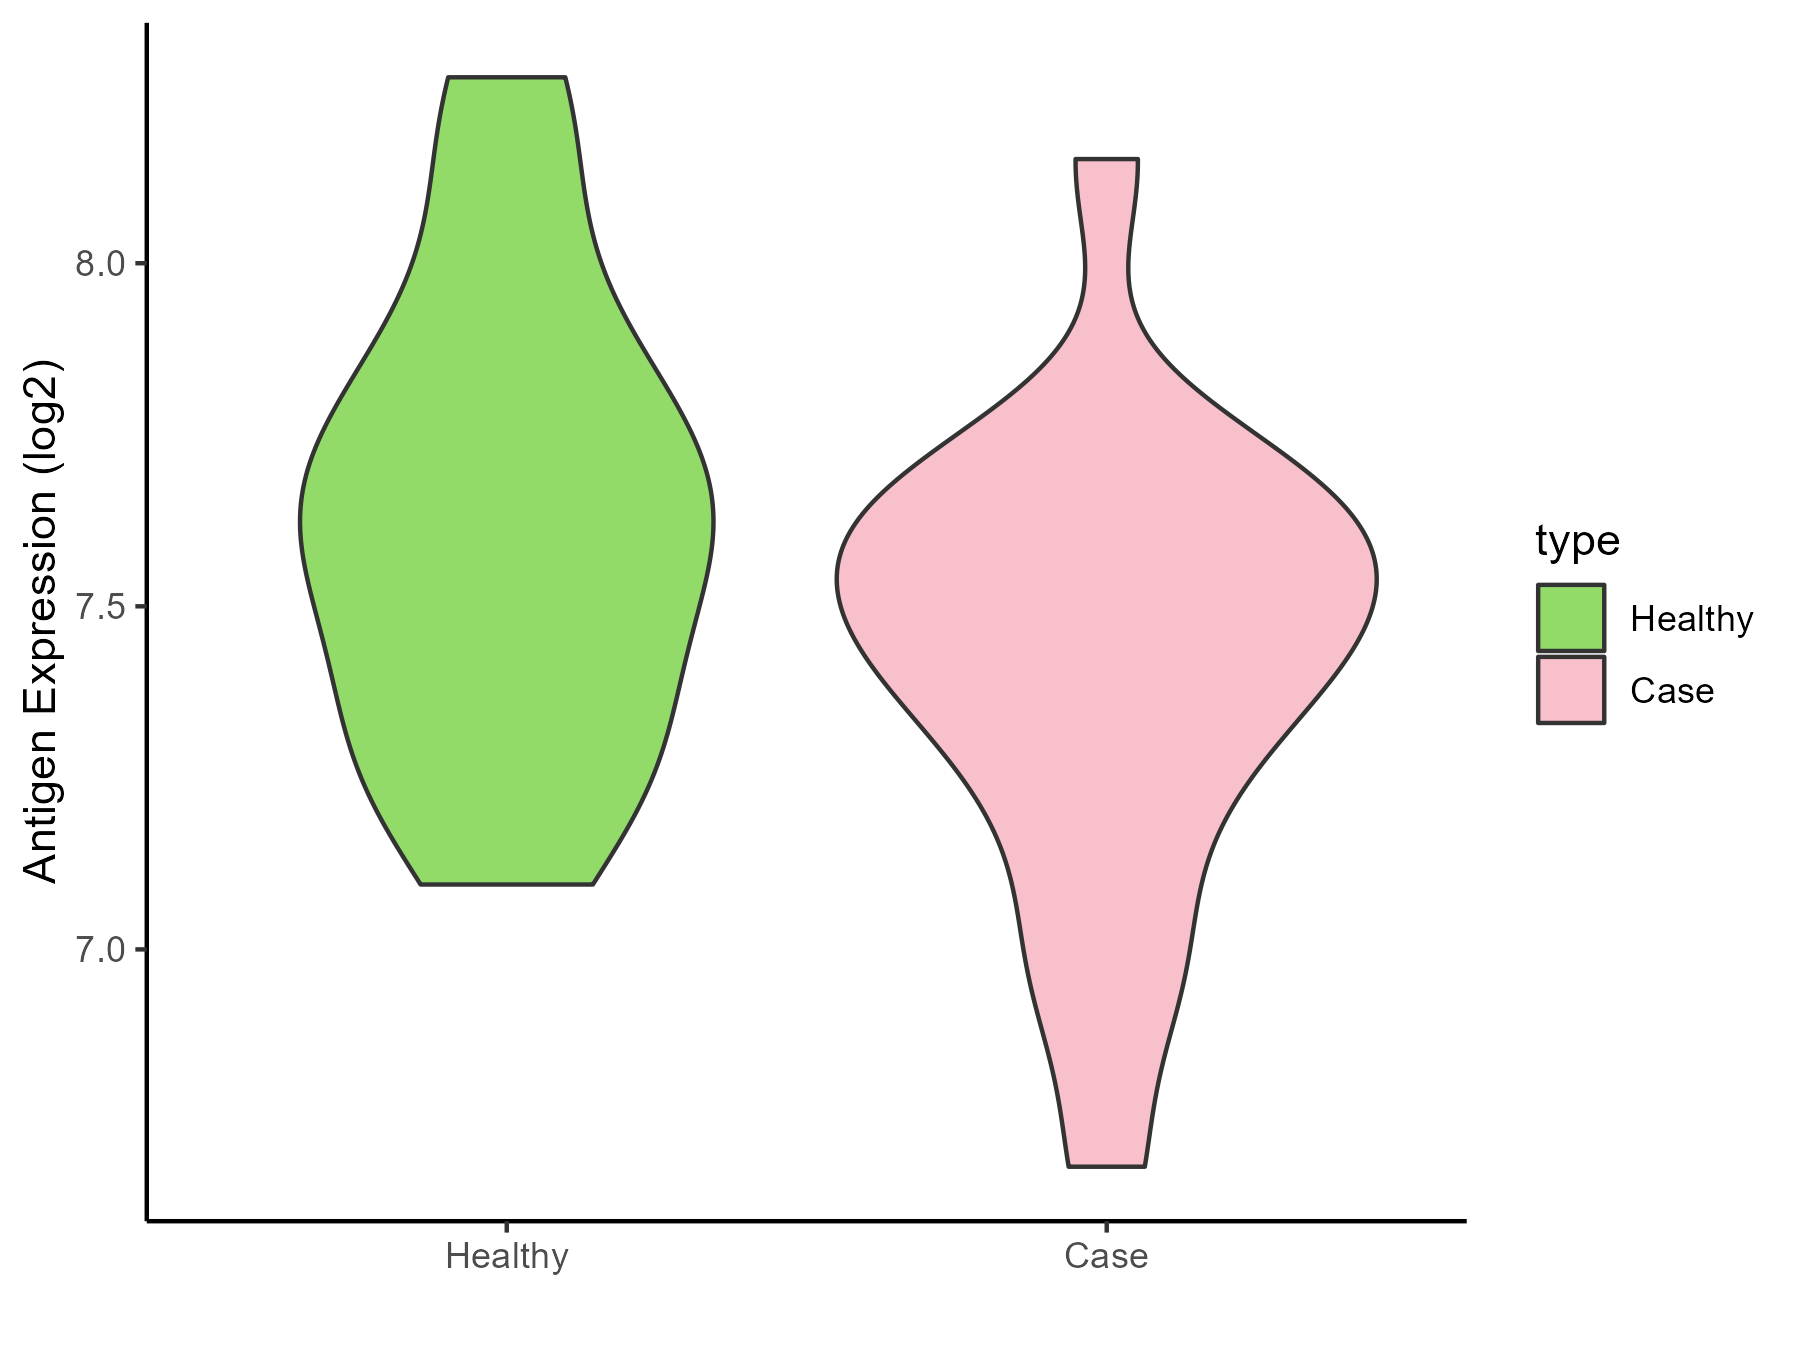
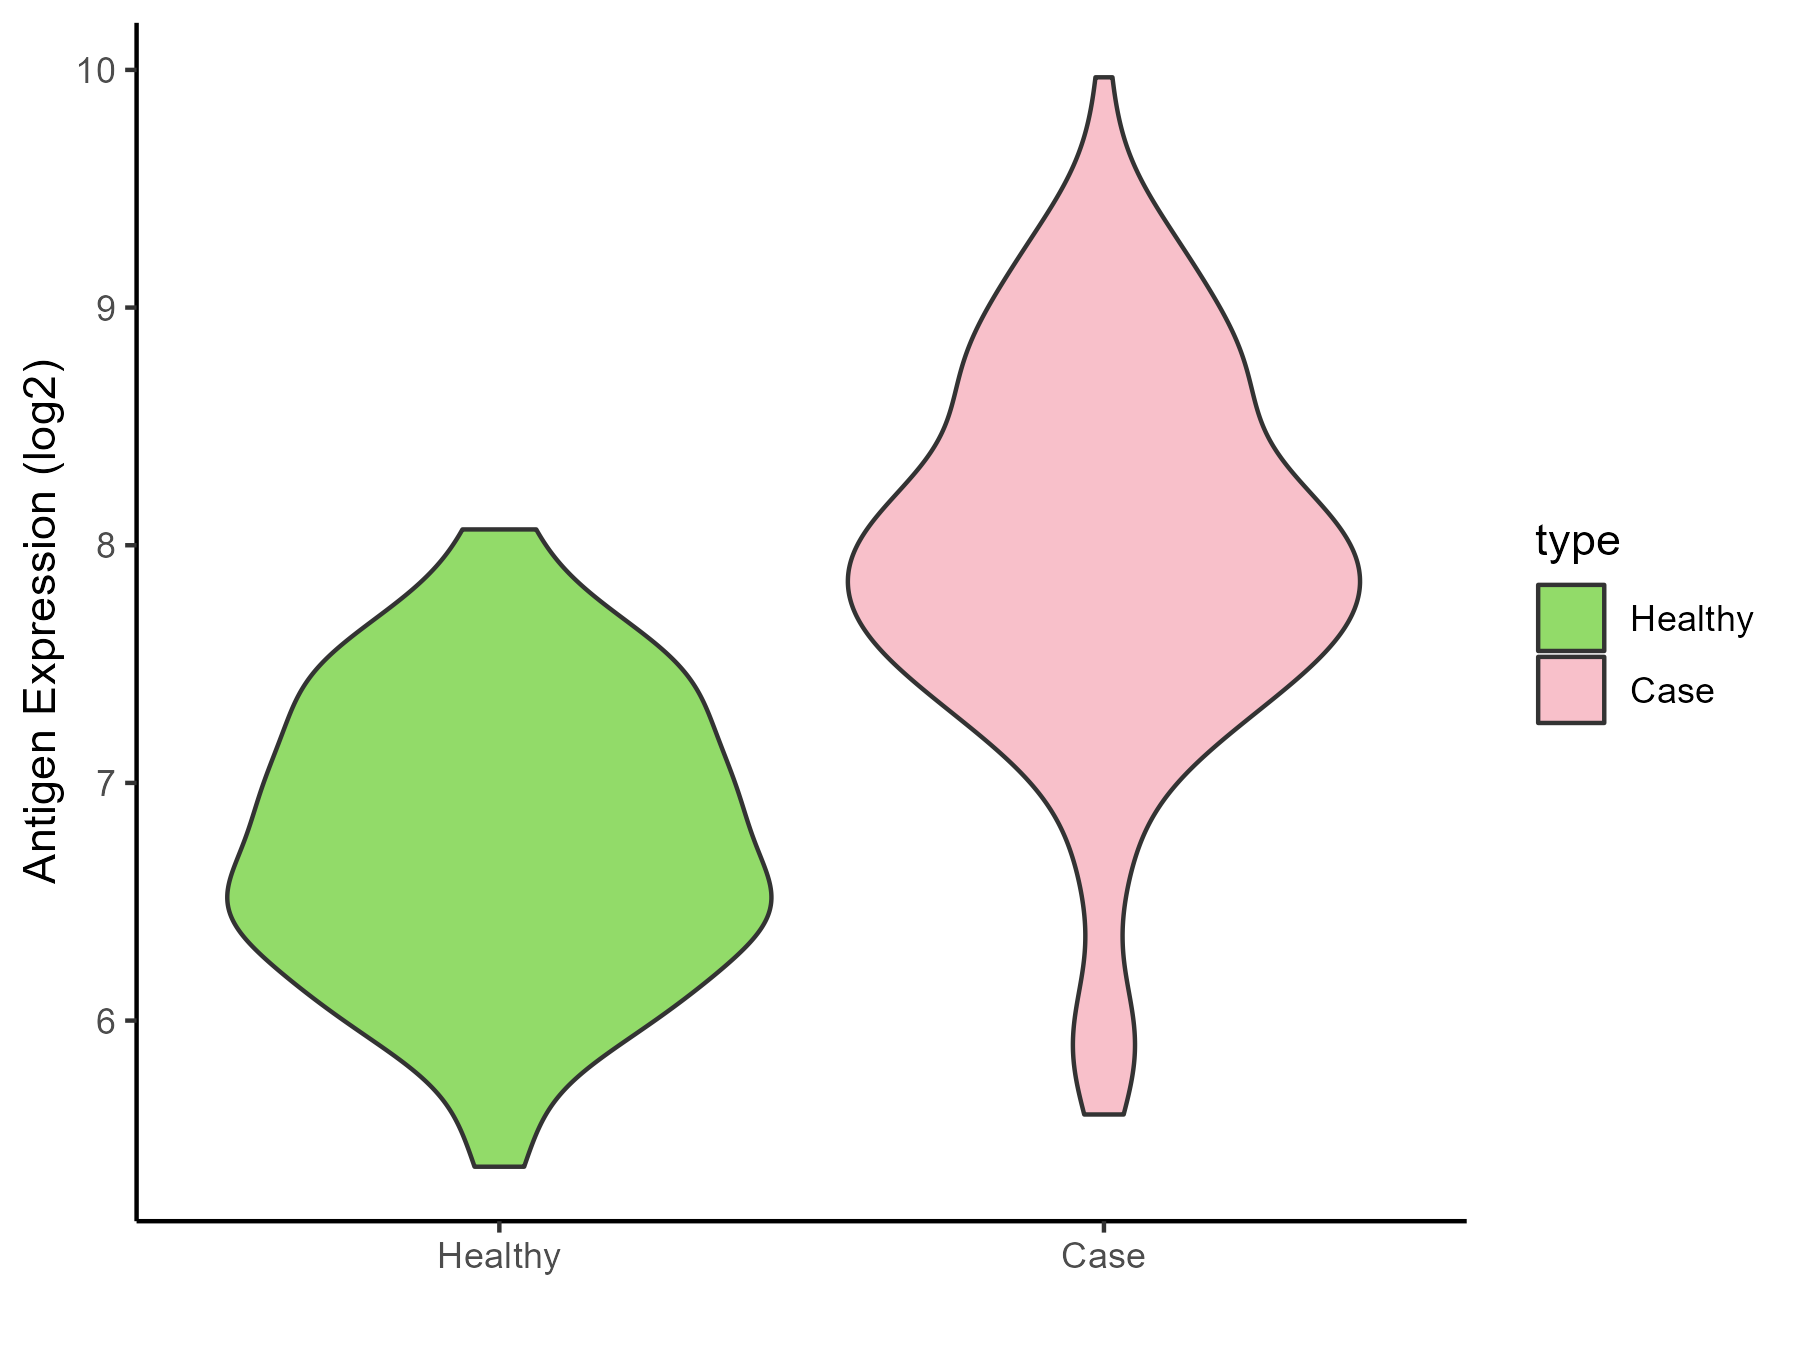
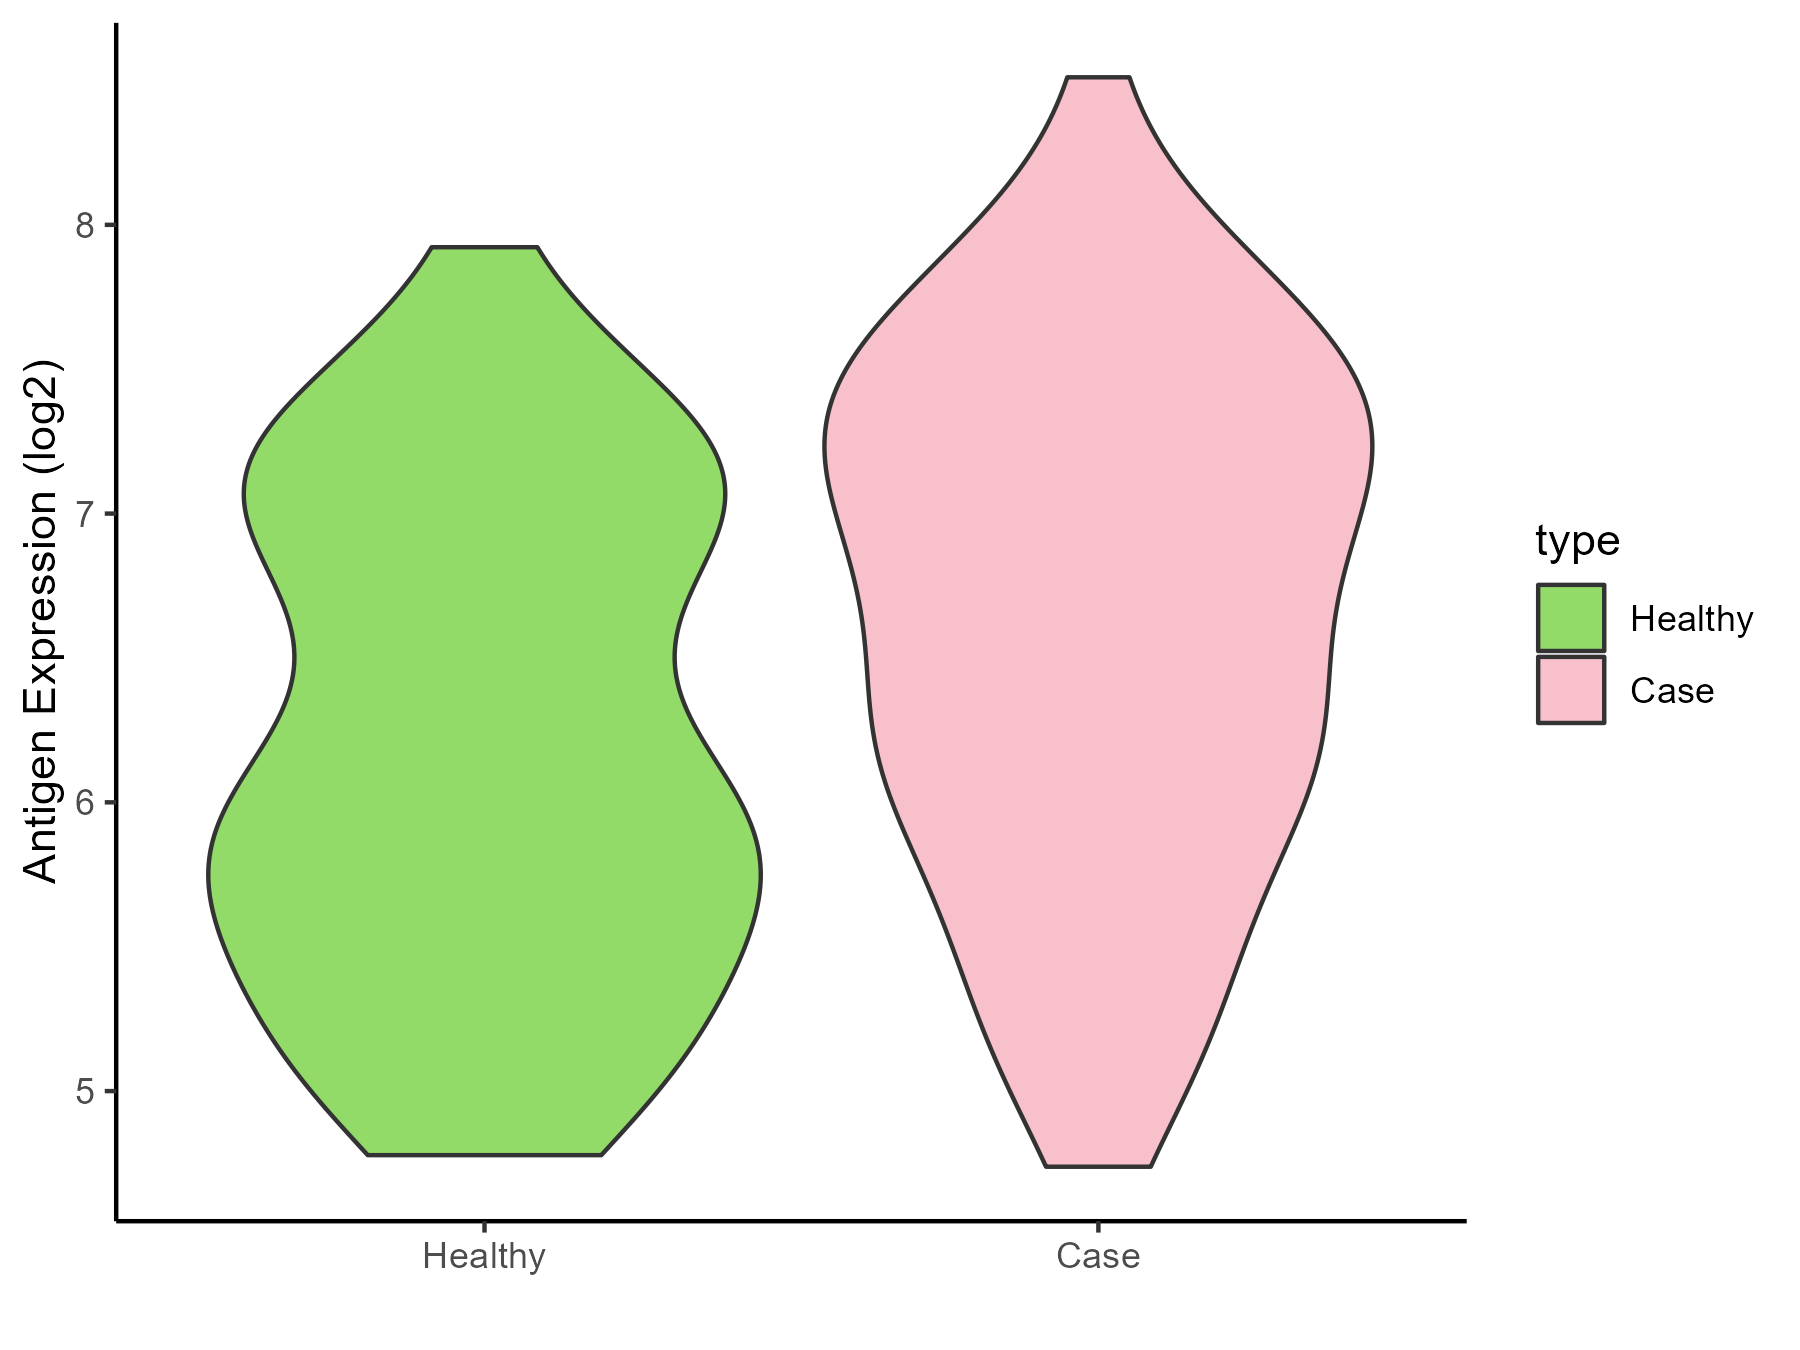
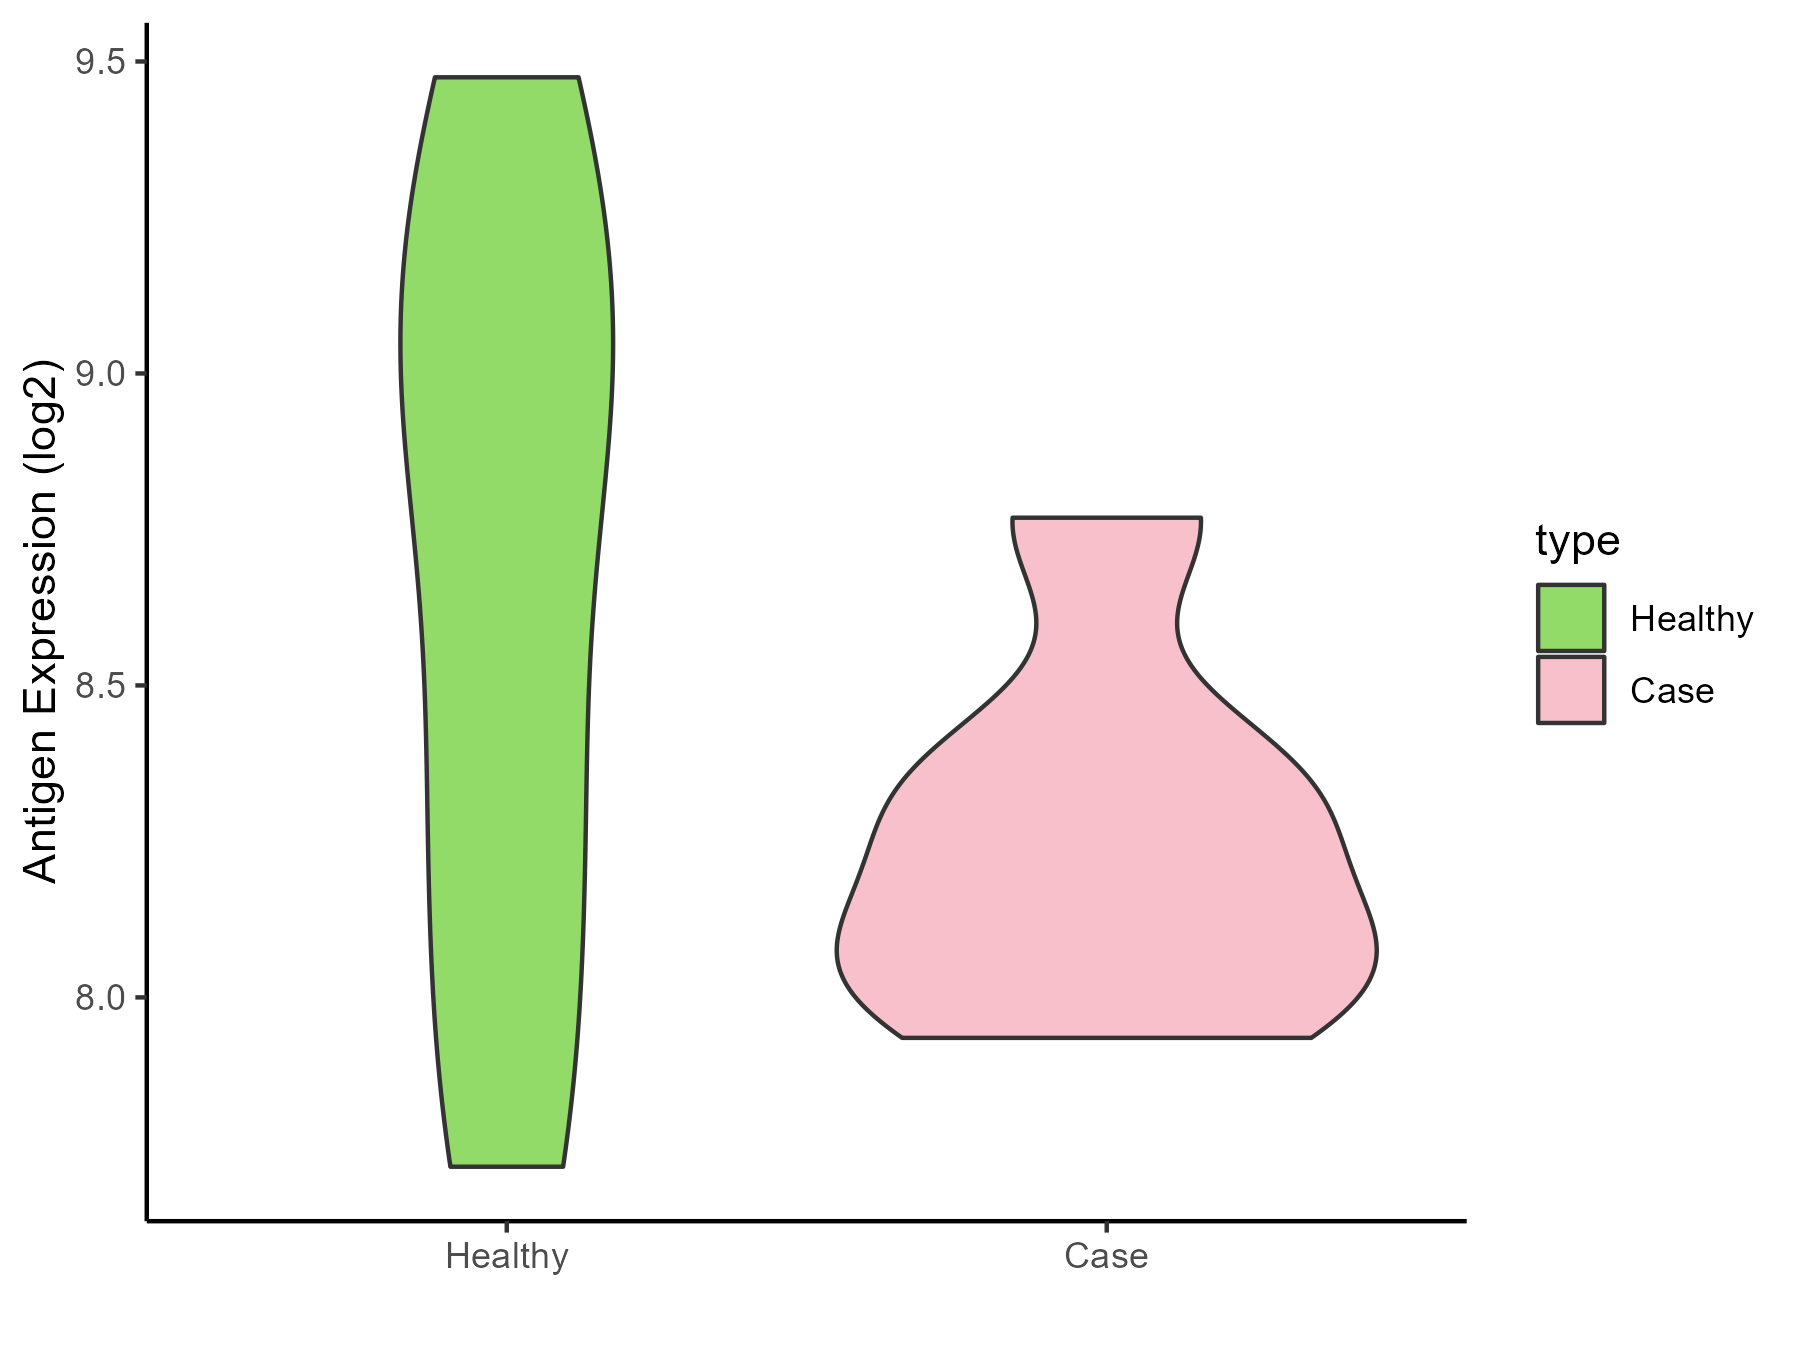
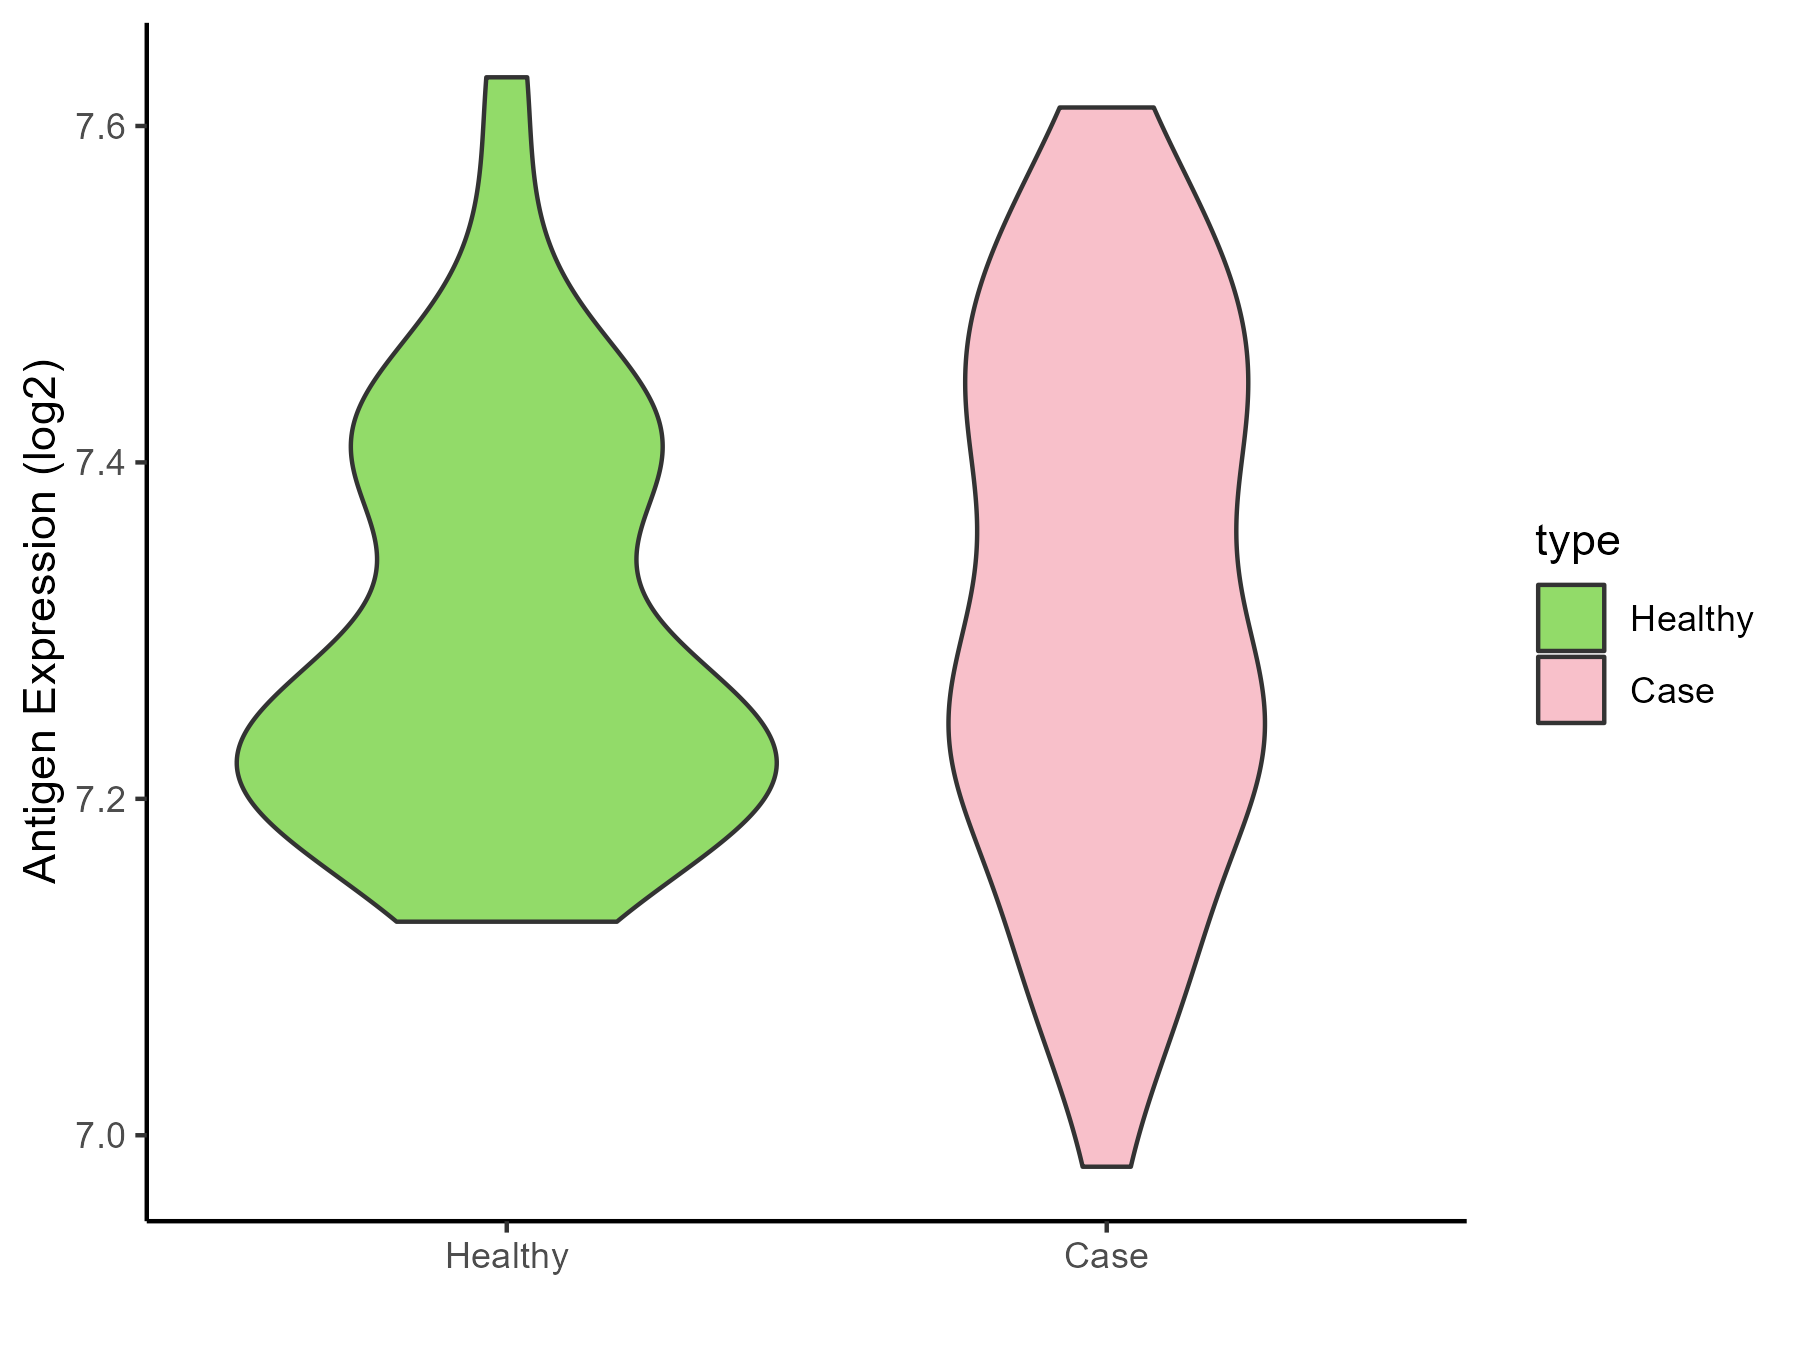
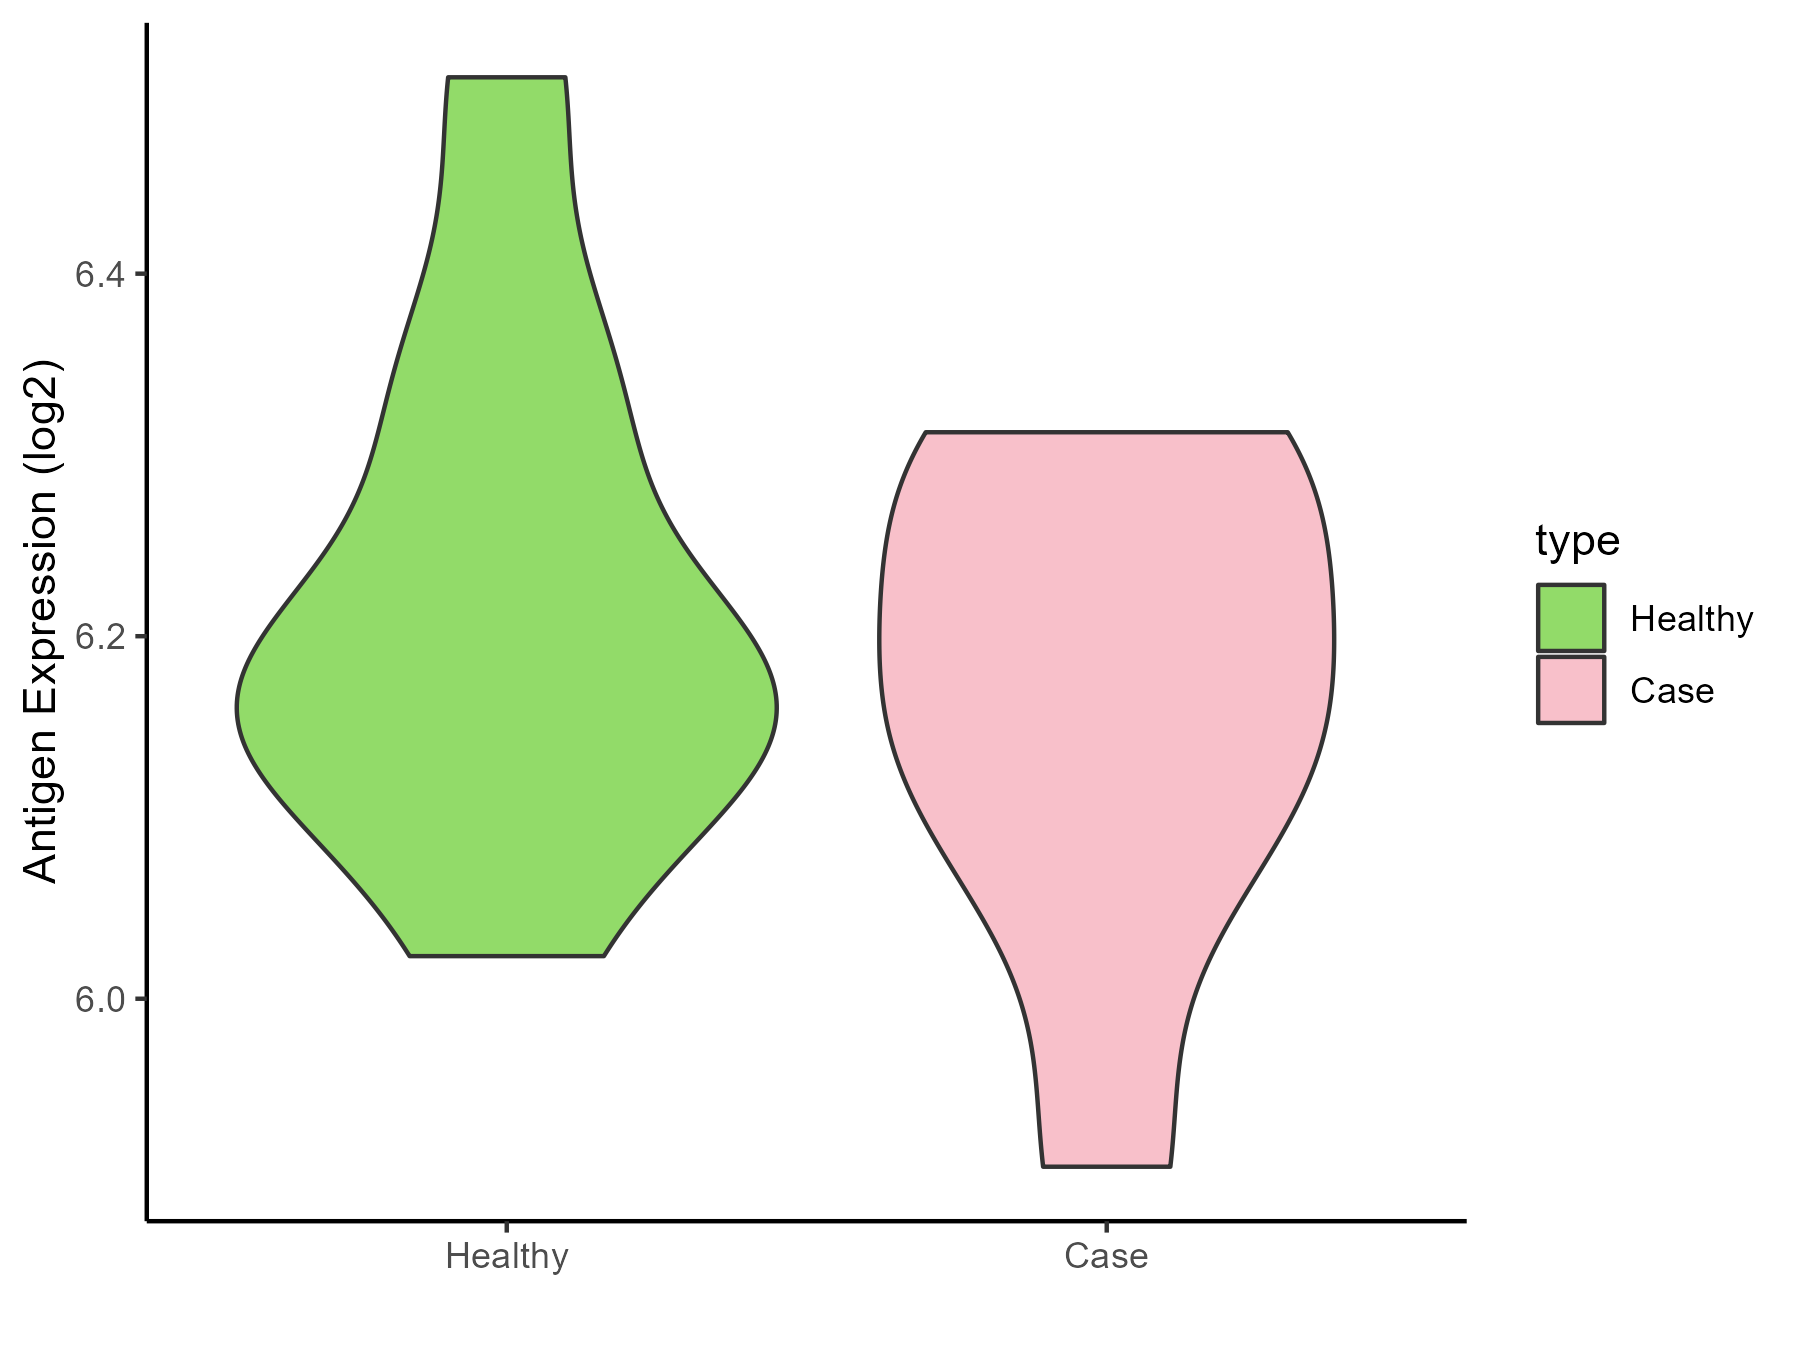
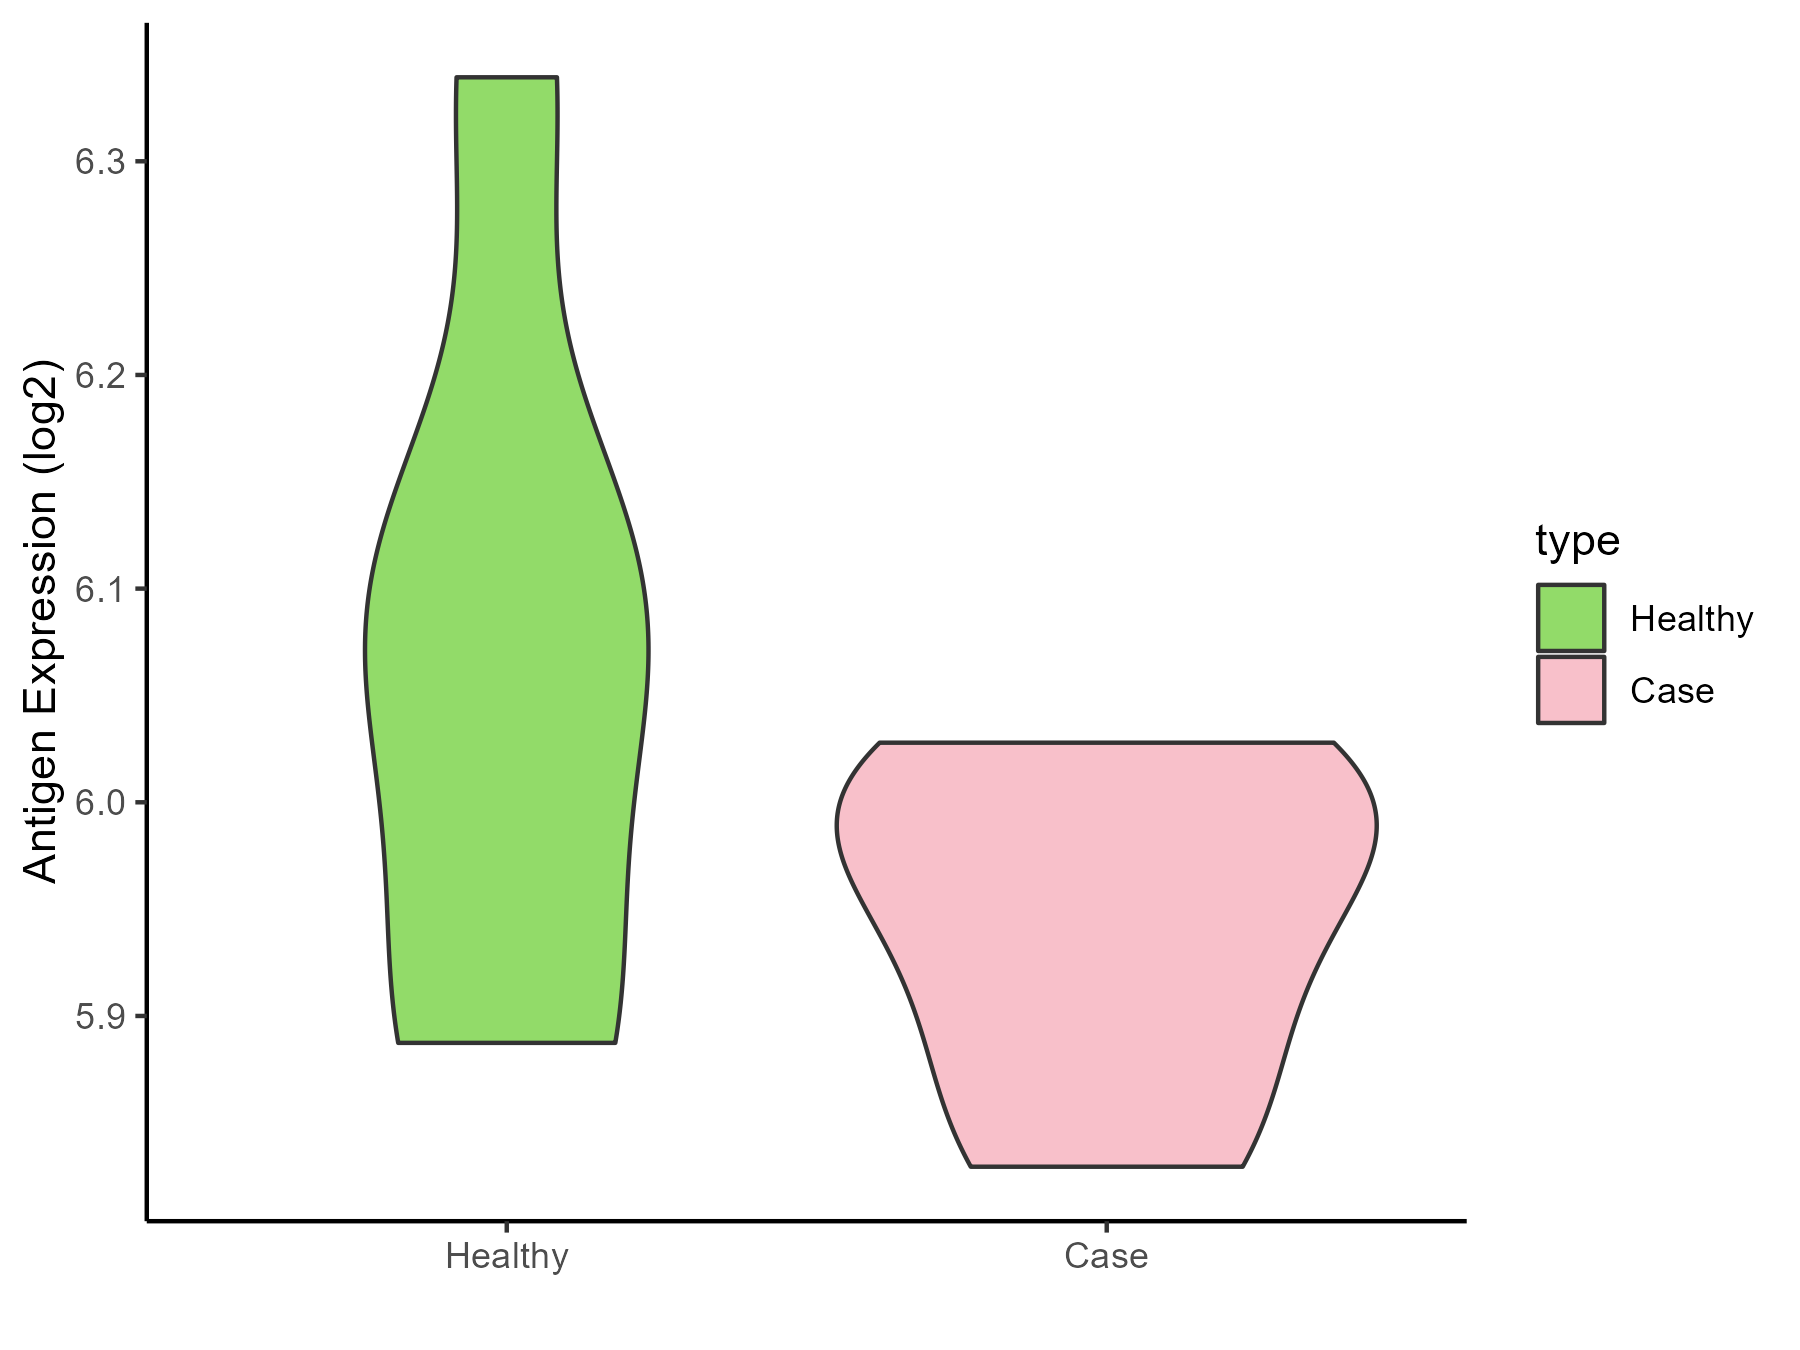
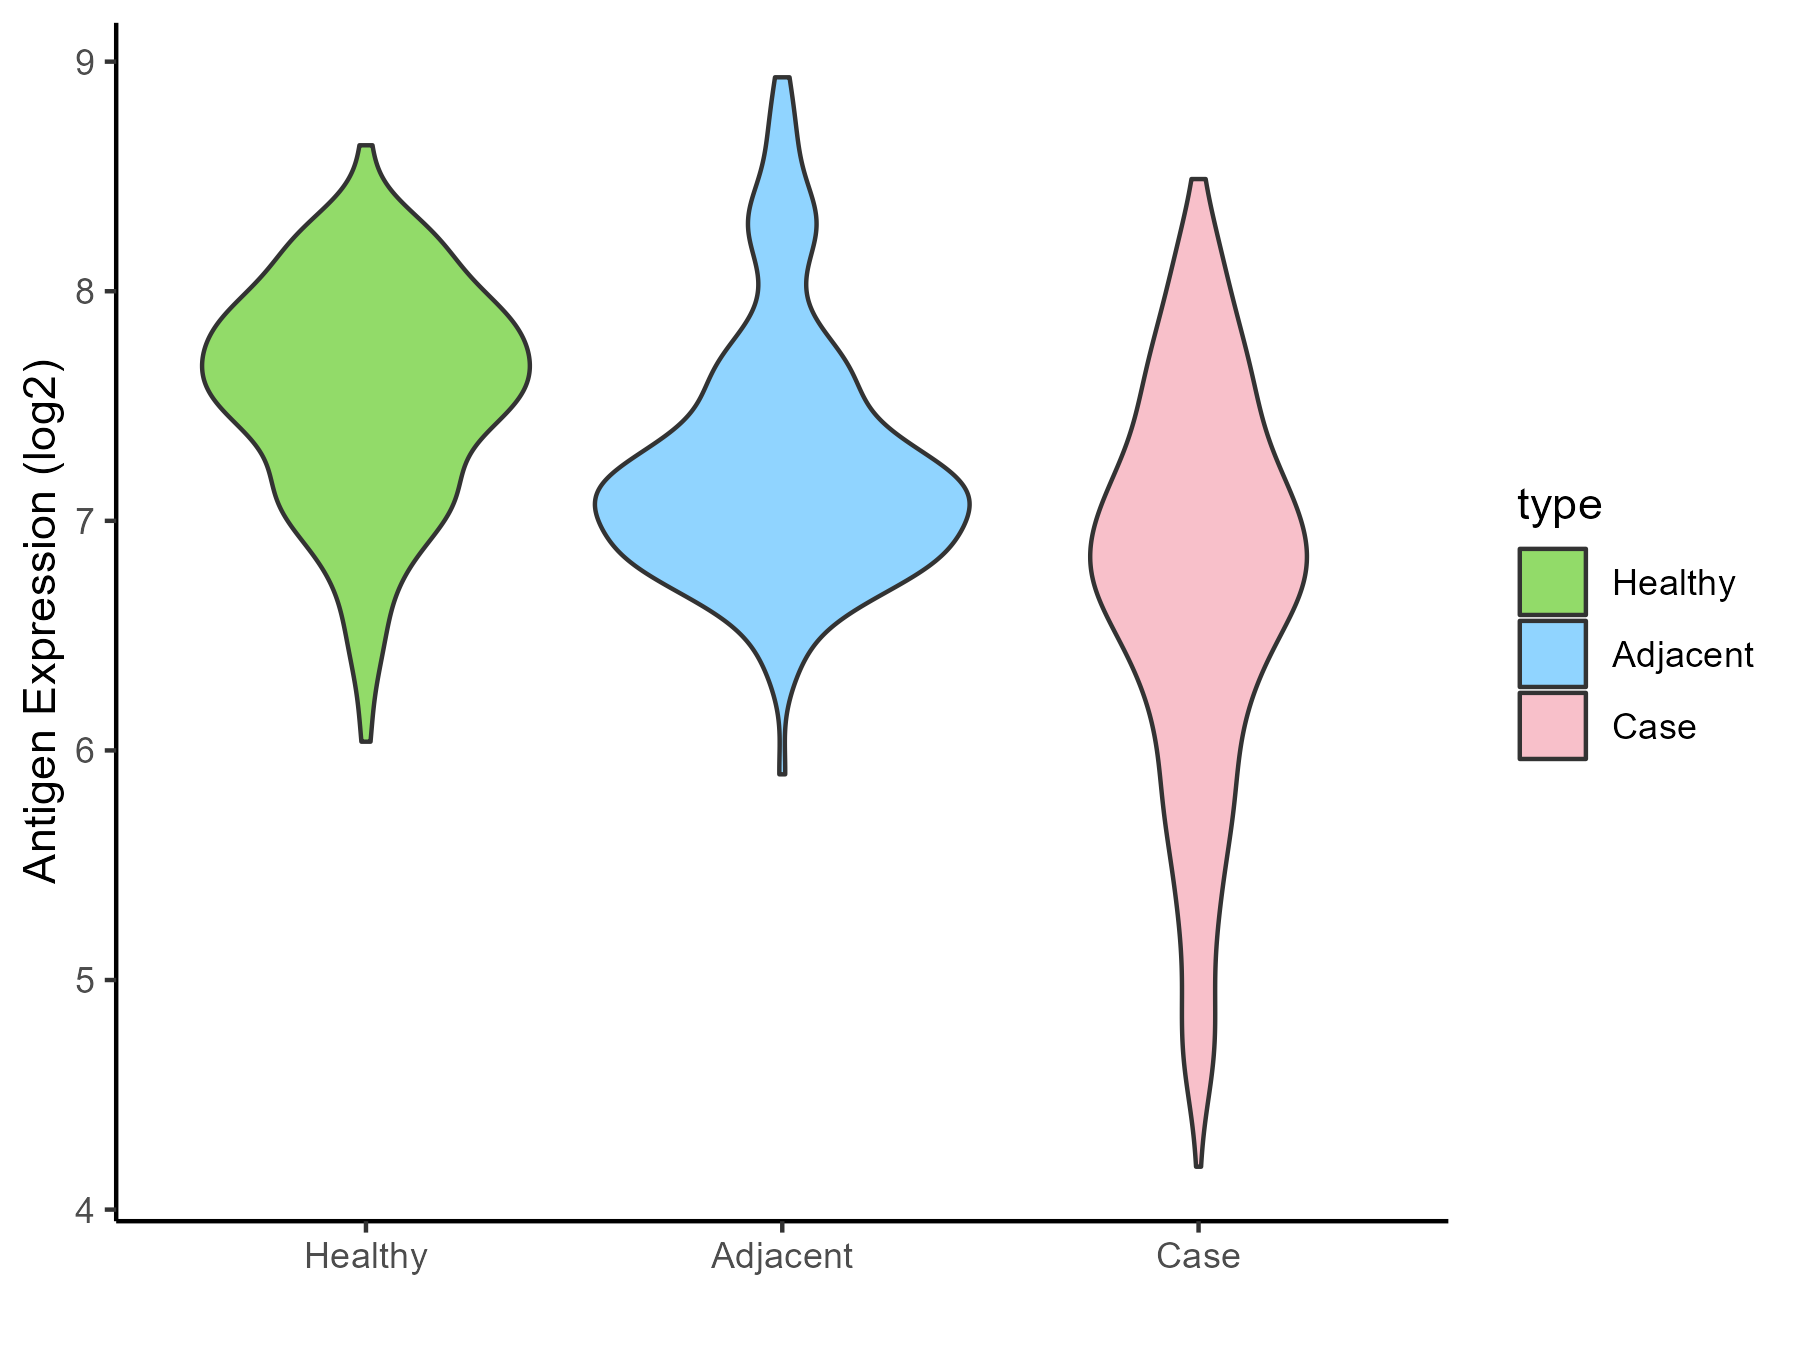
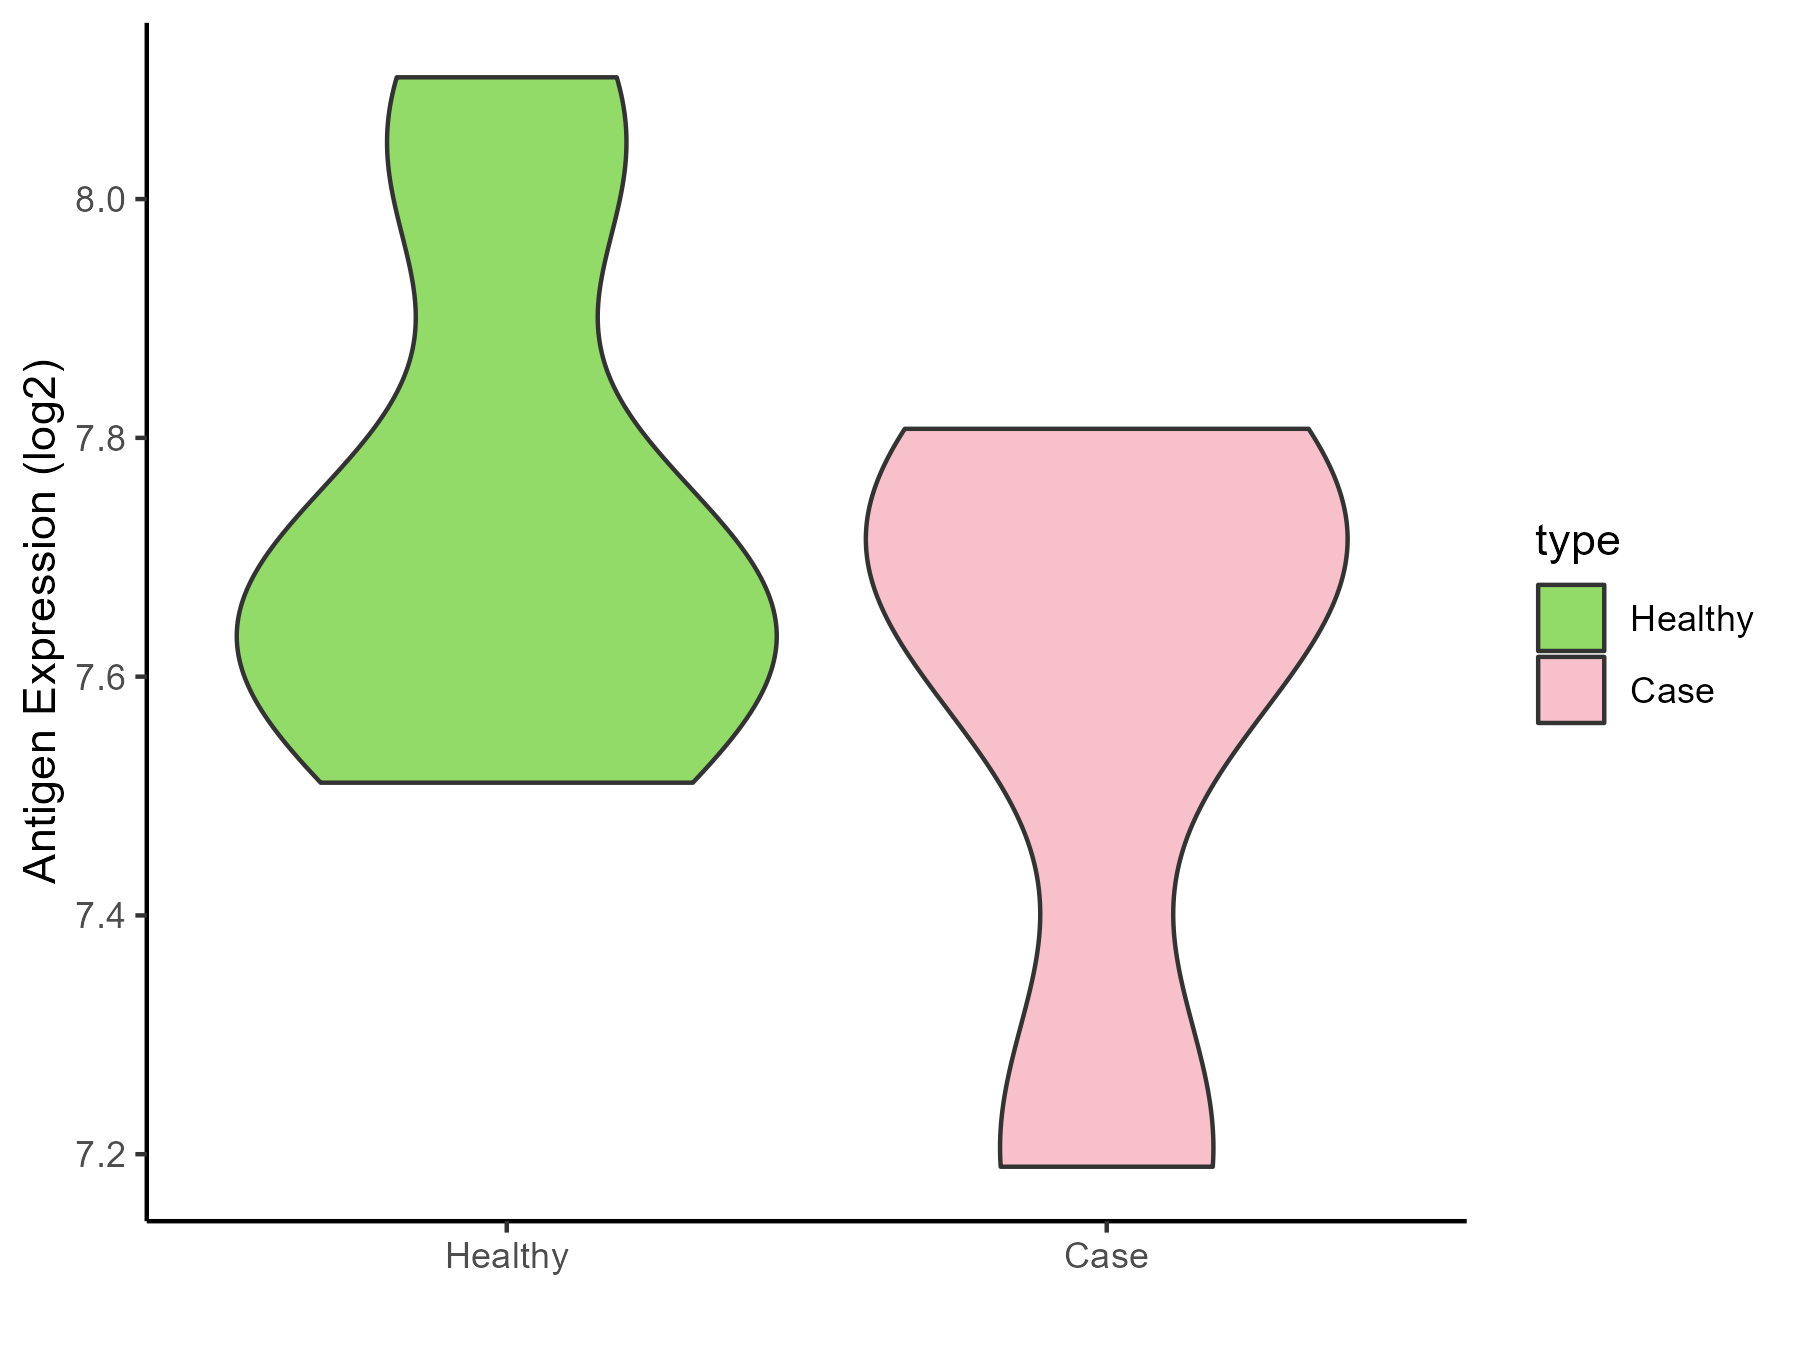
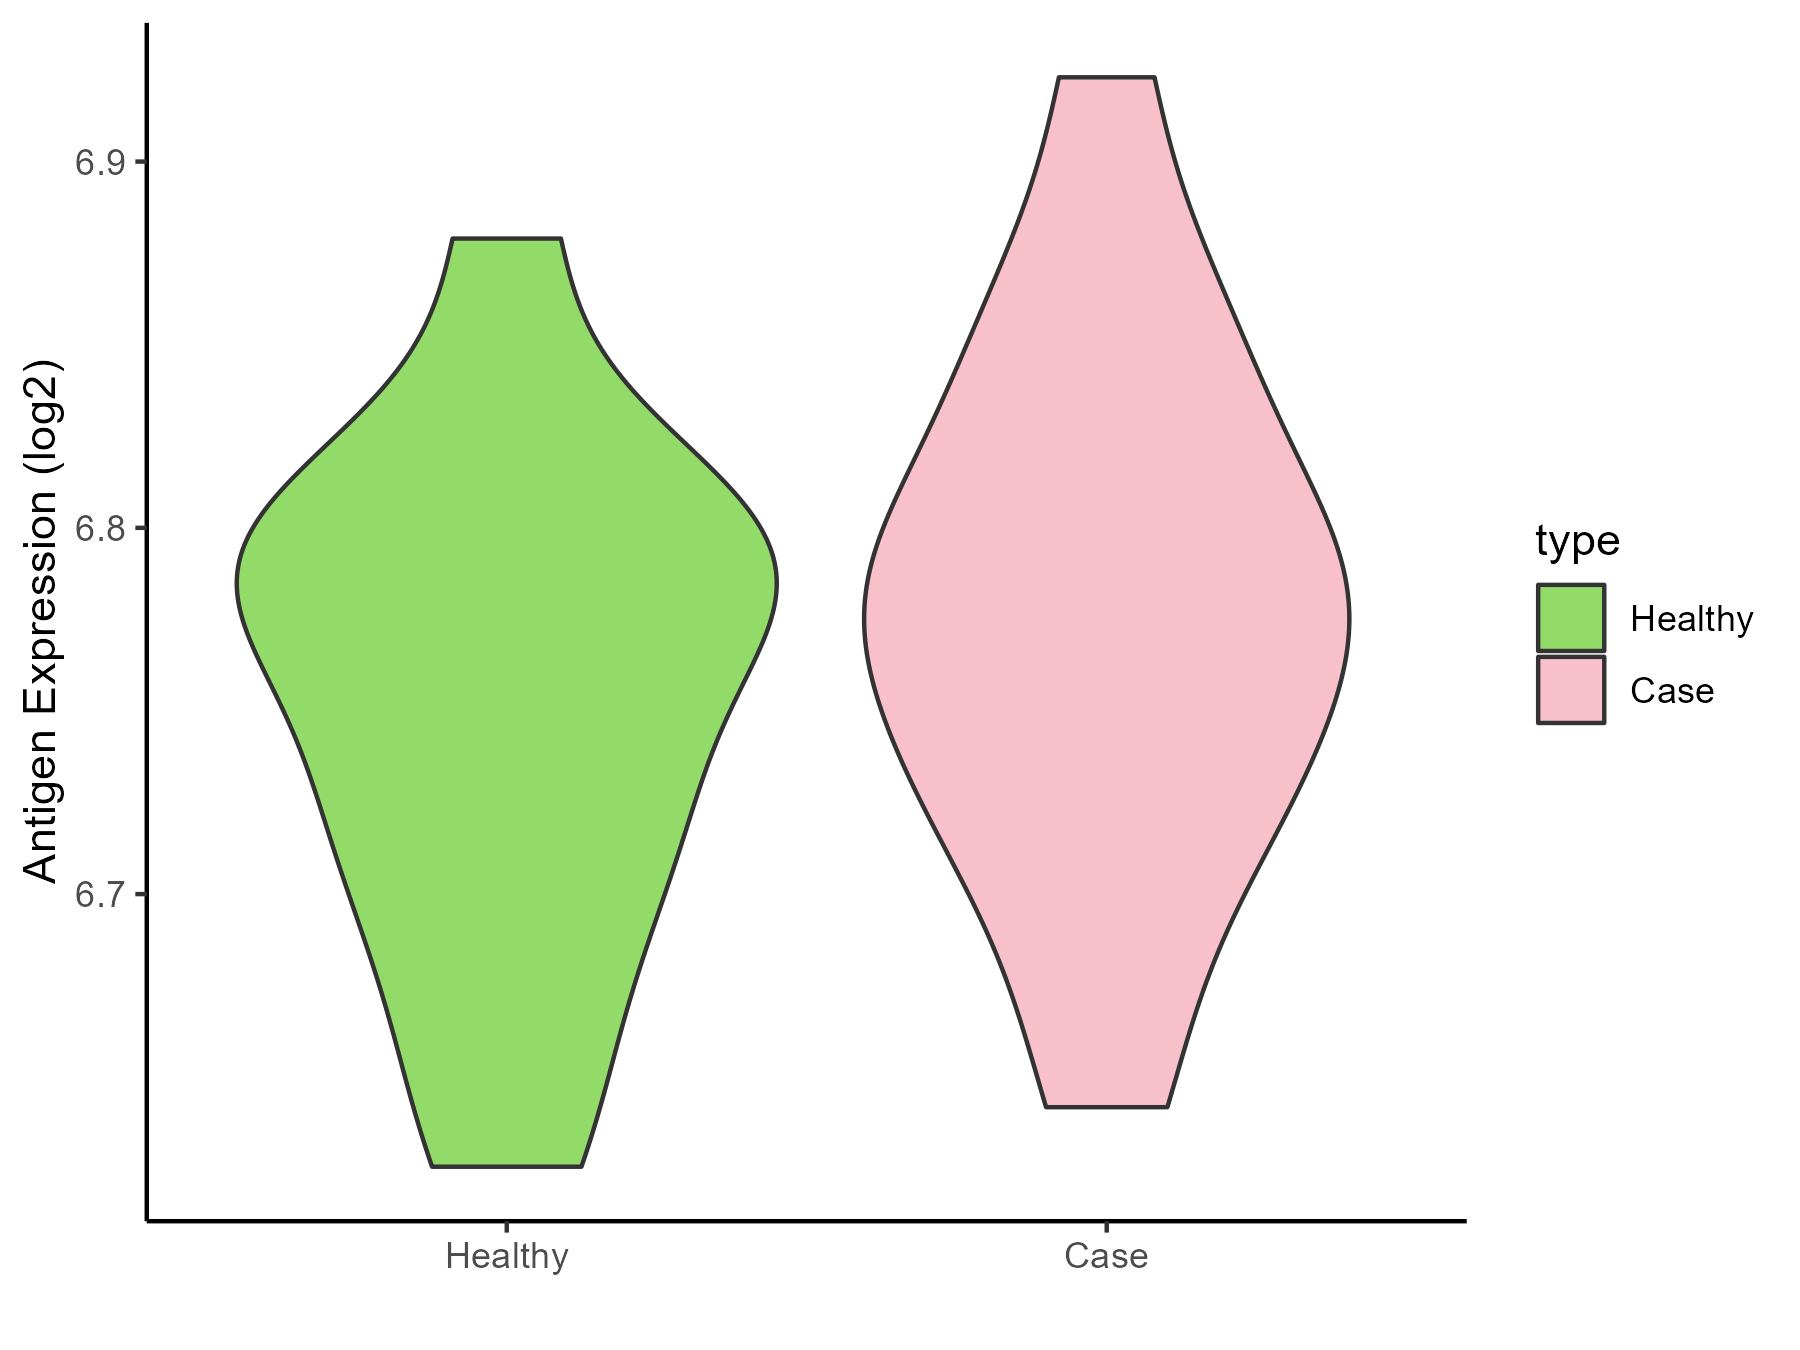
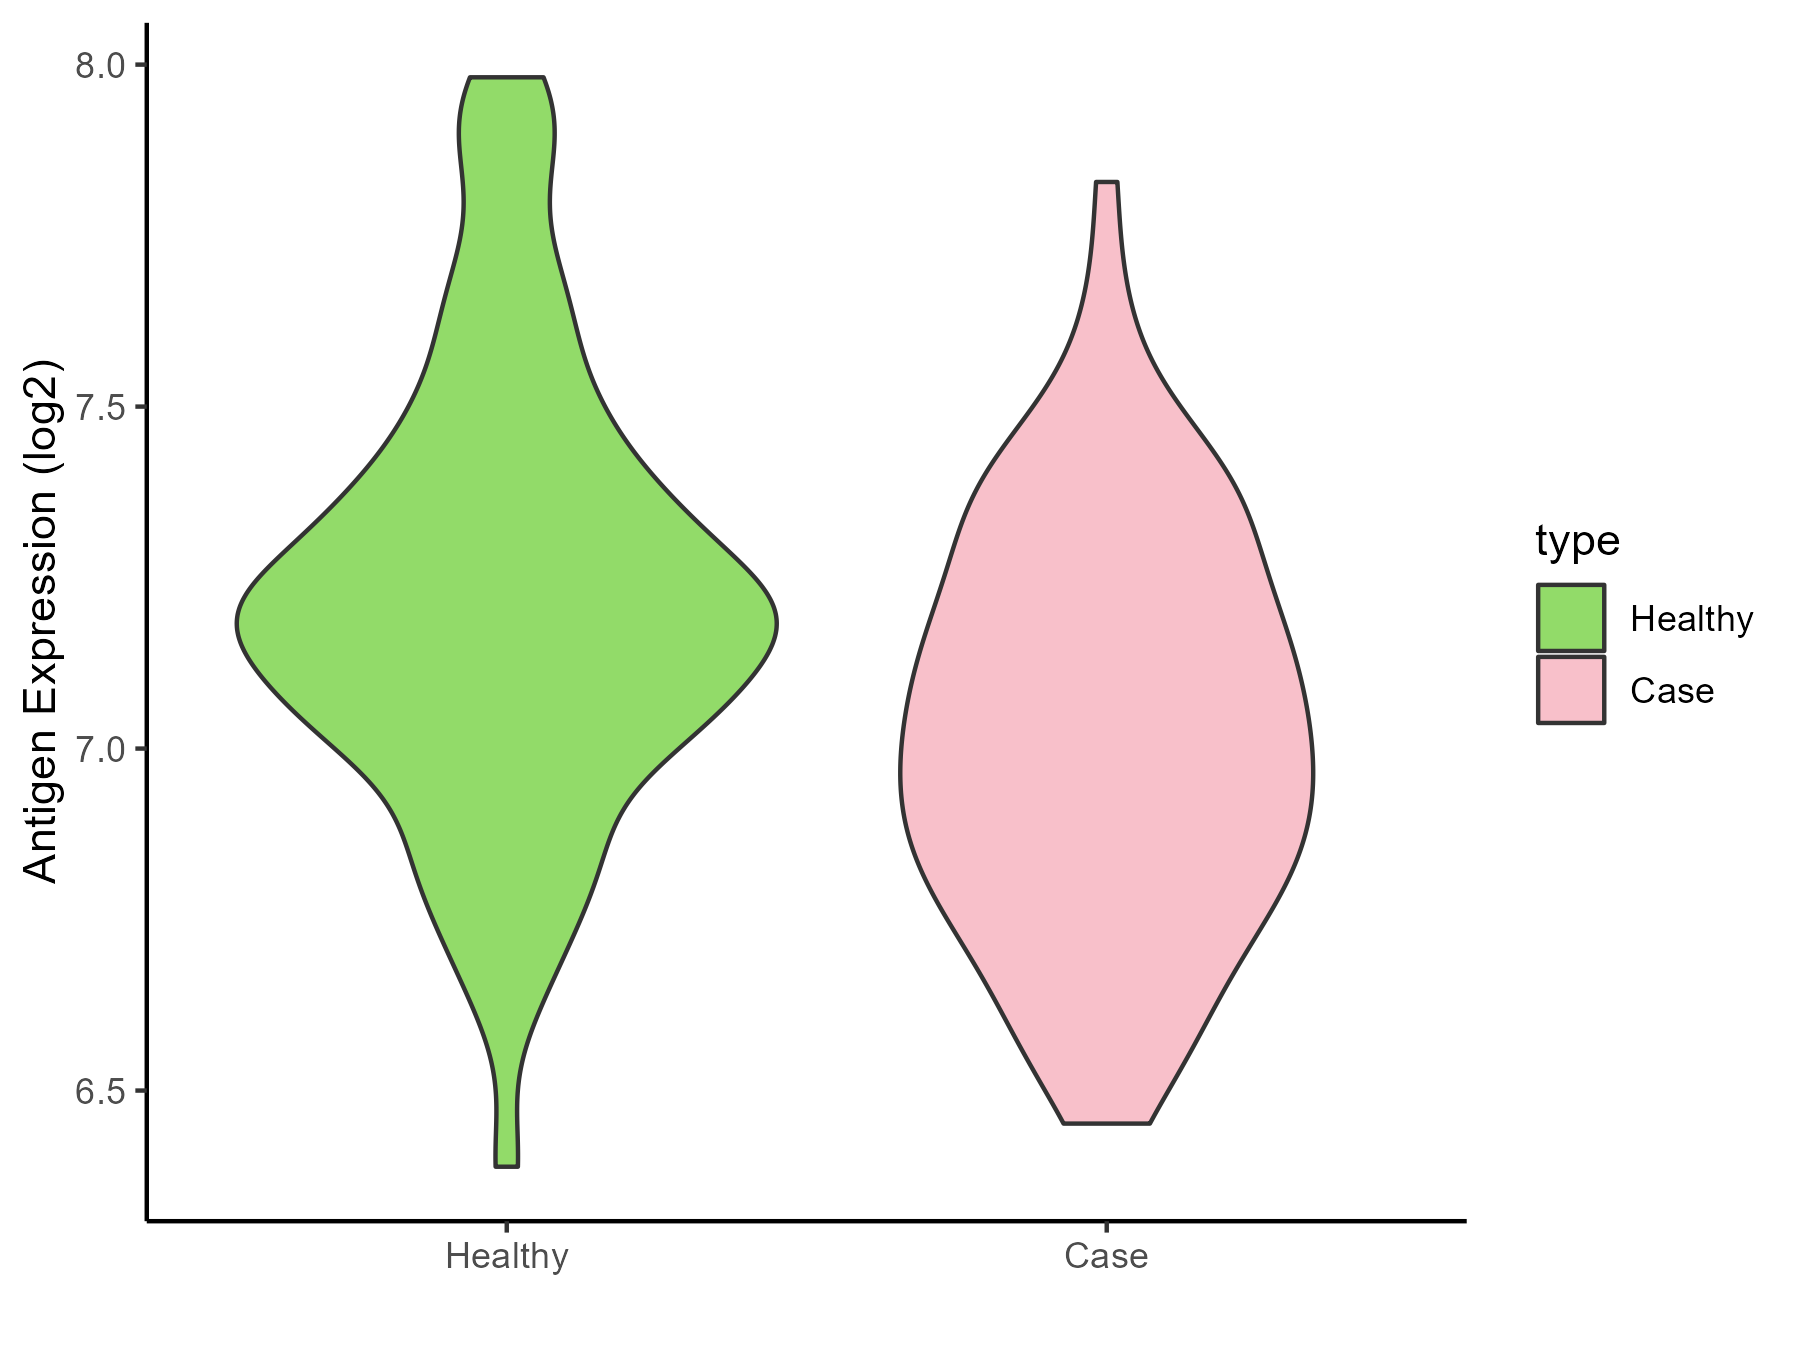
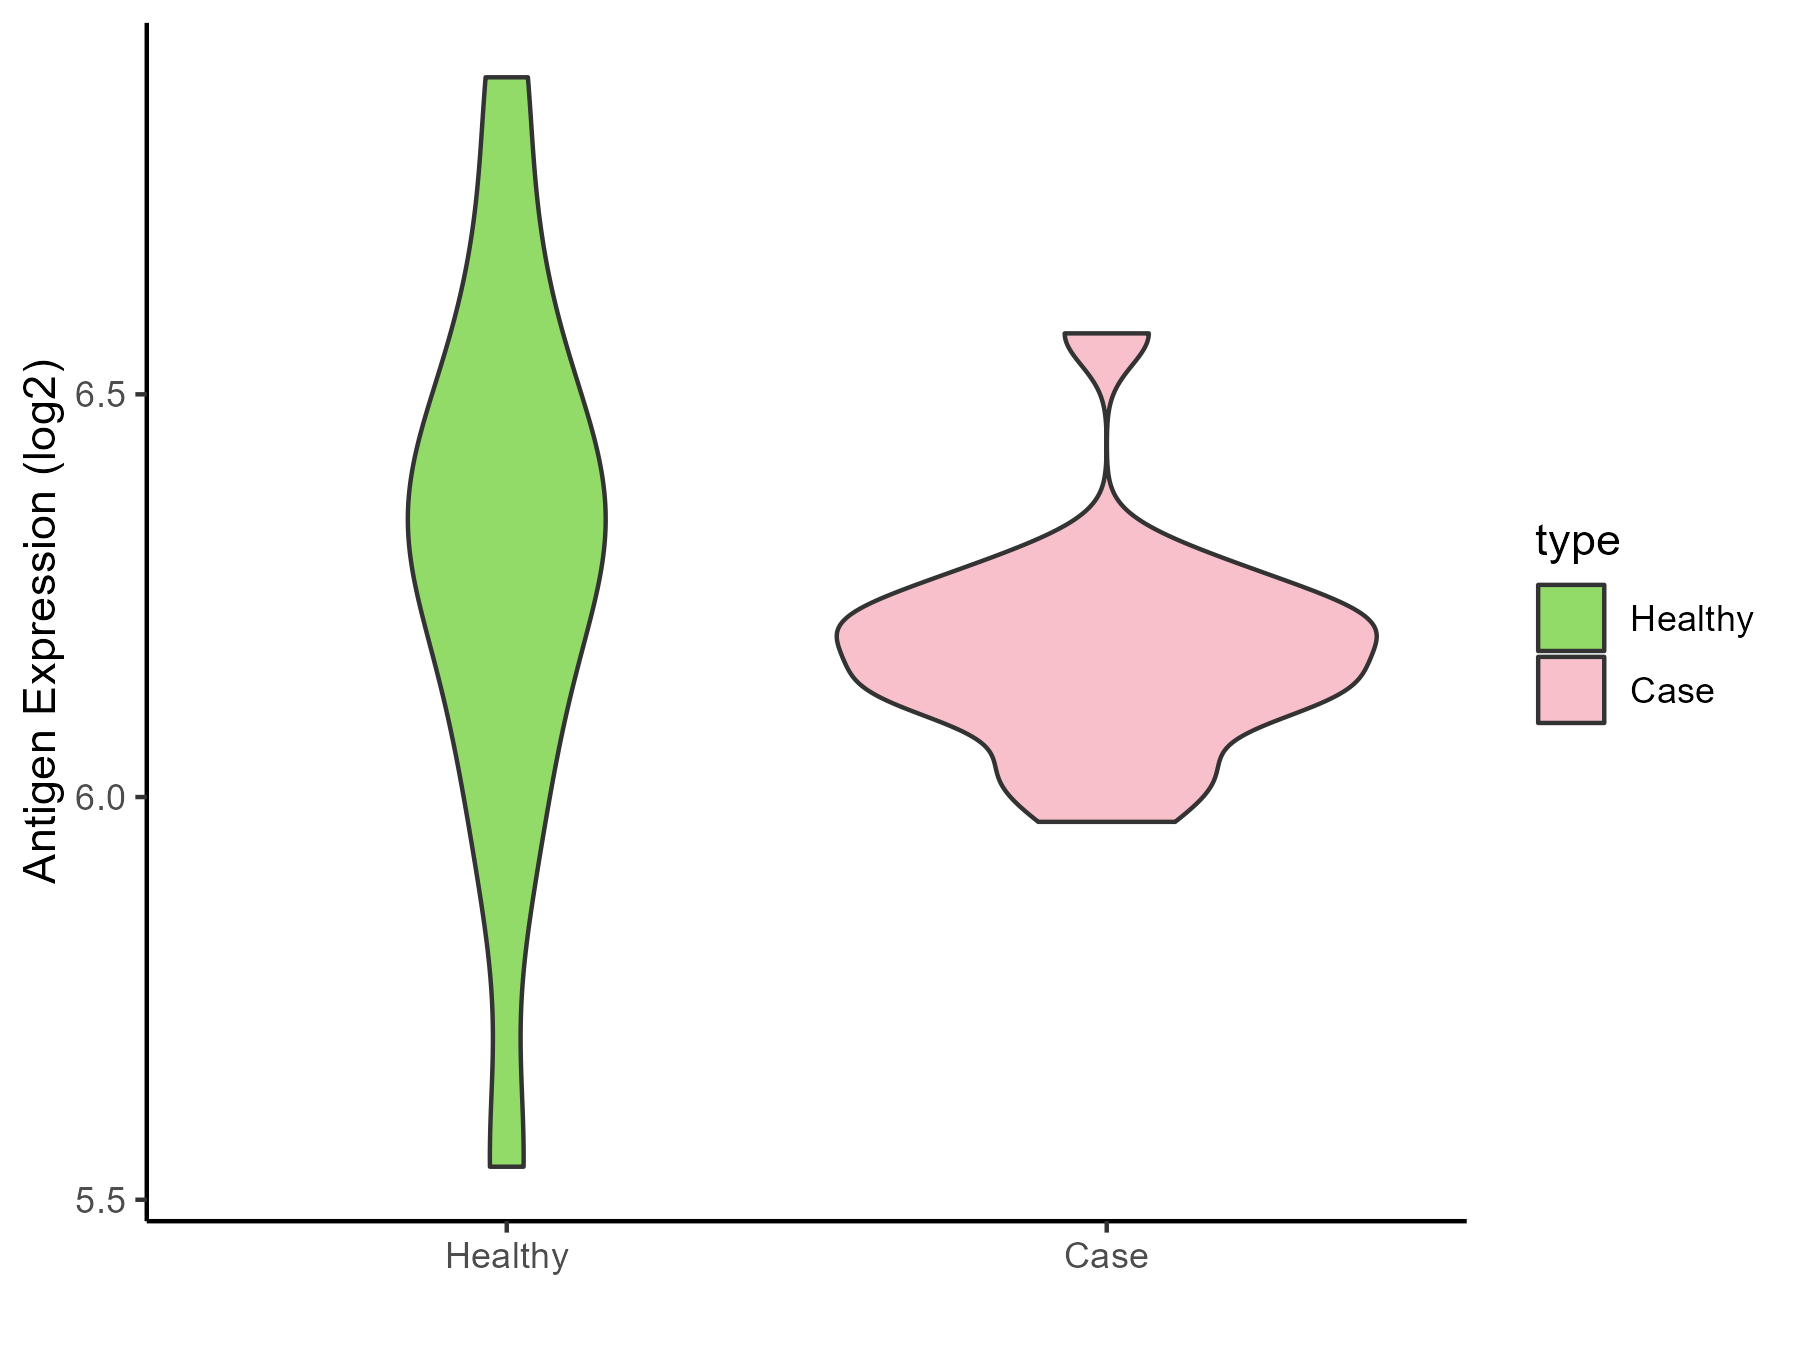
Brain cancer [ICD-11: 2A00]
Click to Show/Hide
| Differential expression pattern of antigen in diseases |
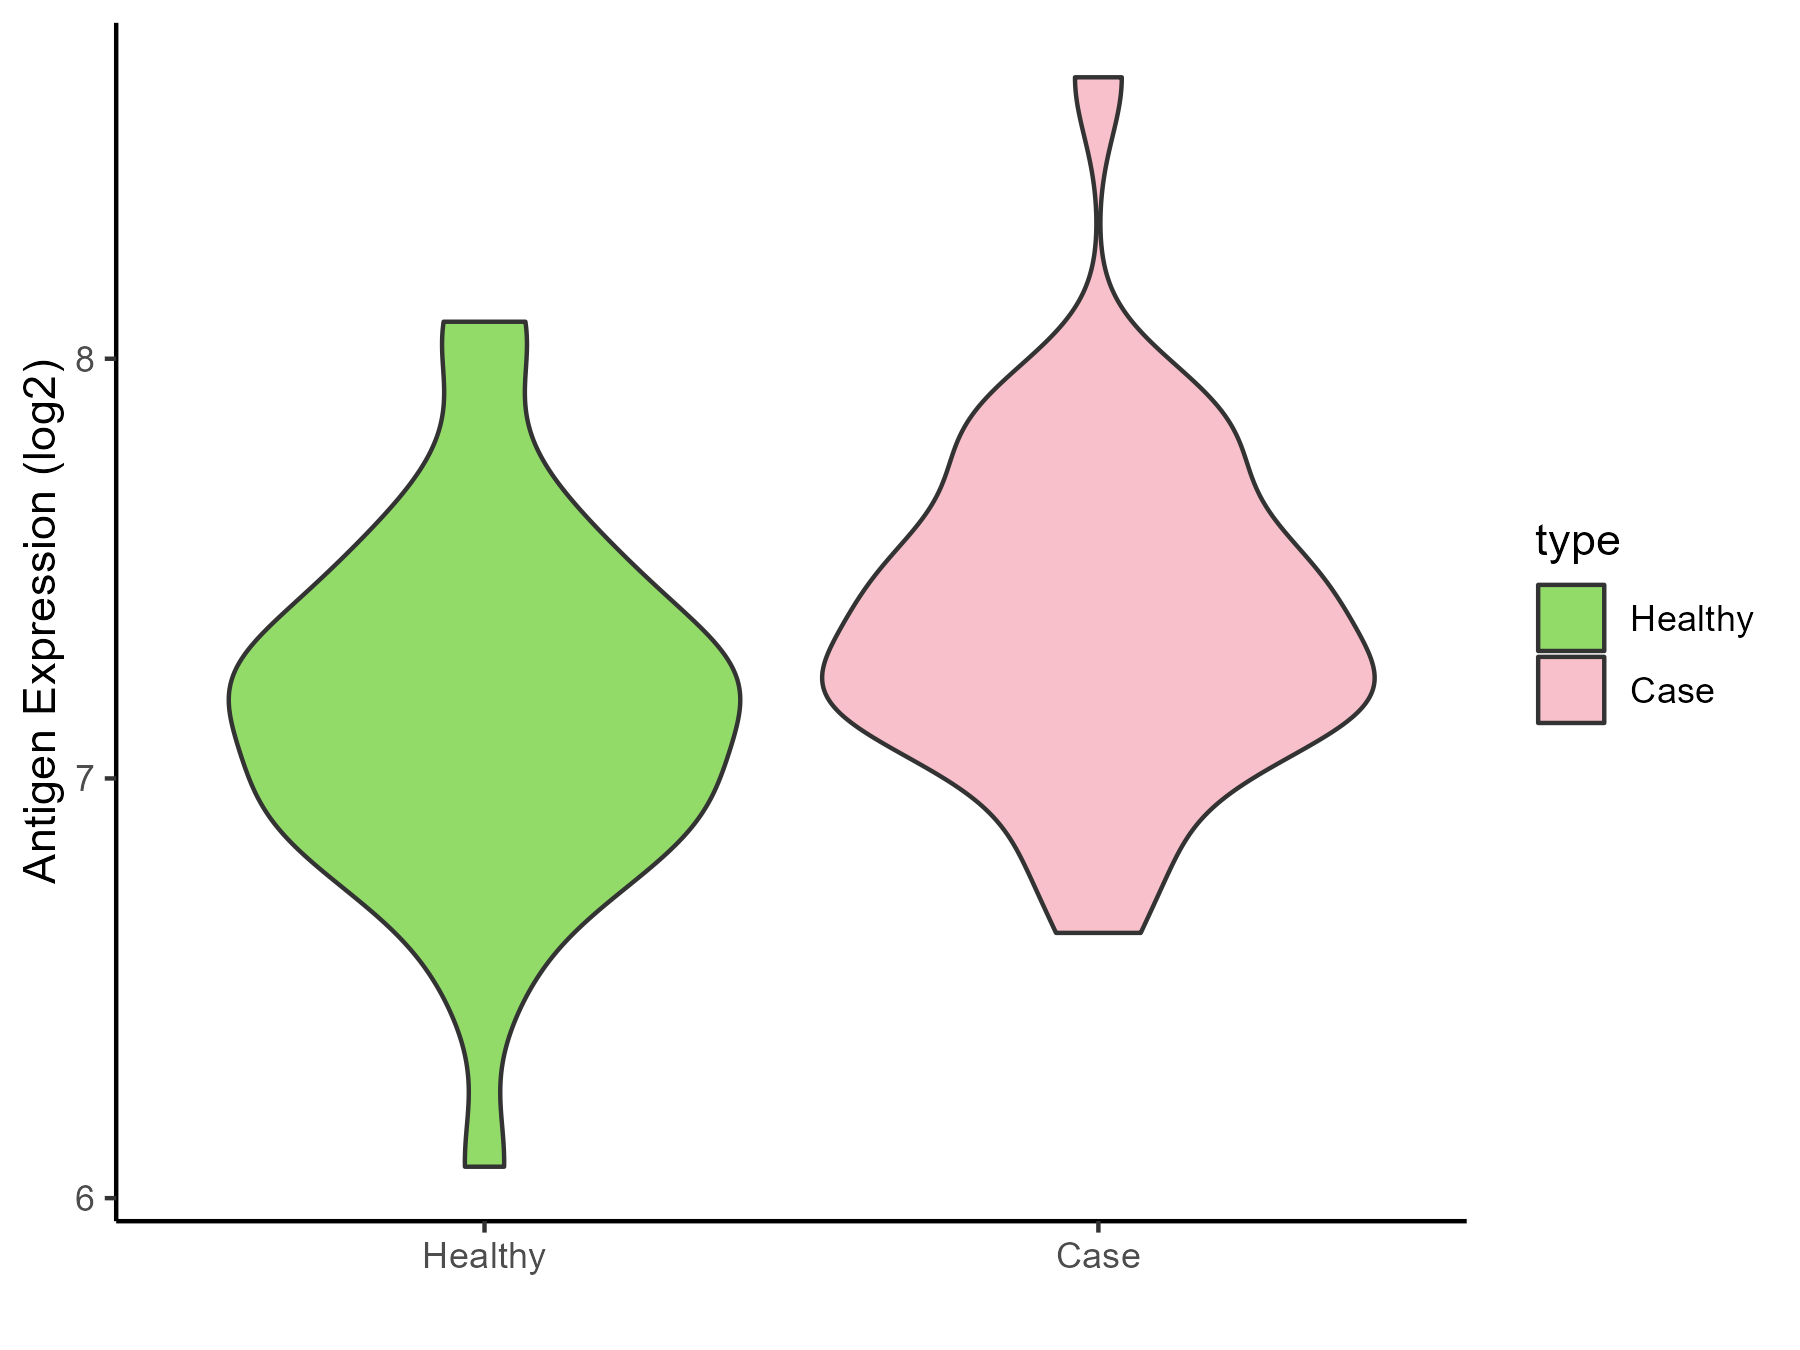
| The Studied Tissue |
White matter |
| The Specific Disease |
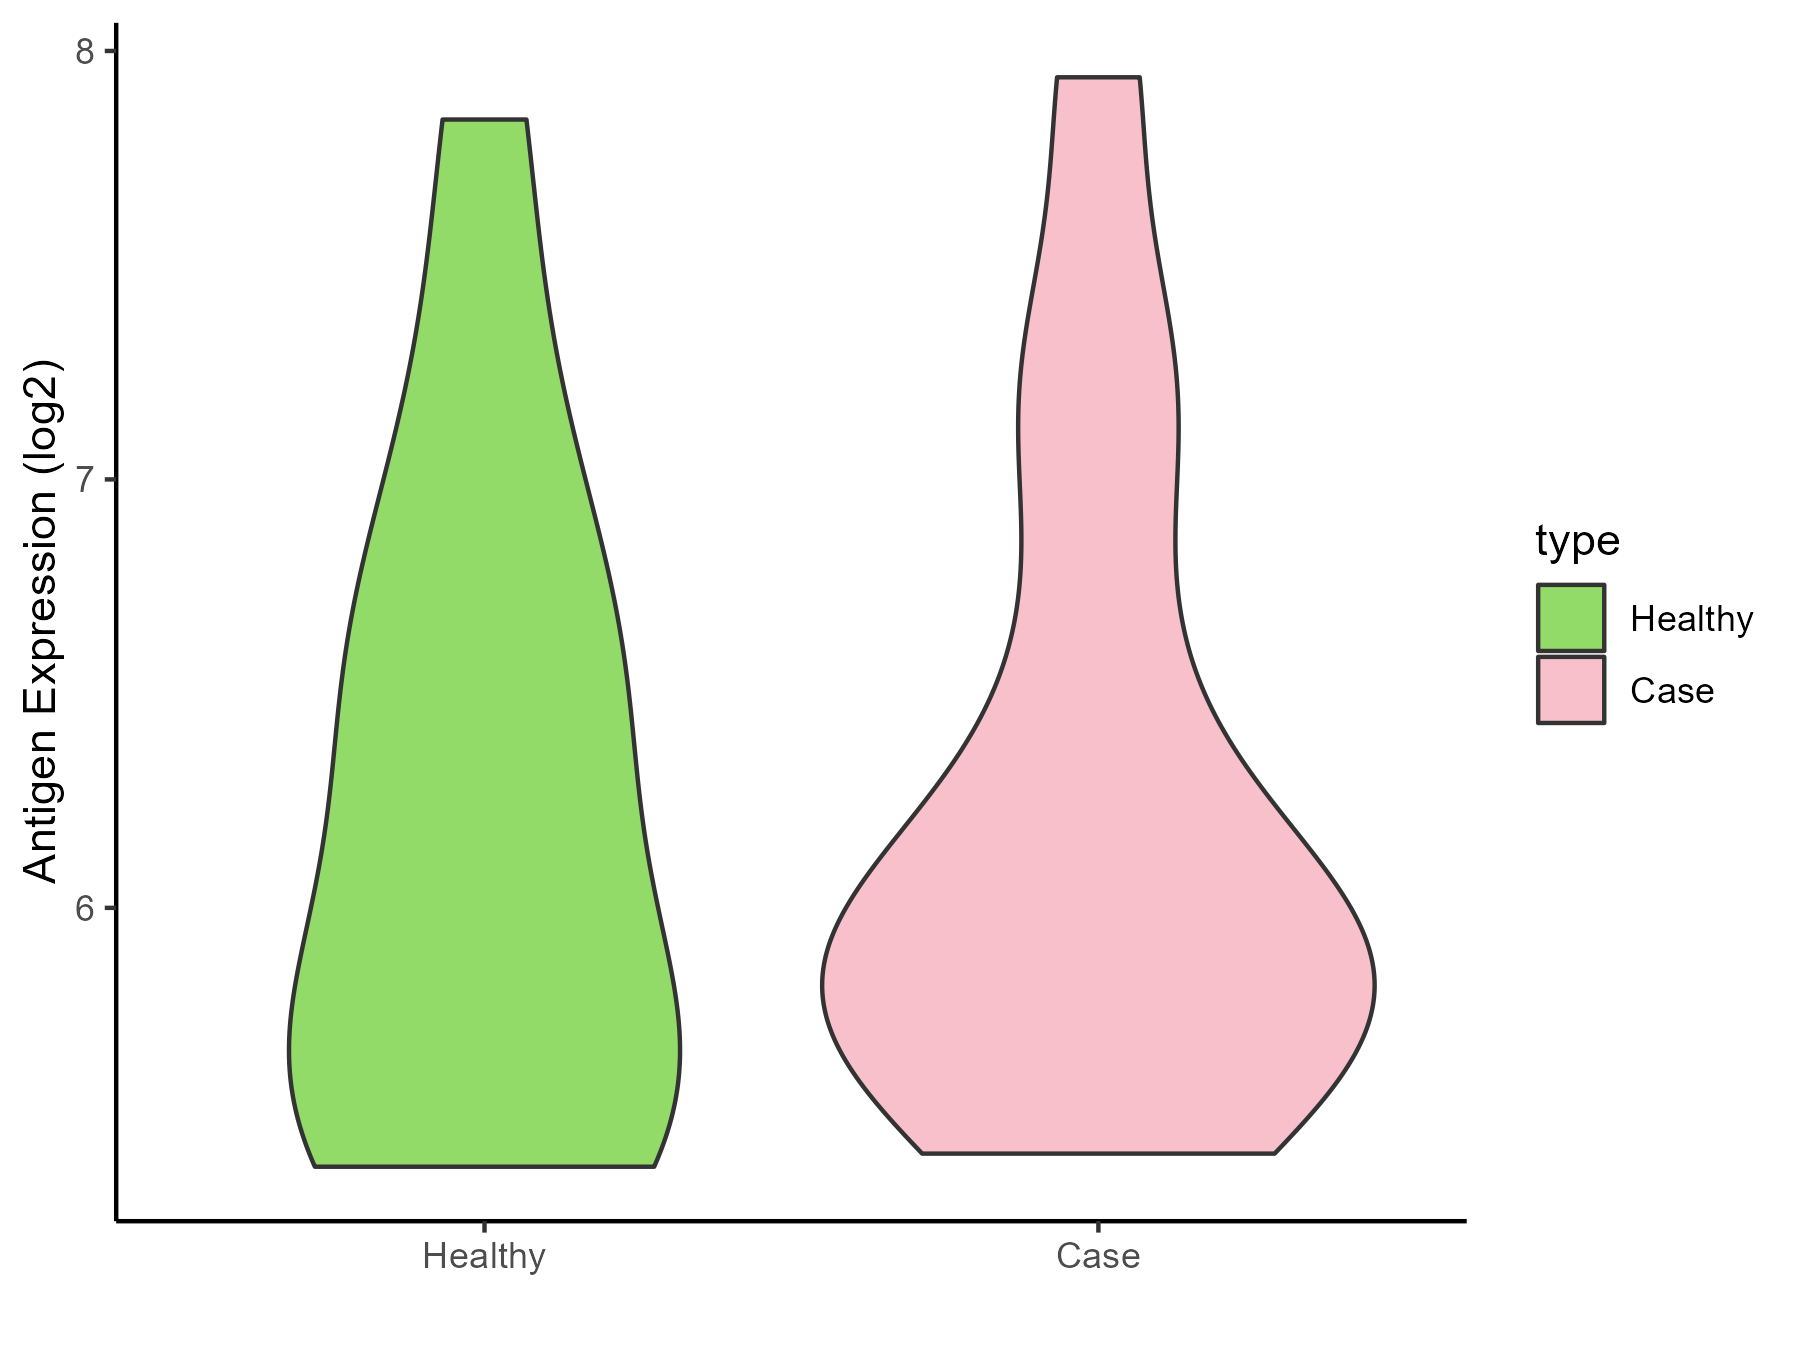
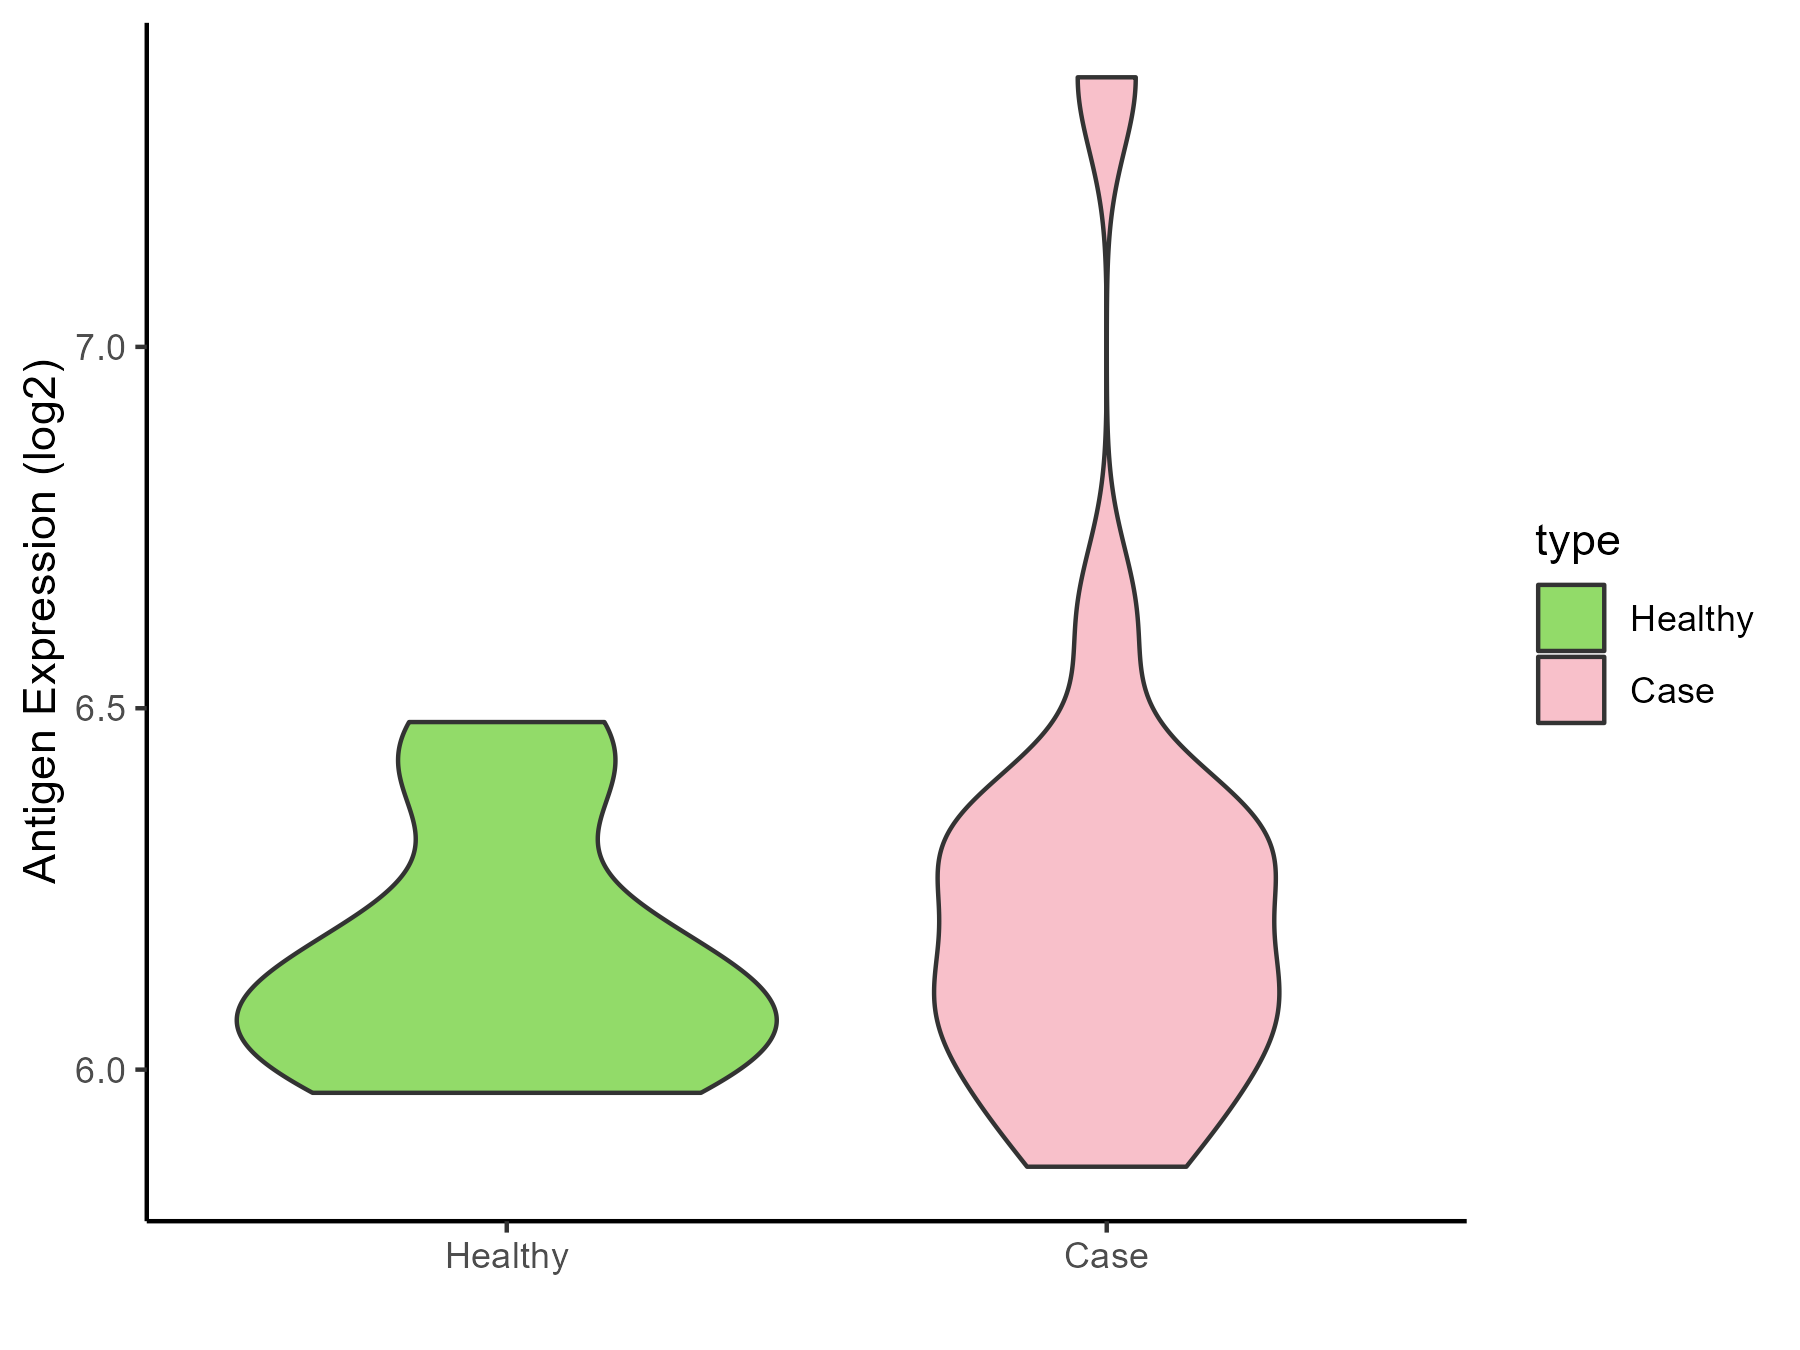
Glioma |
| The Expression Level of Disease Section Compare with the Healthy Individual Tissue |
p-value: 0.075174723;
Fold-change: 0.362906074;
Z-score: 0.637730348
|
| Disease-specific Antigen Abundances |
|
Click to View the Clearer Original Diagram
|
|
|
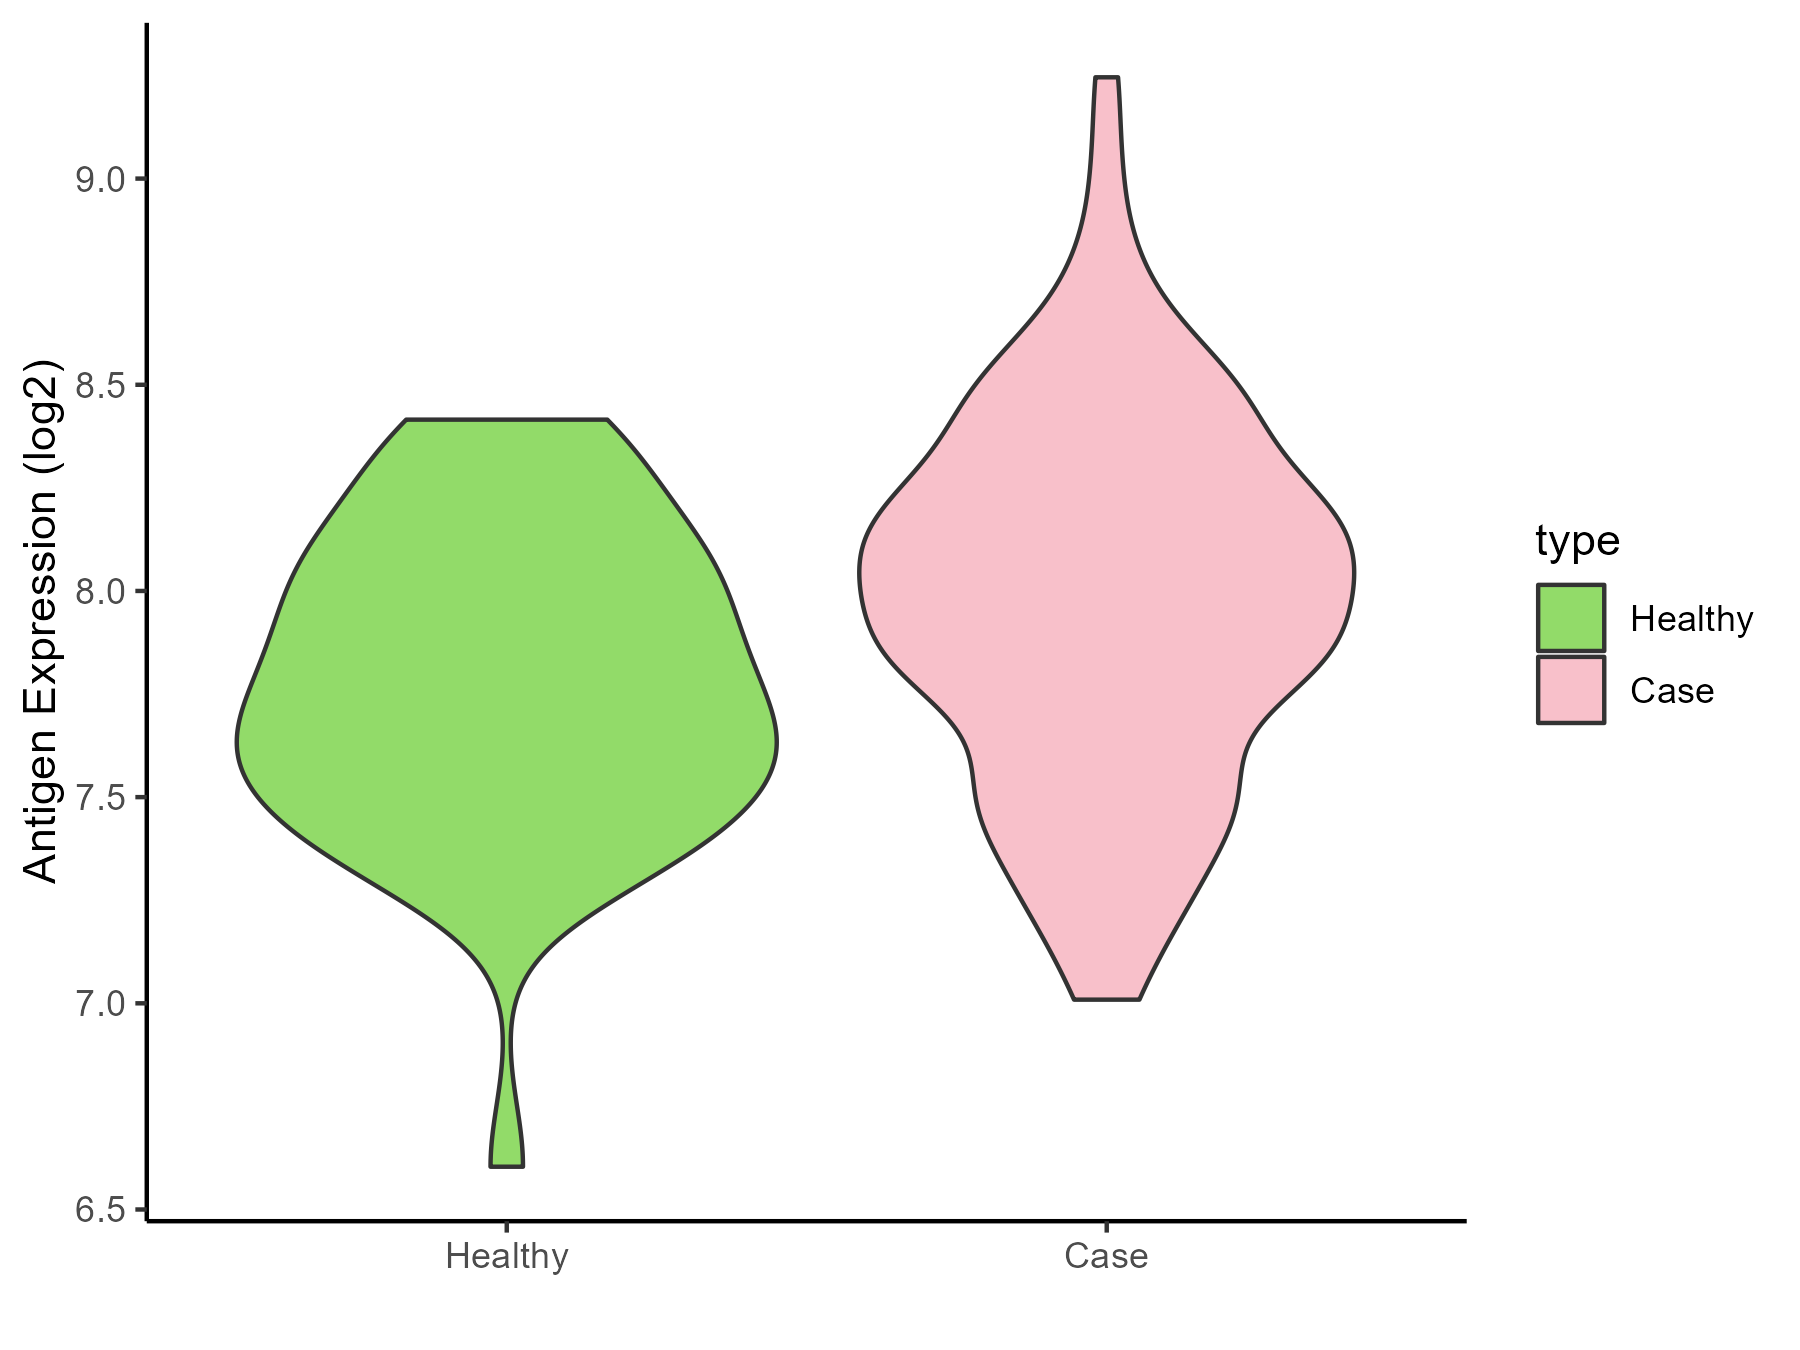
| The Studied Tissue |
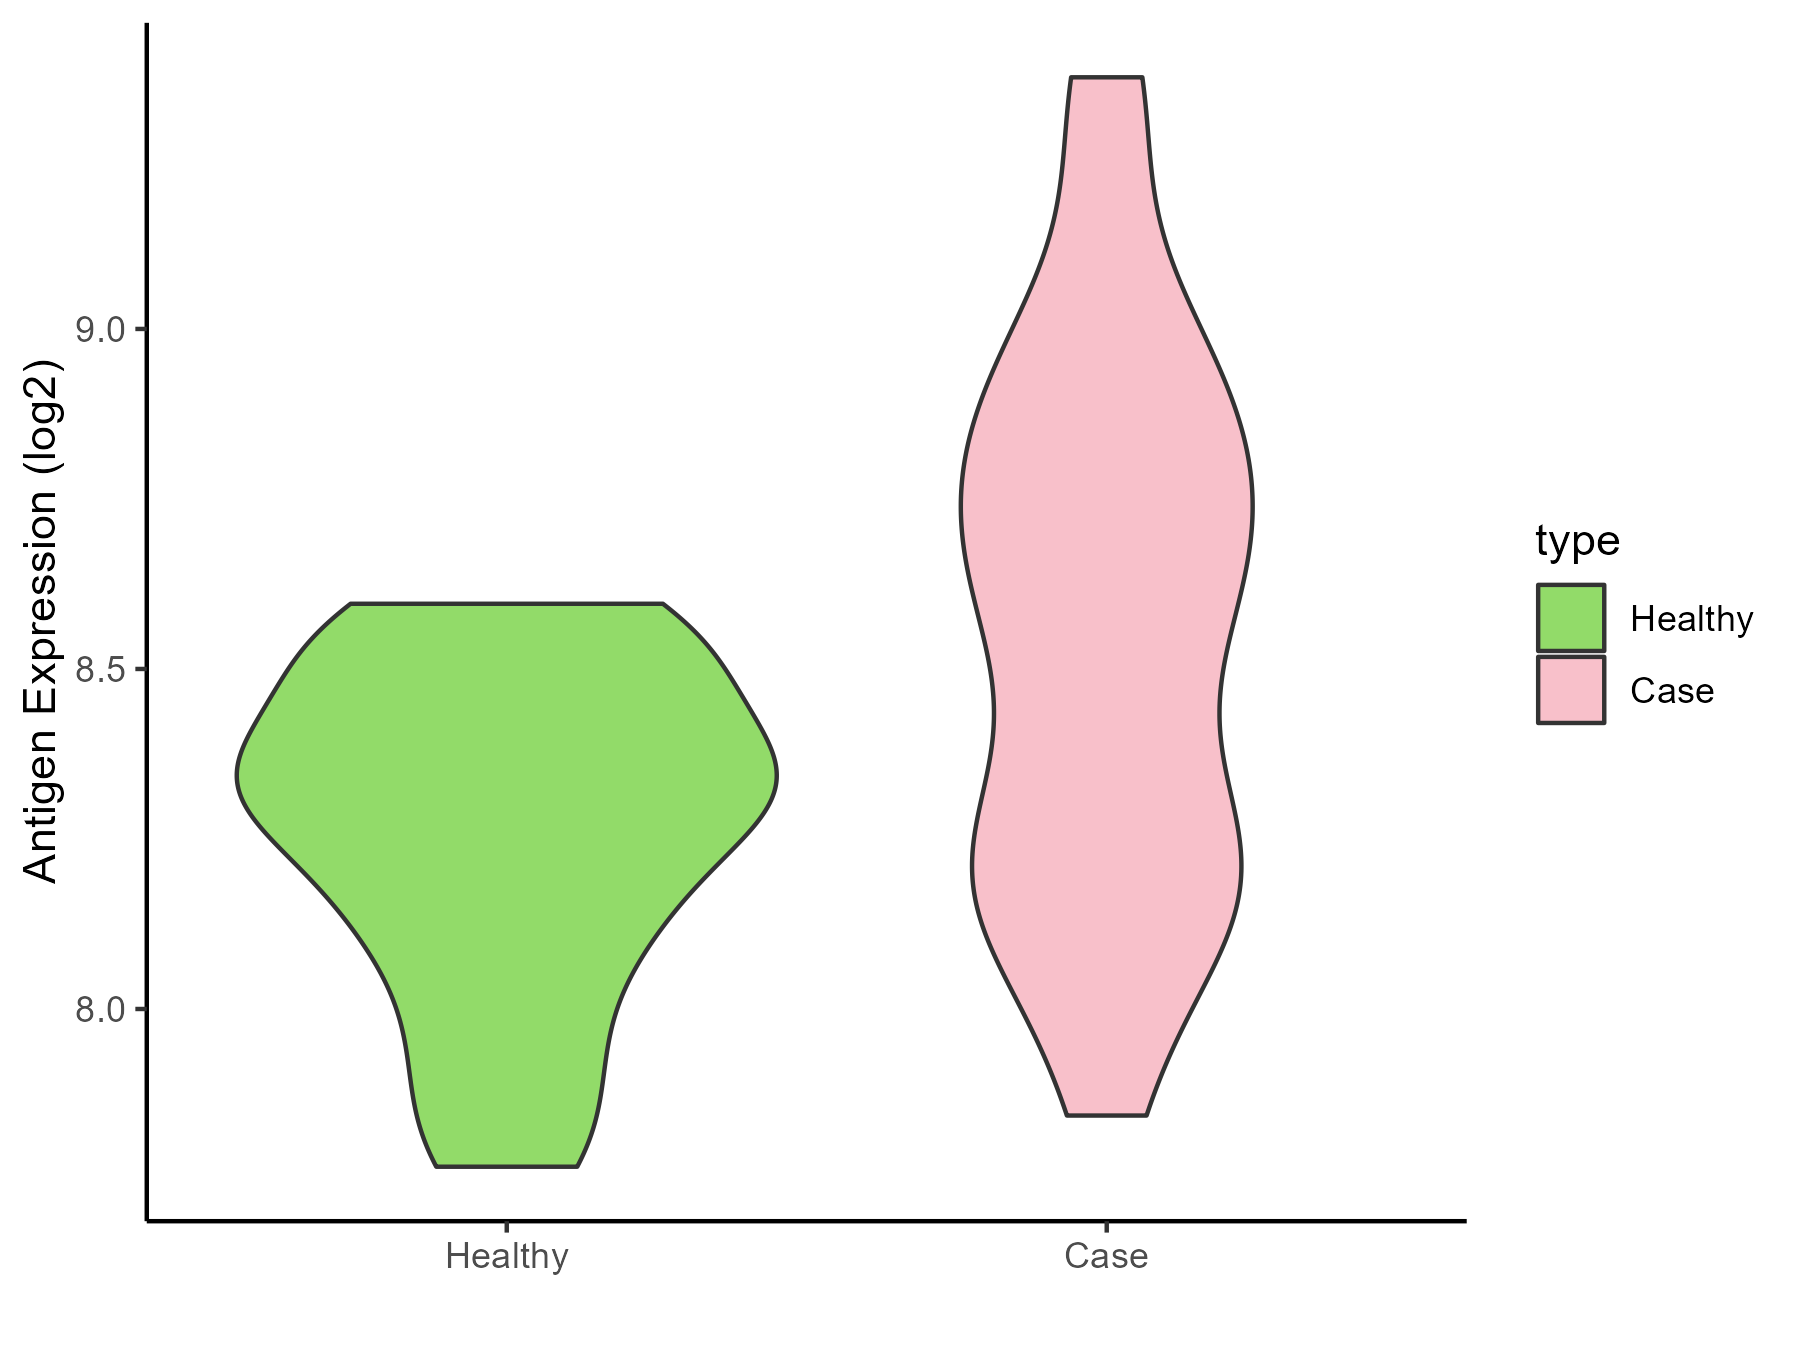
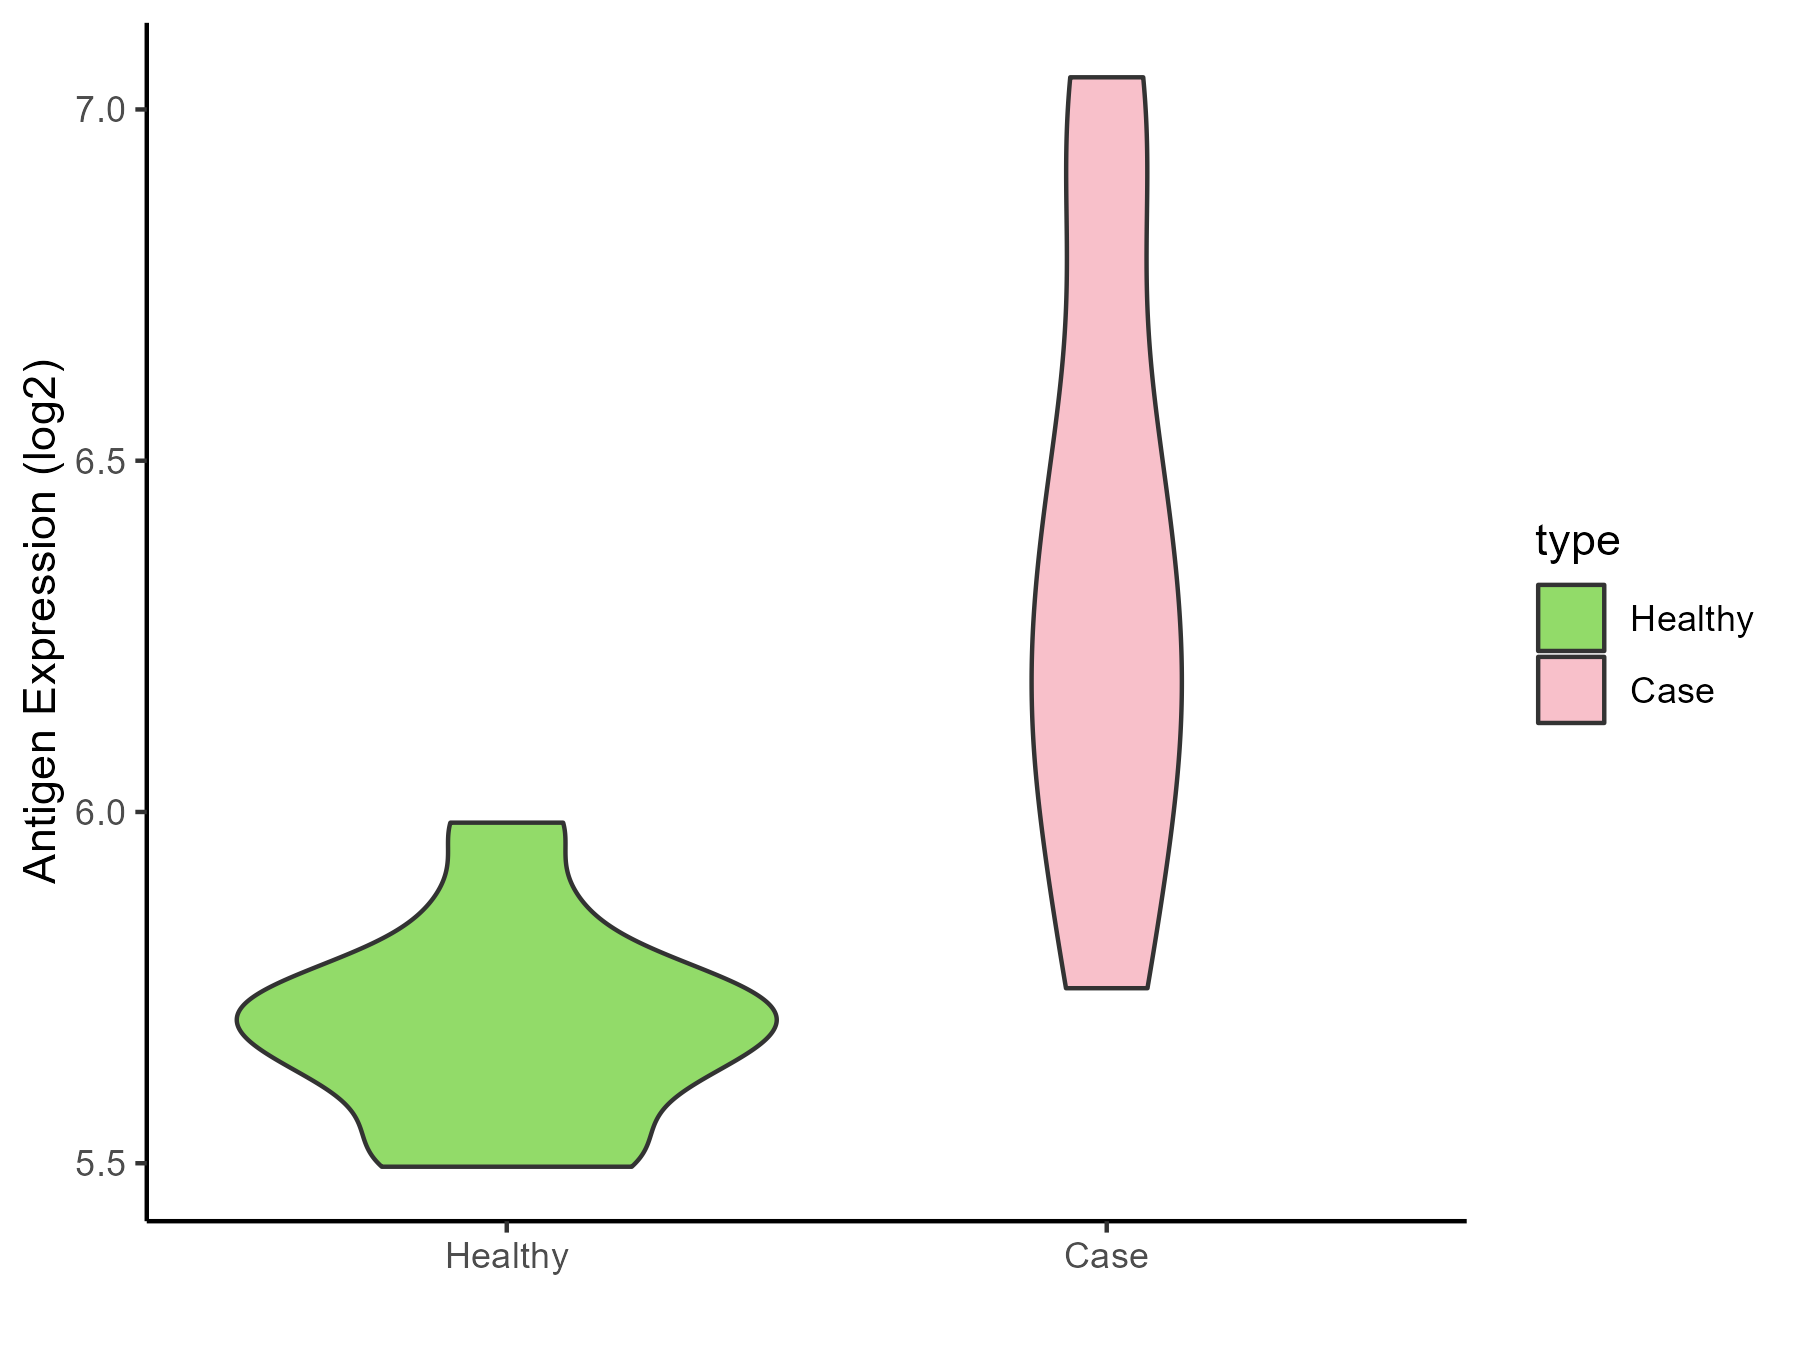
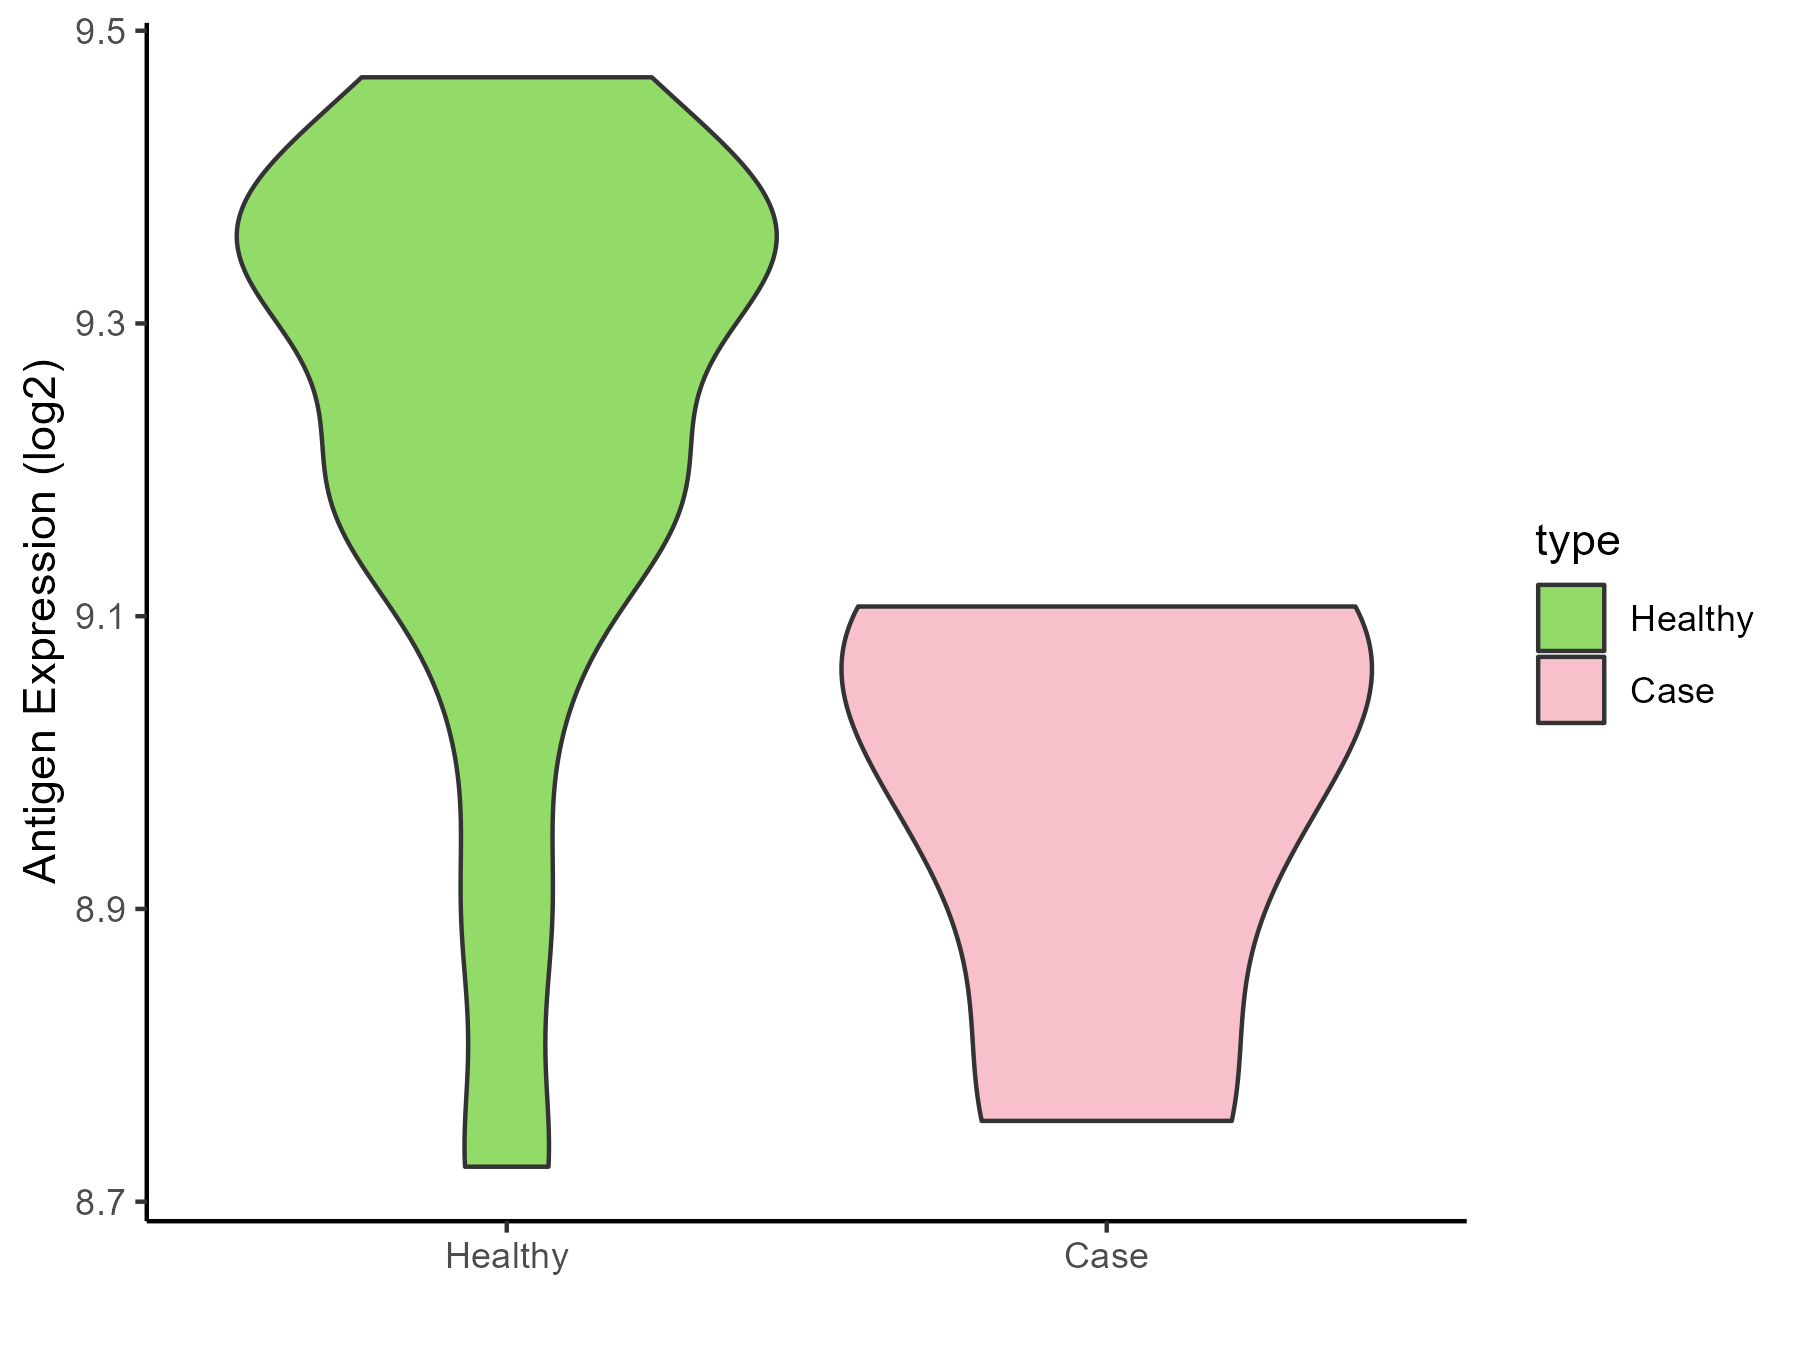
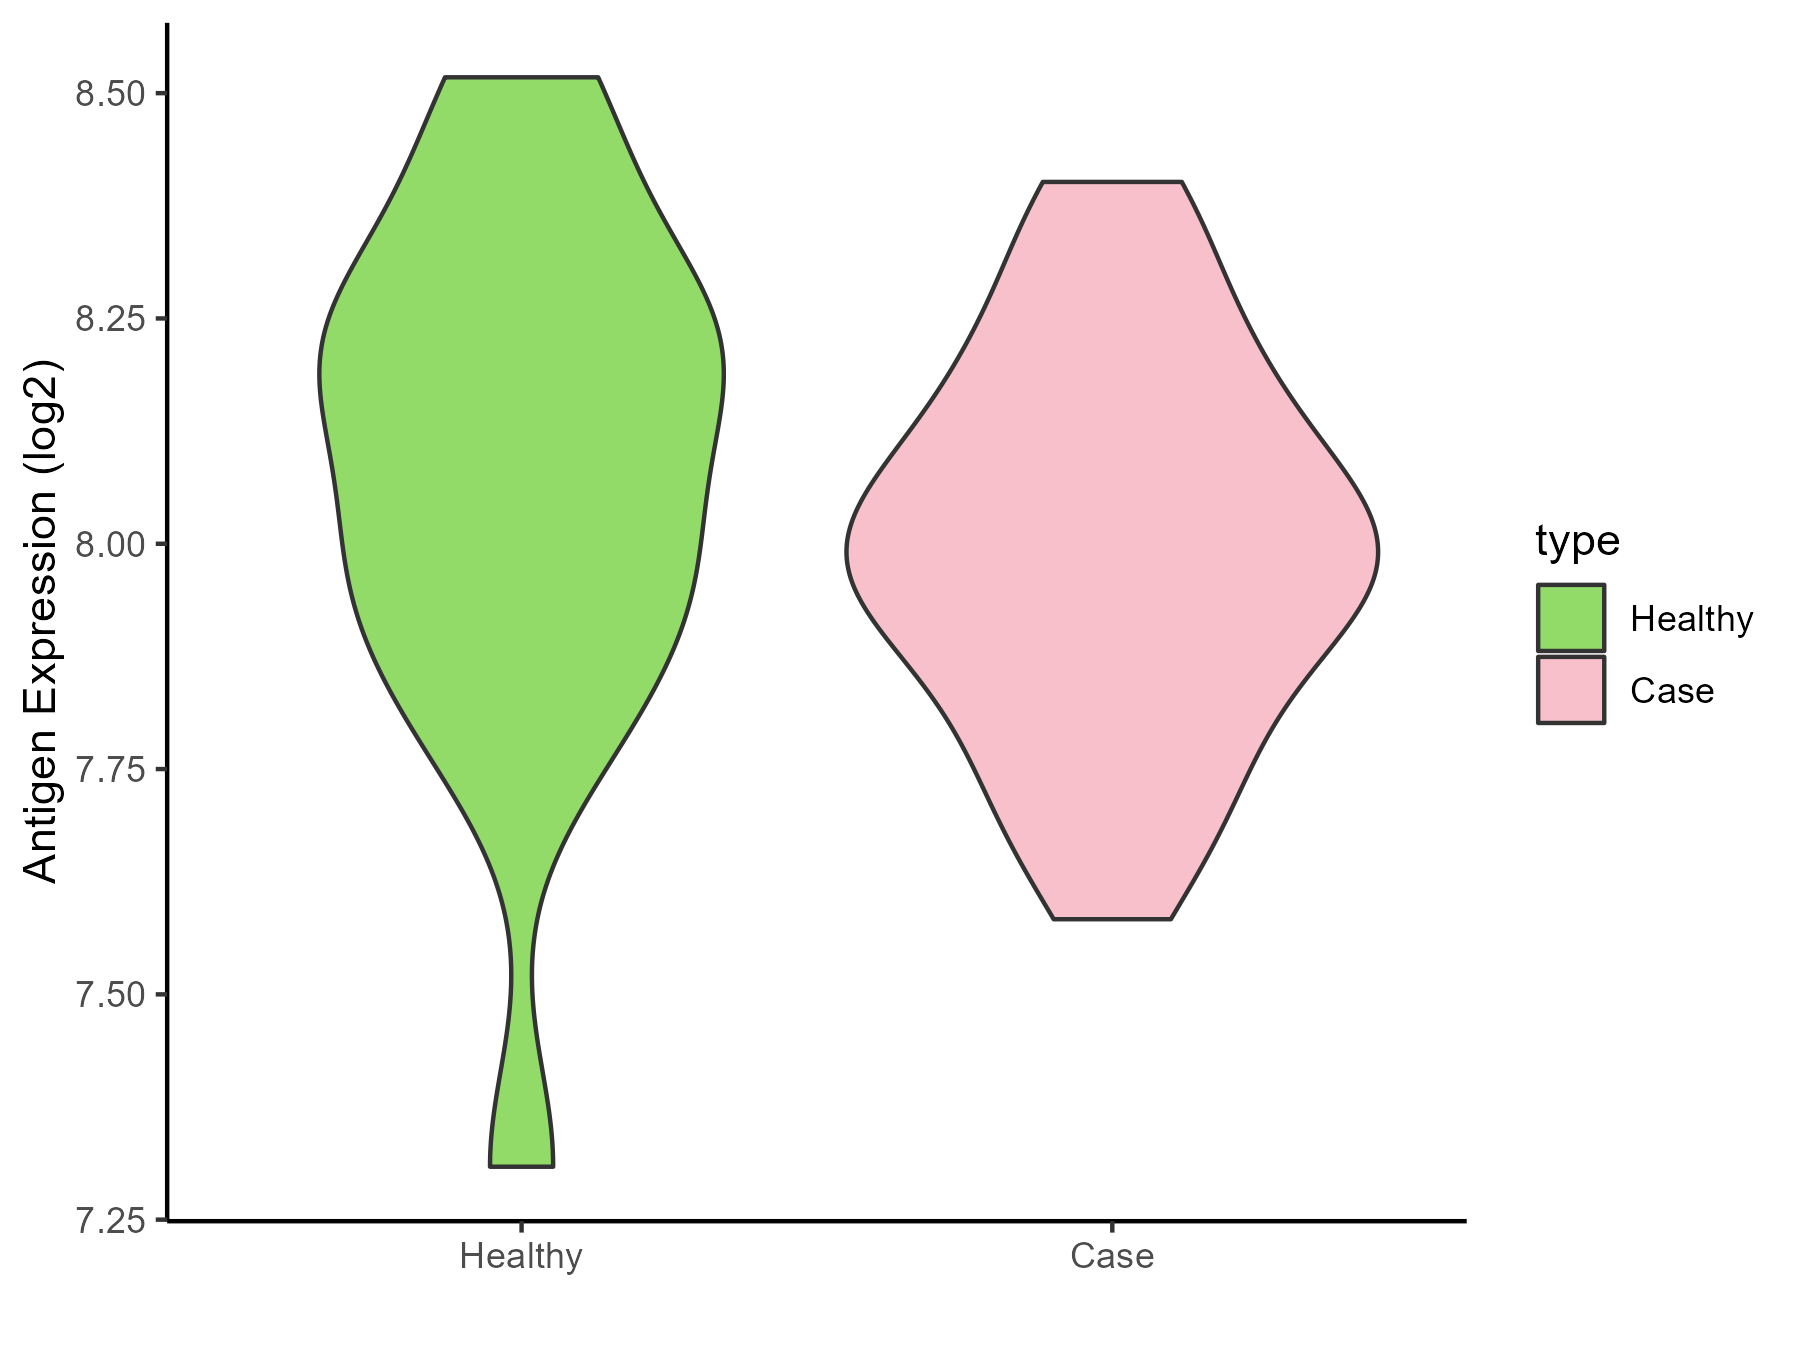
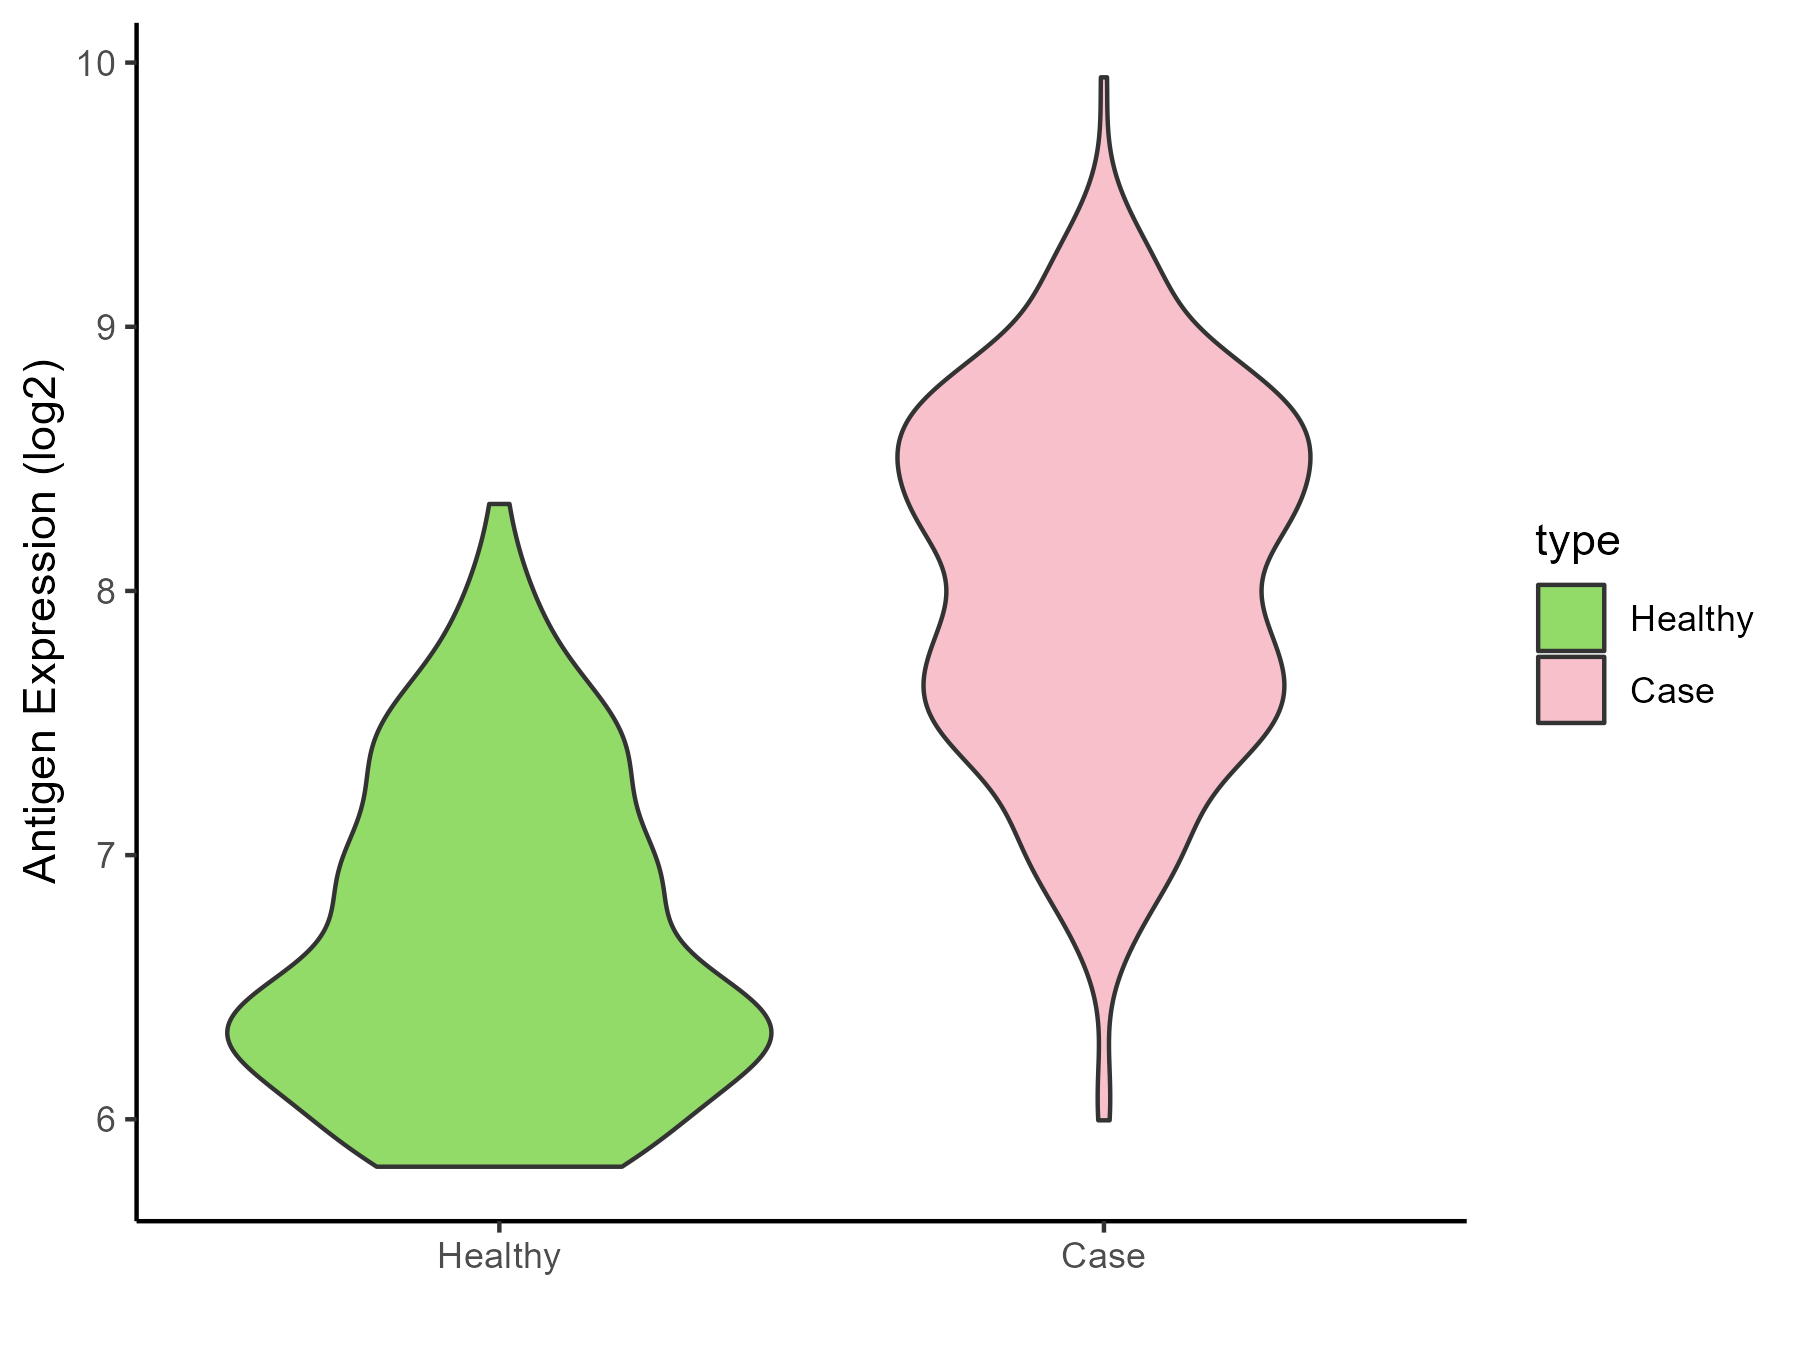
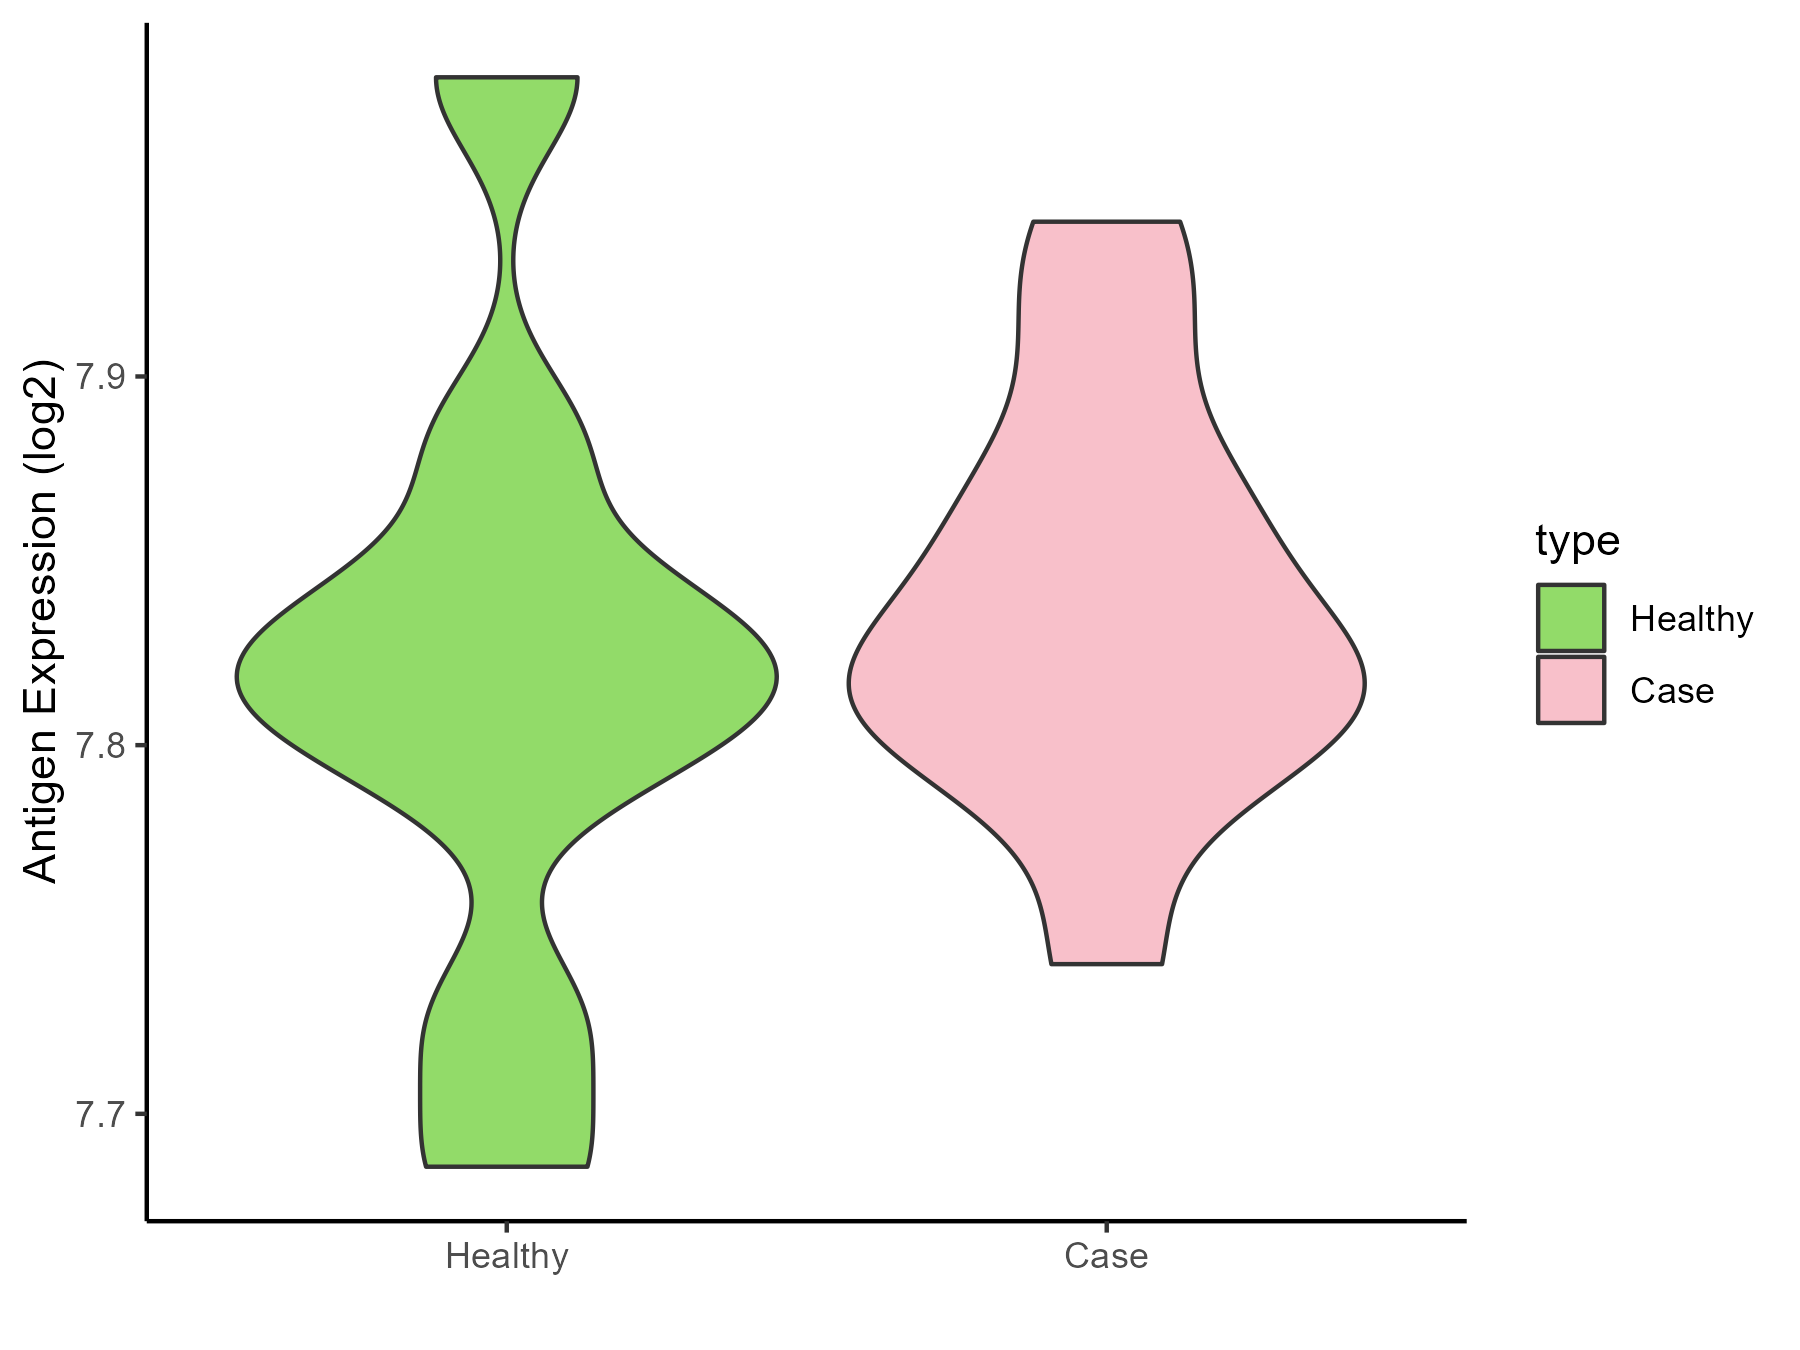
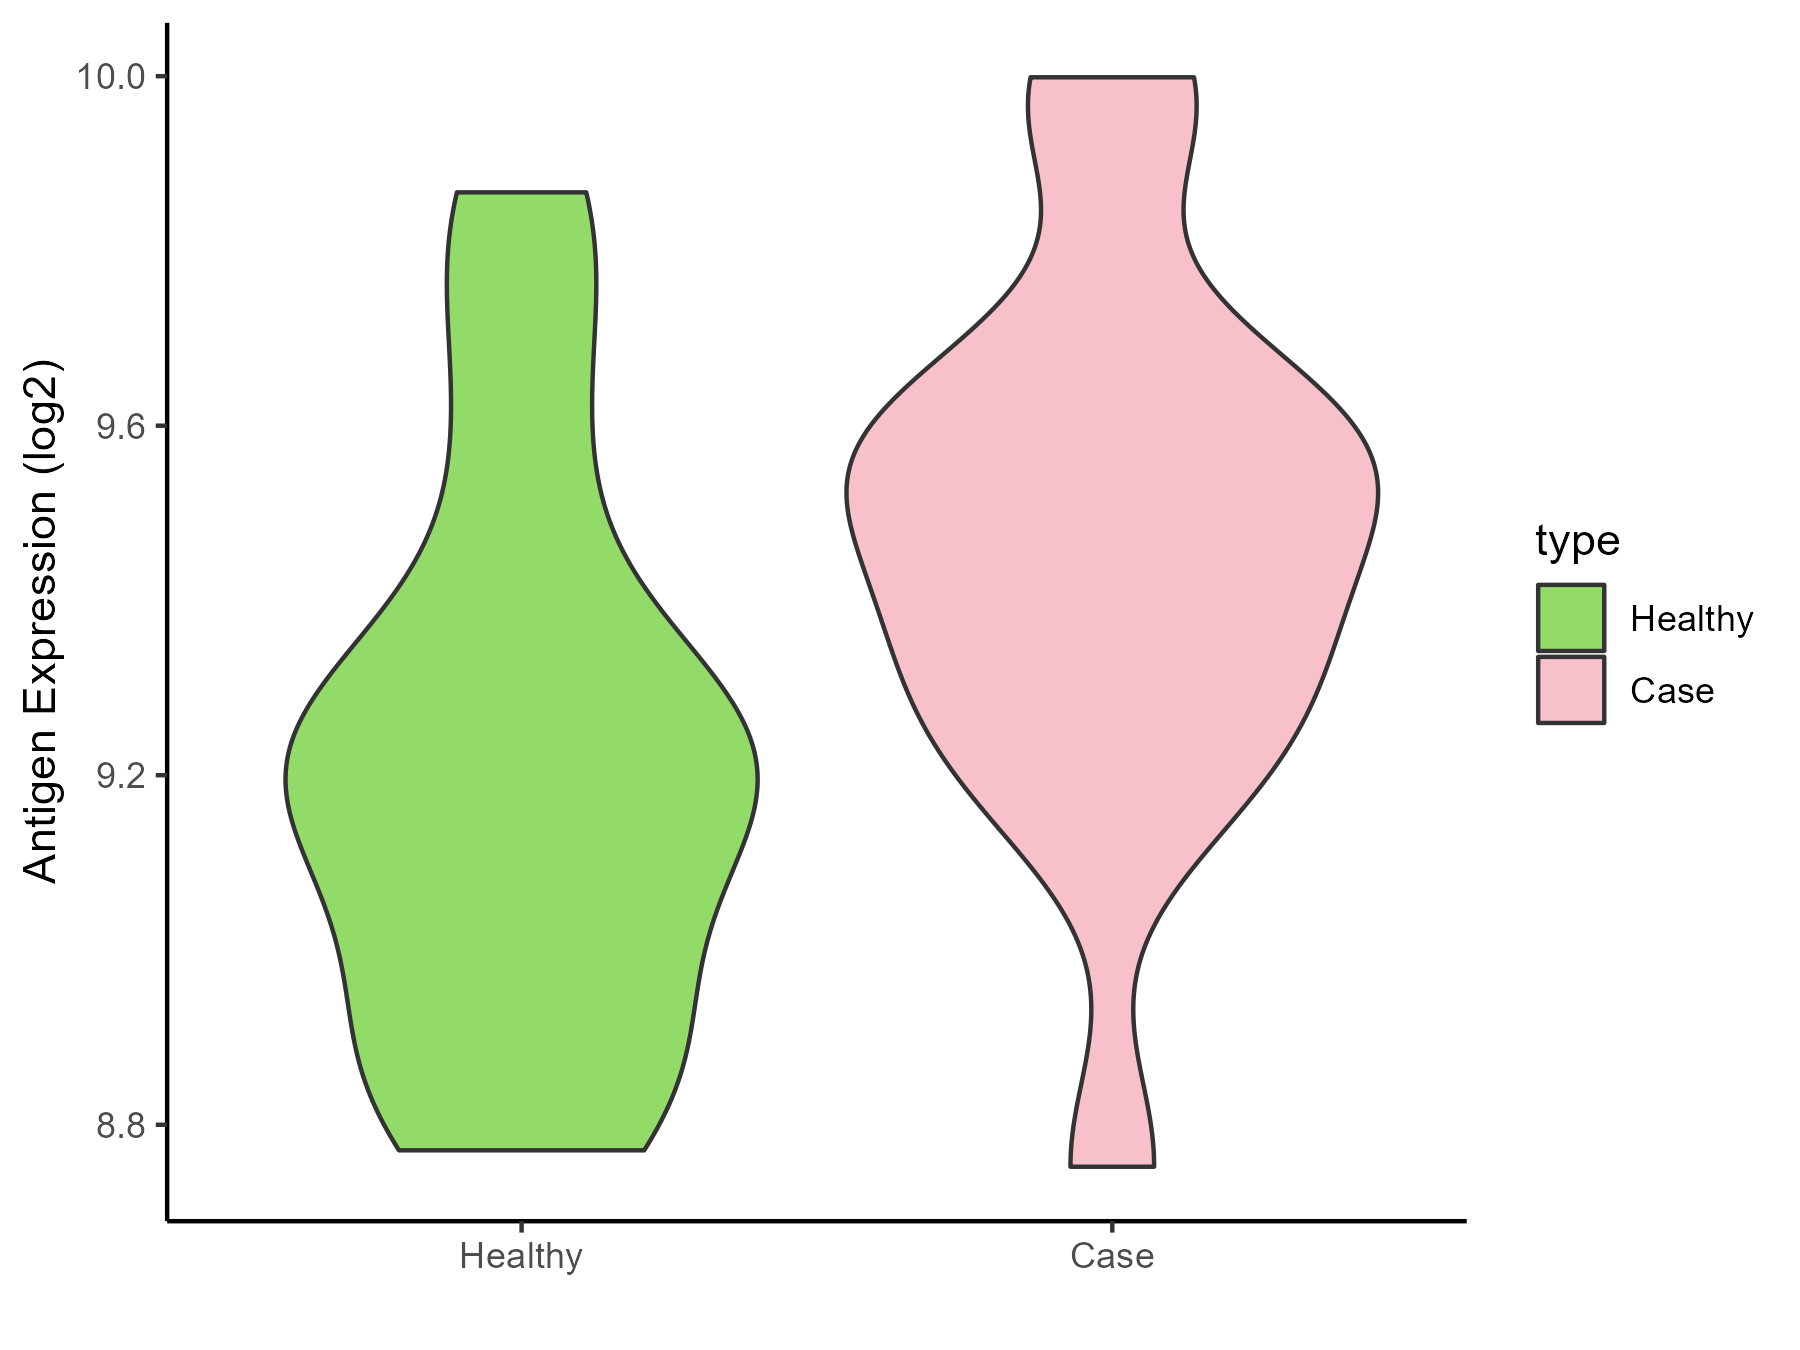
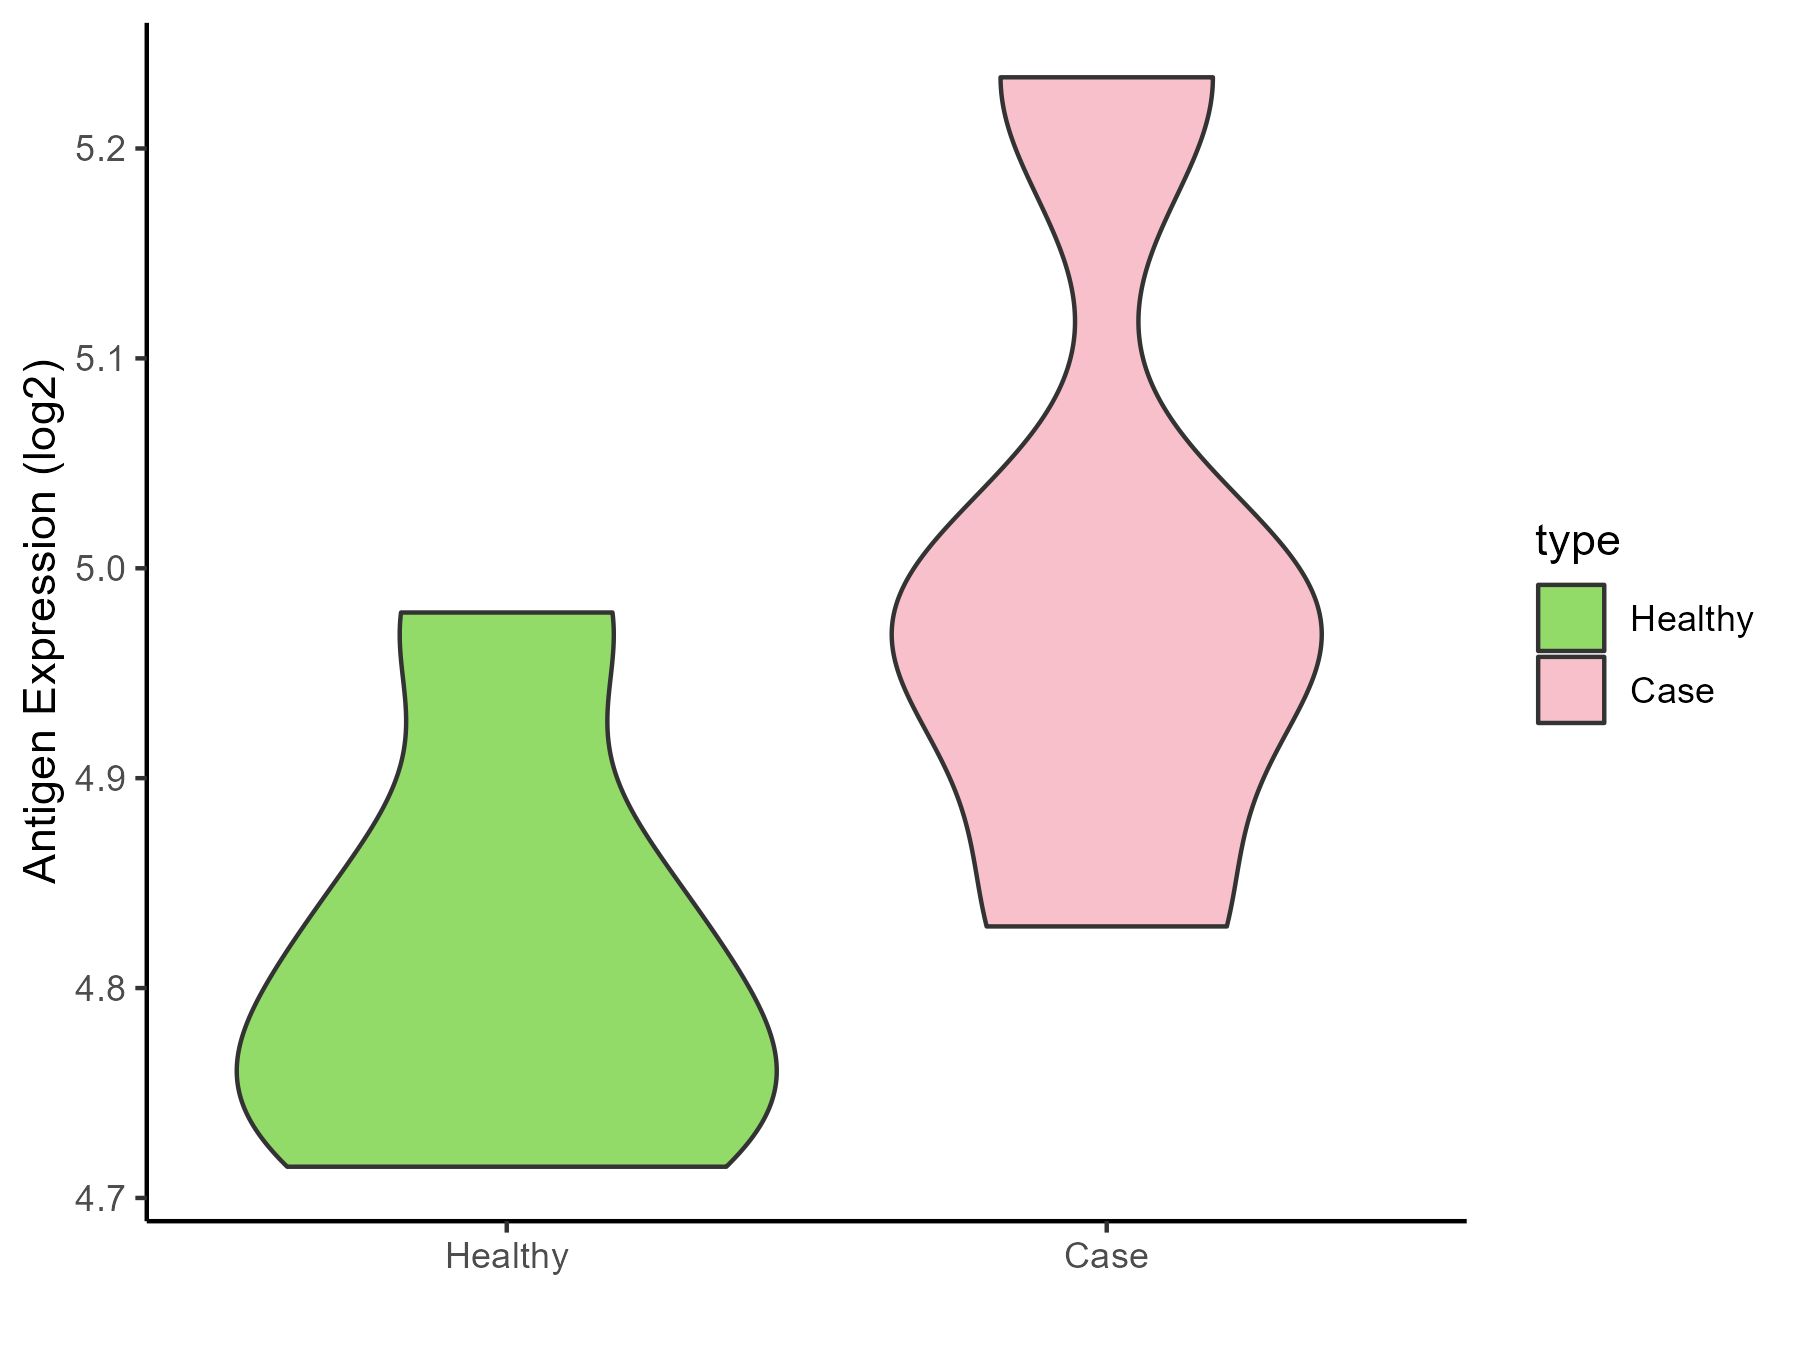
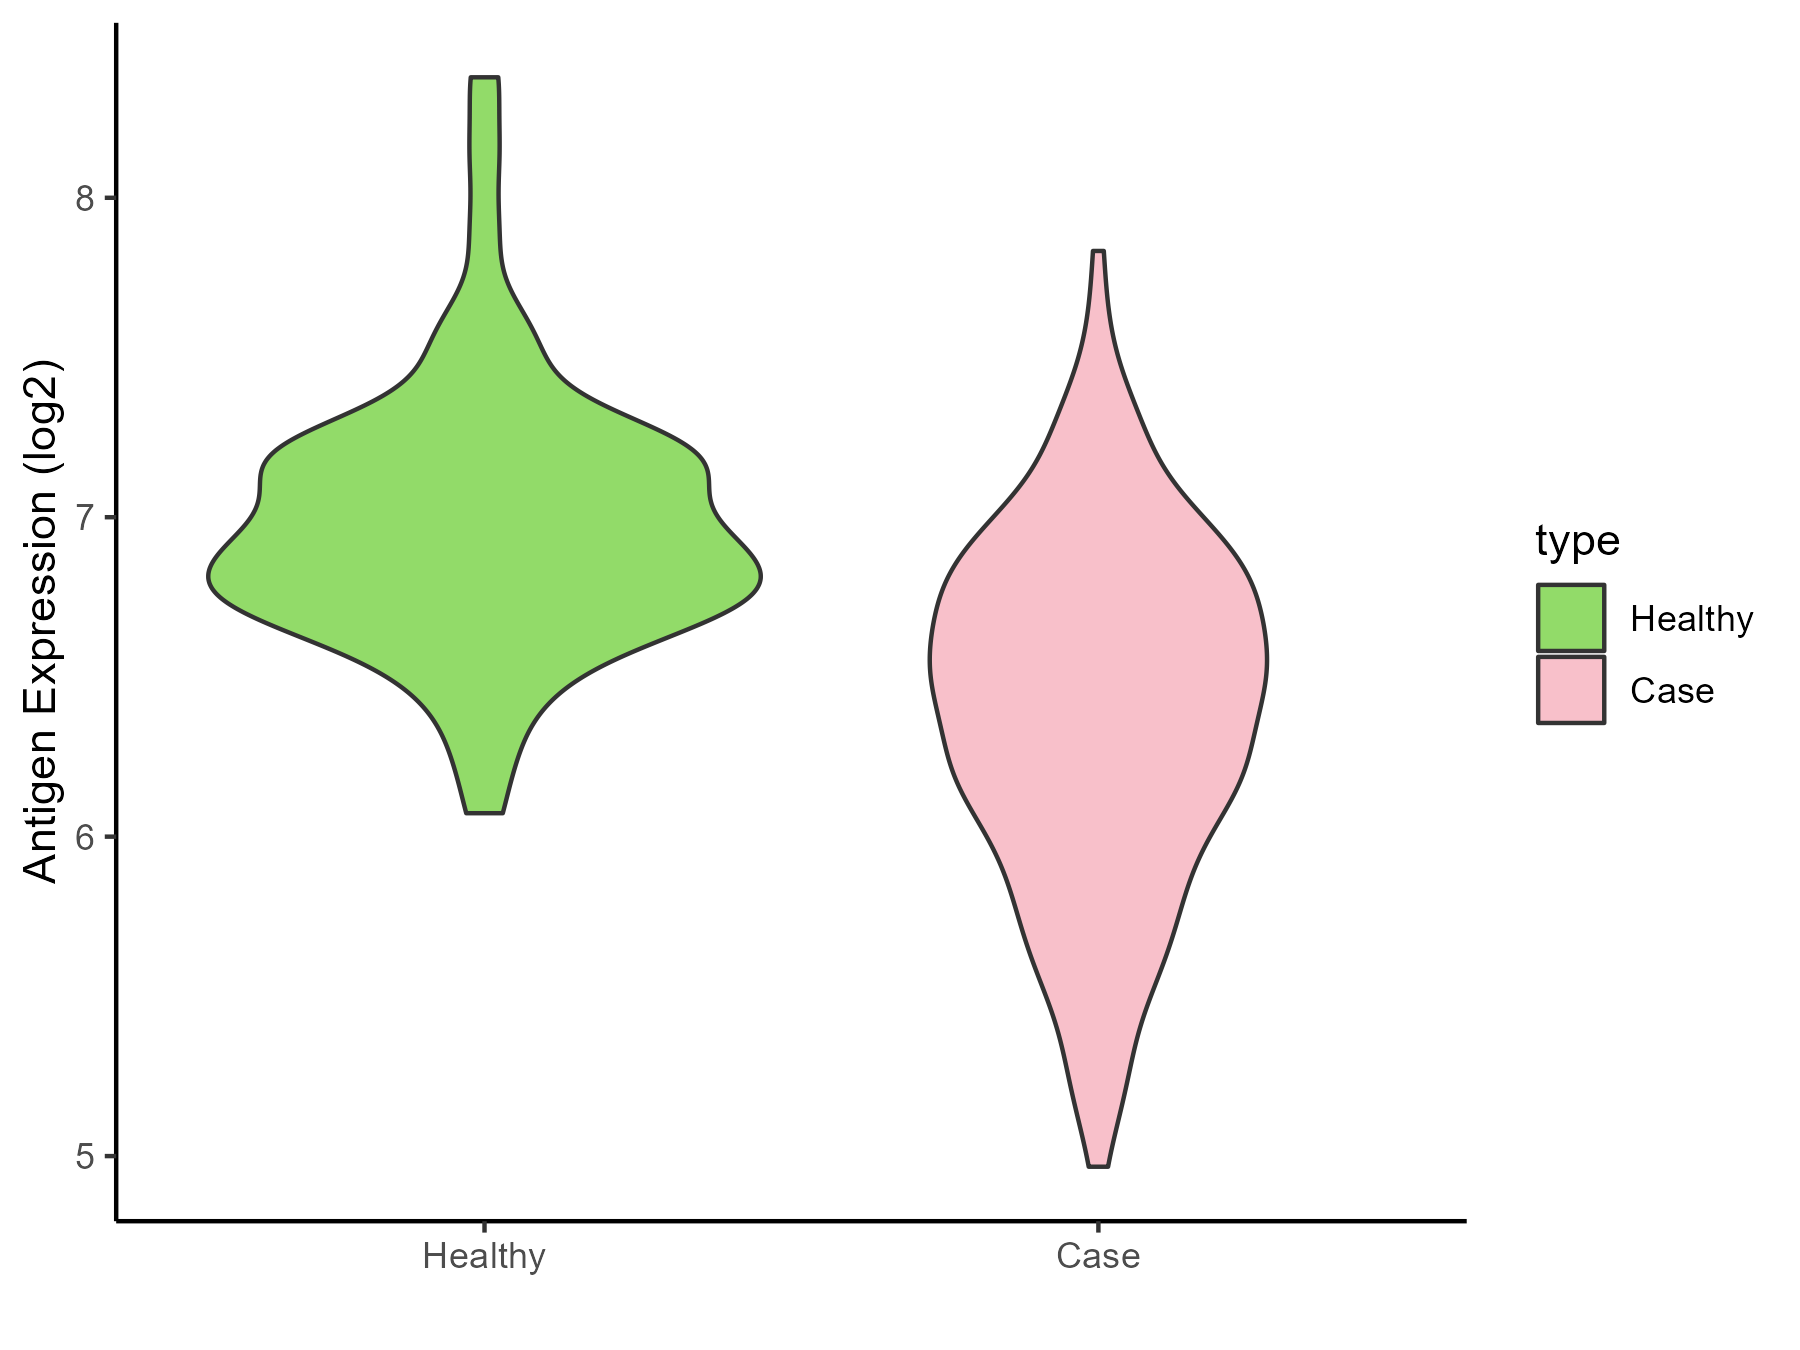
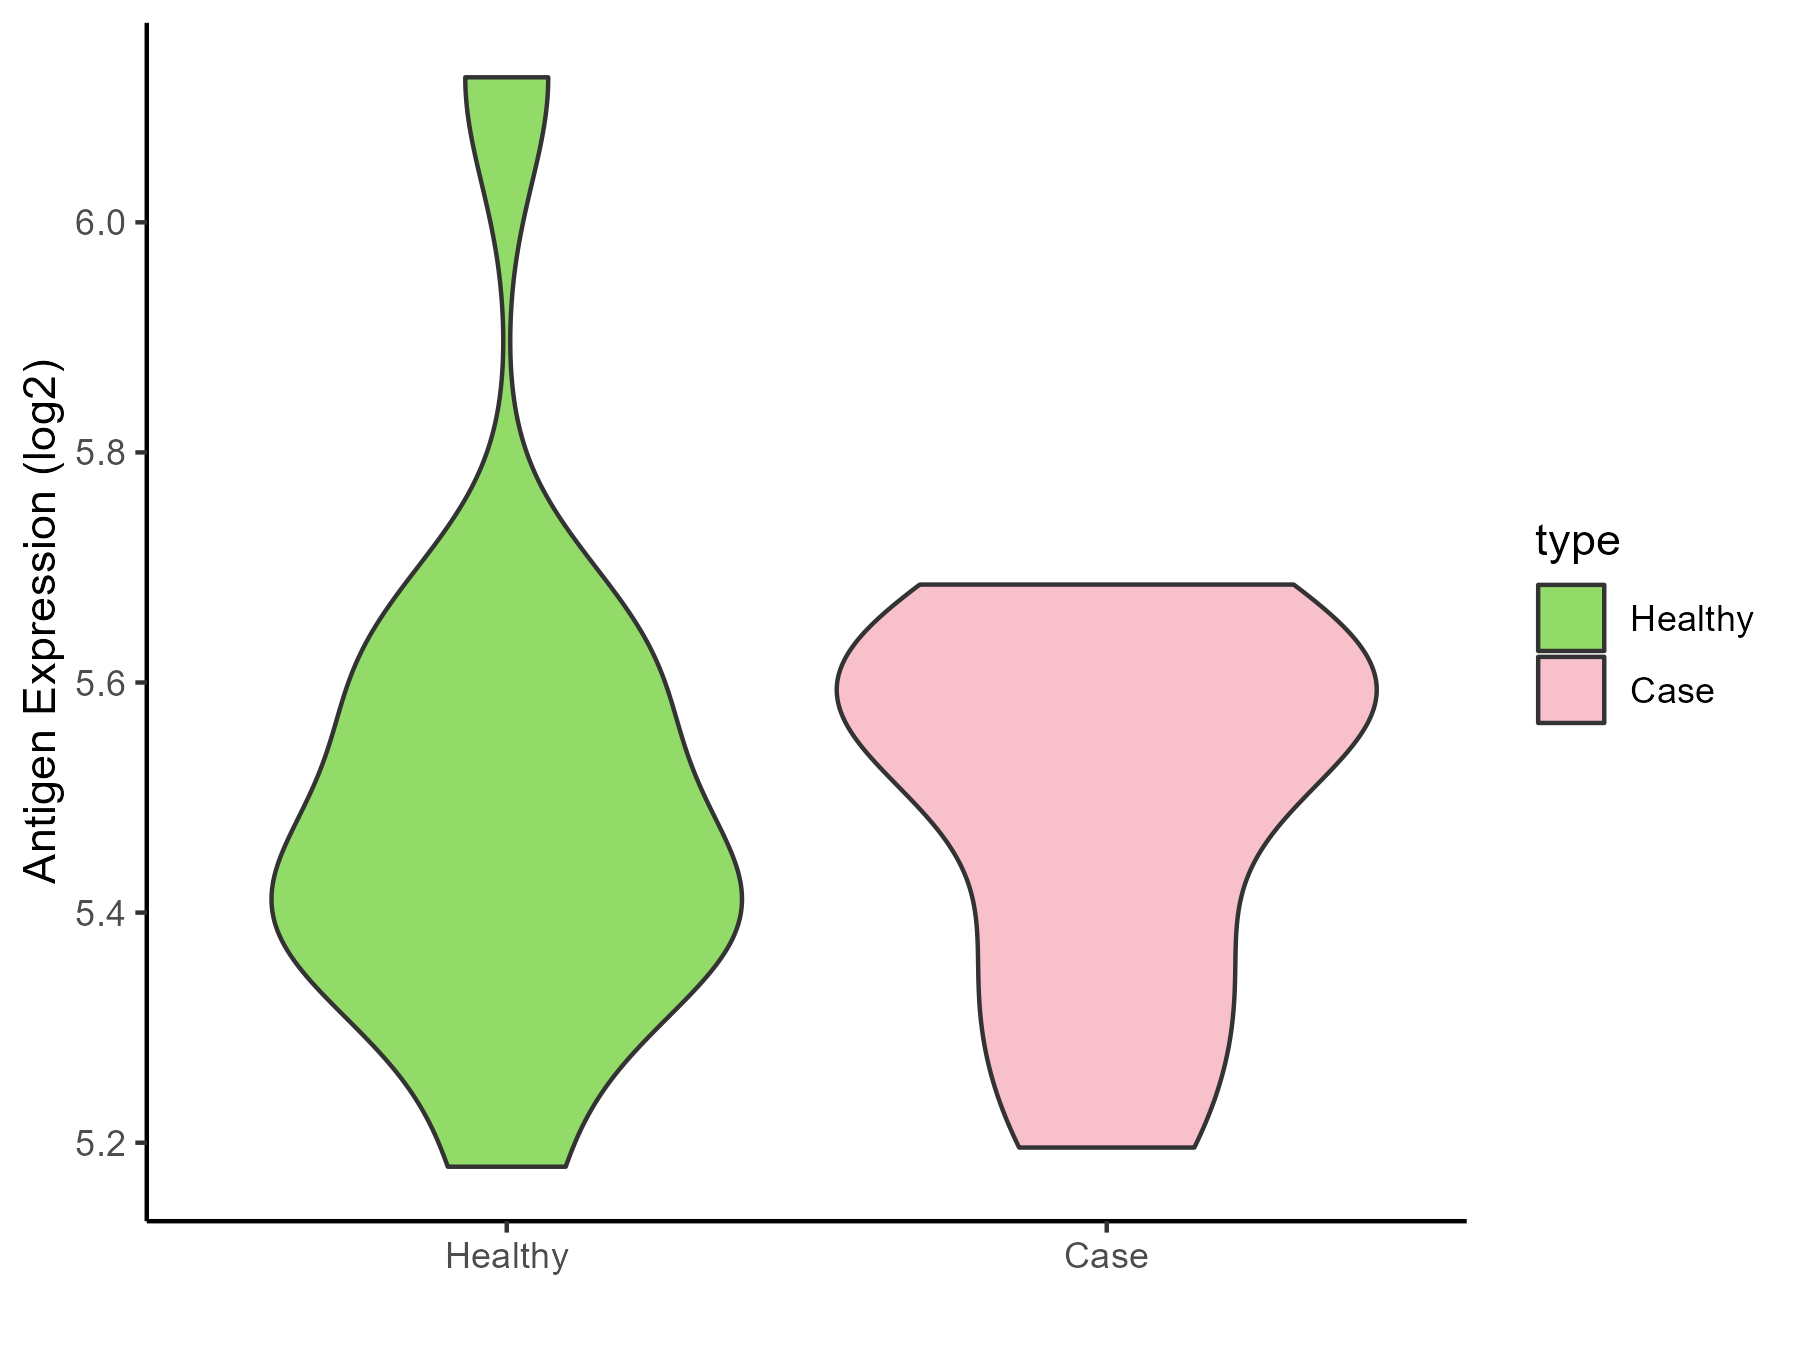
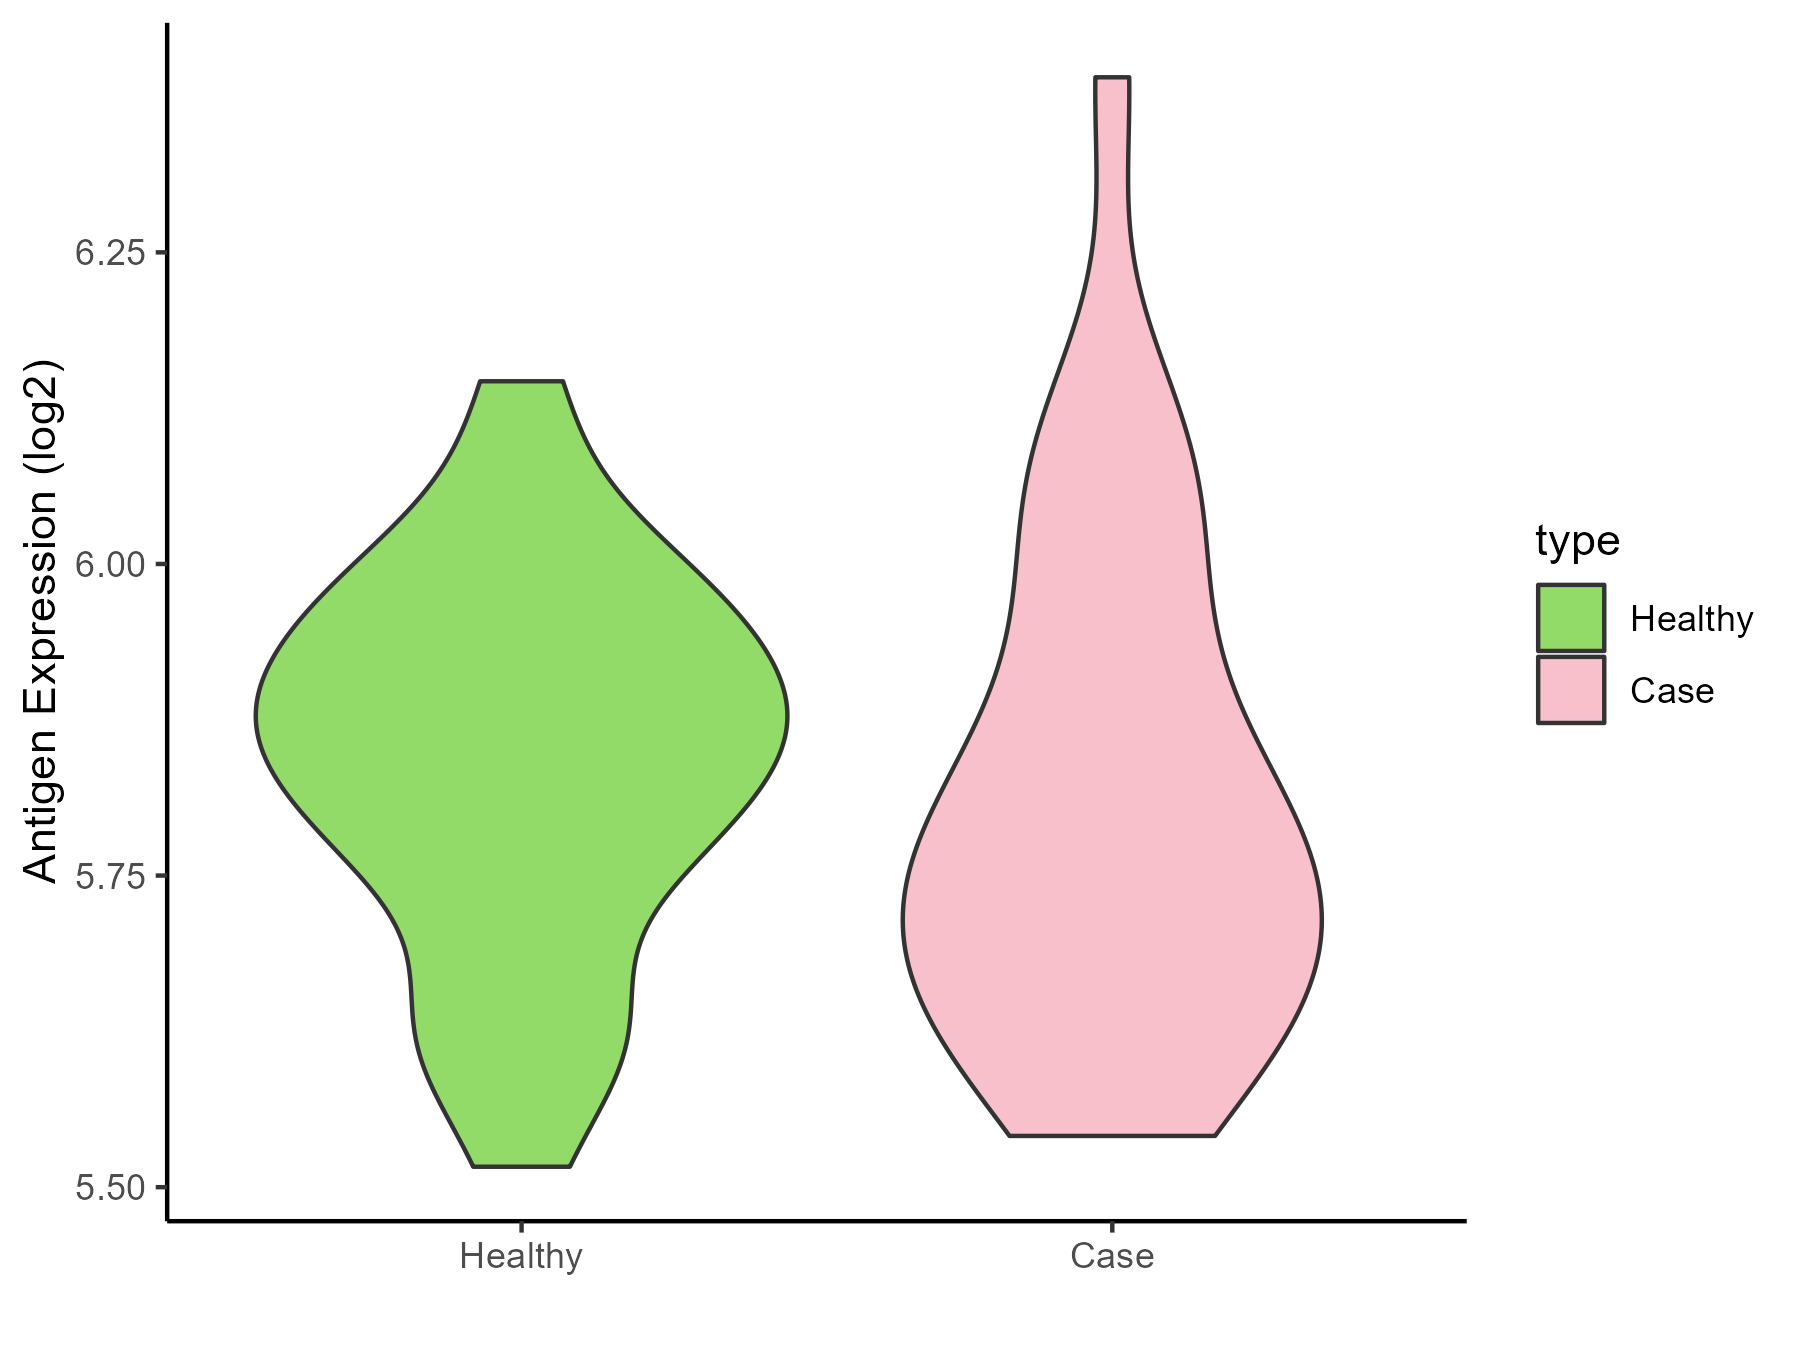
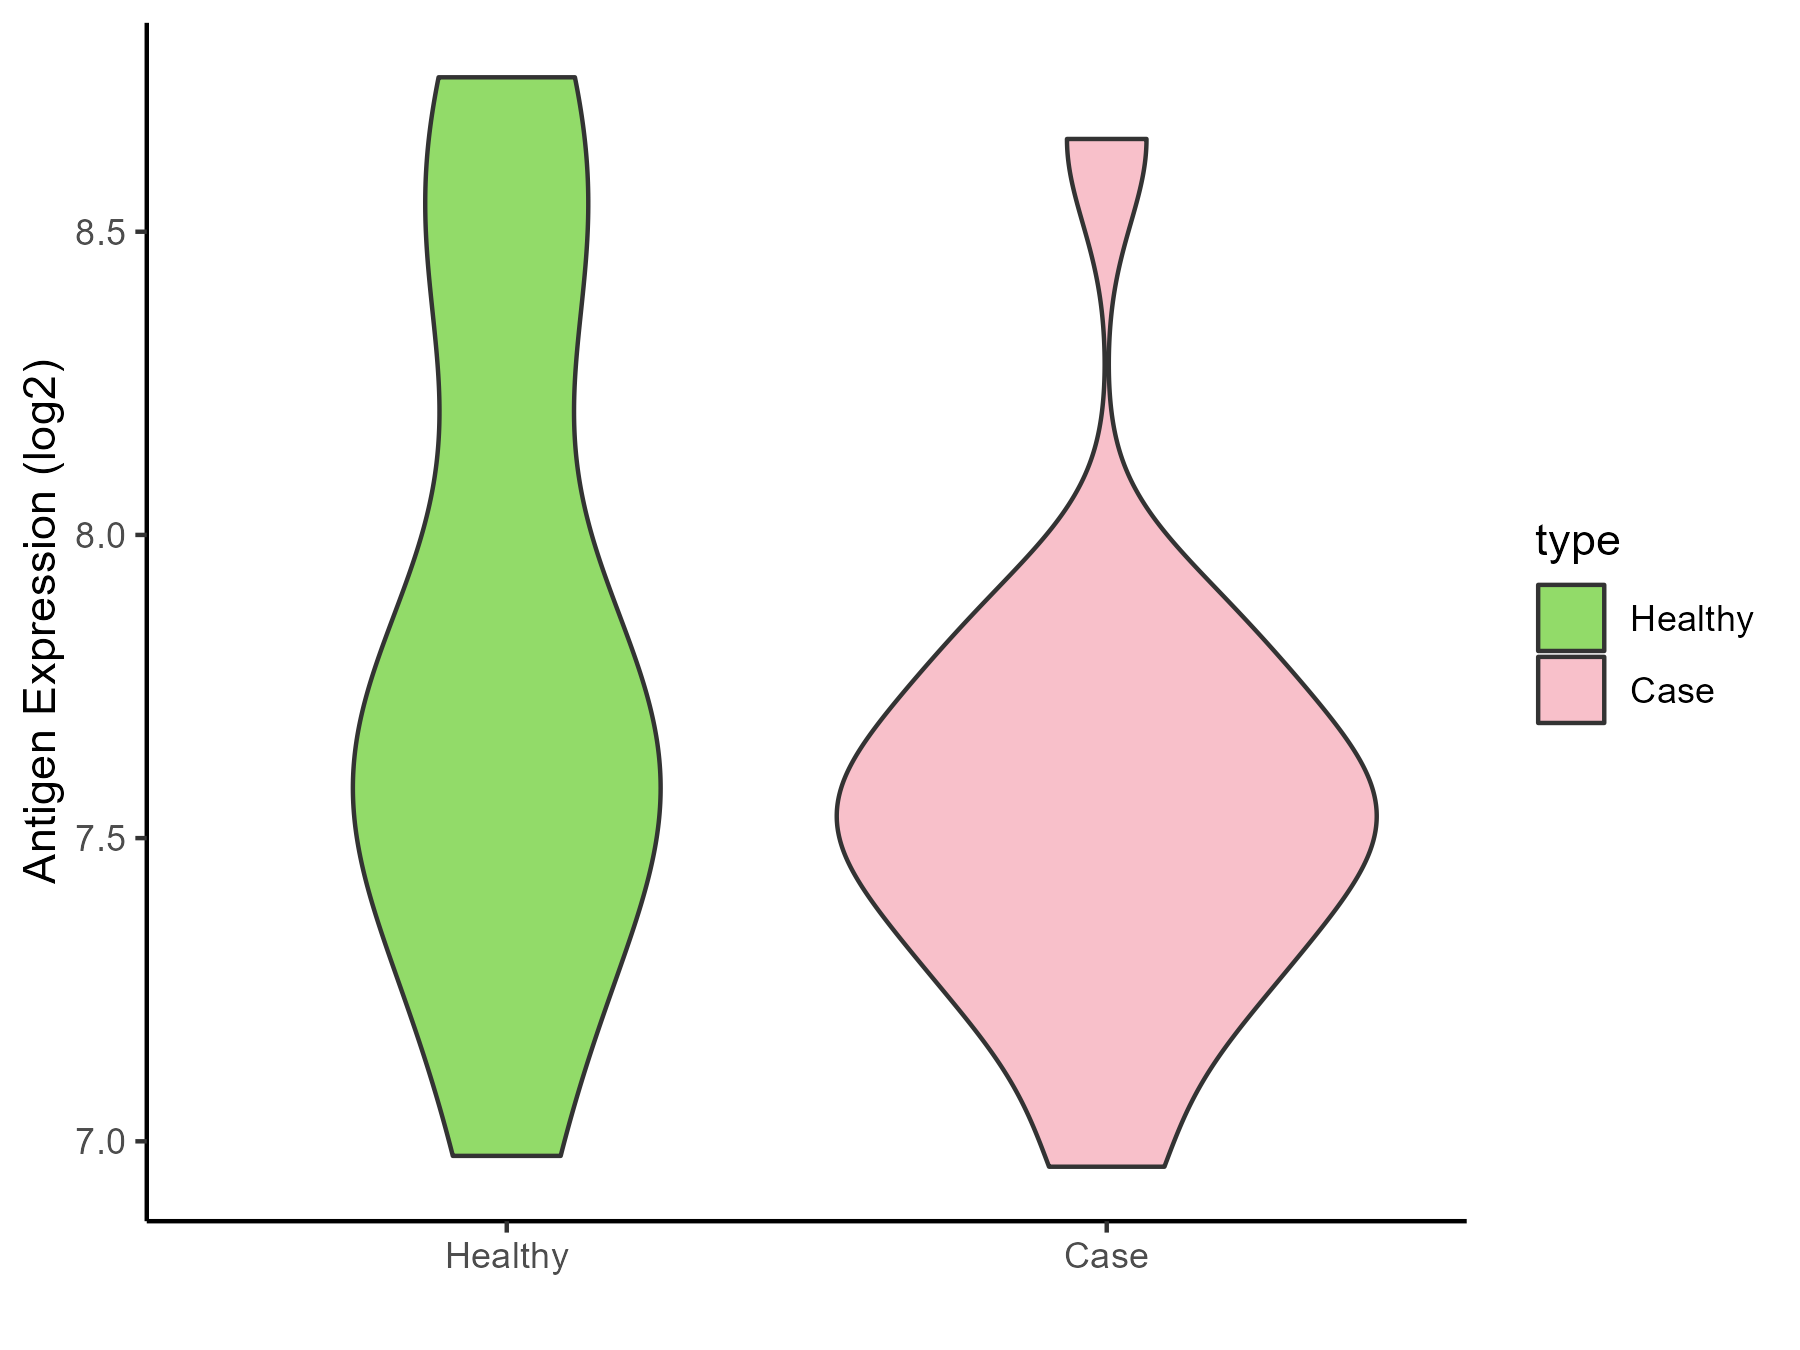
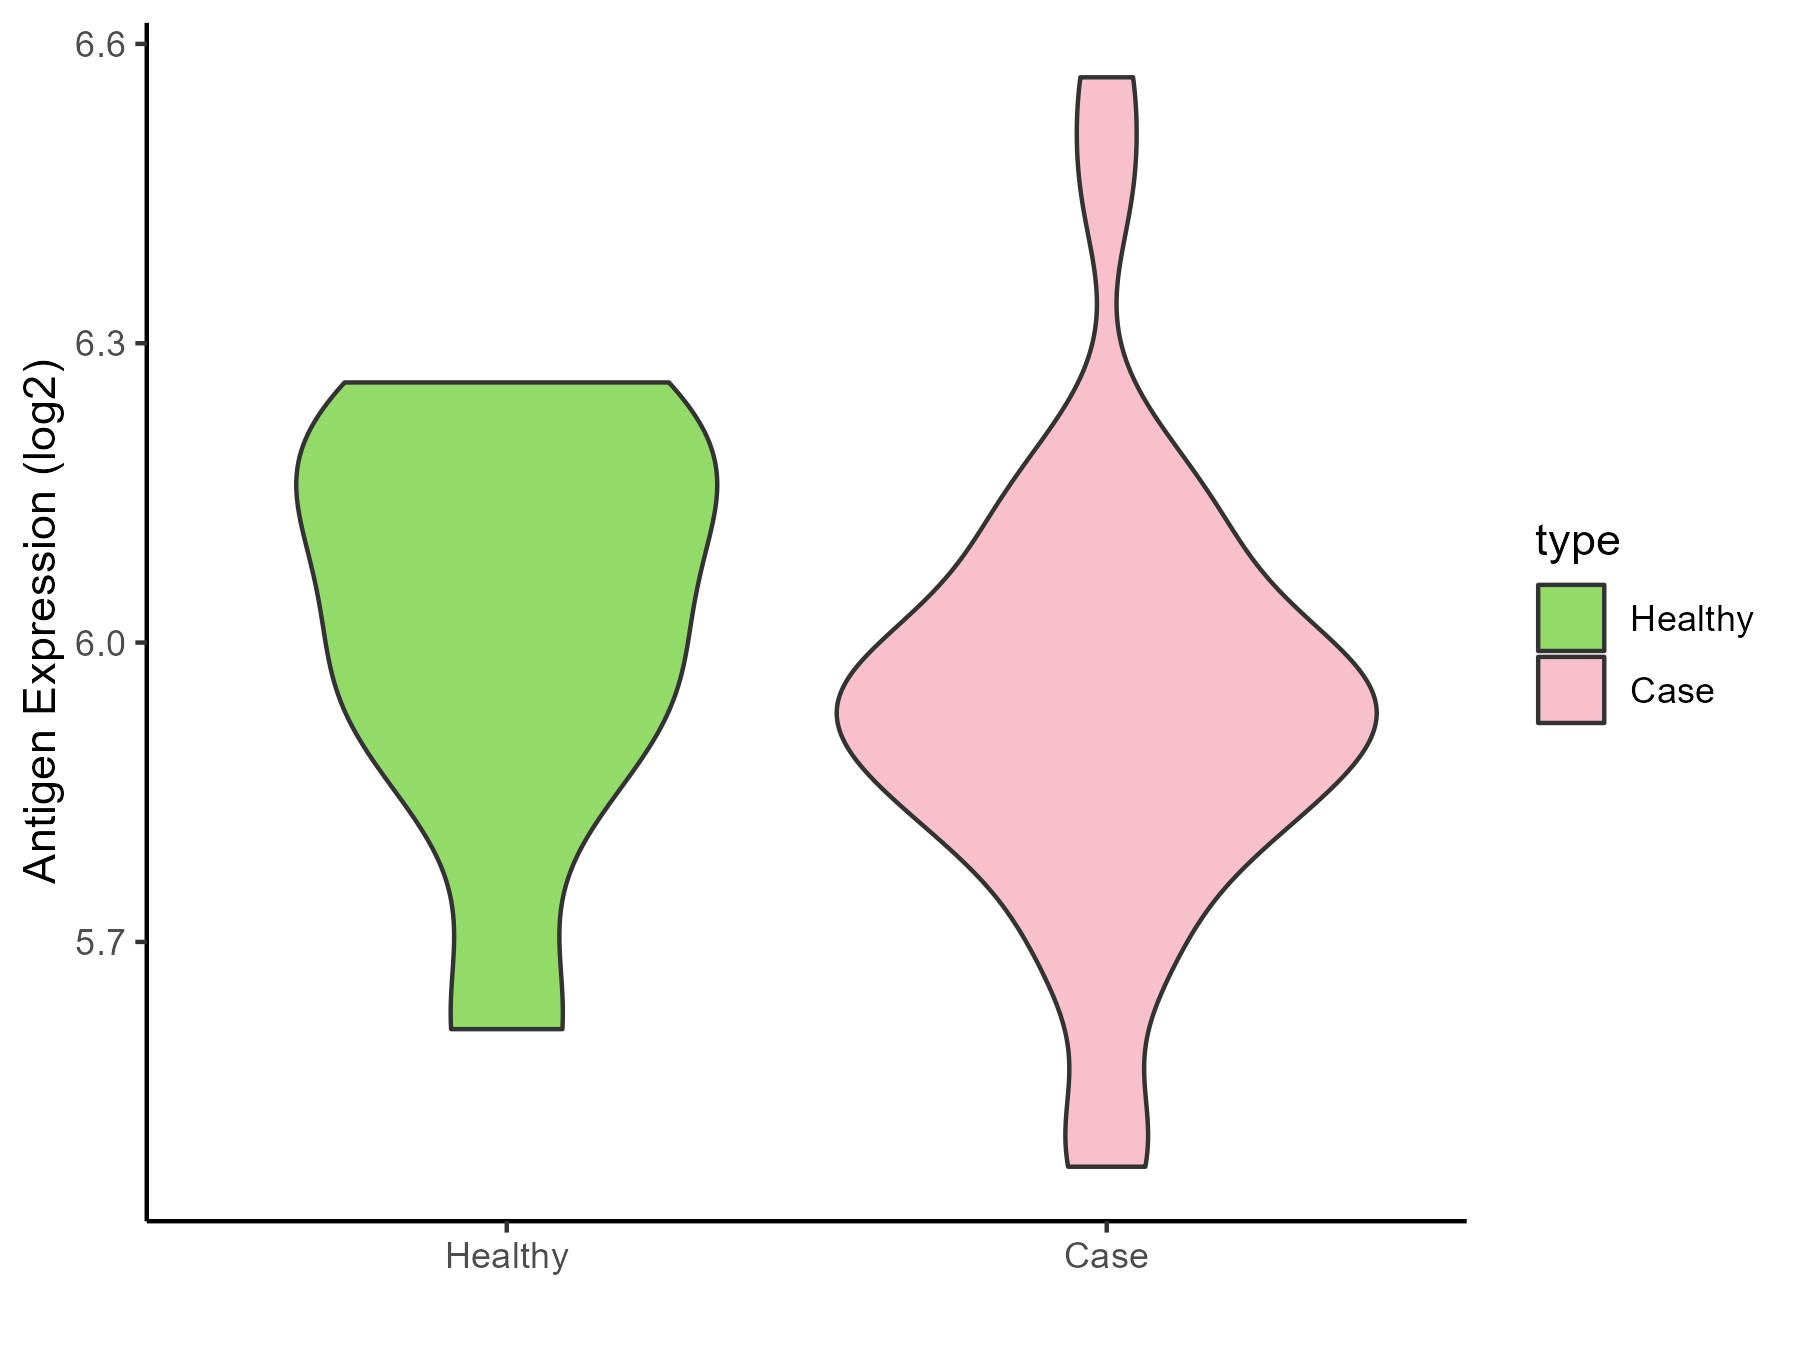
Brainstem |
| The Specific Disease |
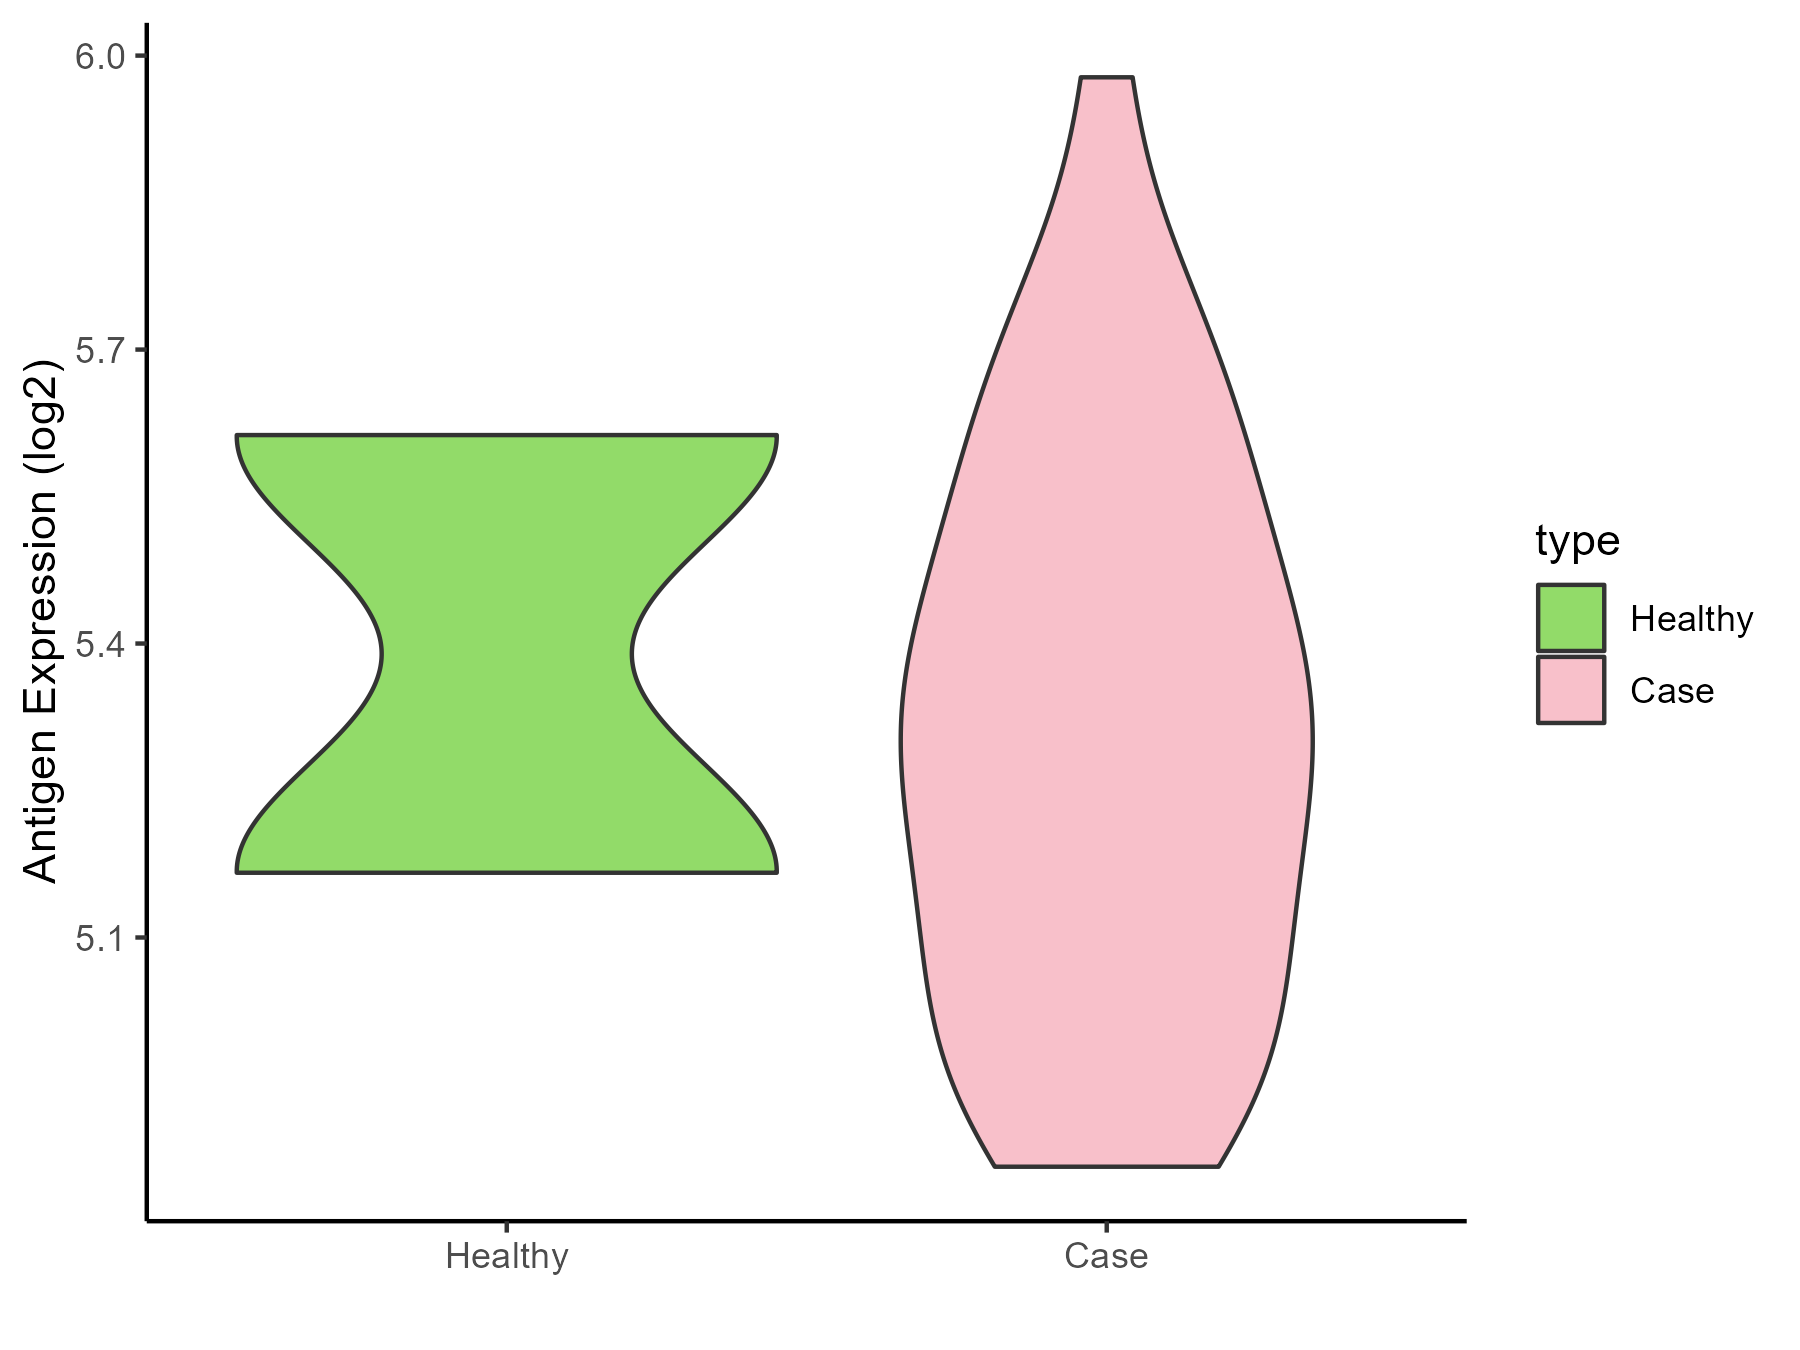
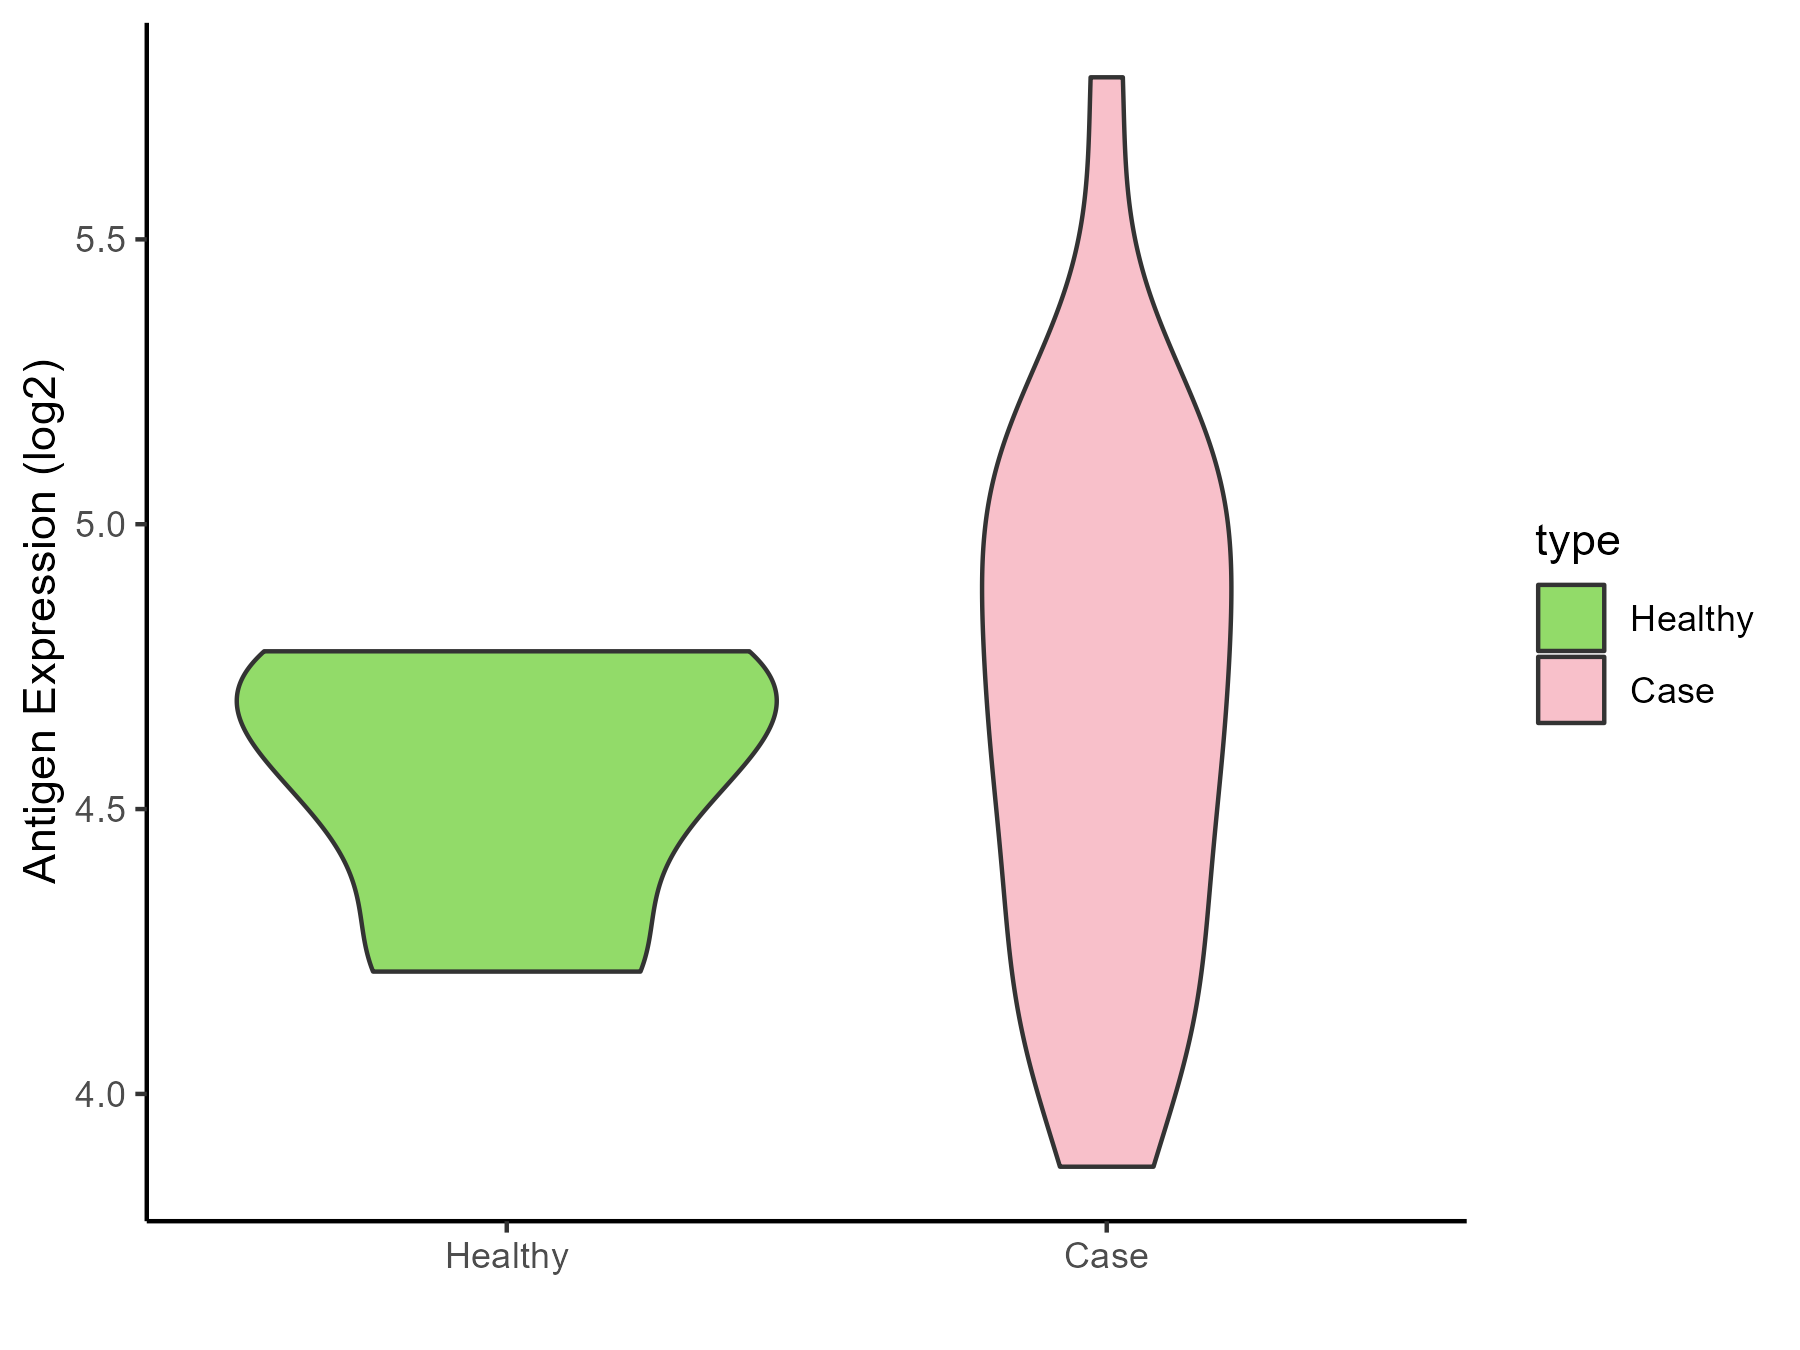
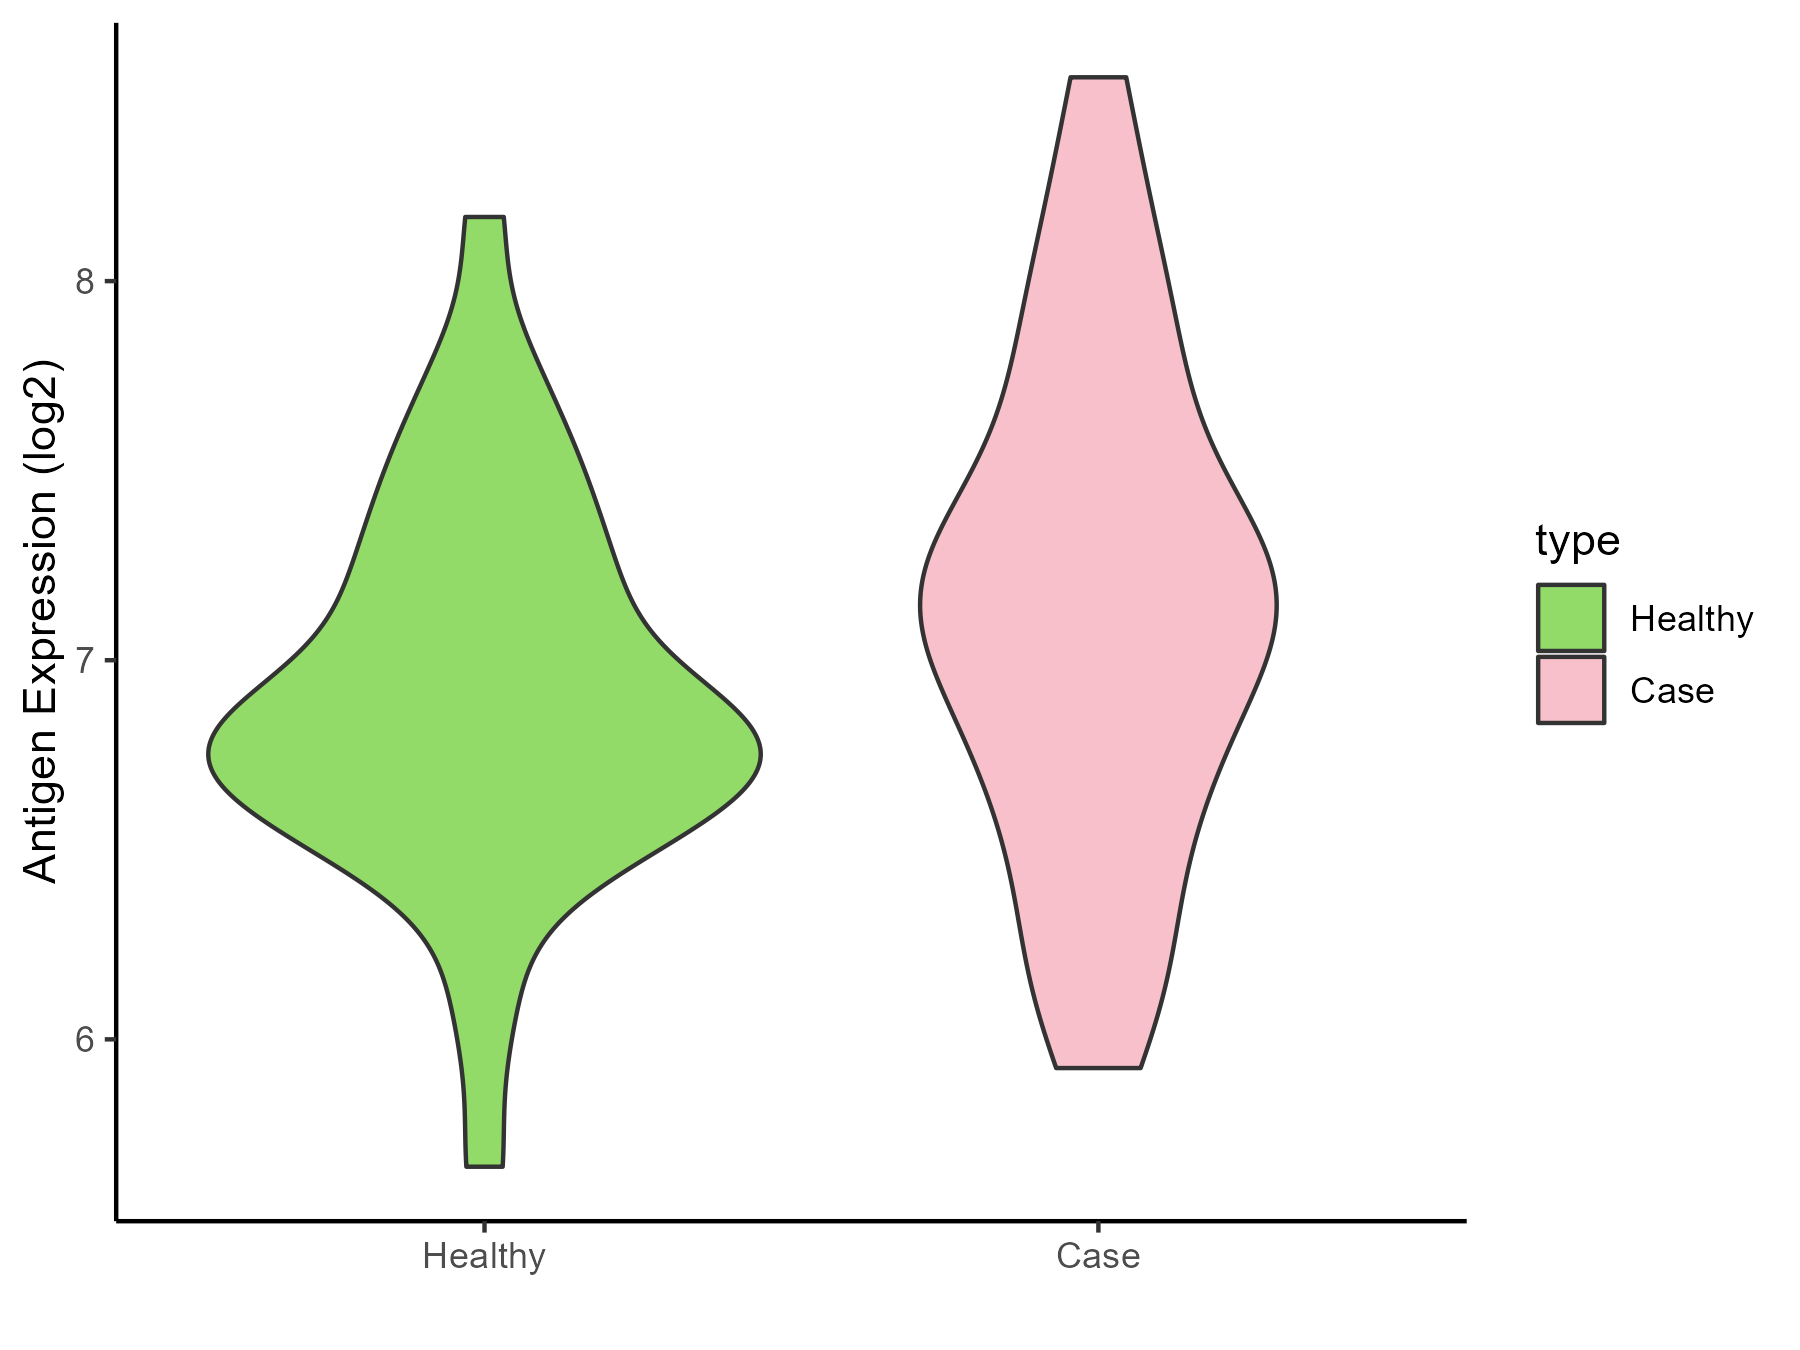
Glioma |
| The Expression Level of Disease Section Compare with the Healthy Individual Tissue |
p-value: 0.776450265;
Fold-change: -0.081856853;
Z-score: -0.259182348
|
| Disease-specific Antigen Abundances |
|
Click to View the Clearer Original Diagram
|
|
|
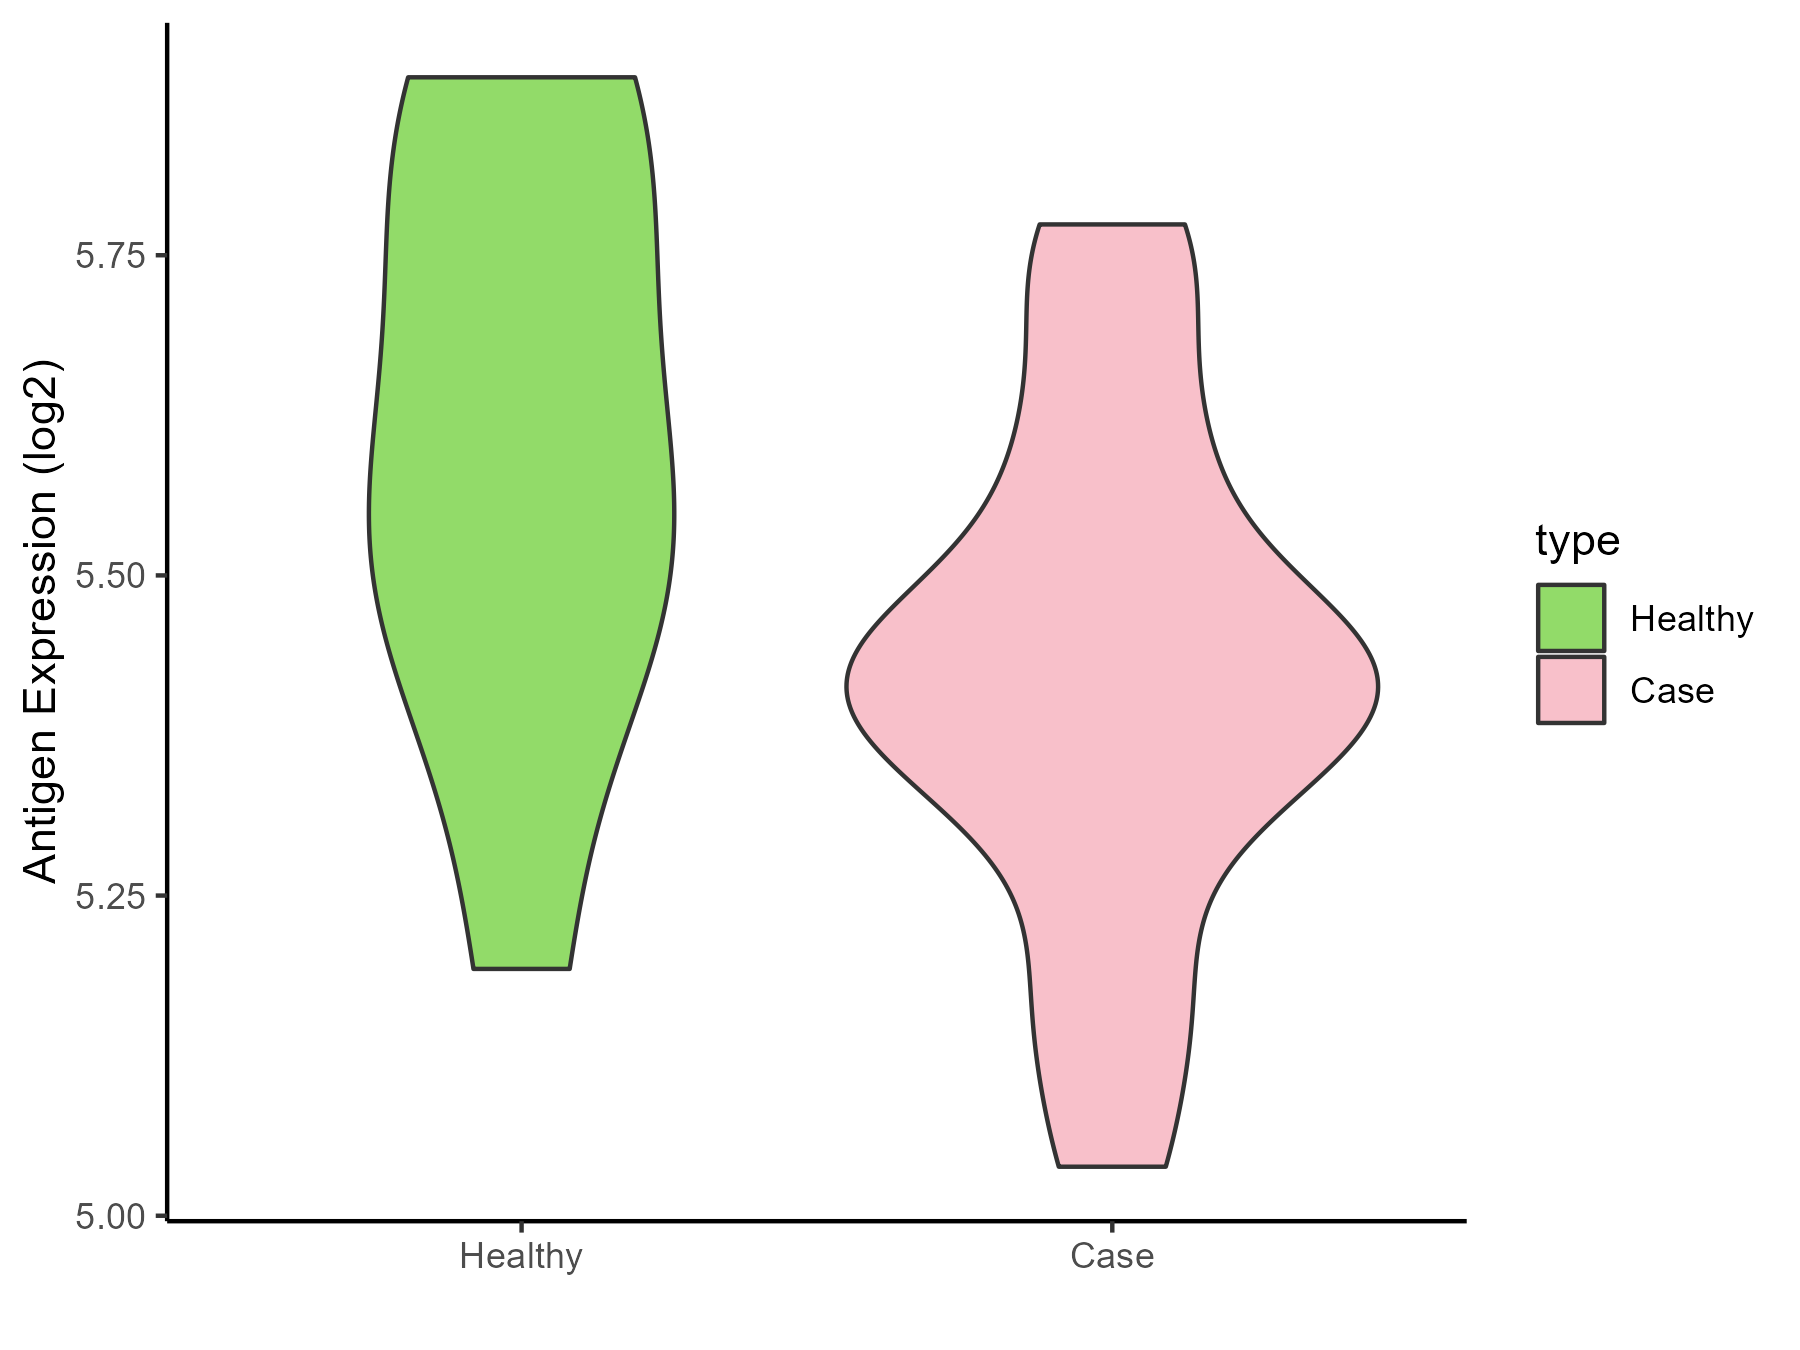
| The Studied Tissue |
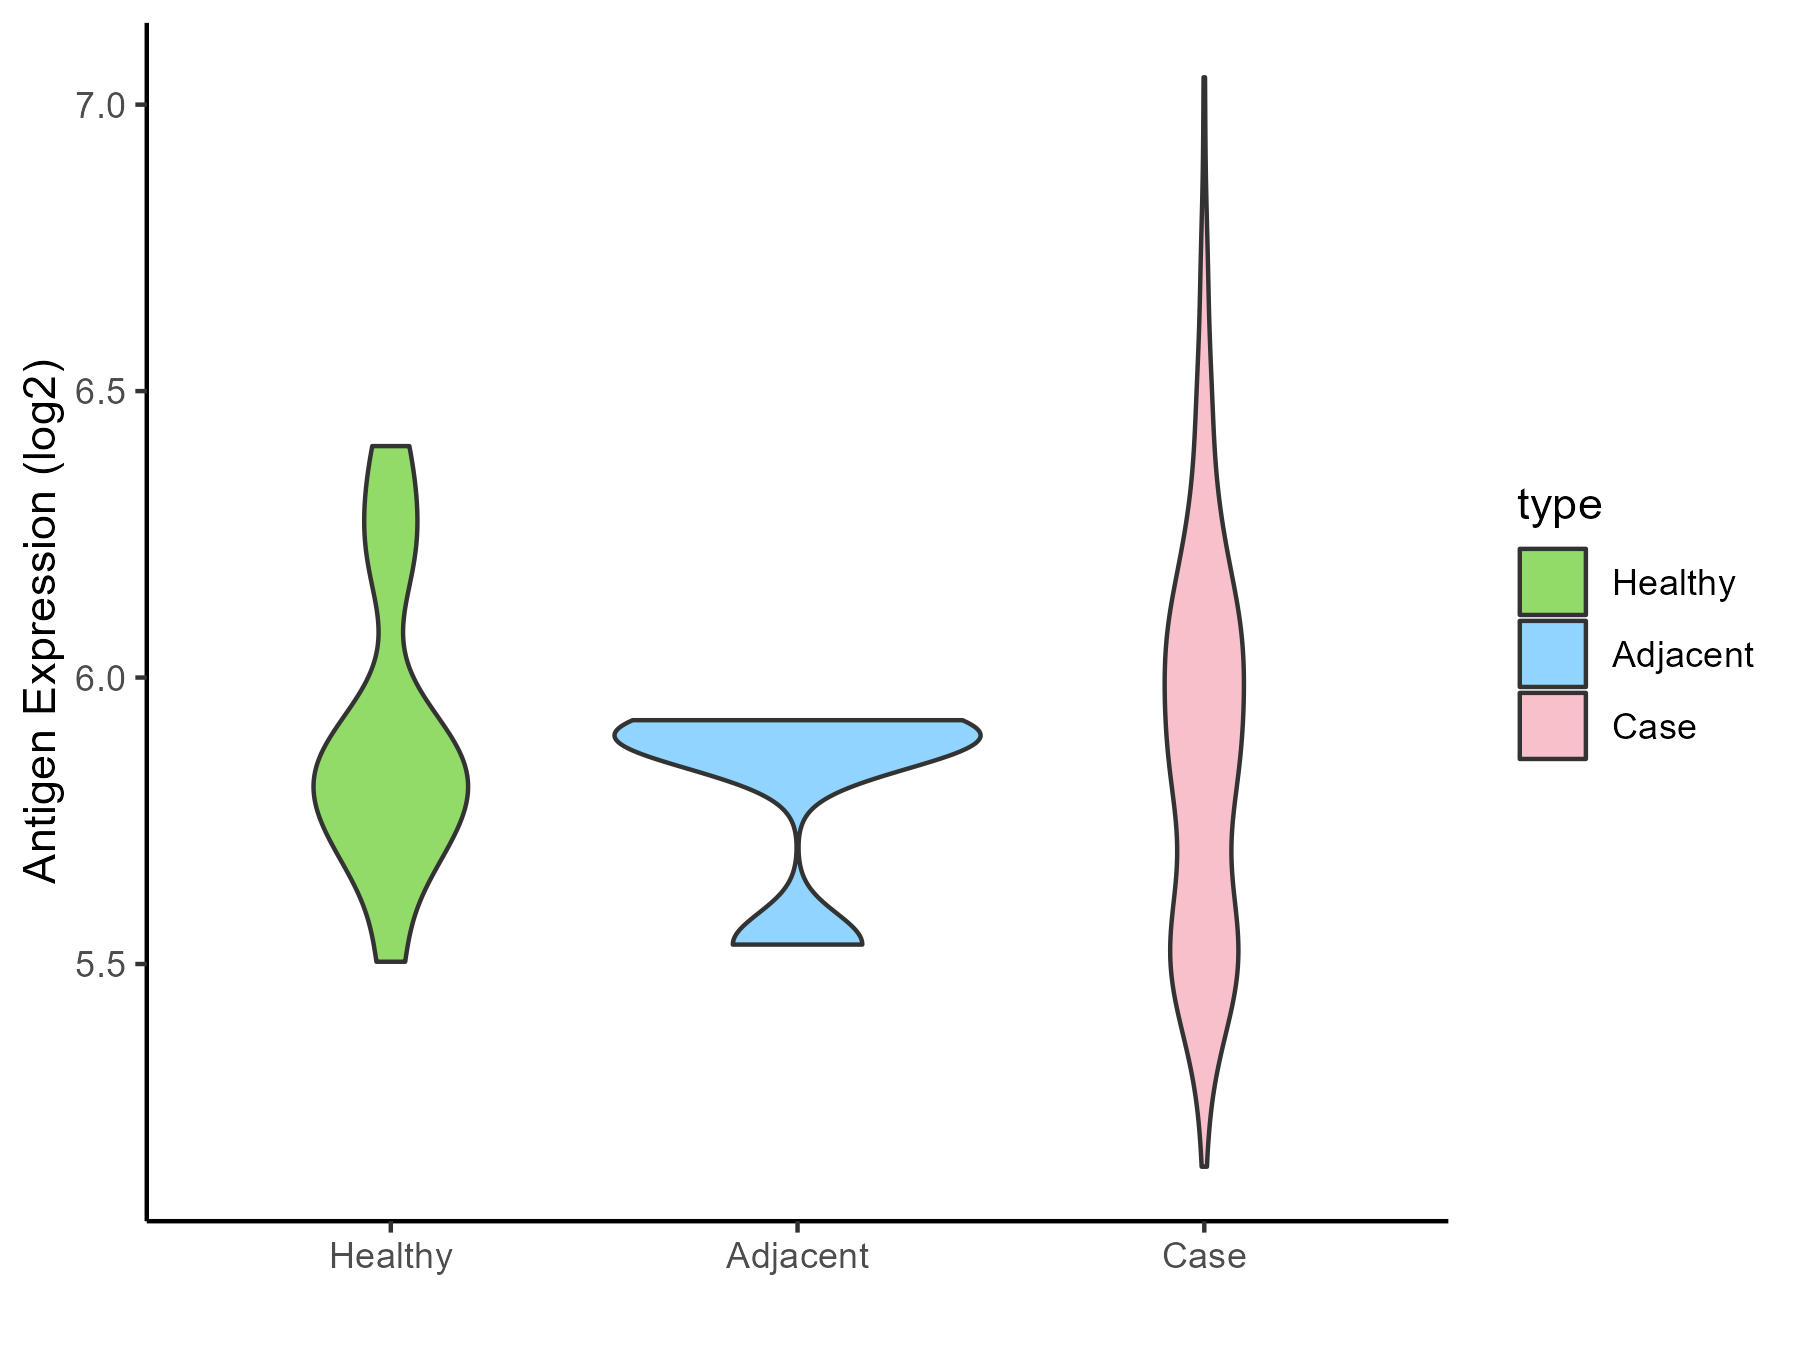
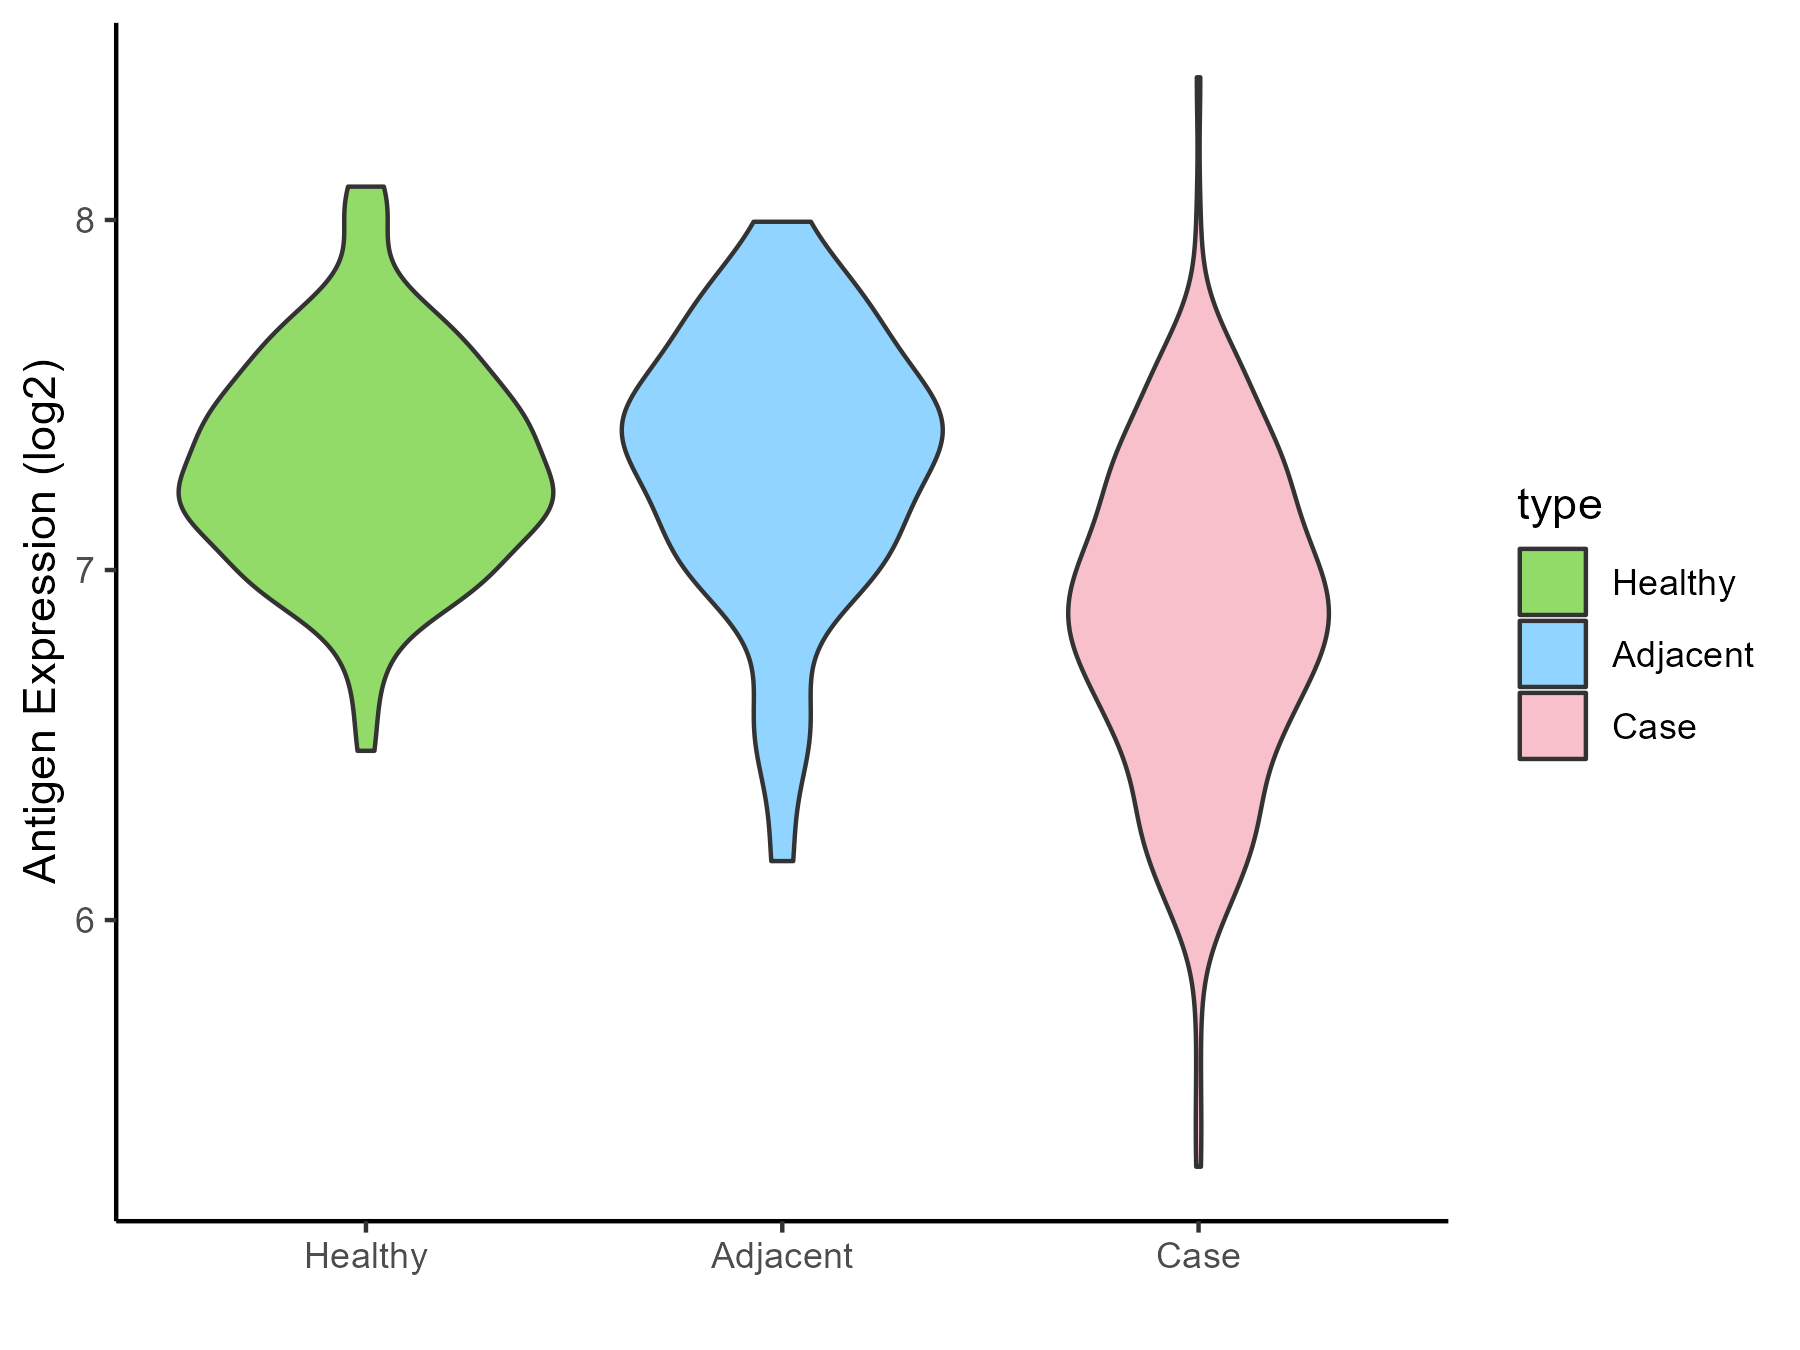
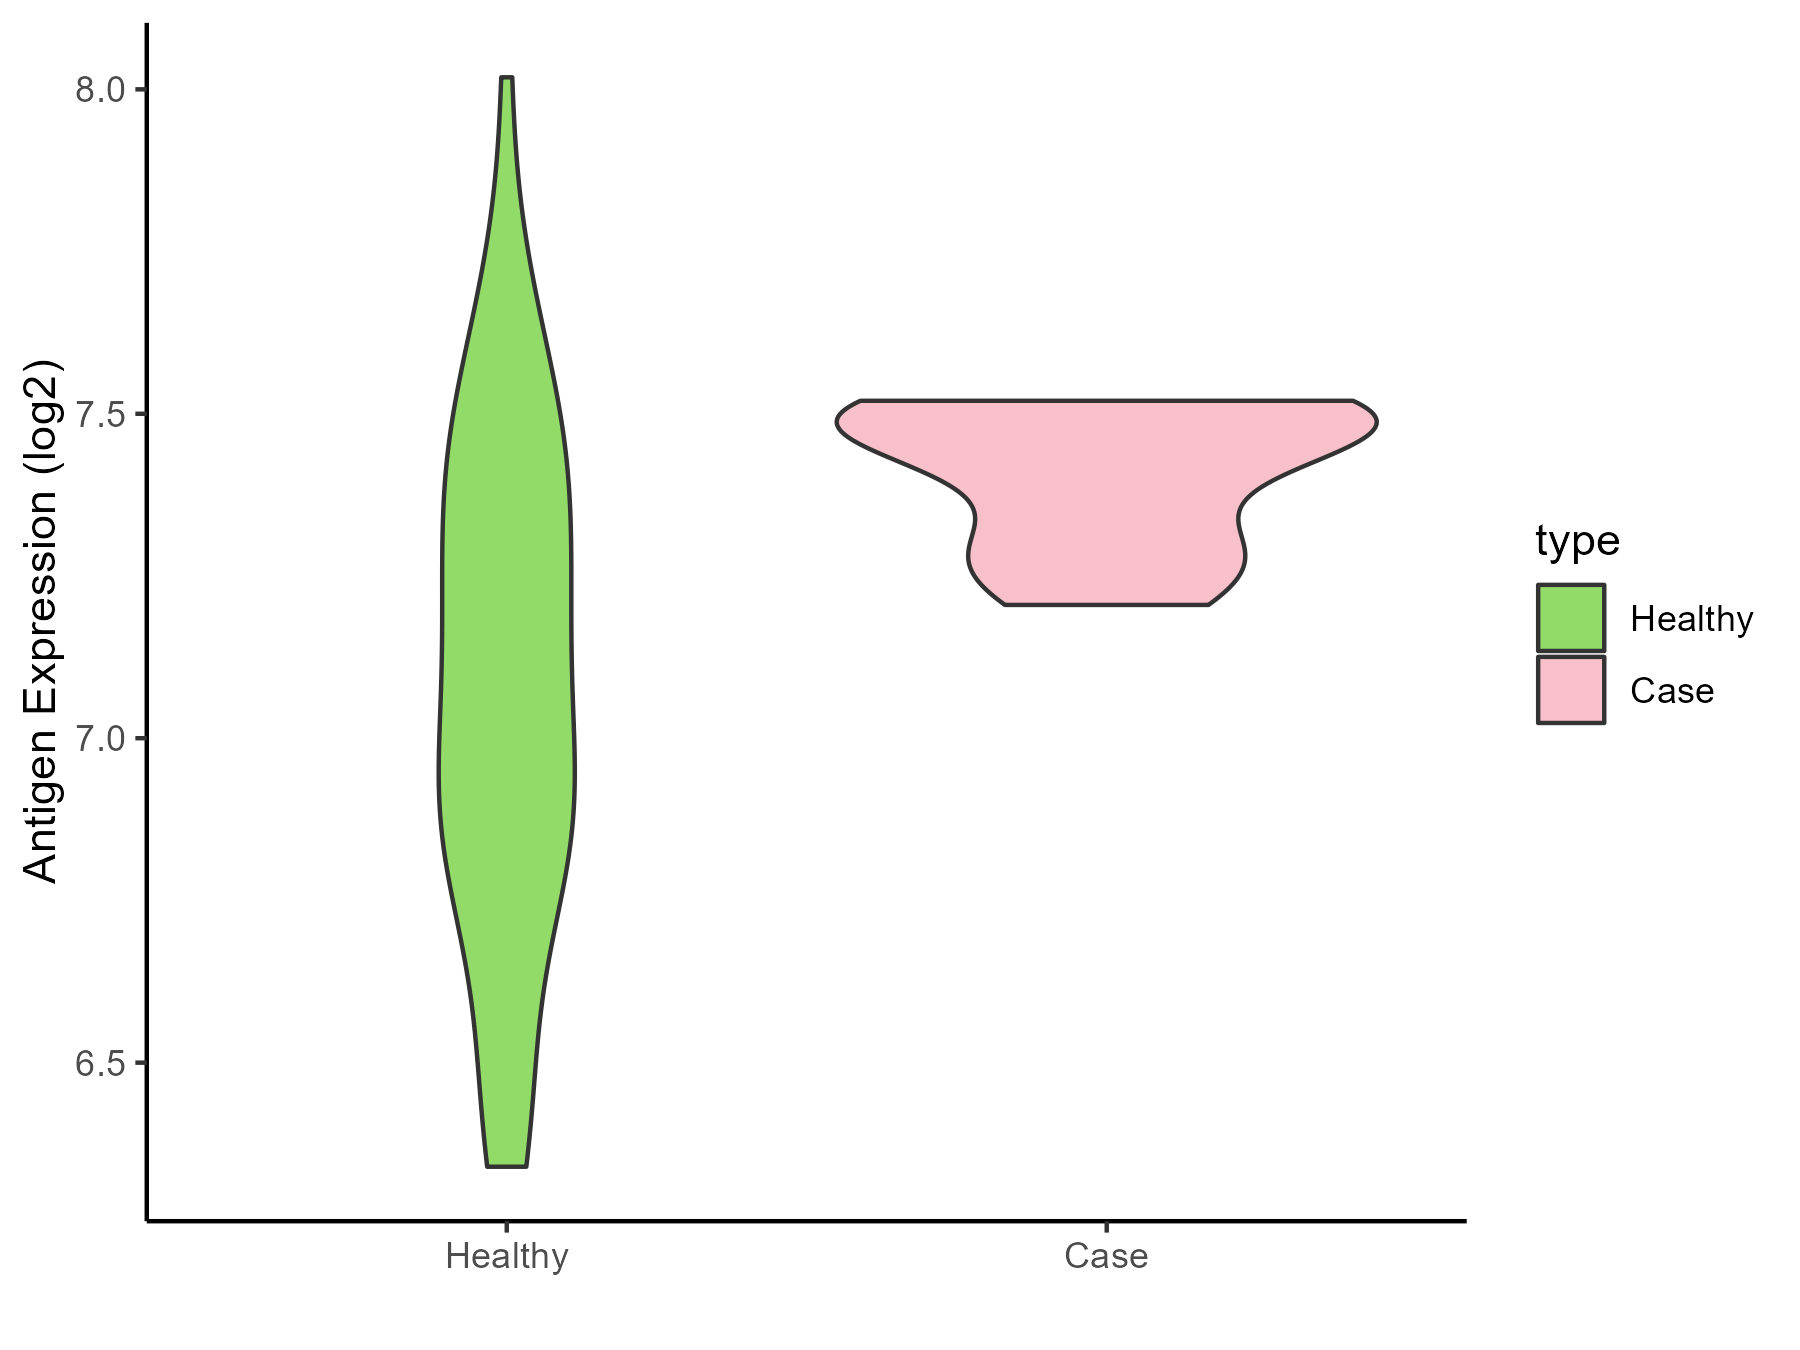
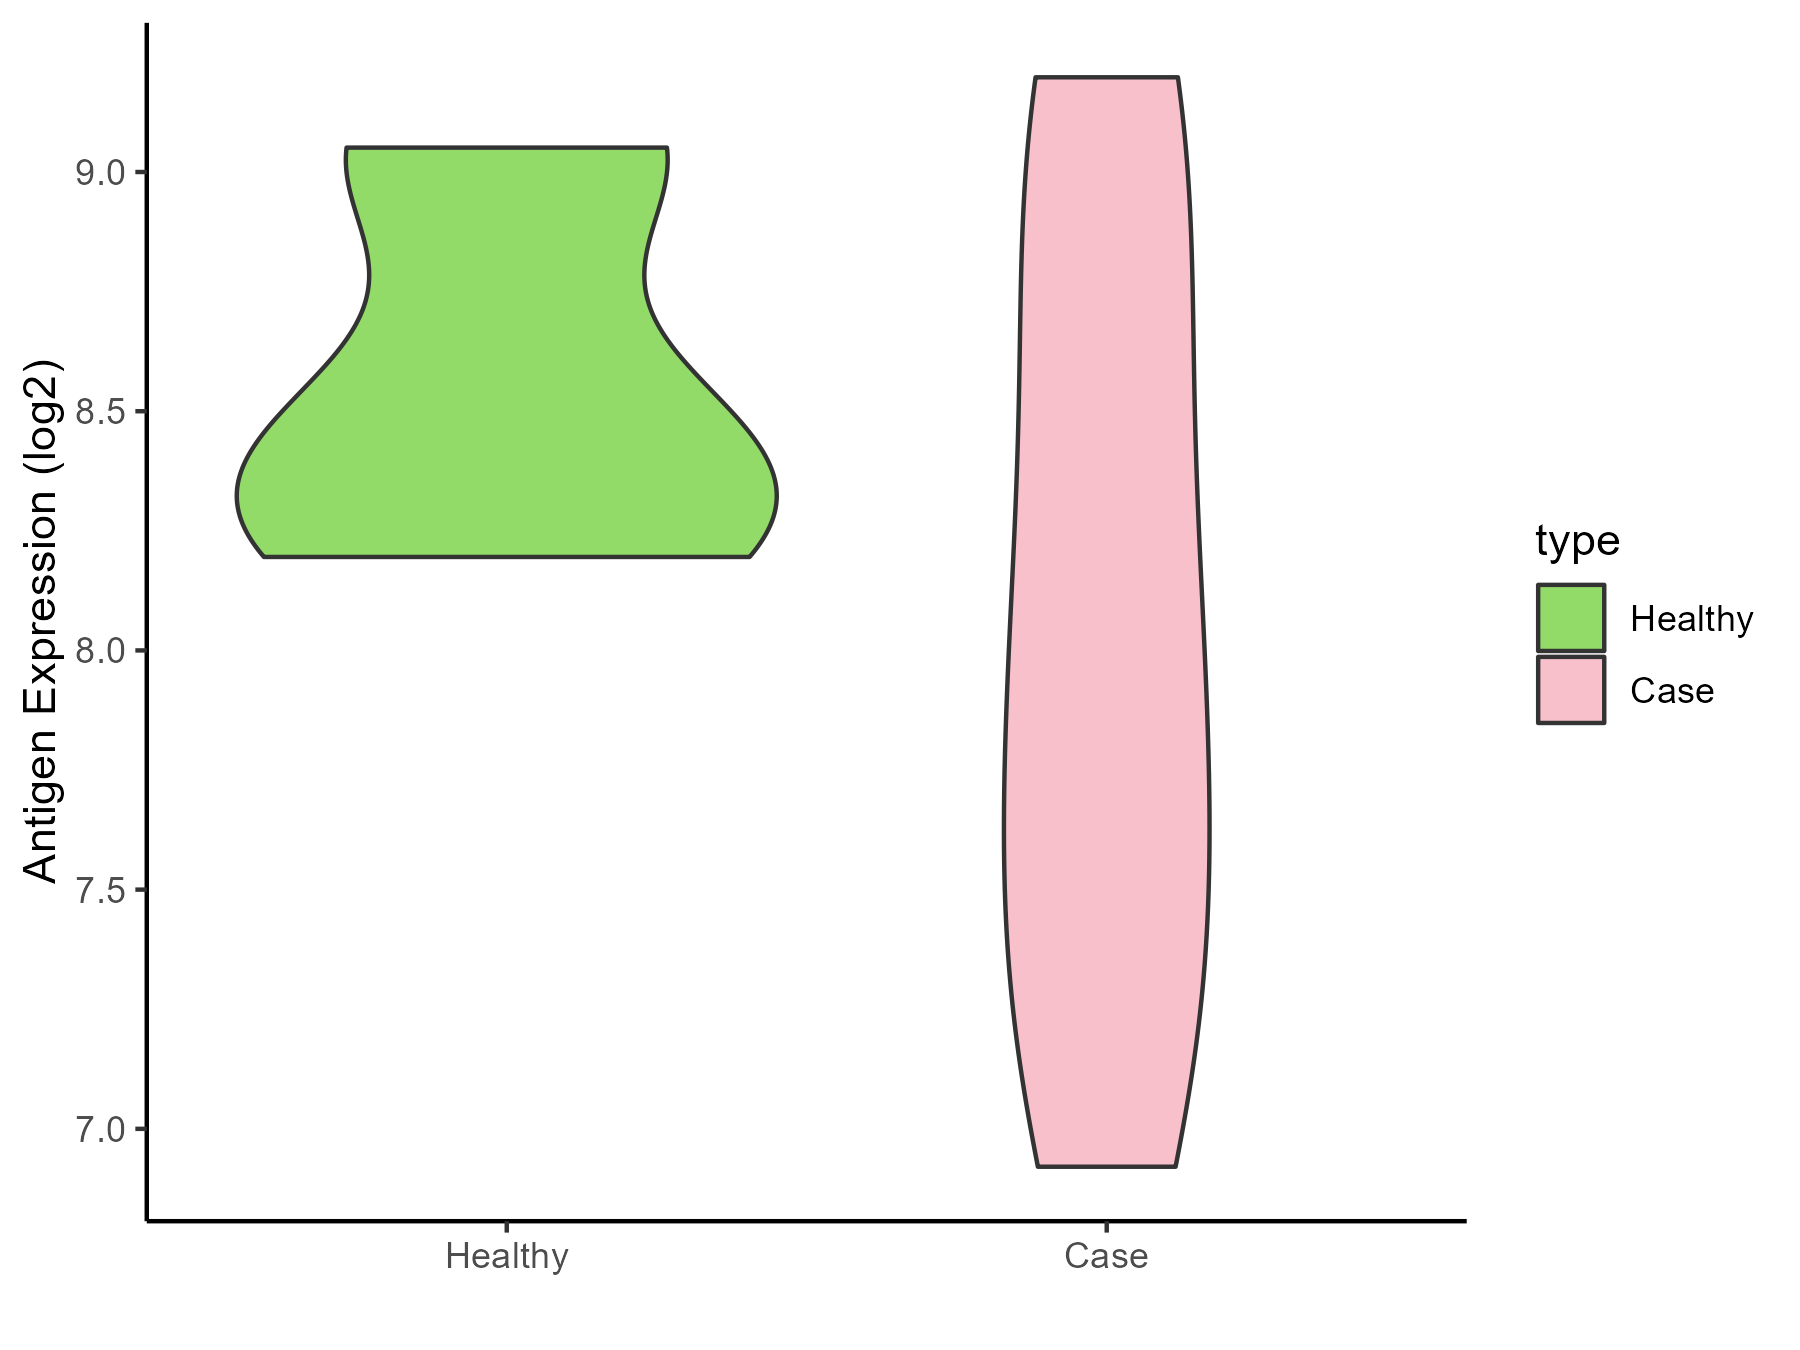
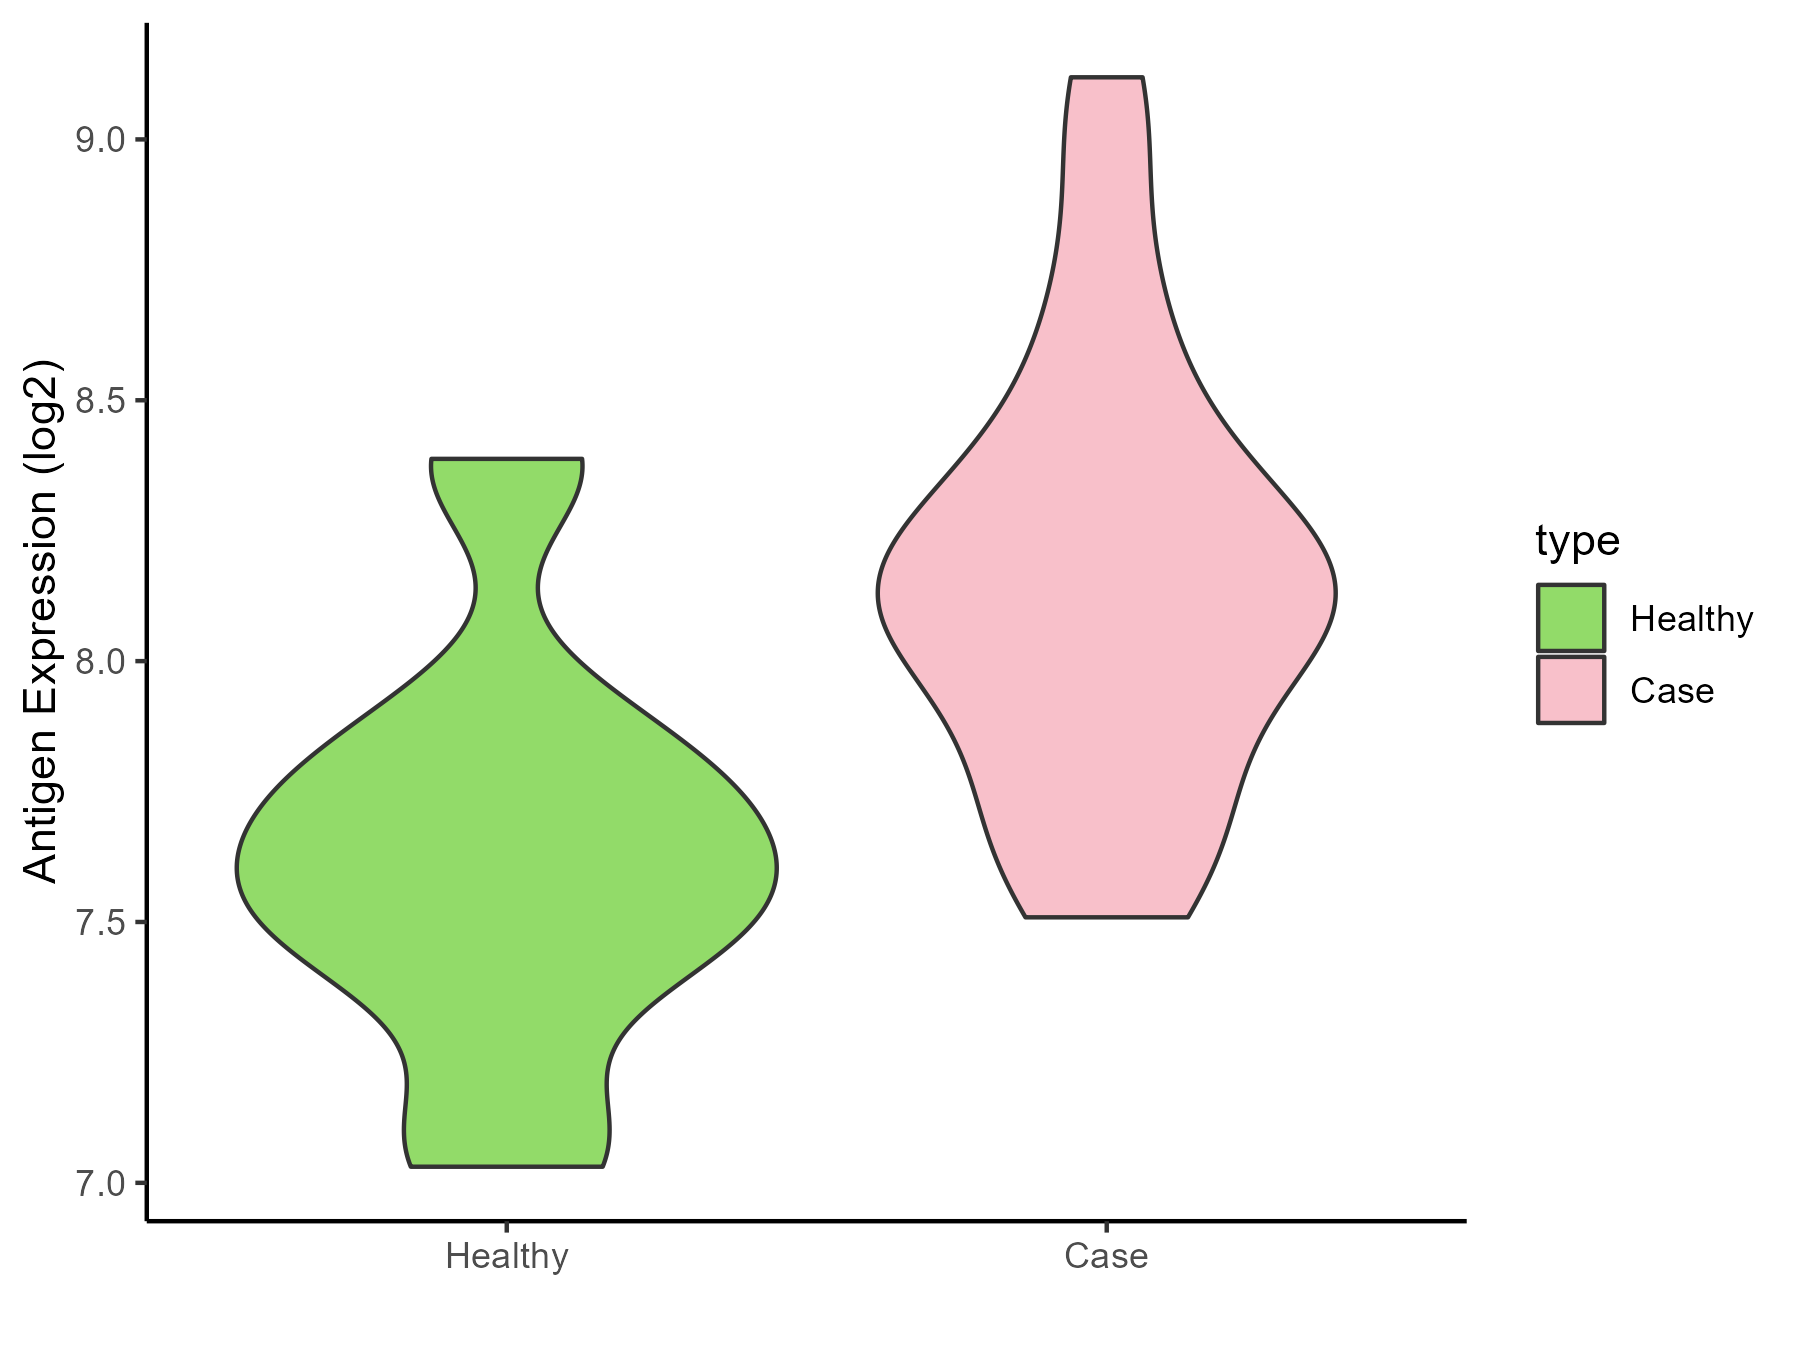
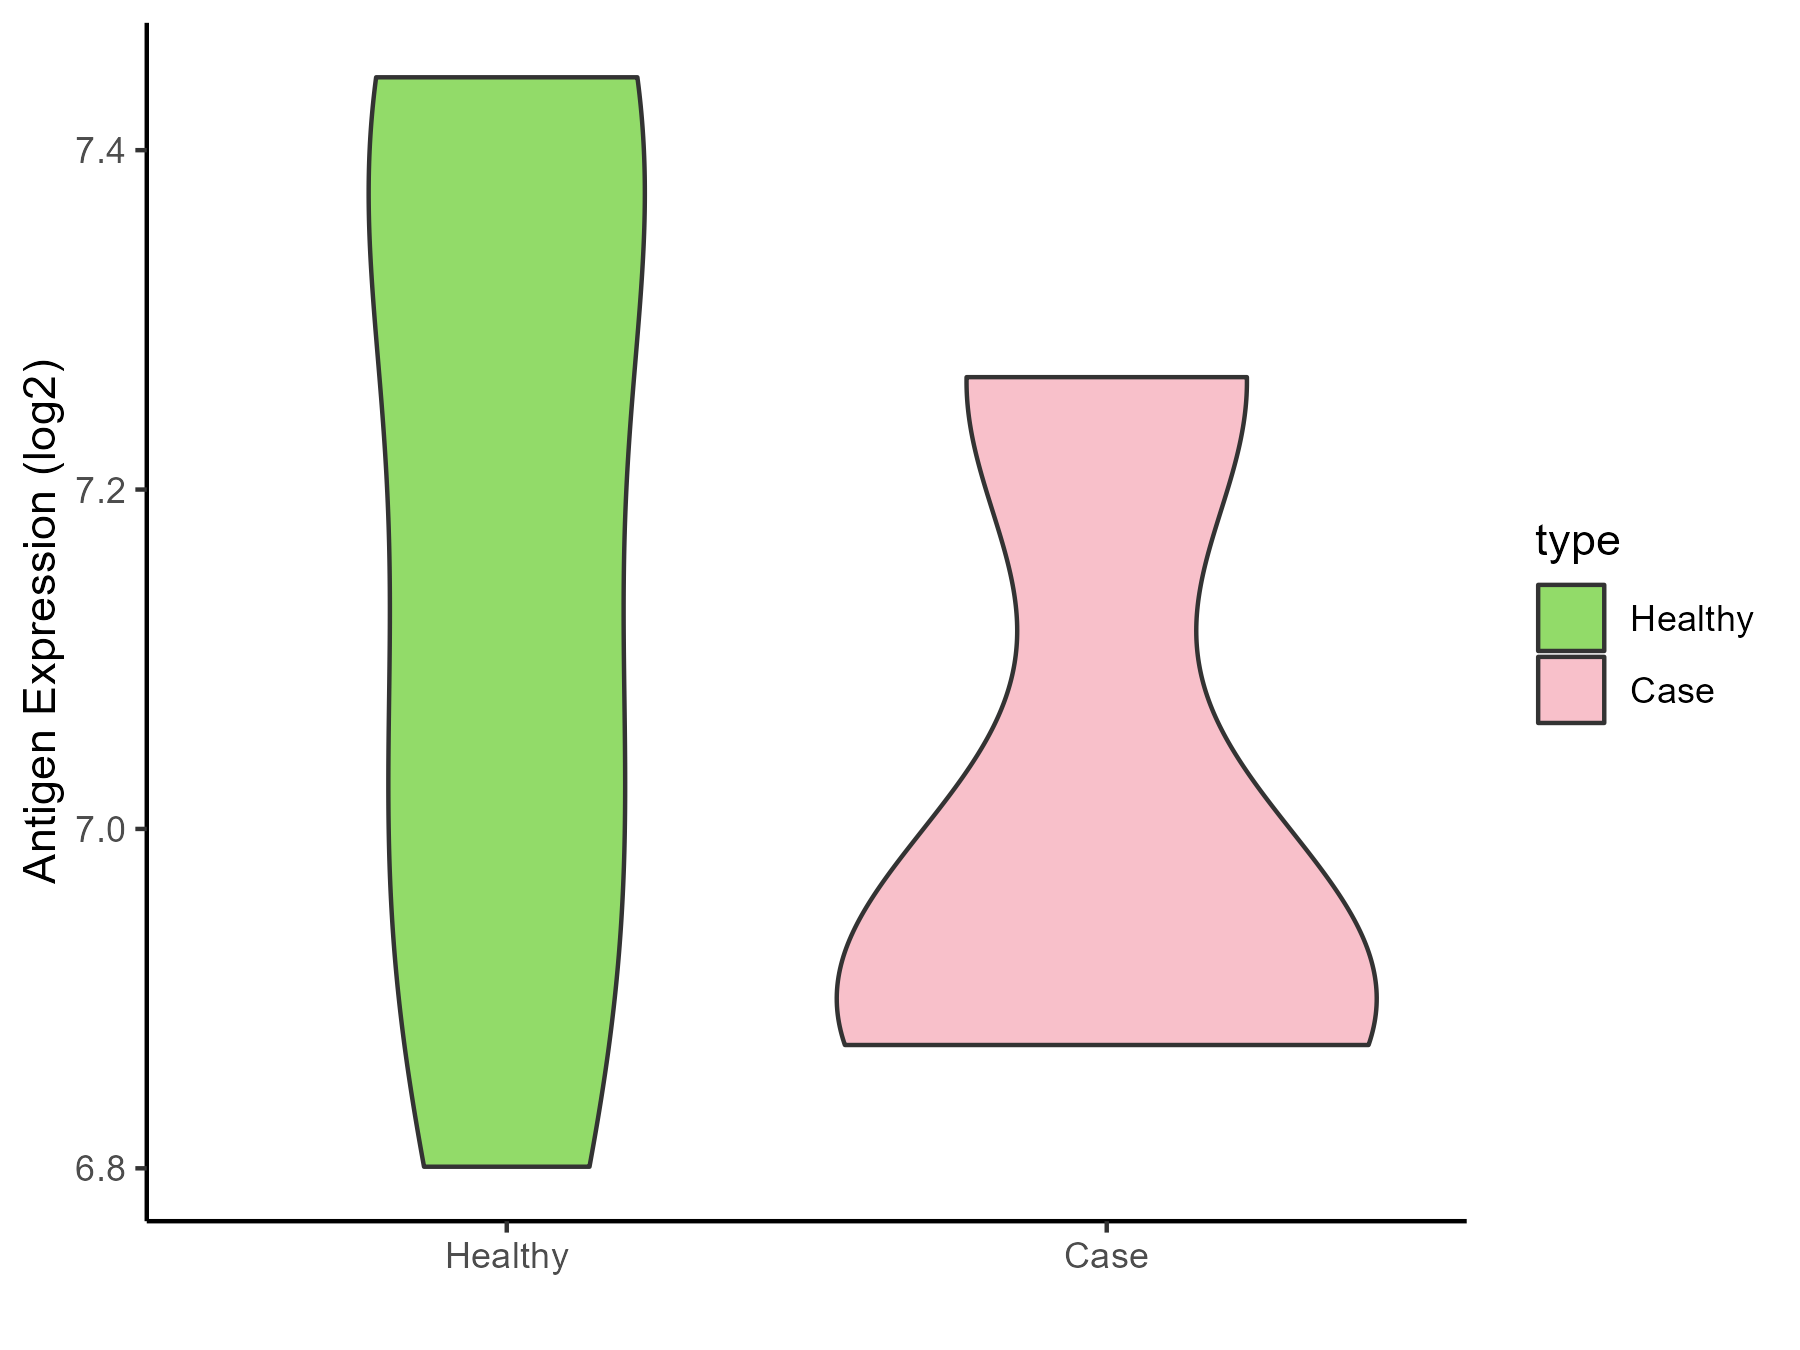
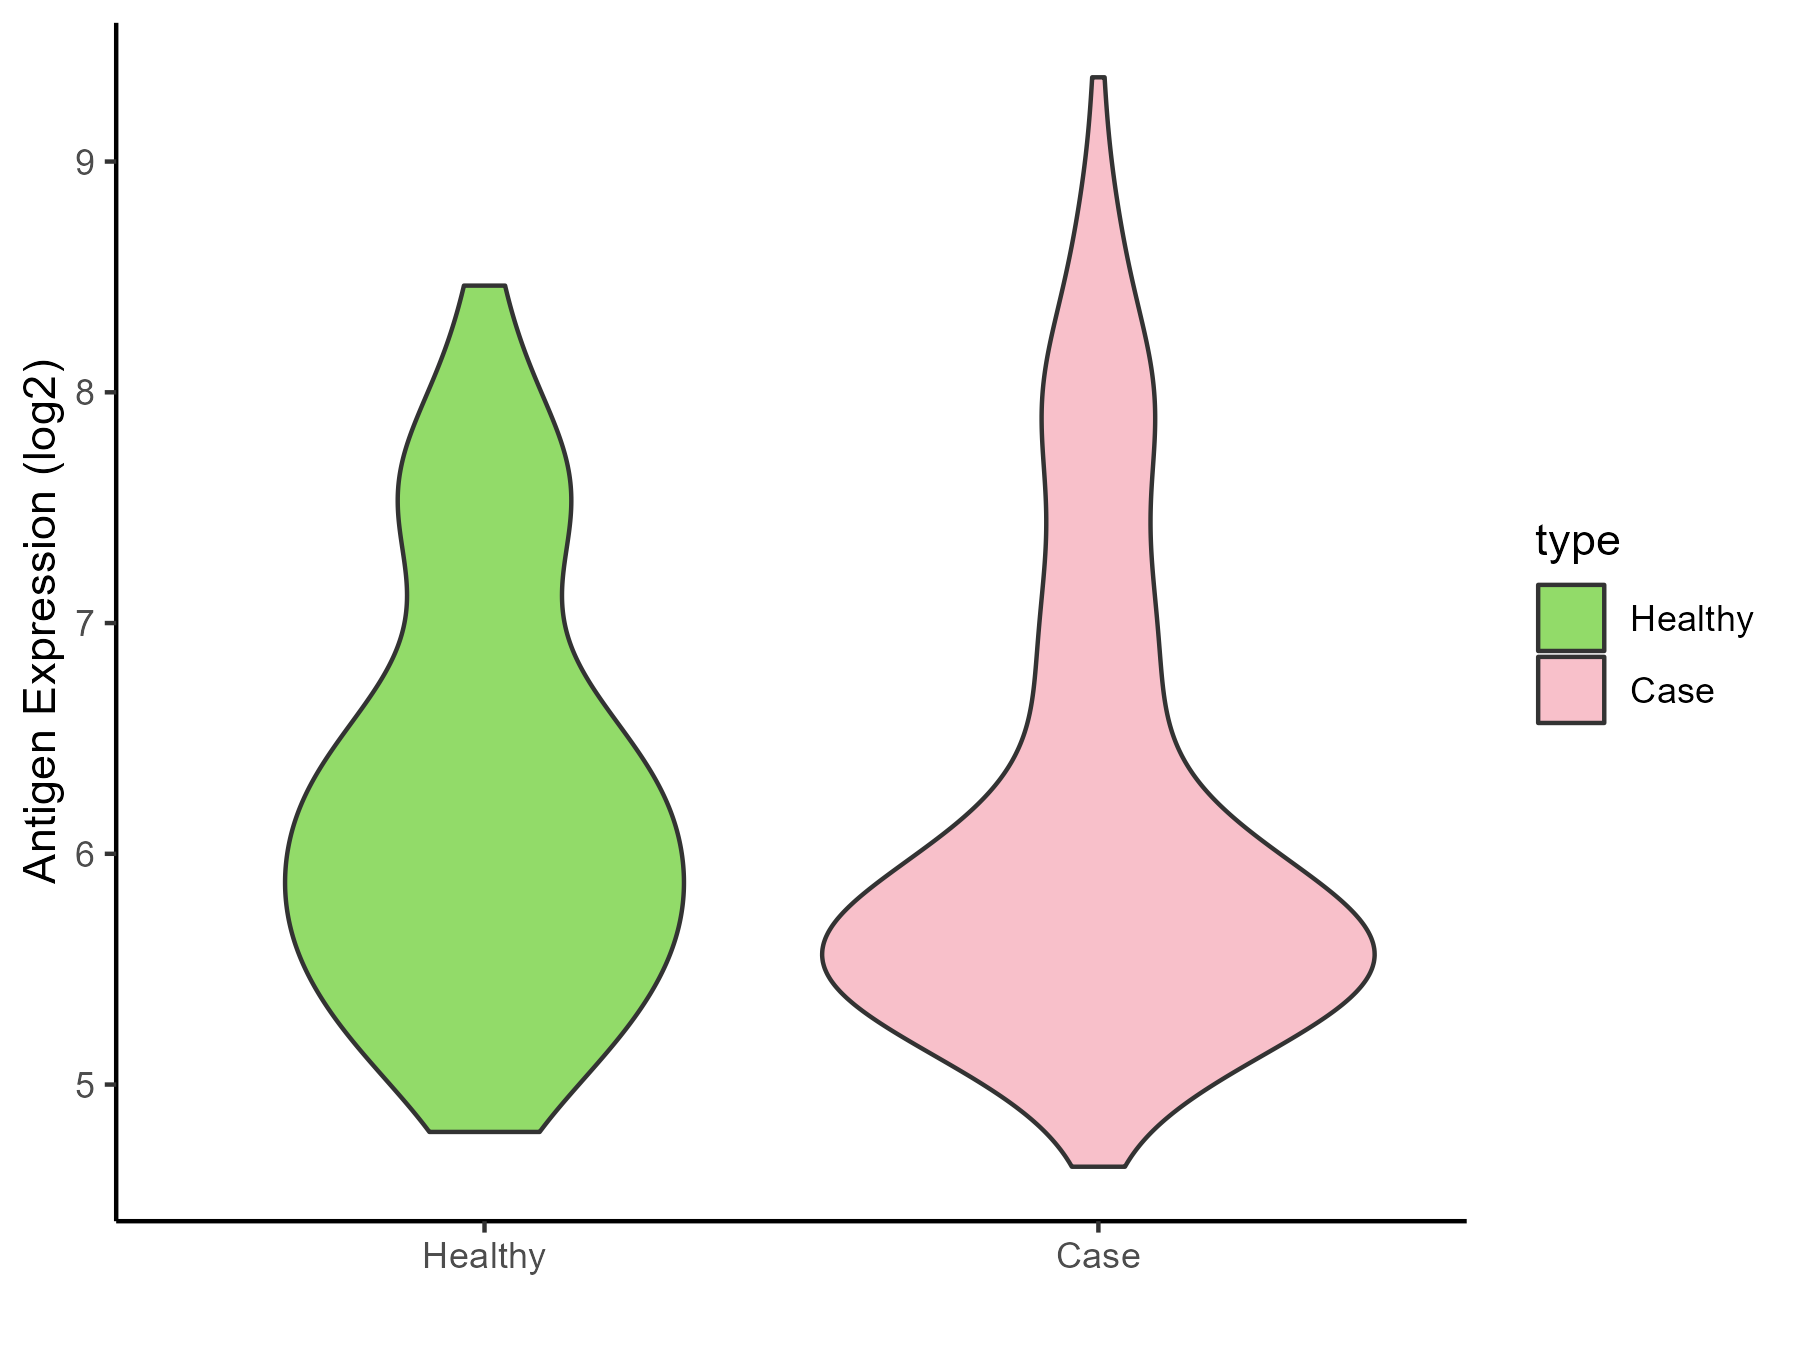
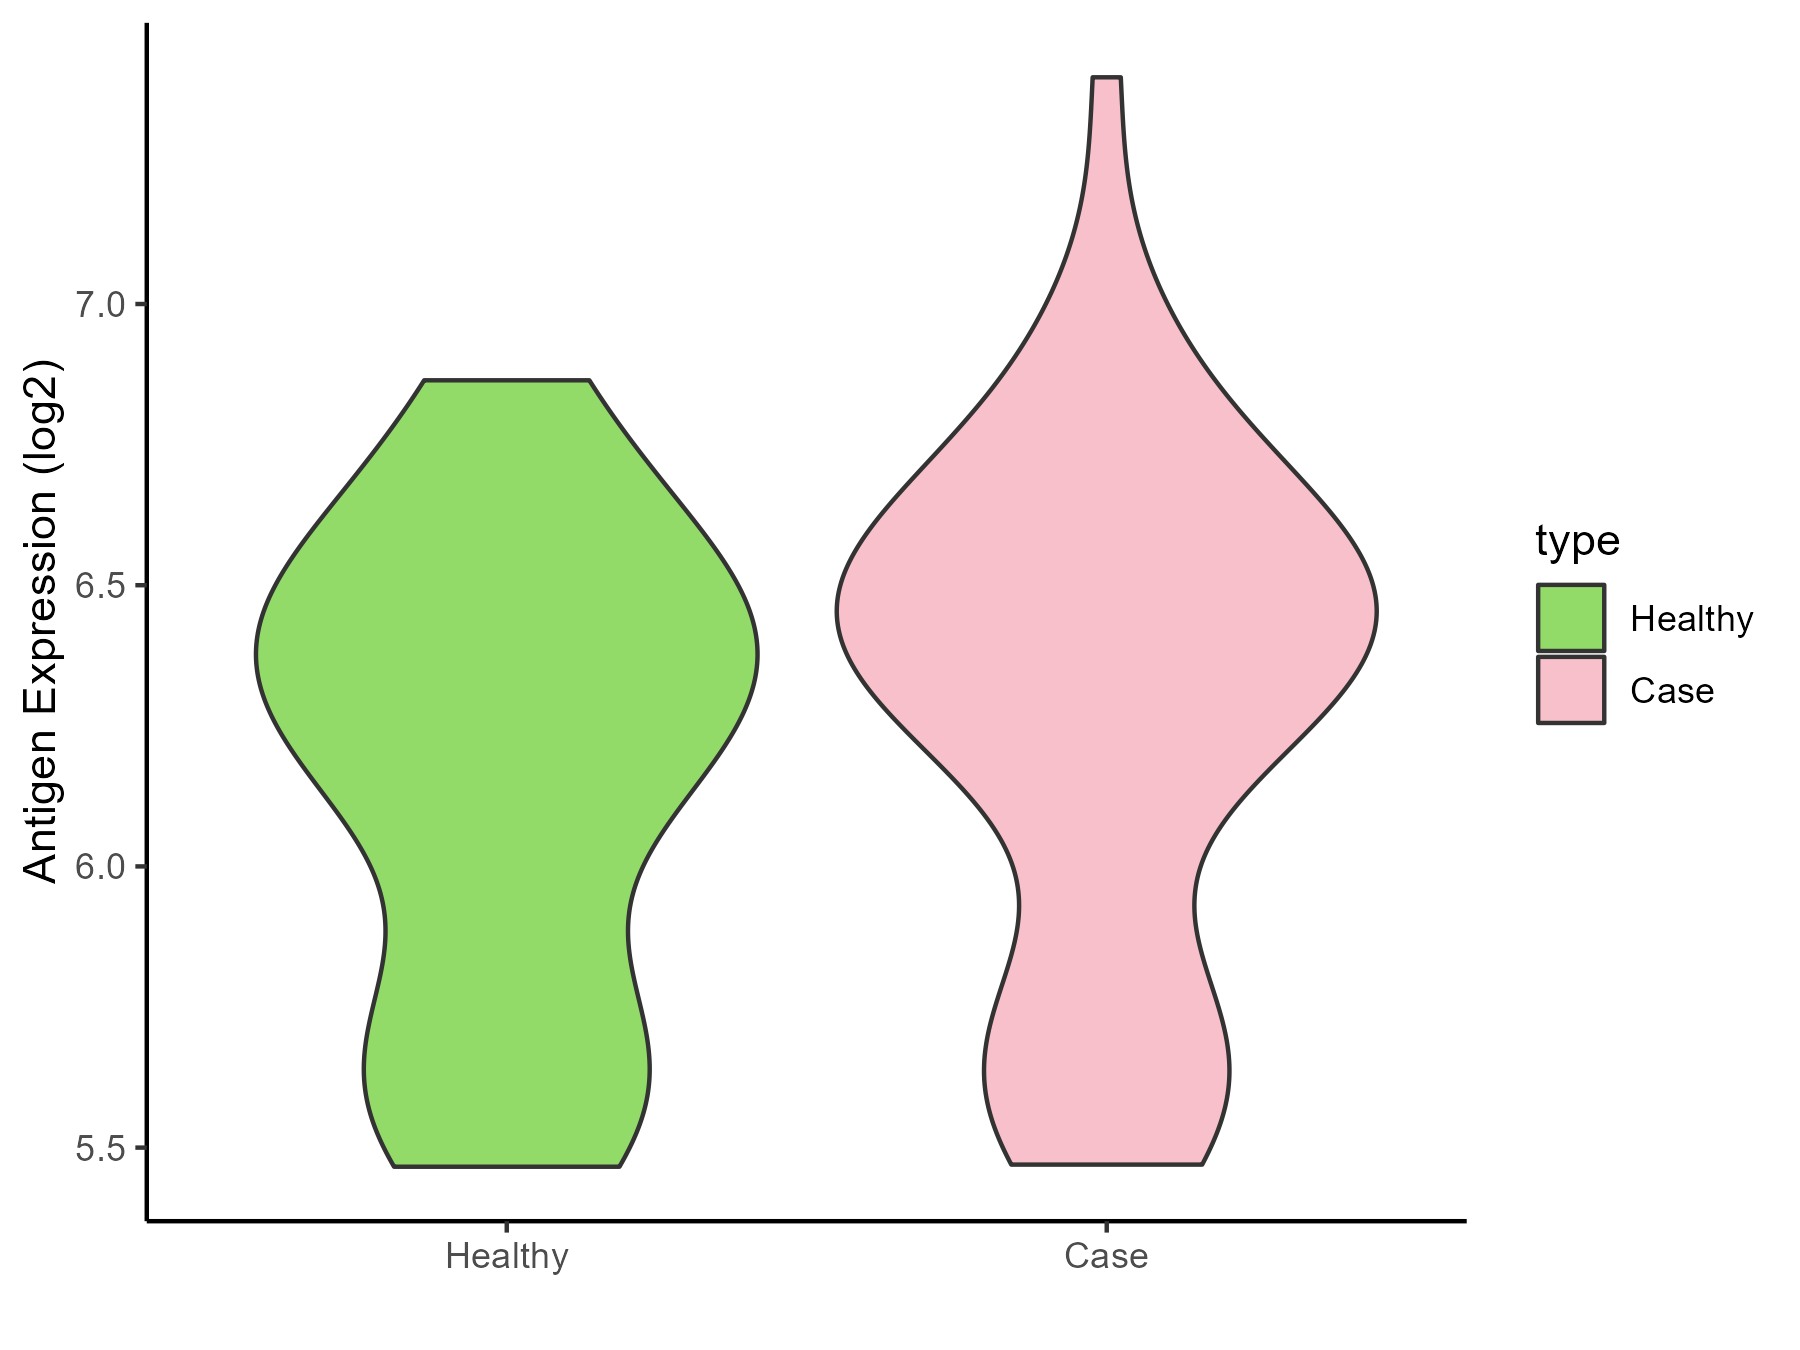
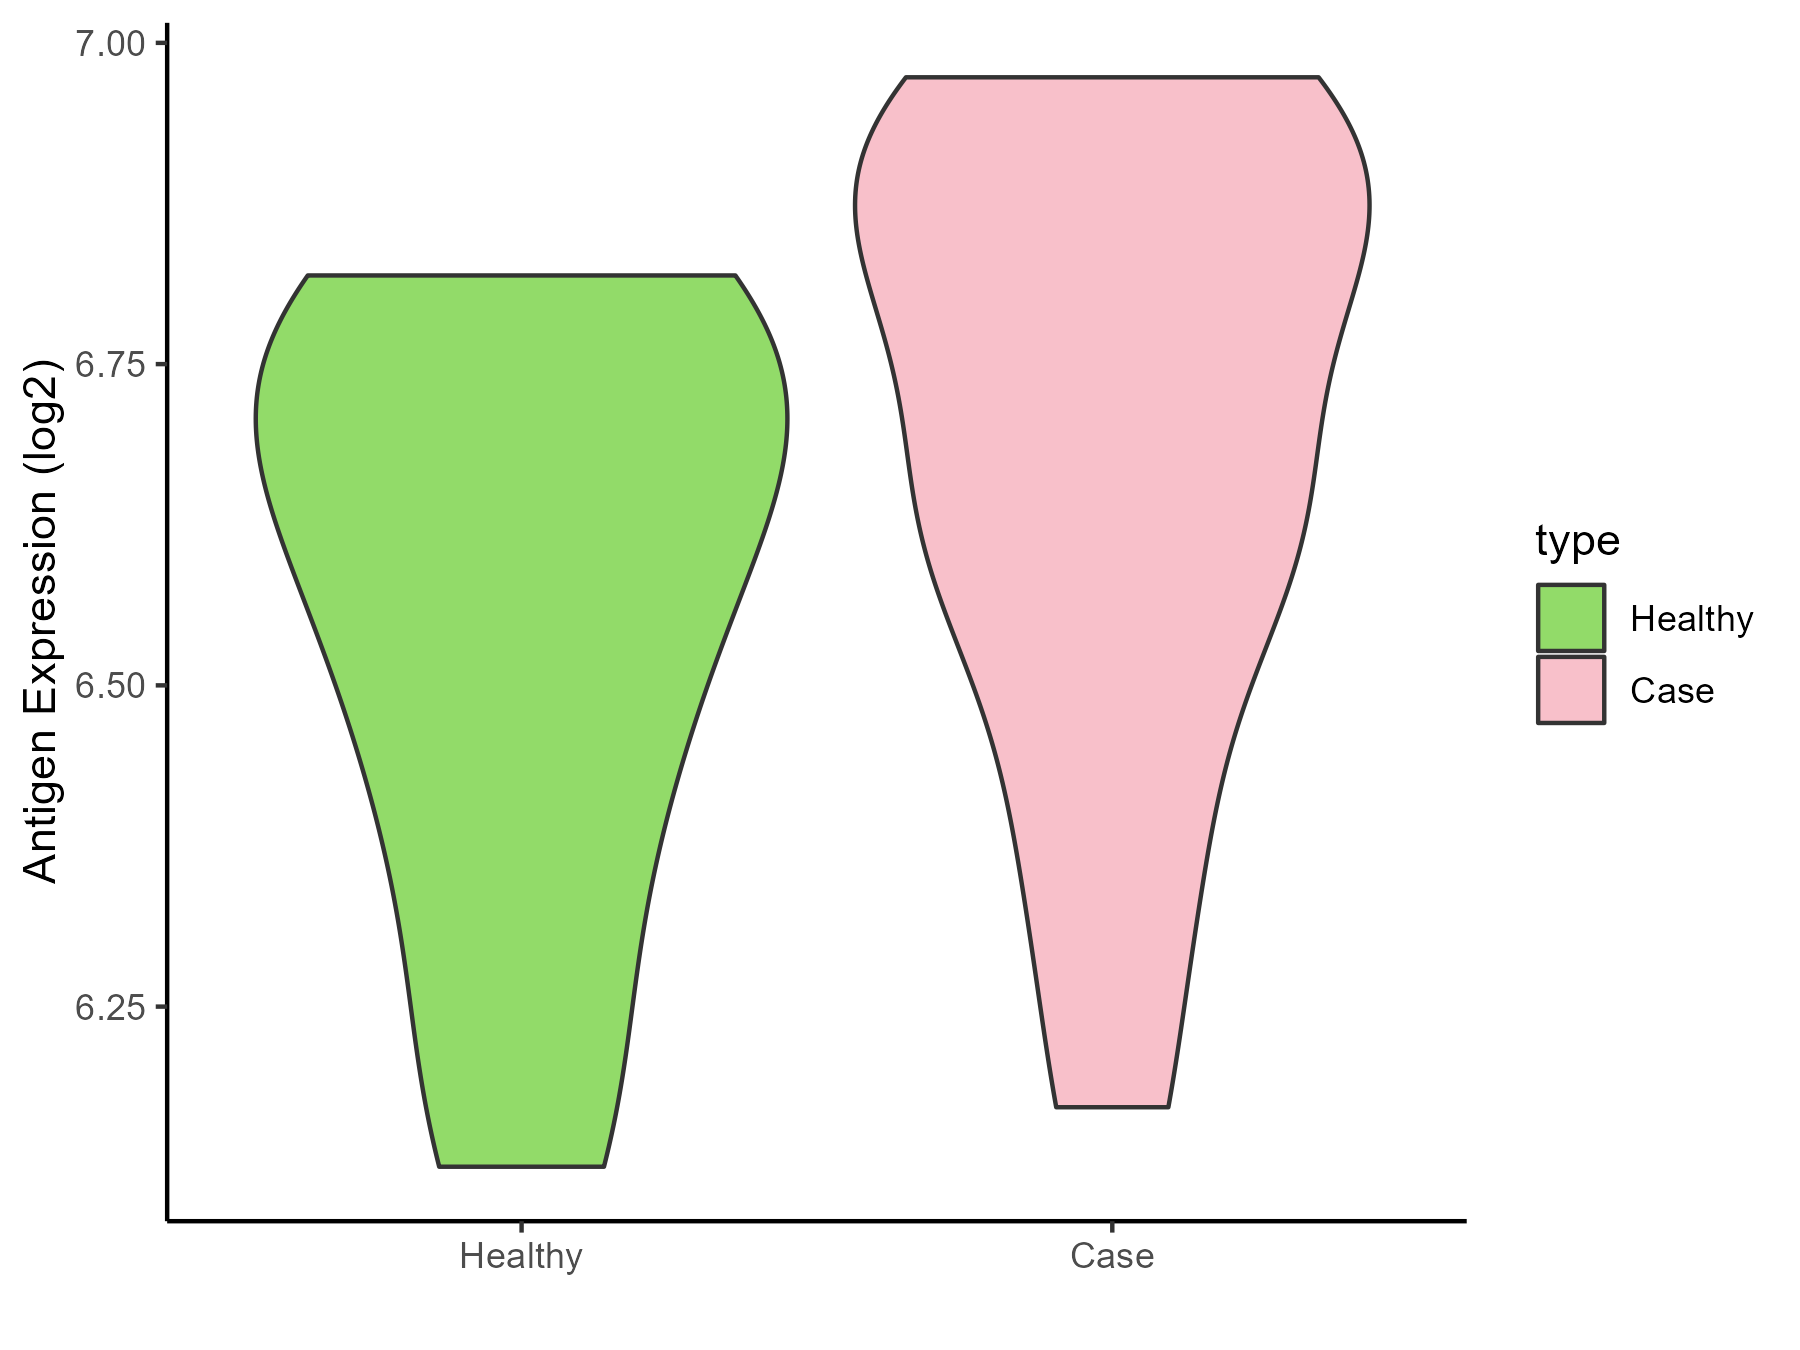
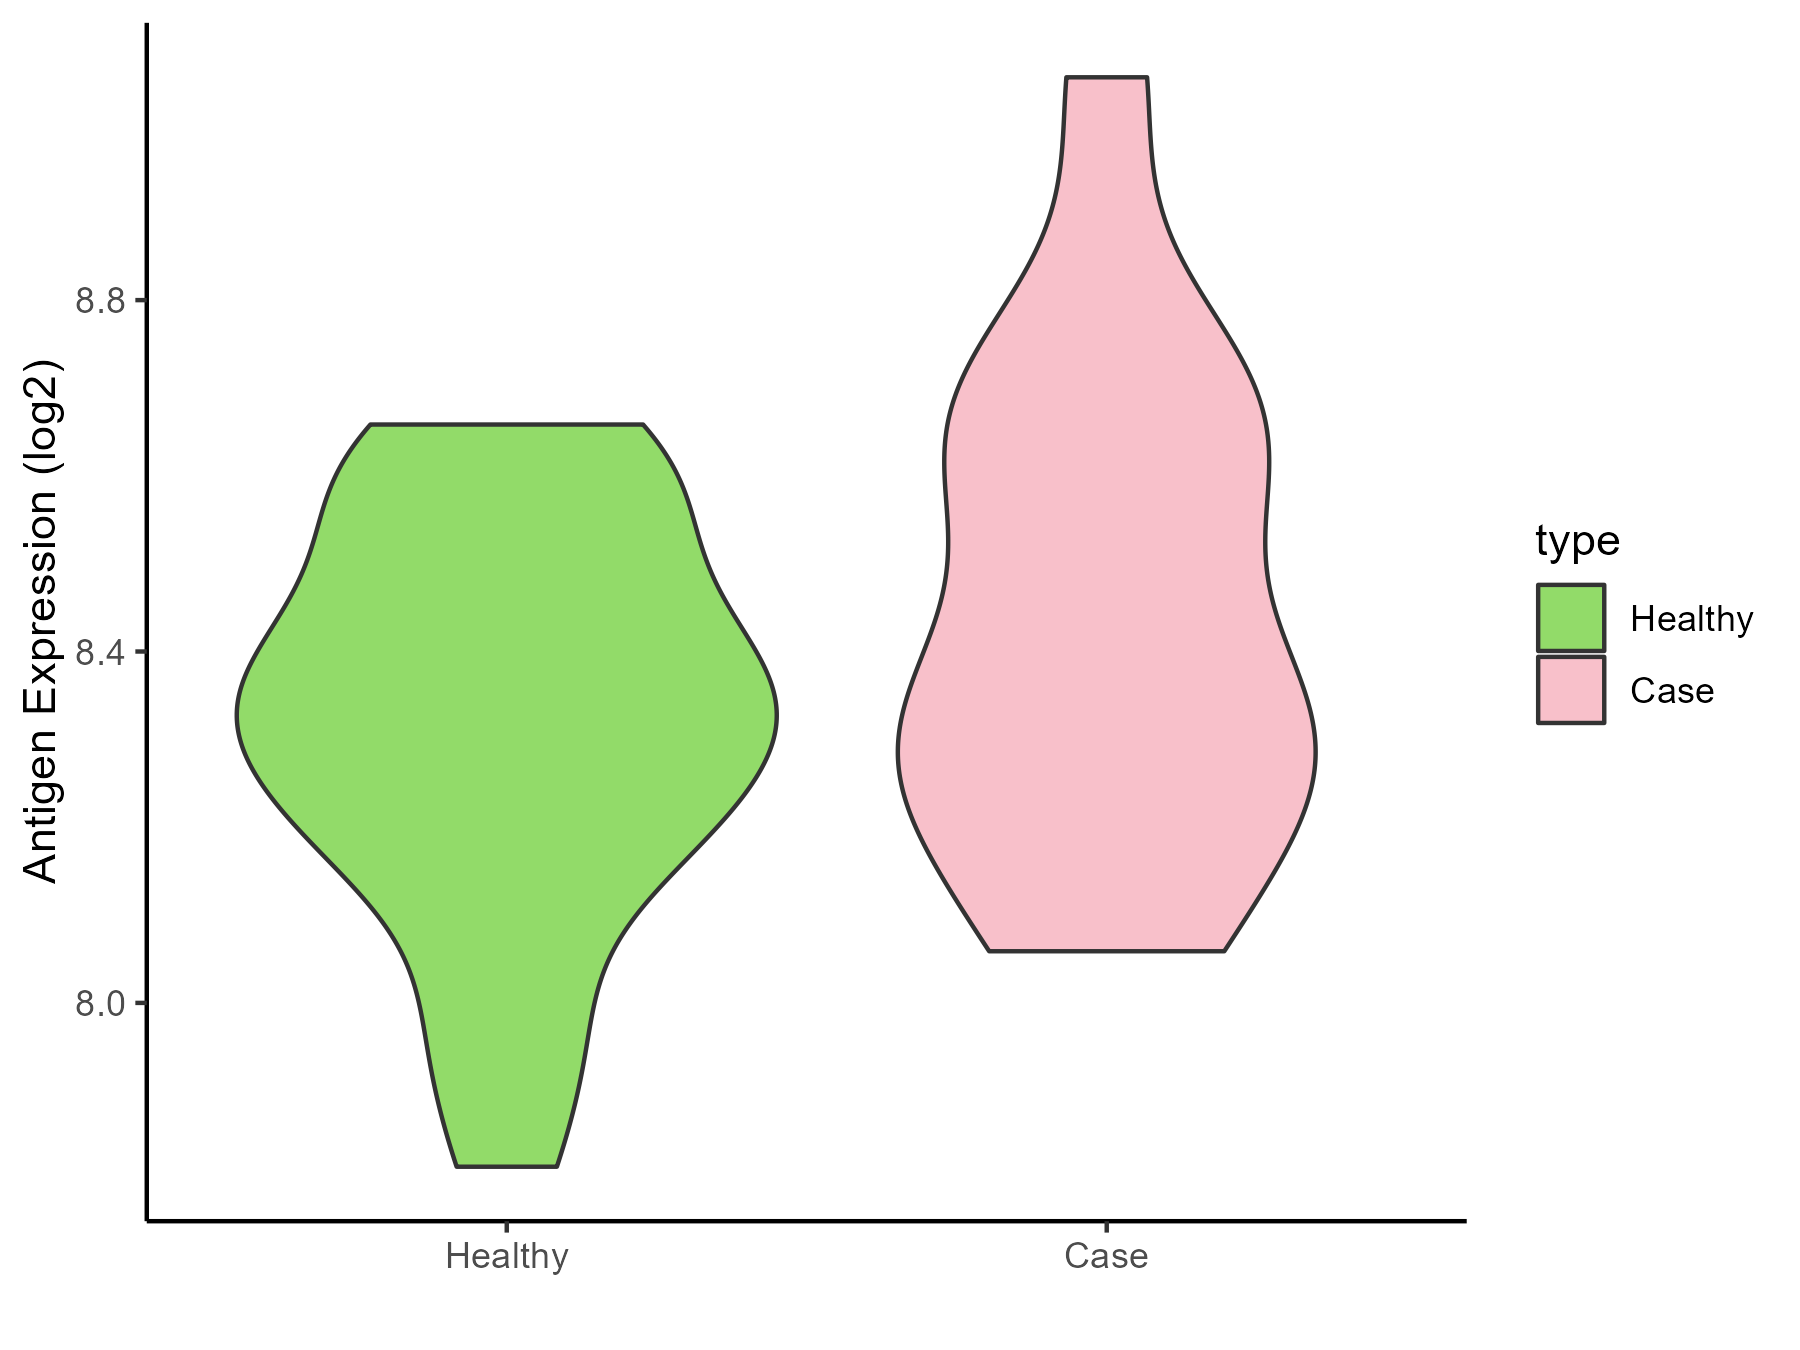
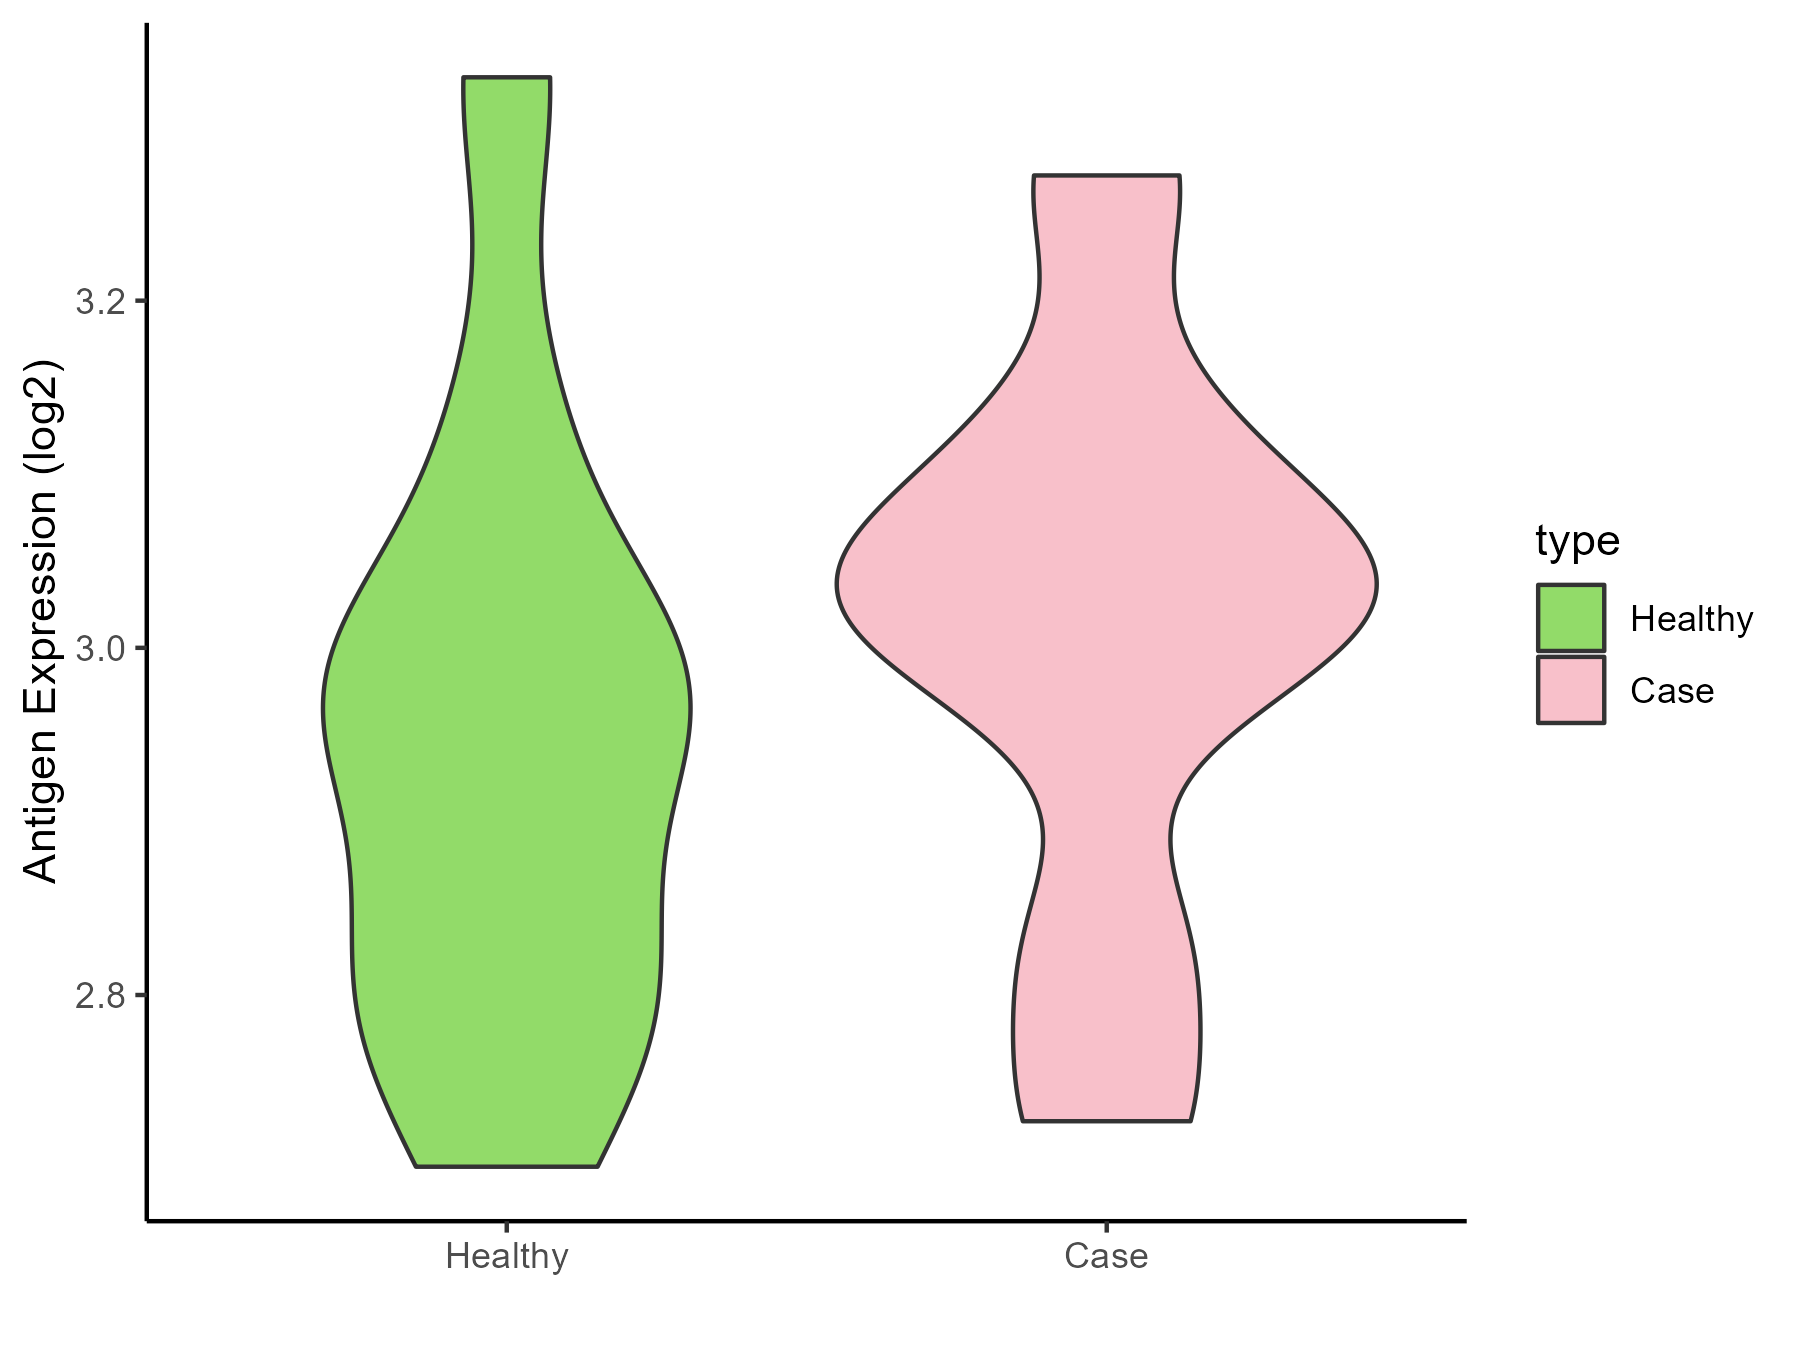
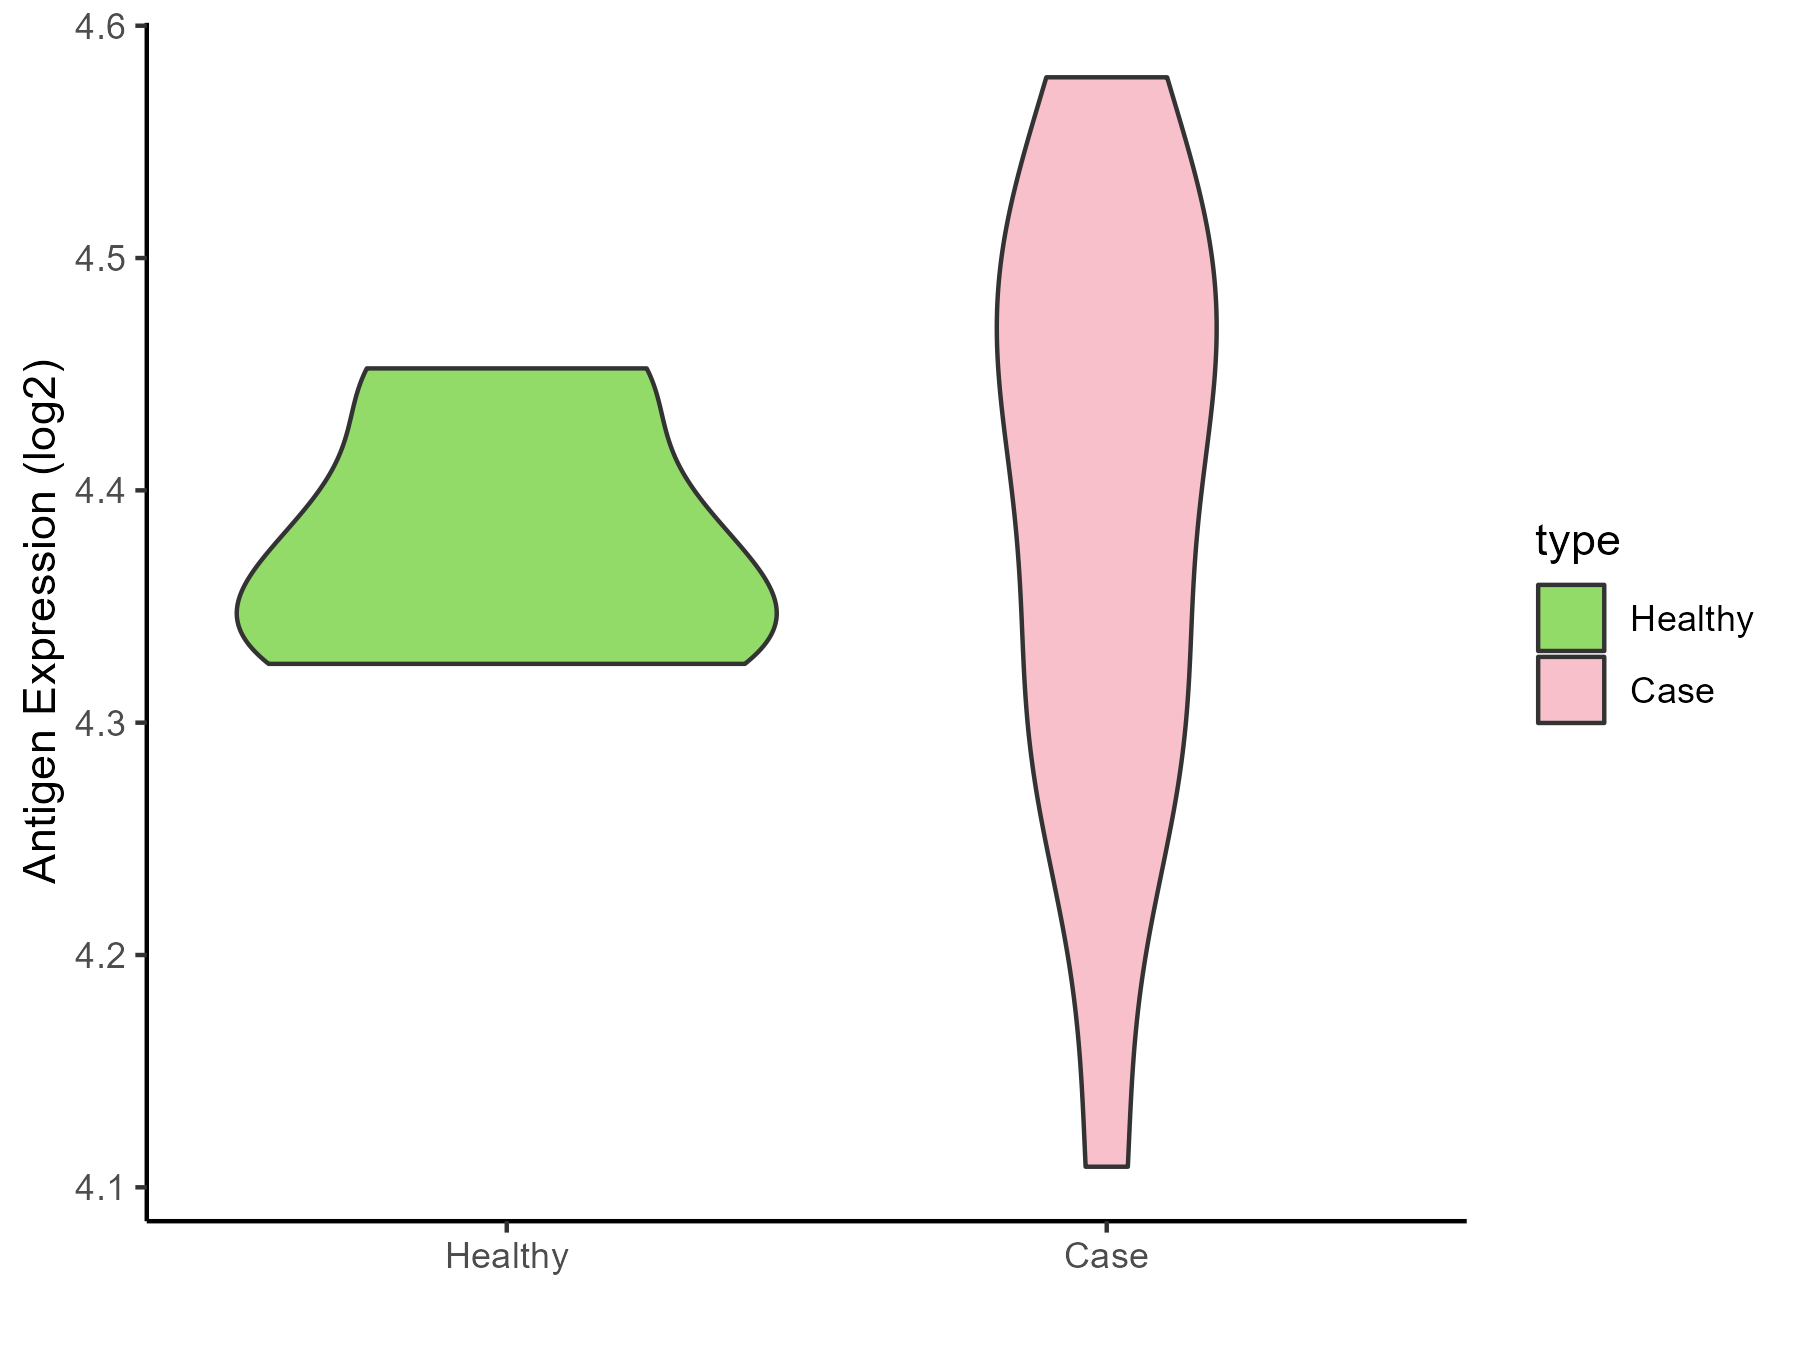
Brainstem |
| The Specific Disease |
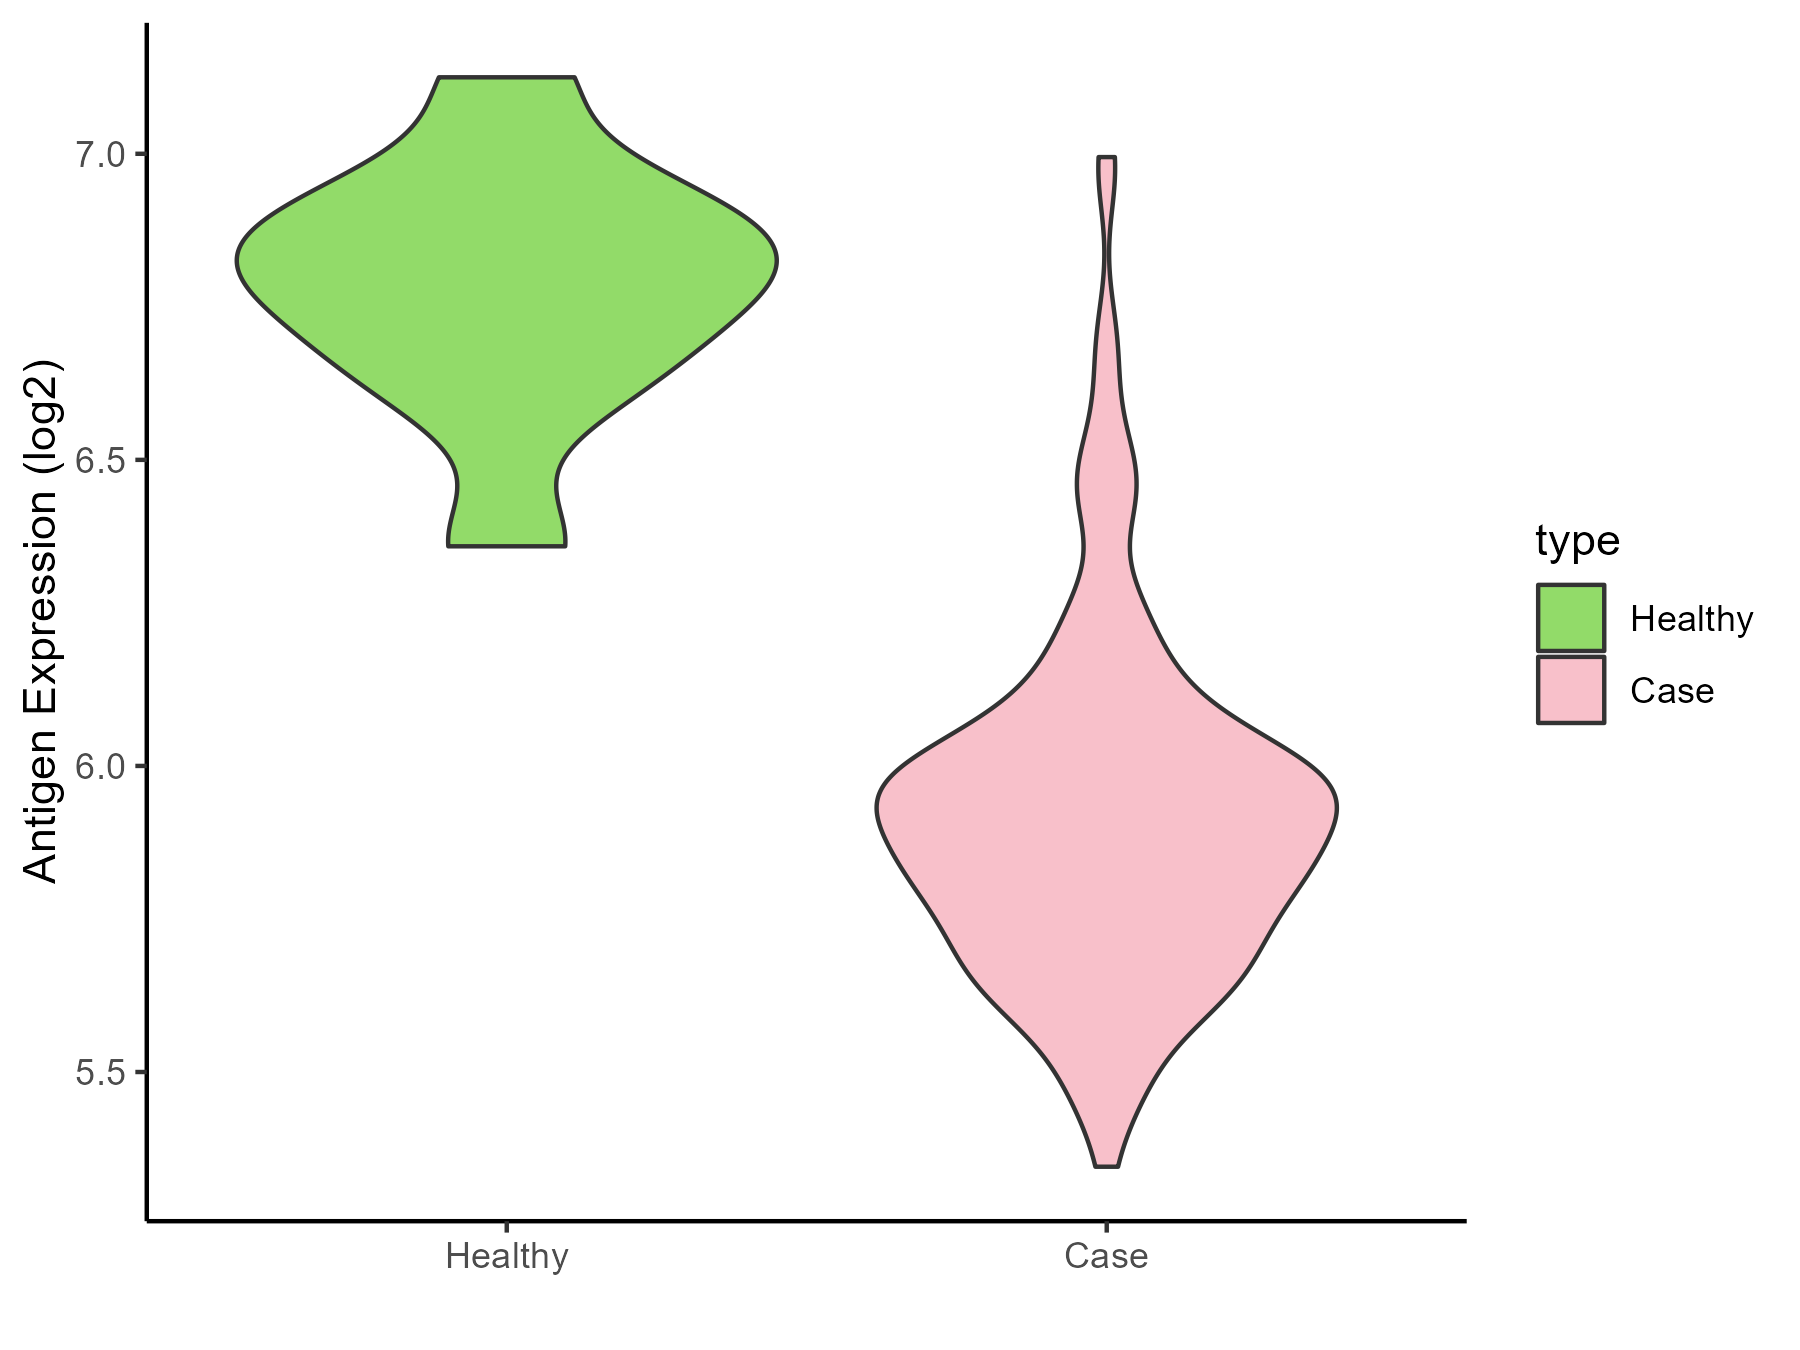
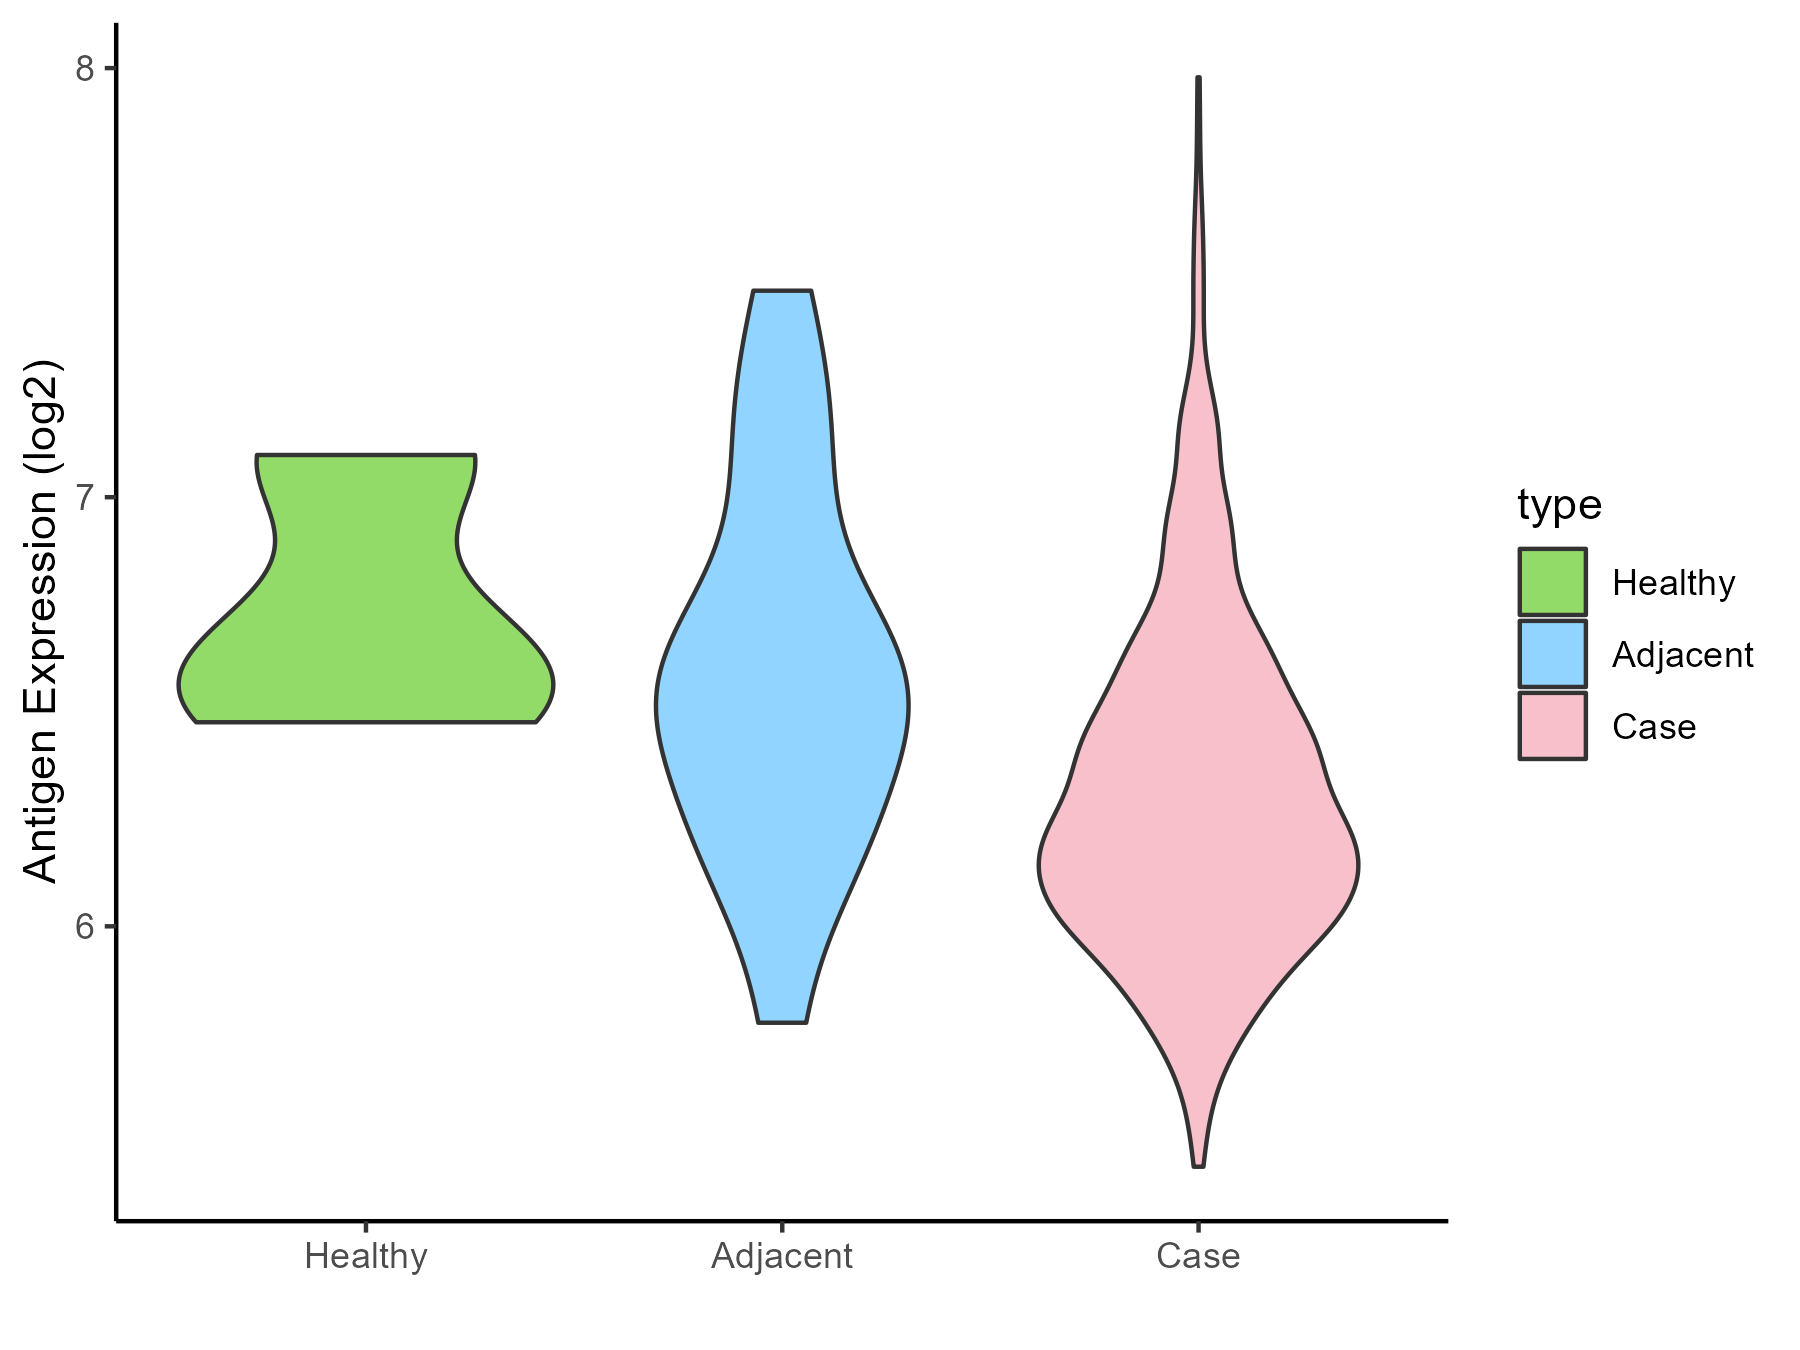
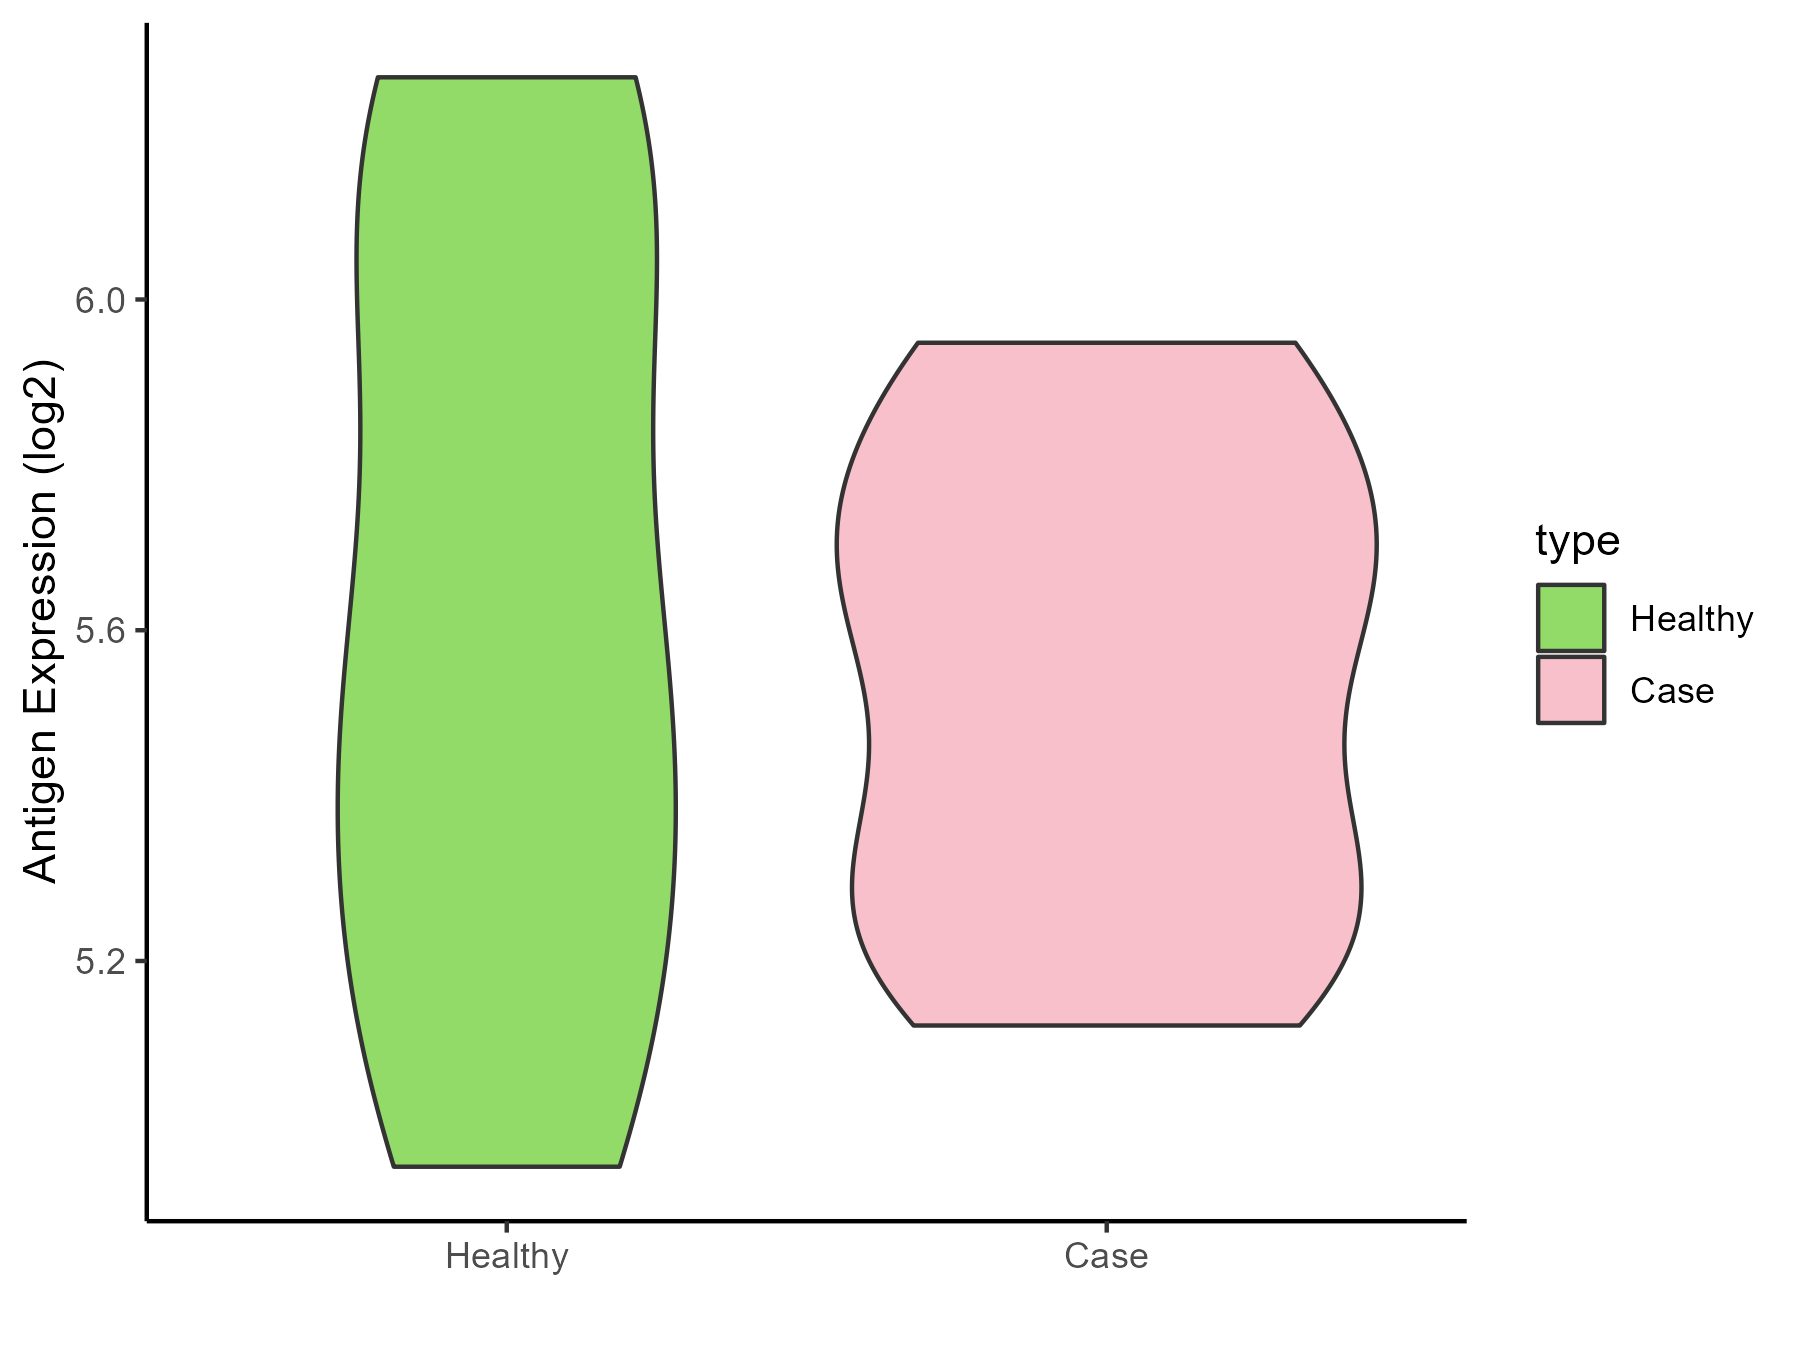
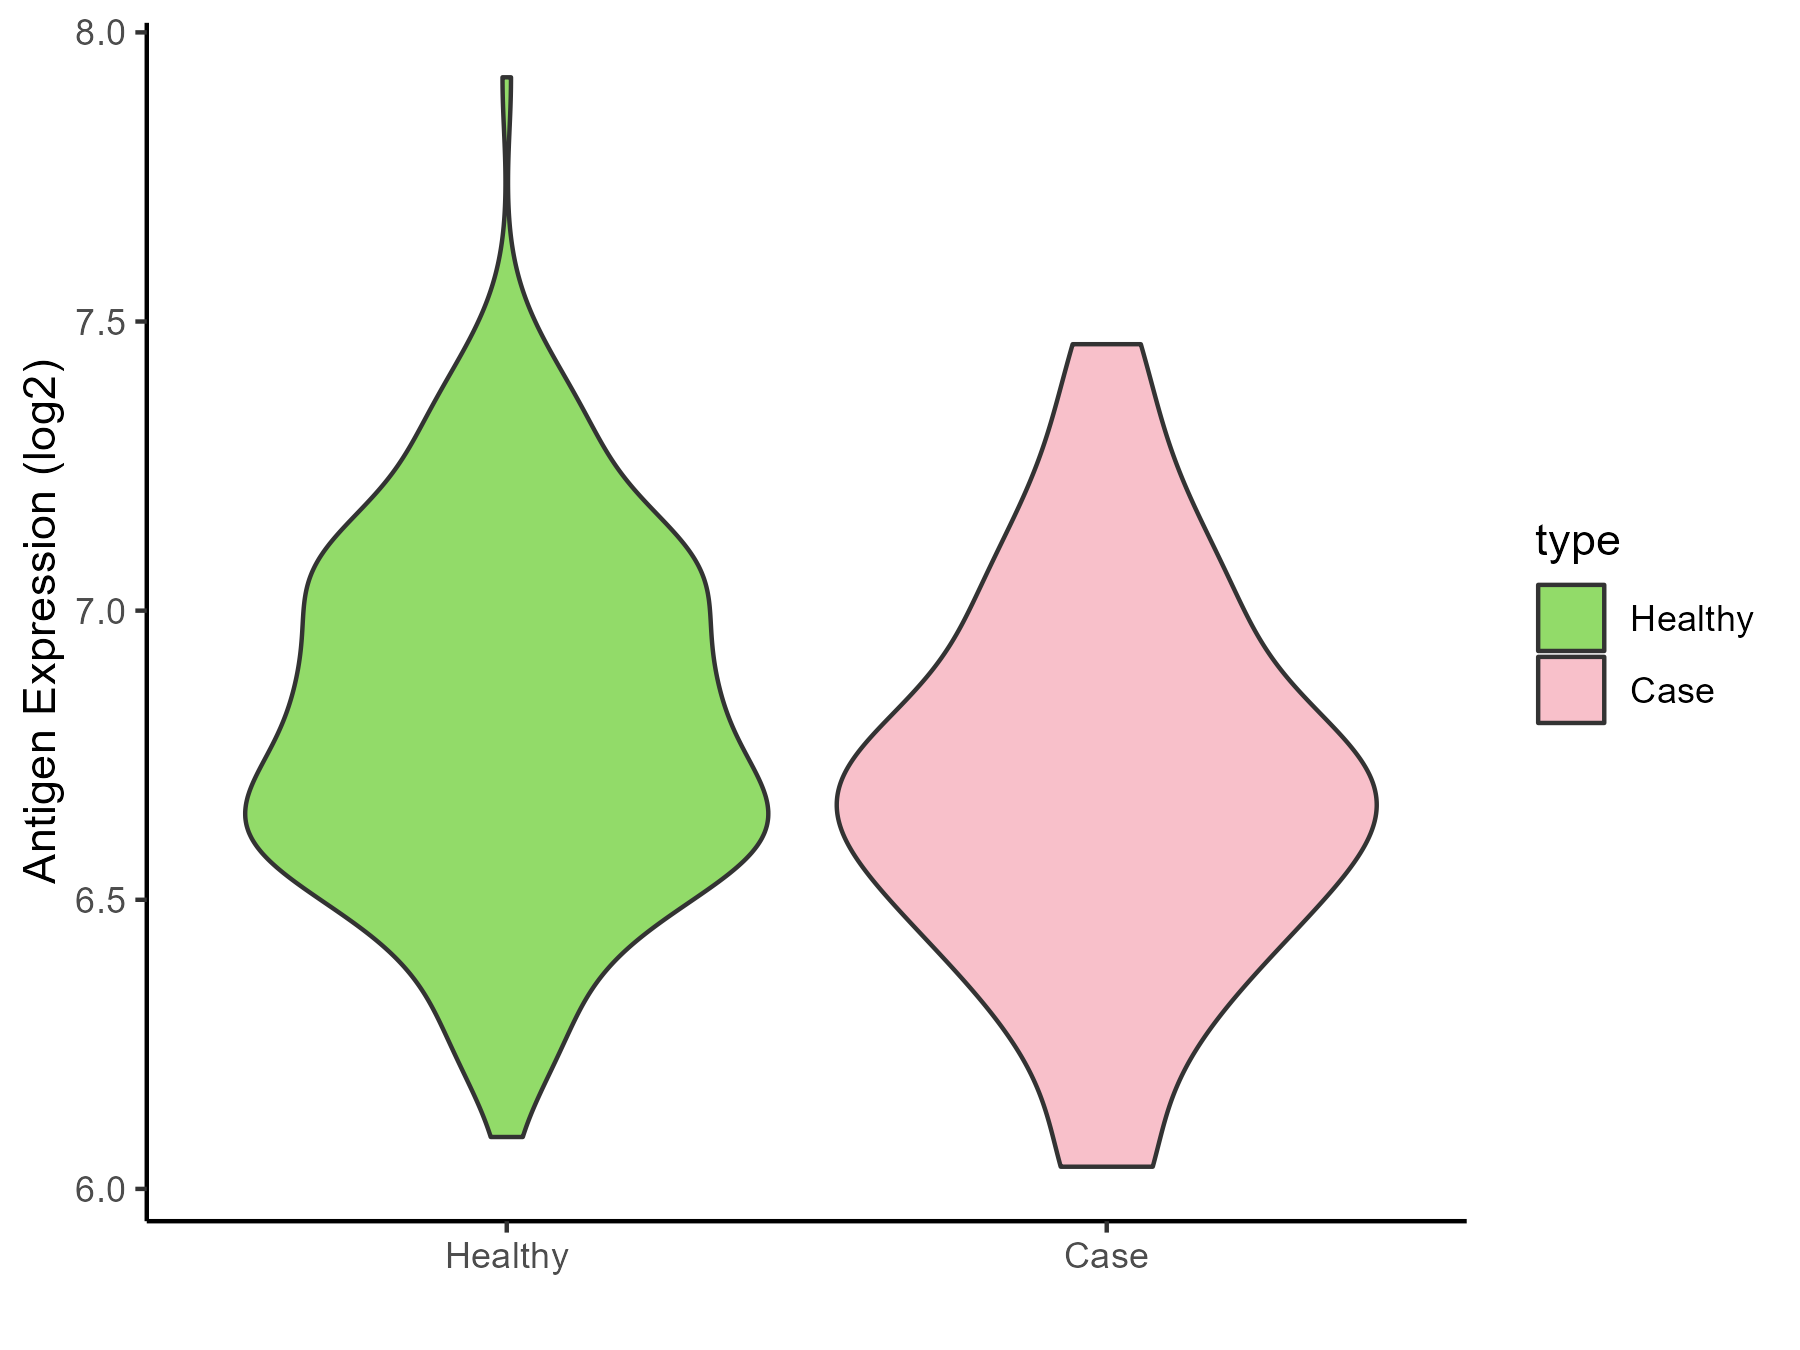
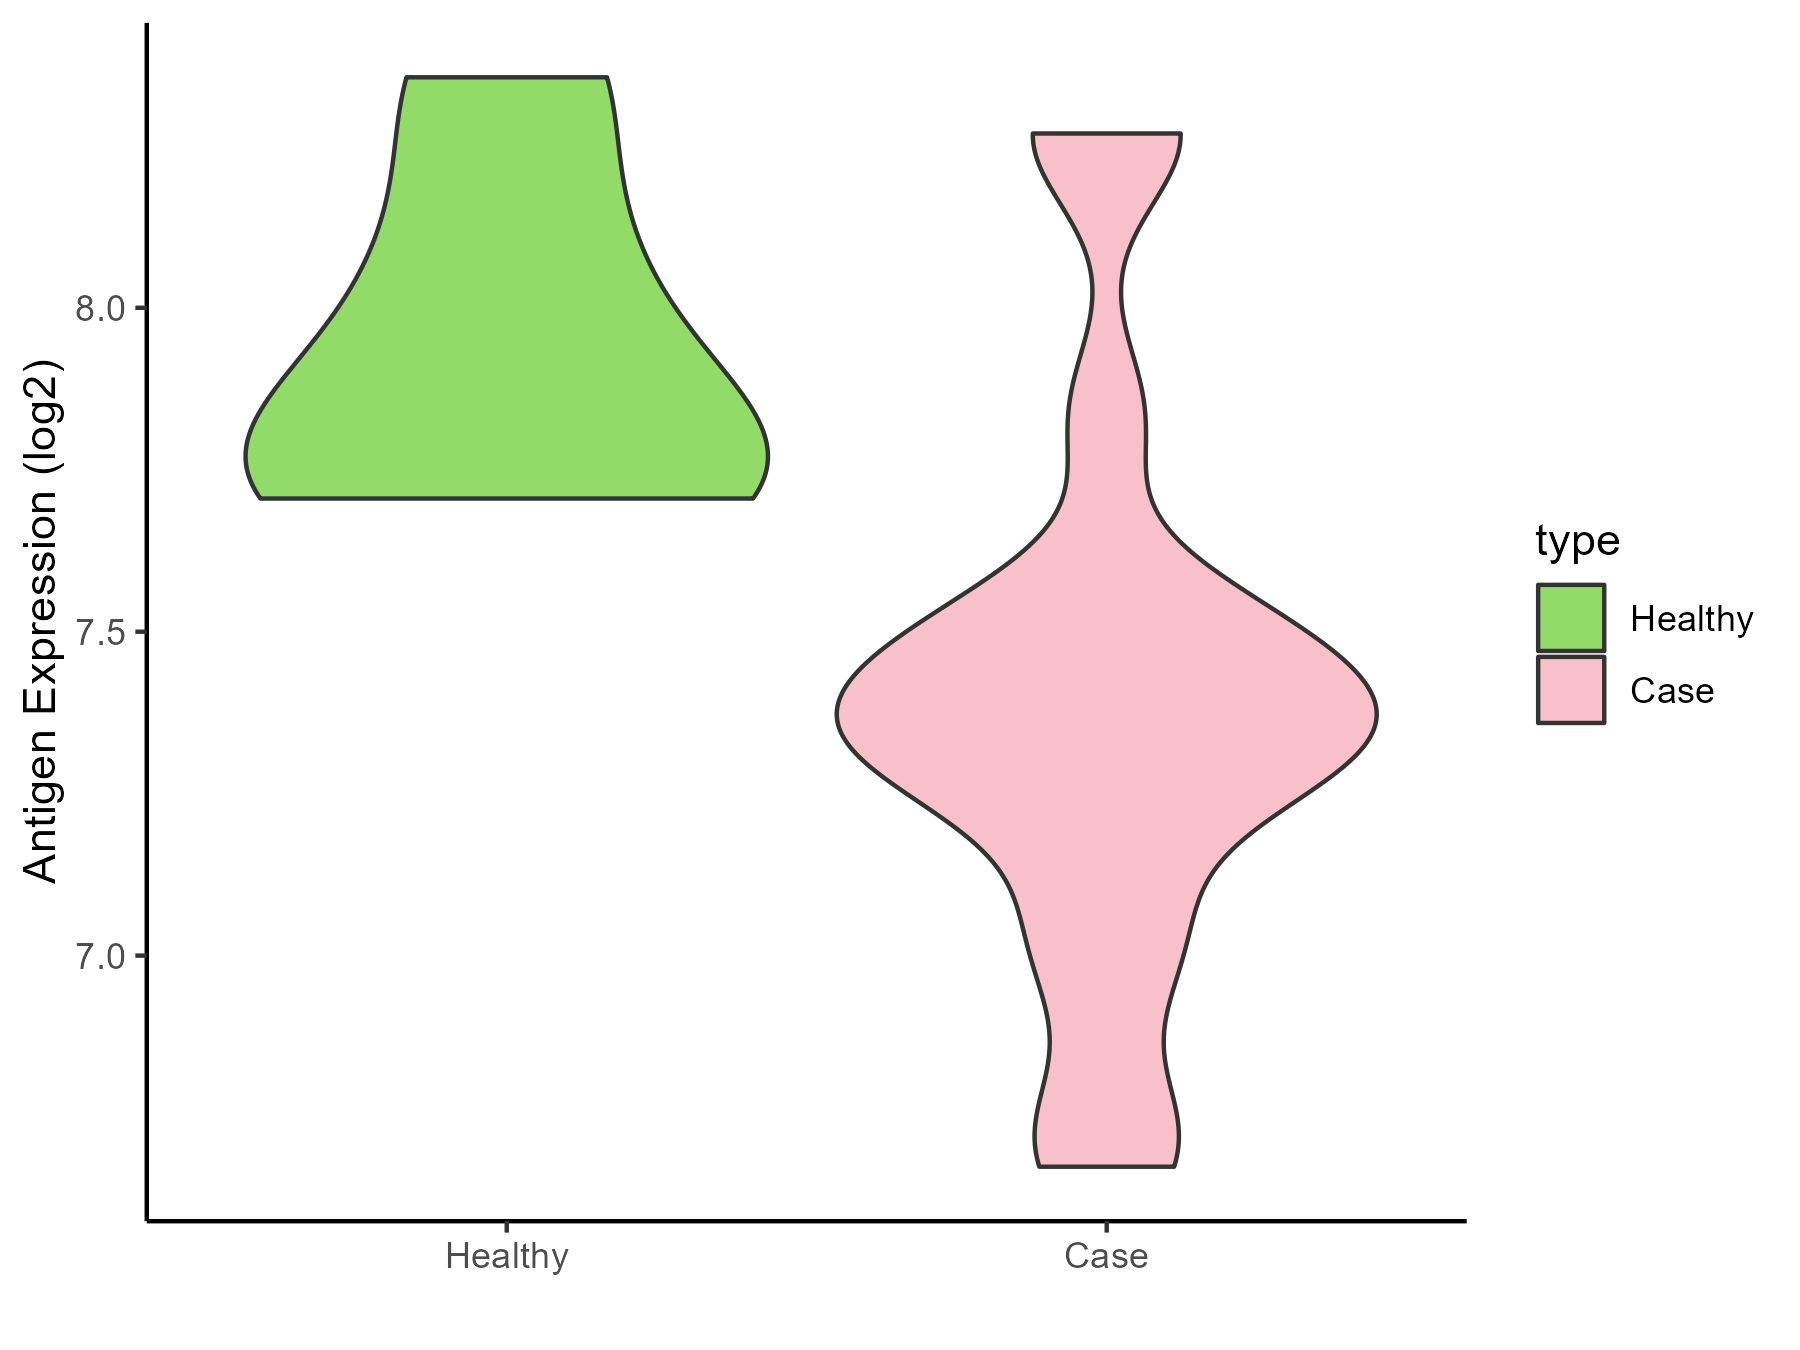
Neuroectodermal tumor |
| The Expression Level of Disease Section Compare with the Healthy Individual Tissue |
p-value: 8.70E-08;
Fold-change: -0.90355686;
Z-score: -4.3117005
|
| Disease-specific Antigen Abundances |
|
Click to View the Clearer Original Diagram
|
|
|
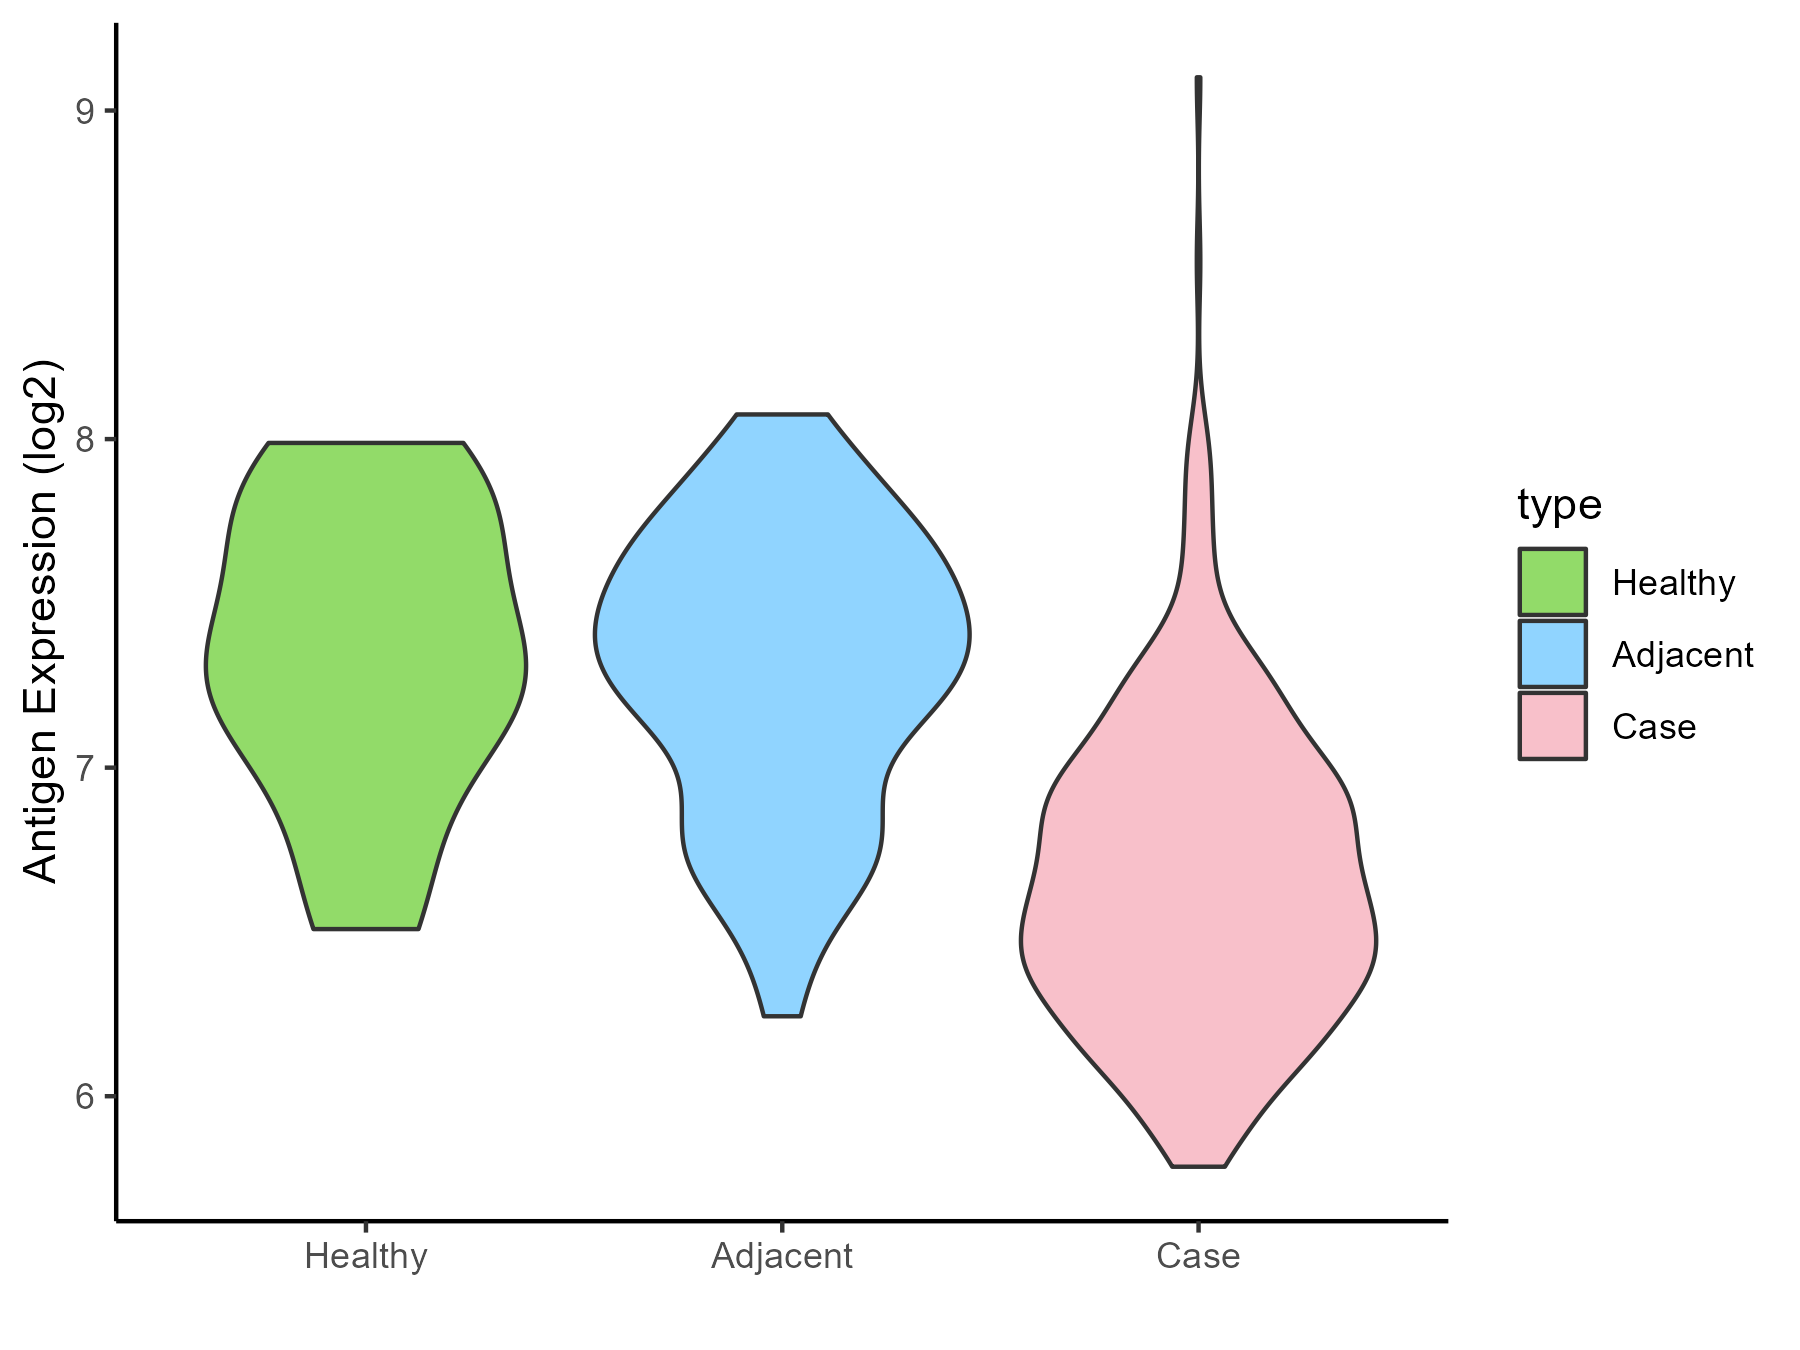
| The Studied Tissue |
Nervous |
| The Specific Disease |
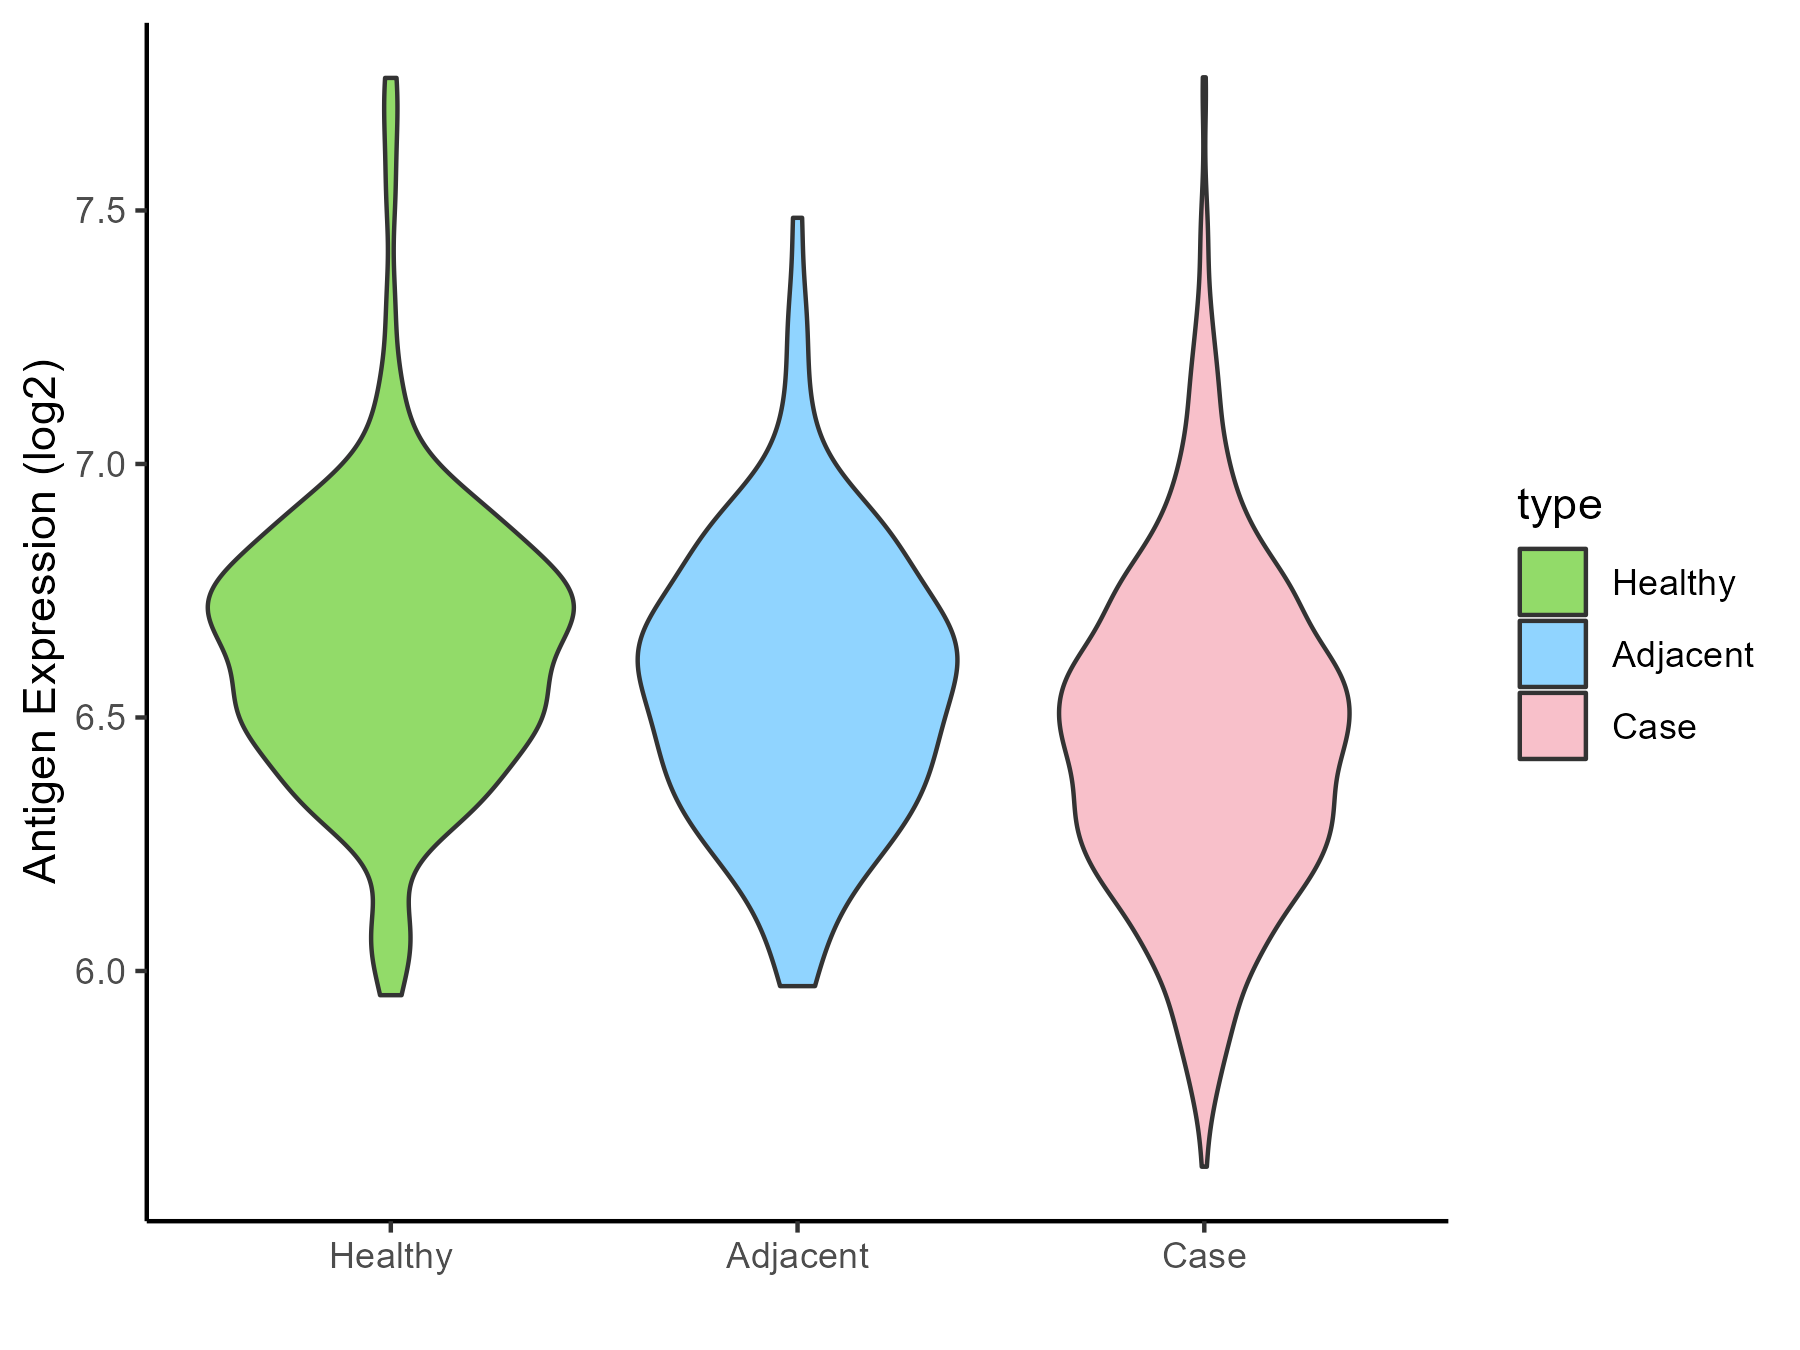
Brain cancer |
| The Expression Level of Disease Section Compare with the Healthy Individual Tissue |
p-value: 9.77E-87;
Fold-change: -0.59398594;
Z-score: -1.500763009
|
| Disease-specific Antigen Abundances |
|
Click to View the Clearer Original Diagram
|
|
|
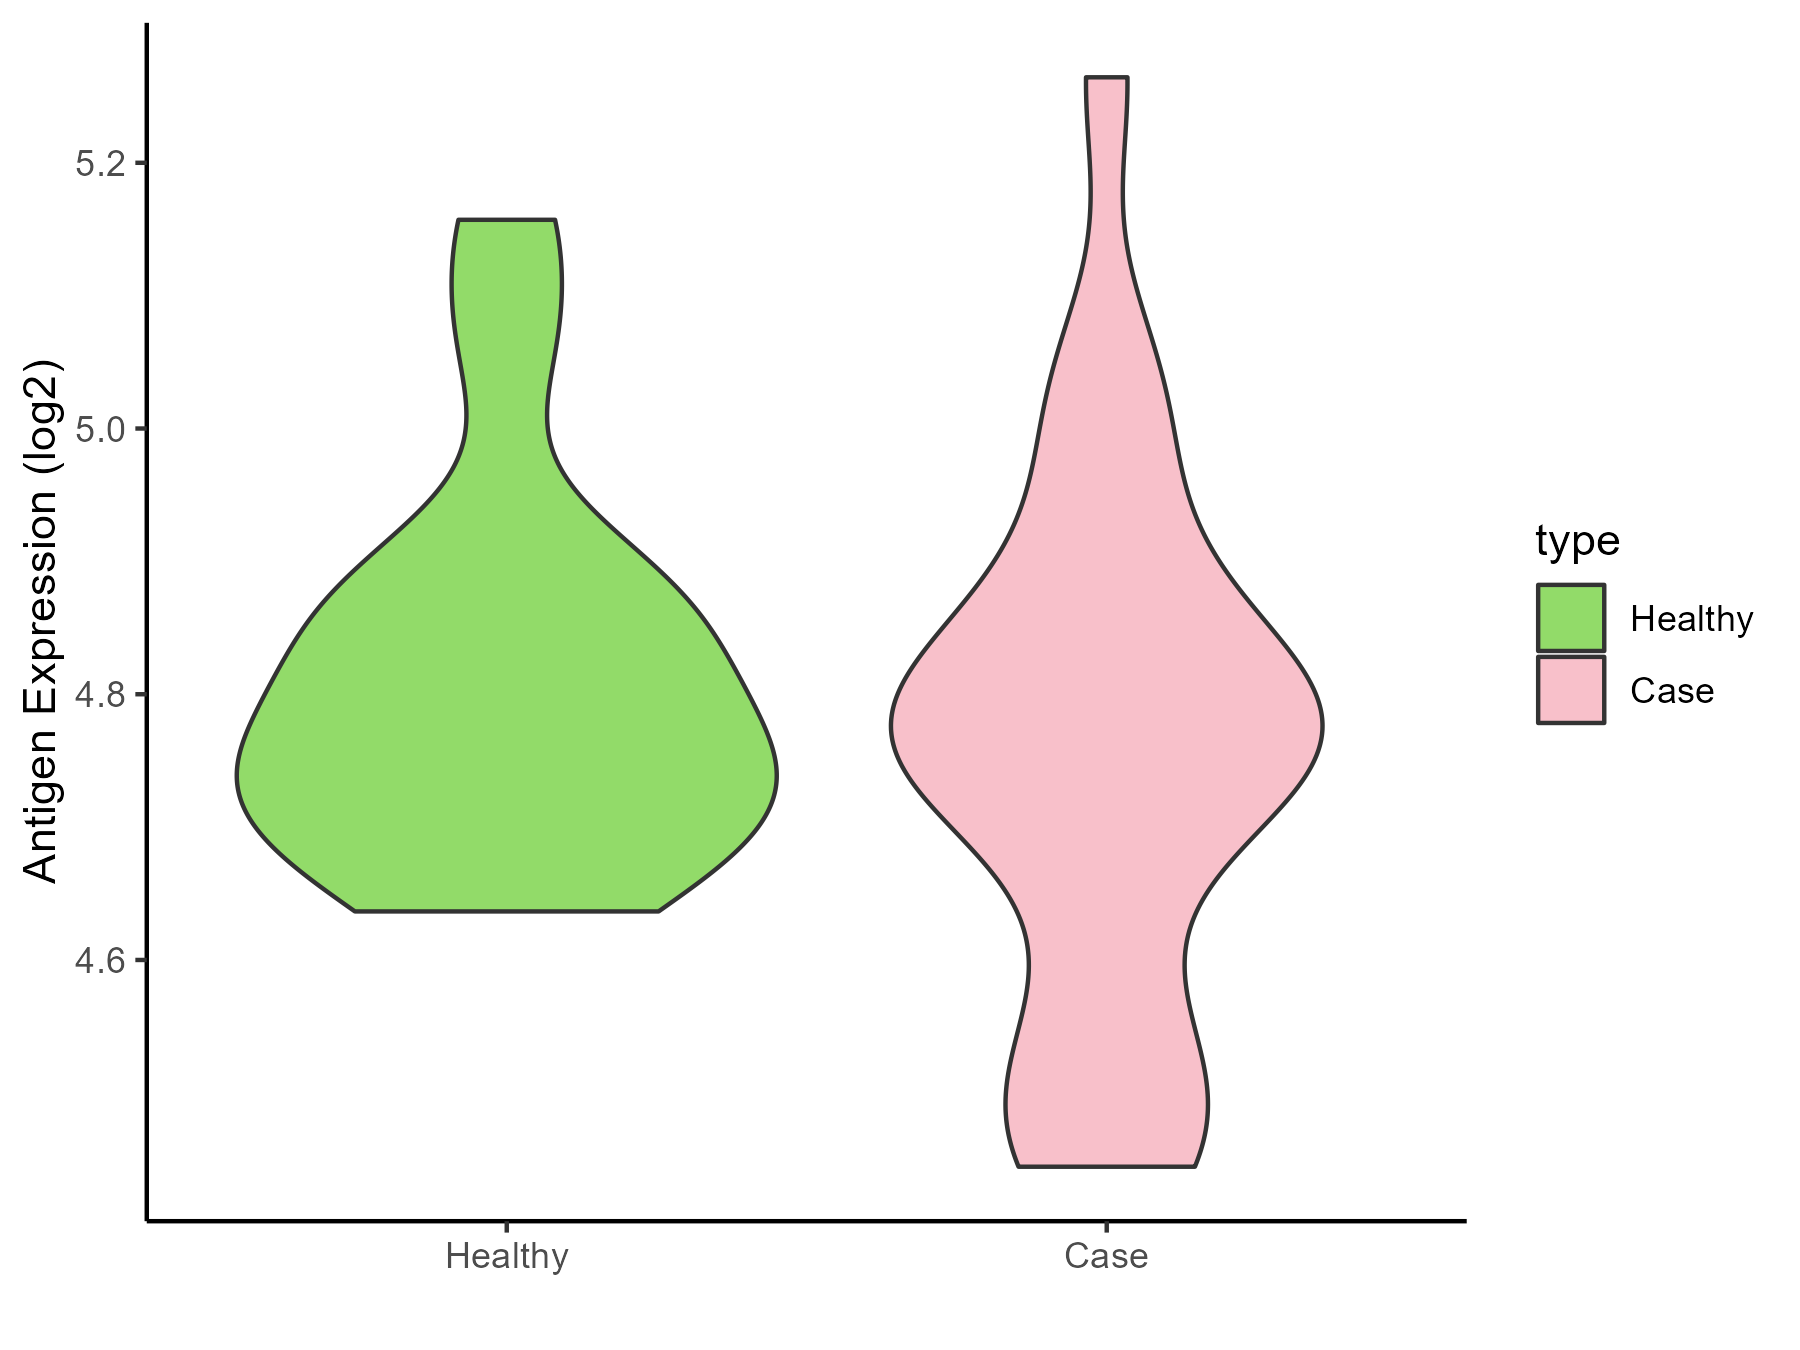
Chronic myeloid leukemia [ICD-11: 2A20]
Click to Show/Hide
| Differential expression pattern of antigen in diseases |
| The Studied Tissue |
Whole blood |
| The Specific Disease |
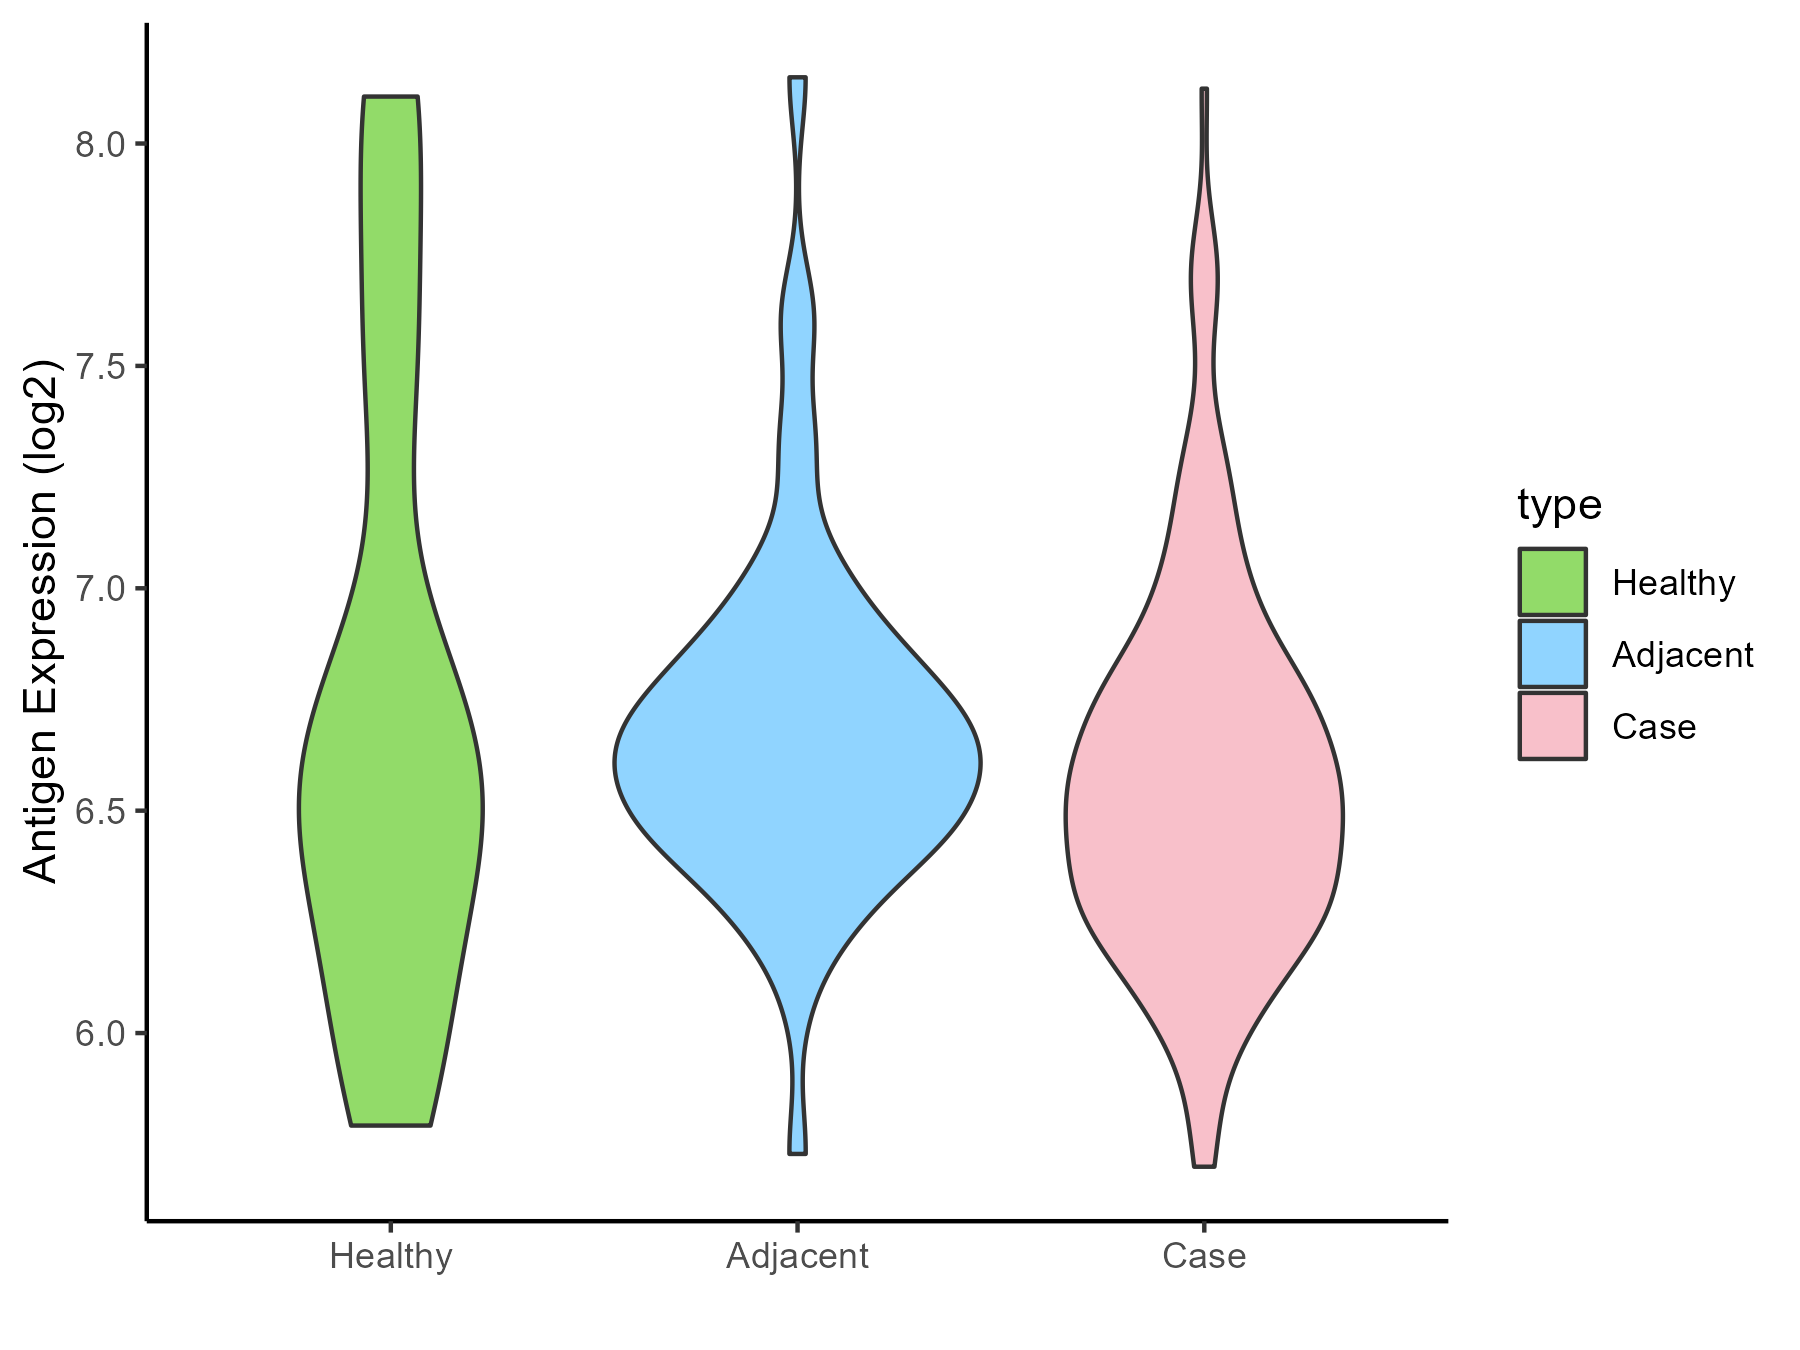
Myelofibrosis |
| The Expression Level of Disease Section Compare with the Healthy Individual Tissue |
p-value: 0.515865841;
Fold-change: 0.038466124;
Z-score: 0.178468348
|
| Disease-specific Antigen Abundances |
|
Click to View the Clearer Original Diagram
|
|
|
| The Studied Tissue |
Whole blood |
| The Specific Disease |
Polycythemia vera |
| The Expression Level of Disease Section Compare with the Healthy Individual Tissue |
p-value: 2.25E-06;
Fold-change: 0.29206664;
Z-score: 1.209926488
|
| Disease-specific Antigen Abundances |
|
Click to View the Clearer Original Diagram
|
|
|
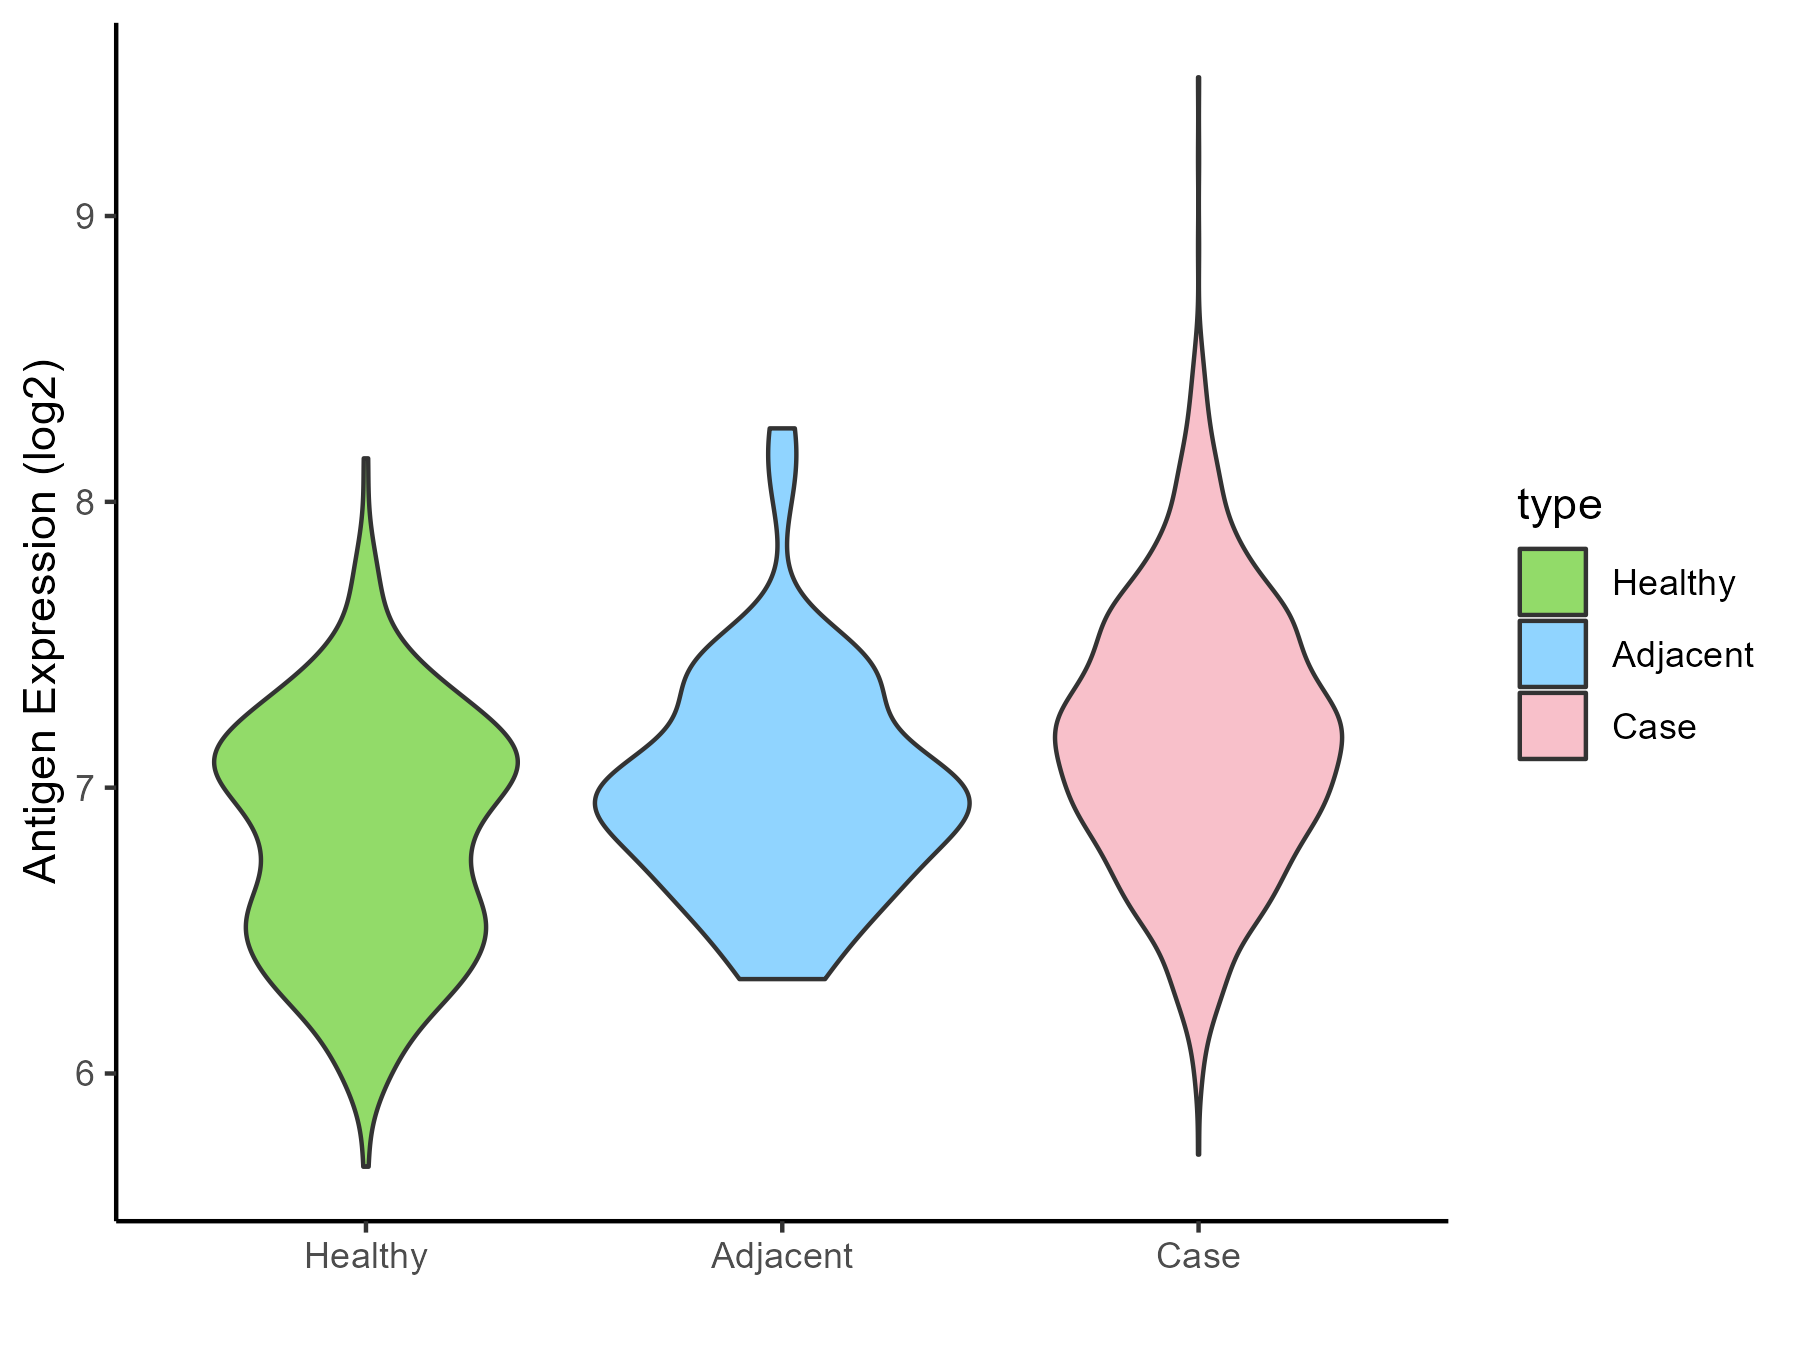
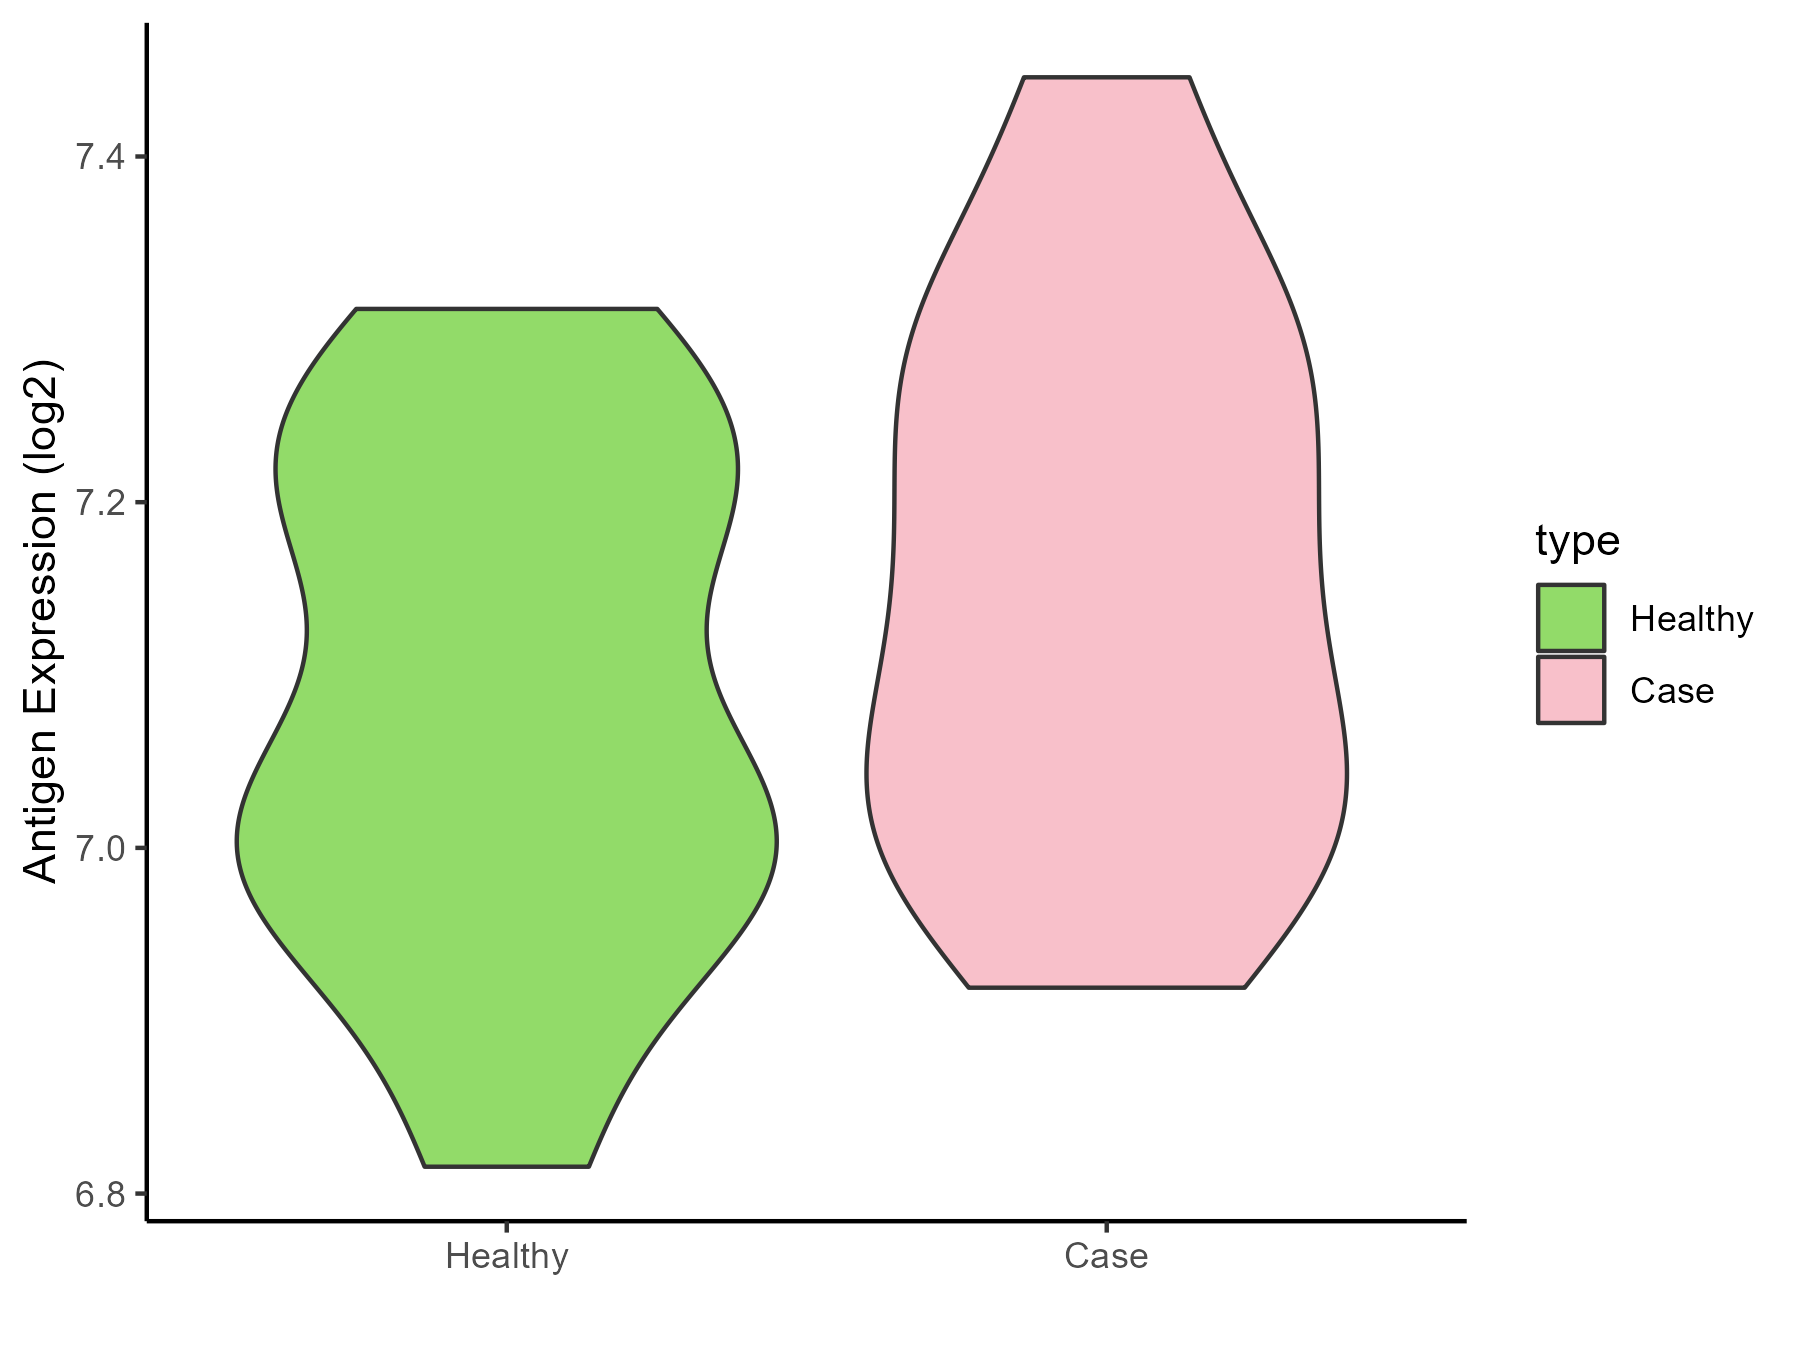
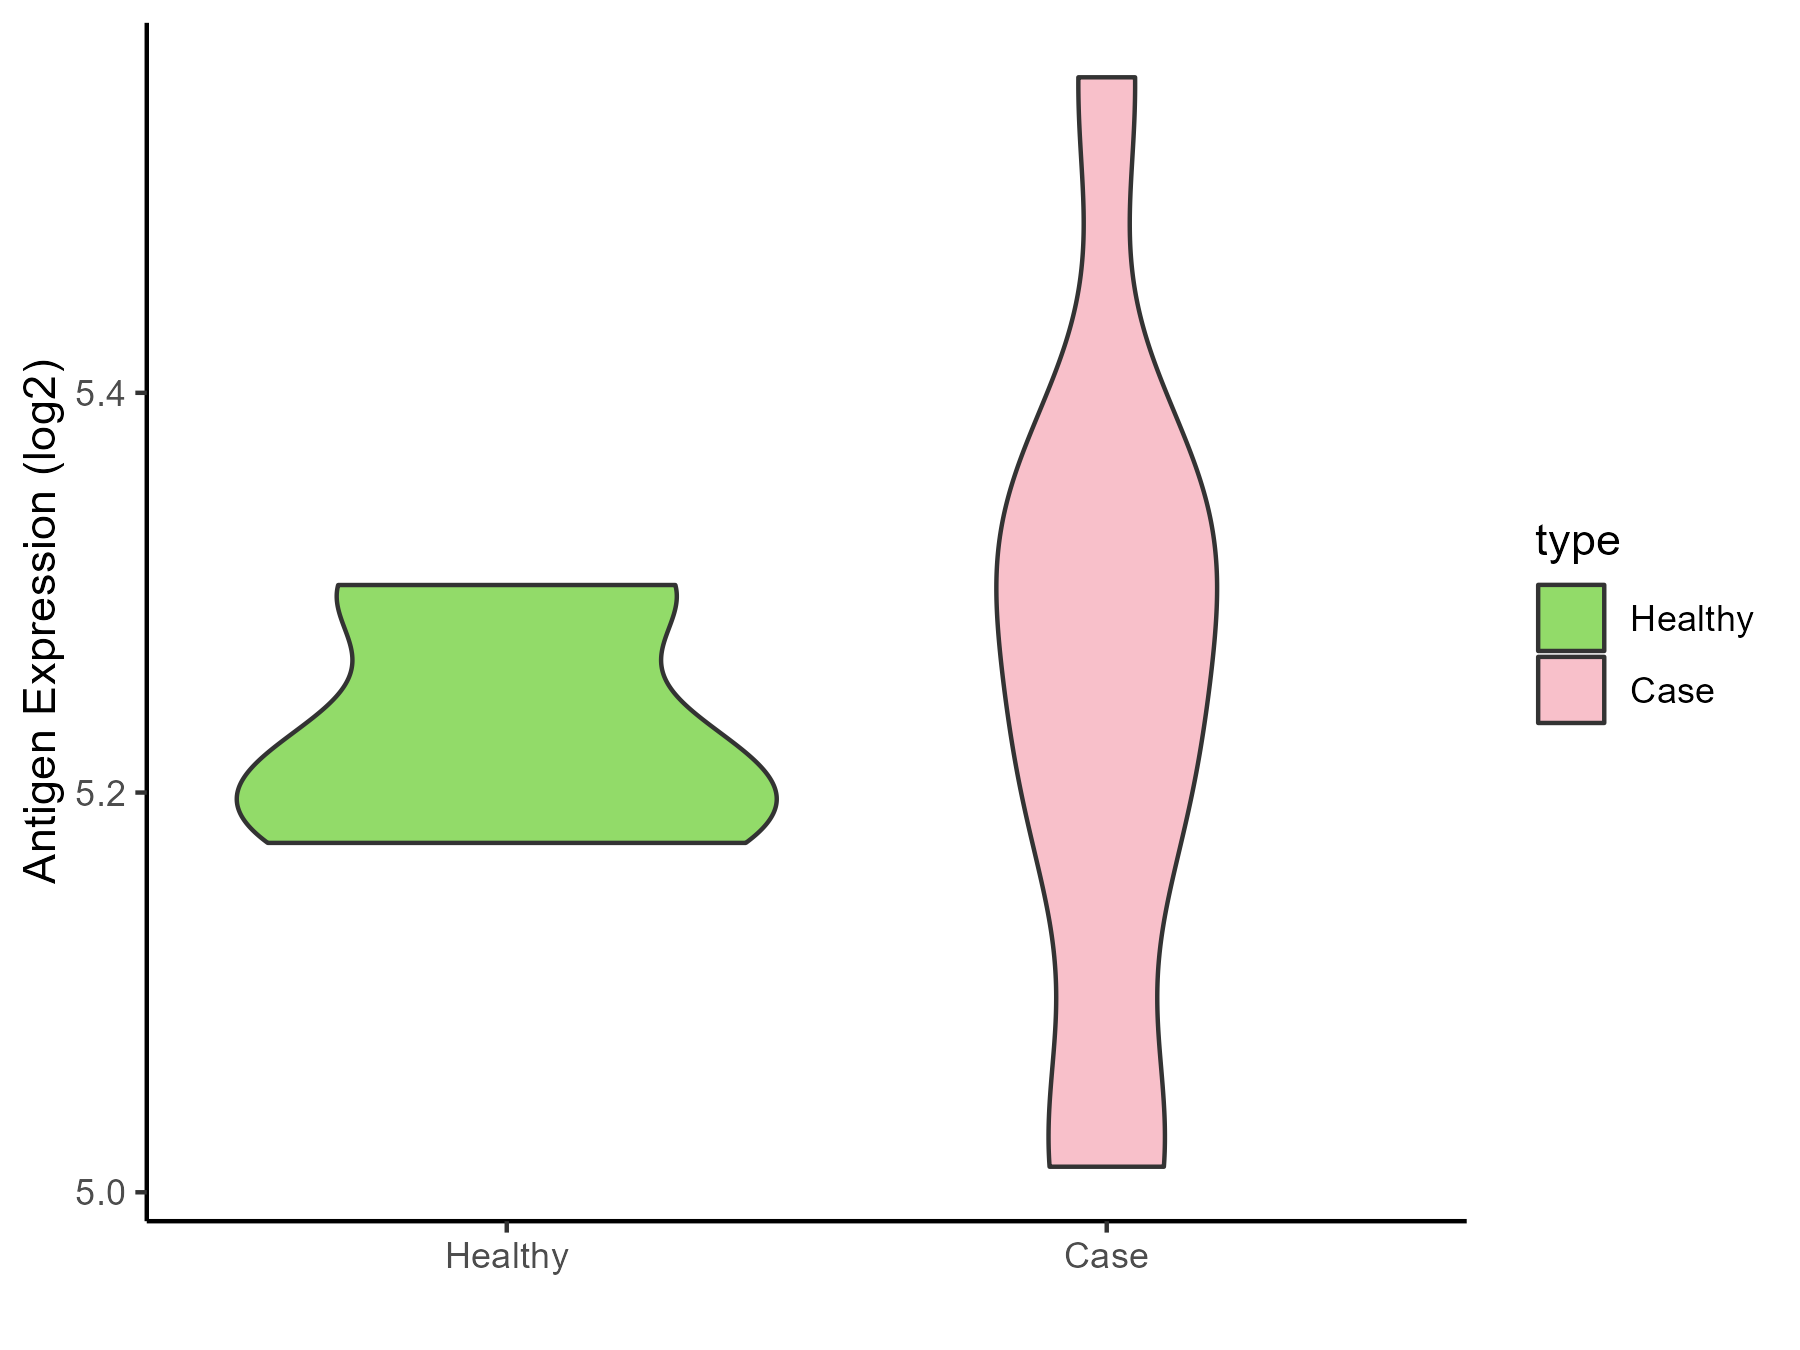
MyeloDysplastic syndromes [ICD-11: 2A37]
Click to Show/Hide
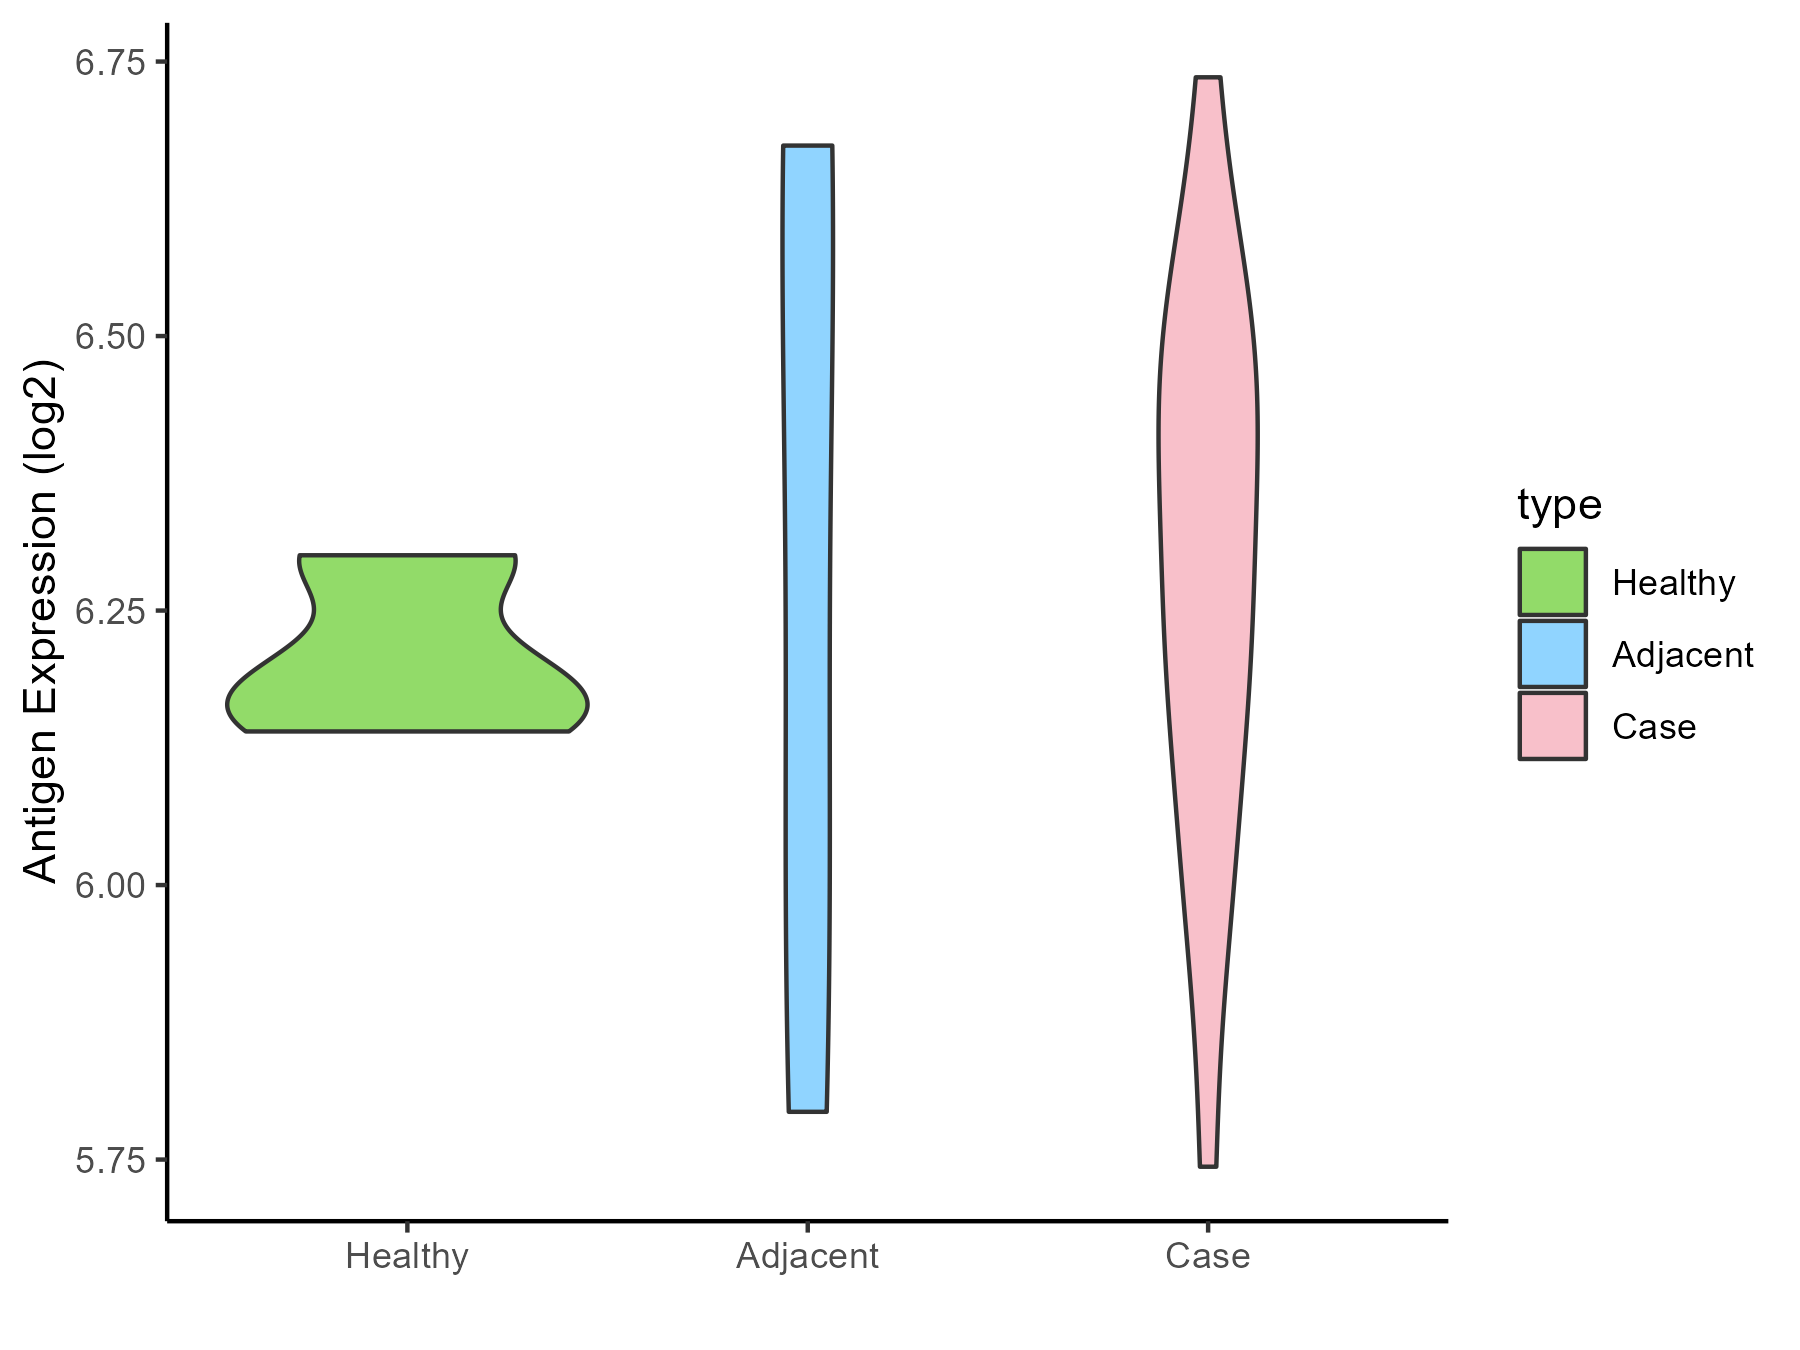
| Differential expression pattern of antigen in diseases |
| The Studied Tissue |
Bone marrow |
| The Specific Disease |
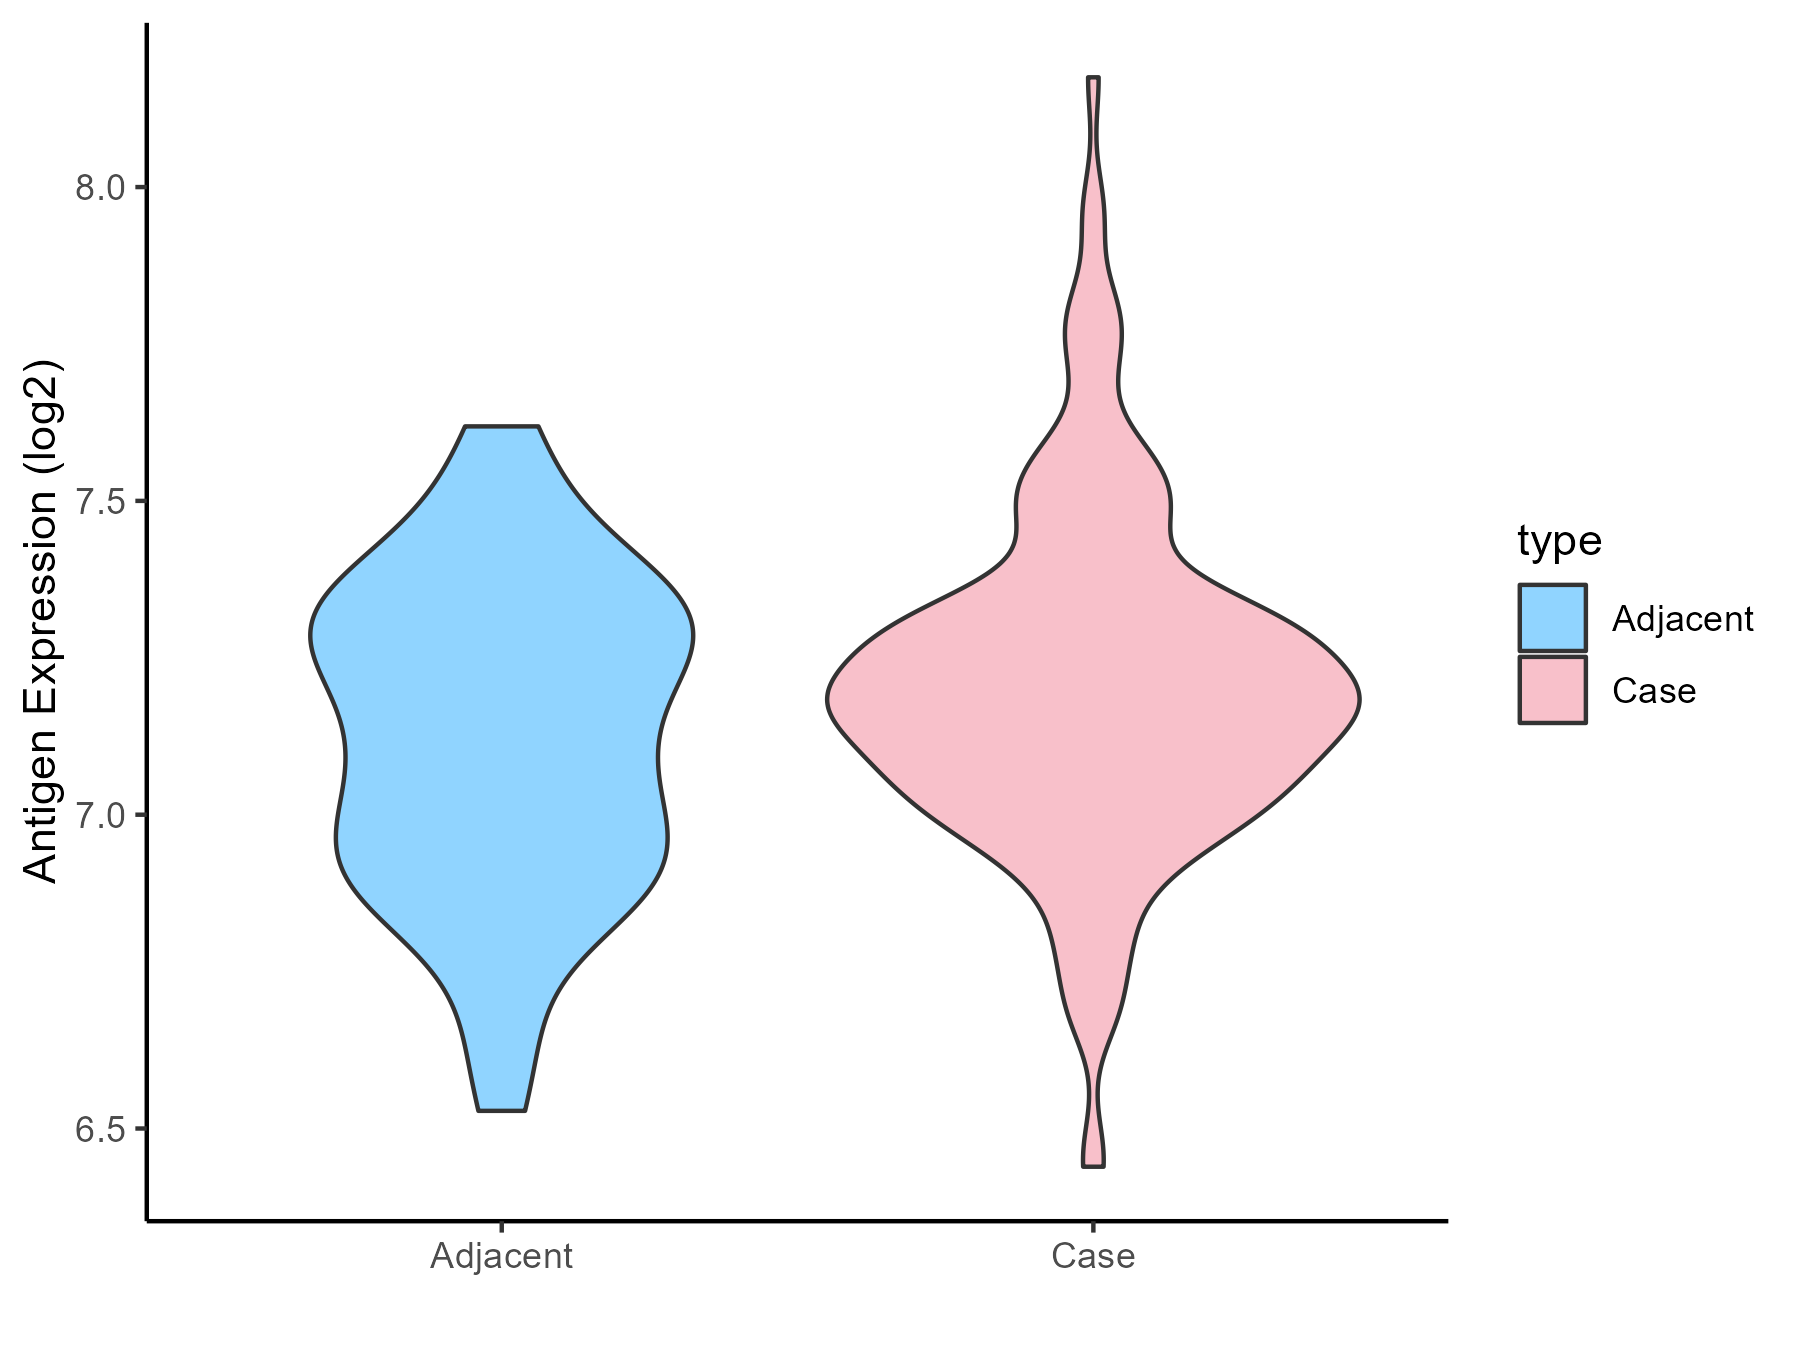
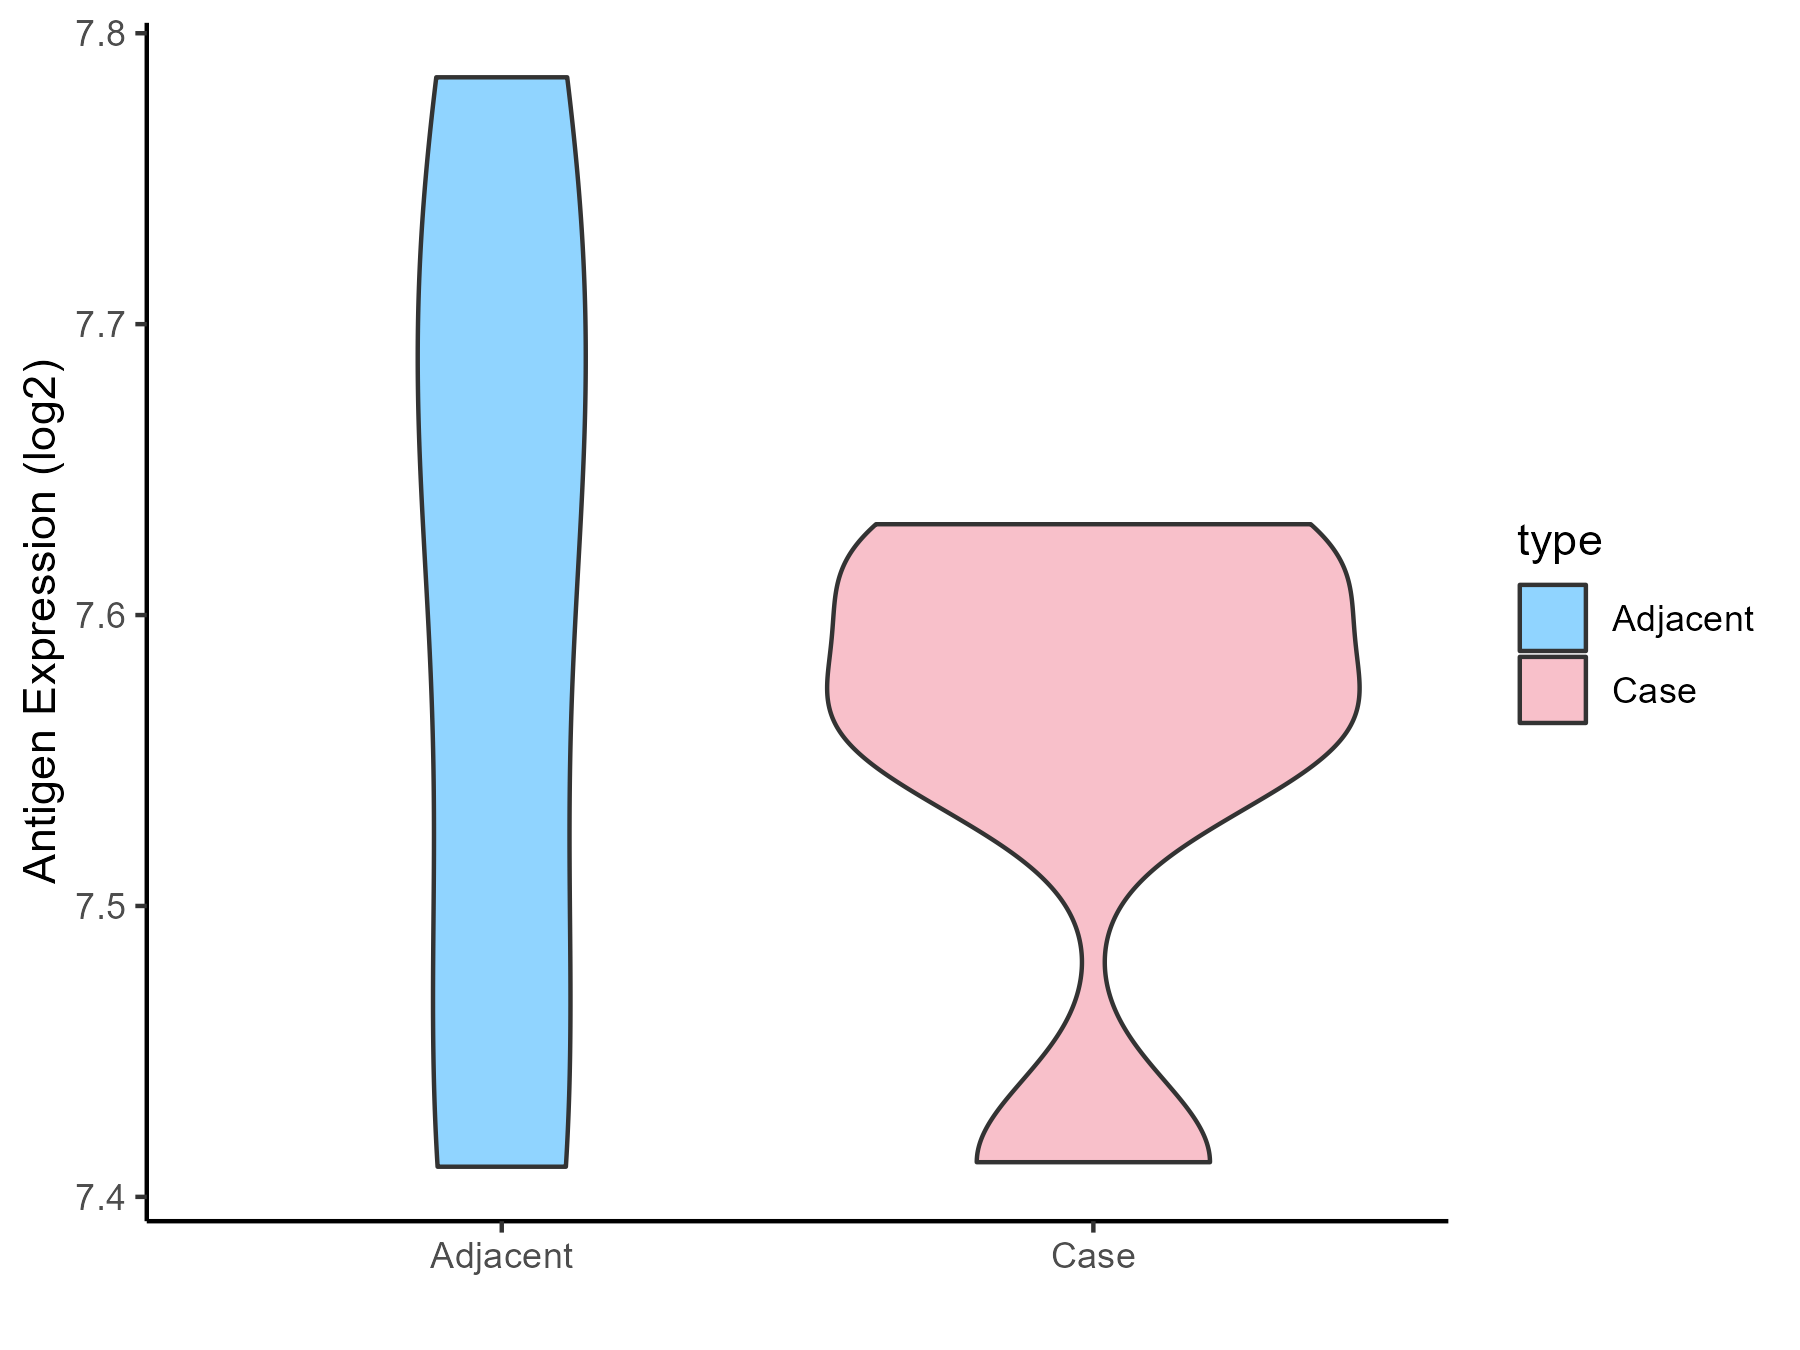
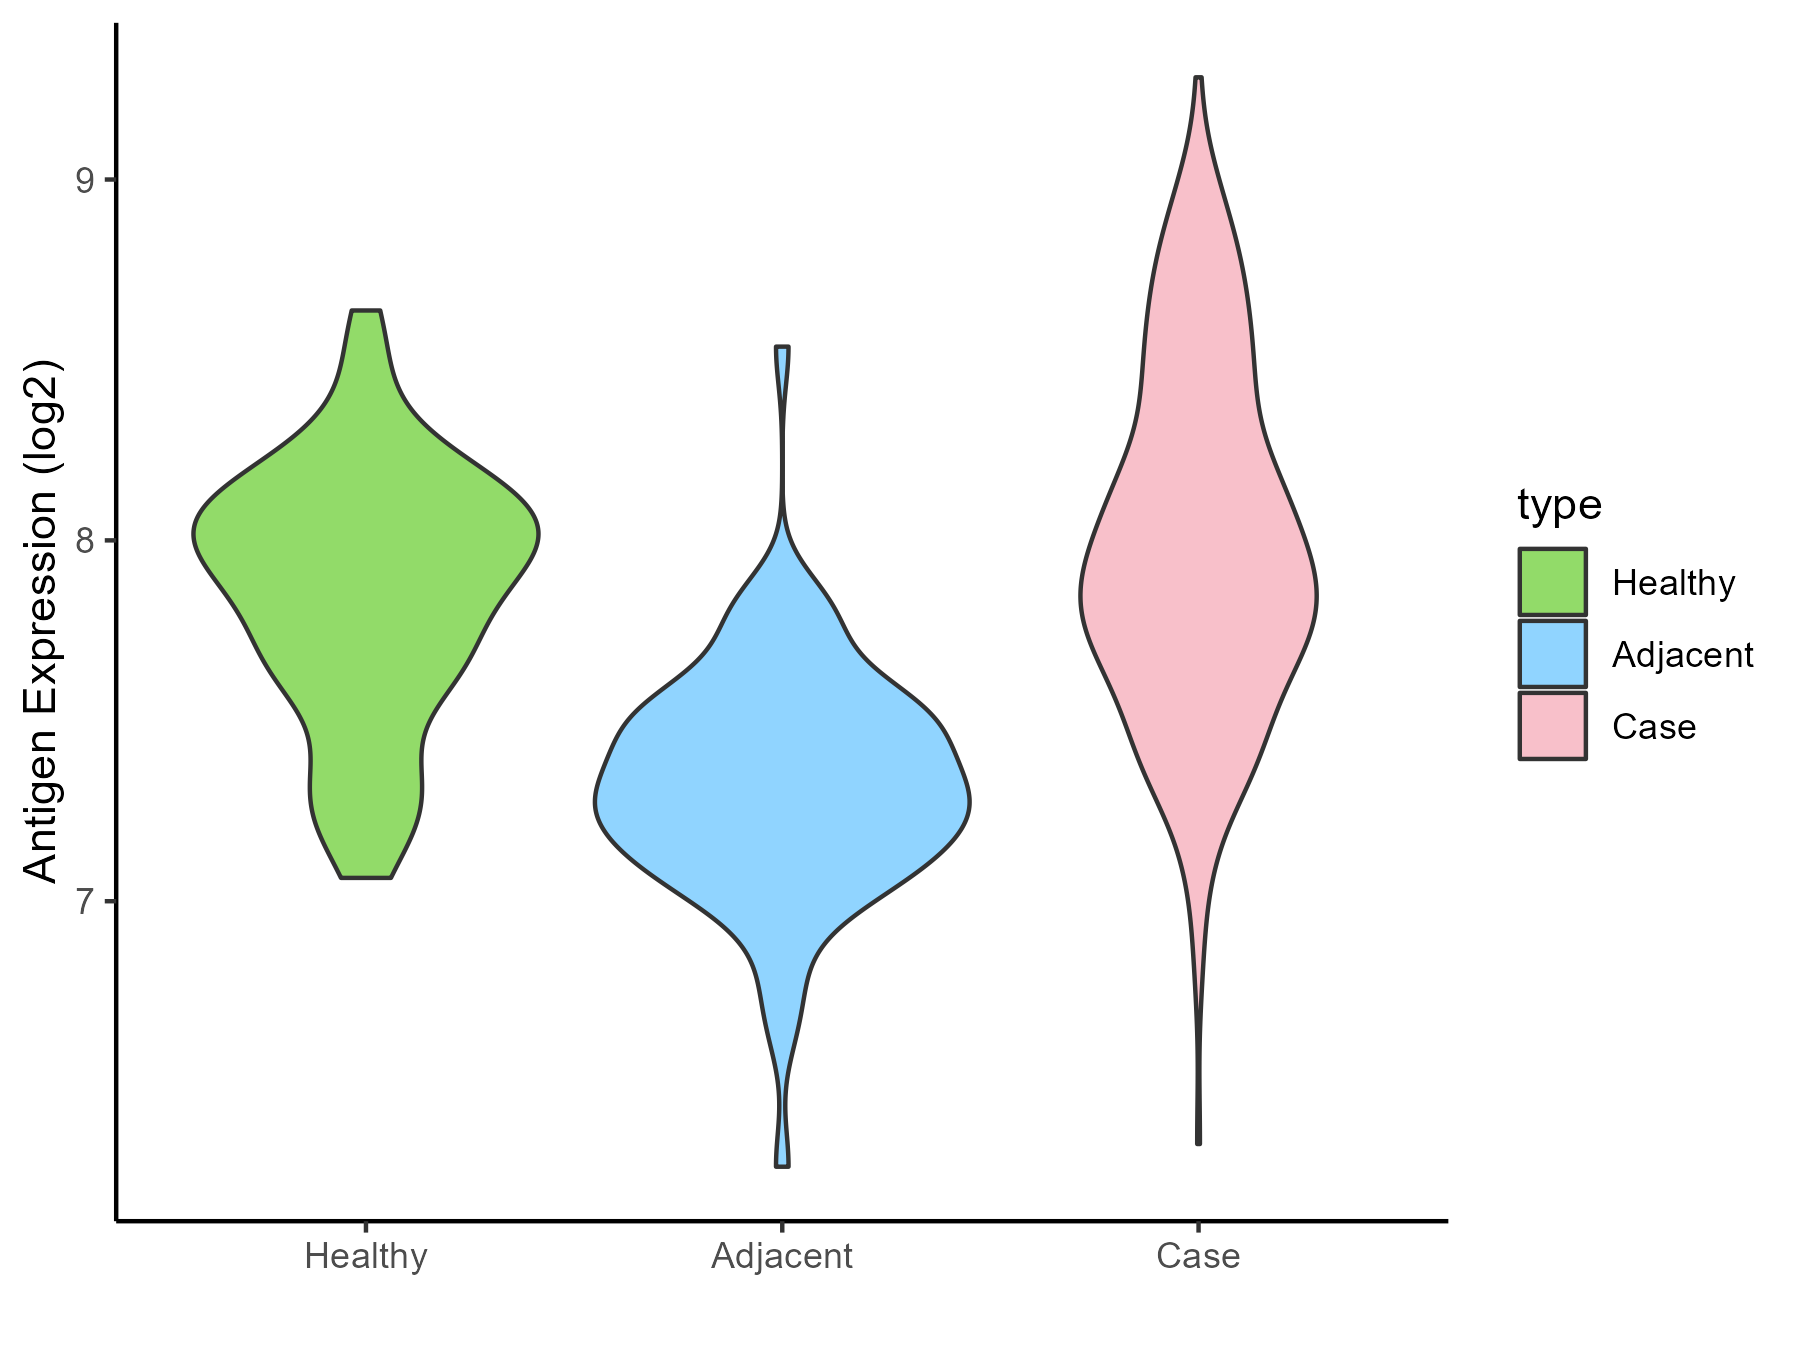
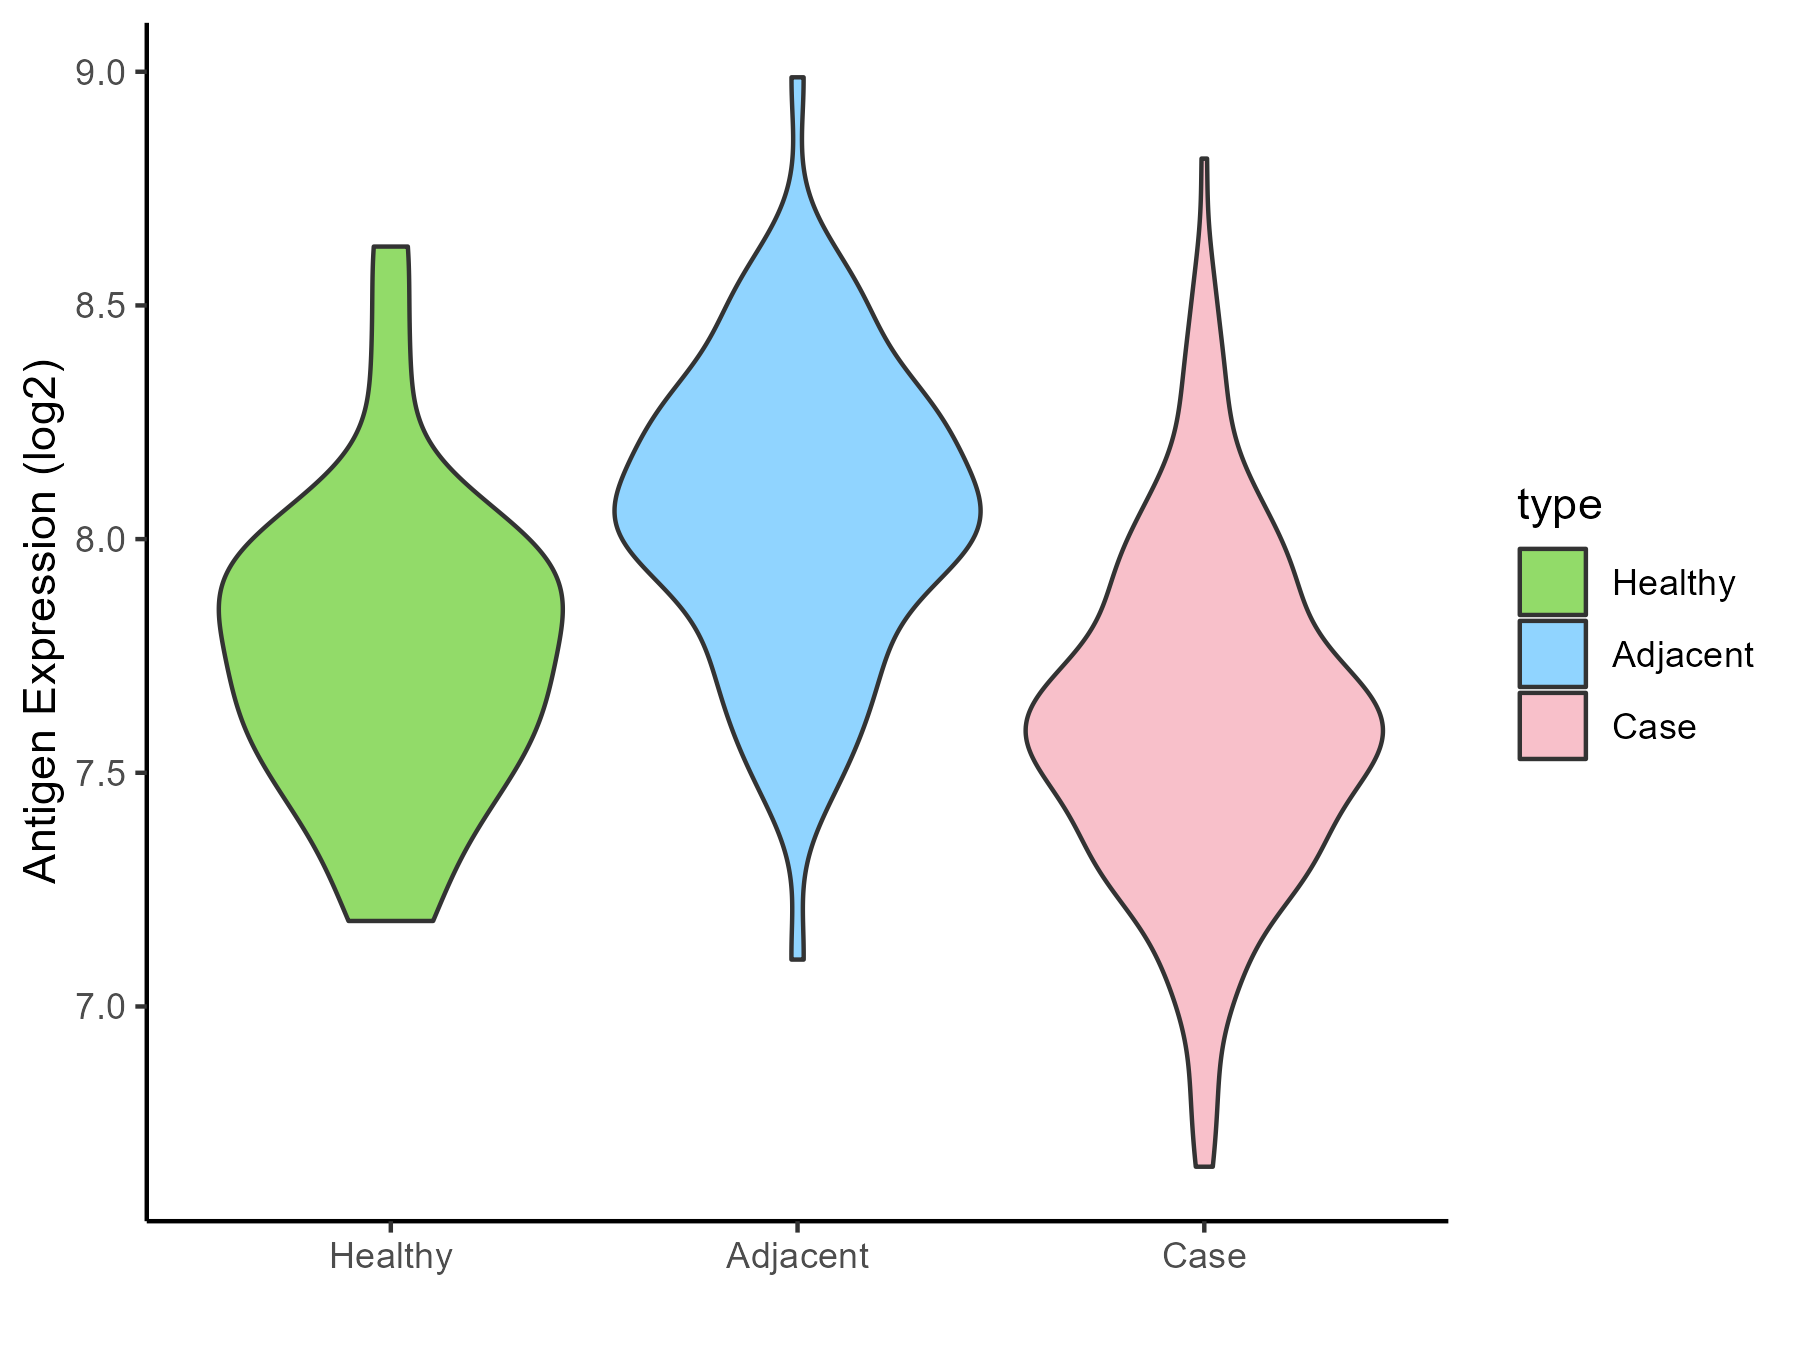
Myelodysplastic syndromes |
| The Expression Level of Disease Section Compare with the Healthy Individual Tissue |
p-value: 0.614260321;
Fold-change: 0.046110906;
Z-score: 0.182842905
|
| The Expression Level of Disease Section Compare with the Adjacent Tissue |
p-value: 0.517099469;
Fold-change: -0.003767157;
Z-score: -0.020487105
|
| Disease-specific Antigen Abundances |
|
Click to View the Clearer Original Diagram
|
|
|
Lymphoma [ICD-11: 2A90- 2A85]
Click to Show/Hide
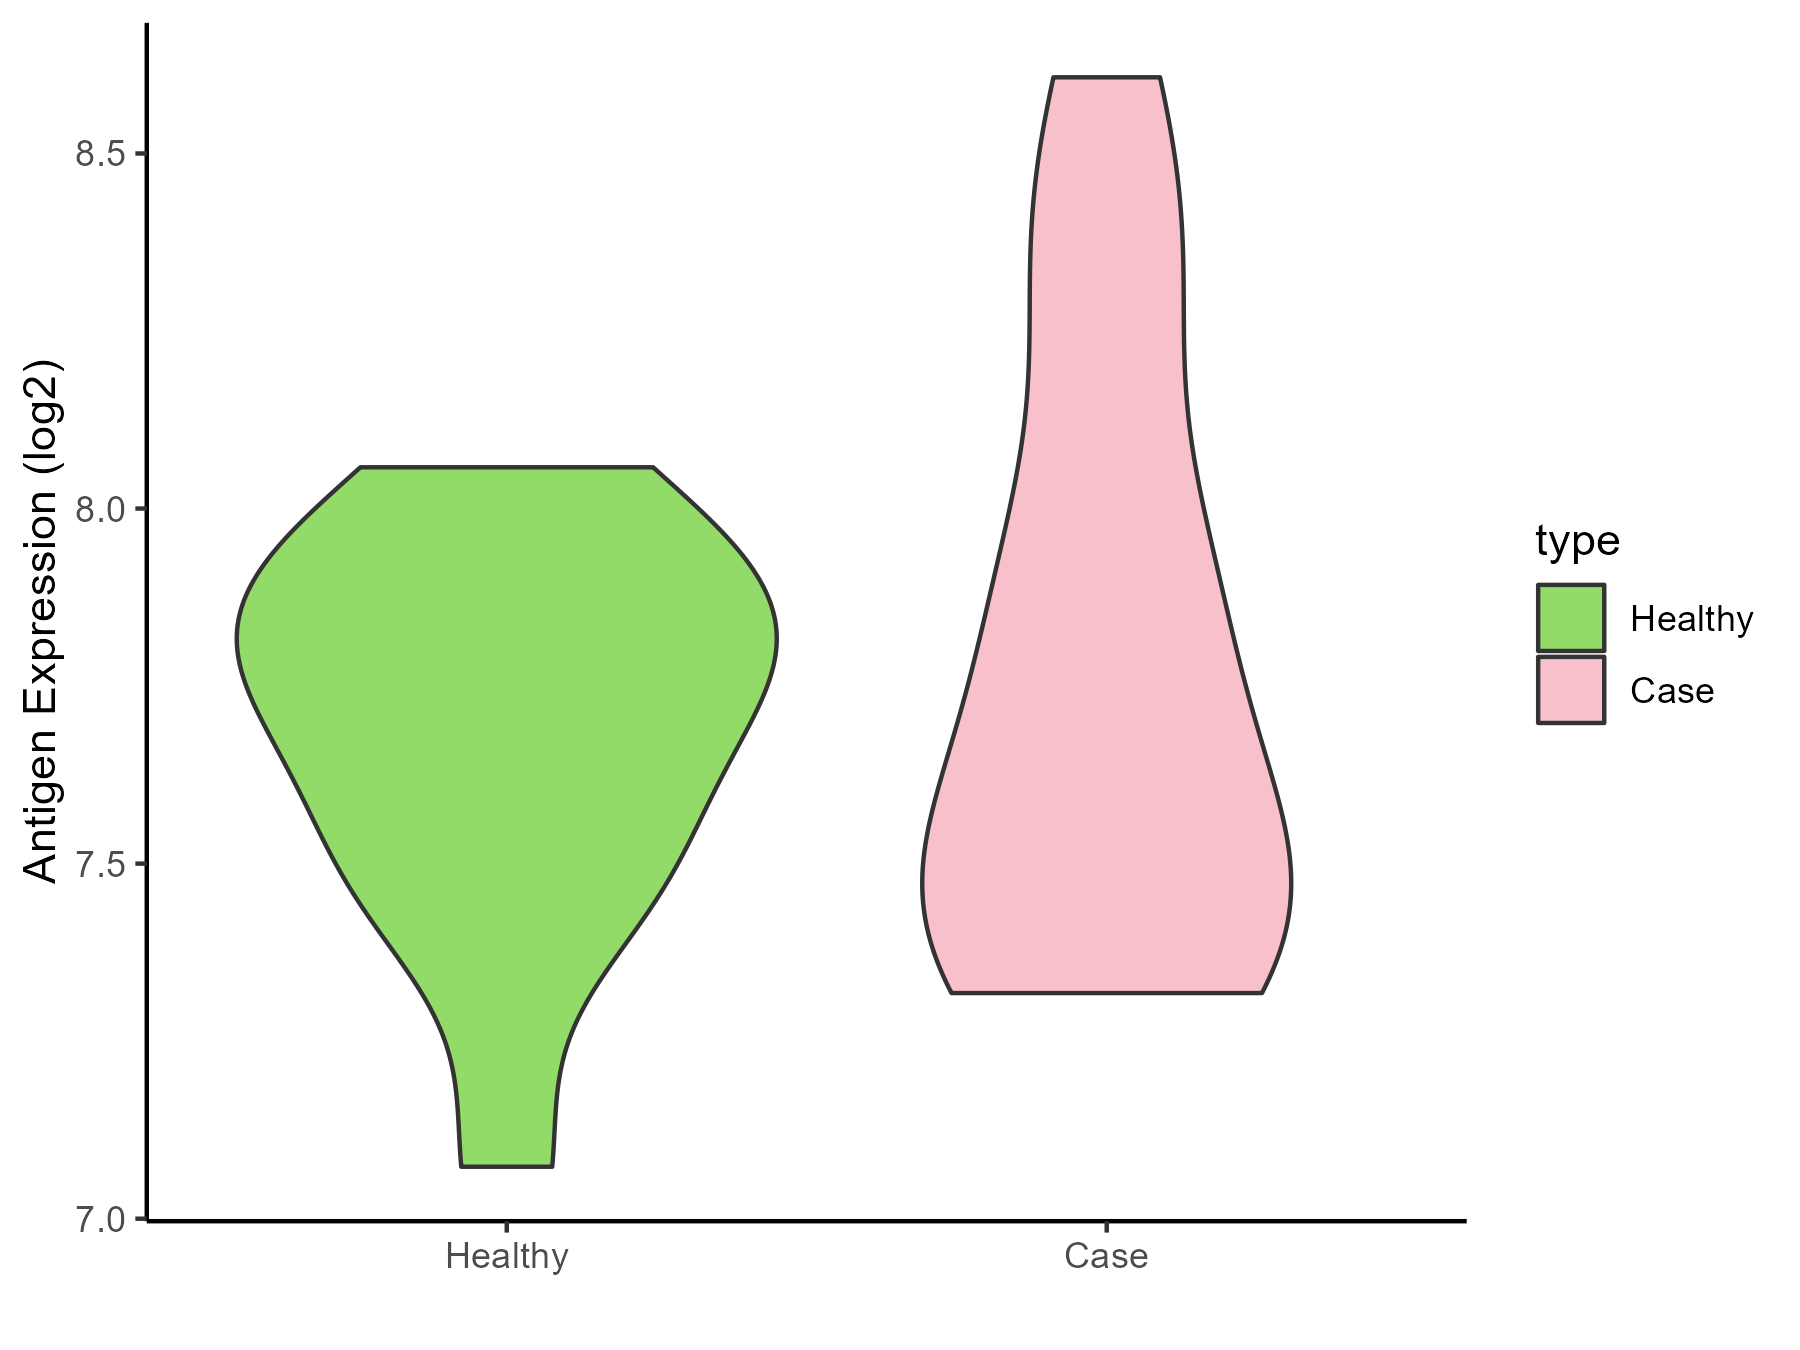
| Differential expression pattern of antigen in diseases |
| The Studied Tissue |
Tonsil |
| The Specific Disease |
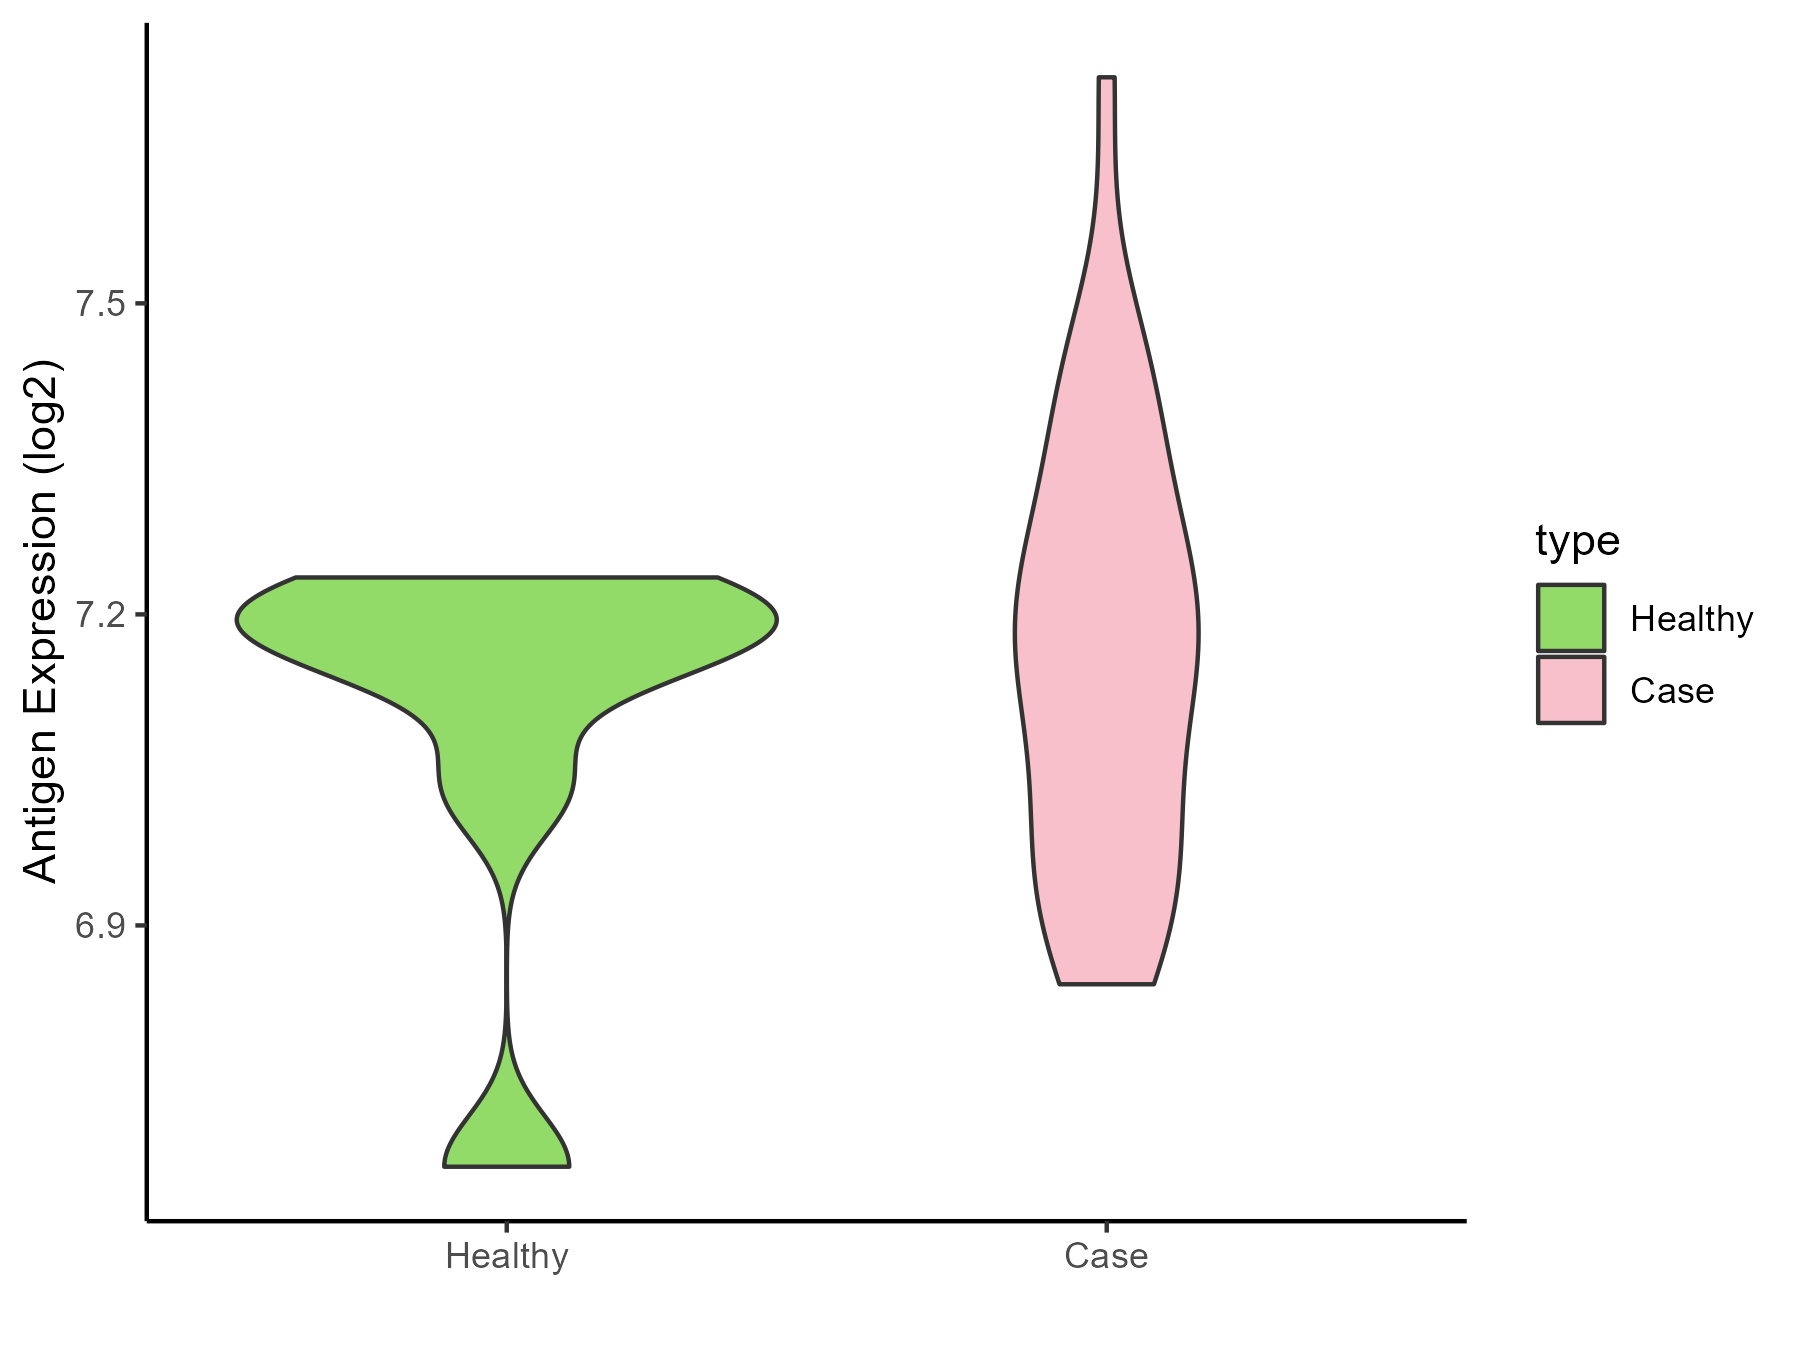
Lymphoma |
| The Expression Level of Disease Section Compare with the Healthy Individual Tissue |
p-value: 0.540318984;
Fold-change: -0.045401986;
Z-score: -0.07308374
|
| Disease-specific Antigen Abundances |
|
Click to View the Clearer Original Diagram
|
|
|
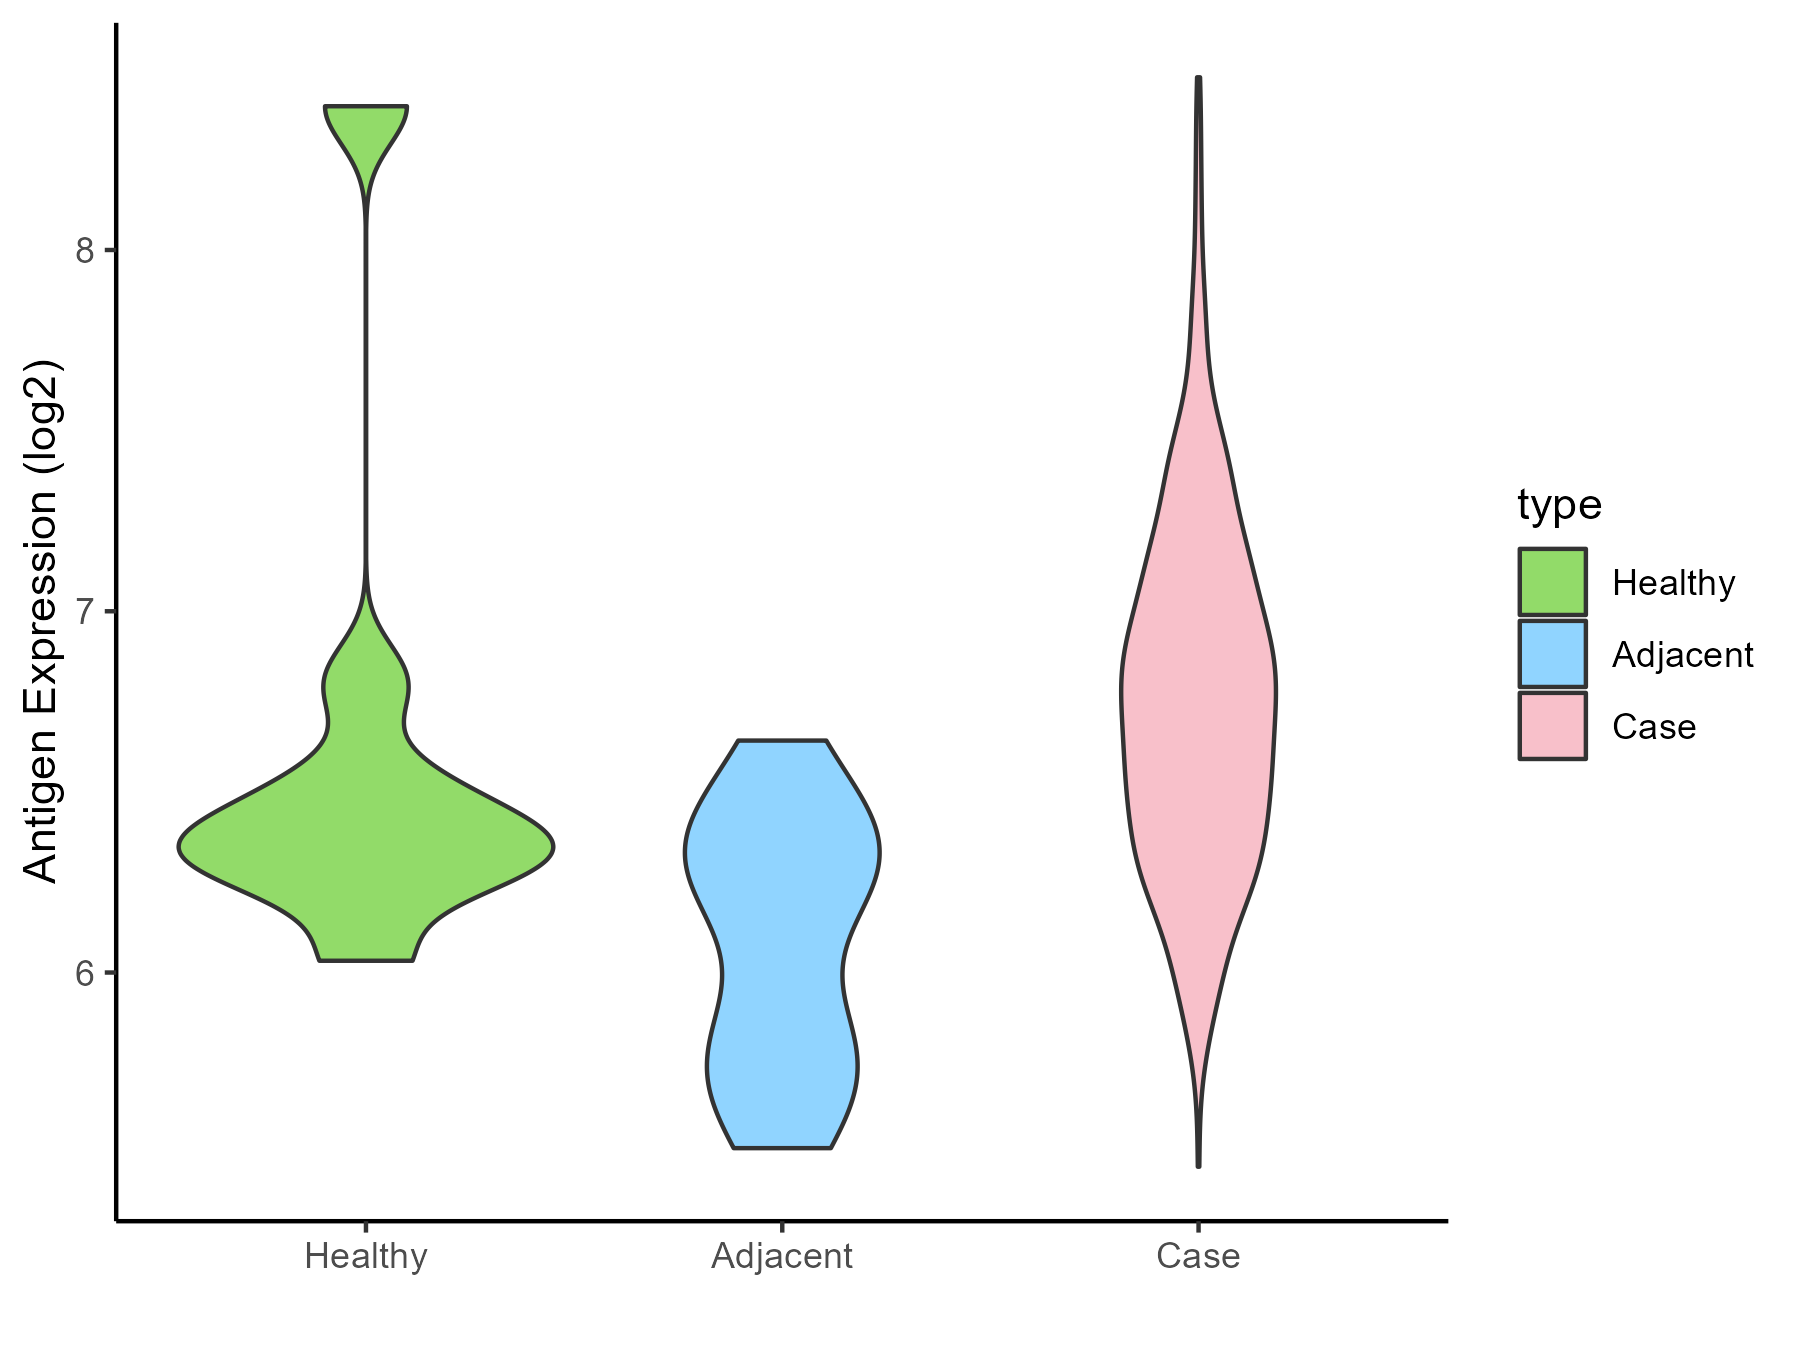
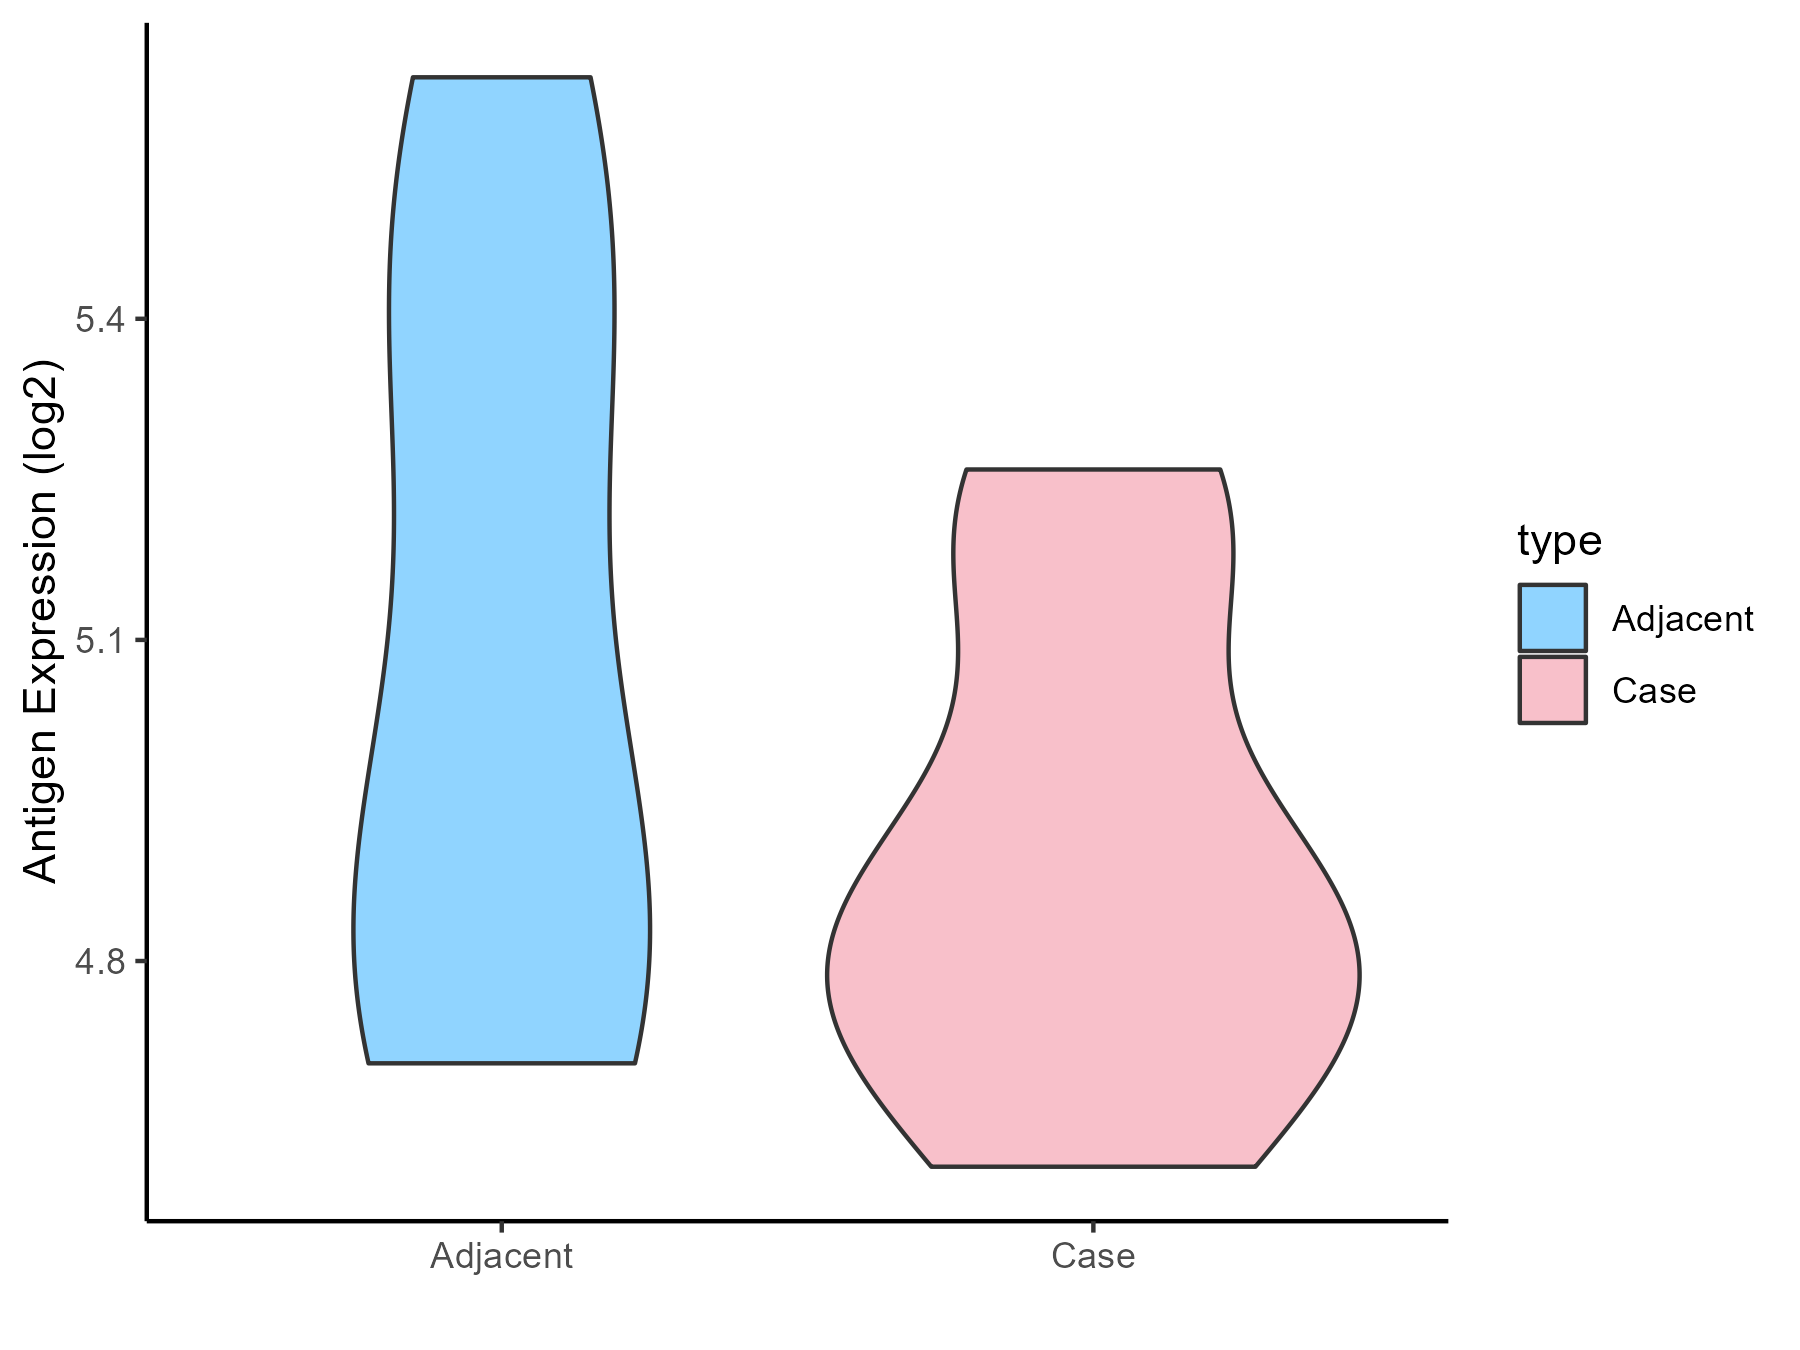
Gastric cancer [ICD-11: 2B72]
Click to Show/Hide
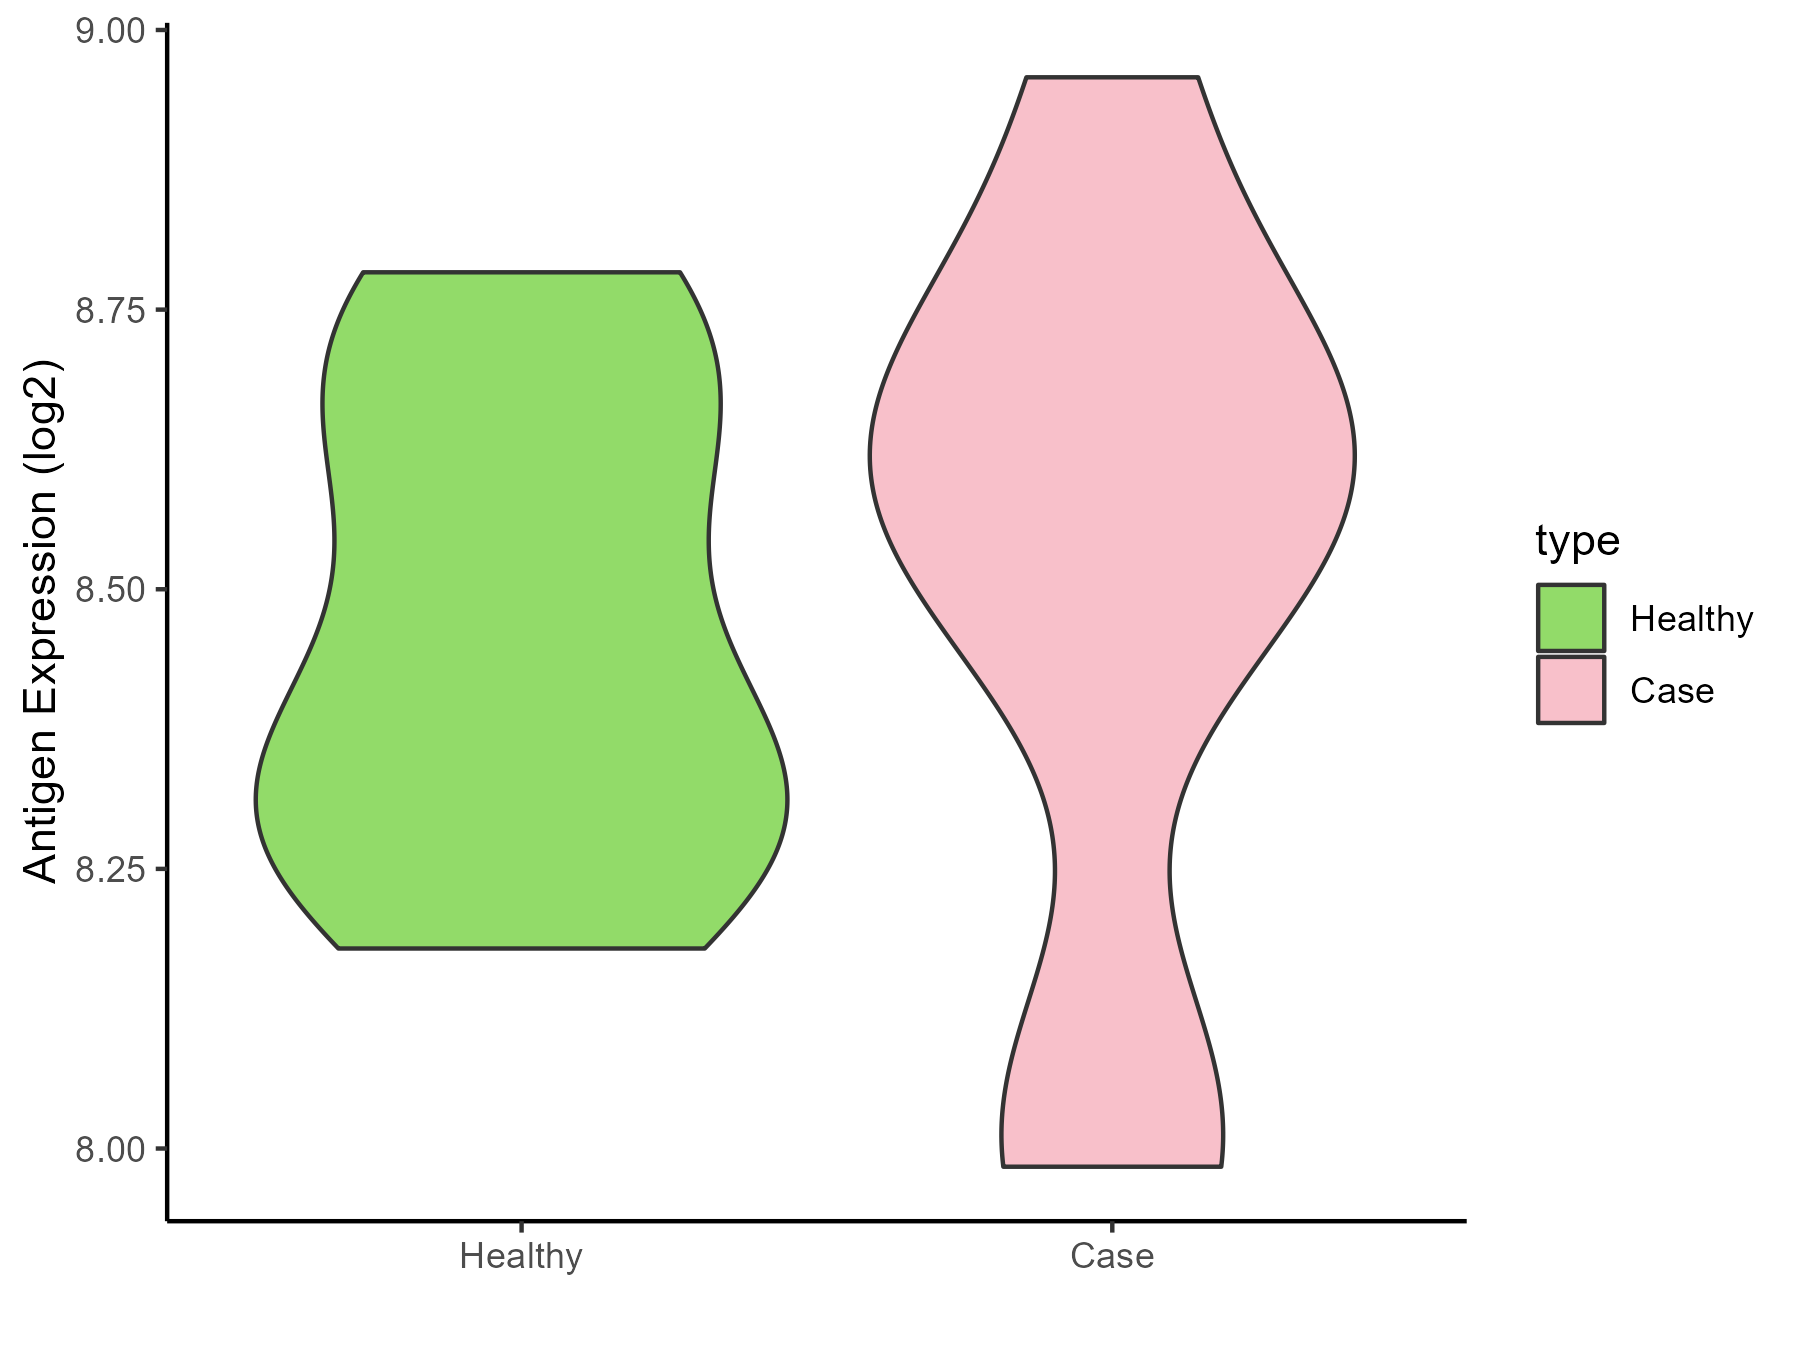
| Differential expression pattern of antigen in diseases |
| The Studied Tissue |
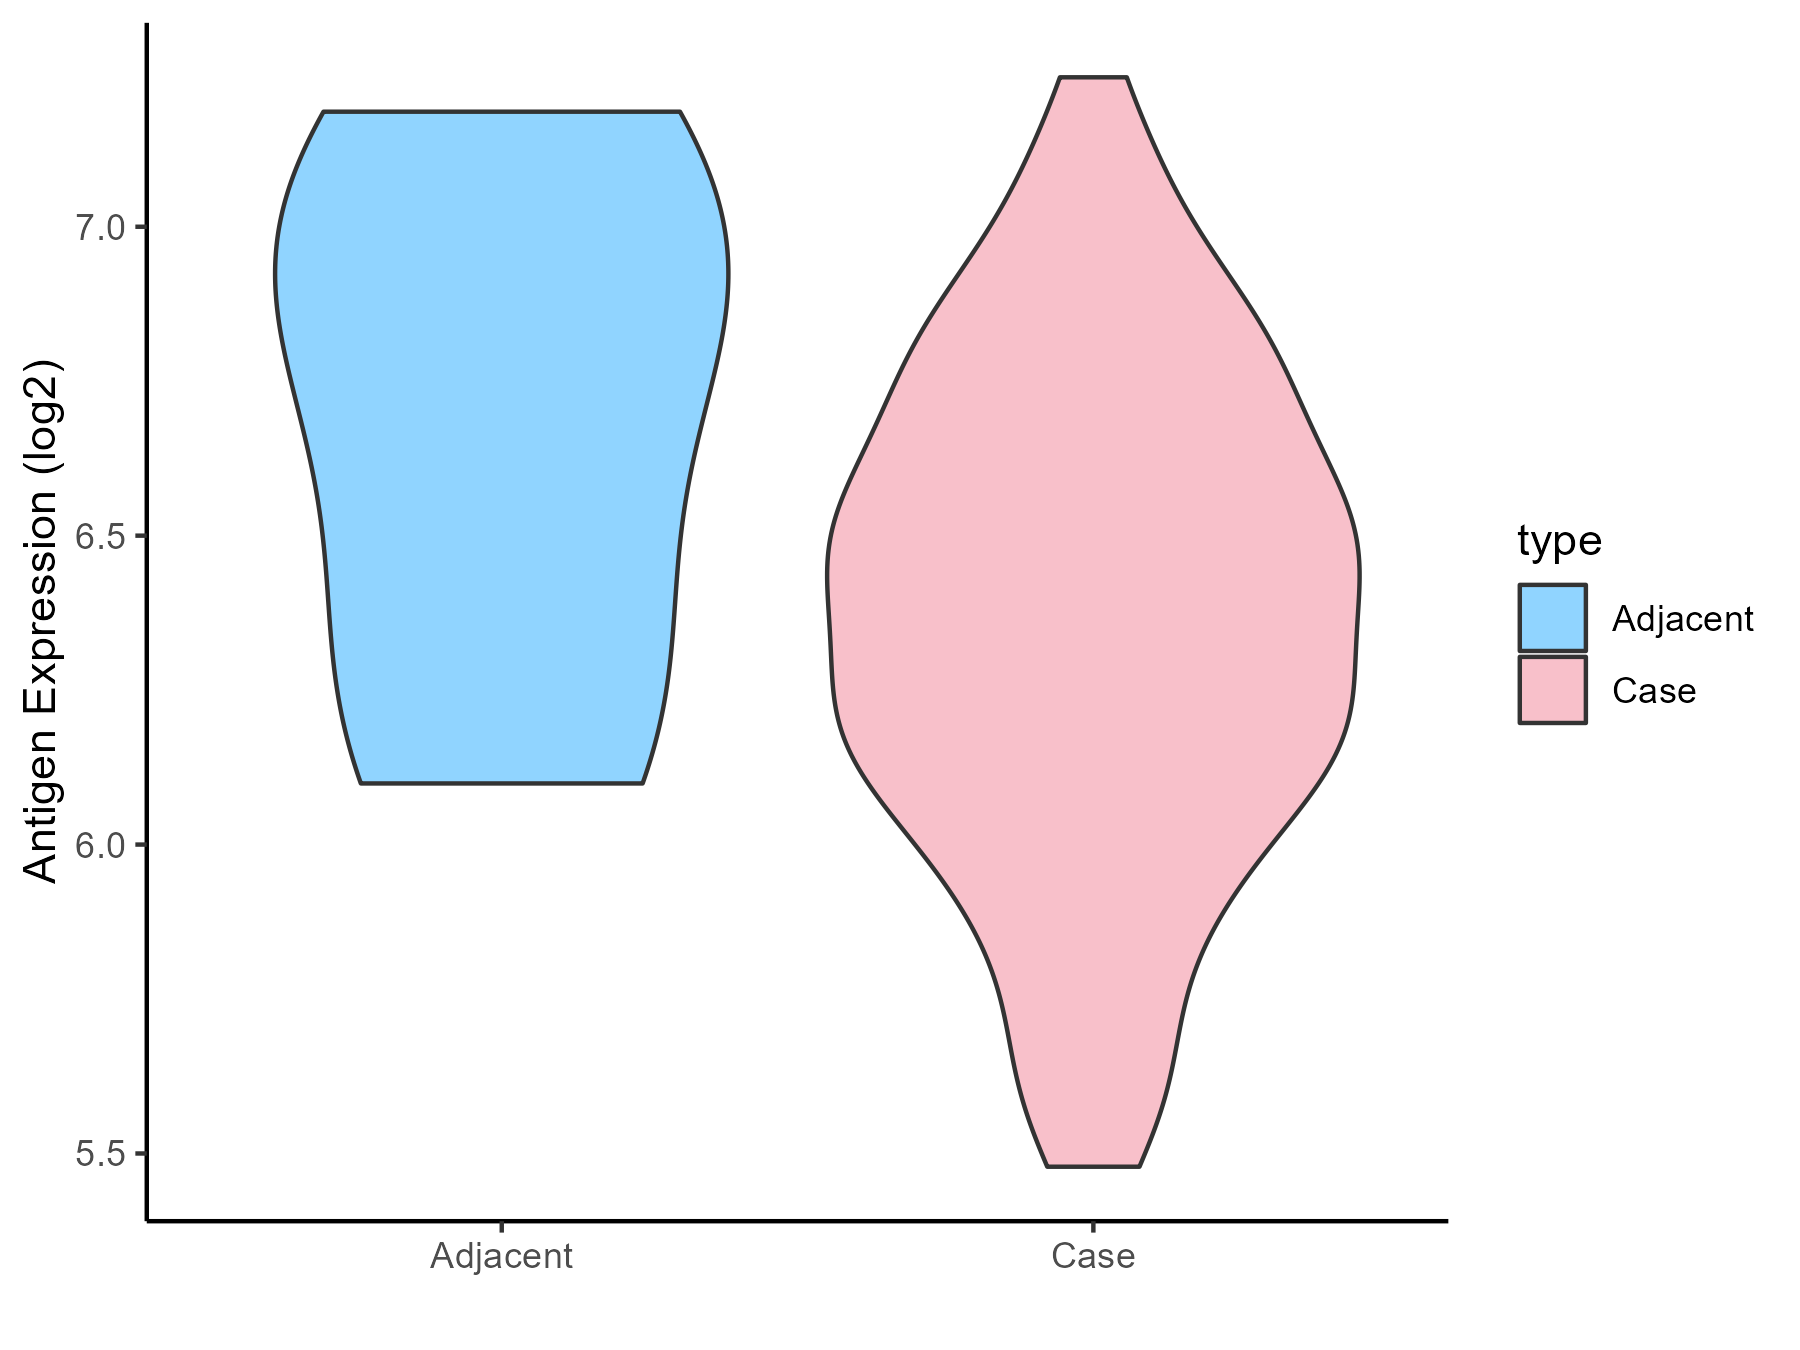
Gastric |
| The Specific Disease |
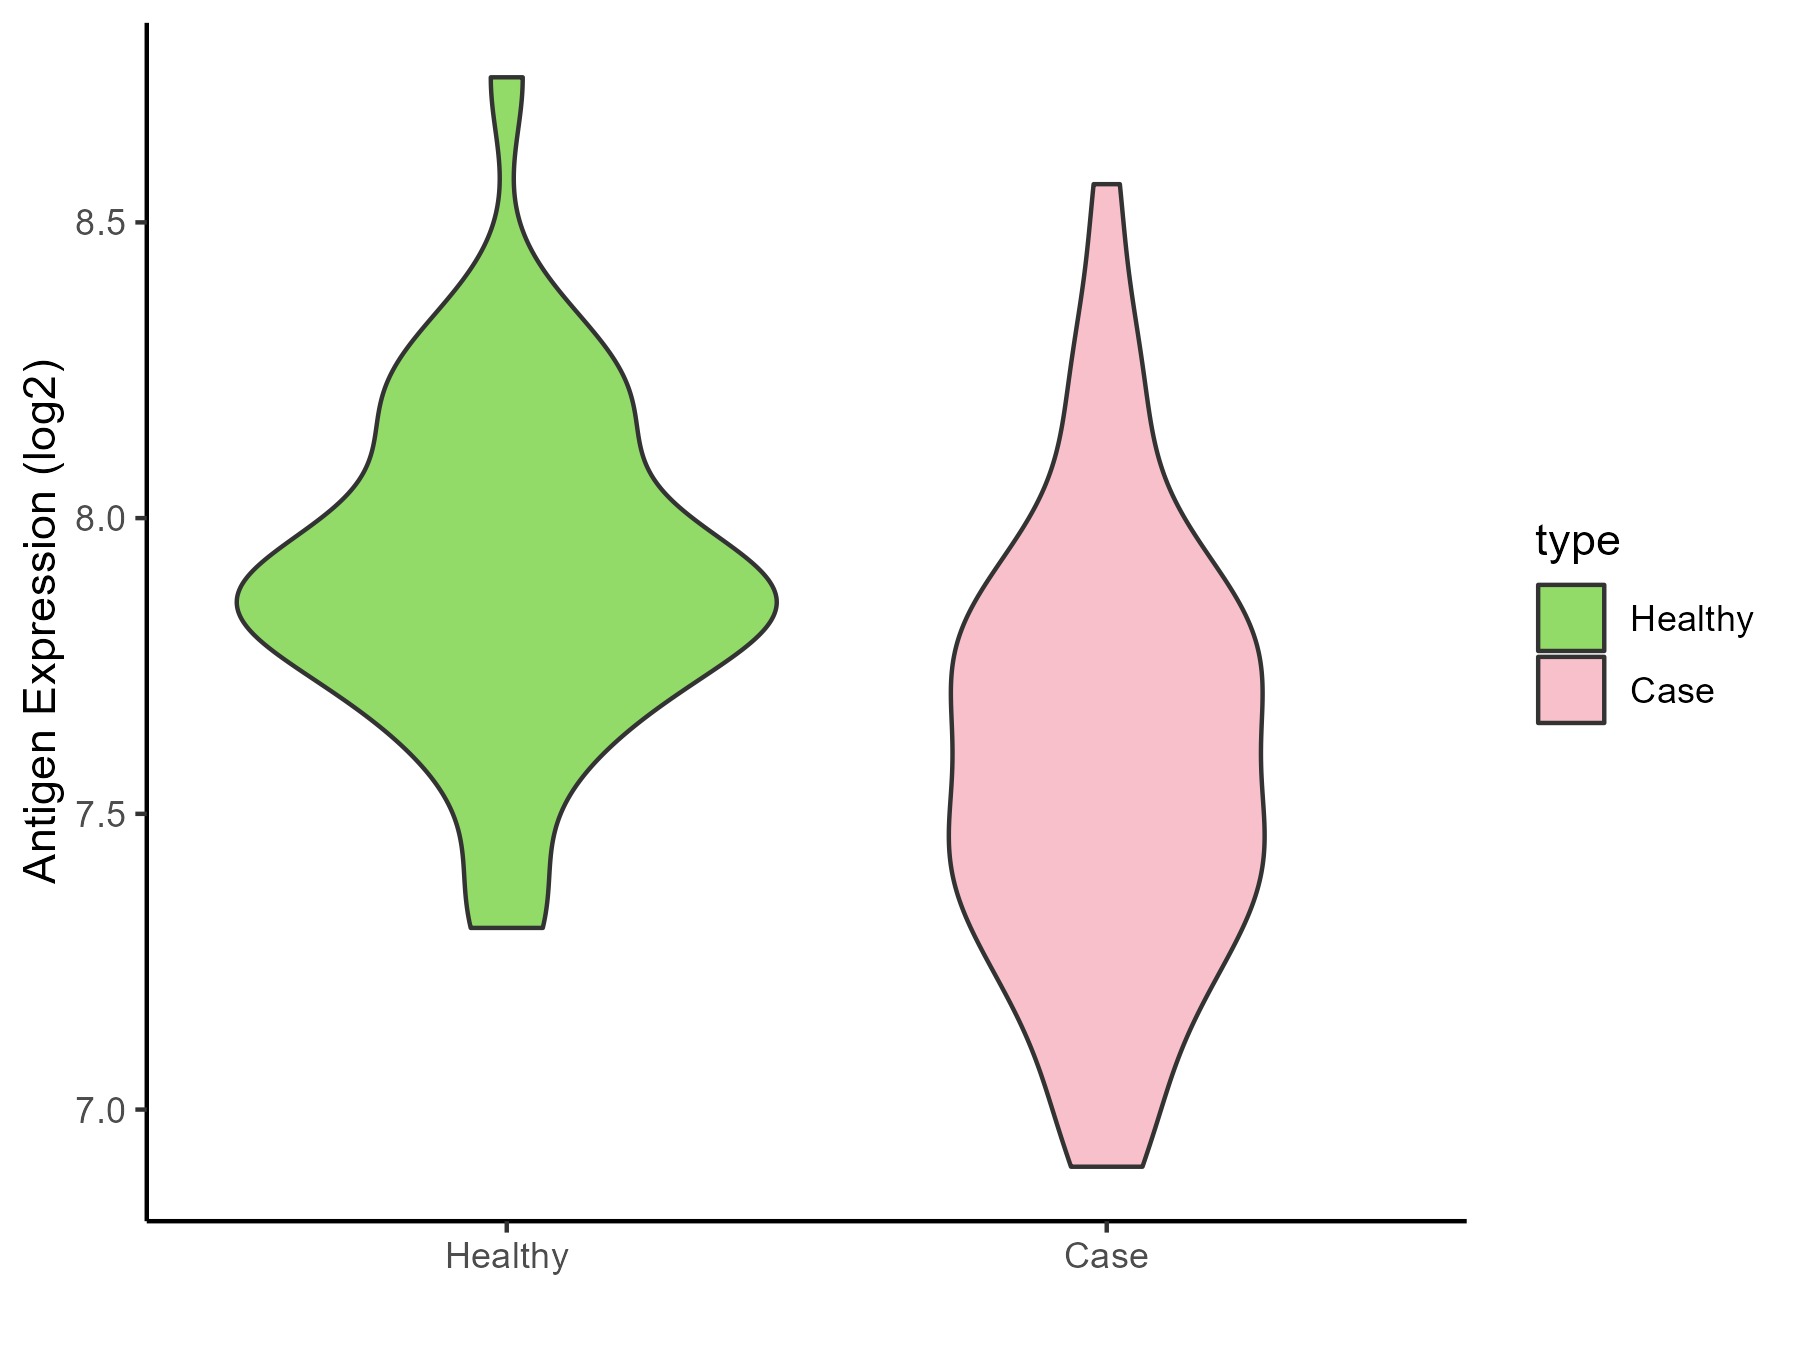
Gastric cancer |
| The Expression Level of Disease Section Compare with the Healthy Individual Tissue |
p-value: 0.147164163;
Fold-change: -0.405060176;
Z-score: -1.258146427
|
| The Expression Level of Disease Section Compare with the Adjacent Tissue |
p-value: 0.019220039;
Fold-change: -0.331456269;
Z-score: -0.752847119
|
| Disease-specific Antigen Abundances |
|
Click to View the Clearer Original Diagram
|
|
|
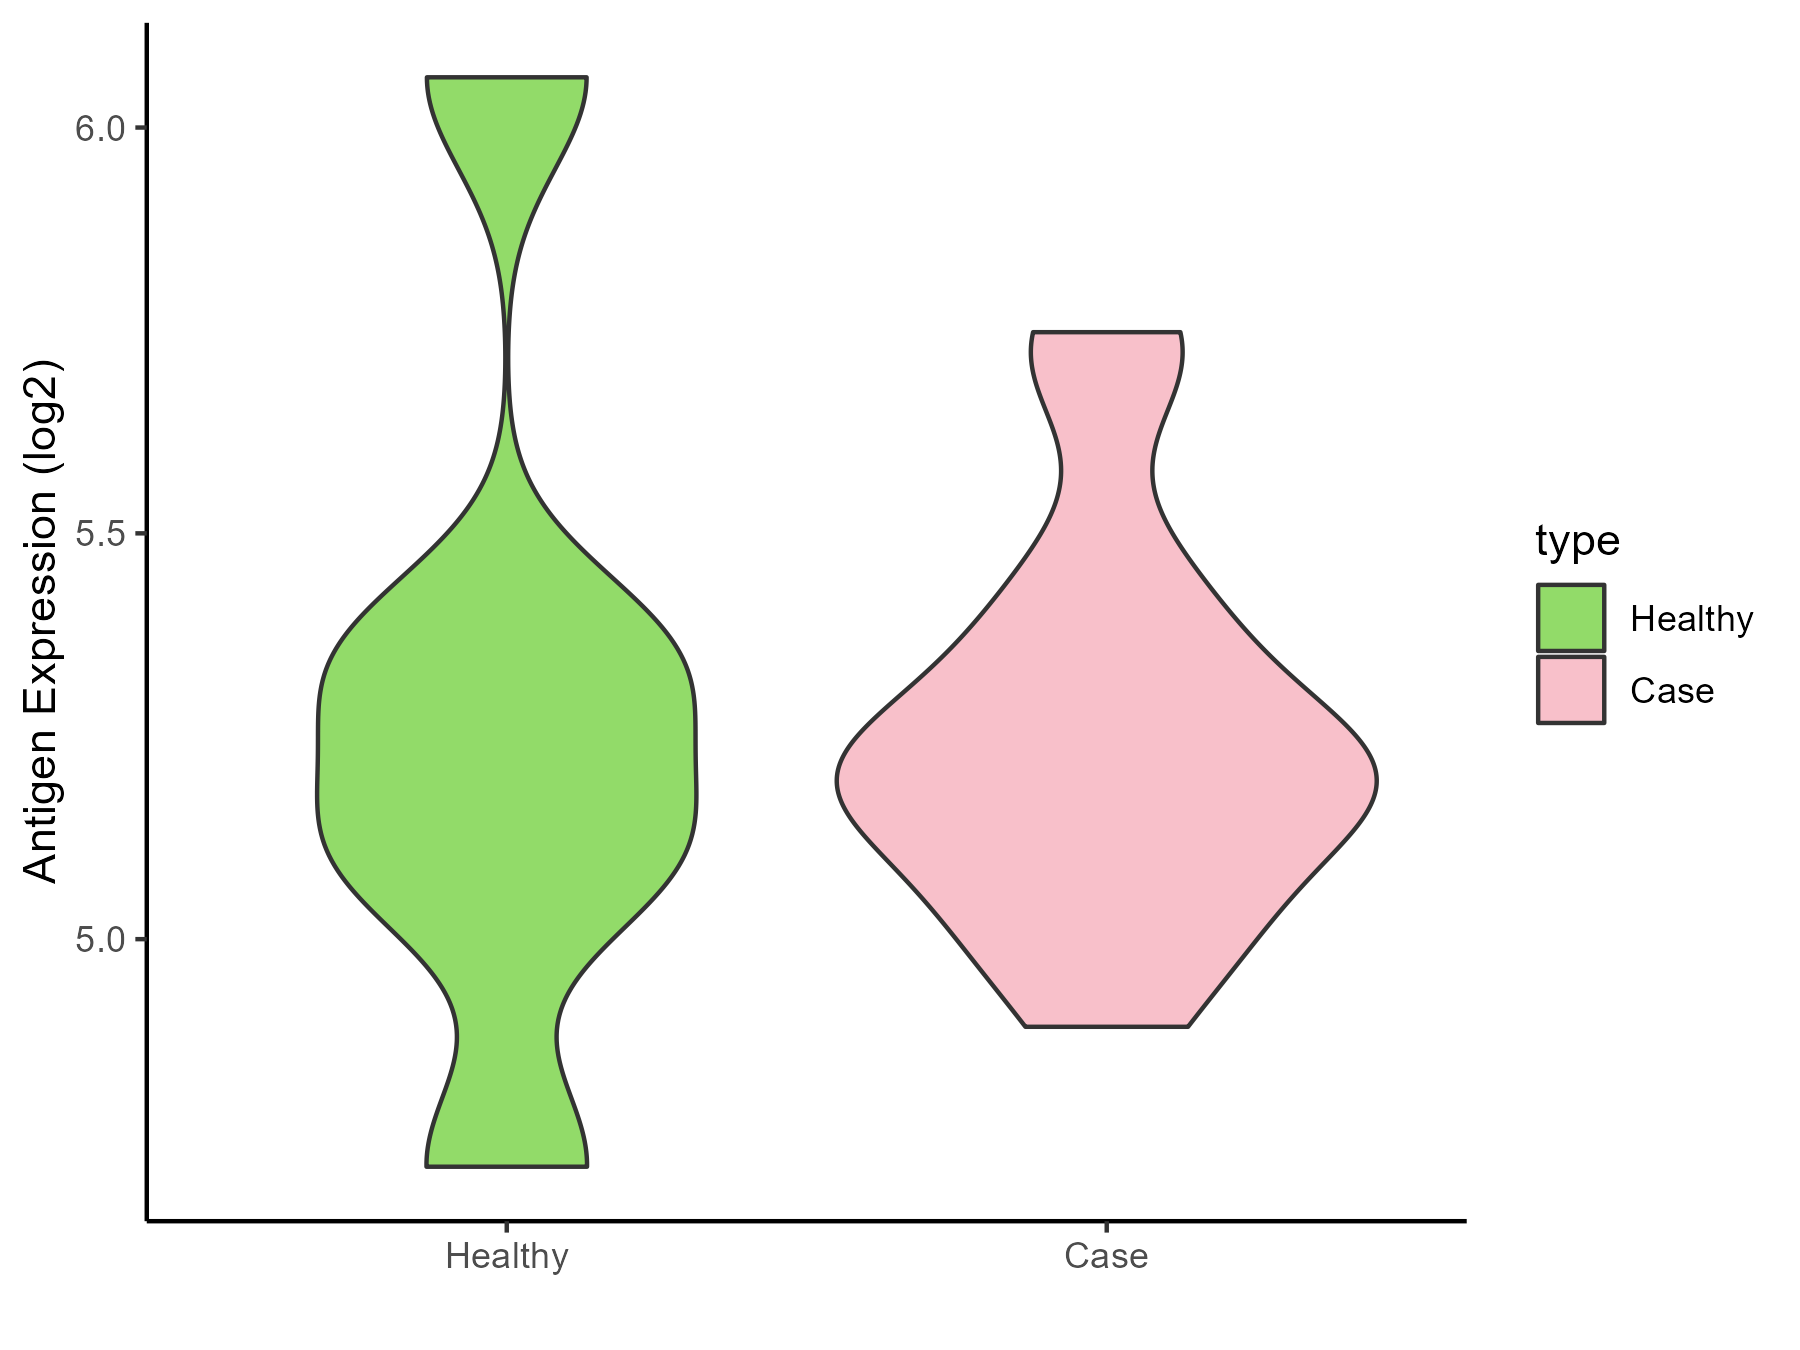
Colon cancer [ICD-11: 2B90]
Click to Show/Hide
| Differential expression pattern of antigen in diseases |
| The Studied Tissue |
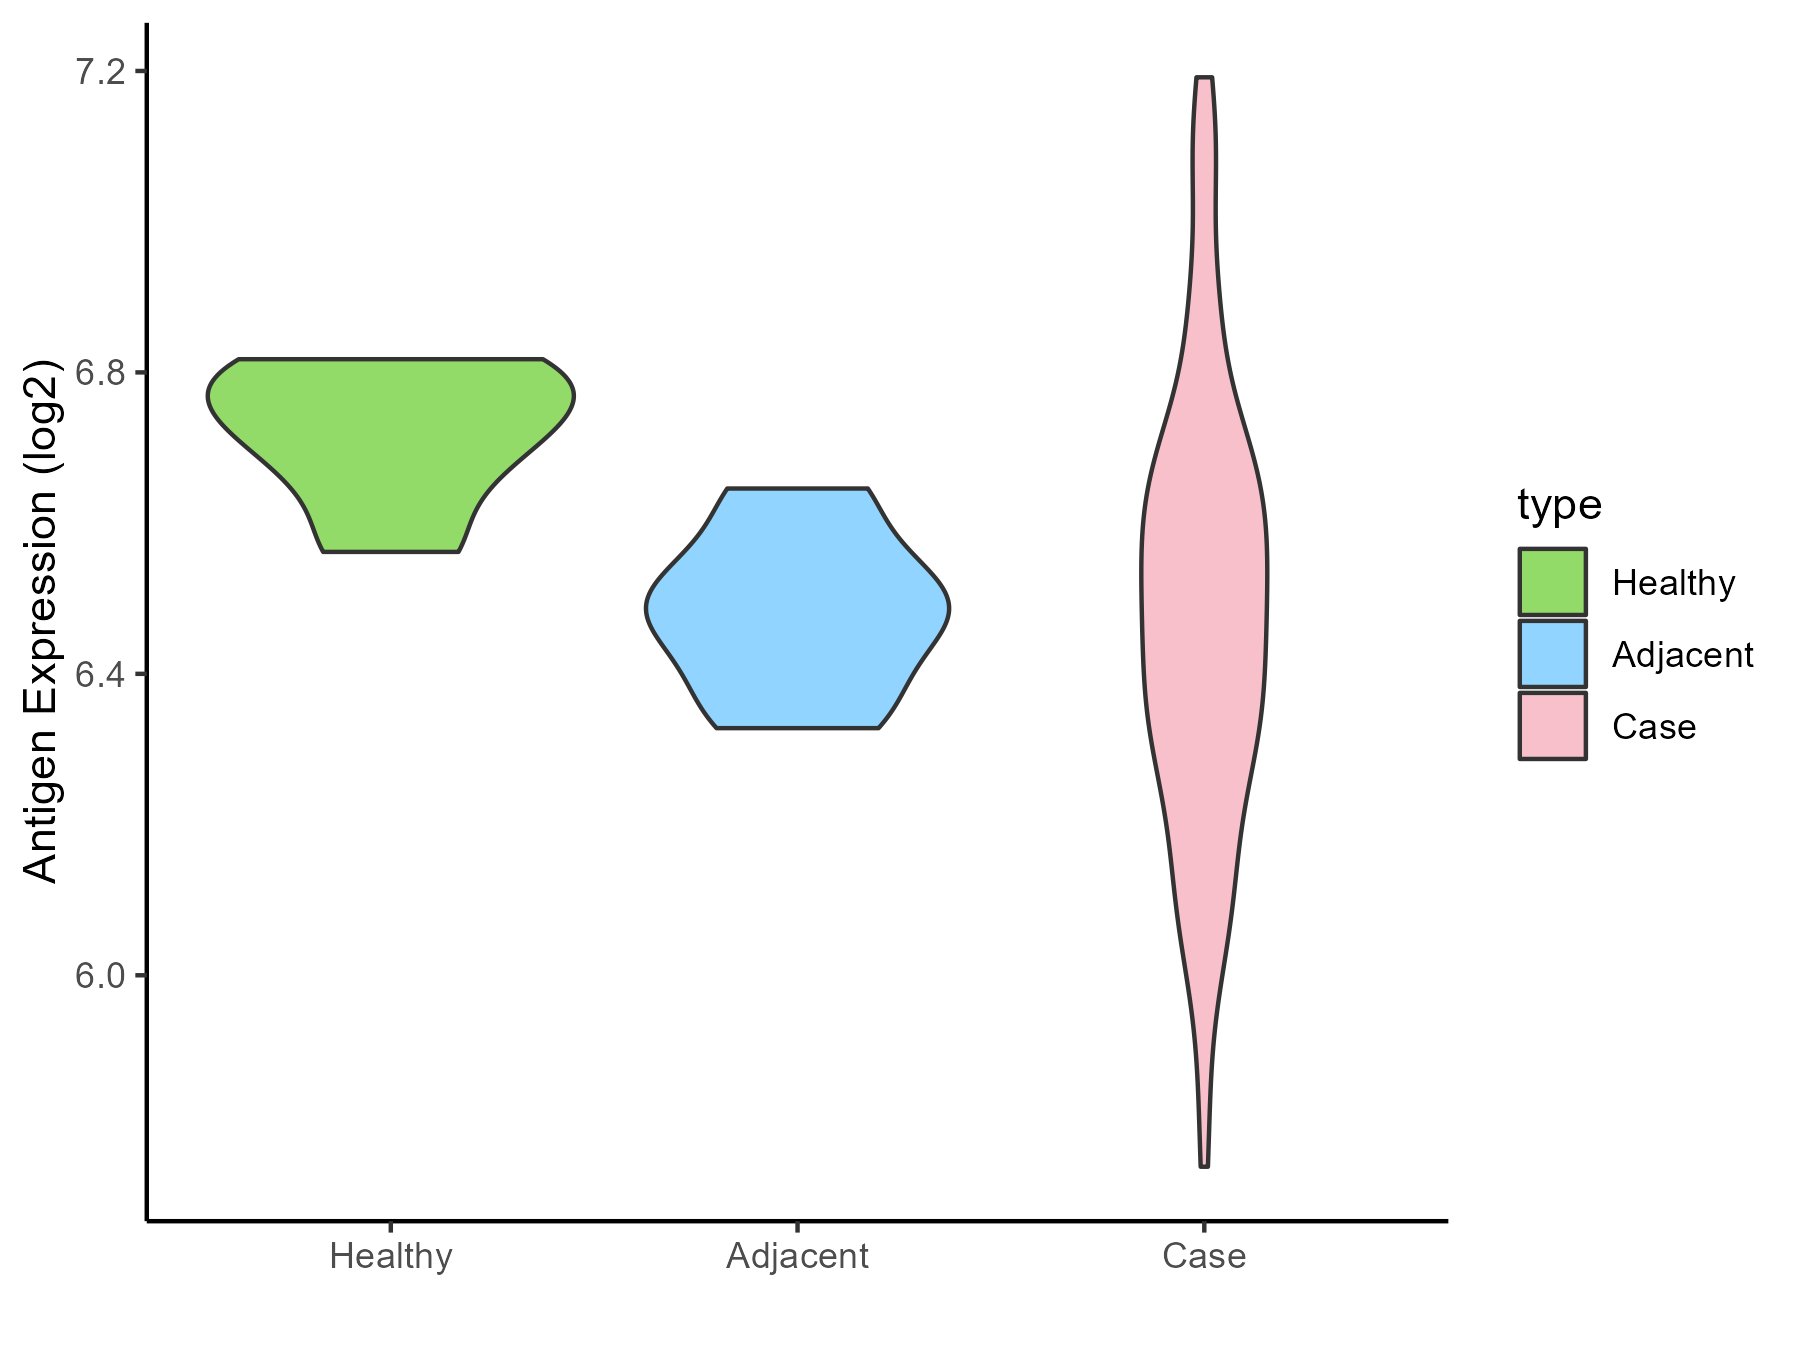
Colon |
| The Specific Disease |
Colon cancer |
| The Expression Level of Disease Section Compare with the Healthy Individual Tissue |
p-value: 8.23E-13;
Fold-change: -0.201194574;
Z-score: -0.735250133
|
| The Expression Level of Disease Section Compare with the Adjacent Tissue |
p-value: 6.56E-05;
Fold-change: -0.106903888;
Z-score: -0.39327174
|
| Disease-specific Antigen Abundances |
|
Click to View the Clearer Original Diagram
|
|
|
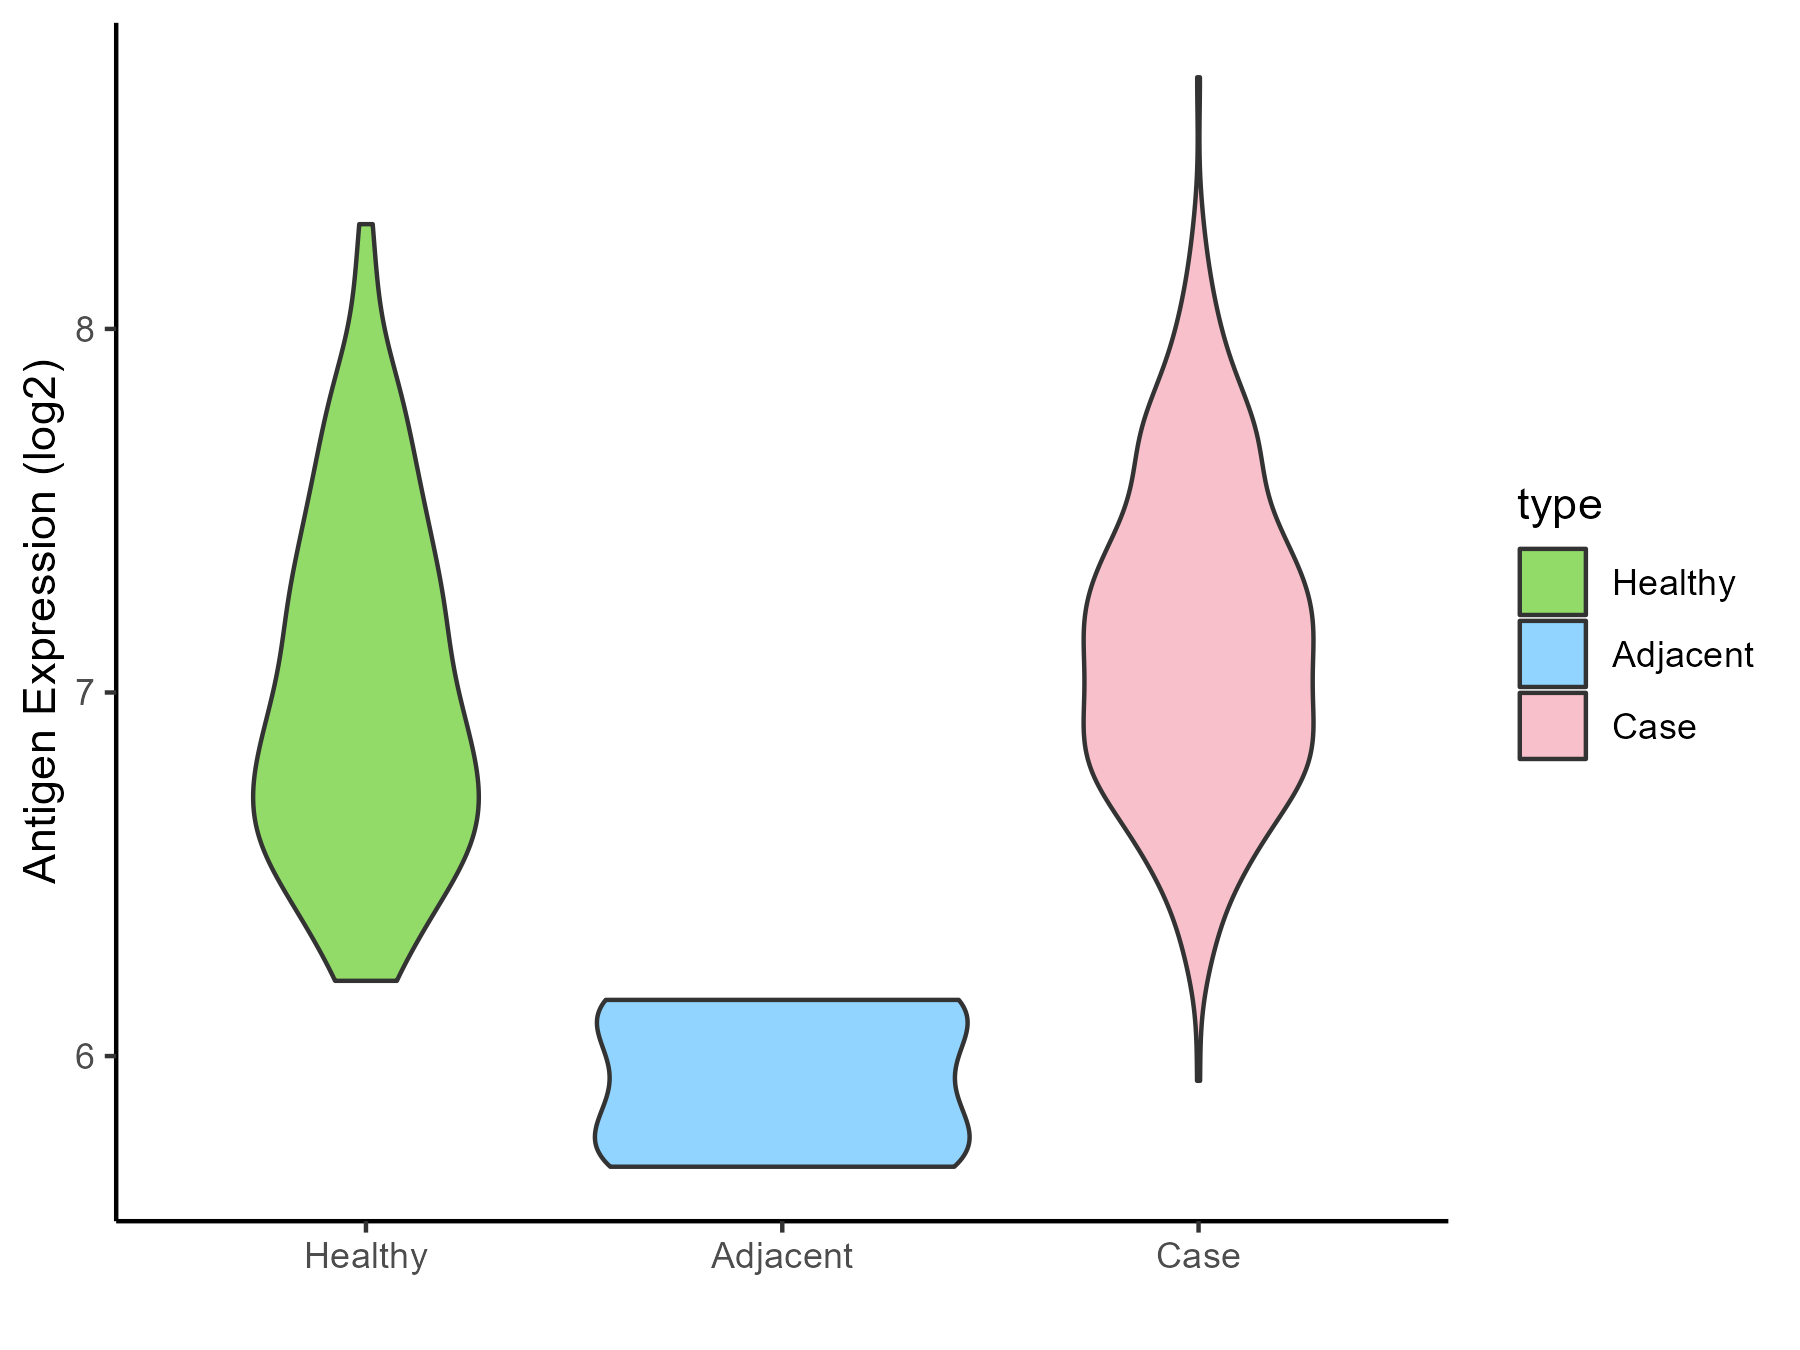
Pancreatic cancer [ICD-11: 2C10]
Click to Show/Hide
| Differential expression pattern of antigen in diseases |
| The Studied Tissue |
Pancreas |
| The Specific Disease |
Pancreatic cancer |
| The Expression Level of Disease Section Compare with the Healthy Individual Tissue |
p-value: 0.398740917;
Fold-change: -0.02533748;
Z-score: -0.035752184
|
| The Expression Level of Disease Section Compare with the Adjacent Tissue |
p-value: 0.065218234;
Fold-change: -0.119580633;
Z-score: -0.308790194
|
| Disease-specific Antigen Abundances |
|
Click to View the Clearer Original Diagram
|
|
|
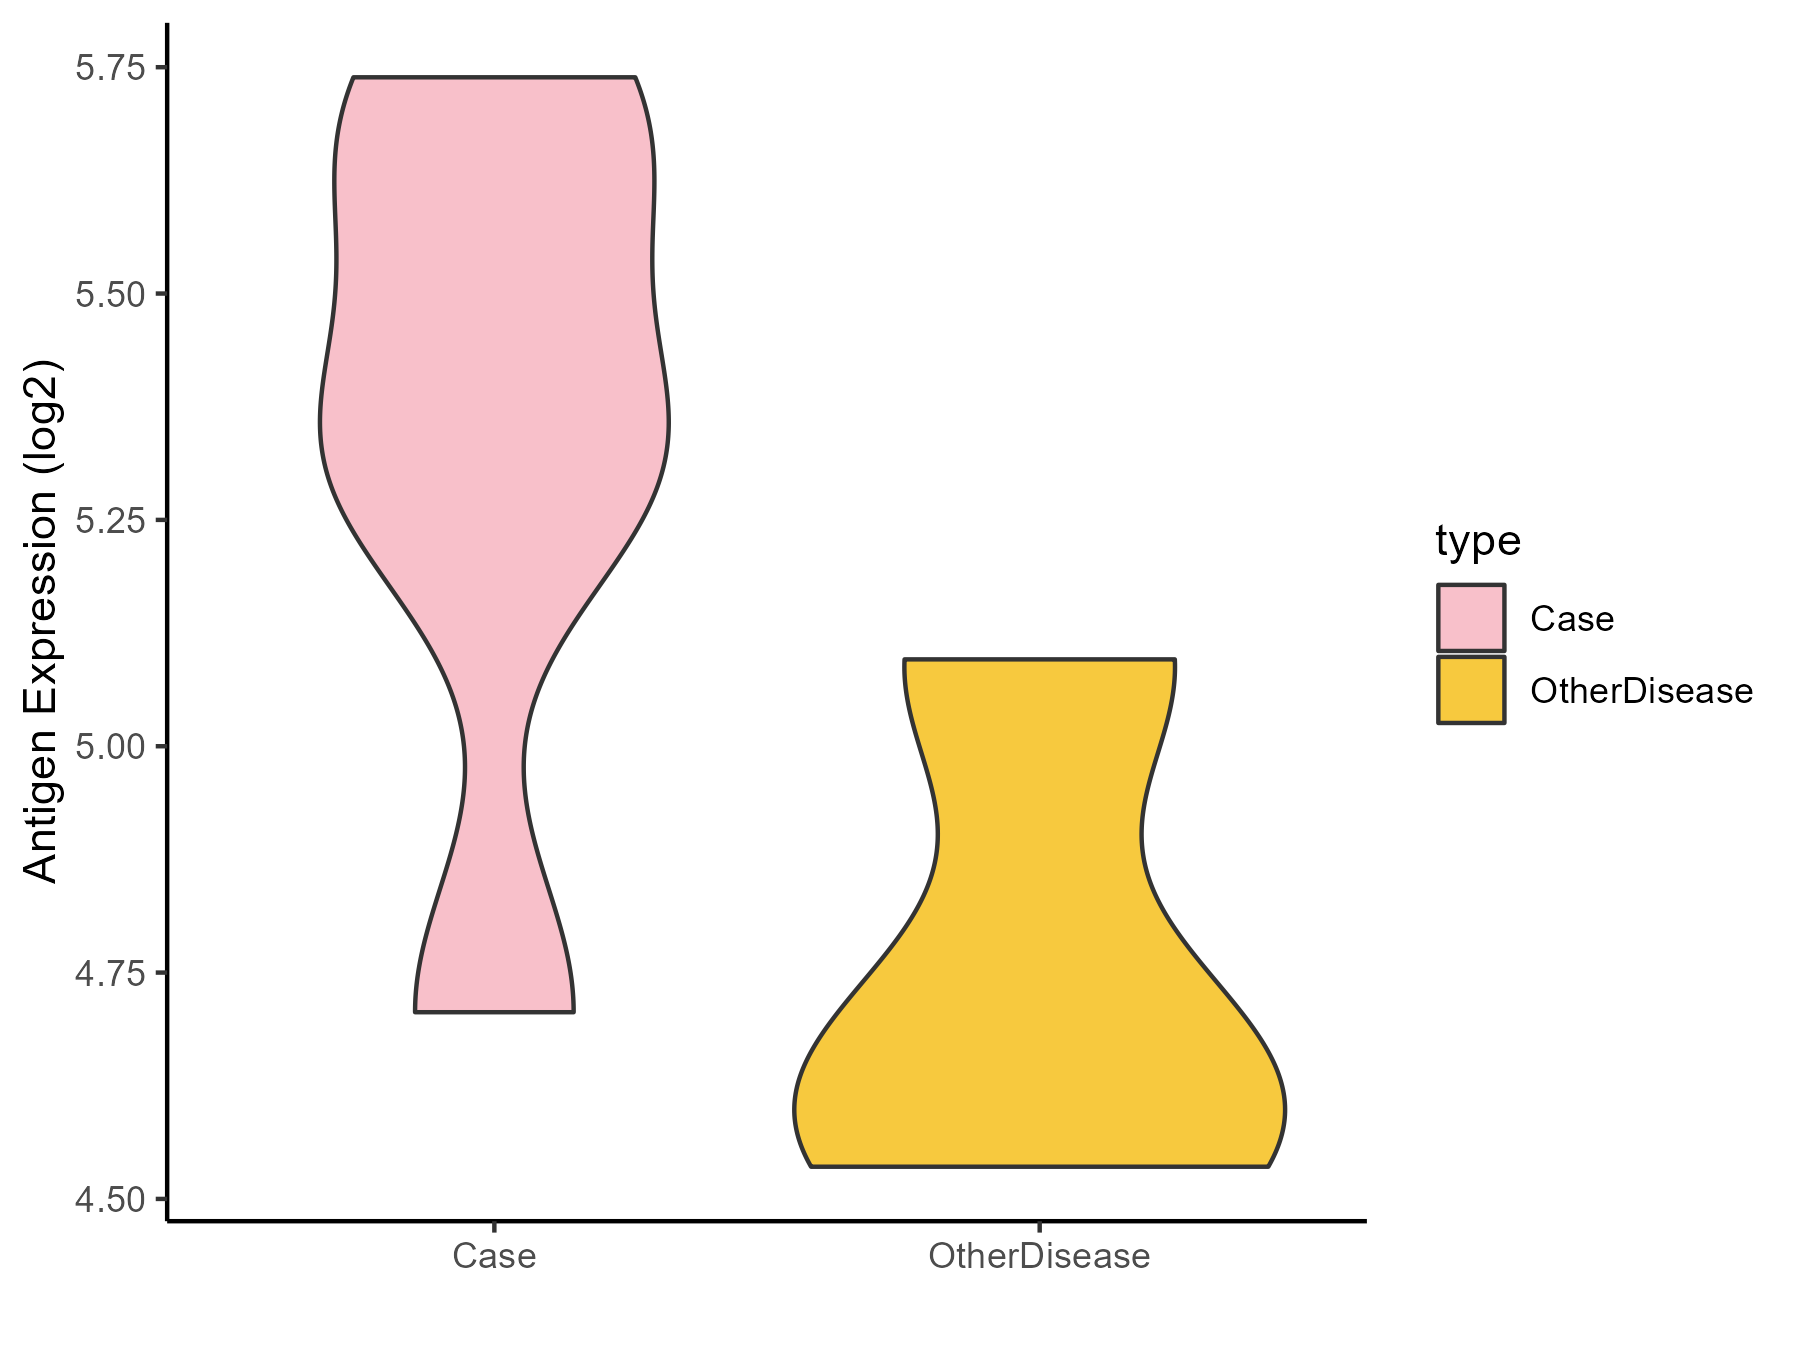
Liver cancer [ICD-11: 2C12]
Click to Show/Hide
| Differential expression pattern of antigen in diseases |
| The Studied Tissue |
Liver |
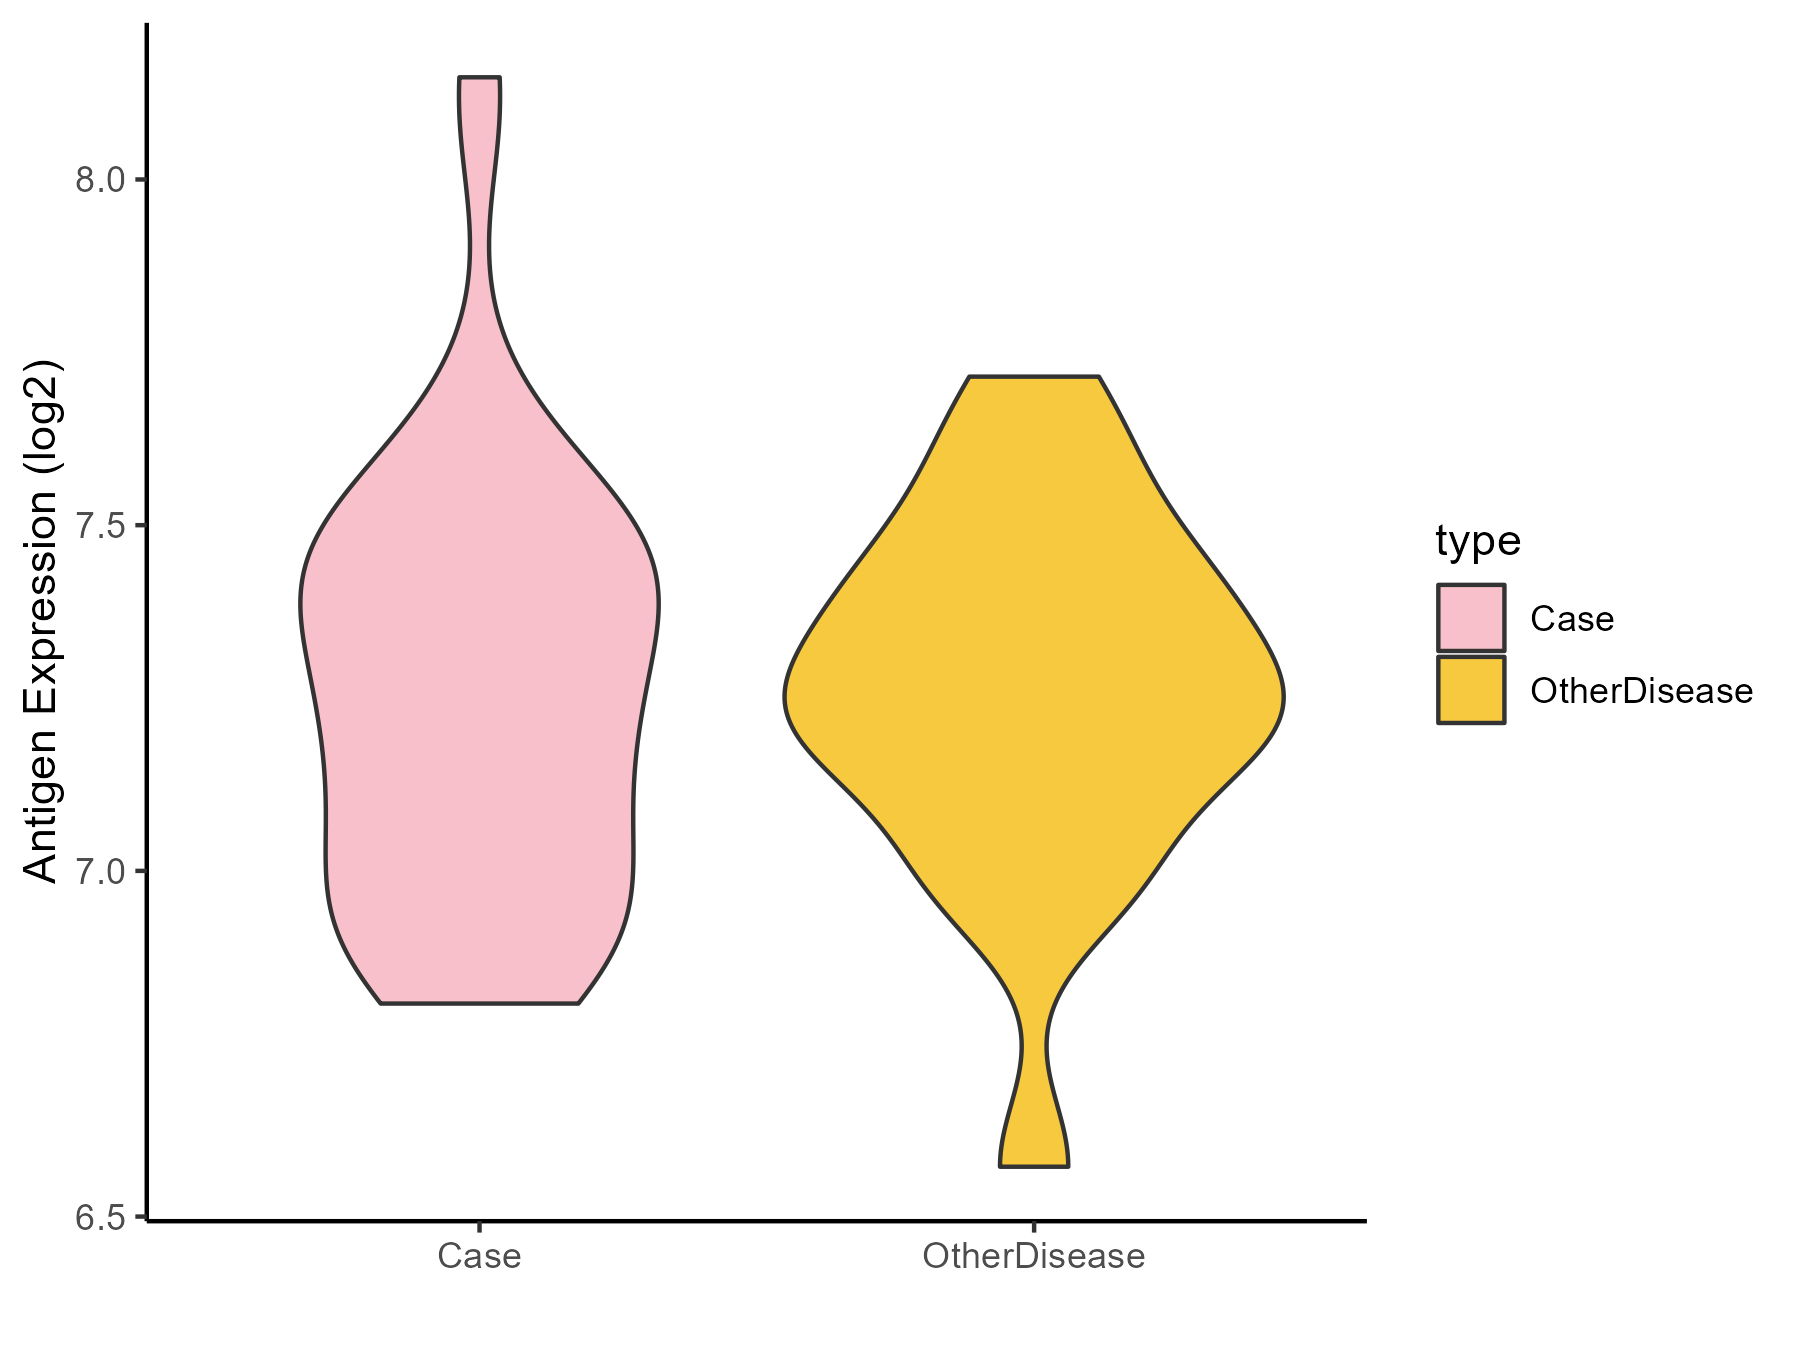
| The Specific Disease |
Liver cancer |
| The Expression Level of Disease Section Compare with the Healthy Individual Tissue |
p-value: 0.060754703;
Fold-change: -0.130552965;
Z-score: -0.499884018
|
| The Expression Level of Disease Section Compare with the Adjacent Tissue |
p-value: 1.89E-17;
Fold-change: -0.247576382;
Z-score: -0.697354669
|
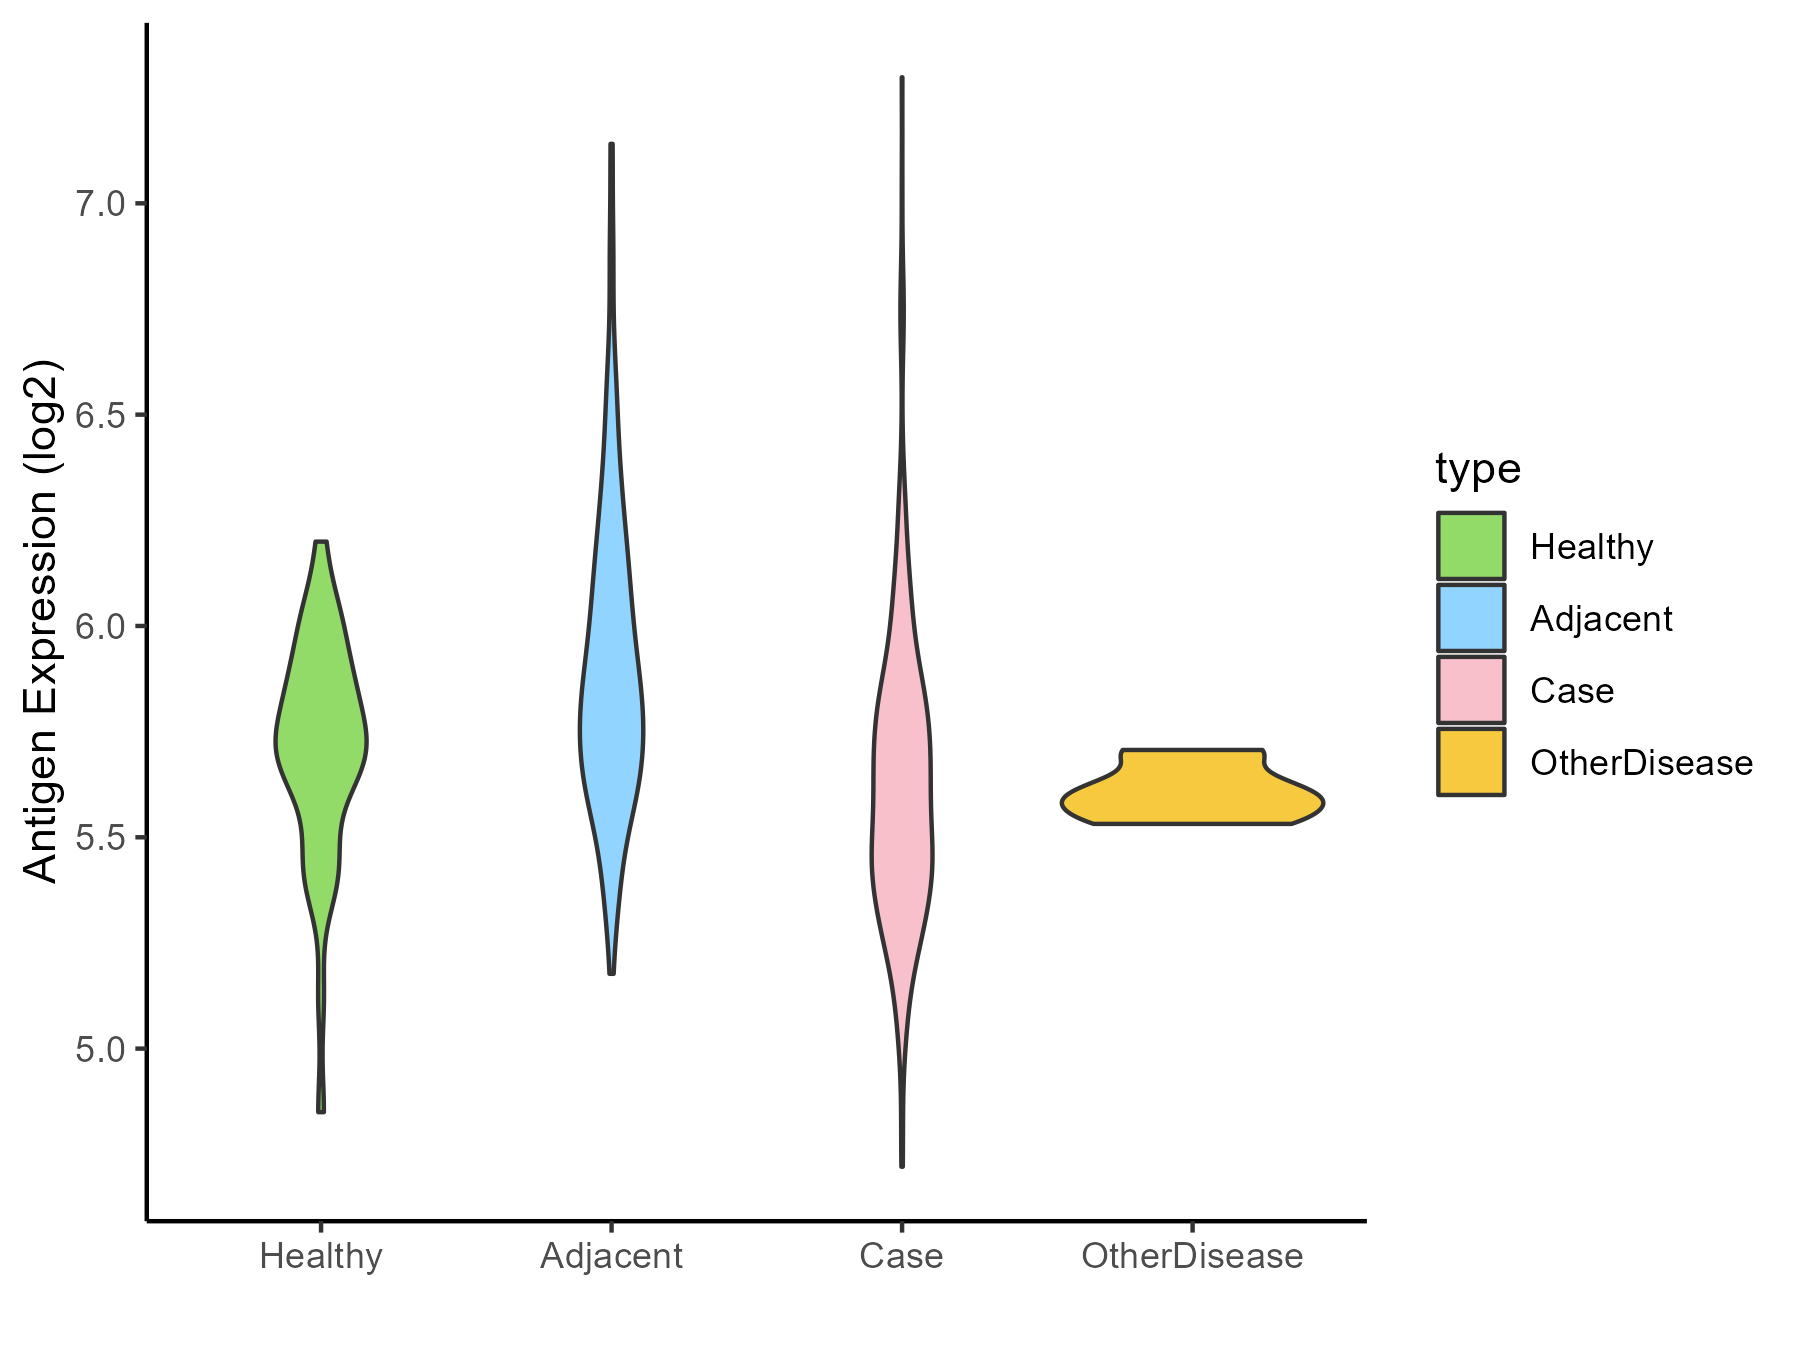
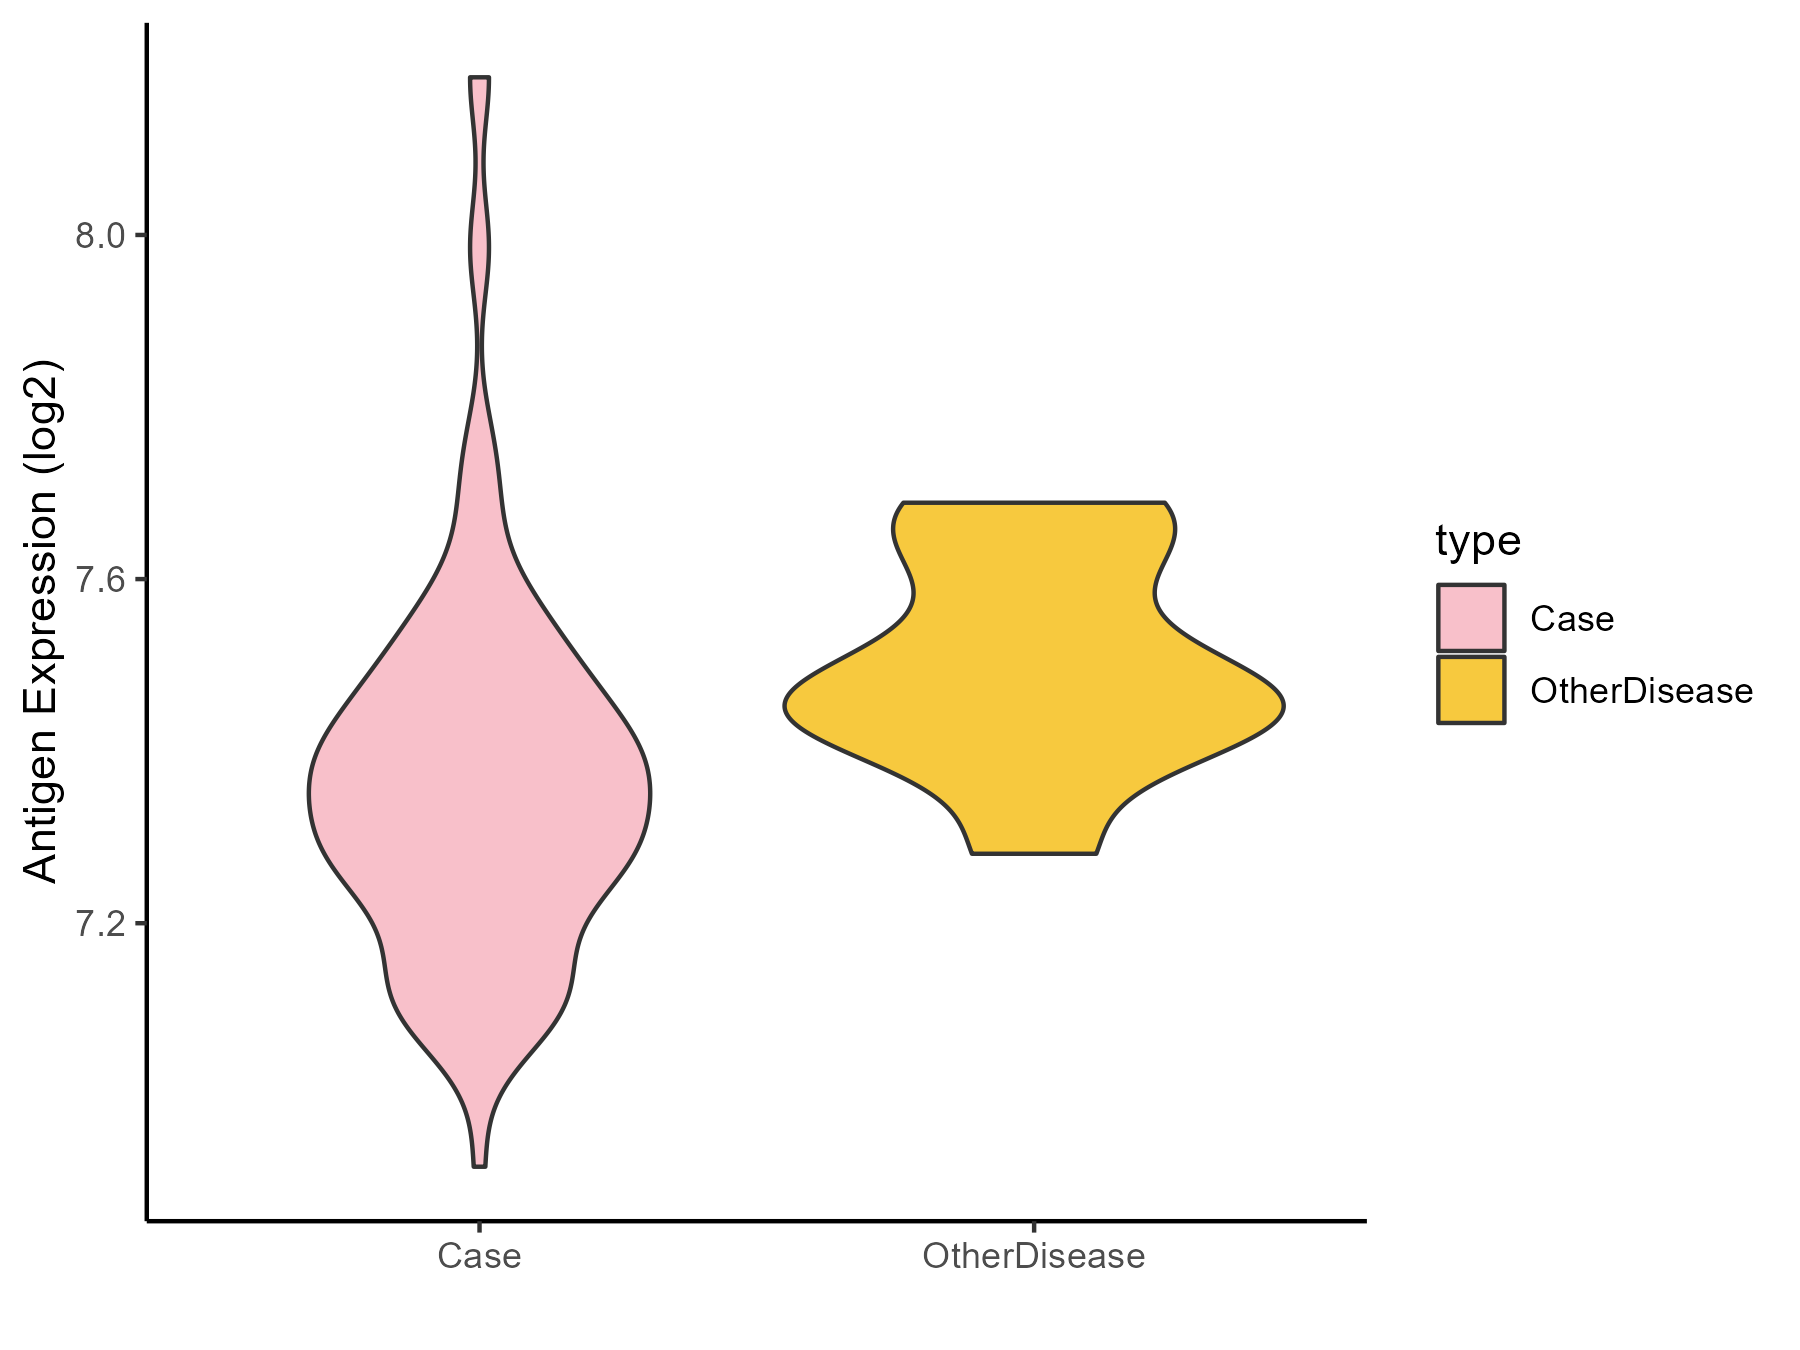
| The Expression Level of Disease Section Compare with the Other Disease Section |
p-value: 0.681359753;
Fold-change: -0.005445284;
Z-score: -0.073331688
|
| Disease-specific Antigen Abundances |
|
Click to View the Clearer Original Diagram
|
|
|
Lung cancer [ICD-11: 2C25]
Click to Show/Hide
| Differential expression pattern of antigen in diseases |
| The Studied Tissue |
Lung |
| The Specific Disease |
Lung cancer |
| The Expression Level of Disease Section Compare with the Healthy Individual Tissue |
p-value: 0.00029842;
Fold-change: -0.075150696;
Z-score: -0.156696368
|
| The Expression Level of Disease Section Compare with the Adjacent Tissue |
p-value: 3.48E-05;
Fold-change: -0.125847896;
Z-score: -0.235592679
|
| Disease-specific Antigen Abundances |
|
Click to View the Clearer Original Diagram
|
|
|
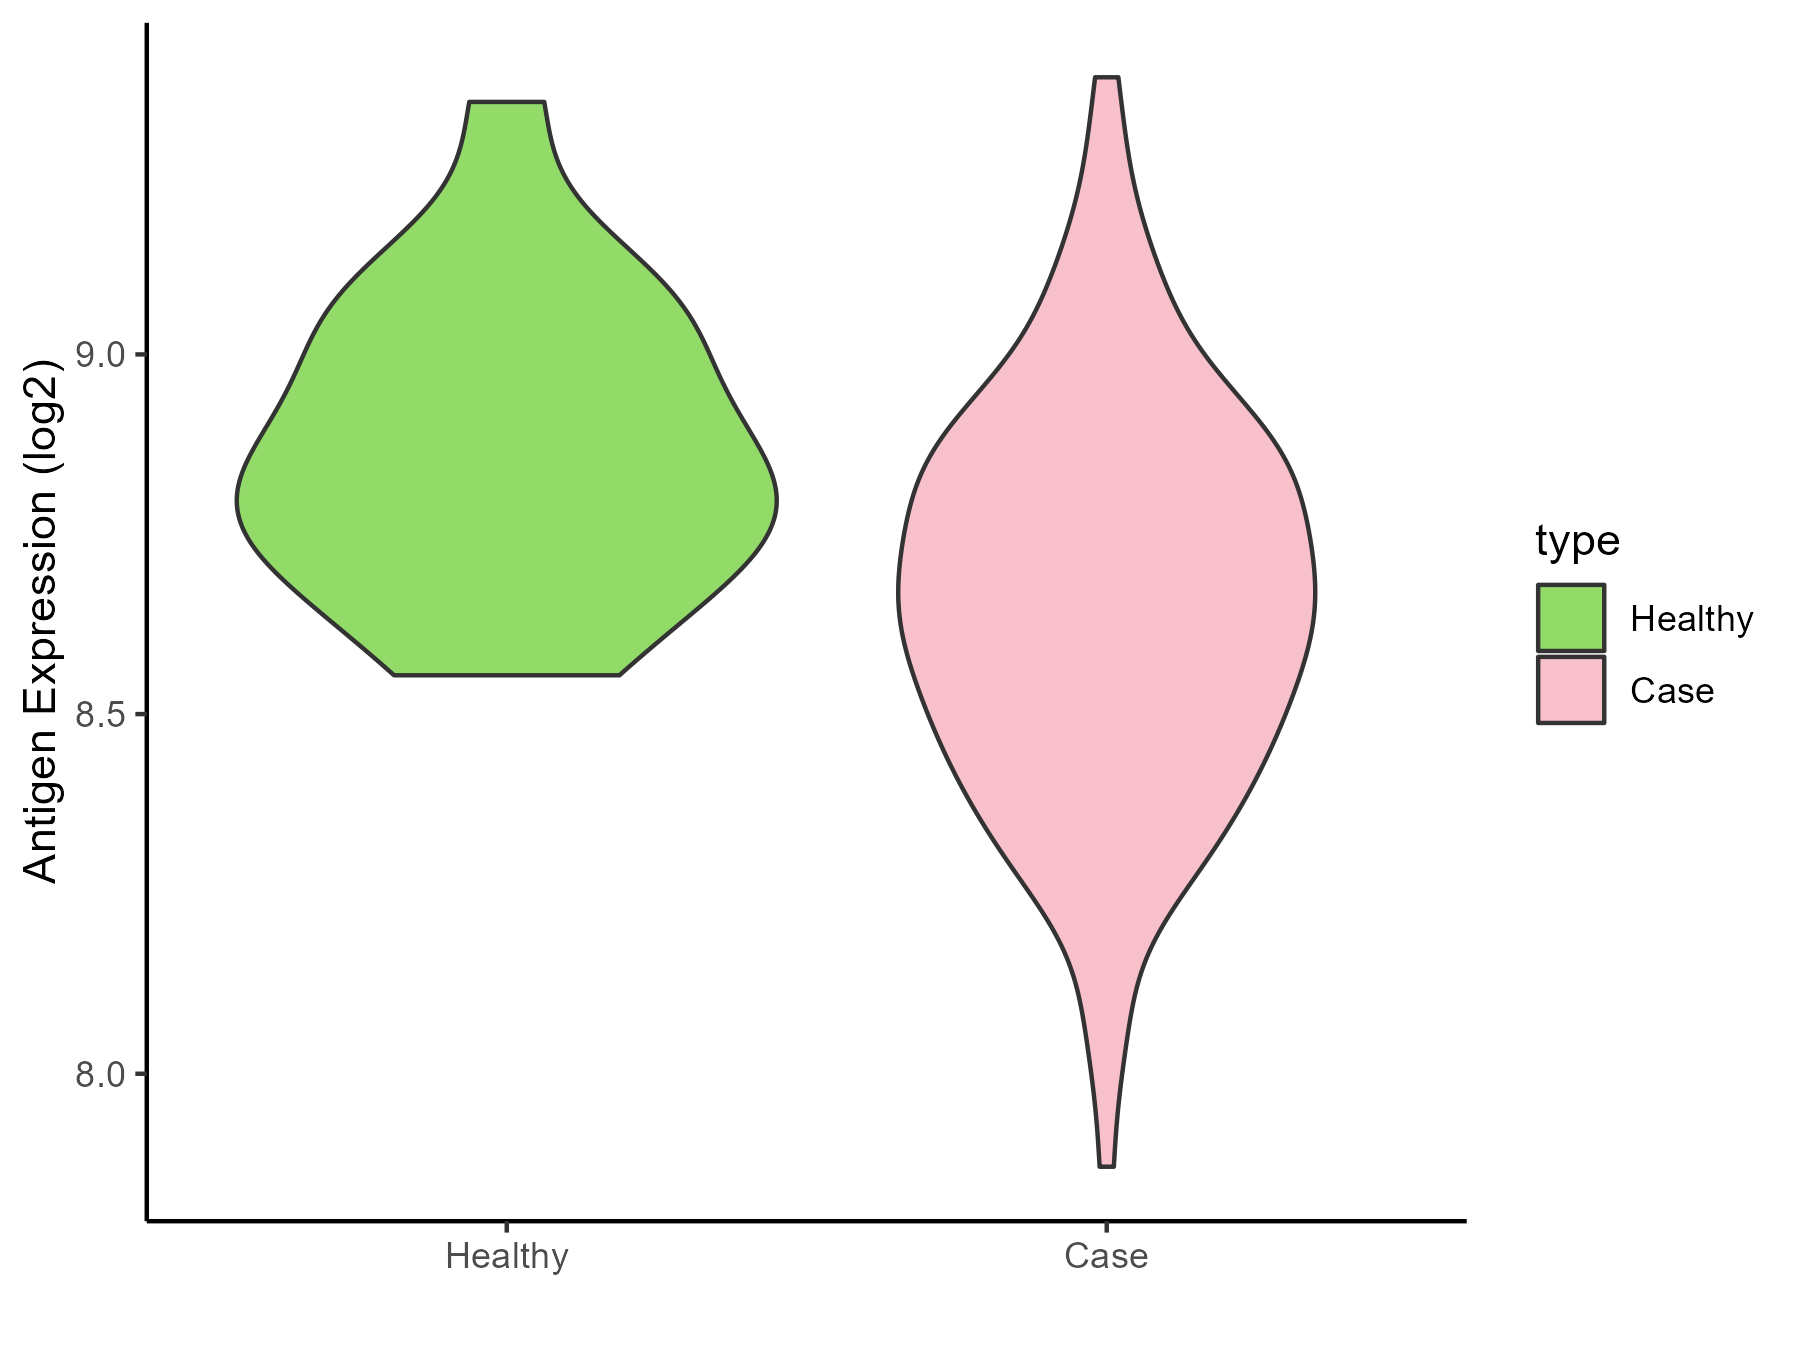
Melanoma [ICD-11: 2C30]
Click to Show/Hide
| Differential expression pattern of antigen in diseases |
| The Studied Tissue |
Skin |
| The Specific Disease |
Melanoma |
| The Expression Level of Disease Section Compare with the Healthy Individual Tissue |
p-value: 0.640463814;
Fold-change: -0.216401185;
Z-score: -0.339746703
|
| Disease-specific Antigen Abundances |
|
Click to View the Clearer Original Diagram
|
|
|
Sarcoma [ICD-11: 2C35]
Click to Show/Hide
| Differential expression pattern of antigen in diseases |
| The Studied Tissue |
Muscle |
| The Specific Disease |
Sarcoma |
| The Expression Level of Disease Section Compare with the Healthy Individual Tissue |
p-value: 0.431441091;
Fold-change: -0.089607813;
Z-score: -0.413872222
|
| The Expression Level of Disease Section Compare with the Adjacent Tissue |
p-value: 0.124109105;
Fold-change: -0.245756214;
Z-score: -1.59791735
|
| Disease-specific Antigen Abundances |
|
Click to View the Clearer Original Diagram
|
|
|
Breast cancer [ICD-11: 2C60]
Click to Show/Hide
| Differential expression pattern of antigen in diseases |
| The Studied Tissue |
Breast |
| The Specific Disease |
Breast cancer |
| The Expression Level of Disease Section Compare with the Healthy Individual Tissue |
p-value: 1.57E-28;
Fold-change: 0.323895153;
Z-score: 0.768823348
|
| The Expression Level of Disease Section Compare with the Adjacent Tissue |
p-value: 0.002757672;
Fold-change: 0.207692539;
Z-score: 0.534847597
|
| Disease-specific Antigen Abundances |
|
Click to View the Clearer Original Diagram
|
|
|
Ovarian cancer [ICD-11: 2C73]
Click to Show/Hide
| Differential expression pattern of antigen in diseases |
| The Studied Tissue |
Ovarian |
| The Specific Disease |
Ovarian cancer |
| The Expression Level of Disease Section Compare with the Healthy Individual Tissue |
p-value: 0.547002245;
Fold-change: 0.338110217;
Z-score: 0.480936075
|
| The Expression Level of Disease Section Compare with the Adjacent Tissue |
p-value: 8.47E-06;
Fold-change: 0.493960477;
Z-score: 1.373798815
|
| Disease-specific Antigen Abundances |
|
Click to View the Clearer Original Diagram
|
|
|
Cervical cancer [ICD-11: 2C77]
Click to Show/Hide
| Differential expression pattern of antigen in diseases |
| The Studied Tissue |
Cervical |
| The Specific Disease |
Cervical cancer |
| The Expression Level of Disease Section Compare with the Healthy Individual Tissue |
p-value: 0.000548295;
Fold-change: -0.163753352;
Z-score: -0.793297671
|
| Disease-specific Antigen Abundances |
|
Click to View the Clearer Original Diagram
|
|
|
Uterine cancer [ICD-11: 2C78]
Click to Show/Hide
| Differential expression pattern of antigen in diseases |
| The Studied Tissue |
Endometrium |
| The Specific Disease |
Uterine cancer |
| The Expression Level of Disease Section Compare with the Healthy Individual Tissue |
p-value: 0.003879662;
Fold-change: 0.216081298;
Z-score: 0.458011187
|
| The Expression Level of Disease Section Compare with the Adjacent Tissue |
p-value: 0.000134483;
Fold-change: 1.197073281;
Z-score: 5.479073549
|
| Disease-specific Antigen Abundances |
|
Click to View the Clearer Original Diagram
|
|
|
Prostate cancer [ICD-11: 2C82]
Click to Show/Hide
| Differential expression pattern of antigen in diseases |
| The Studied Tissue |
Prostate |
| The Specific Disease |
Prostate cancer |
| The Expression Level of Disease Section Compare with the Healthy Individual Tissue |
p-value: 0.001736702;
Fold-change: -1.208658318;
Z-score: -1.207036134
|
| Disease-specific Antigen Abundances |
|
Click to View the Clearer Original Diagram
|
|
|
Bladder cancer [ICD-11: 2C94]
Click to Show/Hide
| Differential expression pattern of antigen in diseases |
| The Studied Tissue |
Bladder |
| The Specific Disease |
Bladder cancer |
| The Expression Level of Disease Section Compare with the Healthy Individual Tissue |
p-value: 0.042119474;
Fold-change: 0.155135147;
Z-score: 0.632896973
|
| Disease-specific Antigen Abundances |
|
Click to View the Clearer Original Diagram
|
|
|
Retina cancer [ICD-11: 2D02]
Click to Show/Hide
| Differential expression pattern of antigen in diseases |
| The Studied Tissue |
Uvea |
| The Specific Disease |
Retinoblastoma tumor |
| The Expression Level of Disease Section Compare with the Healthy Individual Tissue |
p-value: 6.26E-05;
Fold-change: 0.601152173;
Z-score: 4.256225247
|
| Disease-specific Antigen Abundances |
|
Click to View the Clearer Original Diagram
|
|
|
Thyroid cancer [ICD-11: 2D10]
Click to Show/Hide
| Differential expression pattern of antigen in diseases |
| The Studied Tissue |
Thyroid |
| The Specific Disease |
Thyroid cancer |
| The Expression Level of Disease Section Compare with the Healthy Individual Tissue |
p-value: 2.98E-23;
Fold-change: -0.394102614;
Z-score: -1.294985304
|
| The Expression Level of Disease Section Compare with the Adjacent Tissue |
p-value: 2.23E-08;
Fold-change: -0.48337418;
Z-score: -1.244878846
|
| Disease-specific Antigen Abundances |
|
Click to View the Clearer Original Diagram
|
|
|
Adrenal cancer [ICD-11: 2D11]
Click to Show/Hide
| Differential expression pattern of antigen in diseases |
| The Studied Tissue |
Adrenal cortex |
| The Specific Disease |
Adrenocortical carcinoma |
| The Expression Level of Disease Section Compare with the Other Disease Section |
p-value: 0.000591186;
Fold-change: -0.10031952;
Z-score: -0.779231824
|
| Disease-specific Antigen Abundances |
|
Click to View the Clearer Original Diagram
|
|
|
Head and neck cancer [ICD-11: 2D42]
Click to Show/Hide
| Differential expression pattern of antigen in diseases |
| The Studied Tissue |
Head and neck |
| The Specific Disease |
Head and neck cancer |
| The Expression Level of Disease Section Compare with the Healthy Individual Tissue |
p-value: 1.95E-09;
Fold-change: -0.25009586;
Z-score: -0.899636487
|
| Disease-specific Antigen Abundances |
|
Click to View the Clearer Original Diagram
|
|
|
Pituitary cancer [ICD-11: 2F37]
Click to Show/Hide
| Differential expression pattern of antigen in diseases |
| The Studied Tissue |
Pituitary |
| The Specific Disease |
Pituitary gonadotrope tumor |
| The Expression Level of Disease Section Compare with the Healthy Individual Tissue |
p-value: 0.279813241;
Fold-change: -0.139833281;
Z-score: -0.961140438
|
| Disease-specific Antigen Abundances |
|
Click to View the Clearer Original Diagram
|
|
|
| The Studied Tissue |
Pituitary |
| The Specific Disease |
Pituitary cancer |
| The Expression Level of Disease Section Compare with the Healthy Individual Tissue |
p-value: 0.800604958;
Fold-change: 0.032559984;
Z-score: 0.136513411
|
| Disease-specific Antigen Abundances |
|
Click to View the Clearer Original Diagram
|
|
|
ICD Disease Classification 03
Click to Show/Hide the 1 Disease of This Class
Thrombocytopenia [ICD-11: 3B64]
Click to Show/Hide
| Differential expression pattern of antigen in diseases |
| The Studied Tissue |
Whole blood |
| The Specific Disease |
Thrombocytopenia |
| The Expression Level of Disease Section Compare with the Healthy Individual Tissue |
p-value: 0.247351915;
Fold-change: 0.452809448;
Z-score: 0.596393847
|
| Disease-specific Antigen Abundances |
|
Click to View the Clearer Original Diagram
|
|
|
ICD Disease Classification 04
Click to Show/Hide the 2 Disease of This Class
Lupus erythematosus [ICD-11: 4A40]
Click to Show/Hide
| Differential expression pattern of antigen in diseases |
| The Studied Tissue |
Whole blood |
| The Specific Disease |
Lupus erythematosus |
| The Expression Level of Disease Section Compare with the Healthy Individual Tissue |
p-value: 1.85E-08;
Fold-change: 0.305912788;
Z-score: 0.491740932
|
| Disease-specific Antigen Abundances |
|
Click to View the Clearer Original Diagram
|
|
|
Autoimmune disease [ICD-11: 4A4Z]
Click to Show/Hide
| Differential expression pattern of antigen in diseases |
| The Studied Tissue |
Peripheral monocyte |
| The Specific Disease |
Autoimmune uveitis |
| The Expression Level of Disease Section Compare with the Healthy Individual Tissue |
p-value: 0.038468206;
Fold-change: -0.322408871;
Z-score: -1.546982224
|
| Disease-specific Antigen Abundances |
|
Click to View the Clearer Original Diagram
|
|
|
ICD Disease Classification 05
Click to Show/Hide the 1 Disease of This Class
Hyperlipoproteinaemia [ICD-11: 5C80]
Click to Show/Hide
| Differential expression pattern of antigen in diseases |
| The Studied Tissue |
Whole blood |
| The Specific Disease |
Familial hypercholesterolemia |
| The Expression Level of Disease Section Compare with the Healthy Individual Tissue |
p-value: 1.83E-05;
Fold-change: 0.375535761;
Z-score: 0.96846067
|
| Disease-specific Antigen Abundances |
|
Click to View the Clearer Original Diagram
|
|
|
ICD Disease Classification 06
Click to Show/Hide the 1 Disease of This Class
Schizophrenia [ICD-11: 6A20]
Click to Show/Hide
| Differential expression pattern of antigen in diseases |
| The Studied Tissue |
Superior temporal cortex |
| The Specific Disease |
Schizophrenia |
| The Expression Level of Disease Section Compare with the Healthy Individual Tissue |
p-value: 0.138201535;
Fold-change: 0.088511849;
Z-score: 0.595319861
|
| Disease-specific Antigen Abundances |
|
Click to View the Clearer Original Diagram
|
|
|
ICD Disease Classification 08
Click to Show/Hide the 3 Disease of This Class
Multiple sclerosis [ICD-11: 8A40]
Click to Show/Hide
| Differential expression pattern of antigen in diseases |
| The Studied Tissue |
Spinal cord |
| The Specific Disease |
Multiple sclerosis |
| The Expression Level of Disease Section Compare with the Adjacent Tissue |
p-value: 0.256707838;
Fold-change: -0.176875569;
Z-score: -0.479707708
|
| Disease-specific Antigen Abundances |
|
Click to View the Clearer Original Diagram
|
|
|
| The Studied Tissue |
Plasmacytoid dendritic cells |
| The Specific Disease |
Multiple sclerosis |
| The Expression Level of Disease Section Compare with the Healthy Individual Tissue |
p-value: 0.895972895;
Fold-change: -0.008719796;
Z-score: -0.019578446
|
| Disease-specific Antigen Abundances |
|
Click to View the Clearer Original Diagram
|
|
|
Epilepsy [ICD-11: 8A60]
Click to Show/Hide
| Differential expression pattern of antigen in diseases |
| The Studied Tissue |
Peritumoral cortex |
| The Specific Disease |
Epilepsy |
| The Expression Level of Disease Section Compare with the Other Disease Section |
p-value: 0.061930616;
Fold-change: 0.670841666;
Z-score: 2.277809774
|
| Disease-specific Antigen Abundances |
|
Click to View the Clearer Original Diagram
|
|
|
Cerebral ischaemic stroke [ICD-11: 8B11]
Click to Show/Hide
| Differential expression pattern of antigen in diseases |
| The Studied Tissue |
Whole blood |
| The Specific Disease |
Cardioembolic Stroke |
| The Expression Level of Disease Section Compare with the Healthy Individual Tissue |
p-value: 0.090342284;
Fold-change: 0.151907722;
Z-score: 0.416748142
|
| Disease-specific Antigen Abundances |
|
Click to View the Clearer Original Diagram
|
|
|
| The Studied Tissue |
Peripheral blood |
| The Specific Disease |
Ischemic stroke |
| The Expression Level of Disease Section Compare with the Healthy Individual Tissue |
p-value: 0.067708128;
Fold-change: -0.155757341;
Z-score: -0.473236331
|
| Disease-specific Antigen Abundances |
|
Click to View the Clearer Original Diagram
|
|
|
ICD Disease Classification 1
Click to Show/Hide the 6 Disease of This Class
HIV [ICD-11: 1C60-1C62]
Click to Show/Hide
| Differential expression pattern of antigen in diseases |
| The Studied Tissue |
White matter |
| The Specific Disease |
HIV |
| The Expression Level of Disease Section Compare with the Healthy Individual Tissue |
p-value: 0.347604317;
Fold-change: -0.131913034;
Z-score: -0.442308633
|
| Disease-specific Antigen Abundances |
|
Click to View the Clearer Original Diagram
|
|
|
Influenza [ICD-11: 1E30]
Click to Show/Hide
| Differential expression pattern of antigen in diseases |
| The Studied Tissue |
Whole blood |
| The Specific Disease |
Influenza |
| The Expression Level of Disease Section Compare with the Healthy Individual Tissue |
p-value: 0.227964027;
Fold-change: -0.310795835;
Z-score: -0.705807658
|
| Disease-specific Antigen Abundances |
|
Click to View the Clearer Original Diagram
|
|
|
Chronic hepatitis C [ICD-11: 1E51.1]
Click to Show/Hide
| Differential expression pattern of antigen in diseases |
| The Studied Tissue |
Whole blood |
| The Specific Disease |
Chronic hepatitis C |
| The Expression Level of Disease Section Compare with the Healthy Individual Tissue |
p-value: 0.612231444;
Fold-change: -0.147579702;
Z-score: -0.213233767
|
| Disease-specific Antigen Abundances |
|
Click to View the Clearer Original Diagram
|
|
|
Sepsis [ICD-11: 1G40-1G41]
Click to Show/Hide
| Differential expression pattern of antigen in diseases |
| The Studied Tissue |
Whole blood |
| The Specific Disease |
Sepsis |
| The Expression Level of Disease Section Compare with the Healthy Individual Tissue |
p-value: 4.81E-30;
Fold-change: 1.203452811;
Z-score: 2.033567772
|
| Disease-specific Antigen Abundances |
|
Click to View the Clearer Original Diagram
|
|
|
Septic shock [ICD-11: 1G41]
Click to Show/Hide
| Differential expression pattern of antigen in diseases |
| The Studied Tissue |
Whole blood |
| The Specific Disease |
Septic shock |
| The Expression Level of Disease Section Compare with the Healthy Individual Tissue |
p-value: 4.21E-74;
Fold-change: 1.58014876;
Z-score: 2.672178507
|
| Disease-specific Antigen Abundances |
|
Click to View the Clearer Original Diagram
|
|
|
Pediatric respiratory syncytial virus infection [ICD-11: CA40.11]
Click to Show/Hide
| Differential expression pattern of antigen in diseases |
| The Studied Tissue |
Peripheral blood |
| The Specific Disease |
Pediatric respiratory syncytial virus infection |
| The Expression Level of Disease Section Compare with the Healthy Individual Tissue |
p-value: 0.000134272;
Fold-change: 0.544196522;
Z-score: 1.428273023
|
| Disease-specific Antigen Abundances |
|
Click to View the Clearer Original Diagram
|
|
|
ICD Disease Classification 11
Click to Show/Hide the 6 Disease of This Class
Essential hypertension [ICD-11: BA00]
Click to Show/Hide
| Differential expression pattern of antigen in diseases |
| The Studied Tissue |
Peripheral blood |
| The Specific Disease |
Essential hypertension |
| The Expression Level of Disease Section Compare with the Healthy Individual Tissue |
p-value: 0.354155594;
Fold-change: 0.239597613;
Z-score: 7.642409442
|
| Disease-specific Antigen Abundances |
|
Click to View the Clearer Original Diagram
|
|
|
Myocardial infarction [ICD-11: BA41]
Click to Show/Hide
| Differential expression pattern of antigen in diseases |
| The Studied Tissue |
Peripheral blood |
| The Specific Disease |
Myocardial infarction |
| The Expression Level of Disease Section Compare with the Healthy Individual Tissue |
p-value: 0.004115318;
Fold-change: 0.654744029;
Z-score: 0.766906651
|
| Disease-specific Antigen Abundances |
|
Click to View the Clearer Original Diagram
|
|
|
Coronary artery disease [ICD-11: BA8Z]
Click to Show/Hide
| Differential expression pattern of antigen in diseases |
| The Studied Tissue |
Peripheral blood |
| The Specific Disease |
Coronary artery disease |
| The Expression Level of Disease Section Compare with the Healthy Individual Tissue |
p-value: 0.414891697;
Fold-change: 0.080338983;
Z-score: 0.319863622
|
| Disease-specific Antigen Abundances |
|
Click to View the Clearer Original Diagram
|
|
|
Aortic stenosis [ICD-11: BB70]
Click to Show/Hide
| Differential expression pattern of antigen in diseases |
| The Studied Tissue |
Calcified aortic valve |
| The Specific Disease |
Aortic stenosis |
| The Expression Level of Disease Section Compare with the Healthy Individual Tissue |
p-value: 0.635389266;
Fold-change: 0.025474367;
Z-score: 0.053159856
|
| Disease-specific Antigen Abundances |
|
Click to View the Clearer Original Diagram
|
|
|
Arteriosclerosis [ICD-11: BD40]
Click to Show/Hide
| Differential expression pattern of antigen in diseases |
| The Studied Tissue |
Peripheral blood |
| The Specific Disease |
Arteriosclerosis |
| The Expression Level of Disease Section Compare with the Healthy Individual Tissue |
p-value: 0.299394507;
Fold-change: -0.101249362;
Z-score: -0.364351871
|
| Disease-specific Antigen Abundances |
|
Click to View the Clearer Original Diagram
|
|
|
Aneurysm [ICD-11: BD50]
Click to Show/Hide
| Differential expression pattern of antigen in diseases |
| The Studied Tissue |
Intracranial artery |
| The Specific Disease |
Aneurysm |
| The Expression Level of Disease Section Compare with the Healthy Individual Tissue |
p-value: 0.972198292;
Fold-change: -0.13750082;
Z-score: -0.17897087
|
| Disease-specific Antigen Abundances |
|
Click to View the Clearer Original Diagram
|
|
|
ICD Disease Classification 12
Click to Show/Hide the 8 Disease of This Class
Immunodeficiency [ICD-11: 4A00-4A20]
Click to Show/Hide
| Differential expression pattern of antigen in diseases |
| The Studied Tissue |
Peripheral blood |
| The Specific Disease |
Immunodeficiency |
| The Expression Level of Disease Section Compare with the Healthy Individual Tissue |
p-value: 0.560663792;
Fold-change: 0.003058471;
Z-score: 0.035905385
|
| Disease-specific Antigen Abundances |
|
Click to View the Clearer Original Diagram
|
|
|
Apnea [ICD-11: 7A40]
Click to Show/Hide
| Differential expression pattern of antigen in diseases |
| The Studied Tissue |
Hyperplastic tonsil |
| The Specific Disease |
Apnea |
| The Expression Level of Disease Section Compare with the Healthy Individual Tissue |
p-value: 0.373021931;
Fold-change: -0.261839366;
Z-score: -1.010797084
|
| Disease-specific Antigen Abundances |
|
Click to View the Clearer Original Diagram
|
|
|
Olive pollen allergy [ICD-11: CA08.00]
Click to Show/Hide
| Differential expression pattern of antigen in diseases |
| The Studied Tissue |
Peripheral blood |
| The Specific Disease |
Olive pollen allergy |
| The Expression Level of Disease Section Compare with the Healthy Individual Tissue |
p-value: 0.478811695;
Fold-change: 0.22238882;
Z-score: 0.463873997
|
| Disease-specific Antigen Abundances |
|
Click to View the Clearer Original Diagram
|
|
|
Chronic rhinosinusitis [ICD-11: CA0A]
Click to Show/Hide
| Differential expression pattern of antigen in diseases |
| The Studied Tissue |
Sinus mucosa |
| The Specific Disease |
Chronic rhinosinusitis |
| The Expression Level of Disease Section Compare with the Healthy Individual Tissue |
p-value: 0.106273145;
Fold-change: -0.640184556;
Z-score: -1.042862058
|
| Disease-specific Antigen Abundances |
|
Click to View the Clearer Original Diagram
|
|
|
Chronic obstructive pulmonary disease [ICD-11: CA22]
Click to Show/Hide
| Differential expression pattern of antigen in diseases |
| The Studied Tissue |
Lung |
| The Specific Disease |
Chronic obstructive pulmonary disease |
| The Expression Level of Disease Section Compare with the Healthy Individual Tissue |
p-value: 0.056219996;
Fold-change: 0.329645138;
Z-score: 0.667725284
|
| Disease-specific Antigen Abundances |
|
Click to View the Clearer Original Diagram
|
|
|
| The Studied Tissue |
Small airway epithelium |
| The Specific Disease |
Chronic obstructive pulmonary disease |
| The Expression Level of Disease Section Compare with the Healthy Individual Tissue |
p-value: 0.04936803;
Fold-change: -0.108727659;
Z-score: -0.352009277
|
| Disease-specific Antigen Abundances |
|
Click to View the Clearer Original Diagram
|
|
|
Asthma [ICD-11: CA23]
Click to Show/Hide
| Differential expression pattern of antigen in diseases |
| The Studied Tissue |
Nasal and bronchial airway |
| The Specific Disease |
Asthma |
| The Expression Level of Disease Section Compare with the Healthy Individual Tissue |
p-value: 0.044450548;
Fold-change: 0.300923364;
Z-score: 0.355996891
|
| Disease-specific Antigen Abundances |
|
Click to View the Clearer Original Diagram
|
|
|
Human rhinovirus infection [ICD-11: CA42]
Click to Show/Hide
| Differential expression pattern of antigen in diseases |
| The Studied Tissue |
Nasal Epithelium |
| The Specific Disease |
Human rhinovirus infection |
| The Expression Level of Disease Section Compare with the Healthy Individual Tissue |
p-value: 0.516016472;
Fold-change: 0.064967133;
Z-score: 0.531488416
|
| Disease-specific Antigen Abundances |
|
Click to View the Clearer Original Diagram
|
|
|
Idiopathic pulmonary fibrosis [ICD-11: CB03.4]
Click to Show/Hide
| Differential expression pattern of antigen in diseases |
| The Studied Tissue |
Lung |
| The Specific Disease |
Idiopathic pulmonary fibrosis |
| The Expression Level of Disease Section Compare with the Healthy Individual Tissue |
p-value: 0.007221811;
Fold-change: -0.440004205;
Z-score: -1.599884824
|
| Disease-specific Antigen Abundances |
|
Click to View the Clearer Original Diagram
|
|
|
ICD Disease Classification 13
Click to Show/Hide the 5 Disease of This Class
Periodontal disease [ICD-11: DA0C]
Click to Show/Hide
| Differential expression pattern of antigen in diseases |
| The Studied Tissue |
Gingival |
| The Specific Disease |
Periodontal disease |
| The Expression Level of Disease Section Compare with the Adjacent Tissue |
p-value: 0.049020886;
Fold-change: 0.060557131;
Z-score: 0.241101342
|
| Disease-specific Antigen Abundances |
|
Click to View the Clearer Original Diagram
|
|
|
Eosinophilic gastritis [ICD-11: DA42.2]
Click to Show/Hide
| Differential expression pattern of antigen in diseases |
| The Studied Tissue |
Gastric antrum |
| The Specific Disease |
Eosinophilic gastritis |
| The Expression Level of Disease Section Compare with the Adjacent Tissue |
p-value: 0.631972351;
Fold-change: -0.079619969;
Z-score: -0.495221198
|
| Disease-specific Antigen Abundances |
|
Click to View the Clearer Original Diagram
|
|
|
Liver failure [ICD-11: DB99.7-DB99.8]
Click to Show/Hide
| Differential expression pattern of antigen in diseases |
| The Studied Tissue |
Liver |
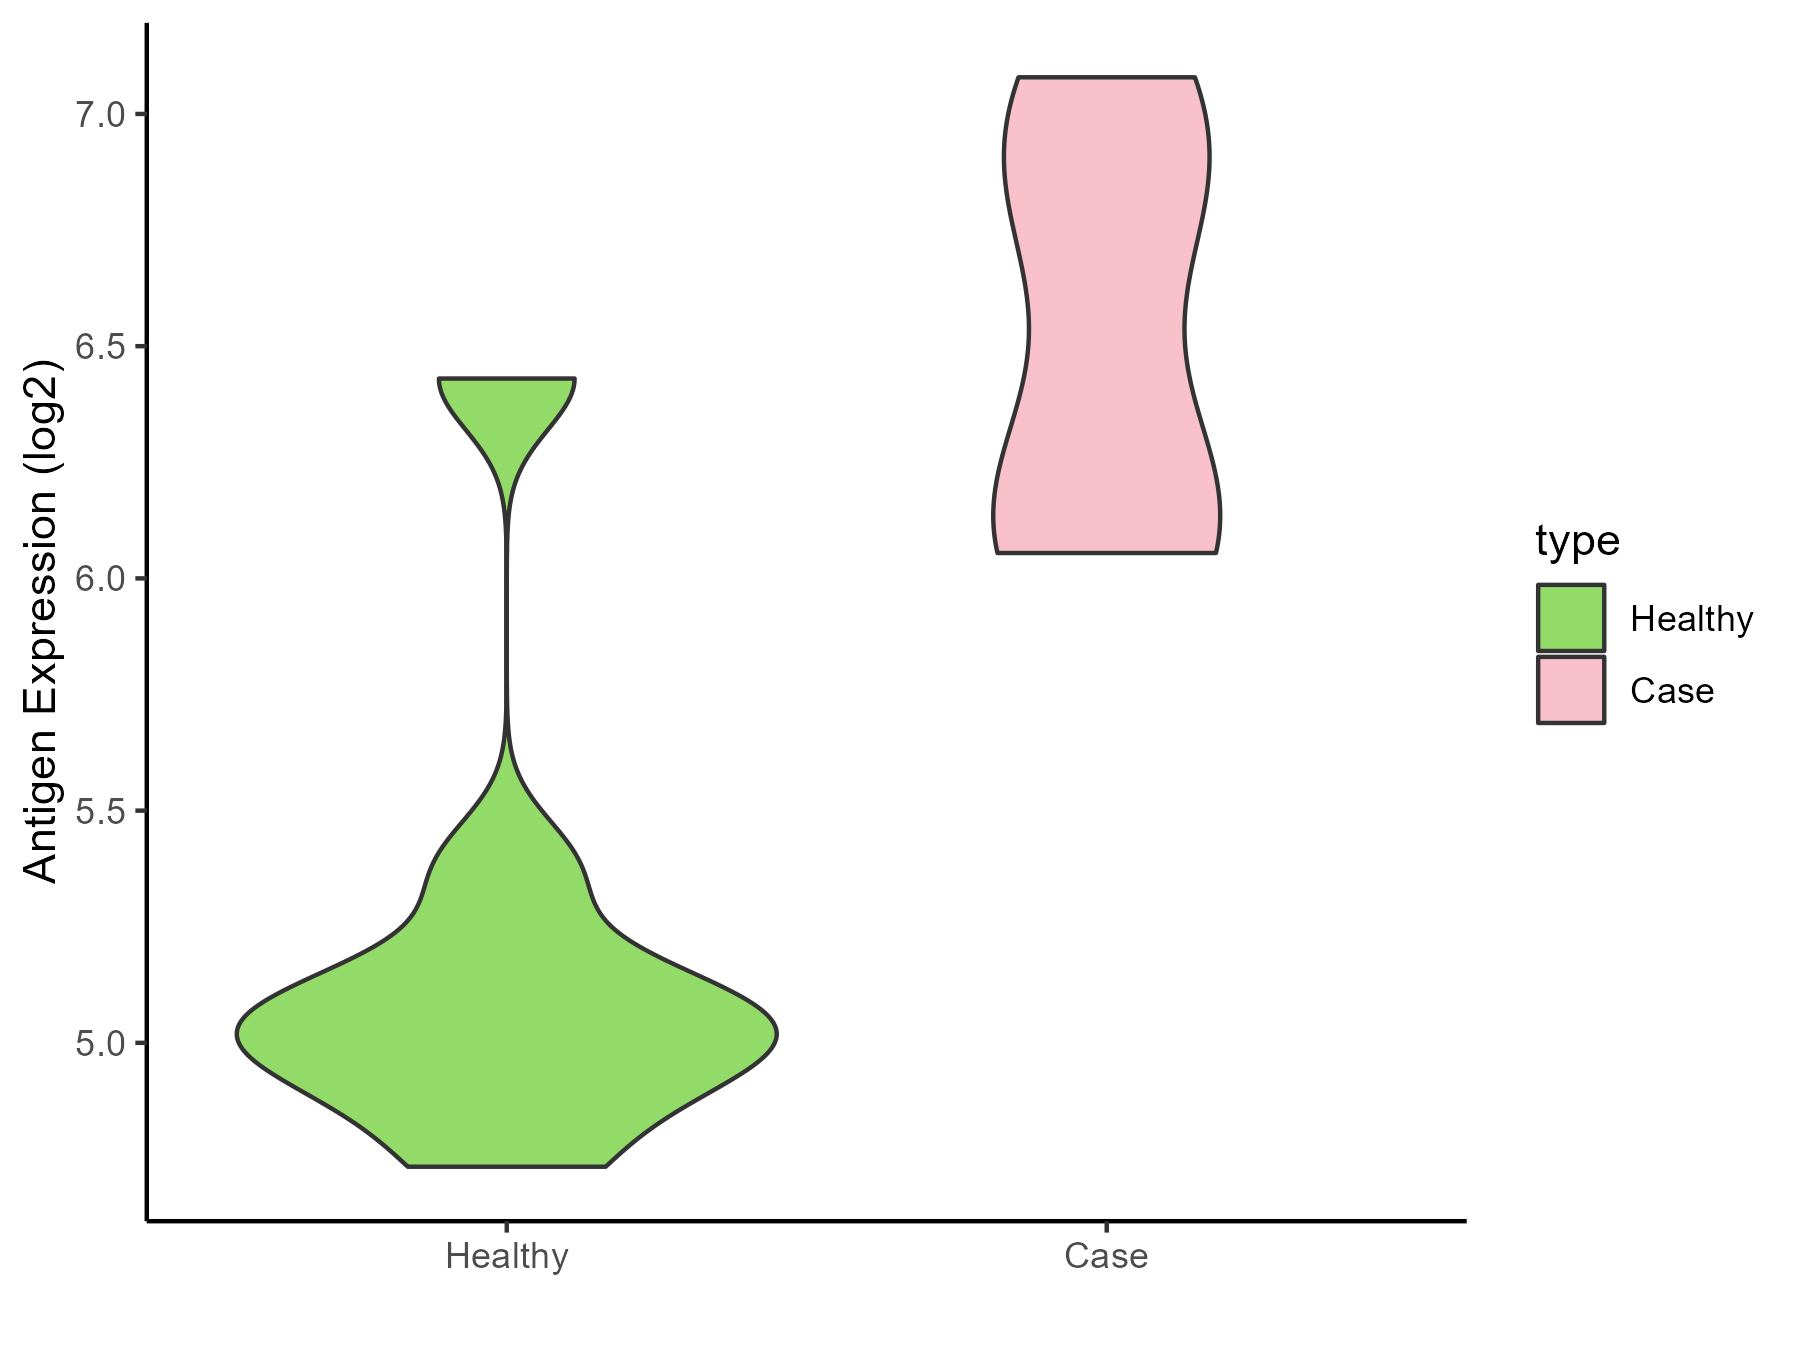
| The Specific Disease |
Liver failure |
| The Expression Level of Disease Section Compare with the Healthy Individual Tissue |
p-value: 0.000106053;
Fold-change: 1.419826581;
Z-score: 2.685976175
|
| Disease-specific Antigen Abundances |
|
Click to View the Clearer Original Diagram
|
|
|
Ulcerative colitis [ICD-11: DD71]
Click to Show/Hide
| Differential expression pattern of antigen in diseases |
| The Studied Tissue |
Colon mucosal |
| The Specific Disease |
Ulcerative colitis |
| The Expression Level of Disease Section Compare with the Adjacent Tissue |
p-value: 0.998041646;
Fold-change: -0.008004911;
Z-score: -0.029810859
|
| Disease-specific Antigen Abundances |
|
Click to View the Clearer Original Diagram
|
|
|
Irritable bowel syndrome [ICD-11: DD91.0]
Click to Show/Hide
| Differential expression pattern of antigen in diseases |
| The Studied Tissue |
Rectal colon |
| The Specific Disease |
Irritable bowel syndrome |
| The Expression Level of Disease Section Compare with the Healthy Individual Tissue |
p-value: 0.54973177;
Fold-change: -0.186305853;
Z-score: -0.489275796
|
| Disease-specific Antigen Abundances |
|
Click to View the Clearer Original Diagram
|
|
|
ICD Disease Classification 14
Click to Show/Hide the 5 Disease of This Class
Atopic dermatitis [ICD-11: EA80]
Click to Show/Hide
| Differential expression pattern of antigen in diseases |
| The Studied Tissue |
Skin |
| The Specific Disease |
Atopic dermatitis |
| The Expression Level of Disease Section Compare with the Healthy Individual Tissue |
p-value: 6.16E-06;
Fold-change: 0.134208353;
Z-score: 0.906400911
|
| Disease-specific Antigen Abundances |
|
Click to View the Clearer Original Diagram
|
|
|
Psoriasis [ICD-11: EA90]
Click to Show/Hide
| Differential expression pattern of antigen in diseases |
| The Studied Tissue |
Skin |
| The Specific Disease |
Psoriasis |
| The Expression Level of Disease Section Compare with the Healthy Individual Tissue |
p-value: 0.005315115;
Fold-change: 0.016556814;
Z-score: 0.047640699
|
| The Expression Level of Disease Section Compare with the Adjacent Tissue |
p-value: 7.15E-34;
Fold-change: 0.614446312;
Z-score: 1.950853309
|
| Disease-specific Antigen Abundances |
|
Click to View the Clearer Original Diagram
|
|
|
Vitiligo [ICD-11: ED63.0]
Click to Show/Hide
| Differential expression pattern of antigen in diseases |
| The Studied Tissue |
Skin |
| The Specific Disease |
Vitiligo |
| The Expression Level of Disease Section Compare with the Healthy Individual Tissue |
p-value: 0.462613064;
Fold-change: -0.005129751;
Z-score: -0.025601617
|
| Disease-specific Antigen Abundances |
|
Click to View the Clearer Original Diagram
|
|
|
Alopecia [ICD-11: ED70]
Click to Show/Hide
| Differential expression pattern of antigen in diseases |
| The Studied Tissue |
Skin from scalp |
| The Specific Disease |
Alopecia |
| The Expression Level of Disease Section Compare with the Healthy Individual Tissue |
p-value: 1.16E-06;
Fold-change: -0.266952442;
Z-score: -0.941262782
|
| Disease-specific Antigen Abundances |
|
Click to View the Clearer Original Diagram
|
|
|
Sensitive skin [ICD-11: EK0Z]
Click to Show/Hide
| Differential expression pattern of antigen in diseases |
| The Studied Tissue |
Skin |
| The Specific Disease |
Sensitive skin |
| The Expression Level of Disease Section Compare with the Healthy Individual Tissue |
p-value: 0.455679137;
Fold-change: 0.04449575;
Z-score: 0.174213799
|
| Disease-specific Antigen Abundances |
|
Click to View the Clearer Original Diagram
|
|
|
ICD Disease Classification 15
Click to Show/Hide the 6 Disease of This Class
Osteoarthritis [ICD-11: FA00-FA0Z]
Click to Show/Hide
| Differential expression pattern of antigen in diseases |
| The Studied Tissue |
Synovial |
| The Specific Disease |
Osteoarthritis |
| The Expression Level of Disease Section Compare with the Healthy Individual Tissue |
p-value: 0.408213665;
Fold-change: 0.066496059;
Z-score: 0.362757085
|
| Disease-specific Antigen Abundances |
|
Click to View the Clearer Original Diagram
|
|
|
Arthropathy [ICD-11: FA00-FA5Z]
Click to Show/Hide
| Differential expression pattern of antigen in diseases |
| The Studied Tissue |
Peripheral blood |
| The Specific Disease |
Arthropathy |
| The Expression Level of Disease Section Compare with the Healthy Individual Tissue |
p-value: 0.022187227;
Fold-change: 0.305572664;
Z-score: 0.952240962
|
| Disease-specific Antigen Abundances |
|
Click to View the Clearer Original Diagram
|
|
|
Arthritis [ICD-11: FA20]
Click to Show/Hide
| Differential expression pattern of antigen in diseases |
| The Studied Tissue |
Peripheral blood |
| The Specific Disease |
Arthritis |
| The Expression Level of Disease Section Compare with the Healthy Individual Tissue |
p-value: 0.481140155;
Fold-change: -0.408136466;
Z-score: -0.455566528
|
| Disease-specific Antigen Abundances |
|
Click to View the Clearer Original Diagram
|
|
|
Rheumatoid arthritis [ICD-11: FA20]
Click to Show/Hide
| Differential expression pattern of antigen in diseases |
| The Studied Tissue |
Synovial |
| The Specific Disease |
Rheumatoid arthritis |
| The Expression Level of Disease Section Compare with the Healthy Individual Tissue |
p-value: 0.077132572;
Fold-change: 0.442999701;
Z-score: 1.219717294
|
| Disease-specific Antigen Abundances |
|
Click to View the Clearer Original Diagram
|
|
|
Ankylosing spondylitis [ICD-11: FA92.0Z]
Click to Show/Hide
| Differential expression pattern of antigen in diseases |
| The Studied Tissue |
Pheripheral blood |
| The Specific Disease |
Ankylosing spondylitis |
| The Expression Level of Disease Section Compare with the Healthy Individual Tissue |
p-value: 0.415205062;
Fold-change: -0.007542876;
Z-score: -0.052245451
|
| Disease-specific Antigen Abundances |
|
Click to View the Clearer Original Diagram
|
|
|
Osteoporosis [ICD-11: FB83]
Click to Show/Hide
| Differential expression pattern of antigen in diseases |
| The Studied Tissue |
Bone marrow |
| The Specific Disease |
Osteoporosis |
| The Expression Level of Disease Section Compare with the Healthy Individual Tissue |
p-value: 0.114721489;
Fold-change: 0.184211065;
Z-score: 1.765957997
|
| Disease-specific Antigen Abundances |
|
Click to View the Clearer Original Diagram
|
|
|
ICD Disease Classification 16
Click to Show/Hide the 2 Disease of This Class
Endometriosis [ICD-11: GA10]
Click to Show/Hide
| Differential expression pattern of antigen in diseases |
| The Studied Tissue |
Endometrium |
| The Specific Disease |
Endometriosis |
| The Expression Level of Disease Section Compare with the Healthy Individual Tissue |
p-value: 0.292755837;
Fold-change: 0.156753255;
Z-score: 0.373228037
|
| Disease-specific Antigen Abundances |
|
Click to View the Clearer Original Diagram
|
|
|
Interstitial cystitis [ICD-11: GC00.3]
Click to Show/Hide
| Differential expression pattern of antigen in diseases |
| The Studied Tissue |
Bladder |
| The Specific Disease |
Interstitial cystitis |
| The Expression Level of Disease Section Compare with the Healthy Individual Tissue |
p-value: 0.362254015;
Fold-change: 0.190364216;
Z-score: 1.04336865
|
| Disease-specific Antigen Abundances |
|
Click to View the Clearer Original Diagram
|
|
|
ICD Disease Classification 19
Click to Show/Hide the 1 Disease of This Class
Preterm birth [ICD-11: KA21.4Z]
Click to Show/Hide
| Differential expression pattern of antigen in diseases |
| The Studied Tissue |
Myometrium |
| The Specific Disease |
Preterm birth |
| The Expression Level of Disease Section Compare with the Healthy Individual Tissue |
p-value: 0.167571672;
Fold-change: -0.10613773;
Z-score: -0.634867912
|
| Disease-specific Antigen Abundances |
|
Click to View the Clearer Original Diagram
|
|
|
ICD Disease Classification 2
Click to Show/Hide the 8 Disease of This Class
Acute myelocytic leukemia [ICD-11: 2A60]
Click to Show/Hide
| Differential expression pattern of antigen in diseases |
| The Studied Tissue |
Bone marrow |
| The Specific Disease |
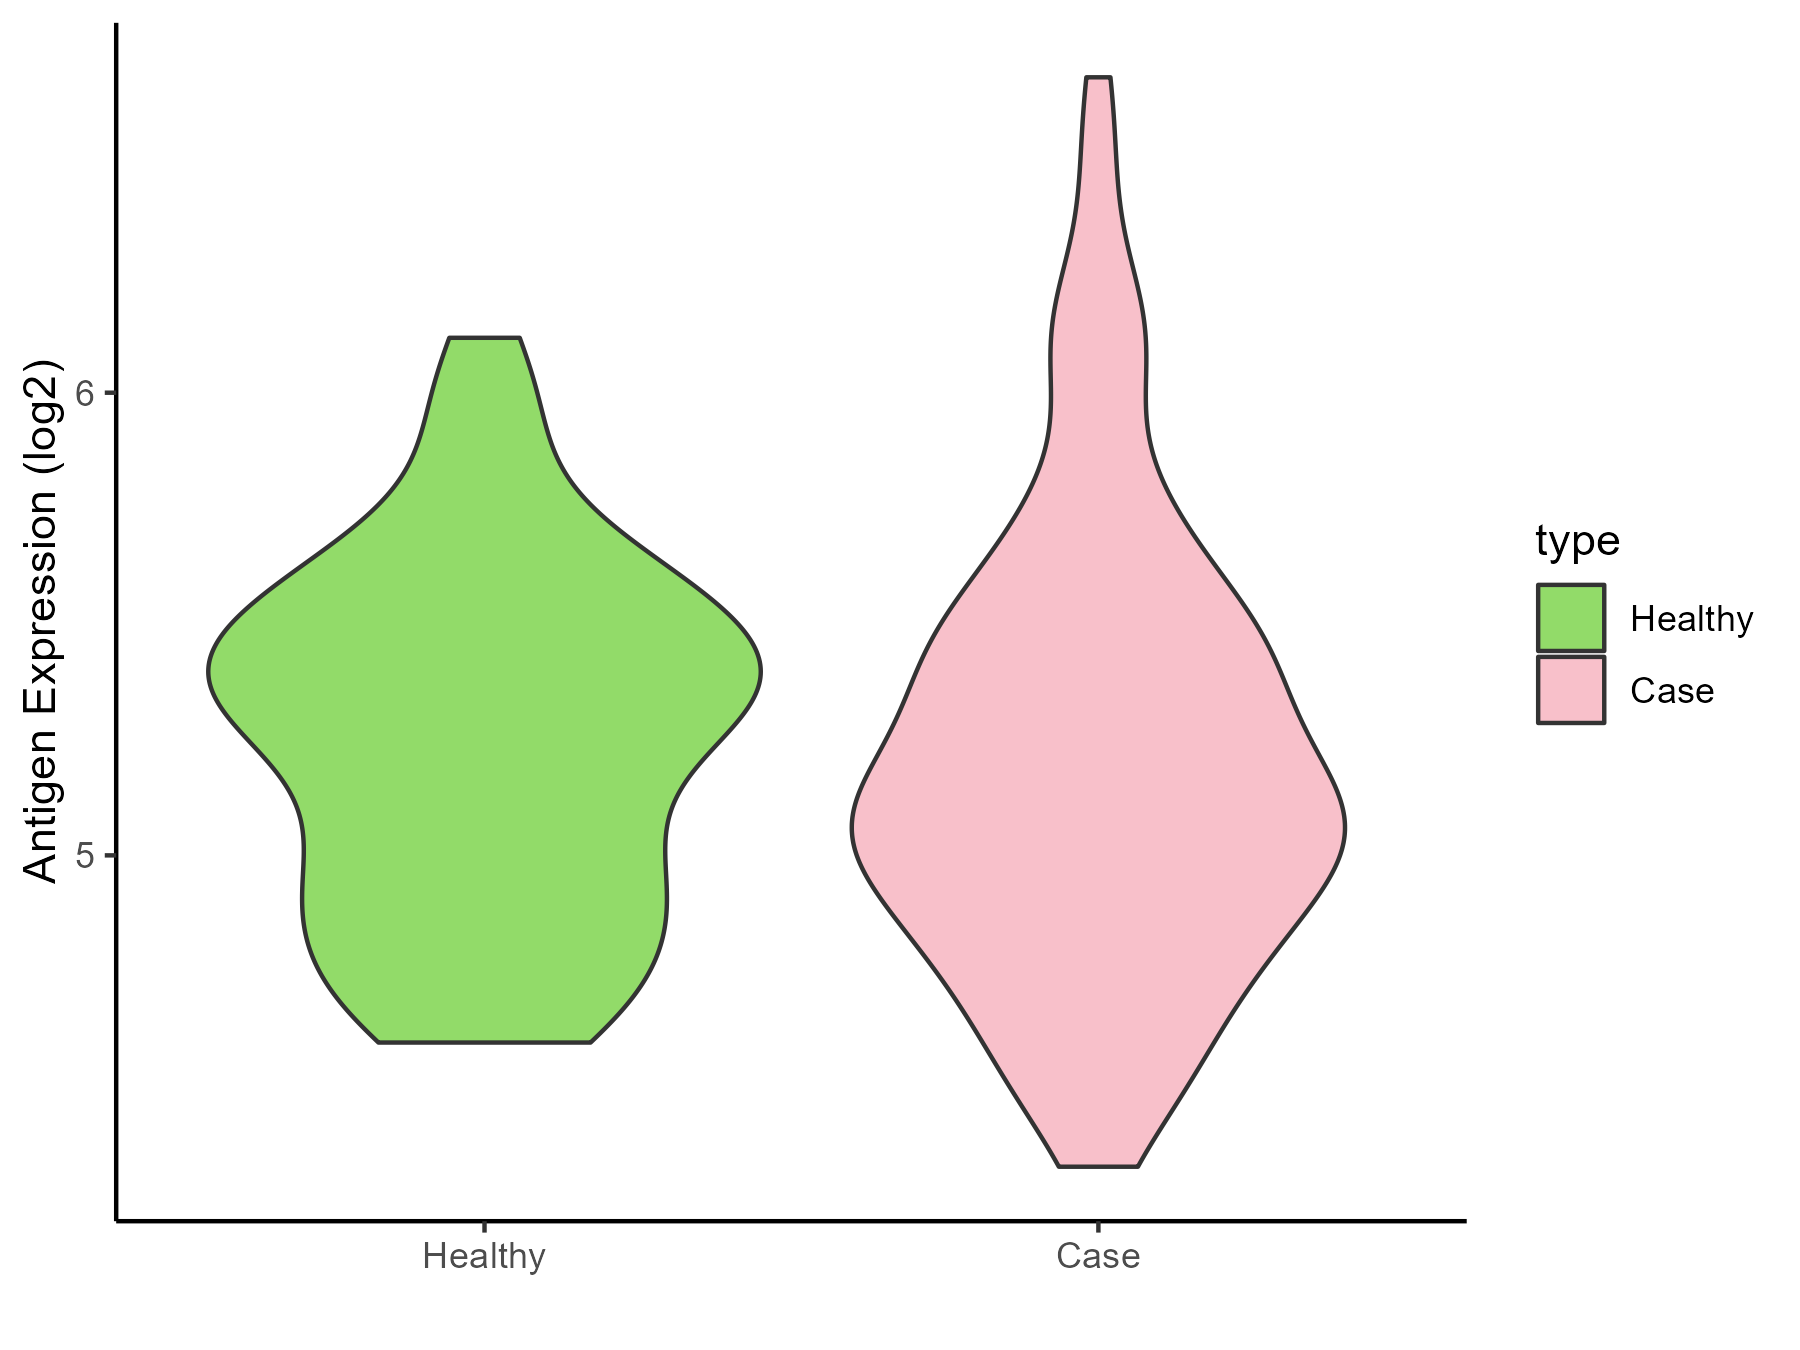
Acute myelocytic leukemia |
| The Expression Level of Disease Section Compare with the Healthy Individual Tissue |
p-value: 2.76E-31;
Fold-change: -0.499692707;
Z-score: -1.241155492
|
| Disease-specific Antigen Abundances |
|
Click to View the Clearer Original Diagram
|
|
|
Myeloma [ICD-11: 2A83]
Click to Show/Hide
| Differential expression pattern of antigen in diseases |
| The Studied Tissue |
Peripheral blood |
| The Specific Disease |
Myeloma |
| The Expression Level of Disease Section Compare with the Healthy Individual Tissue |
p-value: 0.180412538;
Fold-change: 0.116300143;
Z-score: 0.50289476
|
| Disease-specific Antigen Abundances |
|
Click to View the Clearer Original Diagram
|
|
|
| The Studied Tissue |
Bone marrow |
| The Specific Disease |
Myeloma |
| The Expression Level of Disease Section Compare with the Healthy Individual Tissue |
p-value: 0.001976837;
Fold-change: 0.272748181;
Z-score: 1.461300698
|
| Disease-specific Antigen Abundances |
|
Click to View the Clearer Original Diagram
|
|
|
Oral cancer [ICD-11: 2B6E]
Click to Show/Hide
| Differential expression pattern of antigen in diseases |
| The Studied Tissue |
Oral |
| The Specific Disease |
Oral cancer |
| The Expression Level of Disease Section Compare with the Healthy Individual Tissue |
p-value: 0.032661286;
Fold-change: -0.154406;
Z-score: -0.482025118
|
| The Expression Level of Disease Section Compare with the Adjacent Tissue |
p-value: 8.02E-20;
Fold-change: -0.461856002;
Z-score: -1.445459602
|
| Disease-specific Antigen Abundances |
|
Click to View the Clearer Original Diagram
|
|
|
Esophagal cancer [ICD-11: 2B70]
Click to Show/Hide
| Differential expression pattern of antigen in diseases |
| The Studied Tissue |
Esophagus |
| The Specific Disease |
Esophagal cancer |
| The Expression Level of Disease Section Compare with the Adjacent Tissue |
p-value: 0.189999156;
Fold-change: -0.400016588;
Z-score: -0.903661494
|
| Disease-specific Antigen Abundances |
|
Click to View the Clearer Original Diagram
|
|
|
Rectal cancer [ICD-11: 2B92]
Click to Show/Hide
| Differential expression pattern of antigen in diseases |
| The Studied Tissue |
Rectal colon |
| The Specific Disease |
Rectal cancer |
| The Expression Level of Disease Section Compare with the Healthy Individual Tissue |
p-value: 0.000387591;
Fold-change: -0.268889047;
Z-score: -2.781203932
|
| The Expression Level of Disease Section Compare with the Adjacent Tissue |
p-value: 0.921699226;
Fold-change: -0.013155582;
Z-score: -0.117382407
|
| Disease-specific Antigen Abundances |
|
Click to View the Clearer Original Diagram
|
|
|
Skin cancer [ICD-11: 2C30-2C3Z]
Click to Show/Hide
| Differential expression pattern of antigen in diseases |
| The Studied Tissue |
Skin |
| The Specific Disease |
Skin cancer |
| The Expression Level of Disease Section Compare with the Healthy Individual Tissue |
p-value: 4.68E-46;
Fold-change: -0.81378482;
Z-score: -1.705419632
|
| The Expression Level of Disease Section Compare with the Adjacent Tissue |
p-value: 2.98E-19;
Fold-change: -0.331463031;
Z-score: -0.621244046
|
| Disease-specific Antigen Abundances |
|
Click to View the Clearer Original Diagram
|
|
|
Renal cancer [ICD-11: 2C90-2C91]
Click to Show/Hide
| Differential expression pattern of antigen in diseases |
| The Studied Tissue |
Kidney |
| The Specific Disease |
Renal cancer |
| The Expression Level of Disease Section Compare with the Healthy Individual Tissue |
p-value: 0.000592627;
Fold-change: -0.701196643;
Z-score: -1.52674506
|
| The Expression Level of Disease Section Compare with the Adjacent Tissue |
p-value: 8.57E-19;
Fold-change: -0.747997883;
Z-score: -1.73061459
|
| Disease-specific Antigen Abundances |
|
Click to View the Clearer Original Diagram
|
|
|
Ureter cancer [ICD-11: 2C92]
Click to Show/Hide
| Differential expression pattern of antigen in diseases |
| The Studied Tissue |
Urothelium |
| The Specific Disease |
Ureter cancer |
| The Expression Level of Disease Section Compare with the Healthy Individual Tissue |
p-value: 0.363439115;
Fold-change: -0.017022544;
Z-score: -0.117489305
|
| Disease-specific Antigen Abundances |
|
Click to View the Clearer Original Diagram
|
|
|
ICD Disease Classification 20
Click to Show/Hide the 2 Disease of This Class
Simpson golabi behmel syndrome [ICD-11: LD2C]
Click to Show/Hide
| Differential expression pattern of antigen in diseases |
| The Studied Tissue |
Adipose |
| The Specific Disease |
Simpson golabi behmel syndrome |
| The Expression Level of Disease Section Compare with the Healthy Individual Tissue |
p-value: 0.7931935;
Fold-change: 0.041593865;
Z-score: 0.632166263
|
| Disease-specific Antigen Abundances |
|
Click to View the Clearer Original Diagram
|
|
|
Tuberous sclerosis complex [ICD-11: LD2D.2]
Click to Show/Hide
| Differential expression pattern of antigen in diseases |
| The Studied Tissue |
Perituberal |
| The Specific Disease |
Tuberous sclerosis complex |
| The Expression Level of Disease Section Compare with the Healthy Individual Tissue |
p-value: 0.37692399;
Fold-change: -0.0889603;
Z-score: -0.40437833
|
| Disease-specific Antigen Abundances |
|
Click to View the Clearer Original Diagram
|
|
|
ICD Disease Classification 3
Click to Show/Hide the 3 Disease of This Class
Anemia [ICD-11: 3A00-3A9Z]
Click to Show/Hide
| Differential expression pattern of antigen in diseases |
| The Studied Tissue |
Bone marrow |
| The Specific Disease |
Anemia |
| The Expression Level of Disease Section Compare with the Healthy Individual Tissue |
p-value: 0.189559156;
Fold-change: -0.004126203;
Z-score: -0.018756523
|
| Disease-specific Antigen Abundances |
|
Click to View the Clearer Original Diagram
|
|
|
Sickle cell disease [ICD-11: 3A51.0-3A51.3]
Click to Show/Hide
| Differential expression pattern of antigen in diseases |
| The Studied Tissue |
Peripheral blood |
| The Specific Disease |
Sickle cell disease |
| The Expression Level of Disease Section Compare with the Healthy Individual Tissue |
p-value: 0.849778576;
Fold-change: 0.148355101;
Z-score: 0.604789876
|
| Disease-specific Antigen Abundances |
|
Click to View the Clearer Original Diagram
|
|
|
Thrombocythemia [ICD-11: 3B63]
Click to Show/Hide
| Differential expression pattern of antigen in diseases |
| The Studied Tissue |
Whole blood |
| The Specific Disease |
Thrombocythemia |
| The Expression Level of Disease Section Compare with the Healthy Individual Tissue |
p-value: 0.063473264;
Fold-change: 0.033054628;
Z-score: 0.144972674
|
| Disease-specific Antigen Abundances |
|
Click to View the Clearer Original Diagram
|
|
|
ICD Disease Classification 4
Click to Show/Hide the 4 Disease of This Class
Scleroderma [ICD-11: 4A42.Z]
Click to Show/Hide
| Differential expression pattern of antigen in diseases |
| The Studied Tissue |
Whole blood |
| The Specific Disease |
Scleroderma |
| The Expression Level of Disease Section Compare with the Healthy Individual Tissue |
p-value: 0.923562327;
Fold-change: -0.016837717;
Z-score: -0.053240439
|
| Disease-specific Antigen Abundances |
|
Click to View the Clearer Original Diagram
|
|
|
Sjogren syndrome [ICD-11: 4A43]
Click to Show/Hide
| Differential expression pattern of antigen in diseases |
| The Studied Tissue |
Salivary gland |
| The Specific Disease |
Sjogren syndrome |
| The Expression Level of Disease Section Compare with the Healthy Individual Tissue |
p-value: 0.286695221;
Fold-change: 0.101912776;
Z-score: 1.236034885
|
| The Expression Level of Disease Section Compare with the Adjacent Tissue |
p-value: 0.9895086;
Fold-change: -0.069373943;
Z-score: -0.161014547
|
| Disease-specific Antigen Abundances |
|
Click to View the Clearer Original Diagram
|
|
|
Behcet disease [ICD-11: 4A62]
Click to Show/Hide
| Differential expression pattern of antigen in diseases |
| The Studied Tissue |
Peripheral blood |
| The Specific Disease |
Behcet disease |
| The Expression Level of Disease Section Compare with the Healthy Individual Tissue |
p-value: 0.58109964;
Fold-change: -0.12049156;
Z-score: -0.439000418
|
| Disease-specific Antigen Abundances |
|
Click to View the Clearer Original Diagram
|
|
|
Autosomal dominant monocytopenia [ICD-11: 4B04]
Click to Show/Hide
| Differential expression pattern of antigen in diseases |
| The Studied Tissue |
Whole blood |
| The Specific Disease |
Autosomal dominant monocytopenia |
| The Expression Level of Disease Section Compare with the Healthy Individual Tissue |
p-value: 0.790974813;
Fold-change: 0.172617337;
Z-score: 0.801600281
|
| Disease-specific Antigen Abundances |
|
Click to View the Clearer Original Diagram
|
|
|
ICD Disease Classification 5
Click to Show/Hide the 5 Disease of This Class
Type 2 diabetes [ICD-11: 5A11]
Click to Show/Hide
| Differential expression pattern of antigen in diseases |
| The Studied Tissue |
Liver |
| The Specific Disease |
Type 2 diabetes |
| The Expression Level of Disease Section Compare with the Healthy Individual Tissue |
p-value: 0.791089579;
Fold-change: -0.050868662;
Z-score: -0.328859692
|
| Disease-specific Antigen Abundances |
|
Click to View the Clearer Original Diagram
|
|
|
Polycystic ovary syndrome [ICD-11: 5A80.1]
Click to Show/Hide
| Differential expression pattern of antigen in diseases |
| The Studied Tissue |
Vastus lateralis muscle |
| The Specific Disease |
Polycystic ovary syndrome |
| The Expression Level of Disease Section Compare with the Healthy Individual Tissue |
p-value: 0.386714038;
Fold-change: 0.001494737;
Z-score: 0.021669129
|
| Disease-specific Antigen Abundances |
|
Click to View the Clearer Original Diagram
|
|
|
Obesity [ICD-11: 5B81]
Click to Show/Hide
| Differential expression pattern of antigen in diseases |
| The Studied Tissue |
Subcutaneous Adipose |
| The Specific Disease |
Obesity |
| The Expression Level of Disease Section Compare with the Healthy Individual Tissue |
p-value: 0.585776339;
Fold-change: -0.101736361;
Z-score: -0.667677391
|
| Disease-specific Antigen Abundances |
|
Click to View the Clearer Original Diagram
|
|
|
Pompe disease [ICD-11: 5C51.3]
Click to Show/Hide
| Differential expression pattern of antigen in diseases |
| The Studied Tissue |
Biceps muscle |
| The Specific Disease |
Pompe disease |
| The Expression Level of Disease Section Compare with the Healthy Individual Tissue |
p-value: 0.477420149;
Fold-change: 0.070168899;
Z-score: 0.383146597
|
| Disease-specific Antigen Abundances |
|
Click to View the Clearer Original Diagram
|
|
|
Batten disease [ICD-11: 5C56.1]
Click to Show/Hide
| Differential expression pattern of antigen in diseases |
| The Studied Tissue |
Whole blood |
| The Specific Disease |
Batten disease |
| The Expression Level of Disease Section Compare with the Healthy Individual Tissue |
p-value: 0.659512048;
Fold-change: -0.005312365;
Z-score: -0.029325299
|
| Disease-specific Antigen Abundances |
|
Click to View the Clearer Original Diagram
|
|
|
ICD Disease Classification 6
Click to Show/Hide the 2 Disease of This Class
Autism [ICD-11: 6A02]
Click to Show/Hide
| Differential expression pattern of antigen in diseases |
| The Studied Tissue |
Whole blood |
| The Specific Disease |
Autism |
| The Expression Level of Disease Section Compare with the Healthy Individual Tissue |
p-value: 0.023946533;
Fold-change: 0.153392216;
Z-score: 0.372007921
|
| Disease-specific Antigen Abundances |
|
Click to View the Clearer Original Diagram
|
|
|
Anxiety disorder [ICD-11: 6B00-6B0Z]
Click to Show/Hide
| Differential expression pattern of antigen in diseases |
| The Studied Tissue |
Whole blood |
| The Specific Disease |
Anxiety disorder |
| The Expression Level of Disease Section Compare with the Healthy Individual Tissue |
p-value: 0.007907689;
Fold-change: 0.205622738;
Z-score: 0.55431842
|
| Disease-specific Antigen Abundances |
|
Click to View the Clearer Original Diagram
|
|
|
ICD Disease Classification 8
Click to Show/Hide the 7 Disease of This Class
Parkinson disease [ICD-11: 8A00]
Click to Show/Hide
| Differential expression pattern of antigen in diseases |
| The Studied Tissue |
Substantia nigra |
| The Specific Disease |
Parkinson disease |
| The Expression Level of Disease Section Compare with the Healthy Individual Tissue |
p-value: 0.061255823;
Fold-change: -0.145244925;
Z-score: -0.627924488
|
| Disease-specific Antigen Abundances |
|
Click to View the Clearer Original Diagram
|
|
|
Huntington disease [ICD-11: 8A01]
Click to Show/Hide
| Differential expression pattern of antigen in diseases |
| The Studied Tissue |
Whole blood |
| The Specific Disease |
Huntington disease |
| The Expression Level of Disease Section Compare with the Healthy Individual Tissue |
p-value: 0.929068143;
Fold-change: 0.125457787;
Z-score: 0.496022252
|
| Disease-specific Antigen Abundances |
|
Click to View the Clearer Original Diagram
|
|
|
Alzheimer disease [ICD-11: 8A20]
Click to Show/Hide
| Differential expression pattern of antigen in diseases |
| The Studied Tissue |
Entorhinal cortex |
| The Specific Disease |
Alzheimer disease |
| The Expression Level of Disease Section Compare with the Healthy Individual Tissue |
p-value: 1.44E-05;
Fold-change: -0.205419031;
Z-score: -0.647337548
|
| Disease-specific Antigen Abundances |
|
Click to View the Clearer Original Diagram
|
|
|
Seizure [ICD-11: 8A60-8A6Z]
Click to Show/Hide
| Differential expression pattern of antigen in diseases |
| The Studied Tissue |
Whole blood |
| The Specific Disease |
Seizure |
| The Expression Level of Disease Section Compare with the Healthy Individual Tissue |
p-value: 0.135295538;
Fold-change: -0.102738172;
Z-score: -0.184384437
|
| Disease-specific Antigen Abundances |
|
Click to View the Clearer Original Diagram
|
|
|
Lateral sclerosis [ICD-11: 8B60.4]
Click to Show/Hide
| Differential expression pattern of antigen in diseases |
| The Studied Tissue |
Skin |
| The Specific Disease |
Lateral sclerosis |
| The Expression Level of Disease Section Compare with the Healthy Individual Tissue |
p-value: 0.7591215;
Fold-change: 0.072570906;
Z-score: 1.288438367
|
| Disease-specific Antigen Abundances |
|
Click to View the Clearer Original Diagram
|
|
|
| The Studied Tissue |
Cervical spinal cord |
| The Specific Disease |
Lateral sclerosis |
| The Expression Level of Disease Section Compare with the Healthy Individual Tissue |
p-value: 0.557793078;
Fold-change: 0.122536008;
Z-score: 0.377405647
|
| Disease-specific Antigen Abundances |
|
Click to View the Clearer Original Diagram
|
|
|
Muscular atrophy [ICD-11: 8C70]
Click to Show/Hide
| Differential expression pattern of antigen in diseases |
| The Studied Tissue |
Muscle |
| The Specific Disease |
Muscular atrophy |
| The Expression Level of Disease Section Compare with the Healthy Individual Tissue |
p-value: 0.288338953;
Fold-change: -0.137615506;
Z-score: -0.400288087
|
| Disease-specific Antigen Abundances |
|
Click to View the Clearer Original Diagram
|
|
|
Myopathy [ICD-11: 8C70.6]
Click to Show/Hide
| Differential expression pattern of antigen in diseases |
| The Studied Tissue |
Muscle |
| The Specific Disease |
Myopathy |
| The Expression Level of Disease Section Compare with the Healthy Individual Tissue |
p-value: 0.35820324;
Fold-change: -0.12350299;
Z-score: -0.58227888
|
| Disease-specific Antigen Abundances |
|
Click to View the Clearer Original Diagram
|
|
|
